75
Peconic EstuaryNitrogen TMDL
Cumulative Impact Graphics
January 5, 2007January 5, 2007
Cumulative Impacts• The following graphics show the cumulative impacts of
various management alternatives on total nitrogen and dissolved oxygen along transects in the western Peconic Estuary. Model results for 6 runs are shown on each graphic:– 01g: Baseline run (i.e., existing conditions) – 15h1: atmospheric deposition of nitrogen reduced by 31.3%– 15h2: groundwater nitrogen concentration reduced to practical load
reduction scenario concentrations– 15h3: tributary and stormwater nitrogen reduced– 15h: STP loads reduced to practical load reductions with spray
irrigation used during summer months (May 1 – Sep 30)– 15i: same as 15h except mechanical aeration was used to add oxygen
to achieve existing 5.0 mg/L DO water quality standard• These runs are summarized in the following table

76
Scenario WWTPs Atmospheric Deposition Groundwater Peconic River and Tributaries
Stormwater Runoff
01g Flow and load at existing permit limits (Riverhead STP TN =130 lb/day)
Nitrogen from atmospheric deposition at existing levels
Nitrogen at existing concentrations
Nitrogen loads at existing levels
Nitrogen from stormwater loads at existing levels
15h1 Flow and load at existing permit limits (Riverhead STP TN =130 lb/day)
Nitrogen from atmospheric deposition reduced by 31.3%
Nitrogen at existing concentrations
Nitrogen loads at existing levels
Nitrogen from stormwater loads at existing levels
15h2 Flow and load at existing permit limits (Riverhead STP TN =130 lb/day)
Nitrogen from atmospheric deposition reduced by 31.3%
Nitrogen at Practical Load Reduction Scenario concentrations
Nitrogen loads at existing concentrations
Nitrogen from stormwater loads at existing levels
15h3 Flow and load at existing permit limits (Riverhead STP TN =130 lb/day)
Nitrogen from atmospheric deposition reduced by 31.3%
Nitrogen at Practical Load Reduction Scenario concentrations
Nitrogen loads at Practical Load Reduction Scenario concentrations
Nitrogen from stormwater loads reduced by 15% in Peconic River and Flanders Bay; reduced by 10% east of Flanders Bay
15h Flow and load at limit-of-technology with spray irrigation (Riverhead STP TN=40 lb/day)
Nitrogen from atmospheric deposition reduced by 31.3%
Nitrogen at Practical Load Reduction Scenario concentrations
Nitrogen loads at Practical Load Reduction Scenario concentrations
Nitrogen from stormwater loads reduced by 15% in Peconic River and Flanders Bay; reduced by 10% east of Flanders Bay
Summary of Alternative Management Scenarios
Note: Scenario 15i is the same as 15h except mechanical aeration was used to add oxygen to achieve the existing 5.0 mg/L DO water quality standard.
Key to Figures• Figure 1: location and river miles for Peconic River to
Robbins Island transect• Figure 2: locations and river miles for Meetinghouse
Creek, Terrys Creek, and Sawmill Creek transects• Figures of lowest daily-average bottom DO: this is the
lowest of the 730 daily-average DO concentrations from the 2-year model run for the bottom layer at each grid cell along the transect.
• Figures of lowest daily-average surface DO; this is the lowest of the 730 daily-average DO concentrations from the 2-year model run for the surface layer at each grid cell along the transect.

77
Figure 1
Figure 2

78
XXXXXXXXXXXXXXXXXXXXXXXX
15h2 = Groundwater nitrogen level reflects practical load reduction scenario concentrations
Xxxxxxxxxxxxxxxxxxxxx Practical Load Reduction
Appendix A, Figure A.3: Peconic River to Robbins Island Transect - Lowest daily-average surface DO; this is the lowest of the 730 daily-average DO concentrations from the 2-year model run for the surface layer at each grid cell along the Peconic River to Robbins Island Transect.
Xxxxxxxxxxxxxxxxxxxxx Practical Load ReductionXXXXXXXXXXXXXXXXXXXXXXXX
15h2 = Groundwater nitrogen level reflects practical load reduction scenario concentrations
Appendix A, Figure A.4: Peconic River to Robbins Island Transect - Lowest daily-average bottom DO, this is the lowest of the 730 daily-average DO concentrations from the 2-year model run for the bottom layer at each grid cell along the Peconic River to Robbins Island Transect.

79
XXXXXXXXXXXXXXXXXXXXXXXX
15h2 = Groundwater nitrogen level reflects practical load reduction scenario concentrations
Xxxxxxxxxxxxxxxxxxxxx Practical Load Reduction
Appendix A, Figure A.5: Meetinghouse Creek Transect - Lowest daily-average surface DO; this is the lowest of the 730 daily-average DO concentrations from the 2-year model run for the surface layer at each grid cell along the Meetinghouse Creek Transect.
XXXXXXXXXXXXXXXXXXXXXXXX
15h2 = Groundwater nitrogen level reflects practical load reduction scenario concentrations
Xxxxxxxxxxxxxxxxxxxxx Practical Load Reduction
Appendix A, Figure A.6: Meetinghouse Creek Transect - Lowest daily-average bottom DO, this is the lowest of the 730 daily-average DO concentrations from the 2-year model run for the bottom layer at each grid cell along the Meetinghouse Creek Transect.
80
XXXXXXXXXXXXXXXXXXXXXXXX
15h2 = Groundwater nitrogen level reflects practical load reduction scenario concentrations
Xxxxxxxxxxxxxxxxxxxxx Practical Load Reduction
Appendix A, Figure A.7: Terrys Creek Transect - Lowest daily-average surface DO; this is the lowest of the 730 daily-average DO concentrations from the 2-year model run for the surface layer at each grid cell along the Terrys Creek Transect.
XXXXXXXXXXXXXXXXXXXXXXXX
15h2 = Groundwater nitrogen level reflects practical load reduction scenario concentrations
Xxxxxxxxxxxxxxxxxxxxx Practical Load Reduction
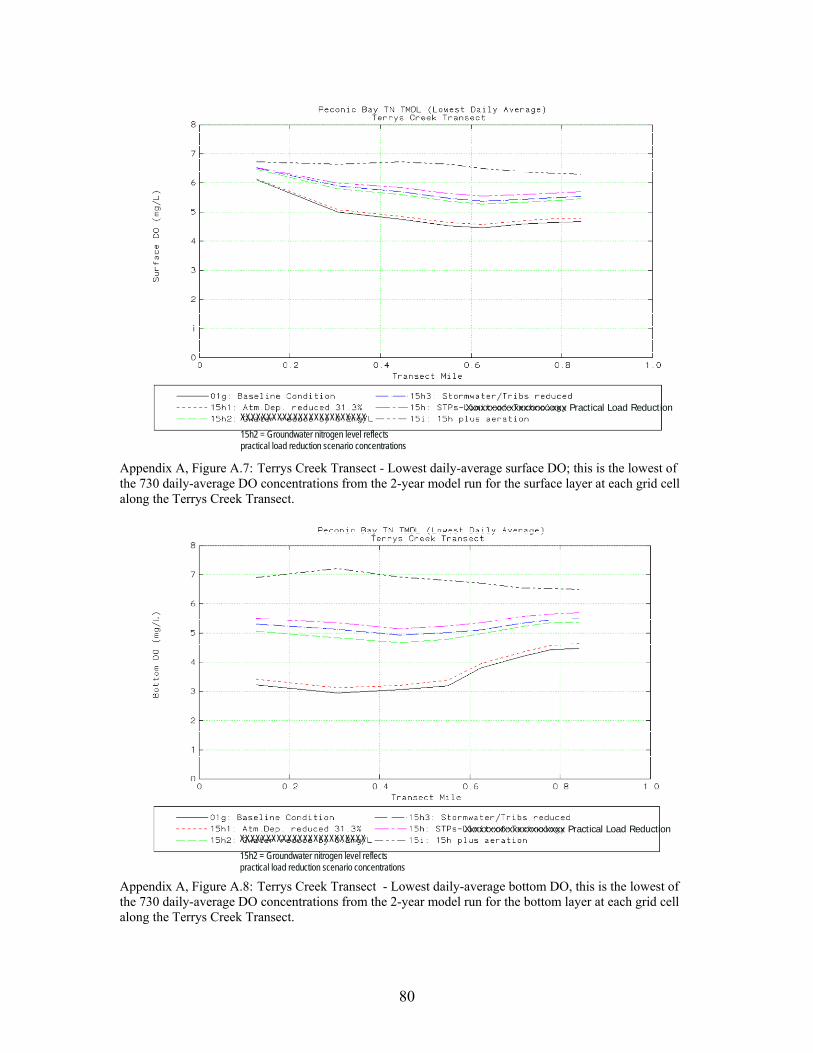
Appendix A, Figure A.8: Terrys Creek Transect - Lowest daily-average bottom DO, this is the lowest of the 730 daily-average DO concentrations from the 2-year model run for the bottom layer at each grid cell along the Terrys Creek Transect.
81
XXXXXXXXXXXXXXXXXXXXXXXX
15h2 = Groundwater nitrogen level reflects practical load reduction scenario concentrations
Xxxxxxxxxxxxxxxxxxxxx Practical Load Reduction
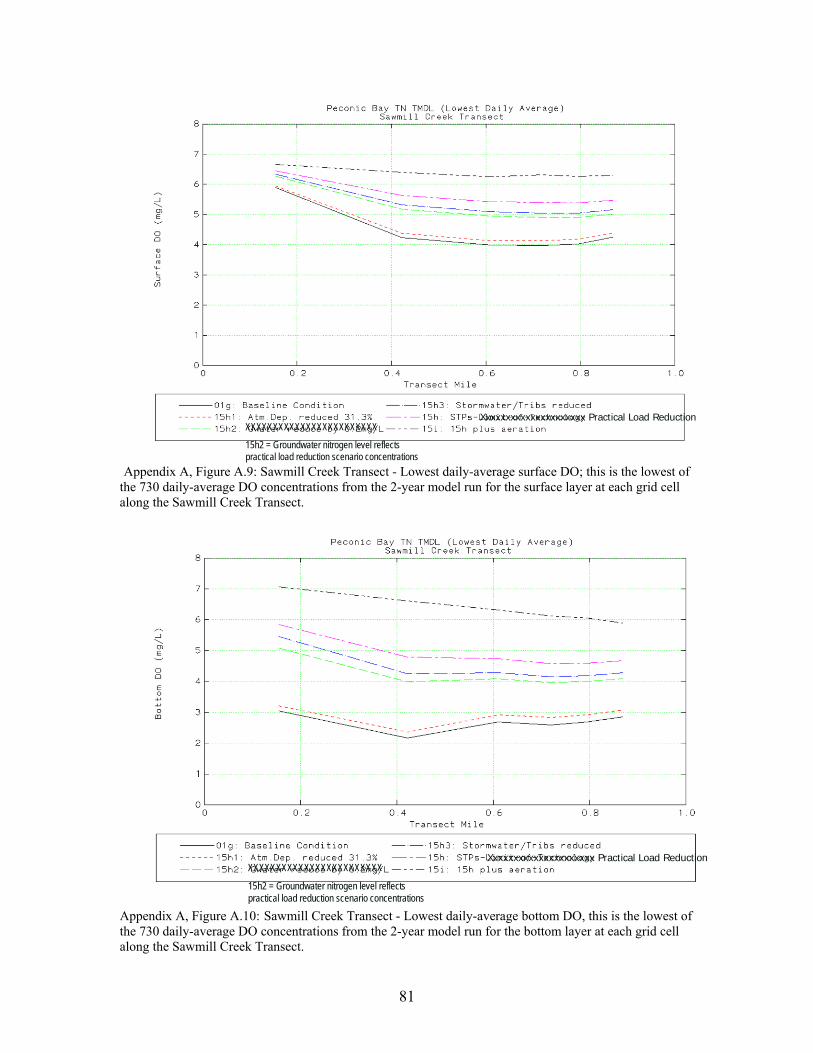
Appendix A, Figure A.9: Sawmill Creek Transect - Lowest daily-average surface DO; this is the lowest of the 730 daily-average DO concentrations from the 2-year model run for the surface layer at each grid cell along the Sawmill Creek Transect.
XXXXXXXXXXXXXXXXXXXXXXXX
15h2 = Groundwater nitrogen level reflects practical load reduction scenario concentrations
Xxxxxxxxxxxxxxxxxxxxx Practical Load Reduction
Appendix A, Figure A.10: Sawmill Creek Transect - Lowest daily-average bottom DO, this is the lowest of the 730 daily-average DO concentrations from the 2-year model run for the bottom layer at each grid cell along the Sawmill Creek Transect.
82
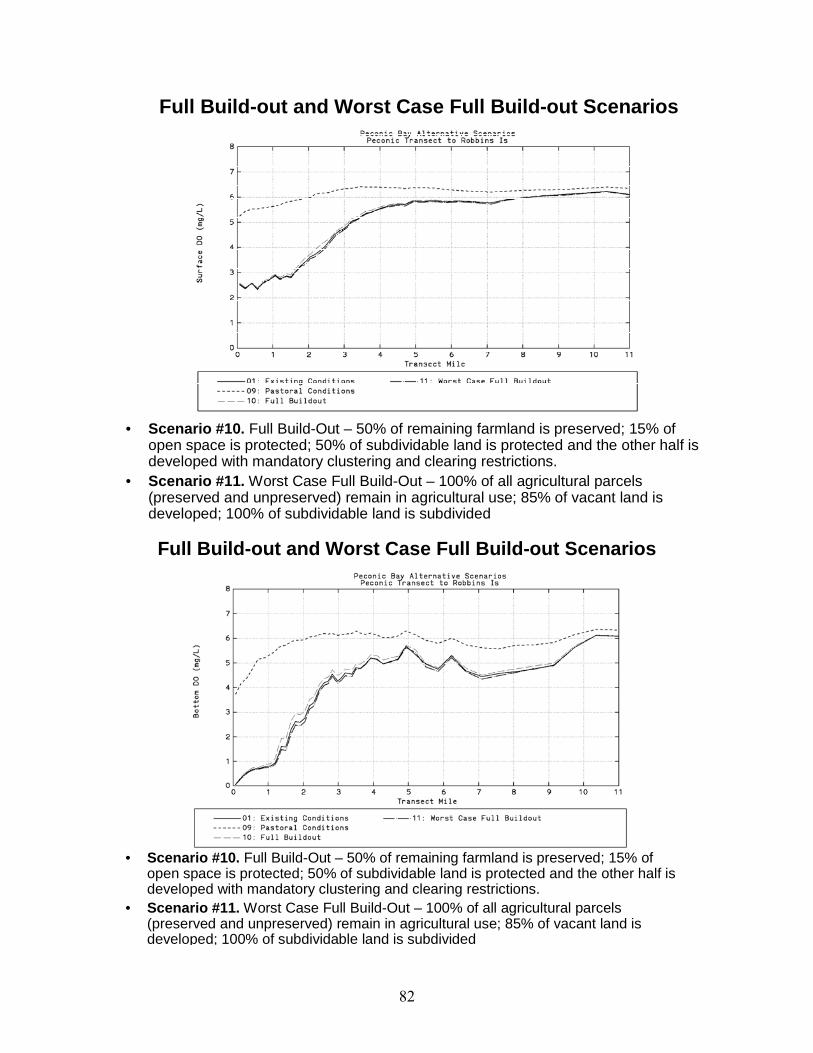
• Scenario #10. Full Build-Out – 50% of remaining farmland is preserved; 15% of open space is protected; 50% of subdividable land is protected and the other half is developed with mandatory clustering and clearing restrictions.
• Scenario #11. Worst Case Full Build-Out – 100% of all agricultural parcels (preserved and unpreserved) remain in agricultural use; 85% of vacant land is developed; 100% of subdividable land is subdivided
Full Build-out and Worst Case Full Build-out Scenarios