ORGANIZATION AND MANAGEMENT OF IRRIGATION SCHEMES IN
EASTERN AMHARA, ETHIOPIA: IN CASE OF SANKA TRADITIONAL AND
GOLINA MODERN IRRIGATION SCHEMES
A Project Paper
Presented to the Faculty of the Graduate School
of Cornell University
in Partial Fulfillment of the Requirements for the Degree of
MPS in Integrated Watershed Management and Hydrology
By
Melisew Misker Belay
January 2012

© 2012 Melisew Misker Belay
ABSTRACT
This study was initiated to evaluate the performance of Sanka traditional irrigation
scheme and Golina small-scale modern irrigation scheme using performance indices.
The technical evaluation was made by looking into selected performance indicators
such as conveyance efficiency, application efficiency, dependability of irrigation
interval and sustainability of irrigated command area. Moreover, availability of
institutional and support services were also investigated through a questionnaire
administered to beneficiary farmers and other stakeholders. Overall activities in
primary data collected included: field observation, interviewing beneficiary farmers,
discharge measurements in the canals, determination of moisture contents of the soil
before and after irrigation and measurement of depth of water applied to the fields. In
addition to primary data, secondary data were collected from the secondary sources.
The results obtained showed that the main canal conveyance efficiency obtained on
the two schemes, Sanka traditional irrigation and Golina modern irrigation, were 45.1
and 98.2%, respectively. Application efficiency monitored on three farmers’ farm
located on different ends of the command ranges from 36.2 to 59.1% and 51.9 to
61.6% at Sanka and Golina irrigation schemes respectively. Dependability of the
schemes evaluated in terms of irrigation interval shows that the schemes irrigate less
frequently than was intended. The sustainability of the irrigated area is 240% at Sanka
and 128% at Golina. Conflict among users is more severe at Sanka than at Golina.
Support services rendered to the beneficiaries were minimal. There were very few
indicators that production was market oriented at Golina; however, production at
Sanka is mainly for household food consumption. In conclusion, the conveyance loss
in Sanka is greater than Golina but in Sanka participation of farmers and sense of
owner ship is rated to be 100%. Therefore, if proper canal and canal structures are in

place and water users associations are empowered more in order for it to enforce its
bylaws; it will augment the efficiency of the scheme exceedingly.

iii
BIOGRAPHICAL SKETCH
The author was born in December 1980 in Addis Zemen, South Gondar. He followed
his elementary and secondary educations at Abebayene elementary school and Addis
Zemen junior and senior secondary school, respectively. He completed his high school
education in 1996 and then joined Debub University, currently Hawassa University,
and graduated with a B.Sc. Degree in Plant Production and Dry Land Farming in July
2000.
The author was working in the Commission for Sustainable Agriculture and
Environmental Rehabilitation in Amhara Region (Co-SEARAR) as an irrigation
Agronomist. Finally, he was employed by Amhara Agricultural Research Institute
(ARARI), Sirinka Agricultural Research Center as Assistant Researcher II in the
Agricultural Water Management Research Division.
In 2011, he enrolled in the School of Graduate Studies at Cornell University for his
MPS in Integrated Watershed Management and Hydrology.

iv
ACKNOWLEDGMENT
First of all, I must thank the Almighty God who helped me to bring this work to the
end.
I feel deeply indebted to express my special gratitude to my instructor and advisor
Prof. Tammo S. Steenhuis for his invaluable advice and professional guidance from
the start of proposal writing to the completion of my research and thesis writing, as
without his assistance this work would have not been successful.
I also extend an extremely indebted thanks to my co-advisor and the program
coordinator Dr. Amy S. Collick for her valuable technical guidance and advice during
the whole period of my study. Many thanks go to Cornell University for offering me
the study opportunity.
I would like to thank my parents and friends for their constant and unlimited
encouragement, concern, understanding, moral and financial support.
Special thanks are due to my best friends Asresie Hassen and Desalegne Tilahun for
their encouragement and help for the accomplishment of this study. I would like to
express my sincere thanks to Ato Birhan Eriku, chairman of Sanka water users
association, and his son for their unreserved help during the field work and
interviewed farmers of both schemes. Acknowledgment is also expressed to the
development agents of both schemes and woreda agricultural department office staffs.

v
TABLE OF CONTENTS
BIOGRAPHICAL SKETCH ......................................................................................... iii
ACKNOWLEDGMENT ............................................................................................... iv
TABLE OF CONTENTS ............................................................................................... v
LIST OF FIGURES ..................................................................................................... viii
LIST OF TABLES ........................................................................................................ ix
LIST OF ABBREVIATIONS ....................................................................................... xi
CHAPTER ONE ............................................................................................................. 1
1 Introduction ............................................................................................................. 1
1.1 Specific Objectives .......................................................................................... 4
CHAPTER TWO ............................................................................................................ 5
2 Description of the systems ...................................................................................... 5
2.1 Golina Medium Scale Irrigation Scheme ......................................................... 5
2.2 Sanka Traditional Irrigation Scheme ............................................................... 8
CHAPTER THREE ...................................................................................................... 10
3 Material and Methods ........................................................................................... 10
3.1 Description of the Study Area ....................................................................... 10
3.1.1 Sanka ...................................................................................................... 10
3.1.2 Golina ..................................................................................................... 10
3.2 Climate ........................................................................................................... 12
3.2.1 Golina irrigation scheme ........................................................................ 12

vi
3.2.2 Sanka traditional irrigation scheme ........................................................ 13
3.3 Technical Efficiency Evaluation .................................................................... 14
3.3.1 Conveyance efficiency ........................................................................... 15
3.3.2 Application efficiency ............................................................................ 19
3.3.3 Dependability of Irrigation Interval ........................................................ 20
3.3.4 Sustainability .......................................................................................... 21
3.4 Institutional and Support Services Assessment ............................................. 21
3.5 Method of Data Analysis ............................................................................... 23
CHAPTER FOUR ........................................................................................................ 24
4 Results And Discussion ......................................................................................... 24
4.1 Technical Efficiency ...................................................................................... 24
4.1.1 Conveyance efficiency ........................................................................... 24
4.1.2 Water application efficiency ................................................................... 26
4.1.3 Dependability of irrigation interval ........................................................ 28
4.1.4 Crops and cropping pattern .................................................................... 29
4.1.5 Irrigation methods .................................................................................. 30
4.1.6 Sustainability of irrigation ...................................................................... 31
4.2 Institutional and Support Service Evaluation ................................................ 32
4.2.1 Organization and Management ............................................................... 32
4.2.2 Water Distribution and Conflict Management ....................................... 34
4.2.3 Training and support service .................................................................. 35
4.3 Food insecurity .............................................................................................. 37
vii
4.4 Labor demand ................................................................................................ 38
4.5 Participation and sense of ownership of the scheme ..................................... 41
4.6 Major problems decreasing the efficiency of the scheme .............................. 42
CHAPTER FIVE .......................................................................................................... 44
5 Conclusion and Recommendation ......................................................................... 44
REFERENCES ............................................................................................................. 45
APPENDICES .............................................................................................................. 47
Appendix A: Additional tables of data and photographs .......................................... 47
Appendix B: Beneficiary Household Questionnaire ................................................ 58
Appendix C: Table of results from the questionairre ............................................... 65

viii
LIST OF FIGURES
Figure 1: Golina irrigation headwork structure .............................................................. 6
Figure 2: Close up view of the diversion from the head structure (in Figure 1) to the
main canal of the Golina irrigation scheme .................................................................... 7
Figure 3: Functional gates on Golina irrigation system ................................................. 7
Figure 4: Head work structure (Sanka Traditional irrigation) ........................................ 9
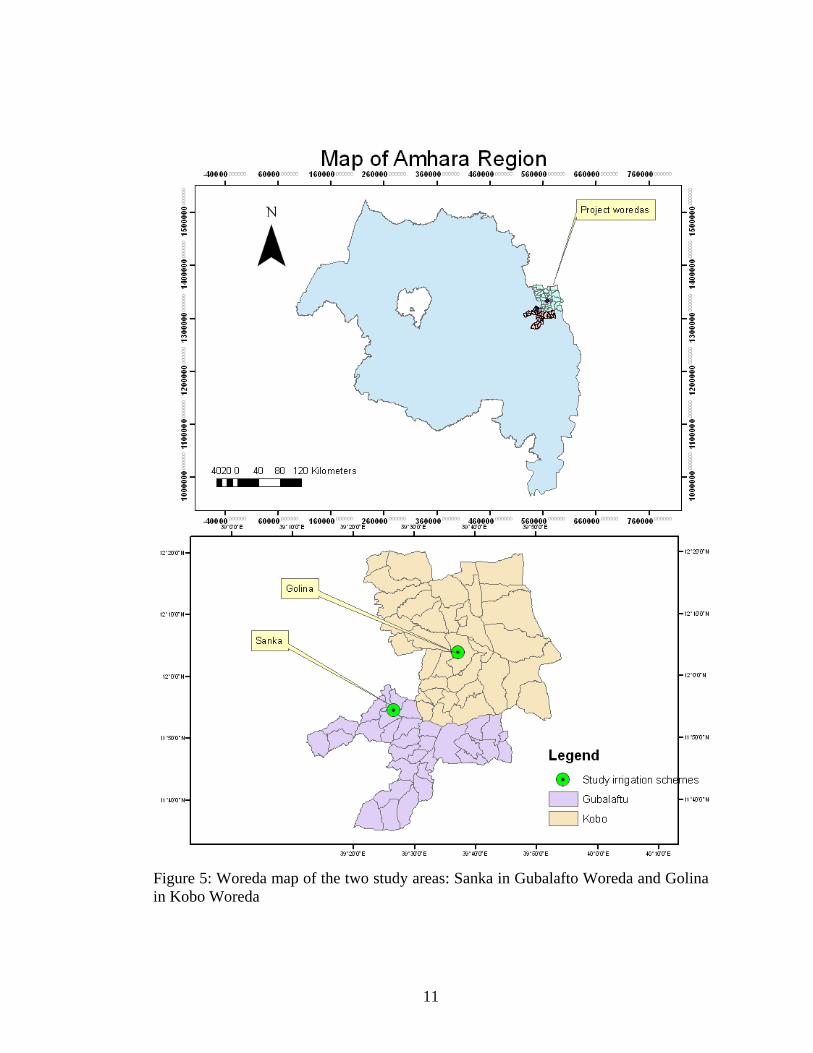
Figure 5: Woreda map of the two study areas: Sanka in Gubalafto Woreda and Golina
in Kobo Woreda ........................................................................................................... 11
Figure 6: Monthly rainfall and PET (at Golina) ........................................................... 13
Figure 7 Monthly rainfall and PET (Sanka) ................................................................. 14
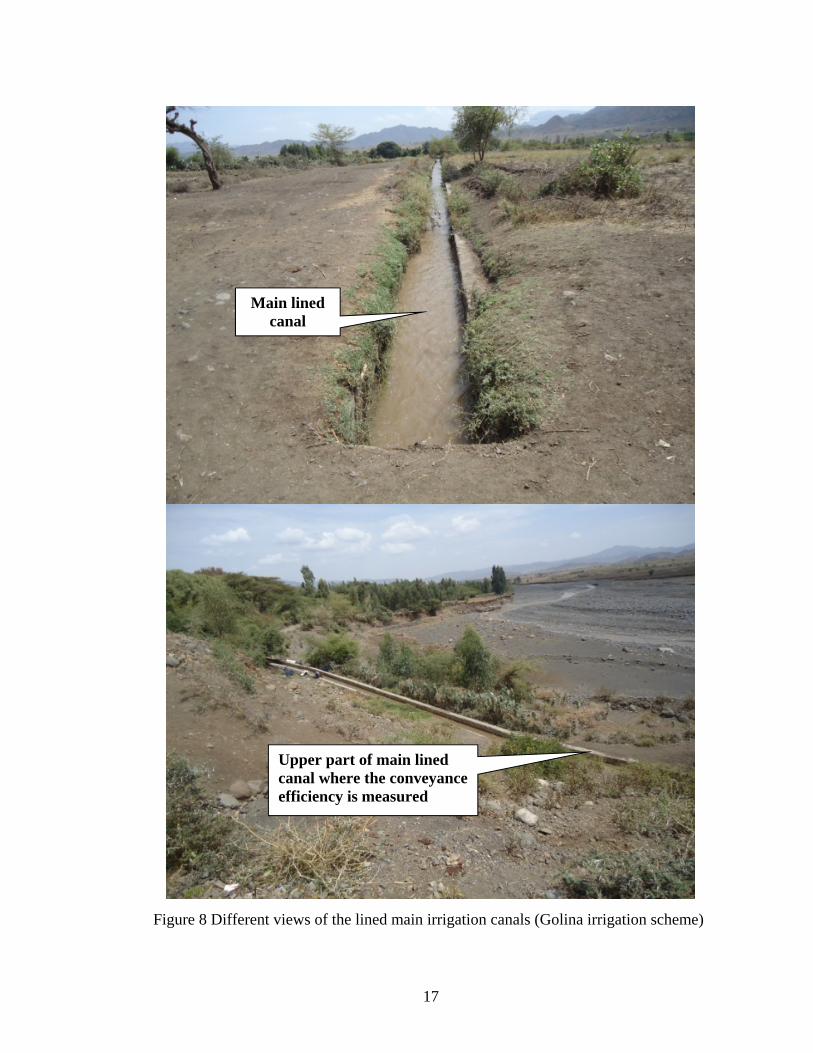
Figure 8 Different views of the lined main irrigation canals (Golina irrigation scheme)
...................................................................................................................................... 17
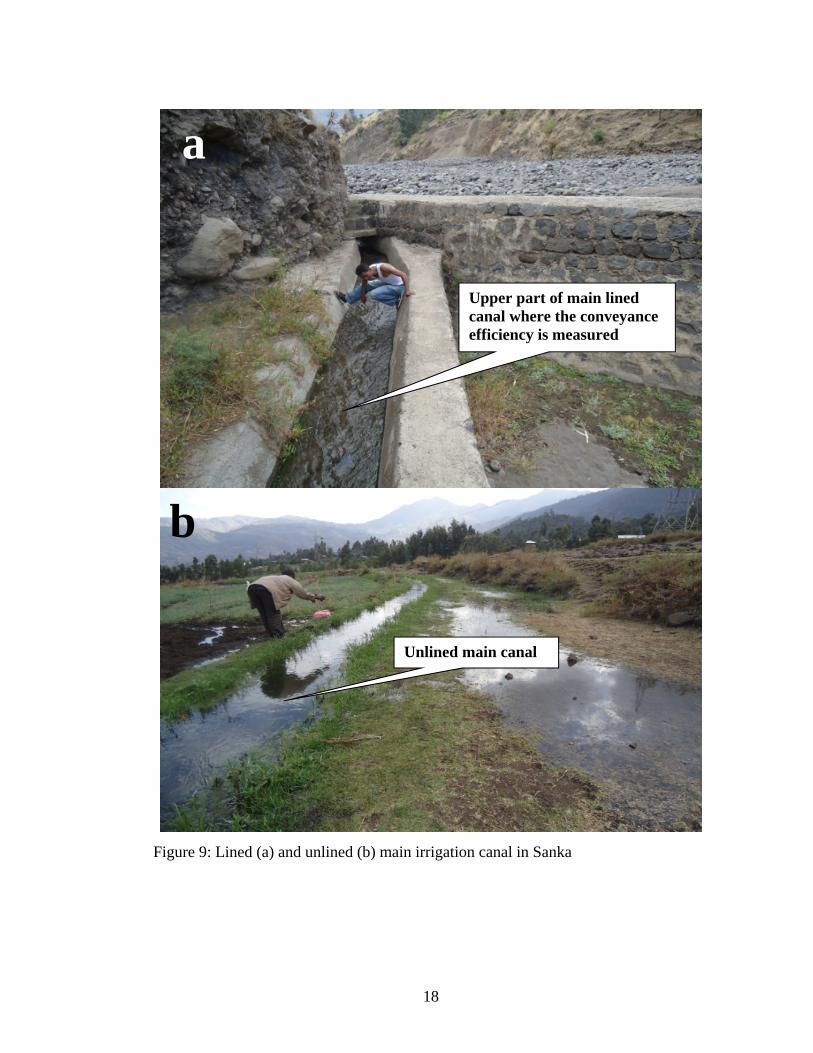
Figure 9: Lined (a) and unlined (b) main irrigation canal in Sanka ............................. 18
Figure 10: Discussion with the beneficiaries of irrigation schemes ............................. 22
Figure 11: Labor demand of female household wives (FHHW), female headed
households (FHH) and male headed households (MHH) in the irrigation season
(Golina irrigation scheme) ............................................................................................ 40
Figure 12: Labor demand for MHH, FHH and FHHW (Sanka irrigation scheme) ..... 41
ix
LIST OF TABLES
Table 1 Computed conveyance efficiency of the upper main (UMC), lower main
(LLC), upper secondary (USC) and lower secondary (LSC) canals for Golina modern
irrigation scheme .......................................................................................................... 25
Table 2 Computed conveyance efficiency of the upper main (UMC), lower main
(LLC), upper secondary (USC) and lower secondary (LSC) canals for Sanka
traditional irrigation scheme ......................................................................................... 25
Table 3 Irrigation water measurement result at Golina modern irrigation scheme ...... 26
Table 4 Irrigation water measurement results at Sanka traditional irrigation scheme . 27
Table 5 Application Efficiency (Golina modern irrigation scheme) ............................ 27
Table 6 Application Efficiency (Sanka traditional irrigation scheme) ......................... 28
Table 7 Dependability of irrigation interval that compares the intended to the actual
(Golina irrigation scheme) ............................................................................................ 28
Table 8 Dependability of irrigation interval that compares the intended to the actual
(Sanka irrigation scheme) ............................................................................................. 29
Table 9 Type of crop produced using irrigation (Golina irrigation scheme) ............... 29
Table 10 Type of crop produced using irrigation (Sanka irrigation scheme) ............... 30
Table 11 Method of irrigation adopted by farmers (Golina irrigation scheme) ........... 31
Table 12 Method of irrigation adopted by farmers (Sanka irrigation scheme) ............ 31
Table 13 Occurrence of conflict among users at Sanka traditional irrigation scheme . 34
Table 14 Occurrence of conflict among water users at Golina irrigation scheme ....... 34
Table 15 Government support service type and magnitude to the irrigation scheme
(Golina) ......................................................................................................................... 36
Table 16 Major problems that make the scheme inefficient (Golina irrigation scheme)
...................................................................................................................................... 42

x
Table 17 Major problems that make the scheme inefficient (Sanka irrigation scheme)
...................................................................................................................................... 43

xi
LIST OF ABBREVIATIONS
ARARI Amhara Region Agricultural Research Institute
ANRSWB Amhara National Regional State Water Bureau
Co-SAERAR Commission for Sustainable Agriculture and Environmental
Rehabilitation in Amhara Region
DA Development Agent
Ea Application Efficiency
ET Evapotranspiration
FAO Food and Agricultural Organization
Ha Hectare
HH Household
FHH Female Head Households
FHHW Female Household Wives
KGVDP Kobo Girana Valley Development Program
MHH Male headed households
PRA Participatory Rural Appraisal
PET Potential Evapotranspiration
SPSS Statistical Package for Social Sciences
USDA United States Development Agency
WUA Water Users Association
1
CHAPTER ONE
1 INTRODUCTION
Food security in developing nations is aggravated by the rapid population growth and
the consequent demand for food. Exacerbating this increased food demand, there has
been a significant rise in prices of food products in the world market. Consequently, to
better meet the demand for food and reduce the impact of inflated food prices,
substantial investments in modifying existing farming systems or establishing new
ones will be necessary (FAO, 1997).
As an extreme example, many parts of Ethiopia have faced food insecurity for the past
three decades. In addition to and as a consequence of increases in population,
continuous land degradation, excessive deforestation, erratic and unreliable rainfall
and other factors have eroded assets and crippled coping mechanisms of farm
households. Recurrent drought has had a long lasting effect on the livelihood of
agricultural communities and the whole economy. As a consequence, both acute and
chronic hunger and malnutrition occur among many Ethiopians even when there are
good harvests during normal times (Catterson et al., 1999).
As a dramatic change to a mostly rain-dependent farming system, irrigated agriculture
was thought to be one of the solutions to enhance food security in the country. Since
its initial promotion, irrigated agriculture in Ethiopia still only comprises a small
fraction of total cultivated area; of the 4.3 million hectares that can be irrigated, only
247,470 ha are irrigated. From this irrigated area, 56% are traditional schemes, 19%

2
are small-modern scale schemes and 25% covered by medium to large modern scale
schemes (Tilahun and Paulos, 2004).
As a regional strategy of water resources development, irrigated agriculture has
become the main intervention to mitigate recurrent drought and thereby improve food
security and income of the rural population in Amhara Region (ANRSWB, 2005).
Although Amhara encompasses four river basins, traditional to modern irrigation
covers less than 2% of 0.57 million ha, the total irrigable area in the region. Currently,
more than 6,200 small scale irrigation schemes of which 95% are traditional exist in
the region. Furthermore, modern schemes cover only 1.4% of the potentially irrigated
area. Interestingly, the irrigation schemes are owned by more than 330,000 households
(or more than 1.9 million people) with an average irrigated land holding of 0.2 ha.
Nevertheless, Ethiopian irrigation projects, in most cases, have failed to significantly
enhance the livelihoods of rural communities or substantially impact food security.
The World Bank, various development agencies and numerous countries have invested
in large irrigation projects, but there is disagreement on whether investing in new
irrigation projects is appropriate because of the less than satisfactory performance of
existing projects (Burt and Styles, 1999). Most of the government initiated and
community-managed projects are confronted with multifaceted technical and socio
economic problems, which have resulted in low land, water and labor productivity.
The lack of operation autonomy and little sense of ownership on the parts of the
beneficiaries are common problems in the majority of small-scale irrigation schemes.
However, no comprehensive studies have been conducted to explore the causes of
these unsuccessful irrigation efforts and to generate potential solutions to improve the
overall efficiencies of the irrigation schemes with the user communities.

3
For example, water use efficiencies in developing countries are typically 30-50%, and
in some areas, only 20-30%. Yet few effective water conservation programs exist, and
most countries do not monitor irrigation system performance and management
(Hennessy, 1993). Furthermore, water shortages have become more frequent and
farmers often face deficiencies in water deliveries, resulting in reduced yields and
incomes. Poor management of available water for irrigation, both at system and farm
levels, has led to a range of problems and further aggravated water availability and has
reduced the benefits of irrigation investments (FAO, 1996).
According to James (1988), farm irrigation systems are designed and operated to
supply the individual irrigation requirements of each field on the farm while
controlling deep percolation, runoff, evaporation, and operational losses. The
performance of a farm irrigation system is determined by the efficiency with which
water is diverted, conveyed, and applied, and by the adequacy and uniformity of
application in each field on the farm. Consequently, optimal water use efficiency in
any irrigation system depends on maximizing water use efficiency, maintaining good
water quality and preventing salinization of irrigation water and these require
improved quality and reliable water delivery to the field (Burt and Styles, 1999).
Field evaluations of irrigation schemes or systems play a fundamental role in
generating information and data to improve surface irrigation systems (Pereira and
Trout (1999) as cited in Solomon (2006)). Evaluations result in an estimate of the
efficiency of the system as it is being used, a measure of how effectively the system
can be operated and whether it can be improved, information that will assist engineers
to design other systems and comparison of various methods, systems, and operating
procedure as a base for economic decisions. Finally, these results then can be used to

4
offer effective advice to the irrigators on how to improve their systems and
management practices.
The performance of irrigation operation has to be evaluated periodically, both at the
system- and at farm-levels, using indicators that have been established. The results and
recommendations of the evaluation exercises, when implemented, contribute towards
maintaining the sustainability of the farms, for economic utilization of the limited
water resource and generation of new data and information for the design and
operation of new irrigation schemes. Huge expectation of the irrigation development
to alleviate poverty versus inability to sustainably utilize them call for detailed
explanation on the relative contribution of technical, support service and institutional
problems contributing for the under performance of the irrigation schemes. Hence, this
study evaluated the performance of a small-scale and a traditional irrigation schemes
in Golina, and Sanka, respectively.
1.1 Specific Objectives
The specific objectives of the study were:
To evaluate the performance of Golina small-scale irrigation scheme and Sanka
traditional irrigation scheme in terms of technical efficiencies.
To assess the institutional and support service problems prevailing in the irrigation
schemes.

5
CHAPTER TWO
2 DESCRIPTION OF THE SYSTEMS
2.1 Golina Medium Scale Irrigation Scheme
Golina small scale irrigation project is a river diversion irrigation project studied and
designed by Kobo-Alamata Agricultural Development Project and funded by
Ethiopian and Italian governments and United Nations Development Program (UNDP)
in 1985. In 1986, the headwork (weir and delivery canal) (Figure 1) construction was
started by Ethiopian Water Works Construction Enterprise in 1986; however, it was
suspended for some years due to security problems and finally completed in 1998.
Design of the infrastructure was carried out by the Ministry of Water Resource
Development, and in 1998 the construction was started by a Chinese construction
company and completed in 2000. The development of the irrigation scheme began in
the dry season of 2001.
The Golina irrigation project command area encompasses 400 ha downstream of
Aradom village on the left side of Golina River. The diversion weir (Figure 2) is
located upstream of Golina bridge (bridge constructed on the Addis –Mekelle road).
The total length of the delivery canal is 1.3km; 0.6km lined and 0.7km earthen. The
delivery canal operates continuously for 24 hours, providing water during the day to
the 1.4km main canal #1 and during the night to the night storage reservoir, which
flows to the 2.8km main canal #2, each irrigating 200ha.
The irrigation system also has a network of secondary and tertiary irrigation canals,
drainage canals and service roads. Other structures like night storage, road crossing
6
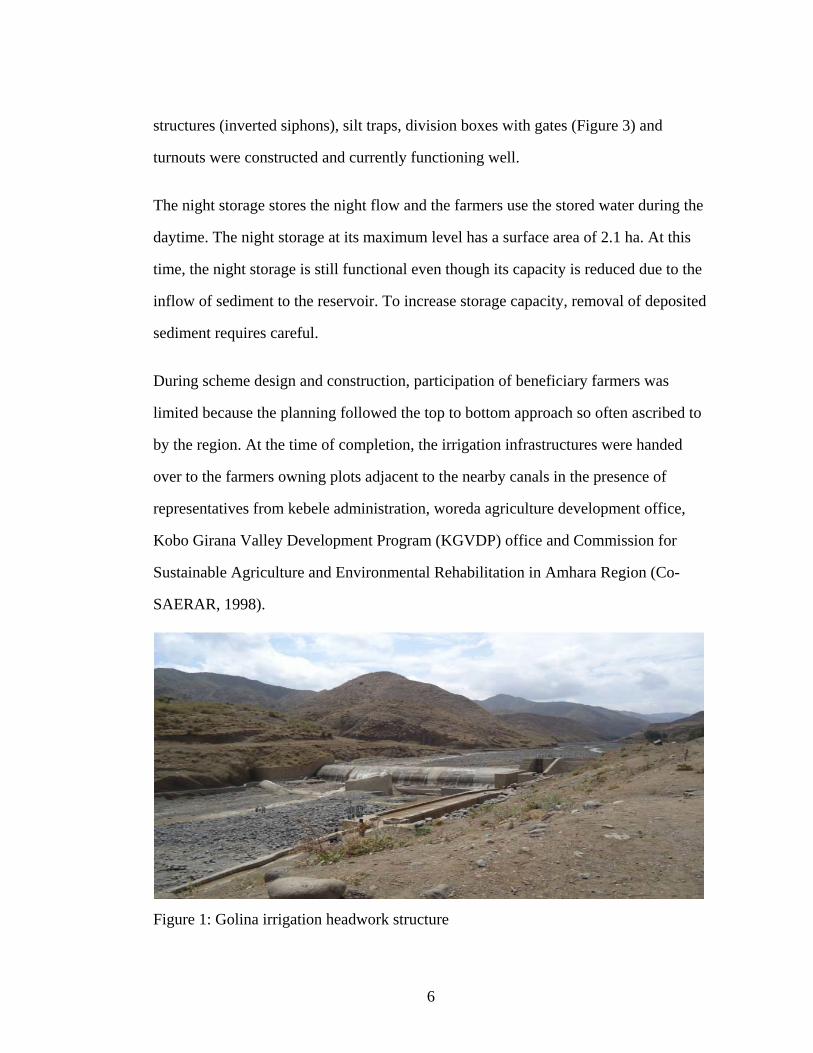
structures (inverted siphons), silt traps, division boxes with gates (Figure 3) and
turnouts were constructed and currently functioning well.
The night storage stores the night flow and the farmers use the stored water during the
daytime. The night storage at its maximum level has a surface area of 2.1 ha. At this
time, the night storage is still functional even though its capacity is reduced due to the
inflow of sediment to the reservoir. To increase storage capacity, removal of deposited
sediment requires careful.
During scheme design and construction, participation of beneficiary farmers was
limited because the planning followed the top to bottom approach so often ascribed to
by the region. At the time of completion, the irrigation infrastructures were handed
over to the farmers owning plots adjacent to the nearby canals in the presence of
representatives from kebele administration, woreda agriculture development office,
Kobo Girana Valley Development Program (KGVDP) office and Commission for
Sustainable Agriculture and Environmental Rehabilitation in Amhara Region (Co-
SAERAR, 1998).
Figure 1: Golina irrigation headwork structure

7
Figure 2: Close up view of the diversion from the head structure (in Figure 1) to the main canal of the Golina irrigation scheme
Figure 3: Functional gates on Golina irrigation system
8
2.2 Sanka Traditional Irrigation Scheme
Sanka traditional irrigation project is a river diversion irrigation project where water
from Gimbora River is traditionally diverted using simple stone bund and straw. The
headwork site is selected and constructed by farmers themselves by their indigenous
knowledge and locally available material (Figure 4). This traditional irrigation practice
was started in 1958 (according to the Ethiopian calendar (EC)) by the community. At
the start, it was able to irrigate only 50 ha and run one flourmill. However, since 1985
EC, the intake structure and 15m protection wall was constructed by concrete and
financially supported by the government. Initially, the gullies were crossed by a flume
hollowed out from a stem of a big tree, and then when the number of beneficiaries is
increasing they changed in to a well done flume made from iron sheet. In addition to
this, by redesigning the canal alignment, currently they are able to irrigate about 120
ha. Farmers have channeled the water to the intake structure constructed traditionally
from stones and hay. In this case farmers are forced to reconstruct the structure every
year. When unexpected rain comes and removes the structure they are also required to
repair it.

9
Figure 4: Head work structure (Sanka Traditional irrigation)
The total length of the main canal supplying irrigation water from the sources is about
4.4 km of which 50m is a lined canal at the beginning and after crossing the main road
connecting Woldia and Bahir Dar, 30m lined canal constructed by the farmers, or
direct benefactors. The remaining is an earthen canal. A number of secondary and
tertiary canals branch out from the main canal to irrigate different blocks within the
command area. The first two secondary canals irrigate the upper side of the command
area. The remaining three secondary canals irrigate the command at Erobi, Geshober
and Godguadit villages.

10
CHAPTER THREE
3 MATERIAL AND METHODS
3.1 Description of the Study Area
The study was carried out at two irrigation schemes in the Amhara National Regional
State (ANRS): one traditional scheme, Sanka, and one modern scheme, Golina.
3.1.1 Sanka
Sanka is in Gubalafto Woreda situated in the North Wollo Administrative Zone on the
main road from Woldia to Bahir Dar approximately 35km from Woldia (Figure 5).
Sanka is geographically situated at 11053’43.2” N longitude and 39027’7.0” E latitude
with an elevation of 2100 meters above sea level (masl).
3.1.2 Golina
Golina irrigation scheme is located downstream of Aradom Village in Menjero (08)
Kebele, Kobo Woreda also in the North Wollo Administrative Zone (See Figure 5).
The scheme is located 8 km from Kobo and 43 km from Woldia town on the main
asphalt road between Addis and Mekelle. The geographical location is
12o04’81’’North, 39o37’65’’East with an elevation of 1486m.a.s.l. at the irrigation
scheme’s weir site.
11
Figure 5: Woreda map of the two study areas: Sanka in Gubalafto Woreda and Golina in Kobo Woreda

12
3.2 Climate
3.2.1 Golina irrigation scheme
The area receives 683 mm average rainfall annually. About 20% of the rainfall is
received in the months of February to March, considered the minor rainy season, and
the remaining rain is received during the months of July and August, the main rainy
season. Late onset, early secession and uneven distribution of the rains shorten the
effective rainy season and results in late dry spells. Therefore, rainfed cropping is
often unreliable, and there is recurrent drought. It is found in the kola agro-ecological
zone.
The mean annual maximum and minimum temperature are 30.5 and 15.50C,
respectively. In the area, the maximum reference evapotranspiration (ETO) is 6.29
mm/day during May and June. Meteorological data such as relative humidity, sunshine
hours, wind speed and rainfall from Kobo meteorological station is used to compute
the crop water requirement and the intended irrigation interval. Adjustment to crop
coefficient (Kc) and depletion fraction (P) had been made according to Allen et al. (1998).
The monthly PET values at Golina are much higher than that of the monthly rainfall
except in the months of July and August (Figure 6). This means irrigation is very
indispensable in most of the months.

13
Figure 6: Monthly rainfall and PET (at Golina)
Topographically, the command area is a flat plain and ranges between 1495 and
1570masl. The relatively uniform topography of the command area provides a good
slope for surface irrigation.
3.2.2 Sanka traditional irrigation scheme
The area has a bimodal rainfall pattern with the main rainy season during summer
from July to August. The remaining months have an irregular rain which differs from
season to season. The mean annual rainfall is 1,026.6 mm. It is found in the
woynadega agro-ecological zone.
The mean annual maximum and minimum temperature is 26.4 and 13.80c,
respectively. The maximum ETO is 5.1 mm/day occurring in May and June.
Meteorological data from Woldia and Sirinka meteorological station is used to
compute the crop water requirement and the intended irrigation interval.
Similar to Kobo in Sanka the monthly PET is higher than that of the rainfall except in
the months of July and August (Figure 7). Therefore supplemental and dry season
irrigation is imperative to make crop production much secured.

14
Figure 7 Monthly rainfall and PET (Sanka)
The topography of the command area ranges between 2180 and 2098 masl. It is
undulating with a slope ranging from 5- 10%. Most of the command area is found
within the village limits surrounding homesteads.
3.3 Technical Efficiency Evaluation
Technical evaluation was conducted using technical efficiency indicators including
conveyance efficiency, application efficiency and dependability of irrigation interval
and sustainability of irrigation. Measurements were made on the field, and for the
modern scheme, design figures were reviewed from secondary sources including the
design document. The water application efficiency was measured two times during the
growing season starting at the initial stage and mid stage of the crop; the conveyance
efficiency is measured twice in the main irrigation time during January at Sanka and
March at Golina irrigation schemes.
Three sample research plots which belong to three farmers were chosen purposely
from the head, middle and tail ends of the scheme, and all the necessary measurement
and data collection were conducted at both schemes. At Golina the sizes of each plot
were 253 m2, 409.5 m2 and 570 m2. Water is diverted to the farms from the secondary
0
50
100
150
200
250
300
J F M A M J J A S O N D
Rainfall
PET

15
canals 1 and 2. The water from the secondary canals reaches each plot through
separate tertiary channels. All the plots chosen for the study were planted with the
local variety of hot pepper.
On the other hand, in Sanka, the plot areas were 350 m2, 748 m2 and 375 m2. Similar
to Golina, separate tertiary channels in Sanka delivered water to each plot. All the
plots chosen for study were planted with maize.
3.3.1 Conveyance efficiency
The conveyance efficiency was measured twice on the main canal by measuring
discharge at two different points. The discharge was calculated by the floating method
in which the velocity of the water flowing in the main canal was estimated by timing
the passage over a predetermined distance of the canal of some material floating on
the water surface. The estimated velocity then was multiplied by the cross sectional
area of the particular section of the canal to obtain the discharge.
The first measurement of discharge was conducted in the upper position of the main
canal. In this canal section, the cross-section of the channel was lined, uniform and
rectangular in shape as seen in Golina in Figure 8 and in Sanka in Figure 9a.
Since the main canal had a rectangular lined section for part of the system, the test site
was ideal for flow measurement. The length of the canal section considered for
discharge measurement was taken. Floating material (dried cow dung) was put on the
upper end of this canal section and the time it took to reach the length of the canal
section was recorded. This test was replicated three times and the average time was
used. To obtain a per meter velocity, the total length of the section was divided by the
average time obtained.

16
The cross sectional area of the canal was also estimated by measuring the average
depth and width of this same canal section. Then, by multiplying the cross sectional
area (A) with the average flow velocity (V), an average discharge was calculated.
The second measurement was taken starting from the 880 and 600 m mark
downstream from the first test site at Sanka and Golina, respectively. The comparison
of discharge from the first site and this second site provided an estimate of the
conveyance loss, or the decrease in discharge from the first to second measurement,
and average conveyance efficiency was calculated.
Ec = Vd/Vc Eq. 1
Where, Ec is the conveyance efficiency (%), Vc is water flowing (m3/sec) into the
canal section and, Vd is water flowing (m3/sec) out of the section.
17
Figure 8 Different views of the lined main irrigation canals (Golina irrigation scheme)
Upper part of main lined canal where the conveyance efficiency is measured
Main lined canal
18
Figure 9: Lined (a) and unlined (b) main irrigation canal in Sanka
a
b
Upper part of main lined canal where the conveyance efficiency is measured
Unlined main canal

19
3.3.2 Application efficiency
The application efficiency was calculated from the fields of three farmers that were
growing pepper in Golina and maize in Sanka, and situated in the top, middle and
lower end of the water source. The soil samples were taken from the pits excavated
from the test plots. The textural analysis was done in Sirinka Agricultural Research
Center soil laboratory using the hydrometric method. The soil textural classes were
determined using United States Development Agency (USDA) soil textural triangle.
For moisture content determination soil samples were taken to the laboratory two
times at two growth stages (initial stage and mid stage) of the crop per plot. For every
three plots, soil samples were taken before irrigation and two days after irrigation from
0 - 30 cm, and 30 – 60 cm depths per test pit. Samples were initially weighed with a
sensitive balance immediately after sample collection on the field. Water content was
then measured gravimetrically by weighing the sample after oven drying at105oC for
24 hours.
To determine the amount of water applied by the irrigators to the field, three inch (3’’)
Parshall flumes were installed at the entrance of test plot. Frequent readings were
taken when the farmers were irrigating the test plots. Irrigation continued until the
farmers’ thought that enough water had been applied to the field. When the irrigator
completed irrigating the test plot, the average depth of irrigation water passing through
the flume and the respective time were recorded for each test plot being irrigated. The
discharge was then calculated using the following equation:
Qf = Cf W(hu )nf Eq. 2
Where W is throat width of the Parshall flume, hu is depth of water flow in the flume,
Cf and nf flow coefficients
20
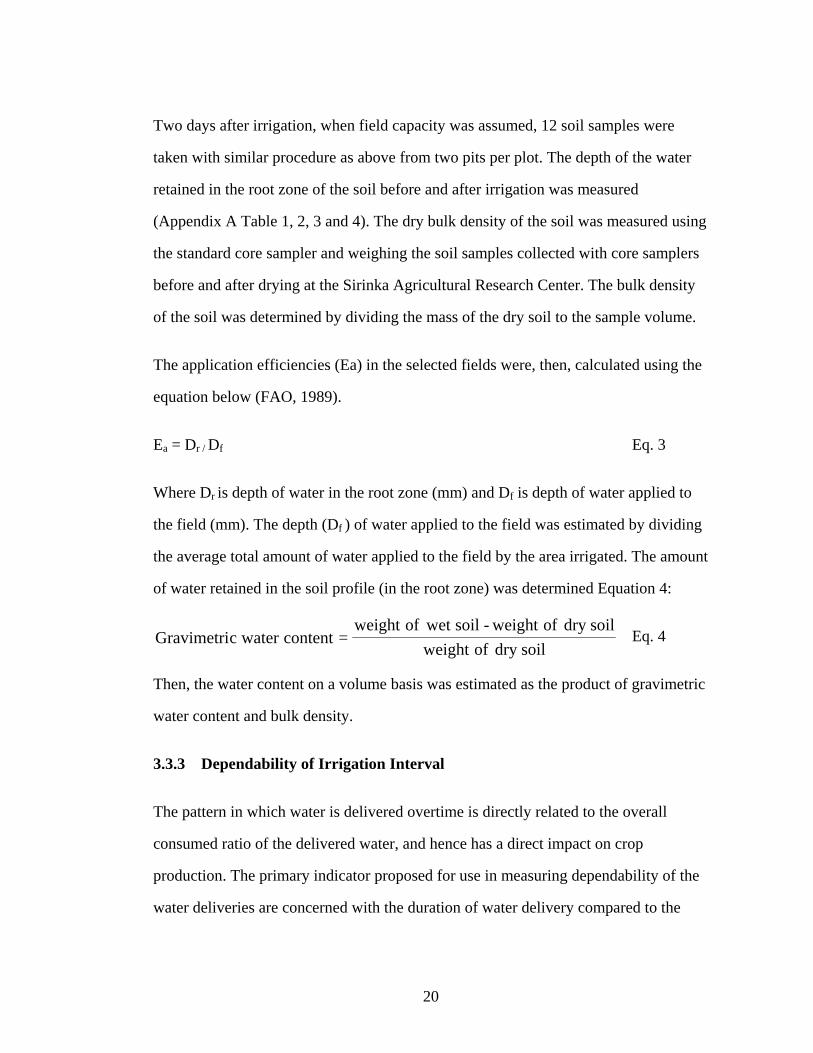
Two days after irrigation, when field capacity was assumed, 12 soil samples were
taken with similar procedure as above from two pits per plot. The depth of the water
retained in the root zone of the soil before and after irrigation was measured
(Appendix A Table 1, 2, 3 and 4). The dry bulk density of the soil was measured using
the standard core sampler and weighing the soil samples collected with core samplers
before and after drying at the Sirinka Agricultural Research Center. The bulk density
of the soil was determined by dividing the mass of the dry soil to the sample volume.
The application efficiencies (Ea) in the selected fields were, then, calculated using the
equation below (FAO, 1989).
Ea = Dr / Df Eq. 3
Where Dr is depth of water in the root zone (mm) and Df is depth of water applied to
the field (mm). The depth (Df ) of water applied to the field was estimated by dividing
the average total amount of water applied to the field by the area irrigated. The amount
of water retained in the soil profile (in the root zone) was determined Equation 4:
soildryofweight
soildryofweight-soilwetofweight=contentwatercGravimetri Eq. 4
Then, the water content on a volume basis was estimated as the product of gravimetric
water content and bulk density.
3.3.3 Dependability of Irrigation Interval
The pattern in which water is delivered overtime is directly related to the overall
consumed ratio of the delivered water, and hence has a direct impact on crop
production. The primary indicator proposed for use in measuring dependability of the
water deliveries are concerned with the duration of water delivery compared to the

21
plan, and the time between deliveries compared to the plan (Clemmens and Bos,
1990).
dayservalintirrigationIntended
dayservalintirrigationActual=ervalintirrigationofityDependabil Eq. 5
3.3.4 Sustainability
According to (Bos et al, 1997) the sustainability of irrigation with respect to
maintenance is best explained by the sustenance of the resources without
compromising the environmental aspects and productivity. This may include the
expected amount of land to be irrigated, the amount and quality of irrigation water and
others. Accordingly, the sustainability of irrigable area is used as an indicator
(parameter) to measure the technical performance of the scheme. It is the ratio of
current total area under irrigation to the initial total irrigable area.
areairrigabletotalInitial
areairrigabletotalCurrent=areairrigableoflitySustainabi Eq. 6
3.4 Institutional and Support Services Assessment
The institutional and support services situation was assessed with the help of
community meetings of all the dwellers and beneficiaries, interviews of sample
community members, interviews with development agents (DAs) and Woreda
Agriculture and Rural Development Office and focus group discussions.
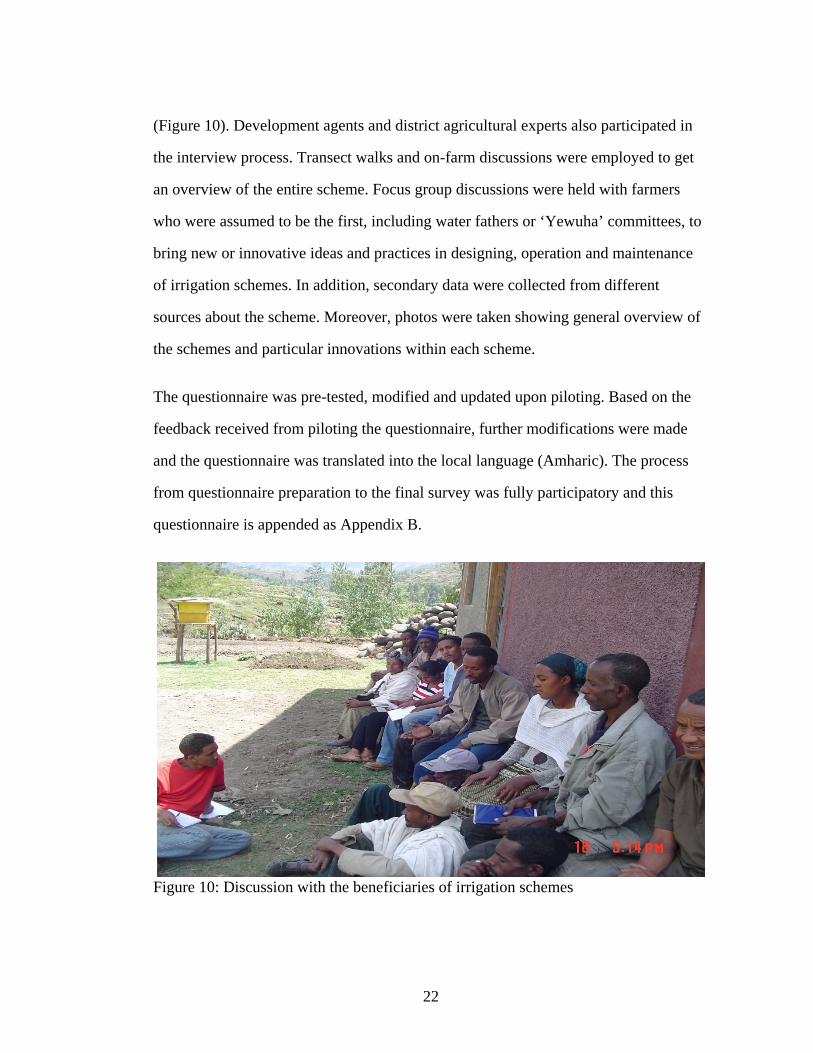
Primary data were collected by surveying the beneficiaries of the irrigation schemes
by conducting a questionnaire with 60 household beneficiaries from the Sanka
irrigation scheme and 60 from the Golina. Among these 20% of the interviews were
female headed households. Various discussions with water users, elders and leaders of
the schemes were conducted using informal tools and semi structured interviews,
22
(Figure 10). Development agents and district agricultural experts also participated in
the interview process. Transect walks and on-farm discussions were employed to get
an overview of the entire scheme. Focus group discussions were held with farmers
who were assumed to be the first, including water fathers or ‘Yewuha’ committees, to
bring new or innovative ideas and practices in designing, operation and maintenance
of irrigation schemes. In addition, secondary data were collected from different
sources about the scheme. Moreover, photos were taken showing general overview of
the schemes and particular innovations within each scheme.
The questionnaire was pre-tested, modified and updated upon piloting. Based on the
feedback received from piloting the questionnaire, further modifications were made
and the questionnaire was translated into the local language (Amharic). The process
from questionnaire preparation to the final survey was fully participatory and this
questionnaire is appended as Appendix B.
Figure 10: Discussion with the beneficiaries of irrigation schemes

23
3.5 Method of Data Analysis
Data collected to evaluate the technical adequacy of the scheme were analyzed
descriptively but separately for both schemes. The data collected through
questionnaires were analyzed descriptively using Statistical Package for Social
Science (SPSS).

24
CHAPTER FOUR
4 RESULTS AND DISCUSSION
4.1 Technical Efficiency
The prevailing parameters assessed for technical efficiency of the scheme included
conveyance efficiency, application efficiency, dependability of duration and
dependability of irrigation interval for both schemes.
4.1.1 Conveyance efficiency
The conveyance efficiency of the main canal monitored during this study at Golina
and at Sanka is presented in Table 1 and 2, respectively. Loses of irrigation water in
the conveyance system can be a major component of the overall water losses
particularly for farms located at distance from water sources where the main canals are
long, unlined and aligned on hillsides (Appendix A Figure 1, 2, 3 and 4). Overtopping
of canals also was considered in conveyance loss (Appendix A Figure 2). The quantity
of loss depends on quality of operation, and maintenance, and the nature of the soil
that affects the seepage rate.
As seen in Table 1, the conveyance efficiency for Golina modern irrigation scheme
measured at a distance of 600m is 98.3% and 92.6% at the main canal and secondary
canal, respectively. The amount of water lost in the main canal is estimated to be
0.001m3 per second (1L/sec). In the secondary canal the amount of water lost is
0.003m3 per second (3 L/sec) which is higher as compared to the main lined canal.
While the conveyance efficiency in the main canal at Sanka traditional irrigation
scheme is 45.2% and 31.5% on the secondary canal (Table 2). For the 880 m distance
25
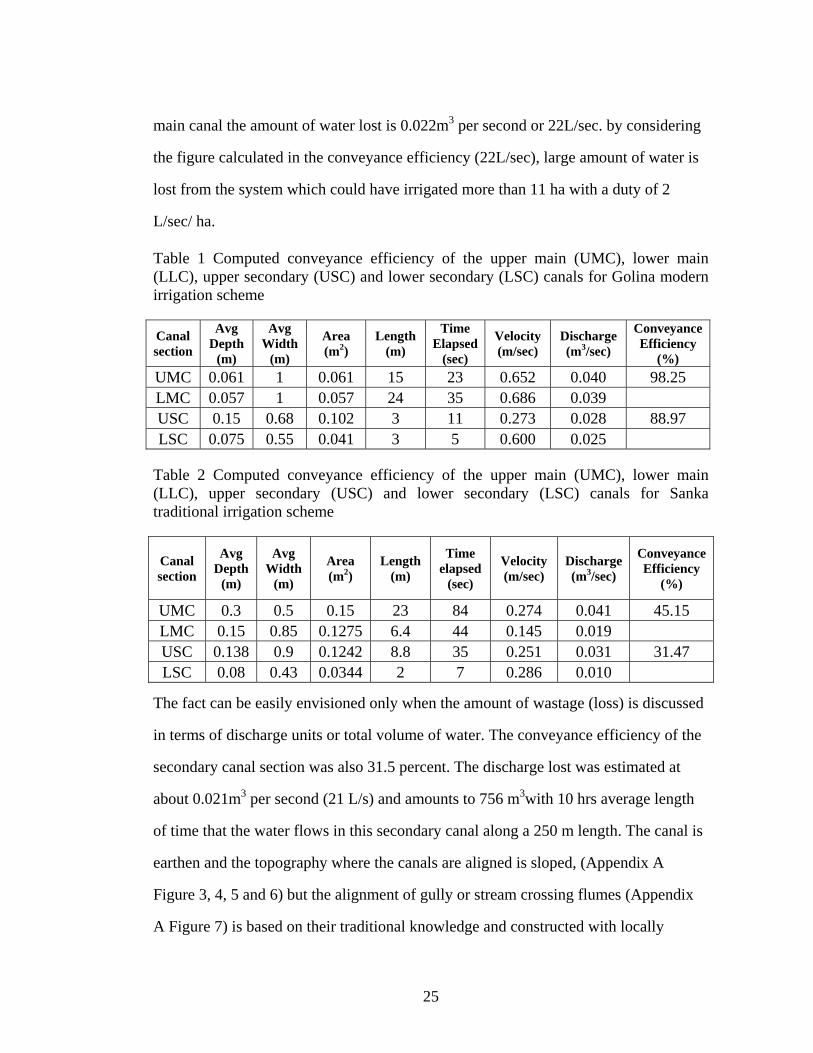
main canal the amount of water lost is 0.022m3 per second or 22L/sec. by considering
the figure calculated in the conveyance efficiency (22L/sec), large amount of water is
lost from the system which could have irrigated more than 11 ha with a duty of 2
L/sec/ ha.
Table 1 Computed conveyance efficiency of the upper main (UMC), lower main (LLC), upper secondary (USC) and lower secondary (LSC) canals for Golina modern irrigation scheme
Canal section
Avg Depth
(m)
Avg Width
(m)
Area (m2)
Length (m)
Time Elapsed
(sec)
Velocity (m/sec)
Discharge (m3/sec)
Conveyance Efficiency
(%)
UMC 0.061 1 0.061 15 23 0.652 0.040 98.25 LMC 0.057 1 0.057 24 35 0.686 0.039 USC 0.15 0.68 0.102 3 11 0.273 0.028 88.97 LSC 0.075 0.55 0.041 3 5 0.600 0.025
Table 2 Computed conveyance efficiency of the upper main (UMC), lower main (LLC), upper secondary (USC) and lower secondary (LSC) canals for Sanka traditional irrigation scheme
Canal section
Avg Depth
(m)
Avg Width
(m)
Area (m2)
Length (m)
Time elapsed
(sec)
Velocity (m/sec)
Discharge (m3/sec)
Conveyance Efficiency
(%)
UMC 0.3 0.5 0.15 23 84 0.274 0.041 45.15 LMC 0.15 0.85 0.1275 6.4 44 0.145 0.019 USC 0.138 0.9 0.1242 8.8 35 0.251 0.031 31.47 LSC 0.08 0.43 0.0344 2 7 0.286 0.010
The fact can be easily envisioned only when the amount of wastage (loss) is discussed
in terms of discharge units or total volume of water. The conveyance efficiency of the
secondary canal section was also 31.5 percent. The discharge lost was estimated at
about 0.021m3 per second (21 L/s) and amounts to 756 m3with 10 hrs average length
of time that the water flows in this secondary canal along a 250 m length. The canal is
earthen and the topography where the canals are aligned is sloped, (Appendix A
Figure 3, 4, 5 and 6) but the alignment of gully or stream crossing flumes (Appendix
A Figure 7) is based on their traditional knowledge and constructed with locally

26
available materials. Therefore, more modern structures like drops, division boxes,
culverts and aqueducts are not available (Appendix A Figure 7 and 8) in the traditional
irrigation scheme, and the canal water losses are higher at Sanka as compared to the
more modern scheme at Golina. This loss would likely have been much lower by
lining the canals especially in areas where the seepage loss is very high and by
constructing protection walls and different canal structures (division boxes, drops and
culverts).
4.1.2 Water application efficiency
The application efficiency of the scheme was measured by using 3 inch Parshal flume
for discharge measurement. The texture of the soil was clay for Golina and silt loam
for Sanka. Table 3 shows the application efficiency measured by installing a 3”
Parshall flume on the inlet of each of the three plots as explained in the materials and
method section. The reasons for the over application of Plot 2 as compared to the area
could be attributed to the slope of the land which had gentle slope that makes the
advance time longer, the furrow orientation which rotates and makes the length
maximum, the expectation of the farmer that more water means more production.
Table 3 Irrigation water measurement result at Golina modern irrigation scheme
Plot number Area Total volume Applied depth Depth stored (m2) (L) (mm) (mm)
Plot 1 253 41104 162 90 Plot 2 409.5 85270 208 128 Plot 3 570 120880 212 108
As shown in Table 4 below, over application as compared to the area is observed in
Plot 3. The reason for this is since the farmers located at the tail of the scheme get the
water after an extended irrigation interval and for specific irrigation hour (2 hour) they
irrigate the whole two hours since it is his turn regardless of his farm size. In addition

27
to this the whole water coming through the secondary canal is allocated to each farm
rotationally, as a result farmers are unable to manage the excess water and allowing it
to be flooded in the farm consequently a large amount of water is lost as a runoff at the
tail of the farm without reaching the root zone. Expectation of the farmer that more
water means more production and the slope of the land also contributed to the over
application.
Table 4 Irrigation water measurement results at Sanka traditional irrigation scheme
Plot number Area Total volume Applied depth Depth stored (m2) (lit) (mm) (mm)
Plot 1 350 42433 121 72 Plot 2 748 96720 129 68 Plot 3 375 45900 122 44
Hence, as seen in Table 5 and 6, the application efficiency in the schemes ranges from
51.0% to 61.6% at Golina and 36.2% to59.9% at Sanka. The values obtained are still
in the ranges expected of such surface irrigation methods, i.e. 40 percent to 60 percent
(FAO, 1995) except in Plot 3 at Sanka traditional irrigation scheme. The reason for
poor water application efficiency may be, as small scale irrigations is associated to
lack of technical capacity of farmers resulted from absence of extension workers and
the required trainings, the type of irrigation system employed which is predominantly
wild flooding and furrow irrigation, the slopes of irrigable fields, absence of
knowledge of irrigation time and scheduling by farmers and more.
Table 5 Application Efficiency (Golina modern irrigation scheme)
Plot number Applied Stored Application depth (mm) depth (mm) efficiency (%)
plot 1 162.466 90.41 55.6 plot 2 208.230 128.28 61.6 plot 3 212.070 108.08 51.0
28
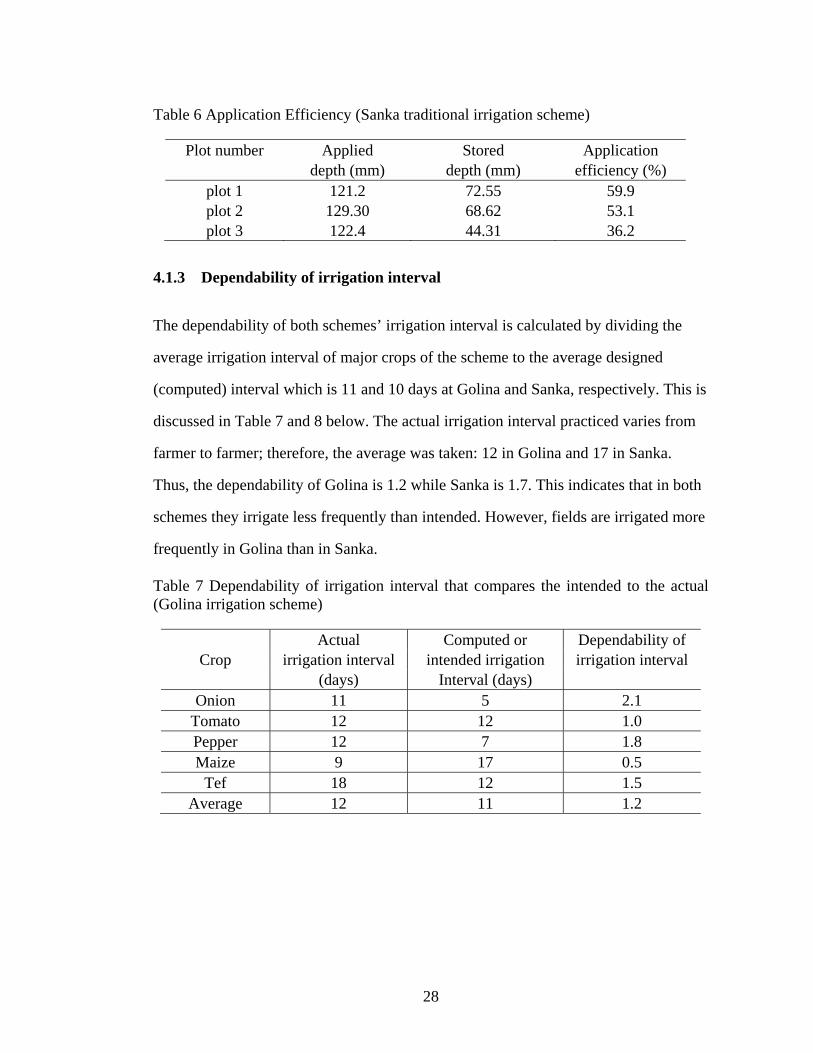
Table 6 Application Efficiency (Sanka traditional irrigation scheme)
Plot number Applied Stored Application depth (mm) depth (mm) efficiency (%)
plot 1 121.2 72.55 59.9 plot 2 129.30 68.62 53.1 plot 3 122.4 44.31 36.2
4.1.3 Dependability of irrigation interval
The dependability of both schemes’ irrigation interval is calculated by dividing the
average irrigation interval of major crops of the scheme to the average designed
(computed) interval which is 11 and 10 days at Golina and Sanka, respectively. This is
discussed in Table 7 and 8 below. The actual irrigation interval practiced varies from
farmer to farmer; therefore, the average was taken: 12 in Golina and 17 in Sanka.
Thus, the dependability of Golina is 1.2 while Sanka is 1.7. This indicates that in both
schemes they irrigate less frequently than intended. However, fields are irrigated more
frequently in Golina than in Sanka.
Table 7 Dependability of irrigation interval that compares the intended to the actual (Golina irrigation scheme)
Actual Computed or Dependability of Crop irrigation interval intended irrigation irrigation interval
(days) Interval (days) Onion 11 5 2.1
Tomato 12 12 1.0 Pepper 12 7 1.8 Maize 9 17 0.5
Tef 18 12 1.5 Average 12 11 1.2

29
Table 8 Dependability of irrigation interval that compares the intended to the actual (Sanka irrigation scheme)
Actual Computed or Dependability of Crop irrigation interval intended irrigation irrigation interval
interval Maize 18 13 1.4 Potato 14 7 2.0 Onion 11 7 1.6
Tef 23 10 2.3 Wheat 19 12 1.6
Average 17 10 1.7
4.1.4 Crops and cropping pattern
The major crops grown in Golina include maize, tef, sorghum, tomato, onion and
pepper. Tef and maize are grown as rain fed and irrigated crops while sorghum
particularly those long maturing types are exclusively grown under rain fed condition.
Tef is the most important crop among the cereals and ranks first in terms of area and
grain production followed by sorghum. Production of vegetables under rain fed
condition is virtually impossible unless the seasonal rainfall is supplemented with
irrigation water. However during the irrigation season as it is indicated in Table 9
56.7% of the Golina respondents are producing horticultural crops, mainly onion,
pepper and tomato; whereas 11.7% of the respondents choose to grow cereals and
31.7% prefer to grow both cereal and horticultural crops.
Table 9 Type of crop produced using irrigation (Golina irrigation scheme)
crop type Frequency Percent
cereals 7 11.7 horticulture 34 56.7
1 and 2 19 31.7 Total 60 100

30
In Sanka traditional irrigation scheme the major crops grown are maize, wheat, tef,
and potato. Tef, maize and wheat are grown as rain fed and irrigated crops. Similar to
Golina tef is the most important crop among the cereals and ranks first in terms of area
and grain production. Production of vegetables, which needs frequent irrigation, under
irrigated condition is very limited in Sanka. This is because the irrigation interval is
very much extended which is long to grow vegetable crops. As a result only 16% of
the beneficiaries produce vegetables (Table 10). However some wise farmers grow
onion early in the season (before all the land is covered by crops) as a result they get
enough water to irrigate their crop frequently. A few farmers also construct a night
storage structure and by collecting the water use it during their off turn.
Therefore, as it is seen from Table 10, most of the farmers (43.3%) produce cereals.
Next to cereals the other 40% of the beneficiary respondents grow both cereals and
horticultural crops and only 16.7% of them produce only horticultural crops.
Table 10 Type of crop produced using irrigation (Sanka irrigation scheme)
crop type Frequency Percent
cereals 26 43.3 horticulture 10 16.7
1 and 2 24 40 Total 60 100
4.1.5 Irrigation methods
In Golina irrigation scheme Irrigation water is applied to crops in different ways; as it
is indicated in Table 11, 50% of the respondents said furrow is the method of
irrigation used especially for vegetables like onion, tomato and pepper. 15% of the
farmers irrigate their crop by flooding. In this case cereals, all tef and most maize

31
fields, are irrigated by the same method whereas, the rest 35% of the farmers irrigate
using furrow and flooding method.
Table 11 Method of irrigation adopted by farmers (Golina irrigation scheme)
Method of irrigation Frequency Percent
flood 9 15 furrow 30 50 1 and 2 21 35 Total 60 100
At Sanka traditional irrigation scheme for ease of work and to use the time allocated
for irrigation effectively, the majority of the farmers broadcast seeds and practice
flood irrigation (73.3%). However, vegetable crops like onion and potato are irrigated
by furrow (11.7%), but this also after two or three irrigation the furrow will be mixed
and becomes flood irrigation.
Table 12 Method of irrigation adopted by farmers (Sanka irrigation scheme)
Method of irrigation Frequency Percent
Flood 44 73.3 Furrow 7 11.7 1 and 2 9 15 Total 60 100
4.1.6 Sustainability of irrigation
In Golina, the actual irrigated area during the design period was 400 ha. However
currently it is irrigating about 512 ha. This shows that additional 112 ha of land is
irrigated which is not considered in the design. Therefore, this additional land that is
irrigated enhances the sustainability of the irrigation scheme up to 128 percent.
In Sanka, sustainability was not in question for the utilization of this scheme for
irrigation. At the initial use of this scheme, the diversion was used only for the
irrigation of 50 ha of land and for the operation of a water-driven flour mill. However,

32
since 1985EC when the number of farmers wanting to irrigate, the area of the irrigated
fields increased drastically. As a result, the beneficiaries decided to stop diverting
water to the flour mill since it consumed high amounts of water to run the engine.
Therefore the total irrigated land now has increased to 120 ha, thus the sustainability
of the scheme is 240 percent.
4.2 Institutional and Support Service Evaluation
4.2.1 Organization and Management
The Golina Irrigation Water Users Association was established in 2002 with 22 male
and 5 female members. Currently, the members of the cooperative reached 270 out of
which 13 are females. There are more than 1,105 potential beneficiary members in the
scheme. However, about 80% of the beneficiaries have not yet become members of
the association. Irrigation users had not become members of the association because of
a lack of awareness of the association and its functions, the suspicions and mistrust of
governmental cooperatives stemming from their experiences during the “Derg”, a
tyrannical regime of Ethiopia, and limited support from concerned governmental
organizations and local administrations.
The board of directors of the association has 10 members which is accountable to the
general assembly. The controlling committee with three members is included in the
structure of the organization. There are two temporary employees hired to attend to the
structures in the scheme and one store keeper. Women involvement in management
and decision making is nearly nonexistent. There are no articles in the by-law of the
association which encourage taking affirmative action to involve women.

33
The basic financial documents are used by the association. The accounts have been
audited twice by the woreda cooperatives promotion desk auditors since its
establishment. The financial position of the association revealed to members according
to the audit report. The organization has a monthly meeting where all members have a
chance to raise outstanding issues for discussion and decision on time. The board of
directors has also its own weekly meeting to evaluate their progress and plan for the
coming week.
Payment of annual water fee from all water users is the main source of income for the
association. Each beneficiary is expected to pay an annual water use fee. Currently,
users pay 20 birr/ha for water use.
Sanka traditional irrigation scheme is mainly administered by ‘yewuha abates’ or
“water fathers” who are elected by the beneficiaries. They have traditional bylaws
worked for as the age of the scheme. The bylaws are a person who divert water
illegally will pay the estimated price of the crop failed due to lack of water during his
illegal diversion; and a person who is absent during development work will be
penalized his water schedule.
Currently a legal water users’ association is established and comprised of 73 members
out of this 57 are male and 6 females. The total numbers of household beneficiaries
are 530, from which 470 are male headed households and 60 female headed
households.
The board of directors of the association has seven members who have one chair
person, one secretary, one accountant and four members. The controlling committee
with 3 members is included in the structure of the organization but they are
independent. The main duty of the controlling committee is controlling the executive

34
committee whether they are distributing the water equitably and managing the scheme
very well.
4.2.2 Water Distribution and Conflict Management
Division leaders are responsible to distribute irrigation water to their respective team
leaders according to the schedule. Team leaders are also mandated to ensure fair water
distribution among the beneficiaries. There is an internal regulation used by the
association to ensure fair water distribution and to manage conflicts among
beneficiaries. All beneficiaries must obey for this internal regulation whether they are
members of the association or not. Despite of all this rules and regulation, according to
the informants, conflict among users in Sanka irrigation is common and happing in all
the irrigation season. As it is explained by 43% and 33.3% of the respondents the
problem is very severe and severe, respectively. This is because the amount of water
diverted is small to irrigate large area as result upstream farmers are forced to steal
water and sometimes use the irrigation turn of the others.
Table 13 Occurrence of conflict among users at Sanka traditional irrigation scheme
Up and down users conflict Frequency Percent Very Severe 26 43.3
Severe 20 33.3 Medium 3 5
It is not a problem 11 18.3 Total 60 100
Table 14 Occurrence of conflict among water users at Golina irrigation scheme
Up and down users conflict Frequency Percent Very Severe 28 46.7
Severe 3 5 Medium - -
It is not a problem 29 48.3 Total 100 100

35
Similar to Sanka traditional irrigation in Golina irrigation division leaders are
responsible to distribute water. However, conflict due to water share is becoming
problem in Golina also. The problem is serious in the months of April and May. On
July where the onset of monsoon is delayed and farmers’ need for irrigation water is
critical to plant the rain fed onion. This problem is further compounded by the
significant decrease of the river water discharge. Since that time no serious conflict is
observed. The major causes of conflicts identified in both schemes are water scarcity,
unequal water distribution and changing of irrigation schedule.
4.2.3 Training and support service
Farmers were asked if they were given training on irrigation water management or not.
In Golina 25% responded that no such training has been given before. On the other
hand, 75% of them reported that they are being given training in the areas of irrigation
agronomy, on farm water management and crop diversification (Appendix C Table 1).
The training, they said, was offered by KGVDP, Sirinka agricultural research center
and the Wereda Agriculture and Cooperative Offices. But most of the trainees were
members of the WUA.
In Sanka 45% of the respondents said there was no training given before and only 55%
of the respondents get training on irrigation agronomy and water management.
(Appendix C Table 1)
Farmers were requested to identify the kind of support they seek from the government.
They reported this as seen in Table 15 for Golina and Table 16 for Sanka below.

36
Table 15 Government support service type and magnitude to the irrigation scheme (Golina)
In Golina farm structures (gates, division boxes and canals) are constructed with
permanent structure and working very well. Therefore maintenance is required when
canals are broken with unexpected flood, and when there is high siltation on the
diversion weir and the canal. To this effect majority of the farmers needs support on
input delivery and creating market to their produce.
Table 16: Government support service type and magnitude to the irrigation scheme (Sanka)
Support type Frequency Percent
irrigation administration 2 3.3 upgrading 2 3.3
maintenance 33 55 input and credit 1 1.7
All type of support 19 31.7 3 and 4 3 5 Total 60 100
From the respondents, 58% of them stated that they need support to maintain and
upgrade the scheme and 31 percent said they need support in all aspects. Especially in
this scheme identification and construction of the head work site, alignment of canal,
crossing big gullies and other engineering works are done by the farmers themselves
using their local indigenous knowledge and material. As a result of this, there are
occasions which decrease significantly the performance of the scheme. From my field
observation farmers try to cross a big gully (30m wide) with flume. However during
Support type Frequency Percent
Irrigation administration 7 11.6 Upgrading 3 5
Maintenance 10 16.7 Input and credit 27 45
All type of support 13 21.7 Total 60 100

37
the alignment they did not maintain the correct slope consequently a lot of water was
lost overtopping to the canal.
4.3 Food insecurity
The majority of Sanka irrigation scheme households do not cover their annual food
demand from their own production. Only 38% of the respondent households cover
their food demand throughout the year while 55% and 6.7% households cover only for
six and less than six months period, respectively (Appendix C Table 2). Most of the
female headed households cover most of their food demand with off farm activities to
supplement the production from their share crop fields. Majority of households filled
their food deficits in the year through involving nonfarm activities (30%) and borrow
money from others (15%) (Appendix C Table 3).
However most of the respondent households (73.3%) in Golina produce enough food
grains that cover the consumption demand for the whole year. But the reaming 21.7%
and 5% of the farmers what they produce cover the first six months beginning from
rain fed crop harvest (Nov-April) and less than six months respectively. The food
consumption during remaining six months of the year will be covered by purchasing
cereals from nearby markets. The income to buy the grains come from the borrowing
money from others (14.3%) and involving in nonfarm activities (9.5%) sale of
vegetables produced under irrigation (around 52.4%), labor sales & share cropping
(19.0%) and animal sales (14.8%). This indicates that how irrigation is important
venture to accomplish food security (Appendix C Table 3).

38
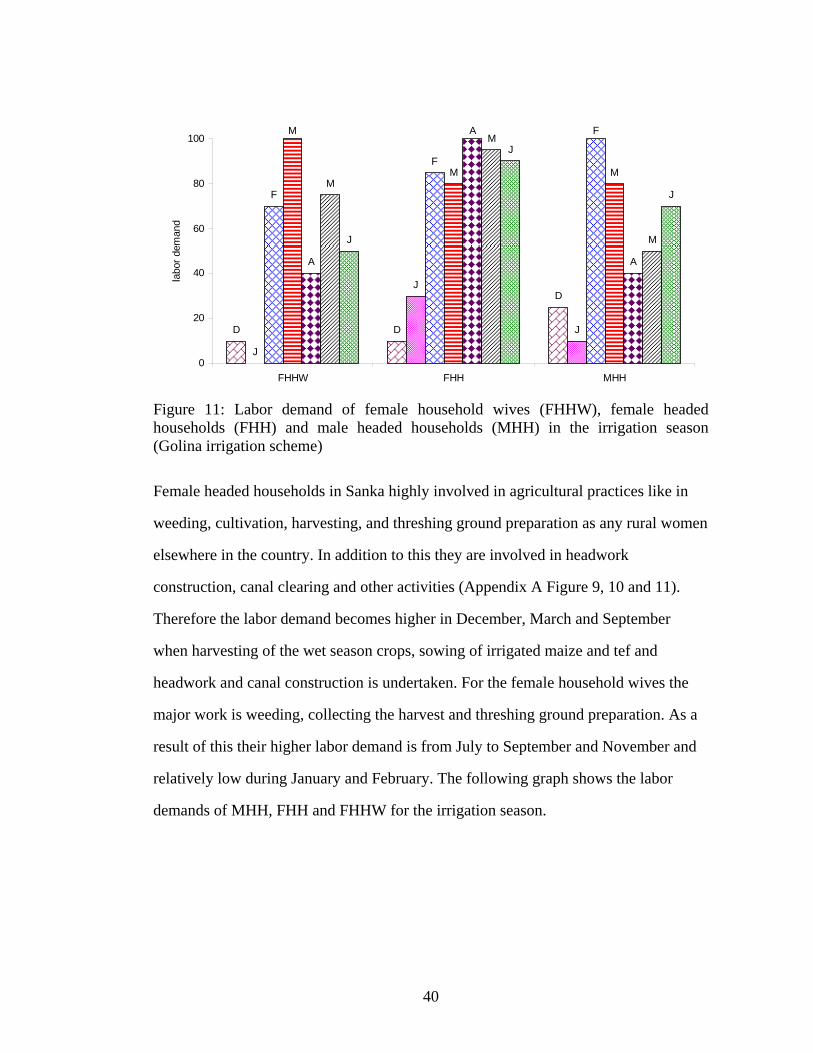
4.4 Labor demand
The labor demand in agriculture production system varies with production seasons and
gender. The labor division and demand amongst female household wives (FHHW),
female-headed households (FHH) and male-headed households (MHH) are provided
in Figure 11 for Golina and Figure 12 for Sanka. In Golina, generally land preparation,
planting, harvesting, threshing, feeding oxen and water application to irrigated farms
are tasks done by men. In addition to day-to-day household or domestic
responsibilities, agricultural activities such as weeding, planting and hoeing of
vegetables and threshing ground preparation are handled by women. Women also are
actively involved during crop harvesting time. It is the responsibility of the women to
transport crop cuts from the field into central threshing grounds. Women headed
households take part in planting, threshing, feeding oxen, and water application to
irrigated crops as men do in addition to the tasks carried out by women household
wives. Marketing of grain cereals are exclusively done by women.
In dry season irrigation labor demand of female household wives (FHHW) peaks in
March followed by second peaks in February and May and slack in December,
January and April. The first peak concedes with weeding of maize crop planted in
January and weeding and hoeing of vegetable crops planted in February, while the
second peak in May overlap with weeding of late planted vegetables. They also spent
considerable labor in harvesting vegetables in month June. Unlike FHHW, the female-
headed households (FHH) are very busy throughout the irrigation season except in
December and January. Because FHH are responsible for all activities including those
tasks normally done by men such as planting, watering irrigated crops, harvesting and
marketing vegetable produce. The labor demand of male headed households (MHH)
slakes in December, January and April similar to that of FHHW and peaks during

39
February and March where land preparation and planting of most vegetables carried
out. The second peak in month of June coincides with harvesting activity of all most
all dry season irrigated crops.
In Sanka traditional irrigation scheme during the irrigation season the main activity
which requires high labor demand is construction of diversion weir and canal. Thus,
the peak labor demand for the MHH occurs on September, October and November
where there is intensive work of digging, and collecting stones for the construction of
head work and canal and harvesting of the wet season crops. In February there is a
winter rain as a result it destroys the structure and make them to construct again then
their labor demand increases. However, in May and June only land preparation of the
wet season crops and harvesting of late sown irrigated crops thus labor demand is less
as compared to other months in the irrigation season. Other months where water
application (irrigation), harvesting, land preparation, cultivation, and weeding, sowing
and secondary cultivation have high to medium labor demand.
40
Figure 11: Labor demand of female household wives (FHHW), female headed households (FHH) and male headed households (MHH) in the irrigation season (Golina irrigation scheme)
Female headed households in Sanka highly involved in agricultural practices like in
weeding, cultivation, harvesting, and threshing ground preparation as any rural women
elsewhere in the country. In addition to this they are involved in headwork
construction, canal clearing and other activities (Appendix A Figure 9, 10 and 11).
Therefore the labor demand becomes higher in December, March and September
when harvesting of the wet season crops, sowing of irrigated maize and tef and
headwork and canal construction is undertaken. For the female household wives the
major work is weeding, collecting the harvest and threshing ground preparation. As a
result of this their higher labor demand is from July to September and November and
relatively low during January and February. The following graph shows the labor
demands of MHH, FHH and FHHW for the irrigation season.
D D
D
J
J
J
F
F
FM
M M
A
A
A
M
M
MJ
J
J
0
20
40
60
80
100
FHHW FHH MHH
labo
r de
man
d

41
Figure 12: Labor demand for MHH, FHH and FHHW (Sanka irrigation scheme)
4.5 Participation and sense of ownership of the scheme
Participation is the active involvement of development beneficiaries in the choice,
implementation and management of development projects that are designed to
improve their standards of living. The pre-conditions for effective community
participation are that the community members must understand the problems they
experience and conceptualize the desirable actions to address the problem. The level
of participation is discernible from the farmer’s willingness to contribute to the project
activities in terms of commitment of time, labor and material resources. With respect
to this in Sanka traditional irrigation participation of beneficiary farmers is 100%
(Appendix C Table 4). Their participation ranges from contribution of money,
applying their enormous indigenous knowledge of site identification, weir and canal
construction, canal alignment, gully crossing, scheme management and often times
contribute both money and labor. However in Golina only 31.7% of the respondents
participate in the scheme development through labor contribution and the rest 68.3%
of the respondents said they do not have any contribution either in money or labor.
S
S
S
OO
O
N N
N
D
D
D
J
J
J
F
F
F
M
M
M
A
A
AM
MM
JJ
J
0
10
20
30
40
50
60
70
80
90
100
MHH FHH FHHW
42
Even though participation of farmers in Sanka traditional irrigation scheme is much
higher than Golina irrigation scheme, this doesn’t result in increased performance.
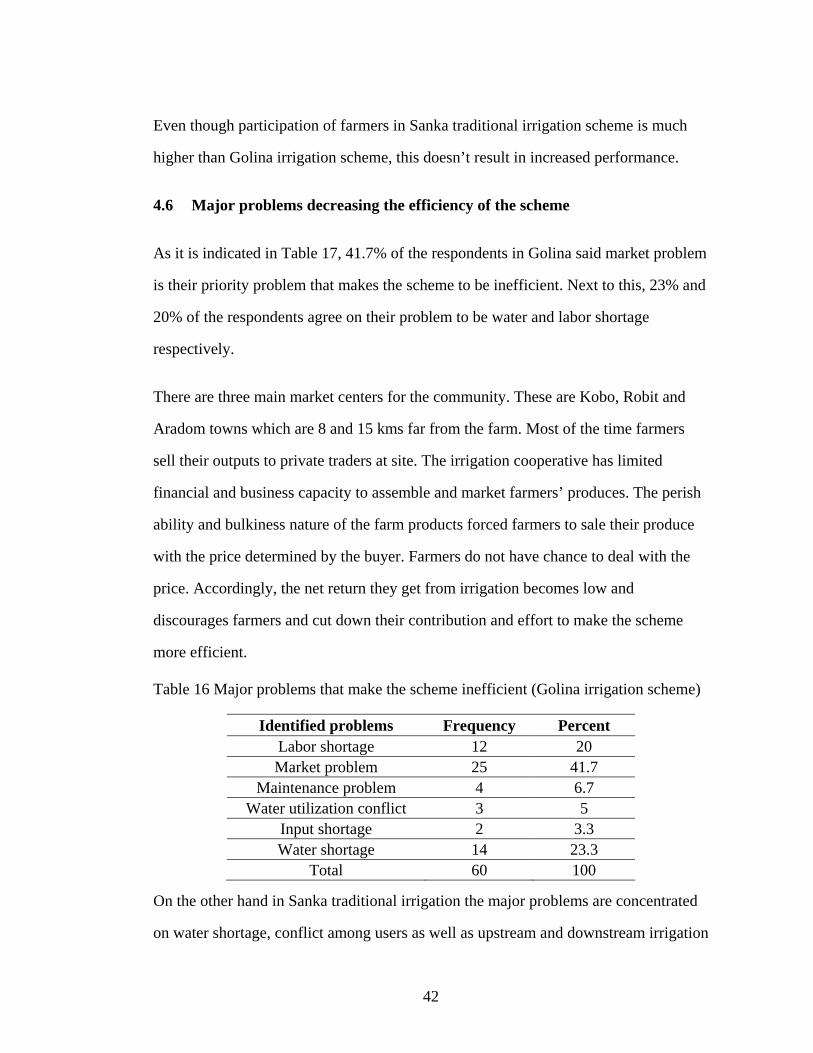
4.6 Major problems decreasing the efficiency of the scheme
As it is indicated in Table 17, 41.7% of the respondents in Golina said market problem
is their priority problem that makes the scheme to be inefficient. Next to this, 23% and
20% of the respondents agree on their problem to be water and labor shortage
respectively.
There are three main market centers for the community. These are Kobo, Robit and
Aradom towns which are 8 and 15 kms far from the farm. Most of the time farmers
sell their outputs to private traders at site. The irrigation cooperative has limited
financial and business capacity to assemble and market farmers’ produces. The perish
ability and bulkiness nature of the farm products forced farmers to sale their produce
with the price determined by the buyer. Farmers do not have chance to deal with the
price. Accordingly, the net return they get from irrigation becomes low and
discourages farmers and cut down their contribution and effort to make the scheme
more efficient.
Table 16 Major problems that make the scheme inefficient (Golina irrigation scheme)
Identified problems Frequency Percent Labor shortage 12 20 Market problem 25 41.7
Maintenance problem 4 6.7 Water utilization conflict 3 5
Input shortage 2 3.3 Water shortage 14 23.3
Total 60 100
On the other hand in Sanka traditional irrigation the major problems are concentrated
on water shortage, conflict among users as well as upstream and downstream irrigation

43
schemes and maintenance problem as it is expressed by the respondents with 36.7%,
28.3% and 20% respectively.
The main household crop production objective is to produce enough food that covers
the annual household consumption. Even though potato, onion and few fruit crops are
produced most of it is used for home consumption and the remaining product can be
accommodated by the local market. Due to this market is not their major problem
differing to Golina.
Table 17 Major problems that make the scheme inefficient (Sanka irrigation scheme)
Identified problems Frequency Percent man power shortage 6 10
market problem - - maintenance problem 12 20
water utilization conflict 17 28.3 input shortage 3 5 water shortage 22 36.7
Total 60 100

44
CHAPTER FIVE
5 CONCLUSION AND RECOMMENDATION
Based on different performance indices in Sanka traditional irrigation a large quantity
of water is lost during conveyance, approximately 22L/sec over a distance of 880 m
and enough to irrigate about 11 ha on average. According to Amhara Region Water
Resource Development Bureau irrigation inventory report (2005), there are 5,908
traditional irrigation schemes in the Amhara Region, which account for 95% of the
total irrigation schemes. Therefore, if the 11 ha is taken as an average and conveyance
losses could be reduced, it is possible to develop a total of 64,988 ha additional land in
the region. This figure becomes even more significant on a national scale. Therefore,
improving the conveyance efficiency of traditional schemes would be a far better than
developing new modern schemes since indigenous scheme management systems are
already established in traditional schemes. In addition, beneficiary participation and
the sense of ownership by the beneficiaries are much higher within traditional
schemes. Participation of the beneficiaries during establishment and community
ownership are core points for the success of any irrigation project.

45
REFERENCES
ANRSWRB, 2005. Regional irrigation land and resource inventory. Bahir dar,
Ethiopia.
Allen, R. G., Pereira, L. S., Raes, D. and Smith, M. 1998. Crop Evapotranspiration: -
Guideline for Computing Crop Water Requirement. Irrigation and Drainage
Paper, 56. FAO, Rome.
Bos, M.G., 1997. Performance Indicators for Irrigation and Drainage, Irrigation and
Drainage Systems 11: 119-137.
Burt, C.M. and Styles, S.W., 1999. Modern Water Control and Management Practices
in Irrigation: Impact on Performance. Water Reports No. 19. International
Program for Technology and Research in Irrigation and Drainage. The World
Bank. FAO, Rome.
Catterson, T., Moges Worku, Messel Endalew, Abate C. G., Brockman F., Abebe
Wolde Amaneul, Kibru Mamusha, 1999. Programmatic Environmental
Assessment of Small- Scale Irrigation in Ethiopia. For Catholic Relief Services
U.S. Catholic Conference Baltimore, Maryland.
Clemmens, A.J. and Bos, M.G., 1990. Statistical methods for irrigation system water
delivery performance evaluation. Irrigation and Drainage Systems, 4:345-365.
Co-SAERAR (Commission for Sustainable Agriculture and Environmental
Rehabilitation in Amhara Region), 1998. Design Documents of Watershed,
Headwork and Infrastructure.

46
FAO (Food and Agriculture Organization), 1989. Guidelines for Designing and
Evaluating Surface Irrigation Systems: Irrigation and Drainage Paper. No. 45.
FAO, Rome.
FAO (Food and Agriculture Organization). 1995. Irrigation in Africa in Figures. FAO
Water Reports No. 7. FAO, Rome.
FAO (Food and Agriculture Organization), 1996. Irrigation Scheduling: From theory
to practice. Water Reports 8. FAO, Rome.
FAO (Food and Agriculture Organization), 1997. Small-Scale Irrigation for Arid
Zones: principles and options. FAO, Rome.
Hennessy, J.R., 1993. Water management in the 21st century. Keynote address 1.
Transactions volume 1-5, Keynote Addresses. Fifteen Congress on Irrigation
and Drainage. ICID. New Delhi, India.
James, L.G., 1988. Principles of Farm Irrigation System Design. John Wiley and Sons,
Inc. New York.
Pereira, L.S. and Trout, T. J., 1999. Irrigation Methods. Land and Water Engineering.
CIGR Handbook of Agricultural Engineering. Volume one. Land and Water
Engineering. American Society of Agricultural Engineers. MI, USA.
Solomon Zeberga, 2006. Performance Assessment of Gerado Small-Scale Irrigation
Scheme, Dessie Zuria Woreda. M.Sc. thesis presented to the School of
Graduate Studies of Alemaya University, Ethiopia.
Tilahun Haile and Paulos Dubale, 2004. Results to Date Future Plan of Research on
Irrigation and its Impact. Workshop on Impact of Irrigation on Poverty and
Environment, Workshop Proceedings, 26-30, April 2004, Addis Ababa.
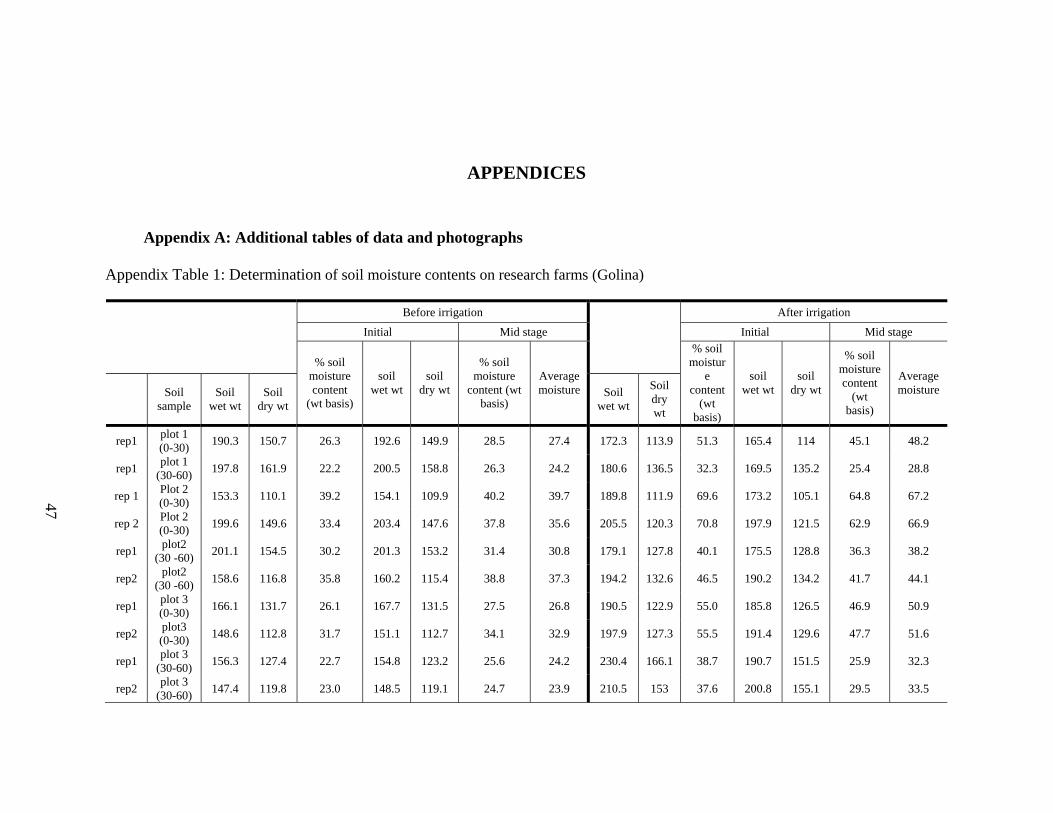
47
APPENDICES
Appendix A: Additional tables of data and photographs
Appendix Table 1: Determination of soil moisture contents on research farms (Golina)
Before irrigation
After irrigation
Initial Mid stage Initial Mid stage
% soil moisture content
(wt basis)
soil wet wt
soil dry wt
% soil moisture
content (wt basis)
Average moisture
% soil moistur
e content
(wt basis)
soil wet wt
soil dry wt
% soil moisture content
(wt basis)
Average moisture
Soil
sample Soil
wet wt Soil
dry wt Soil
wet wt
Soil dry wt
rep1 plot 1 (0-30)
190.3 150.7 26.3 192.6 149.9 28.5 27.4 172.3 113.9 51.3 165.4 114 45.1 48.2
rep1 plot 1
(30-60) 197.8 161.9 22.2 200.5 158.8 26.3 24.2 180.6 136.5 32.3 169.5 135.2 25.4 28.8
rep 1 Plot 2 (0-30)
153.3 110.1 39.2 154.1 109.9 40.2 39.7 189.8 111.9 69.6 173.2 105.1 64.8 67.2
rep 2 Plot 2 (0-30)
199.6 149.6 33.4 203.4 147.6 37.8 35.6 205.5 120.3 70.8 197.9 121.5 62.9 66.9
rep1 plot2
(30 -60) 201.1 154.5 30.2 201.3 153.2 31.4 30.8 179.1 127.8 40.1 175.5 128.8 36.3 38.2
rep2 plot2
(30 -60) 158.6 116.8 35.8 160.2 115.4 38.8 37.3 194.2 132.6 46.5 190.2 134.2 41.7 44.1
rep1 plot 3 (0-30)
166.1 131.7 26.1 167.7 131.5 27.5 26.8 190.5 122.9 55.0 185.8 126.5 46.9 50.9
rep2 plot3 (0-30)
148.6 112.8 31.7 151.1 112.7 34.1 32.9 197.9 127.3 55.5 191.4 129.6 47.7 51.6
rep1 plot 3
(30-60) 156.3 127.4 22.7 154.8 123.2 25.6 24.2 230.4 166.1 38.7 190.7 151.5 25.9 32.3
rep2 plot 3
(30-60) 147.4 119.8 23.0 148.5 119.1 24.7 23.9 210.5 153 37.6 200.8 155.1 29.5 33.5
47

48
Appendix Table 2: Determination of soil moisture contents on research farms (Sanka)
Before irrigation
After irrigation
Initial Mid stage Initial Mid stage
Soil
sample Soil
wet wt Soil
dry wt
% soil moisture content
(wt basis)
soil wet wt
soil dry wt
% soil moisture
content (wt basis)
Average moisture
Soil wet wt
Soil dry wt
% soil moist. content
(wt basis)
soil wet wt
soil dry wt
% soil moisture content
(wt basis)
Aver. Moist.
rep1 plot 1 (0-30)
157.2 117.7 33.6 185.9 116.8 59.2 46.47 175.6 123.6 42.1 182.6 118.4 54.2 48.1
rep1 plot 1
(30-60) 151.2 120.5 25.5 170.7 124.5 37.1 31.3 134.9 100.3 34.5 145.5 99.3 46.5 40.5
rep 1 Plot 2 (0-30)
139.9 107.1 30.6 147 105.8 38.9 34.8 193.5 138 40.2 196.2 137.4 42.8 41.5
rep 2 Plot 2 (0-30)
rep1 plot2
(30 -60) 171.5 139.1 23.3 165.5 128.2 29.1 26.2 171.4 133.4 28.5 180.5 130.2 38.6 33.6
rep2 plot2
(30 -60)
rep1 plot 3 (0-30)
167.4 145.3 15.2 175.9 142.1 23.8 19.5 169.1 141.9 19.2 175.1 135.5 29.2 24.2
rep2 plot3 (0-30)
150.3 125 20.2 163.5 129.1 26.6 23.4 140.2 111.2 26.1 144.5 110.4 30.9 28.5
rep1 plot 3
(30-60) 142.1 119 19.4 149.1 122.9 21.3 20.4 130.5 108.3 20.5 133.5 105.7 26.3 23.4
rep2 plot 3
(30-60) 175.5 144.1 21.8 184.1 146.9 25.3 23.6 140.5 114.5 22.7 147.8 113.8 29.9 26.3
48

49
Appendix Table 3: Average soil moisture content before and after irrigation at 60 cm depth (Golina)
Test plot Soil depth
(cm) Time of sampling
% of average soil moisture content
(wt basis)
Moisture difference
Bulk density (gm/cm3)
% of soil moisture content (vol.
basis)
Moisture content (mm)
Plot 1
0-30 before irrigation 27.37 20.79 1.18 24.53 73.60
90.41 after irrigation 48.16
30 - 60 before irrigation 24.21 4.67 1.2 5.60 16.81
after irrigation 28.88
Plot 2
0 - 30 before irrigation 37.66 29.47 1.18 34.77 104.32
128.28 after irrigation 67.13
30 - 60 before irrigation 34.04 7.13 1.12 7.99 23.96
after irrigation 41.17
Plot 3
0 - 30 before irrigation 29.86 21.46 1.18 25.32 75.97
108.08 after irrigation 51.32
30 - 60 before irrigation 24.02 8.92 1.2 10.70 32.11
after irrigation 32.94
49

50
Appendix Table 4: Average soil moisture content before and after irrigation at 60 cm depth (Sanka)
Appendix Table 5: Irrigation water measurement result (Sanka traditional irrigation)
Plot number Area T Q Total volume Applied depth (m2) (Sec) (l/s) (lit) (mm)
Plot 1 350 5813 7.3 42433 121.2 Plot 2 748 10280 9.4 96720 129.30 Plot 3 375 4980 9.2 45900 122.4
T- Time for water delivery Q- discharge
Test plot Soil depth
(cm) Time of sampling
% of average soil moisture content
(wt basis)
Moisture difference
Bulk density (gm/cm3)
% of soil moisture content (vol.
basis)
Moisture content (mm)
Plot 1 0-30
before irrigation 46.45 9.97 1.25 12.46 37.39
72.55 after irrigation 56.42
30 - 60 before irrigation 31.31 9.23 1.27 11.72 35.17 after irrigation 40.54
Plot 2 0 - 30
before irrigation 34.76 10.75 1.25 13.44 40.31
68.62 after irrigation 45.51
30 - 60 before irrigation 26.17 7.43 1.27 9.44 28.31 after irrigation 33.6
Plot 3 0 - 30
before irrigation 21.47 8.89 1.25 11.11 33.34
44.31 after irrigation 30.36
30 - 60 before irrigation 21.96 2.88 1.27 3.66 10.97 after irrigation 24.84
50

51
Appendix Table 6: Irrigation water measurement result (Golina irrigation scheme)
Plot number Area T Q Total volume Applied depth (m2) (sec) (l/s) (lit) (mm)
Plot 1 253 8055 5.1 41104 162.466 Plot 2 409.5 11369 7.5 85270 208.230 Plot 3 570 11680 10.3 120880 212.070
T- Time for water delivery Q- discharge
51

52
Appendix Figure 1: Seepage loss in the canal constructed by beneficiery farmers themselves (Sanka traditional irrigation)
Appendix Figure 2: Overtopping on the main canal (Sanka traditional irrigation)
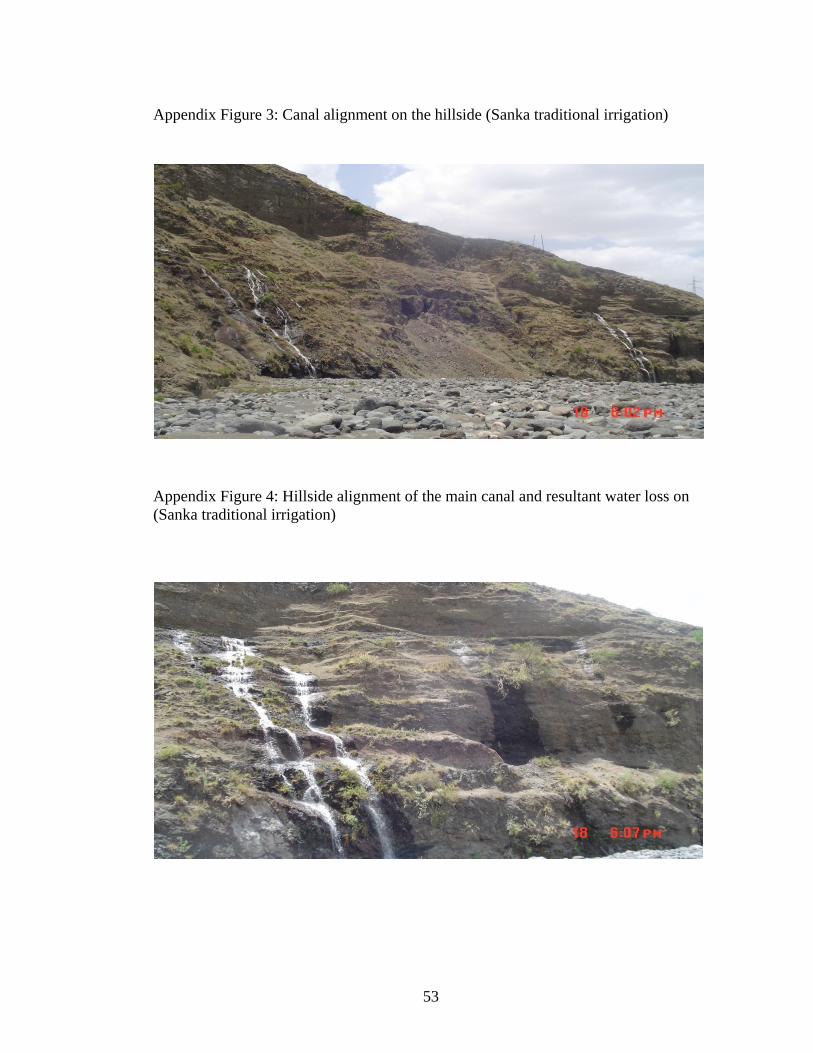
53
Appendix Figure 3: Canal alignment on the hillside (Sanka traditional irrigation)
Appendix Figure 4: Hillside alignment of the main canal and resultant water loss on (Sanka traditional irrigation)
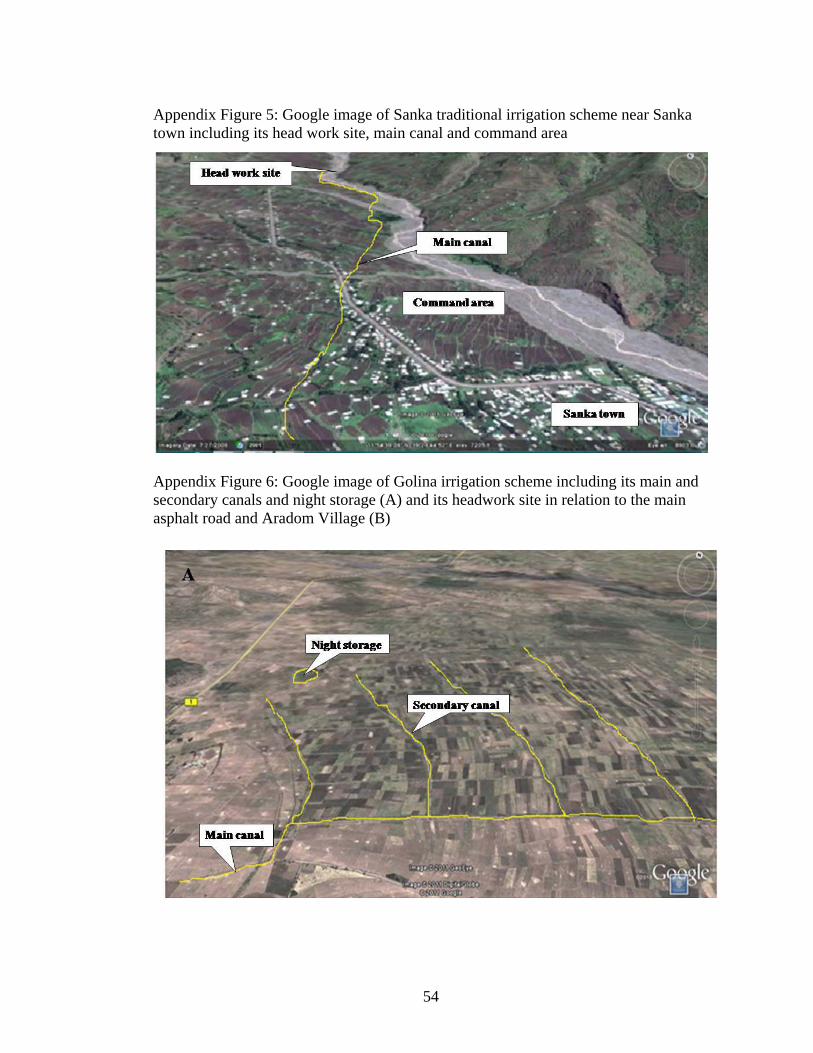
54
Appendix Figure 5: Google image of Sanka traditional irrigation scheme near Sanka town including its head work site, main canal and command area
Appendix Figure 6: Google image of Golina irrigation scheme including its main and secondary canals and night storage (A) and its headwork site in relation to the main asphalt road and Aradom Village (B)
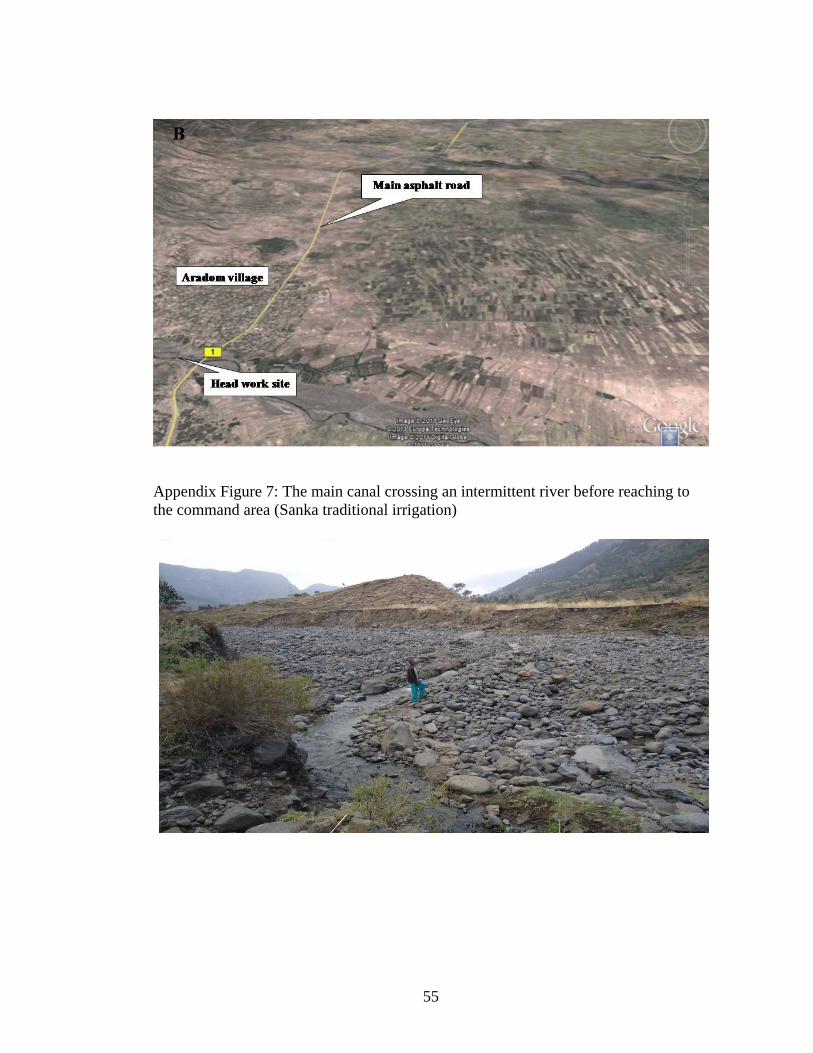
55
Appendix Figure 7: The main canal crossing an intermittent river before reaching to the command area (Sanka traditional irrigation)

56
Appendix Figure 8: Water spreading over the land since there is no appropriate drop structure and leading canal (Sanka traditional irrigation)
Appendix Figure 9: Farmers cleaning their secondary canal to lead to their farm (Sanka traditional irrigation)

57
Appendix Figure 10: Men, women and children cleaning the canal (Sanka traditional irrigation)
Appendix Figure 11: Protecting water seepage on the canal (Sanka traditional irrigation)
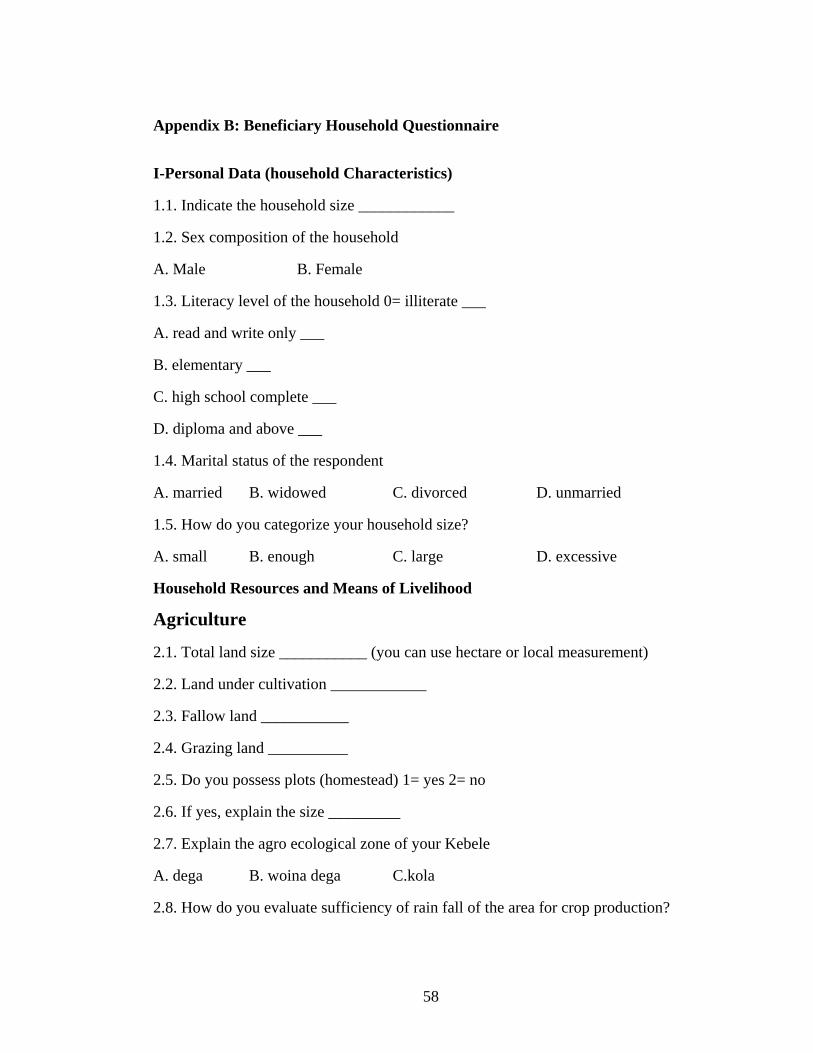
58
Appendix B: Beneficiary Household Questionnaire
I-Personal Data (household Characteristics)
1.1. Indicate the household size ____________
1.2. Sex composition of the household
A. Male B. Female
1.3. Literacy level of the household 0= illiterate ___
A. read and write only ___
B. elementary ___
C. high school complete ___
D. diploma and above ___
1.4. Marital status of the respondent
A. married B. widowed C. divorced D. unmarried
1.5. How do you categorize your household size?
A. small B. enough C. large D. excessive
Household Resources and Means of Livelihood
Agriculture
2.1. Total land size ___________ (you can use hectare or local measurement)
2.2. Land under cultivation ____________
2.3. Fallow land ___________
2.4. Grazing land __________
2.5. Do you possess plots (homestead) 1= yes 2= no
2.6. If yes, explain the size _________
2.7. Explain the agro ecological zone of your Kebele
A. dega B. woina dega C.kola
2.8. How do you evaluate sufficiency of rain fall of the area for crop production?

59
A. excess B. sufficient C. insufficient D. very low
2.9. Patterns of rain fall in the area
A. decrease B. increase C. no difference
2.10. Is there any record of crop failure in the area due to shortage of rain fall?
A. Yes B. No
2.11. If yes, indicate the years _____________________________________________
2.12. What is the major occupation of the household?
A. crop Production B. mixed farming
C. livestock D. vegetable E. others
2.13. Do you have additional incomes that supplement your major occupation?
A. yes B. no
2.14. If your answer is yes, state all in order of their importance.
A. sales of crop production
B. sales of animals
C. sales of vegetables
D. earnings from daily laborer
E. Petty trading
F. Nonfarm activities
G. others (specify) __________
2.15. How was your agricultural
production for the last three years?
A. excess for annual household
consumption
B. sufficient for annual household
consumption
C. sufficient for six months only\
D. sufficient for less than six
months
A. 2.16. If your household faced
food shortage, what do you think was
the reason? (rank in order of
importance)land shortage
B. oxen shortage
C. labor shortage
D. poor productivity
E. farm implements shortage
F. crop failure due to erratic rain
fall

60
G. Others (specify)_____________
2.17. What do you do to cope with the problem?
A. rent farm land
B. borrow money
C. sales of cash crops
D. assets sale
E. involve in off farm activities
F. others (specify)_____________
III. Issues Related to Irrigation Practices
3.1. Who developed the scheme?
A. community B. government
C. NGO D. 1&2 E.1&3
3.2. Who is the owner of the scheme?
A. community B. government
C.NGO D. 1&2 E.1&3
3.3. Do you have any specialized training on irrigation?
A. yes B. no
3.4. For how long (years) you practiced irrigation? _________
3.5. Do the scheme has been constructed with the consent and full participation of the
target beneficiaries?
A. yes B. no
3.6. if yes, in what aspect did you participate
A. simply attending discussion assemblies about the project
B. attending discussion assemblies and actively expressing feelings, ideas, views.
C. acting as an informant
3.7. Explain the type of contribution you made for the project
A. Money B. labor C. material
D. land E. 1&2 F. 1&2&3
G. 1&2&3&4 H. 1&2&3&4&5 I. others__________

61
3.8. What source of water do you use?
A. river/stream B. shallow dug out C. others (specify)
D. natural pool/pond E. artificial pond/dam F. others (specify)
3.9. What type of water delivery system is used from the source?
A. motor pumps using electric power B. motor pumps using diesel power
C. diversion using gravity D. other (specify)____________
3.10. How many hectares of your cultivated land is accessible for irrigation? _______
3.11. Do you irrigate all of your irrigable land?
A. yes B. no
3.12. If not, why? (circle as many as apply)
A. shortage of water
B. low productivity
C. getting sufficient produce by
rain feed agriculture
D. poor quality of irrigation
E. poor maintenance
F. others (specify)
___________________
3.13. Is there a mechanism of water pricing for irrigation users?
A. no, water is provided as a free service
B. yes, water is provided by charge but does not vary with the quantity of water
used
C. irrigation water charge is based on the volume of water used
D. others (specify)_________________
3.14. How many times you produce annually by applying irrigation? ___________
3.15. What are the major agricultural crops you produce using irrigation? ________
3.16. Why do you prefer to grow such crops?
A. better price
B. good production
C. easy to operate
D. high disease tolerance
E. seeds availability
F. others (specify) __________

62
3.17. Have you ever faced a problem of crop failure when using irrigation?
A. Yes B. No
3.18. If yes, why? (Circle as many as apply)
A. water shortage
B. crop disease
C. poor irrigation maintenance
D. over flooding of the farm and
consequent erosion
E. others (specify) ____________
3.19. Are there any problem during the application of irrigation water?
A. yes B. no
3.20. If yes, what are they? (rank them)
A. downstream conflict------
B. shorter time allowed for
irrigation water flow-----
C. water use administration
problem------
D. lack of maintenance ____
E. lack of operational
skill/training
F. others_____________
3.21. How many months of the year you are engaged in irrigation activities? ________
3.22. Do you have labor shortage in operating your irrigation farm?
A. yes B. no
3.23. Are you able to apply as much water as you would like to your crops?
A. yes B. no
3.24. What constraints affect you in using the scheme efficiently? (put in order of
importance)
A. lack of input financing
B. unavailability of inputs
C. shortage of labor
D. lack of rural access road & high
transportation cost
E. conflict in water utilization with
users
F. lack of marketing for produce
G. water shortage
H. others_______

63
3.25. What type of labor do you use for the following Irrigation Activities?
Self
Spouse
Other household members
Hire Labor
Other
Land preparation Planting/transplanting Weeding Applying agro-chemicals Watering Harvesting Transporting & Storing Others (specify)
3.26. If you hire labor fill in the following Activity
Total man days
Cost/day (Birr)
Total cost
Land preparation Planting/ transplanting Weeding Applying agro-chemicals Watering Harvesting Transporting & Storing Others (specify)
3.27. If you do not hire labor why?
A. has enough family labor B. too expensive
C. no available labor to hire D. others (specify)_________________
3.28. Rank the following important factors which most inhibits your irrigated
production at Present Factors Rank Extent of the problem Simple Modest Considerable Water Land Input Credit Market Transport Crop damage Absence of gov. support Lack of skill
4.1. Have you ever visited by an extension agent?
A. Yes B. No
4.2. If yes, during which operation?
A. land preparation
B. planting/transplanting
C. weeding
D. applying agro chemicals
E. watering
F. harvesting

64
4.3. Is there nearby government/private owned large scale irrigation?
A. Yes B. No
4.4. If yes, do you have any relation with them?
A. Yes B. No
4.5. If yes, what are the fields of your cooperation?
A. field day or demonstration
B. on-farm verification
C .market facilitation
D. input provision
E. others (specify)___________
4.6. Do you have any relation with any research center?
A. Yes B. No
4.7. If yes what advice/support do they provide?_______________
4.8. What kind of institutional support do you need in relation to the scheme?
A. organization and management
B. increase the scheme’s capacity
C. maintenance
D. others ____

65
Appendix C: Table of results from the questionairre
Appendix Table 1: Training
Appendix Table 2: Annual crop production for the last five years
Golina Sanka Annual crop production Frequency Percent Frequency Percent
more than 1 year family consumption
20 33.3 2 3.3
only 1 year family consumption
24 40 21 35
6 month family consumption 13 21.7 33 55 < 6 month family consumption 3 5 4 6.7
Total 60 100 60 100 Appendix Table 3: Solution for food shortage
Solution for food shortage Golina Sanka Frequency Percent Frequency Percent
borrow money 3 14.3 9 15 Sale of vegetables produced in
irrigation 11 52.4 3 5
Labor sale &share cropping 4 19.0 2 3.3 nonfarm activity 2 9.5 18 30
Animal sale 1 4.8 5 8.3 Total 21 100 37 100
Appendix Table 4, Farmers participation in the scheme development and sense of ownership
Golina Sanka Frequency Percent Frequency Percent
yes 19 31.7 60 100 no 41 68.3 _ _
Total 60 100 60 100
Do you get training Golina Sanka Frequency Percent Frequency Percent
yes 47 78.3 33 55 no 13 21.7 27 45
Total 60 100 60 100