University of VermontScholarWorks @ UVM
Graduate College Dissertations and Theses Dissertations and Theses
2008
Oligomerization of Levoglucosan in Proxies ofBiomass Burning AerosolsBryan J. HolmesUniversity of Vermont
Follow this and additional works at: https://scholarworks.uvm.edu/graddis
This Dissertation is brought to you for free and open access by the Dissertations and Theses at ScholarWorks @ UVM. It has been accepted forinclusion in Graduate College Dissertations and Theses by an authorized administrator of ScholarWorks @ UVM. For more information, please [email protected].
Recommended CitationHolmes, Bryan J., "Oligomerization of Levoglucosan in Proxies of Biomass Burning Aerosols" (2008). Graduate College Dissertationsand Theses. 111.https://scholarworks.uvm.edu/graddis/111
OLIGOMERIZATION OF LEVOGLUCOSAN IN PROXIES OF BIOMASS BURNING AEROSOLS
A Dissertation Presented
by
Bryan J. Holmes
to
The Faculty of the Graduate College
of
The University of Vermont
In Partial Fulfillment of the Requirements for the Degree of Doctor of Philosophy
Specializing in Chemistry
February, 2008
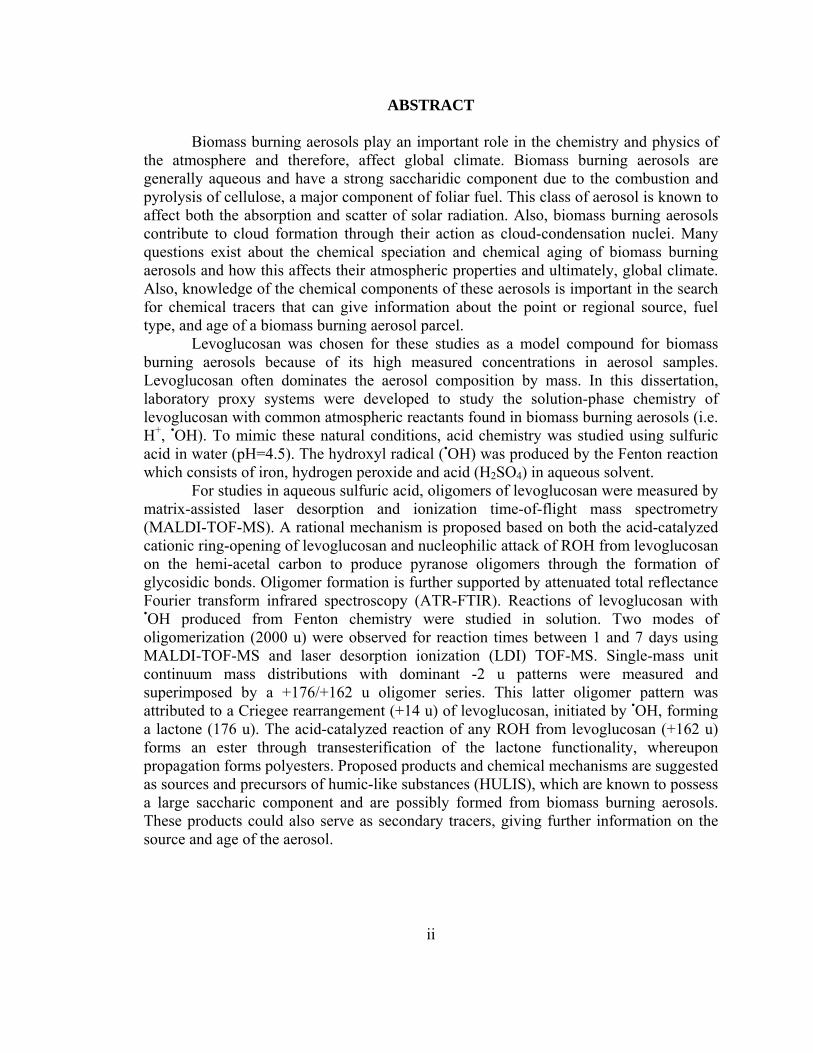
ABSTRACT
Biomass burning aerosols play an important role in the chemistry and physics of the atmosphere and therefore, affect global climate. Biomass burning aerosols are generally aqueous and have a strong saccharidic component due to the combustion and pyrolysis of cellulose, a major component of foliar fuel. This class of aerosol is known to affect both the absorption and scatter of solar radiation. Also, biomass burning aerosols contribute to cloud formation through their action as cloud-condensation nuclei. Many questions exist about the chemical speciation and chemical aging of biomass burning aerosols and how this affects their atmospheric properties and ultimately, global climate. Also, knowledge of the chemical components of these aerosols is important in the search for chemical tracers that can give information about the point or regional source, fuel type, and age of a biomass burning aerosol parcel.
Levoglucosan was chosen for these studies as a model compound for biomass burning aerosols because of its high measured concentrations in aerosol samples. Levoglucosan often dominates the aerosol composition by mass. In this dissertation, laboratory proxy systems were developed to study the solution-phase chemistry of levoglucosan with common atmospheric reactants found in biomass burning aerosols (i.e. H+, •OH). To mimic these natural conditions, acid chemistry was studied using sulfuric acid in water (pH=4.5). The hydroxyl radical (•OH) was produced by the Fenton reaction which consists of iron, hydrogen peroxide and acid (H2SO4) in aqueous solvent.
For studies in aqueous sulfuric acid, oligomers of levoglucosan were measured by matrix-assisted laser desorption and ionization time-of-flight mass spectrometry (MALDI-TOF-MS). A rational mechanism is proposed based on both the acid-catalyzed cationic ring-opening of levoglucosan and nucleophilic attack of ROH from levoglucosan on the hemi-acetal carbon to produce pyranose oligomers through the formation of glycosidic bonds. Oligomer formation is further supported by attenuated total reflectance Fourier transform infrared spectroscopy (ATR-FTIR). Reactions of levoglucosan with •OH produced from Fenton chemistry were studied in solution. Two modes of oligomerization (2000 u) were observed for reaction times between 1 and 7 days using MALDI-TOF-MS and laser desorption ionization (LDI) TOF-MS. Single-mass unit continuum mass distributions with dominant -2 u patterns were measured and superimposed by a +176/+162 u oligomer series. This latter oligomer pattern was attributed to a Criegee rearrangement (+14 u) of levoglucosan, initiated by •OH, forming a lactone (176 u). The acid-catalyzed reaction of any ROH from levoglucosan (+162 u) forms an ester through transesterification of the lactone functionality, whereupon propagation forms polyesters. Proposed products and chemical mechanisms are suggested as sources and precursors of humic-like substances (HULIS), which are known to possess a large saccharic component and are possibly formed from biomass burning aerosols. These products could also serve as secondary tracers, giving further information on the source and age of the aerosol.
ii
CITATIONS
Material from this dissertation has been published in the following form:
Holmes, B. J.; Petrucci, G. A.. (2006) Water-soluble oligomer formation from acid-catalyzed reactions of levoglucosan in proxies of atmospheric aqueous aerosols. Environmental Science & Technology 40, (16), 4983-4989.
Holmes, B. J.; Petrucci, G. A., (2007) Oligomerization of levoglucosan by Fenton
chemistry in proxies of biomass burning aerosols. Journal of Atmospheric Chemistry 58, (2), 151-166.
ii
ACKNOWLEDGEMENTS
The years that I spent working toward this degree had many challenges above the scientific context that brought me close with a number of people whose friendships I will always appreciate. I started at UVM in a new research group headed by Giuseppe “Joe” Petrucci and had many great times that included getting to know my advisor as well as the three other group members. I first became friends with Brian LaFanchi. We connected through our mutual passion for skiing and had many great powder days at variety of resorts and backcountry spots over the years. Through him, I learned to appreciate baseball as I got to see the Boston Red Sox win the World Series after watching Brian work through many painful seasons. Many great times were spent with Brian and Hilary along with their entire social network of friends.
I also got to know Adam Hunt, a Yankees fan, yet somehow friends with Brian. I watched the two on many days after games between the two rival teams, sometimes taunting each other and sometimes just giving the other space after a traumatic game or series. Adam was a great companion for all these years in this research group and I’ll always remember Mark Knights “particles” and “crazy mechanisms” that we both witnessed. I’d like to recognize Jim Zahardis, the fifth member of the Petrucci group, who started with us after we were in our fourth year. You could always count on Jim’s uncanny wit, broad understanding of math and science, animal stories and shout-outs to Thor. I’ll have especially great memories of “The Lord of the Rings” and all its intonations on which we connected. Every time we all could take some time-off to go for coffee, sit on the green and just commiserate on the dysfunctional nuances of our program was great, especially looking back.
Along with these group members, Sandy Wurthmann was always there for the powder days and hang-out times when we were avoiding the work we had ahead. He was an integral part of my experience at UVM and in Vermont as a whole. His wife, Elizabeth and son, Rowan, are important parts of my experience here in Vermont. Having them, Brett, Tobbs, and my old friend Kris around made this time in graduate school special. Thank you all.
I especially want to thank my girlfriend, Julie, for all her support during the years I was in school. While we were both in graduate school, I will always remember the support we both gave each other. Your tolerance and compassion during this time, especially during the last days of my program, was incredible. Lastly I’d like to thank my family for all there support over these years. I would also like to thank my advisor, Joe Petrucci for being a significant part of my development as a scientist. My experience in this research group will always be valued.
iii
TABLE OF CONTENTS
Page
CITATIONS ...................................................................................................................... ii
ACKNOWLEDGEMENTS ............................................................................................ iii
GLOSSARY.................................................................................................................... viii
LIST OF TABLES ........................................................................................................... ix
LIST OF FIGURES .......................................................................................................... x
1. INTRODUCTION..................................................................................................... 1
1.1. INTRODUCTION TO ATMOSPHERIC AEROSOLS...................................................... 1
1.1.1. Definitions and Terms..................................................................................... 1
1.1.2. Characterization of Atmospheric Aerosols..................................................... 1
1.1.3. Cloud Formation by Atmospheric Aerosols.................................................... 3
1.1.4. Atmospheric Aerosol Emissions: Climate Effects........................................... 3
1.1.4.1. The Aerosol Direct Effect............................................................................ 5
1.1.4.2. The Aerosol Indirect Effect ......................................................................... 6
1.2. Biomass Burning Emissions............................................................................ 6
1.2.1. Introduction..................................................................................................... 6
1.2.2. Characterization of Biomass Burning Aerosols ............................................. 9
1.2.3. The Climate Forcing of Biomass Burning Aerosols ....................................... 9
1.2.4. Cloud Condensation Properties of Biomass Burning Aerosols.................... 10
1.3. CARBONACEOUS AEROSOL FORMED FROM BIOMASS BURNING......................... 11
iv
1.3.1. Introduction................................................................................................... 11
1.3.2. Water Soluble Organic Compounds in Biomass Burning Aerosols.............. 13
1.3.3. Organic Tracers for Biomass Burning Aerosols .......................................... 14
1.3.4. Levoglucosan ................................................................................................ 16
2. LEVOGLUCOSAN PROXY EXPERIMENTAL METHODOLOGY.............. 20
2.1. MODEL REACTION SYSTEM ............................................................................... 20
2.1.1. INTRODUCTION .......................................................................................... 20
2.1.2. General Experimental Setup ......................................................................... 21
2.1.3. Model Chemical Reaction Systems ............................................................... 21
2.2. Development of Analytical Methodology...................................................... 22
2.2.1. Proxy Reaction Conditions ........................................................................... 22
2.2.2. Time-of-Flight Mass Spectrometry ............................................................... 22
2.2.3. Matrix-Assisted Laser Desorption and Ionization Time-of-Flight Mass
Spectrometry ............................................................................................................. 23
2.2.4. MALDI-TOF-MS Sample Preparation and Instrument Settings .................. 25
2.2.5. Laser Desorption and Ionization Time-of-Flight Mass Spectrometry.......... 27
2.2.6. Electrospray Ionization Mass Spectrometry................................................. 28
2.2.7. Attenuated Total Reflectance Fourier-Transform Infrared Spectroscopy.... 29
3. WATER SOLUBLE OLIGOMER FORMATION FROM ACID-
CATALYZED REACTIONS OF LEVOGLUCOSAN IN PROXIES OF
ATMOSPHERIC AQUEOUS AEROSOLS81 .............................................................. 30
v
3.1. INTRODUCTION .................................................................................................. 30
3.2. EXPERIMENTAL.................................................................................................. 32
3.2.1. Experimental Design..................................................................................... 32
3.2.2. Sample Preparation for Analytical Analysis................................................. 32
3.3. RESULTS AND DISCUSSION................................................................................. 33
3.3.1. Experimental Description and Background Control Experiments ............... 33
3.3.2. The Fenton Reaction ..................................................................................... 34
3.3.3. Identification of Chemical Mechanism ......................................................... 38
3.3.4. Potential Role of Iron in Reaction Systems................................................... 42
3.3.5. Proposed Chemical Mechanism for Oligomers Pattern............................... 43
3.3.6. Oligomer Polydispersity and Reaction Kinetic Analysis .............................. 46
3.3.7. ATR-FTIR Supporting Data for Saccharidic Oligomer Formation.............. 54
7.2. CONCLUSIONS.................................................................................................... 55
4. OLIGOMERIZATION OF LEVOGLUCOSAN BY FENTON CHEMISTRY
IN PROXIES OF BIOMASS BURNING AEROSOLS 98 ........................................... 58
4.1. INTRODUCTION .................................................................................................. 58
4.2. EXPERIMENTAL DESIGN..................................................................................... 59
4.2.1. Biomass Burning Aerosol Proxy Reactions .................................................. 59
4.2.2. Sample Preparation and Analysis................................................................. 59
4.3. RESULTS AND DISCUSSION................................................................................. 61
4.3.1. •OH Production by the Fenton Reaction ...................................................... 61
4.3.2. •OH Reactions of Levoglucosan.................................................................... 62
vi
4.3.3. Oligomerization Mass Patterns: MALDI-TOF-MS ...................................... 70
4.3.4. MALDI-TOF-MS Matrix Background .......................................................... 73
4.3.5. Studies Supporting Solution-Phase Chemistry ............................................. 74
4.3.6. MALDI-TOF-MS: Lithium Cationization ..................................................... 78
4.4. CONCLUSIONS.................................................................................................... 83
5. COMPREHENSIVE CONCLUSIONS ................................................................ 85
5.1. Summary of Experimental Findings.............................................................. 85
5.2. GENERAL IMPLICATIONS OF EXPERIMENTAL RESULTS ON CLIMATE SCIENCE ... 86
5.2.1. Application of Experimental Results to Formation Mechanisms of Humic-
Like Substances (HULIS).......................................................................................... 87
5.2.2. Broad Scientific Implications of Chemical Research in Biomass Burning
Aerosols..................................................................................................................... 89
5.3. SUGGESTED RESEARCH DIRECTIONS ................................................................. 90
6. APPENDIX A.......................................................................................................... 92
6.1. DEVELOPMENT AND OPTIMIZATION OF THE MALDI-TOF-MS METHODOLOGY92
7. REFERENCES........................................................................................................ 96
vii
GLOSSARY
ATR-FTIR: Attenuated Total Reflectance Infrared Spectroscopy
BC: Black Carbon
CCN: Cloud Condensation Nuclei
CHCA: α-Cyano-4-hydroxycinnamic acid
DHB: 2,5-dihydroxybenzoic acid
EC: Elemental Carbon
GHG: Green House Gases
HULIS: Humic-Like Substances
IPCC: International Panel on Climate Change
LDI-TOF-MS: Laser Desorption and Ionization Time-of-Flight Mass Spectrometry
MALDI-TOF-MS: Matrix Assisted Laser Desorption and Ionization Mass
Spectrometry
OC: Organic Carbon
•OH: Hydroxyl Radical
PAH: Polyaromatic Hydrocarbons
PM: Particulate Matter
SA: Sinapic Acid
SOA: Secondary Organic Aerosols
VOC: Volatile Organic Compounds
WIOC: Water Insoluble Organic Compounds
WSOC: Water Soluble Organic Compounds
viii
LIST OF TABLES
Table Page
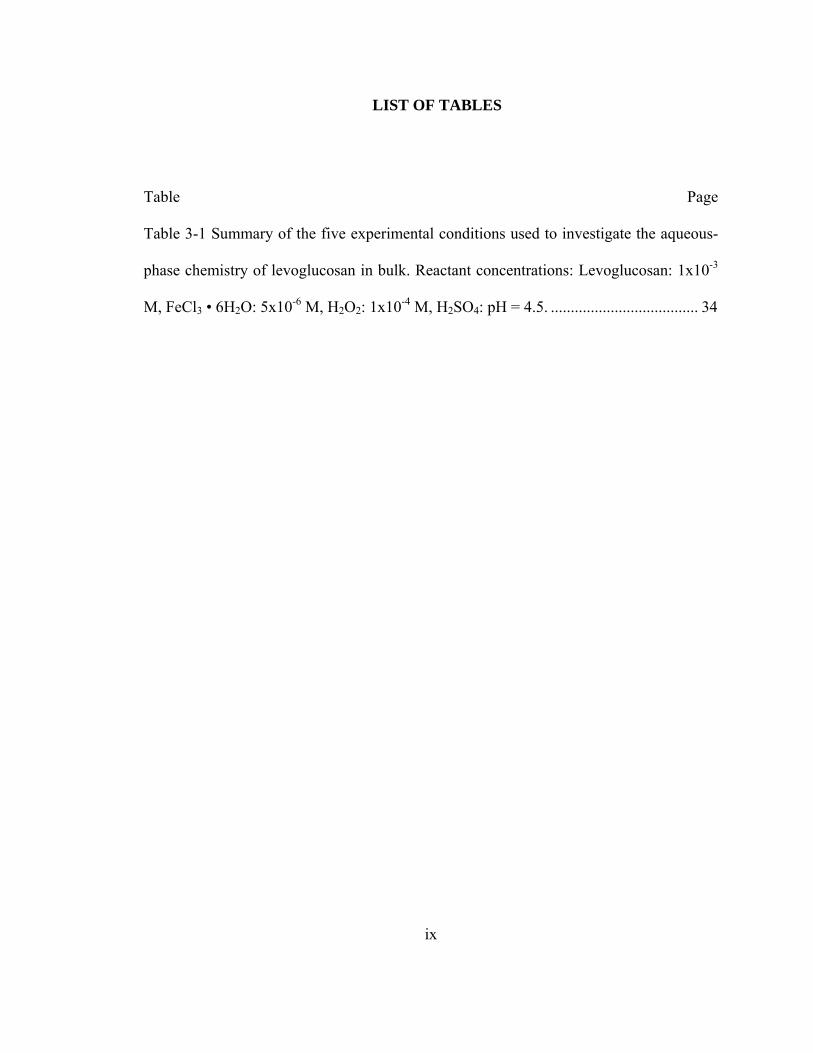
Table 3-1 Summary of the five experimental conditions used to investigate the aqueous-
phase chemistry of levoglucosan in bulk. Reactant concentrations: Levoglucosan: 1x10⁻³
M, FeCl3 • 6H2O: 5x10⁻⁶ M, H2O2: 1x10⁻⁴ M, H2SO4: pH = 4.5. ..................................... 34
ix
LIST OF FIGURES
Figure Page
Figure 1 Estimated radiative forcing of atmospheric components, IPCC, 2001.38........... 10
Figure 2-1 Diagram of MALDI process. www.chm.bris.ac.uk/ms/theory/maldi-
ionisation.html .......................................................................................................... 24
Figure 2-2 MALDI-TOF-MS schematic.
www.cbsu.tc.cornell.edu/vanwijk/mass_spec.htm ................................................... 26
Figure 3-1a MALDI-TOF-MS of Reaction A (levoglucosan, H2O2, H2SO4, Fe3+), day 0.5,
using DHB/NaCl matrix in positive ion, reflectron mode. Spectra are normalized to
the 185 Da (levoglucosan + Na+) peak. (* - indicates relevant product peaks)........ 35
Figure 3-1b MALDI-TOF-MS of Reaction A (levoglucosan, H2O2, H2SO4, Fe3+), day 1,
using DHB/NaCl matrix in positive ion, reflectron mode. Spectra are normalized to
the 185 U (levoglucosan + Na+) peak. (* - indicates relevant product peaks).......... 36
Figure 3-1c MALDI-TOF-MS of Reaction A (levoglucosan, H2O2, H2SO4, Fe3+), day 3,
using DHB/NaCl matrix in positive ion, reflectron mode. Spectra are normalized to
the 185 U (levoglucosan + Na+) peak. (* - indicates relevant product peaks)......... 37
Figure 3-1d MALDI-TOF-MS of Reaction A (levoglucosan, H2O2, H2SO4, Fe3+), day 7,
using DHB/NaCl matrix in positive ion, reflectron mode. Spectra are normalized to
the 185 U (levoglucosan + Na+) peak. (* - indicates relevant product peaks).......... 38
Figure 3-2 Electrospray ionization mass spectrometry (ESI-MS) of the dried day 1
sample for reaction B. (*- indicates relevant product peaks).................................... 40
x
Figure 3-3 MALDI-TOF-MS of Reaction B (levoglucosan, H2SO4), day 1 using
DHB/NaCl matrix in positive ion, reflectron mode. Spectrum is normalized to the
185 U (levoglucosan + Na+) peak. (* - indicates relevant product peaks). .............. 42
Figure 3-4 Proposed acid-catalyzed mechanism for the oligomerization of levoglucosan
(I)............................................................................................................................... 45
Figure 3-5 Mass peak intensity data normalized to day 0.5 for the [x-mer]+ products for
Reaction A. (●) 2-mer; (▲) 3-mer; (▼) 4-mer; (Δ) 5-mer; (□) 6-mer; (◄) 7-mer.
Lines are drawn to aid the eye. Error bars represent 1 standard deviation on 1000
laser shots.................................................................................................................. 47
Figure 3-6a Number (Mn) and weight (Mw) averaged molar mass distributions for the [x-
mer]+ mass peaks from reaction A. (■) Mn, (●) Mw. Error bars represent 1 standard
deviation on 1000 laser shots.................................................................................... 48
Figure 3-6b Number (Mn) and weight (Mw) averaged molar mass distributions for the [x-
mer+18]+ mass peaks from reaction A. (■) Mn, (●) Mw. Error bars represent 1
standard deviation on 1000 laser shots. .................................................................... 49
Figure 3-7a Mass peak intensity data normalized to day 0.5 for the [x-mer]+ products for
Reaction B. (■)1-mer; (●) 2-mer; (▲) 3-mer; (▼) 4-mer; (Δ) 5-mer; (□) 6-mer, (◄)
7-mer. Lines are drawn to aid the eye. Error bars represent 1 standard deviation on
1000 laser shots......................................................................................................... 50
Figure 3-7b Mass peak intensity data normalized to day 0.5 for the [x-mer + 18]+
products for Reaction B. (■)1-mer; (●) 2-mer; (▲) 3-mer; (▼) 4-mer; (Δ) 5-mer;
xi
(□) 6-mer, (◄) 7-mer. Lines are drawn to aid the eye. Error bars represent 1
standard deviation on 1000 laser shots. .................................................................... 51
Figure 3-8a Number (Mn) and weight (Mw) averaged molar mass distributions for the [x-
mer]+ mass peaks from Reaction B. (■) Mn, (●) Mw. Error bars represent 1 standard
deviation on 1000 laser shots.................................................................................... 53
Figure 3-8b Number (Mn) and weight (Mw) averaged molar mass distributions for the [x-
mer+18]+ mass peaks from Reaction B. (■) Mn, (●) Mw. Error bars represent 1
standard deviation on 1000 laser shots. .................................................................... 54
Figure 3-9 ATR-FTIR spectra of dry, lyophilized chemical products from (A) Reaction A
and (B) Reaction B, in addition to the reference compounds (1) cellulose, (2) α -
cyclodextrin, (3) levoglucosan and (4) α-D-glucose. ............................................... 55
Figure 4-1a MALDI-TOF mass spectra of the sodiated products from the reaction of
levoglucosan in the Fenton system; day 1, 1x10⁻³ M H2O2 using DHB/NaCl matrix
in positive ion, reflectron mode. Spectrum is normalized to the 185 u (levoglucosan
+ Na+) ion peak. (* - indicates emphasized oligomer mass peak pattern)................ 64
Figure 4-1b MALDI-TOF mass spectra of the sodiated products from the reaction of
levoglucosan in the Fenton system; day 3, 1x10⁻³ M H2O2 using DHB/NaCl matrix
in positive ion, reflectron mode. Spectrum is normalized to the 185 u (levoglucosan
+ Na+) ion peak. (* - indicates emphasized oligomer mass peak pattern)................ 65
Figure 4-1c MALDI-TOF mass spectra of the sodiated products from the reaction of
levoglucosan in the Fenton system; day 7, 1x10⁻³ M H2O2 using DHB/NaCl matrix
xii
in positive ion, reflectron mode. Spectrum is normalized to the 185 u (levoglucosan
+ Na+) ion peak. (* - indicates emphasized oligomer mass peak pattern)................ 66
Figure 4-2 LDI-TOF mass spectra of the sodiated products from the reaction of
levoglucosan in the Fenton system; day 3, using DHB/NaCl matrix in positive ion,
reflectron mode. The spectrum is normalized to the 185 u (levoglucosan + Na+) ion
peak. .......................................................................................................................... 68
Figure 4-3 Proposed mechanism for the formation of a glucosone by reaction of a
disaccharide with •OH............................................................................................... 69
Figure 4-4 Proposed mechanism for the formation of a ring-expanded lactone from
levoglucosan (Cmpd II) by hydroperoxyl formation initiated by OH• followed by a
Criegee rearrangement. ............................................................................................. 71
Figure 4-5 Proposed mechanism for the formation of ester-containing oligomeric
products from the Fenton system through the acid-catalyzed transesterification
reactions of levoglucosan and the monomeric Criegee lactone product (Cmpd II,
Scheme 3-2). ............................................................................................................. 72
Figure 4-6 Comparison of the normalized 537 u mass peak ion signal. Error bars
represent 1 standard deviation on 3000 laser shots................................................... 76
Figure 4-7 Comparison of the normalized 537 u ion signal for days 1, 3, and 7 using 10-3
M H2O2. Error bars represent 1 standard deviation on 3000 laser shots................... 77
Figure 4-8 ATR-FTIR of the lyophylized, dried products of (A) the Fenton reaction of
levoglucosan (10-3 M H2O2), day 3 and (B) the aqueous reaction of levoglucosan,
H2SO4, and Fe3+ in the absence of H2O2 on day 3. ................................................... 78
xiii
xiv
Figure 4-9 MALDI-TOF mass spectra of the sodiated products from the reaction of
levoglucosan in the Fenton system; day 7, 1x10⁻³ M H2O2 using DHB/LiCl matrix in
positive ion, reflectron mode. Spectrum is normalized to the 169 u (levoglucosan +
Li+) ion peak. Peak in parenthesis indicate significant mass peaks observed in the
background measurements. (* - indicates emphasized oligomer mass peak pattern)80
Figure 4-10 Proposed mechanism for the dehydration (-18 u) of compound IIIa through
nucleophilic intramolecular cyclization by ROH with the terminal gem-diol carbon
to produce compound IIIc (+Li = 327 u). ................................................................. 81
1. INTRODUCTION
1.1. Introduction to Atmospheric Aerosols
1.1.1. Definitions and Terms
An aerosol is defined as a collection of solid or liquid particles suspended in a
gas. While, by definition, an aerosol includes the solid/liquid and gas components, in
the literature the term aerosol usually refers only to the condensed-phase
component(s). As is common in the literature, the terms aerosol and particulate will
be used interchangeably in this dissertation. Common examples of aerosols found in
the Earth’s atmosphere are smoke, smog, fog, and dust. Atmospheric aerosols are
known to have significant impact on atmospheric chemistry, climate forcing and
human health. Both the size distribution and chemical composition of the aerosol are
important in the potential impact of atmospheric aerosols. Important aerosol
composition characteristics include: size, shape, chemical reactivity, and optical
properties.1, 2
1.1.2. Characterization of Atmospheric Aerosols
Particulate matter (PM) found in the atmosphere ranges in size from ~ 0.002 to ~
100 μm in diameter. Over this wide range of particle sizes, several discrete size
modes arise from a variety of sources rather than a broad continuum of sizes.
Particles found in the atmosphere are generally grouped into two broad categories
1
based on size: fine aerosols, which have a diameter less than 2.5 μm and coarse
aerosols which have a diameter greater than 2.5 μm. Fine aerosols are typically
formed through combustion or nucleation events, followed by growth via coagulation
or condensation. An example of this growth process is the condensation of low
volatility gas-phase chemicals on a molecular cluster.3 Fine mode aerosols, due to
their relatively small size, have atmospheric residence times averaging about 3 to 5
days and are affected mainly by dry deposition to the landscape and rainout. They
often have high concentrations of organics and soluble inorganic species such as
nitrate, sulfate, and ammonium. Coarse aerosols, on the other hand, are much larger
and more affected by gravitational sedimentation, lending to them a shorter
atmospheric residence time (seconds to hours). Sources include volcanic emissions,
sea spray and dust storms, all of which are generally driven by mechanical or abrasive
processes. Chemically, coarse particles are generally dominated by inorganic species
such as minerals, and black carbon (soot), while fine particles have high
concentrations of organics and soluble inorganic ions such as sulfate, nitrate, and
ammonium.1, 2
When considering the sources of aerosols in the atmosphere, it is useful to
categorize aerosol sources as either primary or secondary. Primary aerosols are
emitted directly from their source into the atmosphere in the particle phase. Examples
of primary aerosols include sea spray, windborne dust, and soot. Secondary aerosols
are emitted as volatile gas-phase compounds and are converted to the particle phase
in the atmosphere, often as a result of some type of chemical transformation.
2
Oxidation of a number of atmospheric gases can result in secondary sources of
aerosols, including SO2, NOx, and a wide range of volatile organic compounds
(VOCs). As a result, secondary aerosol sources include, but are not limited to,
combustion processes, foliage emissions, marine emission, and volcanoes. Primary
aerosols are usually in the coarse size fraction while secondary aerosols tend to be in
the fine size fraction, though some exceptions exist (e.g.,, primary soot emissions
from combustion processes are mainly fine particles).1, 2
1.1.3. Cloud Formation by Atmospheric Aerosols
Some types of aerosol have the ability to develop into cloud droplets, thereby
acting as cloud condensation nuclei (CCN). In order to produce a cloud droplet under
atmospheric conditions, water vapor needs the solid or liquid surface of an aerosol to
transition to a liquid in the aerosol phase under supersaturated conditions. Although
many types of aerosol act as CCN, generally, biomass burning aerosols are known to
have a high capacity for cloud nucleation. A given aerosol source will affect both the
number concentration, size distribution, and the chemical components of the cloud
droplet as they develop with age.4-6
1.1.4. Atmospheric Aerosol Emissions: Climate Effects
Globally, aerosols are emitted into the atmosphere at a rate of about 3600
teragrams (Tg) per year.2 Both anthropogenic and biogenic sources are significant
contributors to the total atmospheric particulate load. Biogenic emissions total around
3
3100 Tg/year and anthropogenic emissions are estimated to be about 500 Tg/yr.2
Assessment of the total global aerosol mass flux shows that ~80% of that emitted
from both anthropogenic and natural sources is soil dust and sea salt particles that are
in the coarse size range. Fine aerosols, therefore, compose ~20% of the total aerosol
mass. This class of aerosol consists of individual particles that have between 10-3-10-9
of the mass of individual coarse particles. This relationship between fine and coarse
aerosols results in the fact that, of the total number of atmospheric aerosols, almost all
(~100%) are in the fine size fraction.
Often, the impact of aerosols is determined by the number concentration rather
than the mass. This is observed in phenomena such as cloud condensation where the
number of cloud condensation nuclei/aerosol determines the hydrology and reflective
properties of clouds. Cloud measurements have shown that competition for gas-phase
water (humidity) by high numbers of aerosol can suppress cloud droplet growth
because of the high surface area present. By increasing the aerosol numbers and,
therefore, the surface area available for condensation of water within an aerosol
parcel, there is not enough water to grow the aerosols to the critical size for rainout.7
A result of this is suppression of rainout which increases the aerosol/cloud-droplet
atmospheric residence time. By affecting the cloud-droplet size and aerosol/cloud-
droplet atmospheric residence time, changes to the clouds’ albedo (reflectivity) occur,
therefore affecting the radiation budget of the Earth.
4
1.1.4.1. The Aerosol Direct Effect
Research over the past decade has shown that atmospheric aerosols, a majority of
which are formed from anthropogenic sources, possess the ability to affect the
radiation budget of the Earth in both positive and negative directions. This means that
atmospheric aerosols can have a warming or cooling effect on the Earth, which
depends on both particle sizes and chemical composition. Specifically, warming is
caused by absorption of radiation by the aerosol, whereas cooling is due to scattering
of radiation back into space. Early climate models were unable to account for the
measured temperature increase, from 0.3 to 0.6 K, since the industrial age based only
on the increase in green house gas (GHG) emissions over that time.2 The addition of
the aerosol effect into climate models provided significantly better agreement with
the observed temperature increases.8-12
The capacity for aerosols to absorb or scatter radiation is known as the aerosol
direct effect, which has been shown to influence Earth’s radiation budget
significantly, as aerosols can absorb or scatter solar radiation13, 14 as well as infrared
radiation emitted from Earth’s surface. The magnitude of the aerosol direct effect on
climate forcing is influenced by the aerosol’s number concentration, size, chemical
composition, and optical properties.1,2 There is a significant complexity in quantifying
the aerosol direct effect that arises from the uncertainty of the mixing state of
absorbing materials (e.g.,, soot) and reflecting materials (e.g., ammonium sulfate) in
an aerosol parcel. The climate forcing for a given aerosol population is strongly
dependent on whether materials with different optical properties are evenly
5
distributed over all aerosols, separated into discrete types of aerosol, absorbing or
scattering, or, the most likely scenario, somewhere in between (e.g., soot core with an
aqueous ammonium sulfate outer layer).
1.1.4.2. The Aerosol Indirect Effect
Many aerosol indirect effects exist where atmospherically processed aerosols
(e.g., cloud formation from nucleation by aerosols) can affect atmospheric processes,
thereby changing Earth’s radiation budget. The growth of cloud droplets by CCN is
an example of this effect and can cause significant scattering of solar radiation back
to space, thereby cooling the Earth. Additionally, the Twomey effect15, 16 is a
phenomenon which can increase cloud lifetimes, also providing a mechanism which
cools the Earth. Aerosol indirect effects are hypothesized to, in some cases, have a
more significant impact than direct effects.17 The aerosol indirect effects, however,
are very difficult to quantify because of the complex physical and chemical pathways
that affect climate forcing.
1.2. Biomass Burning Emissions
1.2.1. Introduction
Biomass burning, a major source of organic carbon, soot and particulates18, 19 in
the atmosphere, is a global phenomenon with over 80% of the burning occurring in
tropical regions such as the Amazon basin.20 Emissions of biomass burning include
6

both chemically and radiatively active trace gases and particulates that are in
quantities that affect climate on a local, regional, and even a global scale. The global
effects of biomass burning can be attributed to the high convective nature of the
equatorial regions where much of the world’s burning occurs, transporting the gases
and aerosols long distances.
Vegetation is the main source of fuel consumed in biomass burning and contains
mainly the polymeric structures which are found in the cell walls. The composition of
wood is dominated by fibers of cellulose (40-50%) and also lesser amounts of hemi-
cellulose (15-25%) and lignin (15-30%). Cellulose is a linear, crystalline material
consisting of glucose monomers (n = 7,000 – 15,000) linked by β1-4 bonds. Hemi-
cellulose is an amorphous, branched polymer which contains sugar monomers such as
xylose, mannose, galactose, rhamnose, and arabinose. It is much shorter in length
than cellulose, possessing typically around 200 sugar monomers. Finally, lignin is a
large, racemic, cross-linked polymer which is hydrophobic and aromatic in nature. Its
molecular weight is in excess of 10,000 u. There are three general monomers (p-
coumaryl alcohol, coniferyl alcohol, and sinapyl alcohol), which are all methoxylated
to various degrees. Together, these three polymeric materials account for greater than
90% of the dry weight of most vascular plants.21 The remaining mass is composed of
various lipids, proteins, and other metabolites, as well as water and minerals. The
combustion of the organic material in vegetation is a complex sequence of chemical
reactions and physical transformations including pyrolysis, combustion,
depolymerization, water elimination, oxidation, fragmentation, char formation and
7
volatilization.22
Qualitatively, smoke particles are composed of ~ 50-60 % organic carbon and ~5-
10 % elemental carbon (black soot), and trace inorganic species (e.g., K+). They can
be solid, liquid, or a combination. Smoke particles are generally known to have an
aqueous component as they are formed from combustion processes. From a global
perspective, one estimate reports the total contribution of biomass burning to the
global particulate load to be about 7% (104 Tg/yr). Further, compared to global
emissions, the particulate organic carbon is 39% (69 Tg/yr), and elemental carbon
(black soot) is >86% (~108 Tg/yr).20 Aerosol particles (smoke) emitted from biomass
burning sources have 80-90% of their volume in the fine mode and therefore have
significant atmospheric lifetimes.23, 24
Studies to characterize the organic composition of biomass burning aerosols are
mainly motivated by the climate25 and human health effects 26, 27, 28 of this aerosol
class. Currently, only a small percentage of the organic compounds within these
aerosols have been identified. Also, little is known about the chemistry of these types
of primary aerosols, especially with aerosol age, as only a few studies have
characterized ambient biomass fires.29, 30 In order to add to the body of knowledge of
the chemistry of primary aerosols emitted from biomass fires, this dissertation has
focused on fundamental chemistry that may occur in this type of aerosol, specifically
as it applies to the anhydrosaccharide, levoglucosan (c.f. Section 1.3.4.)
8
1.2.2. Characterization of Biomass Burning Aerosols
The organic components of biomass burning aerosols are often composed of a
highly complex mixture of compounds with a diversity of chemical structures and
reactivities, as well as physical properties.31 The complexity of these aerosols makes
comprehensive characterization on the molecular level difficult. To this end, many
laboratory studies have characterized biomass aerosol compounds by burning, for
example, individual components of vegetation such as cellulose22, 32, 33 and vegetation
in its complete form34, 35 yielding information of the chemical speciation of these
systems. Additionally, many field campaigns have been carried out to characterize
real biomass burning aerosols.36, 37 The major observation of these investigations is
that sugar derivatives are a major component of cellulose and hemi-cellulose
pyrolysis.22, 35
1.2.3. The Climate Forcing of Biomass Burning Aerosols
The direct effect of biomass burning emissions on the Earth’s radiation budget
was estimated in 2001 by the International Panel on Climate Change (IPCC) to be
about -0.2 Watts per square meter (Figure 1), therefore acting as a global cooling
mechanism. This measurement, however, has a significant level of uncertainty. There
is a large uncertainty in indirect effects by aerosols in general. As of 2001, the IPCC38
had not given an estimated value for the indirect aerosol effects on climate forcing,
but had only reported an error bar which reports an estimated uncertainty range of ~ 0
to -2 Watts per square meter. Unfortunately, the current level of scientific
9
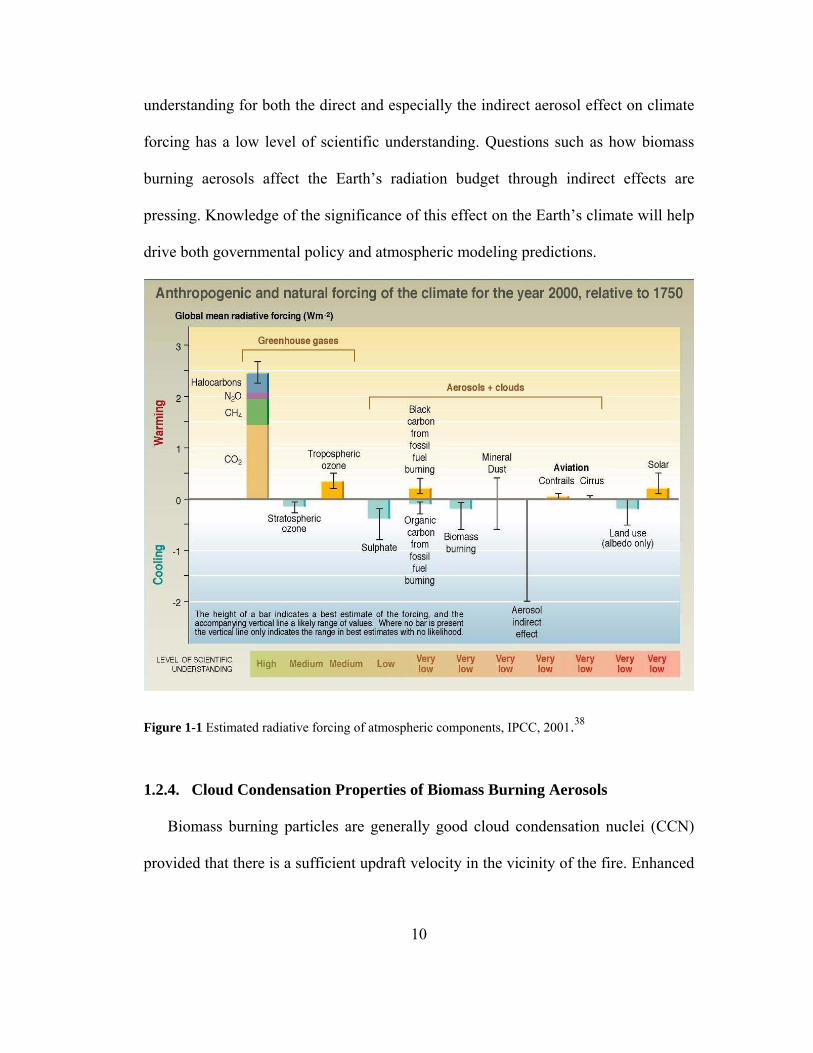
understanding for both the direct and especially the indirect aerosol effect on climate
forcing has a low level of scientific understanding. Questions such as how biomass
burning aerosols affect the Earth’s radiation budget through indirect effects are
pressing. Knowledge of the significance of this effect on the Earth’s climate will help
drive both governmental policy and atmospheric modeling predictions.
Figure 1-1 Estimated radiative forcing of atmospheric components, IPCC, 2001.38
1.2.4. Cloud Condensation Properties of Biomass Burning Aerosols
Biomass burning particles are generally good cloud condensation nuclei (CCN)
provided that there is a sufficient updraft velocity in the vicinity of the fire. Enhanced
10
densities of CCN lead to an increase in Earth’s albedo through cloud formation.6, 39
Although organic compounds are often found to dominate up to ~90 % of the total
aerosol mass in biomass burning aerosols,40, 41 it is not yet understood how either the
organic or inorganic composition of these aerosols affect cloud formation. Biomass
burning aerosols are typically known as cloud formers, although there are exceptions.
Anomalous behavior in the cloud-forming properties of biomass burning aerosols has
been observed. In Amazon fires, cloud-inhibiting phenomena have been observed by
biomass burning aerosols through remote sensing measurements.7 Other physical
effects, such as the Twomey effect,15, 16 which increases cloud droplet concentrations
and therefore cloud albedo, are proposed as processes which cause this phenomenon.
However, little is known about the chemistry within these aerosols and how the
compounds affect the physical properties of these aerosols, especially how they affect
the aerosols capacity as CCN.
1.3. Carbonaceous Aerosol Formed from Biomass Burning
1.3.1. Introduction
Carbon-containing aerosols (carbonaceous) have received significant attention
over the past 10-15 years as their impact on human health, climate change, and
atmospheric chemistry has come into view. Carbonaceous aerosols can exist in two
general forms: organic carbon (OC) or elemental carbon (EC). OC refers to molecular
hydrocarbons that are often functionalized with oxygen, nitrogen, sulfur and/or other
11
elements. OC possesses a wide range of physical and chemical properties as a result
of the great variety of structures that can exist, including oligomeric and polymeric
forms. The exact definition of an oligomer is currently a matter of debate, but it
generally is accepted to be a molecule consisting of between 2 and 100 monomers. A
polymer generally refers to a molecule with an undefined, and usually large, number
of monomers. EC refers to carbon that is graphitic in nature and generally associated
with soot.
A third category, black carbon (BC) refers to carbonaceous aerosols that absorb
visible radiation significantly. This is a useful definition since the absorption
properties of particles are of primary importance in assessing the direct climate
forcing of aerosols. Though BC is predominately composed of elemental carbon (i.e.,
black soot), polyaromatic hydrocarbons, which are categorized as OC, are usually
associated with soot particles and are also very strong absorbers of visible radiation.
For this discussion, organic aerosol (OA) will describe atmospheric aerosols that have
a significant OC (> 30 %) component.
A substantial portion (~20-50%) of the total atmospheric fine particulate matter is
contains carbon and is emitted in significant amounts from both anthropogenic and
natural sources.25 Anthropogenic sources of OA are almost entirely the result of
combustion processes such as biomass burning and can be either primary (POA) or
secondary (SOA) in nature. Anthropogenic OA have been the cause for serious
concern about the health effects of PM in urban areas, where PAHs and nitro-PAHs
have been associated with fine PM from combustion sources, including vehicular
12
emissions and biomass burning. Though, technically, biomass burning, a large source
of primary and secondary organic aerosols, can occur as a result of natural processes
(e.g., lightning-induced forest fires), it is generally categorized as an anthropogenic
contributor to OA.
OC contained in biomass burning aerosols is a complex mixture of hundreds or
maybe thousands of different compounds. Some of the different classes of
compounds that have been identified in biomass burning aerosols include: n-alkanes,
polyaromatic hydrocarbons (PAHs), aromatic carbonyls, methoxyphenols, n-alkanoic
acids, n-alkanedioic acids, n-alkeneoic acids, resin acids (e.g., abietic acid), mono-
and di- saccharides, anhydrosaccarhides, phytosterols, and amino acids.42,43 Across
this diverse set of compounds, physical and chemical properties can vary
substantially, controlling the role and fate of organic aerosols in the atmosphere.
These properties can affect their gas-to-aerosol partitioning, water uptake, and light
scattering and absorption.
1.3.2. Water Soluble Organic Compounds in Biomass Burning Aerosols
A few early field studies reported finding water-soluble compounds enriched in
smoke aerosols. Interest in the water-soluble components of this type of aerosol
increased when Novakav and Corrigan39 reported that the burning of cellulose
produced aerosols composed of nearly 100% water-soluble organic compounds
(WSOC). The interest in these compounds was enhanced by studies indicating that
WSOCs in aerosols could have a significant effect on their CCN nucleating
13
activity.44-47 Further, the high concentrations of WSOCs in smoke aerosol suggests
that they may play important roles in the chemistry of cloud droplets which are
nucleated by smoke aerosol.
Within the past decade, a strong research interest has developed in characterizing
a class of WSOCs found in aerosols known as humic-like substances (HULIS).48, 49
The term HULIS originates from the apparent resemblance of this compound class to
the macromolecular humic and fulvic acids found in terrestrial and aquatic
environments. HULIS is a class of macromolecular compounds that has been
measured in fogwater, aerosols, and cloudwater.50-53 Studies of HULIS are motivated
by its potentially strong effects on aerosol properties such as hygroscopicity, their
ability to nucleate cloud formation, and light absorption.48, 54 Also, in light of humic
acids roles in the solubilization, sorption, complexation, and transport of organic and
inorganic species in the biosphere, it is anticipated that HULIS may play a similar
role in the atmosphere.
1.3.3. Organic Tracers for Biomass Burning Aerosols
Biomass burning aerosols vary between fires depending on moisture, fuel type,
type of fire (smoldering and/or flaming), wind direction, and a variety of other
meteorological variables. As these air parcels mix and age, optical, physical and CCN
properties can change significantly. Even more difficult is assessing the effects of a
combination of burning sources. Mixing of biomass burning aerosols with other
natural and anthropogenic pollution sources forms hazes, which can affect the
14
atmosphere from a local, regional, seasonal, and a global scale.55 In assessing these
aerosol properties, chemical tracers are useful as fingerprints in identifying variables
such as point sources, fuel types, aerosol parcel age, etc. Chemical markers have been
identified for the combustion and pyrolysis of residential wood-smoke.56 The use of
terpeniod and lipid tracers has been applied to the characterization of biomass burning
aerosols in Amazonia, Brazil34, Oregon57, China58, and Southern California.59 Retene,
a thermal alteration product of terpenoids such as abietic acid in conifer wood, has
been found in aerosols in Norway and Oregon. It has also been found to a limited
extent in Los Angeles, California, and China. Retene is not measurable in aerosols
collected in Nigeria or Amazonia, Brazil as conifers are not a fuel source in these
areas. Since retene is a unique product of conifer wood burning, it is not always found
in significant concentrations for it to be used as a tracer.
Not all wood-burning sources have been fully characterized for tracer
composition in aerosols. There is a need to have molecular markers that are specific
to point and regional sources, unique to foliage burning, atmospherically stable and
exist in high concentrations. This information will help investigators to estimate its
atmospheric stability and therefore quality as a marker for biomass burning aerosol
parcels. Such markers and their atmospheric reaction products may be able to provide
not only source information, but aerosol parcel age.35 To understand the potential of
biomass burning aerosols markers such as levoglucosan, laboratory and field studies
must be performed to understand its chemical reactivity.
15
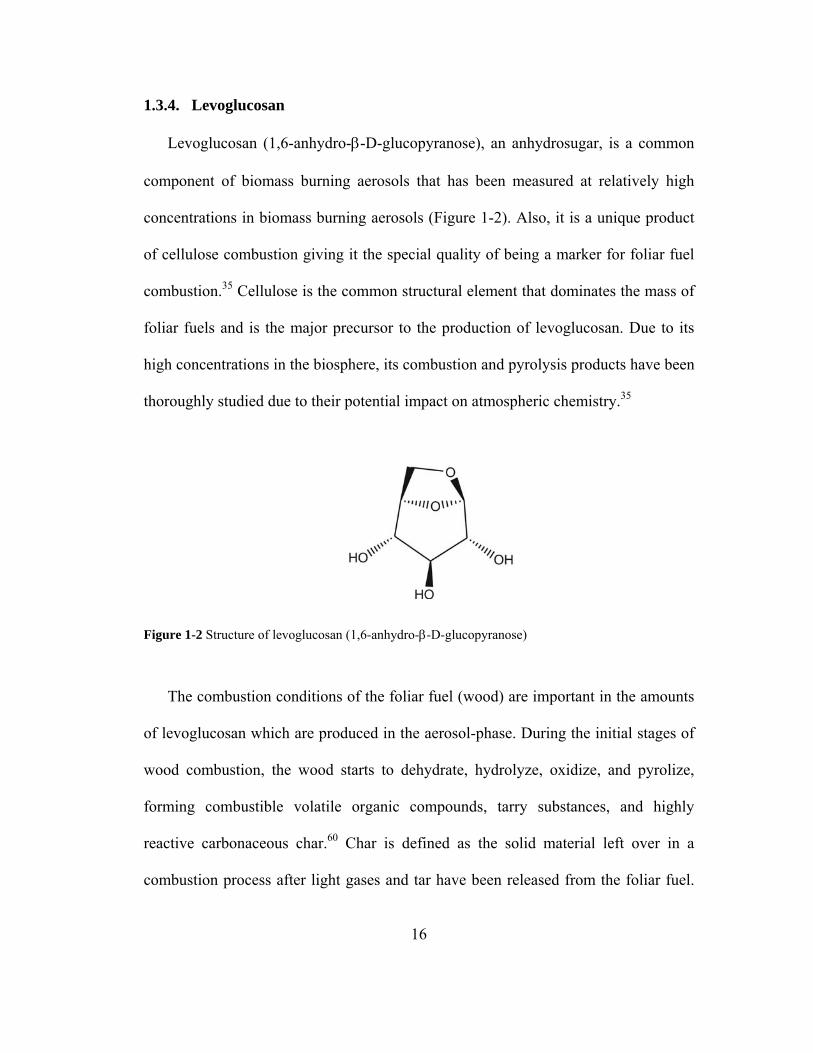
1.3.4. Levoglucosan
Levoglucosan (1,6-anhydro-β-D-glucopyranose), an anhydrosugar, is a common
component of biomass burning aerosols that has been measured at relatively high
concentrations in biomass burning aerosols (Figure 1-2). Also, it is a unique product
of cellulose combustion giving it the special quality of being a marker for foliar fuel
combustion.35 Cellulose is the common structural element that dominates the mass of
foliar fuels and is the major precursor to the production of levoglucosan. Due to its
high concentrations in the biosphere, its combustion and pyrolysis products have been
thoroughly studied due to their potential impact on atmospheric chemistry.35
Figure 1-2 Structure of levoglucosan (1,6-anhydro-β-D-glucopyranose)
The combustion conditions of the foliar fuel (wood) are important in the amounts
of levoglucosan which are produced in the aerosol-phase. During the initial stages of
wood combustion, the wood starts to dehydrate, hydrolyze, oxidize, and pyrolize,
forming combustible volatile organic compounds, tarry substances, and highly
reactive carbonaceous char.60 Char is defined as the solid material left over in a
combustion process after light gases and tar have been released from the foliar fuel.
16
Tar is the viscous liquid emitted from wood during carbonization at high temperatures
under anoxic conditions. The composition of tar is complex and is commonly stated
to contain water, diterpenes, oxygenated benzenes, resin acids (e.g., abietic and
pimaric isomers, C19H29COOH), and fatty acid methyl esters.61, 62 At the ignition
temperatures (<300 °C) of the volatile organic compounds, gas-phase combustion
begins and is visible as a flame. Resinous compounds and thermal decomposition
products of cellulose, hemi-cellulose and lignan are stripped and undergo partial and
complete combustion in the flaming zone. During flaming combustion, this process
continues until the volatile combustible flux drops below a critical threshold where
flaming ends. At this point, a process known as smoldering begins where the
temperature is high enough (>300 °C) for the continued propagation of char
formation. During smoldering, bond cleavage of wood components produces tarry
anhydrosaccharides as well as a variety of other gas- and aerosol-phase products.63 .
This process includes a gas-solid phase reaction between oxygen and the remaining
reactive char which emits large amounts of incompletely oxidized pyrolysis products
into the atmosphere. Many of these compounds, when emitted into the atmosphere,
are found in the particulate phase because of their low vapor pressures. Major
products of the smoldering-phase are levoglucosan (1,6-anhydro-β-D-glucopyranose)
and its furanose isomer which are found in the fine aerosol size mode.35 It is during
the smoldering-phase where high aerosol-phase concentrations of levoglucosan are
formed.
Due to its high water solubility and low vapor pressure, levoglucosan is a
17
common component of smoke aerosols, which are known to be hygroscopic at a
young age.30 Because levoglucosan is a unique product of foliar fuel combustion, it is
currently considered a viable molecular tracer for biomass burning in urban and rural
airsheds and sediments.64 The atmospheric importance of these chemical processes
relies on the conditions that levoglucosan is chemically stable on an atmospherically
relevant time-scale and that viable concentrations of the relevant reactive species and
levoglucosan are present in the biomass burning aerosol. Biomass burning aerosols
may satisfy these conditions as anhydrosaccharides have been found to be a dominant
class (e.g., ~ 61% of carbonaceous material by mass) within these types of aerosols.
In some biomass burning aerosol measurements, levoglucosan has been found to be
by far the dominant anhydrosaccharide and has been measured to be between 87-91%
of the anhydrosaccharide fraction.30
In the field of atmospheric science, broad questions concerning the use of
levoglucosan as a biomass burning species/tracer include 1) what are the atmospheric
chemical sinks/mechanisms for levoglucosan, 2) what products are formed from
common reactive species, 3) what is the significance of these pathways under
atmospheric conditions, 4) will identified chemical products of levoglucosan be
unique to biomass burning, 5) can these products give information on a aerosol
parcel’s age and/or regional or point source, 6) what is the atmospheric lifetime of
levoglucosan, and 7) how do these products affect the atmospheric physical and
optical properties of the aerosols (e.g., CCN, etc.). This dissertation focuses on
questions 1 and 2 which address the fundamental chemical reactions of the model
18

compound, levoglucosan, under simulated atmospheric conditions (i.e. •OH and H+).
19
2. Levoglucosan Proxy Experimental Methodology
2.1. Model Reaction System
2.1.1. Introduction
In considering the question above, biomass burning aerosol proxy experiments
were developed in the laboratory to understand chemical sinks and products of
levoglucosan in aqueous reaction systems. An aqueous reaction system was chosen
since biomass burning aerosols have been found to be highly aqueous. Levoglucosan
was chosen as the model compound for this system since it often dominates the
aerosol mass30 and has been used as a tracer for biomass burning aerosol parcels.35
Also, chemical mechanisms identified may be general for other reactive organic
species in biomass burning aerosols, providing more information about the chemistry
in this type of aerosol. Since levoglucosan is found mainly in fine mode aerosols,
which generally have an atmospheric residence time of about 3-5 days, the
experimental design was setup to measure the reactions of levoglucosan for up to 7
days. All studies in this dissertation used similar methods for the general
experimental design and sample analysis. This section describes the common
techniques used to investigate the levoglucosan proxy systems. Further details will be
given in the chapters for the individual studies where new or augmented experimental
design or sampling methods are used.
20
2.1.2. General Experimental Setup
Reactions were run in bulk solution on a 1 liter scale in 1.5-liter pyrex beakers at
room temperature. Reactions were also performed in water as smoke aerosols are
known to be largely aqueous. Since biomass burning aerosols often have a strong
propensity to act as CCN, aqueous systems are especially relevant.
2.1.3. Model Chemical Reaction Systems
Two environmentally relevant reactive species were targeted for these studies.
Both H+ and •OH are ubiquitous reactants found in the atmosphere. The pH of
cloudwater ranges between 3 and 665, 66 and fine mode aerosols are often even more
acidic.67-70 The pH of the chemical reaction systems in this work were adjusted to 4.5
for all reactions.
The hydroxyl radical is one of the strongest atmospheric oxidants known.71 In the
atmosphere, it is considered as the most important oxidative species as it is a sink for
most organic species. For these studies, •OH was produced in-situ in the bulk solution
using the Fenton reaction.72 In the Fenton reaction, free •OH radicals are formed by
the reaction of Fe(II) and hydrogen peroxide (H2O2) in aqueous acidic solution
(Equation 1).
Fe(II) + H2O2 → Fe(III) + •OH + OH- Eq.1
It is known that although about ~80% of •OH in atmospheric aerosols come from the
21
gas-phase, significant amounts of the •OH are produced within the aerosol, where one
of the routes is through the Fenton reaction.65
2.2. Development of Analytical Methodology
2.2.1. Proxy Reaction Conditions
The general protocol used for sampling from these reactions was to take 250 mL-
aliquots of the solution for time points 0.5, 1, 3, 5, and 7 days. Since the reactions
were in aqueous solution, the sample aliquots were lyophylized (freeze-dried) under
vacuum at low temperature until dry. This served not only to remove water but to
concentrate the reaction products for analysis.
2.2.2. Time-of-Flight Mass Spectrometry
Time-of-flight mass spectrometry (TOF-MS) was the main analysis method used
for the research presented here. As discussed below, different techniques were used to
ionize the analyte using this type of mass spectrometric analysis. The ionization of the
analyte is a key step as a mass spectrometer works on the principle of accelerating a
charged molecule in an electric field. Ions with the same charge will have the same
kinetic energy but the velocity of the ion will depend on its mass-to-charge (m/z)
ratio. In TOF-mass spectrometry, the time that it takes for a specific ion to reach a
detector, with a known flight distance, will depend on the accelerating voltage, and
the m/z of the ion. Heavier ions will have slower speeds. Once the time of the ion
22
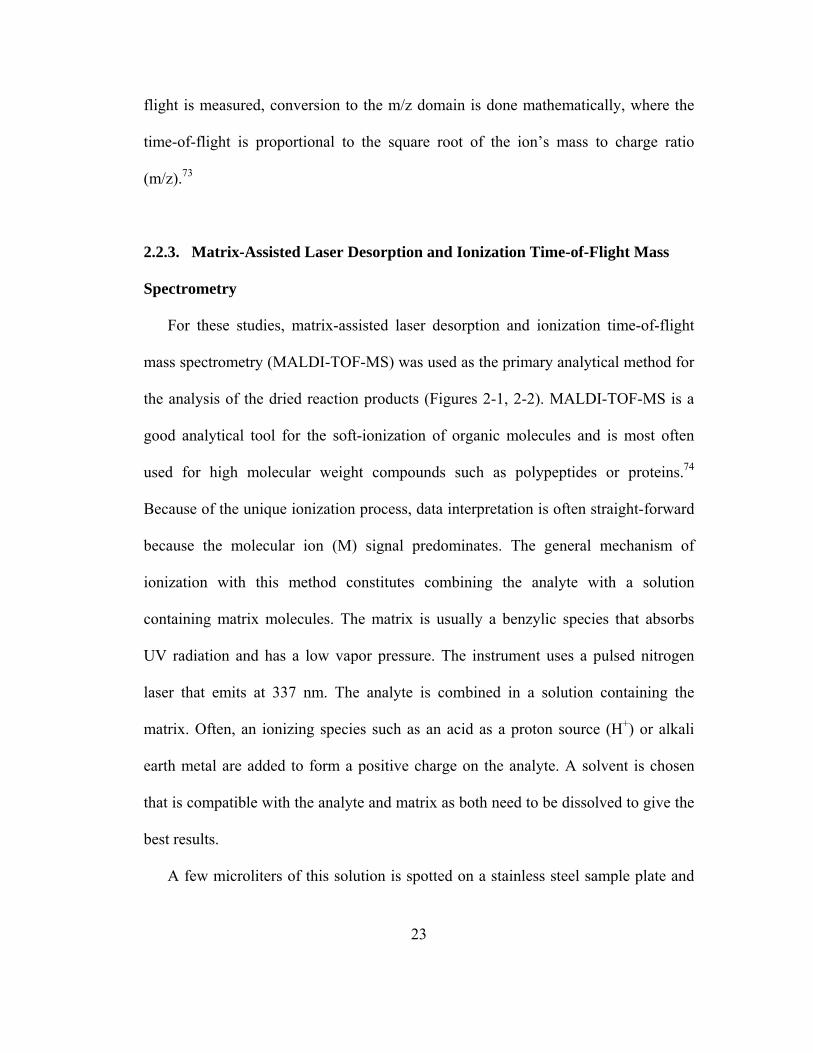
flight is measured, conversion to the m/z domain is done mathematically, where the
time-of-flight is proportional to the square root of the ion’s mass to charge ratio
(m/z).73
2.2.3. Matrix-Assisted Laser Desorption and Ionization Time-of-Flight Mass
Spectrometry
For these studies, matrix-assisted laser desorption and ionization time-of-flight
mass spectrometry (MALDI-TOF-MS) was used as the primary analytical method for
the analysis of the dried reaction products (Figures 2-1, 2-2). MALDI-TOF-MS is a
good analytical tool for the soft-ionization of organic molecules and is most often
used for high molecular weight compounds such as polypeptides or proteins.74
Because of the unique ionization process, data interpretation is often straight-forward
because the molecular ion (M) signal predominates. The general mechanism of
ionization with this method constitutes combining the analyte with a solution
containing matrix molecules. The matrix is usually a benzylic species that absorbs
UV radiation and has a low vapor pressure. The instrument uses a pulsed nitrogen
laser that emits at 337 nm. The analyte is combined in a solution containing the
matrix. Often, an ionizing species such as an acid as a proton source (H+) or alkali
earth metal are added to form a positive charge on the analyte. A solvent is chosen
that is compatible with the analyte and matrix as both need to be dissolved to give the
best results.
A few microliters of this solution is spotted on a stainless steel sample plate and
23
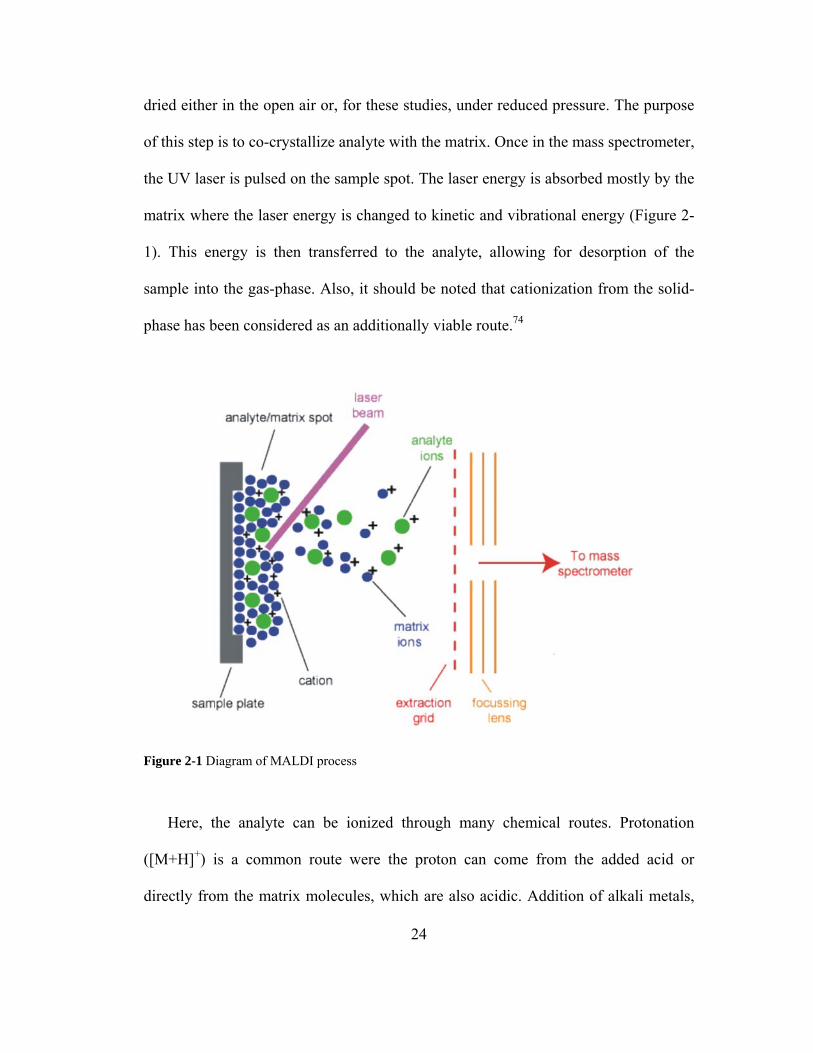
dried either in the open air or, for these studies, under reduced pressure. The purpose
of this step is to co-crystallize analyte with the matrix. Once in the mass spectrometer,
the UV laser is pulsed on the sample spot. The laser energy is absorbed mostly by the
matrix where the laser energy is changed to kinetic and vibrational energy (Figure 2-
1). This energy is then transferred to the analyte, allowing for desorption of the
sample into the gas-phase. Also, it should be noted that cationization from the solid-
phase has been considered as an additionally viable route.74
Figure 2-1 Diagram of MALDI process. www.chm.bris.ac.uk/ms/theory/maldi-ionisation.html
Here, the analyte can be ionized through many chemical routes. Protonation
([M+H]+) is a common route were the proton can come from the added acid or
directly from the matrix molecules, which are also acidic. Addition of alkali metals,
24
such as sodium chloride, is another route to cationization of the analyte. The ideal
cationization method depends primarily on the molecular structure of the analyte and
is chosen to match this molecular character.
Successful measurement of reaction products in the levoglucosan system was
achieved by using 2,5-dihydroxybenzoic acid (DHB) in an aqueous solution using
sodium chloride as a cationization agent. Sodium cationized adducts of the molecular
ion peaks were observed for both the acid-catalyzed and Fenton chemical reaction
products. In general, for both systems, compounds within a class of glucose-type
oligosaccharides were observed. Many studies have shown successful cationization
using this MALDI sample preparation methodology for the cationization of
oligosaccharides.75-77
2.2.4. MALDI-TOF-MS Sample Preparation and Instrument Settings
The samples were prepared for MALDI-TOF-MS by adding ~1 μg of analyte to 5
μL of deionized water. Precisely 1 μL of this solution was mixed with 9 μL of a
matrix solution containing 10 mg/mL DHB and 1 mg/mL NaCl. 1x, 10x, and 100x
dilutions were made. The 10x solution almost always gave the best signals. All
measurements were made in positive ion, reflectron mode (Figure 2-2).
25
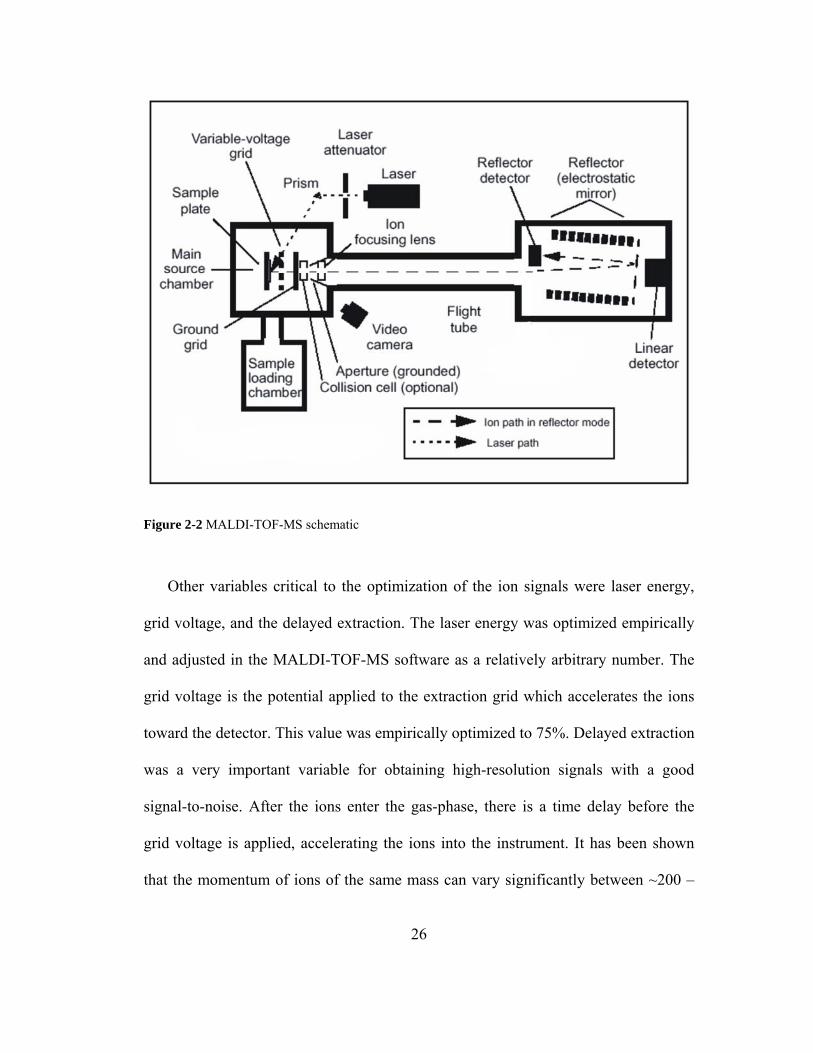
Figure 2-2 MALDI-TOF-MS schematic. www.cbsu.tc.cornell.edu/vanwijk/mass_spec.htm
Other variables critical to the optimization of the ion signals were laser energy,
grid voltage, and the delayed extraction. The laser energy was optimized empirically
and adjusted in the MALDI-TOF-MS software as a relatively arbitrary number. The
grid voltage is the potential applied to the extraction grid which accelerates the ions
toward the detector. This value was empirically optimized to 75%. Delayed extraction
was a very important variable for obtaining high-resolution signals with a good
signal-to-noise. After the ions enter the gas-phase, there is a time delay before the
grid voltage is applied, accelerating the ions into the instrument. It has been shown
that the momentum of ions of the same mass can vary significantly between ~200 –
26
1000 m/z. Also, ions with different molecular weights will have vastly different initial
velocities. The time delay allows for ions with different velocities to move different
distances from the extraction grids. At an optimum time, the extraction pulse is
applied and ions further from the extraction grid will experience a different potential
than, for example, a heavier ion that is closer to the grids. This allows for time
focusing, increasing the likelihood that ions of the same mass will impact on the
detector within a narrow time window, increasing mass resolution and signal
intensity.78 The optimized delayed extraction time used for these levoglucosan studies
was 200 nanoseconds. This delay-time was determined empirically (c.f. Appendix 1).
All measurements were made in reflectron mode. A reflectron is an electrostatic
lens which, by using an electrical potential sign (+/-) that matches the analyte’s
charge, allows for greater mass resolution and signal intensity. The field reverses the
ions’ initial direction of travel in the ion flight-tube by ~180 degrees, increasing their
flight distance. If two ions with the same m/z approach the reflectron with different
kinetic energies, the one with greater kinetic energy will penetrate deeper into the
electrostatic area, increasing the flight path length compared to the ion with lower
kinetic energy. A reflectron improves mass resolution by assuring that ions of the
same m/z but with different kinetic energies arrive at the detector at the same time.
2.2.5. Laser Desorption and Ionization Time-of-Flight Mass Spectrometry
Laser Desorption and Ionization Time-of-Flight Mass Spectrometry (LDI-TOF-
MS) was used as a complimentary technique to the MALDI-TOF-MS experiments.
27
Specifically, it provided unique data in the hydroxyl radical study. This uses the same
instrument as the MALDI-TOF but the analyte is not co-crystallized with a matrix.
Rather, powdered carbon was suspended in water and spotted on the MALDI sample
plate and dried under vacuum. This was repeated until there was an even layer of
dried carbon on the sample well. Next, ~ 1 μg of analyte was dissolved in 5 μL of 1
mg/mL sodium chloride in deionized water. About 3 μL of this solution was spotted
on top of the carbon and dried under vacuum. The sample plate was introduced into
the MALDI-TOF instrument as before and the same instrument variables, except for
laser energy, were used. To form ions, the laser is pulsed on the sample spot. The
carbon is heated by the laser, and the analyte desorbs into the gas-phase. Also, the
laser energy could be absorbed by the analyte if the absorption cross-section for the
UV wavelength was optimal. Once sampled by the pulsed laser, the analytes were
cationized by sodium.79 The laser energy used was significantly higher than that used
for the MALDI-TOF-MS experiments.
2.2.6. Electrospray Ionization Mass Spectrometry
Electrospray ionization mass spectrometry (ESI-MS) is an analytical technique
where ion formation in the vacuum is accomplished by pushing the analyte, which is
dissolved in a volatile solvent, through a high voltage capillary needle. Once through
the needle, the sample is aerosolized and may possess multiple charges. As the
aerosols travel in a nitrogen stream, the charged aerosols evaporate, reducing its size.
As the charged aerosols get smaller and the charges are forced closer together, they
28
undergo Coulombic fission, breaking into smaller particles and evaporating until only
the analyte is left. The analyte accommodates a charge (positive or negative) that
comes from the either the fission process or through the addition of added cationizing
agents such as acids (+), alkali earth metals (+), or halogens (-).
The possibility for ionization artifacts from MALDI-TOF-MS exists due to non-
covalent interactions. The ESI-mass spectra supported solution-phase chemistry
rather than ionization artifacts during the MALDI process. This is discussed in
Section 3.
2.2.7. Attenuated Total Reflectance Fourier-Transform Infrared Spectroscopy
Attenuated total reflectance Fourier-transform infrared spectroscopy (ATR-FTIR)
provided supporting data for the proposed mechanisms in both the acid-catalyzed and
hydroxyl radical studies. In this method, solid or liquid samples can be measured
directly without further sample preparation. ATR uses a property of internal
reflectance called an evanescent wave. An infrared beam in passed through an ATR
crystal where multiple internal reflections create this evanescent wave that extends a
few micrometers (μm) into the sample and finally into a detector. The crystal is
typically made of materials such as germanium and zinc selenide which, to produce
this effect, must have a much higher refractive index than sample being studied.80
Dried samples were directly pressed onto the ATR crystal and spectra were measured
between 4500 and 200 cm-1 using 32 scans, and 4-cm-1 resolution.
29
3. Water Soluble Oligomer Formation from Acid-Catalyzed Reactions of
Levoglucosan in Proxies of Atmospheric Aqueous Aerosols81
3.1. Introduction
Because of its high reactivity, the hydroxyl radical is known to be the most
important atmospheric oxidant as it governs the oxidation and removal of most trace
gases82 as well as various organic species in cloudwater.65 Within aqueous aerosols,
the Fenton reactions may generate significant amounts of hydroxyl radicals through
the reaction of hydrogen peroxide with Fe(II) under acidic conditions.65 Here, an
aqueous levoglucosan reaction system is studied to assess fundamental chemical
pathways that may occur in aqueous biomass burning aerosols.
To be an effective marker for long-range transport, levoglucosan must be
chemically stable on an atmospherically relevant time-scale compared with its loss
from aerosol deposition to the landscape. To date, chemical processes that may
remove levoglucosan from smoke aerosol remain unknown; therefore, the absence of
measurable levoglucosan in an aerosol parcel should not necessarily negate
apportionment of the aerosol to a biomass burning source. It is therefore the focus of
this study to understand the chemical transformations of levoglucosan under
atmospherically relevant conditions to better evaluate levoglucosan as a useful marker
to characterize biomass burning aerosols. In cases where there are significant
chemical removal pathways of levoglucosan, reaction products are generated that, it
30
is suggested here, may serve as secondary tracers for the aerosol parcel. Even in cases
where levoglucosan is measured, the secondary tracers may provide additional
information regarding the age of the aerosol parcel, its source and the atmospheric
processing it has undergone. This laboratory study serves to elucidate upon chemical
loss mechanisms for levoglucosan as well as to identify potential secondary tracers
within simulated biomass burning aerosols.
Oligomerization via acid-catalyzed processes, including aldol condensation and
reaction through the dehydration of hemi-acetal functionalities, has been observed
previously in laboratory studies on secondary organic aerosol formation; 83-85
therefore, it is hypothesized here that, in addition to hydroxyl radical reactions, acid-
catalyzed oligomerization may also be a significant removal pathway for
levoglucosan in atmospheric aqueous aerosols. Also, removal of atmospheric
levoglucosan by acid-catalyzed oligomerization may be facilitated by the naturally
acidic pH of atmospheric aqueous aerosols. In this study, matrix assisted laser
desorption ionization (MALDI) time-of-flight (TOF) mass spectrometry (MS) and
attenuated total reflectance (ATR) Fourier transform infrared (FTIR) spectroscopy
were used to measure the reactivity of levoglucosan and identify molecular products
in solutions designed to serve as proxies for atmospheric aqueous aerosols,86
providing a qualitative description of possible atmospheric aerosol processes leading
to the chemical removal of levoglucosan.
31
3.2. Experimental
3.2.1. Experimental Design
All reagents were used as supplied by the manufacturer. Initial reagent
concentrations were the same for all experiments: levoglucosan (10-3 M) (99%, Alfa
Aesar), hydrogen peroxide (10-4 M) (30% in water, Acros), anhydrous ferric chloride
hexahydrate (5x10⁻⁶ M) (99%, Fisher), and sulfuric acid (to bring the solution pH to
4.5) (96.1%, Mallinckrodt). The concentration of hydrogen peroxide was based on
experimental measurements in cloudwater.87 The iron concentration was based on
both experimental 88 and model studies65 of cloudwater. The pH of cloud droplets
ranges from 4 to 6; 4.5 is taken as a typical value.65 Also, in general, fine-mode
aerosols are known to be acidic.70
Reactions were performed on a one-liter scale in 18 MOhm water (Milli-Q,
Model Gradient A10, TOC <5 ppb) at room temperature. All reactions were
performed in the dark. Where the chemical experiment used Fenton chemistry
(Reactions A, D, Table 3-1), the reaction was initiated by adding hydrogen peroxide.
Reactions B, C and E (Table 3-1) were initiated by the addition of levoglucosan.
Aliquots of 250.0 mL, sampled from each reaction on days 0.5, 1, 3, and 7, were
frozen and lyophilized prior to analysis by MALDI-TOF-MS or ATR-FTIR.
3.2.2. Sample Preparation for Analytical Analysis
Lyophilized samples were dissolved in deionized water and 1 µL of this solution
32
was combined with 9 µL of the matrix and cationizing agent. The water soluble
reaction products were measured with MALDI-TOF-MS using a matrix of 10 mg/mL
2,5 di-hydroxybenzoic acid (DHB, 99%, Alfa Aesar) in deionized water and 1 mg/mL
sodium chloride as the cationizing agent. Aliquots of 2 µL were spotted on a standard
stainless steel MALDI sample plate (Applied Biosystems) and the chemical
components co-crystallized by drying in a vacuum dessicator. Positive ion MALDI-
TOF-MS was performed in reflectron mode with a 337 nm laser (Applied Biosystems
Voyager-DE Pro). The MALDI-TOF mass spectra for 1000 laser shots (500 shots per
well) were averaged for each measurement. As a supporting analytical method,
Electrospray ionization mass spectrometry (ESI-MS) of reaction B (Table 3-1), day 1
was measured using a Finnigan-MATT TSQ-70. The sample was dissolved in 50/50
acetonitrile/water with 1 mg/L sodium acetate before injection into the mass
spectrometer. ATR-FTIR spectra of dry lyophilized reaction products were measured
using a Thermo-Nicolet IR200 series spectrometer using 4 cm-1 resolution and 32
scans.
3.3. Results and Discussion
3.3.1. Experimental Description and Background Control Experiments
Reactions A, B, and C, were run to investigate the bulk aqueous phase chemistry
of levoglucosan with common reactants found in cloudwater (Table 3-1). Reaction A
was designed to investigate the chemistry of levoglucosan with reactants (H+, H2O2,
33
Fe2+) that produce the hydroxyl radical through the Fenton reaction. In order to
identify specific chemical formation mechanisms, variations of these reactants from
Reaction A were tested using reactions B (H+) and C (Fe3+, H+). Reactions D and E
were run as negative controls (i.e., no significant chemical reaction was expected).
Oligomers were observed under all experimental reaction conditions except reactions
D and E. The measured MALDI-TOF spectra were assumed to be for the water-
soluble products from the simulated cloud water because co-crystallization of the
analytes with the aqueous matrix solution was required for the generation of
significant MALDI-TOF signals.
34
H2SO4Reaction Levoglucosan Fe3+
H2O2
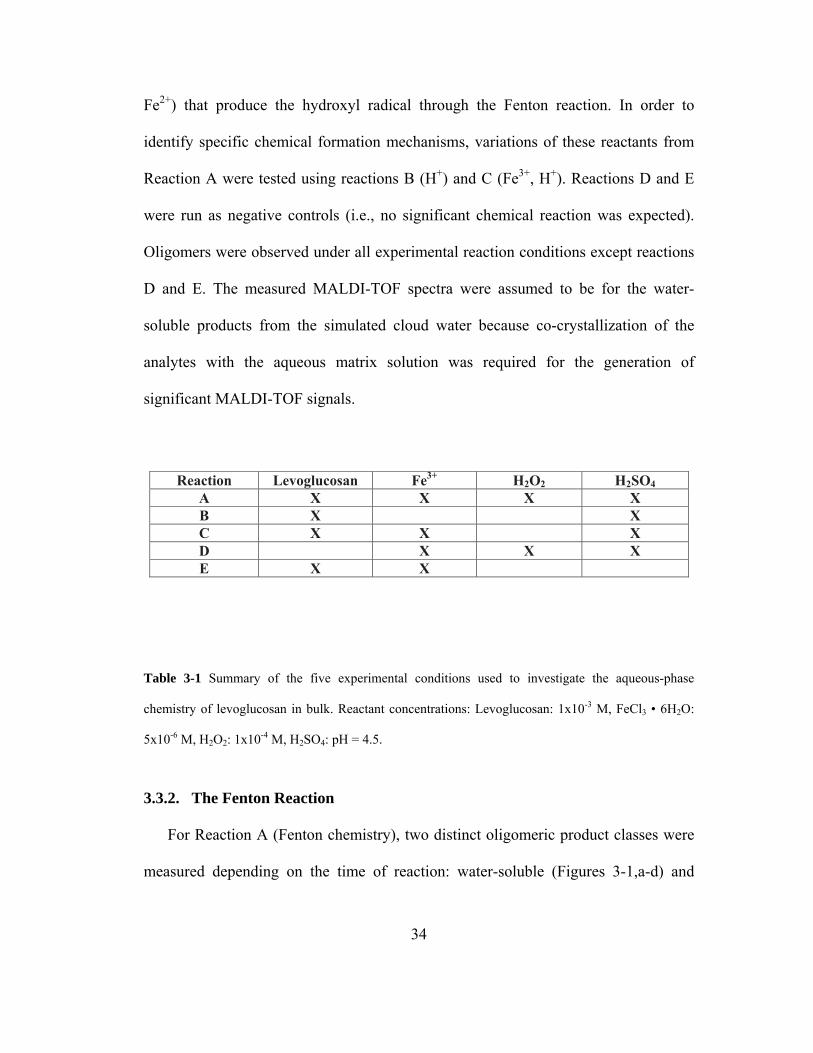
Table 3-1 Summary of the five experimental conditions used to investigate the aqueous-phase
chemistry of levoglucosan in bulk. Reactant concentrations: Levoglucosan: 1x10⁻³ M, FeCl3 • 6H2O:
5x10⁻⁶ M, H2O2: 1x10⁻⁴ M, H2SO4: pH = 4.5.
3.3.2. The Fenton Reaction
For Reaction A (Fenton chemistry), two distinct oligomeric product classes were
measured depending on the time of reaction: water-soluble (Figures 3-1,a-d) and
A X X X X
B X X
C X X X
D X X X
E X X
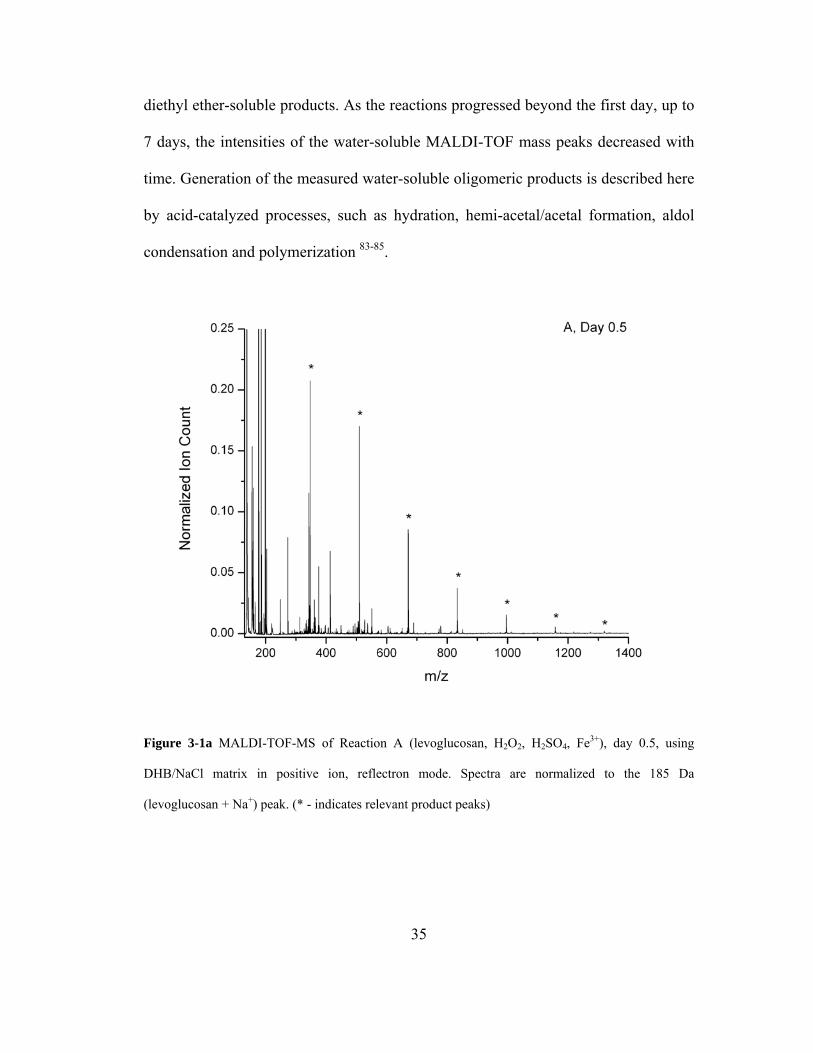
diethyl ether-soluble products. As the reactions progressed beyond the first day, up to
7 days, the intensities of the water-soluble MALDI-TOF mass peaks decreased with
time. Generation of the measured water-soluble oligomeric products is described here
by acid-catalyzed processes, such as hydration, hemi-acetal/acetal formation, aldol
condensation and polymerization 83-85.
Figure 3-1a MALDI-TOF-MS of Reaction A (levoglucosan, H2O2, H2SO4, Fe3+), day 0.5, using
DHB/NaCl matrix in positive ion, reflectron mode. Spectra are normalized to the 185 Da
(levoglucosan + Na+) peak. (* - indicates relevant product peaks)
35
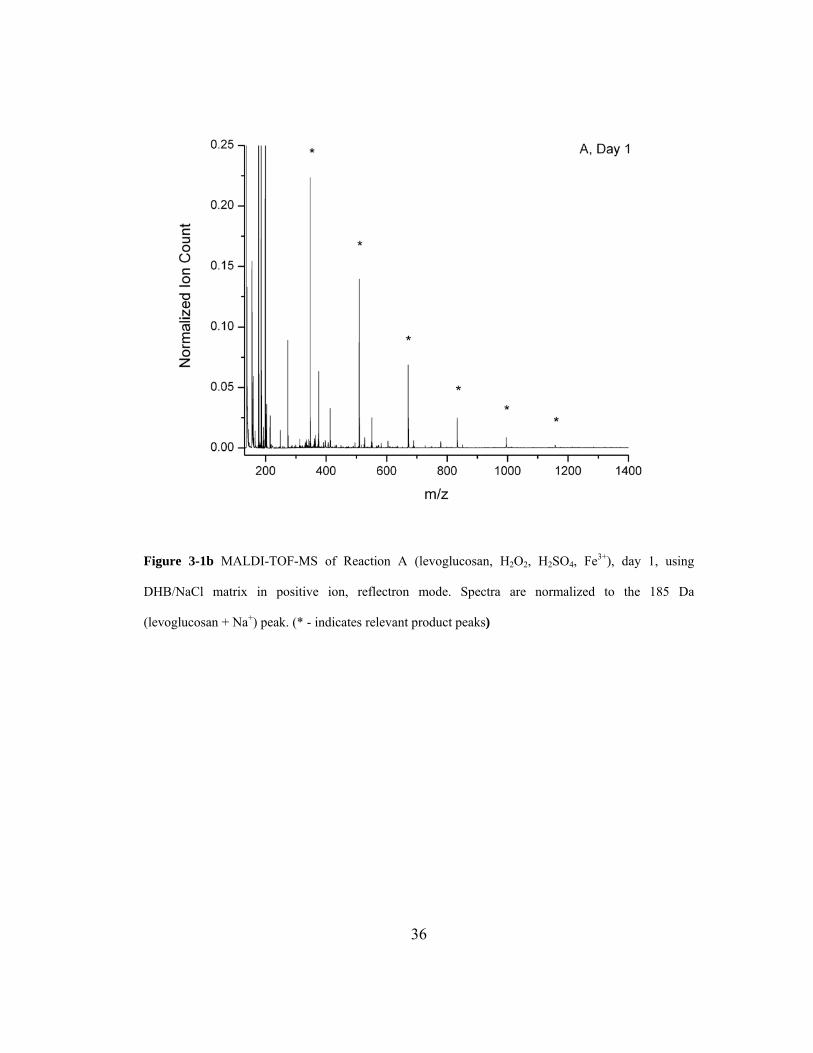
Figure 3-1b MALDI-TOF-MS of Reaction A (levoglucosan, H2O2, H2SO4, Fe3+), day 1, using
DHB/NaCl matrix in positive ion, reflectron mode. Spectra are normalized to the 185 Da
(levoglucosan + Na+) peak. (* - indicates relevant product peaks)
36
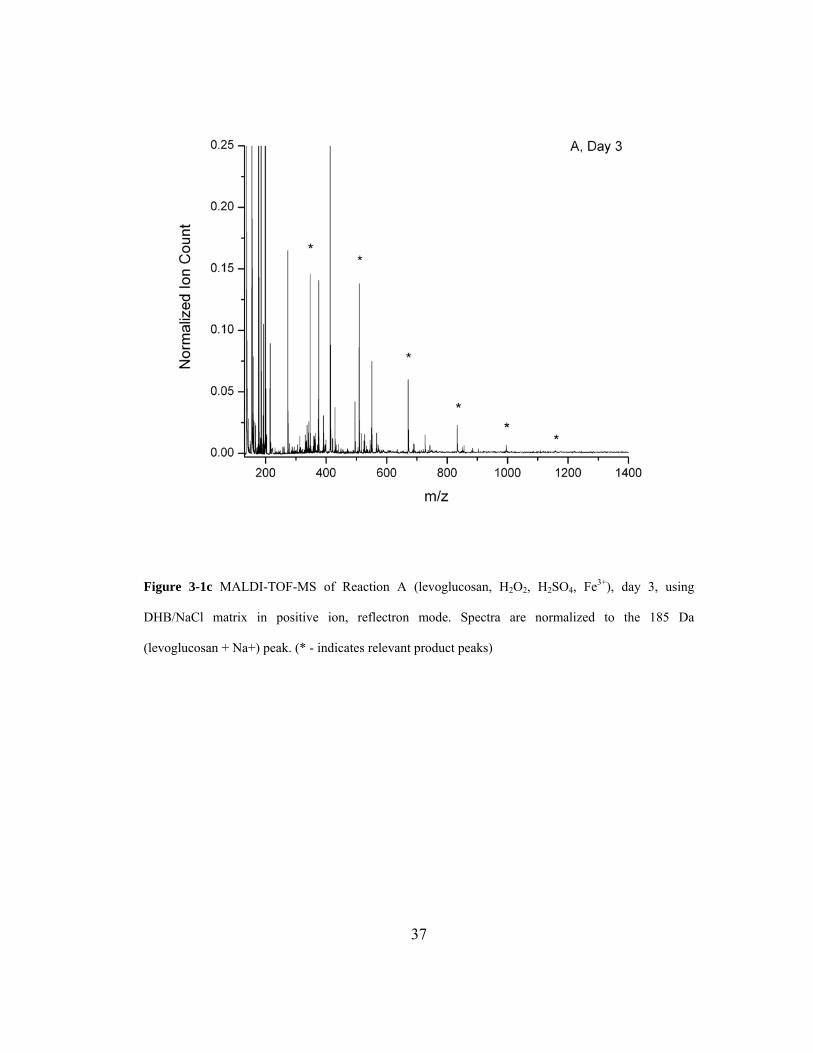
Figure 3-1c MALDI-TOF-MS of Reaction A (levoglucosan, H2O2, H2SO4, Fe3+), day 3, using
DHB/NaCl matrix in positive ion, reflectron mode. Spectra are normalized to the 185 Da
(levoglucosan + Na+) peak. (* - indicates relevant product peaks)
37
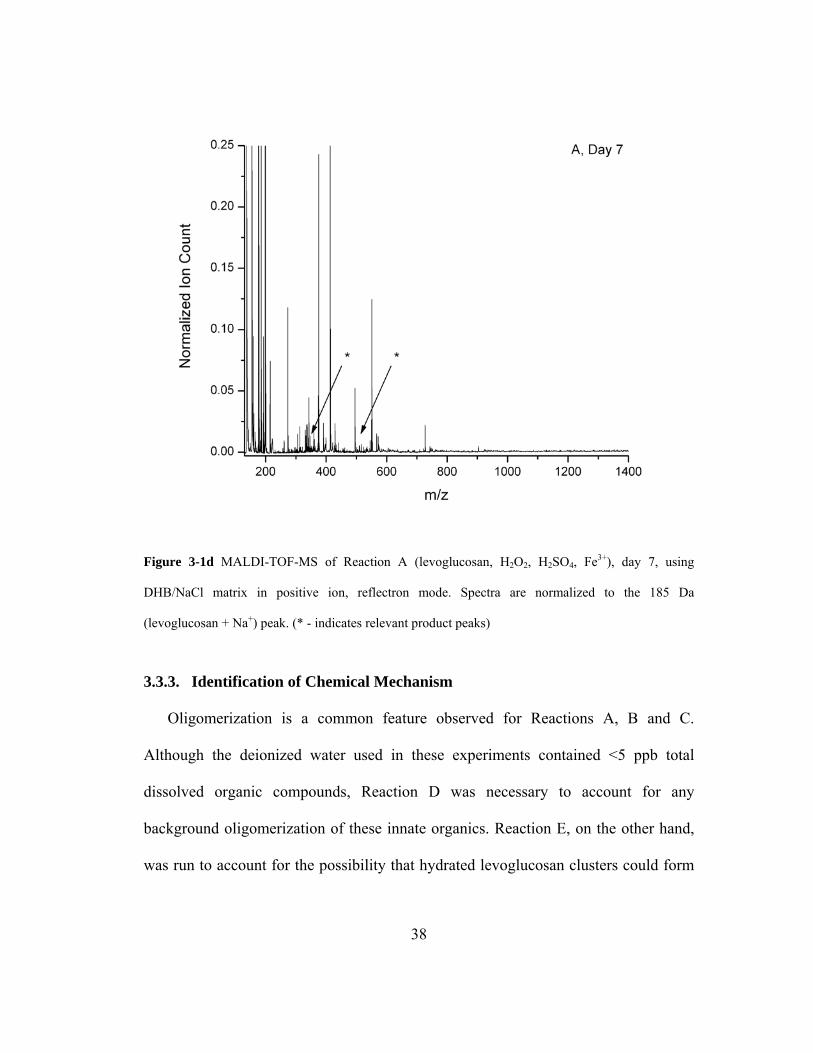
Figure 3-1d MALDI-TOF-MS of Reaction A (levoglucosan, H2O2, H2SO4, Fe3+), day 7, using
DHB/NaCl matrix in positive ion, reflectron mode. Spectra are normalized to the 185 Da
(levoglucosan + Na+) peak. (* - indicates relevant product peaks)
3.3.3. Identification of Chemical Mechanism
Oligomerization is a common feature observed for Reactions A, B and C.
Although the deionized water used in these experiments contained <5 ppb total
dissolved organic compounds, Reaction D was necessary to account for any
background oligomerization of these innate organics. Reaction E, on the other hand,
was run to account for the possibility that hydrated levoglucosan clusters could form
38
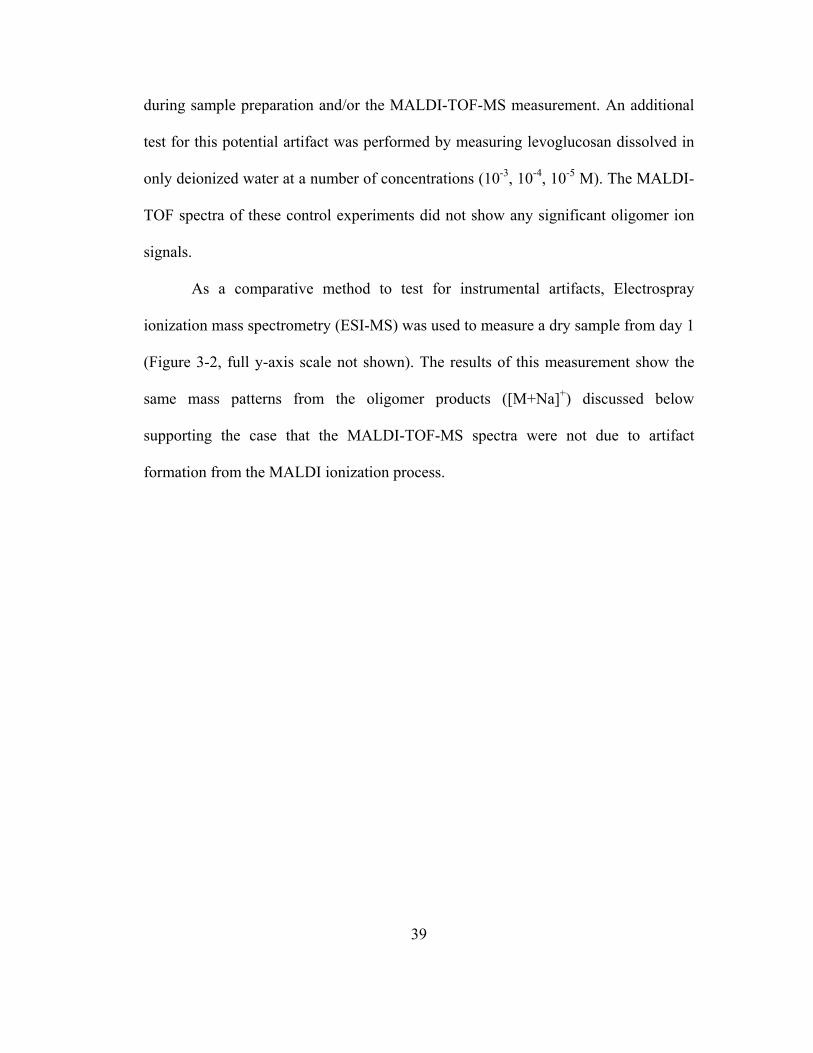
during sample preparation and/or the MALDI-TOF-MS measurement. An additional
test for this potential artifact was performed by measuring levoglucosan dissolved in
only deionized water at a number of concentrations (10-3, 10-4, 10-5 M). The MALDI-
TOF spectra of these control experiments did not show any significant oligomer ion
signals.
As a comparative method to test for instrumental artifacts, Electrospray
ionization mass spectrometry (ESI-MS) was used to measure a dry sample from day 1
(Figure 3-2, full y-axis scale not shown). The results of this measurement show the
same mass patterns from the oligomer products ([M+Na]+) discussed below
supporting the case that the MALDI-TOF-MS spectra were not due to artifact
formation from the MALDI ionization process.
39
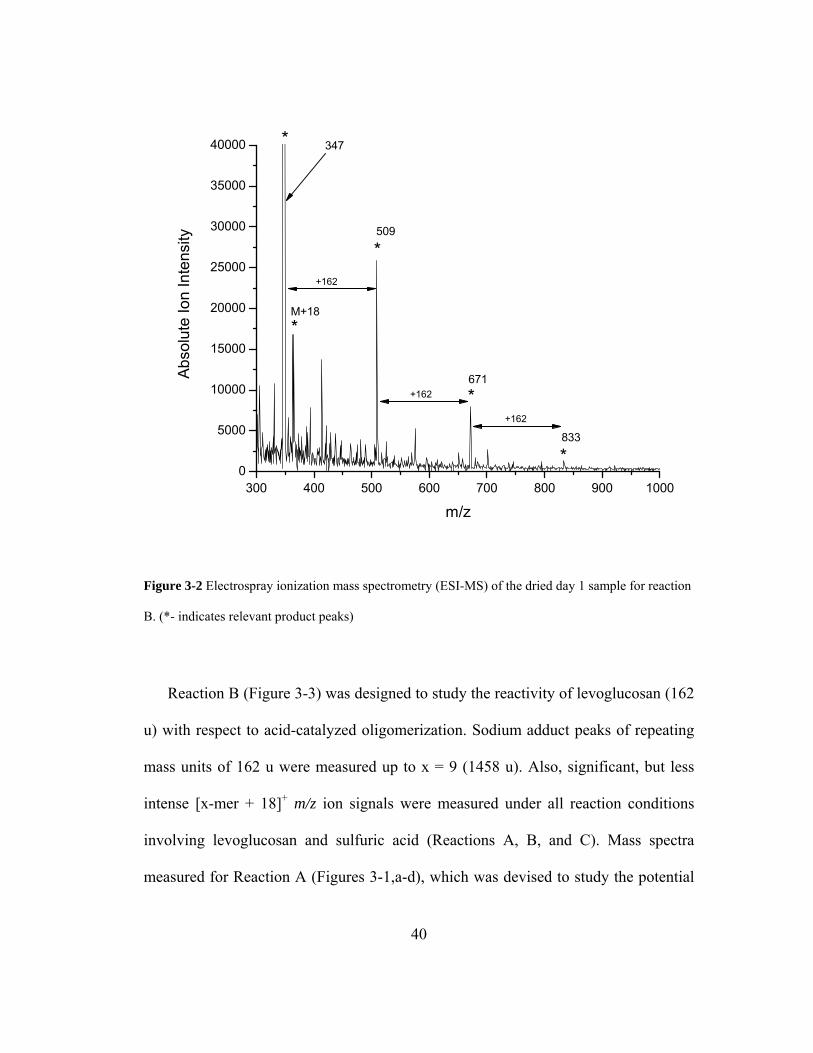
Figure 3-2 Electrospray ionization mass spectrometry (ESI-MS) of the dried day 1 sample for reaction
B. (*- indicates relevant product peaks)
Reaction B (Figure 3-3) was designed to study the reactivity of levoglucosan (162
u) with respect to acid-catalyzed oligomerization. Sodium adduct peaks of repeating
mass units of 162 u were measured up to x = 9 (1458 u). Also, significant, but less
intense [x-mer + 18]+ m/z ion signals were measured under all reaction conditions
involving levoglucosan and sulfuric acid (Reactions A, B, and C). Mass spectra
measured for Reaction A (Figures 3-1,a-d), which was devised to study the potential
40
for •OH-radical initiated oligomerization by the Fenton reaction, were essentially
identical to those measured for reactions B and C. This leads us to believe that the
hydroxyl radical mechanism is not an important route to the observed oligomerization
products under these experimental conditions. Due to the high oxidative strength and
relatively unselective attack of the hydroxyl radical, one would predict a continuum
of product masses from the reaction between this oxidant and levoglucosan.
However, the relative simplicity of the MALDI-TOF mass spectra for Reaction A
lends further support to our hypothesis that Fenton-type chemistry is not a significant
source of the measured water-soluble oligomers. Based on these observations, the
observed products are attributed to an acid-catalyzed mechanism.
41
Figure 3-3 MALDI-TOF-MS of Reaction B (levoglucosan, H2SO4), day 1 using DHB/NaCl matrix in
positive ion, reflectron mode. Spectrum is normalized to the 185 Da (levoglucosan + Na+) peak. (* -
indicates relevant product peaks).
3.3.4. Potential Role of Iron in Reaction Systems
Reaction C was setup to better understand the potential role, if any, of iron in an
acidic reaction system. For reactions B and C, ion signals were observed for all
oligomer products (up to x = 9) throughout the duration of the reaction (i.e., 7 days).
42
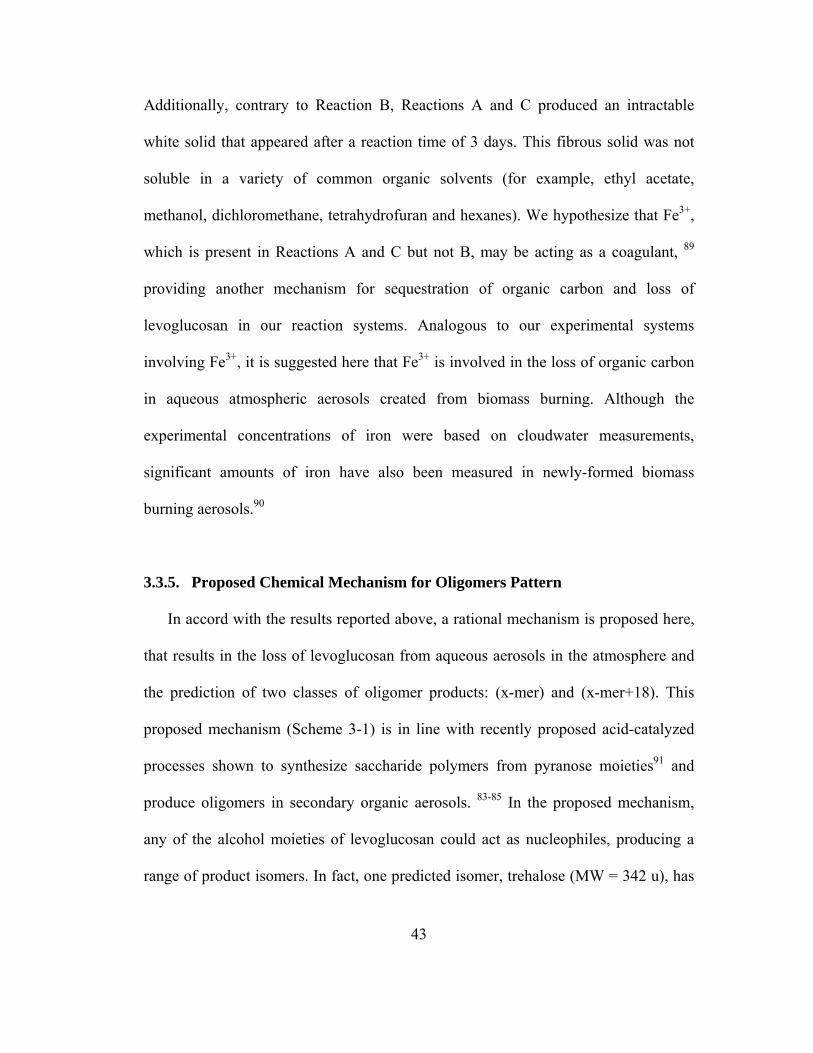
Additionally, contrary to Reaction B, Reactions A and C produced an intractable
white solid that appeared after a reaction time of 3 days. This fibrous solid was not
soluble in a variety of common organic solvents (for example, ethyl acetate,
methanol, dichloromethane, tetrahydrofuran and hexanes). We hypothesize that Fe3+,
which is present in Reactions A and C but not B, may be acting as a coagulant, 89
providing another mechanism for sequestration of organic carbon and loss of
levoglucosan in our reaction systems. Analogous to our experimental systems
involving Fe3+, it is suggested here that Fe3+ is involved in the loss of organic carbon
in aqueous atmospheric aerosols created from biomass burning. Although the
experimental concentrations of iron were based on cloudwater measurements,
significant amounts of iron have also been measured in newly-formed biomass
burning aerosols.90
3.3.5. Proposed Chemical Mechanism for Oligomers Pattern
In accord with the results reported above, a rational mechanism is proposed here,
that results in the loss of levoglucosan from aqueous aerosols in the atmosphere and
the prediction of two classes of oligomer products: (x-mer) and (x-mer+18). This
proposed mechanism (Scheme 3-1) is in line with recently proposed acid-catalyzed
processes shown to synthesize saccharide polymers from pyranose moieties91 and
produce oligomers in secondary organic aerosols. 83-85 In the proposed mechanism,
any of the alcohol moieties of levoglucosan could act as nucleophiles, producing a
range of product isomers. In fact, one predicted isomer, trehalose (MW = 342 u), has
43
been measured in biomass burning aerosol and was attributed to the biogenic source
of the sugar; 30, 92 however, it is possible that trehalose is also produced by compound
III after further processing by reactions 1 and 2 (Figure 3-4). An ion signal was
measured at 365 m/z for Reactions A, B and C, corresponding to the sodiated adduct
ion of a product with the molecular weight of trehalose. In addition to nucleophilic
attack by levoglucosan, water, which is in large excess, may also act as the
nucleophile, hydrating levoglucosan to glucose. 90,93-95 Addition of glucose, or
conversion of levoglucosan by reactions 1 and 2 (Scheme 3-4) on the oligomer chain
results in chemical products with weights 18 u greater than the x-mers (i.e., [x-mer +
18]+).
44
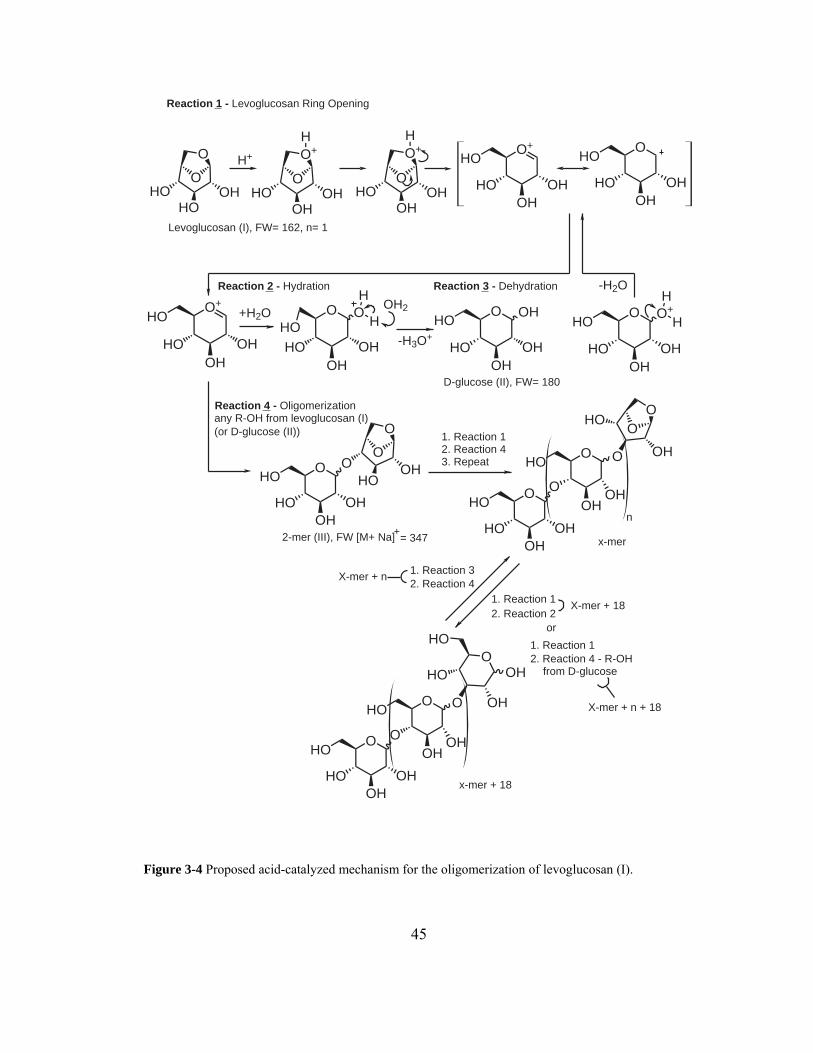
O
O+
OHOH
HO
H
O
O
OHHO
HOO
O+
OHOH
HO
H
HOO+
OHHOOH
HOO
OHHOOH
Levoglucosan (I), FW= 162, n= 1
HOO+
OHHOOH
H
HO
HOO
OHHOOH
OHHO
O
OHHOOH
D-glucose (II), FW= 180
x-mer + 18
x-mer
n
H
HO+
HOO
OHHOOH
X-mer + n
X-mer + 18
any R-OH from levoglucosan (I)(or D-glucose (II)) 1. Reaction 1
2. Reaction 43. Repeat
1. Reaction 32. Reaction 4
1. Reaction 12. Reaction 2
O
O
OHHOHO
O
OHHOOH
O
HOO
OHHOOH
HOO
OHO
OH
HOO
O
OHO
HO
HOO
OHHOOH
HOO
OHOOH
OH
HOO
OHO
or
1. Reaction 12. Reaction 4 - R-OH
from D-glucose
X-mer + n + 18
2-mer (III), FW [M+ Na]+= 347
H+
Reaction 1 - Levoglucosan Ring Opening
Reaction 2 - Hydration Reaction 3 - Dehydration
Reaction 4 - Oligomerization
OH2
-H3O+
-H2O
+H2O
Figure 3-4 Proposed acid-catalyzed mechanism for the oligomerization of levoglucosan (I).
45
3.3.6. Oligomer Polydispersity and Reaction Kinetic Analysis
In both Reactions A and B, oligomerization was observed at the first
measurement time point (0.5 days) for repeating mass units up to x = 9. The
polydispersity (D) of these reaction products was calculated96 to be between 1 and 2,
indicating that they possess relatively narrow oligomer distributions. In all other
aspects, the two chemical systems behaved differently. In Reaction A, simulating
cloud water, the intensities of the [x-mer]+ series peaks generally decreased with
reaction time, to the point that very weak ion signals remained only for the x = 2 and
3 oligomers by day 7 (Figure 3-5).
46
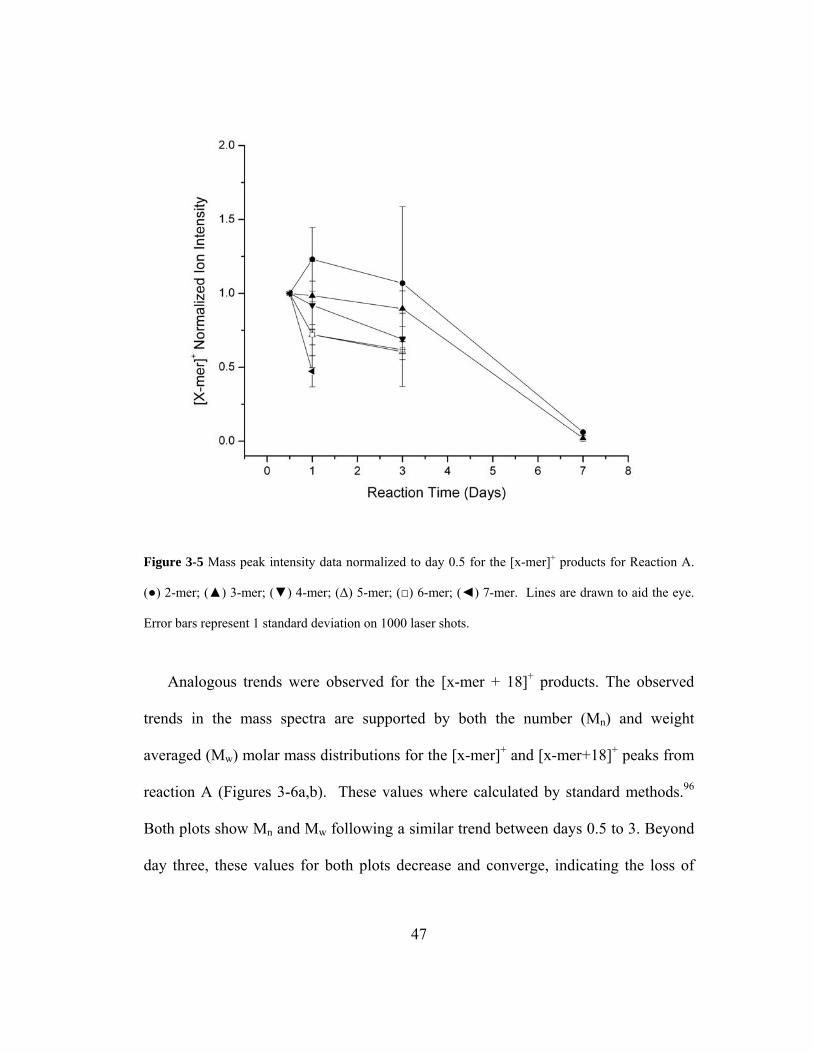
Figure 3-5 Mass peak intensity data normalized to day 0.5 for the [x-mer]+ products for Reaction A.
(●) 2-mer; (▲) 3-mer; (▼) 4-mer; (Δ) 5-mer; (□) 6-mer; (◄) 7-mer. Lines are drawn to aid the eye.
Error bars represent 1 standard deviation on 1000 laser shots.
Analogous trends were observed for the [x-mer + 18]+ products. The observed
trends in the mass spectra are supported by both the number (Mn) and weight
averaged (Mw) molar mass distributions for the [x-mer]+ and [x-mer+18]+ peaks from
reaction A (Figures 3-6a,b). These values where calculated by standard methods.96
Both plots show Mn and Mw following a similar trend between days 0.5 to 3. Beyond
day three, these values for both plots decrease and converge, indicating the loss of
47
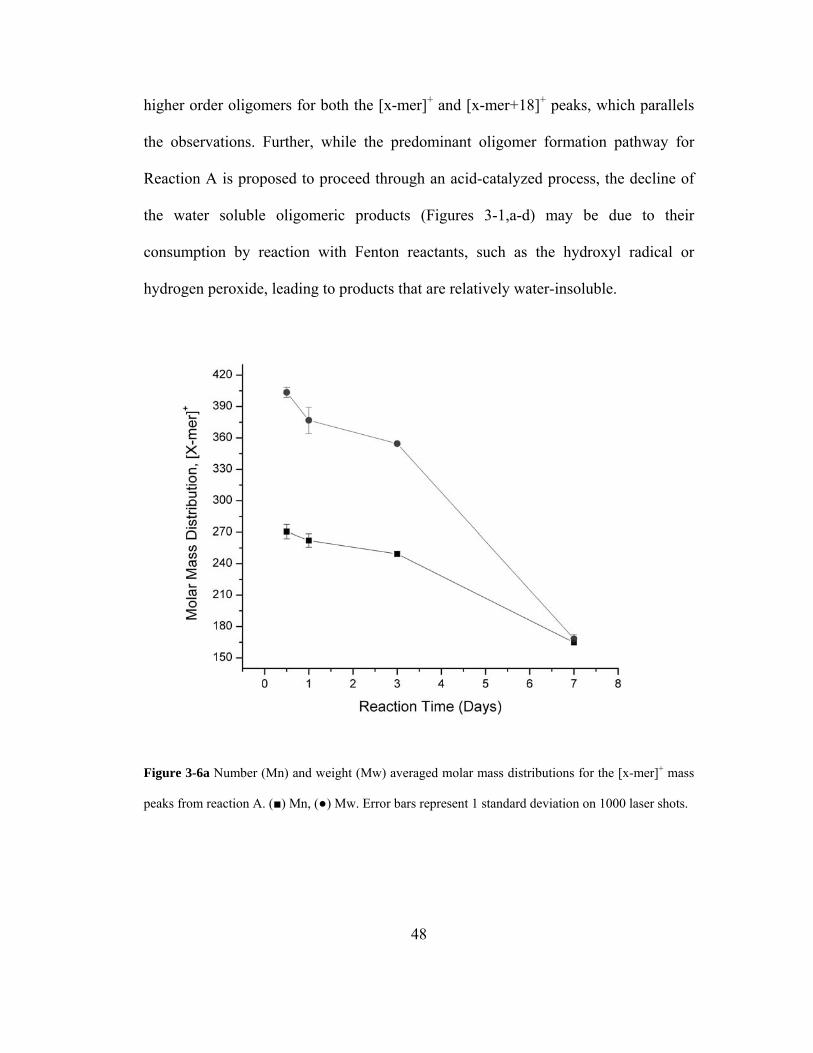
higher order oligomers for both the [x-mer]+ and [x-mer+18]+ peaks, which parallels
the observations. Further, while the predominant oligomer formation pathway for
Reaction A is proposed to proceed through an acid-catalyzed process, the decline of
the water soluble oligomeric products (Figures 3-1,a-d) may be due to their
consumption by reaction with Fenton reactants, such as the hydroxyl radical or
hydrogen peroxide, leading to products that are relatively water-insoluble.
Figure 3-6a Number (Mn) and weight (Mw) averaged molar mass distributions for the [x-mer]+ mass
peaks from reaction A. (■) Mn, (●) Mw. Error bars represent 1 standard deviation on 1000 laser shots.
48
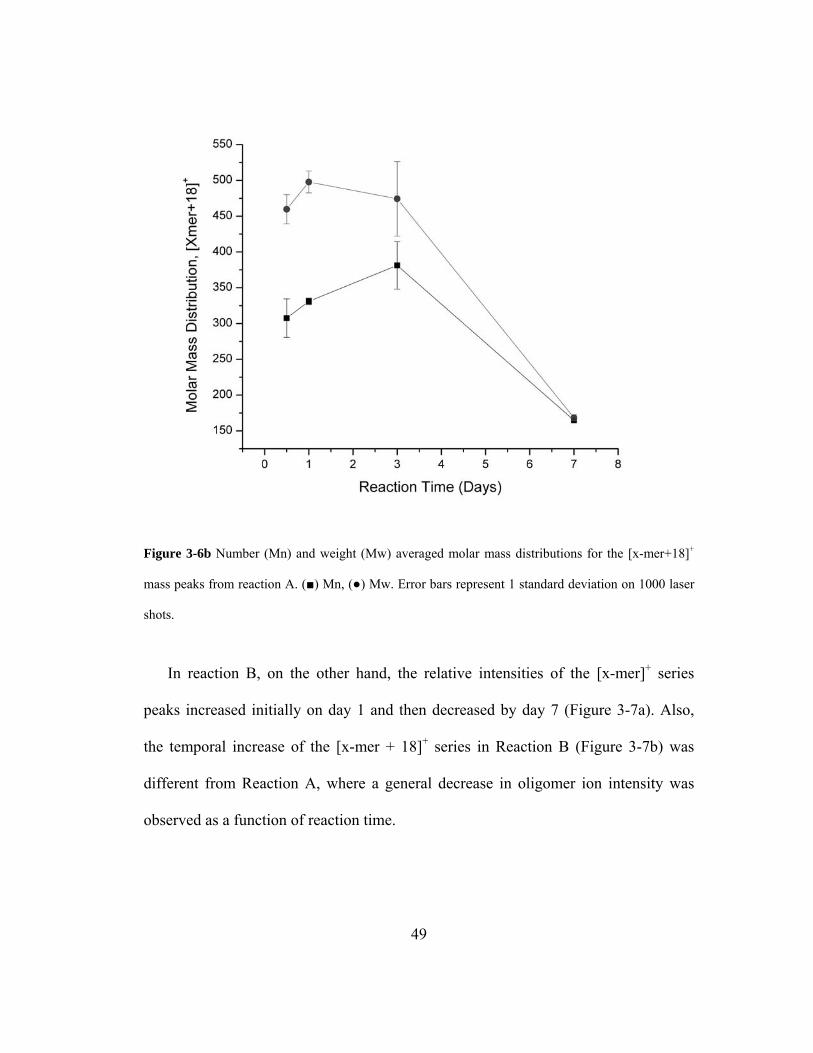
Figure 3-6b Number (Mn) and weight (Mw) averaged molar mass distributions for the [x-mer+18]+
mass peaks from reaction A. (■) Mn, (●) Mw. Error bars represent 1 standard deviation on 1000 laser
shots.
In reaction B, on the other hand, the relative intensities of the [x-mer]+ series
peaks increased initially on day 1 and then decreased by day 7 (Figure 3-7a). Also,
the temporal increase of the [x-mer + 18]+ series in Reaction B (Figure 3-7b) was
different from Reaction A, where a general decrease in oligomer ion intensity was
observed as a function of reaction time.
49
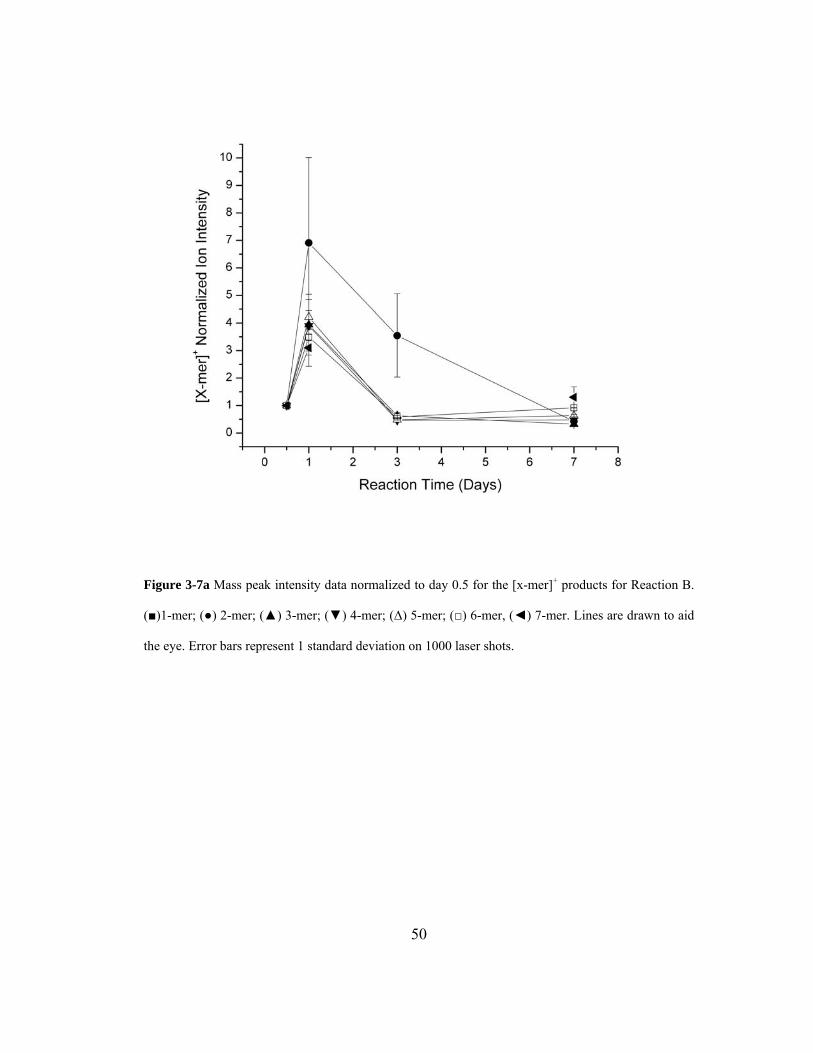
Figure 3-7a Mass peak intensity data normalized to day 0.5 for the [x-mer]+ products for Reaction B.
(■)1-mer; (●) 2-mer; (▲) 3-mer; (▼) 4-mer; (Δ) 5-mer; (□) 6-mer, (◄) 7-mer. Lines are drawn to aid
the eye. Error bars represent 1 standard deviation on 1000 laser shots.
50
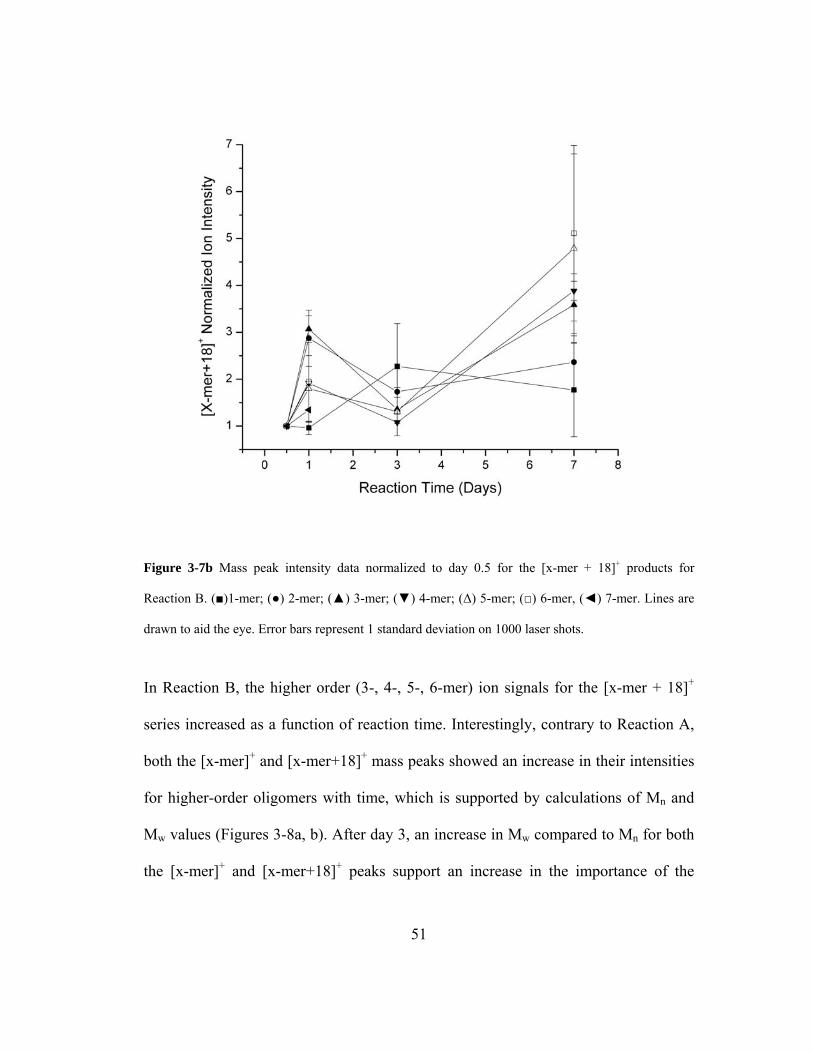
Figure 3-7b Mass peak intensity data normalized to day 0.5 for the [x-mer + 18]+ products for
Reaction B. (■)1-mer; (●) 2-mer; (▲) 3-mer; (▼) 4-mer; (Δ) 5-mer; (□) 6-mer, (◄) 7-mer. Lines are
drawn to aid the eye. Error bars represent 1 standard deviation on 1000 laser shots.
In Reaction B, the higher order (3-, 4-, 5-, 6-mer) ion signals for the [x-mer + 18]+
series increased as a function of reaction time. Interestingly, contrary to Reaction A,
both the [x-mer]+ and [x-mer+18]+ mass peaks showed an increase in their intensities
for higher-order oligomers with time, which is supported by calculations of Mn and
Mw values (Figures 3-8a, b). After day 3, an increase in Mw compared to Mn for both
the [x-mer]+ and [x-mer+18]+ peaks support an increase in the importance of the
51
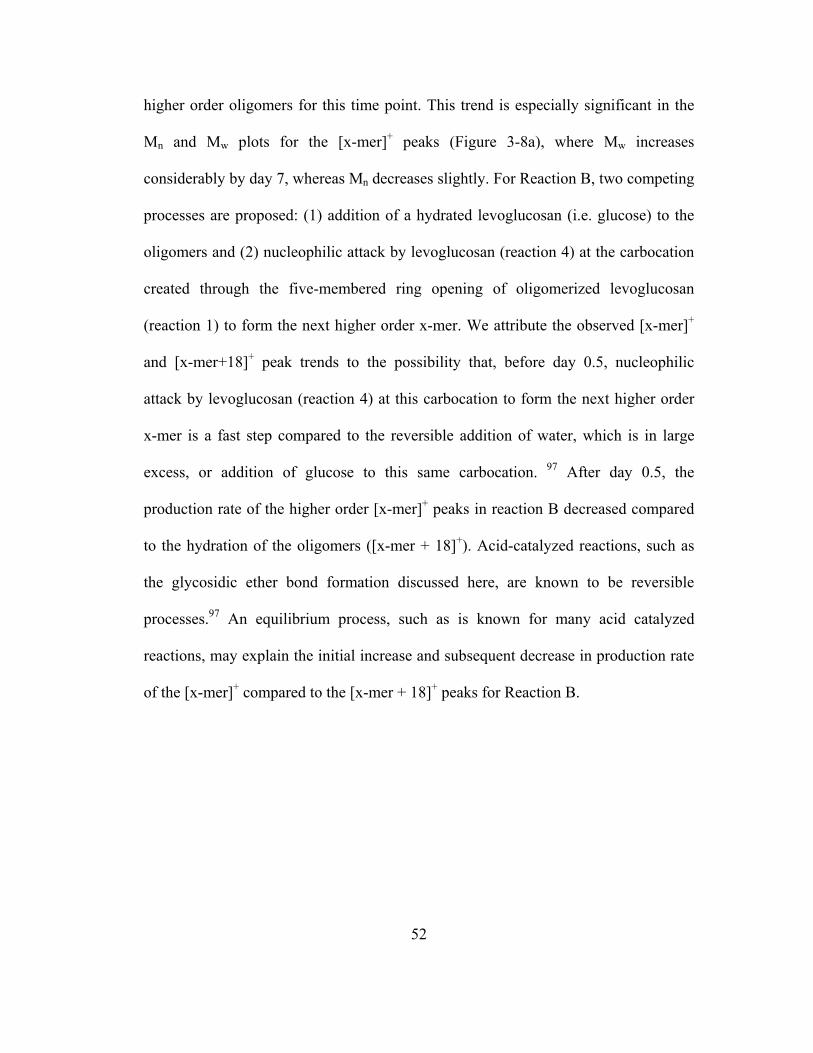
higher order oligomers for this time point. This trend is especially significant in the
Mn and Mw plots for the [x-mer]+ peaks (Figure 3-8a), where Mw increases
considerably by day 7, whereas Mn decreases slightly. For Reaction B, two competing
processes are proposed: (1) addition of a hydrated levoglucosan (i.e. glucose) to the
oligomers and (2) nucleophilic attack by levoglucosan (reaction 4) at the carbocation
created through the five-membered ring opening of oligomerized levoglucosan
(reaction 1) to form the next higher order x-mer. We attribute the observed [x-mer]+
and [x-mer+18]+ peak trends to the possibility that, before day 0.5, nucleophilic
attack by levoglucosan (reaction 4) at this carbocation to form the next higher order
x-mer is a fast step compared to the reversible addition of water, which is in large
excess, or addition of glucose to this same carbocation. 97 After day 0.5, the
production rate of the higher order [x-mer]+ peaks in reaction B decreased compared
to the hydration of the oligomers ([x-mer + 18]+). Acid-catalyzed reactions, such as
the glycosidic ether bond formation discussed here, are known to be reversible
processes.97 An equilibrium process, such as is known for many acid catalyzed
reactions, may explain the initial increase and subsequent decrease in production rate
of the [x-mer]+ compared to the [x-mer + 18]+ peaks for Reaction B.
52
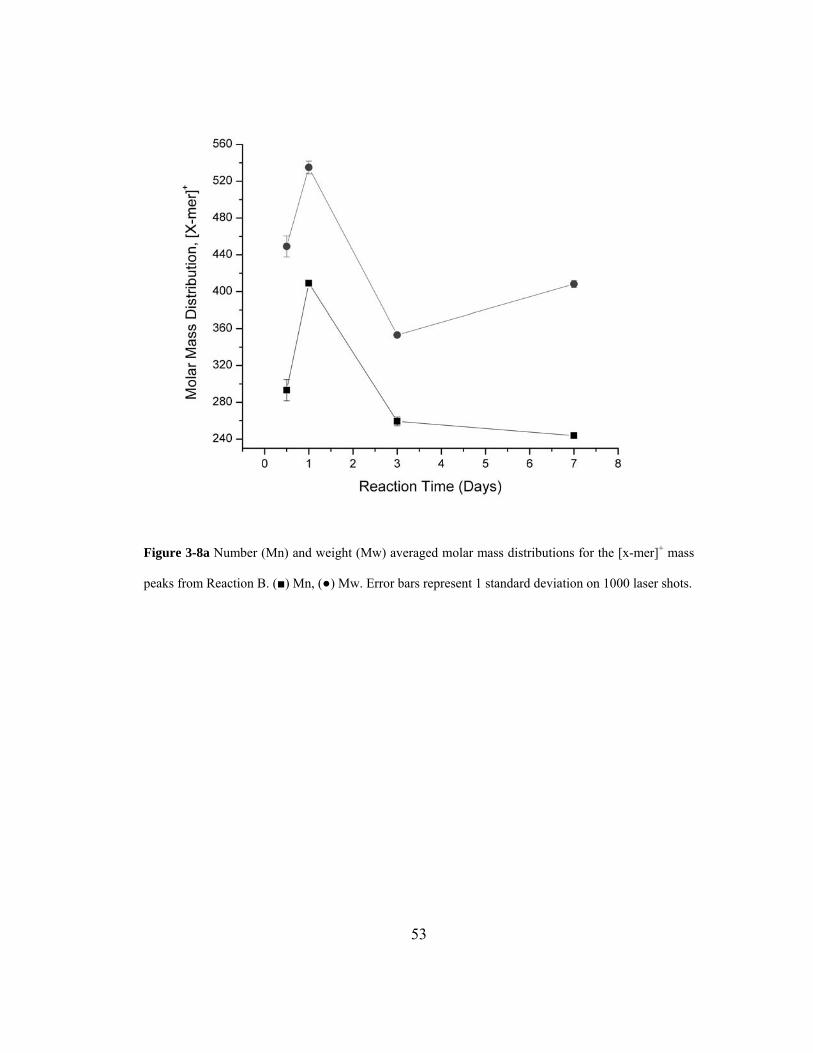
Figure 3-8a Number (Mn) and weight (Mw) averaged molar mass distributions for the [x-mer]+ mass
peaks from Reaction B. (■) Mn, (●) Mw. Error bars represent 1 standard deviation on 1000 laser shots.
53
Figure 3-8b Number (Mn) and weight (Mw) averaged molar mass distributions for the [x-mer+18]+
mass peaks from Reaction B. (■) Mn, (●) Mw. Error bars represent 1 standard deviation on 1000 laser
shots.
3.3.7. ATR-FTIR Supporting Data for Saccharidic Oligomer Formation
The acid-catalyzed oligomerization of levoglucosan is further supported by the
ATR-FTIR spectra of the lyophilized products from Reactions A and B (Figure 3-9),
which showed broad peaks at ~1710-1570 cm-1, possibly due to a bridging C-O-C
functionality between saccharide units. An analogous spectral feature was observed
for the reference compounds cellulose and α-cyclodextrin, which also contain the
sugar-bridging C-O-C functionality, but not for unreacted levoglucosan and α-D-
54
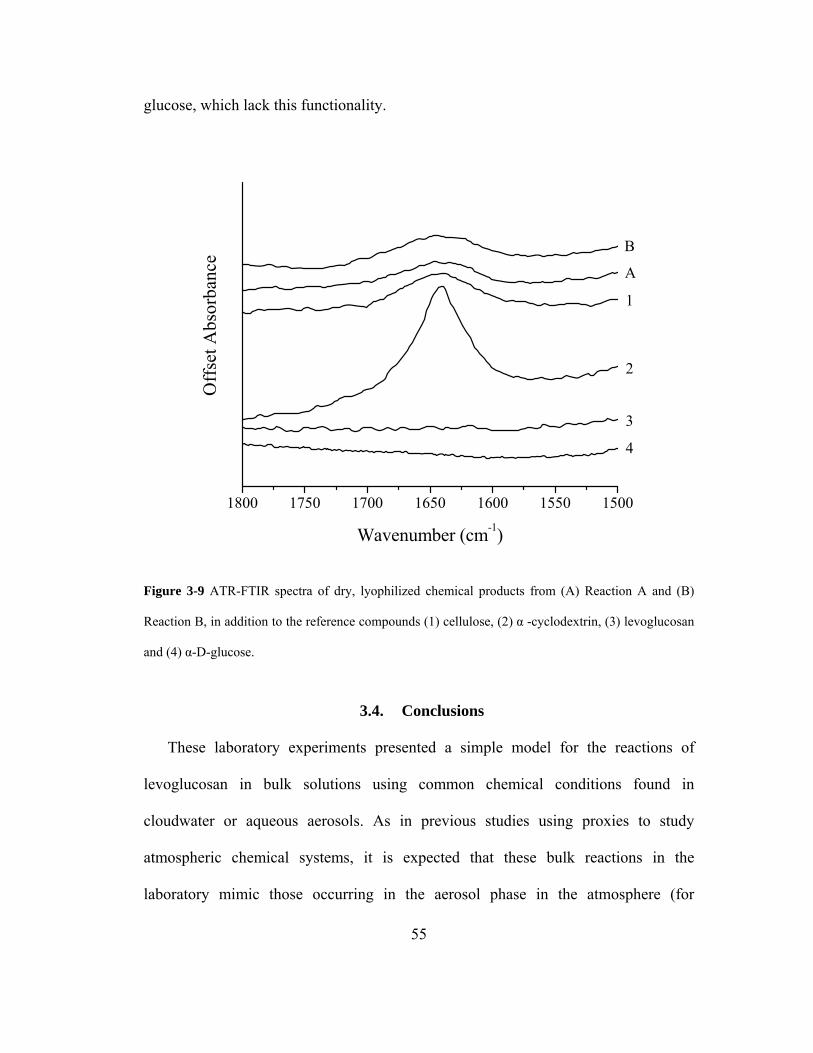
glucose, which lack this functionality.
Figure 3-9 ATR-FTIR spectra of dry, lyophilized chemical products from (A) Reaction A and (B)
Reaction B, in addition to the reference compounds (1) cellulose, (2) α -cyclodextrin, (3) levoglucosan
and (4) α-D-glucose.
3.4. Conclusions
These laboratory experiments presented a simple model for the reactions of
levoglucosan in bulk solutions using common chemical conditions found in
cloudwater or aqueous aerosols. As in previous studies using proxies to study
atmospheric chemical systems, it is expected that these bulk reactions in the
laboratory mimic those occurring in the aerosol phase in the atmosphere (for
55
example, ref. 10). Clearly, in reality this relatively simple picture would be
complicated by the complex mixture of organic and inorganic compounds found in
atmospheric aerosols. By the mechanism (Figure 3-4) proposed here, the increase in
the oligomer chain length by addition of levoglucosan depends on the condition that
significant concentrations of this species are present compared to other potentially
reactive species. Biomass burning aerosols, which are known to be hygroscopic, may
satisfy this condition due to the high mass concentrations of levoglucosan often
measured in these types of aerosols 35, 92.
Water soluble oligomer concentrations in Reaction A were shown to decrease as a
function of time (from 0.5 to 7 days), possibly as a result of reaction with the
hydroxyl radical being produced through the Fenton reaction. Therefore, chemical
processes such as acid-catalyzed polymerization and hydroxyl radical reactions could
explain, in part, the absence of levoglucosan in analyzed aerosols known to originate
from biomass burning. Based on the proposed mechanism, it follows that the products
discussed here are highly polar, which would increase their ability to take on water.
Support for their water-solubility has been through the experimental observation
during the MALDI sample preparation. These reactions could have significant effects
on the lifetime of these oligomer products, the water solubility of the aged aerosols,
and the aerosols capacity as CCN.
Finally, the chemical products identified in this work may be useful as secondary
tracers for measurements of the long-distance transport of biomass burning aerosols.
A useful chemical tracer must have significant concentrations and be chemically
56
stable for the measurement time-period. It is proposed here that the high
concentration of levoglucosan found in biomass burning aerosols may contribute to
the potential of significant amounts of these oligomeric products existing as a stable
component of biomass burning aerosols. The presence of these products in real
atmospheric aerosols may allow their use as secondary tracers for biomass burning
aerosol parcels. Such secondary chemical tracers are potentially important to advance
our understanding of aerosol source, transport and processing in the atmosphere,
which ultimately will add to the growing knowledge of how these types of aerosols
affect global climate.
57
4. Oligomerization of Levoglucosan by Fenton Chemistry in Proxies of
Biomass Burning Aerosols 98
4.1. Introduction
For this study, the chemistry of levoglucosan oxidized by in-situ derived •OH,
produced from an aqueous Fenton chemical system (Fe2+, H2O2, H+), was
investigated in bulk solution serving as a proxy for aqueous biomass burning
aerosols. The primary focus of this investigation was to evaluate the importance of
•OH-radical processing of anhydrosaccharides in the formation of HULIS in aqueous
systems, as well as to identify specific chemical products that may provide
information for both tracer59 and cloud-condensation nucleation studies.99 In this
investigation, increasing the hydrogen peroxide concentration in the Fenton system
relative to our previous acid-catalyzed oligomerization study81 enhanced •OH
production. Chemical products were identified by matrix-assisted (MA) and matrix-
free laser desorption-ionization (LDI) time-of-flight mass spectrometry (TOF-MS).
Attenuated total reflectance (ATR) Fourier transform infrared (FTIR) spectroscopy
was used to support our mass spectrometric results.
58
4.2. Experimental Design
4.2.1. Biomass Burning Aerosol Proxy Reactions
Reactions were run in aqueous solution containing levoglucosan (10-3 M) (99%,
Alfa Aesar), hydrogen peroxide (10-3 M) (30% in water, Acros), anhydrous ferric
chloride hexahydrate (5x10⁻⁶ M) (99%, Fisher), and sulfuric acid (96.1%,
Mallinckrodt) (to bring the solution pH to 4.5). All reagents were used as supplied by
the manufacturer. The concentration of hydrogen peroxide for this experiment was
based on measurements from hydrated aerosols (e.g., cloudwater, fogwater).87, 100-103
Iron concentrations were used which correspond to model65 and experimental88
cloudwater studies although relevant amounts of iron are also found in aerosols.104
Since biomass burning aerosols are known have a strong aqueous and sulfate
component105, the pH of a water solution was adjusted to 4.5 using sulfuric acid. This
pH value was based on field measurements of hydrated aerosol.65, 106 In general, fine-
mode aerosols are known to be acidic.70
4.2.2. Sample Preparation and Analysis
Reactions, initiated by the addition of hydrogen peroxide, were performed on a
one-liter scale in 18-MOhm water (Milli-Q, Model Gradient A10, TOC <5 ppb) at
room temperature, unstirred and in the dark. Aliquots of 250.0 mL were sampled
from each reaction on days 1, 3, and 7. These aliquots were frozen and lyophilized in
preparation for mass spectral and ATR-FTIR analysis.
59
The reaction products, which are likely to have a high water-soluble character due
to the sample preparation process, were measured with MALDI-TOF-MS and LDI-
TOF-MS. The MALDI-TOF-MS sample preparation used a matrix of 10 mg/mL 2,5
dihydroxybenzoic acid (DHB, 99%, Alfa Aesar) in water and either 1 mg/mL sodium
chloride or 2 mg/mL lithium chloride as the cationizing agent. About 1 μg of the
dried products of the lyophilized samples were redissolved in 2 μL of deionized water
and 2 μL of this solution was combined with 8 μL of the matrix and cationizing
agent. Matrix/analyte dilutions of 1x, 10x, and 100x, were used. The 10x dilution
gave the highest quality mass spectrometric data. A 10x dilution corresponds to a
mass concentration of about 0.05 g/L and a total mass of 1x10⁻⁶ grams spotted on the
MALDI sample plate. Aliquots of 1 μL were spotted on a standard stainless steel
MALDI sample plate (Applied Biosystems) and the chemical components co-
crystallized by drying in a vacuum desiccator. Positive ion MALDI-TOF-MS was
performed in reflectron mode with a 337 nm laser source (Applied Biosystems
Voyager-DE Pro). The ion signal was optimized by rastering the laser around the
sample spot while monitoring the ion signal.
LDI-TOF-MS was performed with the same instrument, using a carbon powder
substrate. For these measurements, carbon powder was produced from solid graphite
(Ultra Carbon Corporation, ultra “F” purity) using a mortar and pestle. The carbon
powder was suspended in water and ~5 μL of this suspension was spotted onto a
stainless steel MALDI plate and dried in a vacuum desiccator to produce an even coat
of dry carbon powder. Dried analyte samples were redissolved in 2 μL of a solution
60
of 1mg/mL sodium chloride in water and spotted on top of the dried carbon and
redried in a vacuum desiccator. In all cases, the reported mass spectra represent the
average of 1000 laser shots. ATR-FTIR spectra of dry lyophylized reaction products
were measured using a Thermo-Nicolet IR200 Series spectrometer using 4 cm-1
resolution and 32 scans.
4.3. Results and Discussion
4.3.1. •OH Production by the Fenton Reaction
This work builds on our previous investigation of the water soluble products
formed from the acid-catalyzed oligomerization of levoglucosan in this same Fenton
system.81 Re-analysis of the MALDI-TOF mass spectra using Na+ cationization
presented in this preceding study revealed mass peaks that implied •OH saccharide
chemistry, where the OH• were generated in-situ from the Fenton reaction. For this
study, MALDI-TOF-MS using both sodium and lithium, individually, for
cationization of the analyte were used as the primary analysis method. Supporting
information was provided by LDI-TOF-MS using sodium cationization and ATR-
FTIR.
It has been shown that under polluted air conditions about 80% of the OH• flux
for aqueous aerosols comes from the gas phase.65 Also, it is known that Fenton-type
reactions within aqueous aerosols produce a significant amount of •OH.65, 107 In the
absence of the dominant gas-phase sources of •OH, the experimental conditions used
61
in our previous study, we believe, represent a low-end limit for the •OH flux within
the aerosol proxy system. Therefore, the formal concentration of hydrogen peroxide
in this study was increased an order of magnitude to 1x10⁻³ M in order to enhance in-
situ production of the •OH within the levoglucosan reaction system. Although the
Fenton system was used as a source of •OH in these studies, there are many other
sources of •OH, both from the gas- and aerosol-phases that are reactive within a
biomass burning aerosol. The experimental conditions used here are designed to
produce a flux of •OH within a reasonable environmentally relevant range to allow
observation of fundamental chemical processes using the available analytical
instrumentation.
4.3.2. •OH Reactions of Levoglucosan
MALDI-TOF mass spectra of the reaction products of levoglucosan (Cmpd I, 4-3)
in a Fenton chemical system were measured after reaction times of 1, 3, and 7 days.
The spectra (Figures 4-1a-c) show oligomerization of levoglucosan to form water-
soluble products, with masses for the single- mass unit continuum distribution
occurring up to ~2000 u on day 3 (Figure 4-1b, full mass signal scale not shown). All
mass spectra have been normalized to the sodiated ([M+Na]+, 185 u) (Figures 4-1a-c)
or, when applicable, the lithiated ([M+Li]+, 169 u) levoglucosan ion signal. For day 1,
the single-mass unit continuum mass distribution shows comparatively low relative
ion intensity, ending ~500 u (Figure 4-1a).
62
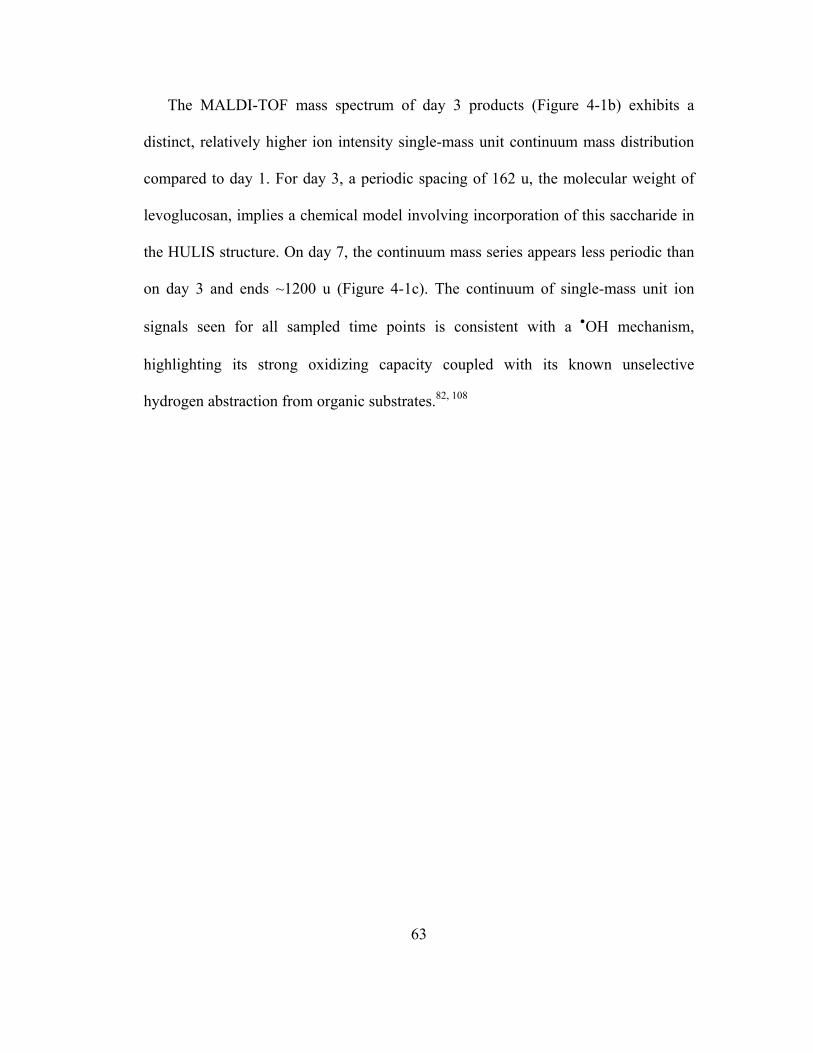
The MALDI-TOF mass spectrum of day 3 products (Figure 4-1b) exhibits a
distinct, relatively higher ion intensity single-mass unit continuum mass distribution
compared to day 1. For day 3, a periodic spacing of 162 u, the molecular weight of
levoglucosan, implies a chemical model involving incorporation of this saccharide in
the HULIS structure. On day 7, the continuum mass series appears less periodic than
on day 3 and ends ~1200 u (Figure 4-1c). The continuum of single-mass unit ion
signals seen for all sampled time points is consistent with a •OH mechanism,
highlighting its strong oxidizing capacity coupled with its known unselective
hydrogen abstraction from organic substrates.82, 108
63
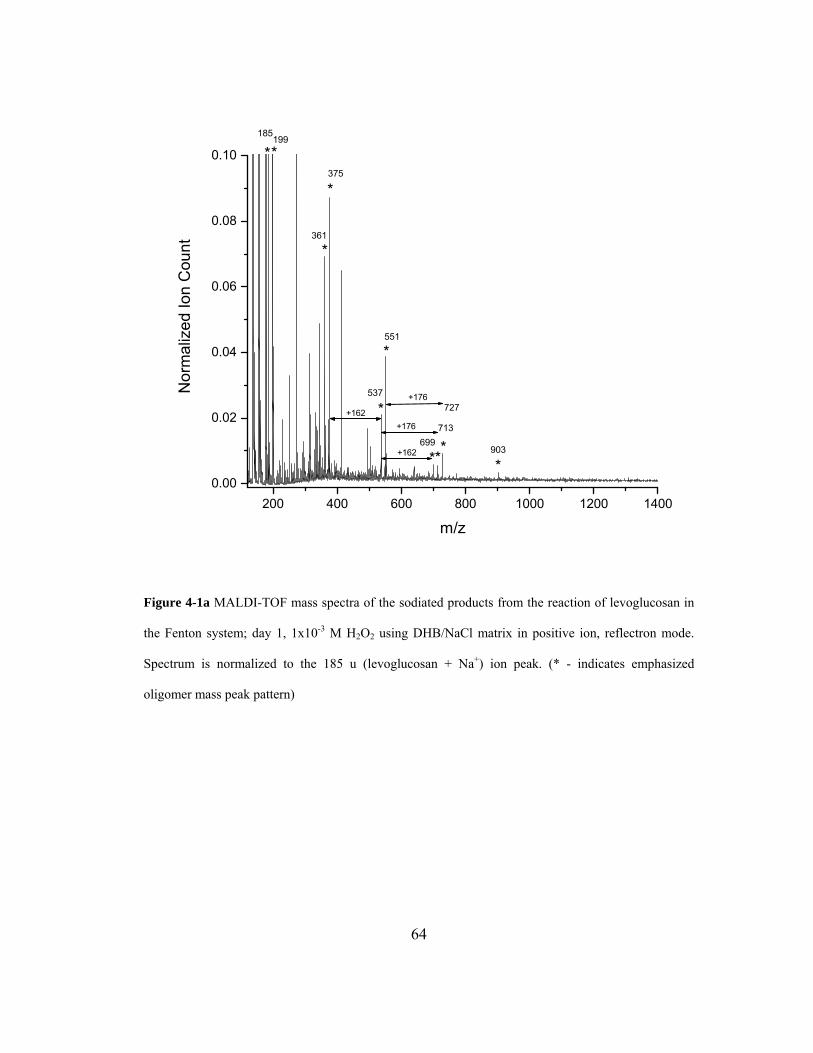
Figure 4-1a MALDI-TOF mass spectra of the sodiated products from the reaction of levoglucosan in
the Fenton system; day 1, 1x10⁻³ M H2O2 using DHB/NaCl matrix in positive ion, reflectron mode.
Spectrum is normalized to the 185 u (levoglucosan + Na+) ion peak. (* - indicates emphasized
oligomer mass peak pattern)
64
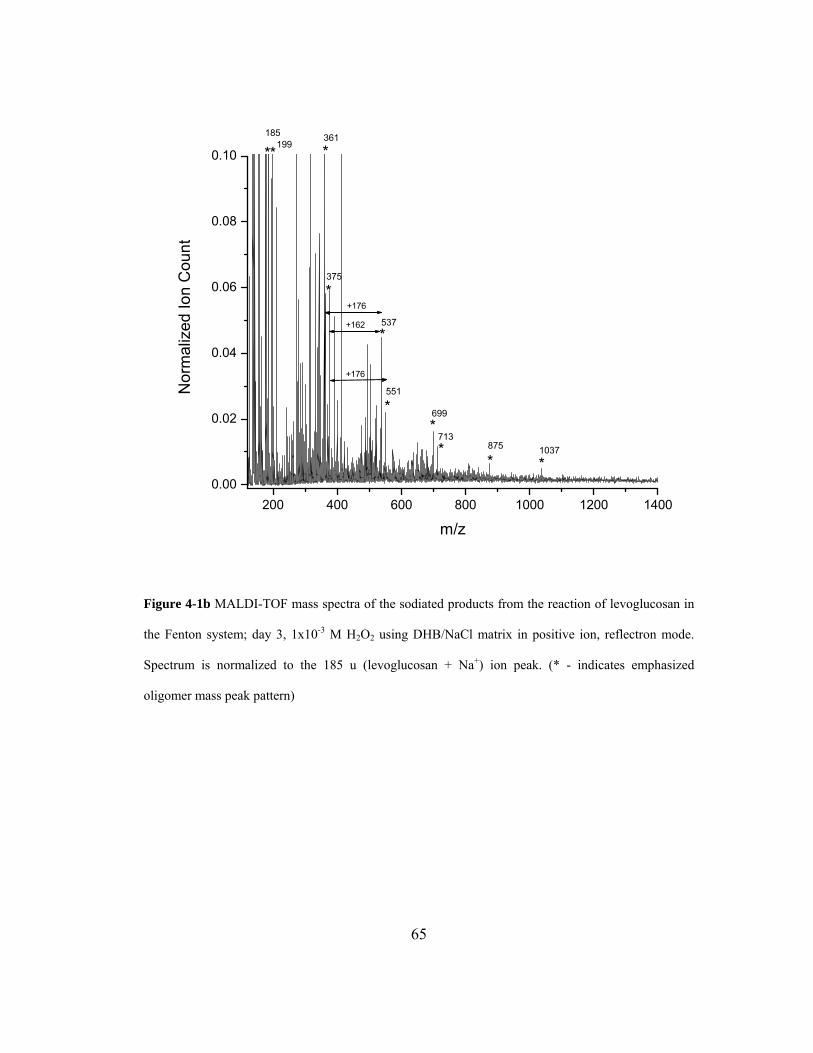
Figure 4-1b MALDI-TOF mass spectra of the sodiated products from the reaction of levoglucosan in
the Fenton system; day 3, 1x10⁻³ M H2O2 using DHB/NaCl matrix in positive ion, reflectron mode.
Spectrum is normalized to the 185 u (levoglucosan + Na+) ion peak. (* - indicates emphasized
oligomer mass peak pattern)
65
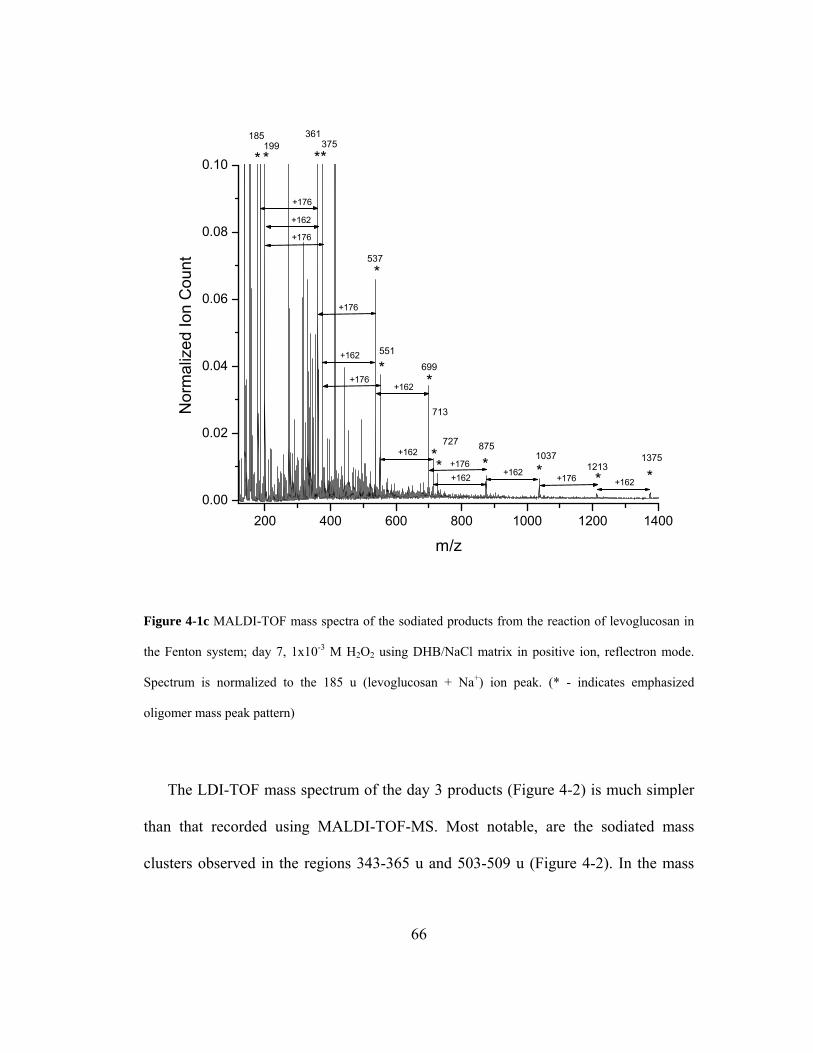
Figure 4-1c MALDI-TOF mass spectra of the sodiated products from the reaction of levoglucosan in
the Fenton system; day 7, 1x10⁻³ M H2O2 using DHB/NaCl matrix in positive ion, reflectron mode.
Spectrum is normalized to the 185 u (levoglucosan + Na+) ion peak. (* - indicates emphasized
oligomer mass peak pattern)
The LDI-TOF mass spectrum of the day 3 products (Figure 4-2) is much simpler
than that recorded using MALDI-TOF-MS. Most notable, are the sodiated mass
clusters observed in the regions 343-365 u and 503-509 u (Figure 4-2). In the mass
66
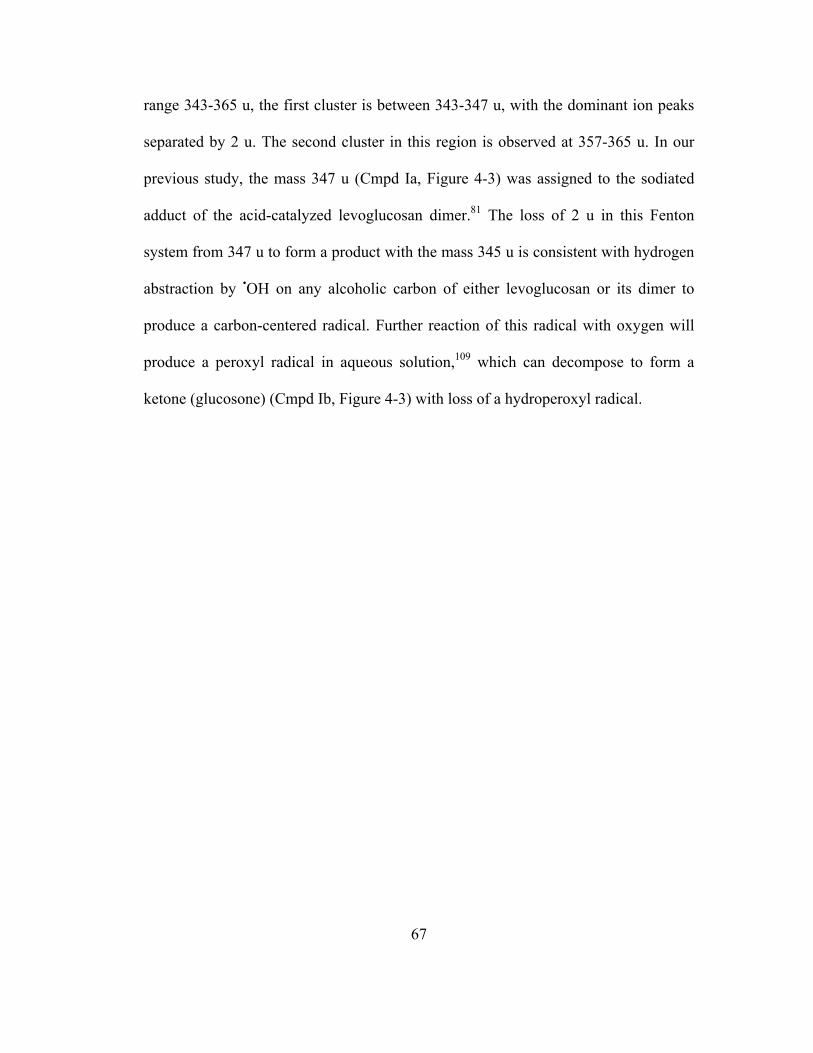
range 343-365 u, the first cluster is between 343-347 u, with the dominant ion peaks
separated by 2 u. The second cluster in this region is observed at 357-365 u. In our
previous study, the mass 347 u (Cmpd Ia, Figure 4-3) was assigned to the sodiated
adduct of the acid-catalyzed levoglucosan dimer.81 The loss of 2 u in this Fenton
system from 347 u to form a product with the mass 345 u is consistent with hydrogen
abstraction by •OH on any alcoholic carbon of either levoglucosan or its dimer to
produce a carbon-centered radical. Further reaction of this radical with oxygen will
produce a peroxyl radical in aqueous solution,109 which can decompose to form a
ketone (glucosone) (Cmpd Ib, Figure 4-3) with loss of a hydroperoxyl radical.
67
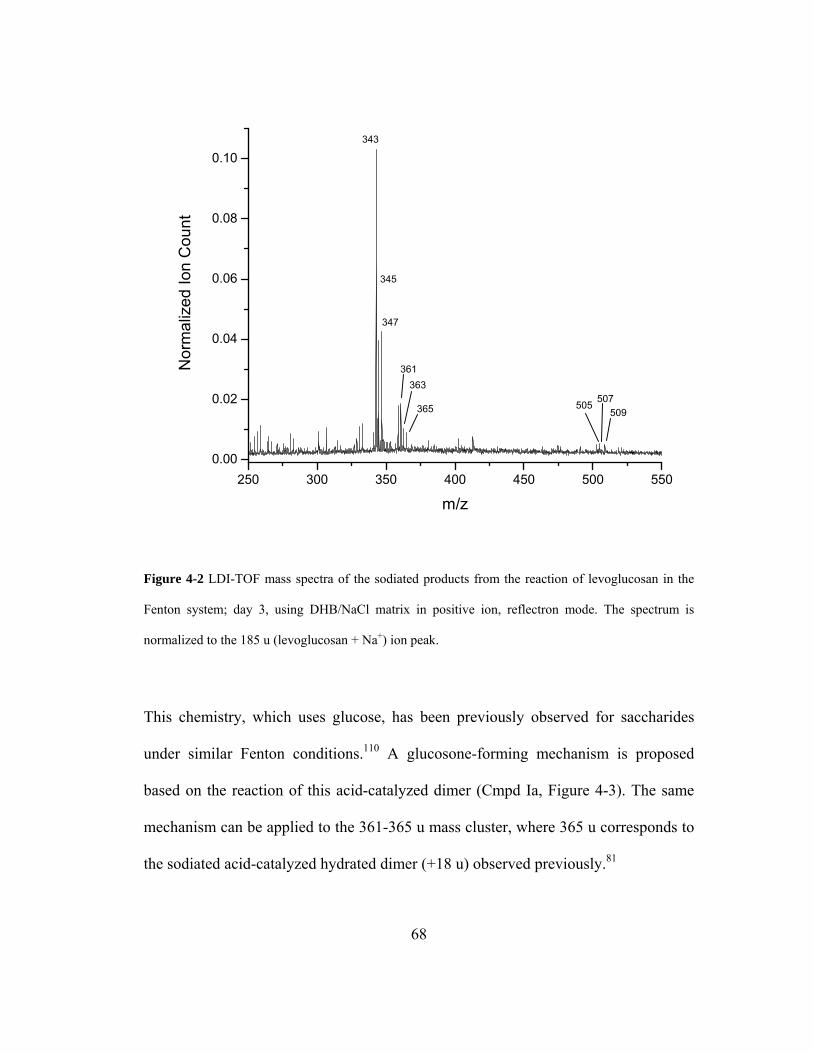
Figure 4-2 LDI-TOF mass spectra of the sodiated products from the reaction of levoglucosan in the
Fenton system; day 3, using DHB/NaCl matrix in positive ion, reflectron mode. The spectrum is
normalized to the 185 u (levoglucosan + Na+) ion peak.
This chemistry, which uses glucose, has been previously observed for saccharides
under similar Fenton conditions.110 A glucosone-forming mechanism is proposed
based on the reaction of this acid-catalyzed dimer (Cmpd Ia, Figure 4-3). The same
mechanism can be applied to the 361-365 u mass cluster, where 365 u corresponds to
the sodiated acid-catalyzed hydrated dimer (+18 u) observed previously.81
68
OO
O
HO
OHO
OH
HO
OH
OH
[M + Na]+ = 347 u
OH
OO
O
HO
OHO
OH
HO
OH
OH
OO
O
HO
OHO
OH
HO
O
OH
O2
O
OH
OO
O
HO
OHO
OH
HO
O
OH
-H2O
[M + Na]+ = 345 u
+ HO2
Cmpd Ib
Cmpd Ia
Figure 4-3 Proposed mechanism for the formation of a glucosone by reaction of a disaccharide with •OH.
Alternatively, Criegee rearrangement of a hydroperoxide formed on the carbon-
centered radicals described above can cause a ring expansion with creation of a
lactone,111, 112 increasing the mass by 14 u (e.g., 347 u + 14 u = 361 u, Figure 4-2).
This process is discussed further below (Figure 4-4). The mass range 503-509 u can
be rationalized analogously based on the glucosone and Criegee chemistry acting on
the acid-catalyzed trimer of levoglucosan81 (i.e. [M + Na]+ = 509 u). These same
mass clusters are also observed with significant relative ion signal intensity within the
continuum mass distribution of the MALDI-TOF mass spectra for all time points,
albeit on a more complex mass spectral baseline. Oligomerization up to the 3-mer, 5-
69
mer, and 5-mer on days 1, 3, and 7, respectively, was observed by MALDI-TOF-MS.
Background reactions (not shown) containing all reagents except hydrogen peroxide
as a Fenton-initiator, did not show a significant background for the single-mass unit
continuum products. Also, these levoglucosan solutions have been previously tested81
with individual and combinations of the reagents used and did not show an
appreciable background. Further, for this study, a test was performed for reaction of
levoglucosan with H2O2 at pH = 4.5 which also did not show a background
interference.
4.3.3. Oligomerization Mass Patterns: MALDI-TOF-MS
Overlaid on the MALDI-TOF single-mass unit continuum mass distribution are
higher intensity ion signals of two oligomeric series with repeating units of either
+162 u (levoglucosan (Cmpd I)) or +176 u originating from the base peaks 185 u
(levoglucosan + Na+) and 199 u (Cmpd II, Figure 4-4, [176 + Na]+) (Figures 4-1a-c).
On days 1, 3, and 7, these series terminate at 903 u, 1037 u, and 1375 u, respectively.
The formation of the 199 u ([176 + Na]+, Cmpd II) ion signal can be rationalized by
reaction of levoglucosan through a •OH-initiated Criegee rearrangement (Figure 4-4),
to form the lactone with ring expansion (i.e., 2,5-Dihydroxy-3,8,9-trioxa-
bicyclo[4.2.1]nonan-4-one). This chemistry has been previously observed for
saccharides and polysaccharides in a Fenton system and has been adapted here for
levoglucosan.111, 112
70
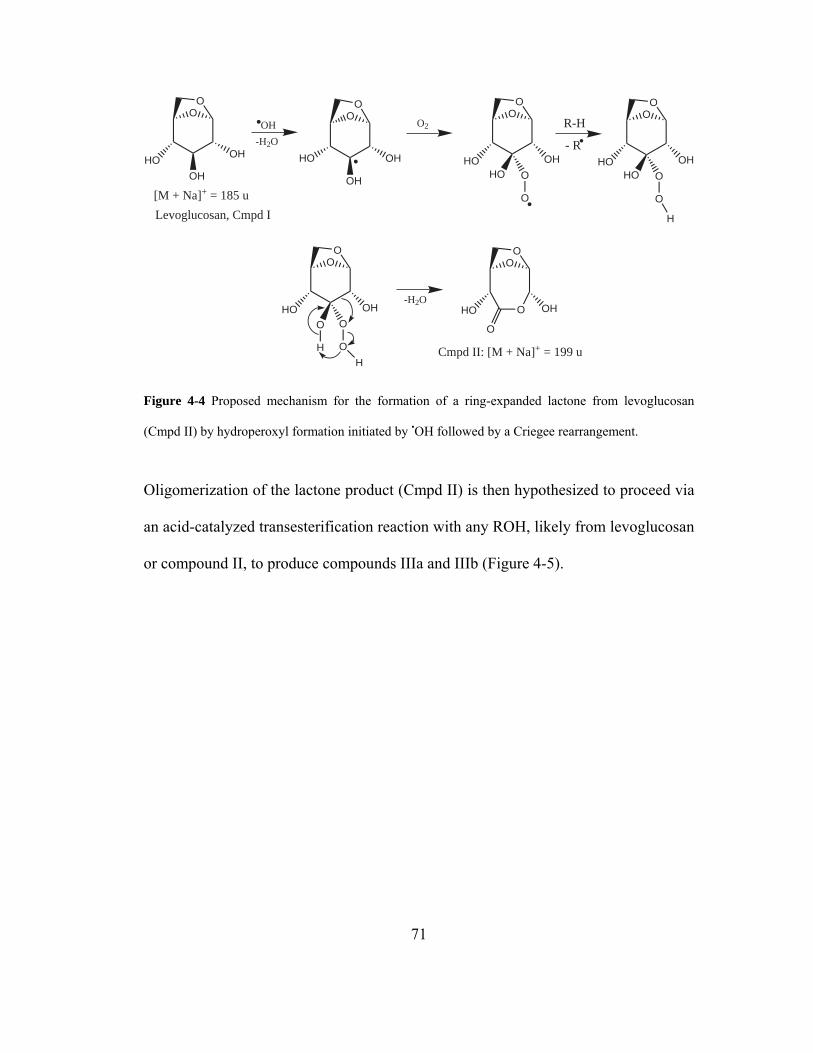
OO
HO
OH
OH
OH
-H2O
OO
HO
OH
OH
O2
OO
HOHO
OH
O
O
OO
HOHO
OH
O
O
R-H
- R
H
OO
HOO
OH
O
O
HH
OO
HO
O
OHO
[M + Na]+ = 185 u
Cmpd II: [M + Na]+ = 199 u
Levoglucosan, Cmpd I
-H2O
Figure 4-4 Proposed mechanism for the formation of a ring-expanded lactone from levoglucosan
(Cmpd II) by hydroperoxyl formation initiated by •OH followed by a Criegee rearrangement.
Oligomerization of the lactone product (Cmpd II) is then hypothesized to proceed via
an acid-catalyzed transesterification reaction with any ROH, likely from levoglucosan
or compound II, to produce compounds IIIa and IIIb (Figure 4-5).
71
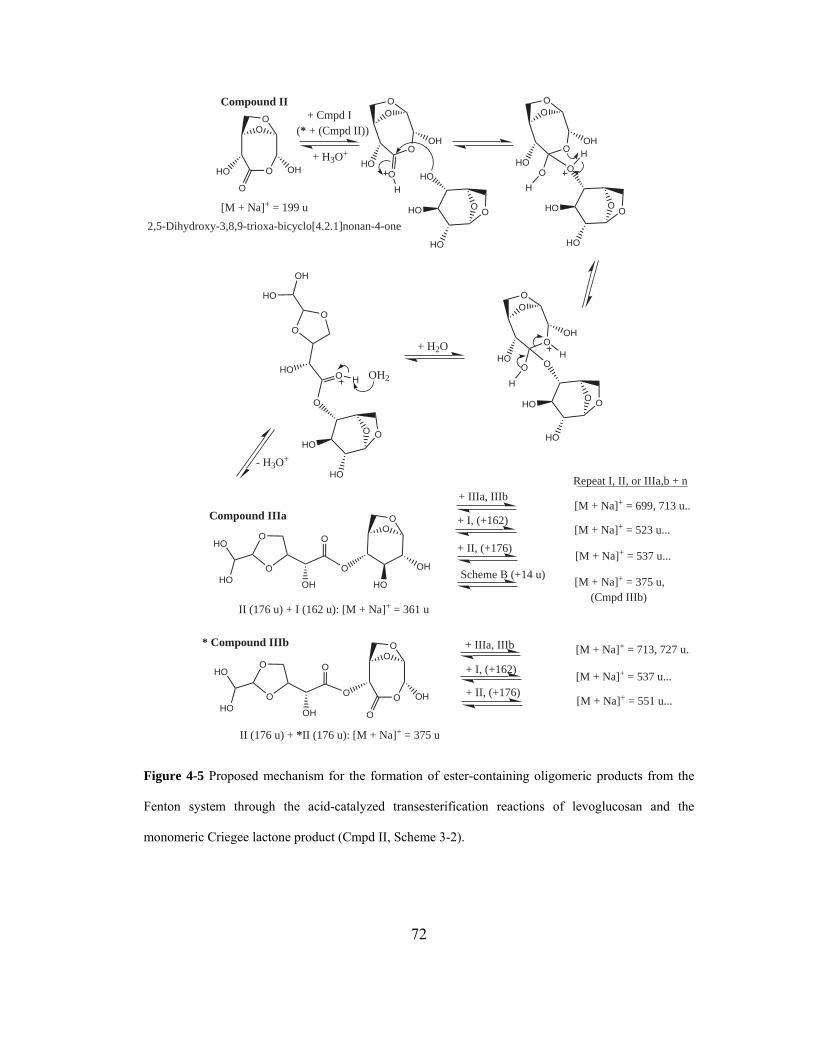
OO
HO
O
OHO
[M + Na]+ = 199 u OO
HO
HO
HO
+ H3O+
OO
HOO
OHO
H
OO
O
HO
HO
OO
HOO
OHO
H
H
O O
O
HO
HO
OO
HOO
OHO
H
H
O O
O
HO
HO
O
O
HOO
HO
OH
H
- H3O+
OH2
OO
O
HO
OHO
O
OH
O
HO
HO
2,5-Dihydroxy-3,8,9-trioxa-bicyclo[4.2.1]nonan-4-one
+ Cmpd I
II (176 u) + I (162 u): [M + Na]+ = 361 u
(* + (Cmpd II))
O
O
OH
O
HO
HO
OO
O
O
OHO
II (176 u) + *II (176 u): [M + Na]+ = 375 u
Compound II
Compound IIIa
* Compound IIIb
+ IIIa, IIIb
+ II, (+176)
+ IIIa, IIIb
[M + Na]+ = 699, 713 u...
[M + Na]+ = 537 u...
[M + Na]+ = 713, 727 u...
[M + Na]+ = 551 u...
+ I, (+162)[M + Na]+ = 523 u...
[M + Na]+ = 537 u...+ I, (+162)
+ II, (+176)
+ H2O
Repeat I, II, or IIIa,b + n
Scheme B (+14 u)[M + Na]+ = 375 u,
(Cmpd IIIb)
Figure 4-5 Proposed mechanism for the formation of ester-containing oligomeric products from the
Fenton system through the acid-catalyzed transesterification reactions of levoglucosan and the
monomeric Criegee lactone product (Cmpd II, Scheme 3-2).
72
If levoglucosan initially adds to compound II to produce compound IIIa, further
reaction of this oligomerized levoglucosan moiety by the Criegee route (Figure 4-4)
will produce compound IIIb (Figure 4-5). Also possible is addition of levoglucosan to
IIIa via acid-catalyzed cationic ring-opening81 to produce an increase in mass of +162
u. Compound IIIb can be formed directly by homo-dimerization of compound II. In
the cases where nucleophilic ROH attack occurs through transesterification at the
lactone site in compound II or a higher-order oligomeric aliphatic ester, a propagating
mechanism may begin, leading to the formation of polyesters (e.g., Cmpd IIIb).
4.3.4. MALDI-TOF-MS Matrix Background
The combination of DHB matrix and sodium cationization agent was selected
because of its sensitivity to oligosaccharides and lower molecular weight analytes
(<10,000 u).76 However, when sampling only the DHB/NaCl matrix background, ion
signals are observed at 199, 375, 551, and 727 u, which are all separated by 176 u
(i.e., [DHB - H + Na]+). The ion peaks 176 and 177 u (i.e., [DHB + Na]+) are also
observed in this background spectra. It should be noted that the formation of inclusion
products of gas-phase matrix DHB species and analyte has been observed
previously,75, 113 and potentially results in an overestimation of the molecular weight
of the oligomer distributions. Such background inclusion products may confound
identification of the proposed products since, for the transesterification process
described above, the formation of a ring-expanded lactone from levoglucosan (Cmpd
II, Figure 4-3), is the key species that allows this chemistry to propagate, appearing at
73
199 u. The background mass peak series (i.e. 199, 375, 551 u…) could then pose a
direct interference with the proposed transesterification process where production of
the sodiated lactone (199 u) would be followed by a propagating reaction with ROH
from this same lactone product to produce a product series (+176 u) starting with the
2-mer (199 u + 176 u = 375 u). Another possible solution-phase process where the
matrix background may interfere arises from Fenton chemistry where reaction of a
transesterified levoglucosan (Cmpd IIIa, Figure 4-5) reacts with an •OH through the
Criegee route (Figure 4-4) adding +14 u to generate compound II. Such a process
would create a product with a mass of 375 u, identical to one of the possible DHB
inclusion products. The production of the next higher order Fenton product which
overlaps the 551 u matrix interference product proceeds by further oligomerization of
the 375 u product with levoglucosan through transesterification followed by the
Criegee rearrangement (375 u + 162 u + 14 u = 551 u).
4.3.5. Studies Supporting Solution-Phase Chemistry
The normalized ion signal for the non-background sodiated 537 u mass peak
(Figures 4-1a-c) may arise either from inclusion of levoglucosan with the 375 u
matrix background species and/or reaction through the Criegee/transesterification
reactions of levoglucosan (Figures 4-4 and 4-5). In order to elucidate the extent of the
Fenton/levoglucosan chemical system compared with the matrix interference, the
relative ion counts for this 537 u mass peak were measured for the following aqueous
levoglucosan experiments: 1) acid-catalyzed (Reaction C),81 2) Fenton using 1x10⁻⁴
74
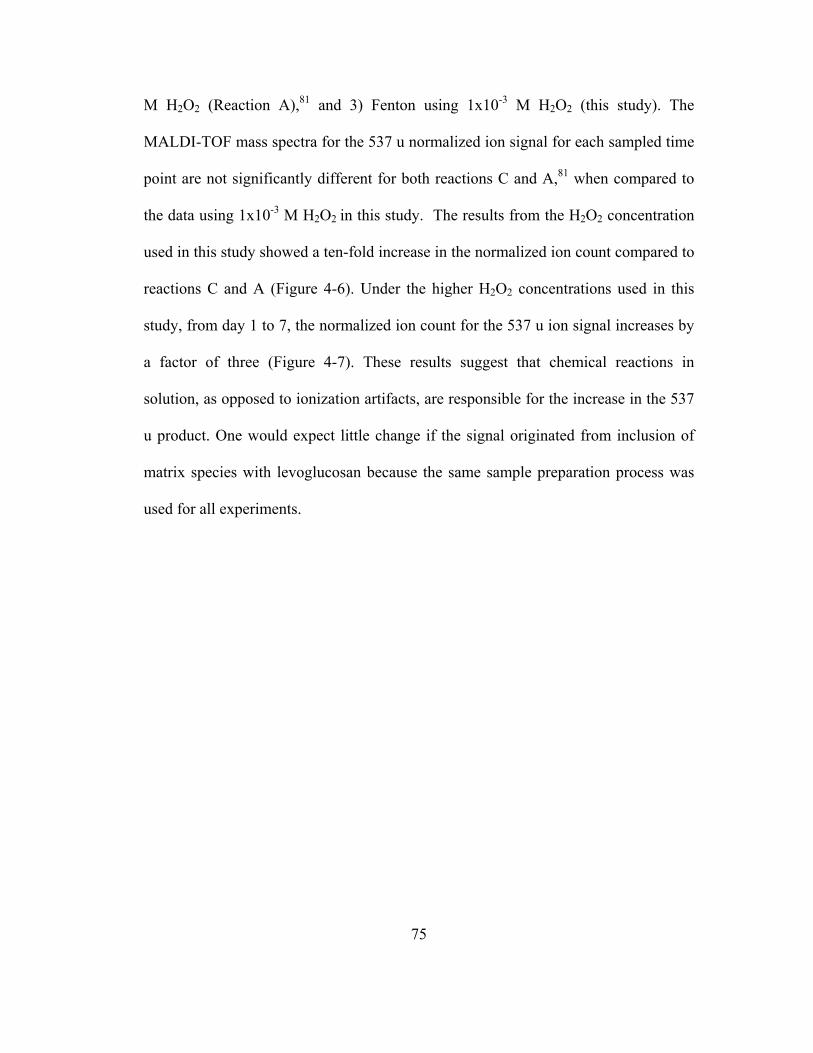
M H2O2 (Reaction A),81 and 3) Fenton using 1x10⁻³ M H2O2 (this study). The
MALDI-TOF mass spectra for the 537 u normalized ion signal for each sampled time
point are not significantly different for both reactions C and A,81 when compared to
the data using 1x10⁻³ M H2O2 in this study. The results from the H2O2 concentration
used in this study showed a ten-fold increase in the normalized ion count compared to
reactions C and A (Figure 4-6). Under the higher H2O2 concentrations used in this
study, from day 1 to 7, the normalized ion count for the 537 u ion signal increases by
a factor of three (Figure 4-7). These results suggest that chemical reactions in
solution, as opposed to ionization artifacts, are responsible for the increase in the 537
u product. One would expect little change if the signal originated from inclusion of
matrix species with levoglucosan because the same sample preparation process was
used for all experiments.
75
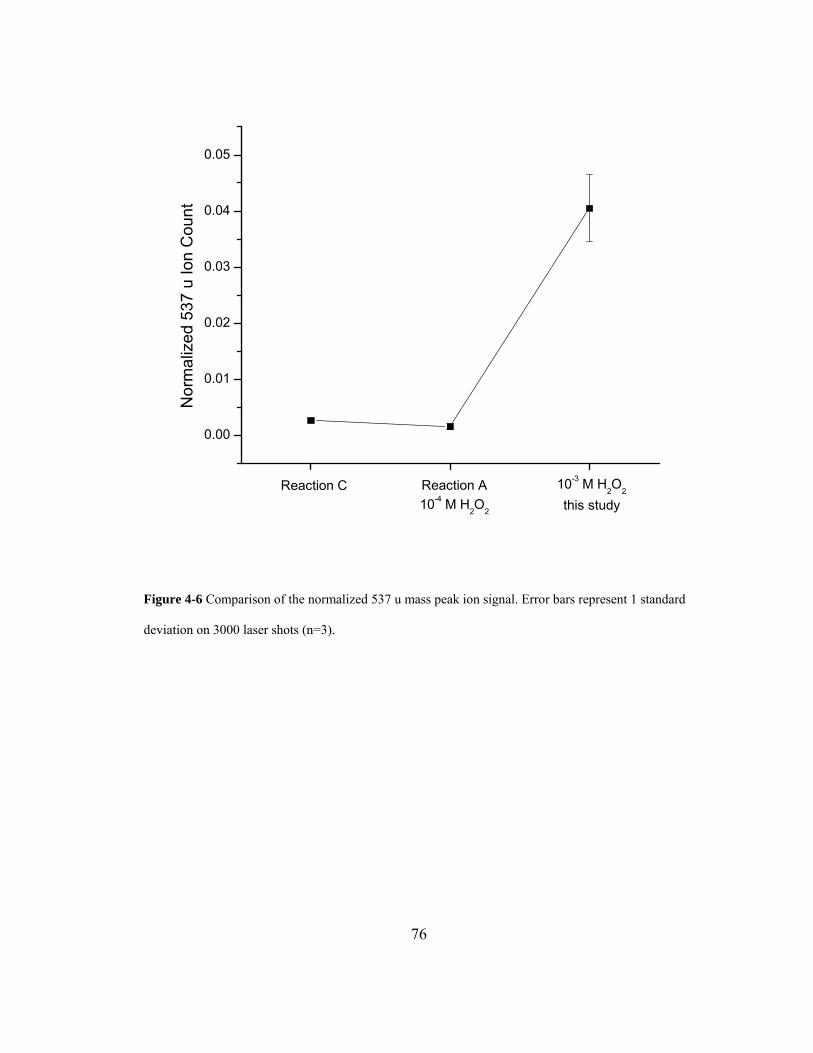
Figure 4-6 Comparison of the normalized 537 u mass peak ion signal. Error bars represent 1 standard
deviation on 3000 laser shots (n=3).
76
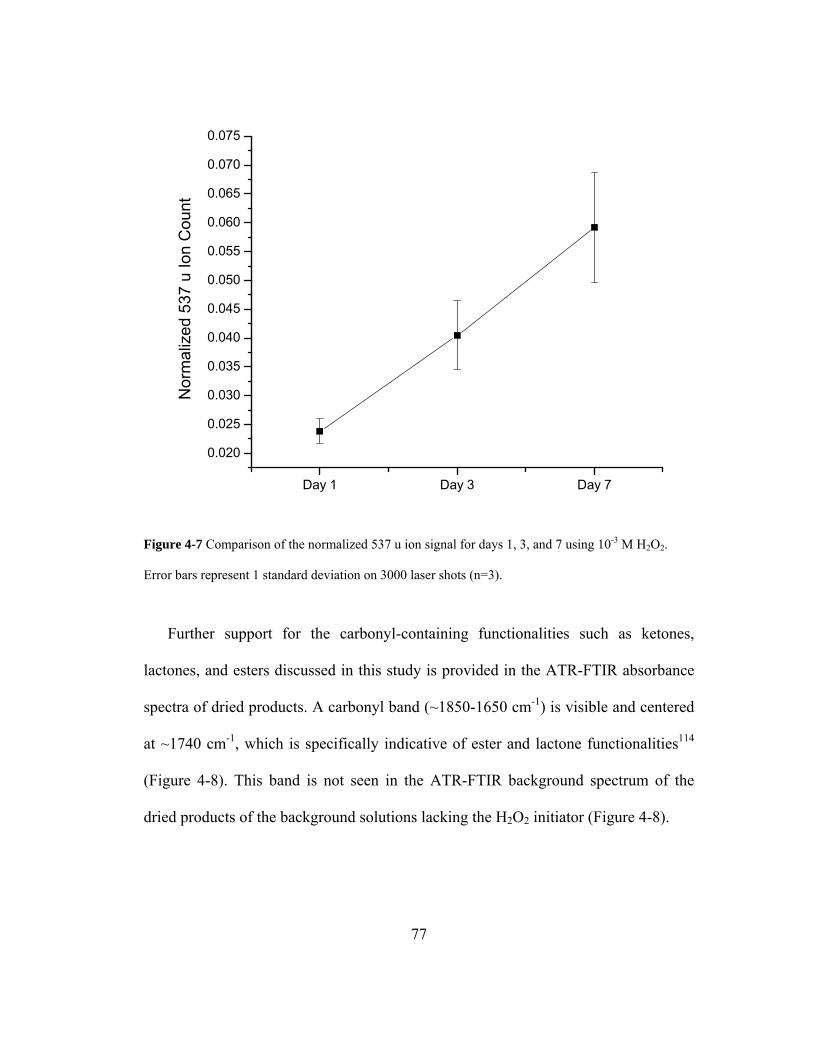
Figure 4-7 Comparison of the normalized 537 u ion signal for days 1, 3, and 7 using 10-3 M H2O2.
Error bars represent 1 standard deviation on 3000 laser shots (n=3).
Further support for the carbonyl-containing functionalities such as ketones,
lactones, and esters discussed in this study is provided in the ATR-FTIR absorbance
spectra of dried products. A carbonyl band (~1850-1650 cm-1) is visible and centered
at ~1740 cm-1, which is specifically indicative of ester and lactone functionalities114
(Figure 4-8). This band is not seen in the ATR-FTIR background spectrum of the
dried products of the background solutions lacking the H2O2 initiator (Figure 4-8).
77
Figure 4-8 ATR-FTIR of the lyophylized, dried products of (A) the Fenton reaction of levoglucosan
(10-3 M H2O2), day 3 and (B) the aqueous reaction of levoglucosan, H2SO4, and Fe3+ in the absence of
H2O2 on day 3.
4.3.6. MALDI-TOF-MS: Lithium Cationization
To minimize any potential artifact or interfering ion signals in the mass spectral
data, various combinations of alternative chemical matrices and alkali salts (Na+, K+,
Li+) were used in the MALDI sample preparation. The use of Li as the cationizing
agent with DHB matrix removes the previously discussed [DHB –H + Na]+ (176 u)
78
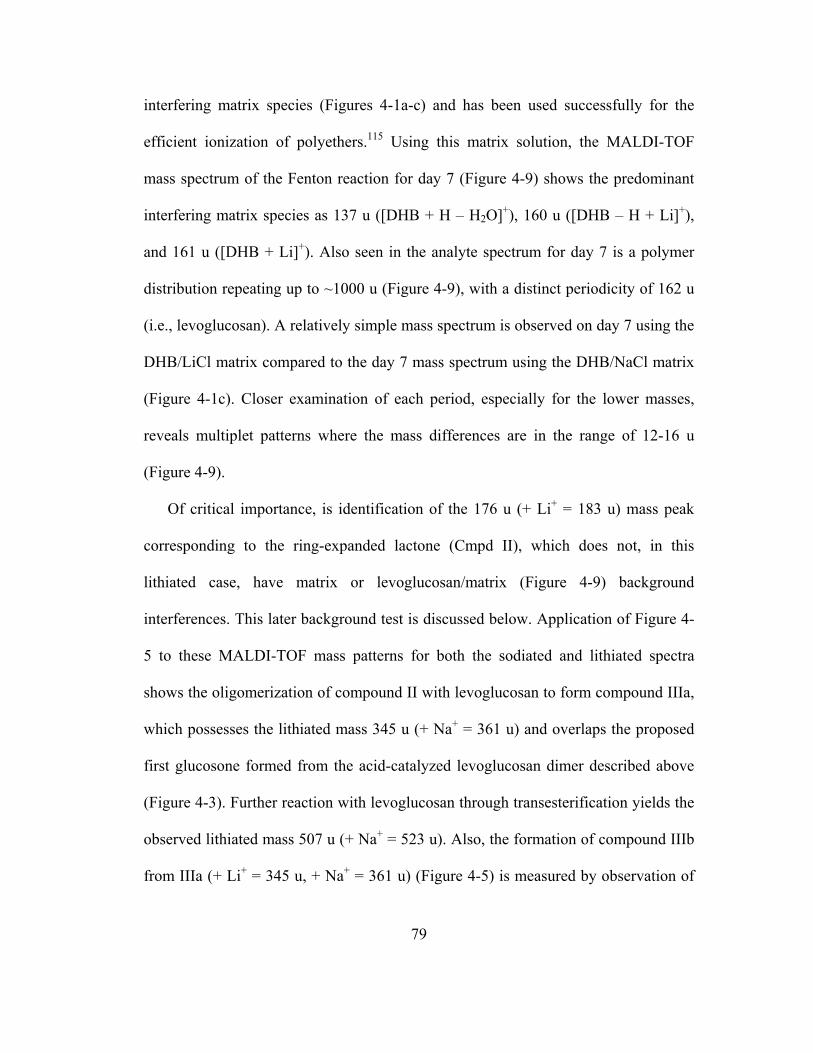
interfering matrix species (Figures 4-1a-c) and has been used successfully for the
efficient ionization of polyethers.115 Using this matrix solution, the MALDI-TOF
mass spectrum of the Fenton reaction for day 7 (Figure 4-9) shows the predominant
interfering matrix species as 137 u ([DHB + H – H2O]+), 160 u ([DHB – H + Li]+),
and 161 u ([DHB + Li]+). Also seen in the analyte spectrum for day 7 is a polymer
distribution repeating up to ~1000 u (Figure 4-9), with a distinct periodicity of 162 u
(i.e., levoglucosan). A relatively simple mass spectrum is observed on day 7 using the
DHB/LiCl matrix compared to the day 7 mass spectrum using the DHB/NaCl matrix
(Figure 4-1c). Closer examination of each period, especially for the lower masses,
reveals multiplet patterns where the mass differences are in the range of 12-16 u
(Figure 4-9).
Of critical importance, is identification of the 176 u (+ Li+ = 183 u) mass peak
corresponding to the ring-expanded lactone (Cmpd II), which does not, in this
lithiated case, have matrix or levoglucosan/matrix (Figure 4-9) background
interferences. This later background test is discussed below. Application of Figure 4-
5 to these MALDI-TOF mass patterns for both the sodiated and lithiated spectra
shows the oligomerization of compound II with levoglucosan to form compound IIIa,
which possesses the lithiated mass 345 u (+ Na+ = 361 u) and overlaps the proposed
first glucosone formed from the acid-catalyzed levoglucosan dimer described above
(Figure 4-3). Further reaction with levoglucosan through transesterification yields the
observed lithiated mass 507 u (+ Na+ = 523 u). Also, the formation of compound IIIb
from IIIa (+ Li+ = 345 u, + Na+ = 361 u) (Figure 4-5) is measured by observation of
79
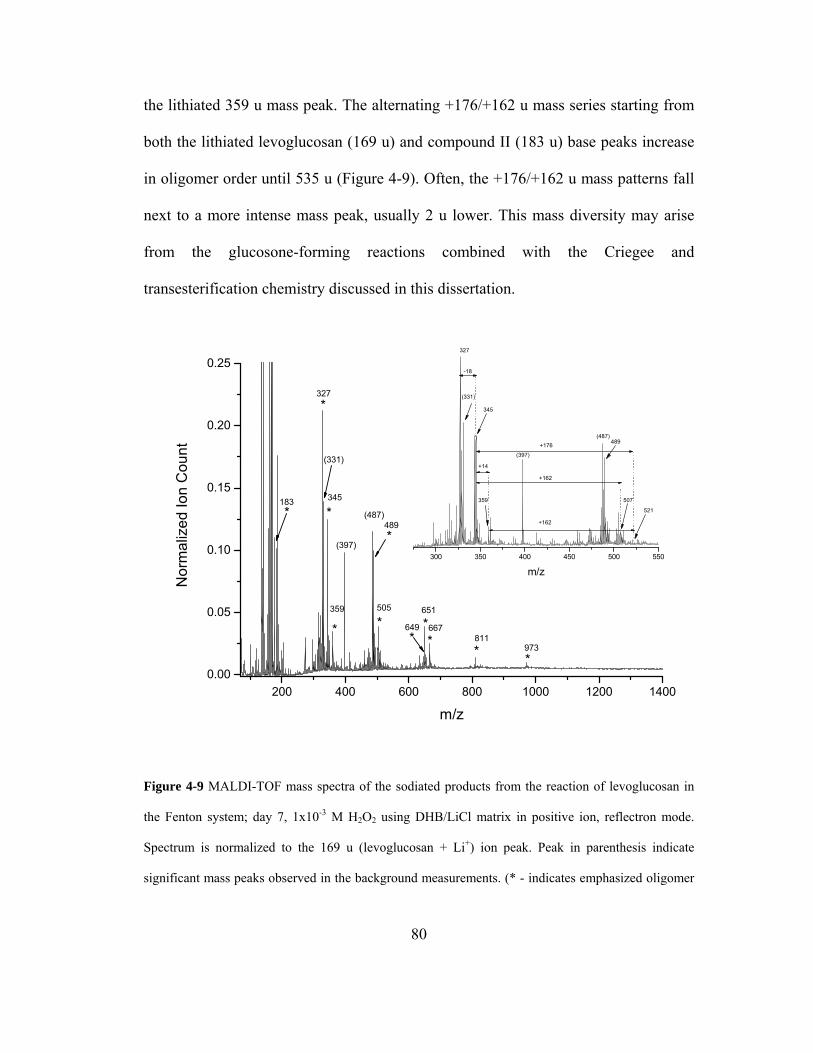
the lithiated 359 u mass peak. The alternating +176/+162 u mass series starting from
both the lithiated levoglucosan (169 u) and compound II (183 u) base peaks increase
in oligomer order until 535 u (Figure 4-9). Often, the +176/+162 u mass patterns fall
next to a more intense mass peak, usually 2 u lower. This mass diversity may arise
from the glucosone-forming reactions combined with the Criegee and
transesterification chemistry discussed in this dissertation.
Figure 4-9 MALDI-TOF mass spectra of the sodiated products from the reaction of levoglucosan in
the Fenton system; day 7, 1x10⁻³ M H2O2 using DHB/LiCl matrix in positive ion, reflectron mode.
Spectrum is normalized to the 169 u (levoglucosan + Li+) ion peak. Peak in parenthesis indicate
significant mass peaks observed in the background measurements. (* - indicates emphasized oligomer
80
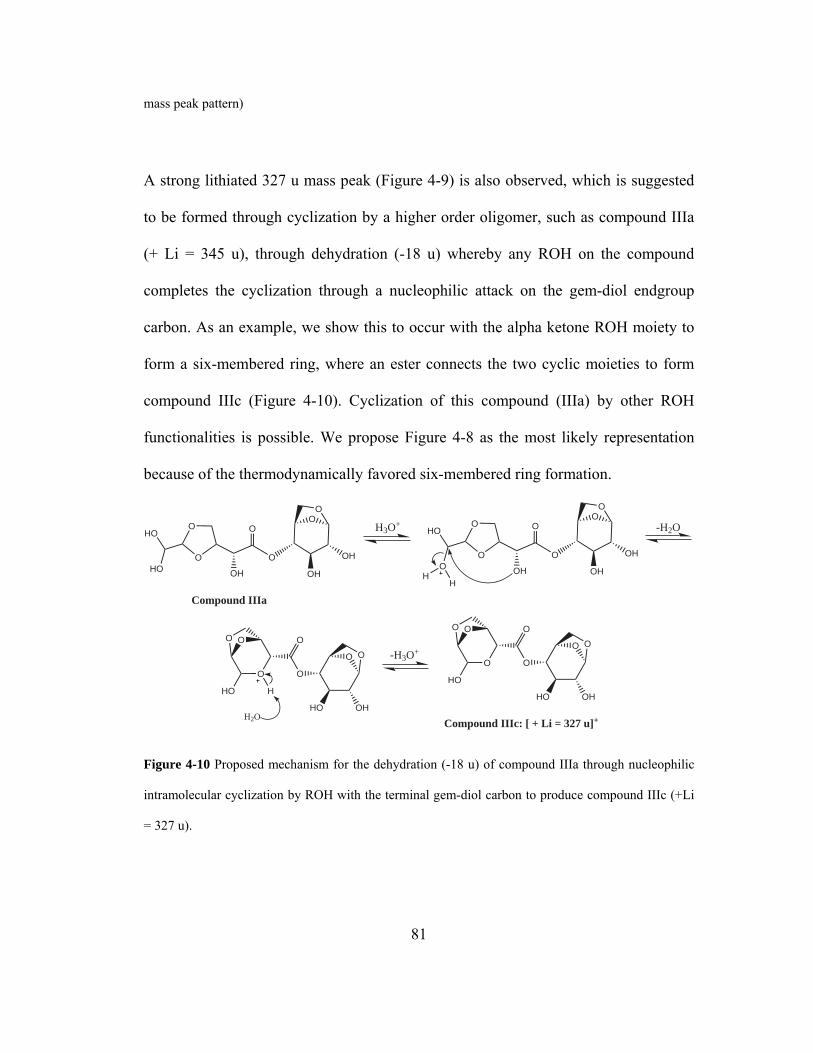
mass peak pattern)
A strong lithiated 327 u mass peak (Figure 4-9) is also observed, which is suggested
to be formed through cyclization by a higher order oligomer, such as compound IIIa
(+ Li = 345 u), through dehydration (-18 u) whereby any ROH on the compound
completes the cyclization through a nucleophilic attack on the gem-diol endgroup
carbon. As an example, we show this to occur with the alpha ketone ROH moiety to
form a six-membered ring, where an ester connects the two cyclic moieties to form
compound IIIc (Figure 4-10). Cyclization of this compound (IIIa) by other ROH
functionalities is possible. We propose Figure 4-8 as the most likely representation
because of the thermodynamically favored six-membered ring formation.
OO
O
OH
OHO
O
OH
O
HO
HO
OO
O
OH
OHO
O
OH
O
O
HO
HH
-H2O
O O
O
HO OH
OO
O
O
HO H
H2O
-H3O+O O
O
HO OH
OO
O
O
HO
Compound IIIc: [ + Li = 327 u]+
Compound IIIa
H3O+
Figure 4-10 Proposed mechanism for the dehydration (-18 u) of compound IIIa through nucleophilic
intramolecular cyclization by ROH with the terminal gem-diol carbon to produce compound IIIc (+Li
= 327 u).
81
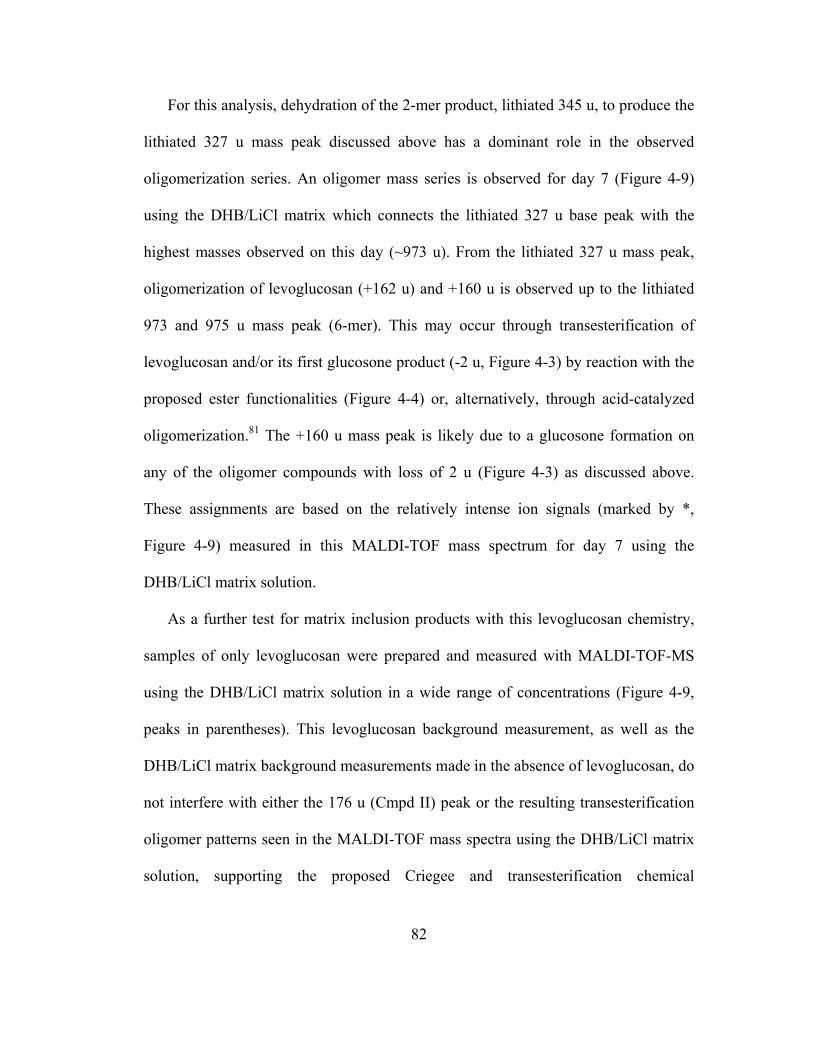
For this analysis, dehydration of the 2-mer product, lithiated 345 u, to produce the
lithiated 327 u mass peak discussed above has a dominant role in the observed
oligomerization series. An oligomer mass series is observed for day 7 (Figure 4-9)
using the DHB/LiCl matrix which connects the lithiated 327 u base peak with the
highest masses observed on this day (~973 u). From the lithiated 327 u mass peak,
oligomerization of levoglucosan (+162 u) and +160 u is observed up to the lithiated
973 and 975 u mass peak (6-mer). This may occur through transesterification of
levoglucosan and/or its first glucosone product (-2 u, Figure 4-3) by reaction with the
proposed ester functionalities (Figure 4-4) or, alternatively, through acid-catalyzed
oligomerization.81 The +160 u mass peak is likely due to a glucosone formation on
any of the oligomer compounds with loss of 2 u (Figure 4-3) as discussed above.
These assignments are based on the relatively intense ion signals (marked by *,
Figure 4-9) measured in this MALDI-TOF mass spectrum for day 7 using the
DHB/LiCl matrix solution.
As a further test for matrix inclusion products with this levoglucosan chemistry,
samples of only levoglucosan were prepared and measured with MALDI-TOF-MS
using the DHB/LiCl matrix solution in a wide range of concentrations (Figure 4-9,
peaks in parentheses). This levoglucosan background measurement, as well as the
DHB/LiCl matrix background measurements made in the absence of levoglucosan, do
not interfere with either the 176 u (Cmpd II) peak or the resulting transesterification
oligomer patterns seen in the MALDI-TOF mass spectra using the DHB/LiCl matrix
solution, supporting the proposed Criegee and transesterification chemical
82
mechanisms. Also, using lithium as the matrix cationization agent simplifies the
spectra significantly compared to sodium. Matrix/analyte inclusion formation for this
system may be suppressed by the use of lithium, which, due to its small ionic radius
compared to that of sodium and potassium, is less likely to chelate with the
carboxylic/alcohol ligands in DHB during MALDI cationization.116 In addition, the
simplified MALDI-TOF mass spectra using the DHB/LiCl matrix solution may also
be a result of the selectivity of Li+ for certain compound classes.115
4.4. Conclusions
Aerosols emitted from biomass burning are multi-component admixtures35, 63
containing a variety of water soluble organic species,30, 42, 117, 118 hydrogen peroxide,
iron, and other transition metals in an acidified aqueous medium; all necessary
components for Fenton chemistry.107 As noted previously, these aqueous
levoglucosan proxy experiments were designed to discern which pathways and
subsequent products that may predominate in complex, multi-component tropospheric
aerosols. In this respect, oligomerization of levoglucosan appears as an important
pathway in both Fenton (this study) and acid-catalyzed chemistry.81 Also possible, is
that the proposed products are intermediates, which incorporate into new compounds
through reactions with other species within aerosols by, for example, acid-catalyzed,
•OH oxidation, or photo-oxidiation processes, potentially forming HULIS.
Chemical products proposed here may aid the understanding of the atmospheric
83
processing of biomass burning aerosol parcels, possibly revealing information such as
its age and source.35 Identification of chemical products by proxy experiments are
useful to guide analytical strategies in field investigations where chemical separations
are critical for the measurement of a complex chemical matrix such as biomass
burning aerosols. Further, the chemical processes identified in this work may
participate in the formation of atmospheric HULIS, which may significantly alter the
hygroscopicity42, 48, 119-122 of the aged biomass burning aerosol, affecting its ability to
act as effective cloud condensation nuclei.5, 99 Increase in HULIS density with the
aging of biomass burning aerosols has been shown previously and was attributed to
an oxidative mechanism,123 which is consistent with the •OH mechanism proposed in
this study. Results reported here provide a direct chemical route by which
levoglucosan is chemically processed by atmospheric reactants and possibly
incorporated into chemical structures that represent HULIS. This is in agreement with
studies that show a strong saccharide nature in HULIS.124, 125 The understanding of
HULIS formation and the fundamental chemical processes occurring within biomass
burning aerosols will further our knowledge of how these phenomena affect global
climate.
84
5. Comprehensive Conclusions
5.1. Summary of Experimental Findings
Results of these laboratory investigations show fundamental chemical
transformations of levoglucosan with both acid-catalyzed81 and oxidative (i.e. •OH)98
reactions under atmospherically relevant conditions. The main feature of the
levoglucosan chemistry reported here is oligomerization to form high molecular
weight (< 2000 m/z) products. Under acidic conditions (pH = 4.5), MALDI-TOF
mass spectrometric measurements showed repeating mass patterns of +162 u, the
molecular weight of levoglucosan. A rational mechanism was proposed showing the
oligomerization of levoglucosan by acid-catalyzed cationic ring-opening of
levoglucosan and nucleophilic attack of ROH from levoglucosan on the hemi-acetal
carbon to produce pyranose oligomers (up to 9-mer) through the formation of
glycosidic bonds. Because of the high degree of oxygenated functional groups, the
predicted reaction products are highly polar and therefore, hydrophilic.
In the case of reaction with •OH, a much more complicated oligomer series was
observed, where the mass spectrometric data showed a single mass unit continuum up
to ~ 2000 m/z. A mass intensity period of ~162 u in the spectral data indicated
incorporation of levoglucosan into the oligomer structure. Despite the complicated
baseline, a more intense oligomer series of +162/176 was discernable and increased
in intensity and m/z with time. Mass spectral behavior for both the MALDI-TOF and
85
LDI-TOF mass spectrometric data was interpreted and fundamental •OH chemistry
known to occur with saccharides in aqueous solution111, 126 was proposed to explain
the mass patterns. Single mass unit continuum mass distributions with dominant -2 u
patterns were measured and superimposed by the +162/+176 u oligomer series. The -
2 u pattern was proposed to occur through glucosone formation by hydrogen
abstraction by •OH from any alcoholic carbon to produce a carbon centered radical.
After reaction of the carbon centered radical with O2, a rearrangement occurs creating
a cyclic ketone. This latter oligomer pattern (i.e., +176) was attributed to a Criegee
rearrangement (+14 u) of levoglucosan, initiated by •OH, forming a lactone (176 u).
Further acid-catalyzed reaction of any ROH from levoglucosan (+162 u) forms an
ester through transesterification of the lactone functionality, whereupon propagation
forms polyesters. Supporting data for the acid-catalyzed formation of the saccharidic
C-O-C bridging functionality, and •OH initiated formation of ester and lactone
functionalities was provided by ATR-FTIR spectroscopy.
5.2. General Implications of Experimental Results on Climate Science
Chemical processes such as acid-catalyzed oligomerization/polymerization and
hydroxyl radical reactions could explain, in part, the absence of levoglucosan in
analyzed aerosols known to originate from biomass burning.127 These reaction
products could have significant effects on the lifetime of these oligomer products, the
water solubility of the aged aerosols, and the capacity of the aerosol to act as CCN.
86
Also, the chemical products identified in this work may be useful as secondary tracers
for measurements of the long-distance transport of biomass burning aerosols. A
useful chemical tracer must have significant concentrations and be chemically stable
for the measurement time-period. It is proposed here that the high concentration of
levoglucosan found in biomass burning aerosols may contribute to the potential of
significant amounts of these oligomeric products existing as a stable component of
biomass burning aerosols. Chemical products proposed here may aid the
understanding of the atmospheric processing of biomass burning aerosol parcels,
possibly revealing information such as its age and source.35, 81, 98 Also, identification
of chemical products by proxy experiments are useful to guide analytical strategies in
field investigations where chemical separations are critical for the measurement of a
complex chemical matrix such as biomass burning aerosols.
5.2.1. Application of Experimental Results to Formation Mechanisms of
Humic-Like Substances (HULIS)
Much attention in recent years has been directed to the ill-defined class of water
soluble organic compounds found in atmospheric aerosols known as HULIS. The
interest in HULIS is based on its high water solubility and light absorbing properties,
which could affect an aerosol’s potential as CCN and radiation balance of the Earth,
respectively. There are many proposed mechanisms for the atmospheric formation of
HULIS. Terrestrial lofting of soils128, marine sources129, 130, secondary organic aerosol
formation,83, 131, 132 aqueous chemistry within hydrated aerosol or cloudwater133, and
87
biomass burning processes30,118,134,135 are all proposed as potential sources of HULIS.
Many sources and mechanisms for HULIS formation have been studied.49 Terrestrial
sources are considered a potentially minor source of HULIS because it is found
mostly in fine mode aerosols. Many studies have shown seasonal variations in the
amount of HULIS measured in real samples as well as descriptions of potential
chemistry to form HULIS.124 One study showed an increase in the aromatic
composition of HULIS in autumn samples compared to summertime samples. This
was attributed to the breakdown of lignin from the increased amount of wood burning
during the cooler times of the year.136 Also, studies have shown an aliphatic and
polysaccharidic nature to HULIS.125 Some suggested mechanisms for the formation
of HULIS in biomass burning aerosols include, soil-derived humic matter lofted into
the air due to the burning process, the combustion and subsequent chemical
transformations of cellulose and lignan combustion products emitted directly in
primary aerosols, and finally, condensation and chemical reactions of volatile low
molecular weight combustion products in primary aerosols.118
The chemical processes identified in this dissertation may participate in the
formation of atmospheric HULIS in primary biomass burning aerosols and/or their
aged entities. In alignment with Gelenscer’s mechanism,86 it is proposed here that the
acid-catalyzed oligomerization of levoglucosan may contribute to the secondary
formation of the saccharide chemical character of HULIS within aqueous aerosols
created from biomass burning. Also, an increase in HULIS density with the aging of
biomass burning aerosols has been shown previously and was attributed to an
88
oxidative mechanism,123 which is consistent with the •OH mechanism presented in
this study. These results provide a direct chemical route by which levoglucosan is
chemically processed by atmospheric reactants and possibly incorporated into
chemical structures that represent HULIS.
5.2.2. Broad Scientific Implications of Chemical Research in Biomass Burning
Aerosols
The understanding of fundamental chemical processes that produce chemical
products within biomass burning aerosols may provide important information that can
aid investigators understand how biomass aerosol processes affect global climate.
Especially important is identification of real atmospheric chemical products which
may change aerosol hygroscopity (CCN) and be used as a secondary tracer for
biomass burning aerosol parcels. The fundamental chemical mechanisms that
influence HULIS formation will aid understanding of HULIS’s potential affect on the
CCN capacity and light-absorbing properties of biomass burning aerosols. Such
information is important to advance our understanding of biomass burning aerosol
source, transport, and processing in the atmosphere, which ultimately will add to the
growing knowledge of how these types of aerosols affect global climate.
89
5.3. Suggested Research Directions
Limitations exist when interpreting laboratory proxy experimental data to real
biomass burning aerosols which are complex admixtures under dynamic chemical and
physical conditions. Therefore, further experimentation is necessary to improve
understanding of the chemical behavior of levoglucosan in biomass burning aerosols.
Here, a few basic experiments are proposed.
First, the effect of a range of acidic pH on the reactions of levoglucosan should be
investigated to understand how these acid-catalyzed processes, which are often
reversible, affect removal of levoglucosan from an aqueous system. Monitoring of the
chemical products formed as well as their concentrations will give new information
on the effect of pH on levoglucosan in this system. Direct and quantitative monitoring
of levoglucosan concentration by high performance liquid chromatography (HPLC)
or gas chromatography (GC) is pertinent in understanding its reaction kinetics. This
information will be important in addressing the atmospheric stability of levoglucosan
and therefore its usefulness as a molecular tracer for biomass burning aerosols.
Another suggestion given here is to generate these model levoglucosan aerosols in
a Teflon bag using conditions similar in this dissertation or additional reactants such
as simulated sunlight or NOx to measure products in the aerosol-phase rather than
bulk solution, on a time-scale of minutes to hours. Analysis of the chemical system
may be done by 1) collection of fine mode aerosols on glass fiber filters and
subsequent detection by MALDI mass spectrometry after a filter extraction method
90
91
has been applied, or 2) in-situ measurements by real-time aerosol instruments such as
photo-electron capture and resonance aerosol mass spectrometry (PERCI-AMS).
Most speciation studies of the organic composition of biomass burning aerosols
have focused on relatively simple, lower molecular weight compounds using
conventional analytical methodologies.29, 30, 118 High molecular weight, water soluble
products such as those proposed in this study should help guide the development of
analytical methodologies for field measurement campaigns to target real aerosol-
phase organic compounds that represent the experimentally identified chemical
products or products in the general product class. Where chemical speciation is
possible, this direction could increase the chances of identifying oligomeric products
that may exist in significant concentrations in real biomass burning aerosol samples.
6. Appendix A
6.1. Development and Optimization of the MALDI-TOF-MS Methodology
Major challenges existed when analyzing the acid-catalyzed and Fenton reactions
of levoglucosan discussed in Section 3. The products were hypothesized to be high
molecular weight (>300 u) chemical products with a saccharidic character. The extent
to which levoglucosan reacted under these conditions was initially unknown. It was
possible that the reactions did not form product concentrations necessary for
observation by MALDI-TOF-MS. Another possibility is that a different class of
products had formed that where not compatible with the different experimental
MALDI sample preparation methods. The experimental MALDI sample preparation
conditions that were successful in identifying the hypothesized chemical products
were based on research that showed favorable ionization of oligosaccharide
compounds using DHB as a MALDI matrix with sodium as a cationizing agent.
Ideally for MALDI, the solvent, analyte, matrix and cationization agent should be
co-soluble. Under these conditions, this sample solution was spotted within a sample
well on the stainless steel MALDI plate. This solution was dried under reduced
pressure. By having all the components soluble in the chosen solvent, the analyte,
matrix compound, and cationization agent should co-crystallize during the drying
process. It has been shown in MALDI that, when these constituents co-crystallize,
that ionization is enhanced.
Initial attempts to identify the chemical products used DHB and tetrafluoroacetic
acid as a proton source for positive ionization. Addition of an acid to the
92
analyte/matrix solution is a common method to enhance proton attachment/ionization
of a variety of analytes for detection of positive ions. Sodium chloride was also used
for cationization.
Many solvents were tried using these conditions. Methanol, ethanol, diethyl ether,
ethyl acetate and acetone where used individually to dissolve the reaction products,
DHB, and tetrafluoroacetic acid. For each sample, 10 mg of DHB was dissolved in 1
mL of each of the individual solvents. 1 mg/mL of tetrafluroacetic acid was used for
cationization. DHB was found to have limited solubility in the less polar solvents
(i.e., ethanol, diethyl ether, ethyl acetate). Evidence of this was observed when the
DHB solid was visible after five or more minutes of shaking the solution in the
eppendorf tube. For the concentration used, DHB was completely soluble in methanol
and acetone after vigorous shaking. Levoglucosan reaction product mass signals were
not observed using these conditions. Different matrix compounds, such as α-Cyano-
4-hydroxycinnamic acid (CHCA) and sinapic acid (SA), where also tried using the
discussed solvents and cationization agents without success.
As discussed in the main dissertation (c.f., chapter 3, 4), meaningful results were
identified using 10 mg/mL DHB, and 1 mg/mL sodium chloride in water. Dissolving
the reactions products in Milli-Q water was necessary to observe the MALDI mass
signals. If the DHB and sodium chloride were dissolved with the reaction products in
any other solvent, the mass signals due to these reaction products were not measured.
Optimization of the MALDI matrix conditions were done empirically. As stated in
the main dissertation, the 10x diluted samples gave the best results and therefore this
93
dilution was used to optimize the mass signals. The effects of sodium chloride
concentration were studied by varying the amount of sodium chloride by 0.5 mg/mL
between 0.5 and 2 mg/mL. Using the acid-catalyzed products of levoglucosan
(Reaction B), the mass signal was optimized using 1 mg/mL sodium chloride. Mass
signal suppression was observed above 1 mg/mL sodium chloride. Using the
optimized conditions, the observed mass signal intensity of the acid-catalyzed 2-mer
mass signal (Reaction B) was approximately 20,000 units.
A similar procedure was used to optimize the DHB concentration using 1 mg/mL
sodium chloride in water. By varying the DHB concentration by 5 mg/mL, between 1
and 20 mg/mL, optimized results were observed using 10 mg/mL DHB. Again, mass
signal suppression was observed above this DHB concentration.
The reaction product amounts that were sampled were kept as consistent as possible
by visually scooping the dried powder out of the round bottom flasks after extensive
scraping and mixing. The same amount of reaction products were approximated by
visual inspection and its size was on the order of the size of a 1 microliter drop
spotted on a stainless steel plate. Once on the spatula, the sample was transferred to
an eppendorf tube. In the tube, the sample was moved to the bottom by tapping the
tube on a surface. One microliter of Milli-Q water was added to this sample as in the
main dissertation (c.f. Chapter 3). After mixing 1 microliter of this solution in another
eppendorf tube with 10 mg/mL DHB and 1 mg/mL sodium chloride, 10x and 100x
dilution were made. By sampling the 1x, 10x, and 100x dilutions of the reaction
products in the MALDI-TOF-mass spectrometer, it was empirically determined that
94

95
the 10x diluted samples, no matter what the reaction conditions were, always gave the
best mass signals.
7. References
1. Finlayson-Pitts, B. J., and J. N. Pitts Jr., Chemistry of the Upper and Lower
Atmosphere: Theory, Experiments, and Applications. Elsevier: New York, 2000.
2. Seinfeld, J. H.; Pandis, S. N., Atmospheric Chemistry of Physics: From Air
Pollution to Climate Change. John Wiley and Sons, Inc.: New York, NY, 1998.
3. Hollander, W.; Dunkhorst, W.; Windt, H., Characterization of aerosol
particles by their heterogeneous nucleation: Activity at low supersaturations with
respect to water and various organic vapors. AIP Conference Proceedings 2000, 534,
(Nucleation and Atmospheric Aerosols 2000), 732-735.
4. Rissler, J.; Swietlicki, E.; Zhou, J.; Roberts, G.; Andreae, M. O.; Gatti, L. V.;
Artaxo, P., Physical properties of the sub-micrometer aerosol over the Amazon rain
forest during the wet-to-dry season transition - comparison of modeled and measured
CCN concentrations. Atmospheric Chemistry and Physics 2004, 4, (8), 2119-2143.
5. Lee, Y. S.; Collins, D. R.; Li, R. J.; Bowman, K. P.; Feingold, G., Expected
impact of an aged biomass burning aerosol on cloud condensation nuclei and cloud
droplet concentrations. Journal of Geophysical Research-Atmospheres 2006, 111,
(D22), D22204. doi:10.1029/2005JD006464
6. Roberts, G. C.; Nenes, A.; Seinfeld, J. H.; Andreae, M. O., Impact of biomass
burning on cloud properties in the Amazon Basin. Journal of Geophysical Research-
Atmospheres 2003, 108, (D2), 4062. doi:10.1029/2001JD000985
7. Koren, I.; Kaufman, Y. J.; Remer, L. A.; Martins, J. V., Measurement of the
effect of Amazon smoke on inhibition of cloud formation. Science 2004, 303, (5662),
96
1342-1345.
8. Engardt, M.; Rodhe, H., A comparison between patterns of temperature trends
and sulfate aerosol pollution. Geophysical Research Letters 1993, 20, (2), 117.
9. Mitchell, J. F. B.; Johns, T. C.; Gregory, J. M.; Tett, S. F. B., Climate
response to increasing levels of greenhouse gases and sulfate aerosols. Nature 1995,
376, 501.
10. Santer, B. D.; Taylor, K. E.; Wigley, T. M. L.; Penner, J. E.; Jones, P. D.;
Cubasch, U., Towards the detection and attribution of an anthropogenic effect on
climate. Climate Dynamics 1995, 12, (2), 77.
11. Santer, B. D.; Wigley, T. M. L.; Jones, P. D., Correlation methods in
fingerprint detection studies. Climate Dynamics 1993, 8, (6), 265.
12. Wigley, T. M. L.; Raper, S. C. B., Implications for climate and sea-level of
revised IPCC emissions scenarios. Nature 1992, 357, (6376), 293.
13. Charlson, R. J.; schwartz, S. E.; Hales, J. M.; Cess, R. D.; Coakley, J. A.;
Hansen, J. E.; Hofmann, D. J., Climate forcing by anthropogenic aerosols. Science
1992, 255, (5043), 423.
14. Ramanathan, V.; Crutzen, P. J.; Kiehl, J. T.; Rosenfeld, D., Atmosphere -
Aerosols, climate, and the hydrological cycle. Science 2001, 294, (5549), 2119-2124.
15. Chuang, C. C.; Penner, J. E.; Prospero, J. M.; Grant, K. E.; Rau, G. H.;
Kawamoto, K., Cloud susceptibility and the first aerosol indirect forcing: Sensitivity
to black carbon and aerosol concentrations. Journal of Geophysical Research,
[Atmospheres] 2002, 107, (D21), AAC10/1-AAC10/23.
97
16. Twomey, S., Aerosols, clouds and radiation. Atmospheric Environment Part
A-General Topics 1991, 25, (11), 2435.
17. Haywood, J.; Boucher, O., Estimates of the direct and indirect radiative
forcing due to tropospheric aerosols: a review. Reviews of Geophysics 2000, 38, (4),
513-543.
18. Andrea, M. O., Biogeochemistry of Global Change: Radiatively Active Trace
Gases. Chapman and Hall: New York, 1993.
19. Penner, J. E.; Ghan, S. J.; Walton, J. J., Global Biomass Burning:
Atmospheric, Climatic, and Biospheric Implications. MIT Press: Cambridge, Mass.,
1991; p 432-438.
20. Andreae, M. O., Biomass burning: Its history, use, and distribution and its
impact on environmental quality and global climate. In Global Biomass Burning,
Levine, J. S., Ed. MIT Press: Cambridge, Mass., 1991; pp 3-21.
21. Sjostrom, E., Wood Chemistry: Fundamentals and Application. Academic
Press: 1993.
22. Rowell, R., Chemistry of Solid Wood. American Chemical Society:
Washington, D. C., 1984; p 489-529.
23. Reid, J. S.; Hobbs, P. V., Physical and optical properties of young smoke from
individual biomass fires in Brazil. Journal of Geophysical Research-Atmospheres
1998, 103, (D24), 32013-32030.
24. Kleeman, M. J.; Schauer, J. J.; Cass, G. R., Size and composition distribution
of fine particulate matter emitted from wood burning, meat charbroiling, and
98
cigarettes. Environmental Science & Technology 1999, 33, (20), 3516-3523.
25. Kanakidou, M.; Seinfeld, J. H.; Pandis, S. N.; Barnes, I.; Dentener, F. J.;
Facchini, M. C.; Van Dingenen, R.; Ervens, B.; Nenes, A.; Nielsen, C. J.; Swietlicki,
E.; Putaud, J. P.; Balkanski, Y.; Fuzzi, S.; Horth, J.; Moortgat, G. K.; Winterhalter,
R.; Myhre, C. E. L.; Tsigaridis, K.; Vignati, E.; Stephanou, E. G.; Wilson, J., Organic
aerosol and global climate modeling: a review. Atmospheric Chemistry and Physics
2005, 5, 1053-1123.
26. Pope, C. A. I.; Bates, D. V.; Raizenne, M. E., Health effects of particulate air
pollution: time for reassessment? Environmental Health Perspectives 1995, 103, (5),
103-110.
27. Englert, N., Fine particles and human health - a review of epidemiological
studies. Toxicology Letters 2004, 149, (1-3), 235-242.
28. Lighty, J. S.; Veranth, J. M.; Sarofim, A. F., Combustion aerosols: Factors
governing their size and composition and implications to human health. Journal of
the Air & Waste Management Association 2000, 50, (9), 1565-1618.
29. Hays, M. D., Speciation of gas-phase and fine particle emissions from burning
of foliar fuels. Environmental Science & Technology 2002, 36, (11), 2281-2295.
30. Graham, B.; Mayol-Bracero, O. L.; Guyon, P.; Roberts, G. C.; Decesari, S.;
Facchini, M. C.; Artaxo, P.; Maenhaut, W.; Koll, P.; Andreae, M. O., Water-soluble
organic compounds in biomass burning aerosols over Amazonia 1. Characterization
by NMR and GC-MS. Journal of Geophysical Research-Atmospheres 2002, 107,
(D20), LBA14/1-LBA14/16.
99
31. Jacobson, M. C.; Hansson, H. C.; Noone, K. J.; Charlson, R. J., Organic
atmospheric aerosols: Review and state of the science. Reviews of Geophysics 2000,
38, (2), 267-294.
32. Koll, P.; Borchers, G.; Metzger, J. O., Thermal-degradation of chitin and
cellulose. Journal of Analytical and Applied Pyrolysis 1991, 19, 119-129.
33. Koll, P.; Borchers, G.; Metzger, J. O., Preperative isolation of oligomers with
a terminal anhydrosugar unit by thermal-degradation of chitin and cellulose. Journal
of Analytical and Applied Pyrolysis 1990, 17, (4), 319-327.
34. bin Abas, M. R.; Simoneit, B. R. T.; Elias, V.; Cabral, J. A.; Cardoso, J. N.,
Composition of higher molecular weight organic matter in smoke aerosol from
biomass combustion in Amazonia. Chemosphere 1995, 30, (5), 995-1015.
35. Simoneit, B. R. T.; Schauer, J. J.; Nolte, C. G.; Oros, D. R.; Elias, V. O.;
Fraser, M. P.; Rogge, W. F.; Cass, G. R., Levoglucosan, a tracer for cellulose in
biomass burning and atmospheric particles. Atmospheric Environment 1999, 33, 173-
182.
36. Fang, M.; Zheng, M.; Wang, F.; To, K. L.; Jaafar, A. B.; Tong, S. L., The
solvent-extractable organic compounds in the Indonesia biomass burning aerosols -
characterization studies. Atmospheric Environment 1999, 33, (5), 783-795.
37. Narukawa, M.; Kawamura, K.; Takeuchi, N.; Nakajima, T., Distribution of
dicarboxylic acids and carbon isotopic compositions in aerosols from 1997
Indonesian forest fires. Geophysical Research Letters 1999, 26, (20), 3101-3104.
38. Watson, R. T., Climate Change 2001: Synthesis Report. Cambridge
100
University Press: Cambridge, 2001.
39. Novakov, T.; Corrigan, C. E., Cloud condensation nucleus activity of the
organic component of biomass smoke particles. Geophysical Research Letters 1996,
23, (16), 2141-2144.
40. Yamasoe, M. A.; Artaxo, P.; Miguel, A. H.; Allen, A. G., Chemical
composition of aerosol particles from direct emissions of vegetation fires in the
Amazon Basin: water-soluble species and trace elements. Atmospheric Environment
2000, 34, (10), 1641-1653.
41. Andrea, M. O.; Merlet, P., Emission of trace gases and aerosols from biomass
burning. Global Biogeochemical Cycles 2001, 15, (4). doi: 10.1029/2000GB001382.
42. Chan, M. N.; Choi, M. Y.; Ng, N. L.; Chan, C. K., Hygroscopicity of water-
soluble organic compounds in atmospheric aerosols: amino acids and biomass
burning derived organic species. Environmental Science and Technology 2005, 39,
(6), 1555-1562.
43. Hays, M. D.; Geron, C. D.; Linna, K. J.; Smith, N. D.; Schauer, J. J.,
Speciation of gas-phase and fine particle emissions from burning of foliar fuels.
Environmental Science & Technology 2002, 36, (11), 2281-2295.
44. Cruz, C. N.; Pandis, S. N., A study of the ability of pure secondary organic
aerosol to act as cloud condensation nuclei. Atmospheric Environment 1997, 31, (15),
2205-2214.
45. Corrigan, C. E.; Novakov, T., Cloud condensation nucleus activity of organic
compounds: a laboratory study. Atmospheric Environment 1999, 33, (17), 2661-2668.
101
46. Facchini, M. C.; Mircea, M.; Fuzzi, S.; Charlson, R. J., Cloud albedo
enhancement by surface-active organic solutes in growing droplets. Nature (London)
1999, 401, (6750), 257-259.
47. Facchini, M. C.; Decesari, S.; Mirceaa, M.; Fuzzi, S.; Loglio, G., Surface
tension of atmospheric wet aerosol and cloud/fog droplets in relation to their organic
carbon content and chemical composition. Atmospheric Environment 2000, 34, (28),
4853-4857.
48. Dinar, E.; Taraniuk, I.; Graber, E. R.; Katsman, S.; Moise, T.; Anttila, T.;
Mentel, T. F.; Rudich, Y., Cloud Condensation Nuclei properties of model and
atmospheric HULIS. Atmospheric Chemistry and Physics 2006, 6, 2465-2481.
49. Graber, E. R.; Rudich, Y., Atmospheric HULIS: how humic-like are they? A
comprehensive and critical review. Atmospheric Chemistry and Physics Discussions
2005, 5, 9801-9860.
50. Feng, J. S.; Moller, D., Characterization of water-soluble macromolecular
substances in cloud water. Journal of Atmospheric Chemistry 2004, 48, (3), 217-233.
51. Kiss, G.; Tombacz, E.; Varga, B.; Alsberg, T.; Persson, L., Estimation of the
average molecular weight of humic-like substances isolated from fine atmospheric
aerosol. Atmospheric Environment 2003, 37, (27), 3783-3794.
52. Cappiello, A.; De Simoni, E.; Fiorucci, C.; Mangani, F.; Palma, P.; Trufelli,
H.; Decesari, S.; Facchini, M. C.; Fuzzi, S., Molecular characterization of the water-
soluble organic compounds in fogwater by ESIMS/MS. Environmental Science &
Technology 2003, 37, (7), 1229-1240.
102
53. Krivacsy, Z.; Kiss, G.; Varga, B.; Galambos, I.; Sarvari, Z.; Gelencser, A.;
Molnar, A.; Fuzzi, S.; Facchini, M. C.; Zappoli, S.; Andracchio, A.; Alsberg, T.;
Hansson, H. C.; Persson, L., Study of humic-like substances in fog and interstitial
aerosol by size-exclusion chromatography and capillary electrophoresis. Atmospheric
Environment 2000, 34, (25), 4273-4281.
54. Hoffer, A.; Gelencser, A.; Guyon, P.; Kiss, G.; Schmid, O.; Frank, G. P.;
Artaxo, P.; Andreae, M. O., Optical properties of humic-like substances (HULIS) in
biomass-burning aerosols. Atmospheric Chemistry and Physics 2006, 6, 3563-3570.
55. Reid, J. S., A review of biomass burning emissions part II: intensive physical
properties of biomass burning particles. Atmospheric Chemistry and Physics 2005, 5,
799-825.
56. Hornig, J. F.; Soderberg, R. H.; Barefoot, A. C., III ; Galasyn, J. F., Wood
smoke analysis: vaporization losses of PAH from filters and levoglucosan as a
distinctive marker for wood smoke. In Polynuclear Aromatic Hydrocarbons:
Mechanisms, Methods, and Metabolism, Cooke, M.; Dennis, A. J., Eds. Battelle
Press: Columbus, 1985; pp 561-568.
57. Standley, L. J.; Simoneit, B. R. T., Resin diterpenoids as tracers for biomass
combustion aerosols. Journal of Atmospheric Chemistry 1994, 18, 1-15.
58. Zheng, M.; Wan, T. S. M.; Fang, M.; Wang, F., Characterization of the non-
volatile organic compounds in the aerosols of Hong Kong- Identification, abundance
and origin. Atmospheric Environment 1997, 31, 227-237.
59. Schauer, J. J.; Rogge, W. F.; Hildemann, L. M.; Mazurek, M. A.; Cass, G. R.,
103
Source apportionment of airborne particulate matter using organic compounds as
tracers. Atmospheric Environment 1996, 30, (22), 3837-3855.
60. Shafizadeh, F., The chemistry of pyrolysis and combustion. American
Chemical Society: Washington, D. C., 1984; p 489-529.
61. Egenberg, I. M.; Aasen, J. A. B.; Holtekjolen, A. K.; Lundanes, E.,
Characterisation of traditionally kiln produced pine tar by gas chromatography-mass
spectrometry. Journal of Analytical and Applied Pyrolysis 2002, 62, (1), 143-155.
62. Egenberg, I. M.; Holtekjolen, A. K.; Lundanes, E., Characterisation of
naturally and artificially weathered pine tar coatings by visual assessment and gas
chromatography-mass spectrometry. Journal of Cultural Heritage 2003, 4, (3), 221-
241.
63. Simoneit, B. R. T., Biomass burning- a review of organic tracers for smoke
from incomplete combustion. Applied Geochemistry 2002, 17, 129-162.
64. Elias, V. O., Simoneit, B. R. T., Cordeiro, R. C., and Turcq, B., Evaluating
levoglucosan as an indicator of biomass burning in Carajas, Amazonia: A comparison
to the charcoal record. Geochimica et Cosmochimica Acta 2001, 65, (2), 267-272.
65. Herrmann, H.; Ervens, B.; Jacobi, H. W.; Wolke, R.; Nowacki, P.; Zellner, R.,
CAPRAM2.3: A chemical aqueous phase radical mechanism for tropospheric
chemistry. Journal of Atmospheric Chemistry 2000, 36, (3), 231-284.
66. Ervens, B.; George, C.; Williams, J. E.; Buxton, G. V.; Salmon, G. A.;
Bydder, M.; Wilkinson, F.; Dentener, F.; Mirabel, P.; Wolke, R.; Herrmann, H.,
CAPRAM 2.4 (MODAC mechanism): an extended and condensed tropospheric
104
aqueous phase mechanism and its application. Journal of Geophysical Research,
[Atmospheres] 2003, 108, (D14), AAC12/1-AAC12/21.
67. Koutrakis, P.; Wolfson, J. M.; Spengler, J. D., An Improved Method for
Measuring Aerosol Strong Acidity - Results from a 9-Month Study in St-Louis,
Missouri and Kingston, Tennessee. Atmospheric Environment 1988, 22, (1), 157-162.
68. Lipfert, F. W.; Wyzga, R. E., On the Spatial and Temporal Variability of
Aerosol Acidity and Sulfate Concentration. Journal of the Air & Waste Management
Association 1993, 43, (4), 489-491.
69. Liu, L. J. S.; Burton, R.; Wilson, W. E.; Koutrakis, P., Comparison of aerosol
acidity in urban and semirural environments. Atmospheric Environment 1996, 30, (8),
1237-1245.
70. Ludwig, J.; Klemm, O., Acidity of Size-Fractionated Aerosol-Particles. Water
Air and Soil Pollution 1990, 49, (1-2), 35-50.
71. Atkinson, R.; Arey, J., Gas-phase tropospheric chemistry of biogenic volatile
organic compounds: a review. Atmospheric Environment 2003, 37, S197-S219.
72. Pignatello, J. J.; Oliveros, E.; MacKay, A., Advanced oxidation processes for
organic contaminant destruction based on the Fenton reaction and related chemistry.
Critical Reviews in Environmental Science and Technology 2006, 36, (1), 1-84.
73. Stephens, W. E., A pulsed mass spectrometer with time dispersion. Physical
Review 1946, 69, 691.
74. Zenobi, R.; Knochenmuss, R., Ion formation in MALDI mass spectrometry.
Mass Spectrometry Reviews 1998, 17, (5), 337-366.
105
75. Harvey, D. J.; Rudd, P. M.; Bateman, R. H.; Bordoli, R. S.; Howes, K.;
Hoyes, J. B.; Vickers, R. G., Examination of complex oligosaccharides by matrix-
assisted laser-desorption ionization mass-spectrometry on time-of-flight and
magnetic-sector instruments. Organic Mass Spectrometry 1994, 29, (12), 753-766.
76. Hao, C. Y.; Ma, X. L.; Liu, Z. Q.; Ji, Y. P.; Liu, S. Y.; Liu, C. C.; Sun, Y. X.;
Liu, J. Z., Matrix-assisted laser desorption/ionization mass spectral study of
saccharides. Chemical Journal of Chinese Universities-Chinese 1998, 19, (7), 1090-
1094.
77. Mohr, M. D.; Bornsen, K. O.; Widmer, H. M., Matrix-Assisted Laser-
Desorption Ionization Mass-Spectrometry - Improved Matrix for Oligosaccharides.
Rapid Communications in Mass Spectrometry 1995, 9, (9), 809-814.
78. Brown, R. S., Mass resolution improvement by incorporation of pulsed ion
extraction in a matrix-assisted laser-desorption ionization linear time-of-flight mass
spectrometer. Analytical Chemistry 1995, 67, (13), 1998-2003.
79. Peterson, D. S., Matrix-free methods for laser desorption/ionization mass
spectrometry. Mass Spectrometry Reviews 2007, 26, (1), 19-34.
80. Workman, J. J., Review of process and non-invasive near-infrared and
infrared spectroscopy: 1993-1999. Applied Spectroscopy Reviews 1999, 34, (1-2),
1-89.
81. Holmes, B. J.; Petrucci, G. A., Water-soluble oligomer formation from acid-
catalyzed reactions of levoglucosan in proxies of atmospheric aqueous aerosols.
Environmental Science & Technology 2006, 40, (16), 4983-4989.
106
82. Lelieveld, J.; Dentener, F. J., Hydroxyl radicals maintain the self-cleansing
capacity of the troposphere. Atmospheric Chemistry and Physics Discussions 2004, 4,
3699-3720.
83. Jang, M., Czoschke, N. M., Lee, S., Kamens, R. M., Heterogeneous
atmospheric aerosol production by acid-catalyzed particle-phase reactions. Science
2002, 298, 814-817.
84. Tolocka, M. P. J., M.; Ginter, J. M.; Cox, F. J.; Kames, R. M.; Johnston, M.
V., Formation of Oligomers in Secondary Organic Aerosol. Environmental Science
and Technology 2004, 38, (5), 1428-1434.
85. Kalberer, M., Paulsen, D., Sax, M., et al., Identification of polymers as major
components of atmospheric organic aerosols. Science 2004, 303, 1659-1662.
86. Gelencser, A., et al., In-situ formation of light-absorbing organic matter in
cloud water. Journal of Atmospheric Chemistry 2003, 45, 25-33.
87. Kelly, T. J.; Daum, P. H.; Schwartz, S. E., Measurements of peroxides in
cloudwater and rain. Journal of Geophysical Research-Atmospheres 1985, 90, (D5),
7861-71.
88. Deutsch, F.; Hoffmann, P.; Ortner, H. M., Field experimental investigations
on the Fe(II)- and Fe(III)-content in cloudwater samples. Journal of Atmospheric
Chemistry 2001, 40, (1), 87-105.
89. Kang, S.-F., Liao, C.- H., Chen, M.- C., Pre-oxidation and coagulation of
textile wastewater by the Fenton process. Chemosphere 2002, 46, 923-928.
90. Gao, S.; Hegg, D. A.; Hobbs, P. V.; Kirchstetter, T. W.; Magi, B. I.; Sadilek,
107
M., Water-soluble organic components in aerosols associated with savanna fires in
southern Africa: Identification, evolution, and distribution. Journal of Geophysical
Research-Atmospheres 2003, 108, (D13), 8491. doi:10.1029/2002JD002324
91. Kanazawa, A.; Suzuki, M., Solid-state polycondensation of natural
aldopentoses and 6-deoxyaldohexoses. Facile preparation of highly branched
polysaccharide. Polymer 2006, 47, 176-183.
92. Simoneit, B. R. T.; Elias, V. O.; Kobayashi, M.; Kawamura, K.; Rushdi, A. I.;
Medeiros, P. M.; Rogge, W. F.; Didyk, B. M., Sugars-dominant water-soluble organic
compounds in soils and characterization as tracers in atmospheric particulate matter.
Environmental Science and Technology 2004, 38, (22), 5939-5949.
93. Shafizadeh, F.; Furneauz, R. H.; Cochran, T. G.; Scholl, J. P.; Sakai, Y.,
Production of levoglucosan and glucose from pyrolysis of cellulosic materials.
Journal of Applied Polymer Science 1979, 23, 3525-3539.
94. Shafizadeh, F., and Y. L. Fu, Pyrolysis of cellulose. Carbohydrate Research
1973, 29, 113-122.
95. Shafizadeh, F., and Stevenson, T. T., Saccharification of doublas-fir wood by
a combination of prehydrolysis and pyrolysis. Journal of Applied Polymer Science
1982, 27, 4577-4585.
96. Montaudo, G.; Lattimer, R. P., Mass Spectrometry of Polymers. CRC Press:
Boca Raton, 2002.
97. Solomons, T. W. G., Fryhle, C. B., Organic Chemistry. 8 ed.; John Wiley and
Sons, Inc.: Hoboken, 2004; p 1083-1084.
108
98. Holmes, B. J.; Petrucci, G. A., Oligomerization of levoglucosan by Fenton
chemistry in proxies of biomass burning aerosols Journal of Atmospheric Chemistry
2007. doi: 10.1007/s10874-007-9084-8
99. Rosenorn, T.; Kiss, G.; Bilde, M., Cloud droplet activation of saccharides and
levoglucosan particles. Atmospheric Environment 2006, 40, (10), 1794-1802.
100. Daum, P. H., Observations of hydrogen peroxide and sulfur(IV) in air,
cloudwater, and precipitation and their implications for the reactive scavenging of
sulfur dioxide. Atmospheric Research 1990, 25, (1-3), 89-102.
101. Weinstein-Lloyd, J.; Schwartz, S. E., Low-intensity radiolysis study of free-
radical reactions in cloudwater: hydrogen peroxide production and destruction.
Environmental Science and Technology 1991, 25, (4), 791-800.
102. Arakaki, T.; Anastasio, C.; Shu, P. G.; Faust, B. C., Aqueous-phase
photoproduction of hydrogen peroxide in authentic cloud waters: wavelength
dependence, and the effects of filtration and freeze-thaw cycles. Atmospheric
Environment 1995, 29, (14), 1697-703.
103. Vione, D.; Maurino, V.; Minero, C.; Pelizzetti, E., The atmospheric chemistry
of hydrogen peroxide: A review. Annali Di Chimica 2003, 93, (4), 477-488.
104. Majestic, B. J.; Schauer, J. J.; Shafer, M. M.; Turner, J. R.; Fine, P. M.; Singh,
M.; Sioutas, C., Development of a wet-chemical method for the speciation of iron in
atmospheric aerosols. Environmental Science & Technology 2006, 40, (7), 2346-
2351.
105. Balasubramanian, R.; Victor, T.; Begum, R., Impact of biomass burning on
109
rainwater acidity and composition in Singapore. Journal of Geophysical Research-
Atmospheres 1999, 104, (D21), 26881-26890.
106. Calvert, J. G.; Lazrus, A.; Kok, G. L.; Heikes, B. G.; Walega, J. G.; Lind, J.;
Cantrell, C. A., Chemical mechanisms of acid generation in the troposphere. Nature
1985, 317, (6032), 27-35.
107. Deguillaume, L.; Leriche, M.; Chaurnerliac, N., Impact of radical versus non-
radical pathway in the Fenton chemistry on the iron redox cycle in clouds.
Chemosphere 2005, 60, (5), 718-724.
108. Hoffer, A.; Kiss, G.; Blazso, M.; Gelencser, A., Chemical characterization of
humic-like substances (HULIS) formed from a lignin-type precursor in model cloud
water. Geophysical Research Letters 2004, 31, (6), L06115.
doi:10.1029/2003GL018962
109. Willson, R. L., The reaction of oxygen with radiation-induced free radicals in
DNA and related compounds. International Journal of Radiation Biology 1970, 17,
(4), 349-358.
110. Schuchmann, M. N.; Sonntag, C. V., Radiation chemistry of carbohydrates.
Part 14. Hydroxyl radical induced oxidation of D-glucose in oxygenated aqueous
solutions. Journal of the Chemical Society Perkin Transactions 2 1977, 1958-1963.
111. Manini, P.; La Pietra, P.; Panzella, L.; Napolitano, A.; d'Ischia, M., Glyoxal
formation by Fenton-induced degradation of carbohydrates and related compounds.
Carbohydrate Research 2006, 341, (11), 1828-1833.
112. Schreiber, S. L.; Liew, W. F., Criegee rearrangement of alpha-alkoxy
110
hydroperoxides - A synthesis of esters and lactones that complements the Baeyer-
Villiger oxidation of ketones. Tetrahedron Letters 1983, 24, (23), 2363-2366.
113. Mele, A.; Malpezzi, L., Noncovalent association phenomena of 2,5-
dihydroxybenzoic acid with cyclic and linear oligosaccharides. A matrix-assisted
laser desorption/ionization time-of-flight mass spectrometric and x-ray
crystallographic study. Journal of the American Society for Mass Spectrometry 2000,
11, (3), 228-236.
114. Silverstein, R. M.; Bassler, G. C.; Morrill, T. C., Spectrometric identification
of organic compounds. 5th ed.; John Wiley and Sons, Inc.: New York, 1991.
115. Wang, Y. Q.; Rashidzadeh, H.; Guo, B. C., Structural effects on polyether
cationization by alkali metal ions in matrix-assisted laser desorption/ionization.
Journal of the American Society for Mass Spectrometry 2000, 11, (7), 639-643.
116. Keki, S.; Szilagyi, L. S.; Deak, G.; Zsuga, M., Effects of different alkali metal
ions on the cationization of poly(ethylene glycol)s in matrix-assisted laser
desorption/ionization mass spectrometry: a new selectivity parameter. Journal of
Mass Spectrometry 2002, 37, (10), 1074-1080.
117. Mochida, M.; Kawamura, K., Hygroscopic properties of levoglucosan and
related organic compounds characteristics to biomass burning aerosol particles.
Journal of Geophysical Research, [Atmospheres] 2004, 109, (D21), D21202/1-
D21202/8.
118. Mayol-Bracero, O. L.; Guyon, P.; Graham, B.; Roberts, G.; Andreae, M. O.;
Decesari, S.; Facchini, M. C.; Fuzzi, S.; Artaxo, P., Water-soluble organic
111
compounds in biomass burning aerosols over Amazonia 2. Apportionment of the
chemical composition and importance of the polyacidic fraction. Journal of
Geophysical Research 2002, 107, (D20), 8091. doi:10.1029/2001JD000522
119. Padro, L. T.; Asa-Awuku, A.; Morrison, R.; Nenes, A., Inferring
thermodynamic properties from CCN activation experiments: a) single-component
and binary aerosols. Atmospheric Chemistry and Physics Discussions 2007, 7, 3805–
3836.
120. Badger, C. L.; George, I.; Griffiths, P. T.; Braban, C. F.; Cox, R. A.; Abbatt, J.
P. D., Phase transitions and hygroscopic growth of aerosol particles containing humic
acid and mixtures of humic acid and ammonium sulphate. Atmospheric Chemistry
and Physics 2006, 6, 755-768.
121. Dinar, E.; Taraniuk, I.; Graber, E. R.; Anttila, T.; Mentel, T. F.; Rudich, Y.,
Hygroscopic growth of atmospheric and model humic-like substances. Journal of
Geophysical Research-Atmospheres 2007, 112, (D5), D05211.
122. Chan, M. N.; Chan, C. K., Hygroscopic properties of two model humic-like
substances and their mixtures with inorganics of atmospheric importance.
Environmental Science & Technology 2003, 37, (22), 5109-5115.
123. Dinar, E.; Mentel, T. F.; Rudich, Y., The density of humic acids and humic
like substances (HULIS) from fresh and aged wood burning and pollution aerosol
particles. Atmospheric Chemistry and Physics 2006, 6, 5213-5224.
124. Graber, E. R.; Rudich, Y., Atmospheric HULIS: How humic-like are they? A
comprehensive and critical review. Atmospheric Chemistry and Physics 2006, 6, 729-
112
753.
125. Havers, N.; Burba, P.; Lambert, J.; Klockow, D., Spectroscopic
characterization of humic-like substances in airborne particulate matter. Journal of
Atmospheric Chemistry 1998, 29, (1), 45-54.
126. Schuchmann, M. N.; Von Sonntag, C., Reactions of ozone with D-glucose in
oxygenated aqueous solution - direct action and hydroxyl radical pathway. Aqua
(Oxford) 1989, 38, (5), 311-17.
127. Gao, S.; Hegg, D. A.; Hobbs, P. V.; Kirchstetter, T. W.; Magi, B. I.; Sadilek,
M., Water-soluble organic components in aerosols associated with savanna fires in
southern Africa: Identification, evolution and distribution. J. Geophys. Res. 2003,
108, (D13), 8491.
128. Simoneit, B. R. T., Eolian particulates from oceanic and rural areas – their
lipids fulvic and humic acids and residual carbon. In Advances in Organic
Geochemistry, Douglas, A. G.; Maxwell, J. R., Eds. Pergamon Press: Oxford, 1980;
pp 343-352.
129. Cavalli, F.; Facchini, M. C.; Decesari, S.; Mircea, M.; Emblico, L.; Fuzzi, S.;
Ceburnis, D.; Yoon, Y. J.; O’Dowd, C. D.; Putaud, J. P.; Dell’Acqua, A., Advances in
characterization of sizeresolved organic matter in marine aerosol over the North
Atlantic. Journal of Geophysical Research-Atmospheres 2004, 109.
doi:10.1029/2004JD005137
130. Cini, R.; Innocenti, N. D.; Loglio, G.; Oppo, C.; Orlandi, G.; Stortini, A. M.;
Tesei, U.; Udisti, R., Air-sea exchange: Sea salt and organic micro components in
113
114
Antarctic snow. Internation Journal of Environmental Analytical Chemistry 1996, 63,
15-27.
131. Gelencser, A.; Hoffer, A.; Krivacsy, Z.; Kiss, G.; Molnar, A.; Meszaros, E.,
On the possible origin of humic matter in fine continental aerosol. Journal of
Geophysical Research- Atmospheres 2002, 107, (D12), 4137.
doi:10.1029/2001JD001299
132. Jang, M. C., B.; Chandramouli, B.; Kamens, R. M., Particle growth by acid-
catalyzed heterogeneous reactions of organic carbonyls on preexisting aerosols.
Environmental Science & Technology 2003, 37, (17), 3828-3837.
133. Gelencser, A.; Hoffer, A.; Kiss, G.; Tombacz, E.; Kurdi, R.; Bencze, L., In-
situ formation of light-absorbing organic matter in cloud water. Journal of
Atmospheric Chemistry 2003, 45, (1), 25-33.
134. Mukai, H., and Ambe, Y., Characterization of a humic acid-like brown
substance in airborne particulate matter and tentative identification of its origin. .
Atmospheric Environment 1986, 20, 813-819.
135. Zappoli, S. A., A.; Facchini, M. C.; et al., Inorganic, organic and
macromolecular components of fine aerosol in different areas of Europe in relation to
their water solubility. Atmospheric Environment 1999, 33, 2733-2743.
136. Duarte, R.; Pio, C. A.; Duarte, A. C., Spectroscopic study of the water-soluble
organic matter isolated from atmospheric aerosols collected under different
atmospheric conditions. Analytica Chimica Acta 2005, 530, 7-14.