UNDERGROUND MINING ENGINEERING 38 (2021) 87-100 UDK 62
UNIVERSITY OF BELGRADE - FACULTY OF MINING AND GEOLOGY ISSN 03542904
Review paper
OKINAWA TROUGH GEOPHYSICAL AND TOPOGRAPHIC
MODELING BY GDAL UTILITIES AND GRASS GIS
Polina Lemenkova1
Received: April 1, 2021 Accepted: May 27, 2021
Abstract: This paper presents using GDAL utilities and GRASS GIS for
topographic analysis of the raster grids based on GEBCO DEM as NetCDF file at
15 arc-second intervals. The focus study area encompasses the area around
Okinawa Trough, Ryukyu trench-arc system, southern Japan, East China Sea and
the Philippine Sea, west Pacific Ocean. Several GDAL utilities were applied for
data processing: gdaldem, gdalwarp, gdalinfo, gdal_translate. The data were
imported to GRASS GIS via r.in.gdal. Data visualization highlighted high
resolution and accuracy of GEBCO grid, enabling topographic modelling at the
advanced level. The algorithm of DEM processing, implemented in GDAL utility
gdaldem, was used for generating multi-purpose topographic models: aspect,
hillshade, roughness and topographic indices, such as Topographic Position Index
(TPI), Terrain Ruggedness Index (TRI). Thematic maps (topography, geoid,
marine free-air gravity) were visualized using GRASS GIS modules for raster
(d.rast, r.colors, r.contour) and vector (d.vect, v.in.region, d.legend) data
processing. The results demonstrated smoother bathymetry in the East China Sea
and rugged relief in the Philippine Sea which corresponds to their different
geological and geophysical settings. The presented methodology of the
topographic analysis based on DEM demonstrated technical aspects of GDAL and
GRASS as scripting approach of advanced cartography.
Keywords: Topography, GRASS GIS, GDAL, Roughness, Ruggedness
1 INTRODUCTION
This paper presents application of scripting cartographic methods for topographic data
analysis and modelling by GDAL, Geospatial Data Abstraction Library (GDAL/OGR
contributors, 2020) and open-source GRASS GIS (Neteler, 2001; Neteler and Mitasova,
2008). Automated data processing in geological mapping is presented in the existing
literature (Gruber et al., 2017; Maggiori et al., 2017; Krčmar et al., 2020; Bongiovanni
et al., 2021; Thiele et al., 2021; Arriagada et al., 2021; Balogun et al., 2021). Using
scripts and console based methods in cartography presented a new step in further
developing of cartographic methods and solutions for machine learning and
automatization in GIS. Data processing by GDAL followed by geo-visualization in
1Schmidt Institute of Physics of the Earth, Russian Academy of Sciences. Department of Natural Disasters, Anthropogenic Hazards and Seismicity of the Earth. Laboratory of Regional Geophysics and Natural Disasters
(Nr. 303). Moscow, Russia.
E-mail: [email protected]

88 Lemenkova P.
GRASS GIS, presented in this paper, aimed at topographic modelling for regional
physical geographical analysis in the area of the Okinawa Trough and Ryukyu trench-
arc system. Such methodology has not been qualitatively explored in the existing papers,
despite some thematic overlaps (Ohta et al., 2013; Minami and Ohara, 2020; Arai et al.,
2016a; Minami et al., 2020; Li et al., 20201; Xu and Chen, 2021).
Figure 1 GRASS GIS console (left) and ‘gdalinfo’ GDAL utility (right). Source: author.
The aim of this paper is to perform a topographic analysis of the selected study area by
applying various types of topographic modelling: Topographic Index Ruggedness (TRI),
Topographic Position Index (TPI), roughness, hillshade, slope orientation aspect, as well
as visualizing geoid and gravimetric grids using GDAL utilities (gdaldem,
gdal_translate, gdalwarp, gdal_contour) and GRASS modules (Figure 1).
The study area includes region of southern Japan: Okinawa Trough and Ryukyu trench-
arc system, located between the East China Sea (ECS) and the Philippine Sea, Pacific
Ocean (Ludwig and Murauchi, 1973), 120°–134°Е, 20°–33°N. The area is notable for
the complex topography and variability in the depths: the ECS is shallower comparing
to the Philippine Sea. The Okinawa Trough and Ryukyu trench-arc system, stretching
parallel, are notable for the rugged bathymetry and local spatial variations. Various
factors affect submarine topography, which is reflected by complex structure and local
variations in the marine environment (Lemenkova, 2019) highlighting correlation in a
complexity of geophysical and geological factors: dynamics of the plate tectonics,

Okinawa trough geophysical and topographic modeling… 89
magmatism (Shinjo and Kato, 2000; Kiminami et al., 2017; Guo et al., 2017), seismicity
(Klingelhoefer et al., 2009; Konstantinou et al., 2013), volcanism and sedimentation (Lee
et al., 2004; Huh et al., 2006; Minami and Ohara 2016; Yang et al., 2021), subduction
channel thickness, landforms (Oiwane et al., 2011; Lemenkova 2020a, 2020b), climatic
factors (Hayakawa et al., 2015).
Topography in the region of Okinawa Trough and Ryukyu Trench is uneven due to the
distribution of the three groups of islands on the forearc basement stretching over the
Ryukyu arc (Kizaki, 1986) with Kerama Fault separating southern and central groups of
islands. The seafloor of the ECS is well levelled with the depth ranges mostly at 60÷90
m rarely increasing up to 100÷120 m at the outer edge. In the southeastern part of the
sea, narrow Okinawa Trough basin extends along the Ryukyu Arc, with depths
increasing southwards (800÷2900) m. The Ryukyu Arc stretching parallel to the Ryukyu
Trench and Okinawa Trough (Figure 2) is an arch-shaped gently curved 1000 km long
chain of mountain structure. The surface of the Cenozoic structures of the Ryukyu Arc
stepwise descends to the seafloor. Geomorphic variations differ regionally: gentler in
central and south (40÷50°) at 7 km depth and steeper (70°) at >7 km in the north (Long
and Hilst 2006).
Figure 2 Topographic map of the Okinawa Trough and Ryukyu trench-arc system, based
on GEBCO grid (right). Running commands in a shell terminal of GRASS GIS (left).
Source: author.
Seismic investigations of the Okinawa area shown that sediment thickness is ca. 2-3 km
on the oceanic plate, crust thickness is 5÷6 km. Upper mantle material underlying the
oceanic plate has low seismic velocities, due to the geochemical processes of the mantle
peridotites (Klingelhoefer et al., 2012). Trenches located far away in the ocean have

90 Lemenkova P.
dominating ‘pelagic’ sedimentation type with pyroclastic material coming from the
neighbour island arc (Yap, Palau, Mariana, Tonga), while Ryukyu Trench and Okinawa
Trough located near the shelf areas (ECS) and large islands – ‘terrigenous’ type with
evident sediment filling. In contrast to the ECS, the Philippine Sea, located southwards
from the trench, is marked by a small amount of sediments and deeper bathymetry
(Figure 2).
Topography of the seafloor is affected by the rates of the sedimentation, strength of ocean
currents and lithological composition of the seafloor rocks (Arai et al., 2016b; Maunde
et al., 2021). The sedimentation in the Okinawa region is as follows: in its eastern part,
sediment thickness is 0.3-0.5 km, increasing to 1 km in the northern part, decreases to
0.1-0.2 km in the western part and increases near Taiwan and Ryukyu (Litvin, 1987).
Figure 3 Marine free-air gravity grid (right). GDAL commands in GRASS GIS: ‘gdalwarp’
for reprojecting grid, ‘r.in/gdal’ for data import and visualizing metadata by ‘r.info’ (left).
Source: author
Important factor affecting the topography in the Okinawa region includes geophysical
settings. Thus, regional differences in the magnetic anomalies in the ECS and the
Philippine seas near Okinawa Trough and Ryukyu trench-arc system are caused by
regional variations in the geochemistry and magnetism of the underlying seafloor rocks
and Earth's magnetic field. Linear magnetic anomalies near the Ryukyu Arc are caused
by the Antiklinorium of the alpine arc structures and Precambrian anticlinal structures
on the shelf of the ECS. Philippine Sea is notable for a typical oceanic linear magnetic
field, consistent with the oceanic crust. Regional seismic differences can be illustrated
by waves velocities: granite layer on the shelf 5.8–6.3 km/s, under the Ryukyu Arc –
5.0–6.2 km/s, in the basaltic layer – 6.7–7.2 km/s (Litvin 1987).

Okinawa trough geophysical and topographic modeling… 91
2 METHODOLOGY
GDAL utilities and GRASS GIS commands were applied to the study area for
topographic modelling. The methodology includes following steps. First, the
topographic raster NetCDF file (rt_relief_UTM52.nc) initially in WGS84 geographic
reference coordinate system was warped to UTM proj Zone 56 by GDAL using PROJ
library via ‘gdalwarp’ utility. The file was then imported to the GRASS GIS environment
via (Figure 1, left). The metadata of the output file were checked up by GDAL ‘gdalinfo’
utility (Figure 1, right): longitude of central and prime meridian, spatial reference details,
datum, projection. The same procedure was repeated for other raster grids: geoid
(EGM96) and marine free-air gravity which shows difference between the observed
acceleration of gravity on the Earth's surface and corresponding modelled value
predicted from the Earth's gravity field.
Figure 4 Geoid model for Okinawa region (right). Shell script in Xcode containing GDAL
(utilities: ‘gdal_translate’, ‘gdalinfo’, ‘gdalwarp’) and GRASS GIS commands (left).
Source: author.
The second step consisted in visualization of topography (Figure 2), gravity (Figure 3)
and geoid models (Figure 4, right) on the Okinawa Trough area using scripts containing
sequence of GRASS GIS commands (Figure 4, left). The conceptual approach of
GRASS GIS consists in scripting cartographic modelling which means that the maps is
being built using a sequence of modules used for each element of map and/or algorithms
of data processing. For example, plotting contour lines for gravity map was perform by
code using ‘r.contour’ module: ‘r.contour rt_grav_UTM52 out=GravRT_UTM52
step=30’, where step=30 assigns an interval for isolines and ‘out=GravRT_UTM5’ flag
stands for defining output file.

92 Lemenkova P.
The display of the modelled contour lines was done by GRASS module ‘d.vect’: ‘d.vect
GravRT_UTM52 color='100:93:134' width=0’. Plotting grid of the cartographic lines
was done using ‘d.grid’ module by following code with self-explaining commands:
‘d.grid size=3 color=yellow border_color=yellow width=0.1 fontsize=8 bgcolor=white
text_color=red’. Likewise, other cartographic elements were added stepwise using
GRASS GIS special modules: 'r.colors' to set up colour palette, 'g.region' to select display
coordinate extent of the study area, 'd.rast' to display grids (NetCDF and GeoTIFF),
'd.legend' for plotting legend, 'd.title' for plotting title of the map, 'd.text' for adding text
annotations, 'v.in.region' module was used to plot a border box. The resulting maps
showing topographic and geophysical settings of the study area are shown on Figure 2,
3 and 4.
The next step included topographic modelling using GDAL utility ‘gdaldem’, which was
used for plotting a series of maps for topographic analysis: Figures 5–7 using sequence
of five GDAL commands in a script (Figure 5, left). The mathematical algorithms of the
modelling are based on the existing GDAL technical documentation (GDAL/OGR
contributors, 2020). The aspect map (Figure 5, right) was generated from the DEM in
NetCDF format (rt_relief_UTM52.nc) using gdaldem utility as follows: 'gdaldem aspect
-of GTiff rt_relief_UTM52.nc rt_aspect.tif -trigonometric -zero_for_flat -alg
ZevenbergenThorne'. The input raster was geographically North-oriented (UTM Zone
56). The output map (rt_aspect.tif) is stored as a 32-bit float GeoTIFF raster with
orientation values 0°÷360° indicating azimuth that slopes are facing. Because the
trigonometric angle was used instead of azimuth, the orientations were set up as follows:
0° is an East facing slope, 90° a North facing slope, 180° is a West facing slope and 270°
is South-facing slope, respectively. The flag ‘zero_for_flat ’ assigns ‘zero’ for absolutely
flat areas (slope=0°).
Figure 5 GDAL script: ‘gdaldem’ utility for topographic analysis (left). Aspect map
showing compass orientation (0°– 360°) of the slopes (right). Map: GRASS GIS. Source:
author
Okinawa trough geophysical and topographic modeling… 93
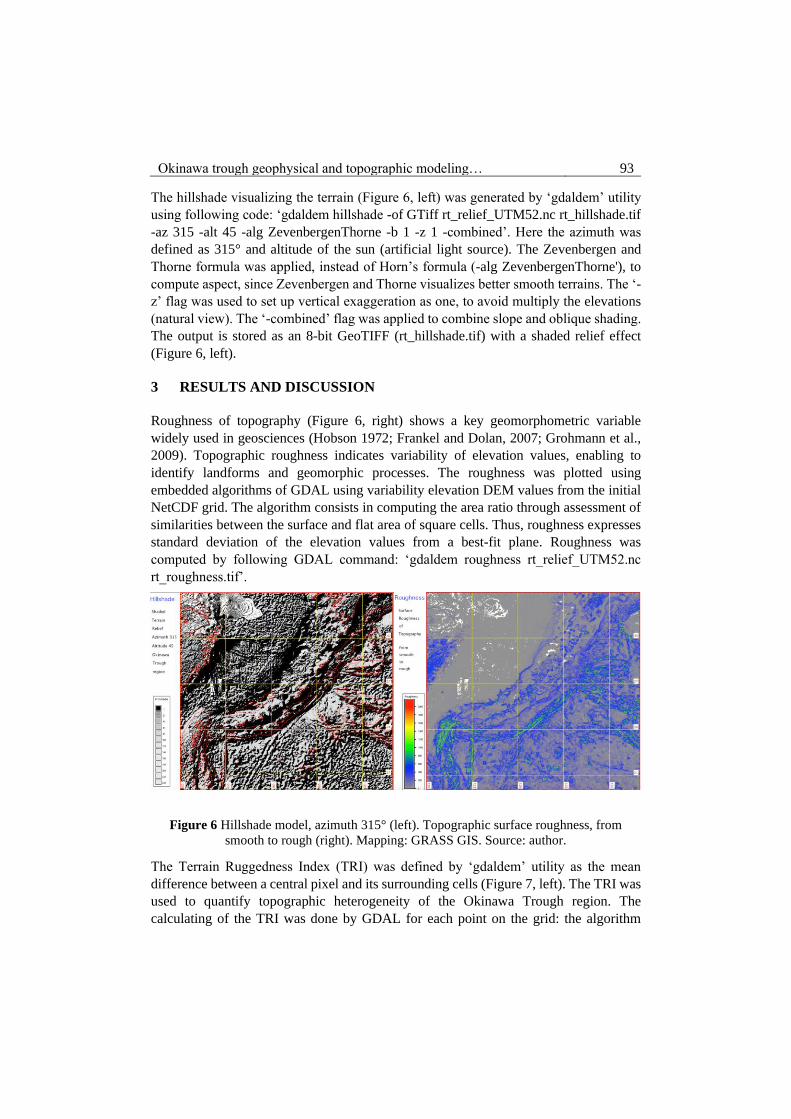
The hillshade visualizing the terrain (Figure 6, left) was generated by ‘gdaldem’ utility
using following code: ‘gdaldem hillshade -of GTiff rt_relief_UTM52.nc rt_hillshade.tif
-az 315 -alt 45 -alg ZevenbergenThorne -b 1 -z 1 -combined’. Here the azimuth was
defined as 315° and altitude of the sun (artificial light source). The Zevenbergen and
Thorne formula was applied, instead of Horn’s formula (-alg ZevenbergenThorne'), to
compute aspect, since Zevenbergen and Thorne visualizes better smooth terrains. The ‘-
z’ flag was used to set up vertical exaggeration as one, to avoid multiply the elevations
(natural view). The ‘-combined’ flag was applied to combine slope and oblique shading.
The output is stored as an 8-bit GeoTIFF (rt_hillshade.tif) with a shaded relief effect
(Figure 6, left).
3 RESULTS AND DISCUSSION
Roughness of topography (Figure 6, right) shows a key geomorphometric variable
widely used in geosciences (Hobson 1972; Frankel and Dolan, 2007; Grohmann et al.,
2009). Topographic roughness indicates variability of elevation values, enabling to
identify landforms and geomorphic processes. The roughness was plotted using
embedded algorithms of GDAL using variability elevation DEM values from the initial
NetCDF grid. The algorithm consists in computing the area ratio through assessment of
similarities between the surface and flat area of square cells. Thus, roughness expresses
standard deviation of the elevation values from a best-fit plane. Roughness was
computed by following GDAL command: ‘gdaldem roughness rt_relief_UTM52.nc
rt_roughness.tif’.
Figure 6 Hillshade model, azimuth 315° (left). Topographic surface roughness, from
smooth to rough (right). Mapping: GRASS GIS. Source: author.
The Terrain Ruggedness Index (TRI) was defined by ‘gdaldem’ utility as the mean
difference between a central pixel and its surrounding cells (Figure 7, left). The TRI was
used to quantify topographic heterogeneity of the Okinawa Trough region. The
calculating of the TRI was done by GDAL for each point on the grid: the algorithm

94 Lemenkova P.
computed average values across all grid cells as an elevation terrain ruggedness of the
surface area. The computation was done using code: ‘gdaldem TRI -compute_edges -of
GTiff rt_relief_UTM52.nc rt_TRI.tif’. Here the ‘-compute_edges’ flag was used to
compute cells at raster edges and 'near-nodata' values. The output map is presented on
Figure 7 (left). As can be seen, the most rugged areas (TRI 500÷725) are coloured dark
brown and correspond to the mountainous areas and deep-sea Ryukyu Trench. The TRI
of 275÷325, yellow-coloured areas, correspond to the moderate ruggedness, and the
lowest values (TRI 0÷50) are notable for the near-flat well-levelled areas of the seafloor
(well seen for the ECS seafloor, while more rugged for the Philippine Sea seafloor with
TRI 50÷275).
The Topographic Position Index (TPI) is computed using DEM elevation values. The
concept is based on the comparison of the elevation of each cell to a mean elevation of
a neighbour cell. The TPI was generated using following GRASS GIS code: ‘gdaldem
TPI -compute_edges -of GTiff rt_relief_UTM52.nc rt_TPI.tif’. The output map shows
TPI for the Okinawa area (Figure 7, right).
Figure 7 Terrain Ruggedness Index (left). Topographic Position Index (right). Source:
author.
Positive TPI values (Figure 7, right, green to brown colours) show locations higher than
the average of the nearby area. Vice versa, negative TPI values (Figure 7, right, blue to
black colours) represent locations lower than the surroundings. The TPI values near zero
are flat areas (the slope is almost zero) or areas of constant slope. As can be seen, the
zero TPI values (light blue colours) are characteristics for the most of the seafloor,
negative TPI – for the deep-sea trenches and troughs (Ryukyu Trench, Okinawa Trough)
and positive TPI are noticeable for the terrestrial areas. High TPIs can be noticed on the
Taiwan Island (brown colours) and around the Ryukyu Arc.

Okinawa trough geophysical and topographic modeling… 95
4 CONCLUSIONS
GDAL and GRASS GIS scripting techniques in cartography demonstrated in this
research presents a new step in cartographic development with an accent on machine
learning and application of advanced scripting and coding in GIS. Applications of GIS
in geoscience are diverse and well known: ArcGIS and QGIS (Klaučo et al., 2013, 2017;
Jamieson and Stewart, 2021; Tsunogai et al., 2002; Ruan et al., 2020; Fang et al., 2020;
Subarno et al., 2016), GMT. However, the use of big data and advanced programming
tools in geoscience (Lemenkov and Lemenkova, 2021) requires use of console-based
data processing rather than GUI.
Using advanced methods for topographic modelling and analysis is important method in
geographic studies. Geographical processes acting on landscapes are highly correlated
with topographic variables, such as surface roughness, hilltop, slope degree and
steepness, aspect compass orientation, valley bottom, seafloor relief of the submarine
landscapes, ridges, plains, upper or lower topographic slope, etc. Topographic
derivatives (slope angle, curvature, aspect) are computed for landslide analysis.
Applying various approaches for calculations of roughness, TPI, TRI, visualizing hill
shade and aspect is important features of GIS. GDAL and GRASS GIS techniques
provide methods for raster data processing at the advanced level. This paper contributed
to the technical methods in cartography with particular application to the ocean studies.
ACKNOWLEDGMENTS
This research has been implemented into the framework of the project No. 0144-2019-
0011, Schmidt Institute of Physics of the Earth, Russian Academy of Sciences. The
author thanks the reviewers and editor for the review and editing of this manuscript.
REFERENCES
ARAI R. et al. (2016a) Structure of the tsunamigenic plate boundary and low-frequency
earthquakes in the southern Ryukyu Trench. Nature Communications, 7(12255) pp. 1-7.
https://doi.org/10.1038/ncomms12255
ARAI, K. et al. (2016b). A newly discovered submerged reef on the Miyako-Sone
platform, Ryukyu Island Arc, Northwestern Pacific. Marine Geology, 373, pp. 49-54.
https://doi.org/10.1016/j.margeo.2016.01.007
ARRIAGADA, P., KARELOVIC, B. and LINK, O. (2021) Automatic gap-filling of
daily streamflow time series in data-scarce regions using a machine learning algorithm.
Journal of Hydrology, 598, pp. 126454. https://doi.org/10.1016/j.jhydrol.2021.126454
BALOGUN, A.-L. et al. (2021) Spatial prediction of landslide susceptibility in western
Serbia using hybrid support vector regression (SVR) with GWO, BAT and COA

96 Lemenkova P.
algorithms. Geoscience Frontiers, 12(3), 101104, pp. 1-15.
https://doi.org/10.1016/j.gsf.2020.10.009
BEMIS, S.P. et al. (2014) Ground-based and UAV-Based photogrammetry: A multi-
scale, high-resolution mapping tool for structural geology and paleoseismology. Journal
of Structural Geology, 69, pp. 163-178, https://doi.org/10.1016/j.jsg.2014.10.007
BONGIOVANNI, C., STEWART, H.A. and JAMIESON, A.J. (2021). High-resolution
multibeam sonar bathymetry of the deepest place in each ocean. Geoscience Data
Journal, 00, pp. 1–16. https://doi.org/10.1002/gdj3.122
FANG, Z., JIANG, G., XU, C. and WANG, S. (2020) A tectonic geodesy mapping
software based on QGIS. Geodesy and Geodynamics, 11(1), pp. 31-39.
https://doi.org/10.1016/j.geog.2019.08.001
FRANKEL, K.L. and DOLAN, J.F. (2007) Characterizing arid region alluvial fan
surface roughness with airborne laser swath mapping digital topographic data. Journal
of Geophysical Research (Earth Surface), 112, pp. F02025.
https://doi.org/10.1029/2006JF000644
GDAL/OGR contributors (2020). GDAL/OGR Geospatial Data Abstraction software
Library. Open Source Geospatial Foundation. https://gdal.org [accessed: 01 April 2021].
GROHMANN, C.H., SMITH, M.J. and RICCOMINI, C. (2009) Surface Roughness of
Topography: A Multi-Scale Analysis of Landform Elements in Midland Valley,
Scotland. In: Proc. Geomorphometry 2009. Zurich, Switzerland, 31.08–2.09.2009, pp.
140–148. https://doi.org/10.1109/TGRS.2010.2053546
GRUBER, F. E. BARUCK, J. and GEITNER, C. (2017) Algorithms vs. surveyors: A
comparison of automated landform delineations and surveyed topographic positions
from soil mapping in an Alpine environment. Geoderma, 308, pp. 9-25.
https://doi.org/10.1016/j.geoderma.2017.08.017
GUO, K. et al. (2017) The influence of a subduction component on magmatism in the
Okinawa Trough: Evidence from thorium and related trace element ratios. Journal of
Asian Earth Sciences, 145, Part A, pp. 205-216.
https://doi.org/10.1016/j.jseaes.2017.05.033
HAYAKAWA, Y. S. et al. (2015). Geomorphic imprints of repeated tsunami waves in a
coastal valley in northeastern Japan. Geomorphology, 242, pp. 3-10.
https://doi.org/10.1016/j.geomorph.2015.02.034
HOBSON, R.D. (1972) Surface roughness in topography: quantitative approach. In:
Chorley, R. J., editor, Spatial analysis in geomorphology, Methuer, London. pp. 225–
245.

Okinawa trough geophysical and topographic modeling… 97
HUH, C.-A., et al. (2006) Sedimentation in the Southern Okinawa Trough — Rates,
turbidites and a sediment budget. Marine Geology, 231(1–4), pp. 129-139.
https://doi.org/10.1016/j.margeo.2006.05.009
JAMIESON, A.J. and STEWART, H.A. (2021) Hadal zones of the Northwest Pacific
Ocean. Progress in Oceanography, 190, pp. 102477.
https://doi.org/10.1016/j.pocean.2020.102477
KIMINAMI, K. et al. (2017) Tectonic implications of Early Miocene OIB magmatism
in a near-trench setting: The Outer Zone of SW Japan and the northernmost Ryukyu
Islands. Journal of Asian Earth Sciences, 135, pp. 291–302.
https://doi.org/10.1016/j.jseaes.2016.12.033
KIZAKI, K. (1986). Geology and tectonics of the Ryukyu Island. Tectonophysics, 125,
pp. 193–207. https://doi.org/10.1016/0040-1951(86)90014-4
KLAUČO, M., et al. (2013) Determination of ecological significance based on
geostatistical assessment: a case study from the Slovak Natura 2000 protected area.
Central European Journal of Geosciences, 5(1), pp. 28–42.
https://doi.org/10.2478/s13533-012-0120-0
KLAUČO, M., et al. (2017) Land planning as a support for sustainable development
based on tourism: A case study of Slovak Rural Region. Environmental Engineering and
Management Journal, 2(16), pp. 449–458. https://doi.org/10.30638/eemj.2017.045
KLINGELHOEFER, F., LEE, C.-S., LIN, J.-Y. and SIBUET, J.-C. (2009) Structure of
the southernmost Okinawa Trough from reflection and wide-angle seismic data.
Tectonophysics, 466(3–4), pp. 281-288. https://doi.org/10.1016/j.tecto.2007.11.031
KLINGELHOEFER, F. et al. (2012) P-wave velocity structure of the southern Ryukyu
margin east of Taiwan: Results from the ACTS wide-angle seismic experiment.
Tectonophysics, 578, pp. 50–62. https://doi.org/10.1016/j.tecto.2011.10.010
KONSTANTINOU, K.I., PAN, C.-Y. and LIN, C.-H. (2013) Microearthquake activity
around Kueishantao island, offshore northeastern Taiwan: Insights into the volcano–
tectonic interactions at the tip of the southern Okinawa Trough. Tectonophysics, 593, pp.
20-32. https://doi.org/10.1016/j.tecto.2013.02.019
KRČMAR, D. et al. (2020) Multicriteria to estimate the environmental risk of sediment
from the Obedska Bog (Northern Serbia), a reservation area on UNESCO's list.
International Journal of Sediment Research, 35(5), pp. 527-539.
https://doi.org/10.1016/j.ijsrc.2020.03.013
LEE, S.-Y., HUH, C.-A., SU, C.-C. and YOU, C.-F. (2004) Sedimentation in the
Southern Okinawa Trough: enhanced particle scavenging and teleconnection between
the Equatorial Pacific and western Pacific margins. Deep Sea Research Part I:

98 Lemenkova P.
Oceanographic Research Papers, 51(11), pp. 1769-1780.
https://doi.org/10.1016/j.dsr.2004.07.008
LEMENKOVA, P. (2020a). NOAA Marine Geophysical Data and a GEBCO Grid for
the Topographical Analysis of Japanese Archipelago by Means of GRASS GIS and
GDAL Library. Geomatics and Environmental Engineering, 14(4), pp. 25–45.
https://doi.org/10.7494/geom.2020.14.4.25
LEMENKOVA, P. (2020b) Using GMT for 2D and 3D Modeling of the Ryukyu Trench
Topography, Pacific Ocean. Miscellanea Geographica, 25(3), pp. 1–13.
https://doi.org/10.2478/mgrsd-2020-0038
LEMENKOVA, P. (2019) Statistical Analysis of the Mariana Trench Geomorphology
Using R Programming Language. Geodesy and Cartography, 45(2), pp. 57–84.
https://doi.org/10.3846/gac.2019.3785
LI, X. et al. (2021) Geochemical and lead isotope compositions of olivine-hosted melt
inclusions from the Yaeyama Graben in the southern Okinawa Trough: Implications for
slab subduction and magmatic processes. Lithos, 398–399, pp. 106263.
https://doi.org/10.1016/j.lithos.2021.106263
LONG, M.D. and VAN DER HILST R.D. (2006) Shear wave splitting from local events
beneath the Ryukyu arc: Trench-parallel anisotropy in the mantle wedge. Physics of the
Earth and Planetary Interiors, 155, pp. 300–312.
https://doi.org/10.1016/j.pepi.2006.01.003
LUDWIG, W. J. et al. (1973) Structure of East China Sea‐West Philippine Sea Margin
off southern Kyushu, Japan'. Journal of Geophysical Research, 78(14), pp. 2526–2536.
https://doi.org/10.1029/JB078i014p02526
MAGGIORI, E., CHARPIAT, G., TARABALKA, Y. and ALLIEZ, P. (2017). Recurrent
Neural Networks to Correct Satellite Image Classification Maps. IEEE Transactions on
Geoscience and Remote Sensing, 55(9), pp. 4962-4971.
https://doi.org/10.1109/TGRS.2017.2697453
MAUNDE, A., ALVES, T.M. and MOORE, G.F. (2021) Shallow fault systems of thrust
anticlines responding to changes in accretionary prism lithology (Nankai, SE Japan.
Tectonophysics, 812, pp. 228888. https://doi.org/10.1016/j.tecto.2021.228888
MINAMI, H. and OHARA, Y. (2016) Detailed morphology and bubble plumes of
Daiichi-Amami Knoll in the central Ryukyu Arc. Marine Geology, 373, pp. 55–63.
https://doi.org/10.1016/j.margeo.2016.01.008
MINAMI, H. and OHARA, Y. (2020) Tectonic, volcanic and hydrothermal features of
a nascent rift graben in the southern Okinawa Trough. Marine Geology, 430, pp. 106348.
https://doi.org/10.1016/j.margeo.2020.106348

Okinawa trough geophysical and topographic modeling… 99
MINAMI, H., NAGASAWA, R. and OHARA, Y. (2020) Detailed volcanic and tectonic
morphology of Nakadomari Hill in the southern Okinawa Trough. Marine Geology, 421,
pp. 106094. https://doi.org/10.1016/j.margeo.2019.106094
NETELER, M. (2001) Towards a stable Open Source GIS: Status and Future Directions
in GRASS Development. In: The Geomatics Workbook Polytecnico di Milano, Italy, 2nd
ed.
NETELER, M. and MITASOVA, H. (2008) Open Source GIS. A GRASS GIS Approach.
Springer. https://doi.org/10.1007/978-0-387-68574-8
OHTA, A., IMAI, N., TERASHIMA, S., TACHIBANA, Y. and IKEHARA, K. (2013)
Regional spatial distribution of multiple elements in the surface sediments of the eastern
Tsushima Strait (southwestern Sea of Japan). Applied Geochemistry, 37, pp. 43-56.
https://doi.org/10.1016/j.apgeochem.2013.06.010
OIWANE, H. et al. (2011) Geomorphological development of the Goto Submarine
Canyon, northeastern East China Sea. Marine Geology, 288(1–4), pp. 49-60.
https://doi.org/10.1016/j.margeo.2011.06.013
RUAN, X. et al. (2020). A new digital bathymetric model of the South China Sea based
on the subregional fusion of seven global seafloor topography products. Geomorphology,
370, pp. 107403. https://doi.org/10.1016/j.geomorph.2020.107403
SHINJO, R. and KATO, Y. (2000) Geochemical constraints on the origin of bimodal
magmatism at the Okinawa Trough, an incipient back-arc basin. Lithos, 54(3–4), pp.
117-137. https://doi.org/10.1016/S0024-4937(00)00034-7
SUBARNO, T., SIREGAR, V.P., AGUS, S.B. and SUNUDDIN, A. (2016) Modelling
Complex Terrain of Reef Geomorphological Structures in Harapan-kelapa Island,
Kepulauan Seribu. Procedia Environmental Sciences, 33, pp. 478-486.
https://doi.org/10.1016/j.proenv.2016.03.100
THIELE, S.T. et al. (2021) Multi-scale, multi-sensor data integration for automated 3-D
geological mapping. Ore Geology Reviews, 136, pp. 104252.
https://doi.org/10.1016/j.oregeorev.2021.104252
TSUNOGAI, U., YOSHIDA, N. and GAMO, T. (2002) Carbon isotopic evidence of
methane oxidation through sulfate reduction in sediment beneath cold seep vents on the
seafloor at Nankai Trough. Marine Geology, 187(1–2), pp. 145-160.
https://doi.org/10.1016/S0025-3227(02)00263-3
XU, G. and CHEN, Z. (2021) Spatial variations of effective elastic thickness of the
lithosphere in the Okinawa Trough. Journal of Asian Earth Sciences, 209, pp. 104670.
https://doi.org/10.1016/j.jseaes.2021.104670

100 Lemenkova P.
YANG, B. et al. (2021) Mineralogical and geochemical characteristics and ore-forming
mechanism of hydrothermal sediments in the middle and southern Okinawa Trough.
Marine Geology, 437, pp. 106501. https://doi.org/10.1016/j.margeo.2021.106501