University of Wollongong University of Wollongong
Research Online Research Online
University of Wollongong Thesis Collection 2017+ University of Wollongong Thesis Collections
2020
Next Generation Inorganic Nanomaterials for Sunscreening Applications Next Generation Inorganic Nanomaterials for Sunscreening Applications
Alexander Morlando
Follow this and additional works at: https://ro.uow.edu.au/theses1
University of Wollongong University of Wollongong
Copyright Warning Copyright Warning
You may print or download ONE copy of this document for the purpose of your own research or study. The University
does not authorise you to copy, communicate or otherwise make available electronically to any other person any
copyright material contained on this site.
You are reminded of the following: This work is copyright. Apart from any use permitted under the Copyright Act
1968, no part of this work may be reproduced by any process, nor may any other exclusive right be exercised,
without the permission of the author. Copyright owners are entitled to take legal action against persons who infringe
their copyright. A reproduction of material that is protected by copyright may be a copyright infringement. A court
may impose penalties and award damages in relation to offences and infringements relating to copyright material.
Higher penalties may apply, and higher damages may be awarded, for offences and infringements involving the
conversion of material into digital or electronic form.
Unless otherwise indicated, the views expressed in this thesis are those of the author and do not necessarily Unless otherwise indicated, the views expressed in this thesis are those of the author and do not necessarily
represent the views of the University of Wollongong. represent the views of the University of Wollongong.
Research Online is the open access institutional repository for the University of Wollongong. For further information contact the UOW Library: [email protected]
Next Generation Inorganic Nanomaterials forSunscreening Applications
Alexander Morlando
This thesis is presented as required for the conferral of the degree:
Doctor of Philosophy
Supervisor:Assoc. Prof. Konstantin Konstantinov
Co-supervisors:Prof. Ronald Sluyter, Dr. Vitor Sencadas & Dr. Shahnaz Bakand
The University of WollongongInstitute for Superconducting and Electronic Materials
May 7, 2020

This work © copyright by Alexander Morlando, 2020. All Rights Reserved.
No part of this work may be reproduced, stored in a retrieval system, transmitted, in any form or by anymeans, electronic, mechanical, photocopying, recording, or otherwise, without the prior permission of theauthor or the University of Wollongong.
This research has been conducted with the support of an Australian Government Research TrainingProgram Scholarship.

Declaration
I, Alexander Morlando, declare that this thesis is submitted in fulfilment of the require-ments for the conferral of the degree Doctor of Philosophy, from the University of Wol-longong, is wholly my own work unless otherwise referenced or acknowledged. This doc-ument has not been submitted for qualifications at any other academic institution.
Alexander Morlando
May 7, 2020
Publications
The following publications resulted directly from this thesis work:
1. Morlando.A, Cardillo.D, Sencadas.V and Konstantinov.K, Suppression of the pho-
tocatalytic activity of TiO2 nanoparticles encapsulated by chitosan through a spray-
drying method with potential for use in sunblocking applications, Powder Technol-
ogy, 2018, 329, 252-259
2. Morlando.A, Borras.M.C, Rehman.Y, Bakand.S, Barker.P, Sluyter.R, Konstantinov.K,
Development of CeO2 nanodot encrusted TiO2 nanoparticles with reduced photo-
catalytic activity and increased biocompatibility towards a human keratinocyte cell
line, Journal of Materials Chemistry B, 2020
3. Morlando.A, McNamara.J, Rehman.Y, Sencadas.V, Barker.P, Konstantinov.K, Hy-
drothermal synthesis of rutile TiO2 nanorods and their decoration with CeO2 nanopar-
ticles as low-photocatalytic active ingredients in UV filtering applications, Journal
of Materials Science, 2020, 55, 8095-8108
The following publications resulted from direct involvement by the author of this thesis
work:
1. Chao.Y, Wang.K, Jalili.R, Morlando.A, Qin.C, Vijayakumar.A, Wang.C, Wallace.G.G,
Scalable Solution Processing MoS2 Powders with Liquid Crystalline Graphene Ox-
ide for Flexible Freestanding Films with High Areal Lithium Storage Capacity, ACS
Applied Materials & Interfaces, 2019, 11, 46746-46755
2. Mueen. R, Morlando.A, Qutaish.H, Lerch.M, Cheng.Z, Konstantinov.K, ZnO/CeO2
nanocomposite with low photocatalytic activity as efficient UV filters, Journal of
iv

v
Materials Science, 2020, 1-14
Abstract
The study of nanomaterials is an area of extensive research due to the size and shape de-
pendent properties that arise as a result of confinement to the 1 - 100 nm scale. Materials
at this scale exhibit new properties that are neither those of the corresponding bulk or in-
dividual molecules making up the material. One reason for this is thought to be due to the
fact that, at this scale, many of the atoms making up the material lie at its surface, and so,
an interface between the material and its surroundings is formed that it is not observed in
the corresponding bulk or individual atoms of the material. This can lead to the generation
of new or improved physical, chemical, magnetic and biological properties in nanomate-
rials compared to their larger scale counterparts. Implementation of nanomaterials, such
as nanoparticles, into consumer products have also been shown to have a positive impact
on the quality life of the general public. One such example of this is the application of
inorganic metal oxide nanoparticles in therapeutic sunscreen products. Sunscreens con-
taining these nanoparticles, namely titanium dioxide (TiO2) and zinc oxide (ZnO), protect
the skin from harmful solar ultraviolet (UV) radiation and thus contribute to the preven-
tion of erythema (sunburn), immunosuppression, premature skin ageing and skin cancer.
The size reduction of these materials to the nanoscale has been shown to improve their
optical UV absorbance properties and increase transparency of formulations containing
these nanomaterials in comparison to their microsized or bulk counterparts. However, as a
consequence of this nano-phenomenon, the photocatalytic potential of these nanoparticles
is also exponentially increased. Like a double-edged sword, absorption of UV radiation
by these nanoparticles can also lead to the generation of reactive free radical species,
which have the capacity to degrade other organic components in a sunscreen formulation.
vi
vii
The ability for these sunscreen based nanoparticles to generate free radicals is also of
concern if they make contact with viable cells within the skin after topical application.
Generation of free radical species within cells can result in a state of oxidative stress, a
condition that has been implicated in a number of physiological and neurological diseases
as well as cancer development. Although a significant number of studies have suggested
these particle remain on the surface of the skin, inconsistencies in some results and dis-
crepancies in the sampling methodologies used have still left the scientific community,
and the general public, divided on the continued safe use of these nanoparticles. In-
vestigations into alternative inorganic UV filters with complementary properties to those
currently used but without the potential toxicological effects has yielded a limited number
of candidate materials. More extensive research has focussed on methods for minimizing
or removing the free radical generating potential of TiO2 and ZnO and comprise ma-
nipulation of the phase composition, particle morphology and surface chemistry. In this
thesis work, we investigate different potential coating materials for TiO2 based nanoma-
terials and assess their suitability based on their impact towards UV light absorption and
photocatalytic/phototoxic potential in hopes of improving the safety of sunscreen based
inorganic UV filters.
The first work of this thesis investigated the physical, optical and photocatalytic prop-
erties of a chitosan/TiO2 nanocomposite material. The nanocomposites were produced
via a spray-drying method, in a single step, directly through an aqueous solution for the
purpose of reducing the photocatalytic activity of commercially available TiO2 nanopar-
ticles. The photocatalytic activity of the nanocomposite materials were assessed using the
organic dye, crystal violet, as the degradation target and irradiating in a photochemical
reactor under UV light irradiation. It was found that the photoactivity of the chitosan
encapsulated nanoparticles was greatly reduced compared to that of the pristine TiO2
nanoparticles, from 95% degradation after 120 min of irradiation for pristine TiO2 to 40%
for the chitosan/TiO2 spray-dried particles. Thus, the work demonstrated the potential for
this simple coating process and chitosan material for application as an inactive protective
coating for sunblocking applications.

viii
The next body of work explored the deposition of cerium dioxide (CeO2) nanodots onto
commercial TiO2 nanoparticles. CeO2 nanoparticles have been demonstrated to display
biocompatible properties and antioxidant activity due to redox cycling of the Ce3+/Ce4+
oxidation states. In this work, CeO2/TiO2 nanocomposites were prepared through a stan-
dard precipitation method at atomic concentrations (at%) of Ce relative to Ti of 2.5, 5 and
10 at%, with the aim of reducing the photocatalytic activity of the core TiO2 nanoparti-
cles and improve biocompatibility. The UV absorptive properties of the nanocomposite
samples revealed excellent absorbance across the UV region as compared to pristine TiO2
and CeO2. Furthermore, a drastic reduction in the photocatalysed decomposition of crys-
tal violet, when in the presence of the nanocomposite samples, under both UV and solar
simulated light was observed compared to the highly photoactive pristine TiO2. An opti-
mal CeO2 nanodot loading, displaying both high UV attenuation and low photocatalytic
performance was determined around 5 at% and further in vitro biological testing revealed
minimal impact on the cell viability of the human keratinocyte cell line (HaCaT) over a
24 hr period with and without prior exposure to UV irradiation. In contrast, pristine TiO2
nanoparticles induced toxicity to HaCaT cells with prior UV exposure before incubation,
particularly at a dosage of 100 mg L−1. Thus, the work has demonstrated the effectiveness
of CeO2 nanodots in improving biocompatibility and its potential as a coating material for
active inorganic UV filters.
The final work explored the synthesis of low photocatalytic rutile TiO2 nanoparticles and
the deposition of CeO2 nanodots at their surface. Using a hydrothermal synthesis method,
the effects of reaction temperature and nitric acid HNO3 concentration on the crystal
phase, composition and morphology were explored to assess the most suitable conditions
for reproduction. Optimal reaction conditions for obtaining purely rutile TiO2 nanorods
occurred when treating the TiO2 precursor at 150oC for 24 hr in 16 M nitric acid. Here,
these rutile nanorods were decorated with CeO2, as a means of producing a material
with high UV attenuation and low photocatalytic activity. The nanocomposite sample
displayed selective UV absorption whilst also demonstrating a reduction in photocatalytic
activity compared to bare rutile TiO2 nanorods of up to 88% and 77% when exposed to

ix
UV and solar simulated light. The results obtained were significant as they would suggest
that CeO2/rutile TiO2 could be safely applied as an active inorganic UV filter in sunscreen
products.
Acknowledgments
I would like to acknowledge the support provided by various parties in aiding and shaping
the thesis presented.
First, I would like to acknowledge that the research conducted and presented in thesis
was supported by the Australian Government Research Training Program Scholarship.
Furthermore, I would like to thank the University of Wollongong, the Australian Insti-
tute for Innovative Materials (AIIM), the Institute for Superconducting and Electronic
Materials (ISEM), the Electron Microscopy Centre (EMC), the Intelligent Polymer Re-
search Institute (IPRI) and the Illawarra Health and Medical Research Institute (IHMRI)
for providing me with the opportunity and the facilities to conduct the research presented
here. Special thanks is also given to the various technical and administrative support staff
at these institutes for their efforts in ensuring availability of facilities equipment, advice
and aid in administrative processes. This includes Dr. Germanas Peleckis, Dr. Jonathan
Knott, Dr. Dongqi Shi, Prof. Xiaolin Wang and Crystal Mahfouz of ISEM; Dr. Patri-
cia Hayes and Dr. Andrew Nattestad of IPRI; Joanne George, Candace Gabelish, Naomi
Davis, Narelle Badger, Paul Hammersly, Robert Morgan and Mat Davies of AIIM and
the AIIM facilities workshop; Dr. Gilberto Casillas-Garcia, Dr. Mitchell Nancarrow, Dr.
David Mitchell and Tony Romeo of the EMC and the technical support staff of IHMRI
including Katie Cicero, Tanya Levchenko and Clare Atkinson.
I would like to also thank my fellow students, past and present, for all their guidance,
support and advice throughout my PhD. Thank you Dr. Dean Cardillo, Dr. Kathrin Bo-
gusz, Dr. M.D. Monirul Islam, Nai-sheng Hsu, Rafid Mueen, Yaser Rehman and Marcela
Chaki Borras for keeping me sane during this long thesis journey. I wish you all the best
x

xi
in your future endeavours.
To my supervisor, Associate Professor Konstantin Konstantinov, I thank you for all the
opportunities you have provide for me, not only through my PhD, but also during my time
as an undergraduate and Honours student. Then and now, during times of uncertainty, you
taught me to stay positive and keep moving forward and I am very grateful for your aid
in keeping me on course during this thesis. I also thank all my co-supervisors, Dr. Vitor
Sencadas, Dr. Shahnaz Bakand and Prof. Ronald Slutyer, for their expert advice in areas
of science I had no prior knowledge of and now hopefully know a little bit more about.
In addition, I would like to also thank Dr. Phil Barker for his efforts and guidance in the
research conducted throughout my PhD.
Finally, I would like to thank my family and friends for providing me with their contin-
ued support over the duration of both my undergraduate and postgraduate studies. To my
parents, I can never thank you enough for the opportunities you have afforded me and I
hope to repay your aid and support by continuing to make you proud of my accomplish-
ments. Finally, I would like to thank my partner Phoebe who has provided me with the
motivation to see through these months of thesis writing and in helping shape my goals
for the future.

Contents
Publications iv
Abstract vi
List of Figures xvi
List of Tables xxviii
List of Abbreviations xxxi
1 Introduction 1
1.1 Nanotechnology - New Properties for Old Materials . . . . . . . . . . . . 1
1.2 Ultraviolet (UV) Radiation - Australia at the Forefront . . . . . . . . . . . 4
1.3 Sunscreens and Nanomaterials . . . . . . . . . . . . . . . . . . . . . . . 7
1.4 Research Objectives and Thesis Outline . . . . . . . . . . . . . . . . . . 13
2 Literature Review 17
2.1 UV and its Effects on Humans . . . . . . . . . . . . . . . . . . . . . . . 17
2.1.1 Free-radicals and the Human Body . . . . . . . . . . . . . . . . . 18
2.1.2 UV-induced Human Health Conditions . . . . . . . . . . . . . . . 26
2.1.3 Human Skin Exposure to UV Radiation and DNA Damage . . . . 31
2.2 Protection from UV Radiation: Sunscreens . . . . . . . . . . . . . . . . . 38
2.2.1 Historical Developments . . . . . . . . . . . . . . . . . . . . . . 39
2.2.2 Regulation of Sunscreen Products in Australia . . . . . . . . . . . 40
2.2.3 Sun Protection Factor (SPF) and UVA Protection Ratings . . . . . 41
2.2.4 Organic and Inorganic UV Filters . . . . . . . . . . . . . . . . . 44
xii

CONTENTS xiii
2.2.5 Health Related Issues Associated with Organic UV Filters . . . . 51
2.3 Health Related Issues Associated with Inorganic UV Filters . . . . . . . . 58
2.3.1 Cytotoxicity and Genotoxicity . . . . . . . . . . . . . . . . . . . 58
2.3.2 Phototoxicity . . . . . . . . . . . . . . . . . . . . . . . . . . . . 64
2.3.3 Environmental Effects . . . . . . . . . . . . . . . . . . . . . . . 67
2.3.4 Dermal Permeation of Inorganic UV Filters . . . . . . . . . . . . 68
2.4 Photocatalysis by Inorganic UV Filtering TiO2 Nanoparticles . . . . . . . 74
2.4.1 General Photocatalysis Mechanism . . . . . . . . . . . . . . . . . 75
2.4.2 Photocatalysis by TiO2 Nanoparticles . . . . . . . . . . . . . . . 77
2.4.3 Consequences of a Photocatalyst in Sunscreen Products . . . . . . 79
2.5 Routes for Inhibiting Photocatalysis in TiO2 . . . . . . . . . . . . . . . . 81
2.5.1 Crystal Phase Composition . . . . . . . . . . . . . . . . . . . . . 83
2.5.2 Surface Passivation by Inert Coating . . . . . . . . . . . . . . . . 85
2.5.3 Elemental Doping . . . . . . . . . . . . . . . . . . . . . . . . . . 88
2.6 Emerging Nanomaterials as Possible UV Filters . . . . . . . . . . . . . . 91
3 Experimental Methods 98
3.1 Synthesis of Nanomaterials . . . . . . . . . . . . . . . . . . . . . . . . . 98
3.1.1 Synthesis of Spray-Dried Chitosan and Chitosan/TiO2 Nanocom-
posite Particles . . . . . . . . . . . . . . . . . . . . . . . . . . . 98
3.1.2 Synthesis of CeO2 Decorated Commercial TiO2 Nanoparticles . . 99
3.1.3 Synthesis of Rutile TiO2 Nanorods and CeO2/Rutile TiO2 Nanocom-
posite Particles . . . . . . . . . . . . . . . . . . . . . . . . . . . 100
3.2 Materials Characterisation . . . . . . . . . . . . . . . . . . . . . . . . . 102
3.2.1 X-Ray Diffraction . . . . . . . . . . . . . . . . . . . . . . . . . . 103
3.2.2 Electron Microscopy . . . . . . . . . . . . . . . . . . . . . . . . 105
3.2.3 Energy Dispersive X-Ray Spectroscopy (EDS) . . . . . . . . . . 107
3.2.4 Electron Energy Loss Spectroscopy . . . . . . . . . . . . . . . . 109
3.2.5 X-ray Photoelectron Spectroscopy . . . . . . . . . . . . . . . . . 110
3.2.6 Fourier Transform Infrared Spectroscopy . . . . . . . . . . . . . 111

CONTENTS xiv
3.2.7 Raman Spectroscopy . . . . . . . . . . . . . . . . . . . . . . . . 112
3.2.8 Nitrogen Adsorption/Desorption Analysis . . . . . . . . . . . . . 113
3.2.9 Thermal Analysis . . . . . . . . . . . . . . . . . . . . . . . . . . 115
3.2.10 Ultraviolet-Visible Absorption Spectroscopy . . . . . . . . . . . . 117
3.2.11 Ultraviolet-Visible (UV-Vis) Diffuse Reflectance Spectroscopy . . 119
3.3 Assessment of Photocatalytic Activity . . . . . . . . . . . . . . . . . . . 121
3.3.1 Experimental Procedure . . . . . . . . . . . . . . . . . . . . . . 121
3.3.2 Data Representation and Statistical Analysis . . . . . . . . . . . . 123
3.4 In Vitro Cytotoxicity towards Human Keratinocytes (HaCaT) . . . . . . . 124
3.4.1 Cell Culture . . . . . . . . . . . . . . . . . . . . . . . . . . . . . 124
3.4.2 Cell Number Optimization . . . . . . . . . . . . . . . . . . . . . 126
3.4.3 Cytotoxicity in Absence of UV Light . . . . . . . . . . . . . . . 129
3.4.4 Cytotoxicity in the Presence of UV Light . . . . . . . . . . . . . 130
3.4.5 Data Representation and Statistical Analysis . . . . . . . . . . . . 133
4 Suppression of the Photocatalytic Activity of TiO2 Nanoparticles Encapsu-
lated by Chitosan through a Spray-Drying Method with Potential for Use
in Sunblocking Applications 134
4.1 Introduction . . . . . . . . . . . . . . . . . . . . . . . . . . . . . . . . . 134
4.2 Results and Discussion . . . . . . . . . . . . . . . . . . . . . . . . . . . 137
4.2.1 SEM/TEM Microanalysis of Particle Size and Morphology . . . . 137
4.2.2 Chemical and Thermal Analysis . . . . . . . . . . . . . . . . . . 140
4.2.3 Optical Absorbance and Photocatalytic Activity . . . . . . . . . . 144
4.3 Conclusion . . . . . . . . . . . . . . . . . . . . . . . . . . . . . . . . . 146
5 Development of CeO2 Nanodot Encrusted TiO2 Nanoparticles with Re-
duced Photocatalytic Activity and Increased Biocompatibility towards the
Human Keratinocyte Cell Line 148
5.1 Introduction . . . . . . . . . . . . . . . . . . . . . . . . . . . . . . . . . 148
5.2 Results and Discussion . . . . . . . . . . . . . . . . . . . . . . . . . . . 151
CONTENTS xv
5.2.1 Materials Characterisation . . . . . . . . . . . . . . . . . . . . . 151
5.2.2 Optical Properties and Photocatalytic Performance . . . . . . . . 158
5.2.3 In Vitro Cytotoxicity in Absence and in the Presence of UV Radi-
ation . . . . . . . . . . . . . . . . . . . . . . . . . . . . . . . . . 165
5.3 Conclusion . . . . . . . . . . . . . . . . . . . . . . . . . . . . . . . . . 169
6 Hydrothermal Synthesis of Rutile TiO2 Nanorods and their Decoration
with CeO2 Nanoparticles as Low-Photocatalytic Active Ingredients in UV
Filtering Applications 170
6.1 Introduction . . . . . . . . . . . . . . . . . . . . . . . . . . . . . . . . . 170
6.2 Results and Discussion . . . . . . . . . . . . . . . . . . . . . . . . . . . 173
6.2.1 Establishment of Synthesis Conditions for Obtaining the Rutile
TiO2 Phase . . . . . . . . . . . . . . . . . . . . . . . . . . . . . 173
6.2.2 Comparative Performance of Hydrothermally Synthesized Rutile
TiO2 and Nanocomposite CeO2/TiO2 Compared to Commercial
Products as a Potential UV Filter . . . . . . . . . . . . . . . . . . 178
6.3 Conclusion . . . . . . . . . . . . . . . . . . . . . . . . . . . . . . . . . 186
7 Conclusion and Future Work 188
Bibliography 193
A Chapter 1 Supplementary Information 248
B Chapter 2 Supplementary Information 249
C Chapter 3 Supplementary Information 255
D Chapter 4 Supplementary Information 257
E Chapter 5 Supplementary Information 261
F Chapter 6 Supplementary Information 264
List of Figures
1.1 Macroscopic and nanoscopic appearance of gold (Au). TEM micrograph
of gold nanoparticles reproduced from Raliya et al, (2017).5 . . . . . . . 2
1.2 Global UV index recorded in the middle of the Australian winter (left)
and summer (right) months during 2015-16. The scales shown represent
the variation of UV index, with higher values representing higher UV
intensities. Figure reproduced from TEMIS, (2016).26 . . . . . . . . . . . 6
1.3 Calculated UV attenuation curves for spherical particles, demonstrating
light scattering effects as a function of particle size. Figure reproduced
from Schilling et al, (2010).44 . . . . . . . . . . . . . . . . . . . . . . . . 9
1.4 Diminished UV absorption of a range of TiO2/SiO2 and TiO2/SiO2/APTES
nanocomposite particles. APTES refers to 3-aminopropyltriethoxysilane.
Figure reproduced from Bai et al, (2017).60 . . . . . . . . . . . . . . . . 12
2.1 (left) Incidence and mortality rates for Australians towards melanoma
through the years 1982 - 2018. 2019 - 2021 are projected estimates.
(right) Comparison of the number of incidences and mortalities associated
with the most common cancers in Australia during 2018. Data obtained
from the Australian Institute of Health and Welfare, Australian Govern-
ment.167 *ASR corresponds to the age-standardised rates per 100,000
people. . . . . . . . . . . . . . . . . . . . . . . . . . . . . . . . . . . . . 30
2.2 Penetration and biologically damaging effects of different wavelengths of
UV radiation. Figure reproduced from D’Orazio et al, (2013).175 . . . . . 32
xvi
LIST OF FIGURES xvii
2.3 (left) The molecular and biological steps involved in response to UV ex-
posure. (top-right) Absorption spectra of eumelanin (dashed line) and
pheomelanin (solid line) along with (bottom-right) corresponding chemi-
cal structures. Figures reproduced from Garibyan et al, (2010)71 and Tran
et al, (2006),181 respectively. . . . . . . . . . . . . . . . . . . . . . . . . 33
2.4 UV effectiveness spectra highlighting wavelengths responsible for ery-
thema (sunburn), ROS generation and immuno-suppression. Figure re-
produced from Osterwalder et al, (2013).198 . . . . . . . . . . . . . . . . 35
2.5 Chemical structure of the main photoproducts formed by UVB-induced
photoreaction of thymine (T) residues in DNA. Figure reproduced from
Cadet et al, (2005).199 . . . . . . . . . . . . . . . . . . . . . . . . . . . . 36
2.6 Selected UVA photosensitizers involved in indirect DNA damage. . . . . 38
2.7 (left) Sunburning (MED) dose for a person susceptible to the dose within
10 minutes in absence of sunscreen and the affects of different SPF value
sunscreens on this timeframe. (right) Bar graph representation of the end-
points shown in (left) for different SPF values. Figure reproduced from
the Australian/New Zealand Standard for Sunscreen products, (2012).225 . 42
2.8 The major groups of organic UV filters used in sunscreen products. . . . . 45
2.9 Fragmentation of avobenzone upon UV exposure, leading to a loss UV
absorptive functionality and production of two reactive species. . . . . . . 46
2.10 UV-Vis absorption properties of microfine (200 - 500 nm) (x) and ultrafine
(<100 nm) (y) particles of (left)TiO2 and (right) ZnO. Figure reproduced
from Dransfield, (2000).43 . . . . . . . . . . . . . . . . . . . . . . . . . 47
2.11 The crystal structures for the different polymorphs of TiO2 including the
(top-left) anatase, (top-right) rutile, (bottom-left) brookite and (bottom-
right) TiO2(B) forms. Figure reproduced from Ma et al, (2014).257 . . . . 48
LIST OF FIGURES xviii
2.12 SEM and TEM images of commercial sunscreens containing the inorganic
UV filters, TiO2 and ZnO. a) and b) corresponds to TiO2 nanoparticles
whilst d) and e) are of ZnO. c) is an example of a blank sample and f)
a mixture of both TiO2 and ZnO. Figure reproduced from Lewicka et al,
(2011).260 . . . . . . . . . . . . . . . . . . . . . . . . . . . . . . . . . . 50
2.13 Spectral changes occurring over time during solar simulated light irradi-
ation of (left) octyl methoxycinnamate and (right) oxybenzone (loading
8 mg L−1) under aerobic conditions in water (top) and hexane (bottom).
Figure reproduced from Serpone et al, (2002).229 . . . . . . . . . . . . . 56
2.14 (left) Mitochondrial activity, (middle) LDH release and (right) IL-8 pro-
duction in A549 cells after 48 hrs exposure to anatase and rutile TiO2
nanoparticles. Figure reproduced from Sayes et al,(2006).47 . . . . . . . . 59
2.15 MDA levels, indicated of cell membrane damage, measured in the su-
pernatants of erythrocytes treated with phosphate-buffered saline (NC) or
with TiO2 nanoparticles (100 µg mL−1)(Physical parameters listed in Ta-
ble B.3).•Significant difference from the control (NC) without UV expo-
sure (p<0.05). †† Significant difference from control with UV exposure
(p<0.01). Figure reproduced from Tang et al, 2018.378 . . . . . . . . . . 66
2.16 (left) Diagram and (right) microscope image of human skin, likely from
the palms of the hands or soles of the feet, detailing the layered structure
of the epidermis and dermis. Figures reproduced from (left) Wickett et al,
(2006)394 and (right) Wbensmith, (2007).398 . . . . . . . . . . . . . . . . 70
2.17 Layered structure of the epidermis and the potential pathways for cuta-
neous penetration including the a) paracellular, b) transcellular and transap-
pendagael routes. The transappendagael routes include c1) hair follicles,
c2) sweat pores and c3) sebaceous glands. Figure reproduced from Smijs
et al, (2011).7 . . . . . . . . . . . . . . . . . . . . . . . . . . . . . . . . 71
LIST OF FIGURES xix
2.18 Multiple-photon second harmonic generation (MP-SHG) and fluorescence
lifetime imaging (MP-FLIM) images of cryosectioned human skin after
48 hrs of applying ZnO nanoparticles in sunscreen formulation. (top-left)
MP-SHG signal of ZnO nanoparticles. (top-right) Transmission image
of skin labelling stratum corneum (SC) and the viable epidermis (VE).
(bottom-left) MP-FLIM signal from ZinPyr-1 (ZP1) fluorescent dye for
detecting labile Zn. (bottom-right) Overlay of images. Figure reproduced
from Mohammed et al, (2020).423 . . . . . . . . . . . . . . . . . . . . . 73
2.19 Different stages of the photocatalysis process for a semiconductor particle
in aqueous media. 1) Valence band (VB) to conduction band (CB) exci-
tation; 2) recombination; 3) direct reduction of an electron acceptor (A);
4) reduction of O2; 5) HOO• formation; 6) H2O2 formation; 7) dispro-
portionation of H2O2 to OH•; 8) oxidation of an electron donor (D); 9)
reduction of surface OH− to OH• and 10) Oxidation of donor D by OH•.
Figure reproduced from Park et al, (2013).426 . . . . . . . . . . . . . . . 75
2.20 Band gaps and band edge positions for different semiconductor materials
relative to the vacuum level. The red dashed area indicates the redox po-
tentials for water photolysis. Figure reproduced from Batzill et al, (2011).425 76
2.21 Generation of carbon-centred radicals through the photoexcitation of TiO2
in the presence of SDS using fluorescence spectroscopy and 4-(3-hydroxy-
2-methyl-4-quinolineoxy)-2,2,6,6-tetramethylpiperidine-1-oxyl as the free
radical probe. The curves shown are from degradation experiments per-
formed, from top to bottom, with: [SDS]=6.5x10⁻⁴ M/[TiO2]=0.0 mg
mL−1, [SDS]=6.5x10⁻⁴ M/[TiO2]=0.5 mg mL−1, [SDS]=6.5x10⁻⁴ M/[TiO2]=1.0
mg mL−1 and [SDS]=1.9x10⁻⁴ M/[TiO2]=1.0 mg mL−1. Figure repro-
duced from Ricci et al, (2003).58 . . . . . . . . . . . . . . . . . . . . . . 81
2.22 ROS generated by TiO2 nanoparticles of varying particle size and phase
composition (left) before and (right) after surface area normalization. Fig-
ure reproduced from Jian et al, (2008).452 . . . . . . . . . . . . . . . . . 84
LIST OF FIGURES xx
2.23 Bar graph representation of EPR spectrum intensities highlighting the
generation of the DMPO-spin adduct (spin trap for the OH• radical).
Samples F and G refer to inorganic TiO2 UV filters found in commercial
sunscreens where F is purely rutile whilst G is an anatase/rutile mixture.
Figure reproduced from Barker et al, (2008).53 . . . . . . . . . . . . . . . 85
2.24 Malondialdehyde production as a result of linoleic acid peroxidation after
2 hrs of UVB irradiation in absence and in the presence of 0.05% w/w
(white bars) or 1.0% (grey bars) TiO2 based sample. Figure reproduced
from Carlotti et al, (2009)59 . . . . . . . . . . . . . . . . . . . . . . . . . 87
2.25 (left) Absorption spectra for commercial TiO2 products and Mn-doped
TiO2 (OptisolT M) suspended water/ethanol. (right) Free radical genera-
tion rates for Mn-doped, undoped and commercial TiO2 using DMPO as
the spin trap. Figures reproduced from Wakefield et al, (2004).484 . . . . 90
2.26 UV-Vis absorption spectra (left) of a) 20 mol%, b) 50 mol%, c) pure
CeO2, d) 30 mol%, e) 40 mol% and f) 10 mol% Ca-doped CeO2 nanopar-
ticles prepared through a co-precipitation method. (right) Calculated SPF
and PFUVA values for sunscreen emulsions prepared containing combi-
nations of TiO2/ZnO and TiO2/Ca-doped CeO2 nanoparticles. Figures
reproduced from Truffault et al, (2010 and 2012).61, 496 . . . . . . . . . . 93
2.27 Relative decrease in crystal violet dye absorbance containing TiO2 nanopar-
ticles and CeO2/α-Fe2O3 nanocomposites at 5 mg L−1 under UV light
exposure. Figure reproduced from Cardillo et al, (2016).62 . . . . . . . . 95
3.1 Schematic representation of the spray drying process used to produce the
chitosan and chitosan/TiO2 nanocomposite particles. . . . . . . . . . . . 99
3.2 Schematic representation of the HTIO2 and CTIO2 synthesis methods. . . 101
3.3 GBC Mini-Materials Analyser X-ray Diffractometer (interior) and sample
holder. . . . . . . . . . . . . . . . . . . . . . . . . . . . . . . . . . . . . 104
LIST OF FIGURES xxi
3.4 (left) Interaction volume generated by incident electron beam and gener-
ation of secondary electrons (SE). (right) JEOL JSM-7500FA field emis-
sion electron microscope. Figure (right) reproduced from JEOL.515 . . . . 106
3.5 JEOL JEM-ARM200F scanning transmission electron microscope. Fig-
ure reproduced from JEOL, 2019.516 . . . . . . . . . . . . . . . . . . . . 107
3.6 (left) Characteristic x-ray generation and (right) EDS mapping of a chitosan/TiO2
nanocomposite material. . . . . . . . . . . . . . . . . . . . . . . . . . . 108
3.7 (left) EELS spectra example highlighting the low loss (top) and core loss
(bottom) regions. (right) Experimental EELS Ti L2,3 main edges for
different titania crystal phases. Figures reproduced from Gloter et al,
2009518 and Egerton et al, 2005.519 . . . . . . . . . . . . . . . . . . . . . 110
3.8 Components of an XPS instrument and the types of data formats employ-
able. Figure reproduced from van der Heide, 2011.520 . . . . . . . . . . . 111
3.9 Energy diagram detailing Rayleigh and Raman scattering events and the
electronic transitions that occur. . . . . . . . . . . . . . . . . . . . . . . . 113
3.10 Micromeritics Vacuum Degassing Station and Tristar II 3020 Gas Sorp-
tion systems. Classification of physisorption isotherms. Graphical figure
reproduced from Thommes, 2015.522 . . . . . . . . . . . . . . . . . . . . 115
3.11 Mettler Toledo TGA/DSC 1 thermal analysis system (left). Components
of a thermogravimetric and differential scanning calorimetry system (right).116
3.12 (left) Absorption plots for a commercial TiO2 powder (P25) at varying
concentrations. (right) Relationship between the peak absorbance and
concentration, validating the Beer-Lambert law. . . . . . . . . . . . . . . 119
3.13 (left) Diffuse reflectance plot for a commercial TiO2 powder (P25). (right)
Calculated band gap using the Kulbelka Monk and Tauc relationships. . . 120
3.14 Assessment of photocatalytic activity scheme using crystal violet as the
degradation target. . . . . . . . . . . . . . . . . . . . . . . . . . . . . . . 123
3.15 Chemical structures of the MTS tetrazolium salt and formazan product
produced in the presence of metabolically active cells. . . . . . . . . . . . 127
LIST OF FIGURES xxii
3.16 Experimental plate design for the cell optimization experiments. . . . . . 128
3.17 Experimental plate design for the in vitro MTS assays in absence of UV
light. . . . . . . . . . . . . . . . . . . . . . . . . . . . . . . . . . . . . . 130
3.18 Solar simulated light exposure set up (top) and experimental plate design
(bottom) for the in vitro MTS cell proliferation assays under UV exposure. 131
4.1 SEM images and EDS maps of the spray dried CHI (top), 2:1 CHI/TiO2
(middle) and 1:1 CHI/TiO2 (bottom) nanocomposite particles. The EDS
maps shown are for the elements Ti (red) and oxygen (green). The scale
bar shown in the SEM images (left) corresponds to 1 µm. . . . . . . . . 138
4.2 TEM micrographs obtained for the (top-left) CHI, (top-right) 2:1 CHI/TiO2,
(bottom-left) 1:1 CHI/TiO2 and (bottom-right) pristine commercial TiO2
nanoparticles. . . . . . . . . . . . . . . . . . . . . . . . . . . . . . . . . 139
4.3 XRD patterns for the raw chitosan starting material, pristine TiO2 nanopar-
ticles and nanocomposite powders prepared. . . . . . . . . . . . . . . . . 140
4.4 FTIR spectra for the pristine TiO2 (P25) nanoparticles as well as the
spray-dried CHI, 1:1 CHI/TiO2 and 2:1 CHI/TiO2 particles. . . . . . . . . 141
4.5 (top-left) TGA curves for the spray-dried samples and corresponding (top-
left) derivative curves obtained at a heating rate of 20oC min−1. (bottom-
left) Kissinger plots and (bottom-right) influence of TiO2 (P25) loading
on the activation energy (Ea) for the spray-dried materials. . . . . . . . . 143
4.6 (left) Absorption plots for the spray-dried and commercial samples ob-
tained through diffuse-reflectance spectroscopy. (right) Relative decrease
in absorbance of crystal violet dye as a function of UV irradiation time in
the presence of the spray-dried and commercial samples. . . . . . . . . . 145
5.1 XRD patterns for the as-prepared composites as well as for pristine TiO2
(P25) and CeO2. Peaks indexed for the TiO2 and CeO2 samples accord-
ing to the following PDF cards: Anatase (03-065-5714), Rutile (03-065-
1119), CeO2 (01-089-8436). . . . . . . . . . . . . . . . . . . . . . . . . 152
LIST OF FIGURES xxiii
5.2 Narrow XPS spectra and fitted peaks of the Ti 2p (left) and Ce 3d (right)
regions for the (top) pristine TiO2 and (bottom) pristine CeO2. Each spec-
tra includes lines for the raw data, fitted peaks and envelope for each peak
fit (excluding spectra where no peaks were observed). . . . . . . . . . . . 153
5.3 Narrow XPS spectra and fitted peaks of the Ti 2p (left) and Ce 3d (right)
regions for the (top) 2.5%, (middle) 5% and (bottom) 10% CeO2/TiO2
composites. Each spectra includes lines for the raw data, fitted peaks
and envelope for each peak fit (excluding spectra where no peaks were
observed). . . . . . . . . . . . . . . . . . . . . . . . . . . . . . . . . . . 154
5.4 TEM micrographs and EDS mapped images of the 10% composite CeO2/TiO2
sample where (left) corresponds to the base dark field image, (middle) the
Ti content and (right) the Ce content. . . . . . . . . . . . . . . . . . . . . 155
5.5 Bright field (left) and corresponding dark field (right) images of the (top)
2.5 at%, (middle) 5 at% and (bottom) 10 at% CeO2/TiO2 composite samples.156
5.6 HRTEM images of the 10 at% CeO2/TiO2 nanocomposite sample ob-
tained in (top-left) dark field and (top-right) bright field imaging modes.
(bottom) Particle size distribution of the CeO2 nanoparticles present on
the surface of TiO2 nanoparticles in the 10 at% composite sample. . . . . 158
5.7 (left) UV-Vis absorption spectra recorded for the CeO2/TiO2 composites,
as well as pristine TiO2 and CeO2 nanoparticles for 30 mg L−1 suspen-
sions prepared in ethanol. (right) Corresponding Beer-Lambert plots used
to calculate extinction coefficient values. . . . . . . . . . . . . . . . . . 160
5.8 Photoactivity assessment of the tested samples, highlighting the (left) rel-
ative absorbance behaviour of the CV dye and the (right) degradation ki-
netics when exposed to (top) UV radiation and (bottom) simulated solar
radiation. Data represents the mean ± SeM (n = 3 experiments). . . . . . 161
LIST OF FIGURES xxiv
5.9 Impact of the pristine TiO2 (P25), CeO2 and nanocomposite CeO2/TiO2
samples on the mitochondrial function of HaCaT human keratinocytes
over a 24 hr incubation period. At the end of the incubation period, cell
viability was assessed via the MTS assay. Data represents mean ± SeM
(n = 3 experiments). One-way ANOVA and Tukey post-hoc tests were
performed to assess statistically different data sets. ∗∗ refers to p < 0.01
for the ZnO NP data set when compared to all other nanoparticle and
nanocomposite sample data sets for the corresponding concentrations. . . 166
5.10 HaCaT cell viability after 24 hr incubation with TiO2 (P25), 5 at% CeO2/TiO2
and CeO2 when exposed to UV radiation prior for (left) 5 min and (right)
15 min at an intensity of 6 mW cm−2. HaCaT cell viability (% of con-
trol) refers to the normalized absorbance readings for all nanoparticle,
nanocomposite and cell only wells exposed to UV irradiation relative to
a control plate in absence of UV exposure for each concentration tested.
Data represents mean ± SeM (n = 3 experiments). One-way ANOVA and
Tukey post-hoc tests were performed to assess statistically different data
sets. ∗ and ∗∗ refer to p < 0.05 and p < 0.01 when compared to the Cell
Only data sets for the corresponding concentrations. † and †† refer to p
< 0.05 and p < 0.01 when compared to the TiO2 (P25) data sets for the
corresponding concentrations. . . . . . . . . . . . . . . . . . . . . . . . 167
6.1 Variation of the crystal phase of the synthesized TiO2 as influenced by
the (left) concentration of HNO3 (when treated at 180oC) and (middle)
autoclaving temperature (when treated with 16M HNO3). . . . . . . . . . 174
6.2 Raman spectra for the H3M, H6M, H16M and HTIO2 samples. . . . . . . 175
6.3 SEM and TEM (inset) micrographs of the hydrothermally synthesized
TiO2 samples. . . . . . . . . . . . . . . . . . . . . . . . . . . . . . . . . 177
6.4 EELS line profiles obtained for sample H6M. EELS profiling location
shown in Figure F.1. . . . . . . . . . . . . . . . . . . . . . . . . . . . . . 178

LIST OF FIGURES xxv
6.5 XRD patterns for the commercial TiO2 and hydrothermally synthesized
powders tested. . . . . . . . . . . . . . . . . . . . . . . . . . . . . . . . 179
6.6 SEM and TEM (inset) micrographs of the DP25, HTIO2, SR and CTIO2
samples. . . . . . . . . . . . . . . . . . . . . . . . . . . . . . . . . . . . 180
6.7 (left) High-angle annular dark-field (HAADF) image of the CTIO2 com-
posite sample. (middle) EELS map detailing the distribution of Ti and Ce
for the particles shown (left) in the form of heat map. (right) High resolu-
tion HAADF of the particles shown in (left), highlighting the presence of
a CeO2 nanoparticle at the surface of the rutile TiO2. . . . . . . . . . . . 181
6.8 UV-Vis absorption spectra recorded for the commercial and as-prepared
TiO2 samples for 30 mg L−1 suspensions prepared in ethanol. The ab-
sorbance spectra for a sample of CeO2 nanoparticles (30 mg L−1) pre-
pared through the same precipitation process used for the CTIO2 nanocom-
posite is also shown for reference. . . . . . . . . . . . . . . . . . . . . . 182
6.9 Photodegradation plots for the commercial and as-prepared TiO2 samples
highlighting the relative absorbance change of the crystal violet dye (left)
and the degradation kinetics (right) when exposed to (top) UV radiation
and (bottom) simulated solar radiation. Data represents the mean ± SeM
(n = 3 experiments). . . . . . . . . . . . . . . . . . . . . . . . . . . . . . 186
A.1 Spectral data used in the calculation of UV indices as well as in vitro sun
protection factor (SPF) measurements for sunscreen products. a) Spectral
irradiance of the ’standard sun’ as a function of the wavelength-dependent
erythemal effectiveness of UV radiation. b) The product of the spectral ir-
radiance and erythemal effectiveness curves seen in a). Figure reproduced
from Heinrich et al (2004).640 . . . . . . . . . . . . . . . . . . . . . . . . 248
C.1 Light emission profile for the OSRAM Ultra-Vitalux 300 W sunlamp.
Figure reproduced from Deka et al, 2008.660 . . . . . . . . . . . . . . . . 255
C.2 Absorbance profiles for the phenol red free media (DMEM/F12) and DPBS.256
LIST OF FIGURES xxvi
D.1 Chemical structures of chitosan and chitin monomers. . . . . . . . . . . . 257
D.2 Particle size distribution and histogram plots for the (top-left CHI, (top-
right) 1:1 CHI/TiO2 and (bottom) 2:1 CHI/TiO2 samples (count = 400 per
sample). . . . . . . . . . . . . . . . . . . . . . . . . . . . . . . . . . . . 258
D.3 TGA curves for the a) CHI, b) 2:1 CHI/TiO2 and c) 1:1 CHI/TiO2 samples
treated at various heating rates. . . . . . . . . . . . . . . . . . . . . . . . 259
D.4 Derivative curves obtained from TGA for the a) CHI, b) 2:1 CHI/TiO2
and c) 1:1 CHI/TiO2 samples treated at various heating rates. . . . . . . . 260
D.5 Kinetics plots for the degradation of crystal violet dye as ascribed by the
Langmuir-Hinshelwood relationship in the presence of the spray-dried
and commercial materials. . . . . . . . . . . . . . . . . . . . . . . . . . 260
E.1 Tauc plots for the a) pristine TiO2 nanoparticles, b) 2.5 at%, c) 5%, d) 10
at% CeO2/TiO2 nanocomposites and e) pristine CeO2 nanoparticles. . . . 262
E.2 UV-Vis absorption plots and corresponding Beer-Lambert relationship plots
for the a) TiO2 (P25), b) 2.5 at%, c) 5 at%, d) 10 at% and e) CeO2 samples
prepared. . . . . . . . . . . . . . . . . . . . . . . . . . . . . . . . . . . . 263
F.1 XRD pattern for the precursor powder obtained after precipitation of TBT
with NH4OH and prior to hydrothermal treatment. . . . . . . . . . . . . 265
F.2 a) EELS profiles obtained across the pixels numbered in c), which is the
region of interested outlined in b). The sample examined here is the 6M
HNO3 180oC treated sample. . . . . . . . . . . . . . . . . . . . . . . . . 266
F.3 Particle size distribution and histogram plots for the (top-left) DP25, (top-
right) SR, (bottom-left) HTIO2 and (bottom-right) CTIO2 samples (count
= 100 per sample). The particle sizes measured for the HTIO2 and CTIO2
samples correspond to the nanorod width and the CeO2 nanodot sizes for
these samples, respectively. . . . . . . . . . . . . . . . . . . . . . . . . . 266
F.4 Example EDS spectrum collected from the CTIO2 sample prepared on
holey carbon copper grid during TEM analysis. . . . . . . . . . . . . . . 267
LIST OF FIGURES xxvii
F.5 Nitrogen gas adsorption isotherm plots for the DP25, SR, HTIO2 and
CTIO2 samples. . . . . . . . . . . . . . . . . . . . . . . . . . . . . . . . 268
F.6 UV-Vis absorption plots and corresponding Beer-Lambert relationship plots
for the a) DP25, b) HTIO2, c) SR and d) CTIO2 samples prepared. . . . . 269
F.7 Tauc plots obtained from diffuse reflectance for the (top-left) DP25, (top-
right) SR, (bottom-left) HTIO2 and (bottom-right) CTIO2 nanoparticle
and nanocomposite samples. . . . . . . . . . . . . . . . . . . . . . . . . 270
List of Tables
1.1 Comparison of yearly total incident UVR as SEDs* between Australian
cities and northern hemisphere cities. Data produced from Gies, (2003).19
*Standard Erythema Dose (SED) - 1 SED is equivalent to an erythemal
radiant exposure of 100 Jm−2. . . . . . . . . . . . . . . . . . . . . . . . 5
2.1 Biologically relevant ROS and RNS produced during cellular metabolism.
Table reproduced from Phaniendra et al, (2015).82 a Half-life dependent
on the environmental medium. Half life units are in seconds (s) and min-
utes (min). . . . . . . . . . . . . . . . . . . . . . . . . . . . . . . . . . . 19
2.2 Different SPF categories and classifications and the labelling permitted
for such sunscreen formulations according to the AS/NZS 2604:2012 stan-
dard.225 . . . . . . . . . . . . . . . . . . . . . . . . . . . . . . . . . . . 43
2.3 List of commercial TiO2 and ZnO nanoparticles.59, 447–449 TMCS and
PMMA refer to trimethoxycaprylylsilane and polymethyl methacrylate. . 82
3.1 Sample details and coding used for the samples prepared and described in
Sections 3.1.1 and Chapter 4. . . . . . . . . . . . . . . . . . . . . . . . . 99
3.2 Sample details and coding used for the samples prepared and described in
Sections 3.1.2 and Chapter 5. . . . . . . . . . . . . . . . . . . . . . . . . 100
3.3 Sample details and coding used for the samples prepared and described in
Sections 3.1.3, 3.1.3 and Chapter 6. . . . . . . . . . . . . . . . . . . . . . 102
xxviii

LIST OF TABLES xxix
4.1 Experimental results obtained from the SEM/TEM and thermal analysis
for the spray-dried particles and commercial TiO2 (P25) nanoparticles.
The SEM particle size data represents mean ± standard deviation (SD)
(count = 100). . . . . . . . . . . . . . . . . . . . . . . . . . . . . . . . . 143
4.2 Photocatalytic degradation efficiencies and rate constants for the spray-
dried particles and commercial TiO2 (P25) nanoparticles. The errors shown
are taken as the SeM between three separate experiments. *These values
were calculated based on the data obtained up until 60 min of UV exposure.146
5.1 Band gaps (Eg), extinction coefficients (ε) and Ce loading for the as-
prepared samples. ε values correspond to extinction coefficients calcu-
lated at the wavelengths of maximum absorption for each sample at a
concentration of 30 mg L−1. The errors shown are the standard deviation
between triplicate measurements. . . . . . . . . . . . . . . . . . . . . . . 156
5.2 CV dye degradation and rate constants (kapp) calculated from the photo-
catalytic degradation experiments under UV and solar simulated (AM1.5G)
irradiation for the pristine and composite samples. Errors shown corre-
spond to the SeM between three separate experiments. . . . . . . . . . . . 163
6.1 Experimental results obtained relating to crystallite/particle size and sur-
face area. The TEM particle size data represents mean ± standard devi-
ation (SD) (count = 100). Errors for the crystallite size and surface area
were generated by the specific software used for measurement. ∗ Mean
size for the CeO2 nanoparticles. . . . . . . . . . . . . . . . . . . . . . . . 179
6.2 Optical band gap (Eg) values and rate constants (kapp) determined for the
samples under UV and solar simulated irradiation. . . . . . . . . . . . . . 183
B.1 TGA approved UV filtering ingredients for use in therapeutic sunscreens
in Australia.66 . . . . . . . . . . . . . . . . . . . . . . . . . . . . . . . . 249
LIST OF TABLES xxx
B.2 EWG hazard scores for selected UV filters commonly found in sunscreen
products.265 Ratings drawn from various factors outlined in literature re-
ports pertaining to the UV filters listed230, 273, 299, 359, 404, 641–659 . . . . . . 252
B.3 List of TiO2 nanoparticle samples and selected physicochemical proper-
ties. Data reproduced from Tang et al, (2018).378 . . . . . . . . . . . . . 254
C.1 Seeding Numbers (SN) calculated using Equation 3.16 for the HaCaT cells
for different doubling times (DT). . . . . . . . . . . . . . . . . . . . . . 256
F.1 EDS results obtained on the CTIO2 composite sample detailing the rela-
tive Ce/Ti atomic and weight percentages. . . . . . . . . . . . . . . . . . 267
List of abbreviations
6-4PP (6-4) Pyrimidone
α-MSH α-Melanocyte stimulating
hormone
A549 Human alveolar basal epithelial
cells
AG01519 Human foreskin fibroblast
cells
ALS Amyotrophic lateral sclerosis
AP Activator protein
ARPE-19 Human retinal pigment ep-
ithelial cells
ARTG Australian Register of Thera-
peutic Goods
ASR Age-standardised rate
ASTM American Society for Testing
and Material
ATP Adenosine triphosphate
ATR Attenuated total reflectance
BALB/c 3T3 Murine embryonic fi-
broblast cells
BCC Basal cell carcinoma
BEAS-2B Human bronchial epithe-
lial cells
BET Bruneaur-Emmett-Teller
BSC Bio-safety cabinet
C Cytosine
Caco-2 Human intestinal epithelial
cells
cAMP Cyclic adenosine monophos-
phate
CAT Catalase
CHL/IU Chinese hamster lung cells
CHO Chinese hamster ovary cells
CPD Cyclobutane pyrimidine dimers
CV Crystal violet
DCF Dichlorofluorescein
DI Deionized
xxxi
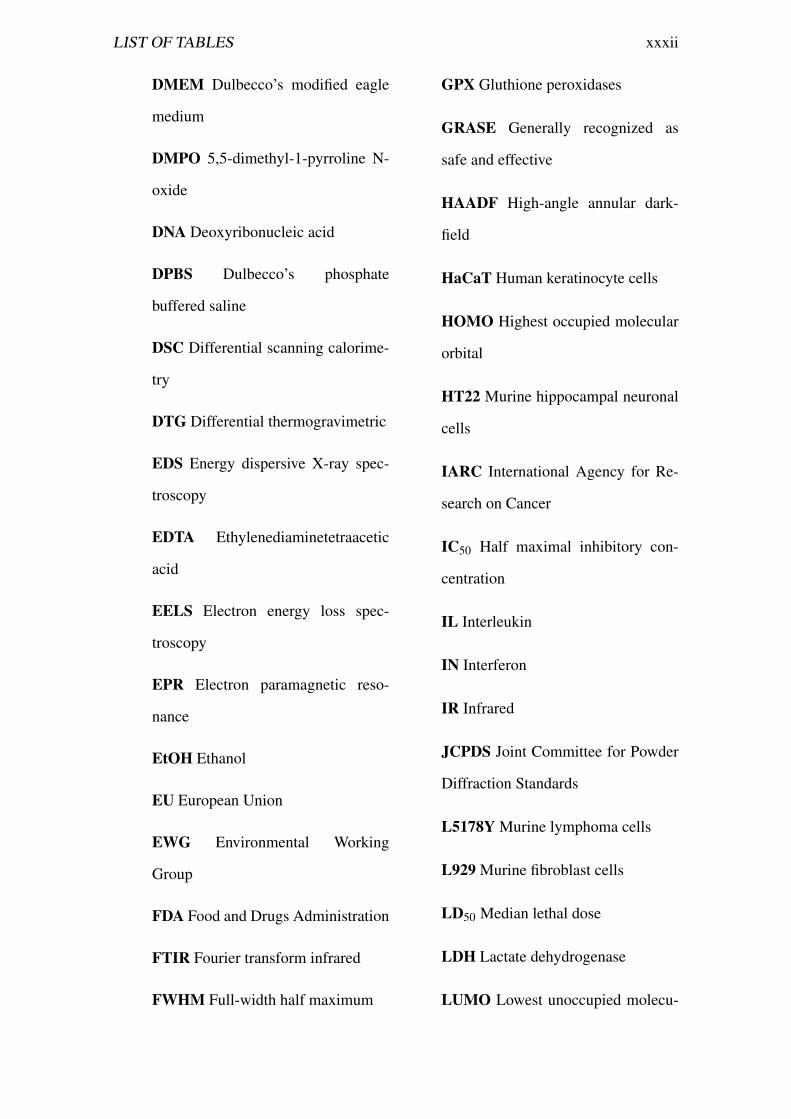
LIST OF TABLES xxxii
DMEM Dulbecco’s modified eagle
medium
DMPO 5,5-dimethyl-1-pyrroline N-
oxide
DNA Deoxyribonucleic acid
DPBS Dulbecco’s phosphate
buffered saline
DSC Differential scanning calorime-
try
DTG Differential thermogravimetric
EDS Energy dispersive X-ray spec-
troscopy
EDTA Ethylenediaminetetraacetic
acid
EELS Electron energy loss spec-
troscopy
EPR Electron paramagnetic reso-
nance
EtOH Ethanol
EU European Union
EWG Environmental Working
Group
FDA Food and Drugs Administration
FTIR Fourier transform infrared
FWHM Full-width half maximum
GPX Gluthione peroxidases
GRASE Generally recognized as
safe and effective
HAADF High-angle annular dark-
field
HaCaT Human keratinocyte cells
HOMO Highest occupied molecular
orbital
HT22 Murine hippocampal neuronal
cells
IARC International Agency for Re-
search on Cancer
IC50 Half maximal inhibitory con-
centration
IL Interleukin
IN Interferon
IR Infrared
JCPDS Joint Committee for Powder
Diffraction Standards
L5178Y Murine lymphoma cells
L929 Murine fibroblast cells
LD50 Median lethal dose
LDH Lactate dehydrogenase
LUMO Lowest unoccupied molecu-
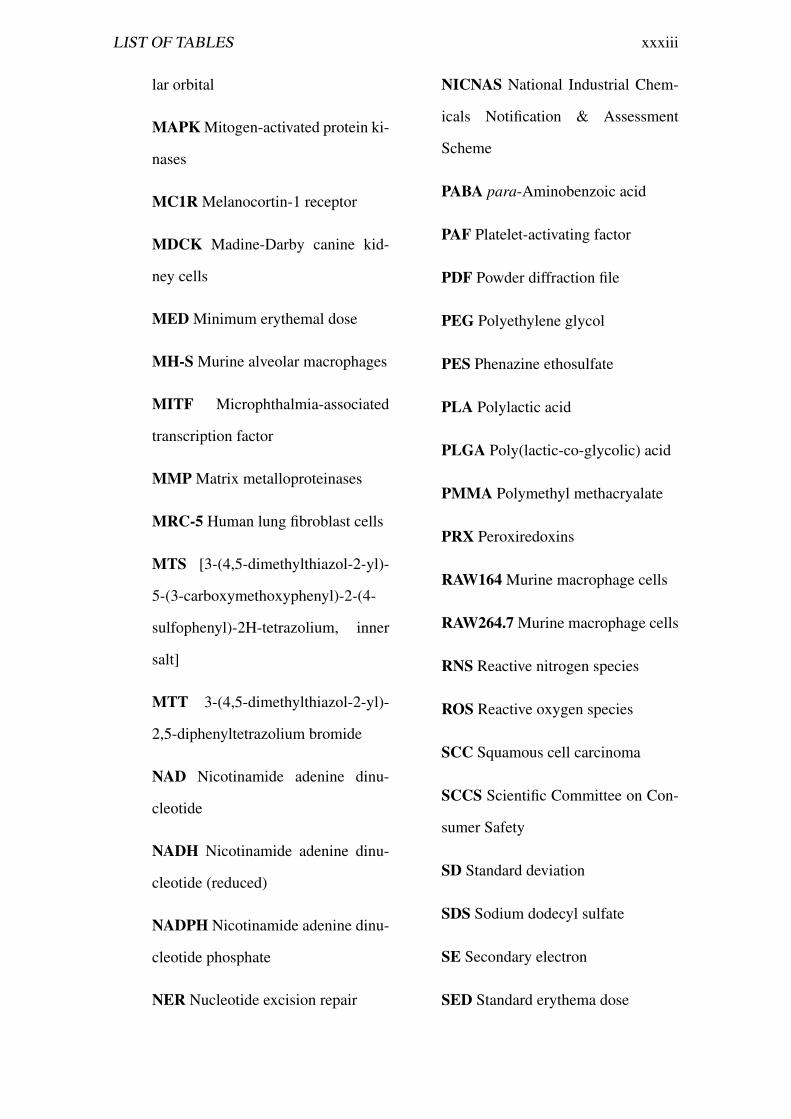
LIST OF TABLES xxxiii
lar orbital
MAPK Mitogen-activated protein ki-
nases
MC1R Melanocortin-1 receptor
MDCK Madine-Darby canine kid-
ney cells
MED Minimum erythemal dose
MH-S Murine alveolar macrophages
MITF Microphthalmia-associated
transcription factor
MMP Matrix metalloproteinases
MRC-5 Human lung fibroblast cells
MTS [3-(4,5-dimethylthiazol-2-yl)-
5-(3-carboxymethoxyphenyl)-2-(4-
sulfophenyl)-2H-tetrazolium, inner
salt]
MTT 3-(4,5-dimethylthiazol-2-yl)-
2,5-diphenyltetrazolium bromide
NAD Nicotinamide adenine dinu-
cleotide
NADH Nicotinamide adenine dinu-
cleotide (reduced)
NADPH Nicotinamide adenine dinu-
cleotide phosphate
NER Nucleotide excision repair
NICNAS National Industrial Chem-
icals Notification & Assessment
Scheme
PABA para-Aminobenzoic acid
PAF Platelet-activating factor
PDF Powder diffraction file
PEG Polyethylene glycol
PES Phenazine ethosulfate
PLA Polylactic acid
PLGA Poly(lactic-co-glycolic) acid
PMMA Polymethyl methacryalate
PRX Peroxiredoxins
RAW164 Murine macrophage cells
RAW264.7 Murine macrophage cells
RNS Reactive nitrogen species
ROS Reactive oxygen species
SCC Squamous cell carcinoma
SCCS Scientific Committee on Con-
sumer Safety
SD Standard deviation
SDS Sodium dodecyl sulfate
SE Secondary electron
SED Standard erythema dose

LIST OF TABLES xxxiv
SEM Scanning electron microscopy
SeM Standard error of mean
SHSY5Y Human neuroblastoma
cells
SOD Superoxide dismutase
SPF Sun protection factor
SSA Specific surface area
T Thymine
TBT Titanium butoxide
TEM Transmission electron mi-
croscopy
TEWL Transepidermal water loss
TGA Thermogravimetric analysis
Th1 T-helper type 1 cell
Th2 T-helper type 2 cell
THBS Thrombospondin
TMCS Trimethoxycaprylsilane
TSP Tumour suppressor protein
U Uracil
U937 Human macrophage cells
UV Ultraviolet
UVAPF Ultraviolet A protection fac-
tor
UVR Ultraviolet radiation
UV-Vis Ultraviolet-visible
WHO World Health Organisation
WIL2-NS Human lymphoblastoid
cells
XPS X-ray photoelectron spec-
troscopy
XRD X-ray diffraction

Chapter 1
Introduction
1.1 Nanotechnology - New Properties for Old Materials
Nanotechnology is a rather broad term that encompasses a variety of technologies and
innovative materials reproduced/manufactured or operating at a scale of 1 to 100 nm in
at least one dimension. The concept of nanotechnology and the manipulation of matter at
this scale was first brought to light by Richard Feynman in a lecture given in 1959.1 It was
first demonstrated practically by Binnig and Rohrer in 1982 with the development of the
scanning transmission microscope and visualization of individual gold atoms.2 The term
’nanotechnology’ itself was not established as a means of describing the manipulation,
processing, separation and behaviour of matter at the nanoscale until Taniguchi et al,
(1974) used it to describe semiconductor processes occurring at this range.3 The study of
different systems and materials at this scale spans a number of scientific fields including
physics, chemistry, biology and materials science, all of which are concerned with the
novel properties and behaviours displayed by materials when operating at this scale.
The development of nanomaterials is an area of extensive research due to the size and
shape dependent properties that arise as a result of the spatial confinement at the nano-
scale. Nanomaterials typically display new properties that are neither those of the corre-
sponding bulk or individual molecules making up the material.4 One reason for this is
thought to be due to the fact that, at this scale, many of the atoms making up the material
lie at the surface, and so, an new interface between the material and its environment is
1

1.1 Nanotechnology - New Properties for Old Materials
formed unlike that observed for the corresponding bulk or individual atoms. Another way
of putting this is to consider the example of a bag of sugar made up of very small crystals
and another bag of sugar cubes, much larger in size than that of the small crystals. When
each bag is poured into their own cups of water, it would be observed that the smaller
sugar crystals dissolve at a faster rate than that of the large sugar cubes. This is a result of
the increased amount of exposed surface area of the smaller sugar crystals as compared
to the sugar cubes, leading to an increase in the chemical dissolution. The same size de-
pendent properties are observed in nanomaterials because, as with the example outlined,
the surface area to volume ratio of nanomaterials is vastly higher than that of their cor-
responding bulk. Optical properties are also affected by these size dependent properties.
This can best be observed when comparing the appearance of bulk gold and gold nanopar-
ticles. At the macro-scale, we observe gold to be, well, gold in colour, which we assign to
being due to particular electronic transition between valence atomic orbitals, resulting in
absorption of specific visible light wavelengths and it’s subsequent appearance. The elec-
trons in gold nanoparticles however are inhibited in there movement due to the effects of
quantum confinement, an effect observed at the nanoscale. This confinement of electrons
in gold nanoparticles leads to a phenomena known as plasmonic resonance, a collective
oscillation of the surface atoms of the gold nanoparticles when exposed to specific elec-
tromagnetic frequencies. The oscillation of these confined electrons occurs at specified
frequencies which, in the case of gold, happens to correspond to wavelengths in the red
light region of the electromagnetic region. (Figure 1.1).
Figure 1.1: Macroscopic and nanoscopic appearance of gold (Au). TEM micrograph ofgold nanoparticles reproduced from Raliya et al, (2017).5
2
1.1 Nanotechnology - New Properties for Old Materials
Advances in our understanding of nanomaterials and the development of devices and
instruments to manipulate materials at this scale has led to the incorporation of nanoma-
terials in numerous commercial products. Silver nanoparticles may be incorporated in
band-aids and bandages owing to their antimicrobial activity.6 Metal oxide nanoparticles
are used in commercial sunscreen products as active UV filtering ingredients.7 Nanos-
tructured anode/cathode materials based upon silicon, carbon and metal chalcogenides are
used in lithium ion batteries due their high surface area and high electron transport rates.8
Graphene, a two dimensional array of carbon atoms, and graphene-based nanocomposite
materials have been incorporated into two of the highest selling vehicles produced by the
Ford Motor Company due to improvements in heat transfer, noise reduction and strength
imparted.9 Development of new nano-fields combining pharmaceutical and biomedical
sciences have also paved the way for the development of novel nanomedicines includ-
ing novel drugs and imaging agents that show improvements in targeting, efficacy and
bioavailability as compared to traditional medicines.10 Superparamagnetic iron oxide
(Fe3O4) have been investigated for targeted drug delivery by manipulation of their mag-
netic properties. Polymeric nanoparticles composed of L-glutamic acid, L-alanine, L-
lysine and L-tyrosine are used as an immunomodulator in the treatment of multiple scle-
rosis.11 Nanoparticles composed of self-assembled liposomes have also been used as
drug-carriers for the delivery of specific drugs to target locations.12
However, this commercialisation and increased production of nanomaterials has also
raised concerns over the potential human health and environmental risks posed by such
materials. The release of nanomaterials into the environment may occur from direct
sources such as production facilities, waste water treatment plants or landfills or indi-
rect sources such as wash-off of cosmetics or other products containing nanomaterials.
Much like the accumulation of heavy metals and radioisotopes, persistent nanomaterials
may be bioaccumulated in flora and fauna and carried up through the food-chain.13 Ex-
posure of organisms to high levels of nanomaterials has also been demonstrated to have
an impact on health and regular functionality. Internalisation may occur through acciden-
tal digestion or inhalation, whilst permeation through the skin may also occur through
3
1.2 Ultraviolet (UV) Radiation - Australia at the Forefront
lipid channels between cells in the stratum corneum or through hair follicles. Various in
vitro and in vivo studies have shown that exposure to nanomaterials can result in cellular
internalisation as well as cytotoxic/genotoxic effects, occasionally mediated through the
production of free radical species within the cell.14–16 As such, there is an urgent need
to ensure new and current nanomaterials, and their unique properties, are understood and
well characterized. This will enable better understanding of the toxicological effects these
materials may have to both humans and the environment and will enable minimization or
removal of any potential harm that could imparted by such new materials.
1.2 Ultraviolet (UV) Radiation - Australia at the Fore-front
UV radiation is a constituent of the electromagnetic spectrum, spanning the wavelength
range of 10 - 400 nm. Of all the solar electromagnetic radiation reaching the earth’s atmo-
sphere, approximately 9% corresponds to wavelengths in the UV region, although this can
vary across the seasons of a year and by geographical location.17 The UV region can also
be further subdivided based upon the differing biological effects associated with different
UV band ranges. As such, the UV electromagnetic wavelength regions of most biological
importance comprise of the UVC region (100 - 290 nm), UVB region (290 - 320 nm),
UVAII (320 - 340 nm) and UVAI (340 - 400 nm) regions.17, 18 The composition of UV
radiation incident on the earth’s surface also varies as a result of atmospheric processes,
such as absorption by stratospheric ozone, leading to total absorption of wavelengths in
the UVC region. Of the terrestrial UV radiation present, approximately 6% corresponds
to UVB radiation and the remaining 94% to UVA radiation.
Living in Australia, people are exposed to some of the highest intensities of solar UV
radiation experienced across the globe. The reason for this is due to a combination of
factors including the geographical location of the continent, earth’s position and orienta-
tion relative to the sun during summer periods and the higher level of air quality in the
southern hemisphere as compared to the northern hemisphere. These factors contribute
4
1.2 Ultraviolet (UV) Radiation - Australia at the Forefront
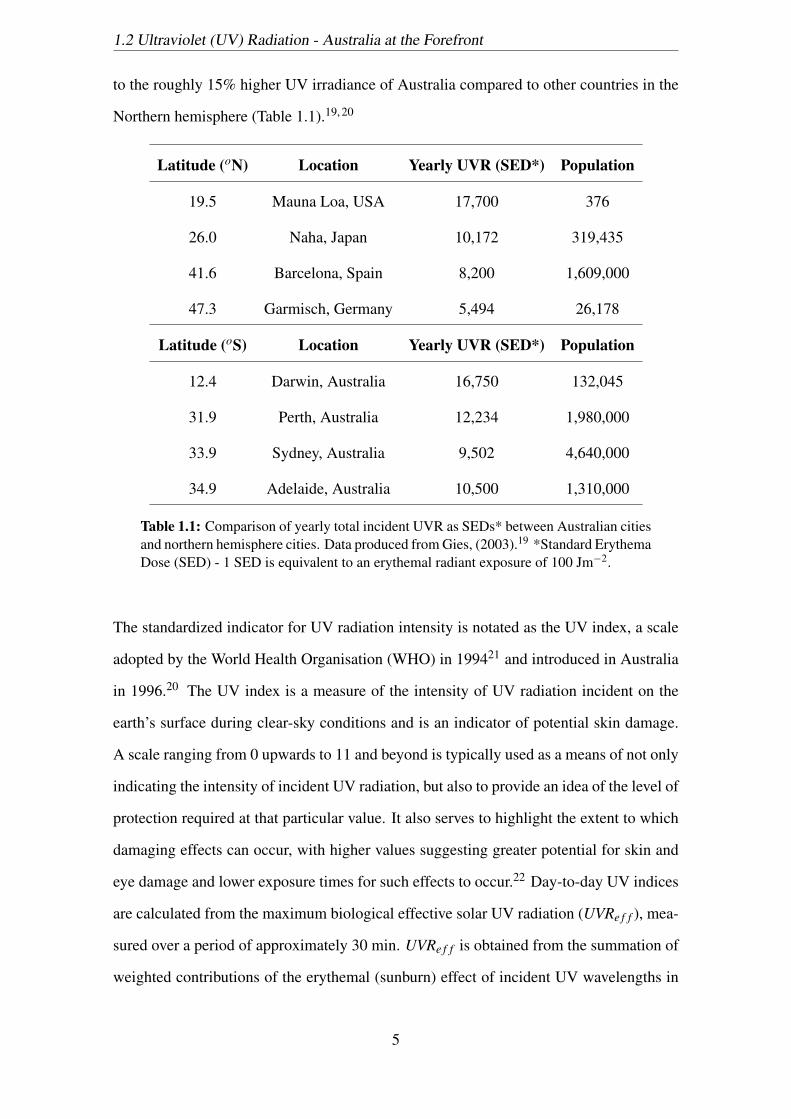
to the roughly 15% higher UV irradiance of Australia compared to other countries in the
Northern hemisphere (Table 1.1).19, 20
Latitude (oN) Location Yearly UVR (SED*) Population
19.5 Mauna Loa, USA 17,700 376
26.0 Naha, Japan 10,172 319,435
41.6 Barcelona, Spain 8,200 1,609,000
47.3 Garmisch, Germany 5,494 26,178
Latitude (oS) Location Yearly UVR (SED*) Population
12.4 Darwin, Australia 16,750 132,045
31.9 Perth, Australia 12,234 1,980,000
33.9 Sydney, Australia 9,502 4,640,000
34.9 Adelaide, Australia 10,500 1,310,000
Table 1.1: Comparison of yearly total incident UVR as SEDs* between Australian citiesand northern hemisphere cities. Data produced from Gies, (2003).19 *Standard ErythemaDose (SED) - 1 SED is equivalent to an erythemal radiant exposure of 100 Jm−2.
The standardized indicator for UV radiation intensity is notated as the UV index, a scale
adopted by the World Health Organisation (WHO) in 199421 and introduced in Australia
in 1996.20 The UV index is a measure of the intensity of UV radiation incident on the
earth’s surface during clear-sky conditions and is an indicator of potential skin damage.
A scale ranging from 0 upwards to 11 and beyond is typically used as a means of not only
indicating the intensity of incident UV radiation, but also to provide an idea of the level of
protection required at that particular value. It also serves to highlight the extent to which
damaging effects can occur, with higher values suggesting greater potential for skin and
eye damage and lower exposure times for such effects to occur.22 Day-to-day UV indices
are calculated from the maximum biological effective solar UV radiation (UVRe f f ), mea-
sured over a period of approximately 30 min. UVRe f f is obtained from the summation of
weighted contributions of the erythemal (sunburn) effect of incident UV wavelengths in
5

1.2 Ultraviolet (UV) Radiation - Australia at the Forefront
the range of 280 - 400 nm, as expressed by the following equation:
UV Re f f =400nm
∑280nm
Eλ Sλ4λ (1.1)
where Eλ is the solar spectral irradiance (W m−2 nm−1 or standard sun), Sλ the erythemal
spectral effectiveness (Figure A.1) and4λ the bandwidth (nm) of the measured intervals.
Figure 1.2 highlights the global UV index spread during the winter and summer months
of 2015/2016, from which it is clear that, not only Australia, but many regions around the
world are exposed to very high levels of UV radiation and, for Australia in particular, is a
leading factor in the substantial diagnosis of skin cancers each year. In fact, statistics from
the WHO attribute approximately 50-90% of malignant melanomas and non-malignant
basal cell carcinomas, as well as 50-70% of non-malignant squamous cell carcinomas in
light-skinned populations due to sun exposure and incident UV radiation.23 In addition
to this, studies of the Australian workforce have shown that outdoor workers, on average,
experience greater exposure to UV radiation as compared to outdoor workers in overseas
countries including Canada and the United Kingdom.24 This also accounts for the higher
skin cancer rates observed in Australia with its largely light-skinned population and the
country having the highest incidence of these types of cancers in the world.25
Figure 1.2: Global UV index recorded in the middle of the Australian winter (left) andsummer (right) months during 2015-16. The scales shown represent the variation of UVindex, with higher values representing higher UV intensities. Figure reproduced fromTEMIS, (2016).26
In addition to the carcinogenic potential of UV radiation, high levels of exposure have
6

1.3 Sunscreens and Nanomaterials
also been shown to induce a range of skin-related conditions including erythema, im-
munosuppression and premature skin ageing.27, 28 The cause behind these conditions is
thought to, in part, be attributed to the generation of free radical species, such as reactive
oxygen species (ROS), within viable cells. ROS and other reactive species are a regular
by-product of the cell cycle and metabolism and thus natural antioxidant pathways exist
within cells to cope with these species.29, 30 In addition, certain free radical species are
important in various cellular function and play a role in intracellular signalling and the
immune response to foreign bodies.31, 32 However, an excess of free radicals or overload-
ing of the inherent cellular mechanisms for dealing with free radicals can result in a state
of oxidative stress within afflicted cells. This can lead to oxidative damage of important
cellular features such as organelles, the cell membrane and even deoxyribonucleic acid
(DNA), accounting for the link between UV exposure and the development of skin can-
cers.33 A number of strategies have been implemented to increase public awareness of
the harmful effects of UV radiation and to encourage the general public to avoid or limit
sun exposure during times of high UV intensities. However, societal norms have limited
the effectiveness of such warnings and so, more effective measures for defence against
UV rays have been developed and integrated into the routine of consumers over the last
50 years through the development and commercialisation of sunscreen products.
1.3 Sunscreens and Nanomaterials
The use of products or minerals containing UV blocking or filtering ingredients is no
modern invention, with evidence suggesting the use of clay products by Ancient Egyp-
tians containing UV absorbing iron oxides dating as far back as 3100 BC.34 However,
mainstream commercialisation and patenting of specific sunscreen formulations and did
not occur until the 1920s.35 Even at this stage, a shift in societal behaviour during the
later half of the 20th century was leading to all time high levels of UV exposure. In ad-
dition, an increasing amount of evidence was mounting in highlighting the link between
UV radiation and skin cancers which, combined with the increasing rates of melanoma
diagnoses, was of particular concern to human populations residing in countries exposed
7
1.3 Sunscreens and Nanomaterials
to high levels of UV, such as Australia. A health campaign promoted in Australia during
the 1980s, colloquially known as the Slip! Slop! Slap! SunSmart Campaign, helped in
educating and encouraging the general public to use sunscreen products during outdoor
activities. According to the Australian Cancer Council, the popularisation of the cam-
paign has helped play a key role in shaping the sun protection attitudes and behaviour of
people in the years since the campaign was run.36
Despite increased public awareness of UV radiation and the need for sunscreen products,
the incidence of skin cancers are still on the rise. A part of this can be attributed to recent
consumer concerns over certain sunscreen features developed over the past 20 years and
a lack of certainty in the safe use of these products. Recent analysis from the Cancer
Council’s National Sun Protection Survey have revealed worrisome statistics about the
Australian public’s perception of sunscreen products.37 According to the survey, 45%
of adults could not agree with whether sunscreens could be used safely on a daily basis,
whilst 20% of adults believed regular use could lead to Vitamin D deficiencies and 17%
of adults believing the ingredients present in sunscreens were bad for health if regularly
used. Publication of news articles in recent times pertaining to the potential bleaching
effects of sunscreens on corals, absorption of certain sunscreen ingredients and concerns
surrounding the use of nanoparticles in sunscreens have also propagated the uncertainty
in such products.38–40 However, misinterpretation of experimental evidence by online
groups lacking specific background knowledge in the field41 has also contributed to the
spread of misinformation and is likely also a contributing factor in the survey results
obtained by the Cancer Council.
The ingredients comprising a sunscreen formulation serve a range of purposes and vary
from emulsification agents, preservatives, antioxidants and the ’active’ ingredients that
provide specific protection from incident UV radiation. These active ingredients are typ-
ically classified as organic or inorganic UV filters and are regulated in Australia by the
Therapeutic Goods Administration (TGA).42 The TGA are responsible for ensuring sun-
screen manufacturers comply to regulation guidelines pertaining to the UV protective
ability of these active ingredients and their safety, and govern the list of approved UV
8
1.3 Sunscreens and Nanomaterials
filters, classified as therapeutics, that may be used in sunscreen formulations. A number
of health and environmental concerns surrounding the use of organic UV filters in sun-
screen products have arisen since their initial inception into the commercial market in
the 1940s, however, they are not the main focus of this thesis work (although a further
look at organic UV filters will be given in Chapter 2). The two TGA approved inor-
ganic UV filtering compounds are materials based upon titanium dioxide (TiO2) and zinc
oxide (ZnO). These materials were initially introduced into commercial formulations in
the form of particles, generally in the micrometer range. Owing to a difference in the
physical properties of these compounds, as compared to organic UV filters, sunscreen
formulations containing these particles typically appeared opaque when applied and left
an unappealing whiteness to the skin even after rubbing in. However, with advances in
manufacturing methods and the fruition of nanotechnology, modern sunscreen formula-
tions containing these two materials have been tailored to improve transparency whilst
also affording increased protection from incident UV radiation.43 The cause for this ad-
vancement has been brought about by the size reduction of these inorganic particles to
below 100 nm, thus forming nanoparticles. With this size reduction, less visible light is
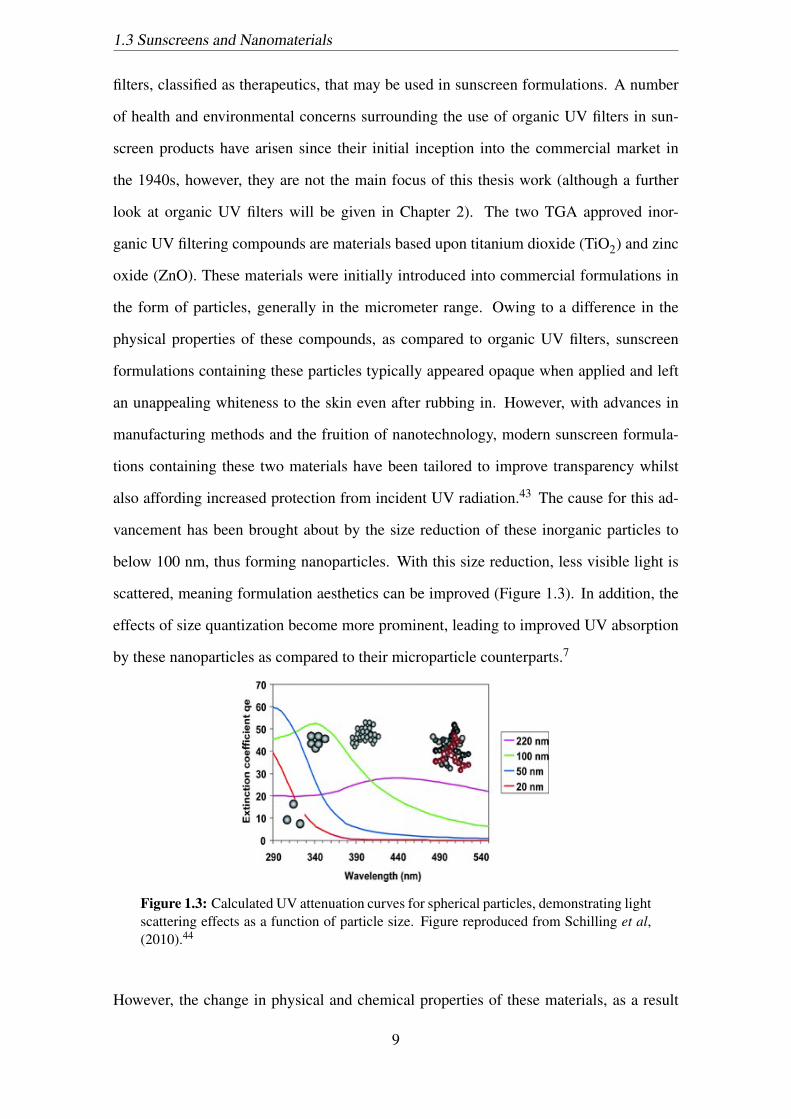
scattered, meaning formulation aesthetics can be improved (Figure 1.3). In addition, the
effects of size quantization become more prominent, leading to improved UV absorption
by these nanoparticles as compared to their microparticle counterparts.7
Figure 1.3: Calculated UV attenuation curves for spherical particles, demonstrating lightscattering effects as a function of particle size. Figure reproduced from Schilling et al,(2010).44
However, the change in physical and chemical properties of these materials, as a result
9

1.3 Sunscreens and Nanomaterials
of this size reduction, has also brought concerns over their potential harm to consumers
when incorporated in commercial goods, such as sunscreens. As a result of the dras-
tic increase in the surface area to volume ratio of nanoparticles compared to their bulk
equivalents, increases in chemical, photochemical and photocatalytic reactivity occur.45
TiO2 nanoparticles in particular have been extensively investigated in photocatalysis ap-
plications due to its well known photocatalytic properties and propensity to generate var-
ious free radicals, including ROS.46 Furthermore, concerns over the potential for these
nanoparticles to penetrate the skin barrier when topically applied has been a topic of
much discussion since their inception into commercial sunscreens. This has been a sig-
nificant cause of concern due to mounting evidence demonstrating the cytotoxic, geno-
toxic and phototoxic potential of TiO2 and ZnO nanoparticles towards various human
cell lines and animal models.47–52 Many of these studies have also linked the toxicity
induced to the increased generation of free radical species by these nanoparticles, result-
ing in states of oxidative stress. Moreover, a study performed in 2008 revealed that many
sunscreen products containing TiO2 nanoparticles were in a compositional form similar to
that of commercial-grade TiO2 nanoparticles sold specifically for photocatalysis applica-
tions.53 In this study, it was found that the sunscreen-based TiO2 nanoparticles displayed
photocatalytic activities on par with the commercial-grade photocatalytic TiO2 powder,
prematurely ageing and degrading coatings on steel roofing panels through a free radi-
cal mediated process. Increased consumer awareness of these nanoparticles in sunscreen
products and surmounting scientific evidence of their potential toxicological effects paved
the way for a review of literature by the Australian TGA, firstly in 2013 and later updated
in 2016.54 The primary focus of this review was on the potential for these sunscreen nano-
materials to penetrate the skin and reach viable cells and considered both in vitro and in
vivo studies. It was in their opinion that the ’weight of evidence’ suggested these nanopar-
ticles cannot reach viable cells when applied topically to skin and that they largely remain
atop the stratum corneum, the outermost layer of superficial skin. As such, it was inferred
that they do not pose any significant threat to consumers using nanoparticle-containing
sunscreens. Despite the conclusions drawn by the TGA, irregularities in testing proto-
10

1.3 Sunscreens and Nanomaterials
cols and inconsistencies in skin models used for a various number of studies cited have
still left the scientific community and consumers divided on the matter. The review also
highlighted the need for additional long-term case studies involving the continuous top-
ical application of nanoparticulate sunscreens to, not only healthy human skin, but also
abraded and pre-damaged skin models to better account for long-term health effects and
to consider the implications of a reduced skin barrier to external entities.
Another important parameter needed to be considered for the continued safe use of nanopar-
ticulate inorganic UV filters is their photocatalytic activity. Both TiO2 and ZnO nanopar-
ticles have been studied for use in various photocatalysis applications including dye-
sensitized solar cells, water purification and splitting and self-cleaning glasses.46, 55, 56
The underlining principle for these nanomaterials and their application is their ability
to react with chemically adsorbed molecules through interaction of photoexcited charge
species generated within the material upon UV exposure. Under certain conditions, such
as within mammalian cells, this can lead to the generation of harmful ROS such as the
hydroxyl and superoxide radicals and can contribute to states of oxidative stress in vi-
able cells.57 In addition, generation of such free radical species can impact the efficacy
of sunscreen formulations by degrading organic based active ingredients, thus reducing
the protection afforded when applied.58 Sunscreen manufacturers are aware of this pho-
tocatalysis property and typically modify these inorganic UV filters by applying inert
surface coatings to the nanoparticles and include antioxidant compounds in formulations
to minimize and limit the impact of photogenerated free radicals. Such strategies how-
ever may bring about further issues, for instance, the addition of antioxidant compounds,
which are typically organic in nature, may enhance the propensity for the formulation to
induce inflammatory and allergenic reactions in sensitive skin. As for the coating strate-
gies, the use of coatants such as aluminium and silicon based oxides and hydroxides have
been shown to aid in reducing the photocatalytic activity of TiO2 and ZnO.59 However,
it has also been demonstrated that excessive coating can impair the UV absorptive ability
of the core nanoparticle material, thus limiting the overall efficiency of the UV protec-
tion afforded and increasing the need for greater nanoparticle loadings in sunscreens to
11

1.3 Sunscreens and Nanomaterials
achieve and maintain a high level of UV attenuation (Figure 1.4).60
Figure 1.4: Diminished UV absorption of a range of TiO2/SiO2 and TiO2/SiO2/APTESnanocomposite particles. APTES refers to 3-aminopropyltriethoxysilane. Figure repro-duced from Bai et al, (2017).60
Novel UV filtering nanomaterials have been explored throughout the 21st century, with
various alternatives to TiO2 and ZnO displaying prominent UV absorptive properties ri-
valling those of the currently approved inorganic UV filters. These include such doped
and undoped variants of cerium oxides (CeO2), iron oxides (Fe2O3), tin oxides (SnO2) as
well as biocompatible polymeric nanoparticles and organic/inorganic hybrid nanomateri-
als.61–65 A major drawback with developing new UV filtering ingredients, in particular
inorganic based filters, is the extensive level of physical, chemical and biological charac-
terisation required to be submitted to regulating bodies before approval can be given.66
This can be a timely and costly process, so manufacturers prefer to work with currently
approved UV filters. This could be adjusting loading concentrations or testing certain
combinations of different filters to achieve high levels of UV protection. Additionally
for inorganic UV filters, manufacturers are given some limited free range to manipulate
the physical properties of these nanomaterials. In the case of inorganic TiO2 UV filtering
12
1.4 Research Objectives and Thesis Outline
nanoparticles, the TGA have recently adopted guidelines outlined by the European Union
(EU) Scientific Committee on Consumer Safety (SCCS) based upon recommendations
made in an earlier report.67, 68 One of the critical components stipulated by these guide-
lines for TiO2 nanomaterials is to ensure that they do not have photocatalytic activity or,
at most, up to 10% photocatalytic activity compared to a corresponding non-coated or
non-doped reference material. Thus the possibility for exploring different coating mate-
rials and methods for applying these materials is relatively open, provided the resultant
composite can adhere to the guidelines outlined.
1.4 Research Objectives and Thesis Outline
Both TiO2 and ZnO nanomaterials are used in consumer products such as sunscreens,
however, concerns have been raised over the safety of these materials due to a combina-
tion of their nanometric scale, photocatalytic properties and the subsequent toxicological
effects that may result. Thus, one focus of this thesis was to explore pathways for re-
ducing the photocatalytic activity of such nanomaterials, in particular TiO2 nanoparticles,
or consider alternative materials that may display similar, if not, improved sunscreen rel-
evant properties compared to current inorganic UV filters. Finally, after assessing the
most ideal methodology for inhibiting photocatalysis, based upon a literature review, new
nanocomposite variants based upon TiO2 nanoparticles will be developed and assessed
for applicability in sunscreen products. The individual aims of this research thesis in-
clude:
(a) To develop and optimize a methodology for synthesizing TiO2 nanoparticles of
specific physical and chemical characteristics suitable for UV filtration.
(b) To investigate and prepare a polymer/TiO2 nanocomposite material and to assess
the suitability of the encapsulation process used as a means of inhibiting the pho-
tocatalytic activity of the core metal oxide nanoparticles whilst still maintaining
adequate levels of UV protection.
(c) To develop a metal oxide/TiO2 nanocomposite material with deposition of poten-
13

1.4 Research Objectives and Thesis Outline
tially free radical scavenging nanoparticles in the form of CeO2 and to assess the
effects of these particles of the UV absorptive and photocatalytic properties of the
composite material, under both UV and solar-simulated light irradiance.
(d) To combine TiO2 nanoparticles that display ideal physical and chemical properties
for use as an inorganic UV filter with free radical scavenging CeO2 nanoparticles
and to assess the changes in UV protection afforded and photocatalytic activity
exerted.
(e) To assess the cytotoxic and phototoxic potential of TiO2 and TiO2-based nanoma-
terials towards a selected human skin epithelial cell line.
The research conducted over the course of this PhD thesis and the content of this thesis is
split into several chapters as described below:
Chapter 1 Provides a general introduction into nanotechnology, nanomaterials and their
application in commercial products. In addition, an overview of UV radiation and its
geographical incidence is provided. The connection between UV radiation, commercial
sunscreen products and nanotechnology is given. Finally, the key motivations and goals
of this thesis work are given.
Chapter 2 A detailed review of current and past literature pertaining to the effects of
UV radiation and the role of ROS in human health complications is given. Furthermore,
an overview of sunscreen products, their regulation in Australia and the role and function
of active ingredients in these products is outlined. A thorough analysis of the potential
dangers of inorganic metal oxide nanoparticles present in sunscreen products is also given
and current methodologies for minimizing consumer concern in relation to these particles
is shown. An introduction to alternative inorganic UV filtering ingredients is also given,
however, the main focus of thesis work is on the modification of currently approved TiO2
based nanoparticles.
14
1.4 Research Objectives and Thesis Outline
Chapter 3 This encompasses the physical, chemical and biological methods employed to
synthesize and characterise the various nanomaterials studied in this thesis work. A brief
outline of the characterisation techniques used to investigate various physical, chemical
and biological properties of the nanomaterials prepared, including particle size, morphol-
ogy, elemental composition, crystal phase composition, optical properties, photocatalytic
properties and cytotoxic properties, is given followed by a procedural outline of the ex-
periments performed.
Chapter 4 Presents a study focussed on the development and characterisation of a nanocom-
posite material based upon the encapsulation of TiO2 nanoparticles by a natural polymer,
chitosan. The study highlights the effectiveness of the encapsulation process in terms of
mitigating the photocatalytic properties of the core TiO2 nanoparticles as well as its effect
on the optical properties of the resultant material. The applicability of the encapsulation
process as an alternative to current commercial coating methods of sunscreen based TiO2
is assessed.
Chapter 5 Focusses on the compatibility of potentially free-radical scavenging CeO2
nanoparticles and commercial TiO2 nanoparticles bound together through a chemical pre-
cipitation method. The effect of CeO2 loading on the optical and photocatalytic properties
of the core TiO2 nanoparticles under both UV and solar-simulated light irradiance were
assessed. In addition, the biological effects of the nanocomposite material, as compared
to the pristine components, were assessed through cytotoxic and phototoxic assays per-
formed using human keratinocyte (HaCaT) cells.
Chapter 6 An in-depth study on the development of TiO2 nanoparticles and CeO2/TiO2
nanocomposites focussed on addressing specific criteria pertaining to certain materials
parameters for sunscreen based TiO2 is given. The study covers the initial optimization
of synthesis parameters in producing TiO2 nanoparticles of the rutile crystal phase. Fol-
lowed by this, a comparative investigation of the optical and photocatalytic properties of
15

1.4 Research Objectives and Thesis Outline
the rutile TiO2, a CeO2/TiO2 nanocomposite prepared using the rutile TiO2 and commer-
cial TiO2 nanoparticles is presented.
Chapter 7 Summarizes the outcomes of this thesis work and addresses the future work
needed to be undertaken.
16
Chapter 2
Literature Review
2.1 UV and its Effects on Humans
Terrestrial solar light is a major source of incident UV radiation, particularly in the wave-
length region of 290 - 400 nm which comprise the biologically relevant UVB and UVA
wavelength bands. Exposure to UV radiation has long been linked to the generation of
harmful cancers such as malignant melanoma.69 It has also lead to the development of
consumer products designed to provide protection from these high energy wavelengths,
as well as the promotion of health awareness campaigns to further aid in educating the
general public and increase awareness of the risks of UV exposure. Small doses of UV
radiation are still necessary for humans, particularly for the synthesis of vitamin D. Ab-
sorption of UVB radiation (around 300 nm) has been shown to stimulate the production
of vitamin D firstly through the conversion of 7-dehydrocholesterol to previtamin D fol-
lowed by isomerisation to vitamin D3 by the kidneys and liver.70, 71 Additional reported
benefits of UV exposure include treatment and prevention of certain skin and non-skin
related diseases, such as atopic dermatitis, rickets and psoriasis, as well as increasing cu-
taneous melanin count, providing a very minimal amount of natural sun protection.72, 73
However, more often than not, people are subjected to periods of exposure to terrestrial
UV far exceeding what is required, thus leading to a variety of photo-induced skin re-
lated health issues and diseases. The major concern associated with UV exposure is its
carcinogenic effect, however, a range of additional side effects are implicated such as im-
17

2.1 UV and its Effects on Humans
munosuppression, erythema (sunburn) and premature skin ageing. This section will give
an overview of free radicals and ROS and will include an outline of their role in regu-
lar cellular metabolic processes as well as various diseases. In addition, an outline of the
deleterious effects of UV exposure on biological tissues will be given as well as an outline
of the mechanisms involved in these effects.
2.1.1 Free-radicals and the Human Body
A major factor in health-related issues associated with UV exposure to the body is the pro-
duction of free radicals. Free radicals are molecular species containing one or more un-
paired electrons in an atomic orbital.74 This means that, generally, free radicals are highly
unstable, reactive and are capable of donating or accepting an electron, thus acting as both
an oxidising or reducing agent.75 The abstraction of an electron from biomolecules results
in the start of a series of chain reactions which, if left unchecked, can cause cellular dam-
age.76 Some of the most important free radical species in biological systems are those
derived from oxygen and include the following generated through oxygen or indirectly
from oxygen through catalysis by a transition metal:
O2 + e−→ O2•− (2.1)
O2 +2e−+2H+→ H2O2 (2.2)
2O2•−+2H+→ H2O2 +O2 (2.3)
O2•−+H2O2→ OH•+OH−+O2 (2.4)
H2O2 +Fe2+→ OH•+OH−+Fe3+ (2.5)
Of these three main ROS molecules, superoxide (O2•−), hydrogen peroxide (H2O2) and
hydroxyl radical (OH•), the hydroxyl radical is considered the most reactive and damag-
18
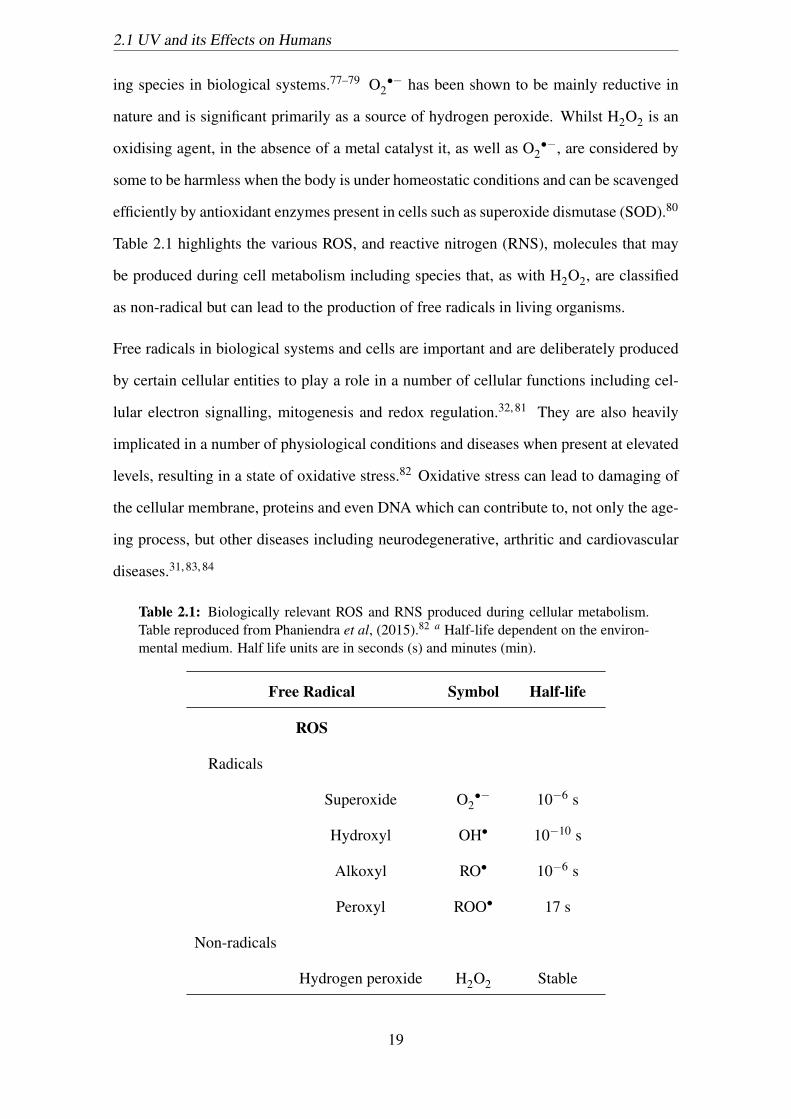
2.1 UV and its Effects on Humans
ing species in biological systems.77–79 O2•− has been shown to be mainly reductive in
nature and is significant primarily as a source of hydrogen peroxide. Whilst H2O2 is an
oxidising agent, in the absence of a metal catalyst it, as well as O2•−, are considered by
some to be harmless when the body is under homeostatic conditions and can be scavenged
efficiently by antioxidant enzymes present in cells such as superoxide dismutase (SOD).80
Table 2.1 highlights the various ROS, and reactive nitrogen (RNS), molecules that may
be produced during cell metabolism including species that, as with H2O2, are classified
as non-radical but can lead to the production of free radicals in living organisms.
Free radicals in biological systems and cells are important and are deliberately produced
by certain cellular entities to play a role in a number of cellular functions including cel-
lular electron signalling, mitogenesis and redox regulation.32, 81 They are also heavily
implicated in a number of physiological conditions and diseases when present at elevated
levels, resulting in a state of oxidative stress.82 Oxidative stress can lead to damaging of
the cellular membrane, proteins and even DNA which can contribute to, not only the age-
ing process, but other diseases including neurodegenerative, arthritic and cardiovascular
diseases.31, 83, 84
Table 2.1: Biologically relevant ROS and RNS produced during cellular metabolism.Table reproduced from Phaniendra et al, (2015).82 a Half-life dependent on the environ-mental medium. Half life units are in seconds (s) and minutes (min).
Free Radical Symbol Half-life
ROS
Radicals
Superoxide O2•− 10−6 s
Hydroxyl OH• 10−10 s
Alkoxyl RO• 10−6 s
Peroxyl ROO• 17 s
Non-radicals
Hydrogen peroxide H2O2 Stable
19

2.1 UV and its Effects on Humans
Singlet oxygen 1O2 10−6 s
Ozone O3 s
Organic peroxide ROOH Stable
Hypochlorous acid HOCl Stable (min)
Hypobromous acid HOBr Stable (min)
RNS
Radicals
Nitric oxide NO• sa
Nitrogen dioxide NO2• s
Non-radicals
Peroxynitrate ONOO− 10−3 s
Nitrosyl cation NO+ s
Nitrosyl anion NO− s
Dinitrogen trioxide N2O3 s
Dinitrogen tetraoxide N2O4 s
Nitrous acid HNO2 s
Peroxynitrous acid ONOOH Fairly stable
Nitryl chloride NO2Cl s
Sources of Important ROS in Biological Systems
Free radicals are produced by cellular entities as part of the normal metabolic progression
of cells and in response to certain external stimuli. The production of free radicals in bio-
logical systems generally arises through a chain-type reaction and can be self-propagating
(Equations 2.1 - 2.5).
One of the most common free radicals generated is the ROS, O2•−. The main source
of O2•− is as an accidental by-product of the mitochondrial electron transport chain.85
20
2.1 UV and its Effects on Humans
In this process, electrons from reduced nicotinamide adenine dinucleotide (NADH) are
passed through a series of enzymatic electron donors and acceptors to convert molecular
oxygen into water. This transfer of electrons creates a proton gradient across the mem-
brane of the mitochondria and enables the production of adenosine triphosphate (ATP).
The production of O2•− occurs due to direct leakage of a single electron from the trans-
port chain that reduces oxygen into a ROS (approximately 1 - 2 % incidence rate).86, 87
O2•− also forms during autoxidation of haemoglobin, a process that can occur at physio-
logical pH due to the higher redox potential of oxygen compared to iron, and is enhanced
when in a state of hypoxia (oxygen deficiency).88, 89If not adequately dismutated, O2•−
can serve as the starting point for other free radicals or cellular damaging species. For
instance, under oxidative stress or certain pathological conditions, the intensification of
haemoglobin autoxidation enables nitric oxide to react with O2•− to produce ONOO−,
a powerful oxidant that can initiate a cascade of ROS generation, leading to protein and
DNA damage.90, 91 It has also been established that O2•− is generated through the acti-
vation of nicotinamide adenine dinucleotide phosphate (NADPH) oxidase by phagocytic
immune cells when in the process of consuming and breaking down microbes.92
Although not a free radical in itself, H2O2 is important as it acts as a generator for both
radical and non-radical species. It is also permeable to cell membranes and can be sig-
nificantly biologically damaging to cells, mainly acting as a precursor to harmful radicals
such as OH•. It has long been known that H2O2 is produced as a by-product of oxy-
gen metabolism, whereby, oxygen consumed by mitochondria is first converted to O2•−,
then H2O2.93 Another major source of H2O2 is through autoxidation or redox cycling
of various xenobiotics, as well as physiological compounds such as heme and flavopro-
teins.94, 95 This autoxidation process of flavoproteins also contributes to the production of
O2•−. The reason for this due to the nature of the electron transfer within the flavoprotein
and its various redox moieties. Thus, in the initial electron transfer step, if oxygen is
present, a free electron can hop to it and form O2•−. At this stage, O2
•− may escape the
newly formed flavosemiquinone and propagate further production of O2•− molecules or,
it can undergo spin inversion and form a peroxy adduct with flavoprotein, leading to the
21

2.1 UV and its Effects on Humans
eventual cleavage and release of H2O2.96, 97
The neutral OH• radical is a highly reactive radical known to cause oxidative damage to
both organic and inorganic biomolecules varying from proteins, lipids and even DNA.98, 99
The primary mode of generation for OH• is through the Fenton reaction (Equation 2.5)
of H2O2, catalysed by metal ions such as Fe2+ and Cu+ bound in proteins such as ferritin
and ceruloplasmin. The propagation of OH• can also be further increased when cells are
under oxidative stress, whereby, elevated levels of O2•− enable the release of free metal
ions from complexed proteins, allowing for more efficient catalysis of H2O2. Mitochon-
dria are thought to be the prime region for OH• production within cells due to the close
proximity of precursor and catalyst molecules within the mitochondrial matrix.99 Thus
under mitochondrial oxidative stress conditions, OH• production is favoured and driven
by the reduction of Fe3+ by O2•−, leading to substantial cellular damage.
External stimuli also contribute to the generation of ROS (and RNS) in multicellular or-
ganisms. Ionizing radiation, such as X-ray and γ radiation can cause extensive cellular
damage due to the production of ROS. Although sufficient in energy to directly excite
biomolecules, H2O being the major constituent of cells leads to the generation of ROS
and an indirect mechanism for radiation damage.100 Irradiation of water with such high
energy radiation can result in one of two events occuring. The water may be ionized to
produce a free electron and charged water molecule, which can both interact with other
water molecules or break down further to produce free radical species such as OH• or the
hydrogen radical, H•. Alternatively, irradiated water may undergo a process known as ly-
sis, in which the molecule is immediately broken into free radical components consisting
of the OH• and H• species. Cosmic rays are a major source of such ionizing radiation,
however, much of it is absorbed and scattered in the earth’s upper atmosphere before
reaching the earth’s surface. Background radiation that is experienced at the surface of
the planet is estimated to induce oxidative free radical damage on orders of magnitude less
than that of the natural processes of aerobic cells thanks largely in part to the shielding of
such cosmic rays.101, 102
22
2.1 UV and its Effects on Humans
Role of Important ROS in Biological Systems
At moderate to low concentrations, ROS can play a role in various physiological functions
including cell signalling, the immune response, mitogenesis and redox regulation.81, 82, 103
H2O2 is produced in all aerobic organisms as a by-product of normal cellular processes
but it can also be produced in response to various stimuli including cytokines and growth
factors.104–106 It can contribute to various biological signalling pathways such as stim-
ulation of cell growth, differentiation and apoptosis.107–110 The response to H2O2 can
vary between different types of cells and its concentration. For instance, in mammalian
cells the expression of different p53-regulated genes is reflected in the different levels of
H2O2 present within the cell. At low H2O2 levels, antioxidants are produced so as miti-
gate further ROS production and prevent oxidative damage whilst at high levels of H2O2,
pro-oxidants are produced to enhance oxidative damage and induce apoptosis.111 H2O2
is also involved in the functioning of various transcription factor kinase and phosphatase
type proteins. An example of this is the oxidation of the bacterial transcriptional activa-
tor, OxyR. Selective oxidation of the cysteine residues by H2O2 of the protein enables
the transcription of antioxidant genes, which aid in promoting cell growth and survival
in response to elevated ROS levels.112 H2O2 has also been shown to be involved in the
activation of human T-cells and B-cells. It acts primarily as a redox modifier that enables
oxidation of cysteine residues in important signalling molecules involved in the activation
of these immune cells.113, 114
As mentioned prior, O2•− also plays a role in the immune response, particularly towards
microbial pathogens. Electron transfer from membrane-bound NADPH oxidase proteins
on phagocytic immune cells to molecular oxygen results in the generation of O2•−. O2
•−
then serves as the starting point for the generation of other ROS which can also aid in
the immune response, provided the generation rate is tightly regulated (too much ROS
may cause damage to surrounding tissues).115 These subsequent ROS include ONOO−
(through reaction with NO) and HOCl (through reaction with H2O2 and Cl− catalysed by
myeloperoxidase), as well as non-ROS H2O2 (through dismutation with SOD) which fur-
ther contribute to ROS generation.116, 117 Extracellular release of these ROS enable oxida-
23
2.1 UV and its Effects on Humans
tive degradation of incident bacterial and fungal pathogens. The secretion of O2•− inside
of phagolysosome formed during phagocytosis is also of importance as it aids in initiating
the release of proteases that allow for the degradation of ingested pathogens.115, 118
Regulation of Important ROS in Biological Systems
Homeostasis of the intracellular free radical system is essential for proper cell functional-
ity and survival. As such, cells are equipped with extensive antioxidant defences for regu-
lating intracellular free radical levels. Examples of enzymatic antioxidant entities include
SOD, peroxiredoxins (PRX), gluthione peroxidases (GPX) and catalase (CAT).29, 119 Hu-
mans contain three variants of SOD, each with different metal-centres. These include
copper/zinc (Cu/Zn)-SOD, located generally in the cytoplasm and extracellular space of
cells and manganese (Mn)-SOD, generally occurring in the mitochondria.120 Some en-
zymatic antioxidants simply convert specific ROS from one form to another, as is the
case with SOD’s and their role in the conversion of O2•− to H2O2.121 As such, combi-
nations of antioxidant enzymes work together to minimize the concentration of free ROS
in cells and to maintain appropriate levels needed for proper cell functionality. Thus,
H2O2 is subsequently removed from cells by CAT and/or GPX peroxidases by converting
it to H2O and O2.122 Antioxidant enzyme activity can also be regulated by modifica-
tion of the protein post-synthesis. In this manner, concentration gradients of ROS can be
established in selective/appropriate locations throughout the body to contribute towards
biological signalling in response to certain cellular stimuli. An example of this is the
action of PRX in removing peroxides and peroxynitrates. Reduction of these species re-
quires an initial disulfide reduction of the antioxidant by thioredoxin before scavenging
may occur.123
Non-enzyme antioxidants include compounds such as vitamin C (ascorbic acid), vitamin
E (which encompasses a variety of lipophilic molecules such as α-, β - and γ-tocopherol),
uric acid and glutathione. Non-enzymatic antioxidants tend to be indiscriminate in their
activity, whereas, enzymatic antioxidants generally act specifically towards a particular
free radical species.124 Furthermore, antioxidant vitamins cannot be produced by the
24
2.1 UV and its Effects on Humans
body naturally, and generally need to be obtained through dietary measures. Vitamins
act as free-radical ’chain-breakers’ as they generally cannot scavenge radicals such as
OH• but instead work in close proximity to the cell membrane to mitigate lipid peroxi-
dation. For instance, α-tocopherol is an efficient lipid peroxyl radical (LOO•) scavenger
that intercepts and terminates lipid peroxidation chain reactions induced by ROS such as
OH•.125 Uric acid is a potent antioxidant compound and the most abundant aqueous an-
tioxidant found in human plasma.126 Although not a direct scavenger of O2•−, it can scav-
enge, carbon-centred radicals, peroxyl radicals (ROO•−) and peroxynitrate (ONOO−) in
hydrophilic environments. When in the presence of ascorbic acid, it has also been shown
to be important in preventing the uncoupling of nitric oxide synthases that help modu-
late blood pressure and regulate smooth muscle relaxation and vasodilation through the
production of nitric oxide (NO).127–129
Detrimental Effects of Important ROS in Biological Systems
Although the presence of ROS species is important in maintaining regular cellular func-
tionality, when at appropriate concentrations, an excess of these species can induce a state
of oxidative stress. This imbalance occurs when the rate of generation of ROS (or free-
radicals in general) in a cell is outweighed by its capacity to remove them. In absence
of adequate antioxidant defences, excess ROS can lead to oxidative damage of important
cellular features including the membrane, organelles, lipids, proteins, the nucleus and
DNA.130–132 These elevated levels of ROS in cells have been implicated in a variety of
physiological and neurological diseases due to their deleterious effects.
As a result of the potential oxidative damage that may occur to DNA in cells, ROS induced
oxidative stress has been suggested to be a cause for certain cancers. Oxidative damage
to DNA can result in strand breaks, base pair lesions, DNA cross-linking and rearrange-
ment of base pairs which in turn can lead to transcription errors, abnormal cell growth
and the activation of oncogenes.133 Metastasis of cancer cells have also been suggested
to be aided by ROS as they can regulate and activate relevant signalling pathways and
transcription activities. For instance, certain mitogen-activated protein kinases (MAPK),
25
2.1 UV and its Effects on Humans
which can regulate cell growth, differentiation, mitosis and apoptosis, have been shown
to be activated through oxidative processes by ROS without the need for accompanying
ligands.134 Elevated levels of ROS and a state of oxidative stress have also been impli-
cated in neurological diseases, including Alzheimer’s disease. Oxidative stress in the cells
composing brain tissue is of major concern due to the abundance of lipids susceptible to
oxidative damage and the lack of means for binding free metal ions which can catalyse
ROS production, as compared to other tissues. Experimental evidence has also shown
that the production of β -amyloid, a toxic peptide found at elevated levels in patients with
Alzheimer’s disease, is reliant on oxidative action by ROS.135 Without an efficient an-
tioxidant system, mitochondrial dysfunction in cells can result in the excessive release of
ROS, oxidative stress and β -amyloid formation, contributing to the ageing process and
neuron degeneration in diseases such as Alzheimer’s.136 Other neurological diseases for
which ROS play a role include Parkinson’s disease, amyotrophic lateral sclerosis (ALS)
and multiple sclerosis.137 There is also evidence to suggest that oxidative stress, and thus
ROS, play an important role in the development of cardiovascular diseases such as hyper-
tension, atherosclerosis and heart failure, kidney diseases such as renal failure and uremia
as well as rheumatoid arthritis.138–140
2.1.2 UV-induced Human Health Conditions
Extensive UV exposure has traditionally been associated with erythema (sunburn), but a
number of physiological issues may arise in addition to this. These UV induced conditions
are influenced by, not only the dosage of UV, but also the absorbing chromophore. ROS
and the generation of ROS also play a significant role in these UV-induced health condi-
tions, which include immunosupression, premature skin ageing and skin cancer.
Immunosuppression
Langerhan cells in the skin help regulate the immune response to skin-related diseases
by communicating with both T and non-T cell lymphocytes. In combination with cy-
tokine releasing keratinocytes and lymph nodes, the collective system is termed ’skin-
associated lymphoid tissues’.141 Exposure to UV radiation, leading to subsequent DNA
26
2.1 UV and its Effects on Humans
damage (as DNA is an inherent chromophore for a broad range of UV wavelengths),
has been suggested to induce immunosuppression by affecting these skin-associated lym-
phoid tissues at the sites of irradiation.142 The regular response of Langerhan cells to
skin-associated diseases results in the secretion of cytokines interleukin (IL)-12 and IL-4.
IL-12 promotes the differentiation of naive T-cells into T-helper type 1 (Th1) cells, which
inhibit the production of T-helper 2 (Th2) cells and up-regulates IL-12 and interferon-γ
(IN-γ) production.143, 144 IN-γ further aids in regulating the immune response by down-
regulating Th2 cell activity and activating macrophages. IL-4 operates to modulate and
suppress the immune response towards foreign entities by promoting Th2 differentiation.
Th2 cells in turn produce a variety of cytokines which suppress macrophage activity and
activate a type of white blood cell called eosinophils.71 The combined activation of these
factors leads to a down-regulation of Th1 cells and overall suppression of the Th1 cell
mediated immune response.145 In vitro and in vivo investigations have shown that UV
exposure can disrupt the immune response upon irradiation by impacting the ratio and
activity of Th1 and Th2 cells.28, 146, 147 Simon et al, (1990) showed functional inactiva-
tion of Th1 cells in C3H/HeN mice exposed to UVB (200 J/m2/day) radiation by showing
significant decreases in the production of IN-γ and IL-2 cytokines between irradiated/non-
irradiated mice, whilst also showing minimal changes in Th2 relevant cytokines.28 Also
through a mouse model, Elnazar et al, (2015) demonstrated a suppression of IL-12 for
specimens exposed to UVB and overall shifts in Th1/Th2 cell responses.148 Nishigori et
al, (1996) also showed suppression of T-cell mediated immune responses in vitro using
murine keratinocytes after exposure to UV radiation.149 It was suggested that unrepaired
DNA damage caused by the irradiation process lead to the production of cytokines that
down-regulate the immune response. UV-mediated immunosuppression has also been
implicated as an indirect cause of skin cancer, with evidence of higher risks of incidence
associated with patients undergoing immunosuppressive therapies.150, 151 Photoperoxida-
tion of polyunsaturated phosopholipids in keratinocytes has also been implicated in UV-
induced immunosuppression. The increased levels of ROS due to UVA exposure in these
cells results in the production of platelet-activating factor (PAF)-like ligands that play a
27
2.1 UV and its Effects on Humans
role in the suppression of the immune system which, when produced in combination with
UV exposure, help promote metastasis and tumor growth.152–154
Premature Skin Ageing
Skin ageing is a natural-occurring process that can be influenced and accelerated by a
number of factors which include genetics, hormonal changes, metabolic processes, time
and environmental factors.155 Substantial experimental evidence has shown that prema-
ture skin ageing, or photoageing, is linked and strongly caused by cumulative exposure to
terrestrial solar radiation.27 Collagen and elastin are the major components of the extracel-
lular matrix which aid in binding tissues and providing structural and biochemical support
for surrounding cells, particularly in the skin. Secretion of type-I procollagen (precursor
compound to collagen) into the dermal extracellular tissue occurs in health skin where
it undergoes a process called fibrillogenesis. In this process, the procollagen structure is
rearranged to associate with other extracellular matrix proteins and to form collagen bun-
dles, which give the skin its strength and elasticity.156 Studies have shown that specific
exposure to UV radiation can induce damage to these bundles and other skin connective
tissues, resulting in a loss of skin elasticity.155 The biological cause of this damage is
believed to be linked to the photochemical generation of ROS, resulting in activation of
certain cellular signalling pathways and the activation of certain endoproteinases.
UV absorbing chromophores endogenous to the human body include the NADH/NADPH
cofactor, trans-urocanic acid and tryptophan. Energy transfer from these entities to molec-
ular oxygen produces O2•−, which may be dismutated to H2O2 by SOD and subsequently
be converted to OH• if in the presence of Fe3+ or Cu+.157 The increased production
of O2•− can also amplify MAPK signalling pathways primarily through the activator
protein (AP)-1 effector.155 AP-1 is a transcription factor that regulates genes governing
cellular growth and differentiation as well as regulate the activity of matrix metallopro-
teinases (MMP). These MMP’s are a group of endoproteases that, collectively, can de-
grade all manner of extracellular proteins and are generally produced by cells in an inac-
tive form (zymogen). Upon UV exposure and the increased production of AP-1, MMP’s
28

2.1 UV and its Effects on Humans
become up-regulated and contribute to premature skin ageing through activation of MMP-
1, MMP-3 and MMP-9 which collectively can degrade type I,II, IV fibrillar collagens and
collagen fragments. The activation of these MMP’s has been shown to occur in vivo in
human skin exposed to UV light and is consistent with the collagen breakdown observed
after irradiation.158 Furthermore, the UV mediated activation of AP-1 further contributes
to skin-ageing by inhibiting the production of new collagen by down-regulating the genes
that encode for type I procollagen, thus furthering UV-induced skin damage.
The extent of UV-induced skin ageing and skin damage has been investigated in a few
studies. A study of a Queensland population with individuals aged 20 to 55 years found
that 72% of young men and 47% of women (aged between 20-29 years) displayed skin
characteristics of moderate to severely photoaged skin.159 Another study demonstrated
that Australian adults are much more susceptible to photoageing than European adults,
owing to the higher intensity of incident UV radiation present in the subtropics.160, 161This
difference in UV incidence based on geographical location has been further demonstrated
in a study by Fritschi et al, (1995), whereby, 33% of schoolchildren between the ages
of 13 and 15 years in Scotland displayed signs of mild skin damage as compared to the
40-70% rate of incidence for Queensland children.162
Skin Cancer
Exposure to UV radiation has long been linked to the formation of non-melanoma and
melanoma skin cancers, which are the most common forms of carcinomas that occur. A
more detailed overview of the mechanisms behind UV-induced carcinogenesis is given in
Section 2.1.3, but a brief introduction to the different skin cancers that may be induced by
UV radiation is given here.
Squamous cell carcinoma (SCC) and basal cell carcinoma (BCC) are typically the most
common forms of non-melanoma skin cancers and are highly prevalent in Australia. Both
SCC and BCC may originate from stem or progenitor cells found in the stratum basale
of the epidermis, the outer most layer of skin, whilst BCC can additionally arise from the
bulge region of hair follicles.163, 164 SCC frequently occurs due to chronic UV exposure
29
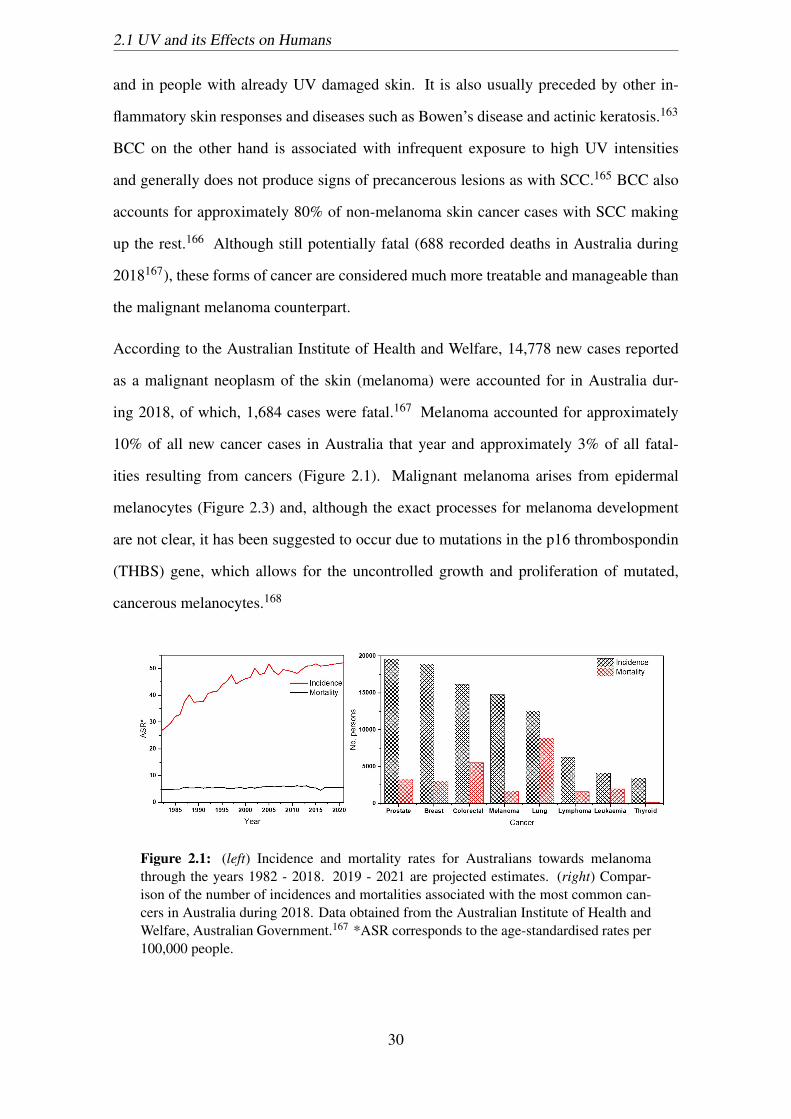
2.1 UV and its Effects on Humans
and in people with already UV damaged skin. It is also usually preceded by other in-
flammatory skin responses and diseases such as Bowen’s disease and actinic keratosis.163
BCC on the other hand is associated with infrequent exposure to high UV intensities
and generally does not produce signs of precancerous lesions as with SCC.165 BCC also
accounts for approximately 80% of non-melanoma skin cancer cases with SCC making
up the rest.166 Although still potentially fatal (688 recorded deaths in Australia during
2018167), these forms of cancer are considered much more treatable and manageable than
the malignant melanoma counterpart.
According to the Australian Institute of Health and Welfare, 14,778 new cases reported
as a malignant neoplasm of the skin (melanoma) were accounted for in Australia dur-
ing 2018, of which, 1,684 cases were fatal.167 Melanoma accounted for approximately
10% of all new cancer cases in Australia that year and approximately 3% of all fatal-
ities resulting from cancers (Figure 2.1). Malignant melanoma arises from epidermal
melanocytes (Figure 2.3) and, although the exact processes for melanoma development
are not clear, it has been suggested to occur due to mutations in the p16 thrombospondin
(THBS) gene, which allows for the uncontrolled growth and proliferation of mutated,
cancerous melanocytes.168
Figure 2.1: (left) Incidence and mortality rates for Australians towards melanomathrough the years 1982 - 2018. 2019 - 2021 are projected estimates. (right) Compar-ison of the number of incidences and mortalities associated with the most common can-cers in Australia during 2018. Data obtained from the Australian Institute of Health andWelfare, Australian Government.167 *ASR corresponds to the age-standardised rates per100,000 people.
30
2.1 UV and its Effects on Humans
The incidence of skin cancers are also inherently linked to a persons phenotype and sus-
ceptibility to UV damage. Light skinned individuals with freckles, light coloured eyes
and an inability to tan are at greater risk of skin cancer incidence.169 Men are also much
more likely to develop BCC or SCC cancers than women, which may be attributable to
increased exposure to UV radiation during outdoor leisure activities.166 Inherited dis-
eases are also linked with increased prevalence of skin cancers. Xeroderma pigmentosum
(colloquially known as vampire syndrome) is an inheritable genetic disease that affects
the ability for skin cells to repair UV damaged DNA. As a result, individuals with this
condition are highly susceptibility to all forms of skin cancers brought about by UV ex-
posure.
2.1.3 Human Skin Exposure to UV Radiation and DNA Damage
Extreme UV radiation (10 nm ≤ λ ≤ 120 nm) is some times classified as a type of ion-
izing radiation, capable of stripping atoms and molecules from biological tissues and
altering the course of chemical reactions in the body.170 Terrestrial UV radiation, typ-
ically in the wavelength range of 290 - 400 nm, is also capable of inducing biological
changes and mutations. The natural source of UV radiation provided by sunlight means
people are exposed to UV on a daily basis. The harmful effects associated with UV ra-
diation are strongly dependent on the length of exposure, the susceptibility of individuals
and the wavelengths of the incident UV radiation. Many organisms, humans included,
contain UV-absorbing pigments to act as a first line of defence, however this type of ra-
diation is still capable of penetrating through superficial tissue and reaching DNA.171–173
The major factors involved in the carcinogenic effect of UV radiation include generation
of mutations in key proto-oncogenes and tumour suppressor genes which help regulate
apoptosis, DNA repair and cell division/arrest.71, 174 The mechanisms behind the carcino-
genic effects of extended UV exposure vary between UVA and UVB wavelengths and are
inherently linked to their fundamental photon energies and permeation capabilities.
31
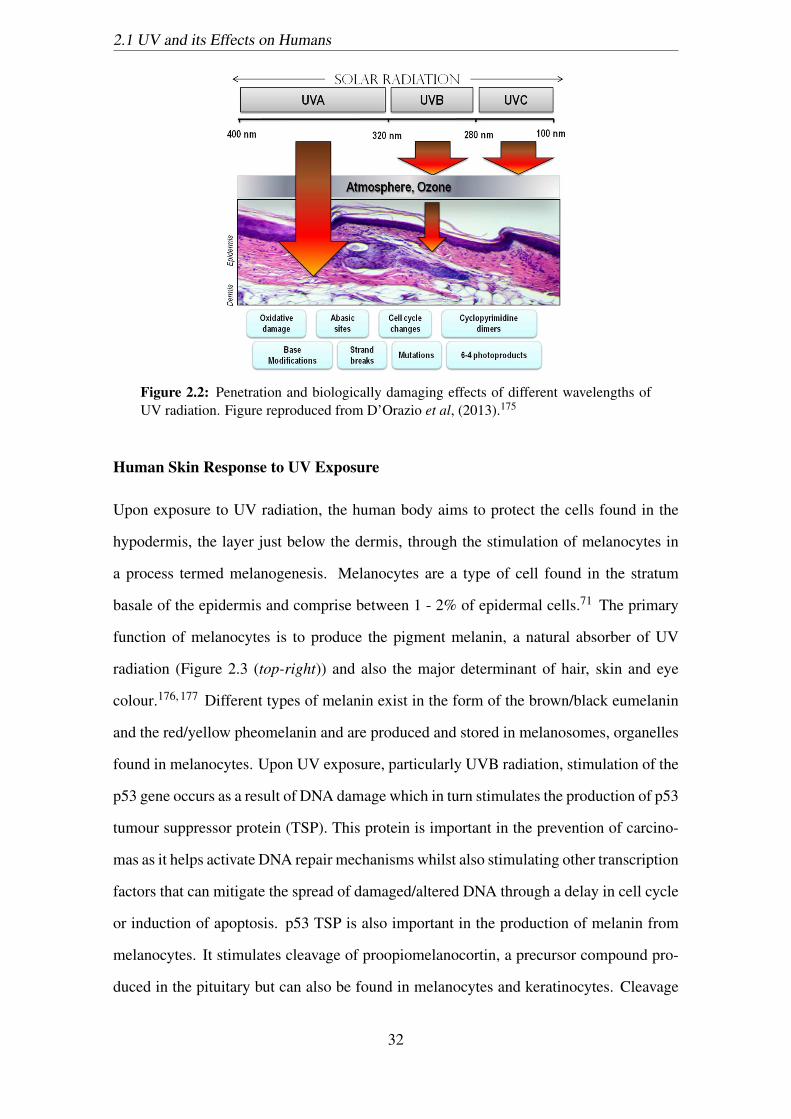
2.1 UV and its Effects on Humans
Figure 2.2: Penetration and biologically damaging effects of different wavelengths ofUV radiation. Figure reproduced from D’Orazio et al, (2013).175
Human Skin Response to UV Exposure
Upon exposure to UV radiation, the human body aims to protect the cells found in the
hypodermis, the layer just below the dermis, through the stimulation of melanocytes in
a process termed melanogenesis. Melanocytes are a type of cell found in the stratum
basale of the epidermis and comprise between 1 - 2% of epidermal cells.71 The primary
function of melanocytes is to produce the pigment melanin, a natural absorber of UV
radiation (Figure 2.3 (top-right)) and also the major determinant of hair, skin and eye
colour.176, 177 Different types of melanin exist in the form of the brown/black eumelanin
and the red/yellow pheomelanin and are produced and stored in melanosomes, organelles
found in melanocytes. Upon UV exposure, particularly UVB radiation, stimulation of the
p53 gene occurs as a result of DNA damage which in turn stimulates the production of p53
tumour suppressor protein (TSP). This protein is important in the prevention of carcino-
mas as it helps activate DNA repair mechanisms whilst also stimulating other transcription
factors that can mitigate the spread of damaged/altered DNA through a delay in cell cycle
or induction of apoptosis. p53 TSP is also important in the production of melanin from
melanocytes. It stimulates cleavage of proopiomelanocortin, a precursor compound pro-
duced in the pituitary but can also be found in melanocytes and keratinocytes. Cleavage
32

2.1 UV and its Effects on Humans
of this precursor results in the synthesis and secretion of α-melanocyte stimulating hor-
mone (α-MSH) which acts upon melanocortin receptors, the most important of which is
the melanocortin-1 receptor (MC1R).178, 179 Notably, variances in the MC1R gene is of-
ten associated with increased risk of SCC, BCC and melanoma skin cancers as mutation
of this gene has been consistently found in people with these diseases.180
Figure 2.3: (left) The molecular and biological steps involved in response to UV expo-sure. (top-right) Absorption spectra of eumelanin (dashed line) and pheomelanin (solidline) along with (bottom-right) corresponding chemical structures. Figures reproducedfrom Garibyan et al, (2010)71 and Tran et al, (2006),181 respectively.
Activation of extracellular MC1R leads to elevated levels of cyclic adenosine monophos-
phate (cAMP), an important intracellular secondary messenger that increases transcrip-
tion of microphthalmia-associated transcription factor (MITF) in melanocytes.71 From
this, initiation of melanin synthesis from tyrosine occurs with the subsequent pigments
being stored in melanosomes. Melanosomes containing melanin are exported to ker-
atinocytes via pseudopodia, temporary projections of the melanocyte cell membrane that
may be engulfed by adjacent kertinocytes. Differentiation in skin pigmentation arises due
to differences in the number, size, composition and distribution of these melanosomes
in keratinocytes,176 not the melanocyte number. These melanosomes are then positioned
over the nuclei in keratinocytes to aid in UV protection (nuclear ’capping’) and prevent
further nucleic DNA damage. The increased activity of these melanocytes upon UV ex-
posure, both UVA and UVB, and increase in pigmentation is actually a delayed tanning
33
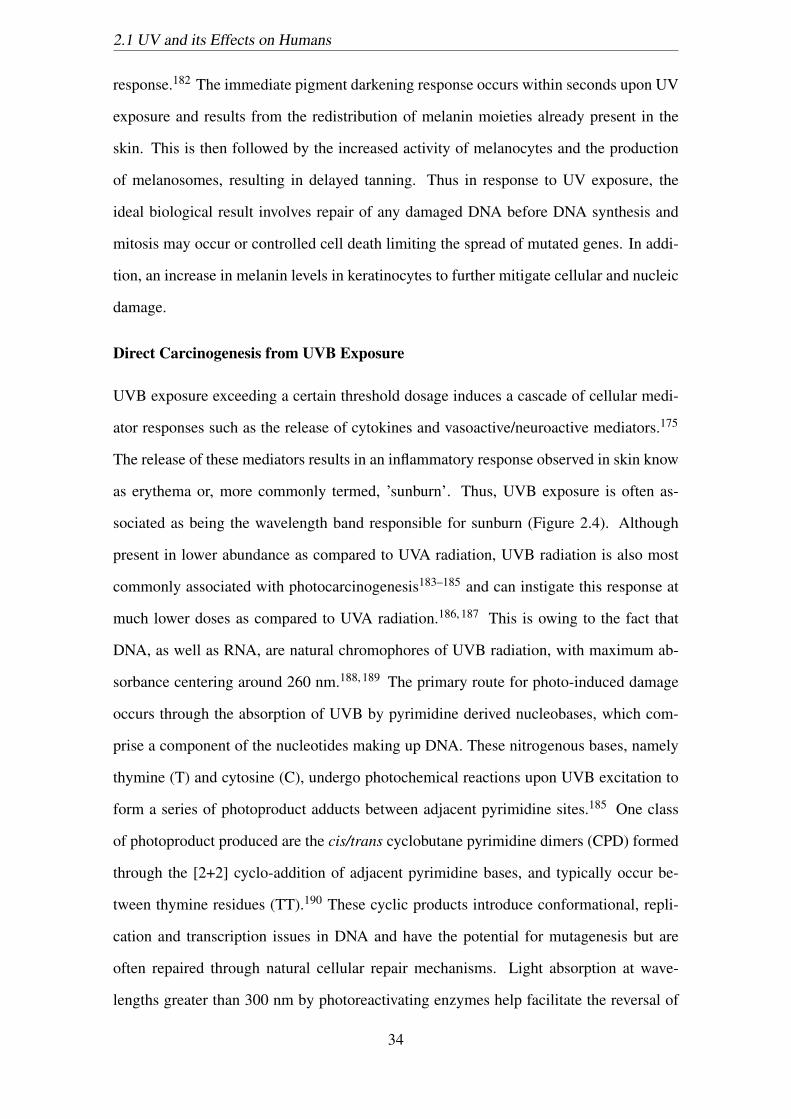
2.1 UV and its Effects on Humans
response.182 The immediate pigment darkening response occurs within seconds upon UV
exposure and results from the redistribution of melanin moieties already present in the
skin. This is then followed by the increased activity of melanocytes and the production
of melanosomes, resulting in delayed tanning. Thus in response to UV exposure, the
ideal biological result involves repair of any damaged DNA before DNA synthesis and
mitosis may occur or controlled cell death limiting the spread of mutated genes. In addi-
tion, an increase in melanin levels in keratinocytes to further mitigate cellular and nucleic
damage.
Direct Carcinogenesis from UVB Exposure
UVB exposure exceeding a certain threshold dosage induces a cascade of cellular medi-
ator responses such as the release of cytokines and vasoactive/neuroactive mediators.175
The release of these mediators results in an inflammatory response observed in skin know
as erythema or, more commonly termed, ’sunburn’. Thus, UVB exposure is often as-
sociated as being the wavelength band responsible for sunburn (Figure 2.4). Although
present in lower abundance as compared to UVA radiation, UVB radiation is also most
commonly associated with photocarcinogenesis183–185 and can instigate this response at
much lower doses as compared to UVA radiation.186, 187 This is owing to the fact that
DNA, as well as RNA, are natural chromophores of UVB radiation, with maximum ab-
sorbance centering around 260 nm.188, 189 The primary route for photo-induced damage
occurs through the absorption of UVB by pyrimidine derived nucleobases, which com-
prise a component of the nucleotides making up DNA. These nitrogenous bases, namely
thymine (T) and cytosine (C), undergo photochemical reactions upon UVB excitation to
form a series of photoproduct adducts between adjacent pyrimidine sites.185 One class
of photoproduct produced are the cis/trans cyclobutane pyrimidine dimers (CPD) formed
through the [2+2] cyclo-addition of adjacent pyrimidine bases, and typically occur be-
tween thymine residues (TT).190 These cyclic products introduce conformational, repli-
cation and transcription issues in DNA and have the potential for mutagenesis but are
often repaired through natural cellular repair mechanisms. Light absorption at wave-
lengths greater than 300 nm by photoreactivating enzymes help facilitate the reversal of
34
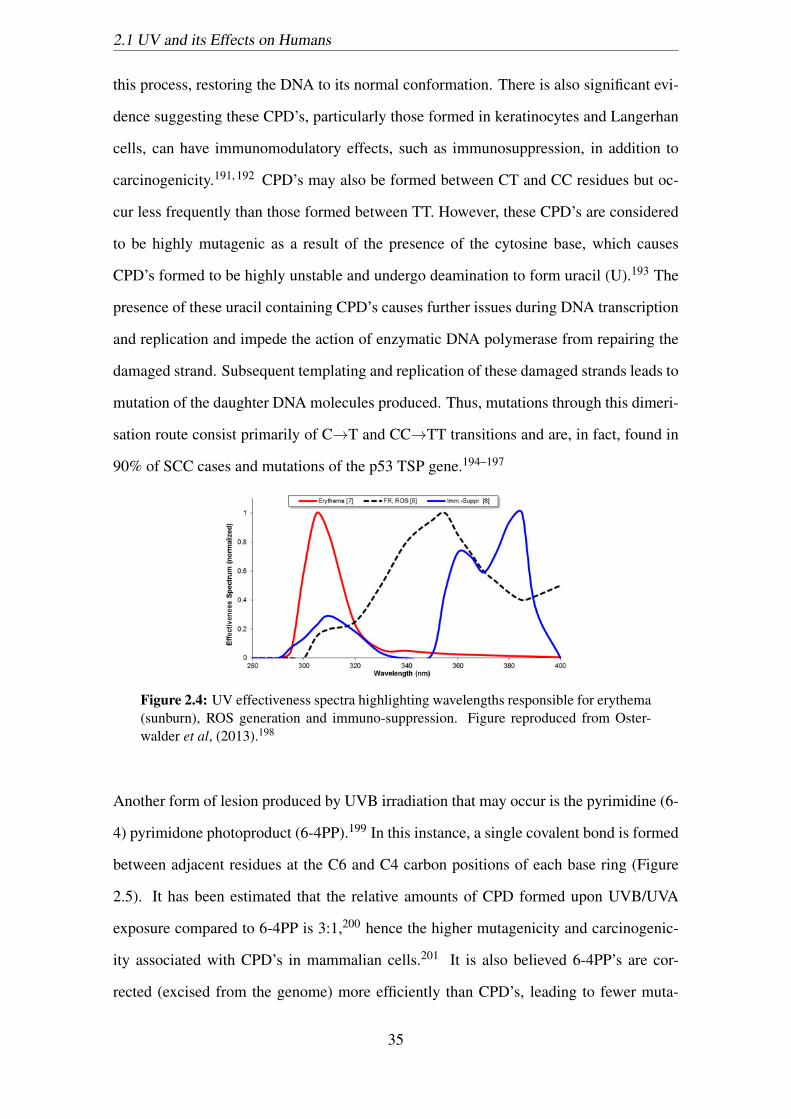
2.1 UV and its Effects on Humans
this process, restoring the DNA to its normal conformation. There is also significant evi-
dence suggesting these CPD’s, particularly those formed in keratinocytes and Langerhan
cells, can have immunomodulatory effects, such as immunosuppression, in addition to
carcinogenicity.191, 192 CPD’s may also be formed between CT and CC residues but oc-
cur less frequently than those formed between TT. However, these CPD’s are considered
to be highly mutagenic as a result of the presence of the cytosine base, which causes
CPD’s formed to be highly unstable and undergo deamination to form uracil (U).193 The
presence of these uracil containing CPD’s causes further issues during DNA transcription
and replication and impede the action of enzymatic DNA polymerase from repairing the
damaged strand. Subsequent templating and replication of these damaged strands leads to
mutation of the daughter DNA molecules produced. Thus, mutations through this dimeri-
sation route consist primarily of C→T and CC→TT transitions and are, in fact, found in
90% of SCC cases and mutations of the p53 TSP gene.194–197
Figure 2.4: UV effectiveness spectra highlighting wavelengths responsible for erythema(sunburn), ROS generation and immuno-suppression. Figure reproduced from Oster-walder et al, (2013).198
Another form of lesion produced by UVB irradiation that may occur is the pyrimidine (6-
4) pyrimidone photoproduct (6-4PP).199 In this instance, a single covalent bond is formed
between adjacent residues at the C6 and C4 carbon positions of each base ring (Figure
2.5). It has been estimated that the relative amounts of CPD formed upon UVB/UVA
exposure compared to 6-4PP is 3:1,200 hence the higher mutagenicity and carcinogenic-
ity associated with CPD’s in mammalian cells.201 It is also believed 6-4PP’s are cor-
rected (excised from the genome) more efficiently than CPD’s, leading to fewer muta-
35

2.1 UV and its Effects on Humans
tions through these photoproducts.202 It is also know that 6-4PP can inter-convert to their
Dewar valence isomers upon UV excitation at wavelengths around 325 nm.203, 204 These
Dewar isomers distort DNA and induce DNA bending, similar to that of their parent 6-
4PP, but to a lesser extent. They have also been suggested to be less mutagenic then their
6-4PP counterparts but are capable of inducing a broader range of mutations.205, 206 As
with the 6-4PP lesions, Dewar isomers are believed to be efficiently repaired through the
nucleotide excision repair (NER) pathway due to more easy recognition by repair pro-
teins sensitive to significant structural changes in DNA, in contrast to CPD lesions.207
However, mutations due to UV exposure in the p53 TSP genes that govern these repair
pathways, such as NER, can inhibit the recovery of DNA and dysregulate apoptosis.208
Thus, uncontrolled cell growth of cancerous cells may occur, an effect which is seen in
the mitosis of affected keratinocytes and the growth of skin cancers.166
Figure 2.5: Chemical structure of the main photoproducts formed by UVB-inducedphotoreaction of thymine (T) residues in DNA. Figure reproduced from Cadet et al,(2005).199
Indirect Carcinogenesis from UVA Exposure
For a long time, the harmful and carcinogenic effects of UV radiation were primarily
attributed to the UVB wavelength range. However, it is now known that UVA radiation
can also damage DNA, as well as RNA, indirectly through the production of ROS.209 The
depth of penetration of UVA radiation is also greater than that of UVB, in that, the so-
called ’fingerprint’ mutations for UVA are found predominantly in the stratum basale of
the epidermis, whilst those for UVB are found mainly in the stratum granulosom.210 This
means that ROS generated by UVA radiation are in closer proximity to a wider variety of
cell types, lipids and extracellular components, thus having the potential to exert greater
36
2.1 UV and its Effects on Humans
oxidative damage to the body than UVB radiation.
Photosenitization of DNA by UVA occurs through indirect oxidative damage. DNA is
a poor chromophore for UVA radiation, however, UVA may trigger the generation of
ROS, including O2•− and OH•, through intermediate photosensitizers. Some of the im-
portant photosensitizer compounds present in human skin include porphyrins (uropor-
phyrins, coproporphyrins and protoporphyrin IX), melanin and melanin precursors, B6
vitamers (pyridoxal), vitamin K, trans-urocanic acid and tryptophan.211 Absorption of
UVA radiation by these photosensitizers results in elevation in the electronic energy state
of the absorbing molecule to an excited singlet state.211 Following excitation, the excited
molecule may relax back to ground state, through irradiative emission of the absorbed
energy or through heat dissipation, or undergo intersystem crossing and transition to a
reactive triplet energy state. In this triplet state, the excited molecule can again relax
back to the ground state through light emission or partake in photochemical reactions to
transfer the excess absorbed energy to surrounding molecules. In this manner, damage
to DNA bases can occur directly from the photosensitizer (type I photosensitization) or
ROS may be formed through interaction of the photosensitizer with molecular oxygen
(type II photosensitization). In type II photosensitization, 1O2 is formed by direct energy
transfer from an excited triplet state chromophore to a ground level triplet state oxygen
molecule. O2•− may subsequently be formed by electron injection from another excited
chromophore, which also results in the formation of a radical cation of the photosensi-
tizer. With O2•− present, additional ROS such as lipid peroxides may be formed, as well
as H2O2 following enzymatic dismutation, thus elevating the levels of ROS present in
cells.212 In addition, if the photosensitizers are positioned in relatively close proximity to
DNA, oxidative DNA damage may occur upon UVA exposure.211
37
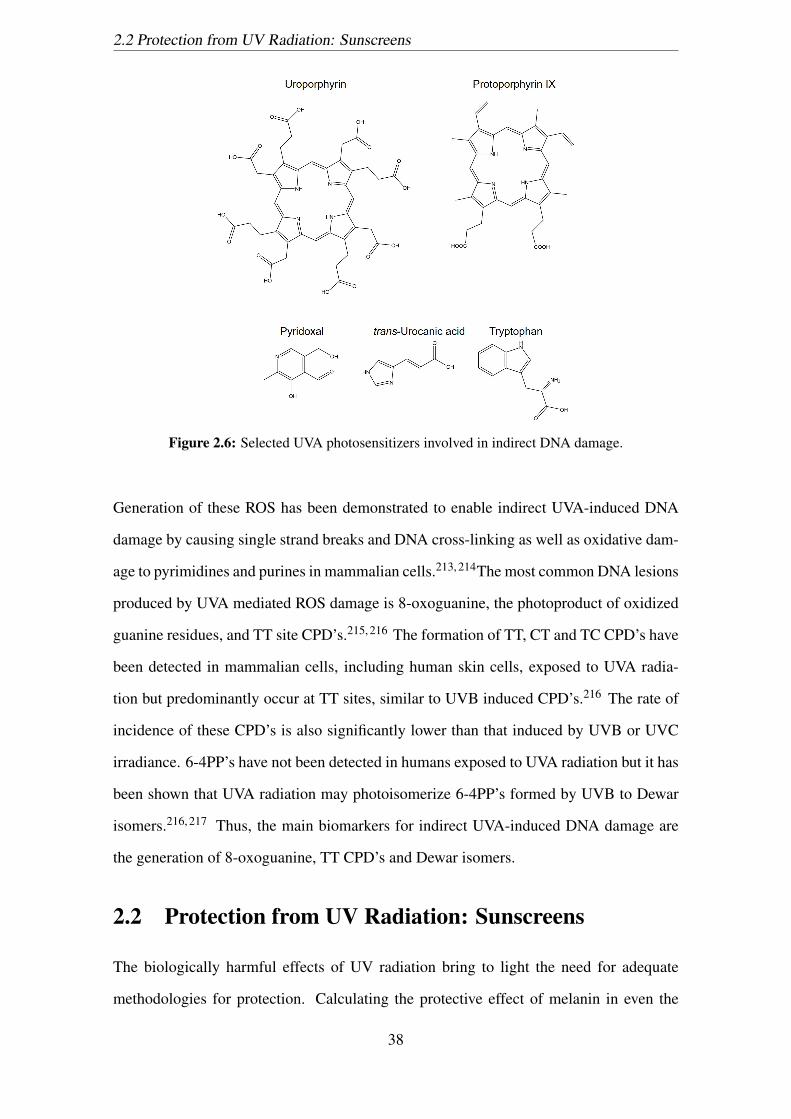
2.2 Protection from UV Radiation: Sunscreens
Figure 2.6: Selected UVA photosensitizers involved in indirect DNA damage.
Generation of these ROS has been demonstrated to enable indirect UVA-induced DNA
damage by causing single strand breaks and DNA cross-linking as well as oxidative dam-
age to pyrimidines and purines in mammalian cells.213, 214The most common DNA lesions
produced by UVA mediated ROS damage is 8-oxoguanine, the photoproduct of oxidized
guanine residues, and TT site CPD’s.215, 216 The formation of TT, CT and TC CPD’s have
been detected in mammalian cells, including human skin cells, exposed to UVA radia-
tion but predominantly occur at TT sites, similar to UVB induced CPD’s.216 The rate of
incidence of these CPD’s is also significantly lower than that induced by UVB or UVC
irradiance. 6-4PP’s have not been detected in humans exposed to UVA radiation but it has
been shown that UVA radiation may photoisomerize 6-4PP’s formed by UVB to Dewar
isomers.216, 217 Thus, the main biomarkers for indirect UVA-induced DNA damage are
the generation of 8-oxoguanine, TT CPD’s and Dewar isomers.
2.2 Protection from UV Radiation: Sunscreens
The biologically harmful effects of UV radiation bring to light the need for adequate
methodologies for protection. Calculating the protective effect of melanin in even the
38
2.2 Protection from UV Radiation: Sunscreens
most dark-skinned individuals through minimal erythemal dosage has shown only 10 -
15 fold increases compared to an absence of melanin, suggesting relatively low levels
of protection.218 The most efficient means of protection is non-exposure, however, out-
door leisure and social activities have become a societal norm, rendering such a measure
infeasible. The next appropriate measure is minimisation of exposure and wearing of ap-
propriate attire but, again, societal pressures, whether due to the latest fashion trends or
leisure activities generally correlates to high levels of skin exposure on a daily basis. This,
along with the increased levels in ambient UV radiation due to changes in stratospheric
ozone levels, coincides with the increase in melanoma incidence observed over the years.
As such, cosmetic and therapeutic products have been developed to aid in combating the
deleterious effects of UV radiation and to combat the incidence of skin cancers. These
products, termed, sunscreens, contain ingredients capable of preventing the transmittance
of terrestrial UV from reaching the skin. In this Section, an overview of the historical
developments and regulation of sunscreen products and ingredients is described. Further-
more an explanation of the protective effect provided by these products and the types of
ingredients used is given.
2.2.1 Historical Developments
The application of ingredients and formulations used specifically for protecting the skin
dates as far back as the Ancient Egyptian period (3100 BC - 330 BC).34 The discovery
of preserved papyri and paintings in tombs have revealed the identity of these ingredients
which include various oils and mineral clays frequently applied to the skin to maintain a
fair complexion and minimize skin damage. A number of these ingredients even include
compounds that are used in modern cosmetic products such as red ochre (iron oxide) and
henna oil (lawsone).219, 220 The first developed sunscreen product released for commer-
cial purchase was in the United States in 1928 and consisted of a formulation with two
active UV filtering ingredients, benzyl salicylate and benzyl cinnamate.221 Further ad-
vances in sunscreen technology and ingredients led to the development of red petrolatum
during World War II, which contained a mixture of both organic compounds and inorganic
39
2.2 Protection from UV Radiation: Sunscreens
particles capable of protecting against UV.35, 219During the 1940s, the first patented UV
filter, specifically para-aminobenzoic acid (PABA), was registered, whilst patenting and
commercialisation of formulations containing the inorganic compounds, TiO2 and ZnO,
did not occur until the late 1980s and early 1990s.222 With the continued development
of new sunscreen actives and an increased understanding of photobiology, a need for a
standardized method for assessing the effectiveness of these filters was required. This led
to the eventual introduction of the sun protection factor (SPF) rating, still used today, in
indicating to consumers the level of protection afforded against UV (or more specifically
UVB) radiation by the given formulation.223, 224
2.2.2 Regulation of Sunscreen Products in Australia
Before commercialization, a sunscreen product goes through a rigorous review process
which requires adherence to specific product and ingredient guidelines. In Australia,
ingredients listed in sunscreen products are regulated by the Therapeutic Goods Admin-
istration (TGA) and require registration in the Australian Register of Therapuetic Goods
(ARTG).42 These include ingredients present only in therapeutic sunscreens, not cosmetic
sunscreens. Therapeutic sunscreens refer to all primary sunscreen products designed for
UV protection with SPF ratings 4 or greater and secondary sunscreens such as insect
repellants and moisturisers with SPF values of 4 and 15, respectively. Cosmetic sun-
screens on the other hand refer to cosmetic products that contain ingredients with UV
protective capabilities but are not marketed specifically for UV protection.66 Such cos-
metic sunscreens are instead regulated by the National Industrial Chemicals Notification
& Assessment Scheme (NICNAS) and the associated Cosmetics Standard and NICNAS
Cosmetics Guidelines. The major focus of the TGA standards for sunscreen ingredients
is on their safety. Prior to registration of a new UV filtering ingredient, various in vitro
and in vivo toxicological information must be provided that adequately demonstrates that
no or limited toxicological potential is exerted by the ingredient. This includes data per-
taining to acute toxicity, local tolerance, allergenicity, genotoxicity, reproductive toxicity
and carcinogenicity. The guidelines used for registering such new ingredients in Australia
40
2.2 Protection from UV Radiation: Sunscreens
have been adopted from EU ’non-clinical’ guidelines by the TGA, despite the differences
in classification of primary sunscreens (therapuetic in Australia as opposed to cosmetic in
EU). This gives certain ingredients and manufacturers leeway in the data that is required
for approval, provided the absence of said data is justified. For example, a lack of long
term in vivo carcinogenicity data for a potential new ingredient may be allowed provided
it can be shown the ingredient displays a lack of in vivo dermal absorption or low persis-
tence in the skin.66 Data pertaining to the actual UV protective abilities of the filter must
also be available in the form of its UV spectral characteristics and specific level of UVB
and UVA protection.
In addition to TGA guidelines, therapeutic sunscreen products must abide by the Aus-
tralian/New Zealand Standard AS/NZS 2604:2012 Sunscreen products - Evaluation and
classification.225 The main purpose of this standard is to provide sunscreen manufacturers
specific guidance on the measurement of the SPF and broad spectrum protection afforded
by their products. The specific methodologies employed for determining these quantities
refer to the International Standards:
• ISO 24443 Determination of sunscreen UVA photoprotection in vitro
• ISO 24444 Cosmetics - Sun protection test methods - In vivo determination of the
sun protection factor (SPF)
For simplicity, all mentioning of sunscreens, sunscreen products and the ingredients used
here onwards refers to therapeutic sunscreens unless stated otherwise.
2.2.3 Sun Protection Factor (SPF) and UVA Protection Ratings
A number of ingredients constitute the composition of a sunscreen formulation, contribut-
ing to formulation factors such as emulsion stability, viscosity and shelf-life. The specific
ingredients included to protect users from UV radiation are listed as the ’active’ ingre-
dients of a particular formulation. These ’active’ ingredients protect the skin through
modes of absorption, reflection and/or scattering of incident UV radiation. The level of
protection provided by these products is quoted as the sun protection factor (SPF), which
41
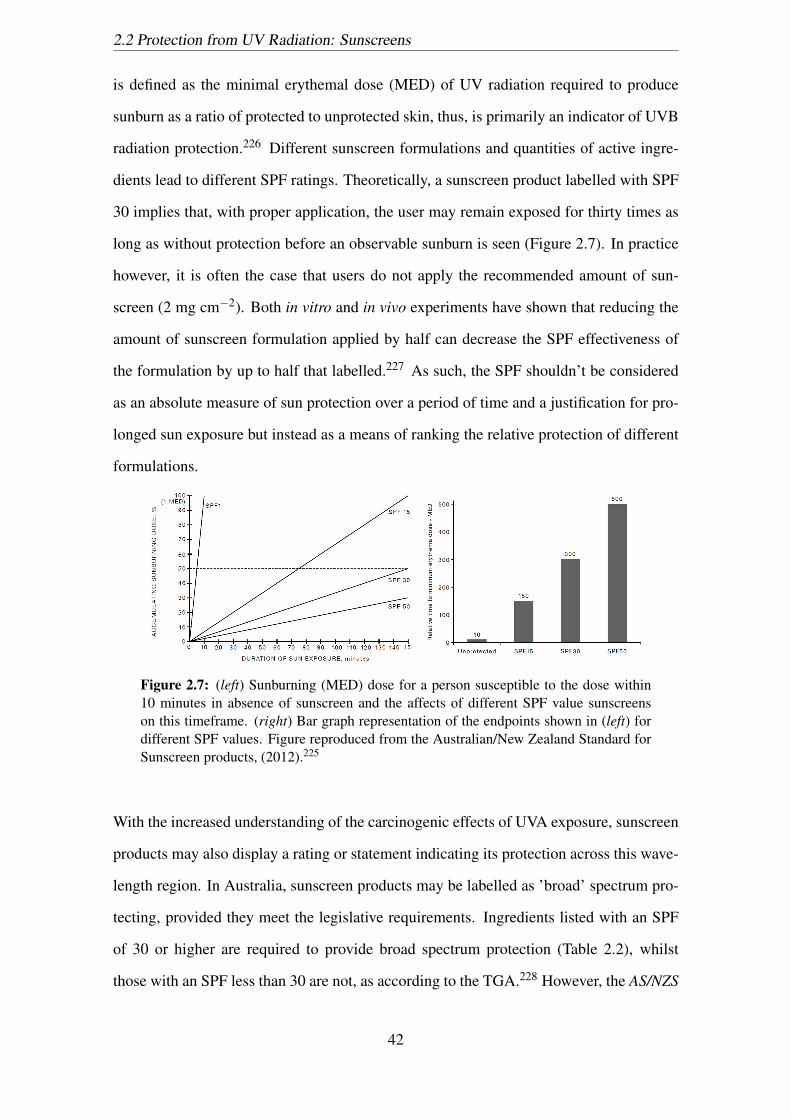
2.2 Protection from UV Radiation: Sunscreens
is defined as the minimal erythemal dose (MED) of UV radiation required to produce
sunburn as a ratio of protected to unprotected skin, thus, is primarily an indicator of UVB
radiation protection.226 Different sunscreen formulations and quantities of active ingre-
dients lead to different SPF ratings. Theoretically, a sunscreen product labelled with SPF
30 implies that, with proper application, the user may remain exposed for thirty times as
long as without protection before an observable sunburn is seen (Figure 2.7). In practice
however, it is often the case that users do not apply the recommended amount of sun-
screen (2 mg cm−2). Both in vitro and in vivo experiments have shown that reducing the
amount of sunscreen formulation applied by half can decrease the SPF effectiveness of
the formulation by up to half that labelled.227 As such, the SPF shouldn’t be considered
as an absolute measure of sun protection over a period of time and a justification for pro-
longed sun exposure but instead as a means of ranking the relative protection of different
formulations.
Figure 2.7: (left) Sunburning (MED) dose for a person susceptible to the dose within10 minutes in absence of sunscreen and the affects of different SPF value sunscreenson this timeframe. (right) Bar graph representation of the endpoints shown in (left) fordifferent SPF values. Figure reproduced from the Australian/New Zealand Standard forSunscreen products, (2012).225
With the increased understanding of the carcinogenic effects of UVA exposure, sunscreen
products may also display a rating or statement indicating its protection across this wave-
length region. In Australia, sunscreen products may be labelled as ’broad’ spectrum pro-
tecting, provided they meet the legislative requirements. Ingredients listed with an SPF
of 30 or higher are required to provide broad spectrum protection (Table 2.2), whilst
those with an SPF less than 30 are not, as according to the TGA.228 However, the AS/NZS
42

2.2 Protection from UV Radiation: Sunscreens
2604:2012 standard stipulates that sunscreen products with SPF 4+ must have broad spec-
trum protection. The specification of being broad spectrum requires that the product or
ingredient meets two criteria:
• That the UVA protection factor (UVAPF) is equal to or greater than one-third the
labelled SPF
• That the critical wavelength is equal to or greater than 370 nm.
Interestingly, the methodology for determining the UVAPF outlined in this Australian
standard refers to the international standard, ISO24443:2012, which is an in vitro method,
contrary to the in vivo method used for SPF. As such, instead of human substrates and
evaluation of pigmentation darkening, the method uses roughened substrates and mea-
sures the transmittance of UV through a thin layer of an applied formulation. The critical
wavelength is defined as the wavelength at which 90% of the cumulative area under the to-
tal absorbance curve between 290 and 400 nm occurs.225 Setting the limitation for broad
spectrum protection to products with critical wavelengths equal to or greater than 370 nm
infers that equal to or greater UVA protection is afforded by the product as compared to
UVB.
Table 2.2: Different SPF categories and classifications and the labelling permitted forsuch sunscreen formulations according to the AS/NZS 2604:2012 standard.225
SPF Labelled SPF Category descriptionBroad spectrum labelling
Primary Secondary (Skin care)
1-3 Not allowed Not allowed Not allowed Not allowed
4-14 4, 6, 8, 10 Low Compulsory Compulsory
15-29 15, 20, 25 Medium or moderate Compulsory Compulsory
30-59 30, 40, 50 High Compulsory Compulsory
60 or higher 50+ Very high Compulsory Compulsory
43

2.2 Protection from UV Radiation: Sunscreens
2.2.4 Organic and Inorganic UV Filters
The active UV filtering ingredients in sunscreen products may be broadly categorized as
organic or inorganic. Table B.1 lists UV filters approved by the TGA for use in Australia
and their maximum loading amount. Initially, the mechanism of protection through this
classification system was generalized such that organic filters protected through means
of UV absorption whilst inorganic filters protected through processes of scattering and
reflection. However, advances in UV filtering materials have led to the development of
novel organic and inorganic materials capable of providing protection opposite to that of
the classical means or even a combination of the two.
Organic Filters
The main mode of protection from UV radiation by organic UV filters is through absorp-
tion. These chemical filters generally consist of organic compounds belonging to one of
several groups shown in Figure 2.8 and can be subdivided as either UVA (benzophenone,
anthranilates and dibenzoylmethanes) or UVB (PABA derivatives, salicylates, cinnamates
and camphor derivatives) absorbers.229 Absorption of particular wavelengths by organic
molecules can occur when the incident photon energy is sufficient to excite an electron
from it’s highest occupied molecular orbital (HOMO) to the lowest unoccupied molecular
orbital (LUMO). Relaxation from the excited state may occur through a number of path-
ways. For instance, in the singlet state, de-excitation may occur through non-radiative
vibrational relaxation, internal conversion or radiative relaxation through emission of a
photon in a process known as fluorescence. Intersystem crossing my also occur, in which
the excited electron’s spin is no longer paired with the ground state, leading to the for-
mation of a triplet state. De-excitation of this triplet state can similarly occur through
internal conversion and also through the emission of a photon which, in this instance, is
termed phosphorescence due to the longer lived state relative to fluorescence.
44
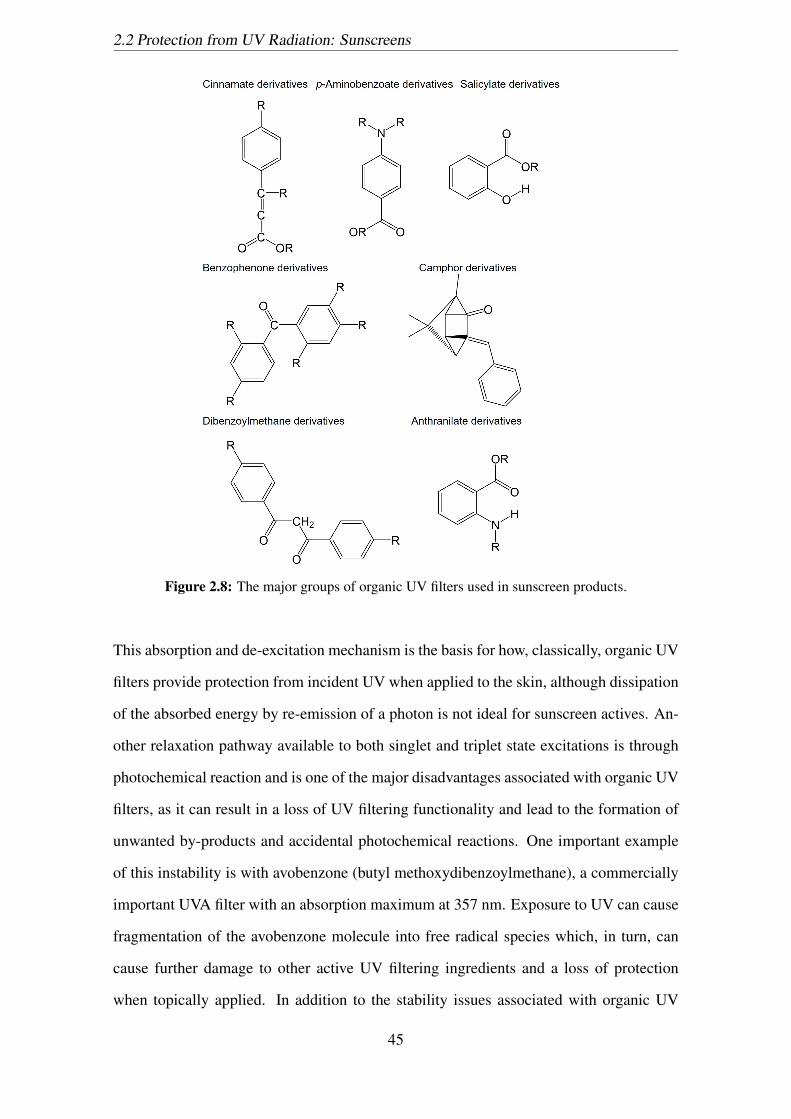
2.2 Protection from UV Radiation: Sunscreens
Figure 2.8: The major groups of organic UV filters used in sunscreen products.
This absorption and de-excitation mechanism is the basis for how, classically, organic UV
filters provide protection from incident UV when applied to the skin, although dissipation
of the absorbed energy by re-emission of a photon is not ideal for sunscreen actives. An-
other relaxation pathway available to both singlet and triplet state excitations is through
photochemical reaction and is one of the major disadvantages associated with organic UV
filters, as it can result in a loss of UV filtering functionality and lead to the formation of
unwanted by-products and accidental photochemical reactions. One important example
of this instability is with avobenzone (butyl methoxydibenzoylmethane), a commercially
important UVA filter with an absorption maximum at 357 nm. Exposure to UV can cause
fragmentation of the avobenzone molecule into free radical species which, in turn, can
cause further damage to other active UV filtering ingredients and a loss of protection
when topically applied. In addition to the stability issues associated with organic UV
45

2.2 Protection from UV Radiation: Sunscreens
filters, substantial concern has been raised over the penetration of organic filters into epi-
dermal cells and their absorption into fatty tissues.64, 230, 231 The detection of metabolites
produced from these filters in urine and breast milk samples after topical application has
also been a topic of much debate due to the potential consequences of their metabolism,
such as endocrine disruption and estrogen mimetic activity.232–234 One countermeasure
being researched is the development of so-called Dalton-500 molecules. These com-
pounds are designed to possess very high molecular weights, so as to minimise dermal
permeation, and possess multiple chromophoric moieties, enabling broad-spectrum UV
protection.235 Encapsulation of organic UV filters is another protective pathway being
explored using biocompatible polymers. Polylactic acid (PLA) is one such example, hav-
ing already been established in drug delivery and has been shown to improve the pho-
tostability of organic UV filters such as octinoxate, avobenzone and octocryene.236, 237
Poly(methyl methacryalate) (PMMA), chitosan, ethyl cellulose and a variety of co-block
polymers such as poly(lactic-co-glycolic acid) (PLGA) have also been investigated for
improving the photostability of organic UV filters and preventing/minimising their per-
meation when applied.238–241
Figure 2.9: Fragmentation of avobenzone upon UV exposure, leading to a loss UVabsorptive functionality and production of two reactive species.
Another concern often associated with organic UV filters is their propensity to induce
allergic and photoallergic reactions when topically applied. A number of specific filters
have been reported to cause such adverse effects, usually some time after their introduc-
tion into the sunscreen market, and has led to the complete removal of some filters by
governing health organisations in various countries.242
46
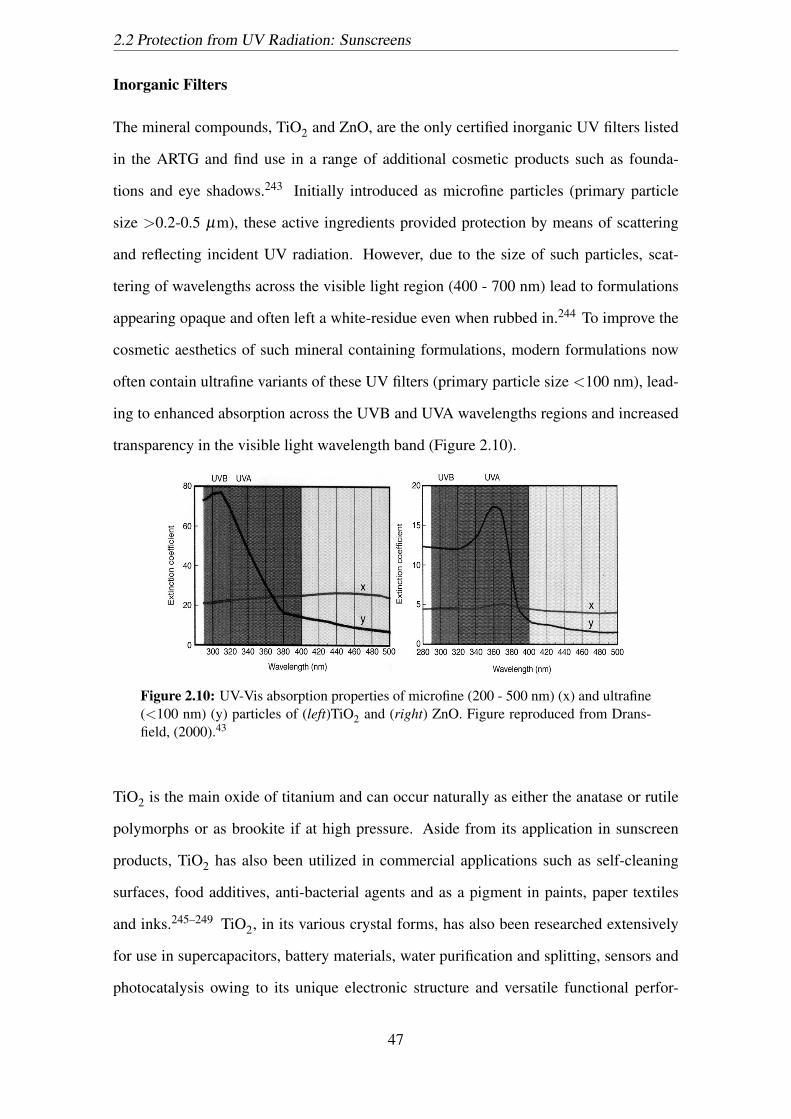
2.2 Protection from UV Radiation: Sunscreens
Inorganic Filters
The mineral compounds, TiO2 and ZnO, are the only certified inorganic UV filters listed
in the ARTG and find use in a range of additional cosmetic products such as founda-
tions and eye shadows.243 Initially introduced as microfine particles (primary particle
size >0.2-0.5 µm), these active ingredients provided protection by means of scattering
and reflecting incident UV radiation. However, due to the size of such particles, scat-
tering of wavelengths across the visible light region (400 - 700 nm) lead to formulations
appearing opaque and often left a white-residue even when rubbed in.244 To improve the
cosmetic aesthetics of such mineral containing formulations, modern formulations now
often contain ultrafine variants of these UV filters (primary particle size <100 nm), lead-
ing to enhanced absorption across the UVB and UVA wavelengths regions and increased
transparency in the visible light wavelength band (Figure 2.10).
Figure 2.10: UV-Vis absorption properties of microfine (200 - 500 nm) (x) and ultrafine(<100 nm) (y) particles of (left)TiO2 and (right) ZnO. Figure reproduced from Drans-field, (2000).43
TiO2 is the main oxide of titanium and can occur naturally as either the anatase or rutile
polymorphs or as brookite if at high pressure. Aside from its application in sunscreen
products, TiO2 has also been utilized in commercial applications such as self-cleaning
surfaces, food additives, anti-bacterial agents and as a pigment in paints, paper textiles
and inks.245–249 TiO2, in its various crystal forms, has also been researched extensively
for use in supercapacitors, battery materials, water purification and splitting, sensors and
photocatalysis owing to its unique electronic structure and versatile functional perfor-
47
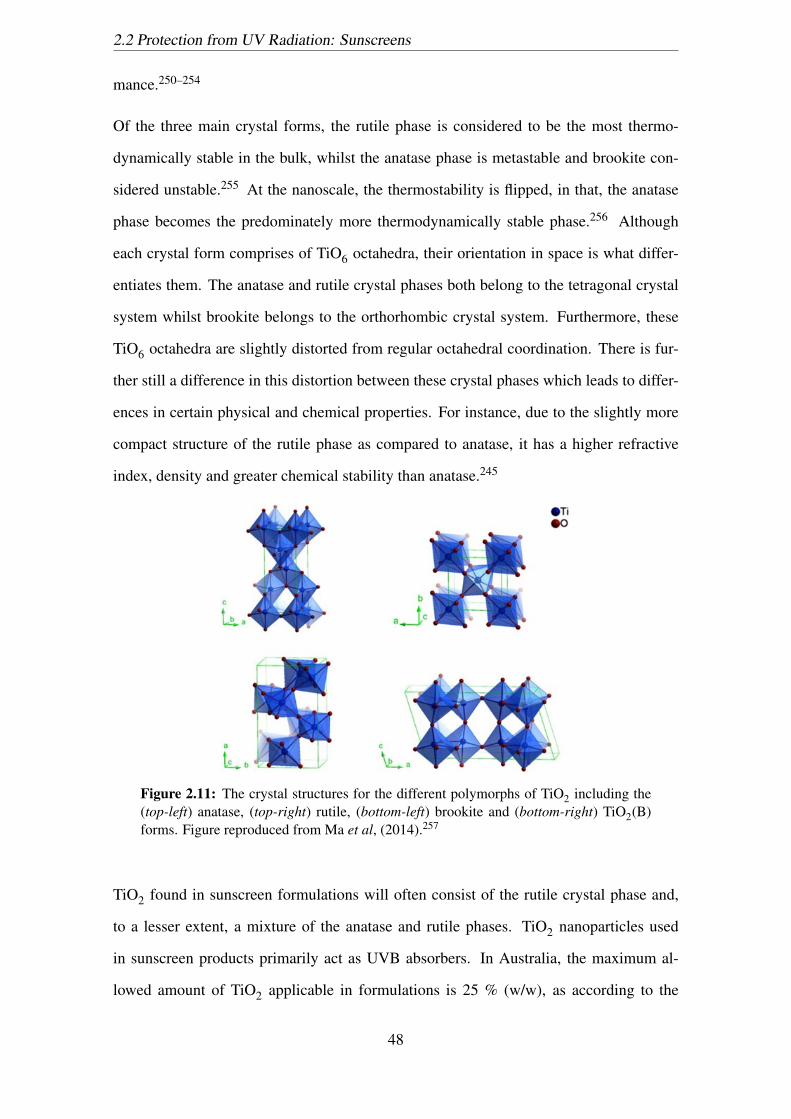
2.2 Protection from UV Radiation: Sunscreens
mance.250–254
Of the three main crystal forms, the rutile phase is considered to be the most thermo-
dynamically stable in the bulk, whilst the anatase phase is metastable and brookite con-
sidered unstable.255 At the nanoscale, the thermostability is flipped, in that, the anatase
phase becomes the predominately more thermodynamically stable phase.256 Although
each crystal form comprises of TiO6 octahedra, their orientation in space is what differ-
entiates them. The anatase and rutile crystal phases both belong to the tetragonal crystal
system whilst brookite belongs to the orthorhombic crystal system. Furthermore, these
TiO6 octahedra are slightly distorted from regular octahedral coordination. There is fur-
ther still a difference in this distortion between these crystal phases which leads to differ-
ences in certain physical and chemical properties. For instance, due to the slightly more
compact structure of the rutile phase as compared to anatase, it has a higher refractive
index, density and greater chemical stability than anatase.245
Figure 2.11: The crystal structures for the different polymorphs of TiO2 including the(top-left) anatase, (top-right) rutile, (bottom-left) brookite and (bottom-right) TiO2(B)forms. Figure reproduced from Ma et al, (2014).257
TiO2 found in sunscreen formulations will often consist of the rutile crystal phase and,
to a lesser extent, a mixture of the anatase and rutile phases. TiO2 nanoparticles used
in sunscreen products primarily act as UVB absorbers. In Australia, the maximum al-
lowed amount of TiO2 applicable in formulations is 25 % (w/w), as according to the
48
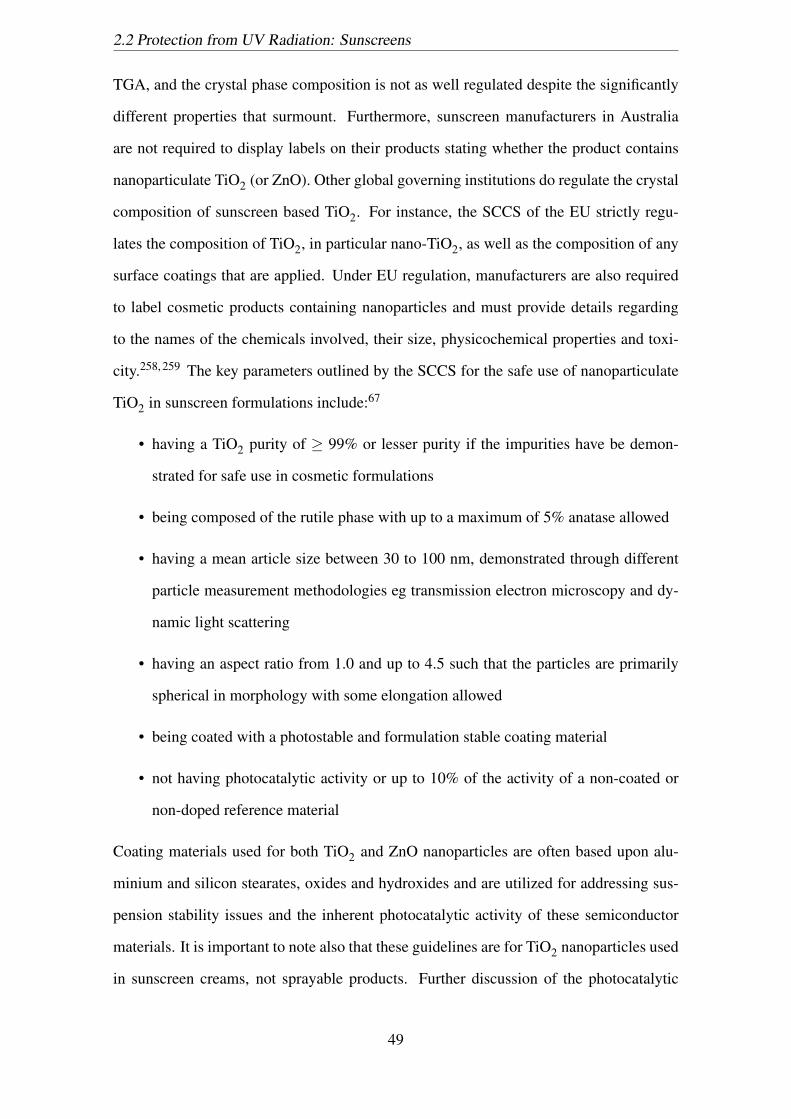
2.2 Protection from UV Radiation: Sunscreens
TGA, and the crystal phase composition is not as well regulated despite the significantly
different properties that surmount. Furthermore, sunscreen manufacturers in Australia
are not required to display labels on their products stating whether the product contains
nanoparticulate TiO2 (or ZnO). Other global governing institutions do regulate the crystal
composition of sunscreen based TiO2. For instance, the SCCS of the EU strictly regu-
lates the composition of TiO2, in particular nano-TiO2, as well as the composition of any
surface coatings that are applied. Under EU regulation, manufacturers are also required
to label cosmetic products containing nanoparticles and must provide details regarding
to the names of the chemicals involved, their size, physicochemical properties and toxi-
city.258, 259 The key parameters outlined by the SCCS for the safe use of nanoparticulate
TiO2 in sunscreen formulations include:67
• having a TiO2 purity of ≥ 99% or lesser purity if the impurities have be demon-
strated for safe use in cosmetic formulations
• being composed of the rutile phase with up to a maximum of 5% anatase allowed
• having a mean article size between 30 to 100 nm, demonstrated through different
particle measurement methodologies eg transmission electron microscopy and dy-
namic light scattering
• having an aspect ratio from 1.0 and up to 4.5 such that the particles are primarily
spherical in morphology with some elongation allowed
• being coated with a photostable and formulation stable coating material
• not having photocatalytic activity or up to 10% of the activity of a non-coated or
non-doped reference material
Coating materials used for both TiO2 and ZnO nanoparticles are often based upon alu-
minium and silicon stearates, oxides and hydroxides and are utilized for addressing sus-
pension stability issues and the inherent photocatalytic activity of these semiconductor
materials. It is important to note also that these guidelines are for TiO2 nanoparticles used
in sunscreen creams, not sprayable products. Further discussion of the photocatalytic
49
2.2 Protection from UV Radiation: Sunscreens
activity and coating materials of inorganic UV filters is given in Section 2.4.
Figure 2.12: SEM and TEM images of commercial sunscreens containing the inorganicUV filters, TiO2 and ZnO. a) and b) corresponds to TiO2 nanoparticles whilst d) and e)are of ZnO. c) is an example of a blank sample and f) a mixture of both TiO2 and ZnO.Figure reproduced from Lewicka et al, (2011).260
ZnO, as with TiO2, also finds use in a wide variety of applications outside of its use as an
inorganic UV filter. Owing to its light absorption properties and photocatalytic activity,
it shares a number of applications with TiO2 such as in hydrogen production, sensor
devices and battery materials. It has also been studied for use in various optoelectronic
and laser technology devices.261–264 The main crystal forms of ZnO are wurtzite, zinc-
blende and rocksalt.262 At room temperature, the thermodynamically stable phase is the
wurtzite phase whilst zinc-blende can be stabilized through specialized growth substrates
and rocksalt obtained at relatively high pressures. The main ZnO crystal phase employed
in sunscreen products is the wurtzite phase and is primarily a UVA absorber. Due to the
limitations in the wavelength ranges covered, quite often both ZnO and TiO2 will be used
in combination with each or other organic UV filters so as to provide broad spectrum
coverage.
There are no current loading limits for the use of ZnO nanoparticles in sunscreen creams
in Australia however the SCCS places a load limit of 25 % (w/w) for European manufac-
turers. As with TiO2 nanoparticles, ZnO nanoparticles are also prohibited for application
in spray-based cosmetic products owing to the toxic effects they may exert through in-
halation.
50

2.2 Protection from UV Radiation: Sunscreens
2.2.5 Health Related Issues Associated with Organic UV Filters
In an ideal world, sunscreen products should include ingredients that do not cause irri-
tations to the skin when applied, be able to prevent UV radiation from reaching the skin
without diminishing effectiveness over time and not be harmful to internal organs if ac-
cidentally consumed orally. However, as touched on previously, the reality is that many
sunscreen ingredients, primarily organic UV filters, are readily absorbed through the skin
and can be found quantifiably in blood, urine and even breast milk samples. In the United
States, when sunscreen products were first beginning to garner mainstream commercial
recognition during the 1970s, many ingredients previously used in specialized situations
were immediately approved for commercial use by the Food and Drug Administration
(FDA) without a review of the potential hazards.265 Only as recently as Febraury 2019,
have the FDA re-reviewed all currently approved UV filters, resulting in the discovery of
at least 12 active ingredients that did not meet the necessary safety requirements. These
ingredients include organic UV filters that have been used in sunscreen products since the
very beginning of commercial sunscreen products such as oxybenzone, octinoxate, oc-
tocrylene and avobenzone.266 The only two filters that met the FDA safety requirements
and were considered to be generally recognized as safe and effective or GRASE were TiO2
and ZnO.
The TGA is also currently in a state of reviewing the Australian regulatory guidelines for
sunscreens (2020). Whether this will result in a review of individual ingredients is un-
known, however, past sunscreen compliance reviews, adhering to the AS/NZS 2604:2012
standard and the Therapeutic Goods Act 1989 have been performed as recently as 2018.267
Of the listed sunscreen products tested, no major compliance deficiencies were found
in relation to the safety and efficacy of the formulation. Only minor issues pertaining
to the labelling and advertisement of a third of the sunscreens were identified whilst a
third of sunscreens reviewed were removed from the ARTG due to compliance with out-
dated standards that allowed elevated levels of the preservatives methylisothiazolinone
and methylchloroisothiazolinone. No specific issues with the active ingredients, specifi-
cally organic UV filters, were found.
51

2.2 Protection from UV Radiation: Sunscreens
Regardless of the regulation of active ingredients in Australia, an American non-profit
organisation dedicated to maintaining the environment and improving human health, the
Environmental Working Group (EWG), developed a hazard rating scheme for various or-
ganic UV filters based upon their potential for dermal permeation, allergenicity, endocrine
disruption and other causes for concern. A list of these ingredients, their hazard scores
and health related concerns is shown in Table B.2.
Skin Permeation
Frequent application and reapplication of sunscreen formulations and the detection of
organic UV filters and UV filter metabolites in urine and breast milk samples suggests
systematic absorption of these active ingredients through the skin. This is a cause of
concern owing to the potential for these ingredients to impact endocrine function and
impair reproductive development. The ability for these ingredients to penetrate through
the skin is strongly dependent on their chemical structure which governs the molecular
weight and lipophilicity of the molecule in question.268 The type of formulation applied
and presence of certain other ingredients can also influence the cutaneous penetration
of these active UV filtering ingredients.269 Both in vitro and in vivo studies have been
performed to assess the permeation of organic UV filters through the skin and their poten-
tial to reach viable skin layers. Jiang et al, (1999) investigated the absorption of various
commercial sunscreen emulsions containing UV filters such as octyl methoxycinnamate,
oxybenzone, titanium dioxide, octylsalicylate, octocrylene and butyl methoxy dibenzoyl-
methane through human skin epidermis using a Franz diffusion cell.270 It was found that
all the filters tested permeated into the epidermis but only oxybenzone was found in the
receptor fluid 8 hr after application. A further study performed by Hayden et al,(2005)
found that the sunscreening agents avobenzone, oxybenzone, octinoxate, octocrylene and
padimate O, were present in the stratum corneum and viable epidermis of a skin model 24
hr after exposure to the sunscreening agents when applied in a mineral oil.230 However,
subsequent cytotoxic investigations of these tested organic UV filters with human epi-
dermal keratinocytes suggested that the concentrations absorbed through the skin would
be insufficient to induce any significant toxicity to viable skin cells. In vivo percuta-
52

2.2 Protection from UV Radiation: Sunscreens
neous permeation studies of oxybenzone have shown the ingredient to have skin pene-
trative abilities after being detected in urine samples from human and animal subjects up
to 48 hr after application.271, 272 Another study investigating the penetration of various
organic UV filters, including octyl methoxycinnamate, 4-methyl benzylidene camphor
and oxybenzone, in human volunteers also found detectable levels of the ingredients in
urine samples.273 Recent advances in the encapsulation of UV filtering ingredients have
enabled the development of micro- and nano-carrier systems capable of minimizing the
permeation of these compounds through the skin.274, 275 The use of zeolitic frameworks
and polymeric delivery systems have been shown to aid in minimizing skin penetration of
organic UV filters and to maintain topical retention of the applied sunscreens but whether
the application of such advanced preparation methods can be transferred industrially is
unclear.64, 276, 277
Endocrine Disruption
Endocrine disrupting substances refer to chemicals capable of blocking, mimicking or
changing the behaviour of hormones produced by the endocrine system.278 Some the
TGA approved organic UV filters that have been implicated as endocrine disrupting
chemicals include oxybenzone, sulisobenzone, 4-methyl benzylidene camphor and octyl
methoxycinnamate.279
Oxybenzone is an organic UVB filter that has been used in sunscreen products since the
1980s, however, studies have shown the filter to be capable of having estrogenic effects.
Estrogens are steroid-type compounds that are important regulators of physiological de-
velopment in many vertebrates and are associated with regulation of immune function,
mineral homeostasis and reproduction in both sexes.280–282 The type of effect estrogen
disruptive compounds can have on these functions can vary according to the chemical
structure of the disruptor as well as the presence of other co-regulators or transcription
factors around the estrogen receptor. Oxybenzone, and other benzophenone type UV fil-
ters used outside of Australia, have been shown to have estrogenic effects and are capable
of inducing developmental and reproductive toxicity in vitro.283, 284 In vivo studies using
53
2.2 Protection from UV Radiation: Sunscreens
rat and fish based subjects have also highlighted the estrogenic activity of oxybenzone
and sulisobenzone and the resultant toxicity induced.234, 285 Oxybenzone has also been
shown to display anti-androgenic activity in an in vitro study using a bone tissue cell
line, U2-OS, abundant in androgen receptors and enabling more selective and sensitive
measurement of the interaction occurring.286 There is also in vivo evidence to suggest
hydroxylated benzophenones, such as sulisobenzone, may exert anti-androgen activity in
rat and fish larvae subjects.284, 285
Camphor derivatives used as UVB filters, such as 4-methyl benzylidene camphor are also
causes of concern not only due to their potential for estrogenic activity, but their propen-
sity for absorption through the skin as a result of their highly lipophilic nature.287–289
Exposure to 4-methyl benzylidene camphor and another UV filter, 3-benzylidene cam-
phor, were also found to impact prostate gland growth and induce delayed puberty in rats
subjected to daily 7 mg kg−1 doses of either chemical for 90 days, displaying activity
similar to that of other estrogen mimetic compounds.287, 290 Octyl methoxycinnamte has
also been shown to disrupt estrogen and androgen activity.291, 292 Pre-natal administration
of octyl methoxycinnamate to pregnant rat subjects resulted in decreased sperm counts in
male offspring eight months later correlating to decreased testes mass, whilst dosed dams
showed marked decreases in thyroxine T4 levels.293 Both results suggest the adminis-
tered UV filter can impact reproductive and neurological development if systematically
exposed.
Allergenicity
Contact dermatitis is a skin condition brought about by exposure to an allergen. This
results in the occurrence of red, itchy rashes on the skin and can be uncomfortable if left
unchecked. Organic UV filters and, in particular organic UVA filters have been shown
to induce allergic reactions.294 In addition, organic UV filters may undergo molecular
changes in their chemical structure after UV exposure. These photoproducts can also
act as allergens and induce allergic reactions to the skin.295 The incidence of allergic
and photoallergic reactions is relatively low and is most prominent in people with a his-
54
2.2 Protection from UV Radiation: Sunscreens
tory of photosensitivity.296–298 In a large-scale study performed in the UK, 1155 patients
were tested for contact allergy and photoallergy towards sunscreening active ingredients,
which included current TGA approved organic UV filters such as butyl methoxy diben-
zoylmethane, isoamyl methoxycinnamate, octocrylene, octyl methoxycinnamate, octyl
triazone, oxybenzone and sulisobenzone.299 Of the 1155 patients tested, 130 (11.3%)
exhibited either contact or photoallergic reactions, with the most common photoallergen
being oxybenzone.
Although not as serious as other side effects of organic UV filter use, the immune response
induced by some organic UV filters was seen as sufficient cause for manufacturers to in-
corporate inorganic UV filters in new formulations since, even at high loadings, allergenic
responses do not occur.
Photostability
Organic UV filters should ideally be able to absorb incident UV radiation and dissipate the
absorbed energy through photophysical and photochemical pathways that do not result in
the formation of ROS or harmful reactive photoproducts.229 However, some organic sun-
screen agents have been shown to undergo photoisomerization and photofragmentation
reactions after UV exposure.300, 301 This can lead to a loss of UV protection, as the frag-
mented species are generally less UV absorbing than the parent species, and can result in
the generation of harmful ROS and other reactive fragments that can cause further dam-
age to formulation ingredients. Combined with skin permeation and internalization, the
photo-instability of certain organic UV filters is a cause of concern owing to the oxidative
or free radical mediated damage they may induce. Serpone et al, (2002) demonstrated
this by monitoring the extensive degradation of PABA when exposed to solar simulated
light.229 This same study also highlighted the instability of TGA approved filters such
as octyl methoxycinnamate and oxybenzone under the same exposure conditions (Figure
2.13).
55

2.2 Protection from UV Radiation: Sunscreens
Figure 2.13: Spectral changes occurring over time during solar simulated light irradia-tion of (left) octyl methoxycinnamate and (right) oxybenzone (loading 8 mg L−1) underaerobic conditions in water (top) and hexane (bottom). Figure reproduced from Serponeet al, (2002).229
A photostability study by Gonzalez et al, (2007) further highlighted the photo-instability
of commercially used organic UV filters with the most prominent changes in UV pro-
tection occurring with formulations containing octyl methoxycinnamate, butyl methoxy
dibenzoylmethane and oxybenzone over UVA/UVB irradiation periods of 30, 90 and 120
min.302 Increased understanding of the photobehaviour of organic UV filters has also led
to the banning of certain combinations. For instance, octyl methoxycinnamate, avoben-
zone and butyl methoxy dibenzoylmethane have been shown to be incompatible with
one another due to the formation of photoadducts when exposed to UV radiation.302, 303
Mixtures of TiO2 and ZnO with organic UV filters have also been suggested to impact
the sunscreen protection efficacy after UV exposure over time.58, 304 The cause for such
changes in protection have been attributed to the photocatalytic activity of these inorganic
UV filters, resulting in the production of ROS and oxidative damage of other sunscreening
ingredients. This property is further discussed in Section 2.4.
Couteau et al, (2007) also investigated the photostability of various commonly used or-
ganic UV filters, prepared in oil/water emulsions, through the application of a spectro-
scopic SPF calculation.305 Formulations displaying significant reductions in protection,
56
2.2 Protection from UV Radiation: Sunscreens
as evidenced by a nominal decrease in SPF, included organic UV filters such as isoamyl
methoxycinnamate, octyl salicylate and PEG-25 PABA. The study results also suggested
that, for the irradiation time employed, octocrylene, octyl methoxy cinnamate and oxy-
benzone present good photostability contrary to the other studies described. This high-
lights the need for adopting a standardized methodology for assessing photostability, as
briefly mentioned by Gonzalez et al (2007).302
Environmental Effects
The increased prevalence of organic UV filters not only in personal care products, such
as sunscreens, but also various textiles, plastics and paints have also increased concerns
over their potential environmental impact. In particular, the contamination of aquatic
environments is of major concern due to the various pathways from which these filters
may enter these systems, which include through run-off from waste water treatment plants
and recreational activity.306–308 In vitro investigations of organic UV filters have shown
that they may exert genotoxic effects to coral cells.309 Furthermore, it has also been shown
that the occurrence and bioaccumulation of these organic filters can impact various aquatic
organisms such as affecting reproduction in fish, the development of coral larvae and
inducing coral bleaching.310–312 The last point in particular has led to state and national
level bans of certain organic UV filtering ingredients. In 2018, Hawai’i proposed banning
the use of sunscreen products containing oxybenzone and octinoxate due to their impact
on coral reefs and the frequency of sunscreen product use by tourists and locals containing
these ingredients.38 Following from this in 2020, Palau became the first country to ban
the use and distribution of sunscreen products containing the same organic UV filtering
ingredients as those proposed by Hawai’i due to findings of the ’toxic sunscreen chemicals
in tissues of their most famous creatures’.313 A review of both in situ and ex situ studies on
the affects of organic UV filters on coral and reef biota was conducted by the International
Coral Reef Initiative in 2018.314 It was suggested that many ex situ studies failed to
appropriately reflect realistic concentrations of the UV filters that have been found in
aquatic systems. However, the levels that have been detected in studies of the Caribbean
(US Virgin Islands), Mediterranean Sea (Majorca), Eastern Atlantic ocean (Gran Canaria)
57
2.3 Health Related Issues Associated with Inorganic UV Filters
and the Pacific Ocean (Hong Kong, Hawai’i, Palau), although varying, are substantially
high enough to be considered a serious environmental threat.
2.3 Health Related Issues Associated with Inorganic UVFilters
As the surface area to volume ratio of particles increases with decreasing particles size, the
surface reactivity of nanoparticles increases significantly compared to their bulk forms. It
is believed there is also an increase in the biological activity of these nanoparticulate ma-
terials due to their reduced size, and their use in therapeutic and cosmetic products has
been a major point of discussion over the last decade. The increased production and use
of nanoparticles in commercial products, not just TiO2 or ZnO, is leading to a general
increase in exposure to these nanomaterials, thus an understanding of the mechanisms
surrounding their potential internalization and effects on the human body are essential. In
some cases, sufficient evidence has been brought forward to warrant the discontinuation of
nanomaterials in certain applications. For instance, the application of either TiO2 or ZnO
nanoparticles in spray-based sunscreen products is strictly prohibited owing to their po-
tential internalization into the lungs and subsequent toxicological effects they may have.
In this section, an overview of the biological effects TiO2 and ZnO nanoparticles may
have and their potential impacts on human health is given.
2.3.1 Cytotoxicity and Genotoxicity
A significant amount of effort has gone into characterising the potential toxicological
effects of nanoparticulate TiO2 and ZnO, particularly now with the use of such nanoma-
terials in commercial products becoming more common knowledge. Various in vitro and
in vivo studies involving the use of mammalian cell lines and animal models have been
published to investigate the effects of these nanomaterials. Furthermore, investigations
surrounding the toxicological effects of these materials whilst exploiting their photocat-
alytic properties, termed phototoxicity, have also been performed to elucidate the potential
oxidative damage induced through ROS generation.
58
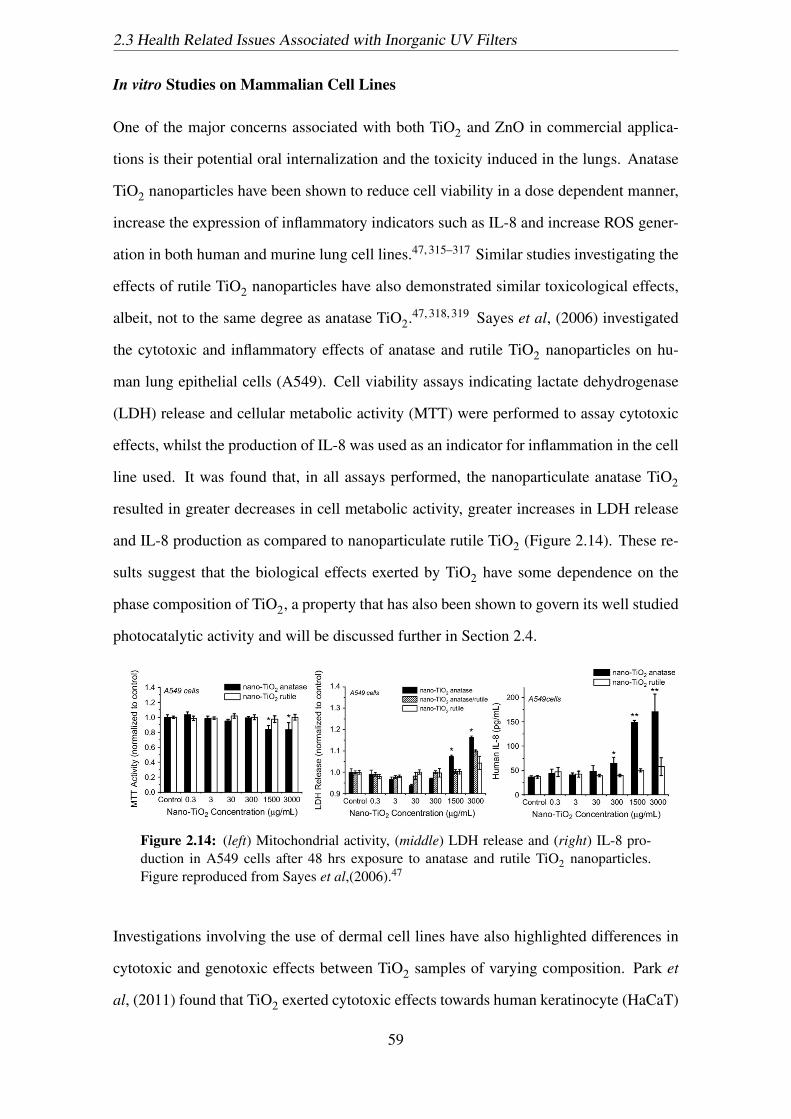
2.3 Health Related Issues Associated with Inorganic UV Filters
In vitro Studies on Mammalian Cell Lines
One of the major concerns associated with both TiO2 and ZnO in commercial applica-
tions is their potential oral internalization and the toxicity induced in the lungs. Anatase
TiO2 nanoparticles have been shown to reduce cell viability in a dose dependent manner,
increase the expression of inflammatory indicators such as IL-8 and increase ROS gener-
ation in both human and murine lung cell lines.47, 315–317 Similar studies investigating the
effects of rutile TiO2 nanoparticles have also demonstrated similar toxicological effects,
albeit, not to the same degree as anatase TiO2.47, 318, 319 Sayes et al, (2006) investigated
the cytotoxic and inflammatory effects of anatase and rutile TiO2 nanoparticles on hu-
man lung epithelial cells (A549). Cell viability assays indicating lactate dehydrogenase
(LDH) release and cellular metabolic activity (MTT) were performed to assay cytotoxic
effects, whilst the production of IL-8 was used as an indicator for inflammation in the cell
line used. It was found that, in all assays performed, the nanoparticulate anatase TiO2
resulted in greater decreases in cell metabolic activity, greater increases in LDH release
and IL-8 production as compared to nanoparticulate rutile TiO2 (Figure 2.14). These re-
sults suggest that the biological effects exerted by TiO2 have some dependence on the
phase composition of TiO2, a property that has also been shown to govern its well studied
photocatalytic activity and will be discussed further in Section 2.4.
Figure 2.14: (left) Mitochondrial activity, (middle) LDH release and (right) IL-8 pro-duction in A549 cells after 48 hrs exposure to anatase and rutile TiO2 nanoparticles.Figure reproduced from Sayes et al,(2006).47
Investigations involving the use of dermal cell lines have also highlighted differences in
cytotoxic and genotoxic effects between TiO2 samples of varying composition. Park et
al, (2011) found that TiO2 exerted cytotoxic effects towards human keratinocyte (HaCaT)
59

2.3 Health Related Issues Associated with Inorganic UV Filters
cells using MTT dichlorofluorescein (DCF) assays.320 It was also found that the degree
of cell death induced and generation of ROS varied according to the crystal phase com-
position of the TiO2 sample used, with mixed phases of anatase/rutile inducing greater
oxidative damage and cell death as compared to the purely anatase phase. Further studies
of anatase TiO2 nanoparticles have shown that they may be internalized after exposure
for 24 hr in in vitro grown human keratinocytes and sebocytes whilst also inhibiting cell
growth, in vitro, for human fibroblasts, melanocytes, keratinocytes and sebocytes in a dose
dependent manner.321 Murine fibroblast cells (L929) treated with anatase TiO2 nanopar-
ticles were also found to have inhibited cell proliferation as well as display evidence of
organelle and membrane damage due to elevated levels of ROS as a result of TiO2 in-
ternalisation.322 Interestingly, rutile TiO2 nanoparticles have been found to have varying
effects on human skin cells. The cause for these conflicting reports have been suggested
to be due to differences in the physicochemical properties of the particles tested, with
differences in particle size, surface area and surface chemistry being major contributing
factors to the toxicity observed.323, 324 Furthermore, cytotoxic effects of rutile nanopar-
ticles may also be cell line dependent, as evidenced by differences in cell proliferation
in HaCaT (human keratinocytes), A549 (human alveolar epithelial cells), U937 (human
macrophage cells) and Caco-2 (human intestinal epithelial cells) cell lines and after ex-
posure to rutile TiO2 nanoparticles.47, 325, 326
A number of in vitro studies have also demonstrated the cytotoxic and genotoxic poten-
tial of ZnO nanoparticles. The impact of ZnO on in vitro cell viability has often been
attributed to the solubility of ZnO and the release of free Zn2+, depending on the cell
line in question. The presence of free Zn2+ can disrupt the natural homoeostatic con-
centration of Zn in cells and lead to a loss of cell viability through oxidative stress and
mitochondrial dysfunction.327, 328 This dissolution mechanism for toxicity has been show
to affect murine neural stem cells (C17.2), human monocyte macrophages and human
alveolar adenocarcinoma cells (A549).48, 329, 330 A further study on human bronchial ep-
ithelial (BEAS-2B) cells incubated with 20 nm ZnO nanoparticles showed a concentration
and time dependent dependence on cytotoxicity, with elevated levels of oxidative stress,
60
2.3 Health Related Issues Associated with Inorganic UV Filters
intracellular Ca2+ levels and membrane damage (LDH release) also being detected.331
This same study also highlighted that, even at sublethal concentrations, ZnO nanopar-
ticles could modulate the expression of at least four genes involved in oxidative stress
and apoptosis, thus reflecting the highly cytotoxic nature of ZnO. Size and shape de-
pendent cytotoxicity of ZnO nanoparticles has also been demonstrated on human lym-
phoblastoid (WIL2-NS) cells , human neuroblastoma (SHSY5Y) cells and human alveo-
lar adenocarcinoma (A549) cells, with the primary influence of these parameters on the
specific surface area of the particles contributing strongly to Zn ion release and the toxic-
ity displayed.324, 332 Comparative cytotoxic studies of various metal oxides nanoparticles
including TiO2, Al2O3, SiO2 and CeO2 alongside ZnO nanoparticles have also demon-
strated the highly cytotoxic nature of these ZnO nanomaterials.333–336
Specific studies involving the use of sunscreen derived inorganic nanoparticles have not
been thoroughly investigated, with most researchers preferring the use of other commer-
cial TiO2 and ZnO or ’in-house’ prepared variants. One study by Dunford et al, (1997)
investigated DNA damage induced by TiO2 nanoparticles derived from commercial sun-
screen products under solar-simulated light exposure.337 Various anatase/rutile crystal
phase compositions were observed from the various sunscreen derived TiO2. Direct
strand breaks in DNA derived from the plasmid pBluescript II SK+ by the sunscreen
derived TiO2 nanoparticles was revealed, with greater damage observed for samples with
greater anatase phase compositions. Furthermore, through the use of various free radical
quenchers, it was found that the damage induced was a direct cause of OH• presumably
induced by the photoexcited TiO2.The same study also demonstrated the genotoxic ef-
fect of sunscreen derived TiO2 on human cells. Comet assays performed using a lung
tissue derived fibroblasts (MRC-5) also revealed extensive oxidative damage induced by
the ROS-generating ability of TiO2.
In vivo Studies on Mammalian Models
The main pathways of internalization as concerned with sunscreen based nanoparticles are
permeation through the skin, inhalation and accidental oral ingestion. As skin permeation
61
2.3 Health Related Issues Associated with Inorganic UV Filters
of inorganic UV filtering nanoparticles is considered a major concern, it will be discussed
in further detail in a Section on its own (Section 2.3.4). As such, studies primarily involv-
ing orally, inhaled or intravenously administration of TiO2 and ZnO nanoparticles will be
discussed here.
A significant study published in 1985 involving the administration through inhalation of
TiO2 fine particles (mean particle size greater than 100 nm) to rats over a 2 year period
revealed the development of lung tumors.49 Although these findings were challenged by
many, with some suggesting the results being due to lung overload (due excessively high
dosage) as opposed to carcinogenicity by the TiO2 particles, the International Agency for
Research on Cancer (IARC) has since classified TiO2 as a Group 2B carcinogen (materi-
als with possible carcinogenicity towards humans).338, 339 More recent studies have also
now demonstrated that TiO2 nanoparticles exert greater in vivo toxic effects as compared
to larger TiO2 particles.340–342 Inhalation studies involving rats exposed to 0 - 50 mg m−3
doses of TiO2 nanoparticles (mean sizes of 5 nm and 25 nm, mixed anatase/rutile crystal
phase) for 5 and 10 days revealed the acute induction of pulmonary inflammation.343, 344
A further study by Liu et al, (2009) demonstrated dose dependent and size dependent inci-
dence of lesions to lung tissues of rats intra-tracheally treated with TiO2 nanoparticles.345
It was found that 5 nm (anatase) TiO2 nanoparticles induced more severe pulmonary toxic
effects as opposed to 21 (mixed phase) or 50 nm (rutile) sized particles. It was also sug-
gested that the smaller sized nanoparticles impaired the phagocytotic ability of alveolar
macrophages at exposure doses of 50 mg kg−1, enabling toxicological effects to occur
more easily due to a decrease in efficiency of natural defensive mechanisms to dealing
with foreign threats. The acute impact of particle size and, subsequently, specific sur-
face area and crystal phase on pulmonary toxicity and alveolar macrophage activity was
further demonstrated by Liu et al, (2010).346 Interestingly, acute oral toxicity studies us-
ing rabbit and mice models suggested minimal systemic toxicity towards 25 nm, 80 nm,
129 nm and 155 nm TiO2.347, 348 Conversely, acute intra-peritoneal studies showed, at
high doses (150 mg kg−1), significant damage to the liver and kidneys could be induced
with administration of 5 nm anatase TiO2 nanoparticles, further demonstrating the size
62

2.3 Health Related Issues Associated with Inorganic UV Filters
dependence of TiO2 toxicity but also the dependence on the method of administration of
said particles.349 This same study also reported a median lethal dose (LD50) of 150 mg
kg−1 in mice used, a significantly lower dose than that reported previously by the WHO
for bulk TiO2 particles administered to rats (>10,000 mg kg−1).348 Chronic exposure
studies performed using inhalation and intra-gastric administration of TiO2 nanoparticles
and fine particles, ranging from 5 nm up to 250 nm, also suggest some moderate levels of
toxicity with incidences of pulmonary lesions, spleen and lung injury, inflammation and
macrophage impairment being most evident in rat, pig and mice models.49, 340, 350, 351 Ex-
perimental studies for carcinogenicity using animal models have also demonstrated that
TiO2 nanoparticles may induce respiratory tract cancers and lung tumors when adminis-
tered at high dosages through intra-tracheal and inhalation routes of exposure but limited
carcinogenicity is observed when intra-gastric or dermal administration is used.352–356 A
limited number of epidemiological studies have been carried out to assess the affect of
TiO2 exposure on humans and have shown that there is no significant link between ex-
posure and risk of lung cancer.357, 358 However, studies that have been performed do not
specify particle size, so it is unclear as to whether chronic exposure to nanoparticulate
TiO2 can increase the risk of cancers and is an area that needs further investigation.
Similarly to TiO2, ZnO particles (70 nm up to 3 µm) have also been shown to demon-
strate acute inflammatory responses and pulmonary damage to the lung tissues of rats
through intra-tracheal administration and inhalation.50, 359 Administration of inhaled ZnO
nanoparticles (20 nm) to rats at dosage of 2.5 mg kg−1 body weight twice daily for 3 days
resulted in extensive lung and liver tissue damage, further demonstrating the toxicologi-
cal potential of ZnO. It has also been suggested that, due to the acidic nature of the lung
lining, greater dissolution of ZnO and release of Zn2+ can result in an increase in local
toxicity as a result of increased intracellular Zn2+ and metal-ion imbalances.360 Treat-
ment of guinea pigs with 50 nm ZnO nanoparticles at the industry-standard occupational
exposure dose of 5 mg m−3 through inhalation for 3 hr per day for 6 days also demon-
strated the propensity for these particles to induce inflammatory response, reduced lung
capacity and lung lesions.361 Furthermore, inhalation studies with human subjects re-
63

2.3 Health Related Issues Associated with Inorganic UV Filters
sulted in the expression of symptoms related to ’metal fever’ due to ZnO nanoparticles
at exposure levels even below 5 mg m−3, although test group sizes were relatively small
(4 and 13 participants).362, 363 Oral administration of ZnO nanoparticles to mice and rats
have also highlighted the size dependent and dose dependent toxicity of ZnO in causing
lung and liver tissue damage through this exposure route.364–366 Pasupuleti et al, (2011)
orally treated adult rats with 20 nm and micro-sized (greater than 100 nm) ZnO particles
at doses varying from 5 up to 2000 mg kg−1 body weight for 14 days.365 It was found that
greater incidence of lesions in the liver, pancreas, heart and stomach occurred with admin-
istration of ZnO nanoparticles at the lowest dosage level (5 mg kg−1 body weight) and, in
turn, particle number within the afflicted organs. This is particularly important in regards
to the potential health effects of sunscreen based nanoparticles since, as will be further dis-
cussed later, minimal permeation of these nanoparticles occurs through the skin thus also
leading to a low loading and particle number. No specific long-term carcinogenic studies
on ZnO in animals could be found, whilst only a few long-term studies using Zn based
chemicals or supplements are available. One epidemiological study performed on 46,974
US male volunteers supplemented with varying amounts of Zn in a 14 year-long study
found that no significant correlation between Zn intake, at realistic dosages (100 mg Zn
per day), and prostate cancer risk was observed after a 10-year follow up.367 However, the
lack of specific carcinogenic ZnO nanoparticle studies still warrants further investigation
due to past evidence of in vitro and in vivo genotoxicity and mutagenicity.368, 369
2.3.2 Phototoxicity
Concerns over the generation of free radicals and ROS by ZnO and TiO2 due to their
semiconductor electronic structure has led to various biological investigations involving
simultaneous exposure to these nanomaterials and UV radiation or solar-simulated sun
light exposure. A more thorough discussion of ROS generation and photocatalysis by
inorganic UV filters is given in Section 2.4, whilst an overview of literature findings in
regards to the phototoxic potential of ZnO and TiO2 nanoparticles is given here.
The phototoxicity associated with TiO2 and its crystal phases is inherently linked to its
64
2.3 Health Related Issues Associated with Inorganic UV Filters
photoactivity and physicochemical properties. Phototoxicity studies performed by Uchino
et al, (2002) found a higher rate of OH• radical production through electron paramagentic
resonance (EPR) spectroscopy for anatase nanoparticles as compared to the rutile crystal
phase when exposed to UVA radiation.51 This increased radical production also corre-
lated to an increase in cytotoxicity towards Chinese hamster ovary (CHO) cells. Particle
size and specific surface area (SSA), which are generally intimately linked, has also been
shown to influence ROS generation by TiO2 nanoparticles. Wyrwoll et al, (2008) found
that the generation of OH• was highest for the smallest TiO2 nanoparticles tested (anatase,
7-10 nm, SSA 280 m2 g−1), however, the overall sum of ROS generated was highest for
slightly larger particles (anatase, 15-25 nm, SSA 77.6 m2 g−1).370 Furthermore, the high-
est degree of phototoxicity towards Daphnia magna under solar-simulated illumination
was achieved with the slightly larger nanoparticles (anatase, 15-25 nm), owing to the
higher concentration of ROS generated. Photocytotoxic and photogenotoxic effects of
TiO2 nanoparticles have also been demonstrated in human peripheral blood lymphocytes,
human retinal pigment epithelial cells (ARPE-19), mouse lymphoma cells (L5178Y),
Chinese hamster CHL/IU cells, RAW264.7 cells and HaCaT cells.371–375 It should be
noted that, in all these studies mentioned, the TiO2 nanoparticles tested were uncoated,
whilst sunscreen based TiO2 nanoparticles are nearly always coated with some form of
inert material that aims to inhibit ROS generation. As such, specific phototoxic studies
investigating the effects of coated TiO2 nanoparticles are of more significant relevance
here. Horie et al, (2010) evaluated the impact of cosmetic grade rutile TiO2 nanoparticles
(5-15 nm × 20-90 nm) coated with Al(OH)3 on the HaCaT and A549 cell lines, showing
minimal influence in toxicity towards the cells in absence of UV light.376 A further study
by Al-Abed et al, (2016) investigated the phototoxic potential of Al(OH)3 coated rutile
TiO2 (mean size 60 nm) but with the additional step of artificial ageing under highly
chlorinated conditions to simulate the conditions of sunscreen users in swimming pool
water.377 It was found that, whilst there was no significant phototoxicity towards human
retinal pigment epithelial cells (ARPE-19) for un-aged samples, a significant difference
between UVA irradiated and non-irradiated aged samples did occur. This was presum-
65
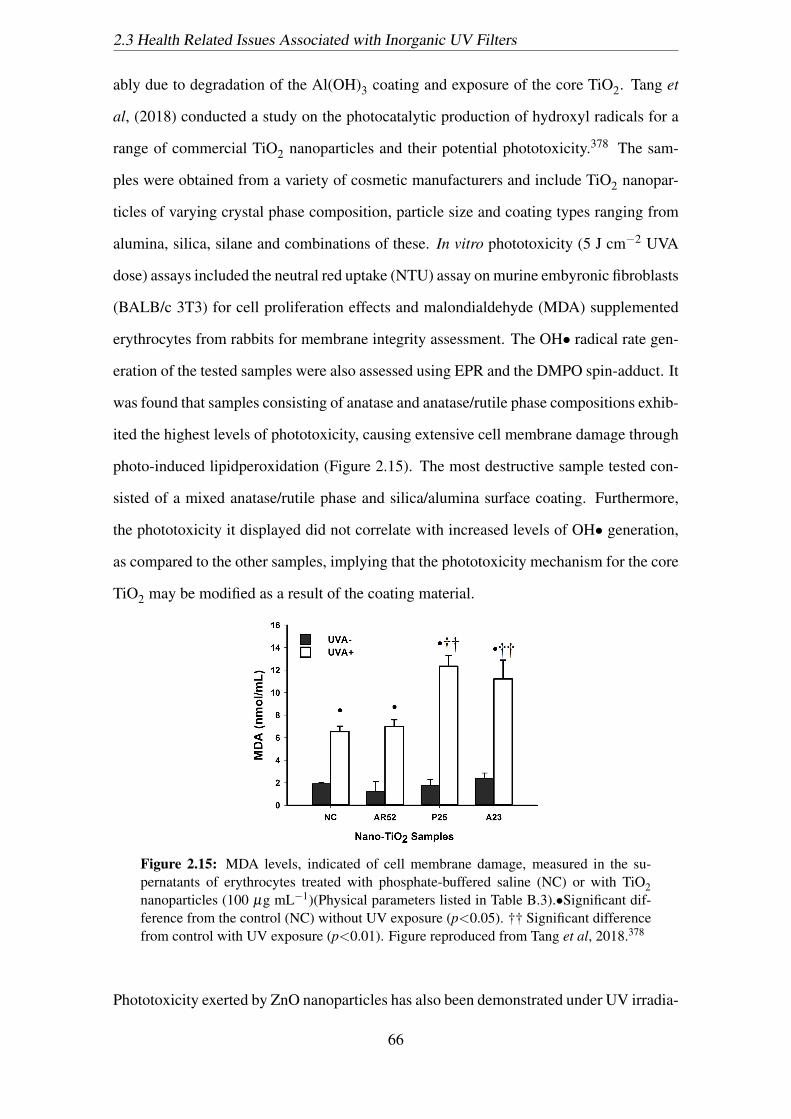
2.3 Health Related Issues Associated with Inorganic UV Filters
ably due to degradation of the Al(OH)3 coating and exposure of the core TiO2. Tang et
al, (2018) conducted a study on the photocatalytic production of hydroxyl radicals for a
range of commercial TiO2 nanoparticles and their potential phototoxicity.378 The sam-
ples were obtained from a variety of cosmetic manufacturers and include TiO2 nanopar-
ticles of varying crystal phase composition, particle size and coating types ranging from
alumina, silica, silane and combinations of these. In vitro phototoxicity (5 J cm−2 UVA
dose) assays included the neutral red uptake (NTU) assay on murine embyronic fibroblasts
(BALB/c 3T3) for cell proliferation effects and malondialdehyde (MDA) supplemented
erythrocytes from rabbits for membrane integrity assessment. The OH• radical rate gen-
eration of the tested samples were also assessed using EPR and the DMPO spin-adduct. It
was found that samples consisting of anatase and anatase/rutile phase compositions exhib-
ited the highest levels of phototoxicity, causing extensive cell membrane damage through
photo-induced lipidperoxidation (Figure 2.15). The most destructive sample tested con-
sisted of a mixed anatase/rutile phase and silica/alumina surface coating. Furthermore,
the phototoxicity it displayed did not correlate with increased levels of OH• generation,
as compared to the other samples, implying that the phototoxicity mechanism for the core
TiO2 may be modified as a result of the coating material.
Figure 2.15: MDA levels, indicated of cell membrane damage, measured in the su-pernatants of erythrocytes treated with phosphate-buffered saline (NC) or with TiO2nanoparticles (100 µg mL−1)(Physical parameters listed in Table B.3).•Significant dif-ference from the control (NC) without UV exposure (p<0.05). †† Significant differencefrom control with UV exposure (p<0.01). Figure reproduced from Tang et al, 2018.378
Phototoxicity exerted by ZnO nanoparticles has also been demonstrated under UV irradia-
66
2.3 Health Related Issues Associated with Inorganic UV Filters
tion towards HaCaT, BALB/c 3T3a, A549 cells and human foreskin fibroblasts (AG01518).52, 379–381
The phototoxic properties of ZnO have also been shown to be particle size dependent,
dose dependent and time dependent with decreasing particle size and increasing dose/time
leading to greater generation of ROS, release of free Zn2+ and, subsequently, phototox-
icity.380, 382, 383 Phototoxicity studies of ZnO nanoparticles have also been performed in
unison with TiO2 nanoparticles. Pre-UV irradiated suspensions of ZnO nanoparticles
(<50 nm) and TiO2 nanoparticles (anatase, <25 nm) were shown to induce significant
phototoxic effects towards Artemia salina shrimp cysts.384 Greater toxicity was observed
in the case of the ZnO nanoparticles and was attributed to the two-fold action of both
ROS generation and ZnO dissolution. Gopalan et al, (2009) also investigated specific
photogenotoxicity of ZnO and TiO2 nanoparticles (both within the 40-70 nm size range)
towards human sperm and lymphocytes using the Comet assay.385 The ZnO nanoparti-
cles were found to induce greater toxicity in both cell types in the way of DNA damage,
both with and without UV irradiation, as compared to the TiO2 nanoparticles, which only
showed significant phototoxicity towards the tested lymphocytes.
Although it is highly recommended by the TGA that all current and new organic and inor-
ganic based UV filters developed by manufacturers have the appropriate cytotoxic/genotoxic
and phototoxic properties of their material evaluated prior to submission, certain informa-
tion may be omitted or excepted if it can be shown said material does not permeate through
the skin and reach viable cells. This has caused alot of distress in consumers surrounding
the use of nanoparticles in cosmetic and therapuetic products and much effort has gone
into assessing the permeation potential of these particles. The findings of such studies
will be discussed further in Section 2.3.4.
2.3.3 Environmental Effects
Global production of nano-TiO2 and nano-ZnO has been estimated to be between 550 -
5500 t and 55 - 550 t per year, respectively, with 60% of TiO2 and 80% of ZnO thought
to be used in cosmetic products.386 The primary ecosystems most prone to nanoparticu-
late ZnO and TiO2 exposure are aquatic systems due to their use in various therapeutic
67

2.3 Health Related Issues Associated with Inorganic UV Filters
and cosmetic sunscreens. An estimation of the release of these nanoparticles into aquatic
systems was suggested by Wong et al, (2010) to be as high as 250 t per year which, consid-
ering the chemical inertness of TiO2 in particular, may pose a significant cause of concern
to aquatic biota.387 Exposure of various aquatic organisms to TiO2 and ZnO nanoparticles
has been demonstrated to have negative effects on the health of such organisms.387–389 In
particular, coral reefs exposed to uncoated TiO2 and ZnO nanoparticles have been show to
undergo coral bleaching processes.390 Notably, ZnO nanoparticles were shown to induce
irreversible expulsion of Acropora coral microbiota, which are necessary for providing
the coral with much of its energy input. Other studies on the Montastraea faveolata stony
coral exposed to TiO2 nanoparticles, whilst still displaying microbiota expulsion, show
some levels of acclimation and recovery.391 Regardless, the large input of either inorganic
UV filter into aquatic systems needs to be constantly monitored or require modifications
to minimize their impact on marine organisms.
2.3.4 Dermal Permeation of Inorganic UV Filters
The most pressing concern associated with the use of nanoparticles in sunscreen products
is their potential permeation through the skin and subsequent oxidative damage they may
induce to viable cells through photocatalyzed ROS generation. The weight of evidence
presented by various ex vivo permeation studies through animal and human skin models
have suggested sunscreen based nanoparticles remain on the surface of the skin and are
unable to penetrate deep enough to reach viable cells.54, 392, 393 However, it is also im-
portant to mention that conflicting reports highlight that various factors related both to
the skin model and the nanoparticle characteristics can impact the depth of penetration.
Physicochemical properties of the nanoparticles, such as their size, shape and surface
properties, can influence their permeation. In addition, the condition of the skin model,
site of application, origin of the skin and method of analysis can also influence the results
obtained from such studies.
Human skin operates as the ’first line of defence’ against environmental factors, both
chemical and physical, and constitutes for approximately 16% of a humans total body
68
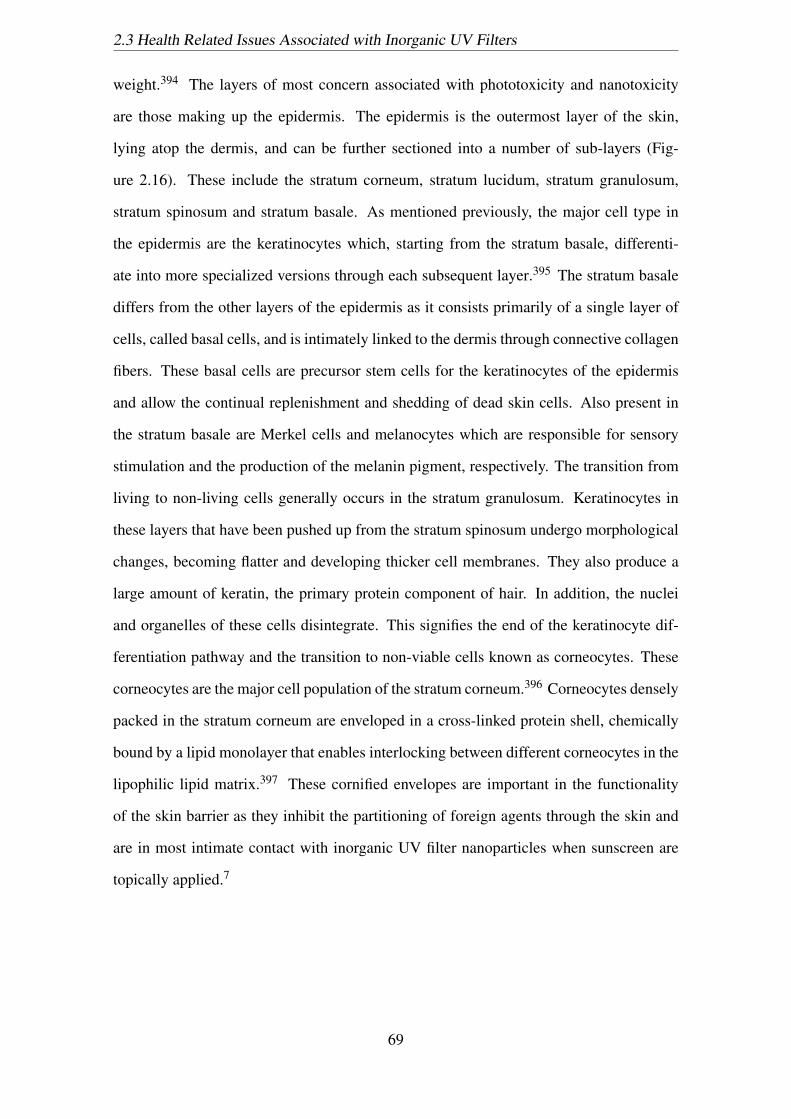
2.3 Health Related Issues Associated with Inorganic UV Filters
weight.394 The layers of most concern associated with phototoxicity and nanotoxicity
are those making up the epidermis. The epidermis is the outermost layer of the skin,
lying atop the dermis, and can be further sectioned into a number of sub-layers (Fig-
ure 2.16). These include the stratum corneum, stratum lucidum, stratum granulosum,
stratum spinosum and stratum basale. As mentioned previously, the major cell type in
the epidermis are the keratinocytes which, starting from the stratum basale, differenti-
ate into more specialized versions through each subsequent layer.395 The stratum basale
differs from the other layers of the epidermis as it consists primarily of a single layer of
cells, called basal cells, and is intimately linked to the dermis through connective collagen
fibers. These basal cells are precursor stem cells for the keratinocytes of the epidermis
and allow the continual replenishment and shedding of dead skin cells. Also present in
the stratum basale are Merkel cells and melanocytes which are responsible for sensory
stimulation and the production of the melanin pigment, respectively. The transition from
living to non-living cells generally occurs in the stratum granulosum. Keratinocytes in
these layers that have been pushed up from the stratum spinosum undergo morphological
changes, becoming flatter and developing thicker cell membranes. They also produce a
large amount of keratin, the primary protein component of hair. In addition, the nuclei
and organelles of these cells disintegrate. This signifies the end of the keratinocyte dif-
ferentiation pathway and the transition to non-viable cells known as corneocytes. These
corneocytes are the major cell population of the stratum corneum.396 Corneocytes densely
packed in the stratum corneum are enveloped in a cross-linked protein shell, chemically
bound by a lipid monolayer that enables interlocking between different corneocytes in the
lipophilic lipid matrix.397 These cornified envelopes are important in the functionality
of the skin barrier as they inhibit the partitioning of foreign agents through the skin and
are in most intimate contact with inorganic UV filter nanoparticles when sunscreen are
topically applied.7
69
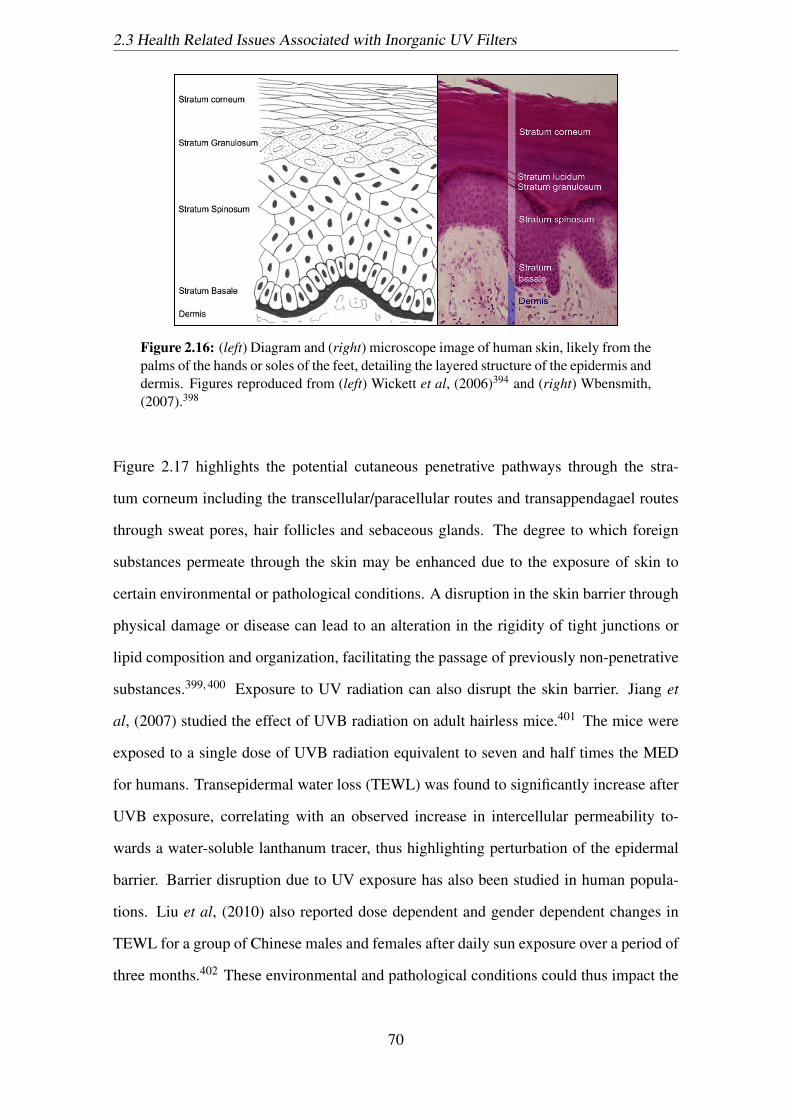
2.3 Health Related Issues Associated with Inorganic UV Filters
Figure 2.16: (left) Diagram and (right) microscope image of human skin, likely from thepalms of the hands or soles of the feet, detailing the layered structure of the epidermis anddermis. Figures reproduced from (left) Wickett et al, (2006)394 and (right) Wbensmith,(2007).398
Figure 2.17 highlights the potential cutaneous penetrative pathways through the stra-
tum corneum including the transcellular/paracellular routes and transappendagael routes
through sweat pores, hair follicles and sebaceous glands. The degree to which foreign
substances permeate through the skin may be enhanced due to the exposure of skin to
certain environmental or pathological conditions. A disruption in the skin barrier through
physical damage or disease can lead to an alteration in the rigidity of tight junctions or
lipid composition and organization, facilitating the passage of previously non-penetrative
substances.399, 400 Exposure to UV radiation can also disrupt the skin barrier. Jiang et
al, (2007) studied the effect of UVB radiation on adult hairless mice.401 The mice were
exposed to a single dose of UVB radiation equivalent to seven and half times the MED
for humans. Transepidermal water loss (TEWL) was found to significantly increase after
UVB exposure, correlating with an observed increase in intercellular permeability to-
wards a water-soluble lanthanum tracer, thus highlighting perturbation of the epidermal
barrier. Barrier disruption due to UV exposure has also been studied in human popula-
tions. Liu et al, (2010) also reported dose dependent and gender dependent changes in
TEWL for a group of Chinese males and females after daily sun exposure over a period of
three months.402 These environmental and pathological conditions could thus impact the
70

2.3 Health Related Issues Associated with Inorganic UV Filters
permeation of sunscreen based nanoparticles, providing alternate routes of penetration to
the viable dermis. This was demonstrated by Mortensen et al, (2008) who investigated
the in vivo penetration of carboxylated-quantum dots (20-33 nm) applied in formulation
to mice dosed with sufficient UVA/UVB radiation to induce erythema.403 It was found
that 24 hr after application, the penetration levels of the quantum dots were, qualita-
tively, higher than those applied to non-irradiated mice, thus demonstrating the impact of
UV radiation of barrier function and the potential for nanoparticle penetration enhance-
ment.
Figure 2.17: Layered structure of the epidermis and the potential pathways for cutaneouspenetration including the a) paracellular, b) transcellular and transappendagael routes.The transappendagael routes include c1) hair follicles, c2) sweat pores and c3) sebaceousglands. Figure reproduced from Smijs et al, (2011).7
The Australian TGA have conducted a safety review of TiO2 and ZnO nanoparticles in
sunscreen products, assessing various physicochemical properties and interactions with
biological systems, including skin permeation.54 It is in their opinion that the weight of
literature evidence suggests these sunscreen based nanoparticles do not penetrate the skin
sufficiently to reach viable cells, thus pose no significant threat. Similarly, the EU SCCS
also takes a similar stance on the safety of these two materials and have allowed the con-
tinued use of these nanoparticulate materials. Despite these opinions, their is still some
uncertainty in the scientific community surrounding the safety of these inorganic nanopar-
ticles due to conflicting experimental evidence and lack of mechanistic explanations for
the behaviour of these nanoparticles on the skin. In their report, the TGA also drew at-
tention to the fact that different test methodologies can lead to differences in permeation
potential for the same material. For instance, studies using isolated human or animal epi-
71
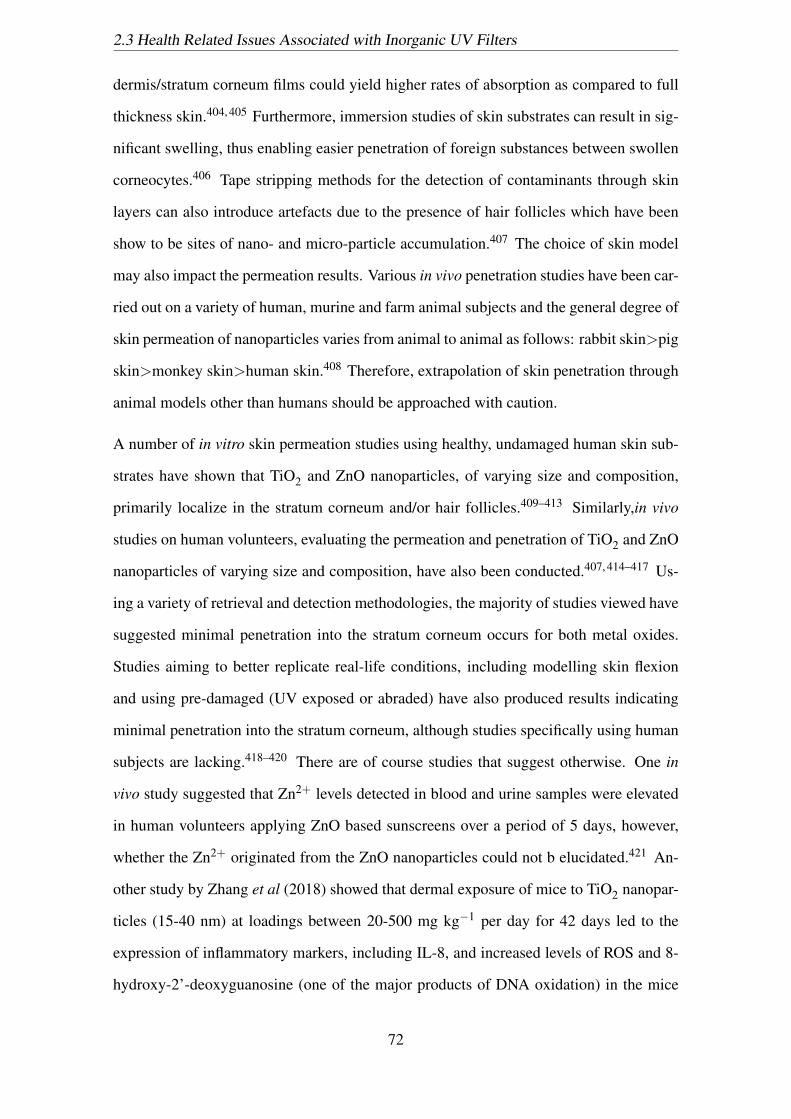
2.3 Health Related Issues Associated with Inorganic UV Filters
dermis/stratum corneum films could yield higher rates of absorption as compared to full
thickness skin.404, 405 Furthermore, immersion studies of skin substrates can result in sig-
nificant swelling, thus enabling easier penetration of foreign substances between swollen
corneocytes.406 Tape stripping methods for the detection of contaminants through skin
layers can also introduce artefacts due to the presence of hair follicles which have been
show to be sites of nano- and micro-particle accumulation.407 The choice of skin model
may also impact the permeation results. Various in vivo penetration studies have been car-
ried out on a variety of human, murine and farm animal subjects and the general degree of
skin permeation of nanoparticles varies from animal to animal as follows: rabbit skin>pig
skin>monkey skin>human skin.408 Therefore, extrapolation of skin penetration through
animal models other than humans should be approached with caution.
A number of in vitro skin permeation studies using healthy, undamaged human skin sub-
strates have shown that TiO2 and ZnO nanoparticles, of varying size and composition,
primarily localize in the stratum corneum and/or hair follicles.409–413 Similarly,in vivo
studies on human volunteers, evaluating the permeation and penetration of TiO2 and ZnO
nanoparticles of varying size and composition, have also been conducted.407, 414–417 Us-
ing a variety of retrieval and detection methodologies, the majority of studies viewed have
suggested minimal penetration into the stratum corneum occurs for both metal oxides.
Studies aiming to better replicate real-life conditions, including modelling skin flexion
and using pre-damaged (UV exposed or abraded) have also produced results indicating
minimal penetration into the stratum corneum, although studies specifically using human
subjects are lacking.418–420 There are of course studies that suggest otherwise. One in
vivo study suggested that Zn2+ levels detected in blood and urine samples were elevated
in human volunteers applying ZnO based sunscreens over a period of 5 days, however,
whether the Zn2+ originated from the ZnO nanoparticles could not b elucidated.421 An-
other study by Zhang et al (2018) showed that dermal exposure of mice to TiO2 nanopar-
ticles (15-40 nm) at loadings between 20-500 mg kg−1 per day for 42 days led to the
expression of inflammatory markers, including IL-8, and increased levels of ROS and 8-
hydroxy-2’-deoxyguanosine (one of the major products of DNA oxidation) in the mice
72
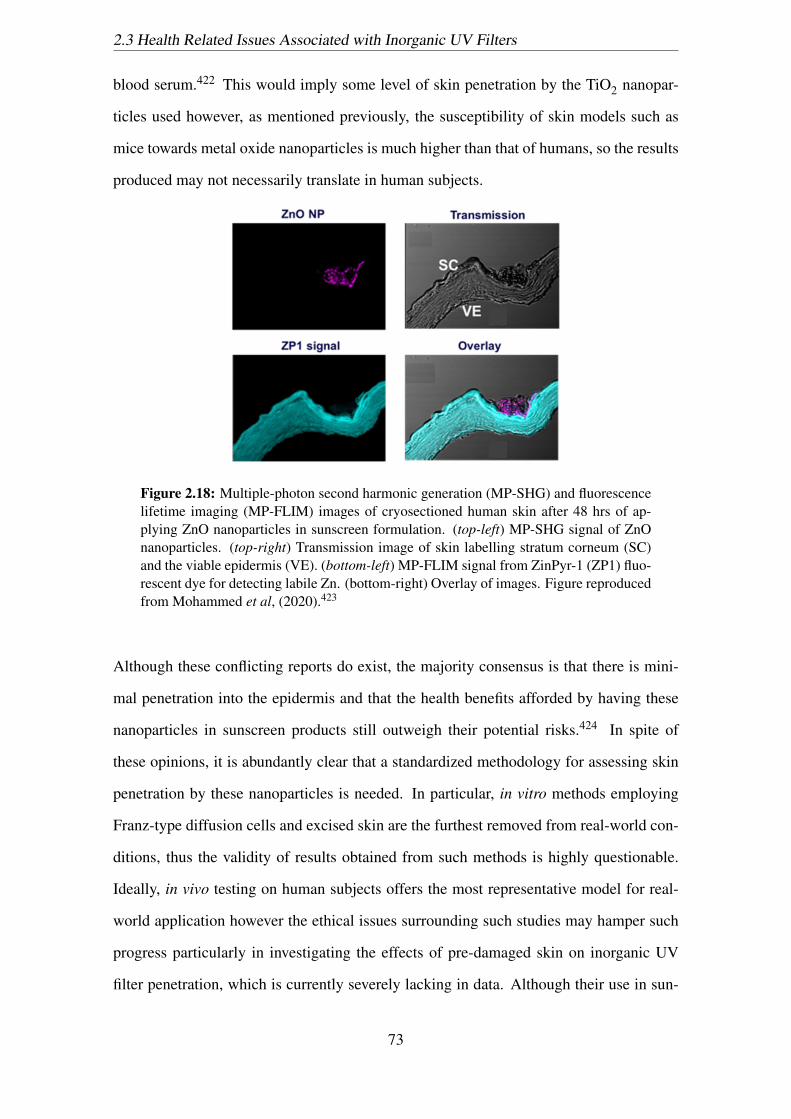
2.3 Health Related Issues Associated with Inorganic UV Filters
blood serum.422 This would imply some level of skin penetration by the TiO2 nanopar-
ticles used however, as mentioned previously, the susceptibility of skin models such as
mice towards metal oxide nanoparticles is much higher than that of humans, so the results
produced may not necessarily translate in human subjects.
Figure 2.18: Multiple-photon second harmonic generation (MP-SHG) and fluorescencelifetime imaging (MP-FLIM) images of cryosectioned human skin after 48 hrs of ap-plying ZnO nanoparticles in sunscreen formulation. (top-left) MP-SHG signal of ZnOnanoparticles. (top-right) Transmission image of skin labelling stratum corneum (SC)and the viable epidermis (VE). (bottom-left) MP-FLIM signal from ZinPyr-1 (ZP1) fluo-rescent dye for detecting labile Zn. (bottom-right) Overlay of images. Figure reproducedfrom Mohammed et al, (2020).423
Although these conflicting reports do exist, the majority consensus is that there is mini-
mal penetration into the epidermis and that the health benefits afforded by having these
nanoparticles in sunscreen products still outweigh their potential risks.424 In spite of
these opinions, it is abundantly clear that a standardized methodology for assessing skin
penetration by these nanoparticles is needed. In particular, in vitro methods employing
Franz-type diffusion cells and excised skin are the furthest removed from real-world con-
ditions, thus the validity of results obtained from such methods is highly questionable.
Ideally, in vivo testing on human subjects offers the most representative model for real-
world application however the ethical issues surrounding such studies may hamper such
progress particularly in investigating the effects of pre-damaged skin on inorganic UV
filter penetration, which is currently severely lacking in data. Although their use in sun-
73
2.4 Photocatalysis by Inorganic UV Filtering TiO2 Nanoparticles
screen products has continued despite ambiguity surrounding their safety, both TiO2 and
ZnO are photocatalyst materials and their propensity to produce ROS when exposed to
UV radiation should still be addressed to further minimize their potentially detrimental
health effects.
2.4 Photocatalysis by Inorganic UV Filtering TiO2 Nanopar-ticles
As mentioned in the prior section, modern formulations will often contain inorganic UV
filters in the form of nanoparticles. The use of these materials in this size range modifies
their interaction with light by increasing their transparency in the visible light region
and improving their absorption across the UVA and UVB wavelength regions. However,
an additional side effect of this size reduction is their increased propensity to produce
free radical species. The reason for this is due to the photocatalytic nature of TiO2 and
ZnO.
Photocatalysts may be defined as stable semiconductors capable of initiating surface
based chemical reactions due to the production of photoexcited charge carriers.425 Both
TiO2 and ZnO are photocatalysts that have long been researched in applications that ma-
nipulate this property. In particular, TiO2 nanoparticles have been used as a reference
photocatalyst materials for many research fields due to its apprently high photocatalytic
activity relative to other semiconductor materials. The use of TiO2 in nanoparticulate form
for catalysis dates back to the development of the first dye-sensitized solar cells by Gratzel
et al, (1991) owing to the high surface area at this size range and the high efficiency of
photon to current conversion of TiO2.46 In this section, an overview of the photocatalytic
mechanism of TiO2 nanoparticles and methodology for modifying this property is given.
Only TiO2 as an inorganic UV filter is considered from here due to it forming the basis of
the thesis work.
74
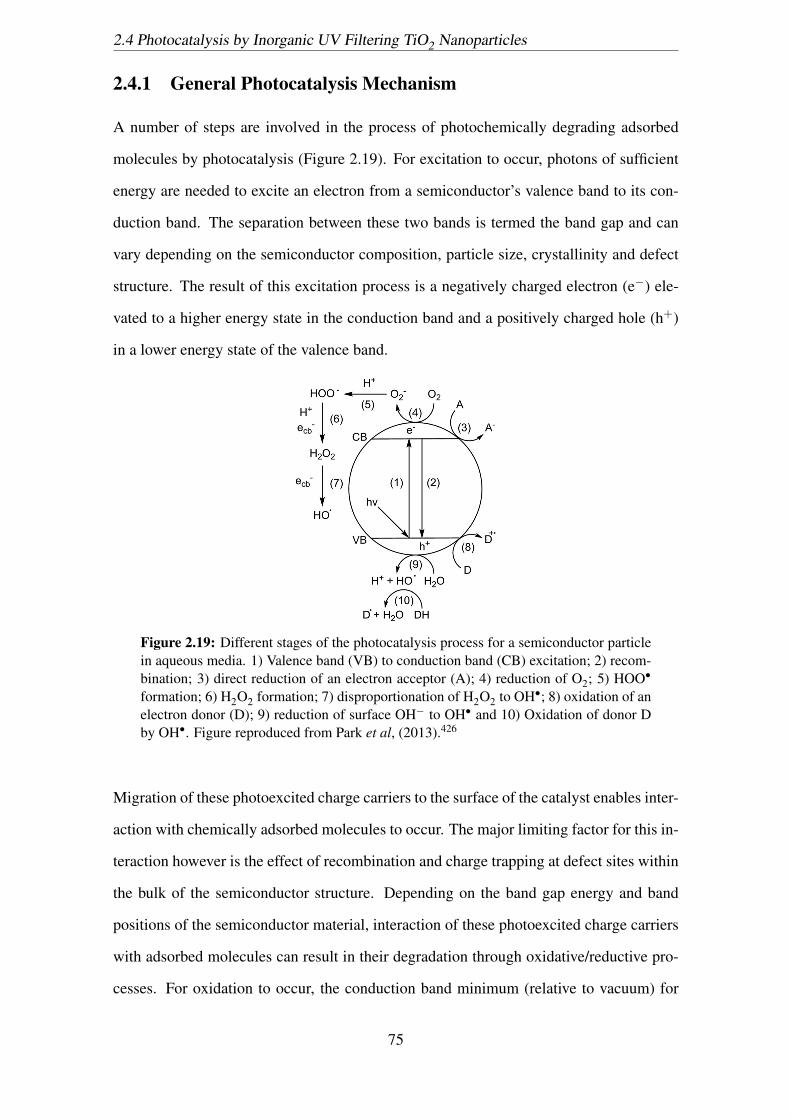
2.4 Photocatalysis by Inorganic UV Filtering TiO2 Nanoparticles
2.4.1 General Photocatalysis Mechanism
A number of steps are involved in the process of photochemically degrading adsorbed
molecules by photocatalysis (Figure 2.19). For excitation to occur, photons of sufficient
energy are needed to excite an electron from a semiconductor’s valence band to its con-
duction band. The separation between these two bands is termed the band gap and can
vary depending on the semiconductor composition, particle size, crystallinity and defect
structure. The result of this excitation process is a negatively charged electron (e−) ele-
vated to a higher energy state in the conduction band and a positively charged hole (h+)
in a lower energy state of the valence band.
Figure 2.19: Different stages of the photocatalysis process for a semiconductor particlein aqueous media. 1) Valence band (VB) to conduction band (CB) excitation; 2) recom-bination; 3) direct reduction of an electron acceptor (A); 4) reduction of O2; 5) HOO•
formation; 6) H2O2 formation; 7) disproportionation of H2O2 to OH•; 8) oxidation of anelectron donor (D); 9) reduction of surface OH− to OH• and 10) Oxidation of donor Dby OH•. Figure reproduced from Park et al, (2013).426
Migration of these photoexcited charge carriers to the surface of the catalyst enables inter-
action with chemically adsorbed molecules to occur. The major limiting factor for this in-
teraction however is the effect of recombination and charge trapping at defect sites within
the bulk of the semiconductor structure. Depending on the band gap energy and band
positions of the semiconductor material, interaction of these photoexcited charge carriers
with adsorbed molecules can result in their degradation through oxidative/reductive pro-
cesses. For oxidation to occur, the conduction band minimum (relative to vacuum) for
75
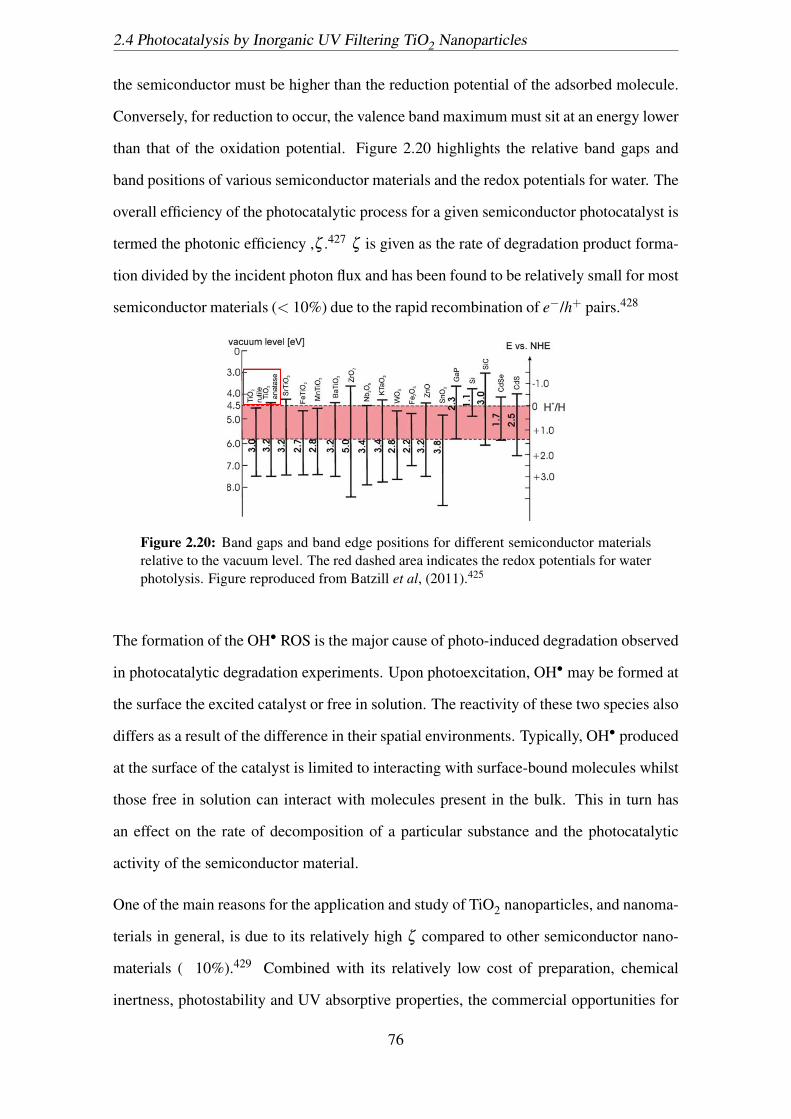
2.4 Photocatalysis by Inorganic UV Filtering TiO2 Nanoparticles
the semiconductor must be higher than the reduction potential of the adsorbed molecule.
Conversely, for reduction to occur, the valence band maximum must sit at an energy lower
than that of the oxidation potential. Figure 2.20 highlights the relative band gaps and
band positions of various semiconductor materials and the redox potentials for water. The
overall efficiency of the photocatalytic process for a given semiconductor photocatalyst is
termed the photonic efficiency ,ζ .427 ζ is given as the rate of degradation product forma-
tion divided by the incident photon flux and has been found to be relatively small for most
semiconductor materials (< 10%) due to the rapid recombination of e−/h+ pairs.428
Figure 2.20: Band gaps and band edge positions for different semiconductor materialsrelative to the vacuum level. The red dashed area indicates the redox potentials for waterphotolysis. Figure reproduced from Batzill et al, (2011).425
The formation of the OH• ROS is the major cause of photo-induced degradation observed
in photocatalytic degradation experiments. Upon photoexcitation, OH• may be formed at
the surface the excited catalyst or free in solution. The reactivity of these two species also
differs as a result of the difference in their spatial environments. Typically, OH• produced
at the surface of the catalyst is limited to interacting with surface-bound molecules whilst
those free in solution can interact with molecules present in the bulk. This in turn has
an effect on the rate of decomposition of a particular substance and the photocatalytic
activity of the semiconductor material.
One of the main reasons for the application and study of TiO2 nanoparticles, and nanoma-
terials in general, is due to its relatively high ζ compared to other semiconductor nano-
materials ( 10%).429 Combined with its relatively low cost of preparation, chemical
inertness, photostability and UV absorptive properties, the commercial opportunities for
76
2.4 Photocatalysis by Inorganic UV Filtering TiO2 Nanoparticles
TiO2 nanomaterials in various applications, such as in sunscreens, is apparent.
2.4.2 Photocatalysis by TiO2 Nanoparticles
TiO2 Surface Adsorption
An important consideration for photocatalysis in TiO2, as well as all other semiconductor
materials, is the surface adsorption of chemical species. TiO2 surfaces are often composed
of defect sites known as oxygen vacancies, which are formed by the transfer of unpaired
electrons in O 2p orbitals to vacant Ti 3d orbitals, accompanied by the removal of an oxy-
gen atom.430, 431 The result of these oxygen vacancies leads to an accumulation of charge
near the surface of the catalyst which is thought to have an impact of the adsorption be-
haviour of molecules. The adsorption of H2O at the surface of TiO2 is of most immediate
relevance owing to its abundance in cellular environments and use in sunscreen products.
Experimental evidence and theoretical calculations have shown that H2O adsorbs through
a dissociate process at oxygen vacancy sites on the surface of TiO2.432–434 In this process,
oxygen vacancy sites are paired with the hydroxyl groups of water molecules and the ex-
cess charge present in Ti 3d orbitals due to these oxygen vacancies is transferred to the π
molecular orbitals of OH.435
Charge Carrier Generation and Recombination in TiO2
Excitation of TiO2 with photons of sufficient energy to generate photoexcited charge carri-
ers is dependent on a few factors, including the crystal phase composition of the material.
The two main phases of TiO2, rutile and anatase, have bulk band gap energies of 3.0
and 3.2 eV, respectively.53, 436 The positioning of these band gap energies at the bound-
ary of UV and visible light radiation also contributes to their use in sunscreen products.
Another factor that may affect this band gap energy is the size of the semiconductor par-
ticle. Modification of a materials dimensions to the nanoscale can induce a phenomenon
known as quantum confinement. As the size of the semiconductor particle is reduced,
spatial confinement of charge carriers (e−/h+) becomes more prominent. As a result, the
energy states comprising the valence and conduction bands become discrete as opposed
77
2.4 Photocatalysis by Inorganic UV Filtering TiO2 Nanoparticles
to the continuous band structure of the corresponding bulk material. This also leads to
an increase in band gap energy with decreasing particle size and is a property that can be
exploited to tailor the band gap properties of various semiconducting materials. However,
variance of the TiO2 band gap, particularly for the anatase crystal phase, has been shown
to be relatively minimal even down particle diameters of 1.5 nm.437 In certain experimen-
tal cases, a reduction in particle size below 100 nm first resulted in a red-shift in band gap
energy before widening again below 29 nm.438 The explanation given for the apparent
red-shift was attributed to bulk defects in the material which allowed delocalization of the
LUMO and creation of shallow trap sites within the band gap whilst the blue-shift that
occurred below a certain threshold particle size was due to shifting of these trap sites to
higher energies (size quantization effect). What can be drawn from literature however
is that the main modification of the TiO2 band gap occurs through modification of the
crystal phase, as mentioned previously, or through the introduction of foreign elements in
a process known as doping (Section 2.5).
Generation of e−/h+ pairs in TiO2 nanoparticles generally occurs near the surface of the
particle, owing to the small penetration depth of the UV radiation needed to excite the
material. This could be a contributing factor in the prominent photocatalytic properties
the material displays. However, recombination of these photoexcited charge carriers is a
limitation that affects not only TiO2 but all photocatalyst semiconductor materials. Pho-
toluminescence and time-resolved absorption spectroscopy methods have been employed
and demonstrated the lifetime of such charge carriers in TiO2, showing longer liftimes
for photoexcited electrons in the anatase crystal phase as compared to the rutile phase.439
Dozzi et al, (2013) showed evidence of the impact of this difference in lifetimes for pho-
toexcited electrons through the enhanced photocatalytic degradation rate of formic acid
by fluorine-doped TiO2 and analysis of the photoluminescent signal generated by trapped
electrons.440 Little difference was observed between lifetimes for photoexcited holes
across the two different crystal phases.
78
2.4 Photocatalysis by Inorganic UV Filtering TiO2 Nanoparticles
ROS Generation by Photoexcited TiO2
Following excitation and the generation of photoexcited charge carriers in TiO2, redox
reactions with surface bound molecules may occur. In the context of an aqueous medium,
the relevant ROS generating reactions that may occur at the surface of a TiO2 particle are
as follows:
TiO2 +hv−→ TiO2(e−CB +h+V B) (2.6)
TiO2(h+V B)+H2O−→ TiO2 +H++OH• (2.7)
TiO2(e−CB)+O2 −→ TiO2 +O2
•− (2.8)
Subsequent dissociation of these free radical species from the surface of the TiO2 particle
gives these species free reign to react with other molecules present within the same chemi-
cal environment as the photocatalyst. Along with direct charge transfer reactions that may
occur with chemically adsorbed molecules, this photocatalytic behaviour of TiO2 and its
ability to mineralize chemical compounds through surface mediated redox reactions, par-
ticularly organic compounds, is the reason behind its application in various photocatalysis
application ranging from H2 production, waste water purification and dye sensitized so-
lar cells. It is also this property, along with the reduction in particle size to below 100
nm, that has raised concerns over its use in sunscreen products and the oxidative dam-
age it may cause to other ingredients in the formulation and to the consumers using such
products.
2.4.3 Consequences of a Photocatalyst in Sunscreen Products
Photostability of sunscreen formulations and active ingredients in such products is of ma-
jor importance in regards to their ability to provide UV protection over the full duration
expected. Many organic UV filters that were once incorporated in sunscreens have since
been removed from commercial use due to photostability issues such as with PABA de-
rived UV filters and those outlined earlier in Sections 2.2.4 and 2.2.5.441, 442 Furthermore,
79

2.4 Photocatalysis by Inorganic UV Filtering TiO2 Nanoparticles
certain organic filters such as octyl methoxycinnamate and octocrylene have also be found
to be responsible for the oxidative damage of other formulation ingredients through the
generation of singlet oxygen (1O2).443Adding to these concerns are the photoreactivty of
both inorganic UV filters, ZnO and the highly photoactive TiO2.
Both inorganic UV filters, as previously discussed, are photocatalytic by nature and can
have a catastrophic impact on the efficacy of sunscreen formulations, particularly if left
uncoated or in formulations lacking additional antioxidant ingredients. This issue is fur-
ther propagated with the use of these compounds as nanoparticles, resulting in increased
surface reactivity and photocatalytic activity. The interaction of organic UV filters with
TiO2 has been extensively studied. A study performed by Ricci et al, (2003) investi-
gated the mineralization behaviour of organic UV filters in the presence of anatase TiO2
nanoparticles (mean size 32 nm) and irradiated with UVA radiation (λ = 366 nm).58 It
was found that direct mineralization of the tested UV filters, which include octocrylene,
oxybenzone, octyl salicilate and E-methoxycinnamic acid, occurred due to the presence of
photoexcited TiO2. In addition, photodegradation experiments in which the TiO2 photo-
catalyst particles were separated from the organic UV filters by micelle encapsulation us-
ing sodium dodecyl sulfate (SDS) yielded enhanced degradation rates compared to those
experiments performed in absence of SDS (Figure 2.21). The reason suggested was due
to the production of ROS species initially by TiO2 and H2O and then the generation of
highly reactive carbon-centred radicals by the subsequent ROS. Following on from this
work, additional investigations on the photodegradation of organic UV filters and other
sunscreen formulation ingredients by TiO2 materials were performed, emphasizing the
potential dangers of reduced sun protection when using TiO2 and TiO2 nanoparticles in
sunscreen formulations.304, 444–446 There was also an increased drive in developing meth-
ods for manipulating the photocatalytic behaviour of TiO2, leading to the development of
the modern sunscreen based TiO2 nanomaterials that are used in formulations today.
80
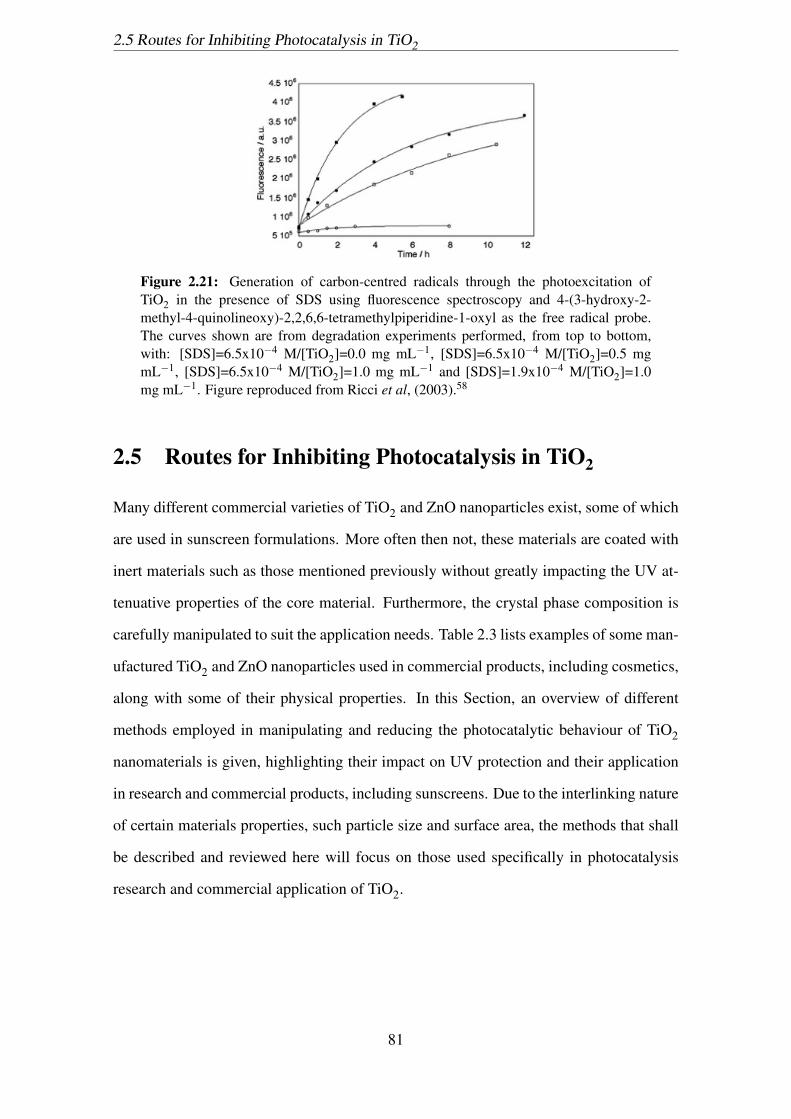
2.5 Routes for Inhibiting Photocatalysis in TiO2
Figure 2.21: Generation of carbon-centred radicals through the photoexcitation ofTiO2 in the presence of SDS using fluorescence spectroscopy and 4-(3-hydroxy-2-methyl-4-quinolineoxy)-2,2,6,6-tetramethylpiperidine-1-oxyl as the free radical probe.The curves shown are from degradation experiments performed, from top to bottom,with: [SDS]=6.5x10⁻⁴ M/[TiO2]=0.0 mg mL−1, [SDS]=6.5x10⁻⁴ M/[TiO2]=0.5 mgmL−1, [SDS]=6.5x10⁻⁴ M/[TiO2]=1.0 mg mL−1 and [SDS]=1.9x10⁻⁴ M/[TiO2]=1.0mg mL−1. Figure reproduced from Ricci et al, (2003).58
2.5 Routes for Inhibiting Photocatalysis in TiO2
Many different commercial varieties of TiO2 and ZnO nanoparticles exist, some of which
are used in sunscreen formulations. More often then not, these materials are coated with
inert materials such as those mentioned previously without greatly impacting the UV at-
tenuative properties of the core material. Furthermore, the crystal phase composition is
carefully manipulated to suit the application needs. Table 2.3 lists examples of some man-
ufactured TiO2 and ZnO nanoparticles used in commercial products, including cosmetics,
along with some of their physical properties. In this Section, an overview of different
methods employed in manipulating and reducing the photocatalytic behaviour of TiO2
nanomaterials is given, highlighting their impact on UV protection and their application
in research and commercial products, including sunscreens. Due to the interlinking nature
of certain materials properties, such particle size and surface area, the methods that shall
be described and reviewed here will focus on those used specifically in photocatalysis
research and commercial application of TiO2.
81
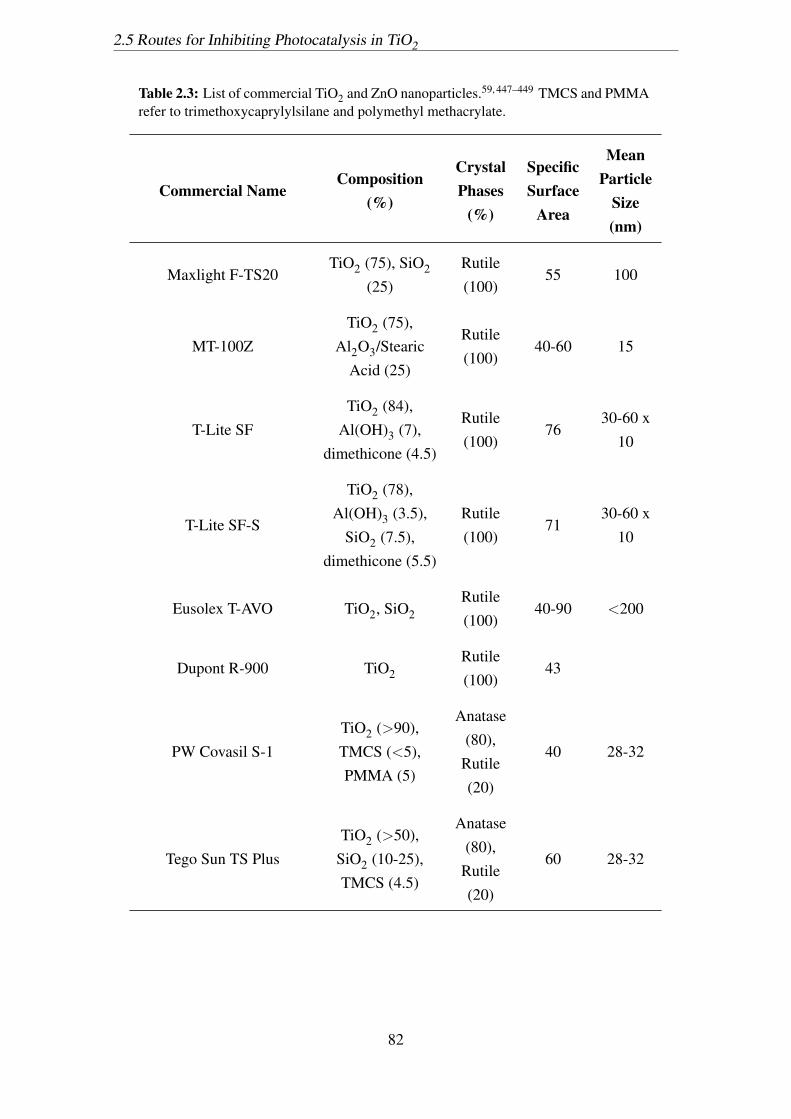
2.5 Routes for Inhibiting Photocatalysis in TiO2
Table 2.3: List of commercial TiO2 and ZnO nanoparticles.59, 447–449 TMCS and PMMArefer to trimethoxycaprylylsilane and polymethyl methacrylate.
Commercial NameComposition
(%)
CrystalPhases
(%)
SpecificSurface
Area
MeanParticle
Size(nm)
Maxlight F-TS20TiO2 (75), SiO2
(25)Rutile(100)
55 100
MT-100ZTiO2 (75),
Al2O3/StearicAcid (25)
Rutile(100)
40-60 15
T-Lite SFTiO2 (84),
Al(OH)3 (7),dimethicone (4.5)
Rutile(100)
7630-60 x
10
T-Lite SF-S
TiO2 (78),Al(OH)3 (3.5),
SiO2 (7.5),dimethicone (5.5)
Rutile(100)
7130-60 x
10
Eusolex T-AVO TiO2, SiO2Rutile(100)
40-90 <200
Dupont R-900 TiO2Rutile(100)
43
PW Covasil S-1TiO2 (>90),TMCS (<5),PMMA (5)
Anatase(80),
Rutile(20)
40 28-32
Tego Sun TS PlusTiO2 (>50),
SiO2 (10-25),TMCS (4.5)
Anatase(80),
Rutile(20)
60 28-32
82

2.5 Routes for Inhibiting Photocatalysis in TiO2
Aeroxide P25 TiO2 (100)
Anatase(80),
Rutile(20)
53 25
Millenium PC 500 TiO2 (100)Anatase
(100)287 5-10
Millenium PC 50 TiO2 (100)Anatase
(100)45
Kerr-McGee TiO2 (100)Anatase
(100)90 20
Hombikat UV 100 TiO2 (100)Anatase
(100)5
Tranox A-K-1 TiO2Anatase
(100)90 20
Zinc Oxide NEUTRAL ZnO (≥ 95) 30-70 41
Tego Sun Z500 ZnO (>99.5) 10-60
NANOX 200 ZnO (99) 17 <200
Z COTE MAX
ZnO, dimethoxy-diphenylsilane,
triethoxy-caprylysilane
Wurtzite 12-24
Zinc Oxide NDMZnO (>90),dimethicone
(<10)10-70 <50
Z-Ald ZnO (100) Wurtzite 12 42-79
2.5.1 Crystal Phase Composition
The identify of the crystal phase of TiO2 and its composition can have an impact on its
photocatalytic properties. It is often suggested that the anatase crystal phase predom-
inantly leads to greater photocatalytic activity, particularly towards the degradation of
83
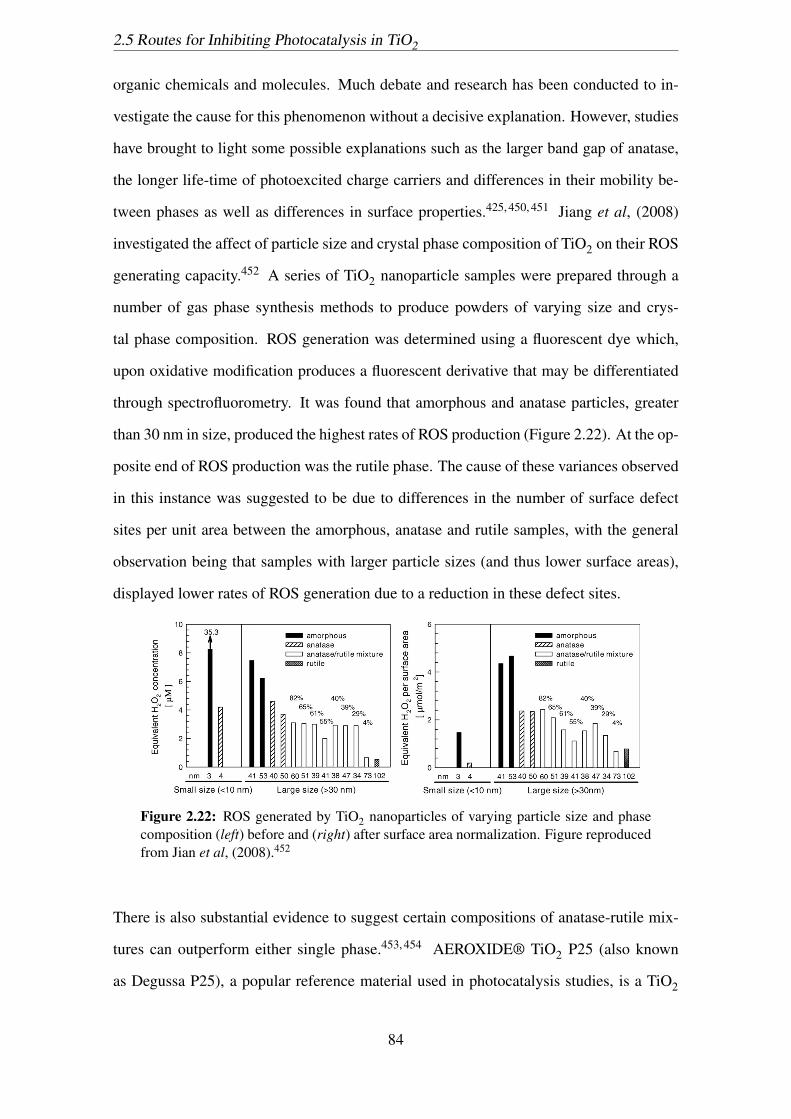
2.5 Routes for Inhibiting Photocatalysis in TiO2
organic chemicals and molecules. Much debate and research has been conducted to in-
vestigate the cause for this phenomenon without a decisive explanation. However, studies
have brought to light some possible explanations such as the larger band gap of anatase,
the longer life-time of photoexcited charge carriers and differences in their mobility be-
tween phases as well as differences in surface properties.425, 450, 451 Jiang et al, (2008)
investigated the affect of particle size and crystal phase composition of TiO2 on their ROS
generating capacity.452 A series of TiO2 nanoparticle samples were prepared through a
number of gas phase synthesis methods to produce powders of varying size and crys-
tal phase composition. ROS generation was determined using a fluorescent dye which,
upon oxidative modification produces a fluorescent derivative that may be differentiated
through spectrofluorometry. It was found that amorphous and anatase particles, greater
than 30 nm in size, produced the highest rates of ROS production (Figure 2.22). At the op-
posite end of ROS production was the rutile phase. The cause of these variances observed
in this instance was suggested to be due to differences in the number of surface defect
sites per unit area between the amorphous, anatase and rutile samples, with the general
observation being that samples with larger particle sizes (and thus lower surface areas),
displayed lower rates of ROS generation due to a reduction in these defect sites.
Figure 2.22: ROS generated by TiO2 nanoparticles of varying particle size and phasecomposition (left) before and (right) after surface area normalization. Figure reproducedfrom Jian et al, (2008).452
There is also substantial evidence to suggest certain compositions of anatase-rutile mix-
tures can outperform either single phase.453, 454 AEROXIDE® TiO2 P25 (also known
as Degussa P25), a popular reference material used in photocatalysis studies, is a TiO2
84

2.5 Routes for Inhibiting Photocatalysis in TiO2
nanopowder consisting of an anatase-rutile ratio of 4:1. This same ratio of anatase-rutile
has also been found in certain sunscreen products containing TiO2 which were shown to
cause accelerated damage to the surface coatings of UV-resistant fluoropolymer-coated
steel panels used in outdoor roofing applications.53 A long-term study investigating the
weathering affects of various commercial sunscreen formulations was performed on these
coated steel panels by exposing the panels to outdoor conditions over a period of 6 or 12
weeks. It was found that a decrease in gloss, corresponding to a degradation in the surface
coating, occurred for formulations containing TiO2. Separation of these particles from
the formulation and analysis using x-ray diffraction revealed a crystal phase composition
similar to that of P25, the commercial photocatalyst mentioned previously. Subsequent
electron paramagnetic resonance (EPR) spectroscopy was performed and revealed that a
similar ROS generation rate for commercially used TiO2 particles existed compared to
that of P25. Such findings have eventuated in modification of the materials properties cri-
teria in regards to the photocatalytic activity of inorganic UV filters by governing cosmetic
and health regulating institutions, such as the SCCS (Section 2.2.4).
Figure 2.23: Bar graph representation of EPR spectrum intensities highlighting the gen-eration of the DMPO-spin adduct (spin trap for the OH• radical). Samples F and G referto inorganic TiO2 UV filters found in commercial sunscreens where F is purely rutilewhilst G is an anatase/rutile mixture. Figure reproduced from Barker et al, (2008).53
2.5.2 Surface Passivation by Inert Coating
Surface passivation and manipulation of the surface chemistry of TiO2 nanoparticles is an
important step in developing photoinactive nanoparticles that can be considered ’safe’ for
use in commercial products. In regards to sunscreen based TiO2, approved coating mate-
rials and compositions must be applied that demonstrate an ability to reduce the photocat-
85

2.5 Routes for Inhibiting Photocatalysis in TiO2
alytic activity of the core material without compromising the effectiveness of the product
or impart further toxicological effects. Although the use of specifically listed coating ma-
terials is recommended for use when developing commercial TiO2 based materials, the
SCCS’s stance on new and alternative coatings is as follows:
”Other cosmetic ingredients applied as stable coatings on TiO2 nanomaterials can also
be used, provided they can be demonstrated to the SCCS to be safe and the coatings do
not affect the particle properties”.455
The Australian TGA has a similar stance on coating materials, declaring that active ingre-
dients for sunscreen products with new coating variants require adequate safety data and
characterisation to assess suitability for use in sunscreen products.
Mentioned in an earlier section (Section 2.2.4), the types of coating materials applied
include organic coatings based on alkoxytitanates, polysiloxanes, silanes and inorganic
coatings based upon alumina, silica or zirconia (Table 2.3). Specialized coating materials
using various polymers have also been investigated with the aim of minimising or remov-
ing the propensity of TiO2 to generate ROS and prevent their interaction with other for-
mulation ingredients. Often, coatings are also applied for reducing particle agglomeration
and thus improving suspension stability and the shelf-life of commercial emulsions.
The photocatalytic activity of dimethicone and silica coated variants of TiO2 towards iso-
propanol oxidation was investigated by Mitchnick et al, (1999).456 It was found that the
highest oxidation rate, and thus highest photocatalytic activity, was achieved for uncoated
TiO2, whilst the dimethicone and silica coated TiO2 showed reductions in oxidation rates
of 45% and 57%, respectively. However, investigations by Rampaul et al, (2007) found
that dimethicone coated TiO2 rapidly degraded methylene blue dye under UVA illumina-
tion at a similar rate to that of the known photocatalyst Degussa P25 and induced cell death
in human skin cells.457 A possible reason for the difference in photocatalytic performance
here as compared to Mitchnick, (1999) could be due to the crystal phase composition of
the TiO2used, with Rampaul, (2007) using TiO2 with 80-90% anatase phase whilst the
crystal phase composition in the Mitchnick study is not mentioned. Regardless, the re-
86
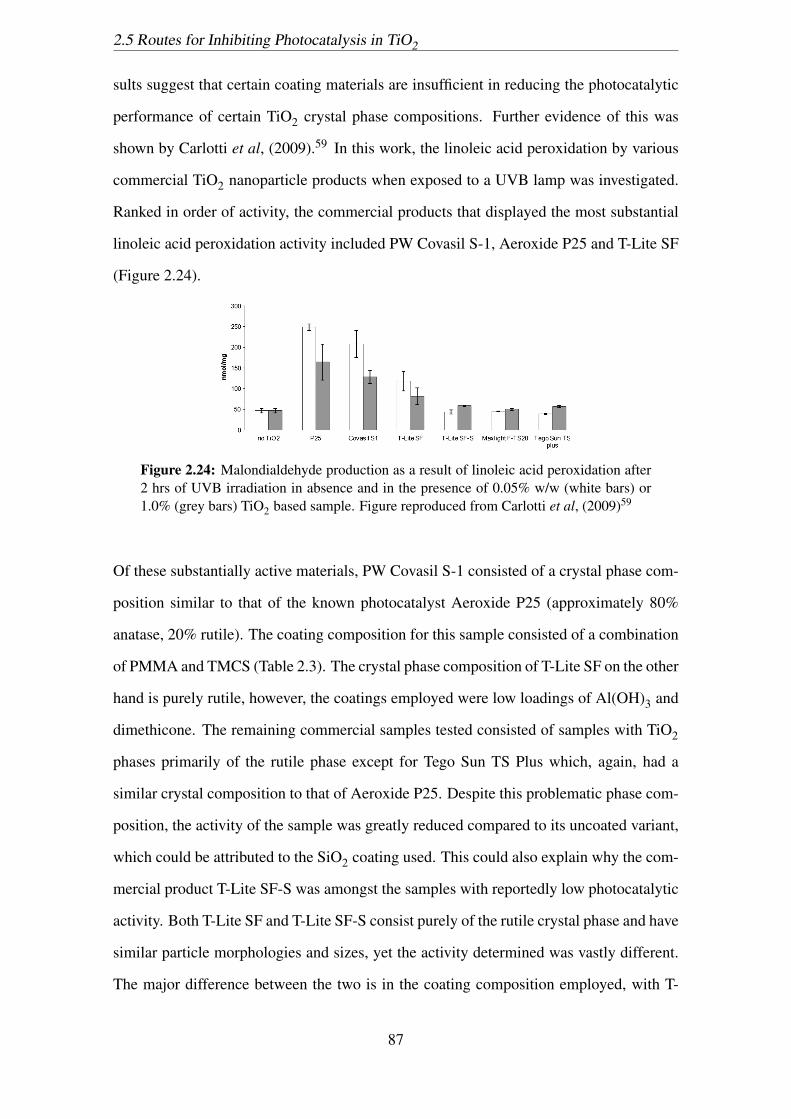
2.5 Routes for Inhibiting Photocatalysis in TiO2
sults suggest that certain coating materials are insufficient in reducing the photocatalytic
performance of certain TiO2 crystal phase compositions. Further evidence of this was
shown by Carlotti et al, (2009).59 In this work, the linoleic acid peroxidation by various
commercial TiO2 nanoparticle products when exposed to a UVB lamp was investigated.
Ranked in order of activity, the commercial products that displayed the most substantial
linoleic acid peroxidation activity included PW Covasil S-1, Aeroxide P25 and T-Lite SF
(Figure 2.24).
Figure 2.24: Malondialdehyde production as a result of linoleic acid peroxidation after2 hrs of UVB irradiation in absence and in the presence of 0.05% w/w (white bars) or1.0% (grey bars) TiO2 based sample. Figure reproduced from Carlotti et al, (2009)59
Of these substantially active materials, PW Covasil S-1 consisted of a crystal phase com-
position similar to that of the known photocatalyst Aeroxide P25 (approximately 80%
anatase, 20% rutile). The coating composition for this sample consisted of a combination
of PMMA and TMCS (Table 2.3). The crystal phase composition of T-Lite SF on the other
hand is purely rutile, however, the coatings employed were low loadings of Al(OH)3 and
dimethicone. The remaining commercial samples tested consisted of samples with TiO2
phases primarily of the rutile phase except for Tego Sun TS Plus which, again, had a
similar crystal composition to that of Aeroxide P25. Despite this problematic phase com-
position, the activity of the sample was greatly reduced compared to its uncoated variant,
which could be attributed to the SiO2 coating used. This could also explain why the com-
mercial product T-Lite SF-S was amongst the samples with reportedly low photocatalytic
activity. Both T-Lite SF and T-Lite SF-S consist purely of the rutile crystal phase and have
similar particle morphologies and sizes, yet the activity determined was vastly different.
The major difference between the two is in the coating composition employed, with T-
87
2.5 Routes for Inhibiting Photocatalysis in TiO2
Lite SF-S containing an additional coating component of SiO2 as compared to the T-Lite
SF coating composition of Al(OH)3 and dimethicone. It is therefore evident that both
the type of coating and the crystal phase composition work hand in hand in reducing the
photocatalytic activity of the core material and need to be carefully considered depending
on the application in which they are employed.
For sunscreen based products, ideally the coating material employed should display in-
hibitory effects for all photocatalytically active TiO2, regardless of the crystal phase, yet it
has been shown that this is not the case. It is also important that the UV filtering capabili-
ties of the core TiO2 are not impacted or diminished and in fact are, ideally, improved. A
more specialized coating material that has been investigated but not yet commercialized
is lignin. Lignin is a biopolymer naturally produced in plants and as a by-product in the
production of paper. Studies have also suggested lignin can act as a free radical scavenger,
making it an ideal ingredient for cosmetic formulations and other topical products such as
sunscreens.458, 459 Investigations of lignin/TiO2 based nanocomposites have yielded ma-
terials displaying substantially reduced photocatalytic activity, towards both anatase and
rutile crystal phases, whilst also serving to maintain and improve the UV attenuative prop-
erties of the core material.460, 461 Direct grafting of antioxidant compounds to the surface
of TiO2 nanoparticles have also been investigated as a means of inhibiting free-radical
production through novel methodologies.462, 463 Yet the use of organic based antioxidants
presents in itself compatibility issues with other formulation ingredients in a similar man-
ner to those for organic UV filters outlined in Section 2.2.5. Although manufacturers of
cosmetic and therapeutic UV filters prepare these materials to address issues surrounding
the use of nanoparticulate TiO2, certain drawbacks have been highlighted with the current
coating materials used, as outlined above.
2.5.3 Elemental Doping
Doping of TiO2 has been extensively investigated, primarily with the view of improving
the visible light responsiveness of the material and the aim of driving future application
into solar cells and visible light driven catalysis. Few research works specifically study
88
2.5 Routes for Inhibiting Photocatalysis in TiO2
the effect of doping into TiO2 with the purpose of minimizing photocatalytic activity and
fewer still report such findings. Implantation of metal or non-metal ions into interstitial
sites or as substitutional dopants into the TiO2 crystal lattice has been shown to modify
the electronic properties of the core material.464–467 These modifications can have rami-
fications on the photocatalytic and light absorptive properties of TiO2 and can influence
particle growth, crystal phase expression and crystallinity.468–470
Various metal dopants have been investigated for improving the photocatalytic activity
of TiO2 nanoparticles including transition metals such as cobalt (Co2+), barium (Ba2+),
nickel (Ni2+), copper (Cu2+), zinc (Zn2+) and iron (Fe3+) as well as various rare-earth
metals such as lanthanum (La3+), cerium (Ce4+), samarium (Sm3+), europium (Eu3+)
and ytterbium (Yb2+).471–481 Such dopants have been shown to improve the photocat-
alytic activity of TiO2 whilst under visible light illumination by shifting the absorption
characteristics of the material to the lower energy visible light region. The cause for this
shift in the absorption band of metal doped TiO2 has been ascribed to be due to a shrink-
ing of the band gap as a result of the introduction of mid-band gap impurity states that
can act as trap sites for photoexcited species. This trapping behaviour in turn can reduce
recombination rates of e−/h+ pairs and improve the photocatalysis efficiency. Yan et al,
(2012) found that doping TiO2 with cerium (Ce4+) at a Ce:Ti ratio of 0.33% resulted in
an improvement in visible light catalysis and red-shift in absorption properties.480 The
reason suggested for these results was attributed to the presence of additional electronic
states just above the valence band of TiO2, which aided in capturing photoexcited h+ and
decreasing recombination. It’s important to note however that the affect on photocatalytic
activity is also dependent on the dopant loading concentration and the synthesis method
employed, which can affect the type of doping that occurs. Although some reports have
shown Fe3+ can improve the photocatalytic activity of TiO2, others have shown that ex-
cessive doping can impact the particle growth, specific surface area and, subsequently,
the photoactivity.482 Li et al, (2008) also contributed to the idea of needing to optimize
the dopant concentration for improving photocatalytic performance with their work on
Fe-doped TiO2 prepared through a hydrothermal method.483 They suggested that, al-
89

2.5 Routes for Inhibiting Photocatalysis in TiO2
though doping led to a narrowing of the band gap, even with increasing dopant load, the
same increase in photocatalytic performance wasn’t achieved due to the location of the
Fe3+ dopant deeper within the bulk of the TiO2 particles as opposed to the surface. What
this means is that, although trapping of photoexcited charge carriers could occur at these
sites, migration to the surface could not be achieved efficiently, thus could not contribute
effectively to the photocatalysis.
One particularly interesting transition metal dopant for TiO2 in sunscreen products is
manganese. Wakefield et al, (2004) synthesized 1% w/w Mn-doped TiO2 through a sol-
gel method and found that the doped materials displayed enhanced UVA protection and
provided broad UV protection relative to undoped TiO2.484 Additionally, the free radical
generation rate of the doped material was found to be reduced, in turn, leading to a re-
duction in photocatalytic activity. The reason for this decrease was suggested to be due to
a form of free radical scavenging effect instilled by the presence of surface Mn3+/Mn4+
species. The significance of this finding ultimately culminated in the commercialization
of this doped material under the trade name OptisolT M. Non-sunscreen specific cosmetic
products and sunscreens in the EU may be found containing this UV filter.
Figure 2.25: (left) Absorption spectra for commercial TiO2 products and Mn-dopedTiO2 (OptisolT M) suspended water/ethanol. (right) Free radical generation rates for Mn-doped, undoped and commercial TiO2 using DMPO as the spin trap. Figures reproducedfrom Wakefield et al, (2004).484
Non-metal doping of TiO2 nanoparticles has also been extensively studied particularly
with nitrogen, sulfur, phosphorus and carbon.485–488 In all cases however, the primary
purpose of the non-metal doping process is for improvement in photocatalysis, particu-
90
2.6 Emerging Nanomaterials as Possible UV Filters
larly driven by visible light excitation. N doping into TiO2 was one of the first non-metal
dopants employed for increasing the TiO2 photocatalysis under visible light illumina-
tion.489 It is also regarded as one of the most efficient dopants however the exact mech-
anism for the improvements in photocatalytic performance is uncertain.467, 489, 490 It has
been suggested that N doping can shrink the band gap of TiO2 due to hybridisation of
lower energy N 2p states and higher energy O 2p states, thus allowing visible light ab-
sorption.489 Another approach is that N doping introduces an impurity energy level just
above the valence bond from which electrons may be excited from to the conduction band
by visible light illumination. Zhao et al (2007) also made the suggestion that the dopant
position influences the modification mechanism, as with metal dopants previously dis-
cussed.491 It was suggested that substitutionally doped N introduced shallow acceptor
states above the valence band whilst interstitially doped N created isolated impurity states
from which electrons could be excited from.
Again, as with metal doping, a saturation point is reached with non-metal doping whereby
the introduction of additional dopants leads to a gradual decrease in photocatalytic per-
formance. Unfortunately, this also tends to coincide with a decrease in the absorptive
performance of the core TiO2 thus is not a particularly viable approach in mitigating the
photocatalytic potential of sunscreen based TiO2, without some compromise.
2.6 Emerging Nanomaterials as Possible UV Filters
Maybe in part due to the limited number of different inorganic UV filters currently ap-
proved by global regulatory bodies or due to the shortcomings of either ZnO or TiO2, sig-
nificant effort has gone into investigating and developing alternative inorganic based UV
filtering nanomaterials. The key characteristics needed to be displayed by any potential
UV filtering ingredient include high UV attenuation (UVA, UVB or both), photostability,
low photocatalytic activity, low persistence in skin and low toxicity, although adherence
to commercial requirements must also be considered such as the ease of synthesis scala-
bility.
91
2.6 Emerging Nanomaterials as Possible UV Filters
Cerium Oxides
A promising metal oxide material that has garnered significant attention is cerium oxide
(CeO2), most notably in the form of nanoparticles. As with TiO2 and ZnO, CeO2 is a
semiconductor material with a relatively wide band gap (3.19 eV for bulk crystals) and
has been shown to display UV absorptive properties.492 In addition, manipulation of the
size of CeO2 has been shown to enable tailoring of these optical properties, with decreas-
ing particle size leading to an increase in transparency across visible light wavelengths
and a widening of the band gap.493, 494 Doping has also proven to be an effective means
of modifying the UV absorptive properties of CeO2, enabling a shift in the absorbance
band to more biologically relevant wavelengths in the UVB and UVA wavelength re-
gions. Yabe et al, (2001) investigated the UV-shielding properties of CeO2 nanoparticles
doped with various metal ions including Mg2+, Ca2+, Sr2+, Ba2+ and Zn2+.495 It was
found that doping with 20 mol% of either Ca2+ or Zn2+ resulted in a reduction in photo-
catalytic activity and increase in visible light transparency. A further study by Truffault et
al, (2010) on co-precipitated Ca-doped CeO2 nanoparticles also demonstrated modifica-
tion of the optical properties of CeO2 with a blue-shift and increase in UVB absorbance
being absorbed for 10 mol% Ca-doped CeO2, as compared to pure CeO2.61 Incorporation
of these 10 mol% Ca-doped CeO2 nanoparticles into sunscreen emulsion was also per-
formed by this same group and a comparative study to TiO2/ZnO nanoparticle emulsions
on the SPF and UVAPF was conducted.496 Mixed formulations consisting of the doped
CeO2 and TiO2 were prepared and compared to an emulsion consisting of TiO2 and ZnO.
Although no significant difference in UVAPF was determined, it was found that the Ca-
doped CeO2/TiO2 emulsion displayed a higher SPF rating as compared to the TiO2/ZnO
emulsion. In addition, the critical wavelength of the emulsion containing Ca-doped CeO2
was determined to be 373 nm, implying broad spectrum protection.
92
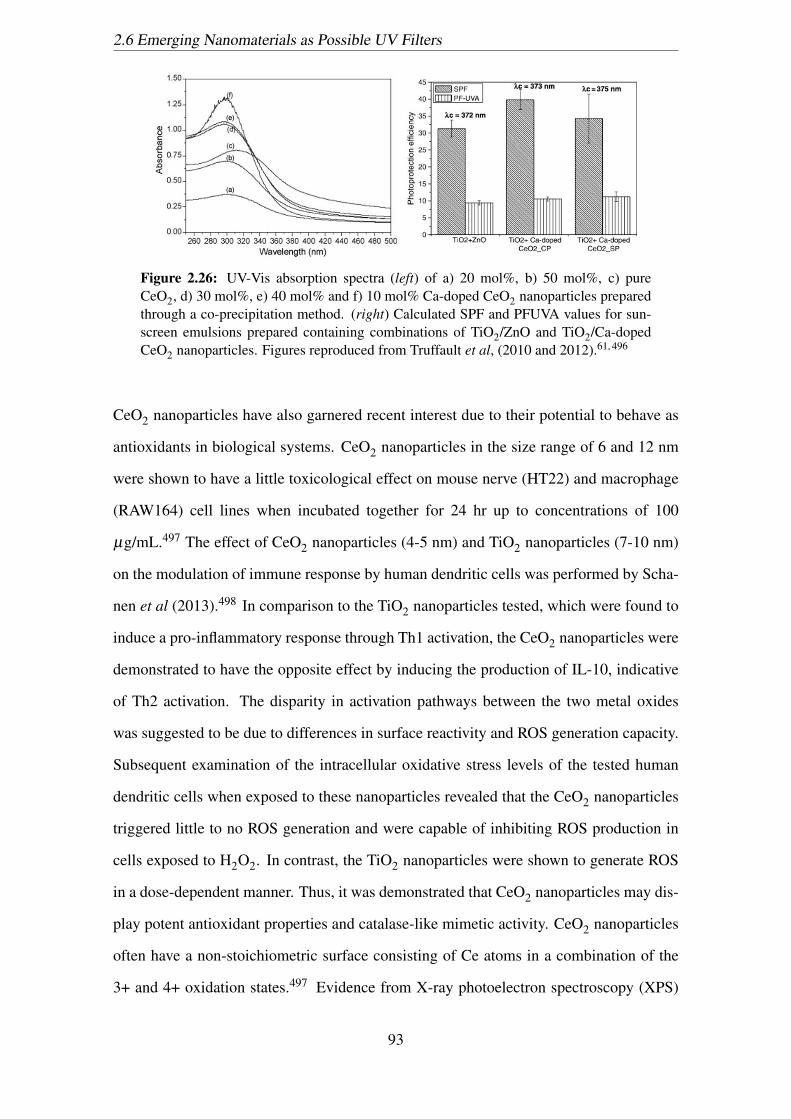
2.6 Emerging Nanomaterials as Possible UV Filters
Figure 2.26: UV-Vis absorption spectra (left) of a) 20 mol%, b) 50 mol%, c) pureCeO2, d) 30 mol%, e) 40 mol% and f) 10 mol% Ca-doped CeO2 nanoparticles preparedthrough a co-precipitation method. (right) Calculated SPF and PFUVA values for sun-screen emulsions prepared containing combinations of TiO2/ZnO and TiO2/Ca-dopedCeO2 nanoparticles. Figures reproduced from Truffault et al, (2010 and 2012).61, 496
CeO2 nanoparticles have also garnered recent interest due to their potential to behave as
antioxidants in biological systems. CeO2 nanoparticles in the size range of 6 and 12 nm
were shown to have a little toxicological effect on mouse nerve (HT22) and macrophage
(RAW164) cell lines when incubated together for 24 hr up to concentrations of 100
µg/mL.497 The effect of CeO2 nanoparticles (4-5 nm) and TiO2 nanoparticles (7-10 nm)
on the modulation of immune response by human dendritic cells was performed by Scha-
nen et al (2013).498 In comparison to the TiO2 nanoparticles tested, which were found to
induce a pro-inflammatory response through Th1 activation, the CeO2 nanoparticles were
demonstrated to have the opposite effect by inducing the production of IL-10, indicative
of Th2 activation. The disparity in activation pathways between the two metal oxides
was suggested to be due to differences in surface reactivity and ROS generation capacity.
Subsequent examination of the intracellular oxidative stress levels of the tested human
dendritic cells when exposed to these nanoparticles revealed that the CeO2 nanoparticles
triggered little to no ROS generation and were capable of inhibiting ROS production in
cells exposed to H2O2. In contrast, the TiO2 nanoparticles were shown to generate ROS
in a dose-dependent manner. Thus, it was demonstrated that CeO2 nanoparticles may dis-
play potent antioxidant properties and catalase-like mimetic activity. CeO2 nanoparticles
often have a non-stoichiometric surface consisting of Ce atoms in a combination of the
3+ and 4+ oxidation states.497 Evidence from X-ray photoelectron spectroscopy (XPS)
93
2.6 Emerging Nanomaterials as Possible UV Filters
studies have shown that the ratio of these two oxidation states can be tuned with particle
size, whereby, decreasing particle size leads to an increase in Ce3+ relative to Ce4+.499
The mixed valent state of this compound leads to the presence of oxygen vacancies, so
as to maintain charge neutrality, and has been suggested to be responsible for the unique
redox properties displayed by the compound.500 The combination of both these antiox-
idant and UV absorptive properties highlight the potential of CeO2 nanoparticles as an
inorganic UV filter in sunscreen products, however, further toxicological characterisation
of these metal oxide nanoparticles is needed. In particular, evaluation of the dermal per-
meation of these particles is essential and currently lacking. An in vitro Franz-diffusion
cell study using damaged and intact human skin exposed to CeO2 nanoparticles (17±5
nm) has shown that little dermal penetration occurs, with the little amount of Ce detected
through energy dispersive spectroscopy more likely due to ionized CeO2 and not CeO2
nanoparticles.501
Iron Oxides
The use of natural minerals containing iron oxides as a skin protecting agents is no novel
idea (Section 2.2.1). However, the application of iron oxide nanoparticles, in particu-
lar those with the hematite (α-Fe2O3) crystal phase, in cosmetic products is a modern
development. Specific application of α-Fe2O3 in sunscreen products is limited due to
the intense colouring of formulation containing these pigments (band gap values around
2.2 eV), however, this has not dampened efforts into investigating and characterising α-
Fe2O3 and modified α-Fe2O3 nanoparticles as a potential inorganic UV filter.502 Truf-
fault et al, (2011) prepared chemically precipitated α-Fe2O3 nanoparticles through post-
synthesis calcination.503 Measurement of the in vitro UVAPF for emulsions containing
these nanoparticles yielded higher UVA protection as compared to emulsions contain-
ing either TiO2 or ZnO at the same mass loadings. Modification of α-Fe2O3 through
doping with Ce3+ has also been shown to aid in improving UVA and UVB attenuation
and shrinking the optical band gap.502 Nanocomposite materials consisting of varying
loadings of CeO2 with α-Fe2O3 can also modify the absorption profile of the core iron
oxide material, leading to an increase in UV attenuation.62 Simultaneously, a reduction in
94
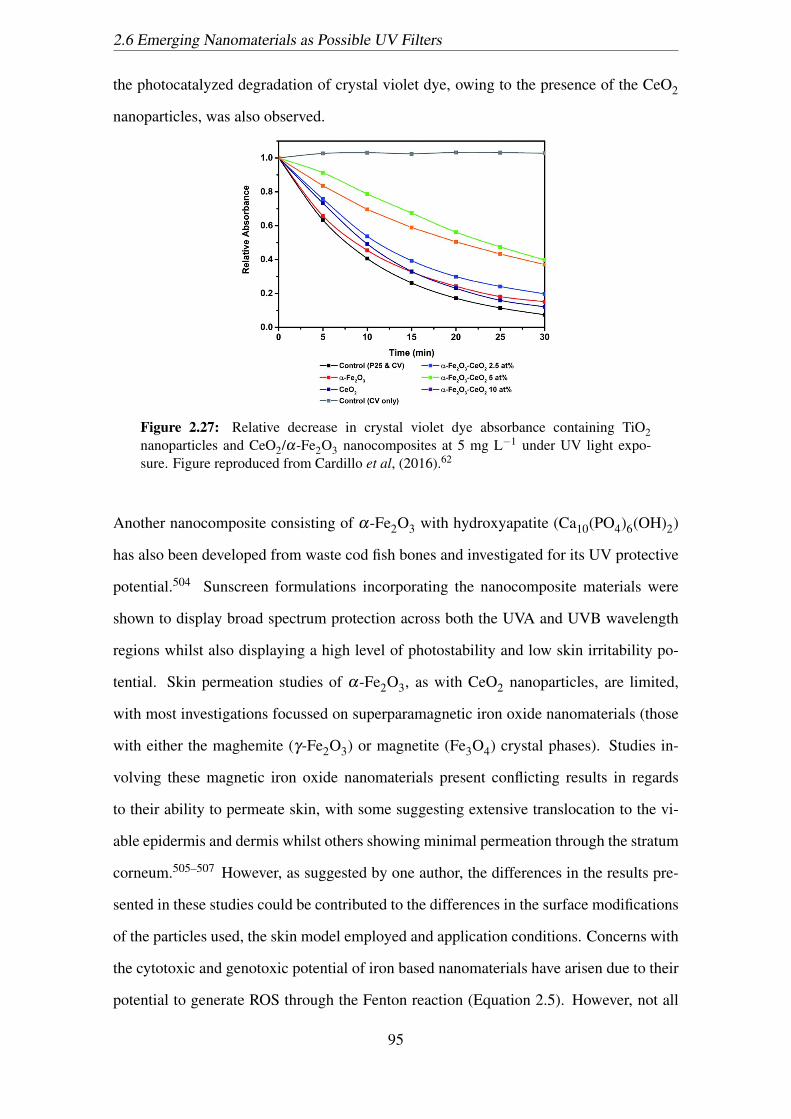
2.6 Emerging Nanomaterials as Possible UV Filters
the photocatalyzed degradation of crystal violet dye, owing to the presence of the CeO2
nanoparticles, was also observed.
Figure 2.27: Relative decrease in crystal violet dye absorbance containing TiO2nanoparticles and CeO2/α-Fe2O3 nanocomposites at 5 mg L−1 under UV light expo-sure. Figure reproduced from Cardillo et al, (2016).62
Another nanocomposite consisting of α-Fe2O3 with hydroxyapatite (Ca10(PO4)6(OH)2)
has also been developed from waste cod fish bones and investigated for its UV protective
potential.504 Sunscreen formulations incorporating the nanocomposite materials were
shown to display broad spectrum protection across both the UVA and UVB wavelength
regions whilst also displaying a high level of photostability and low skin irritability po-
tential. Skin permeation studies of α-Fe2O3, as with CeO2 nanoparticles, are limited,
with most investigations focussed on superparamagnetic iron oxide nanomaterials (those
with either the maghemite (γ-Fe2O3) or magnetite (Fe3O4) crystal phases). Studies in-
volving these magnetic iron oxide nanomaterials present conflicting results in regards
to their ability to permeate skin, with some suggesting extensive translocation to the vi-
able epidermis and dermis whilst others showing minimal permeation through the stratum
corneum.505–507 However, as suggested by one author, the differences in the results pre-
sented in these studies could be contributed to the differences in the surface modifications
of the particles used, the skin model employed and application conditions. Concerns with
the cytotoxic and genotoxic potential of iron based nanomaterials have arisen due to their
potential to generate ROS through the Fenton reaction (Equation 2.5). However, not all
95
2.6 Emerging Nanomaterials as Possible UV Filters
iron-based materials are toxic or generate ROS as it has been shown that these proper-
ties are strongly dependent on the coordination of surface bound iron ions which can
be manipulated through the synthesis method employed to produce the material.508–510
In vitro investigations into the cytotoxicity of iron oxides also yield a range of results.
In one study, α-Fe2O3 nanoparticles were shown to have size-dependent and synthesis-
dependent cytotoxic and ROS-generative activity towards cultured epithelial canine kid-
ney cells (MDCK).511 It was suggested in this work that localized defect states (termed
T-defects), introduced by specific synthesis conditions and particle size parameters, im-
part certain free-radical scavenging properties similar to that of CeO2, thus resulting in
improved biocompatibility towards MDCK cells. Another work by Freyria et al, (2012)
also investigated structural defects in hematite particles, ranging from nanometric (90 nm)
to micrometric (2 µm), and any potential correlation in toxicity towards murine alveolar
macrophages (MH-S) and human lung epithelial cells (A549). Minimal change in surface
defect states corresponding to the presence of surface bound Fe2+ between the particle
samples tested also correlated with minimal changes in cytotoxic and genotoxic potential,
as measured through in vitro LDH release and Comet assays, and overall low toxicity.
However, it was stipulated that further decreases in particle size may lead to an increase
in surface Fe2+ defect states, which may promote ROS generation through the Fention
reaction (Equation 2.5), thus resulting in greater toxicity through oxidative cellular dam-
age.
Other Potential Organic/Inorganic and Hybrid UV Filters
Tin oxide (SnO2) nanoparticles have also been demonstrated to display optical properties
suitable for UV filtering. With a wide band gap of 3.60 eV for bulk SnO2, nanoparticulate
SnO2 has great transparency in the visible light range and generally appears white or pale
yellow in powder form, thus appeasing cosmetic aesthetic requirements similar to that of
TiO2 and ZnO. Doping of SnO2 with Ti4+ has also been shown to manipulate the band
gap properties of the material, with increasing Ti content resulting in further widening of
the SnO2 band gap.512 Although the photocatalytic degradation of methylene blue dye
of the doped material was observed to increase under UV irradiation, the photocatalytic
96
2.6 Emerging Nanomaterials as Possible UV Filters
activity on the whole for both doped and undoped SnO2 was significantly less than that
of commercial ZnO and TiO2 nanoparticles.
To address consumer concerns over the skin penetration of sunscreen active ingredients,
methods for encapsulating UV filters have been developed. Deng et al, (2015) developed
so-called ’bioadhesive’ polylactic acid (PLA) nanoparticles able to encapsulate the or-
ganic UV filter, Padimate O.64 They demonstrated that these PLA nanoparticles remained
adhered to the outer layers of the stratum corneum and prevented epidermal or follic-
ular penetration of the encapsulated organic UV filter. Furthermore, the UV protective
properties of the PLA-encapsulated Padimate O were shown to provide greater protection
against double-stranded DNA breaks in vivo on murine models as compared to a commer-
cial sunscreen formulation. Hybrid organic/inorganic UV filter materials have also been
investigated for encapsulation of UV filter ingredients, such as with the encapsulation
of octyl salicylate by an organic/inorganic polysilisesquioxane/silica shell.65 Although
leaching and photodegradation of the organic UV filter was prevented such complexities
in the synthesis method would like hamper any commercial viability.
97

Chapter 3
Experimental Methods
3.1 Synthesis of Nanomaterials
3.1.1 Synthesis of Spray-Dried Chitosan and Chitosan/TiO2 Nanocom-posite Particles
For the preparation of the chitosan and chitosan/TiO2 nanocomposite materials, desired
quantities of chitosan powder (from Shrimp shells, ≥75% deacetylated, Sigma Aldrich)
and commercial photocatalyst TiO2 powder (P25, Degussa Evonik) were weighed and
transferred to a beaker containing a solution of 3% v/v aqueous acetic acid (CH3COOH,
Sigma Aldrich) in deionized (DI) water such that the theoretical weight ratios of chitosan
to TiO2 were 2:1, 1:1 and 1:0 (in the case of the purely chitosan sample). The solution
was left to stir overnight so as to ensure homogeneity before being spray-dried. As seen
in Figure 3.1, the suspension is fed through a 0.7 mm spray drying nozzle with the aid of
a peristaltic pump at a flow rate of 100 mL hr−1. The nozzle is connected to an air pump
system that atomizes the solution, whilst a hot air stream (inlet temperature of 120oC
and outlet temperature of 40oC) is applied in co-current flow, leading to the drying of the
polymer nanocomposite droplets, and subsequently to solid particle formation. The resul-
tant chitosan and chitosan/TiO2 nanocomposite particles were cross-linked via a vapour
phase process using a heated vacuum desiccator system (JP Selecta S.A.) set at 25oC and
in the presence of glutaraldehyde (OHC(CH2)3CHO, 50% in H2O, Sigma Aldrich) for 48
hr.
98

3.1 Synthesis of Nanomaterials
Figure 3.1: Schematic representation of the spray drying process used to produce thechitosan and chitosan/TiO2 nanocomposite particles.
Table 3.1: Sample details and coding used for the samples prepared and described inSections 3.1.1 and Chapter 4.
Sample Details Sample Code
Chitosan CHI
50 wt% chitosan, 50 wt% TiO2 1:1 CHI/TiO2
67 wt% chitosan, 33 wt% TiO2 2:1 CHI/TIO2
3.1.2 Synthesis of CeO2 Decorated Commercial TiO2 Nanoparticles
The synthesis of the CeO2 decorated TiO2 nanoparticles follows a similar process previ-
ously outlined by Cardillo et al.62 In summation, a suspension of the core TiO2 nanopar-
ticles (0.5 g of P25) was prepared in 50 mL of DI water. Relative amounts of cerium (III)
nitrate hexahydrate (Ce(NO3)3 ·6H2O, 99%, Sigma Aldrich) were added so as to yield
relative ratios of the number of Ce atoms to the number of Ti atoms (atomic concentra-
tion; at%) of 2.5, 5 and 10 at%. The suspension was heated to 60oC before 1 mL of
concentrated ammonium hydroxide (NH4OH, 28 - 30% NH3 basis, Sigma Aldrich) was
99
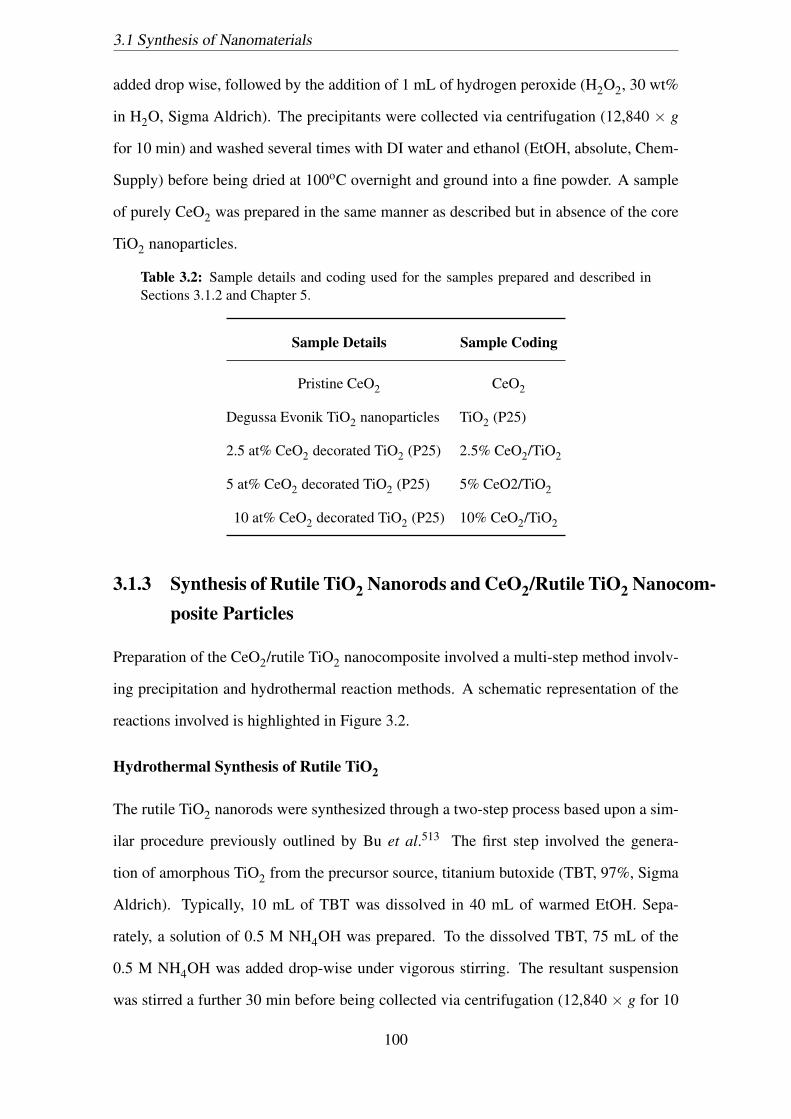
3.1 Synthesis of Nanomaterials
added drop wise, followed by the addition of 1 mL of hydrogen peroxide (H2O2, 30 wt%
in H2O, Sigma Aldrich). The precipitants were collected via centrifugation (12,840 × g
for 10 min) and washed several times with DI water and ethanol (EtOH, absolute, Chem-
Supply) before being dried at 100oC overnight and ground into a fine powder. A sample
of purely CeO2 was prepared in the same manner as described but in absence of the core
TiO2 nanoparticles.
Table 3.2: Sample details and coding used for the samples prepared and described inSections 3.1.2 and Chapter 5.
Sample Details Sample Coding
Pristine CeO2 CeO2
Degussa Evonik TiO2 nanoparticles TiO2 (P25)
2.5 at% CeO2 decorated TiO2 (P25) 2.5% CeO2/TiO2
5 at% CeO2 decorated TiO2 (P25) 5% CeO2/TiO2
10 at% CeO2 decorated TiO2 (P25) 10% CeO2/TiO2
3.1.3 Synthesis of Rutile TiO2 Nanorods and CeO2/Rutile TiO2 Nanocom-posite Particles
Preparation of the CeO2/rutile TiO2 nanocomposite involved a multi-step method involv-
ing precipitation and hydrothermal reaction methods. A schematic representation of the
reactions involved is highlighted in Figure 3.2.
Hydrothermal Synthesis of Rutile TiO2
The rutile TiO2 nanorods were synthesized through a two-step process based upon a sim-
ilar procedure previously outlined by Bu et al.513 The first step involved the genera-
tion of amorphous TiO2 from the precursor source, titanium butoxide (TBT, 97%, Sigma
Aldrich). Typically, 10 mL of TBT was dissolved in 40 mL of warmed EtOH. Sepa-
rately, a solution of 0.5 M NH4OH was prepared. To the dissolved TBT, 75 mL of the
0.5 M NH4OH was added drop-wise under vigorous stirring. The resultant suspension
was stirred a further 30 min before being collected via centrifugation (12,840 × g for 10
100
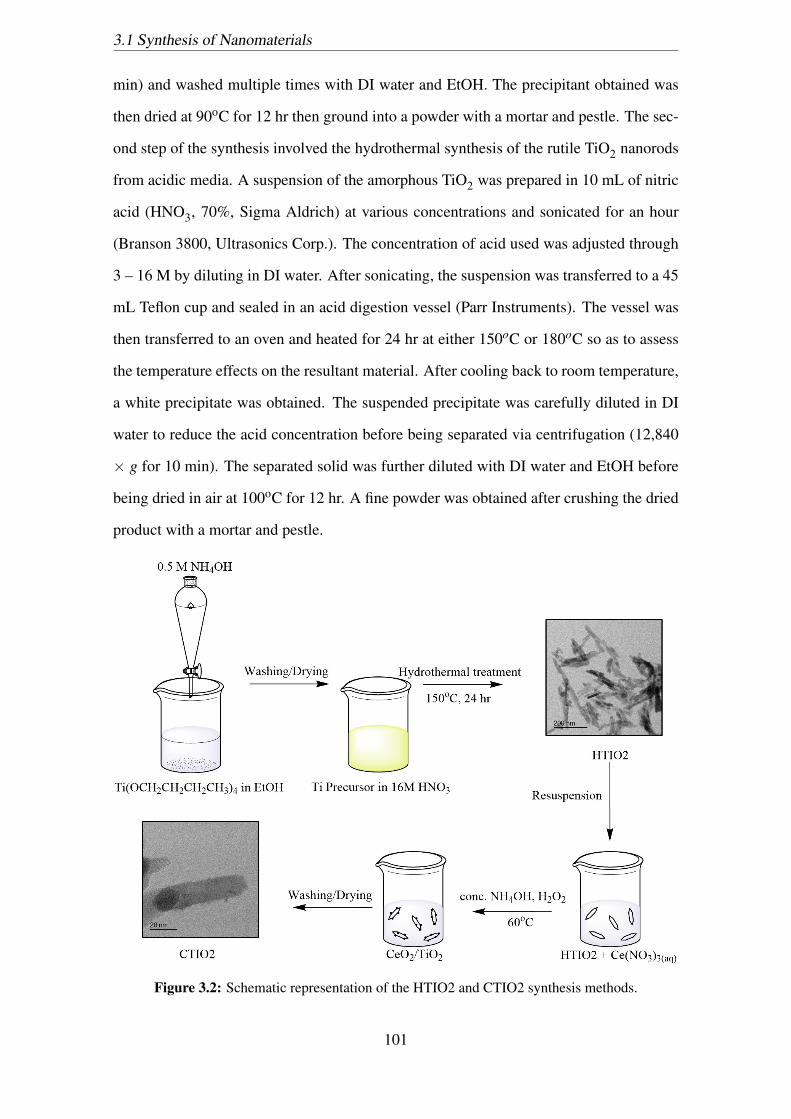
3.1 Synthesis of Nanomaterials
min) and washed multiple times with DI water and EtOH. The precipitant obtained was
then dried at 90oC for 12 hr then ground into a powder with a mortar and pestle. The sec-
ond step of the synthesis involved the hydrothermal synthesis of the rutile TiO2 nanorods
from acidic media. A suspension of the amorphous TiO2 was prepared in 10 mL of nitric
acid (HNO3, 70%, Sigma Aldrich) at various concentrations and sonicated for an hour
(Branson 3800, Ultrasonics Corp.). The concentration of acid used was adjusted through
3 – 16 M by diluting in DI water. After sonicating, the suspension was transferred to a 45
mL Teflon cup and sealed in an acid digestion vessel (Parr Instruments). The vessel was
then transferred to an oven and heated for 24 hr at either 150oC or 180oC so as to assess
the temperature effects on the resultant material. After cooling back to room temperature,
a white precipitate was obtained. The suspended precipitate was carefully diluted in DI
water to reduce the acid concentration before being separated via centrifugation (12,840
× g for 10 min). The separated solid was further diluted with DI water and EtOH before
being dried in air at 100oC for 12 hr. A fine powder was obtained after crushing the dried
product with a mortar and pestle.
Figure 3.2: Schematic representation of the HTIO2 and CTIO2 synthesis methods.
101
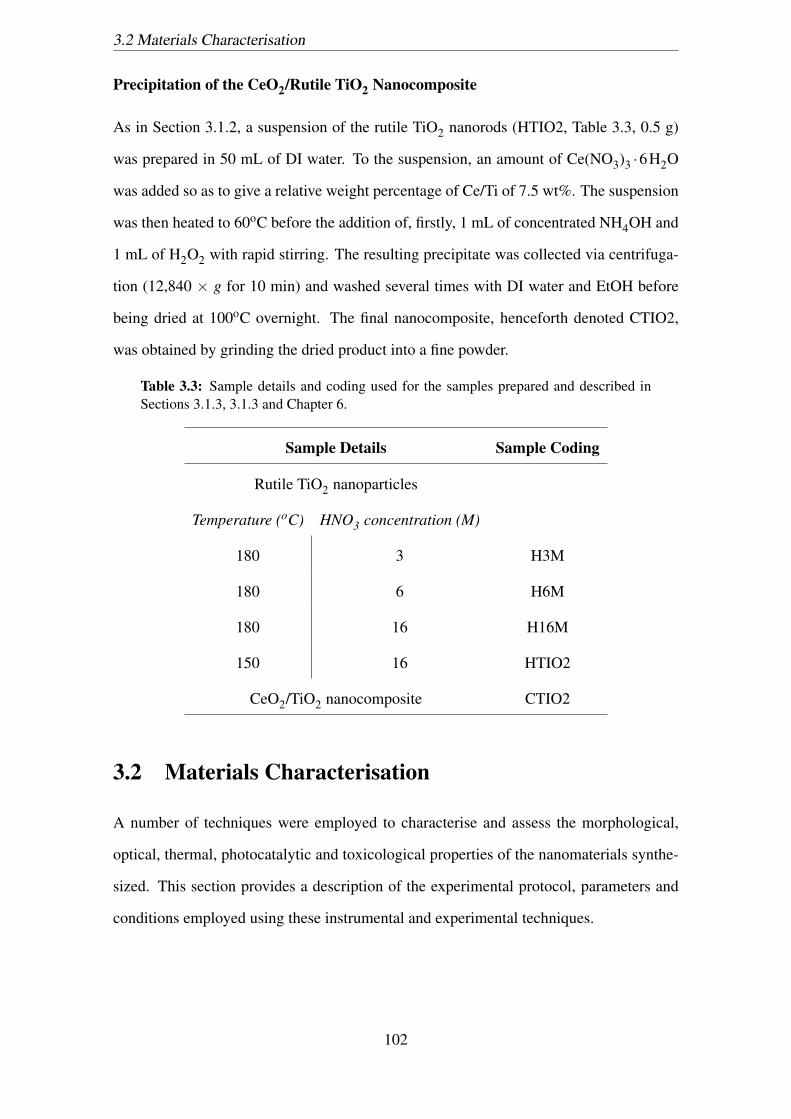
3.2 Materials Characterisation
Precipitation of the CeO2/Rutile TiO2 Nanocomposite
As in Section 3.1.2, a suspension of the rutile TiO2 nanorods (HTIO2, Table 3.3, 0.5 g)
was prepared in 50 mL of DI water. To the suspension, an amount of Ce(NO3)3 ·6H2O
was added so as to give a relative weight percentage of Ce/Ti of 7.5 wt%. The suspension
was then heated to 60oC before the addition of, firstly, 1 mL of concentrated NH4OH and
1 mL of H2O2 with rapid stirring. The resulting precipitate was collected via centrifuga-
tion (12,840 × g for 10 min) and washed several times with DI water and EtOH before
being dried at 100oC overnight. The final nanocomposite, henceforth denoted CTIO2,
was obtained by grinding the dried product into a fine powder.
Table 3.3: Sample details and coding used for the samples prepared and described inSections 3.1.3, 3.1.3 and Chapter 6.
Sample Details Sample Coding
Rutile TiO2 nanoparticles
Temperature (oC) HNO3 concentration (M)
180 3 H3M
180 6 H6M
180 16 H16M
150 16 HTIO2
CeO2/TiO2 nanocomposite CTIO2
3.2 Materials Characterisation
A number of techniques were employed to characterise and assess the morphological,
optical, thermal, photocatalytic and toxicological properties of the nanomaterials synthe-
sized. This section provides a description of the experimental protocol, parameters and
conditions employed using these instrumental and experimental techniques.
102
3.2 Materials Characterisation
3.2.1 X-Ray Diffraction
X-ray radiation is a subset of electromagnetic radiation spanning the wavelength range of
0.01 to 10 nm. This type of radiation is used in X-ray crystallography as an analytical
means of differentiating between different crystal structures due to having wavelengths
close in length to the separation between different crystal planes making up the crystal
structure.514
Long range periodicity in crystals are described by translational vectors and is governed
by one of seven symmetry systems. Local variation in crystal structure about particular
atoms in the crystal structure can also lead to localized/point symmetries. The combi-
nation of both translational and point symmetry elements leads to further new spatial
symmetry elements and differences from one crystalline compound to another. Gener-
ation of a diffraction pattern by x-ray radiation passing through a crystalline solid can
be used to differentiate between different crystal structures or crystal phases and can be
semi-qualitatively used to determine the presence of particular elements/compounds in a
given sample. The angular positions at which these diffraction events occur is defined by
the Bragg law:
2dsin(θ) = nλ (3.1)
where d is the interplanar spacing between diffracting planes (nm) with Miller indices
(hkl), θ the angle of the incident x-ray beam (o), n a integer value defining the diffrac-
tion order and λ the wavelength of the incident x-ray beam. Determining the angular
position of diffraction allows the calculation of the lattice parameters (translational vec-
tor lengths, a, b, c and the vector angles α,β ,γ) that define the basic repeating unit of
the crystal structure being examined, termed the unit cell. In this manner, the diffraction
pattern obtained for a particular crystal structure can be used as a fingerprint for crystal
phase identification, with reference to standard Joint Committee for Powder Diffraction
Standards (JCPDS) files for that crystal phase in question.
X-ray diffraction (XRD) was performed on the powdered forms of the nanomaterials syn-
thesized in order to characterise the crystal phase composition and crystallinity. The XRD
patterns for the as-prepared samples were obtained using a GBC Mini-Materials Analyser
103

3.2 Materials Characterisation
(MMA) X-ray Diffractometer (XRD) (GBC Scientific Equipment) coupled with a Cu Kα
x-ray source. Samples for analysis were prepared by mixing a small portion of powder
sample with ethanol in a agate mortar and pestle to make a slurry. The slurry was then
drop cast onto a quartz glass slide to form a thin film and allowed to dry before analysis.
Diffraction scans were obtained between 2θ = 20 - 90o at a scan rate of 1.5o min−1 and
step size of 0.020. The mean crystallite sizes were also approximated using the Scherrer
equation:
τ =κλ
βcosθ(3.2)
Where τ is the mean crystallite size in the direction normal to the diffraction plane h
k l (nm), κ a constant shape factor (0.9 used for unknown particle sizes), λ the wave-
length of incident X-ray radiation (nm), θ the angle of diffraction (radians) and β the full
width half maximum or line broadening of the selected peak, taking into account the ob-
served broadening of the sample and the broadening due to the instrumental arrangement
(radians). The diffraction patterns obtained were examined and fitted using the Match!
software package.
Figure 3.3: GBC Mini-Materials Analyser X-ray Diffractometer (interior) and sampleholder.
104
3.2 Materials Characterisation
3.2.2 Electron Microscopy
Scanning Electron Microscopy
Scanning electron microscopy (SEM) is a powerful tool for viewing topographical and
morphological features of a sample at extremely high magnification (ranging from 20×
to >500,000×) with nanoscale resolution (1 nm imaging). The use an electron beam
probe scanning across the sample enables the indirect viewing of the sample surface and
its morphological/topographical features. Interaction of the incident electron beam with
a sample can result in the production of a variety of signals depending on the interaction
volume. This interaction volume is dependent on a few factors including:
• The atomic number of the element(s) present in the sample: higher atomic number
elements absorb or impede more electrons, reducing the interaction volume.
• Acceleration voltage used: a higher energy will result in greater interaction volume.
• Angle of the incident electron beam: a greater angle from normal results in a smaller
interaction volume.
SEM images are produced due to secondary electron emission from the sample. Sec-
ondary electrons (SE) originate from or close to the sample surface and are due to inelastic
collisions between the primary electron beam (and also some backscattered electrons) and
electrons orbiting the specimen atoms. These orbiting electrons are sufficiently excited to
overcome the work-function for that atom and are ejected with low kinetic energies (2- 5
eV). Because such a small amount of energy is lost from the initial electron beam (usually
accelerated at energies between 5-50 keV), multiple SE’s can be produced by a single in-
cident electron. As a result of the low energy of SE’s, their mean free path is quite small as
they themselves are quite easily scattered and so, as mentioned earlier, only those ejected
near the surface of the sample can be collected and analysed. Changes in topography of
the sample will result in a change in the number of SE’s produced. In this manner, as the
incident electron beam is rastered across the specimen surface, a contrast image can be
produced based upon the intensity/count of ejected secondary electrons.
105

3.2 Materials Characterisation
Figure 3.4: (left) Interaction volume generated by incident electron beam and gener-ation of secondary electrons (SE). (right) JEOL JSM-7500FA field emission electronmicroscope. Figure (right) reproduced from JEOL.515
SEM images were obtained using a JSM-7500FA field emission electron microscope
(JEOL). Samples for imaging were prepared by spreading a small quantity of powdered
sample onto a small section of double-sided sticky carbon tape attached to an aluminium
stub. To improve image quality and reduce charging effects, the samples were coated
with a thin layer of platinum (Pt) using a Sputter Coater (Dynavac). The conditions for
imaging generally consisted of using an accelerating voltage of 5 kV, emission current of
10 µA and spot size of 8.
Transmission Electron Microscopy
As the name suggests, transmission electron microscopy (TEM) operates on the basis of
the detection of transmitted electrons through the sample, much like a light microscope
that uses visible light. However, TEM microscopes are capable of producing images with
much higher resolution and magnification. The reason for this, as with SEM, is due to
the use of very high energy electrons with very small wavelengths as governed by the de
Broglie equation:
λ = hc/E (3.3)
Where λ is the electron wavelength (nm), h the Planck constant (6.626x10⁻³⁴ Js) and E
the electron energy (Js nm−1). Thus, at high electron voltages, atomic resolution may
be achieved, provided the atomic column being viewed is some low-indexed projection
with the atoms sitting atop each other. Because the technique is reliant on transmittance,
106
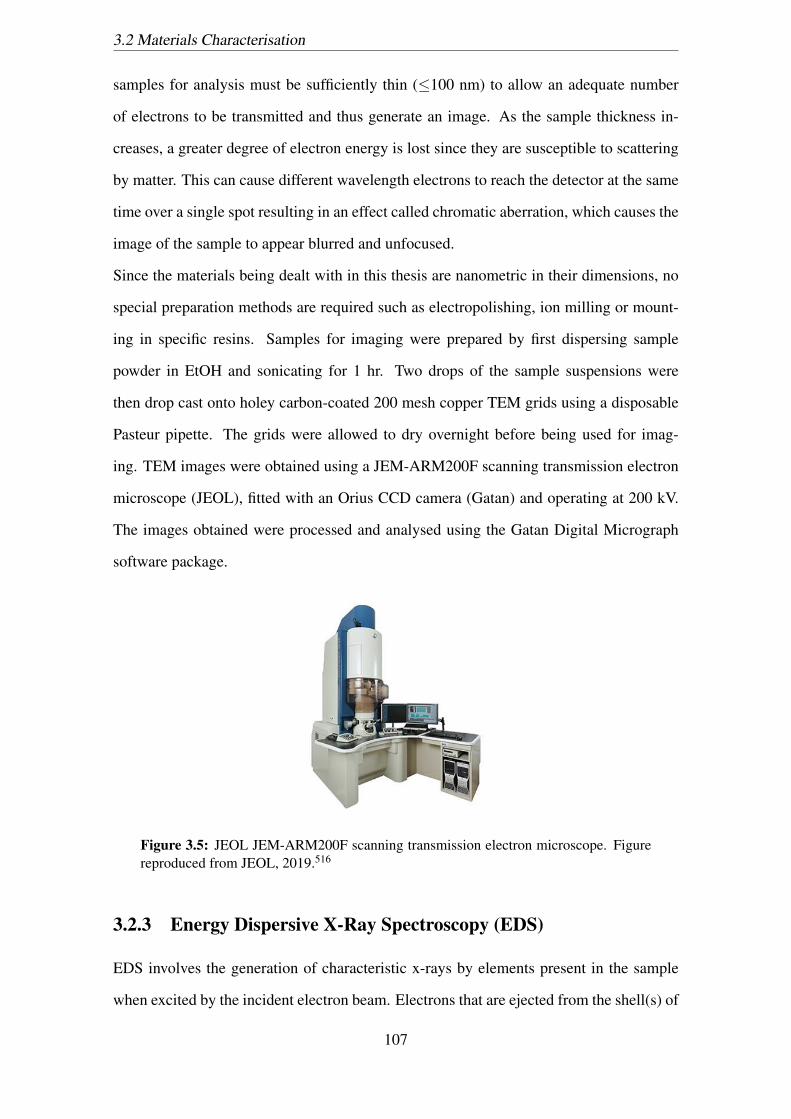
3.2 Materials Characterisation
samples for analysis must be sufficiently thin (≤100 nm) to allow an adequate number
of electrons to be transmitted and thus generate an image. As the sample thickness in-
creases, a greater degree of electron energy is lost since they are susceptible to scattering
by matter. This can cause different wavelength electrons to reach the detector at the same
time over a single spot resulting in an effect called chromatic aberration, which causes the
image of the sample to appear blurred and unfocused.
Since the materials being dealt with in this thesis are nanometric in their dimensions, no
special preparation methods are required such as electropolishing, ion milling or mount-
ing in specific resins. Samples for imaging were prepared by first dispersing sample
powder in EtOH and sonicating for 1 hr. Two drops of the sample suspensions were
then drop cast onto holey carbon-coated 200 mesh copper TEM grids using a disposable
Pasteur pipette. The grids were allowed to dry overnight before being used for imag-
ing. TEM images were obtained using a JEM-ARM200F scanning transmission electron
microscope (JEOL), fitted with an Orius CCD camera (Gatan) and operating at 200 kV.
The images obtained were processed and analysed using the Gatan Digital Micrograph
software package.
Figure 3.5: JEOL JEM-ARM200F scanning transmission electron microscope. Figurereproduced from JEOL, 2019.516
3.2.3 Energy Dispersive X-Ray Spectroscopy (EDS)
EDS involves the generation of characteristic x-rays by elements present in the sample
when excited by the incident electron beam. Electrons that are ejected from the shell(s) of
107
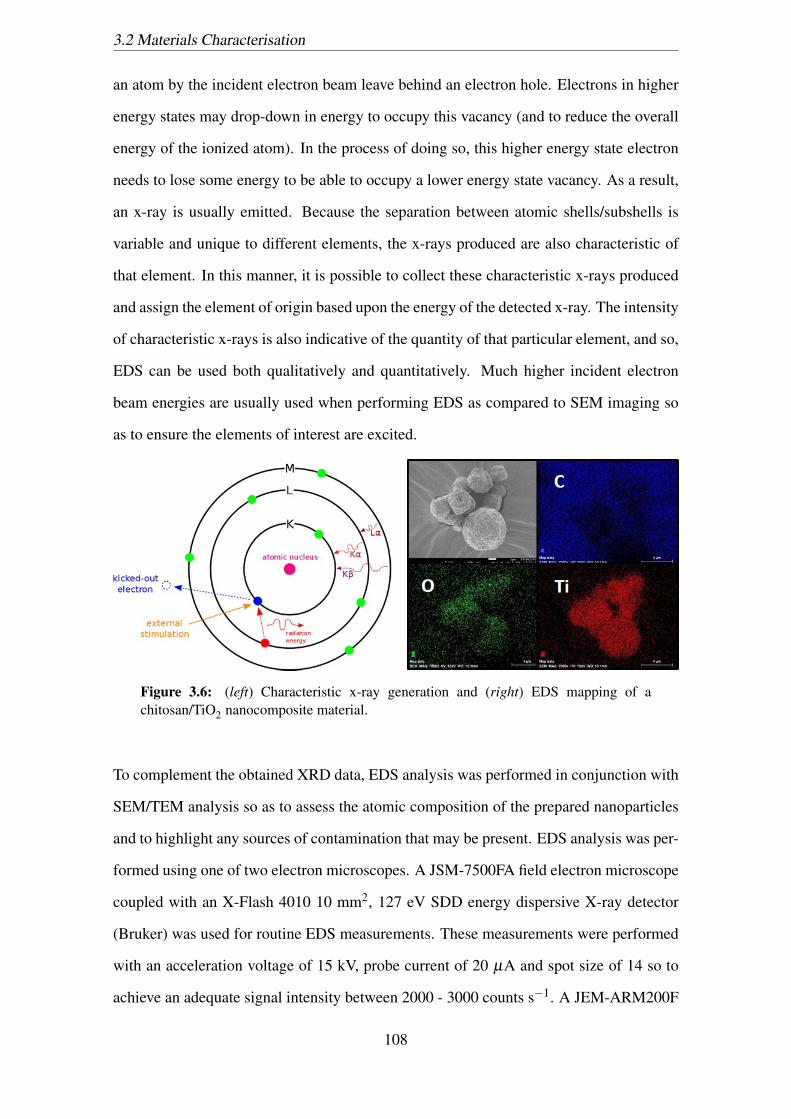
3.2 Materials Characterisation
an atom by the incident electron beam leave behind an electron hole. Electrons in higher
energy states may drop-down in energy to occupy this vacancy (and to reduce the overall
energy of the ionized atom). In the process of doing so, this higher energy state electron
needs to lose some energy to be able to occupy a lower energy state vacancy. As a result,
an x-ray is usually emitted. Because the separation between atomic shells/subshells is
variable and unique to different elements, the x-rays produced are also characteristic of
that element. In this manner, it is possible to collect these characteristic x-rays produced
and assign the element of origin based upon the energy of the detected x-ray. The intensity
of characteristic x-rays is also indicative of the quantity of that particular element, and so,
EDS can be used both qualitatively and quantitatively. Much higher incident electron
beam energies are usually used when performing EDS as compared to SEM imaging so
as to ensure the elements of interest are excited.
Figure 3.6: (left) Characteristic x-ray generation and (right) EDS mapping of achitosan/TiO2 nanocomposite material.
To complement the obtained XRD data, EDS analysis was performed in conjunction with
SEM/TEM analysis so as to assess the atomic composition of the prepared nanoparticles
and to highlight any sources of contamination that may be present. EDS analysis was per-
formed using one of two electron microscopes. A JSM-7500FA field electron microscope
coupled with an X-Flash 4010 10 mm2, 127 eV SDD energy dispersive X-ray detector
(Bruker) was used for routine EDS measurements. These measurements were performed
with an acceleration voltage of 15 kV, probe current of 20 µA and spot size of 14 so to
achieve an adequate signal intensity between 2000 - 3000 counts s−1. A JEM-ARM200F
108

3.2 Materials Characterisation
scanning transmission electron microscope fitted with a Centurio SDD detector (JEOL)
with a 100 mm2 detection area was used to perform high-resolution EDS mapping. Post
data acquisition analysis was performed using NSS 3 X-ray microanalysis software (Ther-
mofischer Scientific).
3.2.4 Electron Energy Loss Spectroscopy
As has been mentioned in previous sections, various interactions of the electron beam in
electron microscopy techniques can lead to a variety of signals brought about by various
interactions with sample atoms. One such interaction is the inelastic scattering of elec-
trons from the incident electron beam by sample atoms. Electron energy loss spectroscopy
(EELS) utilizes this interaction to provide details about the local environment of atomic
electrons which, inturn, provides information about the physical and chemical properties
of the sample being examined.517 The low energy-loss region (>50 eV) can be used to
provide information about the electronic band structure properties of the material being
examined, such as the band gap and surface plasmons. Peaks within the higher energy loss
region (>50 eV) are usually assigned to ionization edges, whereby, core shell electrons
in the sample are excited above the work function due to the high energy incident elec-
tron beam. Using these characteristic ionization edges and having adequate energy-filters
in place, compositional information may obtained from the sample, enabling a means of
quantifying and mapping the distribution of elements present in the sample. In addition
to this compositional information, EELS can also be used to differentiate between differ-
ent crystal structures of the same compositional compound due to slight variations in the
local chemical environmental. These variations can be exploited and used in combina-
tion with compositional mapping to identify changes in crystal structure across a sample
due to variations in the so-called ’fine’ structure of element specific electron energy loss
regions.
109
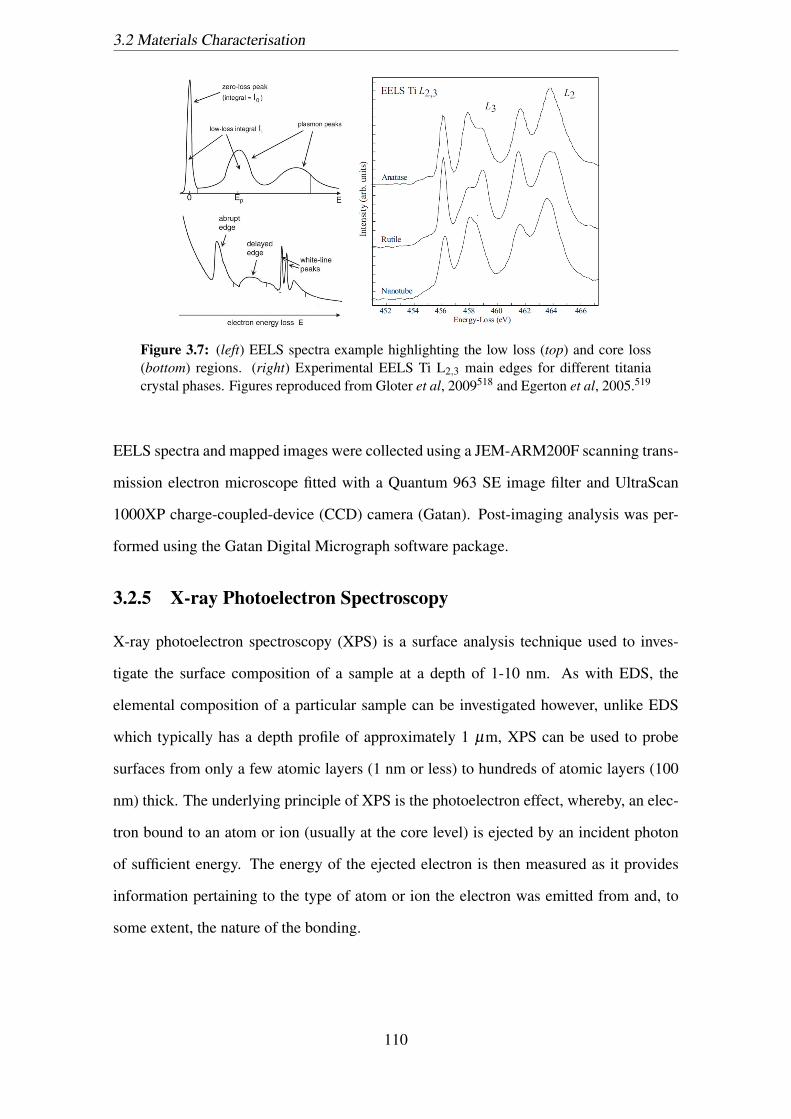
3.2 Materials Characterisation
Figure 3.7: (left) EELS spectra example highlighting the low loss (top) and core loss(bottom) regions. (right) Experimental EELS Ti L2,3 main edges for different titaniacrystal phases. Figures reproduced from Gloter et al, 2009518 and Egerton et al, 2005.519
EELS spectra and mapped images were collected using a JEM-ARM200F scanning trans-
mission electron microscope fitted with a Quantum 963 SE image filter and UltraScan
1000XP charge-coupled-device (CCD) camera (Gatan). Post-imaging analysis was per-
formed using the Gatan Digital Micrograph software package.
3.2.5 X-ray Photoelectron Spectroscopy
X-ray photoelectron spectroscopy (XPS) is a surface analysis technique used to inves-
tigate the surface composition of a sample at a depth of 1-10 nm. As with EDS, the
elemental composition of a particular sample can be investigated however, unlike EDS
which typically has a depth profile of approximately 1 µm, XPS can be used to probe
surfaces from only a few atomic layers (1 nm or less) to hundreds of atomic layers (100
nm) thick. The underlying principle of XPS is the photoelectron effect, whereby, an elec-
tron bound to an atom or ion (usually at the core level) is ejected by an incident photon
of sufficient energy. The energy of the ejected electron is then measured as it provides
information pertaining to the type of atom or ion the electron was emitted from and, to
some extent, the nature of the bonding.
110
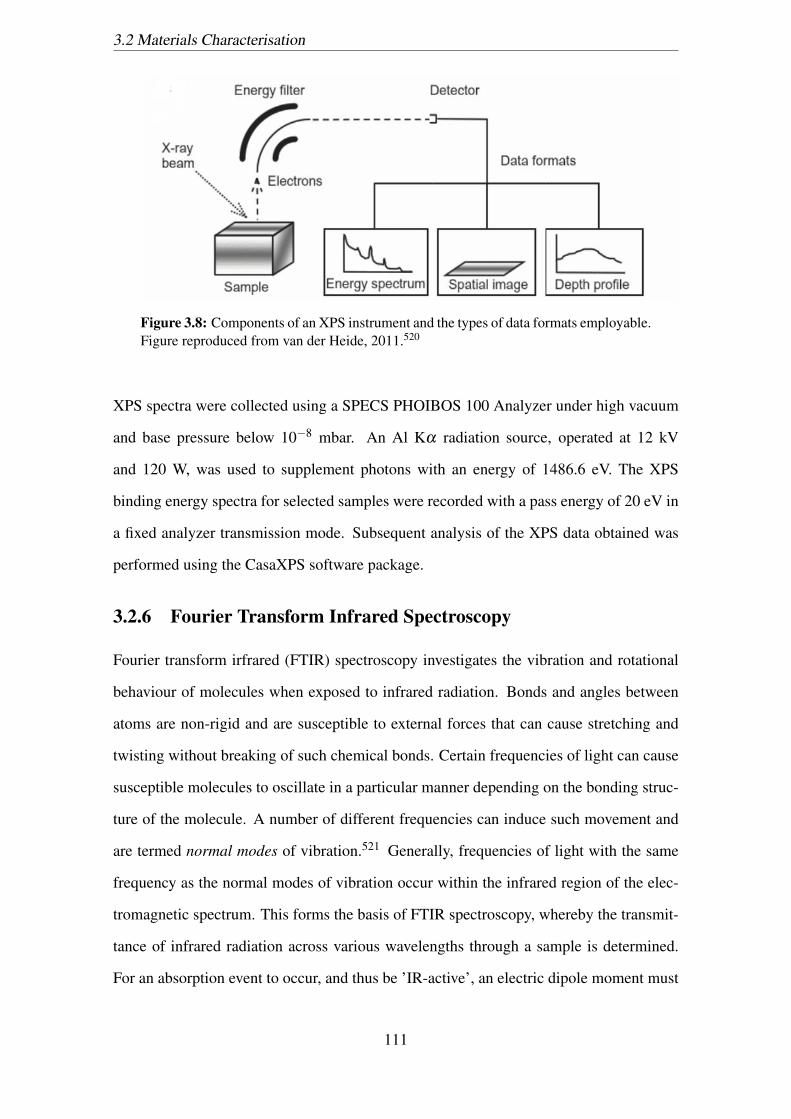
3.2 Materials Characterisation
Figure 3.8: Components of an XPS instrument and the types of data formats employable.Figure reproduced from van der Heide, 2011.520
XPS spectra were collected using a SPECS PHOIBOS 100 Analyzer under high vacuum
and base pressure below 10−8 mbar. An Al Kα radiation source, operated at 12 kV
and 120 W, was used to supplement photons with an energy of 1486.6 eV. The XPS
binding energy spectra for selected samples were recorded with a pass energy of 20 eV in
a fixed analyzer transmission mode. Subsequent analysis of the XPS data obtained was
performed using the CasaXPS software package.
3.2.6 Fourier Transform Infrared Spectroscopy
Fourier transform irfrared (FTIR) spectroscopy investigates the vibration and rotational
behaviour of molecules when exposed to infrared radiation. Bonds and angles between
atoms are non-rigid and are susceptible to external forces that can cause stretching and
twisting without breaking of such chemical bonds. Certain frequencies of light can cause
susceptible molecules to oscillate in a particular manner depending on the bonding struc-
ture of the molecule. A number of different frequencies can induce such movement and
are termed normal modes of vibration.521 Generally, frequencies of light with the same
frequency as the normal modes of vibration occur within the infrared region of the elec-
tromagnetic spectrum. This forms the basis of FTIR spectroscopy, whereby the transmit-
tance of infrared radiation across various wavelengths through a sample is determined.
For an absorption event to occur, and thus be ’IR-active’, an electric dipole moment must
111
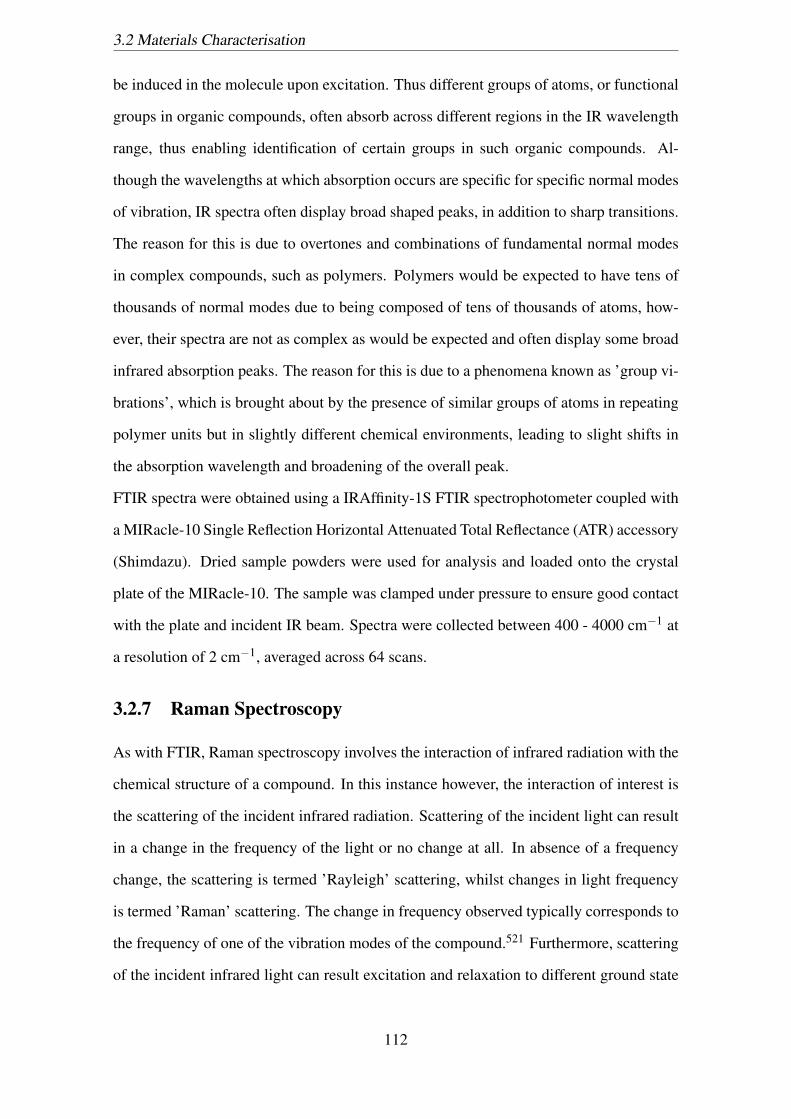
3.2 Materials Characterisation
be induced in the molecule upon excitation. Thus different groups of atoms, or functional
groups in organic compounds, often absorb across different regions in the IR wavelength
range, thus enabling identification of certain groups in such organic compounds. Al-
though the wavelengths at which absorption occurs are specific for specific normal modes
of vibration, IR spectra often display broad shaped peaks, in addition to sharp transitions.
The reason for this is due to overtones and combinations of fundamental normal modes
in complex compounds, such as polymers. Polymers would be expected to have tens of
thousands of normal modes due to being composed of tens of thousands of atoms, how-
ever, their spectra are not as complex as would be expected and often display some broad
infrared absorption peaks. The reason for this is due to a phenomena known as ’group vi-
brations’, which is brought about by the presence of similar groups of atoms in repeating
polymer units but in slightly different chemical environments, leading to slight shifts in
the absorption wavelength and broadening of the overall peak.
FTIR spectra were obtained using a IRAffinity-1S FTIR spectrophotometer coupled with
a MIRacle-10 Single Reflection Horizontal Attenuated Total Reflectance (ATR) accessory
(Shimdazu). Dried sample powders were used for analysis and loaded onto the crystal
plate of the MIRacle-10. The sample was clamped under pressure to ensure good contact
with the plate and incident IR beam. Spectra were collected between 400 - 4000 cm−1 at
a resolution of 2 cm−1, averaged across 64 scans.
3.2.7 Raman Spectroscopy
As with FTIR, Raman spectroscopy involves the interaction of infrared radiation with the
chemical structure of a compound. In this instance however, the interaction of interest is
the scattering of the incident infrared radiation. Scattering of the incident light can result
in a change in the frequency of the light or no change at all. In absence of a frequency
change, the scattering is termed ’Rayleigh’ scattering, whilst changes in light frequency
is termed ’Raman’ scattering. The change in frequency observed typically corresponds to
the frequency of one of the vibration modes of the compound.521 Furthermore, scattering
of the incident infrared light can result excitation and relaxation to different ground state
112
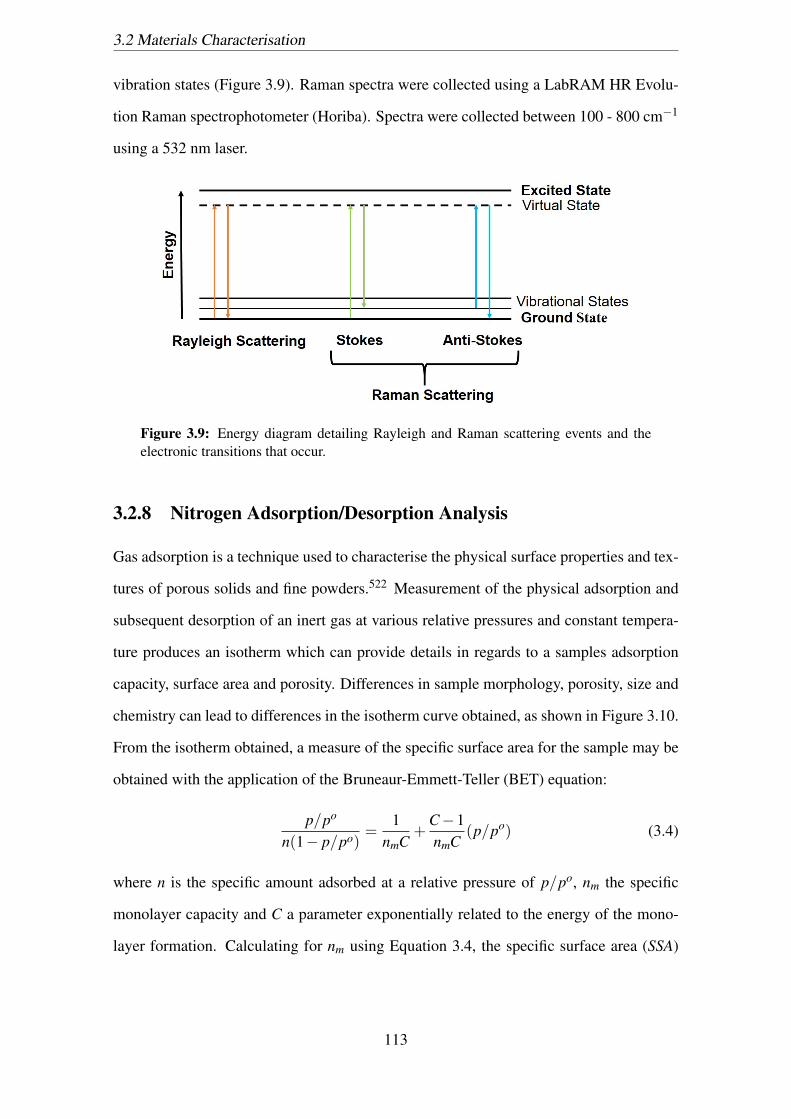
3.2 Materials Characterisation
vibration states (Figure 3.9). Raman spectra were collected using a LabRAM HR Evolu-
tion Raman spectrophotometer (Horiba). Spectra were collected between 100 - 800 cm−1
using a 532 nm laser.
Figure 3.9: Energy diagram detailing Rayleigh and Raman scattering events and theelectronic transitions that occur.
3.2.8 Nitrogen Adsorption/Desorption Analysis
Gas adsorption is a technique used to characterise the physical surface properties and tex-
tures of porous solids and fine powders.522 Measurement of the physical adsorption and
subsequent desorption of an inert gas at various relative pressures and constant tempera-
ture produces an isotherm which can provide details in regards to a samples adsorption
capacity, surface area and porosity. Differences in sample morphology, porosity, size and
chemistry can lead to differences in the isotherm curve obtained, as shown in Figure 3.10.
From the isotherm obtained, a measure of the specific surface area for the sample may be
obtained with the application of the Bruneaur-Emmett-Teller (BET) equation:
p/po
n(1− p/po)=
1nmC
+C−1nmC
(p/po) (3.4)
where n is the specific amount adsorbed at a relative pressure of p/po, nm the specific
monolayer capacity and C a parameter exponentially related to the energy of the mono-
layer formation. Calculating for nm using Equation 3.4, the specific surface area (SSA)
113
3.2 Materials Characterisation
can then be determined using:
SSA = nmNσm/m (3.5)
where m is the mass of the sample, N is Avogadro’s number and σm the molecular cross-
sectional area of the adsorbate gas used. Calculation of the specific surface area of the
prepared nanoparticles was assessed through nitrogen adsorption/desorption methods us-
ing a Tristar II 3020 Gas Sorption system (Micromeritics). initially, clean sample tubes
were prepared by washing with detergent, hot water and EtOH before being dried under
vacuum at 150oC for 4 hr. Samples were loaded into the cell such that the cell bulb was at
least half-filled or with a mass such that the expected specific surface area of the sample
was enough to provide a total surface area in the cell between 10 - 100 m2. The samples
were degassed at 120oC overnight prior to analysis using a Vacuum Degassing Station
(Micromeritics). After degassing, the cells with sample were weighed to determine the
dried sample mass and installed into the analysis station (Figure 3.4). The adsorbate gas
used was nitrogen (N2), with an assumed σm of 0.162 nm2, and the measurements per-
formed at constant liquid nitrogen temperature (77 K). Specific surface area values were
calculated using the isotherm data points between p/po 0.05 - 0.3, standard for isotherm
Types II and IV(a).522
114
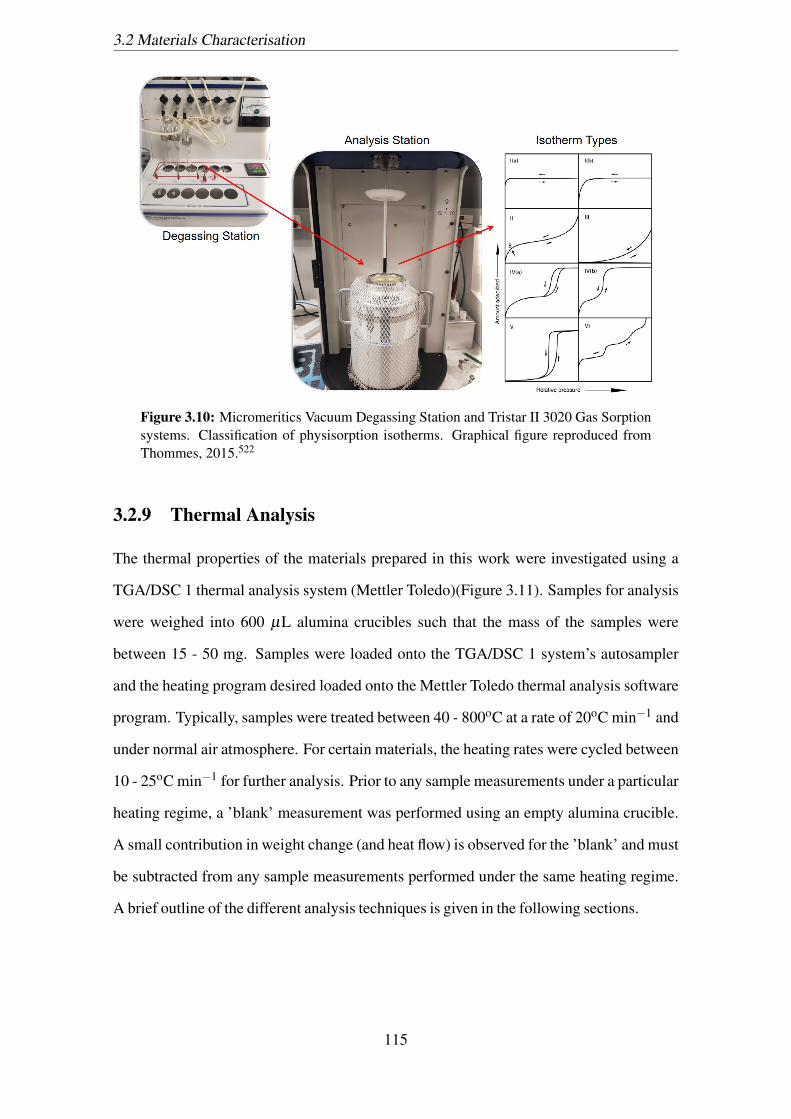
3.2 Materials Characterisation
Figure 3.10: Micromeritics Vacuum Degassing Station and Tristar II 3020 Gas Sorptionsystems. Classification of physisorption isotherms. Graphical figure reproduced fromThommes, 2015.522
3.2.9 Thermal Analysis
The thermal properties of the materials prepared in this work were investigated using a
TGA/DSC 1 thermal analysis system (Mettler Toledo)(Figure 3.11). Samples for analysis
were weighed into 600 µL alumina crucibles such that the mass of the samples were
between 15 - 50 mg. Samples were loaded onto the TGA/DSC 1 system’s autosampler
and the heating program desired loaded onto the Mettler Toledo thermal analysis software
program. Typically, samples were treated between 40 - 800oC at a rate of 20oC min−1 and
under normal air atmosphere. For certain materials, the heating rates were cycled between
10 - 25oC min−1 for further analysis. Prior to any sample measurements under a particular
heating regime, a ’blank’ measurement was performed using an empty alumina crucible.
A small contribution in weight change (and heat flow) is observed for the ’blank’ and must
be subtracted from any sample measurements performed under the same heating regime.
A brief outline of the different analysis techniques is given in the following sections.
115
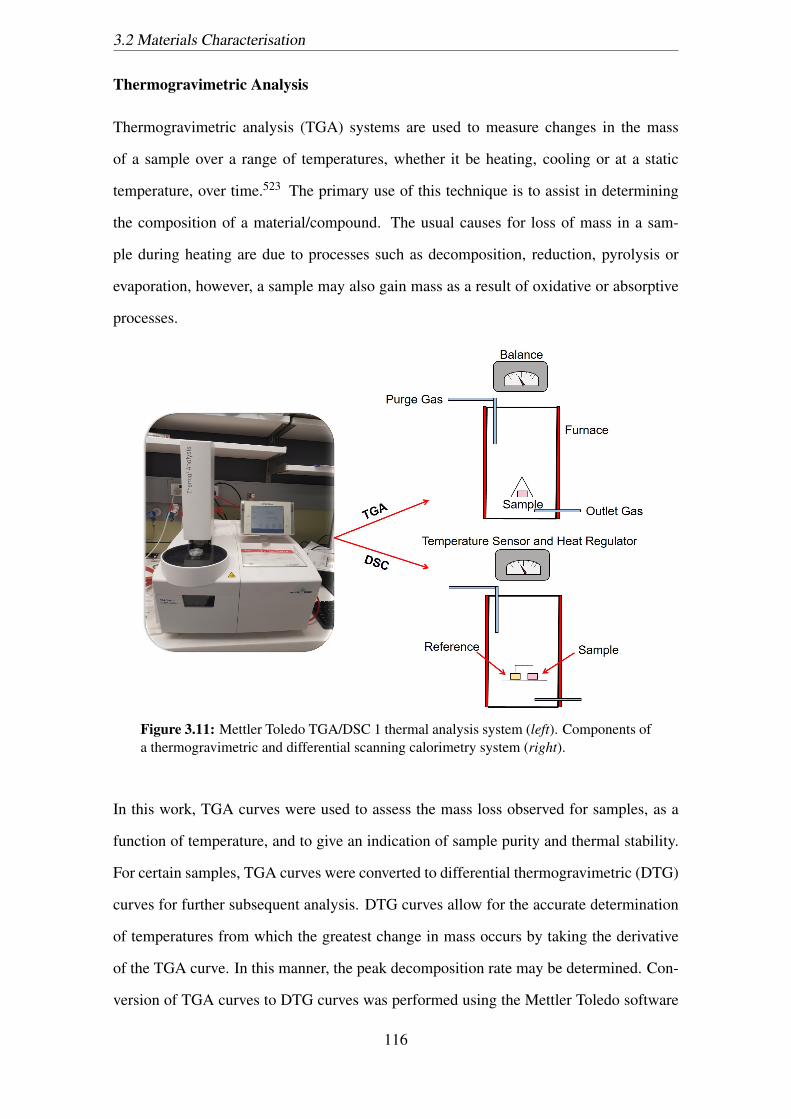
3.2 Materials Characterisation
Thermogravimetric Analysis
Thermogravimetric analysis (TGA) systems are used to measure changes in the mass
of a sample over a range of temperatures, whether it be heating, cooling or at a static
temperature, over time.523 The primary use of this technique is to assist in determining
the composition of a material/compound. The usual causes for loss of mass in a sam-
ple during heating are due to processes such as decomposition, reduction, pyrolysis or
evaporation, however, a sample may also gain mass as a result of oxidative or absorptive
processes.
Figure 3.11: Mettler Toledo TGA/DSC 1 thermal analysis system (left). Components ofa thermogravimetric and differential scanning calorimetry system (right).
In this work, TGA curves were used to assess the mass loss observed for samples, as a
function of temperature, and to give an indication of sample purity and thermal stability.
For certain samples, TGA curves were converted to differential thermogravimetric (DTG)
curves for further subsequent analysis. DTG curves allow for the accurate determination
of temperatures from which the greatest change in mass occurs by taking the derivative
of the TGA curve. In this manner, the peak decomposition rate may be determined. Con-
version of TGA curves to DTG curves was performed using the Mettler Toledo software
116
3.2 Materials Characterisation
package.
Differential Scanning Calorimetry
Differential scanning calorimetry (DSC) measures differences in the heat transmittance
required to increase the temperature of a sample relative to a reference such that both
sample and reference are at the same temperature. When the sample undergoes a phase
transition (or other thermal process) more or less heat will flow into the sample compared
to the reference to ensure the temperatures of the two are equivalent. For example, when
a solid melts to form a liquid, the process is endothermic meaning heat is absorbed by the
sample. This thus requires an additional amount of heat flow to the sample to increase its
temperature to match that of the reference which should be increasing linearly. Crystal-
lization is another thermal process that can be observed through DSC. Crystallization is
an exothermic process and thus requires less heat to raise the sample temperature relative
to the reference. Collection of DSC data occurs concurrently with the collection of the
TGA curves and was obtained for all tested samples.
3.2.10 Ultraviolet-Visible Absorption Spectroscopy
Ultraviolet-visible (UV-Vis) absorption spectroscopy was employed to assess the absorp-
tive properties of the prepared materials.
Samples for analysis were prepared by first weighing 2.5 mg of dry powdered sample into
a glass sample tube. To the weighed powders, 10 mL of EtOH was added to yield a sample
concentration of 250 mg L−1. The samples were then suspended using an ultrasonication
bath (Branson) for 1 hr. A series of dilutions were prepared in EtOH but transferring
aliquots of the 250 mg L−1 to seperate volumes of EtOH in 15 mL Falcon centrifuge
tubes. In this manner, concentrations of 10, 20, 30, 40 and 50 mg L−1 were prepared.
Prior to analysis, these diluted samples were sonicated a further 30 min. Absorbance
measurements were performed using a UV-1800 spectrophotometer (Shimadzu). Data
was collected between 200 - 800 nm at a step size of 1 nm. Baselining was performed in
absence of any sample or cuvette and background measurements obtained for cuvette and
117
3.2 Materials Characterisation
solvent contributions to the absorption spectra. Calculation of the extinction coefficient
for each of the prepared nanoparticle samples was determined from the relation between
the absorbance measured and concentration, in accordance with the Beer-Lambert law:
A = εcl (3.6)
where A is the absorbance (a.u.), ε the extinction coefficient (L mg−1 cm−1), c the con-
centration (mg L−1) and l the path length (cm). By plotting the absorbance against the
concentration of the sample tested, the extinction coefficient may be obtained from the
resulting slope. In addition to the extinction coefficient, for semiconducting materials, the
band gap may also be determined. Due to the quantized nature of energy levels in semi-
conducting nanomaterials, there exists an absorption edge from which incident photons
of sufficient energy can excite electrons from the valence band of the semiconductor to its
conduction band. The energy at which this transition may occur can be estimated using
the Tauc equation:524
(αhv)1/n = B(hv+Eg) (3.7)
where hv refers to the photon energy, calculated from the incident photon wavelength (λ ),
B is a constant, Eg the band gap (eV), n a value related to the nature of the band gap tran-
sition and α the absorption coefficient (or attenuation). The value of n can take on values
between 0 - 3 corresponding to different types such as direct, indirect, allowed, forbidden
or combinations of each. The absorption coefficient, as a function of wavelength (α(λ ))
can be calculated from absorption spectra data through the following equation:
α(λ ) =(2.303×10³)A(λ )ρ
cl(3.8)
where A(λ ) (a.u.) is the absorption of the sample as a function of the wavelength, ρ the
density of the sample (mg cm−3), c the concentration (mg cm−3) and l the pathlength
(cm). By plotting (αhv)1/n against hv and extrapolating the linear portion of the curve
obtained to the x-axis, an estimation of the optical band gap may be obtained.
118
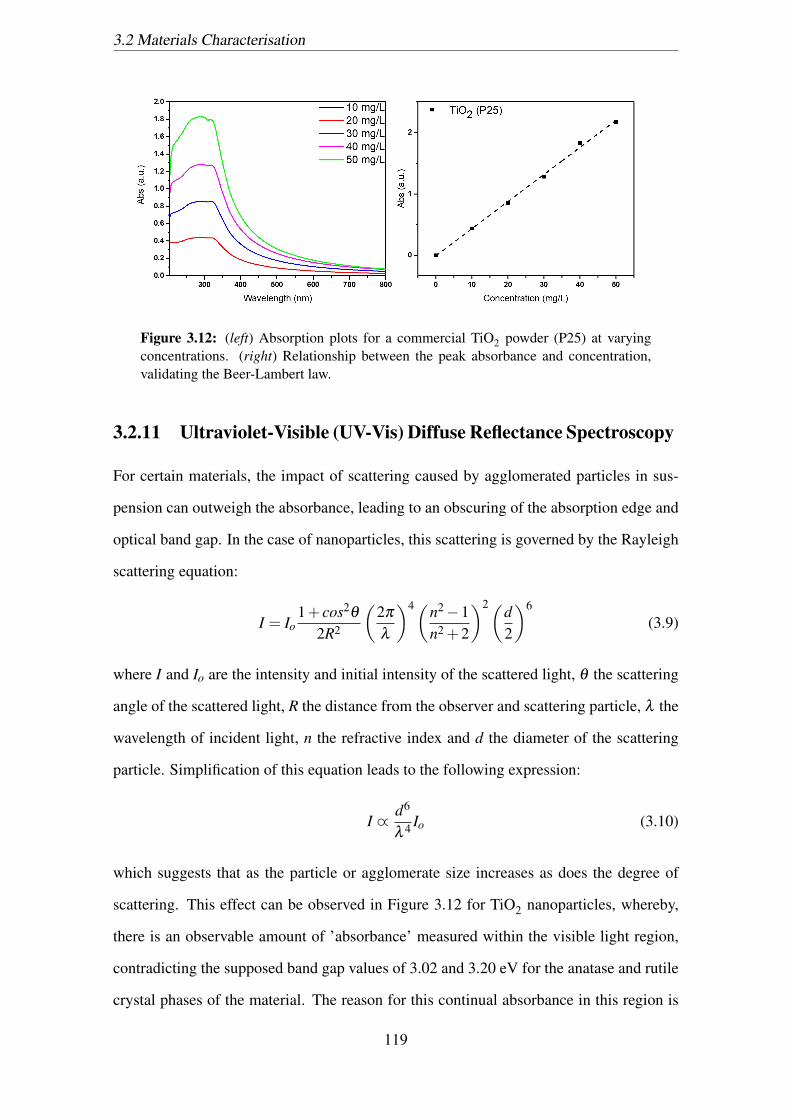
3.2 Materials Characterisation
Figure 3.12: (left) Absorption plots for a commercial TiO2 powder (P25) at varyingconcentrations. (right) Relationship between the peak absorbance and concentration,validating the Beer-Lambert law.
3.2.11 Ultraviolet-Visible (UV-Vis) Diffuse Reflectance Spectroscopy
For certain materials, the impact of scattering caused by agglomerated particles in sus-
pension can outweigh the absorbance, leading to an obscuring of the absorption edge and
optical band gap. In the case of nanoparticles, this scattering is governed by the Rayleigh
scattering equation:
I = Io1+ cos2θ
2R2
(2π
λ
)4(n2−1n2 +2
)2(d2
)6
(3.9)
where I and Io are the intensity and initial intensity of the scattered light, θ the scattering
angle of the scattered light, R the distance from the observer and scattering particle, λ the
wavelength of incident light, n the refractive index and d the diameter of the scattering
particle. Simplification of this equation leads to the following expression:
I ∝d6
λ 4 Io (3.10)
which suggests that as the particle or agglomerate size increases as does the degree of
scattering. This effect can be observed in Figure 3.12 for TiO2 nanoparticles, whereby,
there is an observable amount of ’absorbance’ measured within the visible light region,
contradicting the supposed band gap values of 3.02 and 3.20 eV for the anatase and rutile
crystal phases of the material. The reason for this continual absorbance in this region is
119
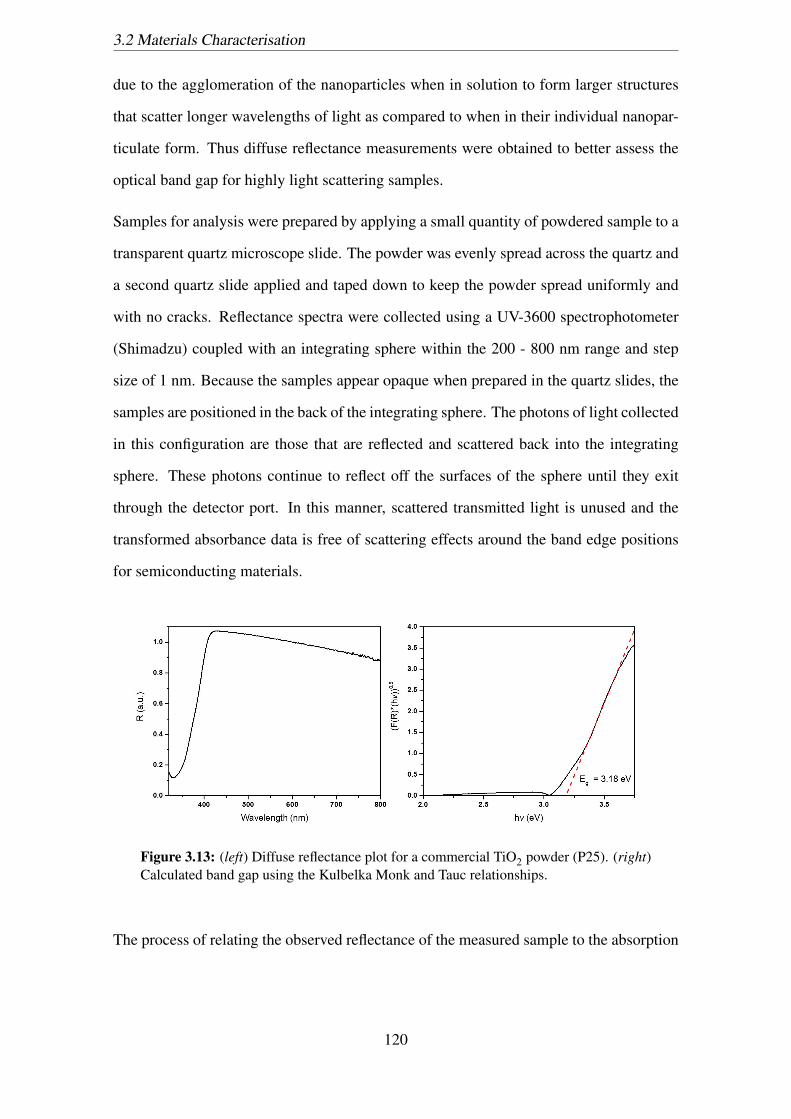
3.2 Materials Characterisation
due to the agglomeration of the nanoparticles when in solution to form larger structures
that scatter longer wavelengths of light as compared to when in their individual nanopar-
ticulate form. Thus diffuse reflectance measurements were obtained to better assess the
optical band gap for highly light scattering samples.
Samples for analysis were prepared by applying a small quantity of powdered sample to a
transparent quartz microscope slide. The powder was evenly spread across the quartz and
a second quartz slide applied and taped down to keep the powder spread uniformly and
with no cracks. Reflectance spectra were collected using a UV-3600 spectrophotometer
(Shimadzu) coupled with an integrating sphere within the 200 - 800 nm range and step
size of 1 nm. Because the samples appear opaque when prepared in the quartz slides, the
samples are positioned in the back of the integrating sphere. The photons of light collected
in this configuration are those that are reflected and scattered back into the integrating
sphere. These photons continue to reflect off the surfaces of the sphere until they exit
through the detector port. In this manner, scattered transmitted light is unused and the
transformed absorbance data is free of scattering effects around the band edge positions
for semiconducting materials.
Figure 3.13: (left) Diffuse reflectance plot for a commercial TiO2 powder (P25). (right)Calculated band gap using the Kulbelka Monk and Tauc relationships.
The process of relating the observed reflectance of the measured sample to the absorption
120
3.3 Assessment of Photocatalytic Activity
requires intermediate transformation using the Kubelka-Munk function:
F(R) =(1− r)2
2r' α
s(3.11)
Where α is the absorption coefficient, s the scattering coefficient, r the measured re-
flectance at a particular wavelength and F(R) the Kubelka-Monk function. F(R) is then
used in place of the absorption coefficient, α , in the Tauc equation (Equation 3.8), thus
enabling calculation of the optical band gap through a similar process as that detailed in
Section 3.2.10.
3.3 Assessment of Photocatalytic Activity
Evaluation of the photocatalytic potential of the prepared nanoparticles was performed
via the photo-induced degradation of the aqueous triarylmethane dye, crystal violet (CV)
(C25H30ClN3≥ 90%SigmaAldrich). Such an experimental approach towards the approxi-
mation of the photocatalytic activity of inorganic nanoparticles, including TiO2 and ZnO,
is often reported in literature, and so, is a suitable technique to employ.
3.3.1 Experimental Procedure
For each degradation experiment, a new 1000 mg L−1 suspension of the tested sample
was prepared by weighing 3 mg of dried sample into a glass sample tube, diluting in DI
water and sonicating for 1 hr. A stock solution of CV at a concentration of 500 mg L−1
and the suspended particles were used to prepare the final reaction mixture. To a 100 mL
volumetric flask, 1 mL of the CV stock and 0.5 mL of the suspension were added and the
flask filled to the mark. The final concentrations of both the CV dye and the tested sample
were 5 mg L−1.
Two different light sources and, subsequently, experimental set-ups were used to induce
excitation in the nanoparticles being examined and to induce photo-oxidative damage to
the target dye, as in accordance with the scheme shown in Figure 3.14. In the first in-
stance, a Rayonet photocatalytic reactor, fitted with 350 nm (8x, 24W) and 300 nm (8x,
121
3.3 Assessment of Photocatalytic Activity
21W) phosphor-coated lamps was used as the UV radiation source. A quartz beaker (100
mL) was used to contain the reaction mixture and to enable transmittance of the incident
UV radiation. A magnetic stir bar and inbuilt stirring system in the reactor enabled contin-
ual stirring of the tested sample suspension so as to inhibit sedimentation. Furthermore,
the experiments were conducted within a fumehood so as to minimize exposure to any
photo-generated ozone (O3) that may be produced by the high energy UV light sources
and oxygen present in the atmosphere. The purpose of using purely UV sources with in-
tensities substantially higher than that reflected in ambient UV measurements is to better
reflect acute photocatalytic effects of the tested nanoparticles.
The second dye degradation based set-up involved the use of a simulated solar radiation
emitting source (filtered 1000 W xenon lamp), calibrated using a silicon photovoltaic cell,
to reflect natural sunlight at an intensity of 1 sun as according to the ASTM E 892 standard
outlined by the American Society for Testing and Materials (ASTM).525 In this case,
the dye/nanoparticle suspension was prepared and transferred to a transparent PMMA
glass reactor vessel and stirred with a magnetic stir bar and stir plate. By irradiating the
target suspension with simulated solar light, a better reflection of the expected ambient
conditions for a consumer using a sunscreen product outdoors may be achieved and thus,
a closer approximation of the solar photocatalytic activity of these UV filtering materials
can be obtained.
For both methods, the photo-induced oxidative degradation of the dyes used is fit to the
Langmuir-Hinshelwood model:526–529
r =dCdt
=kKC
1+KC(3.12)
where r is the oxidation rate (mg L−1min−1), C the concentration of the dye (mg L−1),
t the irradiation time (min), k the rate constant (mg L−1min−1) and K the adsorption
coefficient (L mg−1). When the initial concentration of the dye (Co) is substantially small
(in the order of mM), the above expression can be simplified to follow a pseudo first-order
122

3.3 Assessment of Photocatalytic Activity
rate equation:
ln(Co
C) = kKt = kappt (3.13)
In this manner, a plot of ln(Co/C) against t yields a plot where the gradient corresponds
to the apparent rate constant, kapp, for the photo-mineralization of the dye.
Figure 3.14: Assessment of photocatalytic activity scheme using crystal violet as thedegradation target.
3.3.2 Data Representation and Statistical Analysis
Each nanoparticle and nanocomposite sample was tested in three separate experiments,
either for UV or solar-simulated light exposure or both, and the mean degradation at each
123
3.4 In Vitro Cytotoxicity towards Human Keratinocytes (HaCaT)
time interval taken. Rate constants are presented as the mean ± standard error of mean
(SeM).
3.4 In Vitro Cytotoxicity towards Human Keratinocytes(HaCaT)
Because we are concerned with the effects of inorganic UV filtering nanoparticles on hu-
man health when applied to skin in a sunscreen formulation, it would be appropriate to
therefore use a cell line that reflects cellular structures that said particles may interact
with. As such, the cell line chosen for these assays was the HaCaT cell line, a spon-
taneously transformed human epithelial cell line originating from human adult skin.530
This immortalized cell line is a useful representation of the human keratinocyte cell type,
which is the predominant cell type found in the epidermis, the outermost layers of skin.
Therefore, its use as a means of modelling the possible toxicological effects of inorganic
nanoparticles applied to the skin is obvious.
3.4.1 Cell Culture
The HaCaT cell line was used for all culture experiments and were originally provided
by Dr. J. Guy Lyons (University of Sydney). Short Tandem Repeat Profiling (Garvan
Institute of Medical Research) verified the identity of the cells. The cells were maintained
in phenol red Dulbecco’s Modified Eagle Medium/Nutrient Mixture F-12 (DMEM/F12,
Thermo Fisher Scientific) supplemented with 10% (v/v) heat inactivated fetal bovine
serum (FBS, Bovogen Biologicals), 100 U mL−1 penicillin/100 µg m−1 streptomycin
(Thermo Fisher Scientific) and 2 mM GlutaMAXT M (Thermo Fisher Scientific) and in-
cubated at 37oC with 5% (v/v) CO2 (Hercell 150i cell culture incubator, Thermo Fisher
Scientific) in 75 cm2 tissue culture flasks (Greiner Bio-One). Cells were passaged twice
weekly when the confluency of cells had reached ≥90%. Cells were routinely negative
for mycoplasma (MycoAlert Mycoplasma Detection Kit, Lonza).
Prior to subculturing, the cells were examined using a light microscope to assess con-
124

3.4 In Vitro Cytotoxicity towards Human Keratinocytes (HaCaT)
fluency and if any contamination may be present. After which, the confluent cells were
transferred to a Bio-safety cabinet (BSC) with aseptic measures taken. The old cell cul-
ture medium was decanted from the flask before rinsing the cells with three 3 mL washes
of Dulbecco’s phosphate buffered saline (DPBS, no Ca2+ or Mg2+, Thermo Fisher Sci-
entific). Following this, 3 mL of 0.25% trypsin-ethylenediaminetetraacetic acid (EDTA)
(Thermo Fisher Scientific) was added to the adherent cells and the flask placed in the
incubator for 8 min so as to enzymatically detach the cells from the flask surface. After
detachment, an additional 7 mL of fresh complete medium was added to the flask before
transferring the contents to a 50 mL Falcon centrifuge tube. The cell suspension was
centrifuged using a Heraeus Mulitufge X3 centrifuge (Thermo Fisher Scientific) at 300
× g for 5 min. The media/trypsin-EDTA mixture was decanted and the resulting pellet
resuspended in 10 mL of complete medium.
Cell counts were performed during each passage so as to determine the seeding number
needed for future passages and for determining the cell concentration for cytotoxic testing.
50 µL of the resuspended cells were transferred to a 1.5 mL Falcon tube and mixed with
50 µL of trypan blue dye (0.4%, Sigma Aldrich). From this, 10 µL was transferred to
either side of a haemocytometer (Neubauer), cleaned and sterilized with 70% (v/v) EtOH.
The haemocytometer consisted of two gridded counting chambers from which a total of
eight 1 mm2 square grids were used for cell counting. Cells that appeared blue in colour
were not included in the count as the colouration indicates permeation of the trypan blue
dye into the cell and non-viability. The cell concentration and cell number for the passage
are given by the following equations:
[Cells] = xcount×2×10⁴ (3.14)
NCells = [Cells]×Vresus. (3.15)
where [Cells] corresponds to the concentration of cells (cells mL−1), NCells the cell num-
ber (cells), xcount the average cell count determined using the haemocytometer and Vresus.
125
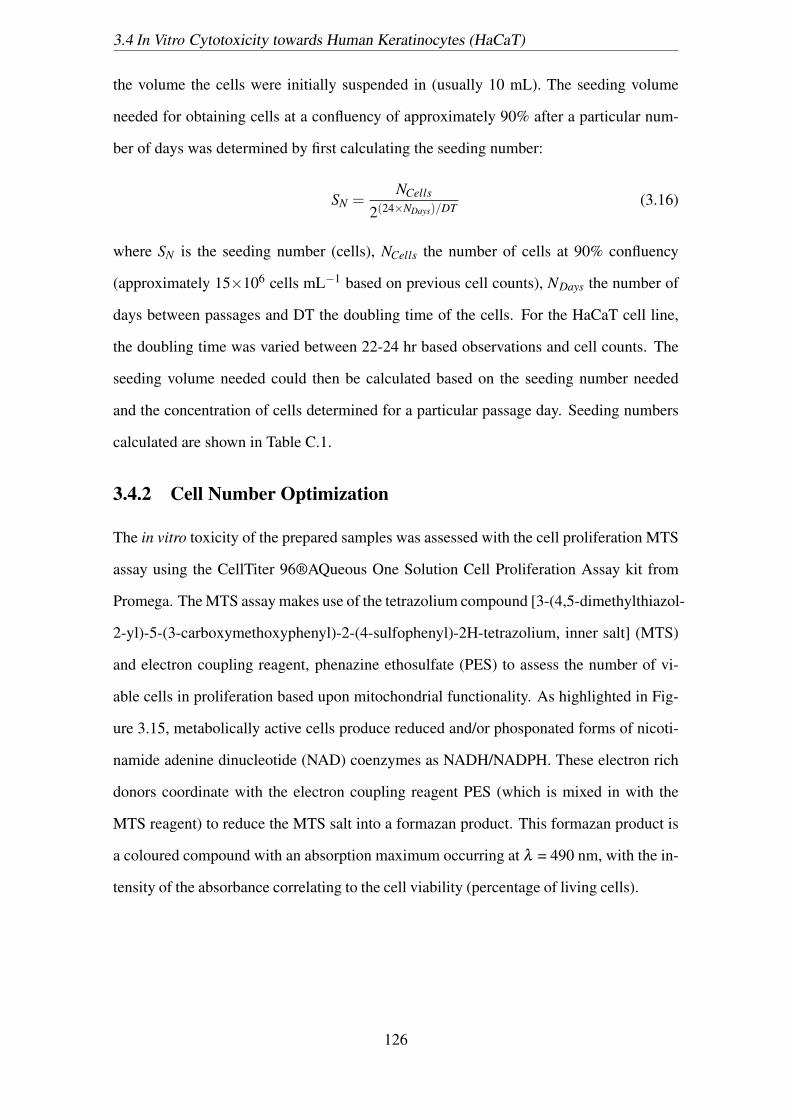
3.4 In Vitro Cytotoxicity towards Human Keratinocytes (HaCaT)
the volume the cells were initially suspended in (usually 10 mL). The seeding volume
needed for obtaining cells at a confluency of approximately 90% after a particular num-
ber of days was determined by first calculating the seeding number:
SN =NCells
2(24×NDays)/DT(3.16)
where SN is the seeding number (cells), NCells the number of cells at 90% confluency
(approximately 15×106 cells mL−1 based on previous cell counts), NDays the number of
days between passages and DT the doubling time of the cells. For the HaCaT cell line,
the doubling time was varied between 22-24 hr based observations and cell counts. The
seeding volume needed could then be calculated based on the seeding number needed
and the concentration of cells determined for a particular passage day. Seeding numbers
calculated are shown in Table C.1.
3.4.2 Cell Number Optimization
The in vitro toxicity of the prepared samples was assessed with the cell proliferation MTS
assay using the CellTiter 96®AQueous One Solution Cell Proliferation Assay kit from
Promega. The MTS assay makes use of the tetrazolium compound [3-(4,5-dimethylthiazol-
2-yl)-5-(3-carboxymethoxyphenyl)-2-(4-sulfophenyl)-2H-tetrazolium, inner salt] (MTS)
and electron coupling reagent, phenazine ethosulfate (PES) to assess the number of vi-
able cells in proliferation based upon mitochondrial functionality. As highlighted in Fig-
ure 3.15, metabolically active cells produce reduced and/or phosponated forms of nicoti-
namide adenine dinucleotide (NAD) coenzymes as NADH/NADPH. These electron rich
donors coordinate with the electron coupling reagent PES (which is mixed in with the
MTS reagent) to reduce the MTS salt into a formazan product. This formazan product is
a coloured compound with an absorption maximum occurring at λ = 490 nm, with the in-
tensity of the absorbance correlating to the cell viability (percentage of living cells).
126
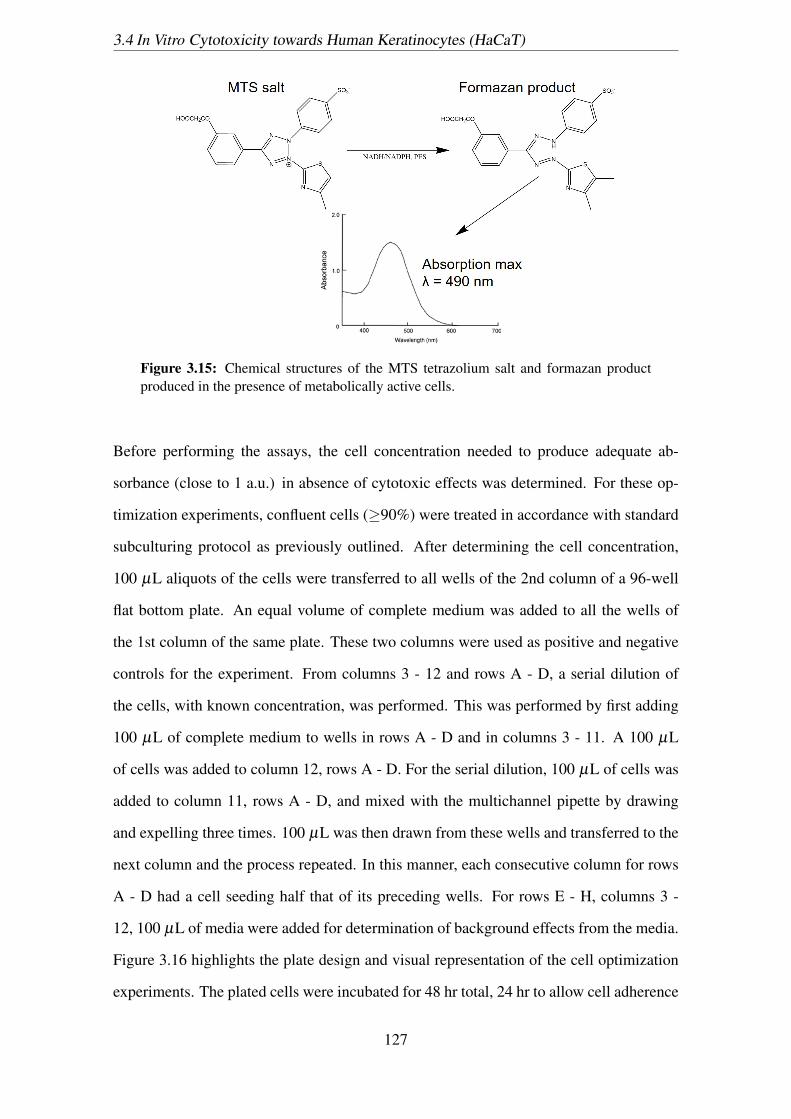
3.4 In Vitro Cytotoxicity towards Human Keratinocytes (HaCaT)
Figure 3.15: Chemical structures of the MTS tetrazolium salt and formazan productproduced in the presence of metabolically active cells.
Before performing the assays, the cell concentration needed to produce adequate ab-
sorbance (close to 1 a.u.) in absence of cytotoxic effects was determined. For these op-
timization experiments, confluent cells (≥90%) were treated in accordance with standard
subculturing protocol as previously outlined. After determining the cell concentration,
100 µL aliquots of the cells were transferred to all wells of the 2nd column of a 96-well
flat bottom plate. An equal volume of complete medium was added to all the wells of
the 1st column of the same plate. These two columns were used as positive and negative
controls for the experiment. From columns 3 - 12 and rows A - D, a serial dilution of
the cells, with known concentration, was performed. This was performed by first adding
100 µL of complete medium to wells in rows A - D and in columns 3 - 11. A 100 µL
of cells was added to column 12, rows A - D. For the serial dilution, 100 µL of cells was
added to column 11, rows A - D, and mixed with the multichannel pipette by drawing
and expelling three times. 100 µL was then drawn from these wells and transferred to the
next column and the process repeated. In this manner, each consecutive column for rows
A - D had a cell seeding half that of its preceding wells. For rows E - H, columns 3 -
12, 100 µL of media were added for determination of background effects from the media.
Figure 3.16 highlights the plate design and visual representation of the cell optimization
experiments. The plated cells were incubated for 48 hr total, 24 hr to allow cell adherence
127
3.4 In Vitro Cytotoxicity towards Human Keratinocytes (HaCaT)
and an additional 24 hr to take into account incubation with the prepared samples being
tested. Four hours prior to the end of this incubation period, 20 µL of MTS reagent was
added to each well used and incubated to the end of the 48 hr period at 37oC. During this
time, the MTS salt is converted to a coloured formazan product, with the intensity of the
colouration dependent on the number of viable cells with functioning metabolic activity.
After incubation, the plate was centrifuged at 750 × g for 10 min. Then, 80 µL of su-
pernatant was transferred to a new 96-well plate and the absorbance at λ = 490 nm read
using a SpectraMax 384 Plus microplate reader (Molecular Devices).
Figure 3.16: Experimental plate design for the cell optimization experiments.
128
3.4 In Vitro Cytotoxicity towards Human Keratinocytes (HaCaT)
3.4.3 Cytotoxicity in Absence of UV Light
The HaCaT cells were seeded at an optimal concentration, based upon the cell optimiza-
tion experiments performed in the previous section (10×103 cells well−1), in 96-well
plates and incubated at 37oC and 5% (v/v) CO2 for 24 hr. Prior to preparing the sample
suspensions for the cytotoxicity assays, the samples were decontaminated under UVC ra-
diation using the inbuilt UV function of a BSC for 20 min. After decontamination, 5 mL
of complete medium was added to 2.5 mg of sample powder, so as to yield a suspension
concentration of 500 mg L−1. The samples being tested were then sonicated for 1 hr in a
sonication bath (Branson 3800, Ultrasonics Corp.). Once sufficiently sonicated, aliquots
of media from the 96-well plates containing the seeded HaCaT cells were removed and
replaced with aliquots of the sample suspension such as to yield nanoparticle concentra-
tions of 1, 3, 10, 30, 100 and 300 mg L−1. After incubating the cells with the test samples
for 24 hr, the 96-well plate was centrifuged at 750 × g for 10 min and 80 µL of super-
natant from each well used transferred to a new 96-well plate. The absorbance was read
at 490 nm using a plate reader, as before for the cell optimization experiments. The cell
viability (as a percentage) was determined as the ratio of the net absorbance for treated
cells at a particular sample concentration to the net absorbance of the control (no sample
present). Figure 3.17 details the plate design employed for these experiments. Each as-
say was performed in triplicate for each tested nanoparticle or nanocomposite sample and
repeated in three separate experiments.
129
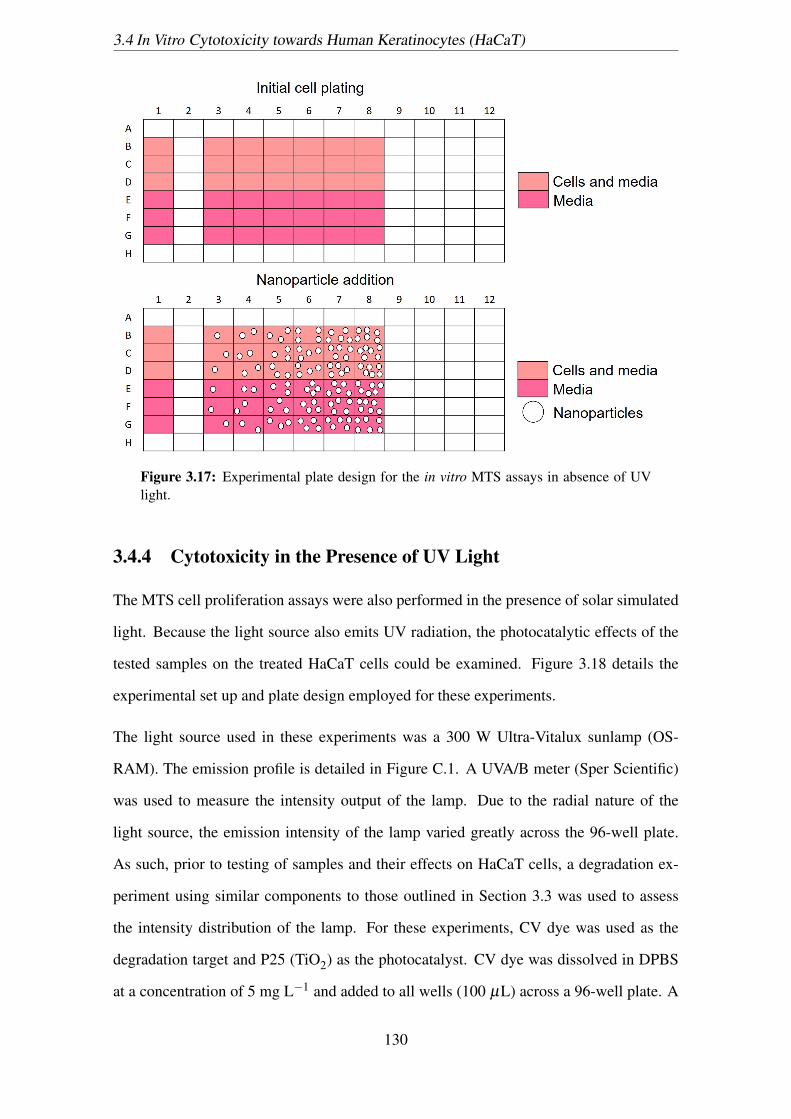
3.4 In Vitro Cytotoxicity towards Human Keratinocytes (HaCaT)
Figure 3.17: Experimental plate design for the in vitro MTS assays in absence of UVlight.
3.4.4 Cytotoxicity in the Presence of UV Light
The MTS cell proliferation assays were also performed in the presence of solar simulated
light. Because the light source also emits UV radiation, the photocatalytic effects of the
tested samples on the treated HaCaT cells could be examined. Figure 3.18 details the
experimental set up and plate design employed for these experiments.
The light source used in these experiments was a 300 W Ultra-Vitalux sunlamp (OS-
RAM). The emission profile is detailed in Figure C.1. A UVA/B meter (Sper Scientific)
was used to measure the intensity output of the lamp. Due to the radial nature of the
light source, the emission intensity of the lamp varied greatly across the 96-well plate.
As such, prior to testing of samples and their effects on HaCaT cells, a degradation ex-
periment using similar components to those outlined in Section 3.3 was used to assess
the intensity distribution of the lamp. For these experiments, CV dye was used as the
degradation target and P25 (TiO2) as the photocatalyst. CV dye was dissolved in DPBS
at a concentration of 5 mg L−1 and added to all wells (100 µL) across a 96-well plate. A
130
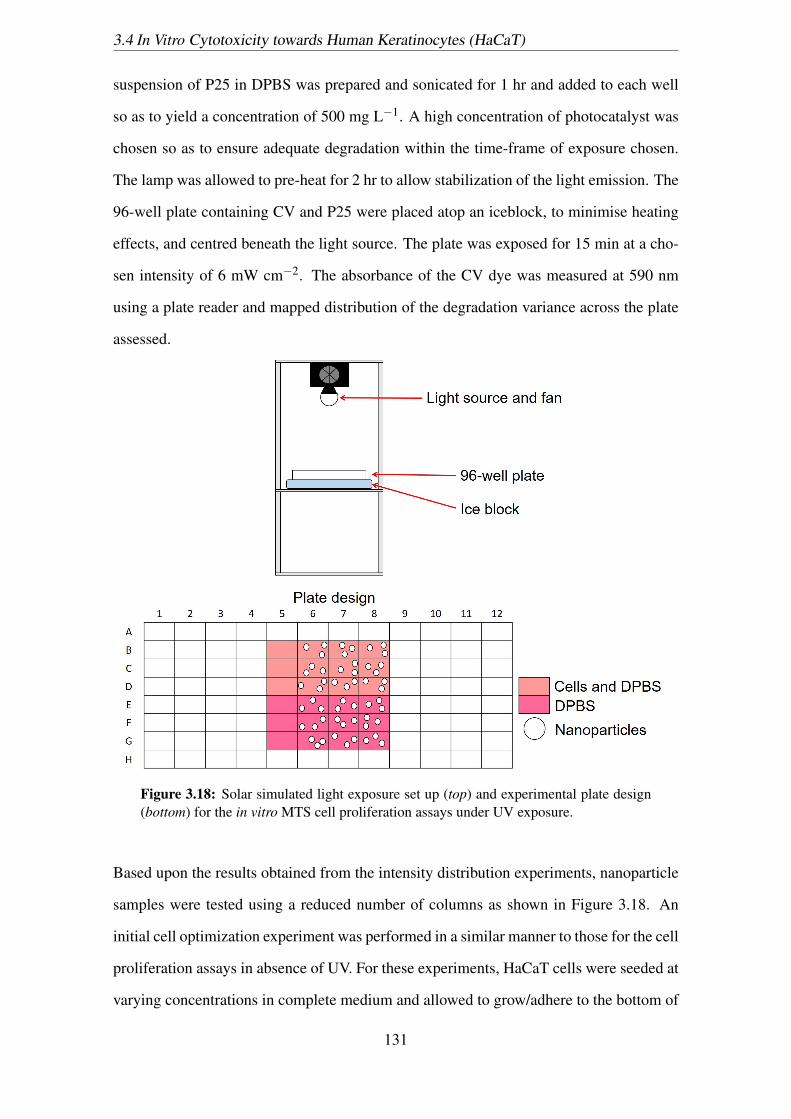
3.4 In Vitro Cytotoxicity towards Human Keratinocytes (HaCaT)
suspension of P25 in DPBS was prepared and sonicated for 1 hr and added to each well
so as to yield a concentration of 500 mg L−1. A high concentration of photocatalyst was
chosen so as to ensure adequate degradation within the time-frame of exposure chosen.
The lamp was allowed to pre-heat for 2 hr to allow stabilization of the light emission. The
96-well plate containing CV and P25 were placed atop an iceblock, to minimise heating
effects, and centred beneath the light source. The plate was exposed for 15 min at a cho-
sen intensity of 6 mW cm−2. The absorbance of the CV dye was measured at 590 nm
using a plate reader and mapped distribution of the degradation variance across the plate
assessed.
Figure 3.18: Solar simulated light exposure set up (top) and experimental plate design(bottom) for the in vitro MTS cell proliferation assays under UV exposure.
Based upon the results obtained from the intensity distribution experiments, nanoparticle
samples were tested using a reduced number of columns as shown in Figure 3.18. An
initial cell optimization experiment was performed in a similar manner to those for the cell
proliferation assays in absence of UV. For these experiments, HaCaT cells were seeded at
varying concentrations in complete medium and allowed to grow/adhere to the bottom of
131
3.4 In Vitro Cytotoxicity towards Human Keratinocytes (HaCaT)
the wells of a 96-well plate for 24 hr in an incubator (37oC and 5% (v/v)). After incubation
and prior to light exposure, the initial media used was removed and replaced with 100 µL
of DPBS. The reason for this is due to the absorptive properties of phenol red, which can
reduce the expected light output reaching the cells. In addition, phenol red free media
similarly could not be used due to its absorbance across the UV region, thus DPBS was
chosen due to its lack of absorbance (Figure C.2). Once all media containing wells had
been replaced with DPBS and allowed to incubate for 1 hr, the plate was exposed to the
simulated solar light lamp at a UVA/UVB intensity of 6 mW cm−2 for 5 or 15 min. After
the exposure period, the 100 µL of DPBS in each well was replaced with fresh phenol red
media and returned to the incubator for 24 hr. MTS reagent was again added 4 hr prior to
the conclusion of this incubation period and the absorbance read at 490 nm using a plate
reader, after centrifugation and aliquoting of 80 µL to a new plate.
For the nanoparticle treated experiments, three plates were used concurrently. A control
plate containing a column each of cells only and complete medium was prepared and
treated in the same manner as the test plates except for light exposure. The two other plates
consisted of the same number of wells and columns used for the initial cell optimization
as shown in Figure 3.18 and were treated in the same manner except for the time of
exposure (the difference being 5 and 15 min exposure periods). Cells for each plate
were seeded at a concentration based upon the cell optimization results (30×103 cells
well−1). The cells were incubated for 24 hr (at 37oC, 5% (v/v) CO2) to allow adherence
to the bottom of the wells. Sample nanoparticle suspensions were prepared in DPBS
and sonicated for 1 hr. Decontamination procedures for the samples were the same as
those used for cell proliferation assays in absence of solar simulated light. Aliquots were
removed from the test plates and replaced with volumes of the sample suspensions so
as to yield concentrations either 25, 50 or 100 mg L−1 and a total volume of 100 µL
well−1. After the addition of the nanoparticles, the plates were returned to the incubator
for 1 hr so as to allow the nanoparticles to settle and increase their interaction with the
cell layer at the bottom of each test well. Plates were then exposed to the simulated light
lamp for the time periods mentioned previously. After the exposure period, the DPBS was
132
3.4 In Vitro Cytotoxicity towards Human Keratinocytes (HaCaT)
removed and 100 µL of fresh complete medium was added to each test well. All three
plates (control and the two exposure plates) were incubated for a further 24 hr (37oC, 5%
(v/v) CeO2). After the incubation period, each plate was centrifuged at 750 × g for 10
min and 80 µL of each well used transferred to new 96-well plates. The absorbance at
490 nm was read for each plate and the cell viability (%) calculated in similar manner
to that for the non-irradiated cell proliferation experiments. In this instance however, the
control plate not exposed to the simulated light was used as the control for the calculation.
Each nanoparticle and nanocomposite tested were tested in triplicate per experiments and
three experiments performed for each concentration tested.
3.4.5 Data Representation and Statistical Analysis
Data is presented as mean± SeM. One-way ANOVA and Tukey post-hoc statistical analy-
sis was performed to assess statistical differences between the nanoparticle and nanocom-
posites samples tested using OriginPro. Statistical significance was determined at the
95% and 99% confidence levels (p < 0.05 and p < 0.01, respectively).
133
Chapter 4
Suppression of the PhotocatalyticActivity of TiO2 NanoparticlesEncapsulated by Chitosan through aSpray-Drying Method with Potential foruse in Sunblocking Applications
The following chapter describes and discusses the research reported in an article published
in the journal Powder Technology.63 Abbreviations used throughout this chapter have
been previously outlined in Section 3.1.1.
4.1 Introduction
Solar UV radiation exposure, particularly to wavelengths in the UVA (320 - 400 nm) and
UVB (290 - 320 nm) regions, is a known cause of skin cancers and has been proven to
cause DNA damage both directly and indirectly through the production of ROS and in-
duction of oxidative stress.531 The use of UV filtering products such as sunscreens is
the primary means of protection employed. These products contain organic and inorganic
compounds, which can protect the skin against UV radiation through modes of absorption,
scattering or reflection. The two mineral compounds TiO2 and ZnO are extensively used
in sunscreen products as inorganic UV filters due to their broadband protection across the
134
4.1 Introduction
UVA and UVB regions, as well as their ability to produce high SPF products. Addition-
ally, modern sunscreen products may now contain these materials as nanoparticles due to
the increased absorbance of UV radiation they display comparatively to larger particles
as a result of size quantization.43Both TiO2 and ZnO are semiconductor materials which,
when illuminated by electromagnetic radiation of energy equal to or greater than their Eg,
can result in the production of photoexcited electron (e−)/ hole (h+) pairs. In the context
of a biological system, these photoexcited species can interact with molecules adsorbed
to the surface of these particles such as H2O, a major constituent of human cells, pro-
ducing ROS, which can go on to cause cellular and potentially mutagenic damage. Some
of these ROS include OH• and O2•− radicals and are due to interfacial redox reactions
between the e−/h+ pairs and adsorbed H2O molecules. One study on the photoxidative
ability of these photocatalysts involved the investigation of various sunscreen products
containing TiO2 or ZnO and their effect when applied to steel sheets pre-painted with
highly durable coatings such as fluoropolymer coating types.53 After performing a series
of ”accelerated weathering” experiments, it was found that formulations containing these
inorganic components resulted in severe degradation of the panels in terms of gloss and
surface roughness. In addition, it was found through X-ray diffraction that, for a particular
cream, the active UV filtering TiO2 ingredient shared a similar mixed anatase/rutile crystal
structure to that of the known commercial photocatalyst TiO2 powder, P25. P25 has been
extensively studied for use in applications such as dye-sensitized solar cells, self-cleaning
glass and water purification owing to its photocatalytic nature and ability to generate
free-radicals.55, 56, 532 As such, despite the inherent benefits of nanoparticles in sunscreen
products, there has been concern as to the potential of these materials to penetrate past
the skin and to induce oxidative stress due to their known photocatalytic activity. In a
review on the safety of TiO2 and ZnO nanoparticles in sunscreens, it was concluded that
the weight of evidence suggests that these nanoparticles remain on the surface of the skin
and the outer layer of the stratum corneum, where they can only interact with non-viable
cells, however there is conclusive in vitro evidence that, whilst in the presence of UV radi-
ation, these materials bring about the production of ROS, which can potentially lead to the
135
4.1 Introduction
damaging of cells.54 In addition, studies have shown ZnO to display cytotoxicity to cells
even in the absence of UV radiation through ROS generation.533, 534 As such, there has
been an emphasis on developing and investigating alternative materials for potential use
as UV filtering additives in sunscreen products. Some potential candidates include CeO2,
Fe2O3 and SnO2.62, 512, 535 Developing methods for reducing the production of ROS and
thus reducing the photocatalytic activity of TiO2 and ZnO is an additional approach being
explored and include methods of doping with foreign elements and coating/encapsulating
with ceramic or polymeric materials. Wakefield et al synthesized manganese (Mn) doped
TiO2 nanoparticles through a sol gel method with increased UVA attenuation.484 Addi-
tionally, the free radical production was observed to be inhibited and was attributed to a
free radical scavenging effect. Commonly used coating materials include wide Eg metal
oxides, such as SiO2 and Al2O3 however, conflicting reports have shown that such com-
posites could in fact enhance the photoactivity, thus alternative materials such as poly-
mers have also been investigated.337, 536 One promising coating/encapsulating material is
the natural polymer chitosan. Chitosan is a non-toxic, biocompatible and biodegradable
polysaccharide that has gained interest for use in biomedical applications such as drug de-
livery, artificial skin and wound dressing.537–539 Studies involving chitosan as a coating
material have also been reported and have yielded promising results in the context of UV
filtration. For example, an investigation into the photocatalytic activity of chitosan/ZnO
composite nanoparticles synthesized through ionotropic gelation had been investigated
and reported to exhibit a quenching effect on the free radical production of ZnO high-
lighting its potential suitability for use as a UV filtering additive in cosmetic products,
such as sunscreens.540 Work on the development of chitosan/TiO2 composites has also
been reported but such findings generally involve chitosan as a form of scaffolding for the
TiO2 particles for use in applications such as tissue engineering and ultrafiltration.538, 541
One reported wet chemical approach resulted in the development of TiO2 coated chitosan
particles with enhanced photocatalytic activity, relative to bare TiO2, for use in antimi-
crobial and photocatalytic applications, with the lack of photocatalytic inhibition being
due to the significant presence of surface TiO2 particles.542 In the context of safe UV
136
4.2 Results and Discussion
filters, the desired outcome involves the reversal of this process through minimization of
photocatalytic active TiO2 by encapsulation with chitosan polymer. Therefore, we report
an alternate method to previous publications for the synthesis of a novel composite ma-
terial based upon TiO2 nanoparticles encapsulated by a cross-linked chitosan coating via
an aqueous spray drying method.453, 542, 543 In this study, nanocomposite chitosan/TiO2
particles were processed in a single step and an investigation into the optical, thermal and
morphological properties of the composite materials was carried out. Additionally, the ef-
fect of chitosan as a coating on the photocatalytic activity of the TiO2 core nanoparticles
was assessed through the photodegradation of an organic dye, crystal violet (CV), in the
presence of the synthesized materials.
4.2 Results and Discussion
4.2.1 SEM/TEM Microanalysis of Particle Size and Morphology
SEM/TEM micrographs of the chitosan/TiO2 composites were obtained so as to ascertain
the morphological profile of the spray dried particles and to assess the loading effects
on the particle sizes obtained and the effectiveness of the encapsulation process. As ev-
idenced from SEM (Figure 4.1) and TEM (Figure 4.2), the TiO2 loading amount has an
impact on the particle morphology and particle sizes of the spray-dried composite parti-
cles. In absence of the TiO2 nanoparticles, the CHI particles formed are spherical and
symmetric in shape but relatively inhomogeneous in size. With the incorporation of the
TiO2 nanoparticles, it is evident there is an increase in the size of the composite particles
formed and, whilst still primarily spherical, the surfaces of the particles appear deformed
and rough due to the presence of TiO2 decorating the outer layer of the polymer shell.
This surface roughness is much more evident in the case of the 1:1 CHI/TiO2 sample due
to the higher ceramic particle loading, relative to the 2:1 CHI/TiO2 sample.
137
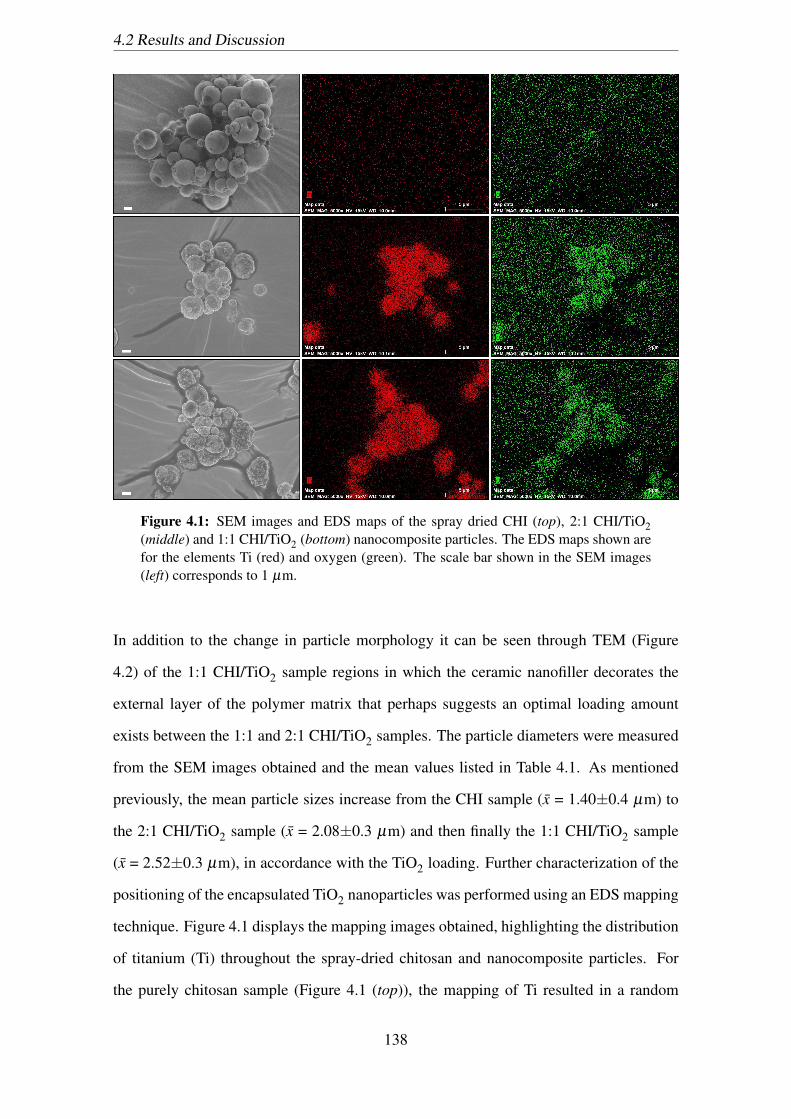
4.2 Results and Discussion
Figure 4.1: SEM images and EDS maps of the spray dried CHI (top), 2:1 CHI/TiO2(middle) and 1:1 CHI/TiO2 (bottom) nanocomposite particles. The EDS maps shown arefor the elements Ti (red) and oxygen (green). The scale bar shown in the SEM images(left) corresponds to 1 µm.
In addition to the change in particle morphology it can be seen through TEM (Figure
4.2) of the 1:1 CHI/TiO2 sample regions in which the ceramic nanofiller decorates the
external layer of the polymer matrix that perhaps suggests an optimal loading amount
exists between the 1:1 and 2:1 CHI/TiO2 samples. The particle diameters were measured
from the SEM images obtained and the mean values listed in Table 4.1. As mentioned
previously, the mean particle sizes increase from the CHI sample (x = 1.40±0.4 µm) to
the 2:1 CHI/TiO2 sample (x = 2.08±0.3 µm) and then finally the 1:1 CHI/TiO2 sample
(x = 2.52±0.3 µm), in accordance with the TiO2 loading. Further characterization of the
positioning of the encapsulated TiO2 nanoparticles was performed using an EDS mapping
technique. Figure 4.1 displays the mapping images obtained, highlighting the distribution
of titanium (Ti) throughout the spray-dried chitosan and nanocomposite particles. For
the purely chitosan sample (Figure 4.1 (top)), the mapping of Ti resulted in a random
138
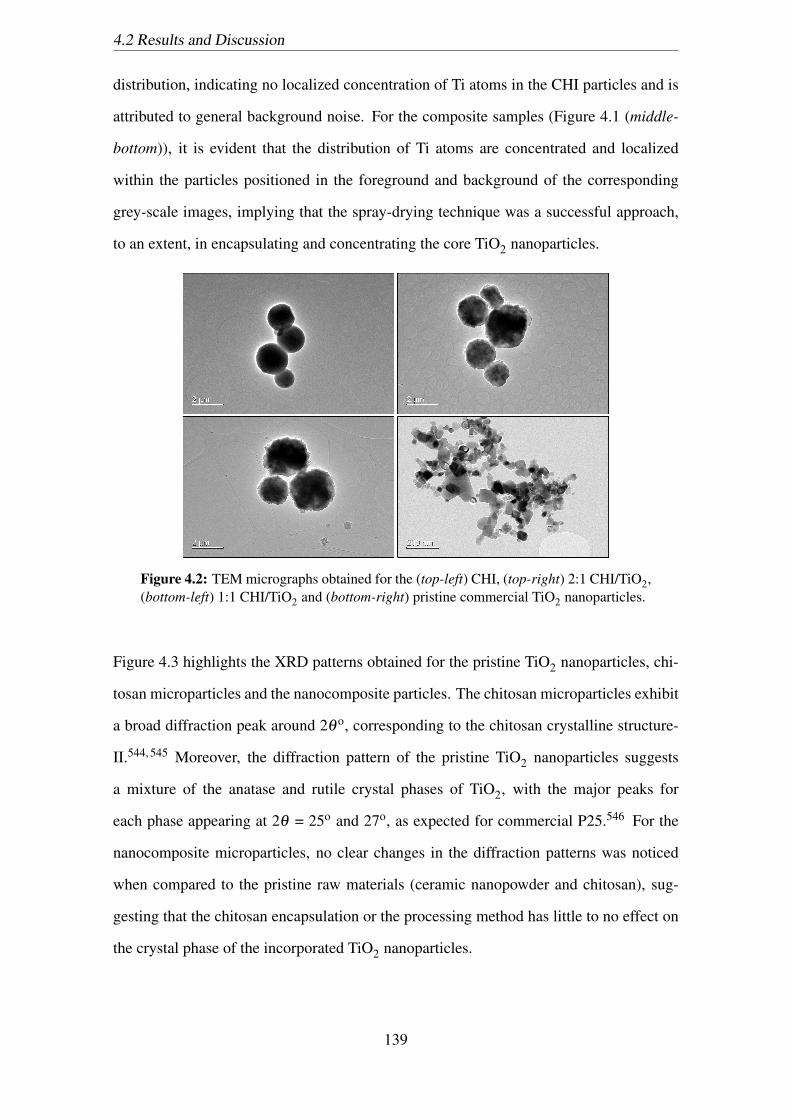
4.2 Results and Discussion
distribution, indicating no localized concentration of Ti atoms in the CHI particles and is
attributed to general background noise. For the composite samples (Figure 4.1 (middle-
bottom)), it is evident that the distribution of Ti atoms are concentrated and localized
within the particles positioned in the foreground and background of the corresponding
grey-scale images, implying that the spray-drying technique was a successful approach,
to an extent, in encapsulating and concentrating the core TiO2 nanoparticles.
Figure 4.2: TEM micrographs obtained for the (top-left) CHI, (top-right) 2:1 CHI/TiO2,(bottom-left) 1:1 CHI/TiO2 and (bottom-right) pristine commercial TiO2 nanoparticles.
Figure 4.3 highlights the XRD patterns obtained for the pristine TiO2 nanoparticles, chi-
tosan microparticles and the nanocomposite particles. The chitosan microparticles exhibit
a broad diffraction peak around 2θ o, corresponding to the chitosan crystalline structure-
II.544, 545 Moreover, the diffraction pattern of the pristine TiO2 nanoparticles suggests
a mixture of the anatase and rutile crystal phases of TiO2, with the major peaks for
each phase appearing at 2θ = 25o and 27o, as expected for commercial P25.546 For the
nanocomposite microparticles, no clear changes in the diffraction patterns was noticed
when compared to the pristine raw materials (ceramic nanopowder and chitosan), sug-
gesting that the chitosan encapsulation or the processing method has little to no effect on
the crystal phase of the incorporated TiO2 nanoparticles.
139
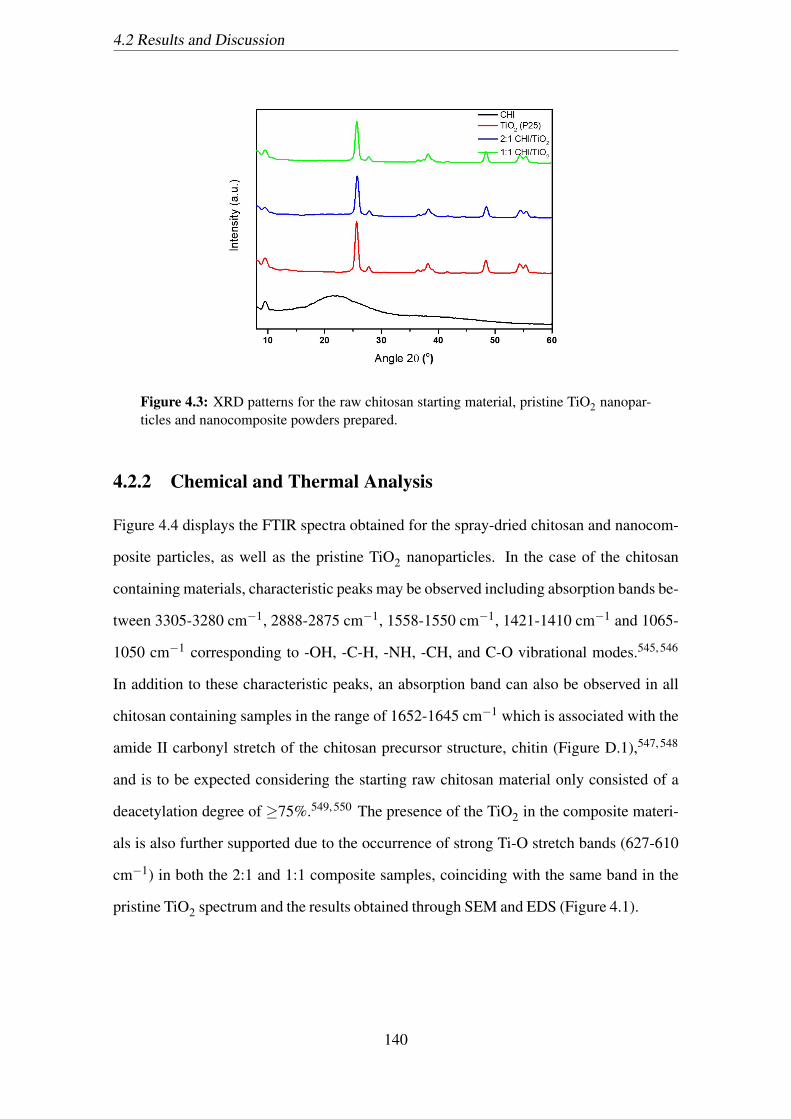
4.2 Results and Discussion
Figure 4.3: XRD patterns for the raw chitosan starting material, pristine TiO2 nanopar-ticles and nanocomposite powders prepared.
4.2.2 Chemical and Thermal Analysis
Figure 4.4 displays the FTIR spectra obtained for the spray-dried chitosan and nanocom-
posite particles, as well as the pristine TiO2 nanoparticles. In the case of the chitosan
containing materials, characteristic peaks may be observed including absorption bands be-
tween 3305-3280 cm−1, 2888-2875 cm−1, 1558-1550 cm−1, 1421-1410 cm−1 and 1065-
1050 cm−1 corresponding to -OH, -C-H, -NH, -CH, and C-O vibrational modes.545, 546
In addition to these characteristic peaks, an absorption band can also be observed in all
chitosan containing samples in the range of 1652-1645 cm−1 which is associated with the
amide II carbonyl stretch of the chitosan precursor structure, chitin (Figure D.1),547, 548
and is to be expected considering the starting raw chitosan material only consisted of a
deacetylation degree of ≥75%.549, 550 The presence of the TiO2 in the composite materi-
als is also further supported due to the occurrence of strong Ti-O stretch bands (627-610
cm−1) in both the 2:1 and 1:1 composite samples, coinciding with the same band in the
pristine TiO2 spectrum and the results obtained through SEM and EDS (Figure 4.1).
140

4.2 Results and Discussion
Figure 4.4: FTIR spectra for the pristine TiO2 (P25) nanoparticles as well as the spray-dried CHI, 1:1 CHI/TiO2 and 2:1 CHI/TiO2 particles.
Figure 4.5 (top-left) highlights the TGA curves obtained for the chitosan and composite
samples heated at a rate of 20oC min−1. In the case of the CHI sample, three main weight
loss steps can be observed. The first occurs between 40oC - 110oC, corresponding to a
weight loss of 5.5% and is attributed to the loss of adsorbed water, due to the hydrophilic
nature of chitosan. The second step occurs between 220oC - 350oC, from which a further
loss of 40.5% is observed. This weight loss is often attributed to the random splitting of
the chitosan polysaccharide structure during decomposition and the removal of degrada-
tion by-products such as acetic, butyric and low mass fatty acids.547, 548 The final stage,
occurring between 350oC - 750oC, arises from the presence of residual cross-linked chi-
tosan chains and is connected with the remaining sample weight loss (45.6%), leaving a
residual mass of 8.4%.551 The onset of degradation (Tonset) for the 2:1 (228oC) and 1:1
(236oC) CHI/TiO2 samples occurs earlier than that of the CHI sample (269oC) suggesting
incorporation of the inorganic TiO2 nanoparticles leads to a decrease in thermal stability,
contrary to previously reported findings, but can be attributed to the thermal conductivity
of the ceramic TiO2 nanoparticles, resulting in an enhancement in the rate of heating of the
polymeric components of the nanocomposite particles.552 As with the CHI sample, the
second degradation stage, corresponding to the decomposition of cross-linked chitosan
141
4.2 Results and Discussion
chains, also appears in the nanocomposite samples. Additionally, the decomposition of
the chitosan component of the nanocomposite samples appears to end at a lower temper-
ature (585oC) than that of the purely chitosan sample (725oC), further highlighting the
reduced thermal stability of the nanocomposite materials. The activation energy (Ea) for
the onset of decomposition for the spray-dried chitosan and nanocomposite samples were
calculated using the Kissinger mathematical method:
ln(β
T 2p) =
ln(AEa)
R+ ln[n(1−αp)
1−n]− Ea
RTp(4.1)
where A is the pre-exponential factor (min−1), R the ideal gas constant (8.31 J mol−1
K−1), β the heating rate and α p and T p the degree of conversion and temperature at
the maximum weight loss.553 From the plot of ln(β /T2p) against 1/T p, at heating rates
between 10oC min−1 and 25oC min−1, the Ea can be calculated from the slope of the line
produced (Figure 4.5 (bottom-left)). The values obtained for the spray-dried chitosan and
composite samples are listed in Table 4.1 and correlate with the initial onset of degradation
for the spray-dried samples, in that, the CHI sample displays the highest degree of thermal
stability (Ea = 183 kJ mol−1) followed by the 1:1 (Ea = 119 kJ mol−1) and the 2:1 (Ea
= 95 kJ mol−1) CHI/TiO2 samples. The loading ratios for the composite particles were
also estimated from the 20oC min−1 TGA curves obtained by subtracting the residual
mass percentage of the purely chitosan sample from those of the composite samples.
In this way, the percentage of TiO2 in the composite samples were determined to be
32% (2:1 CHI/TiO2) and 47% (1:1 CHI/TiO2), which agree well with the desired loading
amounts.
142
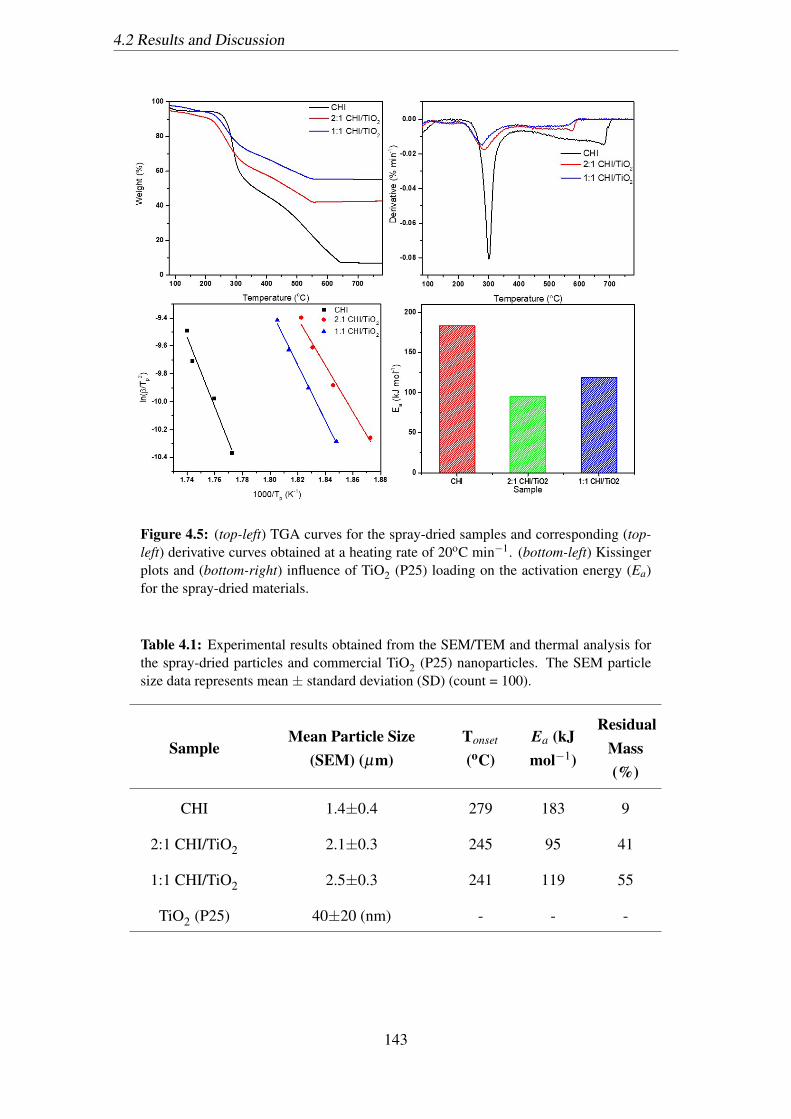
4.2 Results and Discussion
Figure 4.5: (top-left) TGA curves for the spray-dried samples and corresponding (top-left) derivative curves obtained at a heating rate of 20oC min−1. (bottom-left) Kissingerplots and (bottom-right) influence of TiO2 (P25) loading on the activation energy (Ea)for the spray-dried materials.
Table 4.1: Experimental results obtained from the SEM/TEM and thermal analysis forthe spray-dried particles and commercial TiO2 (P25) nanoparticles. The SEM particlesize data represents mean ± standard deviation (SD) (count = 100).
SampleMean Particle Size
(SEM) (µm)Tonset
(oC)Ea (kJmol−1)
ResidualMass(%)
CHI 1.4±0.4 279 183 9
2:1 CHI/TiO2 2.1±0.3 245 95 41
1:1 CHI/TiO2 2.5±0.3 241 119 55
TiO2 (P25) 40±20 (nm) - - -
143

4.2 Results and Discussion
4.2.3 Optical Absorbance and Photocatalytic Activity
Diffuse reflectance spectra were obtained so as to ascertain the effect of the chitosan on
the optical properties of the encapsulated TiO2 nanoparticles. Figure 4.6 (left) highlights
the absorption spectra obtained for the nanocomposite particles as well as the purely chi-
tosan particles and pristine TiO2 nanoparticles. In the case of the TiO2 nanoparticles, the
absorption edge for the material begins at 405 nm and peaks at 310 nm, corresponding
to the UVB region, as has been previously reported.554 For the CHI sample, the primary
absorption band is observed in the UV region and peaks at 305 nm, however, steady ab-
sorption is observed across the visible light region, with smaller absorption peaks seen
at 445 nm, 525 nm and 665 nm. The absorption features seen at 305 nm, 445 nm and
525 nm could be attributed to electronic transitions occurring from σ → σ∗and π → π∗
molecular orbitals owing to the mixture of sp3 and sp2 hybridized bonds present as a
result of the less than 100% deacetylation degree of the chitosan.555 Transitions occur-
ring from non-bonding (n) orbitals may also arise due to the presence of atoms such as
oxygen and nitrogen in the chitosan structure that have lone pairs of electrons capable of
undergoing such transitions, and could explain the appearance of the absorption peak at
665 nm as being a n→ π∗ transition.556, 557 In the case of the nanocomposite materials,
we can see that the UV absorption edges appear red-shifted compared to the pristine TiO2
nanoparticles, with broad absorption bands peaking between 320-325 nm, within the UVA
region. In addition to the shift into the UVA region, translation of pure chitosan visible
light absorption features can also be observed, with the features being more prominent in
the case of the 2:1 CHI/TiO2 sample due to the higher concentration of chitosan present.
Despite the non-white appearance of the composite powders, the pale yellow/brown ap-
pearance brought about by the chitosan absorption features could still be quite appealing
in cosmetic cream formulations due to the closer appearance to skin tones.
144
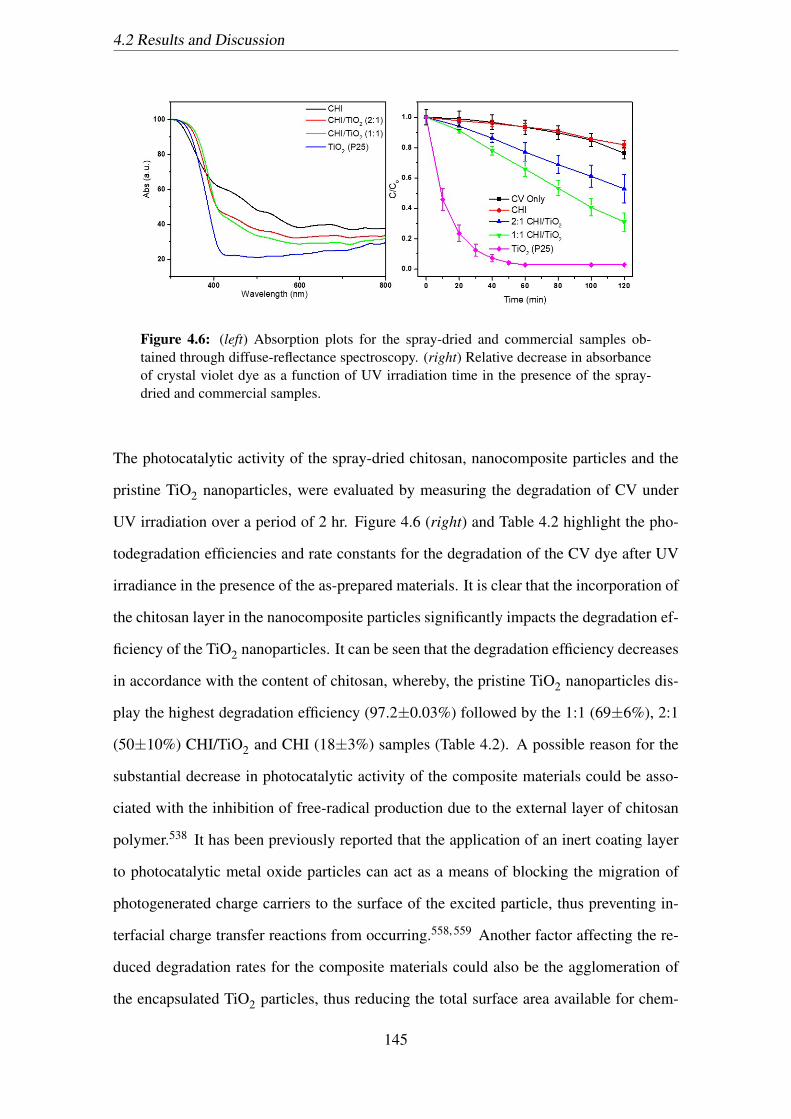
4.2 Results and Discussion
Figure 4.6: (left) Absorption plots for the spray-dried and commercial samples ob-tained through diffuse-reflectance spectroscopy. (right) Relative decrease in absorbanceof crystal violet dye as a function of UV irradiation time in the presence of the spray-dried and commercial samples.
The photocatalytic activity of the spray-dried chitosan, nanocomposite particles and the
pristine TiO2 nanoparticles, were evaluated by measuring the degradation of CV under
UV irradiation over a period of 2 hr. Figure 4.6 (right) and Table 4.2 highlight the pho-
todegradation efficiencies and rate constants for the degradation of the CV dye after UV
irradiance in the presence of the as-prepared materials. It is clear that the incorporation of
the chitosan layer in the nanocomposite particles significantly impacts the degradation ef-
ficiency of the TiO2 nanoparticles. It can be seen that the degradation efficiency decreases
in accordance with the content of chitosan, whereby, the pristine TiO2 nanoparticles dis-
play the highest degradation efficiency (97.2±0.03%) followed by the 1:1 (69±6%), 2:1
(50±10%) CHI/TiO2 and CHI (18±3%) samples (Table 4.2). A possible reason for the
substantial decrease in photocatalytic activity of the composite materials could be asso-
ciated with the inhibition of free-radical production due to the external layer of chitosan
polymer.538 It has been previously reported that the application of an inert coating layer
to photocatalytic metal oxide particles can act as a means of blocking the migration of
photogenerated charge carriers to the surface of the excited particle, thus preventing in-
terfacial charge transfer reactions from occurring.558, 559 Another factor affecting the re-
duced degradation rates for the composite materials could also be the agglomeration of
the encapsulated TiO2 particles, thus reducing the total surface area available for chem-
145
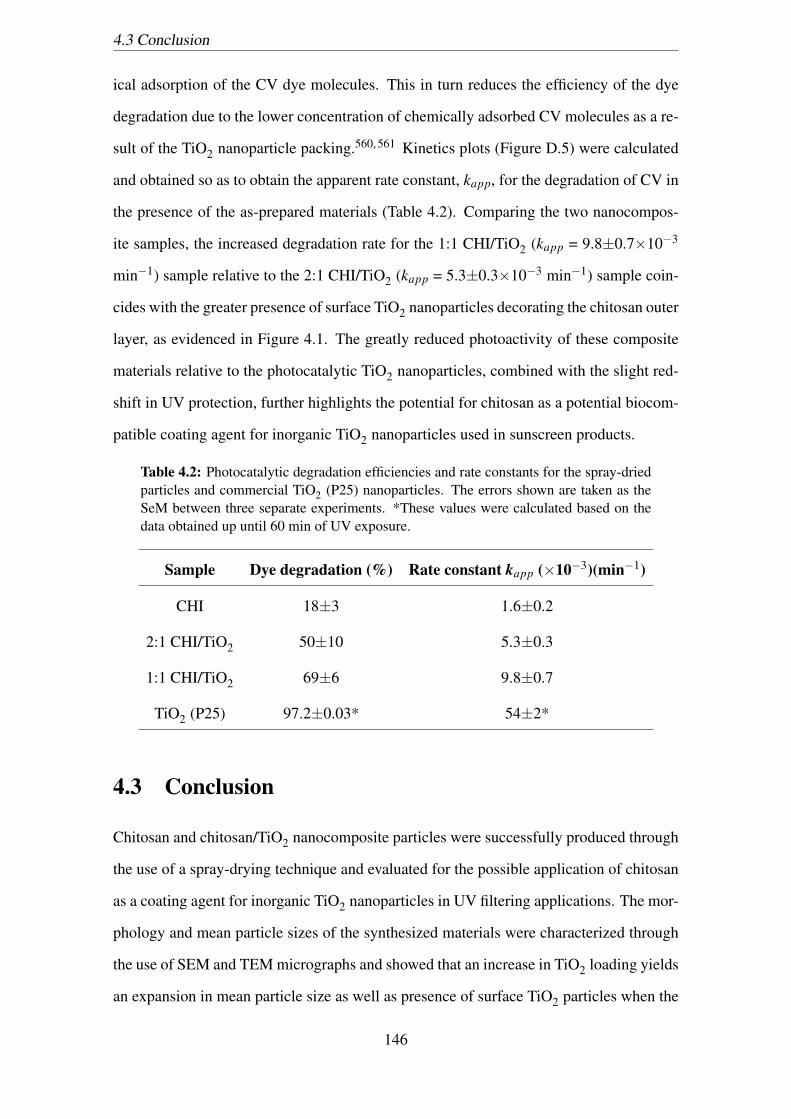
4.3 Conclusion
ical adsorption of the CV dye molecules. This in turn reduces the efficiency of the dye
degradation due to the lower concentration of chemically adsorbed CV molecules as a re-
sult of the TiO2 nanoparticle packing.560, 561 Kinetics plots (Figure D.5) were calculated
and obtained so as to obtain the apparent rate constant, kapp, for the degradation of CV in
the presence of the as-prepared materials (Table 4.2). Comparing the two nanocompos-
ite samples, the increased degradation rate for the 1:1 CHI/TiO2 (kapp = 9.8±0.7×10⁻³
min−1) sample relative to the 2:1 CHI/TiO2 (kapp = 5.3±0.3×10⁻³ min−1) sample coin-
cides with the greater presence of surface TiO2 nanoparticles decorating the chitosan outer
layer, as evidenced in Figure 4.1. The greatly reduced photoactivity of these composite
materials relative to the photocatalytic TiO2 nanoparticles, combined with the slight red-
shift in UV protection, further highlights the potential for chitosan as a potential biocom-
patible coating agent for inorganic TiO2 nanoparticles used in sunscreen products.
Table 4.2: Photocatalytic degradation efficiencies and rate constants for the spray-driedparticles and commercial TiO2 (P25) nanoparticles. The errors shown are taken as theSeM between three separate experiments. *These values were calculated based on thedata obtained up until 60 min of UV exposure.
Sample Dye degradation (%) Rate constant kapp (×10−3)(min−1)
CHI 18±3 1.6±0.2
2:1 CHI/TiO2 50±10 5.3±0.3
1:1 CHI/TiO2 69±6 9.8±0.7
TiO2 (P25) 97.2±0.03* 54±2*
4.3 Conclusion
Chitosan and chitosan/TiO2 nanocomposite particles were successfully produced through
the use of a spray-drying technique and evaluated for the possible application of chitosan
as a coating agent for inorganic TiO2 nanoparticles in UV filtering applications. The mor-
phology and mean particle sizes of the synthesized materials were characterized through
the use of SEM and TEM micrographs and showed that an increase in TiO2 loading yields
an expansion in mean particle size as well as presence of surface TiO2 particles when the
146

4.3 Conclusion
loading exceeds the capacitive amount for the spray-dried chitosan particles. The ther-
mal properties of the chitosan and composite samples were analysed using TGA/DTA
methods and showed that the thermal stability of the composites was decreased relative
to that of the purely chitosan sample, whilst FTIR analysis displayed absorption peaks
corresponding to characteristic chitosan and TiO2 vibrational modes in the case of the
composite particles. Diffuse reflectance spectra for the synthesized materials and pristine
TiO2 nanoparticles were obtained and showed that the primary UV absorbance band in
the composite samples was slightly red-shifted into the UVA region whilst also displaying
additional, smaller, visible light region absorption peaks as a result of the chitosan coating
leading to a pale-yellow tone for the composite powders. The photocatalytic activity of
the spray-dried materials were evaluated and the activity of the composite chitosan/TiO2
particles was found to be significantly reduced in comparison to that of the unbound TiO2
nanoparticles, highlighting the potential for this chitosan coating process for use in the
industrial manufacturing of inorganic TiO2 containing sunscreen products.
147
Chapter 5
Development of CeO2 NanodotEncrusted TiO2 Nanoparticles withReduced Photocatalytic Activity andIncreased Biocompatibility towards theHuman Keratinocyte Cell Line
The following chapter describes and discusses the research reported in an article published
in the Journal of Materials Chemistry B.562 Abbreviations used throughout this chapter
have been previously outlined in Section 3.1.2.
5.1 Introduction
The detrimental effects of extensive solar ultraviolet (UV) exposure have long been known
and include erythema (sunburn), pre-mature skin aging and skin cancer.304, 563, 564 To
counteract such adverse effects, the application of sunscreen products containing active
UV filtering ingredients is a common means of protection. Such products may contain
a combination of inorganic and organic compounds that provide protection through pro-
cesses of absorption, scattering and reflection of incident UV radiation.243 Of the inor-
ganic compounds, the mineral compounds of TiO2 and ZnO are most regularly used. Ini-
tially incorporated into formulations as pigmentary grade particles, recent developments
148

5.1 Introduction
in technology has led to the increased use of nanoparticle materials in the nanoscale size
range of 20-50 nm. This in turn has provided sunscreen products with the ability to pro-
vide enhanced UV protection, as well as increased cosmetic acceptability of such products
by offering transparency in the visible light region.43 Despite concerns over the potential
penetrative ability of these nanoparticles, various dermal penetration studies have con-
cluded that these particles, when in the region of 20-50 nm in size, do not penetrate past
the stratum corneum nor reach viable skin cells.44, 565–567 There is, however, conclusive in
vitro evidence that shows these materials, as nanoparticles, can impart cytotoxic and geno-
toxic effects on human cell lines, particularly when exposed to UV radiation.372, 380, 568
When excited by UV radiation these materials may instigate the production of free radi-
cal species, such as ROS, through the generation of e−/h+ pairs. Particularly in the case
of TiO2, a well-known and thoroughly used photocatalyst in applications such as dye-
sensitized solar cells and water splitting, such photocatalytic ability can severely impact
the photoprotective ability and length of protection provided by sunscreen products due
to potential photodegradation of other organic UV filtering ingredients.304, 569–571 The
production of ROS species can also induce states of oxidative stress in cells if internal-
ized, leading to potential mutagenic effects and premature cell death.572, 573 To counteract
these issues, sunscreen manufacturers may incorporate antioxidant compounds or apply
inert coatings to the inorganic UV filtering nanoparticles as a means of scavenging and/or
minimizing any free radicals produced and potential interactions with other UV filtering
ingredients. The issues with these strategies, however, are that the antioxidant compounds
used are typically organic, which could increase the probability for an allergic reaction to
occur when applied to sensitive skin, whilst coating of TiO2 with materials such as SiO2
and Al2O3 does not necessarily enhance the efficacy of the overall formulation. For in-
stance, various studies have investigated the benefit of applying a silicon-based coating to
the surface of photoactive TiO2 nanoparticles, with the subsequent photocatalytic activity
appearing to be reduced.574–576 Despite this reduction, excessive coating can lead to a
decrease in the UV absorptive ability of the core TiO2 particles, thus being detrimental to
the overall effectiveness of its use in sunscreen products.60 Because of the above, there
149
5.1 Introduction
is still critical need to develop methods or materials that suppress or completely mitigate
the photocatalytic ability of these photoactive nanoparticles whilst also simultaneously
maintaining or improving the UV attenuation and photostability of the subsequent sun-
screen formulation, ideally through some form of free radical scavenging process. Min-
imisation or removal of the cytotoxicity and phototoxic potential of these sunscreen-based
materials is also an essential component of increasing consumer safety.577 A promising
candidate material that could act as both part coating and antioxidant are CeO2 nanopar-
ticles. CeO2 nanoparticles have been investigated previously specifically for potential use
as a UV filter in sunscreen products in part due to its UV absorbing ability, as a result
of its wide band gap (3.19 eV).492 It has also been shown to display free-radical scav-
enging properties owing to its potential to cycle between the Ce3+/Ce4+ oxidation states
through redox mediated processes.535, 578 In vitro studies involving human cell lines have
also shown that CeO2 imparts relatively low cytotoxic responses and minimal intracellular
ROS production, further evidencing its potential in biological oriented applications.579–581
It has also been shown through biological studies to act as a photo-protectant, specifically
against UVA.582 Composites of CeO2 with TiO2 have been previously investigated, pri-
marily for use in applications such as visible-light driven photocatalyst583, 584 and typi-
cally involve the formation of core-shell or doped structures.585–588 However, there are
limited reports of this composite material for targeted use in UV filtering applications.
One reported study though incorporates CeO2 as a partial coating for Fe2O3 nanoparti-
cles which yielded composite materials displaying improved UV absorbance selectivity
and reduced photocatalytic activity through free-radical scavenging.62 In this manner, the
current Chapter presents a material based upon TiO2 nanoparticles encrusted with CeO2
nanodots for the purpose of minimizing free-radical production of the core TiO2 nanopar-
ticles upon UV radiation exposure whilst also maintaining UV attenuating efficiency and
reducing any potential cytotoxic and phototoxic effects on the HaCaT human keratinocyte
cell line.
150
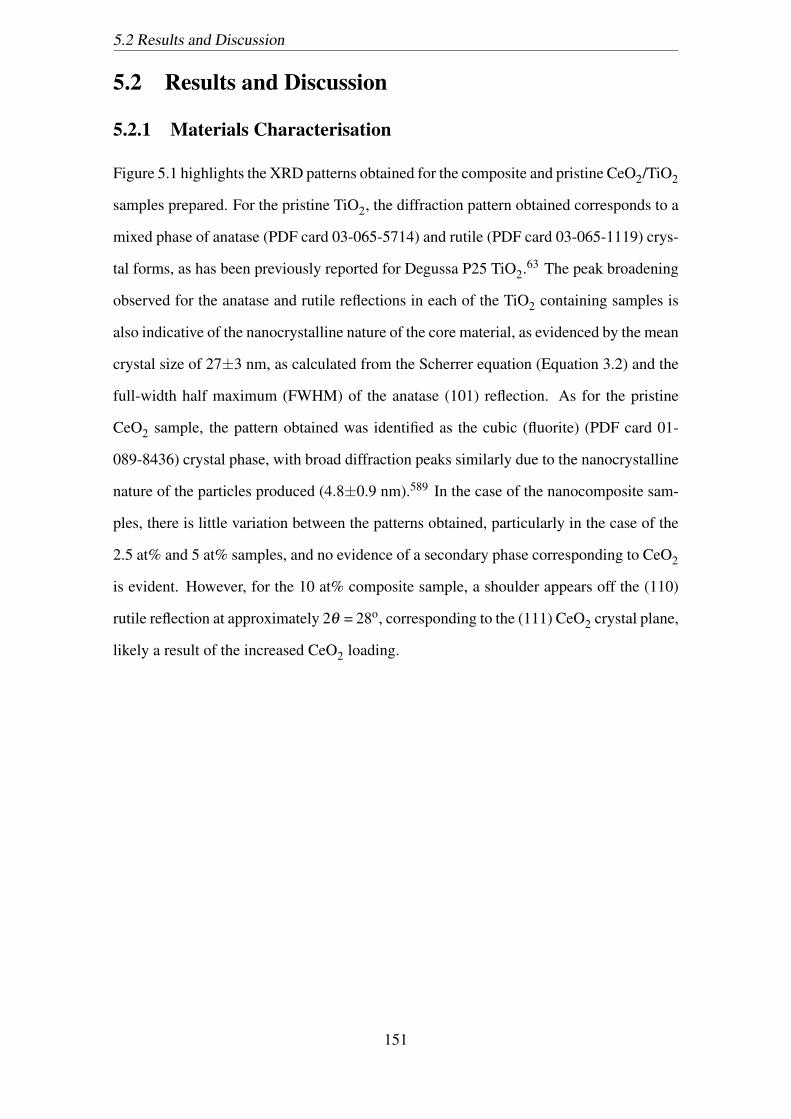
5.2 Results and Discussion
5.2 Results and Discussion
5.2.1 Materials Characterisation
Figure 5.1 highlights the XRD patterns obtained for the composite and pristine CeO2/TiO2
samples prepared. For the pristine TiO2, the diffraction pattern obtained corresponds to a
mixed phase of anatase (PDF card 03-065-5714) and rutile (PDF card 03-065-1119) crys-
tal forms, as has been previously reported for Degussa P25 TiO2.63 The peak broadening
observed for the anatase and rutile reflections in each of the TiO2 containing samples is
also indicative of the nanocrystalline nature of the core material, as evidenced by the mean
crystal size of 27±3 nm, as calculated from the Scherrer equation (Equation 3.2) and the
full-width half maximum (FWHM) of the anatase (101) reflection. As for the pristine
CeO2 sample, the pattern obtained was identified as the cubic (fluorite) (PDF card 01-
089-8436) crystal phase, with broad diffraction peaks similarly due to the nanocrystalline
nature of the particles produced (4.8±0.9 nm).589 In the case of the nanocomposite sam-
ples, there is little variation between the patterns obtained, particularly in the case of the
2.5 at% and 5 at% samples, and no evidence of a secondary phase corresponding to CeO2
is evident. However, for the 10 at% composite sample, a shoulder appears off the (110)
rutile reflection at approximately 2θ = 28o, corresponding to the (111) CeO2 crystal plane,
likely a result of the increased CeO2 loading.
151
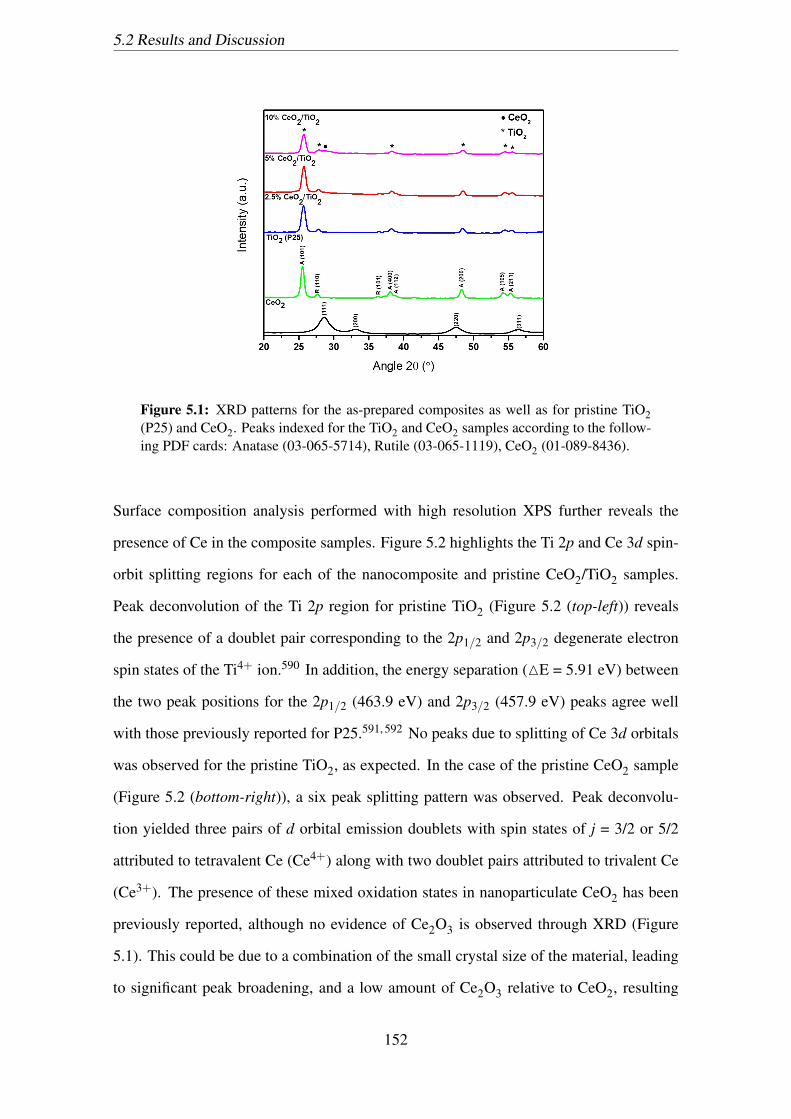
5.2 Results and Discussion
Figure 5.1: XRD patterns for the as-prepared composites as well as for pristine TiO2(P25) and CeO2. Peaks indexed for the TiO2 and CeO2 samples according to the follow-ing PDF cards: Anatase (03-065-5714), Rutile (03-065-1119), CeO2 (01-089-8436).
Surface composition analysis performed with high resolution XPS further reveals the
presence of Ce in the composite samples. Figure 5.2 highlights the Ti 2p and Ce 3d spin-
orbit splitting regions for each of the nanocomposite and pristine CeO2/TiO2 samples.
Peak deconvolution of the Ti 2p region for pristine TiO2 (Figure 5.2 (top-left)) reveals
the presence of a doublet pair corresponding to the 2p1/2 and 2p3/2 degenerate electron
spin states of the Ti4+ ion.590 In addition, the energy separation (ME = 5.91 eV) between
the two peak positions for the 2p1/2 (463.9 eV) and 2p3/2 (457.9 eV) peaks agree well
with those previously reported for P25.591, 592 No peaks due to splitting of Ce 3d orbitals
was observed for the pristine TiO2, as expected. In the case of the pristine CeO2 sample
(Figure 5.2 (bottom-right)), a six peak splitting pattern was observed. Peak deconvolu-
tion yielded three pairs of d orbital emission doublets with spin states of j = 3/2 or 5/2
attributed to tetravalent Ce (Ce4+) along with two doublet pairs attributed to trivalent Ce
(Ce3+). The presence of these mixed oxidation states in nanoparticulate CeO2 has been
previously reported, although no evidence of Ce2O3 is observed through XRD (Figure
5.1). This could be due to a combination of the small crystal size of the material, leading
to significant peak broadening, and a low amount of Ce2O3 relative to CeO2, resulting
152
5.2 Results and Discussion
in a masking of the Ce2O3 contributions to the XRD pattern.593, 594 As is expected, no
evidence of Ti is observed in the pristine CeO2 sample.
Figure 5.2: Narrow XPS spectra and fitted peaks of the Ti 2p (left) and Ce 3d (right)regions for the (top) pristine TiO2 and (bottom) pristine CeO2. Each spectra includeslines for the raw data, fitted peaks and envelope for each peak fit (excluding spectrawhere no peaks were observed).
XPS spectra of the nanocomposite samples highlight peaks from both the Ti 2p and Ce
3d orbitals of TiO2 and CeO2 (Figure 5.3). In addition, the intensity of both the Ti 2p and
Ce 3d peaks vary according to the loading of CeO2. As the loading of CeO2 increases,
the intensity of the Ce 3d peaks increases whilst, conversely, the Ti 2p peak intensities
decrease accordingly. Furthermore, it is evident in the 10 at% CeO2/TiO2 XPS spectra that
Ce is present as a mixture of the 3+/4+ oxidation state. Although deconvolution yielding
peaks due to Ce3+ spin states become less clear in the 2.5 at% and 5 at% nanocomposite
samples, considering that the synthesis method employed for preparing the composites
relative to the pristine CeO2 is the same, it can be inferred that the Ce present in these
153
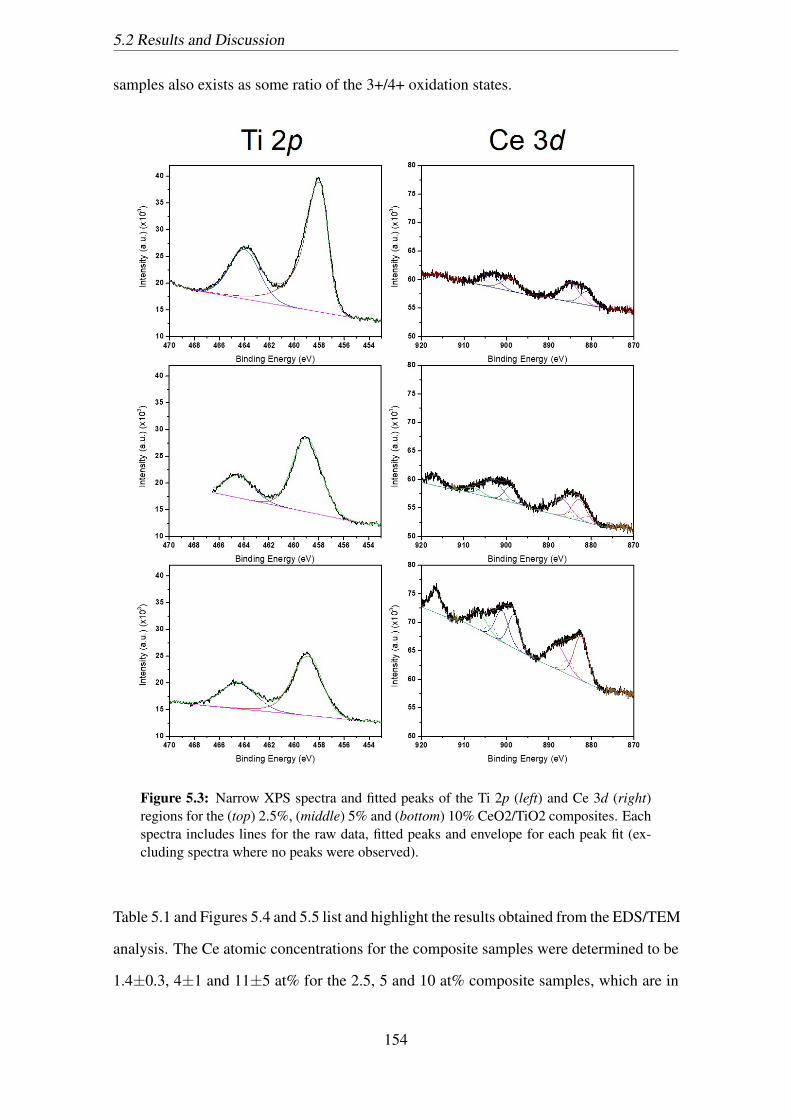
5.2 Results and Discussion
samples also exists as some ratio of the 3+/4+ oxidation states.
Figure 5.3: Narrow XPS spectra and fitted peaks of the Ti 2p (left) and Ce 3d (right)regions for the (top) 2.5%, (middle) 5% and (bottom) 10% CeO2/TiO2 composites. Eachspectra includes lines for the raw data, fitted peaks and envelope for each peak fit (ex-cluding spectra where no peaks were observed).
Table 5.1 and Figures 5.4 and 5.5 list and highlight the results obtained from the EDS/TEM
analysis. The Ce atomic concentrations for the composite samples were determined to be
1.4±0.3, 4±1 and 11±5 at% for the 2.5, 5 and 10 at% composite samples, which are in
154
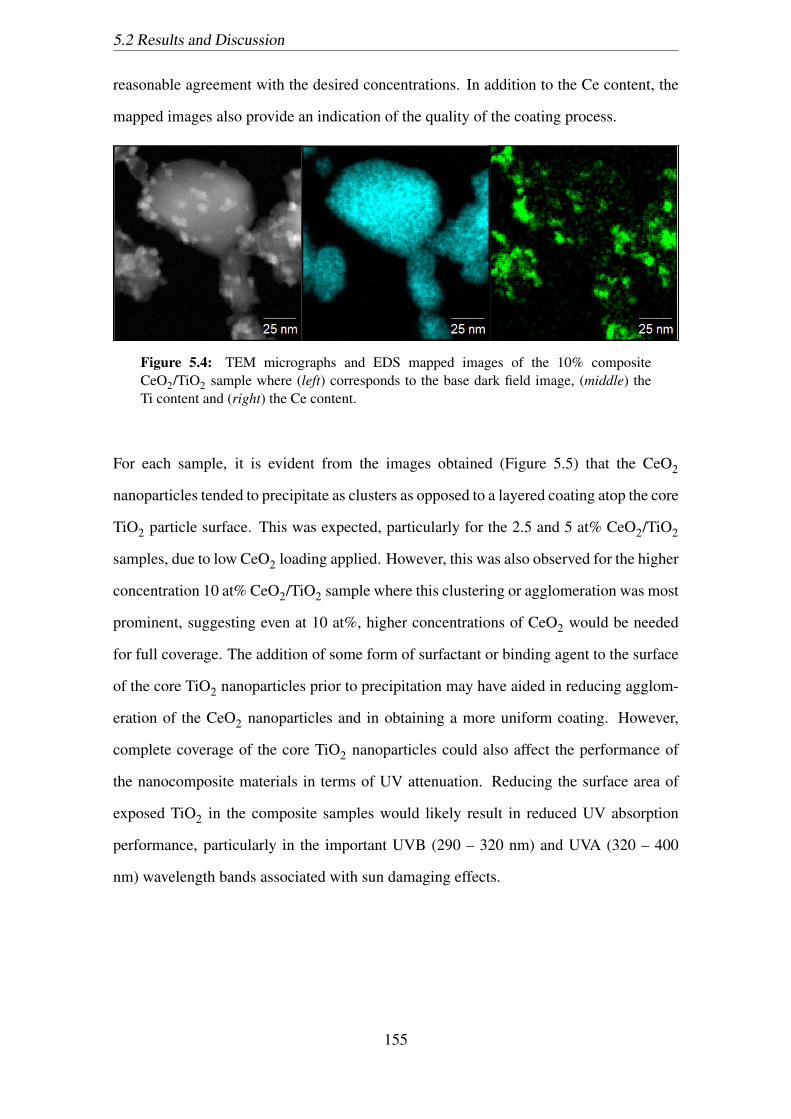
5.2 Results and Discussion
reasonable agreement with the desired concentrations. In addition to the Ce content, the
mapped images also provide an indication of the quality of the coating process.
Figure 5.4: TEM micrographs and EDS mapped images of the 10% compositeCeO2/TiO2 sample where (left) corresponds to the base dark field image, (middle) theTi content and (right) the Ce content.
For each sample, it is evident from the images obtained (Figure 5.5) that the CeO2
nanoparticles tended to precipitate as clusters as opposed to a layered coating atop the core
TiO2 particle surface. This was expected, particularly for the 2.5 and 5 at% CeO2/TiO2
samples, due to low CeO2 loading applied. However, this was also observed for the higher
concentration 10 at% CeO2/TiO2 sample where this clustering or agglomeration was most
prominent, suggesting even at 10 at%, higher concentrations of CeO2 would be needed
for full coverage. The addition of some form of surfactant or binding agent to the surface
of the core TiO2 nanoparticles prior to precipitation may have aided in reducing agglom-
eration of the CeO2 nanoparticles and in obtaining a more uniform coating. However,
complete coverage of the core TiO2 nanoparticles could also affect the performance of
the nanocomposite materials in terms of UV attenuation. Reducing the surface area of
exposed TiO2 in the composite samples would likely result in reduced UV absorption
performance, particularly in the important UVB (290 – 320 nm) and UVA (320 – 400
nm) wavelength bands associated with sun damaging effects.
155
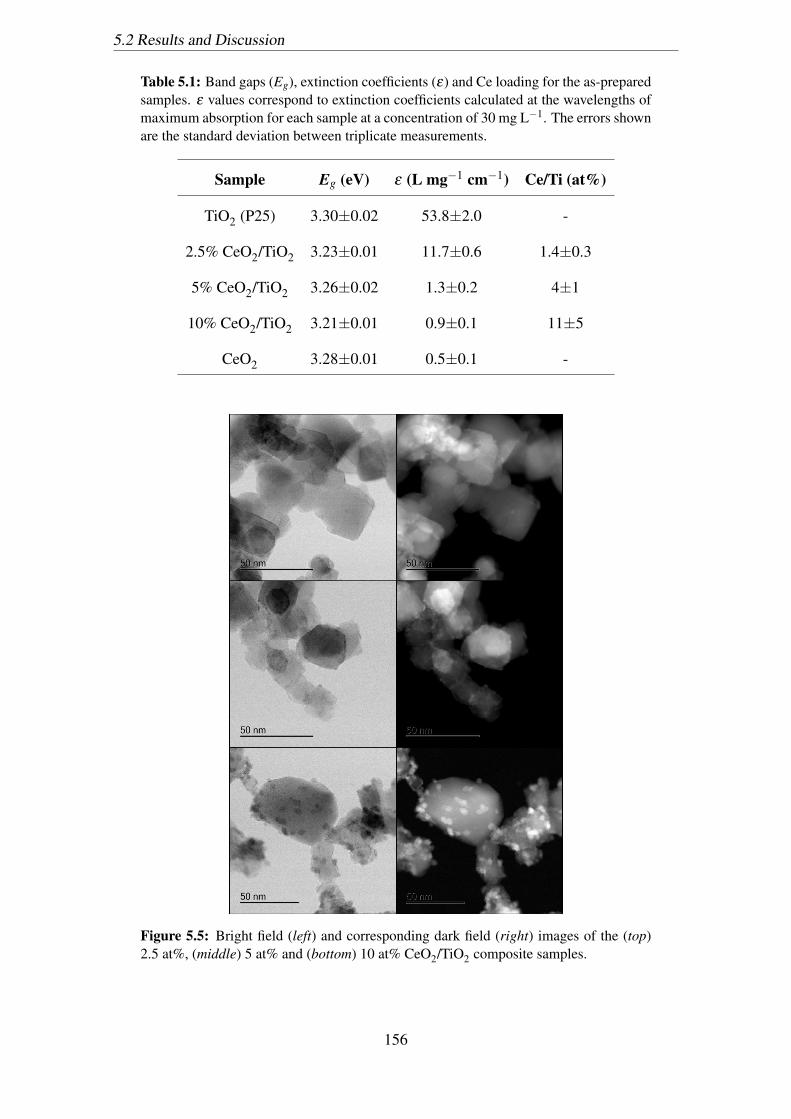
5.2 Results and Discussion
Table 5.1: Band gaps (Eg), extinction coefficients (ε) and Ce loading for the as-preparedsamples. ε values correspond to extinction coefficients calculated at the wavelengths ofmaximum absorption for each sample at a concentration of 30 mg L−1. The errors shownare the standard deviation between triplicate measurements.
Sample Eg (eV) ε (L mg−1 cm−1) Ce/Ti (at%)
TiO2 (P25) 3.30±0.02 53.8±2.0 -
2.5% CeO2/TiO2 3.23±0.01 11.7±0.6 1.4±0.3
5% CeO2/TiO2 3.26±0.02 1.3±0.2 4±1
10% CeO2/TiO2 3.21±0.01 0.9±0.1 11±5
CeO2 3.28±0.01 0.5±0.1 -
Figure 5.5: Bright field (left) and corresponding dark field (right) images of the (top)2.5 at%, (middle) 5 at% and (bottom) 10 at% CeO2/TiO2 composite samples.
156

5.2 Results and Discussion
The mean size of the CeO2 nanodots formed on the surface of the core TiO2 nanoparticles
in the 10 at% CeO2/TiO2 composite sample were measured and averaged. The mean size
calculated for this sample corresponded to 4.6±0.8 nm (Figure 5.6). This value also
corroborates with the mean crystallite size of 4.8±0.5 nm, calculated from the pristine
CeO2 XRD pattern using the Scherrer equation. It has been reported that the size of CeO2
nanoparticles is important in terms of its redox activity and contributes to the coexistence
of the 3+/4+ oxidation states of Ce and the presence of Ce3+ surface sites and oxygen
vacancies.500 This is thought to bring about the prominent antioxidant properties of these
nanoparticles and their ability to scavenge ROS.595 It has been predominantly found that,
as the size of the CeO2 nanoparticle decreases, an increase in the antioxidant activity is
observed.62, 500, 596 In the case of the 2.5 at% and 5 at% CeO2/TiO2 samples the particles
of CeO2 present to be smaller than those found in the 10 at% sample, suggesting sizes
below the approximately the mean of approximately 5 nm. This could lead to a further
increase in the presence of surface Ce3+ sites that contribute to the ROS scavenging ability
of theses materials at these loading concentrations.
157
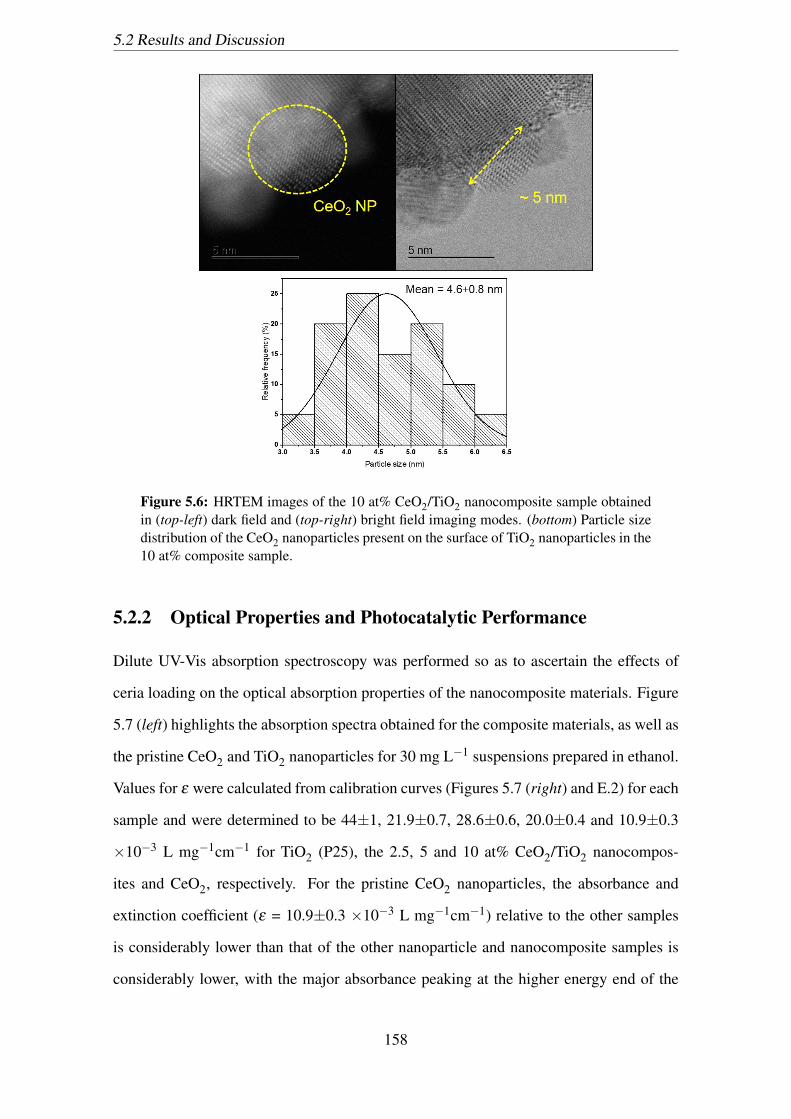
5.2 Results and Discussion
Figure 5.6: HRTEM images of the 10 at% CeO2/TiO2 nanocomposite sample obtainedin (top-left) dark field and (top-right) bright field imaging modes. (bottom) Particle sizedistribution of the CeO2 nanoparticles present on the surface of TiO2 nanoparticles in the10 at% composite sample.
5.2.2 Optical Properties and Photocatalytic Performance
Dilute UV-Vis absorption spectroscopy was performed so as to ascertain the effects of
ceria loading on the optical absorption properties of the nanocomposite materials. Figure
5.7 (left) highlights the absorption spectra obtained for the composite materials, as well as
the pristine CeO2 and TiO2 nanoparticles for 30 mg L−1 suspensions prepared in ethanol.
Values for ε were calculated from calibration curves (Figures 5.7 (right) and E.2) for each
sample and were determined to be 44±1, 21.9±0.7, 28.6±0.6, 20.0±0.4 and 10.9±0.3
×10−3 L mg−1cm−1 for TiO2 (P25), the 2.5, 5 and 10 at% CeO2/TiO2 nanocompos-
ites and CeO2, respectively. For the pristine CeO2 nanoparticles, the absorbance and
extinction coefficient (ε = 10.9±0.3 ×10⁻³ L mg−1cm−1) relative to the other samples
is considerably lower than that of the other nanoparticle and nanocomposite samples is
considerably lower, with the major absorbance peaking at the higher energy end of the
158
5.2 Results and Discussion
UVB region (305 nm). For each of the TiO2 containing samples tested, the primary
absorption band was observed within the UVB region, with the major peak absorption
spanning between 290–320 nm, although substantial absorbance is also observed within
the UVA region, accounting for its commercial use in commercial UV filtering products.
The lower absorbance and extinction values for the nanocomposite samples, as compared
to the pristine TiO2 (P25) nanoparticles would indicate minimal synergistic effect from
the CeO2 coupling concerning these optical properties. Furthermore, as mentioned previ-
ously, the lower optical performance for the nanocomposite samples could be attributed to
the reduction in TiO2 surface area exposed to the incident light source, thus lower absorp-
tion contributed by the TiO2. Despite displaying lower absorbance than the pristine TiO2
(P25), the nanocomposite samples still display substantial UV absorption, highlighting
their promise as UV protection agents. They also display a higher degree of transparency
in the visible light region (400 – 700 nm) compared to the pristine TiO2 (P25), making
them more cosmetically advantageous for use in sunscreening formulations. Notably, the
extinction coefficient increased between 2.5–5 at% CeO2 loading but decreased between
the 5 and 10 at% samples. The increase and decrease suggests that some optimal CeO2
loading amount aids in improving the UV attenuation of the core material, as evidenced
by the improvement between the 2.5 at% and 5% samples in absorbance across the UV
region. However, further loading of CeO2 in the 10 at% samples increases the surface
coverage of the core TiO2 nanoparticles. As such, any synergistic effects imparted by the
CeO2/TiO2 coupling towards UV attenuation is being mitigated by the reduction in avail-
able TiO2 surfaces available for efficient absorption. Band gap values were calculated for
each sample from their corresponding Tauc plots (Figure E.1) and are listed in Table 5.1.
The Eg value of 3.30±0.02 eV for the pristine TiO2 (P25) nanoparticles is in reasonable
agreement with other reported findings for the commercial product.597 A slightly lower
Eg value was obtained for the pristine CeO2 nanoparticles (3.28±0.01 eV) as compared
to the TiO2. As with the extinction coefficients and absorbance efficiencies, the Eg values
tended to increase from 2.5–5 at% CeO2, then decreased again at a CeO2 loading of 10
at%. However, the separation between Eg values calculated from the nanocomposite sam-
159

5.2 Results and Discussion
ples only vary between 1–3%, which is insubstantial to suggest major modification to the
core TiO2 nanoparticles due to the CeO2 loading. This could be considered beneficial, in
the sense that TiO2 is already considered a highly effective UVB absorber and so, keeping
the Eg of the composite materials to within this range is beneficial for ensuring suitable
UV filtration when employed in sun protecting products.
Figure 5.7: (left) UV-Vis absorption spectra recorded for the CeO2/TiO2 composites,as well as pristine TiO2 and CeO2 nanoparticles for 30 mg L−1 suspensions prepared inethanol. (right) Corresponding Beer-Lambert plots used to calculate extinction coeffi-cient values.
The photocatalytic activities of the composite samples were evaluated by measuring the
degradation of CV dye under UV and solar-simulated light irradiation over a period of
1 and 4 hr, respectively. Figure 5.8 (top) and Table 5.2 highlight the photodegradation
efficiencies and rate constants determined for the degradation of CV in the presence of
the nanocomposite and pristine powder samples under UV irradiation. Of the samples
tested, the pristine TiO2 (P25) nanoparticles displayed the highest degradation rate (kapp
= 53.8±2.0 ×10⁻³ min−1), nearly completely degrading the CV dye within the 1 hr ir-
radiation time. The photocatalytic degradation of organic dyes in the presence of TiO2
has been thoroughly studied, and it is well understood that, upon excitation by photons
higher in energy than its respective band gap, the formation of photoexcited e−/h+ pairs
occurs.526, 529, 598 These photoexcited species can then reduce/oxidise the dye directly or
interact with dissolved O2 or other oxygen containing species present, such as H2O, to
produce ROS that cause degradation indirectly. The efficiency of this degradation process
160
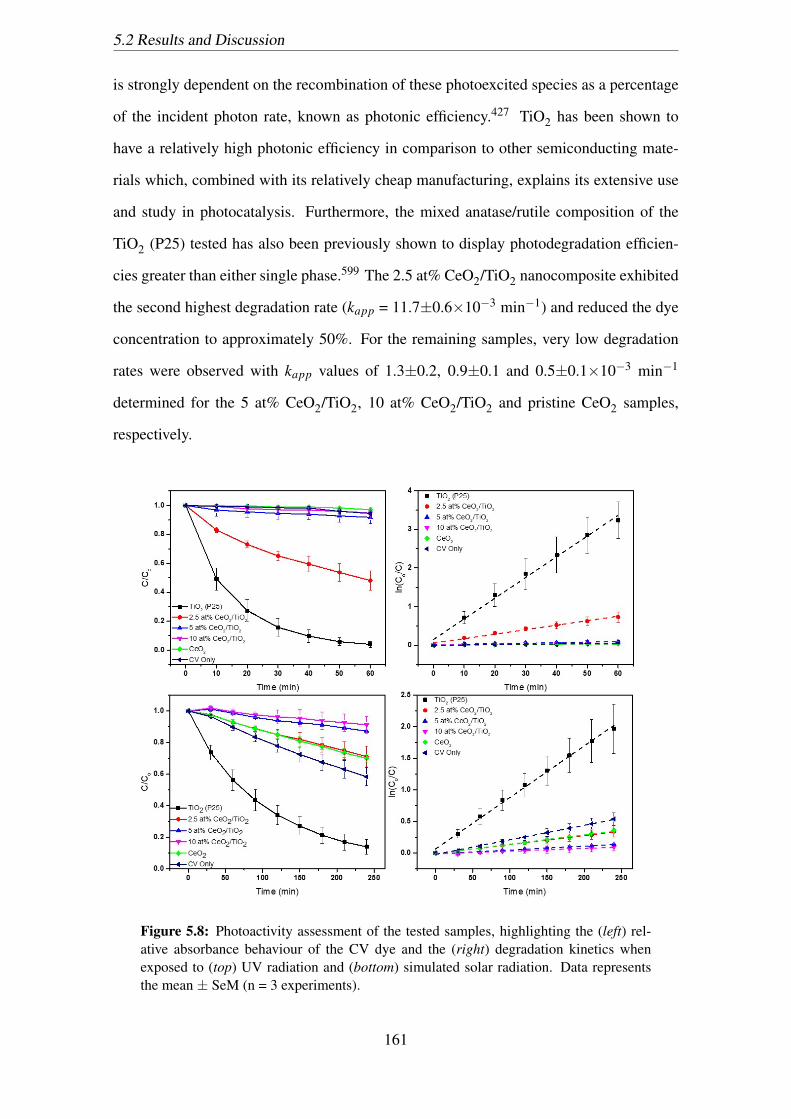
5.2 Results and Discussion
is strongly dependent on the recombination of these photoexcited species as a percentage
of the incident photon rate, known as photonic efficiency.427 TiO2 has been shown to
have a relatively high photonic efficiency in comparison to other semiconducting mate-
rials which, combined with its relatively cheap manufacturing, explains its extensive use
and study in photocatalysis. Furthermore, the mixed anatase/rutile composition of the
TiO2 (P25) tested has also been previously shown to display photodegradation efficien-
cies greater than either single phase.599 The 2.5 at% CeO2/TiO2 nanocomposite exhibited
the second highest degradation rate (kapp = 11.7±0.6×10⁻³ min−1) and reduced the dye
concentration to approximately 50%. For the remaining samples, very low degradation
rates were observed with kapp values of 1.3±0.2, 0.9±0.1 and 0.5±0.1×10⁻³ min−1
determined for the 5 at% CeO2/TiO2, 10 at% CeO2/TiO2 and pristine CeO2 samples,
respectively.
Figure 5.8: Photoactivity assessment of the tested samples, highlighting the (left) rel-ative absorbance behaviour of the CV dye and the (right) degradation kinetics whenexposed to (top) UV radiation and (bottom) simulated solar radiation. Data representsthe mean ± SeM (n = 3 experiments).
161
5.2 Results and Discussion
The substantial reduction in photoactivity for the nanocomposite and pristine CeO2 could,
in part, be attributed to the lower UV absorbing capabilities of these materials in compar-
ison to TiO2 (P25) (Figure 5.7 (left)), however, one particular nanocomposite stands out
from the rest. The near negligible degradation observed in the case of the 5 at% compos-
ite does not coincide with its still relatively high UV absorbance properties. Combined
with the minimal modification seen in the band gap of this nanocomposite compared to
the pristine TiO2 (P25) sample, the low photoactivity observed could be attributed to a
reduction in ROS generation (due to increased recombination of charge carriers) or ROS
scavenging (due to the presence of CeO2). For the latter case, it could be suggested
that the effect is dependent on the loading of CeO2. Despite displaying lower UV ab-
sorbance efficiency than the 5 at% composite, the 2.5 at% sample displayed much higher
photoactivity under UV irradiation (kapp = 11.7±0.6×10⁻³ min−1 compared to kapp =
1.3±0.2×10⁻³ min−1). This could suggest that at this CeO2 loading ratio, the ability for
the CeO2 present to act as an antioxidant is outweighed by the photocatalytic activity of
the core TiO2, in spite of the lower absorptive properties. However, as the CeO2 loading
is increased, a drastic reduction in degradation is observed as well as a peaking in UV
absorbance for the 5 at% loaded sample before decreasing again in the 10 at% loaded
sample. It is thus evident that there is a trade-off between obtaining the antioxidant prop-
erties of the CeO2 surface loaded nanoparticles with maintaining adequate UV protection
afforded mainly by the core TiO2 nanoparticles and is influenced by the CeO2 loading
concentration.
162

5.2 Results and Discussion
Table 5.2: CV dye degradation and rate constants (kapp) calculated from the photocat-alytic degradation experiments under UV and solar simulated (AM1.5G) irradiation forthe pristine and composite samples. Errors shown correspond to the SeM between threeseparate experiments.
Sample Dye degradation (%) Rate constant kapp (×10−3)(min−1)
UV AM1.5G UV AM1.5G
TiO2 (P25) 96±2 86±5 53.8±2.0 8.16±0.17
2.5% CeO2/TiO2 52±7 29±7 11.7±0.6 1.43±0.03
5% CeO2/TiO2 8±5 13±1 1.3±0.2 0.62±0.04
10% CeO2/TiO2 5±4 9±5 0.9±0.1 0.44±0.04
CeO2 3±1 30±3 0.5±0.1 1.51±0.03
Figure 5.8 (bottom) highlights the photodegradation results for the samples tested when
exposed to solar simulated light. In a similar manner to the UV photodegradation tests, the
pristine TiO2 (P25) displayed vastly superior photocatalytic activity (kapp = 8.16±0.17×10⁻³
min−1) as compared to the nanocomposite and pristine CeO2 samples. Furthermore, the
photocatalytic activity of the nanocomposite samples under solar simulated light follows
the same trend observed when exposed to only UV radiation, with greater CeO2 loading
leading to a lower perceived activity (kapp = 1.43±0.03, 0.62±0.04, 0.44±0.04×10⁻³
min−1 for the 2.5 at%, 5 at% and 10 at% CeO2/TiO2 nanocomposite samples, respec-
tively). Similarly, the reasons for this trend across the nanocomposite samples are likely
similar to those outlined previously for the UV photodegradation results since there is lit-
tle direct absorbance within the visible light region for the nanocomposite samples from
which changing the light source can have a major impact.
Notably, the pristine CeO2 sample when exposed to simulated solar light displayed an en-
hancement in photoactivity as compared to when exposed purely to UV, but still afforded
some protection for the dye itself against decomposition by solar simulated light. A possi-
ble explanation as to why the protective effect of CeO2 in this case is not as pronounced as
compared to the nanocomposite samples, where the CeO2 loading is significantly lower,
163

5.2 Results and Discussion
could be due to the influence of surface defects and surface defect concentration. The
main type of surface defect that occurs with ceramic nanoparticles are oxygen vacancies
which, in the case of CeO2, results in the reduction of surface Ce4+ to Ce3+, so as to
compensate for the effects of electrostatic forces. The presence of these surface based
Ce3+ states suggests the presence of Ce2O3, a phase not observed in XRD analysis of the
pristine CeO2 since it is limited to the surface and likely masked by the higher volume
loaded CeO2 phase. Ce2O3 enables the absorption of visible light wavelengths and has
been reported to have a significantly smaller band gap than CeO2 of 2.40 eV.600, 601 The
reason such absorption features were not evidenced in the absorption spectra of CeO2
could be attributed to the very fact that it is a phenomenon strictly limited to the surface
of the CeO2 nanoparticles, whereas absorption spectroscopy considers the entire bulk.
Because of the additional limited visible light absorption afforded, the CeO2 scavenging
capabilities are also in direct competition with the photocatalytic properties of the mate-
rial from both UV and visible light excitation. However, the contribution to photocatalysis
due to visible light excitation in pristine CeO2 is still not so significant since the dye itself
is still afforded some protection over the 4 hr exposure period as compared to the dye
degradation in absence of any catalyst. This effect is also further limited in the case of
the nanocomposite samples due to the reduced loading of CeO2 in these samples relative
to the pristine CeO2 and thus a more pronounced reduction in photocatalytic activity is
observed instead.
It can be concluded from these photodegradation experiments that the application of CeO2
to the surface of highly photoactive TiO2 nanoparticles can influence the photocatalytic
performance. The drastic reduction in photocatalytic activity observed for the nanocom-
posite samples relative to the pristine TiO2 (P25) sample adds further evidence towards to
the potential of CeO2 as new additive coating material for inorganic UV filters.
164
5.2 Results and Discussion
5.2.3 In Vitro Cytotoxicity in Absence and in the Presence of UV Ra-diation
Cell cytotoxic and phototoxic assays were performed using the pristine TiO2 and CeO2
nanoparticle samples, as well as the 5 at% CeO2/TiO2 as a result of the low photocat-
alytic activity and high UV attenuation it displayed, making the ideal sample for testing
amongst the different CeO2 loaded samples prepared. The HaCaT cell line was chosen
for both cytotoxic and phototoxic assays as it is composed of keratinocytes, the major cell
type of the epidermis and the superficial layers of skin in most intimate contact with exter-
nal contaminants.602, 603 Figure 5.9 highlights changes in the cell viability of the HaCaT
cells when exposed to increasing concentrations of pristine TiO2 (P25), CeO2, the 5 at%
CeO2/TiO2 nanocomposite and a known nanoparticulate toxicant, ZnO (Sigma Aldrich,
size < 100 nm).604, 605 Cell viability was reduced significantly after 24 hr incubation in
the presence of the tested ZnO nanoparticles at concentrations above 10 mg L−1. From the
concentration-response curve obtained, the half maximal inhibitory concentration (IC50)
for ZnO nanoparticles tested was reached and calculated to be 16±1 mg L−1. In contrast,
cell viability was only partially reduced in the presence of CeO2, TiO2 (P25) or 5 at%
CeO2/TiO2 with cell viability significantly greater than that of cells incubated in the pres-
ence of corresponding cytotoxic concentrations of ZnO. Unlike ZnO nanoparticles, for the
pristine and nanocomposite samples the half maximal inhibitory concentration could not
be reached and the final cell viabilities of HaCaT cells at the highest concentration tested
(300 mg L−1) were only reduced to 87±5%, 79±9% and 70±10% for the CeO2, 5 at%
CeO2/TiO2 and TiO2 (P25) samples, respectively. The cell viability reduction observed
across all tested concentrations did not vary substantially between samples, suggesting
minimal differences in toxicity for the samples tested and a marginal influence of the
CeO2 loading on the core TiO2 nanoparticle toxicity in absence of external UV radiation
sources.
165
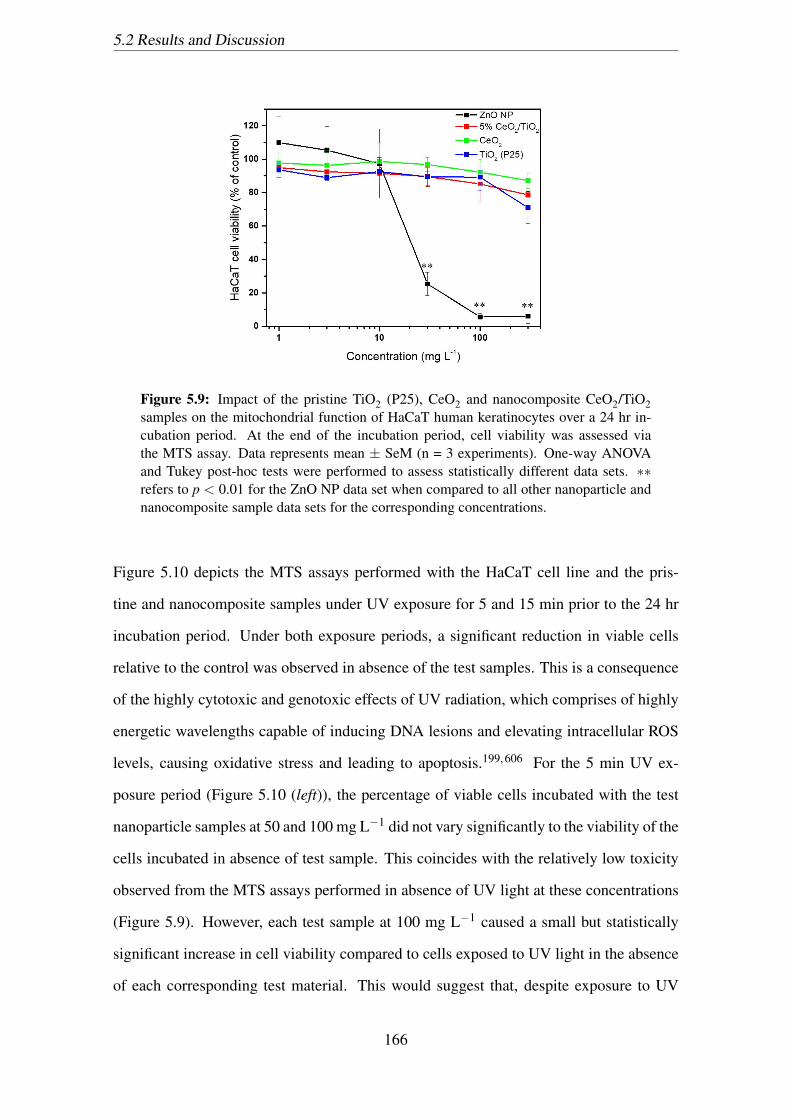
5.2 Results and Discussion
Figure 5.9: Impact of the pristine TiO2 (P25), CeO2 and nanocomposite CeO2/TiO2samples on the mitochondrial function of HaCaT human keratinocytes over a 24 hr in-cubation period. At the end of the incubation period, cell viability was assessed viathe MTS assay. Data represents mean ± SeM (n = 3 experiments). One-way ANOVAand Tukey post-hoc tests were performed to assess statistically different data sets. ∗∗refers to p < 0.01 for the ZnO NP data set when compared to all other nanoparticle andnanocomposite sample data sets for the corresponding concentrations.
Figure 5.10 depicts the MTS assays performed with the HaCaT cell line and the pris-
tine and nanocomposite samples under UV exposure for 5 and 15 min prior to the 24 hr
incubation period. Under both exposure periods, a significant reduction in viable cells
relative to the control was observed in absence of the test samples. This is a consequence
of the highly cytotoxic and genotoxic effects of UV radiation, which comprises of highly
energetic wavelengths capable of inducing DNA lesions and elevating intracellular ROS
levels, causing oxidative stress and leading to apoptosis.199, 606 For the 5 min UV ex-
posure period (Figure 5.10 (left)), the percentage of viable cells incubated with the test
nanoparticle samples at 50 and 100 mg L−1 did not vary significantly to the viability of the
cells incubated in absence of test sample. This coincides with the relatively low toxicity
observed from the MTS assays performed in absence of UV light at these concentrations
(Figure 5.9). However, each test sample at 100 mg L−1 caused a small but statistically
significant increase in cell viability compared to cells exposed to UV light in the absence
of each corresponding test material. This would suggest that, despite exposure to UV
166

5.2 Results and Discussion
radiation for the allotted period, some protective effect was afforded by the tested sam-
ples. Indeed, as has been shown through UV-Vis absorption spectroscopy (Figure 5.7),
each of the tested samples, to a varying degree, display UV absorptive capabilities. How-
ever, with this screening and thus absorption of the incident UV by the samples tested,
ROS generation was expected to occur, particularly for the TiO2 (P25) sample which was
shown to have prominent photocatalytic properties (Figure 5.8). One possible reason as
to why this protective effect is more apparent than the potential toxicological effects of
ROS production could be due to a lack of cellular internalization of the nanoparticles,
leading to insubstantial cellular damage and impairment of metabolic activity. Another
possibility is that, for the time period and intensity of UV emitted to the cells and the
tested samples, the rate of ROS production was insufficient to induce a state of oxidative
stress. Most animal cells contain natural enzymatic antioxidants to counteract ROS and
other free radicals produced as by-products of metabolism or, such as in this work, ROS
produced indirectly by UV radiation.607, 608
Figure 5.10: HaCaT cell viability after 24 hr incubation with TiO2 (P25), 5 at%CeO2/TiO2 and CeO2 when exposed to UV radiation prior for (left) 5 min and (right)15 min at an intensity of 6 mW cm−2. HaCaT cell viability (% of control) refers tothe normalized absorbance readings for all nanoparticle, nanocomposite and cell onlywells exposed to UV irradiation relative to a control plate in absence of UV exposure foreach concentration tested. Data represents mean ± SeM (n = 3 experiments). One-wayANOVA and Tukey post-hoc tests were performed to assess statistically different datasets. ∗ and ∗∗ refer to p < 0.05 and p < 0.01 when compared to the Cell Only data setsfor the corresponding concentrations. † and †† refer to p < 0.05 and p < 0.01 whencompared to the TiO2 (P25) data sets for the corresponding concentrations.
167
5.2 Results and Discussion
For the 15 min UV exposure period (Figure 5.10 (right)), an overall decrease in cell
viability is observed across all samples and concentrations as compared to the 5 min ex-
posure period, simply as result of the higher dose of UV radiation impacting the cells. In
contrast to the 5 min exposure period results (Figure 5.10 (left)), a significant decrease in
cell viability was observed when incubated with the TiO2 (P25) nanoparticles at a con-
centration of 100 mg L−1 compared to UV exposed cells incubated in the absence of test
sample. In this instance, the rate of ROS production may be exceeding the rate at which
these species can be scavenged by natural cellular processes, leading to a state of oxida-
tive stress, metabolic impairment and potentially cell death. In addition, the screening
effect afforded by the UV absorbing TiO2 (P25) nanoparticles is also outweighed by its
potential free radical production, leading to cell damaging effects akin to the degrada-
tion of CV during the photodegradation experiments. In the case of the pristine CeO2
nanoparticles, cell viability was maintained at 25 mg L−1 whilst an increase in cell viabil-
ity was observed for CeO2 nanoparticle concentrations at 50 and 100 mg L−1 compared
to UV exposed cells incubated in the absence of test sample. As with the 5 min exposure
period tests, the increase in cell viability at these higher test concentrations could be a
result of the UV shielding afforded by the absorptive properties of the particles. Con-
tributions from the free radical scavenging ability of the CeO2 nanoparticles could also
be aiding in protecting the cells from photo-induced ROS and in minimizing oxidative
damage.609 A combination of both free radical scavenging and UV shielding by the CeO2
nanoparticles is likely the cause for the perceived increase in cell viability seen at these
higher concentrations, as has been previously shown.535 It can also be seen that the load-
ing of CeO2 nanoparticles at the surface of TiO2 has an impact on the phototoxicity of
the core material. Cell viability was maintained across all tested concentrations for the
5 at% CeO2/TiO2 sample as compared to UV exposed cells incubated in the absence of
test sample. The significant difference in cell viability between the pristine TiO2 (P25)
nanoparticles and the nanocomposite sample, particularly at concentrations of 50 and 100
mg L−1, suggests that the application of CeO2 at this loading concentration is sufficient
in mitigating the potentially phototoxic properties of the core TiO2. The reason for this
168
5.3 Conclusion
could impart be due to a reduction in TiO2 surface active sites due to coverage by the CeO2
nanoparticles, as had been previously suggested in explaining its low photocatalytic ac-
tivity towards the degradation of CV. It is also possible that the biocompatibility of TiO2
in the nanocomposite materials has been improved due to the low toxic and phototoxic
effects exerted by the application of the CeO2 nanoparticles and the potential scaveng-
ing of photo-produced ROS, as demonstrated by the pristine CeO2 nanoparticles in this
work.
5.3 Conclusion
Commercially used TiO2 nanoparticles in sunscreen products have the potential to gen-
erate free-radical species such as ROS when exposed to UV radiation. Such free radical
species have been shown to cause oxidative damage to other active sunscreen ingredients,
leading to a loss in protection, as well cause cytotoxic and genotoxic effects to human
cell lines, particularly when exposed to UV radiation. Thus, modification of the photocat-
alytic activity of these particles whilst maintaining adequate UV attenuation is essential
for their continued safe use in such products. The addition of free radical scavenging
CeO2 nanodots through a simple precipitation method to the surface of highly photoac-
tive commercial TiO2 nanoparticles was employed to demonstrate an alternative to classic
silica and alumina based coatings. It was shown that an optimal CeO2 nanodot loading
of 5 at% was required for drastically reducing the photocatalytic activity of the core TiO2
whilst also maintaining excellent UV absorptive properties. Furthermore, the phototoxic
properties of the core commercial TiO2 nanoparticles towards HaCaT cells were shown
to be diminished in the nanocomposite sample due to the potential biomimetic antioxi-
dant behaviour of CeO2. Thus in this chapter, we have demonstrated the potential for
CeO2 nanodots as an additive to commercial sunscreen active TiO2 that can help improve
biocompatibility, provide UV protection and minimize formulation degradation.
169

Chapter 6
Hydrothermal Synthesis of Rutile TiO2
Nanorods and their Decoration withCeO2 Nanoparticles asLow-Photocatalytic Active Ingredientsin UV Filtering Applications
The following chapter describes and discusses the research reported in an article submit-
ted to the Journal of Materials Science.610 Abbreviations used throughout this chapter
have been previously outlined in Section 3.1.3.
6.1 Introduction
TiO2 has long been used as an inorganic based UV filtering ingredient in many sunscreen
products. Modern formulations often contain TiO2 in the form of nanoparticles due to
the enhanced absorption provided across the UVA (320 – 400 nm) and UVB (290 – 320
nm) wavelength bands. Moreover, with increased transparency, when well dispersed, in
the visible light region (400 – 700 nm), significant cosmetic advantage is afforded.611
However, there is concern associated with the enhanced photocatalytic activity of this
material at this size range and their role in the formation of ROS such as the highly reactive
OH• radical.7 TiO2 nanoparticles have also been shown to induce genotoxic and cytotoxic
170
6.1 Introduction
effects on human cell lines, particularly after exposure to UV radiation, which leads to
the production of ROS.602, 612 ROS production can also affect other active ingredients
present in sunscreen formulations. Degradation of these ingredients can lead to a loss of
sunscreen efficacy and lowering of the labelled SPF. The extent of ROS production and
the photocatalytic activity of TiO2 can be modified by manipulating material parameters
such as the crystal phase, particle size and the surface coating.
The two main crystal phases linked with TiO2 use in photocatalysis are anatase and rutile.
Often, the anatase phase is associated with higher photocatalytic activity, however, there
is also substantial evidence to suggest certain compositions of anatase-rutile mixtures can
outperform either single phase.453, 454 One such proprietary mixture, AEROXIDE® TiO2
P25 (also known as Degussa P25), is a popular IUPAC reference material used in photo-
catalysis research, and is a TiO2 nanopowder with an anatase-rutile ratio of 4:1.613 This
same ratio of anatase-rutile has also been found in certain sunscreen products containing
TiO2 which were shown to cause accelerated damage to organic surface coatings used in
outdoor roofing applications.53 As such, an essential parameter for improving the safety
of nanoparticulate TiO2 in sunscreens is to ensure the use of rutile TiO2. Although lower
in activity, the rutile crystal phase can still exhibit substantial photocatalytic properties,
leading to the need for additional modification. Surface coatings have been utilized as
a means of mitigating the photocatalytic effect of nanoparticulate TiO2. Different types
of coating materials can be used and are often based upon Si or Al oxides, hydroxides or
polymers.614 The principle mechanism behind this process is that the photo-inactive coat-
ing helps promote recombination of photo-excited e−/h+ pairs in the core TiO2 material,
by presenting an insulating layer with an increased band gap, thus reducing the probabil-
ity of ROS production. However, such methods are not entirely foolproof as evidenced
by the incorporation of additional antioxidant compounds in many sunscreen formula-
tions to counteract remnant ROS produced.7 Complex coating materials can also require
lengthy synthesis processes and hence increase the price of production. Our groups has
previously investigated the surface modification of TiO2 nanoparticles with bismuth sub-
carbonate ((BiO)2CO3) and achieved a product with lower photocatalytic activity, relative
171
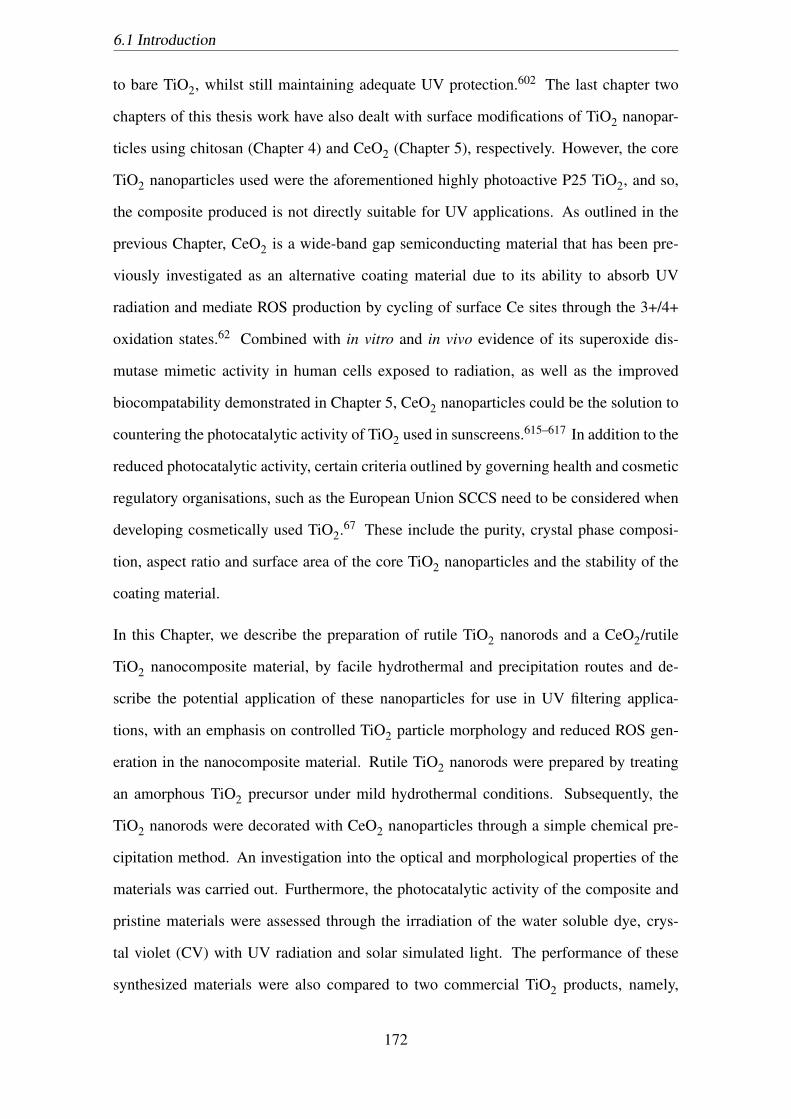
6.1 Introduction
to bare TiO2, whilst still maintaining adequate UV protection.602 The last chapter two
chapters of this thesis work have also dealt with surface modifications of TiO2 nanopar-
ticles using chitosan (Chapter 4) and CeO2 (Chapter 5), respectively. However, the core
TiO2 nanoparticles used were the aforementioned highly photoactive P25 TiO2, and so,
the composite produced is not directly suitable for UV applications. As outlined in the
previous Chapter, CeO2 is a wide-band gap semiconducting material that has been pre-
viously investigated as an alternative coating material due to its ability to absorb UV
radiation and mediate ROS production by cycling of surface Ce sites through the 3+/4+
oxidation states.62 Combined with in vitro and in vivo evidence of its superoxide dis-
mutase mimetic activity in human cells exposed to radiation, as well as the improved
biocompatability demonstrated in Chapter 5, CeO2 nanoparticles could be the solution to
countering the photocatalytic activity of TiO2 used in sunscreens.615–617 In addition to the
reduced photocatalytic activity, certain criteria outlined by governing health and cosmetic
regulatory organisations, such as the European Union SCCS need to be considered when
developing cosmetically used TiO2.67 These include the purity, crystal phase composi-
tion, aspect ratio and surface area of the core TiO2 nanoparticles and the stability of the
coating material.
In this Chapter, we describe the preparation of rutile TiO2 nanorods and a CeO2/rutile
TiO2 nanocomposite material, by facile hydrothermal and precipitation routes and de-
scribe the potential application of these nanoparticles for use in UV filtering applica-
tions, with an emphasis on controlled TiO2 particle morphology and reduced ROS gen-
eration in the nanocomposite material. Rutile TiO2 nanorods were prepared by treating
an amorphous TiO2 precursor under mild hydrothermal conditions. Subsequently, the
TiO2 nanorods were decorated with CeO2 nanoparticles through a simple chemical pre-
cipitation method. An investigation into the optical and morphological properties of the
materials was carried out. Furthermore, the photocatalytic activity of the composite and
pristine materials were assessed through the irradiation of the water soluble dye, crys-
tal violet (CV) with UV radiation and solar simulated light. The performance of these
synthesized materials were also compared to two commercial TiO2 products, namely,
172
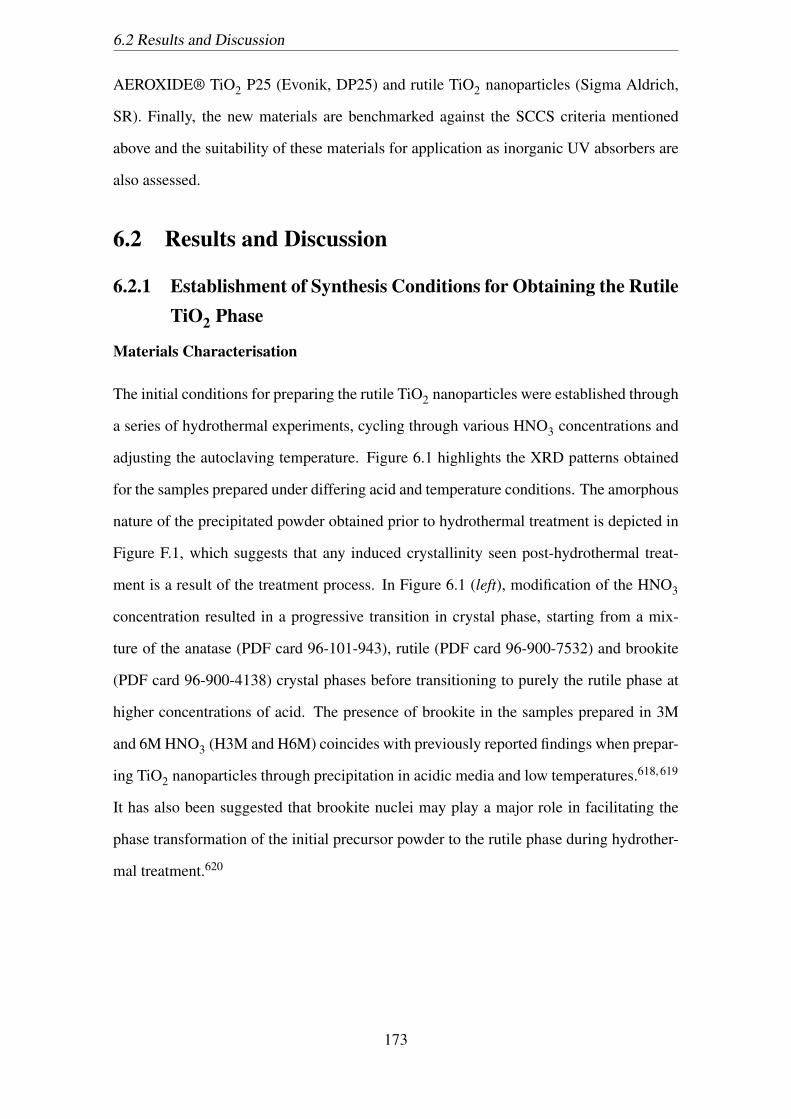
6.2 Results and Discussion
AEROXIDE® TiO2 P25 (Evonik, DP25) and rutile TiO2 nanoparticles (Sigma Aldrich,
SR). Finally, the new materials are benchmarked against the SCCS criteria mentioned
above and the suitability of these materials for application as inorganic UV absorbers are
also assessed.
6.2 Results and Discussion
6.2.1 Establishment of Synthesis Conditions for Obtaining the RutileTiO2 Phase
Materials Characterisation
The initial conditions for preparing the rutile TiO2 nanoparticles were established through
a series of hydrothermal experiments, cycling through various HNO3 concentrations and
adjusting the autoclaving temperature. Figure 6.1 highlights the XRD patterns obtained
for the samples prepared under differing acid and temperature conditions. The amorphous
nature of the precipitated powder obtained prior to hydrothermal treatment is depicted in
Figure F.1, which suggests that any induced crystallinity seen post-hydrothermal treat-
ment is a result of the treatment process. In Figure 6.1 (left), modification of the HNO3
concentration resulted in a progressive transition in crystal phase, starting from a mix-
ture of the anatase (PDF card 96-101-943), rutile (PDF card 96-900-7532) and brookite
(PDF card 96-900-4138) crystal phases before transitioning to purely the rutile phase at
higher concentrations of acid. The presence of brookite in the samples prepared in 3M
and 6M HNO3 (H3M and H6M) coincides with previously reported findings when prepar-
ing TiO2 nanoparticles through precipitation in acidic media and low temperatures.618, 619
It has also been suggested that brookite nuclei may play a major role in facilitating the
phase transformation of the initial precursor powder to the rutile phase during hydrother-
mal treatment.620
173
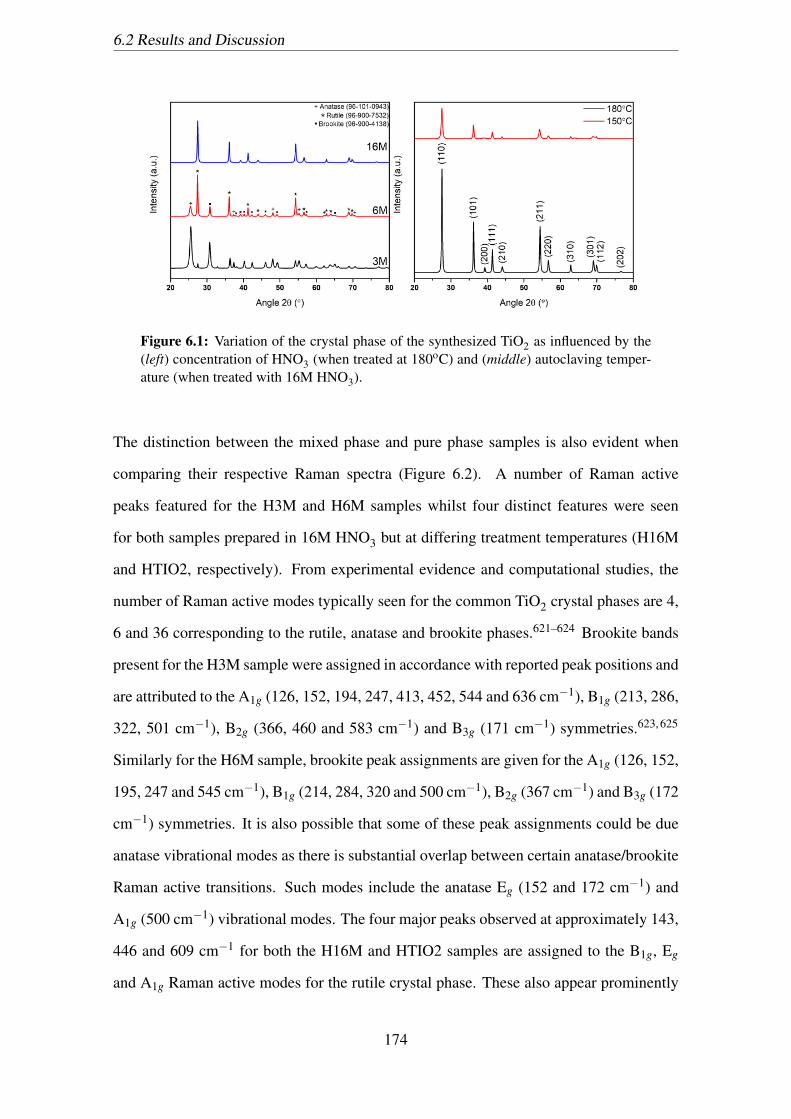
6.2 Results and Discussion
Figure 6.1: Variation of the crystal phase of the synthesized TiO2 as influenced by the(left) concentration of HNO3 (when treated at 180oC) and (middle) autoclaving temper-ature (when treated with 16M HNO3).
The distinction between the mixed phase and pure phase samples is also evident when
comparing their respective Raman spectra (Figure 6.2). A number of Raman active
peaks featured for the H3M and H6M samples whilst four distinct features were seen
for both samples prepared in 16M HNO3 but at differing treatment temperatures (H16M
and HTIO2, respectively). From experimental evidence and computational studies, the
number of Raman active modes typically seen for the common TiO2 crystal phases are 4,
6 and 36 corresponding to the rutile, anatase and brookite phases.621–624 Brookite bands
present for the H3M sample were assigned in accordance with reported peak positions and
are attributed to the A1g (126, 152, 194, 247, 413, 452, 544 and 636 cm−1), B1g (213, 286,
322, 501 cm−1), B2g (366, 460 and 583 cm−1) and B3g (171 cm−1) symmetries.623, 625
Similarly for the H6M sample, brookite peak assignments are given for the A1g (126, 152,
195, 247 and 545 cm−1), B1g (214, 284, 320 and 500 cm−1), B2g (367 cm−1) and B3g (172
cm−1) symmetries. It is also possible that some of these peak assignments could be due
anatase vibrational modes as there is substantial overlap between certain anatase/brookite
Raman active transitions. Such modes include the anatase Eg (152 and 172 cm−1) and
A1g (500 cm−1) vibrational modes. The four major peaks observed at approximately 143,
446 and 609 cm−1 for both the H16M and HTIO2 samples are assigned to the B1g, Eg
and A1g Raman active modes for the rutile crystal phase. These also appear prominently
174
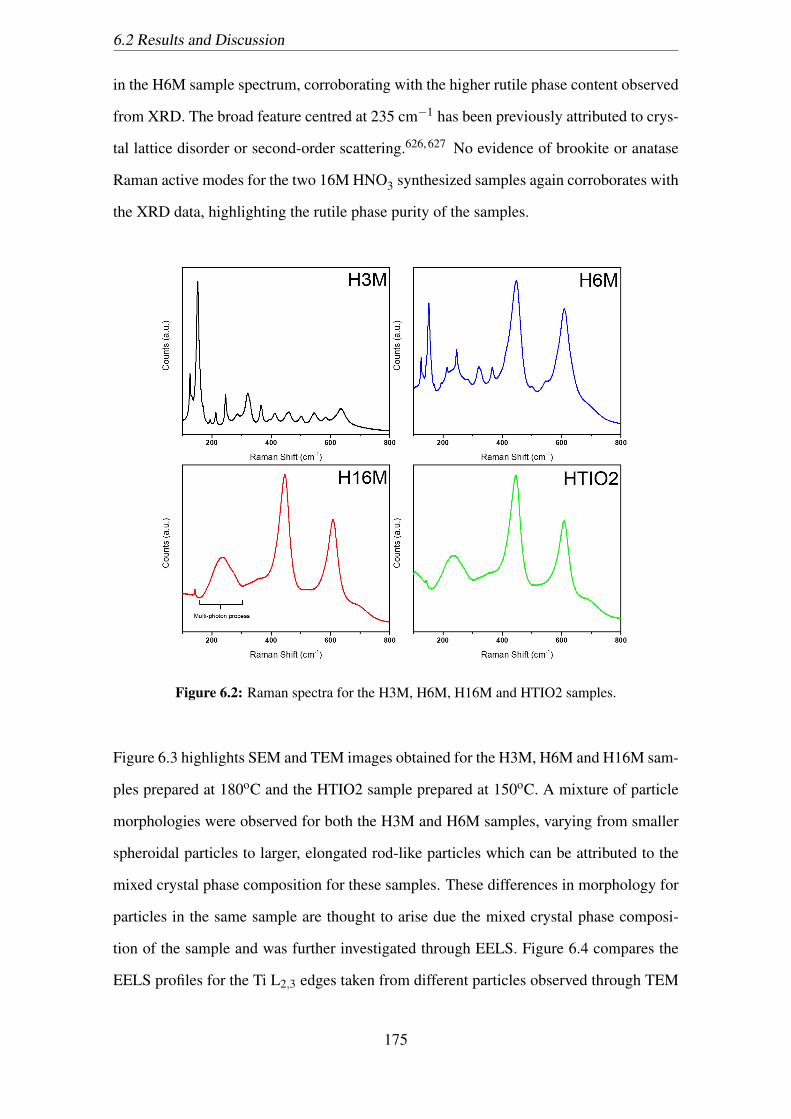
6.2 Results and Discussion
in the H6M sample spectrum, corroborating with the higher rutile phase content observed
from XRD. The broad feature centred at 235 cm−1 has been previously attributed to crys-
tal lattice disorder or second-order scattering.626, 627 No evidence of brookite or anatase
Raman active modes for the two 16M HNO3 synthesized samples again corroborates with
the XRD data, highlighting the rutile phase purity of the samples.
Figure 6.2: Raman spectra for the H3M, H6M, H16M and HTIO2 samples.
Figure 6.3 highlights SEM and TEM images obtained for the H3M, H6M and H16M sam-
ples prepared at 180oC and the HTIO2 sample prepared at 150oC. A mixture of particle
morphologies were observed for both the H3M and H6M samples, varying from smaller
spheroidal particles to larger, elongated rod-like particles which can be attributed to the
mixed crystal phase composition for these samples. These differences in morphology for
particles in the same sample are thought to arise due the mixed crystal phase composi-
tion of the sample and was further investigated through EELS. Figure 6.4 compares the
EELS profiles for the Ti L2,3 edges taken from different particles observed through TEM
175
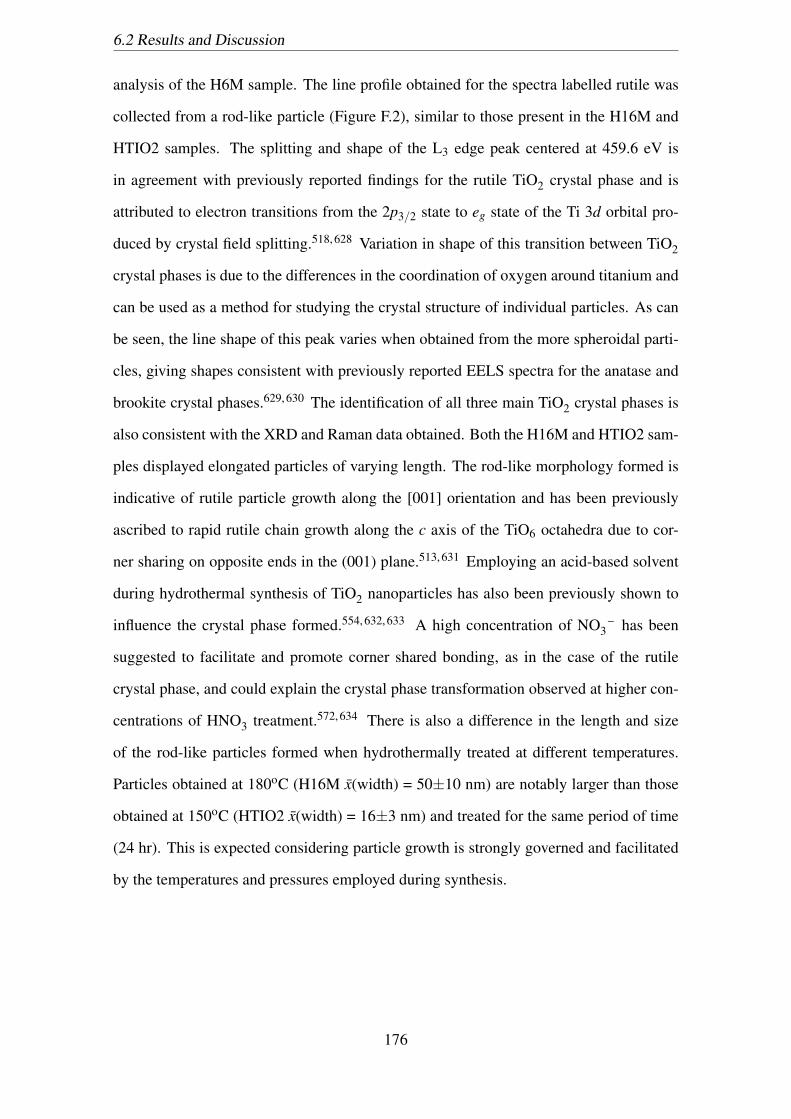
6.2 Results and Discussion
analysis of the H6M sample. The line profile obtained for the spectra labelled rutile was
collected from a rod-like particle (Figure F.2), similar to those present in the H16M and
HTIO2 samples. The splitting and shape of the L3 edge peak centered at 459.6 eV is
in agreement with previously reported findings for the rutile TiO2 crystal phase and is
attributed to electron transitions from the 2p3/2 state to eg state of the Ti 3d orbital pro-
duced by crystal field splitting.518, 628 Variation in shape of this transition between TiO2
crystal phases is due to the differences in the coordination of oxygen around titanium and
can be used as a method for studying the crystal structure of individual particles. As can
be seen, the line shape of this peak varies when obtained from the more spheroidal parti-
cles, giving shapes consistent with previously reported EELS spectra for the anatase and
brookite crystal phases.629, 630 The identification of all three main TiO2 crystal phases is
also consistent with the XRD and Raman data obtained. Both the H16M and HTIO2 sam-
ples displayed elongated particles of varying length. The rod-like morphology formed is
indicative of rutile particle growth along the [001] orientation and has been previously
ascribed to rapid rutile chain growth along the c axis of the TiO6 octahedra due to cor-
ner sharing on opposite ends in the (001) plane.513, 631 Employing an acid-based solvent
during hydrothermal synthesis of TiO2 nanoparticles has also been previously shown to
influence the crystal phase formed.554, 632, 633 A high concentration of NO –3 has been
suggested to facilitate and promote corner shared bonding, as in the case of the rutile
crystal phase, and could explain the crystal phase transformation observed at higher con-
centrations of HNO3 treatment.572, 634 There is also a difference in the length and size
of the rod-like particles formed when hydrothermally treated at different temperatures.
Particles obtained at 180oC (H16M x(width) = 50±10 nm) are notably larger than those
obtained at 150oC (HTIO2 x(width) = 16±3 nm) and treated for the same period of time
(24 hr). This is expected considering particle growth is strongly governed and facilitated
by the temperatures and pressures employed during synthesis.
176
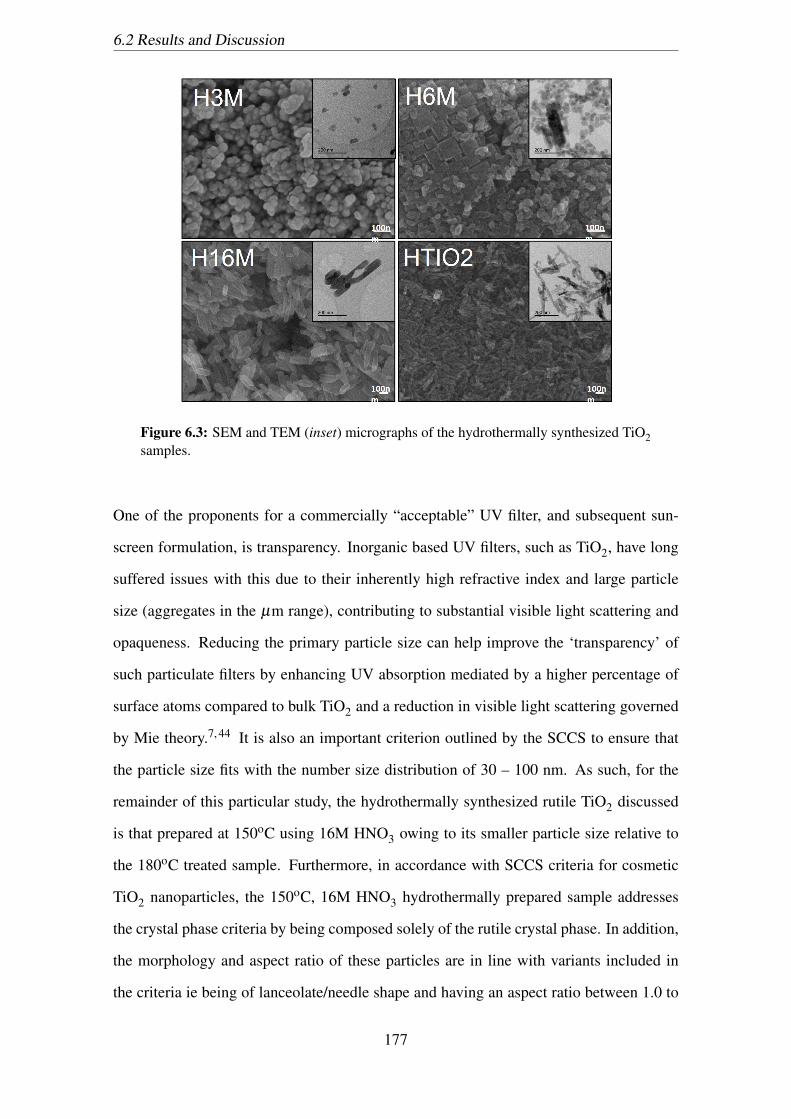
6.2 Results and Discussion
Figure 6.3: SEM and TEM (inset) micrographs of the hydrothermally synthesized TiO2samples.
One of the proponents for a commercially “acceptable” UV filter, and subsequent sun-
screen formulation, is transparency. Inorganic based UV filters, such as TiO2, have long
suffered issues with this due to their inherently high refractive index and large particle
size (aggregates in the µm range), contributing to substantial visible light scattering and
opaqueness. Reducing the primary particle size can help improve the ‘transparency’ of
such particulate filters by enhancing UV absorption mediated by a higher percentage of
surface atoms compared to bulk TiO2 and a reduction in visible light scattering governed
by Mie theory.7, 44 It is also an important criterion outlined by the SCCS to ensure that
the particle size fits with the number size distribution of 30 – 100 nm. As such, for the
remainder of this particular study, the hydrothermally synthesized rutile TiO2 discussed
is that prepared at 150oC using 16M HNO3 owing to its smaller particle size relative to
the 180oC treated sample. Furthermore, in accordance with SCCS criteria for cosmetic
TiO2 nanoparticles, the 150oC, 16M HNO3 hydrothermally prepared sample addresses
the crystal phase criteria by being composed solely of the rutile crystal phase. In addition,
the morphology and aspect ratio of these particles are in line with variants included in
the criteria ie being of lanceolate/needle shape and having an aspect ratio between 1.0 to
177

6.2 Results and Discussion
4.5 (calculated aspect ratio of 6±2 falls within this range based upon length and width
measurements as shown in Table 6.1).
Figure 6.4: EELS line profiles obtained for sample H6M. EELS profiling location shownin Figure F.1.
6.2.2 Comparative Performance of Hydrothermally Synthesized Ru-tile TiO2 and Nanocomposite CeO2/TiO2 Compared to Com-mercial Products as a Potential UV Filter
Materials Characterisation
Figure 6.5 depicts the XRD patterns for the commercial TiO2 powders, DP25 and SR,
as well as the as-prepared HTIO2 and CTIO2 nanoparticles. Of the samples tested, the
SR, HTIO2 and CTIO2 samples displayed single phase reflections, indexed to the rutile
crystal phase as expected. DP25 exhibited a mixed phase composition consisting of ap-
proximately 80% anatase to 20% rutile, which corroborates with previously published
findings for the material.635, 636 The lack of reflections due to a CeO2 impurity phase in
the CTIO2 sample could be a result of a lack of crystallinity but also due to the very low
loading of CeO2 expected. In fact, the weight loading percentage (wt%) of Ce relative to
Ti was determined to be 7±4 wt% as calculated through EDS (Figure F.4 and Table F.1).
The associated mean crystallite sizes and BET specific surface area values are listed in
178
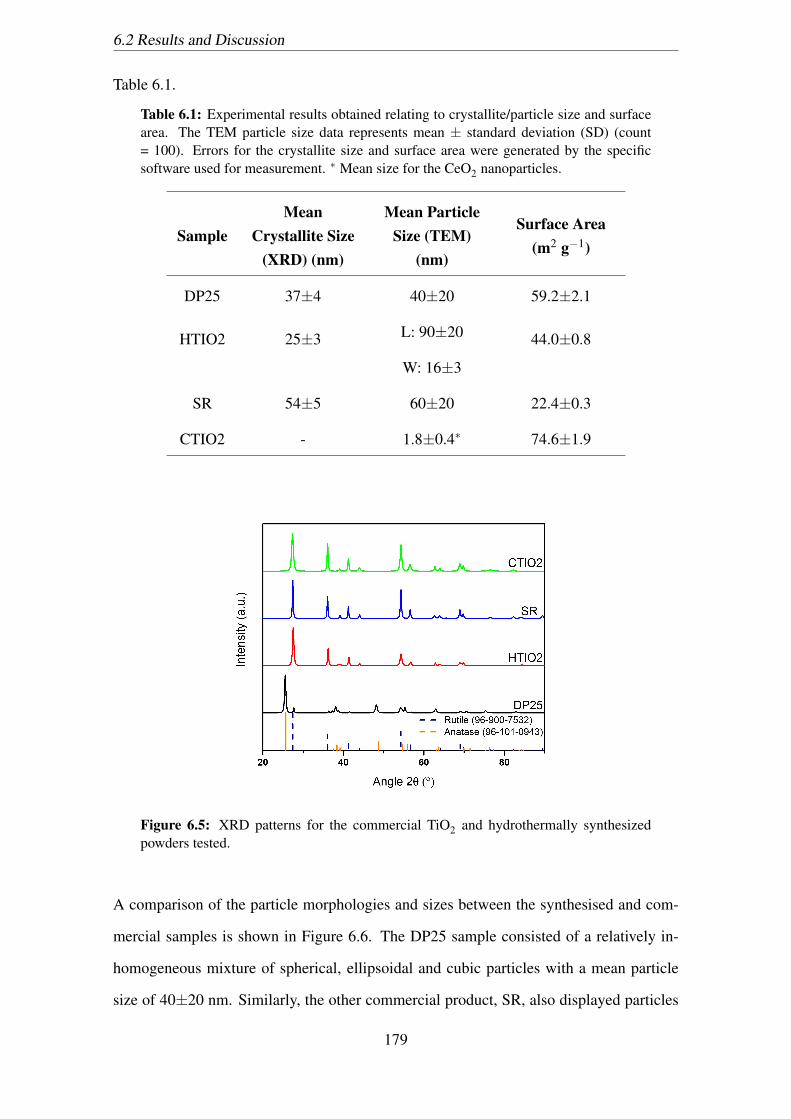
6.2 Results and Discussion
Table 6.1.
Table 6.1: Experimental results obtained relating to crystallite/particle size and surfacearea. The TEM particle size data represents mean ± standard deviation (SD) (count= 100). Errors for the crystallite size and surface area were generated by the specificsoftware used for measurement. ∗ Mean size for the CeO2 nanoparticles.
SampleMean
Crystallite Size(XRD) (nm)
Mean ParticleSize (TEM)
(nm)
Surface Area(m2 g−1)
DP25 37±4 40±20 59.2±2.1
HTIO2 25±3 L: 90±20
W: 16±3
44.0±0.8
SR 54±5 60±20 22.4±0.3
CTIO2 - 1.8±0.4∗ 74.6±1.9
Figure 6.5: XRD patterns for the commercial TiO2 and hydrothermally synthesizedpowders tested.
A comparison of the particle morphologies and sizes between the synthesised and com-
mercial samples is shown in Figure 6.6. The DP25 sample consisted of a relatively in-
homogeneous mixture of spherical, ellipsoidal and cubic particles with a mean particle
size of 40±20 nm. Similarly, the other commercial product, SR, also displayed particles
179
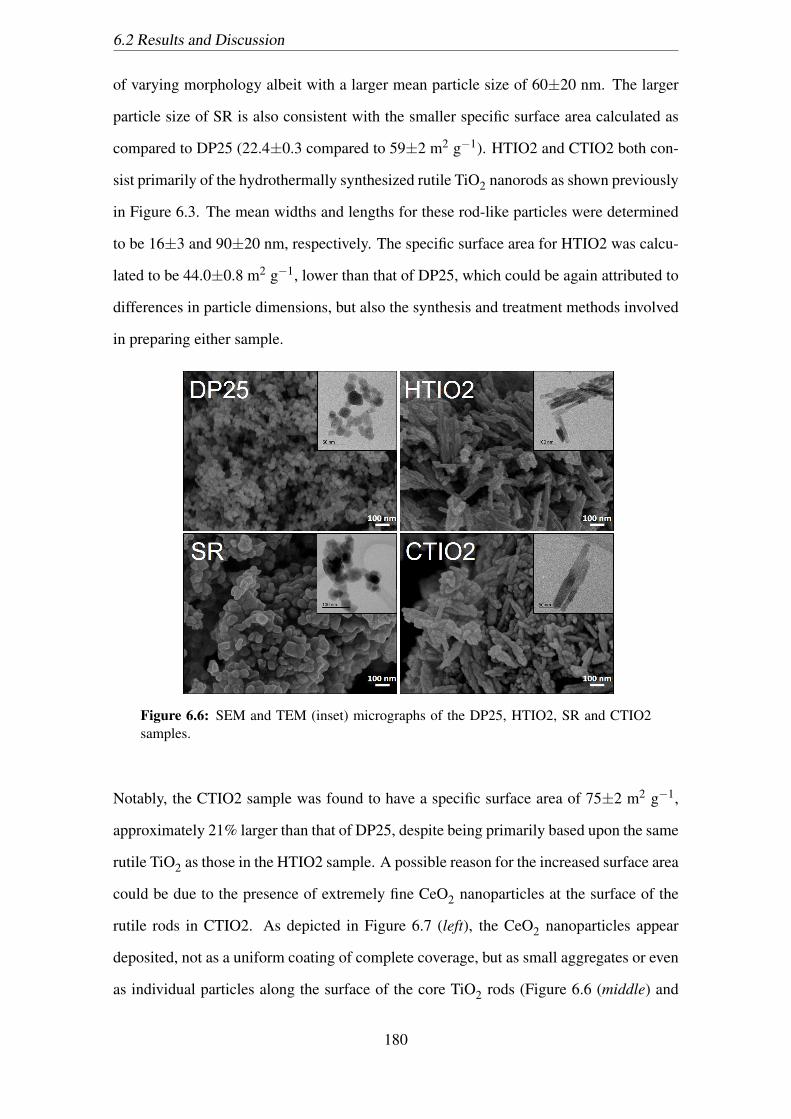
6.2 Results and Discussion
of varying morphology albeit with a larger mean particle size of 60±20 nm. The larger
particle size of SR is also consistent with the smaller specific surface area calculated as
compared to DP25 (22.4±0.3 compared to 59±2 m2 g−1). HTIO2 and CTIO2 both con-
sist primarily of the hydrothermally synthesized rutile TiO2 nanorods as shown previously
in Figure 6.3. The mean widths and lengths for these rod-like particles were determined
to be 16±3 and 90±20 nm, respectively. The specific surface area for HTIO2 was calcu-
lated to be 44.0±0.8 m2 g−1, lower than that of DP25, which could be again attributed to
differences in particle dimensions, but also the synthesis and treatment methods involved
in preparing either sample.
Figure 6.6: SEM and TEM (inset) micrographs of the DP25, HTIO2, SR and CTIO2samples.
Notably, the CTIO2 sample was found to have a specific surface area of 75±2 m2 g−1,
approximately 21% larger than that of DP25, despite being primarily based upon the same
rutile TiO2 as those in the HTIO2 sample. A possible reason for the increased surface area
could be due to the presence of extremely fine CeO2 nanoparticles at the surface of the
rutile rods in CTIO2. As depicted in Figure 6.7 (left), the CeO2 nanoparticles appear
deposited, not as a uniform coating of complete coverage, but as small aggregates or even
as individual particles along the surface of the core TiO2 rods (Figure 6.6 (middle) and
180
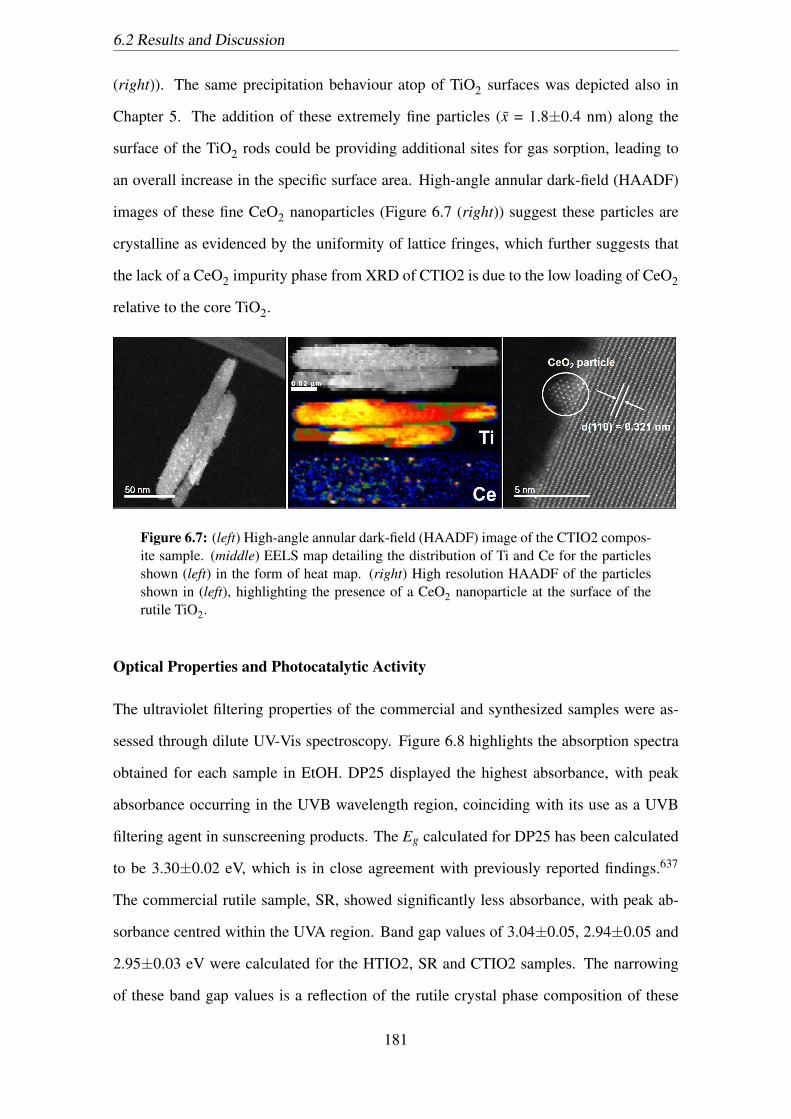
6.2 Results and Discussion
(right)). The same precipitation behaviour atop of TiO2 surfaces was depicted also in
Chapter 5. The addition of these extremely fine particles (x = 1.8±0.4 nm) along the
surface of the TiO2 rods could be providing additional sites for gas sorption, leading to
an overall increase in the specific surface area. High-angle annular dark-field (HAADF)
images of these fine CeO2 nanoparticles (Figure 6.7 (right)) suggest these particles are
crystalline as evidenced by the uniformity of lattice fringes, which further suggests that
the lack of a CeO2 impurity phase from XRD of CTIO2 is due to the low loading of CeO2
relative to the core TiO2.
Figure 6.7: (left) High-angle annular dark-field (HAADF) image of the CTIO2 compos-ite sample. (middle) EELS map detailing the distribution of Ti and Ce for the particlesshown (left) in the form of heat map. (right) High resolution HAADF of the particlesshown in (left), highlighting the presence of a CeO2 nanoparticle at the surface of therutile TiO2.
Optical Properties and Photocatalytic Activity
The ultraviolet filtering properties of the commercial and synthesized samples were as-
sessed through dilute UV-Vis spectroscopy. Figure 6.8 highlights the absorption spectra
obtained for each sample in EtOH. DP25 displayed the highest absorbance, with peak
absorbance occurring in the UVB wavelength region, coinciding with its use as a UVB
filtering agent in sunscreening products. The Eg calculated for DP25 has been calculated
to be 3.30±0.02 eV, which is in close agreement with previously reported findings.637
The commercial rutile sample, SR, showed significantly less absorbance, with peak ab-
sorbance centred within the UVA region. Band gap values of 3.04±0.05, 2.94±0.05 and
2.95±0.03 eV were calculated for the HTIO2, SR and CTIO2 samples. The narrowing
of these band gap values is a reflection of the rutile crystal phase composition of these
181
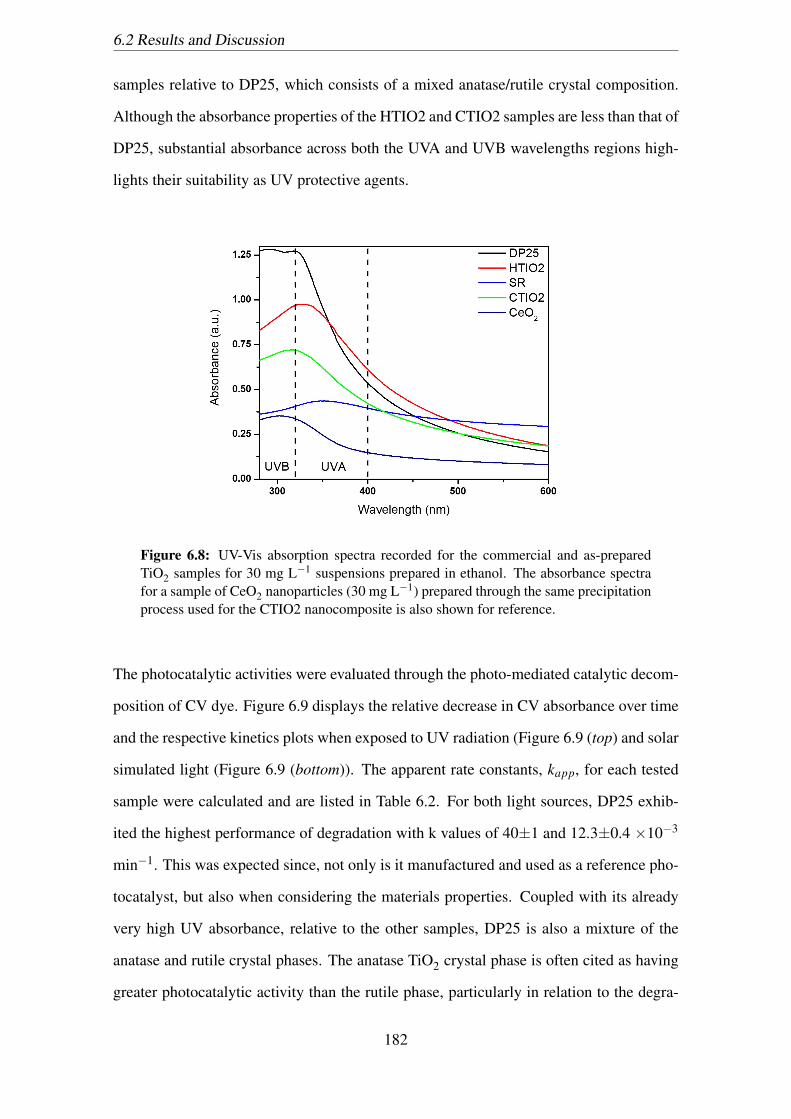
6.2 Results and Discussion
samples relative to DP25, which consists of a mixed anatase/rutile crystal composition.
Although the absorbance properties of the HTIO2 and CTIO2 samples are less than that of
DP25, substantial absorbance across both the UVA and UVB wavelengths regions high-
lights their suitability as UV protective agents.
Figure 6.8: UV-Vis absorption spectra recorded for the commercial and as-preparedTiO2 samples for 30 mg L−1 suspensions prepared in ethanol. The absorbance spectrafor a sample of CeO2 nanoparticles (30 mg L−1) prepared through the same precipitationprocess used for the CTIO2 nanocomposite is also shown for reference.
The photocatalytic activities were evaluated through the photo-mediated catalytic decom-
position of CV dye. Figure 6.9 displays the relative decrease in CV absorbance over time
and the respective kinetics plots when exposed to UV radiation (Figure 6.9 (top) and solar
simulated light (Figure 6.9 (bottom)). The apparent rate constants, kapp, for each tested
sample were calculated and are listed in Table 6.2. For both light sources, DP25 exhib-
ited the highest performance of degradation with k values of 40±1 and 12.3±0.4 ×10⁻³
min−1. This was expected since, not only is it manufactured and used as a reference pho-
tocatalyst, but also when considering the materials properties. Coupled with its already
very high UV absorbance, relative to the other samples, DP25 is also a mixture of the
anatase and rutile crystal phases. The anatase TiO2 crystal phase is often cited as having
greater photocatalytic activity than the rutile phase, particularly in relation to the degra-
182

6.2 Results and Discussion
dation of organic compounds under aerated conditions.638 It has also been reported that
mixed phase TiO2 displays even greater photocatalytic activity relative to either of the
single phases, depending on the composition.599 Sunscreen products in the past that have
used micronized TiO2 previously have been shown to contain particles of a similar crystal
phase composition to that of DP25. In fact, a study investigating the discolouration of
coated steel panels linked the usage of sunscreen products containing DP25-like TiO2 by
workers installing the panels to the early onset of degradation.53, 639 The reason for this
discolouration was attributed to the photocatalysed production of ROS or, more specif-
ically, OH•. As such, it is desirable to modify sunscreen based TiO2 in a manner that
mitigates this free radical production whilst also maintaining adequate protection from
UV radiation.
Table 6.2: Optical band gap (Eg) values and rate constants (kapp) determined for thesamples under UV and solar simulated irradiation.
Sample Eg (eV) Rate Constant kapp (×10−3)(min−1)
UV AM1.5G
DP25 3.30±0.02 40.4±1.1 12.31±0.44
HTIO2 3.04±0.05 10.1±0.3 3.63±0.05
SR 2.94±0.05 7.4±0.1 4.22±0.08
CTIO2 2.95±0.03 0.9±0.1 0.55±0.01
Samples HTIO2 and SR both displayed reduced UV and solar simulated light photocat-
alytic activities, as compared to DP25. A number of factors may be in play to explain
the observed results. To begin, both HTIO2 and SR are purely rutile which, as previously
mentioned, is often found to be less active than that of the anatase crystal phase. Another
factor involved, is the reduced absorbance by these samples across the UVA and UVB
bands relative to DP25. This means that the production of ROS will likely be reduced
due to the decreased excitation of the catalysing material through UV photon absorption.
Yet another factor to consider is the lower specific surface areas of HTIO2 and SR as
183

6.2 Results and Discussion
compared to DP25. In this instance, the reduced surface area means that there are fewer
surface active sites for the CV dye and free water based species (H2O, OH– , H3O+) to
adsorb to. This impairs the ability for the catalysing material to directly degrade the dye
or indirectly degrade it through the production of ROS, thus leading to a decrease in pho-
tocatalytic activity. Although lower in UV absorbance performance, taking into account
the reduced photocatalytic activity seen and the physical parameters in line with SCCS
criteria, the HTIO2 sample also, on its own, appears an ideal platform for conducting
future investigations into the surface modifications of sunscreen based TiO2 UV filters.
In the case of the CTIO2 sample, yet a further reduction in photocatalytic activity whilst
under either UV or solar simulated light was observed. As with HTIO2 and SR, CTIO2
also has weaker absorbance across the UV region as compared to DP25, however, the
surface area calculated for CTIO2 is much larger, which would suggest some other factor
is involved. Furthermore, a comparison of the UV absorptive properties of the CTIO2
nanocomposite as compared to pristine CeO2 nanoparticles (Figure 6.8) at the same con-
centration (30 mg L−1) reveals that the CeO2 imparts minimal additional UV absorbance
benefits, which was demonstrated also in Chapter 5. This is particularly apparent as the
actual loading of CeO2 in the CTIO2 nanocomposite (7±4 wt%) is significantly lower
than the amount of CeO2 present in the UV Vis absorbance measurements of the CeO2
nanoparticles. As such, the contribution of the CeO2 nanoparticles in the CTIO2 sample
towards the decreased photocatalytic activity observed due to UV ’blockin’ is relatively
small. Instead, deposition of CeO2 nanoparticles on the surface of the rutile TiO2 rods
in CTIO2 could be providing a means of inhibiting free radical production or scaveng-
ing free radicals before degradation may occur. Indeed, CeO2 nanoparticles have been
reported to behave as an antioxidant as a result of a large number of surface defect sites.
These defect sites enable the reversible oxidation/reduction of the cerium cation by inter-
action with surface adsorbed molecules, enabling scavenging of free radical species.500
It has also been suggested that the size of the CeO2 nanoparticles can impact this free-
radical scavenging ability, whereby, as the particle size decreases, the antioxidant activity
increases.62, 596 The presence of CeO2 in CTIO2 is thus enabling free radical scavenging
184

6.2 Results and Discussion
of photogeneraed ROS whilst also blocking surface active sites on the core rutile TiO2
particles for adsorption of other molecules. This scavenging and blocking interplay is not
perfect however, as evidenced by the small degradation that still occurs under both light
sources, but is certainly much improved compared to DP25, HTIO2 and SR. Combined
with its absorbance across the UVA and UVB regions, the material shows great potential
as a new active sunscreening ingredient. The very low photocatalytic activity observed
for the CTIO2 sample also addresses another important SCCS criteria in relation to TiO2
nanoparticle cosmetic use. Ideally, new TiO2 based UV filters should have no photocat-
alytic activity, however, the SCCS considers up to 10% activity relative to a standard or
corresponding un-coated/un-doped reference to be acceptable. In this instance, CTIO2
displays up to 2% (UV light) and 4% (solar simulated light) of the photocatalytic activity
of DP25, a material with a crystal phase composition exact to that of a previously used
commercial TiO2 UV filter (these percentages are based upon the calculated rate constants
listed in Table 6.2).53 Compared to the uncoated form, HTIO2, the composite sample is
also substantially low in activity (9% and 15% under UV and solar simulated light), fur-
ther emphasizing its applicability as a potential UV filter in sunscreening products.
185
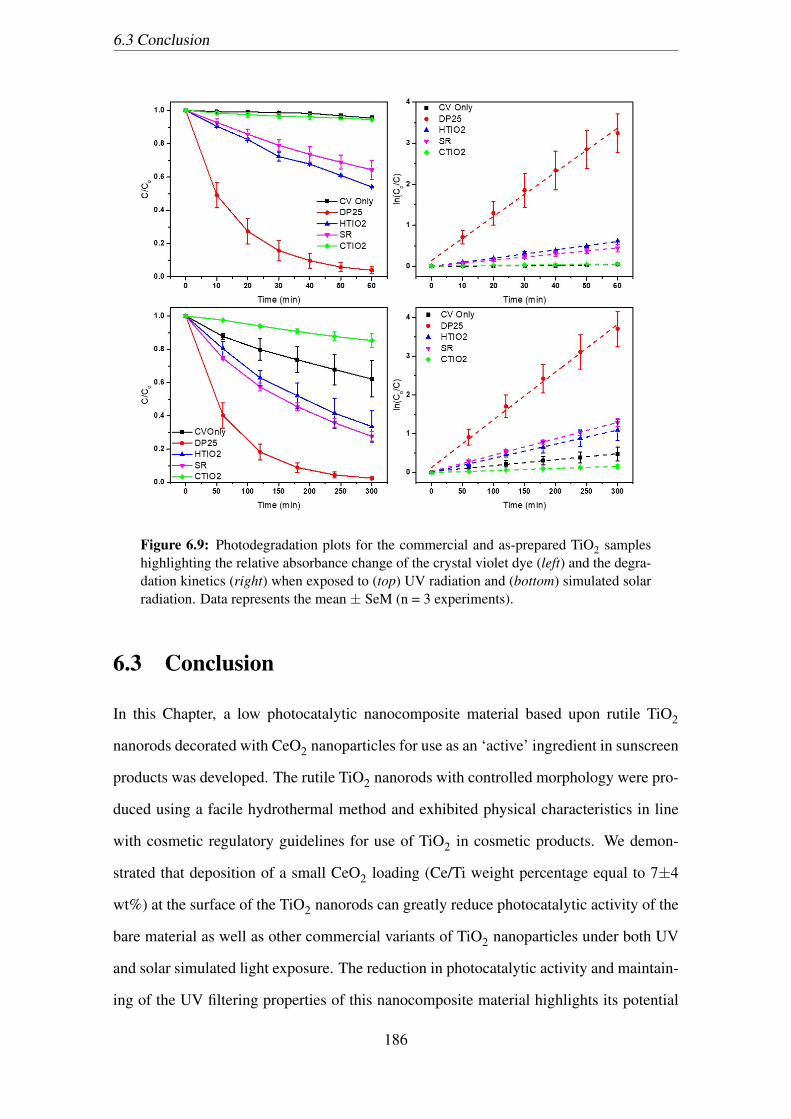
6.3 Conclusion
Figure 6.9: Photodegradation plots for the commercial and as-prepared TiO2 sampleshighlighting the relative absorbance change of the crystal violet dye (left) and the degra-dation kinetics (right) when exposed to (top) UV radiation and (bottom) simulated solarradiation. Data represents the mean ± SeM (n = 3 experiments).
6.3 Conclusion
In this Chapter, a low photocatalytic nanocomposite material based upon rutile TiO2
nanorods decorated with CeO2 nanoparticles for use as an ‘active’ ingredient in sunscreen
products was developed. The rutile TiO2 nanorods with controlled morphology were pro-
duced using a facile hydrothermal method and exhibited physical characteristics in line
with cosmetic regulatory guidelines for use of TiO2 in cosmetic products. We demon-
strated that deposition of a small CeO2 loading (Ce/Ti weight percentage equal to 7±4
wt%) at the surface of the TiO2 nanorods can greatly reduce photocatalytic activity of the
bare material as well as other commercial variants of TiO2 nanoparticles under both UV
and solar simulated light exposure. The reduction in photocatalytic activity and maintain-
ing of the UV filtering properties of this nanocomposite material highlights its potential
186

6.3 Conclusion
for application in sunscreen products.
187

Chapter 7
Conclusion and Future Work
Ultraviolet radiation exposure is a known carcinogen and, with the ever increasing number
of incidences of skin cancers occurring each year, the application of sunscreen products
containing ultraviolet filters has become an important part of minimising and preventing
skin-related diseases. There is also an never-ending need to develop and implement new
ultraviolet filters that provide improved protection and long-term stability which, although
important for all general consumers, is particularly important for populaces in countries
that experience above-average yearly doses of ultraviolet radiation such as Australia. Re-
cently, concerns amongst consumers and the scientific community have been raised over
the application of inorganic ultraviolet filtering nanoparticles in these products. Studies
investigating the potential penetration of these nanoparticles through human skin after
topical application have suggested that the particles are unlikely to reach viable skin cells,
however, concerns over the free radical generating capabilities of these nanoparticles re-
quires attention. In particular, sunscreen nanoparticles based on certain compositions of
TiO2 have been shown to exert significant oxidative potential through the photo-induced
generation of reactive oxygen species. This oxidative potential has also been shown to
have an impact on viable mammalian cells, inducing states of oxidative stress and apop-
tosis. To counteract this photocatalytic activity, manufacturers may coat sunscreen based
titanium dioxide nanoparticles with inert materials, however this can also be detrimental
to the ultraviolet filtering properties of the resultant nanoparticles. As such, the purpose
of this thesis was to address this issue and attempt to develop titanium dioxide based
188
nanocomposite materials with excellent ultraviolet filtering capabilities and diminished
photocatalytic potential.
Manufacturers will commonly employ coating materials based upon silicon and alu-
minium oxides, hydroxides and stearates. The use of polymeric coatings have also been
explored in literature, with one such promising candidate being chitosan, and forms the
basis for the first major chapter of this thesis work. Through a spray-drying technique,
chitosan particles and chitosan/TiO2 nanocomposite particles were successfully produced.
Using a commercial-grade photocatalysis TiO2 powder for the core nanoparticles, the
thermal, optical and photocatalytic properties were assessed. The resulting nanocompos-
ite particles obtained featured TiO2-load dependent encapsulation efficiency, with exces-
sive loading leading to the presence of excess TiO2 nanoparticles at the surface of the
chitosan shell. As such, a more optimal TiO2 loading was found when the weight ratio
of TiO2 to chitosan was 1:1. No modification to the TiO2 crystal phase was observed as
a result of the chitosan encapsulation, whilst Fourier-transform infrared spectroscopy re-
vealed characteristic absorption peaks attributed to chitosan and TiO2 vibrational modes.
A decrease in the activation energy for thermal degradation of chitosan in the nanocom-
posite samples, as compared to the pristine chitosan particles, suggested a decrease in
thermal stability in the nanocomposite samples. Examination of the UV filtering proper-
ties of the nanocomposite samples through diffuse reflectance revealed a slight red-shift
in major absorbance into the UVA region, which was significant considering the primarily
UVB absorbing properties of pristine TiO2 nanoparticles. However, the chitosan encapsu-
lation also introduced increased visible light absorption, leading to significant colouration
of the powders obtained. Assessment of the photocatalytic activity of the nanocompos-
ite particles compared to both pristine chitosan and TiO2 revealed a major reduction in
activity. As such, the work demonstrated the potential for an organic polymer, namely
chitosan, to be employed as an encapsulating agent for sunscreen based TiO2 nanoparti-
cles. Further examination of the UV protective ability of these nanocomposite particles
requires addressing however, with incorporation into a sunscreen formulation and the
subsequent sun protection factor evaluated. In addition, emulsion characteristics such as
189

suspension stability, chemical stability and interaction with other formulation ingredients
must be assessed, particularly under prolonged exposure to ultraviolet radiation.
The next chapter of this thesis work involved investigation of CeO2 nanoparticles as
a coating/partial coating of TiO2 nanoparticles. Literature reports of CeO2 nanoparti-
cles and their influence on viable mammalian cell lines have demonstrated its potential
biomimetic antioxidant activity. CeO2 nanoparticles have also been demonstrated to dis-
play UV filtering properties and thus could play a dual-role as a coating material for
sunscreen based TiO2. Commercial-grade photocatalysis TiO2 nanoparticles were deco-
rated with chemically precipitated CeO2 nanodots at different atomic concentrations of
Ce to Ti. Increased loading of the CeO2 nanodots resulted in the increased presence of
CeO2 aggregates atop the core TiO2 nanoparticles, with the CeO2 particle size increasing
up to 5 nm in diameter. Although the UV absorptive properties of the nanocomposite
samples were decreased as compared to the pristine TiO2 nanoparticles, substantial UV
absorbance was still observed. In addition, the potential free radical scavenging properties
of the CeO2 nanodots were demonstrated through the ultraviolet and solar-simulated light
driven photochemical degradation of crystal violet dye. A significant reduction in the
photocatalytic potential of the nanocomposite samples compared to pristine TiO2 was ob-
served and did not coincide with the still significant UV absorbance measured. This could
suggest that some other UV blocking mechanism is at effect and could be due to scaveng-
ing of reactive species generated by the core TiO2 nanoparticles by the decorating CeO2
nanodots. The potential cytotoxic and phototoxic properties under ultraviolet illumination
of the nanocomposite and the pristine components were evaluated towards the HaCaT hu-
man skin cell line. It was found that, for both the nanocomposite and pristine CeO2
samples that toxicity was minimal and that the changes in cell viability were insignificant
as compared to the control. The potent phototoxic potential of pristine TiO2 nanoparticles
was shown through the reduced cell viability measured and was significantly different as
compared to the control and the nanocomposite and pristine CeO2 samples. Thus, the
work performed demonstrates that the application of CeO2 nanodots to TiO2 can have
a substantially beneficial effect in improving biocompatibility of sunscreen based TiO2
190
nanoparticles through the reduction of photocatalytic activity. Translation of this dimin-
ished photocatalytic activity to specific crystal phase compositions of TiO2 needs to be
addressed to ensure applicability of the nanocomposite as an active ingredient in sun-
screen products and is the focus of the last major chapter of this thesis work.
The crystal phase composition, particle morphology, ultraviolet filtering and photocat-
alytic properties of sunscreen based TiO2 nanoparticles are key properties with specific
criteria outlined by various governmental regulating bodies. To address these criteria, a
hydrothermal synthesis method was employed to synthesize rutile TiO2 nanoparticles of
elongated shape, substantial ultraviolet absorbance and reduced photocatalytic activity as
compared to other TiO2 crystal phases/compositions. Employing nitric acid as a digesting
and coordinating agent, the optimal conditions for obtaining rutile TiO2 were determined
to be with 16 M nitric acid at 150oC for 24 hr. Other synthesis conditions either yielded
mixed phases of TiO2 consisting of the rutile, anatase and brookite crystal phases or pro-
duced particles of sizes larger than 100 nm in all directions. Subsequently, these rutile
nanoparticles were decorated with CeO2 nanodots in a similar manner to those prepared
in the prior chapter and the ultraviolet filtering and photocatalytic properties assessed.
The CeO2/rutile TiO2 nanocomposite displayed excellent ultraviolet absorption albeit,
to a lesser extent as compared to the pristine rutile TiO2 and commercial-grade photo-
catalysis TiO2 nanoparticles. However, the significantly reduced photocatalytic activity
of the nanocomposite under both ultraviolet and solar-simulated light irradiation, out of
line with its ultraviolet absorption properties, further highlights the potential free radi-
cal scavenging properties of CeO2 and its applicability as a coating for sunscreen based
TiO2 nanoparticles. To further complement the work performed, incorporation of the
nanocomposite into sunscreen emulsions must be performed to assess the sun protective
and ultraviolet A protective factors. Furthermore, to appease consumer concerns over the
use of nanoparticles in such cosmetic and therapeutic sunscreen products and to further
demonstrate the biocompatibility of the nanocomposite material produced, both in vivo
and ex vivo dermal penetration experiments must be performed. Finally, a deeper under-
standing of the mechanism behind the reduction in photocatalytic potential imparted by
191
the CeO2 nanoparticles must be investigated. Studies employing electron paramagnetic
resonance could be employed to directly observed and demonstrate the free radical scav-
enging properties of CeO2 and add further weight to its potential application in sunscreen
products as an active coating ingredient and antioxidant compound.
192
Bibliography
[1] Feynman, R. P. In APS Annual Meeting, (1959).
[2] Binnig, G., Rohrer, H., Gerber, C., and Weibel, E. Physical Review Letters 49(1),
57 (1982).
[3] Taniguchi, N. In Proceedings of the International Conference on Production Engi-
neering, 18–23. Japan Society of Precision Engineering, (1974).
[4] Eustis, S. and El-Sayed, M. A. Chemical Society Reviews 35, 209–217 (2006).
[5] Raliya, R., Saha, D., Chadha, T., Raman, B., and Biswas, P. Scientific Reports 7,
44718 (2017).
[6] Wilkinson, L., White, R., and Chipman, J. Journal of Wound Care 20(11), 543–549
(2011).
[7] Smijs, T. G. and Pavel, S. Nanotechnology, Science and Applications 4, 95–112
(2011).
[8] Roy, P. and Srivastava, S. K. Journal of Materials Chemistry A 3(6), 2454–2484
(2015).
[9] Barkan, T. Nature Nanotechnology 14(10), 904–906 (2019).
[10] Faunce, T. A. Medical Journal of Australia 186(4), 189–191 (2007).
[11] Bobo, D., Robinson, K. J., Islam, J., Thurecht, K. J., and Corrie, S. R. Pharmaceu-
tical Research 33(10), 2373–2387 (2016).
193

BIBLIOGRAPHY BIBLIOGRAPHY
[12] Allen, T. M. and Cullis, P. R. Advanced Drug Delivery Reviews 65(1), 36–48
(2013).
[13] Nowack, B. and Bucheli, T. D. Environmental Pollution 150(1), 5 – 22 (2007).
[14] Rothen-Rutishauser, B. M., Schurch, S., Haenni, B., Kapp, N., and Gehr, P. Envi-
ronmental Science & Technology 40(14), 4353–4359 (2006).
[15] Smart, S., Cassady, A., Lu, G., and Martin, D. Carbon 44(6), 1034–1047 (2006).
[16] Nel, A., Xia, T., Madler, L., and Li, N. Science 311(5761), 622–627 (2006).
[17] Diffey, B. L. Methods 28(1), 4 – 13 (2002).
[18] Coblentz, W. Science 76(1975), 412–415 (1932).
[19] Gies, P. Clinical and Experimental Optometry 86(2), 71–73 (2003).
[20] Gies, P., Roy, C., Javorniczky, J., Henderson, S., Lemus-Deschamps, L., and
Driscoll, C. Photochemistry and Photobiology 79(1), 32–39 (2004).
[21] Fioletov, V., Kerr, J. B., and Fergusson, A. Canadian Journal of Public Health
101(4), I5–9 (2010).
[22] World Health Organisation, Word Meteorological Organisation, United Nations
Environment Programme, International Commission on Non-Ionizing Radiation
Protection, Global solar uV index: a practical guide, (2002). http://www.who.
int/iris/handle/10665/42459, (viewed 13/2/18).
[23] Lucas, R., McMichael, T., Smith, W., Armstrong, B.K, Pruss-Ustun, A and World
Health Organization, Solar ultraviolet radiation: global burden of disease from so-
lar ultraviolet radiation, Environmental Burden of Disease Series, No. 13. (2006).
[24] Carey, R. N., Glass, D. C., Peters, S., Reid, A., Benke, G., Driscoll, T. R., and
Fritschi, L. Australian and New Zealand Journal of Public Health 38(1), 54–59
(2014).
194

BIBLIOGRAPHY BIBLIOGRAPHY
[25] Gies, P., Roy, C., Javorniczky, J., Henderson, S., Lemus-Deschamps, L., and
Driscoll, C. Photochemistry and Photobiology 79(1), 32–39 (2004).
[26] Tropospheric Emission Monitoring Internet Service, Royal Netherlands Meteoro-
logical Institute. http://www.temis.nl/uvradiation/UVindex.html, (2016
(viewed 25/3/16).
[27] Fisher, G. J., Kang, S., Varani, J., Bata-Csorgo, Z., Wan, Y., Datta, S., and
Voorhees, J. J. JAMA Dermatology 138(11), 1462–1470 11 (2002).
[28] Simon, J., Mosmann, T., Edelbaum, D., Schopf, E., Bergstresser, P., and Cruz, P.
Photodermatology, Photoimmunology & Photomedicine 10(5), 206—211 October
(1994).
[29] McCord, J. M. and Fridovich, I. Journal of Biological Chemistry 244(22), 6049–
6055 (1969).
[30] Starkov, A. A. Annals of the New York Academy of Sciences 1147, 37 (2008).
[31] Marnett, L. J. Carcinogenesis 21(3), 361–370 (2000).
[32] Nordberg, J. and Arner, E. S. Free Radical Biology and Medicine 31(11), 1287–
1312 (2001).
[33] Valko, M., Rhodes, C., Moncol, J., Izakovic, M., and Mazur, M. Chemico-
biological Interactions 160(1), 1–40 (2006).
[34] Manniche, L. Egyptian Luxuries: Fragrance, aromatherapy, and cosmetics in
pharaonic times. American University in Cairo Press, (1999).
[35] Schalka, S. and Reis, V. M. S. d. Anais Brasileiros de Dermatologia 86(3), 507–
515 (2011).
[36] Cancer Council Victoria, Slip! Slop! Slap! Original SunSmart Campaign, (2019).
https://www.sunsmart.com.au/tools/videos/past-tv-campaigns/
slip-slop-slap-original-sunsmart-campaign.html, (viewed 25/2/20).
195

BIBLIOGRAPHY BIBLIOGRAPHY
[37] Jenkins, H., Almost half of Australians confused about sunscreens,
(2020). https://www.cancer.org.au/news/media-releases/
almost-half-of-australians-confused-about-sunscreen.html, (viewed
25/2/20).
[38] Gregory, K., Hawaii bans sunscreens with chemicals that damage coral reefs,
but Australia reluctant to follow, (2018). https://www.abc.net.au/news/
2018-05-04/hawaii-bans-sunscreen-coral-bleaching/9728322, (viewed
22/1/20).
[39] Culliney, K., L’Oreal funds reviews to debunk safety concerns on
’often misrepresented yet fundamental’ cosmetic substances, (2019).
https://www.cosmeticsdesign-europe.com/Article/2019/10/15/
L-Oreal-funded-scientific-reviews-analyse-safety-ofmineral-oils/
-preservatives-and-UV-filters, (viewed 26/2/20).
[40] Signe, D., What’s the deal with nanoparticles in sunscreen?, (2019).
https://www.sbs.com.au/topics/science/fundamentals/explainer/
whats-deal-nanoparticles-sunscreen, (viewed 26/2/20).
[41] Sales, L., What’s the story with nanoparticles in sunscreen?, (2020).
https://www.foe.org.au/whats-story-nanoparticles-sunscreen,
(viewed 25/2/20).
[42] Therapeutic Goods Administration, Sunscreens: information for
consumers, (2020). https://www.tga.gov.au/community-qa/
sunscreens-information-consumers, (viewed 16/1/20).
[43] Dransfield, G. Radiation Protection Dosimetry 91(1-3), 271–273 (2000).
[44] Schilling, K., Bradford, B., Castelli, D., Dufour, E., Nash, J. F., Pape, W., Schulte,
S., Tooley, I., van den Bosch, J., and Schellauf, F. Photochemical & Photobiologi-
cal Sciences 9, 495–509 (2010).
196
BIBLIOGRAPHY BIBLIOGRAPHY
[45] Oberdorster, G., Oberdorster, E., and Oberdorster, J. Environmental Health Per-
spectives 113(7), 823–839 (2005).
[46] O’Regan, B. and Gratzel, M. Nature 353(6346), 737–740 (1991).
[47] Sayes, C. M., Wahi, R., Kurian, P. A., Liu, Y., West, J. L., Ausman, K. D., Warheit,
D. B., and Colvin, V. L. Toxicological Sciences 92(1), 174–185 (2006).
[48] Deng, X., Luan, Q., Chen, W., Wang, Y., Wu, M., Zhang, H., and Jiao, Z. Nan-
otechnology 20(11), 115101 (2009).
[49] Lee, K., Trochimowicz, H., and Reinhardt, C. Toxicology and Applied Pharmacol-
ogy 79(2), 179 – 192 (1985).
[50] Warheit, D., Sayes, C., and Reed, K. Environmental Science & Technology 43(20),
7939–7945 (2009).
[51] Uchino, T., Tokunaga, H., Ando, M., and Utsumi, H. Toxicology in Vitro 16(5),
629 – 635 (2002).
[52] Jang, Y. S., Lee, E. Y., Park, Y.-H., Jeong, S. H., Lee, S. G., Kim, Y.-R., Kim,
M.-K., and Son, S. W. Molecular & Cellular Toxicology 8(2), 171–177 (2012).
[53] Barker, P. J. and Branch, A. Progress in Organic Coatings 62(3), 313 – 320 (2008).
[54] Therapeutic Goods Administration, Literature review on the safety of titanium
dioxide and zinc oxide nanoparticles in sunscreens, (2017). (viewed 22/5/17).
[55] Belver, C., Bedia, J., Alvarez Montero, M., and Rodriguez, J. Catalysis Today
266, 36 – 45 (2016). Novel nanomaterials for photocatalysis, photochemistry, and
photobiology.
[56] Kim, S. M., In, I., and Park, S. Y. Surface and Coatings Technology 294, 75 – 82
(2016).
[57] Xue, C., Wu, J., Lan, F., Liu, W., Yang, X., Zeng, F., and Xu, H. Journal of
Nanoscience and Nanotechnology 10(12), 8500–8507 (2010).
197
BIBLIOGRAPHY BIBLIOGRAPHY
[58] Ricci, A., Chretien, M. N., Maretti, L., and Scaiano, J. C. Photochemical & Pho-
tobiological Sciences 2, 487–492 (2003).
[59] Carlotti, M. E., Ugazio, E., Sapino, S., Fenoglio, I., Greco, G., and Fubini, B. Free
Radical Research 43(3), 312–322 (2009).
[60] Bai, Y., Li, Z., Cheng, B., Zhang, M., and Su, K. RSC Advances 7(35), 21758–
21767 (2017).
[61] Truffault, L., Ta, M.-T., Devers, T., Konstantinov, K., Harel, V., Simmonard, C.,
Andreazza, C., Nevirkovets, I. P., Pineau, A., Veron, O., and Blondeau, J.-P. Mate-
rials Research Bulletin 45(5), 527 – 535 (2010).
[62] Cardillo, D., Weiss, M., Tehei, M., Devers, T., Rosenfeld, A., and Konstantinov, K.
RSC Advances 6, 65397–65402 (2016).
[63] Morlando, A., Sencadas, V., Cardillo, D., and Konstantinov, K. Powder Technology
329, 252 – 259 (2018).
[64] Deng, Y., Ediriwickrema, A., Yang, F., Lewis, J., Girardi, M., and Saltzman, W.
Nature Materials 14, 1278 – 1285 (2015).
[65] Tolbert, S. H., McFadden, P. D., and Loy, D. A. ACS Applied Materials & Inter-
faces 8(5), 3160–3174 (2016). PMID: 26730573.
[66] Therapeutic Goods Administration, Australian regulatory guidelines for
sunscreens (ARGS), (2020). https://www.tga.gov.au/community-qa/
sunscreens-information-consumers, (viewed 16/1/20).
[67] Chaudhry, Q. Regulatory Toxicology and Pharmacology 73(2), 669–670 (2015).
[68] Scientific Committee on Consumer Safety, Opinion on titanium dioxide
(nano form) Colipa No S75. SCCS/1516/13. Revision 22/04/2014, (2014).
https://ec.europa.eu/health/scientific_committees/consumer_
safety/docs/sccs_o_136.pdf, (viewed 26/2/20).
198
BIBLIOGRAPHY BIBLIOGRAPHY
[69] Kripke, M. L. Speculations on the role of ultraviolet radiation in the development
of malignant melanoma. Oxford University Press, (1979).
[70] Wacker, M. and Holick, M. F. Dermato-Endocrinology 5(1), 51–108 (2013).
PMID: 24494042.
[71] Garibyan, L. and Fisher, D. E. Current Oncology Reports 12(5), 319–326 Sep
(2010).
[72] Sivamani, R. K., Crane, L. A., and Dellavalle, R. P. Dermatologic Clinics 27(2),
149 – 154 (2009). Dermatologic Epidemiology and Public Health.
[73] Albert, M. R. and Ostheimer, K. G. Journal of the American Academy of Derma-
tology 47(6), 930 – 937 (2002).
[74] Lobo, V., Patil, A., Phatak, A., and Chandra, N. Pharmacognosy Reviews 4(8),
118–126 (2010).
[75] Cheeseman, K. H. and Slater, T. F. British Medical Bulletin 49(3), 481–493 09
(1993).
[76] Mukherji, S. and Singh, S. P. Reaction mechanism in organic chemistry. Macmil-
lan, (1984).
[77] Lipinski, B. Oxidative Medicine and Cellular Longevity 2011 (2011).
[78] Cheng, F.-C., Jen, J.-F., and Tsai, T.-H. Journal of Chromatography B 781(1), 481
– 496 (2002).
[79] Michaels, H. B. and Hunt, J. W. Radiation Research 56(1), 57–70 (1973).
[80] Imlay, J. A. Annual Review of Biochemistry 77, 755–776 (2008).
[81] Valko, M., Leibfritz, D., Moncol, J., Cronin, M. T., Mazur, M., and Telser, J. The
International Journal of Biochemistry & Cell Biology 39(1), 44–84 (2007).
[82] Phaniendra, A., Jestadi, D. B., and Periyasamy, L. Indian Journal of Clinical
Biochemistry 30(1), 11–26 (2015).
199
BIBLIOGRAPHY BIBLIOGRAPHY
[83] Yla-Herttuala, S. Annals of the New York Academy of Sciences 874(1), 134–137
(1999).
[84] Stadtman, E. R. and Levine, R. L. Annals of the New York Academy of Sciences
899(1), 191–208 (2000).
[85] Datla, S. R. and Griendling, K. K. Hypertension 56(3), 325–330 (2010).
[86] Bayr, H. Critical Care Medicine 33(12), S498–S501 (2005).
[87] Urakawa, H., Katsuki, A., Sumida, Y., Gabazza, E. C., Murashima, S., Morioka,
K., Maruyama, N., Kitagawa, N., Tanaka, T., Hori, Y., et al. The Journal of Clinical
Endocrinology & Metabolism 88(10), 4673–4676 (2003).
[88] Bonaventura, C., Henkens, R., Alayash, A. I., Banerjee, S., and Crumbliss, A. L.
Antioxidants & Redox Signaling 18(17), 2298–2313 (2013).
[89] Quaye, I. K. Frontiers in Physiology 6, 96 (2015).
[90] Griendling, K. K. and FitzGerald, G. A. Circulation 108(16), 1912–1916 (2003).
[91] Pacher, P., Beckman, J. S., and Liaudet, L. Physiological Reviews 87(1), 315–424
(2007). PMID: 17237348.
[92] Veal, E. A., Day, A. M., and Morgan, B. A. Molecular cell 26(1), 1–14 (2007).
[93] Murphy, M. P. Biochemical Journal 417(1), 1–13 (2009).
[94] Winterbourn, C. C. Encyclopedia of Radicals in Chemistry, Biology and Materials
(2012).
[95] Winterbourn, C. C. Antioxidants & Redox Signaling 29(6), 541–551 (2018).
PMID: 29113458.
[96] Messner, K. R. and Imlay, J. A. Journal of Biological Chemistry 274(15), 10119–
10128 (1999).
[97] Messner, K. R. and Imlay, J. A. Journal of Biological Chemistry 277(45), 42563–
42571 (2002).
200
BIBLIOGRAPHY BIBLIOGRAPHY
[98] Halliwell, B. The FASEB Journal 1(5), 358–364 (1987).
[99] Thomas, C., Mackey, M. M., Diaz, A. A., and Cox, D. P. Redox Report 14(3),
102–108 (2009).
[100] Dartnell, L. R. Astrobiology 11(6), 551–582 (2011).
[101] Imlay, J. A. Annual Review of Microbiology 57(1), 395–418 (2003). PMID:
14527285.
[102] Svensmark, H. Astronomische Nachrichten 327(9), 871–875 (2006).
[103] Pham-Huy, L. A., He, H., and Pham-Huy, C. International Journal of Biomedical
Science 4(2), 89–96 (2008).
[104] Rhee, S. G. Science 312(5782), 1882–1883 (2006).
[105] Oakley, F. D., Abbott, D., Li, Q., and Engelhardt, J. F. Antioxidants & Redox
Signaling 11(6), 1313–1333 (2009).
[106] D’Autreaux, B. and Toledano, M. B. Nature Reviews Molecular Cell Biology 8(10),
813 (2007).
[107] Foreman, J., Demidchik, V., Bothwell, J. H., Mylona, P., Miedema, H., Torres,
M. A., Linstead, P., Costa, S., Brownlee, C., Jones, J. D., et al. Nature 422(6930),
442 (2003).
[108] Geiszt, M. and Leto, T. L. Journal of Biological Chemistry 279(50), 51715–51718
(2004).
[109] Sauer, H., Rahimi, G., Hescheler, J., and Wartenberg, M. FEBS Letters 476(3),
218–223 (2000).
[110] Cai, H. Cardiovascular Research 68(1), 26–36 (2005).
[111] Sablina, A. A., Budanov, A. V., Ilyinskaya, G. V., Agapova, L. S., Kravchenko,
J. E., and Chumakov, P. M. Nature Medicine 11(12), 1306 (2005).
[112] Storz, G., Tartaglia, L. A., and Ames, B. N. Science 248(4952), 189–194 (1990).
201
BIBLIOGRAPHY BIBLIOGRAPHY
[113] Sareila, O., Kelkka, T., Pizzolla, A., Hultqvist, M., and Holmdahl, R. Antioxidants
& Redox Signaling 15(8), 2197–2208 (2011).
[114] Reth, M. Nature Immunology 3(12), 1129–1134 (2002).
[115] Yang, Y., Bazhin, A. V., Werner, J., and Karakhanova, S. International Reviews of
Immunology 32(3), 249–270 (2013).
[116] Lam, G. Y., Huang, J., and Brumell, J. H. In Seminars in Immunopathology, vol-
ume 32, 415–430. Springer, (2010).
[117] Lambeth, J. D. Nature Reviews Immunology 4(3), 181–189 (2004).
[118] Reeves, E. P., Lu, H., Jacobs, H. L., Messina, C. G., Bolsover, S., Gabella, G.,
Potma, E. O., Warley, A., Roes, J., and Segal, A. W. Nature 416(6878), 291–297
(2002).
[119] Rhee, S. G., Woo, H. A., Kil, I. S., and Bae, S. H. Journal of Biological Chemistry
287(7), 4403–4410 (2012).
[120] Patlevic, P., Vaskova, J., Svorc, P., Vasko, L., and Svorc, P. Integrative Medicine
Research 5(4), 250 – 258 (2016).
[121] Murphy, M. P., Holmgren, A., Larsson, N.-G., Halliwell, B., Chang, C. J., Kalya-
naraman, B., Rhee, S. G., Thornalley, P. J., Partridge, L., Gems, D., Nystrom, T.,
Belousov, V., Schumacker, P. T., and Winterbourn, C. C. Cell Metabolism 13(4),
361 – 366 (2011).
[122] Rajendran, P., Nandakumar, N., Rengarajan, T., Palaniswami, R., Gnanadhas,
E. N., Lakshminarasaiah, U., Gopas, J., and Nishigaki, I. Clinica Chimica Acta
436, 332–347 (2014).
[123] Woo, H. A., Yim, S. H., Shin, D. H., Kang, D., Yu, D.-Y., and Rhee, S. G. Cell
140(4), 517 – 528 (2010).
[124] Ferreira, C. A., Ni, D., Rosenkrans, Z. T., and Cai, W. Nano Research 11(10),
4955–4984 Oct (2018).
202
BIBLIOGRAPHY BIBLIOGRAPHY
[125] Nimse, S. B. and Pal, D. RSC Advances 5(35), 27986–28006 (2015).
[126] Stinefelt, B., Leonard, S. S., Blemings, K. P., Shi, X., and Klandorf, H. Annals of
Clinical & Laboratory Science 35(1), 37–45 (2005).
[127] Forstermann, U. and Sessa, W. C. European Heart Journal 33(7), 829–37 (2012).
[128] Muraoka, S. and Miura, T. Pharmacology & Toxicology 93(6), 284–289 (2003).
[129] Kuzkaya, N., Weissmann, N., Harrison, D. G., and Dikalov, S. Biochemical Phar-
macology 70(3), 343–354 (2005).
[130] Genestra, M. Cellular Signalling 19(9), 1807–1819 (2007).
[131] Sies, H. Angewandte Chemie International Edition in English 25(12), 1058–1071
(1986).
[132] Pizzino, G., Irrera, N., Cucinotta, M., Pallio, G., Mannino, F., Arcoraci, V.,
Squadrito, F., Altavilla, D., and Bitto, A. Oxidative Medicine and Cellular
Longevity 2017 (2017).
[133] Levine, A. S., Sun, L., Tan, R., Gao, Y., Yang, L., Chen, H., Teng, Y., and Lan, L.
Science China Life Sciences 60(10), 1077–1080 (2017).
[134] Son, Y., Cheong, Y.-K., Kim, N.-H., Chung, H.-T., Kang, D. G., and Pae, H.-O.
Journal of Signal Transduction 2011 (2011).
[135] Allan Butterfield, D. Free Radical Research 36(12), 1307–1313 (2002).
[136] Beal, M. F. Biochimica et Biophysica Acta - Bioenergetics 1366(1-2), 211–223
(1998).
[137] Halliwell, B., Halliwell, B., Halliwell, B., and Gutteridge, J. Amyotrophic Lateral
Sclerosis 7(sup1), 67–67 (2006).
[138] Higashi, Y., Noma, K., Yoshizumi, M., and Kihara, Y. Circulation Journal 73(3),
411–418 (2009).
203
BIBLIOGRAPHY BIBLIOGRAPHY
[139] Mahajan, A. and Tandon, V. R. Indian Journal of Rheumatology 12, 139–142
(2004).
[140] Galle, J. Nephrology Dialysis Transplantation 16(11), 2135–2137 (2001).
[141] Streilein, J. W. and Tigelaar, R. E. SALT: Skin-Associated Lymphoid Tissues, 95–
130. Springer US, Boston, MA (1983).
[142] Norval, M. Progress in Biophysics and Molecular Biology 92(1), 108 – 118 (2006).
[143] Trinchieri, G. Current Opinion in Hematology 4(1), 59–66 (1997).
[144] Smeltz, R. B., Chen, J., Ehrhardt, R., and Shevach, E. M. The Journal of Immunol-
ogy 168(12), 6165–6172 (2002).
[145] Cruz, P. D. Springer Seminars in Immunopathology 13(3), 281–288 Jul (1992).
[146] Simon, J. C., Cruz, P. D., Bergstresser, P. R., and Tigelaar, R. E. The Journal of
Immunology 145(7), 2087–2091 (1990).
[147] Araneo, B., Dowell, T., Moon, H. B., and Daynes, R. The Journal of Immunology
143(6), 1737–1744 (1989).
[148] Abo Elnazar, S. Y., Ghazy, A. A., Ghoneim, H. E., Taha, A. R., and Abouelella,
A. M. Frontiers in Pharmacology 6, 56 (2015).
[149] Nishigori, C., Yarosh, D. B., Ullrich, S. E., Vink, A. A., Bucana, C. D., Roza,
L., and Kripke, M. L. Proceedings of the National Academy of Sciences 93(19),
10354–10359 (1996).
[150] Kuijken, I. and Bavinck, J. N. B. BioDrugs 14(5), 319–329 Nov (2000).
[151] Long, M. D., Martin, C. F., Pipkin, C. A., Herfarth, H. H., Sandler, R. S., and
Kappelman, M. D. Gastroenterology 143(2), 390 – 399.e1 (2012).
[152] Lordan, R., Tsoupras, A., and Zabetakis, I. Advances in Nutrition 10(1), 148–164
02 (2019).
204
BIBLIOGRAPHY BIBLIOGRAPHY
[153] Marathe, G. K., Johnson, C., Billings, S. D., Southall, M. D., Pei, Y., Spandau, D.,
Murphy, R. C., Zimmerman, G. A., McIntyre, T. M., and Travers, J. B. Journal of
Biological Chemistry 280(42), 35448–35457 (2005).
[154] Konger, R. L., Marathe, G. K., Yao, Y., Zhang, Q., and Travers, J. B.
Prostaglandins & Other Lipid Mediators 87(1-4), 1–8 (2008).
[155] Rittie, L. and Fisher, G. J. Ageing Research Reviews 1(4), 705 – 720 (2002).
[156] Bateman, J. F., Lamande, S. R., and Ramshaw, J. A. Extracellular Matrix 2, 22–67
(1996).
[157] Brenneisen, P., Wenk, J., Klotz, L. O., Wlaschek, M., Briviba, K., Krieg, T., Sies,
H., and Scharffetter-Kochanek, K. Journal of Biological Chemistry 273(9), 5279–
5287 (1998).
[158] Fisher, G. J., Wang, Z., Datta, S. C., Varani, J., Kang, S., and Voorhees, J. J. New
England Journal of Medicine 337(20), 1419–1429 (1997).
[159] Green, A. C. Medical Journal of Australia 155(7), 473–478 (1991).
[160] Lucas, R. M., Ponsonby, A.-L., Dear, K., Taylor, B. V., Dwyer, T., McMichael,
A. J., Valery, P., Van Der Mei, I., Williams, D., Pender, M. P., et al. Cancer
Epidemiology and Prevention Biomarkers 18(11), 2887–2894 (2009).
[161] Green, A. C., Wallingford, S. C., and McBride, P. Progress in Biophysics and
Molecular Biology 107(3), 349 – 355 (2011).
[162] Fritschi, L., Battistutta, D., Strutton, G. M., and Green, A. International Journal
of Epidemiology 24(1), 150–154 (1995).
[163] Feller, L., Khammissa, R., Kramer, B., Altini, M., and Lemmer, J. Head & Face
Medicine 12(1), 11 (2016).
[164] Youssef, K. K., Van Keymeulen, A., Lapouge, G., Beck, B., Michaux, C., Achouri,
Y., Sotiropoulou, P. A., and Blanpain, C. Nature Cell Biology 12(3), 299–305
(2010).
205
BIBLIOGRAPHY BIBLIOGRAPHY
[165] Epstein, E. H. Nature Reviews Cancer 8(10), 743–754 (2008).
[166] Gordon, R. Seminars in Oncology Nursing 29(3), 160 – 169 (2013). Skin Cancer.
[167] Australian Institute of Health and Welfare, Australian Government, Cancer
data in Australia, (2018). https://www.aihw.gov.au/reports/cancer/
cancer-data-in-australia/contents/summary, (viewed 13/6/19). Online;
accessed 13/6/19.
[168] Cummins, D. L., Cummins, J. M., Pantle, H., Silverman, M. A., Leonard, A. L.,
and Chanmugam, A. In Mayo Clinic Proceedings, volume 81, 500–507. Elsevier,
(2006).
[169] Madan, V., Lear, J. T., and Szeimies, R.-M. The Lancet 375(9715), 673–685
(2010).
[170] Zamanian, A. and Hardiman, C. High Frequency Electronics 4(3), 16–26 (2005).
[171] Sinha, R., Haeder, D., and Krywult, M. Acta Hydrobiologica 40(2), 105–112
(1998).
[172] Rastogi, R. P., Richa, Kumar, A., Tyagi, M. B., and Sinha, R. P. Journal of Nucleic
Acids 2010, 592980–592980 (2010).
[173] Rastogi, R. P., Singh, S. P., Hader, D.-P., Sinha, R. P., et al. Australian Journal of
Botany 58(4), 286–293 (2010).
[174] Matsumura, Y. and Ananthaswamy, H. N. Toxicology and Applied Pharmacology
195(3), 298 – 308 (2004). Toxicology of the Skin.
[175] D’Orazio, J., Jarrett, S., Amaro-Ortiz, A., and Scott, T. International Journal of
Molecular Sciences 14(6), 12222–12248 (2013).
[176] Lin, J. Y. and Fisher, D. E. Nature 445, 843 (2007).
[177] Videira, I. F. d. S., Moura, D. F. L., and Magina, S. Anais Brasileiros de Derma-
tologia 88(1), 76–83 (2013).
206
BIBLIOGRAPHY BIBLIOGRAPHY
[178] Slominski, A., Tobin, D. J., Shibahara, S., and Wortsman, J. Physiological Reviews
84(4), 1155–1228 (2004).
[179] Schauer, E., Trautinger, F., Kock, A., Schwarz, A., Bhardwaj, R., Simon, M.,
Ansel, J., Schwarz, T., and Luger, T. The Journal of Clinical Investigation 93(5),
2258–2262 (1994).
[180] Scherer, D. and Kumar, R. Mutation Research/Reviews in Mutation Research
705(2), 141–153 (2010).
[181] Tran, M. L., Powell, B. J., and Meredith, P. Biophysical Journal 90(3), 743 – 752
(2006).
[182] McGregor, J. Dermatology in General Medicine (1999).
[183] Lan, C.-C. E., Wu, C.-S., Huang, S.-M., Wu, C.-H., Lai, H.-C., Peng, Y.-T., Hou,
P.-S., Yang, H.-J., and Chen, G.-S. Scientific Reports 6, 37403 (2016).
[184] Melnikova, V. O. and Ananthaswamy, H. N. Mutation Research/Fundamental and
Molecular Mechanisms of Mutagenesis 571(1), 91 – 106 (2005).
[185] Ravanat, J.-L., Douki, T., and Cadet, J. Journal of Photochemistry and Photobiol-
ogy B: Biology 63(1), 88 – 102 (2001).
[186] Kohen, E., Santus, R., and Hirschberg, J. G. Photobiology. Elsevier, (1995).
[187] Slominski, A. and Pawelek, J. Clinics in Dermatology 16(4), 503 – 515 (1998).
[188] Markovitsi, D., Gustavsson, T., and Banyasz, A. Mutation Research/Reviews in
Mutation Research 704(1), 21–28 (2010).
[189] Anna, B., Blazej, Z., Jacqueline, G., Andrew, C. J., Jeffrey, R., and Andrzej, S.
Expert Review of Dermatology 2(4), 451–469 (2007).
[190] Friedberg, E. C. Nature 421(6921), 436–440 (2003).
[191] Bernard, J. J., Gallo, R. L., and Krutmann, J. Nature Reviews Immunology (2019).
207
BIBLIOGRAPHY BIBLIOGRAPHY
[192] Kripke, M. L., Cox, P. A., Alas, L. G., and Yarosh, D. B. Proceedings of the
National Academy of Sciences 89(16), 7516–7520 (1992).
[193] Peng, W. and Shaw, B. R. Biochemistry 35(31), 10172–10181 (1996). PMID:
8756482.
[194] Hutchinson, F. Mutation Research/Fundamental and Molecular Mechanisms of
Mutagenesis 309(1), 11–15 (1994).
[195] McGregor, W. G., Chen, R.-H., Lukash, L., Maher, V. M., and McCormick, J. J.
Molecular and Cellular Biology 11(4), 1927–1934 (1991).
[196] Armstrong, J. D. and Kunz, B. A. Proceedings of the National Academy of Sciences
87(22), 9005–9009 (1990).
[197] Brash, D. E., Rudolph, J. A., Simon, J. A., Lin, A., McKenna, G. J., Baden, H. P.,
Halperin, A. J., and Ponten, J. Proceedings of the National Academy of Sciences
88(22), 10124–10128 (1991).
[198] Osterwalder, U., The evolution of UVA protection, (2013).
http://www.skin-care-forum.basf.com/en/articles/
skin/the-evolution-of-uva-protection/2013/09/04?id=
5cb3fae5-1a42-49c7-96df-66d08d2465c0&mode=Detail, (viewed 26/2/16).
[199] Cadet, J., Sage, E., and Douki, T. Mutation Research/Fundamental and Molecular
Mechanisms of Mutagenesis 571(1), 3 – 17 (2005).
[200] Sinha, R. and Haeder, D. Photochemical & Photobiological Sciences 1(4), 225–
236 (2002).
[201] You, Y., H Lee, D., H Yoon, J., Nakajima, S., Yasui, A., and Pfeifer, G. The Journal
of Biological Chemistry 276, 44688–94 12 (2001).
[202] Ikehata, H. and Ono, T. Journal of Radiation Research 52(2), 115–125 (2011).
[203] Taylor, J. S. and Cohrs, M. P. Journal of the American Chemical Society 109(9),
2834–2835 (1987).
208

BIBLIOGRAPHY BIBLIOGRAPHY
[204] Johns, H., Pearson, M., LeBlanc, J., and Helleiner, C. Journal of Molecular Biology
9(2), 503 – IN1 (1964).
[205] Lee, J.-H., Bae, S.-H., and Choi, B.-S. Proceedings of the National Academy of
Sciences 97(9), 4591–4596 (2000).
[206] LeClerc, J. E., Borden, A., and Lawrence, C. W. Proceedings of the National
Academy of Sciences 88(21), 9685–9689 (1991).
[207] Douki, T. and Sage, E. Photochemical & Photobiological Science 15, 24–30
(2016).
[208] Benjamin, C. L. and Ananthaswamy, H. N. Toxicology and Applied Pharmacology
224(3), 241–248 (2007).
[209] Runger, T. M., Epe, B., and Moller, K. In Skin Cancer: Basic Science, Clinical
Research and Treatment, Garbe, C., Schmitz, S., and Orfanos, C. E., editors, 31–42
(Springer, Berlin, Heidelberg, 1995).
[210] Agar, N. S., Halliday, G. M., Barnetson, R. S., Ananthaswamy, H. N., Wheeler,
M., and Jones, A. M. Proceedings of the National Academy of Sciences 101(14),
4954–4959 (2004).
[211] Wondrak, G. T., Jacobson, M. K., and Jacobson, E. L. Photochemical & Photobi-
ological Sciences 5(2), 215–237 (2006).
[212] Ouedraogo, G. D. and Redmond, R. W. Photochemistry and Photobiology 77(2),
192–203 (2003).
[213] Kvam, E. and Tyrrell, R. M. Carcinogenesis 18(12), 2379–2384 (1997).
[214] Zhang, X., Rosenstein, B. S., Wang, Y., Lebwohl, M., Mitchell, D. M., and Wei,
H. Photochemistry & Photobiology 65(1), 119–124 (1997).
[215] Pouget, J.-P., Douki, T., Richard, M.-J., and Cadet, J. Chemical Research in Toxi-
cology 13(7), 541–549 (2000).
209

BIBLIOGRAPHY BIBLIOGRAPHY
[216] Douki, T., Reynaud-Angelin, A., Cadet, J., and Sage, E. Biochemistry 42(30),
9221–9226 (2003).
[217] Tewari, A., Sarkany, R. P., and Young, A. R. Journal of Investigative Dermatology
132(2), 394 – 400 (2012).
[218] Brenner, M. and Hearing, V. J. Photochemistry and Photobiology 84(3), 539–549
(2008).
[219] Shaath, N. Sunscreens: Regulations and commercial development. CRC Press,
(2005).
[220] Larsen, K. Nordic Journal of Botany 19(3), 328–328 (1999).
[221] Patini, G. Drug & Cosmetic Industry 143(2), 42 (1988).
[222] Giacomoni, P. Sunscreens: Regulation and commercial development. 3rd ed. Boca
Raton: T&F Informa , 71–85 (2005).
[223] Brown, M. Shaath NA. Sunscreens: Regulation and Commercial Development. 3rd
ed. Boca Raton: T&F Informa , 779–806 (2005).
[224] Greiter, F. Parf Kosm 55, 70–75 (1974).
[225] Joint Technical Committee CS-042, Sunscreen Agents, AS/NZS 2604:2012 Sun-
screen products - Evaluation and classification, (2020). (viewed 16/1/20).
[226] Sambandan, D. R. and Ratner, D. Journal of the American Academy of Dermatol-
ogy 64(4), 748 – 758 (2011).
[227] Couteau, C., Paparis, E., El-Bourry-Alami, S., and Coiffard, L. International Jour-
nal of Pharmaceutics 437(1–2), 250 – 252 (2012).
[228] Therapeutic Goods Administration, Skin Cancer,
(2016). https://www.tga.gov.au/publication/
australian-regulatory-guidelines-sunscreens-args, (viewed 18/5/17).
210
BIBLIOGRAPHY BIBLIOGRAPHY
[229] Serpone, N., Salinaro, A., Emeline, A. V., Horikoshi, S., Hidaka, H., and Zhao, J.
Photochemical & Photobiological Sciences 1(12), 970–981 (2002).
[230] Hayden, C., Cross, S., Anderson, C., Saunders, N., and Roberts, M. Skin and
Pharmacology and Physiology 18, 170 – 174 (2005).
[231] Liu, X., Grice, J. E., Lademann, J., Otberg, N., Trauer, S., Patzelt, A., and Roberts,
M. S. British Journal of Clinical Pharmacology 72(5), 768–774 (2011).
[232] Krause, M., Klit, A., Blomberg Jensen, M., Søeborg, T., Frederiksen, H.,
Schlumpf, M., Lichtensteiger, W., Skakkebaek, N., and Drzewiecki, K. Interna-
tional Journal of Andrology 35(3), 424–436 (2012).
[233] Klammer, H., Schlecht, C., Wuttke, W., and Jarry, H. Toxicology 215(1), 90 – 96
(2005).
[234] Kunz, P. Y. and Fent, K. Toxicology and Applied Pharmacology 217(1), 86–99
(2006).
[235] Shaath, N. A. Photochemical & Photobiological Sciences 9, 464–469 (2010).
[236] Suh, H.-W., Lewis, J., Fong, L., Ramseier, J. Y., Carlson, K., Peng, Z.-H., Yin,
E. S., Saltzman, W. M., and Girardi, M. Bioengineering & Translational Medicine
4(1), 129–140 (2018).
[237] Vettor, M., Perugini, P., Scalia, S., Conti, B., Genta, I., Modena, T., and Pavanetto,
F. International Journal of Cosmetic Science 30(3), 219–227 (2008).
[238] Ntohogian, S., Gavriliadou, V., Christodoulou, E., Nanaki, S., Lykidou, S.,
Naidis, P., Mischopoulou, L., Barmpalexis, P., Nikolaidis, N., and Bikiaris, D. N.
Molecules 23(9), 2107 (2018).
[239] Lee, J.-S., Kim, J.-W., Kim, J., Han, S.-H., and Chang, I.-S. Colloid and Polymer
Science 283(2), 194–199 (2004).
[240] Perugini, P., Simeoni, S., Scalia, S., Genta, I., Modena, T., Conti, B., and Pavanetto,
F. International Journal of Pharmaceutics 246(1), 37 – 45 (2002).
211

BIBLIOGRAPHY BIBLIOGRAPHY
[241] Hayden, D. R., Imhof, A., and Velikov, K. P. ACS Applied Materials & Interfaces
8(48), 32655–32660 (2016). PMID: 27934192.
[242] Kerr, A. and Ferguson, J. Photodermatology, Photoimmunology & Photomedicine
26(2), 56–65 (2010).
[243] Serpone, N., Dondi, D., and Albini, A. Inorganica Chimica Acta 360(3), 794 – 802
(2007).
[244] Gasparro, F. P., Mitchnick, M., and Nash, J. F. Photochemistry and Photobiology
68(3), 243–256 (1998).
[245] Rahimi, N., Pax, R. A., and Gray, E. M. Progress in Solid State Chemistry 44(3),
86 – 105 (2016).
[246] Xiaobo, C. Chinese Journal of Catalysis 30(8), 839–851 (2009).
[247] Choi, H. C., Ahn, H.-J., Jung, Y. M., Lee, M. K., Shin, H. J., Kim, S. B., and Sung,
Y.-E. Applied Spectroscopy 58(5), 598–602 (2004).
[248] Bard, A. J. The Journal of Physical Chemistry 86(2), 172–177 (1982).
[249] Yamashita, H., Harada, M., Misaka, J., Takeuchi, M., Neppolian, B., and Anpo, M.
Catalysis Today 84(3-4), 191–196 (2003).
[250] Salari, M., Aboutalebi, S. H., Konstantinov, K., and Liu, H. K. Physical Chemistry
Chemical Physics 13(11), 5038–5041 (2011).
[251] Sennik, E., Colak, Z., Kilinc, N., and Ozturk, Z. Z. International Journal of Hy-
drogen Energy 35(9), 4420–4427 (2010).
[252] Huang, S., Kavan, L., Exnar, I., and Gratzel, M. Journal of the Electrochemical
Society 142(9), L142–L144 (1995).
[253] Khan, S. U., Al-Shahry, M., and Ingler, W. B. Science 297(5590), 2243–2245
(2002).
212
BIBLIOGRAPHY BIBLIOGRAPHY
[254] Mor, G. K., Varghese, O. K., Paulose, M., Ong, K. G., and Grimes, C. A. Thin
Solid Films 496(1), 42–48 (2006).
[255] Shannon, R. D. and Pask, J. A. Journal of the American Ceramic Society 48(8),
391–398 (1965).
[256] Lazzeri, M., Vittadini, A., and Selloni, A. Physical Review B 63(15), 155409
(2001).
[257] Ma, Y., Wang, X., Jia, Y., Chen, X., Han, H., and Li, C. Chemical Reviews 114(19),
9987–10043 (2014). PMID: 25098384.
[258] Lu, P., Fang, S., Cheng, W., Huang, S., Huang, M., and Cheng, H. Journal of Food
and Drug Analysis 26(3), 1192 – 1200 (2018).
[259] Buzek, J. and Ask, B. Official Journal of the European Union L 342 (2009).
[260] Lewicka, Z. A., Benedetto, A. F., Benoit, D. N., Yu, W. W., Fortner, J. D., and
Colvin, V. L. Journal of Nanoparticle Research 13(9), 3607 Jul (2011).
[261] Chaari, M. and Matoussi, A. Physica B: Condensed Matter 407(17), 3441–3447
(2012).
[262] Ozgur, U., Alivov, Y. I., Liu, C., Teke, A., Reshchikov, M., Dogan, S., Avrutin, V.,
Cho, S.-J., Morkoc, and H. Journal of Applied Physics 98(4), 11 (2005).
[263] Nicoll, F. Applied Physics Letters 9(1), 13–15 (1966).
[264] Wang, Z. L. ACS Nano 2(10), 1987–1992 (2008).
[265] Environmental Working Group, The Trouble With Ingredients in
Sunscreens, (2020). https://www.ewg.org/sunscreen/report/
the-trouble-with-sunscreen-chemicals/, (viewed 20/1/20).
[266] Food and Drug Administration, United States, FDA advances new pro-
posed regulation to make sure that sunscreens are safe and effective,
(2020). https://www.fda.gov/news-events/press-announcements/
213
BIBLIOGRAPHY BIBLIOGRAPHY
fda-advances-new-proposed-regulation-make-sure-sunscreens/
aresafe-and-effective, (viewed 20/1/20).
[267] Therapeutic Goods Administration, Findings from TGA’s compli-
ance review of sunscreens, (2020). https://www.tga.gov.au/
findings-tgas-compliance-review-sunscreens, (viewed 20/1/20).
[268] Tampucci, S., Burgalassi, S., Chetoni, P., and Monti, D. Cosmetics 5(1), 1 (2018).
[269] Freitas, J., Praca, F., Bentley, M., and Gaspar, L. International Journal of Pharma-
ceutics 484(1), 131 – 137 (2015).
[270] Jiang, R., Roberts, M., Collins, D., and Benson, H. British Journal of Clinical
Pharmacology 48(4), 635 (1999).
[271] Gustavsson Gonzalez, H., Farbrot, A., and Larko, O. Clinical and Experimental
Dermatology 27(8), 691–694 (2002).
[272] Okereke, C. S., Barat, S. A., and Abdel-Rahman, M. S. Toxicology Letters 80(1-3),
61–67 (1995).
[273] Janjua, N. R., Mogensen, B., Andersson, A.-M., Petersen, J. H., Henriksen, M.,
Skakkebæk, N. E., and Wulf, H. C. Journal of Investigative Dermatology 123(1),
57–61 (2004).
[274] Oliveira, A., Cerize, N., Ferreira, F., Schianti, J., and Aldeia, W. Progress in
Nanotechnology and Nanomaterials 3, 64–72 10 (2014).
[275] Damiani, E. and Puglia, C. Journal of Pharmaceutical Sciences 108(12), 3769 –
3780 (2019).
[276] Xu, L., Wu, D., Zhou, B., Xu, Y., Wang, W., Yu, D., and Luo, D. RSC Advances 8,
12315–12321 (2018).
[277] Scalia, S., Mezzena, M., and Ramaccini, D. Skin Pharmacology and Physiology
24(4), 182–189 (2011).
214
BIBLIOGRAPHY BIBLIOGRAPHY
[278] Szwarcfarb, B., Carbone, S., Reynoso, R., Bollero, G., Ponzo, O., Moguilevsky,
J., and Scacchi, P. Experimental and Clinical Endocrinology & Diabetes 116(02),
94–98 (2008).
[279] Wang, J., Pan, L., Wu, S., Lu, L., Xu, Y., Zhu, Y., Guo, M., and Zhuang, S. Inter-
national Journal of Environmental Research and Public Health 13(8), 782 (2016).
[280] Guerreiro, P., Fuentes, J., Canario, A. V., and Power, D. Journal of Endocrinology
173(2), 377–385 (2002).
[281] Lange, I. G., Hartel, A., and Meyer, H. H. The Journal of Steroid Biochemistry and
Molecular Biology 83(1-5), 219–226 (2002).
[282] Shi, Y., Liu, X., Zhu, P., Li, J., Sham, K. W., Cheng, S. H., Li, S., Zhang, Y., Cheng,
C. H., and Lin, H. Biochemical and Biophysical Research Communications 435(1),
21–27 (2013).
[283] Molina-Molina, J.-M., Escande, A., Pillon, A., Gomez, E., Pakdel, F., Cavailles,
V., Olea, N., Ait-Aissa, S., and Balaguer, P. Toxicology and Applied Pharmacology
232(3), 384–395 (2008).
[284] Suzuki, T., Kitamura, S., Khota, R., Sugihara, K., Fujimoto, N., and Ohta, S. Toxi-
cology and Applied Pharmacology 203(1), 9–17 (2005).
[285] Zhang, Q., Ma, X., Dzakpasu, M., and Wang, X. C. Ecotoxicology and Environ-
mental Safety 142, 338 – 347 (2017).
[286] Schreurs, R. H. M. M., Sonneveld, E., Jansen, J. H. J., Seinen, W., and van der
Burg, B. Toxicological Sciences 83(2), 264–272 11 (2004).
[287] Hofkamp, L., Bradley, S., Tresguerres, J., Lichtensteiger, W., Schlumpf, M., and
Timms, B. Environmental Health Perspectives 116(7), 867–872 (2008).
[288] Schlumpf, M., Kypke, K., Vokt, C. C., Birchler, M., Durrer, S., Faass, O., Ehnes,
C., Fuetsch, M., Gaille, C., Henseler, M., et al. CHIMIA International Journal for
Chemistry 62(5), 345–351 (2008).
215

BIBLIOGRAPHY BIBLIOGRAPHY
[289] Buser, H.-R., Balmer, M. E., Schmid, P., and Kohler, M. Environmental Science &
Technology 40(5), 1427–1431 (2006).
[290] Durrer, S., Maerkel, K., Schlumpf, M., and Lichtensteiger, W. Endocrinology
146(5), 2130–2139 (2005).
[291] Schlumpf, M., Cotton, B., Conscience, M., Haller, V., Steinmann, B., and Lichten-
steiger, W. Environmental Health Perspectives 109(3), 239–244 (2001).
[292] Gomez, E., Pillon, A., Fenet, H., Rosain, D., Duchesne, M., Nicolas, J., Balaguer,
P., and Casellas, C. Journal of Toxicology and Environmental Health, Part A 68(4),
239–251 (2005).
[293] Axelstad, M., Boberg, J., Hougaard, K. S., Christiansen, S., Jacobsen, P. R., Man-
drup, K. R., Nellemann, C., Lund, S. P., and Hass, U. Toxicology and Applied
Pharmacology 250(3), 278–290 (2011).
[294] Collaris, E. J. and Frank, J. International Journal of Dermatology 47, 35–37
(2008).
[295] Wong, T. and Orton, D. Clinics in Dermatology 29(3), 306 – 310 (2011). Current
Views on Contact Dermatitis.
[296] Darvay, A., White, I., Rycroft, R., Jones, A., Hawk, J., and McFadden, J. British
Journal of Dermatology 145(4), 597–601 (2001).
[297] English, J., White, I., and Cronin, K. Contact Dermatitis 17(3), 159–162 (1987).
[298] Cook, N. and Freeman, S. Australasian Journal of Dermatology 42(4), 257–259
(2001).
[299] Bryden, A., Moseley, H., Ibbotson, S., Chowdhury, M., Beck, M., Bourke, J., En-
glish, J., Farr, P., Foulds, I., Gawkrodger, D., et al. British Journal of Dermatology
155(4), 737–747 (2006).
[300] Deflandre, A. and Lang, G. International Journal of Cosmetic Science 10(2), 53–
62 (1988).
216
BIBLIOGRAPHY BIBLIOGRAPHY
[301] Andrae, I., Bringhen, A., Bohm, F., Gonzenbach, H., Hill, T., Mulroy, L., and
Truscott, T. Journal of Photochemistry and Photobiology B: Biology 37(1-2), 147–
150 (1997).
[302] Gonzalez, H., Tarras-Wahlberg, N., Stromdahl, B., Juzeniene, A., Moan, J., Larko,
O., Rosen, A., and Wennberg, A.-M. BMC Dermatology 7(1), 1 (2007).
[303] Johncock, W. Cosmetics and Toiletries 114(9), 75–82 (1999).
[304] Dondi, D., Albini, A., and Serpone, N. Photochemical & Photobiological Sciences
5(9), 835–843 (2006).
[305] Couteau, C., Faure, A., Fortin, J., Paparis, E., and Coiffard, L. J. Journal of Phar-
maceutical and Biomedical Analysis 44(1), 270 – 273 (2007).
[306] Giokas, D. L., Salvador, A., and Chisvert, A. Trends in Analytical Chemistry 26(5),
360 – 374 (2007).
[307] Fent, K., Zenker, A., and Rapp, M. Environmental Pollution 158(5), 1817–1824
(2010).
[308] Tsui, M. M., Lam, J. C., Ng, T., Ang, P. O., Murphy, M. B., and Lam, P. K.
Environmental Science & Technology 51(8), 4182–4190 (2017).
[309] Downs, C. A., Kramarsky-Winter, E., Segal, R., Fauth, J., Knutson, S., Bronstein,
O., Ciner, F. R., Jeger, R., Lichtenfeld, Y., Woodley, C. M., et al. Archives of
Environmental Contamination and Toxicology 70(2), 265–288 (2016).
[310] Coronado, M., De Haro, H., Deng, X., Rempel, M. A., Lavado, R., and Schlenk,
D. Aquatic Toxicology 90(3), 182–187 (2008).
[311] Downs, C., Kramarsky-Winter, E., Fauth, J. E., Segal, R., Bronstein, O., Jeger, R.,
Lichtenfeld, Y., Woodley, C. M., Pennington, P., Kushmaro, A., et al. Ecotoxicol-
ogy 23(2), 175–191 (2014).
217
BIBLIOGRAPHY BIBLIOGRAPHY
[312] Danovaro, R., Bongiorni, L., Corinaldesi, C., Giovannelli, D., Damiani, E., Astolfi,
P., Greci, L., and Pusceddu, A. Environmental Health Perspectives 116(4), 441–
447 (2008).
[313] BBC News, Palau is first country to ban ’reef toxic’ sun cream, (2020). https:
//www.bbc.com/news/world-asia-50963080, (viewed 22/1/20).
[314] Wood, E. Report by the International Coral Reef Initiative (ICRI) (2018).
[315] Soto, K., Garza, K., and Murr, L. Acta Biomaterialia 3(3), 351–358 (2007).
[316] Bhattacharya, K., Davoren, M., Boertz, J., Schins, R. P., Hoffmann, E., and Dopp,
E. Particle and Fibre Toxicology 6(1), 17 (2009).
[317] Gurr, J.-R., Wang, A. S., Chen, C.-H., and Jan, K.-Y. Toxicology 213(1-2), 66–73
(2005).
[318] Chen, H.-W., Su, S.-F., Chien, C.-T., Lin, W.-H., Yu, S.-L., Chou, C.-C., Chen, J. J.,
Yang, P.-C., Chen, H.-W., Su, S.-F., et al. The FASEB Journal 20(13), 2393–2395
(2006).
[319] Rossi, E. M., Pylkkanen, L., Koivisto, A. J., Vippola, M., Jensen, K. A., Miettinen,
M., Sirola, K., Nykasenoja, H., Karisola, P., Stjernvall, T., et al. Toxicological
Sciences 113(2), 422–433 (2010).
[320] Park, H.-O., Yu, M., Kang, S. K., Yang, S. I., and Kim, Y.-J. Molecular & Cellular
Toxicology 7(1), 67–75 (2011).
[321] Kiss, B., Biro, T., Czifra, G., Toth, B. I., Kertesz, Z., Szikszai, Z., Kiss, A. Z.,
Juhasz, I., Zouboulis, C. C., and Hunyadi, J. Experimental Dermatology 17(8),
659–667 (2008).
[322] Jin, C.-Y., Zhu, B.-S., Wang, X.-F., and Lu, Q.-H. Chemical Research in Toxicology
21(9), 1871–1877 (2008). PMID: 18680314.
[323] Uboldi, C., Urban, P., Gilliland, D., Bajak, E., Valsami-Jones, E., Ponti, J., and
Rossi, F. Toxicology in Vitro 31, 137 – 145 (2016).
218
BIBLIOGRAPHY BIBLIOGRAPHY
[324] Hsiao, I.-L. and Huang, Y.-J. Science of The Total Environment 409(7), 1219 –
1228 (2011).
[325] Vamanu, C. I., Cimpan, M. R., Hol, P. J., Sornes, S., Lie, S. A., and Gjerdet, N. R.
Toxicology in Vitro 22(7), 1689–1696 (2008).
[326] Gerloff, K., Fenoglio, I., Carella, E., Kolling, J., Albrecht, C., Boots, A. W., Forster,
I., and Schins, R. P. Chemical Research in Toxicology 25(3), 646–655 (2012).
[327] Vandebriel, R. J. and De Jong, W. H. Nanotechnology, Science and Applications 5,
61 (2012).
[328] Kao, Y.-Y., Chen, Y.-C., Cheng, T.-J., Chiung, Y.-M., and Liu, P.-S. Toxicological
Sciences 125(2), 462–472 (2012).
[329] H. Muller, K., Kulkarni, J., Motskin, M., Goode, A., Winship, P., Skepper, J. N.,
Ryan, M. P., and Porter, A. E. ACS Nano 4(11), 6767–6779 (2010).
[330] Ahamed, M., Akhtar, M. J., Raja, M., Ahmad, I., Siddiqui, M. K. J., AlSalhi, M. S.,
and Alrokayan, S. A. Nanomedicine: Nanotechnology, Biology and Medicine 7(6),
904–913 (2011).
[331] Huang, C.-C., Aronstam, R. S., Chen, D.-R., and Huang, Y.-W. Toxicology in vitro
24(1), 45–55 (2010).
[332] Yin, H. and Casey, P. S. Chemosphere 124, 116 – 121 (2015).
[333] Lin, W., Huang, Y.-w., Zhou, X.-D., and Ma, Y. Toxicology and Applied Pharma-
cology 217(3), 252–259 (2006).
[334] Lin, W., Huang, Y.-w., Zhou, X.-D., and Ma, Y. International Journal of Toxicology
25(6), 451–457 (2006).
[335] Lin, W., Stayton, I., Huang, Y.-w., Zhou, X.-D., and Ma, Y. Toxicological and
Environmental Chemistry 90(5), 983–996 (2008).
[336] Lin, W., Xu, Y., Huang, C.-C., Ma, Y., Shannon, K. B., Chen, D.-R., and Huang,
Y.-W. Journal of Nanoparticle Research 11(1), 25–39 (2009).
219
BIBLIOGRAPHY BIBLIOGRAPHY
[337] Dunford, R., Salinaro, A., Cai, L., Serpone, N., Horikoshi, S., Hidaka, H., and
Knowland, J. FEBS Letters 418(1), 87 – 90 (1997).
[338] International Life Sciences Institute, Risk Science Institute. Inhalation Toxicology
12(1-2), 1 (2000).
[339] Baan, R., Straif, K., Grosse, Y., Secretan, B., El Ghissassi, F., Cogliano, V. and
WHO International Agency for Research on Cancer Monograph Working Group,
Carcinogenicity of carbon black, titanium dioxide, and talc. (2006).
[340] Oberdorster, G., Ferin, J., and Lehnert, B. E. Environmental Health Perspectives
102(suppl 5), 173–179 (1994).
[341] Oberdorster, G. International Archives of Occupational and Environmental Health
74(1), 1–8 (2000).
[342] Fabian, E., Landsiedel, R., Ma-Hock, L., Wiench, K., Wohlleben, W., and
Van Ravenzwaay, B. Archives of Toxicology 82(3), 151–157 (2008).
[343] Ma-Hock, L., Burkhardt, S., Strauss, V., Gamer, A. O., Wiench, K., van Raven-
zwaay, B., and Landsiedel, R. Inhalation Toxicology 21(2), 102–118 (2009).
[344] Grassian, V. H., O’Shaughnessy, P. T., Adamcakova-Dodd, A., Pettibone, J. M.,
and Thorne, P. S. Environmental Health Perspectives 115(3), 397–402 (2007).
[345] Liu, R., Yin, L., Pu, Y., Liang, G., Zhang, J., Su, Y., Xiao, Z., and Ye, B. Progress
in Natural Science 19(5), 573 – 579 (2009).
[346] Liu, R., Yin, L.-h., Pu, Y.-p., Li, Y.-h., Zhang, X.-q., Liang, G.-y., Li, X.-b., Zhang,
J., Li, Y.-f., and Zhang, X.-y. Journal of Nanoscience and Nanotechnology 10(12),
8491–8499 (2010).
[347] Warheit, D. B., Hoke, R. A., Finlay, C., Donner, E. M., Reed, K. L., and Sayes,
C. M. Toxicology Letters 171(3), 99–110 (2007).
[348] Wang, J., Zhou, G., Chen, C., Yu, H., Wang, T., Ma, Y., Jia, G., Gao, Y., Li, B.,
Sun, J., et al. Toxicology Letters 168(2), 176–185 (2007).
220

BIBLIOGRAPHY BIBLIOGRAPHY
[349] Liu, H., Ma, L., Zhao, J., Liu, J., Yan, J., Ruan, J., and Hong, F. Biological Trace
Element Research 129(1-3), 170–180 (2009).
[350] Sang, X., Zheng, L., Sun, Q., Li, N., Cui, Y., Hu, R., Gao, G., Cheng, Z., Cheng, J.,
Gui, S., et al. Journal of Biomedical Materials Research Part A 100(4), 894–902
(2012).
[351] Baskerville, A., Fitzgeorge, R., Gilmour, M., Dowsett, A., Williams, A., and Feath-
erstone, A. British Journal of Experimental Pathology 69(6), 781 (1988).
[352] Xu, J., Sagawa, Y., Futakuchi, M., Fukamachi, K., Alexander, D. B., Furukawa,
F., Ikarashi, Y., Uchino, T., Nishimura, T., Morita, A., et al. Food and Chemical
Toxicology 49(6), 1298–1302 (2011).
[353] Borm, P. J., Schins, R. P., and Albrecht, C. International Journal of Cancer 110(1),
3–14 (2004).
[354] Heinrich, U., Fuhst, R., Rittinghausen, S., Creutzenberg, O., Bellmann, B., Koch,
W., and Levsen, K. Inhalation Toxicology 7(4), 533–556 (1995).
[355] Pott, F. Eur J Oncol 10, 249–281 (2005).
[356] Bernard, B. K., Osheroff, M. R., Hofmann, A., and Mennear, J. H. Journal of Tox-
icology and Environmental Health, Part A Current Issues 29(4), 417–429 (1990).
[357] Boffetta, P., Gaborieau, V., Nadon, L., Parent, M.-E., Weiderpass, E., and Siemi-
atycki, J. Scandinavian Journal of Work, Environment & Health , 227–232 (2001).
[358] Fryzek, J. P., Chadda, B., Marano, D., White, K., Schweitzer, S., McLaughlin,
J. K., and Blot, W. J. Journal of Occupational and Environmental Medicine 45(4),
400–409 (2003).
[359] Sayes, C. M., Reed, K. L., and Warheit, D. B. Toxicological Sciences 97(1), 163–
180 (2007).
[360] Osmond, M. J. and Mccall, M. J. Nanotoxicology 4(1), 15–41 (2010).
221

BIBLIOGRAPHY BIBLIOGRAPHY
[361] Lam, H., Conner, M., Rogers, A., Fitzgerald, S., and Amdur, M. Toxicology and
Applied Pharmacology 78(1), 29 – 38 (1985).
[362] Fine, J. M., Gordon, T., Chen, L. C., Kinney, P., Falcone, G., and Beckett, W. S.
Journal of Occupational and Environmental Medicine 39(8), 722–726 (1997).
[363] Gordon, T., Chen, L. C., Fine, J. M., Schlesinger, R. B., Su, W. Y., Kimmel, T. A.,
and Amdur, M. O. American Industrial Hygiene Association journal 53(8), 503–
509 (1992).
[364] Esmaeillou, M., Moharamnejad, M., Hsankhani, R., Tehrani, A. A., and Maadi, H.
Environmental Toxicology and Pharmacology 35(1), 67 – 71 (2013).
[365] Pasupuleti, S., Alapati, S., Ganapathy, S., Anumolu, G., Pully, N. R., and Prakhya,
B. M. Toxicology and Industrial Health 28(8), 675–686 (2012).
[366] Wang, B., Feng, W., Wang, M., Wang, T., Gu, Y., Zhu, M., Ouyang, H., Shi,
J., Zhang, F., Zhao, Y., et al. Journal of Nanoparticle Research 10(2), 263–276
(2008).
[367] Leitzmann, M. F., Stampfer, M. J., Wu, K., Colditz, G. A., Willett, W. C., and
Giovannucci, E. L. Journal of the National Cancer Institute 95(13), 1004–1007
(2003).
[368] Sharma, V., Singh, P., Pandey, A. K., and Dhawan, A. Mutation Research/Genetic
Toxicology and Environmental Mutagenesis 745(1-2), 84–91 (2012).
[369] Dufour, E. K., Kumaravel, T., Nohynek, G. J., Kirkland, D., and Toutain, H. Mu-
tation Research/Genetic Toxicology and Environmental Mutagenesis 607(2), 215–
224 (2006).
[370] Wyrwoll, A. J., Lautenschlager, P., Bach, A., Hellack, B., Dybowska, A.,
Kuhlbusch, T. A., Hollert, H., Schaffer, A., and Maes, H. M. Environmental Pollu-
tion 208, 859 – 867 (2016).
222
BIBLIOGRAPHY BIBLIOGRAPHY
[371] Kang, S. J., Lee, Y. J., Kim, B. M., Choi, Y. J., and Chung, H. W. Drug and
Chemical Toxicology 34(3), 277–284 (2011).
[372] Yin, J.-J., Liu, J., Ehrenshaft, M., Roberts, J. E., Fu, P. P., Mason, R. P., and Zhao,
B. Toxicology and Applied Pharmacology 263(1), 81–88 (2012).
[373] Sanders, K., Degn, L. L., Mundy, W. R., Zucker, R. M., Dreher, K., Zhao, B.,
Roberts, J. E., and Boyes, W. K. Toxicology and Applied Pharmacology 258(2),
226 – 236 (2012).
[374] Nakagawa, Y., Wakuri, S., Sakamoto, K., and Tanaka, N. Mutation Re-
search/Genetic Toxicology and Environmental Mutagenesis 394(1), 125 – 132
(1997).
[375] George, S., Pokhrel, S., Ji, Z., Henderson, B. L., Xia, T., Li, L., Zink, J. I., Nel,
A. E., and Madler, L. Journal of the American Chemical Society 133(29), 11270–
11278 (2011).
[376] Horie, M., Komaba, L. K., Kato, H., Endoh, S., Fujita, K., Nishio, K., Nakamura,
A., Miyauchi, A., Kinugasa, S., Hagihara, Y., et al. Nano Biomedicine 2(2), 182–
193 (2010).
[377] Al-Abed, S. R., Virkutyte, J., Ortenzio, J. N., McCarrick, R. M., Degn, L. L.,
Zucker, R., Coates, N. H., Childs, K., Ma, H., Diamond, S., et al. Environmental
Science: Nano 3(3), 593–601 (2016).
[378] Tang, Y., Cai, R., Cao, D., Kong, X., and Lu, Y. Toxicology 406-407, 1 – 8 (2018).
[379] Kishwar, S., Siddique, M., Israr-Qadir, M., Nur, O., Willander, M., and Ollinger,
K. Laser Physics Letters 11(11), 115606 (2014).
[380] Wang, C.-C., Wang, S., Xia, Q., He, W., Yin, J.-J., Fu, P. P., and Li, J.-H. Journal
of Nanoscience and Nanotechnology 13(6), 3880–3888 (2013).
[381] Yang, Q. and Ma, Y. International Journal of Toxicology 33(3), 187–203 (2014).
223
BIBLIOGRAPHY BIBLIOGRAPHY
[382] Ma, H., Kabengi, N., Bertsch, P., Unrine, J., Glenn, T., and Williams, P. Environ-
mental Pollution 159(6), 1473—1480 (2011).
[383] Zhang, Y., Chen, W., Wang, S., Liu, Y., and Pope, C. Journal of Biomedical
Nanotechnology 4(4), 432–438 12 (2008).
[384] Bhuvaneshwari, M., Sagar, B., Doshi, S., Chandrasekaran, N., and Mukherjee, A.
Environmental Science and Pollution Research 24(6), 5633–5646 (2017).
[385] Gopalan, R. C., Osman, I. F., Amani, A., Matas, M. D., and Anderson, P. D. Nan-
otoxicology 3(1), 33–39 (2009).
[386] Piccinno, F., Gottschalk, F., Seeger, S., and Nowack, B. Journal of Nanoparticle
Research 14(9), 1109 (2012).
[387] Wong, S. W., Leung, P. T., Djurisic, A., and Leung, K. M. Analytical and Bioana-
lytical Chemistry 396(2), 609–618 (2010).
[388] Hu, J., Wang, J., Liu, S., Zhang, Z., Zhang, H., Cai, X., Pan, J., and Liu, J. Journal
of Environmental Sciences 66, 208–215 (2018).
[389] Blaise, C., Gagne, F., Ferard, J., and Eullaffroy, P. Environmental Toxicology: An
International Journal 23(5), 591–598 (2008).
[390] Corinaldesi, C., Marcellini, F., Nepote, E., Damiani, E., and Danovaro, R. Science
of The Total Environment 637-638, 1279 – 1285 (2018).
[391] Jovanovic, B. and Guzman, H. M. Environmental Toxicology and Chemistry 33(6),
1346–1353 (2014).
[392] Kertesz, Z., Szikszai, Z., and Kiss, A. ATOMKI Annual Report , 70 (2004).
[393] Barnard, A. S. Nature Nanotechnology 5(4), 271–274 (2010).
[394] Wickett, R. R. and Visscher, M. O. American Journal of Infection Control 34(10,
Supplement), S98 – S110 (2006).
224
BIBLIOGRAPHY BIBLIOGRAPHY
[395] Freedberg, I. M., Tomic-Canic, M., Komine, M., and Blumenberg, M. Journal of
Investigative Dermatology 116(5), 633 – 640 (2001).
[396] Das, C., Noro, M. G., and Olmsted, P. D. Physical Reviews Letters 111, 148101
(2013).
[397] Elias, P. M. Seminars in Immunopathology 29(1), 3 Mar (2007).
[398] Wbensmith, User:Wbensmith, (2007). https://commons.wikimedia.org/
wiki/User:Wbensmith, (viewed 19/2/18).
[399] Cevc, G. and Vierl, U. Journal of Controlled Release 141(3), 277 – 299 (2010).
Pharmaceutical Nanotechnology: Unmet Needs in Drug Delivery.
[400] Kezic, S. and Nielsen, J. B. International Archives of Occupational and Environ-
mental Health 82(6), 677–688 May (2009).
[401] Jiang, S. J., Chu, A. W., Lu, Z. F., Pan, M. H., Che, D. F., and Zhou, X. J. Experi-
mental Dermatology 16(12), 985–992 (2007).
[402] Liu, Z., Fluhr, J. W., Song, S. P., Sun, Z., Wang, H., Shi, Y. J., Elias, P. M., and
Man, M. Q. Skin Pharmacology and Physiology 23(6), 313–319 (2010).
[403] Mortensen, L. J., Oberdorster, G., Pentland, A. P., and DeLouise, L. A. Nano
Letters 8(9), 2779–2787 (2008).
[404] Nohynek, G. J., Lademann, J., Ribaud, C., and Roberts, M. S. Critical Reviews in
Toxicology 37(3), 251–277 (2007).
[405] Potts, R. O. and Guy, R. H. Pharmaceutical Research 9(5), 663–669 (1992).
[406] Zhai, H. and Maibach, H. I. Skin Pharmacology and Physiology 14(1), 1–10
(2001).
[407] Mavon, A., Miquel, C., Lejeune, O., Payre, B., and Moretto, P. Skin Pharmacology
and Physiology 20(1), 10–20 (2007).
225

BIBLIOGRAPHY BIBLIOGRAPHY
[408] Magnusson, B. M., Walters, K. A., and Roberts, M. S. Advanced Drug Delivery
Reviews 50(3), 205–227 (2001).
[409] Holmes, A. M., Song, Z., Moghimi, H. R., and Roberts, M. S. ACS Nano 10(2),
1810–1819 (2016).
[410] Crosera, M., Prodi, A., Mauro, M., Pelin, M., Florio, C., Bellomo, F., Adami, G.,
Apostoli, P., De Palma, G., Bovenzi, M., et al. International Journal of Environ-
mental Research and Public Health 12(8), 9282–9297 (2015).
[411] Cross, S., Innes, B., Roberts, M., Tsuzuki, T., Robertson, T., and McCormick, P.
Skin and Pharmacology and Physiology 20, 148 – 154 (2007).
[412] Durand, L., Habran, N., Henschel, V., and Amighi, K. International Journal of
Cosmetic Science 31(4), 279–292 (2009).
[413] Pflucker, F., Wendel, V., Hohenberg, H., Gartner, E., Will, T., Pfeiffer, S., Wepf,
R., and Gers-Barlag, H. Skin Pharmacology and Physiology 14(Suppl. 1), 92–97
(2001).
[414] Schulz, J., Hohenberg, H., Pflucker, F., Gartner, E., Will, T., Pfeiffer, S., Wepf, R.,
Wendel, V., Gers-Barlag, H., and Wittern, K.-P. Advanced Drug Delivery Reviews
54, S157–S163 (2002).
[415] Filipe, P., Silva, J., Silva, R., De Castro, J. C., Gomes, M. M., Alves, L., Santus,
R., and Pinheiro, T. Skin Pharmacology and Physiology 22(5), 266–275 (2009).
[416] Zvyagin, A. V., Zhao, X., Gierden, A., Sanchez, W., Ross, J., and Roberts, M. S.
Journal of Biomedical Optics 13(6), 1 – 9 (2008).
[417] Roberts, M. S., Roberts, M. J., Robertson, T. A., Sanchez, W., Thorling, C., Zou,
Y., Zhao, X., Becker, W., and Zvyagin, A. V. Journal of Biophotonics 1(6), 478–
493 (2008).
[418] Leite-Silva, V. R., Liu, D. C., Sanchez, W. Y., Studier, H., Mohammed, Y. H.,
Holmes, A., Becker, W., Grice, J. E., Benson, H. A., and Roberts, M. S.
226
BIBLIOGRAPHY BIBLIOGRAPHY
Nanomedicine 11(10), 1193–1205 (2016). PMID: 27102240.
[419] Senzui, M., Tamura, T., Miura, K., Ikarashi, Y., Watanabe, Y., and Fujii, M. The
Journal of Toxicological Sciences 35(1), 107–113 (2010).
[420] Miquel-Jeanjean, C., Crepel, F., Raufast, V., Payre, B., Datas, L., Bessou-Touya,
S., and Duplan, H. Photochemistry and Photobiology 88(6), 1513–1521 (2012).
[421] Gulson, B., McCall, M., Korsch, M., Gomez, L., Casey, P., Oytam, Y., Taylor,
A., McCulloch, M., Trotter, J., Kinsley, L., et al. Toxicological Sciences 118(1),
140–149 (2010).
[422] Zhang, Q., Liu, Z., Du, J., Qin, W., Lu, M., Cui, H., Li, X., Ding, S., Li, R., and
Yuan, J. The Journal of Toxicological Sciences 44(1), 35–45 (2019).
[423] Mohammed, Y. H., Barkauskas, D. S., Holmes, A., Grice, J., and Roberts, M. S.
Journal of Biomedical Optics 25(1), 1 – 19 (2020).
[424] Fajzulin, I., Zhu, X., and Moller, M. Journal of Coatings Technology and Research
12(4), 617–632 (2015).
[425] Batzill, M. Energy & Environmental Science 4(9), 3275–3286 (2011).
[426] Park, H., Park, Y., Kim, W., and Choi, W. Journal of Photochemistry and Photobi-
ology C: Photochemistry Reviews 15, 1–20 (2013).
[427] Schneider, J., Matsuoka, M., Takeuchi, M., Zhang, J., Horiuchi, Y., Anpo, M., and
Bahnemann, D. W. Chemical Reviews 114(19), 9919–9986 (2014).
[428] Hoffmann, M. R., Martin, S. T., Choi, W., and Bahnemann, D. W. Chemical Re-
views 95(1), 69–96 (1995).
[429] Khataee, A. and Kasiri, M. B. Journal of Molecular Catalysis A: Chemical 328(1-
2), 8–26 (2010).
[430] Lindan, P., Harrison, N., Gillan, M., and White, J. Physical Review B 55(23),
15919 (1997).
227

BIBLIOGRAPHY BIBLIOGRAPHY
[431] Chretien, S. and Metiu, H. The Journal of Physical Chemistry C 115(11), 4696–
4705 (2011).
[432] Wendt, S., Matthiesen, J., Schaub, R., Vestergaard, E. K., Lægsgaard, E., Besen-
bacher, F., and Hammer, B. Physical Review Letters 96(6), 066107 (2006).
[433] Bikondoa, O., Pang, C. L., Ithnin, R., Muryn, C. A., Onishi, H., and Thornton, G.
Nature Materials 5(3), 189 (2006).
[434] Ketteler, G., Yamamoto, S., Bluhm, H., Andersson, K., Starr, D. E., Ogletree, D. F.,
Ogasawara, H., Nilsson, A., and Salmeron, M. The Journal of Physical Chemistry
C 111(23), 8278–8282 (2007).
[435] Tilocca, A. and Selloni, A. The Journal of Physical Chemistry B 108(15), 4743–
4751 (2004).
[436] Gupta, S. M. and Tripathi, M. Chinese Science Bulletin 56(16), 1639–1657 (2011).
[437] Monticone, S., Tufeu, R., Kanaev, A., Scolan, E., and Sanchez, C. Applied Surface
Science 162-163, 565 – 570 (2000).
[438] Lin, H., Huang, C., Li, W., Ni, C., Shah, S. I., and Tseng, Y.-H. Applied Catalysis
B: Environmental 68(1), 1–11 (2006).
[439] Yamada, Y. and Kanemitsu, Y. Applied Physics Letters 101(13), 133907 (2012).
[440] Dozzi, M. V., D’Andrea, C., Ohtani, B., Valentini, G., and Selli, E. The Journal of
Physical Chemistry C 117(48), 25586–25595 (2013).
[441] Shaw, A. A., Wainschel, L. A., and Shetlar, M. D. Photochemistry and Photobiol-
ogy 55(5), 647–656 (1992).
[442] Gasparro, F. Photo-dermatology 2(3), 151–157 (1985).
[443] Allen, J. M., Gossett, C. J., and Allen, S. K. Chemical Research in Toxicology 9(3),
605–609 (1996).
228
BIBLIOGRAPHY BIBLIOGRAPHY
[444] Buchalska, M., Kras, G., Oszajca, M., Łasocha, W., and Macyk, W. Journal of
Photochemistry and Photobiology A: Chemistry 213(2), 158 – 163 (2010).
[445] Carlotti, M. E., Sapino, S., Vione, D., Minero, C., Peira, E., and Trotta, M. Journal
of Dispersion Science and Technology 28(5), 805–818 (2007).
[446] Kim, E., Kim, M., Im, N., and Park, S. Journal of Photochemistry and Photobiol-
ogy B: Biology 149, 196 – 203 (2015).
[447] Rajeshwar, K., Osugi, M., Chanmanee, W., Chenthamarakshan, C., Zanoni, M.
V. B., Kajitvichyanukul, P., and Krishnan-Ayer, R. Journal of Photochemistry and
Photobiology C: Photochemistry Reviews 9(4), 171–192 (2008).
[448] Carlotti, M. E., Ugazio, E., Gastaldi, L., Sapino, S., Vione, D., Fenoglio, I., and
Fubini, B. Journal of Photochemistry and Photobiology B: Biology 96(2), 130–135
(2009).
[449] Lewicka, Z. A., William, W. Y., Oliva, B. L., Contreras, E. Q., and Colvin, V. L.
Journal of Photochemistry and Photobiology A: Chemistry 263, 24–33 (2013).
[450] Wilson, J. N. and Idriss, H. Journal of the American Chemical Society 124(38),
11284–11285 (2002).
[451] Xu, M., Gao, Y., Moreno, E. M., Kunst, M., Muhler, M., Wang, Y., Idriss, H., and
Woll, C. Physical Review Letters 106(13), 138302 (2011).
[452] Jiang, J., Oberdorster, G., Elder, A., Gelein, R., Mercer, P., and Biswas, P. P. Nan-
otoxicology 2(1), 33–42 (2008). PMID: 20827377.
[453] SHI, L. and WENG, D. Journal of Environmental Sciences 20(10), 1263 – 1267
(2008).
[454] Hurum, D. C., Agrios, A. G., Gray, K. A., Rajh, T., and Thurnauer, M. C. The
Journal of Physical Chemistry B 107(19), 4545–4549 (2003).
[455] Bernauer, U., Bodin, L., Celleno, L., Chaudhry, Q.M., Coenraads, P., Dusinska,
M., Duus-Johansen, J., Ezendam, J., Gaffet, E., Galli, L.C., OPINION ON Tita-
229
BIBLIOGRAPHY BIBLIOGRAPHY
nium Dioxide (nano form) coated with Cetyl Phosphate, Manganese Dioxide or
Triethoxycaprylylsilane as UV-filter in dermally applied cosmetic. (2016).
[456] Mitchnick, M. A., Fairhurst, D., and Pinnell, S. R. Journal of the American
Academy of Dermatology 40(1), 85 – 90 (1999).
[457] Rampaul, A., Parkin, I. P., and Cramer, L. P. Journal of Photochemistry and Pho-
tobiology A: Chemistry 191(2), 138 – 148 (2007).
[458] Dizhbite, T., Telysheva, G., Jurkjane, V., and Viesturs, U. Bioresource Technology
95(3), 309 – 317 (2004).
[459] Qian, Y., Qiu, X., and Zhu, S. Green Chemistry 17, 320–324 (2015).
[460] Yu, J., Li, L., Qian, Y., Lou, H., Yang, D., and Qiu, X. Industrial & Engineering
Chemistry Research 57(46), 15740–15748 (2018).
[461] Morsella, M., Giammatteo, M., Arrizza, L., Tonucci, L., Bressan, M., and
d’Alessandro, N. RSC Advances 5, 57453–57461 (2015).
[462] Lee, W. A., Pernodet, N., Li, B., Lin, C. H., Hatchwell, E., and Rafailovich, M. H.
Chemical Communications , 4815–4817 (2007).
[463] Yang, H., He, P., Cheng, H., and Shentu, B. Industrial & Engineering Chemistry
Research 58(28), 12516–12524 (2019).
[464] Anpo, M., Ichihashi, Y., Takeuchi, M., and Yamashita, H. Research on Chemical
Intermediates 24(2), 143–149 (1998).
[465] Anpo, M. Bulletin of the Chemical Society of Japan 77(8), 1427–1442 (2004).
[466] Wang, J., Tafen, D. N., Lewis, J. P., Hong, Z., Manivannan, A., Zhi, M., Li, M., and
Wu, N. Journal of the American Chemical Society 131(34), 12290–12297 (2009).
[467] Zaleska, A. Recent Patents on Engineering 2(3), 157–164 (2008).
[468] Arroyo, R., Cordoba, G., Padilla, J., and Lara, V. Materials Letters 54(5-6), 397–
402 (2002).
230
BIBLIOGRAPHY BIBLIOGRAPHY
[469] Mogal, S. I., Gandhi, V. G., Mishra, M., Tripathi, S., Shripathi, T., Joshi, P. A.,
and Shah, D. O. Industrial & Engineering Chemistry Research 53(14), 5749–5758
(2014).
[470] Sajjad, S., Leghari, S. A., Chen, F., and Zhang, J. Chemistry–A European Journal
16(46), 13795–13804 (2010).
[471] Hsieh, C.-T., Fan, W.-S., Chen, W.-Y., and Lin, J.-Y. Separation and Purification
Technology 67(3), 312–318 (2009).
[472] Atashfaraz, M., Shariaty-Niassar, M., Ohara, S., Minami, K., Umetsu, M., Naka,
T., and Adschiri, T. Fluid Phase Equilibria 257(2), 233–237 (2007).
[473] Wang, M., Song, G., Li, J., Miao, L., and Zhang, B. Journal of University of
Science and Technology Beijing, Mineral, Metallurgy, Material 15(5), 644–648
(2008).
[474] Chen, R.-f., Zhang, C.-x., Deng, J., and Song, G.-q. International Journal of Min-
erals, Metallurgy and Materials 16(2), 220–225 (2009).
[475] Xu, J.-C., Lu, M., Guo, X.-Y., and Li, H.-L. Journal of Molecular Catalysis A:
Chemical 226(1), 123–127 (2005).
[476] Deng, L., Wang, S., Liu, D., Zhu, B., Huang, W., Wu, S., and Zhang, S. Catalysis
Letters 129(3-4), 513–518 (2009).
[477] Ma, Y., Zhang, J., Tian, B., Chen, F., Bao, S., and Anpo, M. Research on Chemical
Intermediates 38(8), 1947–1960 (2012).
[478] Ma, Y., Zhang, J., Tian, B., Chen, F., and Wang, L. Journal of Hazardous Materials
182(1-3), 386–393 (2010).
[479] Sun, L., Zhao, X., Cheng, X., Sun, H., Li, Y., Li, P., and Fan, W. Langmuir 28(13),
5882–5891 (2012).
[480] Yan, N., Zhu, Z., Zhang, J., Zhao, Z., and Liu, Q. Materials Research Bulletin
47(8), 1869 – 1873 (2012).
231

BIBLIOGRAPHY BIBLIOGRAPHY
[481] Ma, Y., Xing, M., Zhang, J., Tian, B., and Chen, F. Microporous and Mesoporous
Materials 156, 145–152 (2012).
[482] Zhu, J., Zheng, W., He, B., Zhang, J., and Anpo, M. Journal of Molecular Catalysis
A: Chemical 216(1), 35–43 (2004).
[483] Li, Z., Shen, W., He, W., and Zu, X. Journal of Hazardous Materials 155(3),
590–594 (2008).
[484] Wakefield, G., Lipscomb, S., Holland, E., and Knowland, J. Photochemical &
Photobiological Sciences 3, 648–652 (2004).
[485] Irie, H., Watanabe, Y., and Hashimoto, K. Chemistry Letters 32(8), 772–773
(2003).
[486] Ho, W., Jimmy, C. Y., and Lee, S. Journal of Solid State Chemistry 179(4), 1171–
1176 (2006).
[487] Senthilnathan, J. and Philip, L. Chemical Engineering Journal 161(1-2), 83–92
(2010).
[488] Raj, K. J. A., Ramaswamy, A., and Viswanathan, B. The Journal of Physical
Chemistry C 113(31), 13750–13757 (2009).
[489] Asahi, R., Morikawa, T., Ohwaki, T., Aoki, K., and Taga, Y. Science 293(5528),
269–271 (2001).
[490] Huang, F., Yan, A., and Zhao, H. Semiconductor Photocatalysis—Materials,
Mechanisms and Applications; Cao, W., Ed , 31–80 (2016).
[491] Zhao, Z. and Liu, Q. Journal of Physics D: Applied Physics 41(2), 025105 (2007).
[492] Ansari, S. A., Khan, M. M., Ansari, M. O., Kalathil, S., Lee, J., and Cho, M. H.
RSC Advances 4, 16782–16791 (2014).
[493] Inoue, M., Kimura, M., and Inui, T. Chemical Communications (11), 957–958
(1999).
232
BIBLIOGRAPHY BIBLIOGRAPHY
[494] Tsunekawa, S., Fukuda, T., and Kasuya, A. Journal of Applied Physics 87(3),
1318–1321 (2000).
[495] Yabe, S., Yamashita, M., Momose, S., Tahira, K., Yoshida, S., Li, R., Yin, S., and
Sato, T. International Journal of Inorganic Materials 3(7), 1003 – 1008 (2001).
[496] Truffault, L., Winton, B., Choquenet, B., Andreazza, C., Simmonard, C., Devers,
T., Konstantinov, K., Couteau, C., and Coiffard, L. J. Materials Letters 68, 357 –
360 (2012).
[497] Schubert, D., Dargusch, R., Raitano, J., and Chan, S.-W. Biochemical and Bio-
physical Research Communications 342(1), 86 – 91 (2006).
[498] Schanen, B. C., Das, S., Reilly, C. M., Warren, W. L., Self, W. T., Seal, S., and
Drake III, D. R. PloS One 8(5) (2013).
[499] Zhang, F., Wang, P., Koberstein, J., Khalid, S., and Chan, S.-W. Surface Science
563(1-3), 74–82 (2004).
[500] Nelson, B. C., Johnson, M. E., Walker, M. L., Riley, K. R., and Sims, C. M. An-
tioxidants 5(2) (2016).
[501] Mauro, M., Crosera, M., Monai, M., Montini, T., Fornasiero, P., Bovenzi, M.,
Adami, G., Turco, G., and Larese Filon, F. Molecules 24(20), 3759 (2019).
[502] Cardillo, D., Konstantinov, K., and Devers, T. Materials Research Bulletin 48(11),
4521–4525 (2013).
[503] Truffault, L., Choquenet, B., Konstantinov, K., Devers, T., Couteau, C., and Coif-
fard, L. J. Journal of Nanoscience and Nanotechnology 11(3), 2413–2420 (2011).
[504] Piccirillo, C., Rocha, C., Tobaldi, D., Pullar, R., Labrincha, J., Ferreira, M., Castro,
P. M., and Pintado, M. Journal of Materials Chemistry B 2(36), 5999–6009 (2014).
[505] Baroli, B., Ennas, M. G., Loffredo, F., Isola, M., Pinna, R., and Lopez-Quintela,
M. A. Journal of Investigative Dermatology 127(7), 1701 – 1712 (2007).
233

BIBLIOGRAPHY BIBLIOGRAPHY
[506] Musazzi, U. M., Santini, B., Selmin, F., Marini, V., Corsi, F., Allevi, R., Ferretti,
A. M., Prosperi, D., Cilurzo, F., Colombo, M., et al. Journal of Nanobiotechnology
15(1), 14 (2017).
[507] Lewinski, N. A., Berthet, A., Maurizi, L., Eisenbeis, A., and Hopf, N. B. Journal
of Occupational and Environmental Hygiene 14(8), D115–D119 (2017).
[508] Freyria, F. S., Bonelli, B., Tomatis, M., Ghiazza, M., Gazzano, E., Ghigo, D.,
Garrone, E., and Fubini, B. Chemical Research in Toxicology 25(4), 850–861
(2012).
[509] Steinhoff, D., Mohr, U., and Hahnemann, S. Experimental Pathology 43(3-4),
189–194 (1991).
[510] Turci, F., Tomatis, M., Lesci, I. G., Roveri, N., and Fubini, B. Chemistry–A Euro-
pean Journal 17(1), 350–358 (2011).
[511] Cardillo, D., Tehei, M., Hossain, M. S., Islam, M. M., Bogusz, K., Shi, D.,
Mitchell, D., Lerch, M., Rosenfeld, A., Corde, S., et al. ACS Applied Materials
& Interfaces 8(9), 5867–5876 (2016).
[512] Morlando, A., Cardillo, D., Devers, T., and Konstantinov, K. Materials Letters
171, 289–292 (2016).
[513] Bu, L., Yang, W., and Ming, H. RSC Advances 5, 45122–45128 (2015).
[514] Zolotoyabko, E. Basic Concepts of X-Ray Diffraction. John Wiley and Sons,
Incorporated, Weinheim, GERMANY, (2014).
[515] JEOL, JSM-7500F Field Emission Scanning Electron Microscope, (2019).
https://www.jeol.co.jp/en/products/detail/JSM-7500F.html, (viewed
6/12/19).
[516] JEOL, Electron Microscopy, NMR and Mass Spectrometry
News, (2019). https://www.jeolbenelux.com/JEOL-BV-News/
inauguration-of-the-jem-arm200f-in-leuven, (viewed 10/12/19).
234

BIBLIOGRAPHY BIBLIOGRAPHY
[517] Hofer, F., Schmidt, F. P., Grogger, W., and Kothleitner, G. IOP Conference Series:
Materials Science and Engineering 109, 012007 (2016).
[518] Gloter, A., Ewels, C., Umek, P., Arcon, D., and Colliex, C. Physical Review B
80(3), 035413 (2009).
[519] Egerton, R. and Malac, M. Journal of Electron Spectroscopy and Related Phenom-
ena 143(2), 43 – 50 (2005). Electron Energy Loss Spectroscopy in the Electron
Microscope.
[520] van der Heide, P. X-ray Photoelectron Spectroscopy : An introduction to Principles
and Practices. Wiley, Hoboken, UNITED STATES, (2011).
[521] Bower, D. I. An Introduction to Polymer Physics. Cambridge University Press,
(2002).
[522] Thommes, M., Kaneko, K., Neimark, A. V., Olivier, J. P., Rodriguez-Reinoso, F.,
Rouquerol, J., and Sing, K. S. Pure and Applied Chemistry 87(9-10) (2015).
[523] Gabbott, P. Principles and Applications of Thermal Analysis. John Wiley & Sons,
Incorporated, Hoboken, UNITED KINGDOM, (2007).
[524] Tauc, J. Materials Research Bulletin 3(1), 37 – 46 (1968).
[525] American Society for Testing and Materials. Standard Tables for Reference So-
lar Spectral Irradiances. ASTM International West Conshohocken, Pennsylvania,
(2005).
[526] Konstantinou, I. K. and Albanis, T. A. Applied Catalysis B: Environmental 49(1),
1 – 14 (2004).
[527] Habib, M. A., Ismail, I. M. I., Mahmood, A. J., and Ullah, M. R. Journal of Saudi
Chemical Society 16(4), 423 – 429 (2012).
[528] Galindo, C., Jacques, P., and Kalt, A. Journal of Photochemistry and Photobiology
A: Chemistry 130(1), 35 – 47 (2000).
235

BIBLIOGRAPHY BIBLIOGRAPHY
[529] Houas, A., Lachheb, H., Ksibi, M., Elaloui, E., Guillard, C., and Herrmann, J.-M.
Applied Catalysis B: Environmental 31(2), 145 – 157 (2001).
[530] Boukamp, P., Petrussevska, R. T., Breitkreutz, D., Hornung, J., Markham, A., and
Fusenig, N. E. The Journal of Cell Biology 106(3), 761–771 (1988).
[531] Ichihashi, M., Ueda, M., Budiyanto, A., Bito, T., Oka, M., Fukunaga, M., Tsuru,
K., and Horikawa, T. Toxicology 189(1–2), 21 – 39 (2003).
[532] Bach, U., Lupo, D., Comte, P., Moser, J. E., Weissortel, F., Salbeck, J., Spreitzer,
H., and Gratzel, M. Nature 395(6702), 583–585 (1998).
[533] Sharma, V., Anderson, D., and Dhawan, A. Apoptosis 17(8), 852–870 (2012).
[534] Heng, B. C., Zhao, X., Xiong, S., Ng, K. W., Boey, F. Y.-C., and Loo, J. S.-C. Food
and Chemical Toxicology 48(6), 1762 – 1766 (2010).
[535] Caputo, F., De Nicola, M., Sienkiewicz, A., Giovanetti, A., Bejarano, I., Licoccia,
S., Traversa, E., and Ghibelli, L. Nanoscale 7, 15643–15656 (2015).
[536] Seentrakoon, B., Junhasavasdikul, B., and Chavasiri, W. Polymer Degradation and
Stability 98(2), 566 – 578 (2013).
[537] Bernkop-Schnurch, A. and Dunnhaupt, S. European Journal of Pharmaceutics and
Biopharmaceutics 81(3), 463 – 469 (2012).
[538] Jayakumar, R., Prabaharan, M., Kumar, P. S., Nair, S., and Tamura, H. Biotechnol-
ogy Advances 29(3), 322 – 337 (2011).
[539] Parvez, S., Rahman, M. M., Khan, M. A., Khan, M. A. H., Islam, J. M. M., Ahmed,
M., Rahman, M. F., and Ahmed, B. Polymer Bulletin 69(6), 715–731 (2012).
[540] Regiel-Futyra, A., Kus-Liskiewicz, M., Wojtyła, S., Stochel, G., and Macyk, W.
RSC Advances 5, 80089–80097 (2015).
[541] Yang, D., Li, J., Jiang, Z., Lu, L., and Chen, X. Chemical Engineering Science
64(13), 3130 – 3137 (2009).
236
BIBLIOGRAPHY BIBLIOGRAPHY
[542] Haldorai, Y. and Shim, J.-J. Polymer Composites 35(2), 327–333 (2014).
[543] Kilicarslan, M., Gumustas, M., Yildiz, S., and Baykara, T. Current Drug Delivery
11(1), 98–111 (2014).
[544] Sencadas, V., Correia, D. M., Ribeiro, C., Moreira, S., Botelho, G., Ribelles, J. G.,
and Lanceros-Mendez, S. Polymer Testing 31(8), 1062–1069 (2012).
[545] Souza, B., Cerqueira, M., Martins, J., Casariego, A., Teixeira, J., and Vicente, A.
Food Hydrocolloids 24(4), 330–335 (2010).
[546] Bojinova, A., Kralchevska, R., Poulios, I., and Dushkin, C. Materials Chemistry
and Physics 106(2-3), 187–192 (2007).
[547] Mohammadpour Dounighi, N., Eskandari, R., Avadi, M. R., Zolfagharian, H., Mir
Mohammad Sadeghi, A., and Rezayat, M. Journal of Venomous Animals and Tox-
ins Including Tropical Diseases 18(1), 44–52 (2012).
[548] Kumirska, J., Czerwicka, M., Kaczynski, Z., Bychowska, A., Brzozowski, K.,
Thoming, J., and Stepnowski, P. Marine Drugs 8(5), 1567–1636 (2010).
[549] A.C., A., J.A., G.-T., V., S., J., A., Gomez, R. J., and S., L.-M. Polymer Engineering
& Science 52(6), 1293–1300.
[550] Brugnerotto, J., Lizardi, J., Goycoolea, F., Arguelles-Monal, W., Desbrieres, J.,
and Rinaudo, M. Polymer 42(8), 3569–3580 (2001).
[551] Neto, C., Giacometti, J., Job, A., Ferreira, F., Fonseca, J., and Pereira, M. Carbo-
hydrate Polymers 62(2), 97 – 103 (2005).
[552] Georgieva, V., Zvezdova, D., and Vlaev, L. Chemistry Central Journal 6(1), 81
Aug (2012).
[553] Sencadas, V., Costa, C. M., Botelho, G., Caparros, C., Ribeiro, C., Gomez-
Ribelles, J. L., and Lanceros-Mendez, S. Journal of Macromolecular Science,
Part B 51(3), 411–424 (2012).
237
BIBLIOGRAPHY BIBLIOGRAPHY
[554] Wang, G., Xu, L., Zhang, J., Yin, T., and Han, D. International Journal of Pho-
toenergy 2012, 9 (2012).
[555] Ramaprasad, A., Rao, V., Sanjeev, G., Ramanani, S., and Sabharwal, S. Synthetic
Metals 159(19), 1983 – 1990 (2009).
[556] Wang, Y., Pitto-Barry, A., Habtemariam, A., Romero-Canelon, I., Sadler, P. J., and
Barry, N. P. E. Inorganic Chemistry Frontiers 3, 1058–1064 (2016).
[557] Urreaga, J. M. and de la Orden, M. European Polymer Journal 42(10), 2606 –
2616 (2006).
[558] Tran, D. T. and Salmon, R. Australasian Journal of Dermatology 52(1), 1–6
(2011).
[559] Livraghi, S., Corazzari, I., Cristina Paganini, M., Ceccone, G., Giamello, E., Fu-
bini, B., and Fenoglio, I. Chemical Communications 46, 8478–80 10 (2010).
[560] Lakshminarasimhan, N., Bokare, A. D., and Choi, W. The Journal of Physical
Chemistry C 116(33), 17531–17539 (2012).
[561] Vaiano, V., Sacco, O., Sannino, D., Navarra, W., Daniel, C., and Vincenzo, V. Jour-
nal of Photochemistry and Photobiology A: Chemistry 336, 191–197 03 (2017).
[562] Morlando, A., Chaki Borras, M., Rehman, Y., Bakand, S., Barker, P., Sluyter, R.,
and Konstantinov, K. Journal of Materials Chemistry B , – (2020).
[563] Lucas, R. M., Norval, M., Neale, R. E., Young, A. R., de Gruijl, F. R., Takizawa,
Y., and van der Leun, J. C. Photochemical & Photobiological Sciences 14, 53–87
(2015).
[564] De Gruijl, F. R., Longstreth, J., Norval, M., Cullen, A. P., Slaper, H., Kripke, M. L.,
Takizawa, Y., and van der Leun, J. C. Photochemical & Photobiological Sciences
2(1), 16–28 (2003).
238

BIBLIOGRAPHY BIBLIOGRAPHY
[565] Schulz, J., Hohenberg, H., Pflucker, F., Gartner, E., Will, T., Pfeiffer, S., Wepf, R.,
Wendel, V., Gers-Barlag, H., and Wittern, K.-P. Advanced Drug Delivery Reviews
54, Supplement, S157 – S163 (2002). Human skin: the Medium of Touch.
[566] Lekki, J., Stachura, Z., Dabros, W., Stachura, J., Menzel, F., Reinert, T., Butz, T.,
Pallon, J., Gontier, E., Ynsa, M., et al. Nuclear Instruments and Methods in Physics
Research Section B: Beam Interactions with Materials and Atoms 260(1), 174–177
(2007).
[567] Pinheiro, T., Pallon, J., Alves, L., Verıssimo, A., Filipe, P., Silva, J., and Silva, R.
Nuclear Instruments and Methods in Physics Research Section B: Beam Interac-
tions with Materials and Atoms 260(1), 119–123 (2007).
[568] Ren, Y., Liu, X., Geng, R., Lu, Q., Rao, R., Tan, X., Yang, X., and Liu, W. Nano-
materials 8(4), 253 (2018).
[569] Ji, Y., Zhou, L., Ferronato, C., Salvador, A., Yang, X., and Chovelon, J.-M. Applied
Catalysis B: Environmental 140, 457–467 (2013).
[570] O’Regan, B. and Gratzel, M. Nature 353(6346), 737 (1991).
[571] Li, J. and Wu, N. Catalysis Science & Technology 5(3), 1360–1384 (2015).
[572] Klein, S. M., Choi, J. H., Pine, D. J., and Lange, F. F. Journal of Materials Research
18(6), 1457–1464 (2003).
[573] Feig, D. I., Sowers, L. C., and Loeb, L. A. Proceedings of the National Academy
of Sciences 91(14), 6609–6613 (1994).
[574] El-Toni, A. M., Yin, S., and Sato, T. Journal of Colloid and Interface Science
300(1), 123–130 (2006).
[575] Furusawa, T., Honda, K., Ukaji, E., Sato, M., and Suzuki, N. Materials Research
Bulletin 43(4), 946–957 (2008).
[576] Siddiquey, I. A., Furusawa, T., Sato, M., Honda, K., and Suzuki, N. Dyes and
Pigments 76(3), 754–759 (2008).
239

BIBLIOGRAPHY BIBLIOGRAPHY
[577] Solaiman, S., Algie, J., Bakand, S., Sluyter, R., Sencadas, V., Lerch, M., Huang,
X.-F., Konstantinov, K., and Barker, P. J. Critical Reviews in Toxicology 49(2),
122–139 (2019).
[578] Pirmohamed, T., Dowding, J. M., Singh, S., Wasserman, B., Heckert, E., Karakoti,
A. S., King, J. E. S., Seal, S., and Self, W. T. Chemical Communications 46,
2736–2738 (2010).
[579] Ngoc, L. T. N., Bui, V. K. H., Moon, J.-Y., and Lee, Y.-C. Journal of Nanoscience
and Nanotechnology 19(10), 6369–6375 (2019).
[580] Caputo, F., Giovanetti, A., Corsi, F., Maresca, V., Briganti, S., Licoccia, S.,
Traversa, E., and Ghibelli, L. Frontiers in Pharmacology 9, 1183 (2018).
[581] Pagliari, F., Mandoli, C., Forte, G., Magnani, E., Pagliari, S., Nardone, G., Licoc-
cia, S., Minieri, M., Di Nardo, P., and Traversa, E. ACS Nano 6(5), 3767–3775
(2012).
[582] Li, Y., Hou, X., Yang, C., Pang, Y., Li, X., Jiang, G., and Liu, Y. Scientific Reports
9(1), 1–10 (2019).
[583] Zhang, Y., Zhao, G., Zhang, Y., and Huang, X. Green Chemistry 16(8), 3860–3869
(2014).
[584] Li, G., Zhang, D., and Jimmy, C. Y. Physical Chemistry Chemical Physics 11(19),
3775–3782 (2009).
[585] Yuan, B., Long, Y., Wu, L., Liang, K., Wen, H., Luo, S., Huo, H., Yang, H., and
Ma, J. Catalysis Science & Technology 6(16), 6396–6405 (2016).
[586] Huang, B., Yu, D., Sheng, Z., and Yang, L. Journal of Environmental Sciences 55,
129–136 (2017).
[587] Karunakaran, C. and Gomathisankar, P. ACS Sustainable Chemistry & Engineering
1(12), 1555–1563 (2013).
240
BIBLIOGRAPHY BIBLIOGRAPHY
[588] Jiao, J., Wei, Y., Zhao, Z., Liu, J., Li, J., Duan, A., and Jiang, G. Industrial &
Engineering Chemistry Research 53(44), 17345–17354 (2014).
[589] Muhammed Shafi, P. and Chandra Bose, A. AIP Advances 5(5), 057137 (2015).
[590] Singh, I. and Birajdar, B. RSC Advances 7(85), 54053–54062 (2017).
[591] Qin, X., Jing, L., Tian, G., Qu, Y., and Feng, Y. Journal of Hazardous Materials
172(2-3), 1168–1174 (2009).
[592] Erdem, B., Hunsicker, R. A., Simmons, G. W., Sudol, E. D., Dimonie, V. L., and
El-Aasser, M. S. Langmuir 17(9), 2664–2669 (2001).
[593] Xu, J., Harmer, J., Li, G., Chapman, T., Collier, P., Longworth, S., and Tsang, S. C.
Chemical Communications 46(11), 1887–1889 (2010).
[594] Sims, C. M., Maier, R. A., Johnston-Peck, A. C., Gorham, J. M., Hackley, V. A.,
and Nelson, B. C. In Abstracts of Papers of the American Chemical Society, volume
254. American Chemical Society 1155 16th St, NW, Washingston, DC 20036 USA,
(2017).
[595] Eriksson, P., Tal, A. A., Skallberg, A., Brommesson, C., Hu, Z., Boyd, R. D.,
Olovsson, W., Fairley, N., Abrikosov, I. A., Zhang, X., et al. Scientific Reports
8(1), 6999 (2018).
[596] Xue, Y., Luan, Q., Yang, D., Yao, X., and Zhou, K. The Journal of Physical
Chemistry C 115(11), 4433–4438 (2011).
[597] Naldoni, A., Allieta, M., Santangelo, S., Marelli, M., Fabbri, F., Cappelli, S.,
Bianchi, C. L., Psaro, R., and Dal Santo, V. Journal of the American Chemical
Society 134(18), 7600–7603 (2012).
[598] Tanaka, K., Padermpole, K., and Hisanaga, T. Water Research 34(1), 327–333
(2000).
[599] Cong, S. and Xu, Y. The Journal of Physical Chemistry C 115(43), 21161–21168
(2011).
241

BIBLIOGRAPHY BIBLIOGRAPHY
[600] Fronzi, M., Soon, A., Delley, B., Traversa, E., and Stampfl, C. The Journal of
Chemical Physics 131(10), 104701 (2009).
[601] Ghoshal, T., Fleming, P. G., Holmes, J. D., and Morris, M. A. Journal of Materials
Chemistry 22(43), 22949–22957 (2012).
[602] Bogusz, K., Tehei, M., Lerch, M., Dou, S. X., Liu, H. K., and Konstantinov, K.
Journal of Materials Chemistry C 6(21), 5639–5650 (2018).
[603] Rancan, F., Nazemi, B., Rautenberg, S., Ryll, M., Hadam, S., Gao, Q., Hackbarth,
S., Haag, S., Graf, C., Ruhl, E., et al. Skin Research and Technology 20(2), 182–
193 (2014).
[604] Saranya, S., Vijayaranai, K., Pavithra, S., Raihana, N., and Kumanan, K. Toxicol-
ogy Reports 4, 427–430 (2017).
[605] Lee, S. H., Lee, H. R., Kim, Y.-R., and Kim, M.-K. Toxicology and Environmental
Health Sciences 4(1), 14–18 (2012).
[606] Panich, U., Sittithumcharee, G., Rathviboon, N., and Jirawatnotai, S. Stem Cells
International 2016 (2016).
[607] Yohn, J. J., Norris, D. A., Yrastorza, D. G., Buno, I. J., Leff, J. A., Hake, S. S., and
Repine, J. E. Journal of Investigative Dermatology 97(3), 405–409 (1991).
[608] Birben, E., Sahiner, U. M., Sackesen, C., Erzurum, S., and Kalayci, O. World
Allergy Organization Journal 5(1), 9–19 (2012).
[609] Celardo, I., De Nicola, M., Mandoli, C., Pedersen, J. Z., Traversa, E., and Ghibelli,
L. ACS Nano 5(6), 4537–4549 (2011).
[610] Morlando, A., McNamara, J., Rehman, Y., Sencadas, V., Barker, P. J., and Kon-
stantinov, K. Journal of Materials Science 55, 8095 – 8108 (2020).
[611] Popov, A. P., Lademann, J., Priezzhev, A. V., and Myllyla, R. Journal of Biomedi-
cal Optics 10(6), 064037–064037–9 (2005).
242
BIBLIOGRAPHY BIBLIOGRAPHY
[612] Chen, R., Huo, L., Shi, X., Bai, R., Zhang, Z., Zhao, Y., Chang, Y., and Chen, C.
ACS Nano 8(3), 2562–2574 (2014). PMID: 24490819.
[613] Serpone, N. and Salinaro, A. Pure and Applied Chemistry 71(2), 303–320 (1999).
[614] Philippe, A., Kosık, J., Welle, A., Guigner, J.-M., Clemens, O., and Schaumann,
G. E. Environmental Science: Nano 5(1), 191–202 (2018).
[615] Colon, J., Hsieh, N., Ferguson, A., Kupelian, P., Seal, S., Jenkins, D. W., and
Baker, C. H. Nanomedicine: Nanotechnology, Biology and Medicine 6(5), 698–
705 (2010).
[616] Colon, J., Herrera, L., Smith, J., Patil, S., Komanski, C., Kupelian, P., Seal, S.,
Jenkins, D. W., and Baker, C. H. Nanomedicine: Nanotechnology, Biology and
Medicine 5(2), 225–231 (2009).
[617] Celardo, I., De Nicola, M., Mandoli, C., Pedersen, J. Z., Traversa, E., and Ghibelli,
L. ACS Nano 5(6), 4537–4549 (2011).
[618] Pottier, A., Chaneac, C., Tronc, E., Mazerolles, L., and Jolivet, J.-P. Journal of
Materials Chemistry 11(4), 1116–1121 (2001).
[619] Arnal, P., Corriu, R. J., Leclercq, D., Mutin, P. H., and Vioux, A. Journal of
Materials Chemistry 6(12), 1925–1932 (1996).
[620] Ovenstone, J. and Yanagisawa, K. Chemistry of Materials 11(10), 2770–2774
(1999).
[621] Lukacevic, I., Gupta, S. K., Jha, P. K., and Kirin, D. Materials Chemistry and
Physics 137(1), 282–289 (2012).
[622] Hardcastle, F. D., Ishihara, H., Sharma, R., and Biris, A. S. Journal of Materials
Chemistry 21(17), 6337–6345 (2011).
[623] Iliev, M., Hadjiev, V., and Litvinchuk, A. Vibrational Spectroscopy 64, 148–152
(2013).
243
BIBLIOGRAPHY BIBLIOGRAPHY
[624] Tian, F., Zhang, Y., Zhang, J., and Pan, C. The Journal of Physical Chemistry C
116(13), 7515–7519 (2012).
[625] Tompsett, G., Bowmaker, G., Cooney, R., Metson, J., Rodgers, K., and Seakins, J.
Journal of Raman Spectroscopy 26(1), 57–62 (1995).
[626] Balachandran, U. and Eror, N. Journal of Solid State Chemistry 42(3), 276–282
(1982).
[627] Ekoi, E., Gowen, A., Dorrepaal, R., and Dowling, D. Results in Physics 12, 1574–
1585 (2019).
[628] Akita, T. and Kohyama, M. Surface and Interface Analysis 46(12-13), 1249–1252
(2014).
[629] Brydson, R., Sauer, H., Engel, W., Thomass, J., Zeitler, E., Kosugi, N., and Kuroda,
H. Journal of Physics: Condensed Matter 1(4), 797 (1989).
[630] Lazar, S., Botton, G., Wu, M.-Y., Tichelaar, F., and Zandbergen, H. Ultrami-
croscopy 96(3), 535 – 546 (2003). Proceedings of the International Workshop on
Strategies and Advances in Atomic Level Spectroscopy and Analysis.
[631] Huang, Y.-S. and Liu, H.-W. Journal of Materials Engineering and Performance
23(4), 1240–1246 (2014).
[632] Wu, M., Lin, G., Chen, D., Wang, G., He, D., Feng, S., and Xu, R. Chemistry of
Materials 14(5), 1974–1980 (2002).
[633] Zhou, J., Song, B., Zhao, G., and Han, G. Nanoscale Research Letters 7(1), 217
(2012).
[634] Erdogan, N., Ozturk, A., and Park, J. Ceramics International 42(5), 5985 – 5994
(2016).
[635] Wang, H., Wu, Z., Liu, Y., and Sheng, Z. Journal of Molecular Catalysis A:
Chemical 287(1), 176 – 181 (2008).
244

BIBLIOGRAPHY BIBLIOGRAPHY
[636] Ohtani, B., Prieto-Mahaney, O., Li, D., and Abe, R. Journal of Photochemistry and
Photobiology A: Chemistry 216(2), 179 – 182 (2010). 3rd International Conference
on Semiconductor Photochemistry, SP-3, April, 2010, Glasgow UK.
[637] Bogusz, K., Cardillo, D., Tehei, M., Boutard, T., Barker, P. J., Devers, T., Rosen-
feld, A., Dou, S. X., Liu, H. K., and Konstantinov, K. Materials Research Bulletin
108, 130 – 141 (2018).
[638] Sun, Q. and Xu, Y. The Journal of Physical Chemistry C 114(44), 18911–18918
(2010).
[639] Barker, P. Journal of Surface Coatings Australia , 10 (2016).
[640] Heinrich, U., Tronnier, H., Kockott, D., Kuckuk, R., and Heise, H. M. International
Journal of Cosmetic Science 26(2), 79–89 (2004).
[641] Benech-Kieffer, F., Meuling, W., Leclerc, C., Roza, L., Leclaire, J., and Nohynek,
G. Skin Pharmacology and Physiology 16(6), 343–355 (2003).
[642] Fourtanier, A., Moyal, D., and Seite, S. Photodermatology, Photoimmunology &
Photomedicine 24(4), 164–174 (2008).
[643] Klinubol, P., Asawanonda, P., and Wanichwecharungruang, S. Skin Pharmacology
and Physiology 21(1), 23–29 (2008).
[644] Montenegro, L., Carbone, C., Paolino, D., Drago, R., Stancampiano, A., and
Puglisi, G. International Journal of Cosmetic Science 30(1), 57–65 (2008).
[645] Gulson, B., Wong, H., Korsch, M., Gomez, L., Casey, P., McCall, M., McCulloch,
M., Trotter, J., Stauber, J., and Greenoak, G. Science of the Total Environment 420,
313–318 (2012).
[646] Gamer, A., Leibold, E. v., and Van Ravenzwaay, B. Toxicology in vitro 20(3),
301–307 (2006).
[647] Wu, J., Liu, W., Xue, C., Zhou, S., Lan, F., Bi, L., Xu, H., Yang, X., and Zeng,
F.-D. Toxicology letters 191(1), 1–8 (2009).
245

BIBLIOGRAPHY BIBLIOGRAPHY
[648] Sadrieh, N., Wokovich, A. M., Gopee, N. V., Zheng, J., Haines, D., Parmiter, D.,
Siitonen, P. H., Cozart, C. R., Patri, A. K., McNeil, S. E., et al. Toxicological
Sciences 115(1), 156–166 (2010).
[649] Takeda, K., Suzuki, K.-i., Ishihara, A., Kubo-Irie, M., Fujimoto, R., Tabata, M.,
Oshio, S., Nihei, Y., Ihara, T., and Sugamata, M. Journal of Health Science 55(1),
95–102 (2009).
[650] Shimizu, M., Tainaka, H., Oba, T., Mizuo, K., Umezawa, M., and Takeda, K.
Particle and Fibre toxicology 6(1), 20 (2009).
[651] Krause, M., Klit, A., Blomberg Jensen, M., Søeborg, T., Frederiksen, H.,
Schlumpf, M., Lichtensteiger, W., Skakkebaek, N. E., and Drzewiecki, K. T. Inter-
national Journal of Andrology 35(3), 424–436 (2012).
[652] Walters, C., Keeney, A., Wigal, C. T., Johnston, C. R., and Cornelius, R. D. Journal
of Chemical Education 74(1), 99 (1997).
[653] Shaw, D. W. Dermatitis 17(3), 152–155 (2006).
[654] Singh, M. and Beck, M. Contact Dermatitis 56(1), 48–48 (2007).
[655] Sarveiya, V., Risk, S., and Benson, H. A. Journal of Chromatography B 803(2),
225–231 (2004).
[656] Rodrıguez, E., Valbuena, M. C., Rey, M., and Porras de Quintana, L. Photoderma-
tology, photoimmunology & photomedicine 22(4), 189–192 (2006).
[657] Janjua, N., Kongshoj, B., Andersson, A.-M., and Wulf, H. C. Journal of the Euro-
pean Academy of Dermatology and Venereology 22(4), 456–461 (2008).
[658] Gonzalez, H., Farbrot, A., Larko, O., and Wennberg, A.-M. British Journal of
Dermatology 154(2), 337–340 (2006).
[659] Ghazipura, M., McGowan, R., Arslan, A., and Hossain, T. Reproductive Toxicology
73, 175–183 (2017).
246
BIBLIOGRAPHY BIBLIOGRAPHY
[660] Deka, M., Humar, M., Rep, G., Kricej, B., Sentjurc, M., and Petric, M. Wood
Science and Technology 42(1), 5–20 (2008).
247
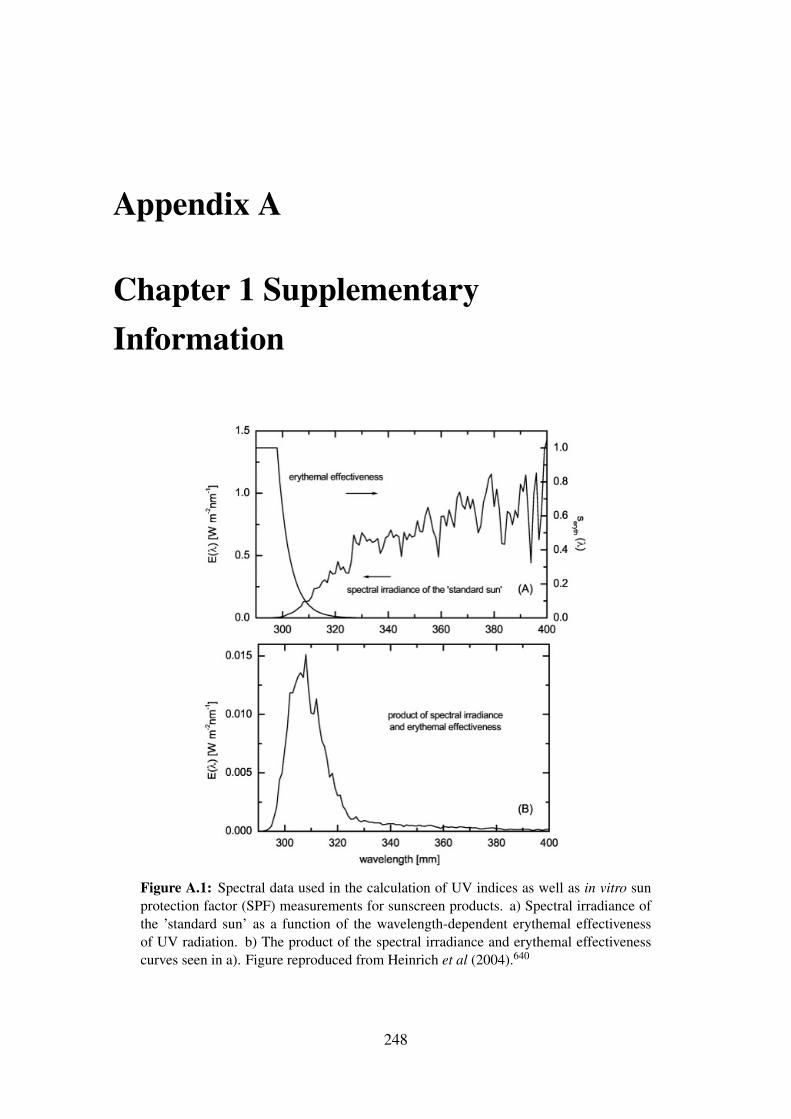
Appendix A
Chapter 1 SupplementaryInformation
Figure A.1: Spectral data used in the calculation of UV indices as well as in vitro sunprotection factor (SPF) measurements for sunscreen products. a) Spectral irradiance ofthe ’standard sun’ as a function of the wavelength-dependent erythemal effectivenessof UV radiation. b) The product of the spectral irradiance and erythemal effectivenesscurves seen in a). Figure reproduced from Heinrich et al (2004).640
248
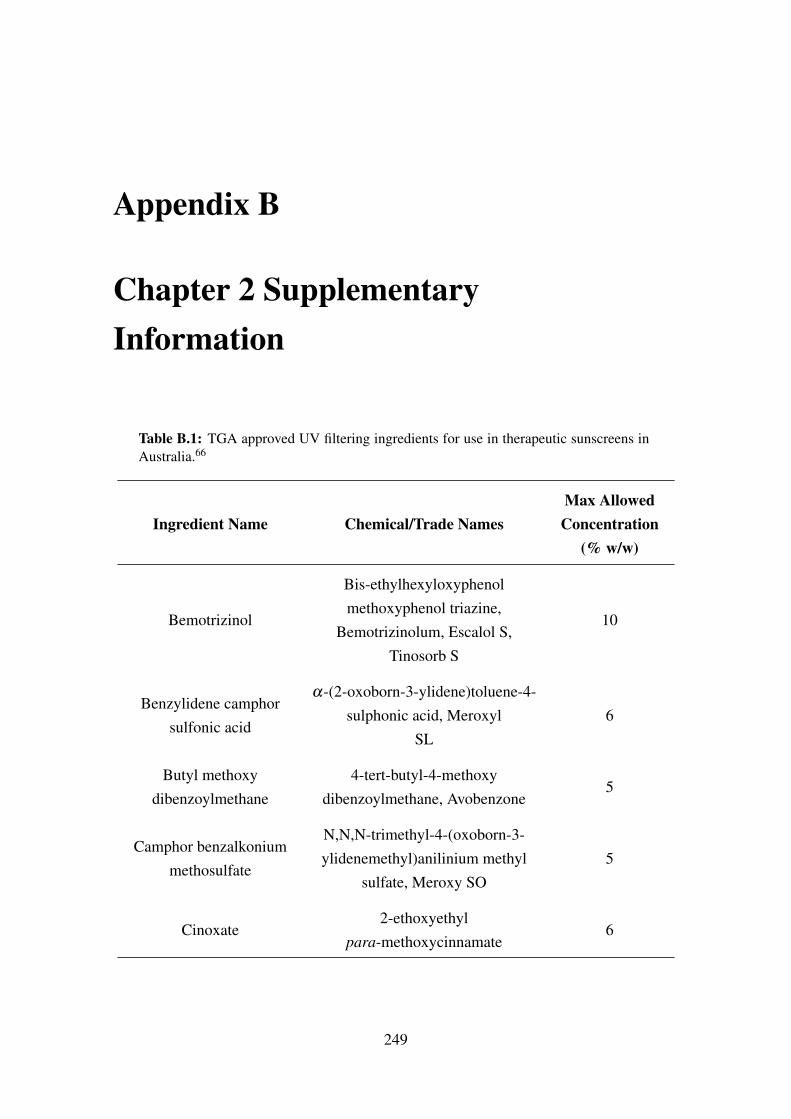
Appendix B
Chapter 2 SupplementaryInformation
Table B.1: TGA approved UV filtering ingredients for use in therapeutic sunscreens inAustralia.66
Ingredient Name Chemical/Trade NamesMax AllowedConcentration
(% w/w)
Bemotrizinol
Bis-ethylhexyloxyphenolmethoxyphenol triazine,
Bemotrizinolum, Escalol S,Tinosorb S
10
Benzylidene camphorsulfonic acid
α-(2-oxoborn-3-ylidene)toluene-4-sulphonic acid, Meroxyl
SL6
Butyl methoxydibenzoylmethane
4-tert-butyl-4-methoxydibenzoylmethane, Avobenzone
5
Camphor benzalkoniummethosulfate
N,N,N-trimethyl-4-(oxoborn-3-ylidenemethyl)anilinium methyl
sulfate, Meroxy SO5
Cinoxate2-ethoxyethyl
para-methoxycinnamate6
249
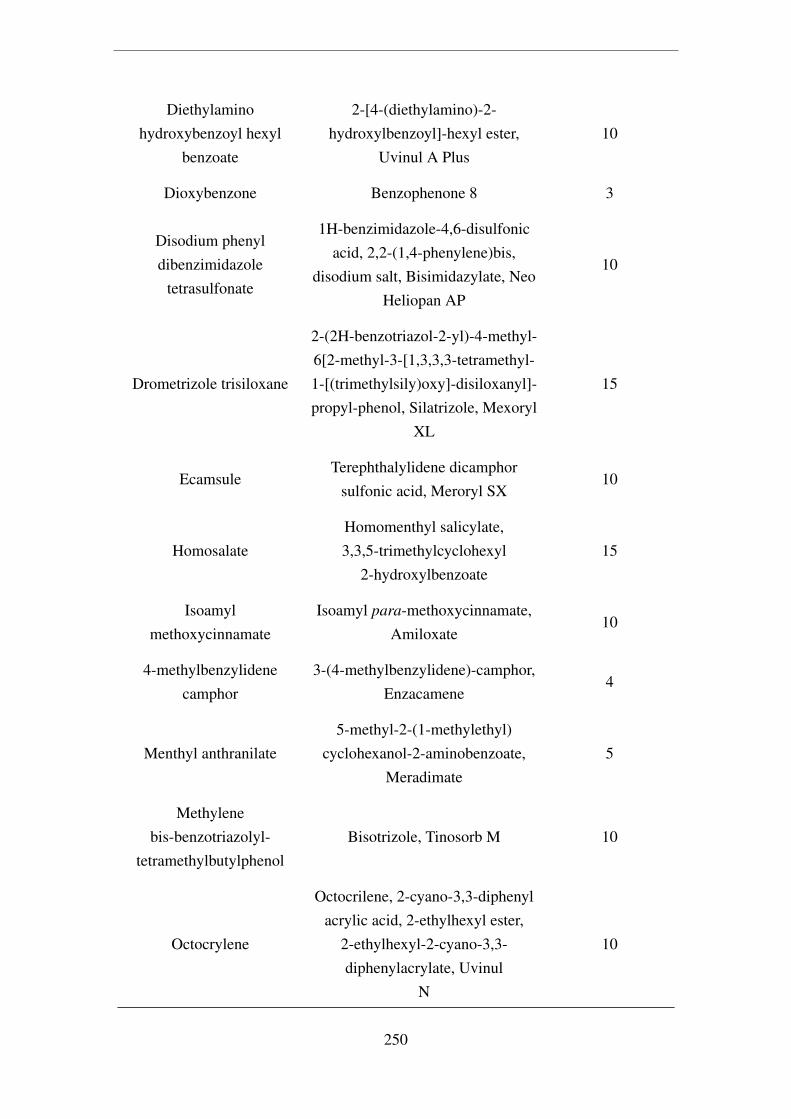
Diethylaminohydroxybenzoyl hexyl
benzoate
2-[4-(diethylamino)-2-hydroxylbenzoyl]-hexyl ester,
Uvinul A Plus10
Dioxybenzone Benzophenone 8 3
Disodium phenyldibenzimidazole
tetrasulfonate
1H-benzimidazole-4,6-disulfonicacid, 2,2-(1,4-phenylene)bis,
disodium salt, Bisimidazylate, NeoHeliopan AP
10
Drometrizole trisiloxane
2-(2H-benzotriazol-2-yl)-4-methyl-6[2-methyl-3-[1,3,3,3-tetramethyl-1-[(trimethylsily)oxy]-disiloxanyl]-propyl-phenol, Silatrizole, Mexoryl
XL
15
EcamsuleTerephthalylidene dicamphor
sulfonic acid, Meroryl SX10
HomosalateHomomenthyl salicylate,3,3,5-trimethylcyclohexyl
2-hydroxylbenzoate15
Isoamylmethoxycinnamate
Isoamyl para-methoxycinnamate,Amiloxate
10
4-methylbenzylidenecamphor
3-(4-methylbenzylidene)-camphor,Enzacamene
4
Menthyl anthranilate5-methyl-2-(1-methylethyl)
cyclohexanol-2-aminobenzoate,Meradimate
5
Methylenebis-benzotriazolyl-
tetramethylbutylphenolBisotrizole, Tinosorb M 10
Octocrylene
Octocrilene, 2-cyano-3,3-diphenylacrylic acid, 2-ethylhexyl ester,
2-ethylhexyl-2-cyano-3,3-diphenylacrylate, Uvinul
N
10
250
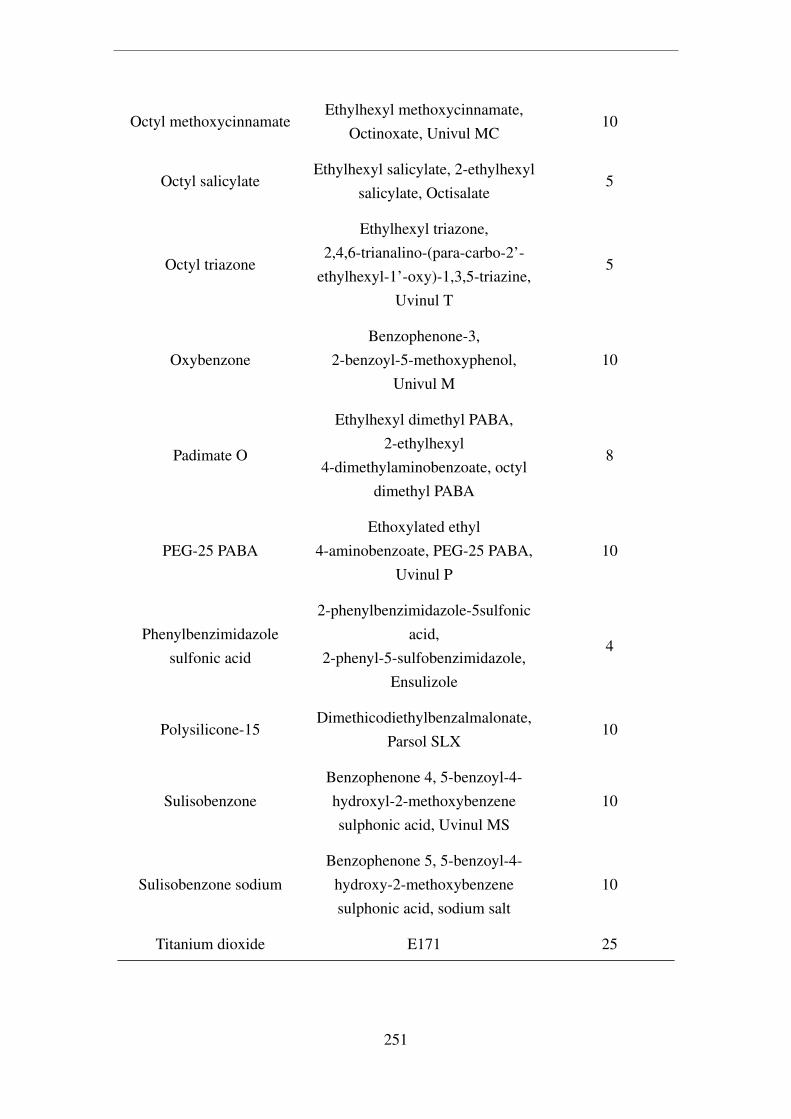
Octyl methoxycinnamateEthylhexyl methoxycinnamate,
Octinoxate, Univul MC10
Octyl salicylateEthylhexyl salicylate, 2-ethylhexyl
salicylate, Octisalate5
Octyl triazone
Ethylhexyl triazone,2,4,6-trianalino-(para-carbo-2’-
ethylhexyl-1’-oxy)-1,3,5-triazine,Uvinul T
5
OxybenzoneBenzophenone-3,
2-benzoyl-5-methoxyphenol,Univul M
10
Padimate O
Ethylhexyl dimethyl PABA,2-ethylhexyl
4-dimethylaminobenzoate, octyldimethyl PABA
8
PEG-25 PABAEthoxylated ethyl
4-aminobenzoate, PEG-25 PABA,Uvinul P
10
Phenylbenzimidazolesulfonic acid
2-phenylbenzimidazole-5sulfonicacid,
2-phenyl-5-sulfobenzimidazole,Ensulizole
4
Polysilicone-15Dimethicodiethylbenzalmalonate,
Parsol SLX10
SulisobenzoneBenzophenone 4, 5-benzoyl-4-hydroxyl-2-methoxybenzenesulphonic acid, Uvinul MS
10
Sulisobenzone sodiumBenzophenone 5, 5-benzoyl-4-
hydroxy-2-methoxybenzenesulphonic acid, sodium salt
10
Titanium dioxide E171 25
251

Triethanolamine salicylateTEA-salicylate, trolamine
salicylate12
Tris-biphenyl triazine1,3,5-triazine,
2,4,6-tris([1,1’-biphenyl]-4-yl),Tinosorb A2B
10
Zinc oxide Pigment white 4 No limit
Table B.2: EWG hazard scores for selected UV filters commonly found in sunscreenproducts.265 Ratings drawn from various factors outlined in literature reports pertainingto the UV filters listed230, 273, 299, 359, 404, 641–659
ChemicalEWG
hazardscore
Skinpenetration
Hormonedisruption
Skin allergyOther
concerns
Oxybenzone 8
Detected inbreast milk;1% to 9%
skinpenetrationin in vitro
studies
Weakestrogen,moderate
anti-androgen;associated
with alteredbirth weight
in humanstudies
Relativelyhigh rates ofskin allergy
Octylmethoxy-cinnamate
6
Detected inbreast milk;<1% skinpenetrationin in vitro
and in vivostudies
Hormone-like activity;reproductive
system,thyroid andbehavioral
alterations inin vivostudies
Moderaterates of skin
allergy
252

Homosalate 4
Detected inbreast milk;<1% skinpenetrationin in vitro
and in vivostudies
Disruptsestrogen,androgen
andprogesterone
Toxicbreakdownproducts
Octisalate 4
Skinpenetrationin in vitro
studies
Rarelyreported
cases of skinallergy
Octocrylene 3
Detected inbreast milk;
skinpenetrationin in vitro
studies
Relativelyhigh rates ofskin allergy
Titaniumdioxide
2
Noconclusiveevidence of
skinpenetration
No evidenceof hormonedisruption
NoneInhalationconcerns
ZincOxide
2
<0.01% skinpenetrationin humanvolunteers
No evidenceof hormonedisruption
NoneInhalationconcerns
Avobenzone 2Very limited
skinpenetration
No evidenceof hormonedisruption
Breakdownproductscauses
relativelyhigh rates ofskin allergy
Unstable insunshine,must be
mixed withstabilizers
253

MexorylSX
2
<0.16% skinpenetrationin humanvolunteers
No evidenceof hormonedisruption
Skin allergyis rare
Table B.3: List of TiO2 nanoparticle samples and selected physicochemical properties.Data reproduced from Tang et al, (2018).378
SampleCrystalline
Phase
PrimaryParticle Size
(nm)
CoatingMaterial
Purity(wt%)
SSA (m2
g−1)
P2580% anatase20% rutile
31±8 - 99.5 61.7
AR5278% anatase22% rutile
52±9 Silica/Alumina ≥98 34.0
AR23 Anatase 23±8 Silane 99.8 283.7
254
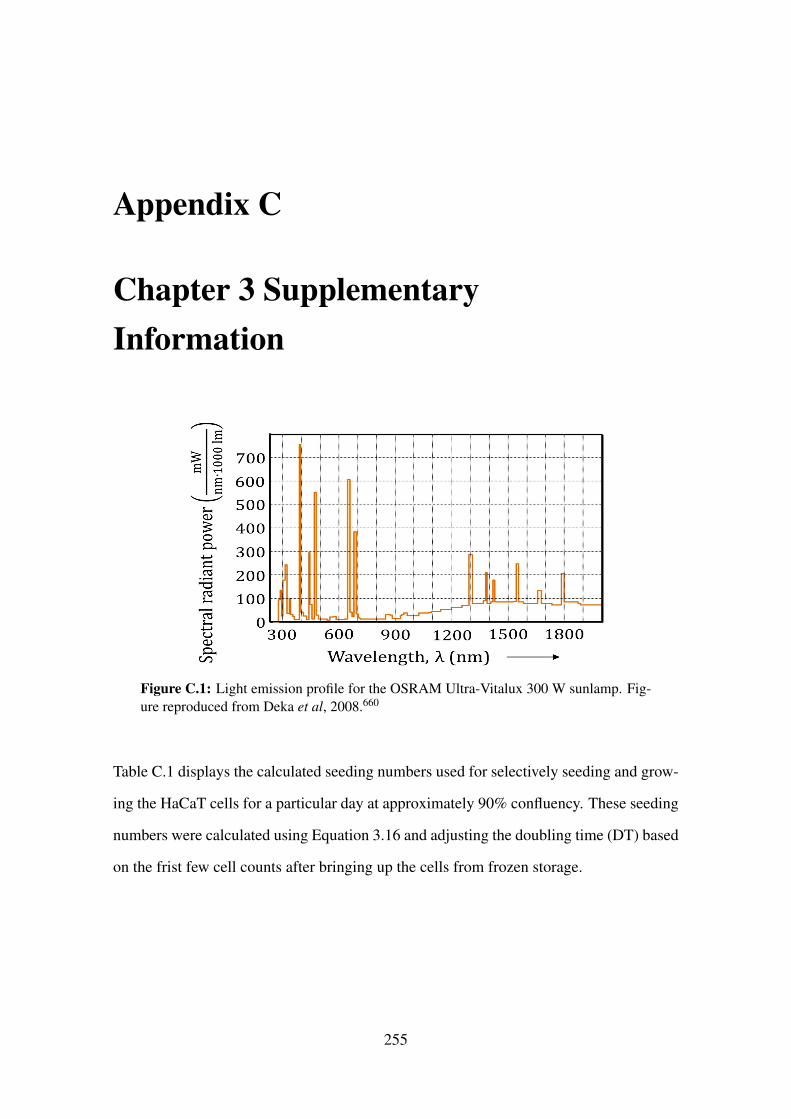
Appendix C
Chapter 3 SupplementaryInformation
Figure C.1: Light emission profile for the OSRAM Ultra-Vitalux 300 W sunlamp. Fig-ure reproduced from Deka et al, 2008.660
Table C.1 displays the calculated seeding numbers used for selectively seeding and grow-
ing the HaCaT cells for a particular day at approximately 90% confluency. These seeding
numbers were calculated using Equation 3.16 and adjusting the doubling time (DT) based
on the frist few cell counts after bringing up the cells from frozen storage.
255

Table C.1: Seeding Numbers (SN) calculated using Equation 3.16 for the HaCaT cellsfor different doubling times (DT).
Seeding Number (SN) (×106 cells)
Incubation Days (NDays) DT = 22 hr DT = 23 hr DT = 24 hr
1 7.04 7.28 7.50
2 3.30 3.53 3.75
3 1.55 1.71 1.88
4 0.73 0.83 0.94
5 0.34 0.40 0.47
6 0.16 0.20 0.23
7 0.08 0.09 0.12
Due to the light absorbing nature of the phenol red medium used for culturing the HaCaT
cells, a different medium or solvent was required to prevent the cells from drying out
without absorbing the incident visible and UV light during the phototoxic assays. Fig-
ure C.2 displays the absorption plots measured for phenol red free medium and DPBS,
demonstrating the reason for using DPBS due to its lack of UV or visible light absorp-
tion.
Figure C.2: Absorbance profiles for the phenol red free media (DMEM/F12) and DPBS.
256
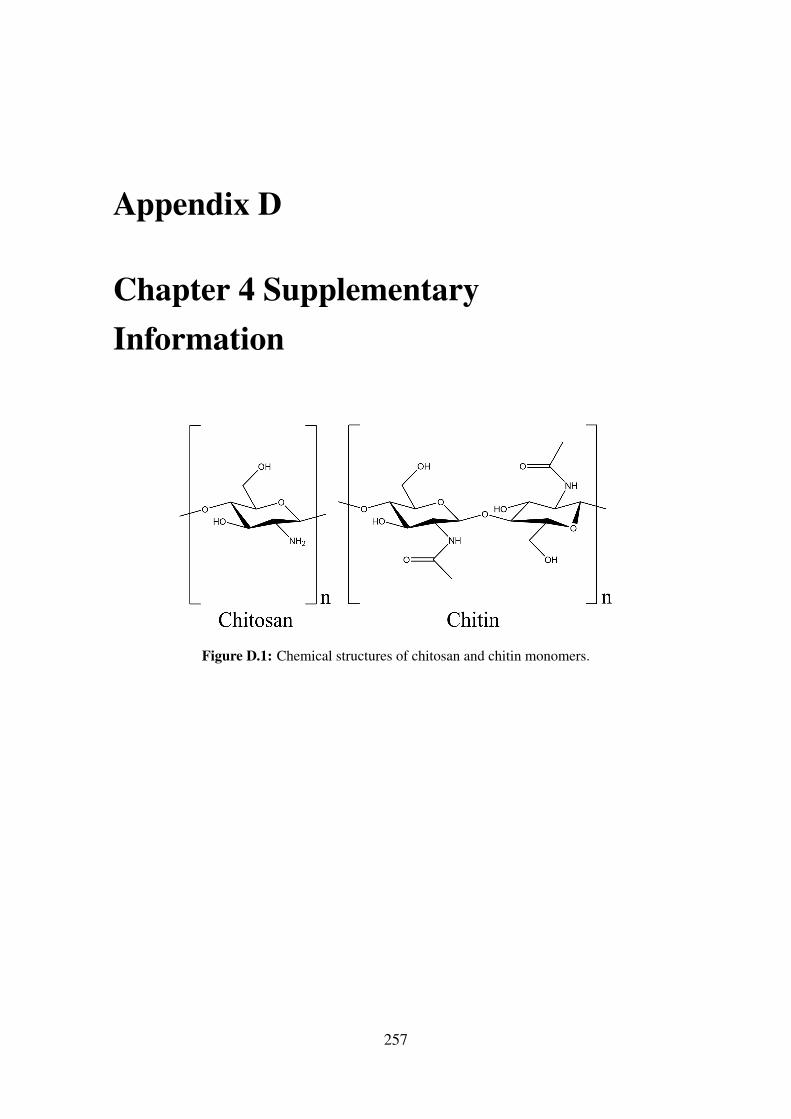
Appendix D
Chapter 4 SupplementaryInformation
Figure D.1: Chemical structures of chitosan and chitin monomers.
257
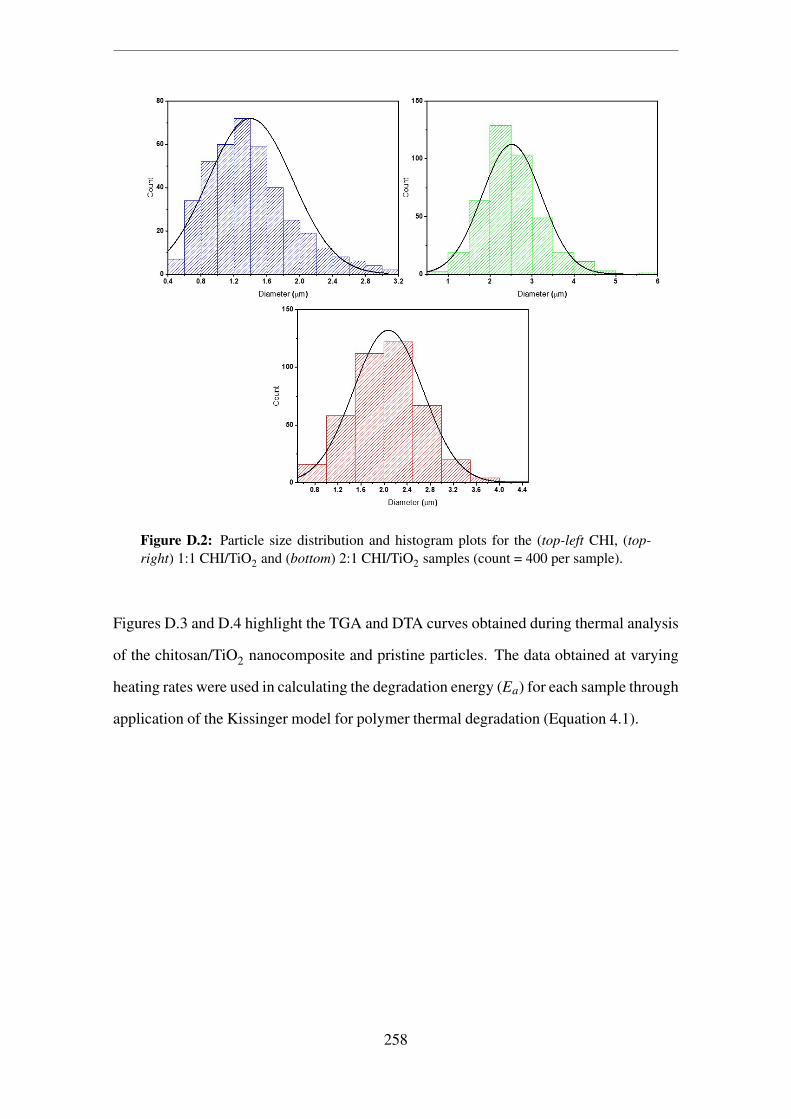
Figure D.2: Particle size distribution and histogram plots for the (top-left CHI, (top-right) 1:1 CHI/TiO2 and (bottom) 2:1 CHI/TiO2 samples (count = 400 per sample).
Figures D.3 and D.4 highlight the TGA and DTA curves obtained during thermal analysis
of the chitosan/TiO2 nanocomposite and pristine particles. The data obtained at varying
heating rates were used in calculating the degradation energy (Ea) for each sample through
application of the Kissinger model for polymer thermal degradation (Equation 4.1).
258
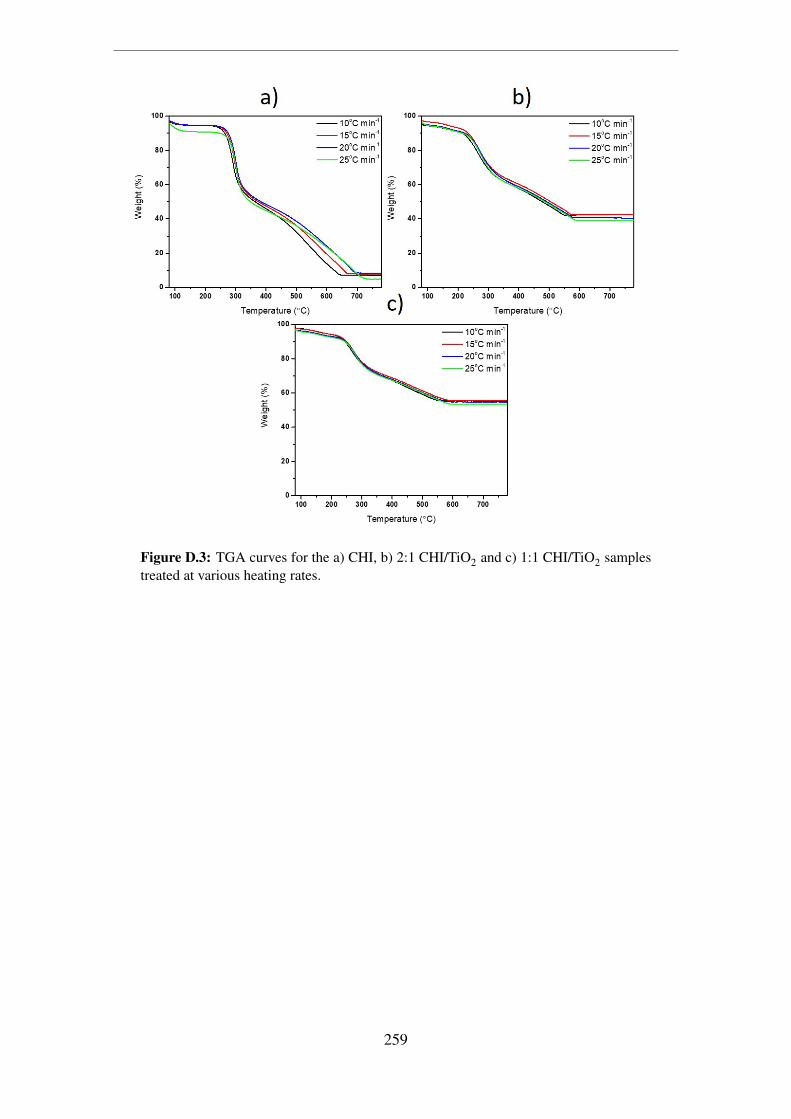
Figure D.3: TGA curves for the a) CHI, b) 2:1 CHI/TiO2 and c) 1:1 CHI/TiO2 samplestreated at various heating rates.
259
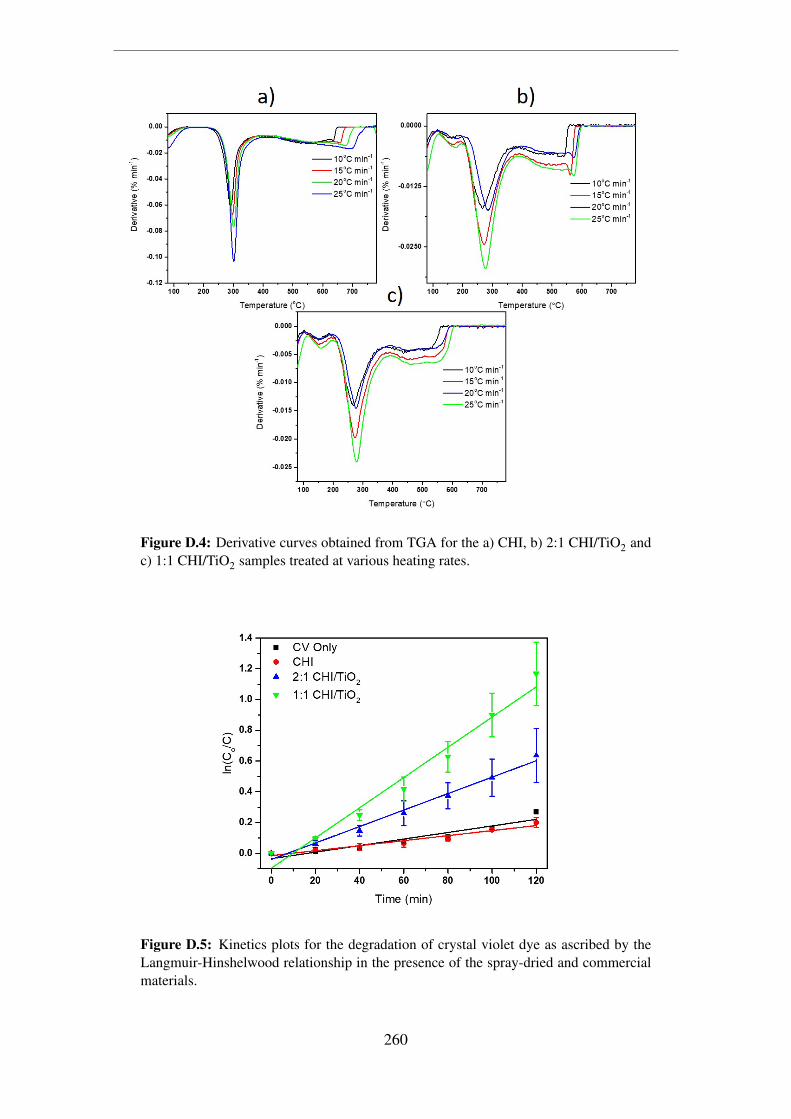
Figure D.4: Derivative curves obtained from TGA for the a) CHI, b) 2:1 CHI/TiO2 andc) 1:1 CHI/TiO2 samples treated at various heating rates.
Figure D.5: Kinetics plots for the degradation of crystal violet dye as ascribed by theLangmuir-Hinshelwood relationship in the presence of the spray-dried and commercialmaterials.
260
Appendix E
Chapter 5 SupplementaryInformation
Figure E.1 displays the individual Tauc plots used for calculating the optical band gap
(Eg) values for the samples tested. As can be seen, plotting of the absorption coefficient
to an exponent value correlating to the type of electronic transition that occurs between
conduction band and valence band of a semiconductor against the wavelength energy
yields a plot with an absorption edge. Extrapolation of this linear absorption edge to the
x-axis yields an approximation of Eg.
261
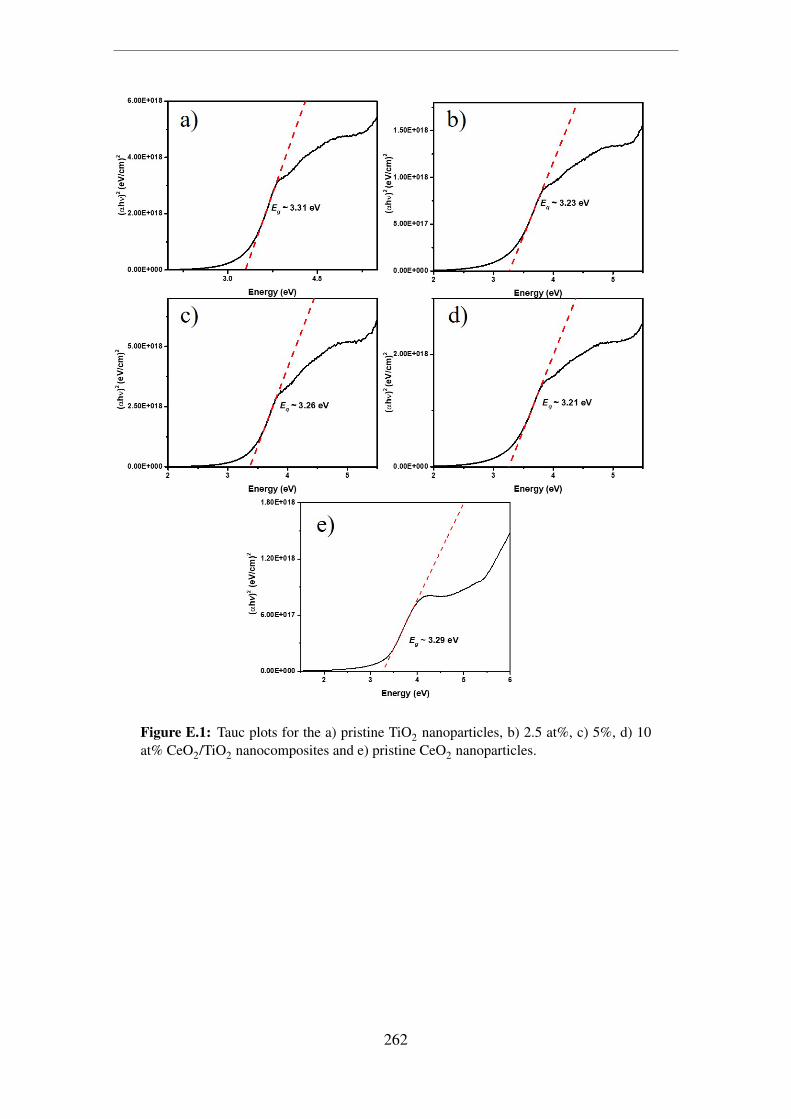
Figure E.1: Tauc plots for the a) pristine TiO2 nanoparticles, b) 2.5 at%, c) 5%, d) 10at% CeO2/TiO2 nanocomposites and e) pristine CeO2 nanoparticles.
262

Figure E.2: UV-Vis absorption plots and corresponding Beer-Lambert relationship plotsfor the a) TiO2 (P25), b) 2.5 at%, c) 5 at%, d) 10 at% and e) CeO2 samples prepared.
263
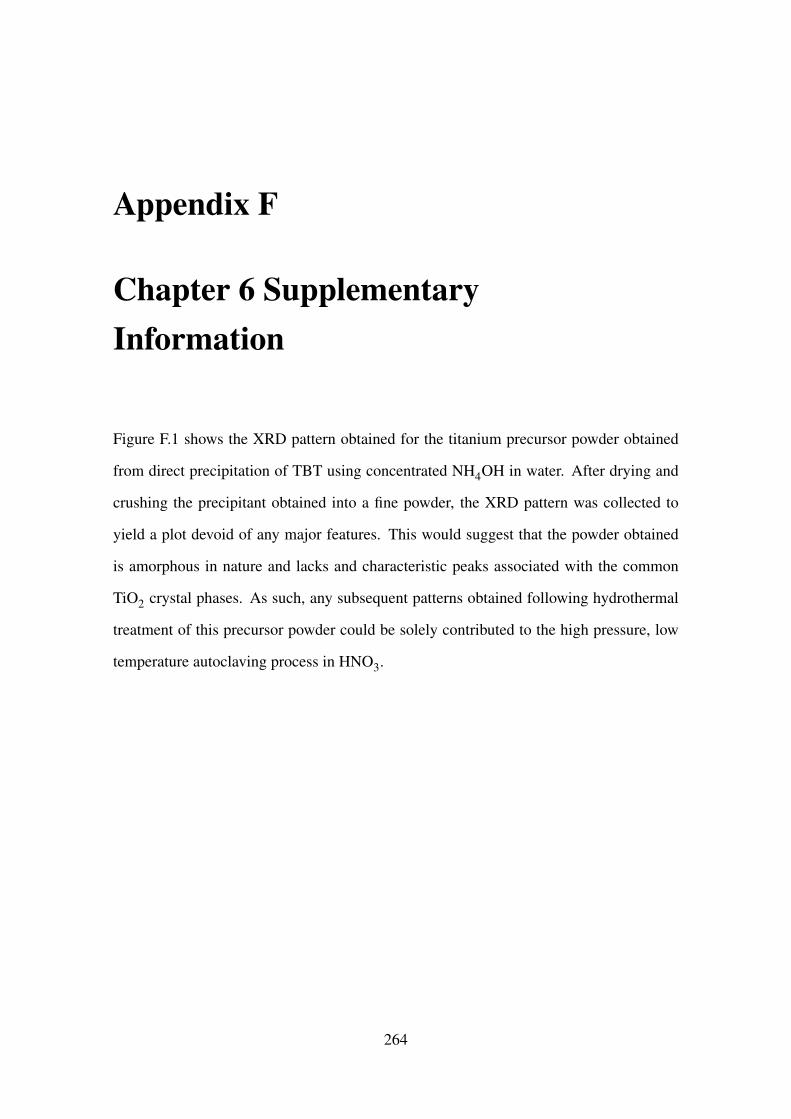
Appendix F
Chapter 6 SupplementaryInformation
Figure F.1 shows the XRD pattern obtained for the titanium precursor powder obtained
from direct precipitation of TBT using concentrated NH4OH in water. After drying and
crushing the precipitant obtained into a fine powder, the XRD pattern was collected to
yield a plot devoid of any major features. This would suggest that the powder obtained
is amorphous in nature and lacks and characteristic peaks associated with the common
TiO2 crystal phases. As such, any subsequent patterns obtained following hydrothermal
treatment of this precursor powder could be solely contributed to the high pressure, low
temperature autoclaving process in HNO3.
264
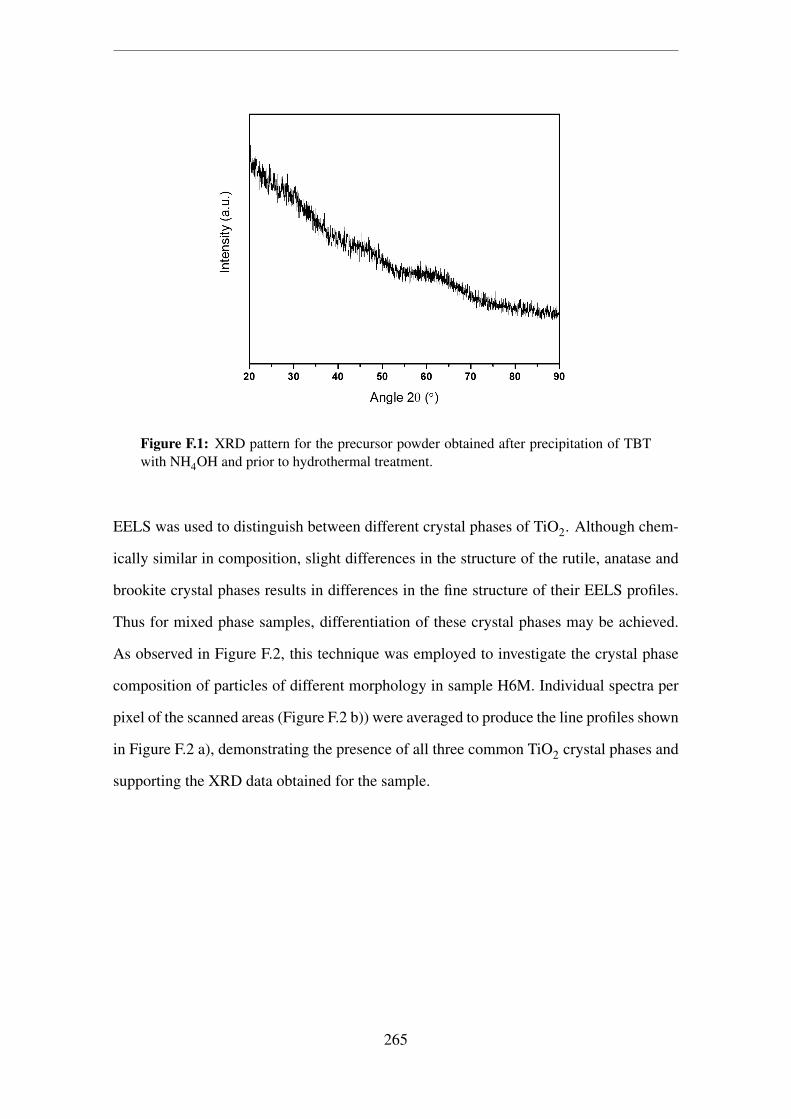
Figure F.1: XRD pattern for the precursor powder obtained after precipitation of TBTwith NH4OH and prior to hydrothermal treatment.
EELS was used to distinguish between different crystal phases of TiO2. Although chem-
ically similar in composition, slight differences in the structure of the rutile, anatase and
brookite crystal phases results in differences in the fine structure of their EELS profiles.
Thus for mixed phase samples, differentiation of these crystal phases may be achieved.
As observed in Figure F.2, this technique was employed to investigate the crystal phase
composition of particles of different morphology in sample H6M. Individual spectra per
pixel of the scanned areas (Figure F.2 b)) were averaged to produce the line profiles shown
in Figure F.2 a), demonstrating the presence of all three common TiO2 crystal phases and
supporting the XRD data obtained for the sample.
265

Figure F.2: a) EELS profiles obtained across the pixels numbered in c), which is theregion of interested outlined in b). The sample examined here is the 6M HNO3 180oCtreated sample.
Figure F.3: Particle size distribution and histogram plots for the (top-left) DP25, (top-right) SR, (bottom-left) HTIO2 and (bottom-right) CTIO2 samples (count = 100 persample). The particle sizes measured for the HTIO2 and CTIO2 samples correspond tothe nanorod width and the CeO2 nanodot sizes for these samples, respectively.
266

Figure F.4: Example EDS spectrum collected from the CTIO2 sample prepared on holeycarbon copper grid during TEM analysis.
Table F.1: EDS results obtained on the CTIO2 composite sample detailing the relativeCe/Ti atomic and weight percentages.
Element
Ti Ce
Measurement Wt.% At.% Wt.% At.%
1 94.34 97.99 5.66 2.01
2 87.97 95.54 12.03 4.46
3 93.81 97.79 6.19 2.21
4 97.13 99.00 2.87 1.00
Mean (±SD) 93±4 98±1 7±4 2±1
267
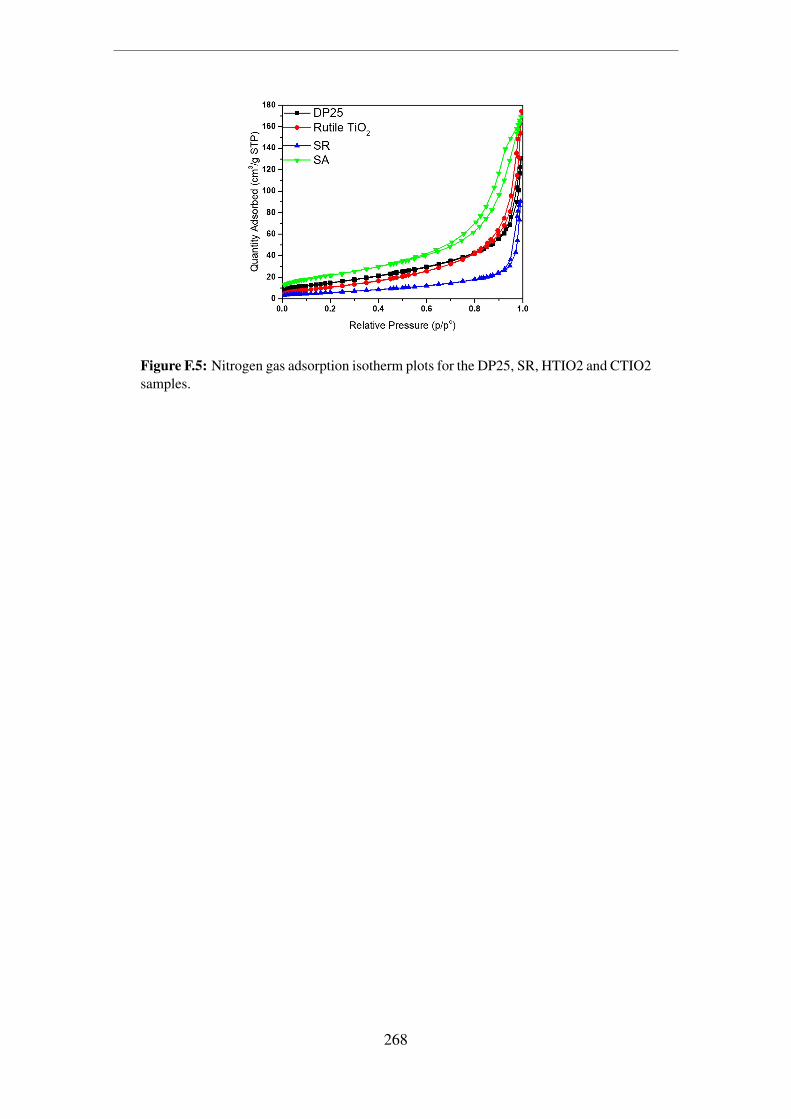
Figure F.5: Nitrogen gas adsorption isotherm plots for the DP25, SR, HTIO2 and CTIO2samples.
268
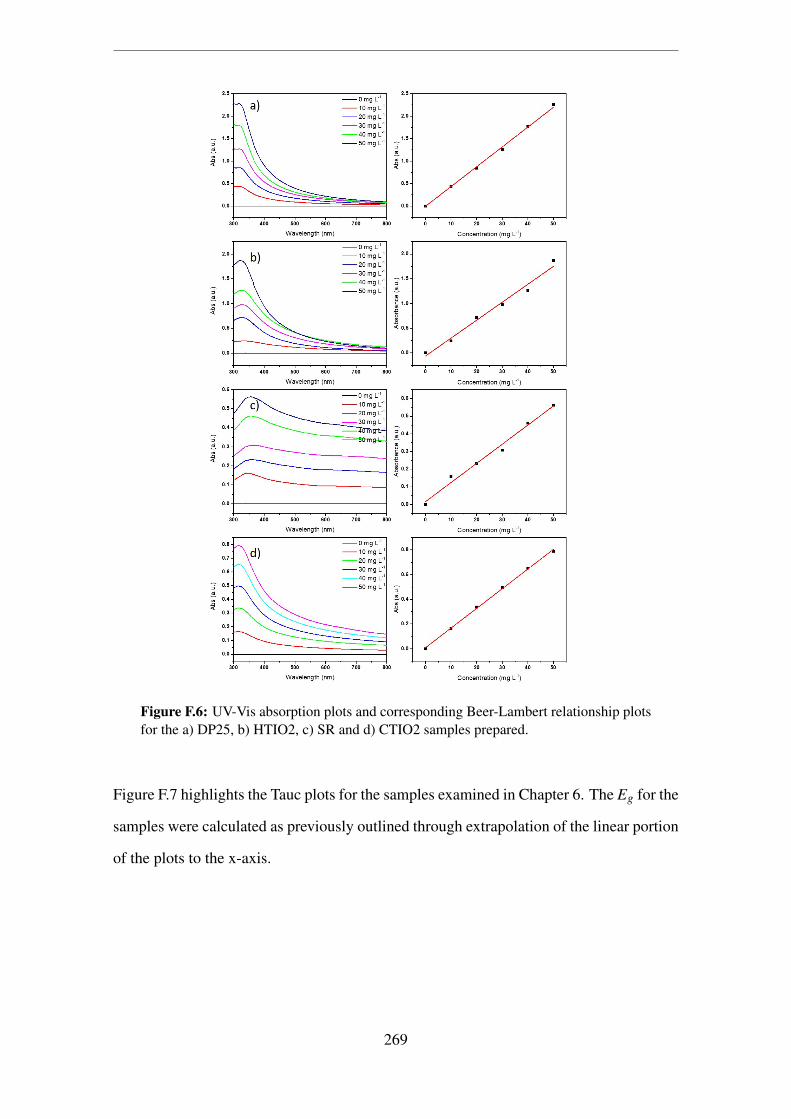
Figure F.6: UV-Vis absorption plots and corresponding Beer-Lambert relationship plotsfor the a) DP25, b) HTIO2, c) SR and d) CTIO2 samples prepared.
Figure F.7 highlights the Tauc plots for the samples examined in Chapter 6. The Eg for the
samples were calculated as previously outlined through extrapolation of the linear portion
of the plots to the x-axis.
269
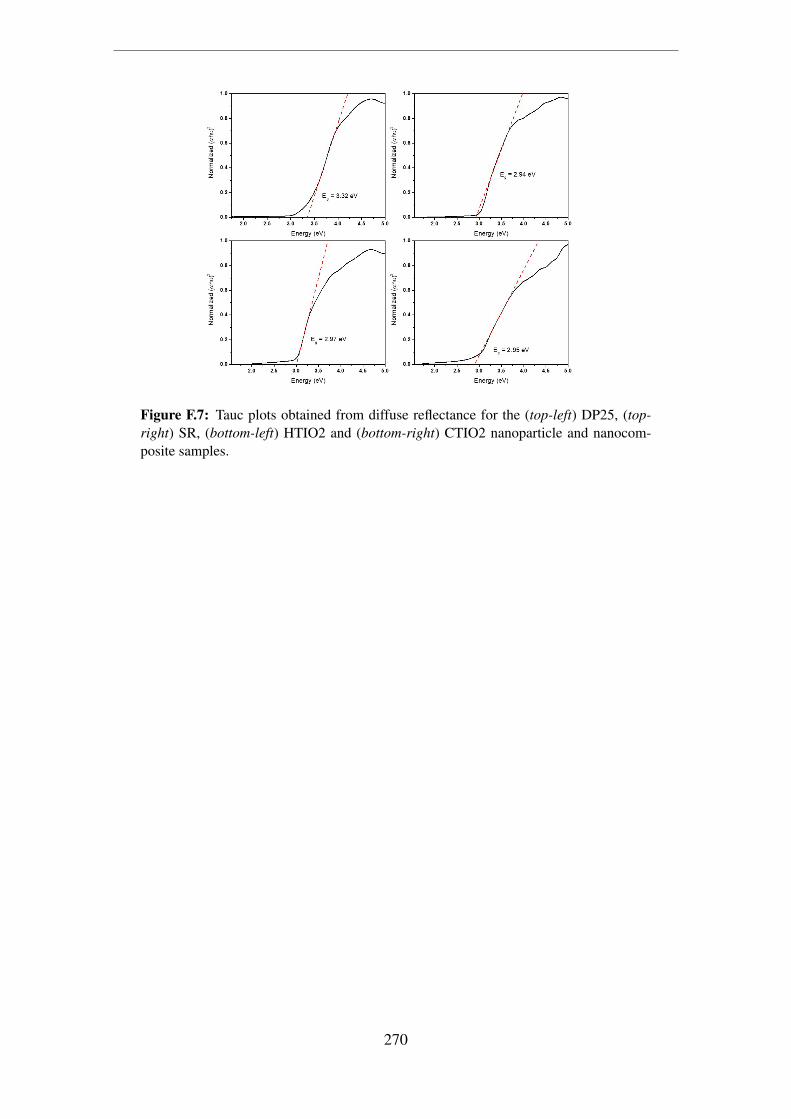
Figure F.7: Tauc plots obtained from diffuse reflectance for the (top-left) DP25, (top-right) SR, (bottom-left) HTIO2 and (bottom-right) CTIO2 nanoparticle and nanocom-posite samples.
270


![Ultrafast photoprotective properties of the sunscreening ......cinnamate and benzophenone derivatives, as well as inorganic scattering molecules such as TiO 2 and ZnO 2 [10, 11]. The](https://static.cupdf.com/doc/110x72/5f70f231c3335011d7349ea4/ultrafast-photoprotective-properties-of-the-sunscreening-cinnamate-and-benzophenone.jpg)