New Jersey’s
Advanced Manufacturing Industry Cluster
Prepared by:New Jersey Department of Labor & Workforce Development
Office of Research & InformationBureau of Labor Market Information
Winter 2017-2018

The goal of this report is to get an “IDEA” of what advanced manufacturing means to New Jersey
Identify the types of industries and establishments that make up the advanced
manufacturing cluster based on a standard industry classification system
Describe any similarities and differences among its components with
regard to such variables as employment, wage, occupation type, education, and demographic characteristics
Examine any present distinctions within the cluster and its components that
give New Jersey a competitive advantage compared to neighboring states, regions or the nation, or show areas where New Jersey could improve to add to the state’s economy
Analyze the current state of the advanced manufacturing cluster and provide
an outlook for employment into the future
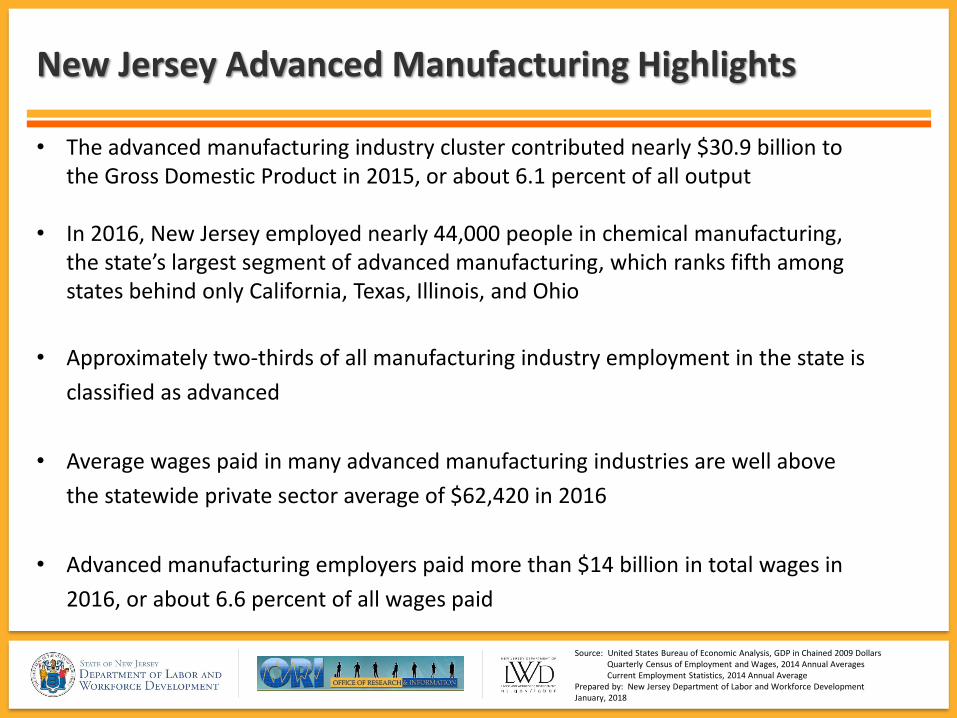
New Jersey Advanced Manufacturing Highlights
• The advanced manufacturing industry cluster contributed nearly $30.9 billion to the Gross Domestic Product in 2015, or about 6.1 percent of all output
• In 2016, New Jersey employed nearly 44,000 people in chemical manufacturing, the state’s largest segment of advanced manufacturing, which ranks fifth among states behind only California, Texas, Illinois, and Ohio
• Approximately two-thirds of all manufacturing industry employment in the state is
classified as advanced
• Average wages paid in many advanced manufacturing industries are well above
the statewide private sector average of $62,420 in 2016
• Advanced manufacturing employers paid more than $14 billion in total wages in
2016, or about 6.6 percent of all wages paid
Source: United States Bureau of Economic Analysis, GDP in Chained 2009 DollarsQuarterly Census of Employment and Wages, 2014 Annual AveragesCurrent Employment Statistics, 2014 Annual Average
Prepared by: New Jersey Department of Labor and Workforce DevelopmentJanuary, 2018
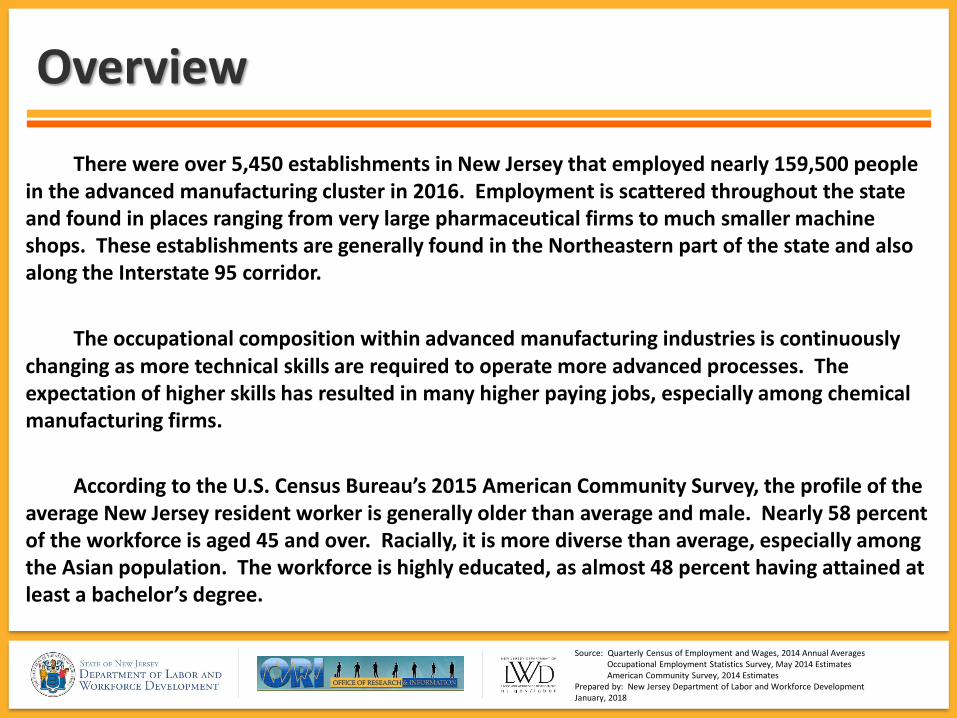
Overview
There were over 5,450 establishments in New Jersey that employed nearly 159,500 people in the advanced manufacturing cluster in 2016. Employment is scattered throughout the state and found in places ranging from very large pharmaceutical firms to much smaller machine shops. These establishments are generally found in the Northeastern part of the state and also along the Interstate 95 corridor.
According to the U.S. Census Bureau’s 2015 American Community Survey, the profile of the average New Jersey resident worker is generally older than average and male. Nearly 58 percent of the workforce is aged 45 and over. Racially, it is more diverse than average, especially among the Asian population. The workforce is highly educated, as almost 48 percent having attained at least a bachelor’s degree.
The occupational composition within advanced manufacturing industries is continuously changing as more technical skills are required to operate more advanced processes. The expectation of higher skills has resulted in many higher paying jobs, especially among chemical manufacturing firms.
Source: Quarterly Census of Employment and Wages, 2014 Annual AveragesOccupational Employment Statistics Survey, May 2014 EstimatesAmerican Community Survey, 2014 Estimates
Prepared by: New Jersey Department of Labor and Workforce DevelopmentJanuary, 2018

INDUSTRIAL COMPOSITION

The five primary components of the advanced manufacturing sector with some examples of industries classified within them
Chemical Manufacturing
•Basic chemical
•Pharmaceutical & medicine
•Cleaning compound and toiletry
•Paint, coating & adhesive
Machinery Manufacturing
•Industrial machinery
•HVAC and commercial refrigeration equipment
•Commercial and service industry machinery
•Turbine and power transmission
Computer and Electronic Product
Manufacturing•Computers and peripheral equipment
•Communications equipment
•Audio and visual equipment
•Semiconductors and other electronic components
Source: North American Industry Classification System (NAICS)Prepared by: New Jersey Department of Labor and Workforce DevelopmentJanuary, 2018
Fabricated Metal Product
Manufacturing
•Architectural and structural metals
•Machine shops and threaded product
•Forging and stamping
•Coating, engraving, and heat treating metals
Food Manufacturing
•Bakeries
•Dairy products
•Fruit & vegetable preserving
•Seafood product preparation & packaging
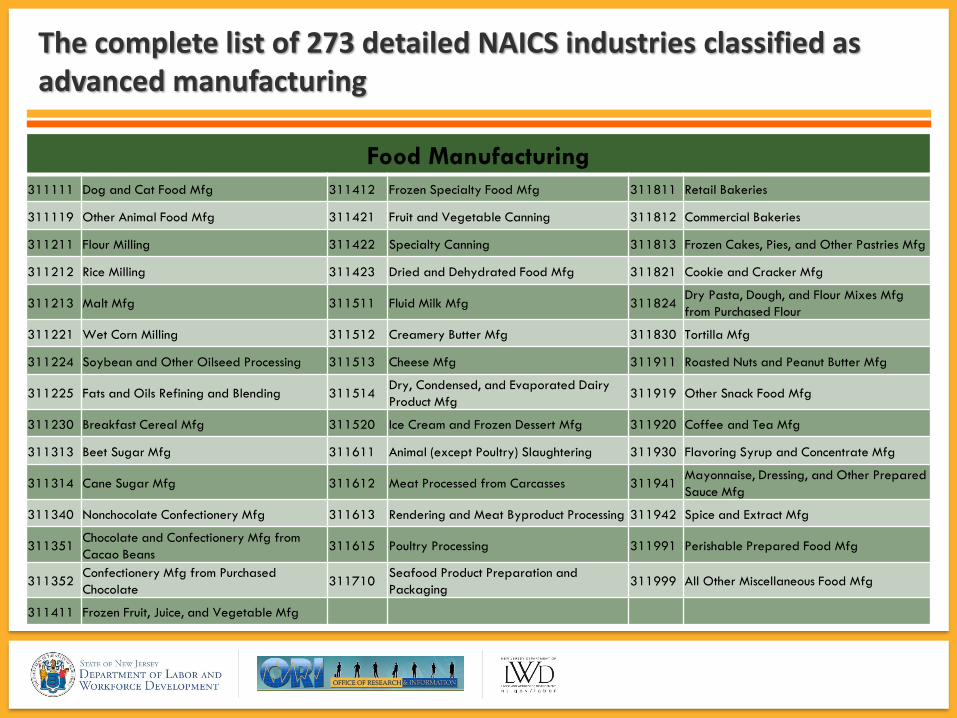
The complete list of 273 detailed NAICS industries classified as advanced manufacturing
Food Manufacturing
311111 Dog and Cat Food Mfg 311412 Frozen Specialty Food Mfg 311811 Retail Bakeries
311119 Other Animal Food Mfg 311421 Fruit and Vegetable Canning 311812 Commercial Bakeries
311211 Flour Milling 311422 Specialty Canning 311813 Frozen Cakes, Pies, and Other Pastries Mfg
311212 Rice Milling 311423 Dried and Dehydrated Food Mfg 311821 Cookie and Cracker Mfg
311213 Malt Mfg 311511 Fluid Milk Mfg 311824Dry Pasta, Dough, and Flour Mixes Mfg
from Purchased Flour
311221 Wet Corn Milling 311512 Creamery Butter Mfg 311830 Tortilla Mfg
311224 Soybean and Other Oilseed Processing 311513 Cheese Mfg 311911 Roasted Nuts and Peanut Butter Mfg
311225 Fats and Oils Refining and Blending 311514Dry, Condensed, and Evaporated Dairy
Product Mfg311919 Other Snack Food Mfg
311230 Breakfast Cereal Mfg 311520 Ice Cream and Frozen Dessert Mfg 311920 Coffee and Tea Mfg
311313 Beet Sugar Mfg 311611 Animal (except Poultry) Slaughtering 311930 Flavoring Syrup and Concentrate Mfg
311314 Cane Sugar Mfg 311612 Meat Processed from Carcasses 311941Mayonnaise, Dressing, and Other Prepared
Sauce Mfg
311340 Nonchocolate Confectionery Mfg 311613 Rendering and Meat Byproduct Processing 311942 Spice and Extract Mfg
311351Chocolate and Confectionery Mfg from
Cacao Beans311615 Poultry Processing 311991 Perishable Prepared Food Mfg
311352Confectionery Mfg from Purchased
Chocolate311710
Seafood Product Preparation and
Packaging311999 All Other Miscellaneous Food Mfg
311411 Frozen Fruit, Juice, and Vegetable Mfg

The complete list of 273 detailed NAICS industries classified as advanced manufacturing, continued…
Chemical Manufacturing
325110 Petrochemical Mfg 325311 Nitrogenous Fertilizer Mfg 325611 Soap and Other Detergent Mfg
325120 Industrial Gas Mfg 325312 Phosphatic Fertilizer Mfg 325612 Polish and Other Sanitation Good Mfg
325130 Synthetic Dye and Pigment Mfg 325314 Fertilizer (Mixing Only) Mfg 325613 Surface Active Agent Mfg
325180 Other Basic Inorganic Chemical Mfg 325320Pesticide and Other Agricultural Chemical
Mfg325620 Toilet Preparation Mfg
325193 Ethyl Alcohol Mfg 325411 Medicinal and Botanical Mfg 325910 Printing Ink Mfg
325194Cyclic Crude, Gum and Wood Chemical
Mfg325412 Pharmaceutical Preparation Mfg 325920 Explosives Mfg
325199 All Other Basic Organic Chemical Mfg 325413 In-Vitro Diagnostic Substance Mfg 325991 Custom Compounding of Purchased Resins
325211 Plastics Material and Resin Mfg 325414Biological Product (except Diagnostic)
Mfg325992
Photographic Film, Paper, Plate, and
Chemical Mfg
325212 Synthetic Rubber Mfg 325510 Paint and Coating Mfg 325998All Other Misc. Chemical Product and
Preparation Mfg
325220Artificial and Synthetic Fibers and
Filaments Mfg325520 Adhesive Mfg
The complete list of 273 detailed NAICS industries classified as advanced manufacturing, continued…
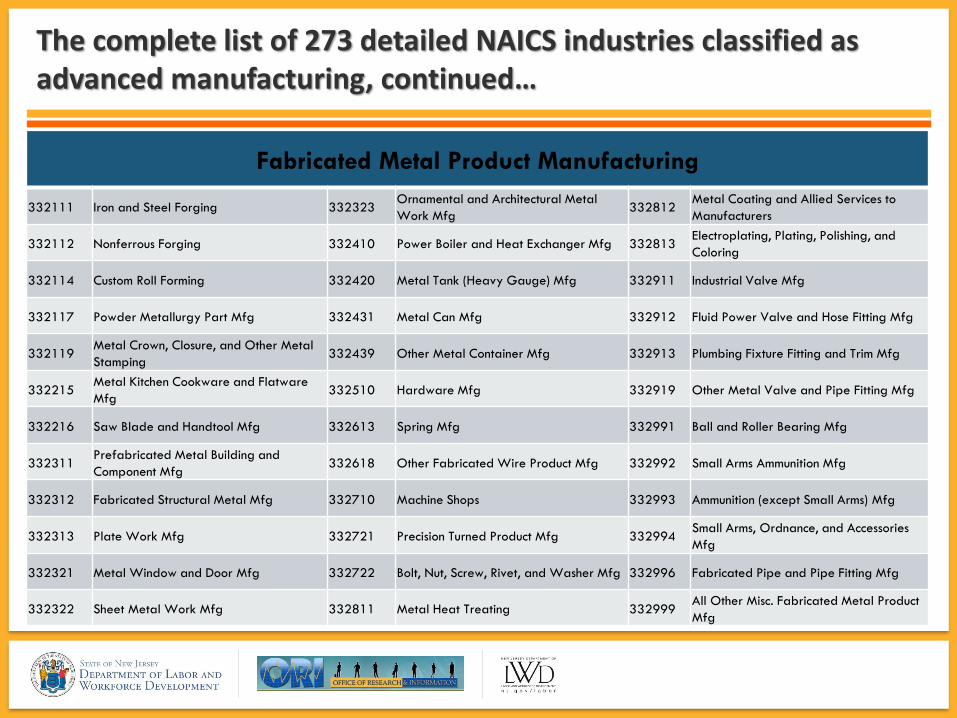
Fabricated Metal Product Manufacturing
332111 Iron and Steel Forging 332323Ornamental and Architectural Metal
Work Mfg332812
Metal Coating and Allied Services to
Manufacturers
332112 Nonferrous Forging 332410 Power Boiler and Heat Exchanger Mfg 332813Electroplating, Plating, Polishing, and
Coloring
332114 Custom Roll Forming 332420 Metal Tank (Heavy Gauge) Mfg 332911 Industrial Valve Mfg
332117 Powder Metallurgy Part Mfg 332431 Metal Can Mfg 332912 Fluid Power Valve and Hose Fitting Mfg
332119Metal Crown, Closure, and Other Metal
Stamping332439 Other Metal Container Mfg 332913 Plumbing Fixture Fitting and Trim Mfg
332215Metal Kitchen Cookware and Flatware
Mfg332510 Hardware Mfg 332919 Other Metal Valve and Pipe Fitting Mfg
332216 Saw Blade and Handtool Mfg 332613 Spring Mfg 332991 Ball and Roller Bearing Mfg
332311Prefabricated Metal Building and
Component Mfg332618 Other Fabricated Wire Product Mfg 332992 Small Arms Ammunition Mfg
332312 Fabricated Structural Metal Mfg 332710 Machine Shops 332993 Ammunition (except Small Arms) Mfg
332313 Plate Work Mfg 332721 Precision Turned Product Mfg 332994Small Arms, Ordnance, and Accessories
Mfg
332321 Metal Window and Door Mfg 332722 Bolt, Nut, Screw, Rivet, and Washer Mfg 332996 Fabricated Pipe and Pipe Fitting Mfg
332322 Sheet Metal Work Mfg 332811 Metal Heat Treating 332999All Other Misc. Fabricated Metal Product
Mfg

The complete list of 273 detailed NAICS industries classified as advanced manufacturing, continued…
Machinery Manufacturing
333111 Farm Machinery and Equipment Mfg 333413Industrial and Commercial Fan and Air
Purification Equipment Mfg333912 Air and Gas Compressor Mfg
333112 Lawn and Garden Tractor Equipment Mfg 333414 Heating Equipment Mfg 333913 Measuring and Dispensing Pump Mfg
333120 Construction Machinery Mfg 333415 AC, Refrigeration, & Forced Air Heating 333921 Elevator and Moving Stairway Mfg
333131 Mining Machinery and Equipment Mfg 333511 Industrial Mold Mfg 333922 Conveyor and Conveying Equipment Mfg
333132Oil and Gas Field Machinery and
Equipment Mfg333514
Special Die and Tool, Die Set, Jig, and
Fixture Mfg333923
Overhead Crane, Hoist, and Monorail
System Mfg
333241 Food Product Machinery Mfg 333515Cutting Tool and Machine Tool Accessory
Mfg333924
Industrial Truck, Tractor, and Trailer
Machinery Mfg
333242 Semiconductor Machinery Mfg 333517 Machine Tool Mfg 333991 Power-Driven Handtool Mfg
333243Sawmill, Woodworking, and Paper
Machinery Mfg333519
Rolling Mill and Other Metalworking
Machinery Mfg333992 Welding and Soldering Equipment Mfg
333244 Printing Machinery and Equipment Mfg 333611Turbine and Turbine Generator Set Units
Mfg333993 Packaging Machinery Mfg
333249 Other Industrial Machinery Mfg 333612Speed Changer, Industrial High-Speed
Drive, and Gear Mfg333994 Industrial Process Furnace and Oven Mfg
333314 Optical Instrument and Lens Mfg 333613Mechanical Power Transmission Equipment
Mfg333995 Fluid Power Cylinder and Actuator Mfg
333316Photographic and Photocopying Equipment
Mfg333618 Other Engine Equipment Mfg 333996 Fluid Power Pump and Motor Mfg
333318Other Commercial and Service Industry
Machinery Mfg333911 Pump and Pumping Equipment Mfg 333997 Scale and Balance Mfg

The complete list of 273 detailed NAICS industries classified as advanced manufacturing, continued…
Computer and Electronic Product Manufacturing
334111 Electronic Computer Mfg 334413 Semiconductor and Related Device Mfg 334513 Industrial Process Variable Instruments
334112 Computer Storage Device Mfg 334416Capacitor, Resistor, Coil, and Other
Inductor Mfg334514
Totalizing Fluid Meter and Counting
Device Mfg
334118Terminal and Other Computer Peripheral
Equip. Mfg334417 Electronic Connector Mfg 334515
Instrument Mfg for Measuring Electrical
Signals
334210 Telephone Apparatus Mfg 334418 Printed Circuit Assembly Mfg 334516 Analytical Laboratory Instrument Mfg
334220Radio and Other Broadcasting Equipment
Mfg334419 Other Electronic Component Mfg 334517 Irradiation Apparatus Mfg
334290 Other Communications Equipment Mfg 334510Electromedical and Electrotherapeutic
Apparatus Mfg334519
Other Measuring and Controlling Device
Mfg
334310 Audio and Video Equipment Mfg 334511 Search, Detection & Navigation Instrumnt 334613Blank Magnetic and Optical Recording
Media Mfg
334412 Bare Printed Circuit Board Mfg 334512 Automatic Environmental Control Mfg. 334614Software, CD, Tape, and Record
Reproducing

The complete list of 273 detailed NAICS industries classified as advanced manufacturing, continued…
All Other Advanced Manufacturing
324110 Petroleum Refineries 335313Switchgear and Switchboard Apparatus
Mfg336412 Aircraft Engine and Engine Parts Mfg
324121 Asphalt Paving Mixture and Block Mfg 335314 Relay and Industrial Control Mfg 336413Other Aircraft Parts and Auxiliary
Equipment Mfg
324122Asphalt Shingle and Coating Materials
Mfg336310
Motor Vehicle Gasoline Engine and
Engine Parts Mfg336414 Guided Missile and Space Vehicle Mfg
324191Petroleum Lubricating Oil and Grease
Mfg336320
Motor Vehicle Electrical and Electronic
Equipment Mfg336415 Space Vehicle Propulsion Units and Parts
324199All Other Petroleum and Coal Products
Mfg336330
Motor Vehicle Steering and Suspension
Mfg336419
Other Guided Missile/Space Vehicle
Parts
327211 Flat Glass Mfg 336340 Motor Vehicle Brake System Mfg 336611 Ship Building and Repairing
327212Other Pressed and Blown Glass and
Glassware Mfg336350
Motor Vehicle Transmission and Power
Train Mfg336612 Boat Building
327213 Glass Container Mfg 336360Motor Vehicle Seating and Interior Trim
Mfg339112 Surgical and Medical Instrument Mfg
327215Glass Product Mfg Made of Purchased
Glass336370 Motor Vehicle Metal Stamping 339113 Surgical Appliance and Supplies Mfg
335311Power, Distribution, and Specialty
Transformer Mfg336390 Other Motor Vehicle Parts Mfg 339114 Dental Equipment and Supplies Mfg
335312 Motor and Generator Mfg 336411 Aircraft Mfg 339115 Ophthalmic Goods Mfg
339116 Dental Laboratories

ECONOMIC IMPACT

GDP growth in New Jersey has averaged 1.2 percent per year from 1997 to 2016, and now exceeds half of a trillion dollars
60
70
80
90
100
110
120
130
140
150
1997 2000 2005 2010 2016
Gross Domestic Product Index (Chained 2009 Dollars)New Jersey & United States: 1997-2016
US Total US Mfg NJ Total NJ Mfg
1997=100Over the same period, the national GDP has averaged 2 percent annual growth
Manufacturing GDP in the United States has grown in line with the overall economy, but in New Jersey, the declining manufacturing GDP estimate has been a detractor
New Jersey’s manufacturing sector averaged marginal growth of 0.4 percent per year from 1997 through 2008, but tumbled to decline by an annual average of 4.2 percent from 2008 through 2016
Source: United States Bureau of Economic Analysis, GDP in Chained 2009 DollarsPrepared by: New Jersey Department of Labor and Workforce DevelopmentJanuary, 2018
Gray area denotes U.S. economic recession as defined by the National
Bureau of Economic Research (NBER)

Roughly 81 percent of manufacturing GDP in New Jersey is derived from industries classified as advanced
0
10,000
20,000
30,000
40,000
50,000
60,000
70,000
1997 2000 2005 2010 2015
Gross Domestic Product of Manufacturing Sector (Billions of Chained 2009 Dollars)
New Jersey: 1997-2015
Non-Advanced Manufacturing
Advanced Manufacturing
Source: United States Bureau of Economic Analysis, GDP in Chained 2009 DollarsPrepared by: New Jersey Department of Labor and Workforce DevelopmentJanuary, 2018
These advanced manufacturing industries also accounted for roughly 81 percent of manufacturing GDP at the national level
Total manufacturing GDP in New Jersey exceeded $50 billion consistently from 1997 through 2008, averaging 0.4 percent annual growth
GDP in statewide advanced manufacturing industries were essentially unchanged from 1997-2008, but declined by an annual average rate of 5.3 percent over the next five years following the national recession
Gray area denotes U.S. economic recession as defined by the National
Bureau of Economic Research (NBER)

Output produced from the chemical manufacturing sector dominates GDP output among advanced manufacturing industries
0
10
20
30
40
50
1997 2000 2005 2010 2015
Bill
ion
s o
f C
hai
ne
d 2
00
9 D
olla
rs
Gross Domestic Product by Advanced Manufacturing Segment New Jersey: 1997-2015
Chemical products Computer and electronic products
Food and beverage and tobacco products Fabricated metal products
Machinery Other advanced manufacturing
Source: United States Bureau of Economic Analysis, GDP in Chained 2009 DollarsPrepared by: New Jersey Department of Labor and Workforce DevelopmentJanuary, 2018
Chemical manufacturing accounted for 59 percent of advanced manufacturing GDP in 1997, but only 46 percent in 2015
The fabricated metal, machinery, and all other advanced manufacturing segments maintained a fairly steady share of total GDP throughout this time period.
Computer and electronic products manufacturing has been the best performing industry among this group, increasing its GDP from $591 million in 1997 to nearly $4.2 billion in 2015
Gray area denotes U.S. economic recession as defined by the National
Bureau of Economic Research (NBER)

Chemical manufacturing accounts for nearly half of New Jersey’s manufacturing GDP, which makes the rate of decline alarming
0%
20%
40%
60%
50
75
100
125
150
1997 2000 2005 2010 2015
Ch
em
ical Share
of To
tal Mfg G
DP
GD
P In
dex
–1
99
7=1
00
Measures of GDP for Chemical ManufacturingNew Jersey & United States: 1997-2015
US Chemical Mfg NJ Chemical Mfg
US Chemical Share of Total Mfg NJ Chemical Share of Total Mfg
Source: United States Bureau of Economic Analysis, GDP in Chained 2009 DollarsPrepared by: New Jersey Department of Labor and Workforce DevelopmentJanuary, 2018
Annual average change in GDP by chemical manufacturers in New Jersey and the nation have been moving in opposite directions for some time
From 1997-2007, the nation had robust growth of 3.5 percent per year while New Jersey increased slightly
From 2007-2015, New Jersey experienced deep losses in GDP of 4.1 percent per year while the nation is only slightly below its pre-recession peak
Gray area denotes U.S. economic recession as defined by the National
Bureau of Economic Research (NBER)

INDUSTRY ANALYSIS

New Jersey has followed a similar employment trend as the nation, but has fared worse over the last 26 years
40
60
80
100
120
140
1990 1995 2000 2005 2010 2015
Employment: Manufacturing vs. All “other” IndustriesNew Jersey & United States: 1990-2016
NJ Manufacturing
NJ Total Nonfarm, Except Manufacturing
US Manufacturing
US Total Nonfarm, Except Manufacturing
(1990=100)
Manufacturing has lost 297,300 jobs in New Jersey since 1990, a 3 percent annual decline, while the nation has declined at a 1.4 percent annual rate, shedding roughly 5.3 million jobs
The “other” non-agricultural industries grew by an annual average of 0.8 percent posting a net gain of 728,000 jobs in New Jersey, while the United States added over 40 million jobs, an average gain of 1.4 percent per year
From 2015 to 2016, New Jersey’s manufacturing sector experienced its best year since 1990, gaining 2,900 jobs, and continuing a three year trend over the past 26 years of avoiding an employment decline
Source: NJLWD, Current Employment Statistics, Annual AveragesPrepared by: New Jersey Department of Labor and Workforce DevelopmentJanuary, 2018

24
4.7
22
2.2
20
4.7
19
5.6
19
4.9
19
3.7
18
9.5
19
1.0
19
0.0
18
6.9
18
9.4
18
1.5
16
2.5
15
5.0
15
0.4
14
7.5
14
5.1
13
9.6
13
5.3
11
8.8
11
4.3
11
3.9
11
1.9
11
0.3
10
9.0
10
9.5
10
9.7
28
4.3
27
4.6
26
6.8
26
3.8
25
6.5
24
9.4
24
1.3
23
6.8
23
7.3
23
3.6
23
0.2
21
7.6
20
2.5
19
3.0
18
5.3
18
0.3
17
6.0
16
8.9
16
0.2
14
2.1
13
7.9
13
3.0
12
9.0
12
8.4
12
9.8
12
9.3
13
2.1
0
200
400
600
1990 1995 2000 2005 2010 2015
Employment (000s) breakdown Durable vs. Non-durable Goods
New Jersey: 1990-2016
Durable Goods Non-Durable Goods
Manufacturing employment in New Jersey has declined from 14.6 percent of all jobs in 1990 to 5.9 percent in 2016
Widespread and consistent losses among industries that manufacture both durable and non-durable goods have resulted in closely distributed annual average losses of 3.0 and 2.9 percent, respectively
Nationally, manufacturing’s share of total employment has declined from 16.2 percent in 1990 to 8.6 percent in 2016
Source: NJLWD, Current Employment Statistics, Annual AveragesPrepared by: New Jersey Department of Labor and Workforce DevelopmentJanuary, 2018
During the six worst years for manufacturing employment in New Jersey (‘91-’92, ‘01-’03, ’09), more than 163,000 of the 291,000 total jobs losses occurred, an average rate of decline of more than 6 percent per year
Gray area denotes U.S. economic recession as defined by the National
Bureau of Economic Research (NBER)
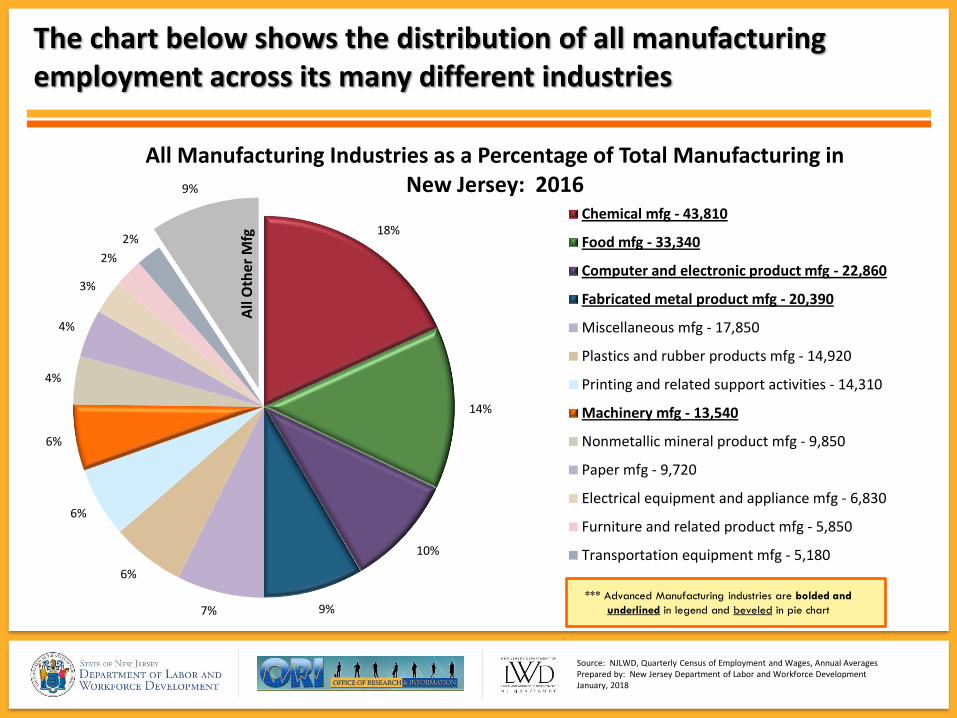
The chart below shows the distribution of all manufacturing employment across its many different industries
18%
14%
10%
9%7%
6%
6%
6%
4%
4%
3%
2%
2%
9%
All Manufacturing Industries as a Percentage of Total Manufacturing in New Jersey: 2016
Chemical mfg - 43,810
Food mfg - 33,340
Computer and electronic product mfg - 22,860
Fabricated metal product mfg - 20,390
Miscellaneous mfg - 17,850
Plastics and rubber products mfg - 14,920
Printing and related support activities - 14,310
Machinery mfg - 13,540
Nonmetallic mineral product mfg - 9,850
Paper mfg - 9,720
Electrical equipment and appliance mfg - 6,830
Furniture and related product mfg - 5,850
Transportation equipment mfg - 5,180
Source: NJLWD, Quarterly Census of Employment and Wages, Annual AveragesPrepared by: New Jersey Department of Labor and Workforce DevelopmentJanuary, 2018
*** Advanced Manufacturing industries are bolded and
underlined in legend and beveled in pie chart
All
Oth
er M
fg
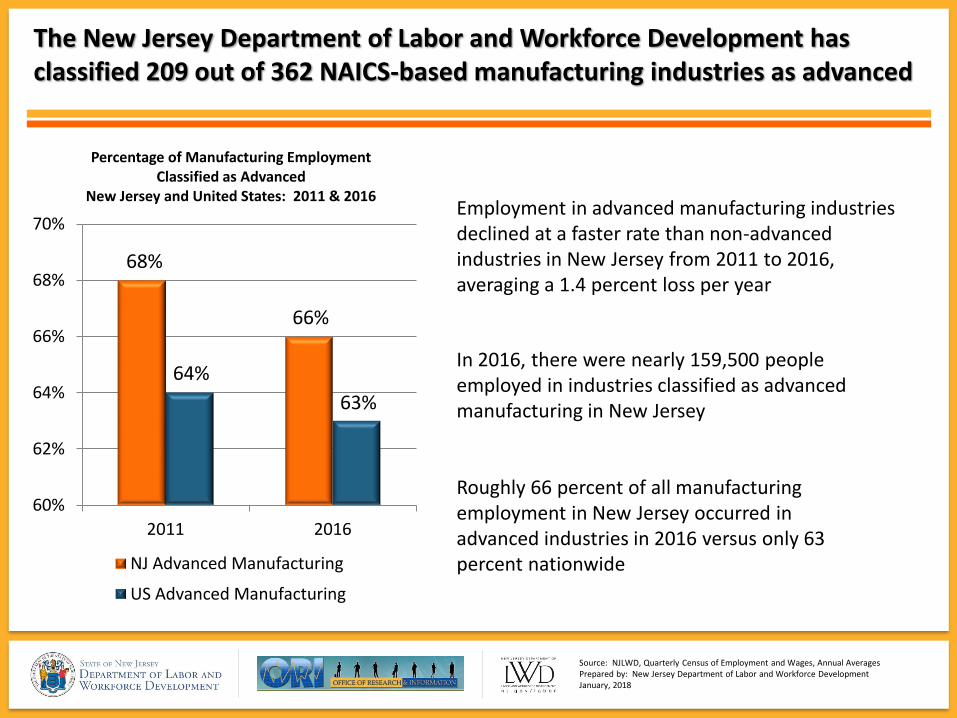
The New Jersey Department of Labor and Workforce Development has classified 209 out of 362 NAICS-based manufacturing industries as advanced
68%
66%
64%
63%
60%
62%
64%
66%
68%
70%
2011 2016
Percentage of Manufacturing Employment Classified as Advanced
New Jersey and United States: 2011 & 2016
NJ Advanced Manufacturing
US Advanced Manufacturing
Employment in advanced manufacturing industries declined at a faster rate than non-advanced industries in New Jersey from 2011 to 2016, averaging a 1.4 percent loss per year
In 2016, there were nearly 159,500 people employed in industries classified as advanced manufacturing in New Jersey
Roughly 66 percent of all manufacturing employment in New Jersey occurred in advanced industries in 2016 versus only 63 percent nationwide
Source: NJLWD, Quarterly Census of Employment and Wages, Annual AveragesPrepared by: New Jersey Department of Labor and Workforce DevelopmentJanuary, 2018

The five major components of advanced manufacturing accounted for nearly 84 percent of its employment in New Jersey in 2016
27%
21%
14%
13%
9%
16%
Employment Distribution of Advanced ManufacturingNew Jersey: 2016
Chemical Mfg
Food Mfg
Electronic Product Mfg
Fabricated Metal Mfg
Machinery Mfg
The remaining 16 percent of advanced manufacturing employment is comprised of a group of industries producing goods such as glass and glass products, electrical equipment, transportation equipment, and medical instruments and devices
Chemical manufacturing, which includes pharmaceuticals and medicine, employed nearly 43,900 in 2016, which is about 18 percent of all manufacturing in the state
Computer and electronic product and fabricated metal product manufacturing together employed nearly 43,300 in 2016
Source: NJLWD, Quarterly Census of Employment and Wages, Annual AveragePrepared by: New Jersey Department of Labor and Workforce DevelopmentJanuary, 2018
Other AdvancedManufacturing
Food manufacturing is the second largest segment and employed more than 33,300 in 2016

These industries each employ a disproportionately high number of people in New Jersey and are among the manufacturing industries that define the state in 2016
7.8%
8.3%
10.5%
12.2%
16.9%
0% 10% 20% 30%
PharmaceuticalPreparation
Glass Container
Spice and Extract
Toiletry Preparation
Medicinal and Botanical
New Jersey Employment as aPercentage of the nation: 2016
All NJ Mfg. accounts for 2% of all US Mfg
Chemical manufacturing in New Jersey, where three of the five industries on this list are classified, accounts for 5.4 percent of chemical manufacturing employment in the nation
Overall, New Jersey employed 2 percent of all advanced manufacturing in the nation
Source: NJLWD, Quarterly Census of Employment and Wages, Annual AveragePrepared by: New Jersey Department of Labor and Workforce DevelopmentJanuary, 2018
Each of these five industries pays an average annual wage greater than the statewide average of $62,420

The five largest manufacturing industries make up nearly 19 percent of all manufacturing employment in the state in 2016
6.6%
4.2%
2.9%
2.7%
2.6%
81.2%
Percentage of Industry’s Employmentof All Manufacturing
New Jersey, 2016
Pharmaceutical Preparation
Commercial Printing
Surgical Appliance and Supplies
Toiletry Preparation
Search, Detection & Navigation Instruments
Pharmaceutical preparation accounts for 6.6 percent of all manufacturing jobs in New Jersey, but less than 2 percent of all manufacturing jobs nationally
Among these five largest manufacturing industries, only commercial printing is not classified as advanced
Each of these industries earns a substantial average annual wage, ranging from $58,600 for commercial printing to $156,400 for pharmaceutical preparation
Source: NJLWD, Quarterly Census of Employment and Wages, Annual AveragePrepared by: New Jersey Department of Labor and Workforce DevelopmentJanuary, 2018
OtherManufacturing

Annual average wages in New Jersey in 2016 among advanced manufacturing industries are about 45 percent more than those non-advanced manufacturing industries
$53,400
$71,600
$60,400
$87,800
$0 $50,000 $100,000
Non-Advanced
Advanced
Comparison of Annual Average Wages Among Advanced and Non-advanced Manufacturing:
New Jersey & United States, 2016
NJ Average Wage US Average Wage
From 2011 to 2016, annual average wages in New Jersey in advanced manufacturing have increased 1.0 percent per year compared to only 1.3 percent per year for non-advanced
Annual average wages paid are 23 percent higher in New Jersey in 2016 than the nation among advanced manufacturing industries
One of the higher paying industry clusters in New Jersey, the advanced manufacturing industry earns about 41 percent more than the state average of $62,400 in 2016
Source: NJLWD, Quarterly Census of Employment and Wages, Annual AveragesPrepared by: New Jersey Department of Labor and Workforce DevelopmentJanuary, 2018
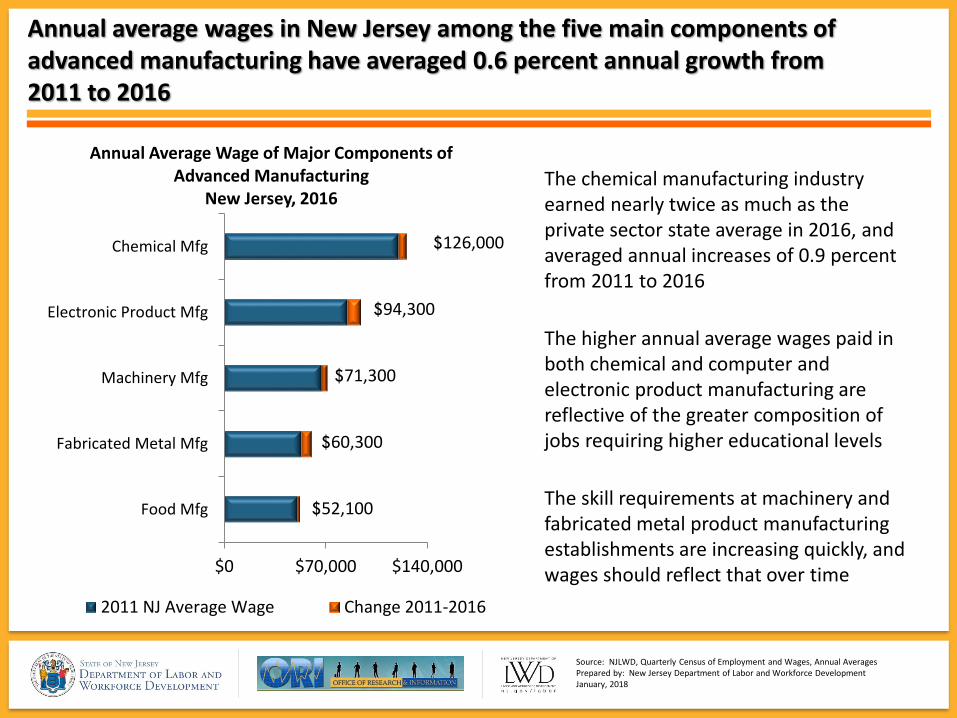
Annual average wages in New Jersey among the five main components of advanced manufacturing have averaged 0.6 percent annual growth from 2011 to 2016
$0 $70,000 $140,000
Food Mfg
Fabricated Metal Mfg
Machinery Mfg
Electronic Product Mfg
Chemical Mfg
Annual Average Wage of Major Components of Advanced Manufacturing
New Jersey, 2016
2011 NJ Average Wage Change 2011-2016
$52,100
$71,300
$94,300
$126,000
The chemical manufacturing industry earned nearly twice as much as the private sector state average in 2016, and averaged annual increases of 0.9 percent from 2011 to 2016
The higher annual average wages paid in both chemical and computer and electronic product manufacturing are reflective of the greater composition of jobs requiring higher educational levels
Source: NJLWD, Quarterly Census of Employment and Wages, Annual AveragesPrepared by: New Jersey Department of Labor and Workforce DevelopmentJanuary, 2018
$60,300
The skill requirements at machinery and fabricated metal product manufacturing establishments are increasing quickly, and wages should reflect that over time

These detailed industries make up the roughly 25,520 workers employed in the “other” advanced manufacturing component
Medical equipment and supplies manufacturing
47%
Glass and glass product manufacturing
18%
Petroleum and coal products manufacturing
12%
Other motor vehicle manufacturing
11%
Electrical equipment manufacturing
7%
Aerospace product and parts manufacturing
5%
Breakdown of Employment of “Other” Advanced ManufacturingNew Jersey, 2016
Nearly half of these “other” workers are employed in the medical equipment and supplies manufacturing industry, which tends to have very high annual average wages and are primarily located in northeast New Jersey
Glass and glass product manufacturing is a vital industry in New Jersey unique mainly to its southern counties
Source: NJLWD, Quarterly Census of Employment and Wages, Annual AveragePrepared by: New Jersey Department of Labor and Workforce DevelopmentJanuary, 2018

Employment in advanced manufacturing is highly concentrated in New Jersey’s most populous counties and along the Interstate 95 corridor…
New Jersey offers unique business advantages including:
-geographic proximity to roughly 40 percent of the US population, or around 100 million potential consumers
-highly educated and very diverse workforce
-extensive transportation network in place to carry goods by land, air, and sea
Source: NJWLD, Quarterly Census of Employment and Wages< Annual AveragePrepared by: New Jersey Department of Labor and Workforce DevelopmentJanuary, 2018
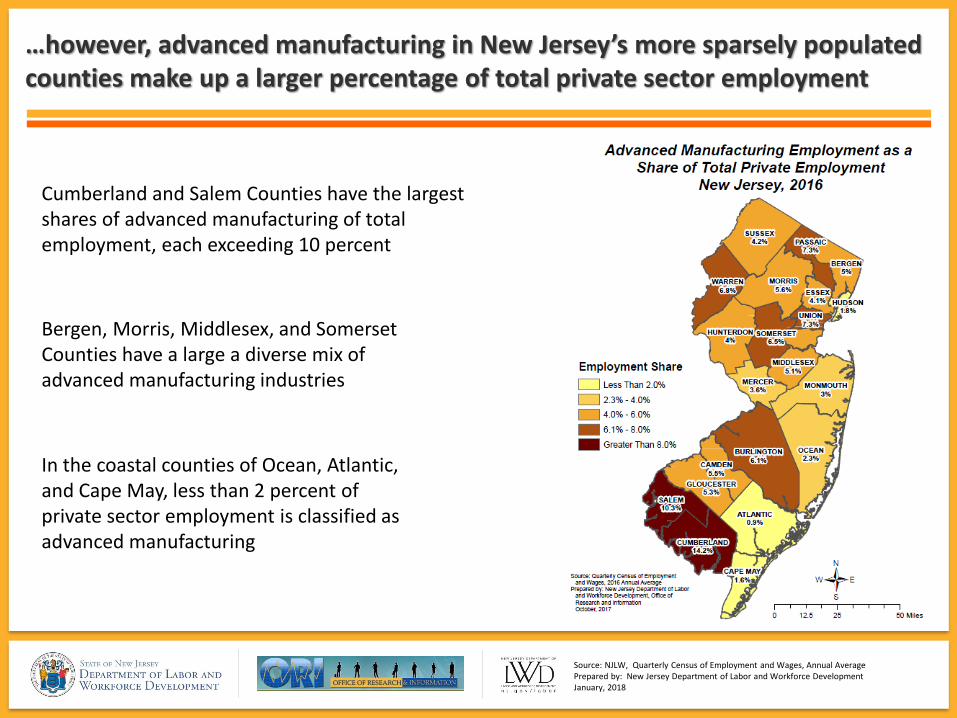
…however, advanced manufacturing in New Jersey’s more sparsely populated counties make up a larger percentage of total private sector employment
In the coastal counties of Ocean, Atlantic, and Cape May, less than 2 percent of private sector employment is classified as advanced manufacturing
Source: NJLW, Quarterly Census of Employment and Wages, Annual AveragePrepared by: New Jersey Department of Labor and Workforce DevelopmentJanuary, 2018
Cumberland and Salem Counties have the largest shares of advanced manufacturing of total employment, each exceeding 10 percent
Bergen, Morris, Middlesex, and Somerset Counties have a large a diverse mix of advanced manufacturing industries

OCCUPATIONAL ANALYSIS

Greater than 75 percent of all advanced manufacturing jobs are classified into these five groups
Production 45%
Office & Administrative
Support 11%
Transportation & Material
Moving 7%
Management 7%
Engineering 7%
All Other23%
Breakdown of Major Occupational Groups within Advanced Manufacturing Industry:
New Jersey, 2016Nearly half of advanced manufacturing workers are directly involved with production
Roughly 13 percent of workers are classified in STEM occupations
The “other” 23 percent of advanced manufacturing occupations primarily consists of business, sales and other profession and service occupations
Source: NJLWD, Occupational Employment Statistics Survey, May 2015Prepared by: New Jersey Department of Labor and Workforce DevelopmentJanuary, 2018
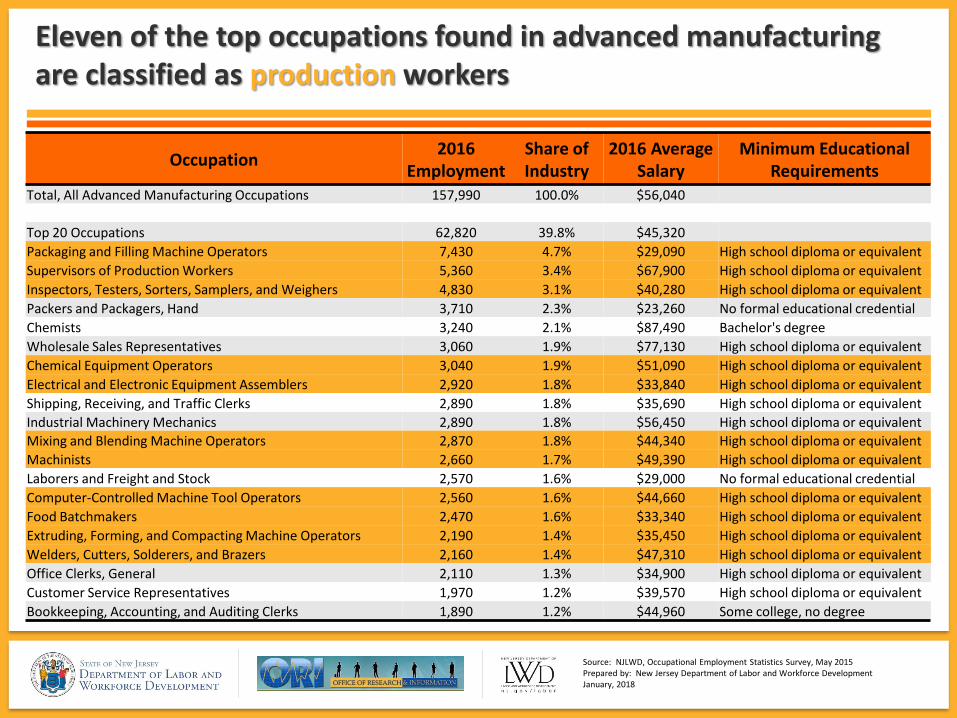
Eleven of the top occupations found in advanced manufacturing are classified as production workers
Occupation2016
EmploymentShare of Industry
2016 Average Salary
Minimum Educational Requirements
Total, All Advanced Manufacturing Occupations 157,990 100.0% $56,040
Top 20 Occupations 62,820 39.8% $45,320
Packaging and Filling Machine Operators 7,430 4.7% $29,090 High school diploma or equivalent
Supervisors of Production Workers 5,360 3.4% $67,900 High school diploma or equivalent
Inspectors, Testers, Sorters, Samplers, and Weighers 4,830 3.1% $40,280 High school diploma or equivalent
Packers and Packagers, Hand 3,710 2.3% $23,260 No formal educational credential
Chemists 3,240 2.1% $87,490 Bachelor's degree
Wholesale Sales Representatives 3,060 1.9% $77,130 High school diploma or equivalent
Chemical Equipment Operators 3,040 1.9% $51,090 High school diploma or equivalent
Electrical and Electronic Equipment Assemblers 2,920 1.8% $33,840 High school diploma or equivalent
Shipping, Receiving, and Traffic Clerks 2,890 1.8% $35,690 High school diploma or equivalent
Industrial Machinery Mechanics 2,890 1.8% $56,450 High school diploma or equivalent
Mixing and Blending Machine Operators 2,870 1.8% $44,340 High school diploma or equivalent
Machinists 2,660 1.7% $49,390 High school diploma or equivalent
Laborers and Freight and Stock 2,570 1.6% $29,000 No formal educational credential
Computer-Controlled Machine Tool Operators 2,560 1.6% $44,660 High school diploma or equivalent
Food Batchmakers 2,470 1.6% $33,340 High school diploma or equivalent
Extruding, Forming, and Compacting Machine Operators 2,190 1.4% $35,450 High school diploma or equivalent
Welders, Cutters, Solderers, and Brazers 2,160 1.4% $47,310 High school diploma or equivalent
Office Clerks, General 2,110 1.3% $34,900 High school diploma or equivalent
Customer Service Representatives 1,970 1.2% $39,570 High school diploma or equivalent
Bookkeeping, Accounting, and Auditing Clerks 1,890 1.2% $44,960 Some college, no degree
Source: NJLWD, Occupational Employment Statistics Survey, May 2015Prepared by: New Jersey Department of Labor and Workforce DevelopmentJanuary, 2018

Many of the occupations found in advanced manufacturing have moderate to high education/training requirements for entry
Total Number of Employment in Advanced Manufacturing by Minimum Education Requirement
New Jersey, 2016
Scientists and engineers primarily account for the roughly 19 percent of the occupations found in advanced manufacturing that require at least an bachelor’s degree for entry
Although the majority of employment in advanced manufacturing may not require postsecondary education for entry, the tradesmen and production workers that comprise this group often have many years of experience, and may have completed an apprenticeship or extensive on-the-job training program
Minimum Education Requirement
2016 Employment
% of Total
Total, Advanced Manufacturing 157,990 100.0%
Total High Requirements 31,400 19.9%
Doctoral or professional degree 600 0.4%
Master's degree 90 0.1%
Bachelor's degree 30,710 19.4%
Total Moderate Requirements 7,200 4.6%
Associate's degree 3,940 2.5%
Postsecondary nondegree award 1,140 0.7%
Some college, no degree 2,120 1.3%
Total Low Requirements 102,480 64.9%
High school diploma or equivalent 82,530 52.2%
No formal educational credential 19,950 12.6%
Education unavailable 16,910 10.7%
Source: NJLWD, Occupational Employment Statistics Survey, May 2015Prepared by: New Jersey Department of Labor and Workforce DevelopmentJanuary, 2018

SUBSECTOR DETAILS

Food Manufacturing
The food manufacturing industry has exhibited steady growth in New Jersey from 2011 through 2016, both in terms of employment and the total number of establishments.
Source: NJLWD, Quarterly Census of Employment and Wages, Annual AveragePrepared by: New Jersey Department of Labor and Workforce DevelopmentJanuary, 2018
Establishments EmploymentEmployment Per
Establishment
2011 993 30,014 30
2016 1,134 33,346 29
Change 141 3,332 -1
Commercial and retail bakeries, in particular, have shown solid growth over these five years, and have accounted for a large portion of the rise in both employment and establishments.
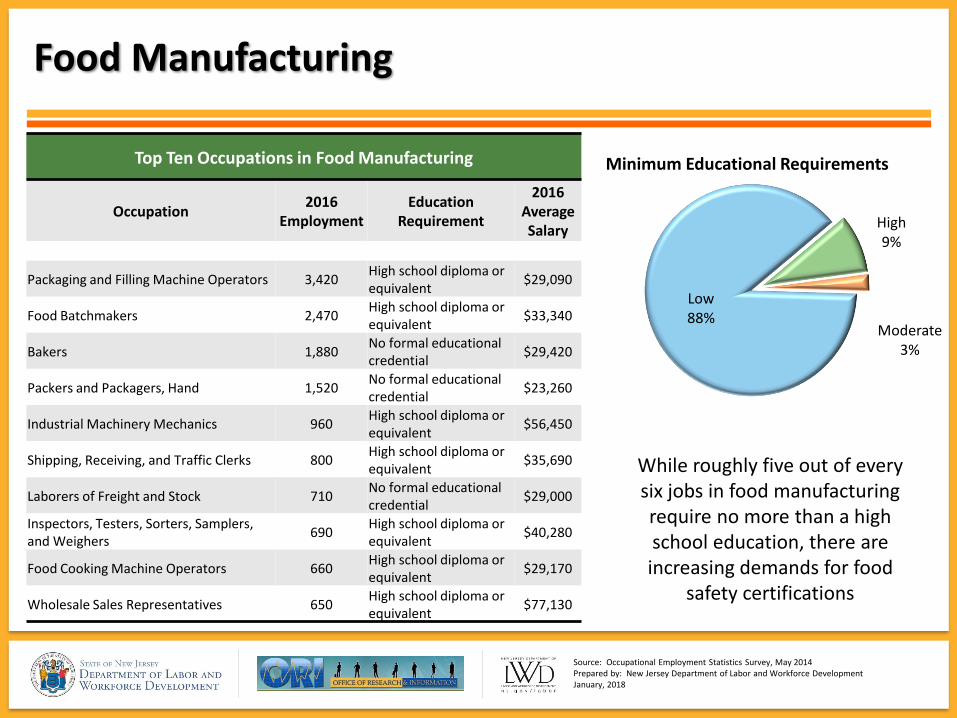
High9%
Moderate 3%
Low88%
Minimum Educational Requirements
While roughly five out of every six jobs in food manufacturing require no more than a high school education, there are increasing demands for food
safety certifications
Top Ten Occupations in Food Manufacturing
Occupation2016
EmploymentEducation
Requirement
2016 Average Salary
Packaging and Filling Machine Operators 3,420High school diploma or equivalent
$29,090
Food Batchmakers 2,470High school diploma or equivalent
$33,340
Bakers 1,880No formal educational credential
$29,420
Packers and Packagers, Hand 1,520No formal educational credential
$23,260
Industrial Machinery Mechanics 960High school diploma or equivalent
$56,450
Shipping, Receiving, and Traffic Clerks 800High school diploma or equivalent
$35,690
Laborers of Freight and Stock 710No formal educational credential
$29,000
Inspectors, Testers, Sorters, Samplers, and Weighers
690High school diploma or equivalent
$40,280
Food Cooking Machine Operators 660High school diploma or equivalent
$29,170
Wholesale Sales Representatives 650High school diploma or equivalent
$77,130
Source: Occupational Employment Statistics Survey, May 2014Prepared by: New Jersey Department of Labor and Workforce DevelopmentJanuary, 2018
Food Manufacturing

Chemical Manufacturing
Some well-known employers vital to New Jersey’s economy include:
• Johnson & Johnson• Squibb• Schering• Firmenich• Smith Kline Beecham
• Bayer• Novartis• L’Oreal• Merck• Pfizer
Chemical manufacturing declined from 2011-2016 both in the absolute number of establishments and also in the average employment per unit
Source: NJLWD, Quarterly Census of Employment and Wages, Annual AveragePrepared by: New Jersey Department of Labor and Workforce DevelopmentJanuary, 2018
Establishments EmploymentEmployment Per
Establishment
2011 871 52,735 61
2016 828 43,813 53
Change -43 -8,922 -8

High31%
Moderate 5%
Low64%
Minimum Educational Requirements
Nearly half of all chemists in the state work for companies
classified in chemical manufacturing
Top Ten Occupations in Chemical Manufacturing
Occupation2016
EmploymentEducation
Requirement
2016 Average Salary
Packaging and Filling Machine Operators
3,580High school diploma or equivalent
$29,090
Chemists 3,100 Bachelor's degree $87,490
Chemical Equipment Operators 2,610High school diploma or equivalent
$51,090
Mixing and Blending Machine Operators
2,420High school diploma or equivalent
$44,340
Inspectors, Testers, Sorters, Samplers, and Weighers
1,770High school diploma or equivalent
$40,280
Extruding, Forming, Pressing, and Compacting Machine Operators
1,710High school diploma or equivalent
$35,450
Chemical Technicians 1,090 Associate's degree $67,030
Industrial Machinery Mechanics 1,070High school diploma or equivalent
$56,450
Laborers of Freight and Stock 1,050No formal educational credential
$29,000
Wholesale Sales Representatives 820High school diploma or equivalent
$77,130
Source: Occupational Employment Statistics Survey, May 2014Prepared by: New Jersey Department of Labor and Workforce DevelopmentJanuary, 2018
Chemical Manufacturing

Computer and Electronic Product Manufacturing
Some well-known employers vital to New Jersey’s economy include:
• L-3 Communications• Lockheed Martin• Crestron Electronics• Exelis• Siemens
• Datascope• Kulite Semiconductor• Honeywell• Anadigics• Trumpf
Most establishments are largely clustered in Northern New Jersey and Camden areas of the state
Source: NJLWD, Quarterly Census of Employment and Wages, Annual AveragePrepared by: New Jersey Department of Labor and Workforce DevelopmentJanuary, 2018
Establishments EmploymentEmployment Per
Establishment
2011 745 26,185 35
2016 704 22,865 32
Change -41 -3,320 -3

High38%
Moderate 11%
Low50%
Minimum Educational Requirements
Nearly 30 percent of all employment in this
industry is classified among STEM occupations.
Top Ten Occupations in Computer and Electronic Product Manufacturing
Occupation2016
EmploymentEducation
Requirement
2016 Average Salary
Electrical and Electronic Equipment Assemblers
2,330High school diploma or equivalent
$33,840
Electrical and Electronics Engineering Technicians
890 Associate's degree $66,200
Inspectors, Testers, Sorters, Samplers, and Weighers
770High school diploma or equivalent
$40,280
Electromechanical Equipment Assemblers
690High school diploma or equivalent
$37,730
Electronics Engineers 690 Bachelor's degree $106,960
Team Assemblers 520High school diploma or equivalent
$27,760
Electrical Engineers 490 Bachelor's degree $106,110
Shipping, Receiving, and Traffic Clerks 390High school diploma or equivalent
$35,690
Semiconductor Processors 380 Associate's degree $42,680
Industrial Engineers 360 Bachelor's degree $94,630
Source: Occupational Employment Statistics Survey, May 2014Prepared by: New Jersey Department of Labor and Workforce DevelopmentJanuary, 2018
Computer and Electronic Product Manufacturing

Fabricated Metal Product Manufacturing
Source: NJLWD, Quarterly Census of Employment and Wages, Annual AveragePrepared by: New Jersey Department of Labor and Workforce DevelopmentJanuary, 2018
Fabricated metal product manufacturing lost the most establishments from 2011-2016
Most of the establishments classified in this industry are smaller shops who predominantly operate in a support capacity to other types of manufacturers in the state and region
Establishments EmploymentEmployment Per
Establishment
2011 1,271 22,377 18
2016 1,153 20,387 18
Change -118 -1,990 -1

High12%
Moderate 4%
Low84%
Minimum Educational Requirements
Although each of the occupations on this list
require only a high school education, most require a great amount of skill and
experience to excel
Top Ten Occupations in Fabricated Metal Manufacturing
Occupation2016
EmploymentEducation
Requirement
2016 Average Salary
Cutting, Punching, and Press Machine Operators
1,470High school diploma or equivalent
$33,730
Welders, Cutters, Solderers, and Brazers
1,380High school diploma or equivalent
$47,310
Computer-Controlled Machine Tool Operators
1,330High school diploma or equivalent
$44,660
Machinists 1,210High school diploma or equivalent
$49,390
Inspectors, Testers, Sorters, Samplers, and Weighers
550High school diploma or equivalent
$40,280
Shipping, Receiving, and Traffic Clerks
470High school diploma or equivalent
$35,690
Coating, Painting, and Spraying Machine Operators
440High school diploma or equivalent
$38,130
Wholesale Sales Representatives 430High school diploma or equivalent
$77,130
Sheet Metal Workers 410High school diploma or equivalent
$63,380
Grinding, Lapping, Polishing, and Buffing Machine Tool Operators
350High school diploma or equivalent
$32,450
Source: Occupational Employment Statistics Survey, May 2014Prepared by: New Jersey Department of Labor and Workforce DevelopmentJanuary, 2018
Fabricated Metal Product Manufacturing
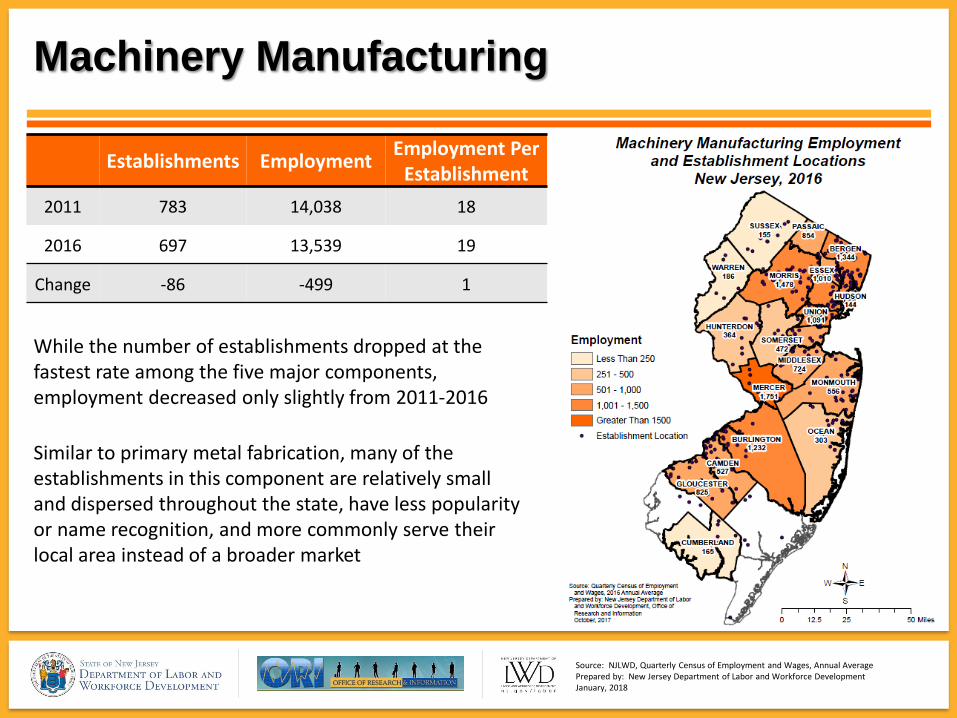
Machinery Manufacturing
While the number of establishments dropped at the fastest rate among the five major components, employment decreased only slightly from 2011-2016
Similar to primary metal fabrication, many of the establishments in this component are relatively small and dispersed throughout the state, have less popularity or name recognition, and more commonly serve their local area instead of a broader market
Source: NJLWD, Quarterly Census of Employment and Wages, Annual AveragePrepared by: New Jersey Department of Labor and Workforce DevelopmentJanuary, 2018
Establishments EmploymentEmployment Per
Establishment
2011 783 14,038 18
2016 697 13,539 19
Change -86 -499 1

High20%
Moderate 6%
Low75%
Minimum Educational Requirements
Source: Occupational Employment Statistics Survey, May 2014Prepared by: New Jersey Department of Labor and Workforce DevelopmentJanuary, 2018
Many of the occupations on this list have low minimum
educational and training requirements for entry, but are
filled by workers with vast levels of experience
Top Ten Occupations in Machinery Manufacturing
Occupation2016
EmploymentEducation
Requirement
2016 Average Salary
Machinists 980High school diploma or equivalent
$49,390
Electromechanical Equipment Assemblers
560High school diploma or equivalent
$37,730
Team Assemblers 530High school diploma or equivalent
$27,760
Wholesale Sales Representatives 480High school diploma or equivalent
$77,130
Computer-Controlled Machine Tool Operators
440High school diploma or equivalent
$44,660
Welders, Cutters, Solderers, and Brazers
430High school diploma or equivalent
$47,310
Mechanical Engineers 410 Bachelor's degree $93,570
Tool and Die Makers 330High school diploma or equivalent
$56,380
Shipping, Receiving, and Traffic Clerks 260High school diploma or equivalent
$35,690
Inspectors, Testers, Sorters, Samplers, and Weighers
250High school diploma or equivalent
$40,280
Machinery Manufacturing
DEMOGRAPHIC PROFILE

Data shows a steady and gradual change toward an older workforce in nearly every age cohort
0%
50%
100%
19
97
Q1
19
99
Q1
20
01
Q1
20
03
Q1
20
05
Q1
20
07
Q1
20
09
Q1
20
11
Q1
20
13
Q1
20
15
Q1
Breakdown of Workforce by AgeNew Jersey: 1997-2016
65+
55-64
45-54
35-44
25-34
<25
Source: United States Census Bureau, Quarterly Workforce IndicatorsPrepared by: New Jersey Department of Labor and Workforce DevelopmentJanuary, 2018
The workforce aged 65 and older has doubled its share of total employment from 3 percent to over 7 percent from 1997 to 2016
Although there are nearly 25,000 fewer workers in the 45-54 and 55-64 cohorts, their share of the workforce has increased from 39 percent in 1997 to 50 percent in 2016
Employment for those younger than age 34 has decreased by more than half and now accounts for only 22 percent of the total workforce

Gender, racial, and ethnic profile of New Jersey residents working in advanced manufacturing industries
Male64%
Female36%
Advanced Manufacturing
Male53%
Female47%
All Industries
White70%
Black9%
Asian12%
Other9%
Advanced Manufacturing
White69%
Black13%
Asian10%
Other8%
All Industries
Non-Hispanic
79%
Hispanic21%
Advanced Manufacturing
Non-Hispanic
81%
Hispanic19%
All Industries
The advanced manufacturing workforce is predominantly male
The Asian population makes up a larger portion of the advanced manufacturing
workforce than the overall economy
The Hispanic population is slightly less among advanced manufacturing industries
Source: U.S. Census Bureau, 2015 American Community Survey
Prepared by: New Jersey Department of Labor and Workforce DevelopmentJanuary, 2018

Self-reported educational attainment and average wage of NJ residents in the advanced manufacturing workforce
18.3%
21.8%
17.6%
28.6%
13.7%
0.0% 20.0% 40.0%
Less than $25,000
$25,000-$50,000
$50,000-$75,000
$75,000-$150,000
$150,000 & more
Average Wage
Source: U.S. Census Bureau, 2015 American Community Survey
Prepared by: New Jersey Department of Labor and Workforce DevelopmentJanuary, 2018
31.5%
20.4%
28.5%
16.4%
3.2%
0.0% 20.0% 40.0%
High School or less
Some college/Associate degree
Bachelor's degree
Master's/Professional degree
Doctoral degree
Education Level
Nearly 50 percent of the workforce reported that they have earned at least a bachelor’s degree, and…
…nearly 60 percent of the workforce claimed to have earned wages above $50,000

OUTLOOK

The employment losses experienced by the five major components of advanced manufacturing are projected to stabilize
0
20
40
60
80
100
120
1990 1994 1998 2002 2006 2010 2014
Indices of Actual and Projected Employment of Four Major Components of Advanced Manufacturing
New Jersey: 1990-2024
Fabricated Metal Product Manufacturing
Machinery Manufacturing
Computer and Electronic Product Manufacturing
Food Manufacturing
Chemical Manufacturing
Source:: Current Employment Statistics, New Jersey Industry and Occupational Projections
Prepared by: New Jersey Department of Labor and Workforce Development
January, 2018
Yellow area denotes projected period from 2014-2024
Shaded areas indicate recessionary periods as determinedby the National Bureau of Economic Research
1990=100 Each of the five components have experienced fairly deep losses overall, with recessionary periods being particularly acute
Food manufacturing has retained the greatest portion of its employment since 1990, losing just over 20 percent of its jobs
2024

THIS WORKFORCE PRODUCT WAS FUNDED BY A GRANT AWARDED BY THE U.S.DEPARTMENT OF LABOR’S EMPLOYMENT AND TRAINING ADMINISTRATION. THE PRODUCT WAS CREATED BY THE RECIPIENT AND DOES NOT NECESSARILY REFLECT THE OFFICIAL POSITION OF THE U.S. DEPARTMENT OF LABOR. THE DEPARTMENT OF LABOR MAKES NO GUARANTEES, WARRANTIES, OR ASSURANCES OF ANY KIND, EXPRESS OR IMPLIED, WITH RESPECT TO SUCH INFORMATION, INCLUDING ANY INFORMATION ON LINKED SITES AND INCLUDING, BUT NOT LIMITED TO, ACCURACY OF THE INFORMATION OR ITS COMPLETENESS, TIMELINESS, USEFULNESS, ADEQUACY, CONTINUED AVAILABILITY, OR OWNERSHIP. THISPRODUCT IS COPYRIGHTED BY THE INSTITUTION THAT CREATED IT. INTERNAL USE BY AN ORGANIZATION AND/OR PERSONAL USE BY AN INDIVIDUAL FOR NON-COMMERCIAL PURPOSES IS PERMISSIBLE. ALL OTHER USES REQUIRE THE PRIOR AUTHORIZATION OF THE COPYRIGHT OWNER.