Neuroprotective Actions of Methylene Blue and ItsDerivativesEthan Poteet1, Ali Winters1, Liang-Jun Yan1, Kyle Shufelt2, Kayla N. Green2, James W. Simpkins1, Yi Wen1,
Shao-Hua Yang1*
1 Department of Pharmacology and Neuroscience, Institute for Alzheimer’s Disease and Aging Research, University of North Texas Health Science Center at Fort Worth,
Fort Worth, Texas, United States of America, 2 Department of Chemistry, Texas Christian University, Fort Worth, Texas, United States of America
Abstract
Methylene blue (MB), the first lead chemical structure of phenothiazine and other derivatives, is commonly used indiagnostic procedures and as a treatment for methemoglobinemia. We have previously demonstrated that MB couldfunction as an alternative mitochondrial electron transfer carrier, enhance cellular oxygen consumption, and provideprotection in vitro and in rodent models of Parkinson’s disease and stroke. In the present study, we investigated thestructure-activity relationships of MB in vitro using MB and six structurally related compounds. MB reduces mitochondrialsuperoxide production via alternative electron transfer that bypasses mitochondrial complexes I-III. MB mitigates reactivefree radical production and provides neuroprotection in HT-22 cells against glutamate, IAA and rotenone toxicity. Distinctly,MB provides no protection against direct oxidative stress induced by glucose oxidase. Substitution of a side chain at MB’s10-nitrogen rendered a 1000-fold reduction of the protective potency against glutamate neurototoxicity. Compoundswithout side chains at positions 3 and 7, chlorophenothiazine and phenothiazine, have distinct redox potentials comparedto MB and are incapable of enhancing mitochondrial electron transfer, while obtaining direct antioxidant actions againstglutamate, IAA, and rotenone insults. Chlorophenothiazine exhibited direct antioxidant actions in mitochondria lysate assaycompared to MB, which required reduction by NADH and mitochondria. MB increased complex IV expression and activity,while 2-chlorphenothiazine had no effect. Our study indicated that MB could attenuate superoxide production byfunctioning as an alternative mitochondrial electron transfer carrier and as a regenerable anti-oxidant in mitochondria.
Citation: Poteet E, Winters A, Yan L-J, Shufelt K, Green KN, et al. (2012) Neuroprotective Actions of Methylene Blue and Its Derivatives. PLoS ONE 7(10): e48279.doi:10.1371/journal.pone.0048279
Editor: Rafael Linden, Universidade Federal do Rio de Janeiro, Brazil
Received June 25, 2012; Accepted September 21, 2012; Published October 31, 2012
Copyright: � 2012 Poteet et al. This is an open-access article distributed under the terms of the Creative Commons Attribution License, which permitsunrestricted use, distribution, and reproduction in any medium, provided the original author and source are credited.
Funding: This work was partly supported by National Institutes of Health grants R01NS054687 (SY), R01NS054651 (SY), and ECP is a predoctoral traineesupported by T32 AG020494. The Robert A. Welch Foundation to KG (P-1760). The funders had no role in study design, data collection and analysis, decision topublish, or preparation of the manuscript.
Competing Interests: The authors have declared that no competing interests exist.
* E-mail: [email protected]
Introduction
Neurological disorders are estimated to affect as many as 1
billion people globally [1]. The cost of dementia alone is estimated
at $100 billion annually in the United States [1]. Increased
oxidative stress has been recognized as a common theme of many
neurological disorders including Alzheimer’s disease, Parkinson’s
disease, and stroke [2,3,4]. Antioxidative strategies have been
extensively explored for the treatment of various neurological
disorders with many of the compounds demonstrating neuropro-
tection in multiple in vitro and in vivo models. However, none of the
identified antioxidants have proven to be effective for the
treatment of any neurodegenerative disease in clinical settings
[5,6,7]. It is therefore important and practical to examine
alternative strategies for reducing oxidative stress besides tradi-
tional antioxidants.
Methylene blue (MB), the very first lead chemical structure of
phenothiazine and other derivatives, has been used for diagnostic
procedures and the treatment of multiple disorders; including
methemoglobinemia, malaria, and cyanide and carbon monoxide
poisoning [8,9]. Recently, we have shown MB to be neuropro-
tective in a variety of mitochondria targeted cytotoxicity
paradigms [10]. MB retains its protective activity in in vivo models
of stroke, Parkinson’s disease, and optic neuropathy [10,11].
Importantly, MB is distinct from traditional antioxidants in that it
provides no protection against direct oxidative insult of H2O2
produced by glucose oxidase [10].
MB has long been known as an electron carrier, which is best
represented by MB’s action to increase the rate of cytochrome c
reduction in isolated mitochondria [12]. Through this shunt, MB
causes an increase in cellular oxygen consumption and a
corresponding decrease in anaerobic glycolysis in vitro and in vivo
[10,13,14]. In addition, chronic exposure to MB results in
increased activity and expression of mitochondria complex IV
[15,16]. In this study, we determined the structure-activity
relationship of MB using MB and six other derivatives: toluidine
blue O (TB), 2-chlorophenothiazine, phenothiazine, prometha-
zine, chlorpromazine, and neutral red (NR). These derivatives
comprise three major modifications of MB (Figure 1): 1) side chain
deletions at positions 3 and 7 (phenothiazine and 2-chlorophe-
nothiazine), 2) substitution of a side chain at position 10
(chlorpromazine and promethazine), 3) substitution of sulfur at
position 5 with nitrogen (neutral red). Our study demonstrated
that MB has a distinct action as an alternative mitochondrial
electron transfer carrier and a re-generable anti-oxidant in the
PLOS ONE | www.plosone.org 1 October 2012 | Volume 7 | Issue 10 | e48279
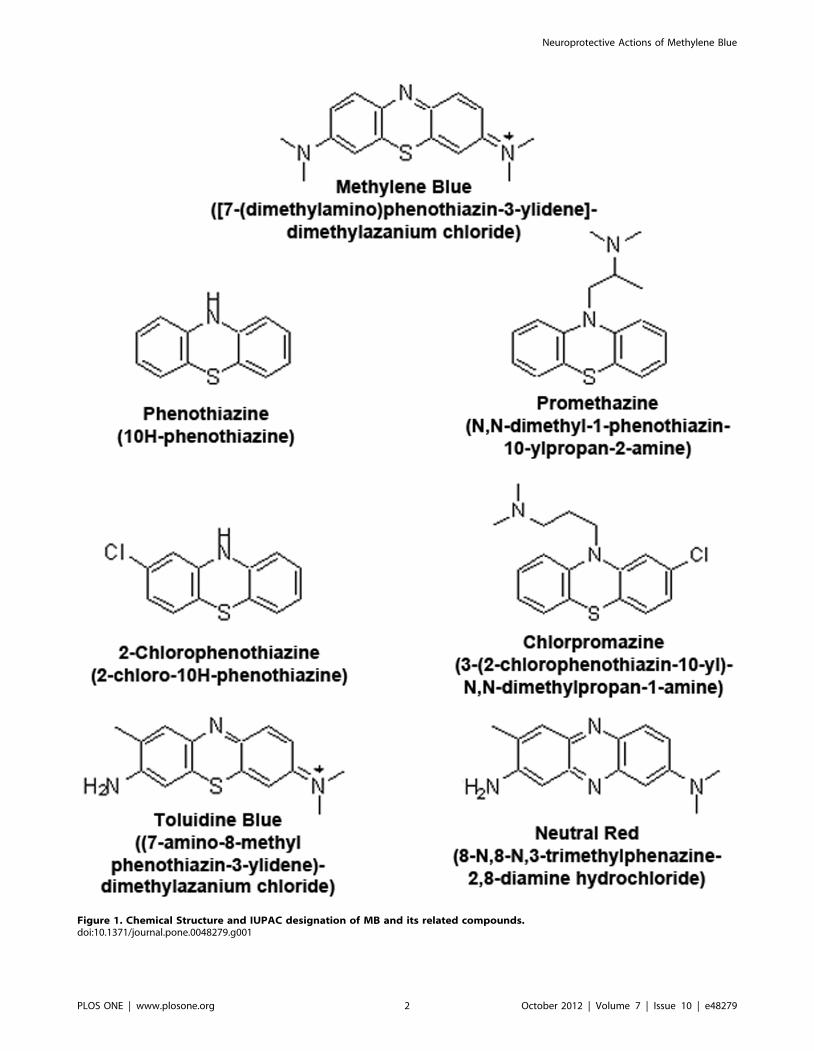
Figure 1. Chemical Structure and IUPAC designation of MB and its related compounds.doi:10.1371/journal.pone.0048279.g001
Neuroprotective Actions of Methylene Blue
PLOS ONE | www.plosone.org 2 October 2012 | Volume 7 | Issue 10 | e48279
mitochondria and hence may provide neuroprotective effects for
various neurological disorders.
Materials and Methods
Cell CultureHT-22 cells, a murine hippocampal cell line derived from the
mouse hippocampal HT-4 cell line, were the generous gift of Dr.
David Schubert (Salk Institute, San Diego, CA) [17]. Cells were
maintained in high glucose DMEM (HyClone, Logan, UT) with
1 mM pyruvate and 4 mM glutamine media supplemented with
10% FBS (Equitech Bio, Lewisville, TX), and Pen/Strep in
monolayers in 100 mm Greiner tissue culture dishes (Greiner,
Orlando, FL) at standard cell culture conditions (5% CO2, 95%
air). Medium were changed three times weekly and back cultured
at confluence (every 3–5 days). Cells were observed with a phase-
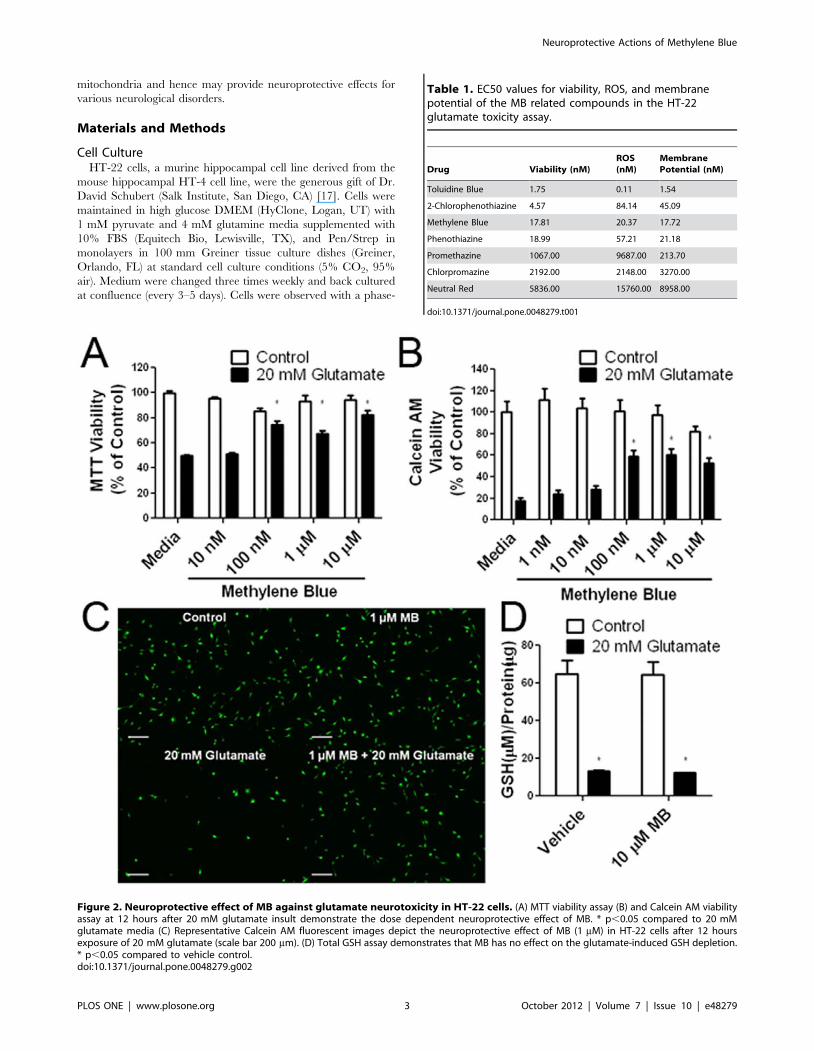
Figure 2. Neuroprotective effect of MB against glutamate neurotoxicity in HT-22 cells. (A) MTT viability assay (B) and Calcein AM viabilityassay at 12 hours after 20 mM glutamate insult demonstrate the dose dependent neuroprotective effect of MB. * p,0.05 compared to 20 mMglutamate media (C) Representative Calcein AM fluorescent images depict the neuroprotective effect of MB (1 mM) in HT-22 cells after 12 hoursexposure of 20 mM glutamate (scale bar 200 mm). (D) Total GSH assay demonstrates that MB has no effect on the glutamate-induced GSH depletion.* p,0.05 compared to vehicle control.doi:10.1371/journal.pone.0048279.g002
Table 1. EC50 values for viability, ROS, and membranepotential of the MB related compounds in the HT-22glutamate toxicity assay.
Drug Viability (nM)ROS(nM)
MembranePotential (nM)
Toluidine Blue 1.75 0.11 1.54
2-Chlorophenothiazine 4.57 84.14 45.09
Methylene Blue 17.81 20.37 17.72
Phenothiazine 18.99 57.21 21.18
Promethazine 1067.00 9687.00 213.70
Chlorpromazine 2192.00 2148.00 3270.00
Neutral Red 5836.00 15760.00 8958.00
doi:10.1371/journal.pone.0048279.t001
Neuroprotective Actions of Methylene Blue
PLOS ONE | www.plosone.org 3 October 2012 | Volume 7 | Issue 10 | e48279
contrast microscope (Zeiss Invertoskop 40uC). HT-22 cells were
used between passages 10–30.
Cell Viability AssayCell viability was determined by Calcein AM and MTT assays.
For the Calcein AM assay, HT-22 cells were seeded at a density of
3,000 cells/well and were incubated overnight in 96-well plates in
100 ml of DMEM (high glucose with 1 mM pyruvate and 10%
FBS). Varying concentrations of MB or its derivatives and 20 mM
glutamate were added to each well and incubated for 12 hours at
37uC with 5% CO2. After 12 hours, media was removed and
replaced with a 1 mM solution of Calcein AM in PBS. Cells were
incubated for 5 minutes at 37uC and fluorescence was measured
using a Tecan Infinite F200 plate reader (excitation 485 emission
530). For the MTT assay, HT-22 cells were seeded into 96-well,
flat-bottomed plates at a density of 3000 cells/well in 100 ml
DMEM (high glucose, 1 mM pyruvate, 10% FBS) and allowed to
attach overnight. Varying concentrations of drug and 20 mM
glutamate (or media for control wells) was then added to each well.
Plates were incubated for 12 hours at 37uC with 5% CO2. Plates
were removed from the incubator and 20 ml MTT (5 mg/ml in
PBS) was added per well. The plates were agitated gently to mix
the MTT into the media and then returned to the incubator for 2
hours. After 2 hours the media was removed and 100 ml of DMSO
was added to each well. The plate was mixed by gentle agitation
and the absorbance was measured (560 nm with a reference of
670 nm) with a Tecan Infinite F200 plate reader.
Rotenone Neurotoxicity AssayHT-22 cells were seeded into 96-well flat-bottomed plates at a
density of 3000 cells/well in 100 ml DMEM (high glucose, 1 mM
pyruvate, 10% FBS) and allowed to attach overnight. Varying
concentrations of MB or its derivatives and 5 mM rotenone (or
media for control wells) was then added to each well. Plates were
incubated for 24 hours at 37uC with 5% CO2. Viability was
determined by Calcein AM assay.
Glucose Oxidase Neurotoxicity AssaysHT-22 cells were seeded into 96-well flat-bottomed plates at a
density of 3000 cells/well in 100 ml DMEM (high glucose, 1 mM
pyruvate, 10% FBS) and allowed to attach overnight. Varying
concentrations of MB or its derivatives and 2 U glucose oxidase (or
media for control wells) was then added to each well. Plates were
incubated for 3 hours at 37uC with 5% CO2. Viability was
determined by Calcein AM assay.
Iodoacetic Acid (IAA) Neurotoxicity AssaysHT-22 cells were seeded into 96-well flat-bottomed plates at a
density of 3000 cells/well in 100 ml DMEM (high glucose, 1 mM
pyruvate, 10% FBS) and allowed to attach overnight. Varying
concentrations of MB or its derivatives and 20 mM IAA (or media
for control wells) was then added to each well. Plates were
incubated for 2 hours at 37uC with 5% CO2. After 2 hours, all
media was removed and replaced with fresh media containing
drugs, but not IAA. The plates were incubated an additional 22
hours at 37uC with 5% CO2. Viability was determined by Calcein
AM assay.
Mitochondria Membrane Potential AnalysisMitochondrial membrane potential was analyzed by FRET
using TMRE/NAO as described previously [18]. TMRE
quenches the NAO fluorescence under normal mitochondria
membrane potential. As the membrane potential collapses, the
TMRE fluorescence decreases, which results in an increase in
NAO fluorescence. The increased NAO fluorescence is interpret-
ed as a decrease in the mitochondria membrane potential. Cells
were incubated with glutamate and MB or related compounds for
12 hours. The media was then removed and the cells were washed
once with PBS, then incubated in PBS containing 1 mM NAO and
1 mM TMRE for 30 minutes at 37uC. The NAO/TMRE was
removed and cells were incubated for an additional 15 minutes at
37uC in KRH. Cells were washed twice in PBS and NAO
fluorescence was measured using a Tecan Infinite F200 plate
reader (excitation 485, emission 530). Raw data are represented as
RFU. The NAO fluorescence was then standardized based on
control and Calcein AM cell viability.
Mitochondrial membrane potential was also analyzed by flow
cytometry and fluorescent microscopy using JC-1 dye. For
fluorescent microscopy, HT-22 cells were plated at a density of
10,000 cells/well in a 6-well plate. Cells were incubated for 8
hours in glutamate and indicated drug. After 6 hours, media was
replaced with KRH media containing 5 mg/ml JC-1 dye. Cells
were incubated at 37uC for 15 minutes. After which time, they
were washed once with KRH and incubated an additional 10
minutes in KRH at 37uC. The media was replaced with fresh
KRH buffer and the cells imaged.
Reactive Oxygen Species AnalysisChanges in cellular ROS were measured by the ROS reactive
fluorescent indicator H2DCFDA (Anaspec) using a fluorescent
microplate reader, flow cytometry, and fluorescent microscopy.
For the microplate experiment, HT-22 cells were plated overnight
at a density of 3,000 cells/well in a 96-well plate. Cells were
incubated with drug and 20 mM glutamate for 12 hours at 37uCand 5% CO2. The media was then removed and the cells were
washed once with PBS then incubated in PBS containing 10 mM
H2DCFDA for 30 minutes at 37uC. The PBS was removed and
cells were incubated for an additional 15 minutes at 37uC in
KRH. Cells were washed twice in PBS and DCF fluorescence was
measured using a Tecan Infinite F200 plate reader (excitation 485,
emission 530). Raw data are represented as RFU. The DCF
fluorescence was then standardized based on control and Calcein
AM cell viability. For fluorescent microscopy, HT-22 cells were
plated at a density of 10,000 cells/well in a 6-well plate. Cells were
incubated for 8 hours in glutamate and indicated drug. After 8
hours, media was replaced with KRH media containing 10 mM
H2DCFDA. Cells were incubated at 37uC for 15 minutes, washed
once with KRH and incubated an additional 10 minutes in fresh
KRH at 37uC. The media was replaced with fresh KRH buffer
and the cells imaged. For flow cytometry, HT-22 cells were seeded
at a density of 50,000 cells/well in 6-well dishes (Greiner) and
attached overnight. Media was removed and replaced with fresh
DMEM (high glucose, 1 mM pyruvate, 10% FBS) containing
vehicle, 10 mM MB, 20 mM glutamate, or 10 mM MB and20 mM
glutamate. Cells were incubated for 8 hours at 37uC and 5% CO2.
Following the incubation, the media was removed, the cells were
washed once with PBS, and incubated in PBS containing 10 mM
H2DCFDA for 15 minutes at 37uC. The PBS was removed and
cells were incubated for an additional 10 minutes at 37uC in PBS.
The PBS was replaced with fresh PBS and the DCF fluorescence
was determined with a Beckman Coulter FC-500.
Glutathione AssayGlutathione was measured using the Anaspec Total GSH Assay
Kit (cat#: 72153). HT-22 cells were seeded into 10 cm plates at a
density of 2.56105 cells/plate. Cells were allowed to attach
overnight. Media was removed and replaced with fresh media
Neuroprotective Actions of Methylene Blue
PLOS ONE | www.plosone.org 4 October 2012 | Volume 7 | Issue 10 | e48279

Neuroprotective Actions of Methylene Blue
PLOS ONE | www.plosone.org 5 October 2012 | Volume 7 | Issue 10 | e48279
containing varying concentrations of drug and incubated at 37uCand 5% CO2 for 8 hours. Afterwards, the cells were trypsinized for
5 minutes, placed in 1.5 ml Eppendorf tubes, and centrifuged at
12006g for 5 minutes at 4uC. The cells were centrifuged and
washed with PBS twice more, and finally lysed with 100 ml lysis
buffer (500 mM Tricine buffer, pH 7.8, 100 mM MgSO4, 2 mM
EDTA, and 2 mM sodium azide) containing 1% Triton X-100.
For protein assays, 40 ml cell lysate was set aside. The remaining
cell lysate (60 ml), was combined in a 1:1 ratio with 2% 5-
sufosalicylic acid and centrifuged for 5 minutes at 14,0006g. 10 ml
of cell lysate was added in triplicate to a 96-well plate along with a
GSH standard curve. Prior to reading the plate, 90 ml reaction
buffer containing the following reagents; NADPH, GSH reduc-
tase, and diphenyl diselenide was added to each well. Absorbance
(415 nm) was measured using a Tecan Infinite F200 plate reader.
Protein concentration was measured simultaneously using the
Pierce 660 nm Protein Assay (660 nm absorbance).
Mitochondria Isolation and Mitochondrial ComplexActivity Assay
Rat hearts were harvested from 3-month old Sprague Dawley
rats after euthanasia following the University of North Texas
Health Science Center’s IACUC approved protocol; specifically,
rats were anesthetized with ketamine/xylazine and death induced
by decapitation (guillotine). Rat hearts were flash frozen in liquid
nitrogen and stored at 280uC until use. Hearts were thawed on
iced and were then homogenized in 10 mM phosphate buffer (pH
= 7.4) containing 300 mM sucrose, and 2 mM EDTA. The
resulting homogenate was centrifuged at 8006g and the superna-
tant collected. The supernatant was then centrifuged at 8,0006g
and the resulting pellet containing the mitochondria fraction was
re-suspended in 100 mM phosphate buffer (pH = 7.4). Mitochon-
dria were sonicated 3 times for 30 seconds on low power to break
apart mitochondria membranes and expose the individual
complexes of the electron transport chain. For complex I/III
assay, mitochondria membrane fractions were added to 50 mM
phosphate buffer (pH = 7.4) containing 2 mM MgCl2, 2 mM
KCN, 80 mM oxidized cytochrome c, and 4 mM NADH. Changes
in absorbance at 550 nm were monitored with a spectrophotom-
eter. The addition of 2 mg/ml rotenone was used to inhibit
complex I activity. For complex II/III assay, mitochondria
membrane fractions were added to 50 mM phosphate buffer
(pH = 7.4) containing 20 mM succinate, 500 mM EDTA, 2 mM
KCN, 30 mM oxidized cytochrome c, and 2 mg/ml rotenone.
Changes in absorbance at 550 nm were monitored with a
spectrophotometer. The addition of 2 mg/ml antimycin was used
to inhibit complex III activity.
Cyclic Voltammetry (Redox Potential Analysis)Cyclic voltammograms were acquired at room temperature
using a BASiC3 potentiostat equipped with a 3.0 mm glassy
carbon working electrode, a platinum wire auxiliary electrode, and
Ag/AgNO3 reference electrode. Measurements were performed
under a blanket of nitrogen in acetonitrile with [Et4N][BF4]
(0.1 M) as supporting electrolyte at a scan rate of 100 mV/s.
Analyte concentration was kept constant at 10 mg of sample in
10 ml of solution. Ferrocene was used as an internal standard and
reported relative to NHE (Fc/Fc+ = 692 mV vs. NHE).
Cellular Bioenergetics AssayHT-22 cells were plated at a density of 5000/well in an XF24
plate. Cells attached overnight and the media was exchanged 1
hour prior to the assay for XF24 media. Rotenone (100 nM),
carbonyl cyanide-p- FCCP (300 nM), and oligomycin (1 mg/ml)
were diluted into XF24 media and loaded into the accompanying
cartridge. Injections of the drugs into the medium occurred at the
time points specified. Oxygen consumption was monitored using a
Seahorse Bioscience XF24 Extracellular Flux Analyzer.
Mitochondria Lysate Oxidation AssayFour compounds (MB, NR, 2-chlorophenothiazine, and chlor-
promazine) were assayed in 10 mM phosphate buffer (pH = 7.4)
with 500 mM H2O2, 10 mM DCF and in the presence or absence
of 165 mM NADH and mitochondria lysate (19.4 mg/ml). Assay
took place in Greiner 96-well black plates for 30 minutes at 37uC,
at which time the DCF fluorescence was measured with a Tecan
Infinite F200 plate reader (excitation 485, emission 530).
Western BlotHT-22 cells were plated at a density of 150000/well in a 6-well
plate. Cells attached overnight and either MB or 2-chlorophe-
nothiazine was added to the cells the following day at the indicated
concentrations. Cells were grown for 3 days and lysed in
radioimmunoprecipitation assay (RIPA) buffer with protease and
phosphatase inhibitors. Cell lysate was loaded onto a 10%
polyacrylamide gel and transferred onto nitrocellulose. Nitrocel-
lulose was incubated with primary antibody overnight at 4uC at
the indicated concentrations (Cox1, Invitrogen, 1:500; Actin,
Santa Cruz Biotechnology, 1:3000). Secondary antibody linked to
horseradish peroxidase (Jackson Immunoresearch) was incubated
for 2 hours at room temperature (1:2000 dilution). Chemilumi-
nescence was detected with a UVP Biospectrum 500.
Mitochondrial Complex IV Activity Analysis by Blue-native PAGE
Complex IV activity was analyzed by an in-gel method as
previously described [19]. Briefly, after separation of complex IV
from other mitochondrial complexes by blue native gel electro-
phoresis, gel strips were incubated in 50 ml potassium phosphate
buffer (50 mM, pH 7.0) containing 20 mg of 3,39-diaminobenzi-
dine tetrachloride (DAB) and 50 mg of cytochrome c. When a
clear activity-containing band could be visualized, the staining was
stopped by transferring the gel strips to a solution containing 8%
acetic acid and 10% method. Gel image was documented by an
Epson Perfection 1670 scanner.
Figure 3. Effect of MB on ROS production and mitochondrial membrane potential depolarization induced by glutamate in HT-22cells. (A) DCF microplate reader assay depicts that a significant increase of ROS was induced by a 12 hour exposure to 20 mM glutamate, which wasdose dependently attenuated MB. (B) TMRE/NAO plate reader assay depicts a significant mitochondria membrane potential depolarization inducedby glutamate insult, which was dose dependently attenuated by MB. (C) Representative DCF flow cytometry assay depicts increase of ROS induced by8 hour exposure of 10 mM glutamate which was attenuated by 10 mM MB. (D) Representative images of DCF fluorescence demonstrated increasedcellular ROS after 8 hours exposure to 20 mM glutamate. DCF fluorescence was reduced with co-treatment of 1 mM MB (scale bar 50 mm). (E)Representative images of JC-1 fluorescence indicate mitochondria membrane potential collapse after an 8 hour exposure to 20 mM glutamate, whichwas attenuated by co-treatment of 1 mM MB (scale bar 50 mm). * p,0.05 compared to 20 mM glutamate media.doi:10.1371/journal.pone.0048279.g003
Neuroprotective Actions of Methylene Blue
PLOS ONE | www.plosone.org 6 October 2012 | Volume 7 | Issue 10 | e48279
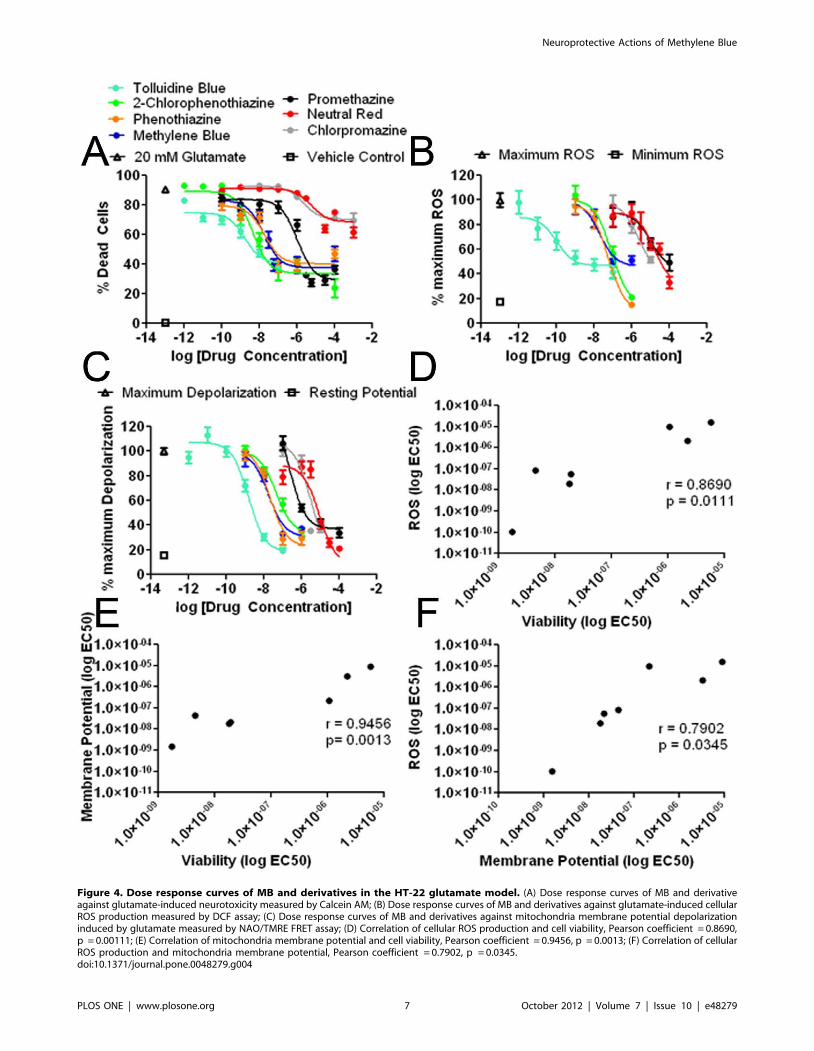
Figure 4. Dose response curves of MB and derivatives in the HT-22 glutamate model. (A) Dose response curves of MB and derivativeagainst glutamate-induced neurotoxicity measured by Calcein AM; (B) Dose response curves of MB and derivatives against glutamate-induced cellularROS production measured by DCF assay; (C) Dose response curves of MB and derivatives against mitochondria membrane potential depolarizationinduced by glutamate measured by NAO/TMRE FRET assay; (D) Correlation of cellular ROS production and cell viability, Pearson coefficient = 0.8690,p = 0.00111; (E) Correlation of mitochondria membrane potential and cell viability, Pearson coefficient = 0.9456, p = 0.0013; (F) Correlation of cellularROS production and mitochondria membrane potential, Pearson coefficient = 0.7902, p = 0.0345.doi:10.1371/journal.pone.0048279.g004
Neuroprotective Actions of Methylene Blue
PLOS ONE | www.plosone.org 7 October 2012 | Volume 7 | Issue 10 | e48279
Statistic AnalysisAll data were presented as mean +/2 S.E.M. The significance
of differences among groups with one independent variable was
determined by one-way ANOVA with a Tukey’s multiple-
comparisons test for planned comparisons between groups when
significance was detected. The significance of differences among
groups where two independent variables presented were deter-
mined by two-way ANOVA with a Bonferronni Post test for
planned comparisons between groups when significance was
detected. For all tests, p,0.05 was considered significant.
Results
Effects of MB and its Derivatives Against Oxidative InsultsThe protective action of MB was initially characterized in HT-
22 cells using a glutamate neurotoxicity model. In HT-22 cells,
glutamate blocks the glutamate/cysteine antiporter with saturating
concentrations of extracellular glutamate, resulting in depletion of
cellular glutathione [20,21]. In both Calcein AM and MTT assays,
MB provided protection in HT-22 cells with an EC50 of
17.81 nM (Figure 2A, B and C, Table 1) without any effect on
the glutathione levels (Figure 2D).
To measure the effect of MB on mitigating ROS generation
induced by glutamate insult in HT-22 cells, we employed the
fluorescent indicator H2DCFDA, which is converted into DCF by
ROS. In the plate reader assay, glutamate caused a significant
increase in DCF fluorescence, which was attenuated by MB with
an EC50 of 20.37 nM (Figure 3A, Table 1). The inhibitory action
of MB on ROS production in HT-22 cells was verified using flow
cytometry and fluorescent microscopy. MB decreased ROS
production measured as total cellular ROS by flow cytometry
(Figure 3C). Fluorescent microscopy demonstrated that glutamate
exposure increased cellular ROS production which was attenuated
by treatment of MB (Figure 3D).
High levels of ROS in the mitochondria affect the mitochondria
membrane potential, causing loss of the proton gradient and
membrane depolarization. A plate reader assay based on the
FRET between NAO and TMRE was run in parallel with a cell
viability assay to measure the effect of MB on mitochondria
membrane potential depolarization induced by glutamate in HT-
22 cells. A 12-hour incubation of HT-22 cells with 20 mM
glutamate caused a decrease in mitochondria membrane potential,
evidenced by an increase in NAO fluorescence, which was
attenuated by the treatment of MB with an EC50 of 17.72 nM
(Figure 3B, Table 1). We further verified the protective action of
MB on mitochondrial membrane potential using JC-1 with
fluorescent microscopy. A decrease in the JC-1 polymer and
increase in the JC-1 monomer were observed by microscopy after
an 8-hour glutamate exposure, which was greatly attenuated with
MB treatment (Figure 3E).
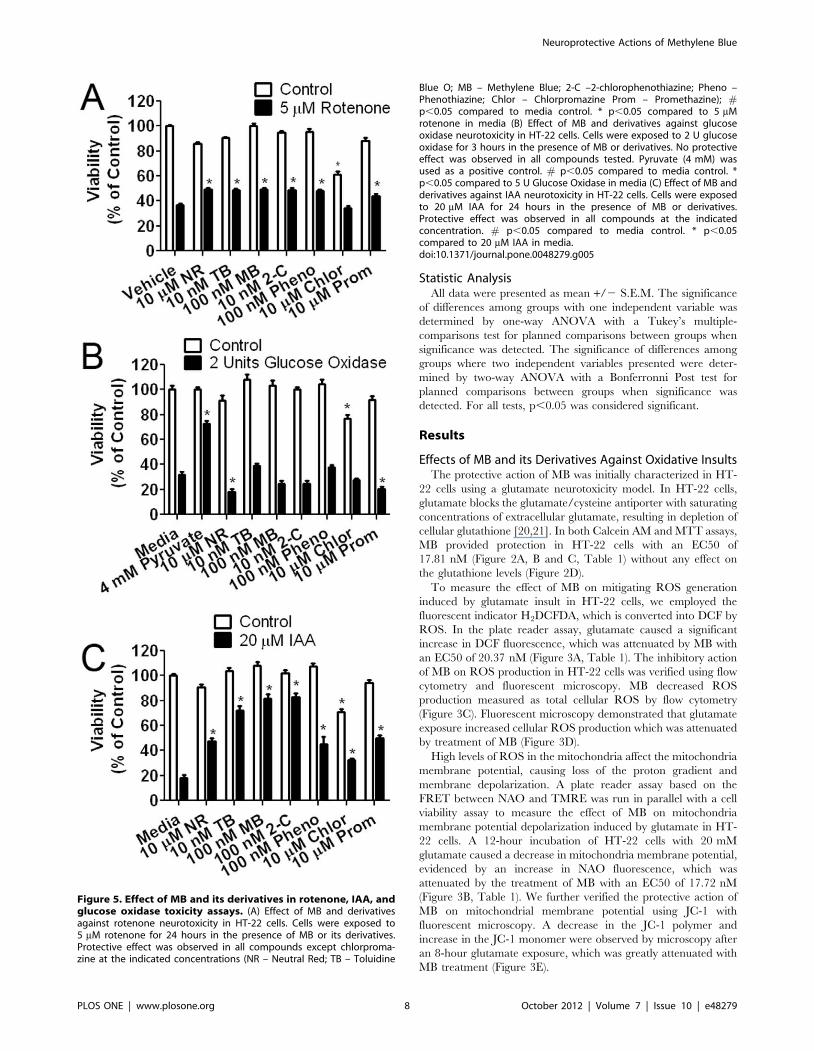
Figure 5. Effect of MB and its derivatives in rotenone, IAA, andglucose oxidase toxicity assays. (A) Effect of MB and derivativesagainst rotenone neurotoxicity in HT-22 cells. Cells were exposed to5 mM rotenone for 24 hours in the presence of MB or its derivatives.Protective effect was observed in all compounds except chlorproma-zine at the indicated concentrations (NR – Neutral Red; TB – Toluidine
Blue O; MB – Methylene Blue; 2-C –2-chlorophenothiazine; Pheno –Phenothiazine; Chlor – Chlorpromazine Prom – Promethazine); #p,0.05 compared to media control. * p,0.05 compared to 5 mMrotenone in media (B) Effect of MB and derivatives against glucoseoxidase neurotoxicity in HT-22 cells. Cells were exposed to 2 U glucoseoxidase for 3 hours in the presence of MB or derivatives. No protectiveeffect was observed in all compounds tested. Pyruvate (4 mM) wasused as a positive control. # p,0.05 compared to media control. *p,0.05 compared to 5 U Glucose Oxidase in media (C) Effect of MB andderivatives against IAA neurotoxicity in HT-22 cells. Cells were exposedto 20 mM IAA for 24 hours in the presence of MB or derivatives.Protective effect was observed in all compounds at the indicatedconcentration. # p,0.05 compared to media control. * p,0.05compared to 20 mM IAA in media.doi:10.1371/journal.pone.0048279.g005
Neuroprotective Actions of Methylene Blue
PLOS ONE | www.plosone.org 8 October 2012 | Volume 7 | Issue 10 | e48279
We tested MB’s protective action in the rotenone and IAA
neurotoxicity models in HT-22 cells. Rotenone reduces oxidative
phosphorylation and generates excess ROS by inhibiting mito-
chondria complex I (NADH oxidase) [22]. HT-22 cells were
incubated for 24 hours in media containing 5 mM rotenone and
MB ranging in concentration from 1 nM to 10 mM. MB increased
cell viability in rotenone treated cells at concentrations of 10 nM,
100 nM, 1 mM, and 10 mM compared to rotenone control (Figure
S1A).
IAA is a toxic derivative of acetic acid that inhibits glyceral-
dehyde 3-phosphate dehydrogenase and disrupts disulfide bonds
causing an increase in ROS and lipid peroxidation [23,24,25,26].
MB protected against IAA induced neurotoxicity at concentrations
of 100 nM and 1 mM, but lost its protective effect at 10 mM
(Figure S2A).
To determine the effect of MB in mitigating extracellular H2O2
insult, 2 U of glucose oxidase was added to the media of HT-22
cells. The HT-22 glucose oxidase model is defined by generation
of extracellular H2O2 from glucose, where antioxidants, such as
pyruvate, are highly effective [27,28,29]. Glucose oxidase induced
80% cell death after 3 hours of exposure which was not attenuated
by MB at concentrations between 10 nM and 10 mM (Figure S3).
Pyruvate, as a positive antioxidant control, provided protection
against 2 U of glucose oxidase at a concentration of 4 mM.
To determine the structure-activity relationships of MB’s
neuroprotective action, we selected six commercially available
compounds and compared their effects to MB in HT-22 cells.
These compounds exhibited a wide range of potencies in HT-22
cells against glutamate insult (Figure 4A). Three of the compounds
showed a similar protective profile to that of MB with EC50s of
18.99, 4.57, and 1.75 nM for phenothiazine, 2-chlorophenothia-
zine, and TB, respectively. The two compounds with side chains
on their heterocyclic nitrogen, exhibited much lower potencies as
compared to the compounds with free nitrogen groups with EC50s
against glutamate neurotoxicity of 1067 and 2192 nM for
promethazine and chlorpromazine, respectively. Replacement of
the heterocyclic sulfur with nitrogen attenuated the protective
action of NR compared to TB against glutamate neurotoxicity
(Figure 4A, Table 1).
We determined the structure-activity relationships of MB and its
derivatives on ROS production induced by glutamate in HT-22
cells. To measure intracellular ROS, we employed a 96-well assay
format and measured DCF fluorescence in parallel with a cell
viability assay after a 12-hour incubation of 20 mM glutamate.
Glutamate caused a significant increase in ROS in HT-22 cells
after 12 hours, which was significantly reduced by phenothiazine
and 2-chlorophenothiazine with EC50s of 57.21 and 84.14 nM,
respectively (Figure 4B, Table 1). TB, again the most potent of the
tested compounds, significantly attenuated ROS production
induced by glutamate with an EC50 of 0.11 nM (Figure 4C,
Table 1). Consistent with the cell viability study, the two
compounds with side chains on their 10 nitrogen, chlorpromazine
and promethazine, exhibited significantly lower potencies against
ROS generation with EC50s of 2148 and 9687 nM, respectively
(Figure 4C, Table 1). Similarly, NR also displayed lower potency
against ROS production as compared with TB, MB, phenothia-
zine, and 2-chlorophenothiazine.
We further determined the structure-activity relationships of
MB and its derivatives on glutamate induced mitochondria
membrane potential depolarization in HT-22 cells. As indicated
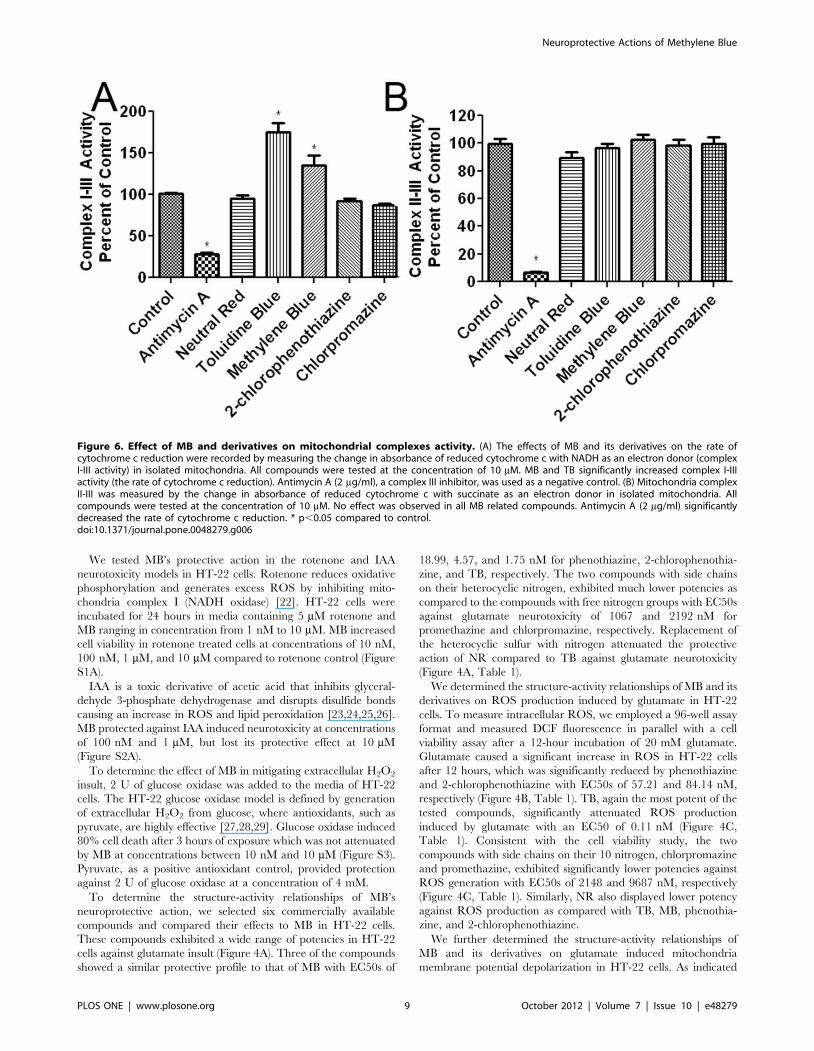
Figure 6. Effect of MB and derivatives on mitochondrial complexes activity. (A) The effects of MB and its derivatives on the rate ofcytochrome c reduction were recorded by measuring the change in absorbance of reduced cytochrome c with NADH as an electron donor (complexI-III activity) in isolated mitochondria. All compounds were tested at the concentration of 10 mM. MB and TB significantly increased complex I-IIIactivity (the rate of cytochrome c reduction). Antimycin A (2 mg/ml), a complex III inhibitor, was used as a negative control. (B) Mitochondria complexII-III was measured by the change in absorbance of reduced cytochrome c with succinate as an electron donor in isolated mitochondria. Allcompounds were tested at the concentration of 10 mM. No effect was observed in all MB related compounds. Antimycin A (2 mg/ml) significantlydecreased the rate of cytochrome c reduction. * p,0.05 compared to control.doi:10.1371/journal.pone.0048279.g006
Neuroprotective Actions of Methylene Blue
PLOS ONE | www.plosone.org 9 October 2012 | Volume 7 | Issue 10 | e48279
Neuroprotective Actions of Methylene Blue
PLOS ONE | www.plosone.org 10 October 2012 | Volume 7 | Issue 10 | e48279
by the NAO/TMRE FRET assay, a 12-hour incubation with
20 mM glutamate caused mitochondria membrane potential
depolarization which was mitigated by TB, MB, phenothiazine,
and 2-chlorophenothiazine with the EC50s of 1.54, 17.72, 21.18,
and 45.09 nM respectively. Consistent with the cell viability and
ROS production assays, promethazine, chlorpromazine, and NR
had much lower potencies as compared to TB, MB, phenothia-
zine, and 2-chlorophenothiazine (Figure 4C, Table 1).
Our further analysis indicated significant correlation between
the EC50s for the effect of MB and its derivatives on ROS
production and their neuroprotective action (Figure 4D). Similar-
ly, significant correlation was also found between the action of MB
and its derivatives on neuroprotection and mitochondria mem-
brane potential (Figure 4E) and between the EC50 of MB and its
derivatives on ROS production and mitochondria membrane
potential collapse induced by glutamate insult (Figure 4F).
MB and its derivatives were screened at concentrations between
10 nM to 10 mM in the rotenone, IAA, and glucose oxidase
neurotoxicity models in HT-22 cells. For the purpose of
conciseness, the concentration displayed for each compound in
the rotenone, IAA, and glucose oxidase assays is based on the
EC50 value calculated from the glutamate assay. All the tested
compounds except for chlorpromazine were protective in the
rotenone model of cellular toxicity (Figure 5A). For the glucose
oxidase insult, pyruvate provided robust protection as a positive
antioxidant as predicted. On the other hand, none of the MB
related compounds exhibited any protection (Figure 5B). All of the
MB related compounds were efficacious in the IAA neurotoxicity
assay (Figure 5C). In addition, MB and 2-chlorophenothiazine had
increased efficacy compared to chlorpromazine and NR (Figure
S2).
Effects of MB and Derivatives on MitochondriaWe determined the effect of MB and its derivatives on the
activity of mitochondria complexes I-III (NADH oxidase and
cytochrome c reductase, respectively) and complexes II-III
(succinate dehydrogenase and cytochrome c reductase, respective-
ly). Both assays rely on measuring the rate of cytochrome c
reduction in terms of changes in cytochrome c absorbance, which
is typically reduced by complex III. In the complex I-III assay,
with NADH as the electron donor, MB and TB significantly
increased the rate of cytochrome c reduction, while no effect was
found in the other tested compounds (Figure 6A). To verify that
the negative compounds were incapable of increasing the rate of
cytochrome c reduction the concentrations of 1 mM and 100 mM
were also tested, yielding negative results (data not shown).
Antimycin A, a complex III inhibitor, significantly reduced the
rate of cytochrome c reduction. For the complex II-III assay using
succinate as the electron donor, no effect was observed in all the
tested compounds (Figure 6B). As predicted, antimycin A
significantly inhibited complex II-III activity.
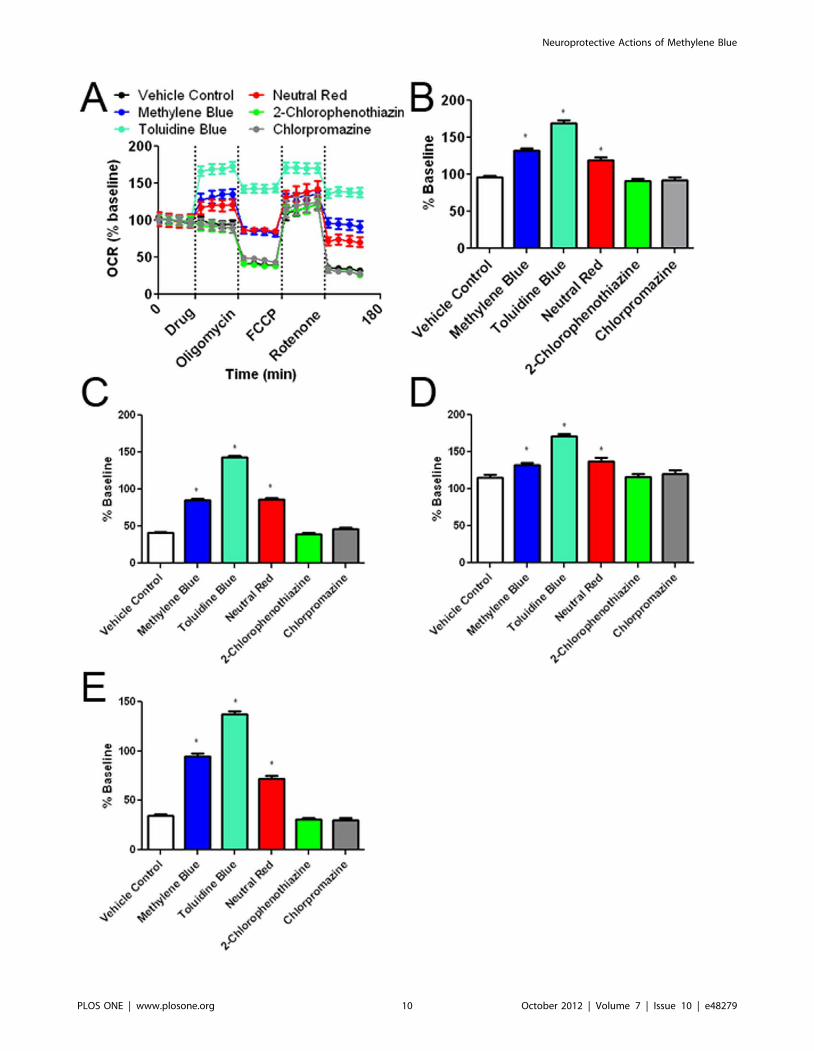
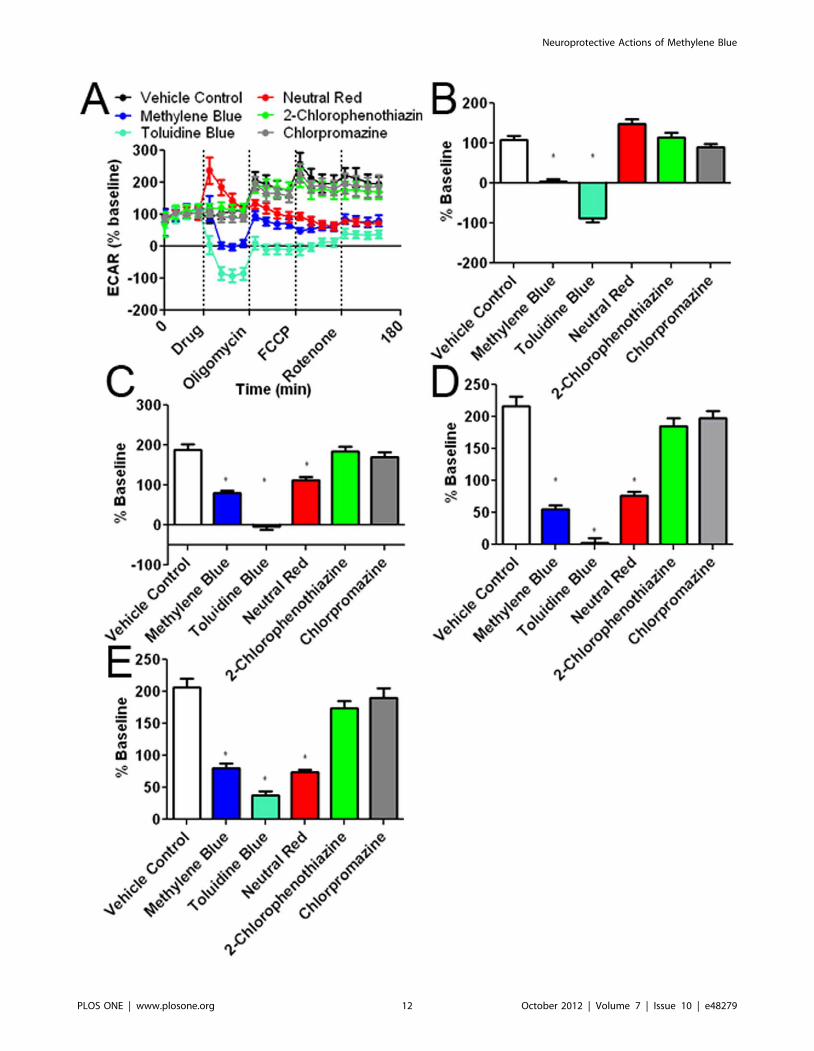
We determined the effect of MB and its derivatives on cellular
oxygen consumption rate (OCR) and extracellular acidification
rate (ECAR) using a Seahorse XF24 Flux Analyzer. OCR and
ECAR were measured under five conditions. The first set of
measurements established a baseline for 35 minutes followed by
injection of media containing MB or each of its derivatives. Upon
injection, NR, MB and TB increased OCR, while 2-chlorophe-
nothiazine and chlorpromazine had no effect on the OCR
(Figure 7A, C). Cells received sequent treatment of oligomycin (an
ATP synthase inhibitor), FCCP (mitochondrial uncoupler), and
rotenone (complex I inhibitor). As predicted, oligomycin caused a
decrease in OCR, FCCP maximized cellular OCR, and rotenone
reduced OCR. At each condition, TB, NR, and MB treatment
significantly enhanced OCR compared to control (Figure 7A, D,
E). As a control, we tested MB in the absence of cells and
determined that MB had no effect on oxygen consumption
without the presence of cells (Figure S4C).
Changes in cellular oxygen consumption are often mirrored by
opposing changes in lactate production [30]. Changes in lactate
production are measured by ECAR. MB and TB had corre-
sponding decreases in ECAR compared to controls (Figure 8A, B,
C, D and E). Again, in the absence of cells, MB did not affect
ECAR other than an initial spike, which is a slight change of pH
caused by MB itself (Figure S4D). NR initially increased ECAR,
but ECAR subsequently reduced, reaching a similar level as that of
MB (Figure 8A, C, D, and E). To verify that NR was not directly
affecting the pH of the media, the experiment was repeated in
10 mM HEPES buffer; however, NR continued to increase ECAR
upon initial injection (data not shown).
We determined the redox potential of MB and its derivatives
and standardized them to a normal hydrogen electrode (NHE).
Our analysis indicated that MB, NR and TB have distinct redox
potential from the other derivatives (Table 2). Interestingly, these 3
compounds have similar action on cellular oxygen consumption.
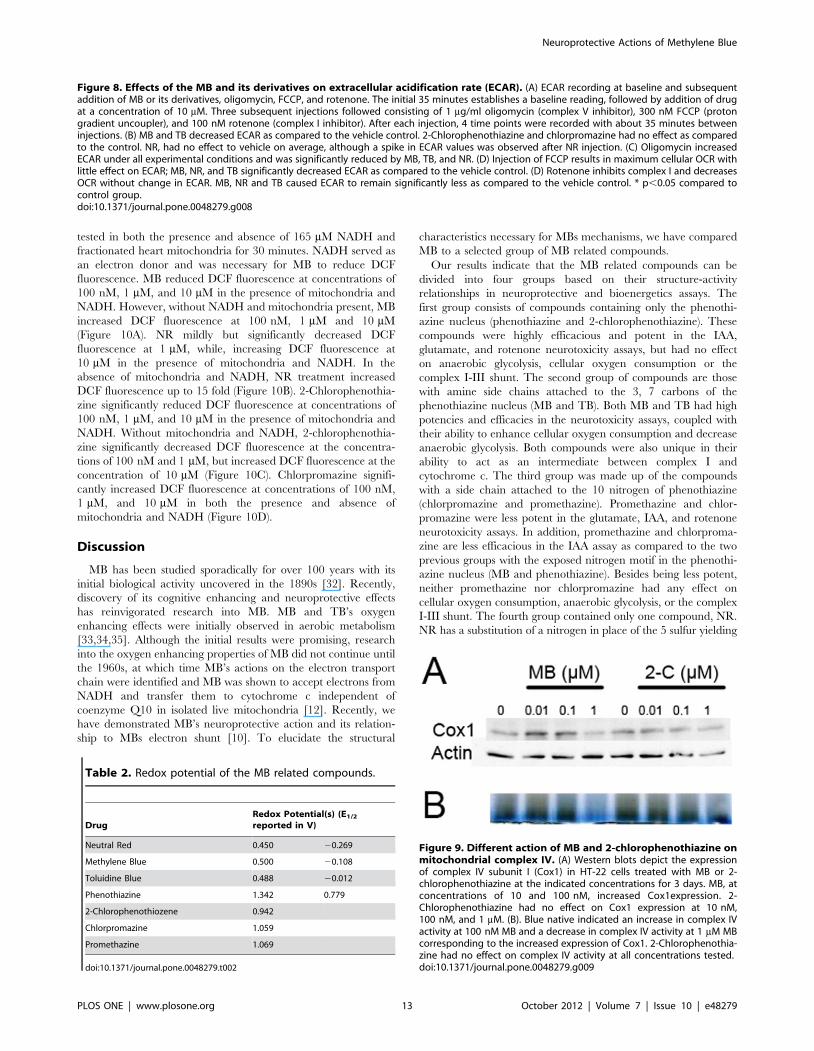
Action of MB and 2-Chlorophenothiazine onMitochondria Complex IV
We compared the effect of MB and 2-chlorophenothiazine on
the expression of mitochondria complex IV subunit I (Cox1).
Previous studies have reported that MB increases the activity of
complex IV as well as the expression of subunit II of complex IV,
coded by mitochondrial DNA [14,15,31]. Our data indicates a
clear increase in Cox1 expression upon MB treatment at 10 and
100 nM, but not 1 mM (Figure 9A), a similar result has been
reported previously [15]. On the other hand, no effect on Cox 1
expression was observed upon the treatment of 2-chlorophe-
nothiazine. Consistently, MB, but not 2-chlorophenothiazine,
treatment increases complex IV activity indicated by the in-gel
activity staining (Figure 9B).
Action of MB and Derivatives as ROS ScavengersThe action of MB and its derivatives as ROS scavengers was
determined by a cell-free mitochondria lysate oxidation assay. We
combined 500 mM H2O2 and 10 mM H2DCFDA in phosphate
buffer with the addition of each MB related compound ranging in
concentration between 10 nM and 10 mM. Each compound was
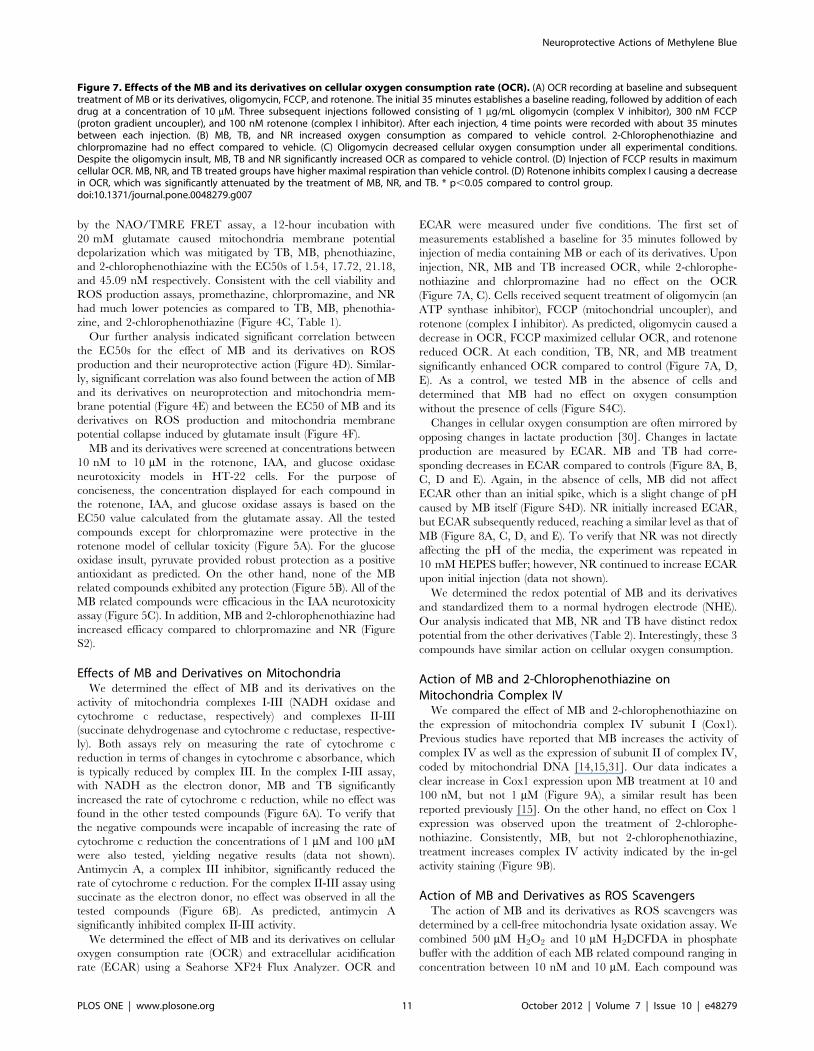
Figure 7. Effects of the MB and its derivatives on cellular oxygen consumption rate (OCR). (A) OCR recording at baseline and subsequenttreatment of MB or its derivatives, oligomycin, FCCP, and rotenone. The initial 35 minutes establishes a baseline reading, followed by addition of eachdrug at a concentration of 10 mM. Three subsequent injections followed consisting of 1 mg/mL oligomycin (complex V inhibitor), 300 nM FCCP(proton gradient uncoupler), and 100 nM rotenone (complex I inhibitor). After each injection, 4 time points were recorded with about 35 minutesbetween each injection. (B) MB, TB, and NR increased oxygen consumption as compared to vehicle control. 2-Chlorophenothiazine andchlorpromazine had no effect compared to vehicle. (C) Oligomycin decreased cellular oxygen consumption under all experimental conditions.Despite the oligomycin insult, MB, TB and NR significantly increased OCR as compared to vehicle control. (D) Injection of FCCP results in maximumcellular OCR. MB, NR, and TB treated groups have higher maximal respiration than vehicle control. (D) Rotenone inhibits complex I causing a decreasein OCR, which was significantly attenuated by the treatment of MB, NR, and TB. * p,0.05 compared to control group.doi:10.1371/journal.pone.0048279.g007
Neuroprotective Actions of Methylene Blue
PLOS ONE | www.plosone.org 11 October 2012 | Volume 7 | Issue 10 | e48279
Neuroprotective Actions of Methylene Blue
PLOS ONE | www.plosone.org 12 October 2012 | Volume 7 | Issue 10 | e48279
tested in both the presence and absence of 165 mM NADH and
fractionated heart mitochondria for 30 minutes. NADH served as
an electron donor and was necessary for MB to reduce DCF
fluorescence. MB reduced DCF fluorescence at concentrations of
100 nM, 1 mM, and 10 mM in the presence of mitochondria and
NADH. However, without NADH and mitochondria present, MB
increased DCF fluorescence at 100 nM, 1 mM and 10 mM
(Figure 10A). NR mildly but significantly decreased DCF
fluorescence at 1 mM, while, increasing DCF fluorescence at
10 mM in the presence of mitochondria and NADH. In the
absence of mitochondria and NADH, NR treatment increased
DCF fluorescence up to 15 fold (Figure 10B). 2-Chlorophenothia-
zine significantly reduced DCF fluorescence at concentrations of
100 nM, 1 mM, and 10 mM in the presence of mitochondria and
NADH. Without mitochondria and NADH, 2-chlorophenothia-
zine significantly decreased DCF fluorescence at the concentra-
tions of 100 nM and 1 mM, but increased DCF fluorescence at the
concentration of 10 mM (Figure 10C). Chlorpromazine signifi-
cantly increased DCF fluorescence at concentrations of 100 nM,
1 mM, and 10 mM in both the presence and absence of
mitochondria and NADH (Figure 10D).
Discussion
MB has been studied sporadically for over 100 years with its
initial biological activity uncovered in the 1890s [32]. Recently,
discovery of its cognitive enhancing and neuroprotective effects
has reinvigorated research into MB. MB and TB’s oxygen
enhancing effects were initially observed in aerobic metabolism
[33,34,35]. Although the initial results were promising, research
into the oxygen enhancing properties of MB did not continue until
the 1960s, at which time MB’s actions on the electron transport
chain were identified and MB was shown to accept electrons from
NADH and transfer them to cytochrome c independent of
coenzyme Q10 in isolated live mitochondria [12]. Recently, we
have demonstrated MB’s neuroprotective action and its relation-
ship to MBs electron shunt [10]. To elucidate the structural
characteristics necessary for MBs mechanisms, we have compared
MB to a selected group of MB related compounds.
Our results indicate that the MB related compounds can be
divided into four groups based on their structure-activity
relationships in neuroprotective and bioenergetics assays. The
first group consists of compounds containing only the phenothi-
azine nucleus (phenothiazine and 2-chlorophenothiazine). These
compounds were highly efficacious and potent in the IAA,
glutamate, and rotenone neurotoxicity assays, but had no effect
on anaerobic glycolysis, cellular oxygen consumption or the
complex I-III shunt. The second group of compounds are those
with amine side chains attached to the 3, 7 carbons of the
phenothiazine nucleus (MB and TB). Both MB and TB had high
potencies and efficacies in the neurotoxicity assays, coupled with
their ability to enhance cellular oxygen consumption and decrease
anaerobic glycolysis. Both compounds were also unique in their
ability to act as an intermediate between complex I and
cytochrome c. The third group was made up of the compounds
with a side chain attached to the 10 nitrogen of phenothiazine
(chlorpromazine and promethazine). Promethazine and chlor-
promazine were less potent in the glutamate, IAA, and rotenone
neurotoxicity assays. In addition, promethazine and chlorproma-
zine are less efficacious in the IAA assay as compared to the two
previous groups with the exposed nitrogen motif in the phenothi-
azine nucleus (MB and phenothiazine). Besides being less potent,
neither promethazine nor chlorpromazine had any effect on
cellular oxygen consumption, anaerobic glycolysis, or the complex
I-III shunt. The fourth group contained only one compound, NR.
NR has a substitution of a nitrogen in place of the 5 sulfur yielding
Figure 8. Effects of the MB and its derivatives on extracellular acidification rate (ECAR). (A) ECAR recording at baseline and subsequentaddition of MB or its derivatives, oligomycin, FCCP, and rotenone. The initial 35 minutes establishes a baseline reading, followed by addition of drugat a concentration of 10 mM. Three subsequent injections followed consisting of 1 mg/ml oligomycin (complex V inhibitor), 300 nM FCCP (protongradient uncoupler), and 100 nM rotenone (complex I inhibitor). After each injection, 4 time points were recorded with about 35 minutes betweeninjections. (B) MB and TB decreased ECAR as compared to the vehicle control. 2-Chlorophenothiazine and chlorpromazine had no effect as comparedto the control. NR, had no effect to vehicle on average, although a spike in ECAR values was observed after NR injection. (C) Oligomycin increasedECAR under all experimental conditions and was significantly reduced by MB, TB, and NR. (D) Injection of FCCP results in maximum cellular OCR withlittle effect on ECAR; MB, NR, and TB significantly decreased ECAR as compared to the vehicle control. (D) Rotenone inhibits complex I and decreasesOCR without change in ECAR. MB, NR and TB caused ECAR to remain significantly less as compared to the vehicle control. * p,0.05 compared tocontrol group.doi:10.1371/journal.pone.0048279.g008
Table 2. Redox potential of the MB related compounds.
DrugRedox Potential(s) (E1/2
reported in V)
Neutral Red 0.450 20.269
Methylene Blue 0.500 20.108
Toluidine Blue 0.488 20.012
Phenothiazine 1.342 0.779
2-Chlorophenothiozene 0.942
Chlorpromazine 1.059
Promethazine 1.069
doi:10.1371/journal.pone.0048279.t002
Figure 9. Different action of MB and 2-chlorophenothiazine onmitochondrial complex IV. (A) Western blots depict the expressionof complex IV subunit I (Cox1) in HT-22 cells treated with MB or 2-chlorophenothiazine at the indicated concentrations for 3 days. MB, atconcentrations of 10 and 100 nM, increased Cox1expression. 2-Chlorophenothiazine had no effect on Cox1 expression at 10 nM,100 nM, and 1 mM. (B). Blue native indicated an increase in complex IVactivity at 100 nM MB and a decrease in complex IV activity at 1 mM MBcorresponding to the increased expression of Cox1. 2-Chlorophenothia-zine had no effect on complex IV activity at all concentrations tested.doi:10.1371/journal.pone.0048279.g009
Neuroprotective Actions of Methylene Blue
PLOS ONE | www.plosone.org 13 October 2012 | Volume 7 | Issue 10 | e48279
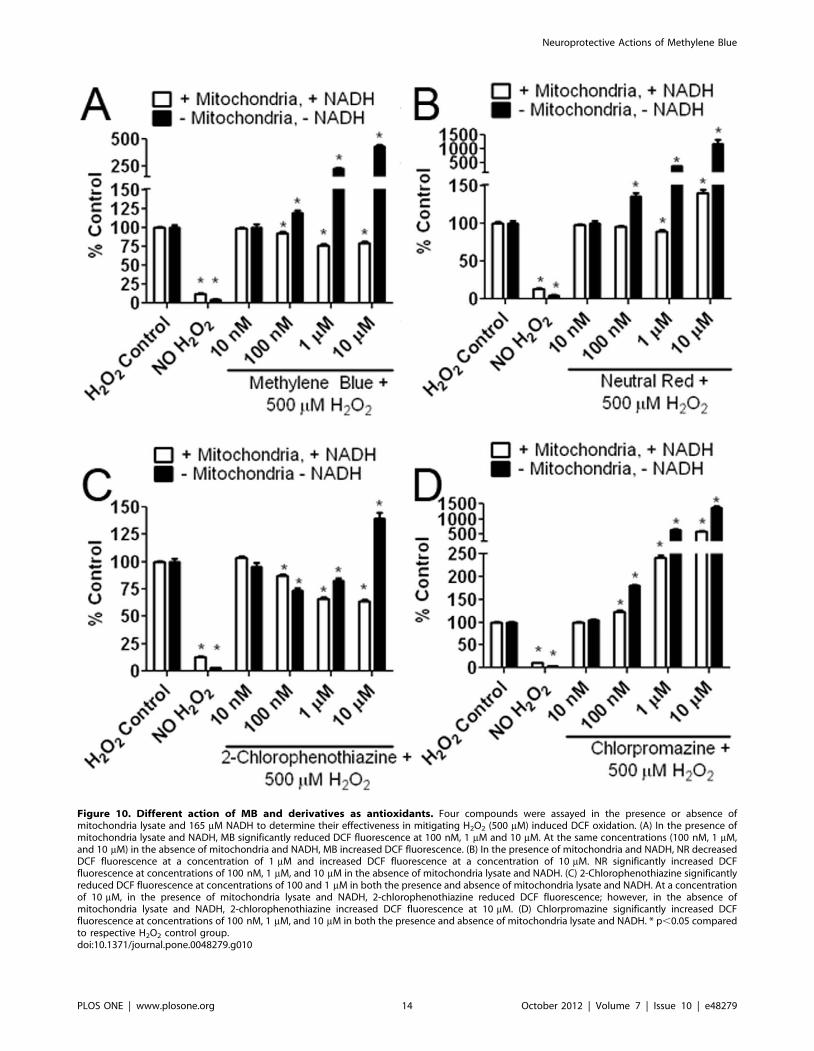
Figure 10. Different action of MB and derivatives as antioxidants. Four compounds were assayed in the presence or absence ofmitochondria lysate and 165 mM NADH to determine their effectiveness in mitigating H2O2 (500 mM) induced DCF oxidation. (A) In the presence ofmitochondria lysate and NADH, MB significantly reduced DCF fluorescence at 100 nM, 1 mM and 10 mM. At the same concentrations (100 nM, 1 mM,and 10 mM) in the absence of mitochondria and NADH, MB increased DCF fluorescence. (B) In the presence of mitochondria and NADH, NR decreasedDCF fluorescence at a concentration of 1 mM and increased DCF fluorescence at a concentration of 10 mM. NR significantly increased DCFfluorescence at concentrations of 100 nM, 1 mM, and 10 mM in the absence of mitochondria lysate and NADH. (C) 2-Chlorophenothiazine significantlyreduced DCF fluorescence at concentrations of 100 and 1 mM in both the presence and absence of mitochondria lysate and NADH. At a concentrationof 10 mM, in the presence of mitochondria lysate and NADH, 2-chlorophenothiazine reduced DCF fluorescence; however, in the absence ofmitochondria lysate and NADH, 2-chlorophenothiazine increased DCF fluorescence at 10 mM. (D) Chlorpromazine significantly increased DCFfluorescence at concentrations of 100 nM, 1 mM, and 10 mM in both the presence and absence of mitochondria lysate and NADH. * p,0.05 comparedto respective H2O2 control group.doi:10.1371/journal.pone.0048279.g010
Neuroprotective Actions of Methylene Blue
PLOS ONE | www.plosone.org 14 October 2012 | Volume 7 | Issue 10 | e48279
a phenazine nucleus with side chains on the 3, 7 carbons. NR had
decreased neuroprotective potency relative to MB in the
glutamate, rotenone and IAA assays as well as a decreased
efficacy in the IAA assay. However, NR was capable of enhancing
cellular oxygen consumption, but did not aid in electron transfer
between mitochondria complexes I and III.
The addition of a side chain to the 10 nitrogen caused a
significant loss of potency and efficacy as demonstrated by the
differences between phenothiazine and chlorpromazine in the
glutamate, IAA, and rotenone assays. Chlorpromazine and
promethazine have previously been reported to have minor
protective actions with micromolar potency, which corresponds to
our results from the neurotoxicity assays [36,37]. In addition, the
neuroprotective effects of phenothiazine and chlorpromazine were
previously compared in a rotenone neurotoxicity assay highlight-
ing phenothiazine’s robust neuroprotection as compared to
chlorpromazine’s lack of efficacy [38]. This was later elaborated
on in vivo in a C elegans model of Parkinson’s disease, with
phenothiazine again being highly efficacious [39,40,41].
The position 5 sulfur is as equally important as the availability of
the free 10 nitrogen motif evidenced by the differences between
TB and NR in the glutamate, IAA, and rotenone assays. The
substitution of a nitrogen in place of the sulfur in the heterocyclic
nucleus of the molecule (phenothiazine backbone replaced with
phenazine backbone) significantly decreased both the potency and
efficacy of NR as compared with MB.
MB’s neuroprotective effects have been demonstrated in models
of Alzheimer’s disease, Parkinson’s disease, stroke, optic neurop-
athy, and hypoxia [10,11,15,42,43,44]. In addition, phenothiazine
has been demonstrated to be protective in models of Parkinson’s
disease employing rotenone or MPP+ [38,39]. However, previous
studies have not compared the effects of MB and phenothiazine
together. Our results indicate that MB and phenothiazine have
very similar neuroprotective effects due to the availability of their
heterocyclic nitrogen and the presence of the position 5 sulfur. The
two structural analogs for phenothiazine and MB, 2-chlorophe-
nothiazine and TB respectively, also exhibit nanomolar neuro-
protective effects in our neurotoxicity assays. However, our
cellular bioenergetics and mitochondria lysate results indicate an
apparent difference between MB and phenothiazine.
The distinct neuroprotective action of MB was suggested by our
mitochondrial lysate oxidation assay, where MB requires mito-
chondria and NADH to reduce oxidative stress. We predict that
MB accepts electron(s) from NADH via mitochondria complex I
and is reduced to leuco-MB, which can act as a direct free radical
scavenger and recycle back to the oxidized form of MB. This
unique action of MB makes it a mitochondria specific regenerative
anti-oxidant. On the other hand, phenothiazine and 2-chlorophe-
nothiazine can function as direct free radical scavengers indepen-
dent of the presence of mitochondria and NADH. In addition, the
enhancement of complex IV expression and activity associated
with MB was not observed with 2-chlorophenothiazine indicating
a distinct mechanism between these two compounds. With the
addition of a side chain to the 10-nitrogen, chlorpromazine
enhanced the oxidative reaction independent of the presence of
mitochondria and NADH explaining its low neuroprotective
potency.
MB has previously been shown to directly accept electrons from
NADH, NADPH, and FADH2 [10,15,41,45,46]. We predicted
that MB derivatives derive their protective actions by acting in an
electron donor/acceptor capacity between mitochondria com-
plexes I-III similar to MB [10,12,15,47]. Surprisingly, only two
compounds, MB and TB, were capable of increasing the rate of
cytochrome c reduction in our complex I-III assay. The identified
action of MB on complex I-III is consistent with its action on
mitochondrial oxidative phosphorylation as we published previ-
ously [10]. Similar to MB, we also observed that TB and NR
increased cellular oxygen consumption and decreased lactate
production although the action and pattern of NR on ECAR was
different from that of MB and TB. Interestingly, MB, TB, and NR
all have similar negative redox potentials. MB, TB, and other
phenazine and phenothiazine derivatives have previously been
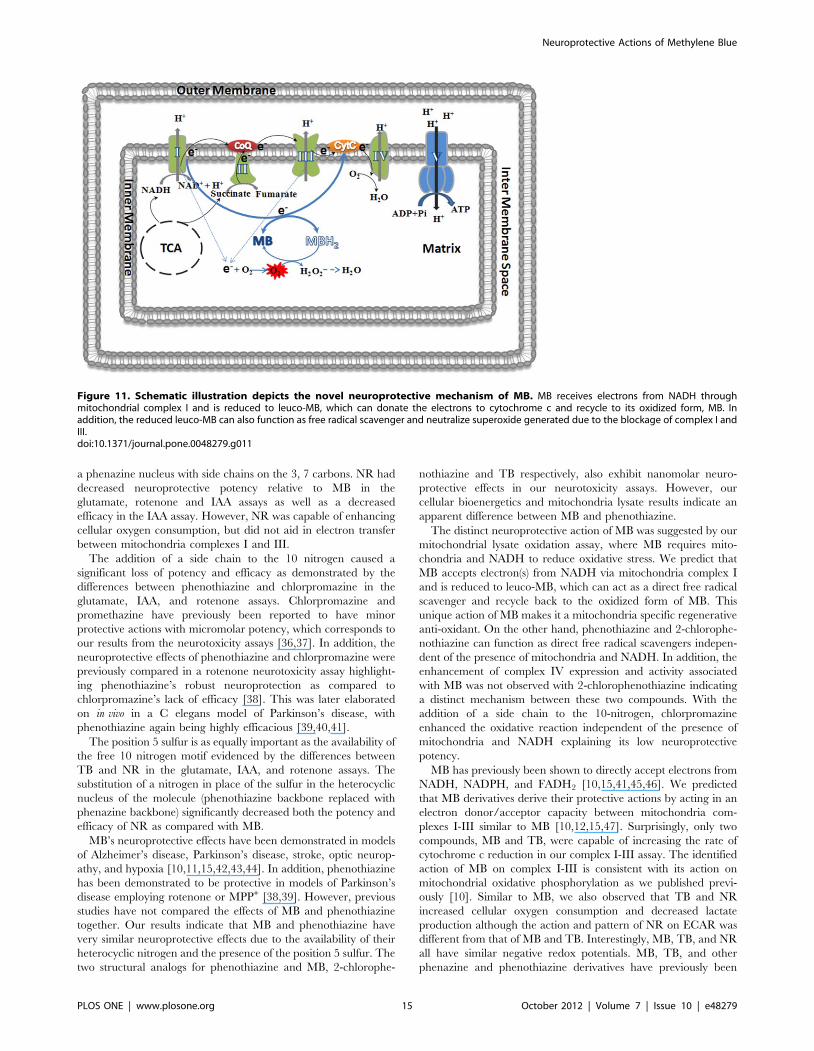
Figure 11. Schematic illustration depicts the novel neuroprotective mechanism of MB. MB receives electrons from NADH throughmitochondrial complex I and is reduced to leuco-MB, which can donate the electrons to cytochrome c and recycle to its oxidized form, MB. Inaddition, the reduced leuco-MB can also function as free radical scavenger and neutralize superoxide generated due to the blockage of complex I andIII.doi:10.1371/journal.pone.0048279.g011
Neuroprotective Actions of Methylene Blue
PLOS ONE | www.plosone.org 15 October 2012 | Volume 7 | Issue 10 | e48279
shown to enhance electron transfer in a microbial fuel cell system
[48]. MB, NR, and TB have similar structural characteristics
distinct from the other derivatives suggesting that the amine side
chains are likely the major factor for the negative redox potential
of these compounds, thus, their action on oxygen consumption
and lactate production. In addition, since NR, with the
substitution of a nitrogen for sulfur in the heterocyclic ring, has
a very weak neuroprotective effect and does not function as an
alternative electron transfer carrier in mitochondria, we predict
that the protective effect of MB is likely related to its action on
electron transfer independent of its effect on oxygen consumption
and lactate production.
In conclusion, our structure-activity relationship study of MB
has demonstrated the distinct anti-oxidant properties of MB. MB
acts on superoxide generated due to the blockage of the
mitochondria electron transport chain by providing an alternative
mitochondrial electron transfer carrier to bypass complexes I-III.
In addition, reduced leuco-MB can directly scavenge superoxide
and recycle back to the oxidized form MB (Figure 11). As a more
than one century old drug, MB has been used clinically for the
treatment of multiple diseases with well known pharmacokinetics
in humans for both acute intravenous and chronic oral admin-
istration [49,50]. These make MB and some of its derivatives ideal
candidates for future investigations for the treatment of neurode-
generative diseases.
Supporting Information
Figure S1 Effect of MB and its derivatives on rotenoneneurotoxicity in HT-22 cells. Calcein AM cell viability assay
after 24 hour exposure of 5 mM rotenone with co-treatment of (A)
MB, (B) 2-chlorophenothiazine, (C) NR, or (D) chlorpromazine. *
p,0.05 compared to 5 mM rotenone in media.
(TIF)
Figure S2 Effect of MB and its derivatives on IAAneurotoxicity in HT-22 cells. (A) Calcein AM cell viability
assay after 24 hour exposure of 20 mM IAA with co-treatment of
(A) MB, (B) 2-chlorophenothiazine (C) NR, or (D) chlorpromazine.
* p,0.05 compared to 20 mM IAA in media.
(TIF)
Figure S3 No protective action of MB on direct oxidativeinsult induced by 3 hours exposure of 2 U glucoseoxidase. MB enhances direct oxidative insult induced cell death
at 1 and 10 mM. Pyruvate significantly attenuates the direct
oxidative damage acting as an ROS scavenger. * p,0.05
compared to 2 U glucose oxidase in media.
(TIF)
Figure S4 Effects of phenothiazine and promethazineon OCR and ECAR. (A) OCR and (B) ECAR recording at
baseline and cumulative treatment of each drug (MB, phenothi-
azine, or promethazine), oligomycin, FCCP, and rotenone.
Promethazine and phenothiazine had no effect on OCR and
ECAR. (C) OCR and (D) ECAR recordings at baseline and
cumulative treatment of MB, oligomycin, FCCP, and rotenone.
Wells containing media only were used as blank controls. MB
dramatically enhances OCR and inhibits ECAR, but exhibited no
effect on OCR and ECAR in blank controls.
(TIF)
Author Contributions
Conceived and designed the experiments: EP JWS YW SY. Performed the
experiments: EP AW LJY KS. Analyzed the data: EP KNG. Contributed
reagents/materials/analysis tools: JWS SY. Wrote the paper: EP.
References
1. Bergen DC (2008) Neurological Disorders: Public Health Challenges. ArchNeurol 65: 154–154.
2. Pratico D (2008) Oxidative stress hypothesis in Alzheimer’s disease: areappraisal. Trends Pharmacol Sci 29: 609–615.
3. Barnham KJ, Masters CL, Bush AI (2004) Neurodegenerative diseases and
oxidative stress. Nat Rev Drug Discov 3: 205–214.
4. Sanchez-Moreno C, Dashe JF, Scott T, Thaler D, Folstein MF, et al. (2004)
Decreased levels of plasma vitamin C and increased concentrations ofinflammatory and oxidative stress markers after stroke. Stroke 35: 163–168.
5. Kamat CD, Gadal S, Mhatre M, Williamson KS, Pye QN, et al. (2008)
Antioxidants in central nervous system diseases: preclinical promise and
translational challenges. J Alzheimers Dis 15: 473–493.
6. Laurin D, Foley DJ, Masaki KH, White LR, Launer LJ (2002) Vitamin E and Csupplements and risk of dementia. JAMA 288: 2266–2268.
7. Bjelakovic G, Nikolova D, Gluud LL, Simonetti RG, Gluud C (2008)
Antioxidant supplements for prevention of mortality in healthy participants
and patients with various diseases. Cochrane Database Syst Rev: CD007176.
8. Schirmer RH, Coulibaly B, Stich A, Scheiwein M, Merkle H, et al. (2003)Methylene blue as an antimalarial agent. Redox Rep 8: 272–275.
9. Kwok ES, Howes D (2006) Use of methylene blue in sepsis: a systematic review.J Intensive Care Med 21: 359–363.
10. Wen Y, Li W, Poteet EC, Xie L, Tan C, et al. (2011) Alternative mitochondrial
electron transfer as a novel strategy for neuroprotection. J Biol Chem 286:16504–16515.
11. Rojas JC, John JM, Lee J, Gonzalez-Lima F (2009) Methylene blue providesbehavioral and metabolic neuroprotection against optic neuropathy. Neurotox
Res 15: 260–273.
12. Weinstein J, Scott A, Hunter FE, Jr. (1964) The Action of Gramicidin D on
Isolated Liver Mitochondria. J Biol Chem 239: 3031–3037.
13. Riha PD, Bruchey AK, Echevarria DJ, Gonzalez-Lima F (2005) Memoryfacilitation by methylene blue: dose-dependent effect on behavior and brain
oxygen consumption. Eur J Pharmacol 511: 151–158.
14. Callaway NL, Riha PD, Bruchey AK, Munshi Z, Gonzalez-Lima F (2004)
Methylene blue improves brain oxidative metabolism and memory retention inrats. Pharmacol Biochem Behav 77: 175–181.
15. Atamna H, Nguyen A, Schultz C, Boyle K, Newberry J, et al. (2008) Methylene
blue delays cellular senescence and enhances key mitochondrial biochemicalpathways. FASEB J 22: 703–712.
16. Wrubel KM, Riha PD, Maldonado MA, McCollum D, Gonzalez-Lima F (2007)
The brain metabolic enhancer methylene blue improves discrimination learning
in rats. Pharmacol Biochem Behav 86: 712–717.
17. Morimoto BH, Koshland DE, Jr. (1990) Induction and expression of long- and
short-term neurosecretory potentiation in a neural cell line. Neuron 5: 875–880.
18. Dykens JA, Fleck B, Ghosh S, Lewis M, Velicelebi G, et al. (2002) High-
throughput assessment of mitochondrial membrane potential in situ using
fluorescence resonance energy transfer. Mitochondrion 1: 461–473.
19. Yan LJ, Forster MJ (2009) Resolving mitochondrial protein complexes using
nongradient blue native polyacrylamide gel electrophoresis. Anal Biochem 389:
143–149.
20. Fukui M, Song JH, Choi J, Choi HJ, Zhu BT (2009) Mechanism of glutamate-
induced neurotoxicity in HT22 mouse hippocampal cells. Eur J Pharmacol 617:
1–11.
21. Murphy TH, Miyamoto M, Sastre A, Schnaar RL, Coyle JT (1989) Glutamate
toxicity in a neuronal cell line involves inhibition of cystine transport leading to
oxidative stress. Neuron 2: 1547–1558.
22. Panee J, Liu W, Nakamura K, Berry MJ (2007) The responses of HT22 cells to
the blockade of mitochondrial complexes and potential protective effect of
selenium supplementation. Int J Biol Sci 3: 335–341.
23. Lapchak PA, Maher P, Schubert D, Zivin JA (2007) Baicalein, an antioxidant
12/15-lipoxygenase inhibitor improves clinical rating scores following multiple
infarct embolic strokes. Neuroscience 150: 585–591.
24. Rego AC, Areias FM, Santos MS, Oliveira CR (1999) Distinct glycolysis
inhibitors determine retinal cell sensitivity to glutamate-mediated injury.
Neurochem Res 24: 351–358.
25. Dickens F (1933) Interaction of halogenacetates and SH compounds: The
reaction of halogenacetic acids with glutathione and cysteine. The mechanism of
iodoacetate poisoning of glyoxalase. Biochem J 27: 1141–1151.
26. Sigalov E, Fridkin M, Brenneman DE, Gozes I (2000) VIP-Related protection
against lodoacetate toxicity in pheochromocytoma (PC12) cells: a model for
ischemic/hypoxic injury. J Mol Neurosci 15: 147–154.
27. Gille JJ, Joenje H (1992) Cell culture models for oxidative stress: superoxide and
hydrogen peroxide versus normobaric hyperoxia. Mutat Res 275: 405–414.
28. Simon RH, Scoggin CH, Patterson D (1981) Hydrogen peroxide causes the fatal
injury to human fibroblasts exposed to oxygen radicals. J Biol Chem 256: 7181–
7186.
Neuroprotective Actions of Methylene Blue
PLOS ONE | www.plosone.org 16 October 2012 | Volume 7 | Issue 10 | e48279
29. Keilin D, Hartree EF (1952) Specificity of glucose oxidase (notatin). Biochem J
50: 331–341.
30. Wu M, Neilson A, Swift AL, Moran R, Tamagnine J, et al. (2007)
Multiparameter metabolic analysis reveals a close link between attenuated
mitochondrial bioenergetic function and enhanced glycolysis dependency in
human tumor cells. Am J Physiol Cell Physiol 292: C125–136.
31. Gonzalez-Lima F, Bruchey AK (2004) Extinction memory improvement by the
metabolic enhancer methylene blue. Learn Mem 11: 633–640.
32. Ohlow MJ, Moosmann B (2011) Phenothiazine: the seven lives of pharmacol-
ogy’s first lead structure. Drug Discov Today 16: 119–131.
33. Barron ES (1930) The Catalytic Effect of Methylene Blue on the Oxygen
Consumption of Tumors and Normal Tissues. J Exp Med 52: 447–456.
34. Barron ES, Hoffman LA (1930) The Catalytic Effect of Dyes on the Oxygen
Consumption of Living Cells. J Gen Physiol 13: 483–494.
35. Michaelis L, Smythe CV (1936) INFLUENCE OF CERTAIN DYESTUFFS
ON FERMENTATION AND RESPIRATION OF YEAST EXTRACT.
Journal of Biological Chemistry 113: 717–734.
36. Bernheim ML (1959) Antioxidant effect of chlorpromazine. Proc Soc Exp Biol
Med 102: 660–662.
37. Galzigna L, Rizzoli V, Schiappelli MP, Rigobello MP, Scarpa M, et al. (1996)
Horseradish peroxidase-catalyzed sulfoxidation of promethazine and properties
of promethazine sulfoxide. Free Radic Biol Med 20: 807–811.
38. Hajieva P, Mocko JB, Moosmann B, Behl C (2009) Novel imine antioxidants at
low nanomolar concentrations protect dopaminergic cells from oxidative
neurotoxicity. J Neurochem 110: 118–132.
39. Mocko JB, Kern A, Moosmann B, Behl C, Hajieva P (2010) Phenothiazines
interfere with dopaminergic neurodegeneration in Caenorhabditis elegans
models of Parkinson’s disease. Neurobiol Dis 40: 120–129.
40. Biaglow JE, Koch CJ, Tuttle SW, Manevich Y, Ayene IS, et al. (1998) The
measurement of bioreductive capacity of tumor cells using methylene blue.Int J Radiat Oncol Biol Phys 42: 769–773.
41. Dixon M (1971) The acceptor specificity of flavins and flavoproteins. II. Free
flavins. Biochim Biophys Acta 226: 259–268.42. Rojas JC, Simola N, Kermath BA, Kane JR, Schallert T, et al. (2009) Striatal
neuroprotection with methylene blue. Neuroscience 163: 877–889.43. Muratsubaki H, Yajima N, Yoneda H, Enomoto K, Tezuka T (2008) Methylene
blue protection against hypoxic injury in primary cultures of rat hepatocyte
monolayers. Cell Biochem Funct 26: 275–278.44. Atamna H, Kumar R (2010) Protective role of methylene blue in Alzheimer’s
disease via mitochondria and cytochrome c oxidase. J Alzheimers Dis 20 Suppl2: S439–452.
45. May JM, Qu ZC, Cobb CE (2004) Reduction and uptake of methylene blue byhuman erythrocytes. Am J Physiol Cell Physiol 286: C1390–1398.
46. Buchholz K, Schirmer RH, Eubel JK, Akoachere MB, Dandekar T, et al. (2008)
Interactions of methylene blue with human disulfide reductases and theirorthologues from Plasmodium falciparum. Antimicrob Agents Chemother 52:
183–191.47. Visarius TM, Stucki JW, Lauterburg BH (1997) Stimulation of respiration by
methylene blue in rat liver mitochondria. FEBS Lett 412: 157–160.
48. Roller SD, Bennetto HP, Delaney GM, Mason JR, Stirling JL, et al. (1984)Electron-transfer coupling in microbial fuel cells: 1. comparison of redox-
mediator reduction rates and respiratory rates of bacteria. Journal of ChemicalTechnology and Biotechnology Biotechnology 34: 3–12.
49. Clifton J, 2nd, Leikin JB (2003) Methylene blue. Am J Ther 10: 289–291.50. Peter C, Hongwan D, Kupfer A, Lauterburg BH (2000) Pharmacokinetics and
organ distribution of intravenous and oral methylene blue. Eur J Clin Pharmacol
56: 247–250.
Neuroprotective Actions of Methylene Blue
PLOS ONE | www.plosone.org 17 October 2012 | Volume 7 | Issue 10 | e48279