Working Papers in
Trade and Development
Network Effects on Trade in Intermediate Goods:
Evidence from the Automobile Industry
Shuhei Nishitateno
April 2014
Working Paper No. 2014/009
Arndt-Corden Department of Economics
Crawford School of Public Policy
ANU College of Asia and the Pacific

This Working Paper series provides a vehicle for preliminary circulation of research results in
the fields of economic development and international trade. The series is intended to
stimulate discussion and critical comment. Staff and visitors in any part of the Australian
National University are encouraged to contribute. To facilitate prompt distribution, papers
are screened, but not formally refereed.
Copies may be obtained at WWW Site
http://www.crawford.anu.edu.au/acde/publications/
Network Effects on Trade in Intermediate Goods:
Evidence from the Automobile Industry
Shuhei Nishitateno (corresponding author)
School of Policy Studies,
Kwansei Gakuin University
2-1 Gakuen, Sanda 669-1337 Japan
Phone: +81-79-565-7957
Email: [email protected]
April 2014
Working Paper No. 2014/09

Network Effects on Trade in Intermediate Goods:
Evidence from the Automobile Industry
Shuhei Nishitateno
School of Policy Studies,
Kwansei Gakuin University
2-1 Gakuen, Sanda 669-1337 Japan
Phone: +81-79-565-7957
Email: [email protected]
Abstract
Growing production fragmentation makes analysis of network effects on trade in parts and
components more important than ever. This study examines network effects on auto parts exports
from six major auto producing countries using a panel dataset covering 49 destinations and 31
products over the period from 2002 to 2008. Unlike previous research, this study finds that, in
the case of Japanese automakers, overseas production by subsidiary plants is less important in
determining auto parts exports from Japan than it is for the other major auto producing countries.
Japanese auto parts suppliers, unlike their counterparts in other countries, have a tendency to
follow the Japanese auto makers in internationalizing their operations. This practice of meeting
the need of automakers from overseas production plants weakens the network effects on auto
parts exports from Japan.
Keywords: Network effect, International trade, production fragmentation, keiretsu, automobile industry,
Japan
JEL classification: F14, L23

2
1. Introduction
It is well held in trade literature that business and social networks are important driving forces of
international trade (Rauch and Feenstra, 1999). Networks that were domestically forged are now being
internationalized through cross-border migration and foreign direct investment, helping to alleviate
informal trade barriers. Previous research has predominantly examined the implications of Japanese
keiretsu and overseas Chinese networks for international trade. One consensus is that relationships
between sellers and buyers matter in an environment where enforcement of international contracts is weak
and information about international trade opportunities is not adequate (Rauch and Feenstra, 1999). The
magnitude of these networks is an ongoing empirical issue in international trade. The stronger network
effects are, the worse the standard trade models are expected to perform under the assumptions of
anonymous agents trading through arms-length transactions (Greaney, 2009).
Given the growing importance of production fragmentation1 in international trade, analysis of the network
effects on trade in intermediate goods has become more important than ever. The geographically
integrated production process began to separate as technological developments in transportation and
communication made long-distance transactions feasible. Furthermore, the development of information
technology and liberalization of trade and investment have dramatically reduced communication and
transaction costs, enabling multinational enterprises (MNEs) to outsource an increasing amount of their
production process across multiple countries based on factor endowments and organize their value chains
globally. This has resulted in a steady rise in trade in parts and components across national borders
(Yeats, 1998; Kimura and Ando, 2005; Athukorala and Yamashita, 2006).
1 Production fragmentation is defined as intra-product specialization where the production process is
sliced into discrete activities, which are then allocated across multiple countries based on factor
endowments such as labor, capital and technology. In the recent literature an array of alternative terms
has been used to describe this phenomenon including ‘global production sharing’ and ‘international
outsourcing’ (Jones and Kierzkowski, 1990; Helpman, 2006).
3
The objective of this paper is to broaden understanding of network effects in international trade by
analyzing intermediate goods. In this paper, the following questions are explored: Do networks increase
parts and components trade and, if so, to what extent? Are Japanese network effects distinctive? To
answer these questions, I estimate the network effects on auto parts exports from 6 traditional auto-
producing countries (hereafter, TPCs): Japan, the United States, Germany, France, Italy, and Sweden. The
network effect is measured using overseas production by automakers headquartered in TPCs. My method
involves estimating an augmented version of the Anderson and Wincoop (2003) gravity equation with a
fixed effects model. I employ a large panel data covering 49 destination countries and 31 auto parts over
the 7-year period from 2002 to 2008.
In accordance with expectations, the results suggest that on average, a 10% increase in overseas
production by TPC automakers leads to an increase in auto parts exports from their home country by
4.3%.2 An important finding, however, is that Japanese network effects are less important than those of
other TPCs. I argue that such uniqueness could be led by the higher reliance on domestic procurements of
overseas subsidiaries of Japanese automakers as a result of transfer of the vertical networks between
automakers and parts suppliers formed in Japan. This is reflected in a general tendency of Japanese parts
suppliers to internationalize their operations following Japanese automakers, which could weaken
Japanese network effects.
This study adds to the literature measuring network effects in international trade and relates closely to
Greaney (2005, 2009). The key extension is that this study analyzes total network effects including both
intra- and inter-firm network effects with a newly-constructed product-level dataset. In contrast, Greaney
focused on intra-firm network effects using firm-level data. The inclusion of inter-firm network effects
matter, because the important aspect of production fragmentation is the splitting of production processes
2 This is the simple average between the year 2002 and 2008 (See the lower part of Table 3).
4
across national borders beyond a firm’s boundaries (Grossman and Helpman, 2002). In addition, as far as
I am aware, this is the first paper to show empirical evidence of weaker Japanese network effects relative
to other developed countries. Greaney’s works present evidence that the Japanese network effect is,
rather, stronger. The other contribution is that this paper demonstrates evidence that the standard gravity
model might suffer from misspecification problems when determinants of intermediate trade are
estimated, as argued by Baldwin and Taglioni (2013).3
The rest of this paper is structured as follows. Section 2 overviews the literature on network effects in
international trade, with a particular focus on the role of Japanese keiretsu. Section 3 presents the
empirical model and discusses data and estimation methods. Section 4 reports the estimation results.
Section 5 discusses the key results. Section 6 concludes.
2. Japanese Network Effects: Theory and Evidence
Japanese keiretsu is among the business networks that have been paid the most attention by economists.4
Unlike other networks, early research on Japanese keiretsu was motivated by how Japanese local business
networks create trade barriers for outside competitors. Thus, both the theoretical and empirical literature
has focused on an import-reducing effect of the domestic keiretsu network operating through the
preferential choice of domestic keiretsu suppliers by assembly makers (Lawrence, 1991; Fung, 1991; Qiu
and Spencer, 2002). This view was prominent in the policy debate on the US-Japan trade friction during
the 1980s and 1990s. In recent years, there has been some research on the impact of the global keiretsu
network, which has trade-creating effects. Empirical evidence in this literature is summarized in Table 1.
3 Previous studies such as Kimura and Ando (2005) and Athukorala and Yamashita (2006) use GDP as
the mass variable, despite the fact that they rely on the consumer good version of the gravity model to describe parts and components trade. This study shows that value-added could underestimate the role of the mass variable in explaining trade in intermediate products.
4 See Rauch (2001) for an overview of network effects in international trade.
5
Qiu and Spencer (2002) postulate that the domestic keiretsu networks have import-reducing effects from
the relation-specific investment (RSI) that improves the fit or ease of assembly with other parts produced
by keiretsu suppliers.5 Hence, efficiency-raising RSI causes Japanese assembly makers to choose
domestic procurement within the keiretsu network rather than imports from local suppliers in a foreign
country even if produced at a cheaper cost. This theoretical observation is consistent with empirical
results. Lawrence (1991) and Fung (1991) examine the role of the domestic keiretsu network for US-
Japan trade and find that it negatively affects import penetration in Japan by foreign sellers. Fung (1991)
concludes Japanese keiretsu may be an important determinant of US-Japan trade.6
Subsequent work by Baldwin and Ottaviano (2001) and Greaney (2003) has emphasized that the global
keiretsu network promotes international trade by helping to overcome informal trade barriers. The cost
here reflects the expenditure required to penetrate the market by creating a connection with buyers. This
cost becomes higher when agents have a different nature such as culture, language, nationality, and
business customs. However, if the seller and buyer belong to the keiretsu, the costs could be much lower
compared with non-keiretsu members because they already have mutual trust based on a close and long-
standing business relationship.
This theoretical prediction is supported by the empirical results of Head et al. (2004) and Greaney (2005,
2009). Head et al. (2004) explicitly investigate the impact of both the domestic and global keiretsu
network on the pattern of auto parts imports from the US in Japan. They find the global keiretsu network
5 There are several forms of RSI such as physical asset specificity (e.g. customized machinery), site
specificity (e.g. improvements in coordination to economize on inventory or transportation costs), and
human asset specificity (e.g. gains in know-how from experience and information sharing). For
applications within keiretsu, see Aoki (1988). 6 Saxonhouse (1989) takes an opposite position, arguing that Japan’s trade pattern can be explained by
factor endowments in a similar way as for other advanced countries. Also, Ueda and Sasaki (1988)
investigate whether the keiretsu affects manufacturing imports in Japanese manufacturing and find
evidence that the domestic keiretsu network has an import-creating effect especially for vertical keiretsu
such as Toyota, Nissan, Sony, and Fujitsu.
6
positively works for auto parts imports in Japan through “reverse imports” (i.e. imports from overseas
affiliates of that country’s own firms) however it is smaller than the import-reducing effect of the
domestic keiretsu network. Using firm-level data, Greaney (2005, 2009) finds that Japanese affiliates in
the United States display a stronger home bias in their international trade pattern than any other foreign
affiliates located in the United States, suggesting that production networks between headquarters and
overseas subsidiaries play an more important role in determining Japan’s trade.
This study builds on the works of Greaney (2005, 2009) by investigating network effects on auto parts
exports from TPCs and the uniqueness of Japanese network effects.7 The first development is to analyze
total network effects in international trade with an emphasis on inter-firm network effects, which Greaney
has not explored. To do so I analyze the automobile industry, which is characterized by a vertical
integration between automakers and auto parts suppliers. It is expected that the expansion of overseas
production by Japanese automakers increases auto parts exports from suppliers (and automakers) in Japan
more than in the case of other TPCs due to global keiretsu networks (Baldwin and Ottaviano, 2001;
Greaney, 2003). Second, the dataset in this study includes 49 trading countries (Appendix 1), allowing for
an investigation of differences in network effects among destinations. It is postulated that network effects
are stronger in developing countries where enforcement of international contracts is weak and information
about international trade opportunities is not adequate (Rauch and Feenstra, 1999). On the other hand,
Greaney’s works include only the United States as a host country. Third, this paper employs a new
measurement approach for network effects. Instead of using dummy variables, I measure network effects
using the overseas production in each trading country by automobile producers headquartered in the
TPCs.
7 Data limitations do not allow for measuring network effects on auto parts imports to TPCs. It is difficult
to obtain information on overseas activities of suppliers headquartered in TPCs.
7
3. Empirical Analysis
3.1. Estimation strategy
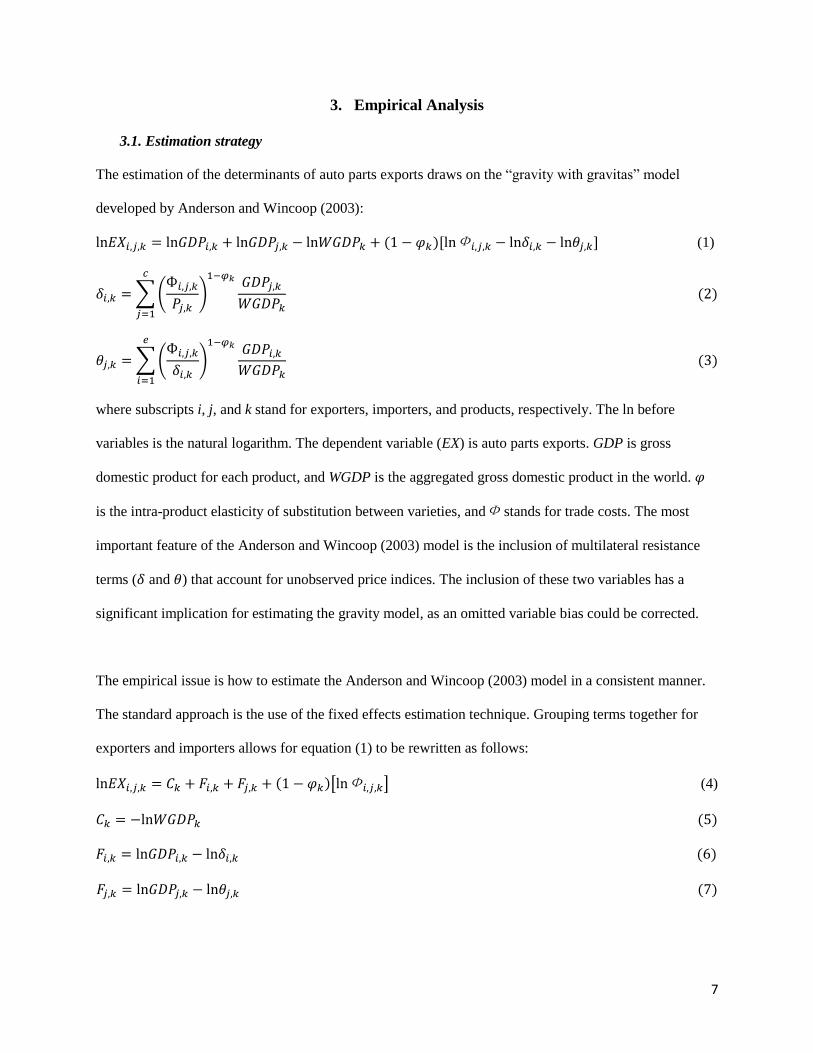
The estimation of the determinants of auto parts exports draws on the “gravity with gravitas” model
developed by Anderson and Wincoop (2003):
ln𝐸𝑋𝑖,𝑗,𝑘 = ln𝐺𝐷𝑃𝑖,𝑘 + ln𝐺𝐷𝑃𝑗,𝑘 − ln𝑊𝐺𝐷𝑃𝑘 + (1 − 𝜑𝑘)[lnФ𝑖,𝑗,𝑘 − ln𝛿𝑖,𝑘 − ln𝜃𝑗,𝑘] (1)
𝛿𝑖,𝑘 = ∑ (Ф𝑖,𝑗,𝑘
𝑃𝑗,𝑘)
1−𝜑𝑘𝑐
𝑗=1
𝐺𝐷𝑃𝑗,𝑘
𝑊𝐺𝐷𝑃𝑘 (2)
𝜃𝑗,𝑘 = ∑ (Ф𝑖,𝑗,𝑘
𝛿𝑖,𝑘)
1−𝜑𝑘𝑒
𝑖=1
𝐺𝐷𝑃𝑖,𝑘
𝑊𝐺𝐷𝑃𝑘 (3)
where subscripts i, j, and k stand for exporters, importers, and products, respectively. The ln before
variables is the natural logarithm. The dependent variable (EX) is auto parts exports. GDP is gross
domestic product for each product, and WGDP is the aggregated gross domestic product in the world. 𝜑
is the intra-product elasticity of substitution between varieties, andФ stands for trade costs. The most
important feature of the Anderson and Wincoop (2003) model is the inclusion of multilateral resistance
terms (𝛿 and 𝜃) that account for unobserved price indices. The inclusion of these two variables has a
significant implication for estimating the gravity model, as an omitted variable bias could be corrected.
The empirical issue is how to estimate the Anderson and Wincoop (2003) model in a consistent manner.
The standard approach is the use of the fixed effects estimation technique. Grouping terms together for
exporters and importers allows for equation (1) to be rewritten as follows:
ln𝐸𝑋𝑖,𝑗,𝑘 = 𝐶𝑘 + 𝐹𝑖,𝑘 + 𝐹𝑗,𝑘 + (1 − 𝜑𝑘)[lnФ𝑖,𝑗,𝑘] (4)
𝐶𝑘 = −ln𝑊𝐺𝐷𝑃𝑘 (5)
𝐹𝑖,𝑘 = ln𝐺𝐷𝑃𝑖,𝑘 − ln𝛿𝑖,𝑘 (6)
𝐹𝑗,𝑘 = ln𝐺𝐷𝑃𝑗,𝑘 − ln𝜃𝑗,𝑘 (7)
8
The equations indicate that three fixed effects should be controlled for. One is product fixed effects (𝐶𝑘).
Indeed, auto part fixed effects matter in controlling for omitted variable biases (Head et al., 2004). For
example, auto parts with higher asset specificity and engineering costs (e.g. catalytic converters, variable
valve lift systems) are probably exported from headquarters’ plants in a home country to avoid breaches
of technology and information. The others are exporter-product fixed effects (𝐹𝑖,𝑘) and importer-product
fixed effects (𝐹𝑗,𝑘). Because trade costs potentially vary by products, the multilateral resistance terms also
vary across not only exporters and importers but also products.
For the purpose of this study the standard gravity equation (4) is augmented by adding a number of other
variables. Overseas production in an importing country by automobile producers headquartered in the
TPCs (OSP) allows for the measurement of network effects on auto parts exports from TPCs. Four
variables are included as representatives of trade costs (Ф): the geographical distance (DIS), adjacency
(ADJ), common language (LAN), and colonial tie (COL) between exporters and importers. The
augmented version of the gravity equation is:
ln𝐸𝑋𝑖,𝑗,𝑘 = 𝛽1ln𝑂𝑆𝑃𝑖,𝑗 + 𝛽2ln𝐷𝐼𝑆𝑖,𝑗 + 𝛽3𝐴𝐷𝐽𝑖,𝑗 + 𝛽4𝐿𝐴𝑁𝑖,𝑗 + 𝛽5𝐶𝑂𝐿𝑖,𝑗 + 𝐶𝑘 + 𝐹𝑖,𝑘 + 𝐹𝑗,𝑘 + 휀𝑖,𝑗,𝑘 (8)
Estimation is carried out in three steps. The first is to estimate equation (8) separately for products (k) in a
single period. This is the most feasible approach to estimating the Anderson and Wincoop (2003) model
consistently. All that is needed is a full set of exporter and importer fixed effects. The superiority of this
approach allows two multilateral resistances (𝛿, 𝜃) and the elasticity of substitution (𝜑) to vary
accordingly. The second step is to estimate equation (8) directly for each year (2002-2008). However, the
shortcoming of this approach is to rely on the assumption that the elasticity of substitution is constant
across products. Lastly, additional examinations are undertaken with the four-dimensional panel dataset
pooling all dimensions (exporters, importer, products, and periods) together. The use of the four-
dimensional panel data not only enhances the efficiency of estimation due to the increase in the number of

9
observations but also allows for additional control variables and a different estimation method. The
additional variables include domestic output in the automobile industry (DAP) to represent economic
mass, the value/weight ratio (VWR), and the nominal exchange rate (NER). The Poisson pseudo-
maximum-likelihood (PPML) technique is employed to investigate the possibility of estimation biases
emanating from missing values (Silva and Tenreyro, 2006).
Careful attention needs to be paid to mass variables (DAP). Conceptually, the expenditure and output for
each product should be included instead of GDP, as the product-based gravity model is estimated in this
study. In addition, mass variables should be measured in gross term rather than value-added terms when
determinants of trade in parts and components are examined using the Anderson and Wincoop (2003)
framework (Baldwin and Taglioni, 2013). The Anderson and Wincoop (2003) model is based on
consumer demand rather than intermediate demand, and is therefore less appropriate in explaining
determinants of trade in intermediate goods. Furthermore, to capture the market size for auto parts exports
properly, not only car production but also auto parts production should be included, as intra-industry trade
within the auto parts industry becomes an important driver of bilateral trade given the growing production
fragmentation in recent years. Taking into account these points, mass variables are constructed and their
performance are examined (see below for details).
One advantage of the use of product-level data is to allow for constructing a unit value ratio (VWR) for
each auto part. Controlling for this variable is important because product characteristics such as bulkiness
could influence the firm’s internationalization strategy (i.e. exporting or foreign direct investment): bulky
parts such as body and chassis components are expected to be directly supplied in a host country rather
than exported from a home country because of higher transportation costs. In addition, the nominal
exchange rate (NER) is an important variable to influence the firm’s internationalization strategy and so is
an important control.
10
3.2. Variable Construction and Data Sources
Data on overseas production are obtained from the International Organization of Motor Vehicle
Manufacturers, which provides information on production volume by manufacturer and country. Using
these data, I calculate overseas production in each importing country by automobile producers
headquartered in the TPCs (Appendix 2). While a classification based on ownership would be more
appropriate, this study does not employ such a classification due to the difficulty of measuring ownership
in a consistent manner. One reason is that there are wide varieties of degree of ownership and alliances.8
In addition, the degree of ownership changes over time, and alliances between automakers have
sometimes been dissolved.9 On the other hand, the locations of their headquarters can be easily identified,
because they normally do not move even when merged into another company (e.g. Opel has continued to
be headquartered in Germany).
Auto parts exports from TPCs are obtained from UN Comtrade. Exports are measured in nominal US
dollars. Distance, adjacency, common language, and colonial ties between countries are obtained from the
CEPII database. Distance is measured using the geographical coordinates of the capital cities. The
adjacency dummy indicates whether two countries are contiguous. The common language variable is a
dummy variable indicating whether countries share a common official language. The colonial dummy
variable is measured in the same manner. Data on nominal exchange rates are from the World
Development Indicators. The nominal exchange rate is calculated by local currency units per US dollars
(period average), and indexed by making the year 2002 a base year. The value/weight ratio is constructed
as
VWRi,j,k,t = EX i,j,k,t / NW i,j,k,t
8 For example, while Opel, a German carmaker, has been a complete subsidiary of General Motors since
1929, Mazda, a Japanese automobile producer, has been more loosely allied with Ford. 9 For example, Chrysler, a US carmaker, was purchased by Daimler Benz, a German car maker, creating
a combined entity, DaimlerChrysler, in 1998. However, this alliance was dissolved in 2007.
11
where EX stands for nominal export value and NW stands for net weight, respectively.10 These data are
obtained from UN Comtrade.
Data on domestic output in the automobile industry are obtained from the International Yearbook of
Industrial Statistics of the United Nations Industrial Development Organization (UNIDO) for various
years. As discussed above, gross output in the automobile industry including both auto production and
parts and components production is constructed in nominal terms.11 For an international comparison, the
output is converted to US dollars in purchasing power parity (PPP) terms, as they are measured in local
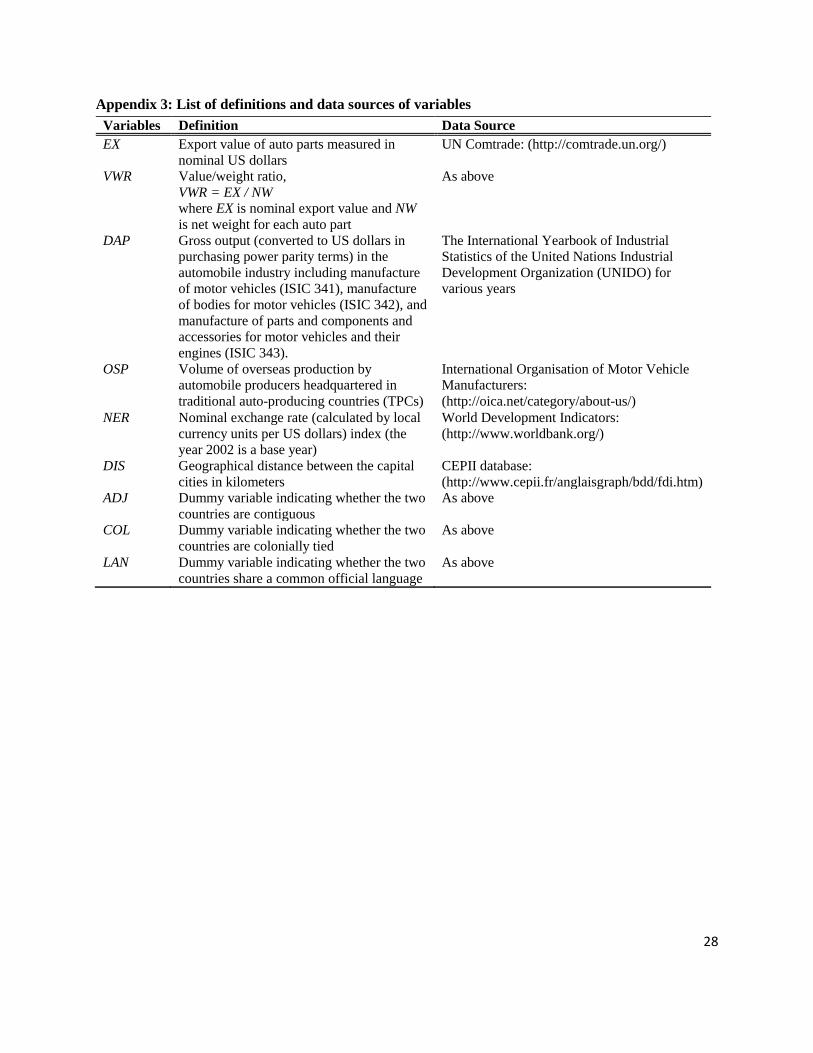
currency. Data on the PPP are downloaded from the Penn World Table. A detailed list of variable
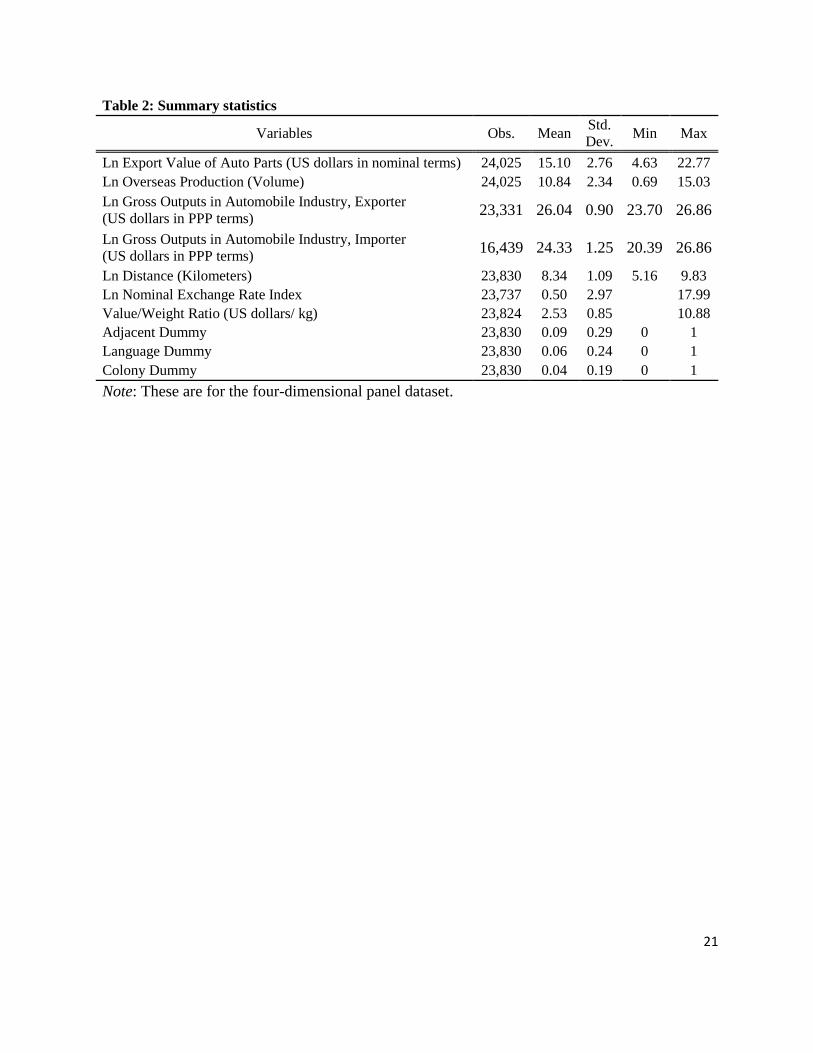
definitions and data sources is provided in Appendix 3. Summary statistics are presented in Table 2.
4. Results
4.1. Do networks increase auto parts exports from TPCs and, if so, to what extent?
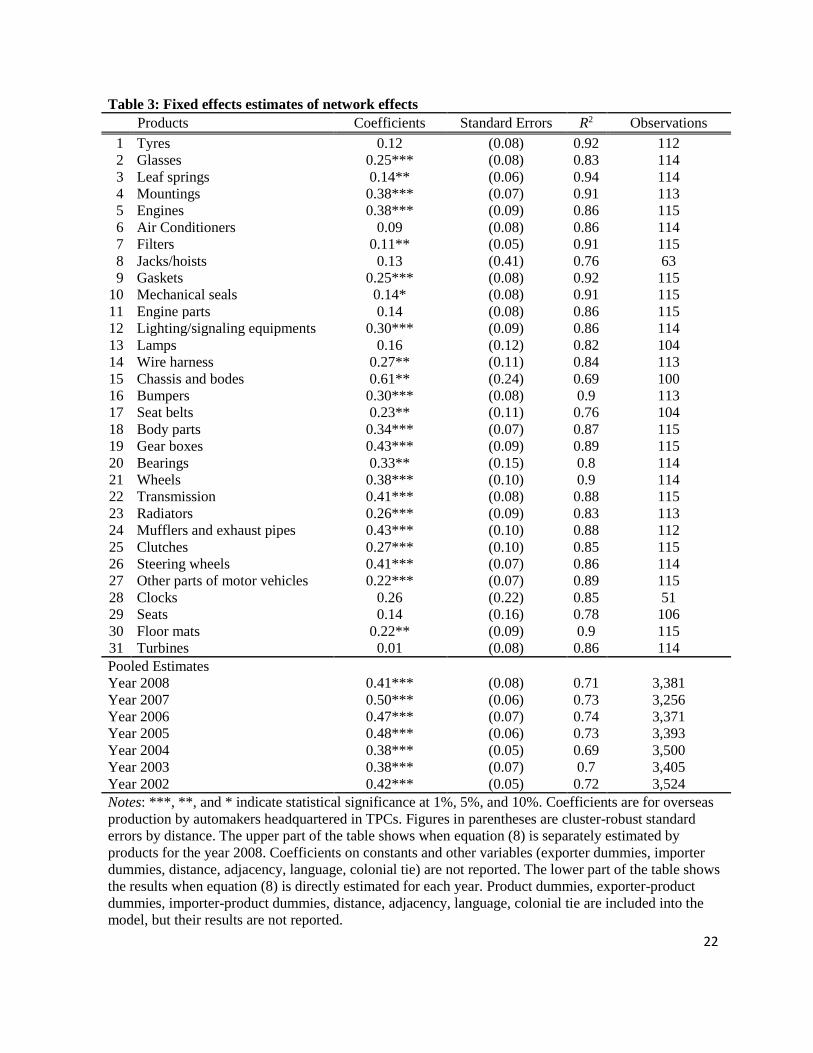
Table 3 reports fixed effect estimates of network effects. The upper part of the table shows the results
when equation (8) is separately estimated by products for the year 2008.12 Overall the goodness-of-fit of
each regression is sufficient. The result clearly suggests that network effects on auto parts exports from
TPCs exist for a wide variety of products. Positive and significant coefficients (at the 10% level or higher)
of overseas production by TPC automakers are found for 23 auto parts (out of 31). The coefficients range
from 0.11 to 0.61. The lower part of the table shows the results, in which equation (8) is estimated
directly for each year with pooled data covering around 3,200-3,500 observations. The overall goodness-
10 The weight/unit could be more appropriate than value/weight ratio in this context. However, while
weight is measured for almost all of the products in a consistent manner, unit data are not available for a
large share of the products analyzed in this study. 11 Domestic output in the automobile industry includes the manufacture of motor vehicles (ISIC 341),
manufacture of bodies for motor vehicles (ISIC 342), and manufacture of parts and components and
accessories for motor vehicles and their engines (ISIC 343). 12 The year 2008 is the latest year of the sample. The estimation result is consistent with that for the other
periods (2002-2007).
12
of-fit of the regression is around 0.70. The results are consistent with those of the product-by-product
analyses. The coefficients of overseas production by TPC automakers are positive and statistically
significant for all periods. The coefficients range from 0.38 to 0.50 across years.
Table 4 demonstrates additional evidence of the network effects analyzing four-dimensional panel data.13
The first column shows that the coefficient of overseas production (OSP) is positive and statistically
significant at the 1% level. The result suggests that overall, a 10% expansion of overseas production by
TPC automakers leads to a 4.3% increase in auto parts exports from their home country. Next, splitting
the sample into developed and developing countries, the model is estimated separately (Columns 2 and 3).
In accordance with expectations, the results suggest that the network effect for developing-country
destinations (0.45) is stronger than that for developed countries (0.37).14 This finding is consistent with
the view that developing countries are subject to weaker enforcement of international contracts and
greater asymmetric information between exporters and importers compared with developed countries
(Rauch and Feenstra, 1999). The network effects on auto parts exports from TPCs remain robust even
after including controls (Columns 4 and 5) and estimating by PPML instead of OLS (Column 6).
The negative coefficient of distance reflects the importance of proximity for trade, and the positive
coefficient of the adjacency dummy supports the importance of geographical clusters in the automobile
industry. On the other hand, there is no evidence that common language and colonial ties are determinants
of auto parts exports from TPCs. The size of the automobile industry for exporter and importer are highly
significant predictors of auto parts exports from TPCs (Columns 4 and 5). The important finding is that
the mass variables in value-added terms are underestimated compared with gross outputs. This implies
that once the equation is mis-specified, we are in the realm of omitted variables (Baldwin and Taglioni,
13 Fisher-type unit root tests strongly reject the null hypothesis that all panels contain a unit root for time-
variant variables: auto parts exports (EX), overseas production by automakers (OSP), gross outputs in
automobile industry (DAP), value/weight ratio (VWR), nominal exchange rate (NER). 14 Chow test rejects the null hypothesis that the slopes are identical across these two country groups.

13
2013). Interestingly, a high value/weight ratio product tends to be less associated with network effects
suggesting that bulky products tend to be locally procured instead of being exported from home countries
due to higher transportation costs (Column 4). However, this result appears not to be robust. The
coefficient of nominal exchange rate is not reliable, as its sign and statistical significance vary with
sample and estimation technique.
4.2. Are Japanese network effects distinctive?
Table 5 demonstrates that the network effects are heterogeneous for exporting countries. The striking
finding is the weaker Japanese network effect relative to that of other TPCs. As can be seen in row 3, the
negative coefficients of the interaction term between the country dummy and overseas production is
found only for Japan. The result predicts that the magnitude of the interlink between auto part exports
from Japan and overseas production by Japanese automakers is 0.12 percentage points smaller compared
with the magnitude of the average relationship estimated for all TPCs.15 On the other hand, the result
suggests that the network effects for the United States (0.32) and Sweden (0.24) are larger relative to
those of other TPCs. There is no evidence that network effects for France, Italy, and Germany differ from
the average effect for other countries.
That the findings are robust is demonstrated in Table 6 which presents product-by-product analyses for
Japan, the United States, and Sweden. Negative and significant coefficients of the interaction term
between the Japan dummy and overseas production by Japanese automakers are found for a wide variety
of products. 19 estimates of the interaction term are negative and significant with at least a 10%
significance level, whereas no positive and significant estimate is found. On the other hand, positive and
15 The smaller Japanese network effects do not necessarily mean there is a substitution relationship
between overseas production and exports. In fact, the result shows that overseas production by Japanese automakers and auto parts exports from Japan are complementary (Table 5). These two variables are statistically assessed as “complementary” when the sum over the two coefficients of overseas production by automakers (+0.26) and its interaction terms with country dummy (-0.12) is positive (Wooldridge, 2002).
14
significant coefficients are found for almost half of the products for the United States (15) and Sweden
(16).
5. Discussions
Why are Japanese network effects weaker? One explanation is that the export-reducing effects of the
following-leader investments are more significant in the case of Japan than other TPCs. Following-leader
investment – auto parts suppliers’ investments following their customers’ investment abroad – is a
common phenomenon in the automobile industry. Modularity, for example, results in large modules (e.g.
cockpit and chassis modules), which are more difficult and expensive to ship over long distances and are
more likely to be coordinated tightly with the final assembly process, leading to the co-location of
automaker and parts suppliers (Sturgeon et al., 2008). In addition, MNEs have generally attempted to be
localized in host countries due to transportation costs and foreign currency risks. Import-substitution
policies in host countries also affect the investment decision not only by automakers but also by parts
suppliers. For example, local content requirements combined with a high tariff on automobile imports are
popular among developing countries such as India, Thailand, Vietnam, Indonesia, Brazil, Argentina and
Mexico. Thus, it could be that while overseas production by automakers increases export demands for
intermediate goods produced at home, overseas production by parts suppliers could offset such a trade-
creating effect to the extent that exporting and investments are alternative strategies.16
The stronger export-reducing effects of the following-leader investments by Japanese parts suppliers
could emanate from the unique modalities of inter-firm relationships. The Japanese automobile industry is
characterized by vertical integration between automakers and parts suppliers. As Qiu and Spencer (2002)
discussed, the RSI by Japanese parts suppliers encourages Japanese automakers to choose domestic
16 Analyzing the Japanese automobile industry, Nishitateno (2013) presents evidence that overseas
production by parts suppliers offsets increased demands for intermediate goods resulting from overseas
production by automakers.

15
procurement within the keiretsu network, resulting in relatively low dependence on imported parts and
components.17 The important point is that when Japanese automakers build production plants abroad, this
locally forged inter-firm relationship is transferred to host countries (Kimura and Pugel, 1995).18
Therefore, overseas subsidiaries of Japanese automakers are also expected to rely on domestic
procurements rather than cross-border sourcing including importing from Japan. On the other hand,
overseas subsidiaries of the other TPCs tend to outsource their auto parts production globally, as their
industrial organizations are more market-oriented (IRC, 2004, 2008).
The smaller Japanese network effect contrasts with the finding of Greaney (2005, 2009) that the Japanese
network effect is stronger than those of other developed countries. However, care is needed in comparing
this study with Greaney’s work, as data and measurement of network effects are different.19 Moreover,
the different scope of the network effects leads to difficulties in comparing the results: this study
examines total network effects, mainly focusing on inter-firm network effects between automakers and
parts suppliers, whereas Greaney only analyzes intra-firm network effects.
6. Conclusion
In this paper, I explored whether networks could be a leading determinant of trade in auto parts, and
whether Japan is unique. The results clearly suggest that overseas production by automakers
17 The value of auto parts imports to Japan relative to domestic auto production is quite low compared
with the other TPCs. The ratio of auto parts imports (22 billion US dollars) to domestic auto production
(12 million units) for Japan was 1,899 in 2008. On the other hand, the counterparts for the other TPCs
are 10,784 for the United States, 13,216 for Germany, 14,327 for France, 19,931 for Italy, and 41,543
for Sweden. 18 The incentive is to utilize agglomeration externalities including easier information sharing among
keiretsu members, greater advantages of proximity due to the use of just-in-time delivery, and the use of
specialized components for which the specifications are developed within long-term supplier-assembler
relationships in Japan (Head et al., 1995, 1999; Blonigen, 2005). 19 Greaney (2009) employs firm-level data for nonbank foreign affiliates during the year 1992, 1997,
2002. The information relates to exports and imports of overseas subsidiaries in the United States from
8 developed countries including Japan.

16
headquartered in TPCs increases auto parts exports from their home country. The elasticity ranges from
0.38-0.50. The results also suggest that in the case of Japanese automakers overseas production by their
subsidiary plants is less important in determining auto part exports from Japan. I argue that the results
perhaps reflect a general tendency of Japanese part suppliers to internationalize their operations following
Japanese automakers, which could weaken Japanese network effects.
However, care is needed in generalizing the findings of this study due to the unique features of the
automobile industry. The automobile industry is characterized by imperfect competition resulting from
the important role of knowledge-based intangible assets produced by highly skilled labor and R&D. For
example, since automobile production inevitably accompanies negative externalities such as air pollution,
greenhouse gas emissions, and road accidents, a large amount of investment is required to mitigate these
problems. The oligopolistic nature of the automobile industry resulting from such large investments may
create network effects in international trade and smaller Japanese network effects, which may not exist to
the same extent in other industries. This examination of network effects on intermediate goods in other
industries could be an interesting research agenda to be explored.
Acknowledgements
I am grateful for research funding from the Crawford School of Public Policy at the Australian National
University. This paper also beneficial from comments from Prema-Chandra Athukorala, Hodaka Morita,
Paul Burke and two anonymous referees.
17
References
Anderson, J., Wincoop, E.V., 2003. Gravity with Gravitas: A solution to the border puzzle. American
Economic Review 93, 170-192.
Aoki, M., 1988. Information, Incentives and Bargaining in the Japanese Economy. Cambridge and New
York: Cambridge University Press.
Athukorala, P.C., Yamashita, N., 2006. Production fragmentation and trade integration: East Asia in a
global context. The North American Journal of Economics and Finance 17, 233-256.
Baldwin, R.E., Ottaviano, G.I.P., 2001. Multiproduct multinationals and reciprocal FDI dumping. Journal
of International Economics 54, 429-448.
Baldwin, R.E., Taglioni, D., 2013. Gravity Chains: Estimating bilateral trade flows when trade in
components and parts is important. In: Mattoo, A., Wang, Z., Wei, S.J. (Eds.). Trade in value
added: developing new measures of cross-border trade, Washington, DC: The World Bank, 161-
186.
Blonigen, B.A., Ellis, C.J., Fausten, D., 2005. Industrial groupings and foreign direct investment. Journal
of International Economics 65, 75– 91.
Fung, K.C., 1991. Collusive intra-industry trade. Canadian Journal of Economics 24, 391-404.
Greaney, T.M., 2003. Reverse importing and asymmetric trade and FDI: A networks explanation. Journal
of International Economics 61, 453–465.
Greaney, T.M., 2005. Measuring network effects on trade: Are Japanese affiliates distinctive? Journal of
Japanese and International Economics 19, 194–214.
Greaney, T.M., 2009. Measuring network effects on trade: A reexamination. Japan and the World
Economy 21, 219-225.
Grossman, G.M., Helpman, E., 2002. Integration versus Outsourcing in Industry Equilibrium. Quarterly
Journal of Economics 117, 85-120.
18
Head, K., Ries, J., Swenson, D., 1995. Agglomeration benefits and location choice: Evidence from
Japanese manufacturing investments in the United States. Journal of International Economics 38,
223-247.
Head, K., Ries, J., Swenson, D., 1999. Attracting foreign manufacturing: Investment promotion and
agglomeration. Regional Science and Urban Economics 29, 197-218.
Head, K., Ries, J., Spencer, B.J., 2004. Vertical networks and auto parts exports: Is Japan different?”
Journal of Economics and Management Strategy 13, 37-67.
Helpman, E., 2006. Trade, FDI, and the organization of firms. Journal of Economics Literature 44, 589-
630.
IRC., 2004. Hokubei jidosha sangyo to nihon meka no jigyosenryaku 2004 [Automobile Industry in North
America and Business Strategy of Japanese Automakers]. IRC Co., Ltd.
IRC., 2008. BRICs Jidosha sangyo no jittai 2008 [Investigation on Automobile Industry in BRICs]. IRC
Co., Ltd.
Jones, R.W., Kierzkowski, H., 1990. The role of services in production and international trade: A
theoretical framework. In: Jones, R.W., Krueger, A.O. (Eds.). The Political Economy of
International Trade: Essays in Honor of Robert E. Baldwin, Oxford: Basil Blackwell, 31-47.
Kimura, F., Ando, M., 2005. Two-dimensional fragmentation in East Asia: Conceptual framework and
empirics. International Review of Economics and Finance 14, 317-348.
Kimura, Y., Pugel, T.A., 1995. Keiretsu and Japanese direct investment in US manufacturing. Japan and
the World Economy 7, 481-503.
Lawrence, R.Z., 1991. Efficient or exclusionist?: The import behavior of Japanese corporate groups.
Brookings Papers on Economic Activity 1, 311-330.
Nishitateno, S., 2013. Global Production Sharing and the FDI–Trade Nexus: New Evidence from the
Japanese Automobile Industry. Journal of the Japanese and International Economies 27, 64-80.
Qiu, L.D., Spencer, B.J., 2002. Keiretsu and relationship-specific investment: Implications for market-
opening trade policy. Journal of International Economics 58, 49-79.
19
Rauch, J.E., 2001. Business and social networks in international trade. Journal of Economic Literature
39, 1177-1203.
Rauch, J.E., Feenstra, R.C., 1999. Introduction to symposium on “Business and social networks in
international trade”. Journal of International Economics 48, 3-6.
Saxonhouse, G.C., 1989. Differentiated products, economies of scale and access to the Japanese market.
In: Feenstra, R.C. (Eds.). Trade Policies for International Competitiveness. Chicago: University of
Chicago Press, 145-174.
Silva, J.M.C.S., Tenreyro, S., 2006. The log of gravity. Review of Economics and Statistics 88, 641-658.
Sturgeon, T., Biesebroeck, J.V., Gereffi, G., 2008. Value chains, networks and clusters: reframing the
global automotive industry. Journal of Economic Geography, 1-25.
Ueda, K., Sasaki, Y.N., 1998. The import behavior of Japanese corporate groups: Evidence from micro-
survey data. Japan and the World Economy 10, 1-11.
Wooldridge, J.M., 2002. Introductory Econometrics: A modern Approach. the United States: Thomson
South-Western.
Yeats, A.J., 1998. Just how big is global production sharing? Policy Research Working Paper 1871,
Washington, DC: The World Bank.

20
Table 1: Empirical evidence measuring network effects on international trade Author Variable Explained Measurement/Data Source Data/Technique Network effects
Lawrence
(1991)
Ratio of Japanese imports to
domestic demand in 1985
Share of industry sales by vertical keiretsu/
Dodwell Marketing Consultants(1986)
Cross section/
OLS
Domestic network (-)
Fung (1991) Net U.S export to Japan in
1980
Share of industry sales and employment by keiretsu/
Dodwell Marketing Consultants (1990)
Cross section/
OLS
Domestic network (-)
Ueda and
Sasaki (1998)
Imports by Japanese
manufacturing firms divided
by inputs in 1993
A binary variable that takes on a value of 1 if a firm
belongs to keiretsu/Nikkei (1993)
Cross section/
Tobit
Domestic network (+)
Head, Ries, and
Spencer (2004)
U.S auto parts exports to Japan
per car from 1989 to 1994
Share of keiretsu for each part in terms of the number
of suppliers/Dodwell Marketing Consultants (1990)
Panel data/
OLS
Domestic network (-)
Share of Japanese firm’s employment for each part in
U.S/ Dodwell Marketing Consultants (1997)
Global network (+)
Greaney (2005) Exports of foreign affiliates in
US to 8 major trade partners
including Japan
A binary variable that takes on a value of 1 if trade is
between foreign affiliates and their home country
/Bureau of Economic Analysis (1987, 1992, 1997)
Panel data/
Fixed effects model
Global network (+)
A binary variable that takes on a value of 1 if trade is
between Japanese affiliates and Japan
Japanese network effect
is more significant
Greaney (2009) Exports and imports of foreign
affiliates in US to 17 major
trade partners including Japan
A binary variable that takes on a value of 1 if trade is
between foreign affiliates and their home country/
Bureau of Economic Analysis (1987, 1992, 1997)
Panel data/
Fixed effects model
Global network (+)
A binary variable that takes on a value of 1 if trade is
between Japanese affiliates and Japan
Japanese network effect
is more significant
21
Table 2: Summary statistics
Variables Obs. Mean Std.
Dev. Min Max
Ln Export Value of Auto Parts (US dollars in nominal terms) 24,025 15.10 2.76 4.63 22.77
Ln Overseas Production (Volume) 24,025 10.84 2.34 0.69 15.03
Ln Gross Outputs in Automobile Industry, Exporter
(US dollars in PPP terms) 23,331 26.04 0.90 23.70 26.86
Ln Gross Outputs in Automobile Industry, Importer
(US dollars in PPP terms) 16,439 24.33 1.25 20.39 26.86
Ln Distance (Kilometers) 23,830 8.34 1.09 5.16 9.83
Ln Nominal Exchange Rate Index 23,737 0.50 2.97 17.99
Value/Weight Ratio (US dollars/ kg) 23,824 2.53 0.85 10.88
Adjacent Dummy 23,830 0.09 0.29 0 1
Language Dummy 23,830 0.06 0.24 0 1
Colony Dummy 23,830 0.04 0.19 0 1
Note: These are for the four-dimensional panel dataset.
22
Table 3: Fixed effects estimates of network effects
Products Coefficients Standard Errors R2 Observations
1 Tyres 0.12 (0.08) 0.92 112
2 Glasses 0.25*** (0.08) 0.83 114
3 Leaf springs 0.14** (0.06) 0.94 114
4 Mountings 0.38*** (0.07) 0.91 113
5 Engines 0.38*** (0.09) 0.86 115
6 Air Conditioners 0.09 (0.08) 0.86 114
7 Filters 0.11** (0.05) 0.91 115
8 Jacks/hoists 0.13 (0.41) 0.76 63
9 Gaskets 0.25*** (0.08) 0.92 115
10 Mechanical seals 0.14* (0.08) 0.91 115
11 Engine parts 0.14 (0.08) 0.86 115
12 Lighting/signaling equipments 0.30*** (0.09) 0.86 114
13 Lamps 0.16 (0.12) 0.82 104
14 Wire harness 0.27** (0.11) 0.84 113
15 Chassis and bodes 0.61** (0.24) 0.69 100
16 Bumpers 0.30*** (0.08) 0.9 113
17 Seat belts 0.23** (0.11) 0.76 104
18 Body parts 0.34*** (0.07) 0.87 115
19 Gear boxes 0.43*** (0.09) 0.89 115
20 Bearings 0.33** (0.15) 0.8 114
21 Wheels 0.38*** (0.10) 0.9 114
22 Transmission 0.41*** (0.08) 0.88 115
23 Radiators 0.26*** (0.09) 0.83 113
24 Mufflers and exhaust pipes 0.43*** (0.10) 0.88 112
25 Clutches 0.27*** (0.10) 0.85 115
26 Steering wheels 0.41*** (0.07) 0.86 114
27 Other parts of motor vehicles 0.22*** (0.07) 0.89 115
28 Clocks 0.26 (0.22) 0.85 51
29 Seats 0.14 (0.16) 0.78 106
30 Floor mats 0.22** (0.09) 0.9 115
31 Turbines 0.01 (0.08) 0.86 114
Pooled Estimates
Year 2008 0.41*** (0.08) 0.71 3,381
Year 2007 0.50*** (0.06) 0.73 3,256
Year 2006 0.47*** (0.07) 0.74 3,371
Year 2005 0.48*** (0.06) 0.73 3,393
Year 2004 0.38*** (0.05) 0.69 3,500
Year 2003 0.38*** (0.07) 0.7 3,405
Year 2002 0.42*** (0.05) 0.72 3,524
Notes: ***, **, and * indicate statistical significance at 1%, 5%, and 10%. Coefficients are for overseas
production by automakers headquartered in TPCs. Figures in parentheses are cluster-robust standard
errors by distance. The upper part of the table shows when equation (8) is separately estimated by
products for the year 2008. Coefficients on constants and other variables (exporter dummies, importer
dummies, distance, adjacency, language, colonial tie) are not reported. The lower part of the table shows
the results when equation (8) is directly estimated for each year. Product dummies, exporter-product
dummies, importer-product dummies, distance, adjacency, language, colonial tie are included into the
model, but their results are not reported.

23
Table 4: Determinants of auto part exports from 6 major auto producing countries with four-dimensional panel data
Dependent variables:
Ln Exports of auto parts from 6 major auto
producing countries (EX) (1) (2) (3) (4) (5) (6)
Ln Overseas Production (OSP) 0.43*** 0.37*** 0.45*** 0.32*** 0.34*** 0.27***
(0.05) (0.08) (0.05) (0.06) (0.06) (0.07)
Ln Distance (DIS) -0.81*** -0.87*** -0.75*** -0.99*** -0.94*** -0.63***
(0.14) (0.15) (0.24) (0.10) (0.11) (0.08)
Adjacent Dummy (ADJ) 0.80*** 0.14 1.61** 0.38 0.47* 0.44***
(0.29) (0.34) (0.62) (0.30) (0.30) (0.18)
Language Dummy (LAN) 0.22 0.63 0.16 0.21 -0.04 -0.05
(0.31) (0.40) (0.41) (0.43) (0.42) (0.25)
Colony Dummy (COL) -0.17 -0.71 -0.16 -0.45 -0.45 -0.36
(0.38) (0.57) (0.51) (0.40) (0.40) (0.26)
Ln Gross Outputs in Automobile Industry, 0.68*** 0.60*** 0.25**
Exporter (DAP) (0.13) (0.09) (0.11)
Ln Gross Outputs in Automobile Industry, 0.39*** 0.18** 0.39***
Importer (DAP) (0.09) (0.09) (0.09)
Value/Weight Ratio (VWR) 0.06 -0.02 -0.07
(0.15) (0.15) (0.29)
Ln (OSP) Ln (VWR) -0.03* -0.02 -0.001
(0.01) (0.01) (0.03)
Ln Nominal Exchange Rate (NER) -0.02 -0.10** 0.09*
(0.05) (0.05) (0.05)
Exporter-Product Fixed Effects Yes Yes Yes Yes Yes Yes Exporter-Product Fixed Effects Yes Yes Yes Yes Yes Yes
Product Fixed Effects Yes Yes Yes Yes Yes Yes
Year Fixed Effects Yes Yes Yes Yes Yes Yes Sample All Per Capita GNI
>$12,616
Per Capita GNI
<$12,616
All All All
Estimation Technique OLS OLS OLS OLS OLS PPML
R-Squared 0.69 0.75 0.69 0.74 0.73 n.a.
Observations 23,830 10,226 13,604 15,496 15,844 15,496 Notes: ***, **, and * indicate statistical significance at 1%, 5%, and 10%. Figures in parentheses are cluster-robust standard errors by distance. I analyze four-dimensional panel data, which is made of exporter, importer, product and year. Exporter includes 6 countries (Japan, United States, Germany, France, Italy, and Sweden), Importer covers 49 countries listed in Appendix 1, product include
31auto parts presented in Table 3 and time period is 7 years from 2002 to 2008. According to the World Bank, a country with GNI per capita $12,616 or more is classified as high income country.
The natural logarithm of value-added in automobile industry is included instead of gross outputs in Column (5). OLS stands for ordinary least squares, and PPML stands for Poisson pseudo-maximum-likelihood. Fisher-type unit root tests strongly reject the null hypothesis that all panels contain a unit root for every time-variant variable.

24
Table 5: A comparison of the interaction term between country dummies and overseas production
Japan USA France Sweden Italy Germany Ln Overseas Production (OSP) 0.26*** 0.22*** 0.23*** 0.20*** 0.24*** 0.24*** (0.04) (0.03) (0.04) (0.03) (0.04) (0.03) Country Dummy 1.46** -4.52*** -0.93* -4.28*** -0.07 2.01** (0.65) (1.53) (0.51) (0.73) (0.74) (0.83)
Country Dummy Ln (OSP) -0.12** 0.32** 0.01 0.24*** -0.08 -0.10 (0.05) (0.13) (0.05) (0.08) (0.07) (0.07) Notes: ***, **, and * indicate statistical significance at 1%, 5%, and 10%. Figures in parentheses are
cluster-robust standard errors by distance. I analyze four-dimensional panel data, which is made of
exporter (6), importer (49), product (31) and year (2002-2008). Coefficients on constants and other
variables (distance, language, adjacency, colonial ties) are not reported. Importer fixed effects, product
fixed effects, and year fixed effects are controlled, but not reported.
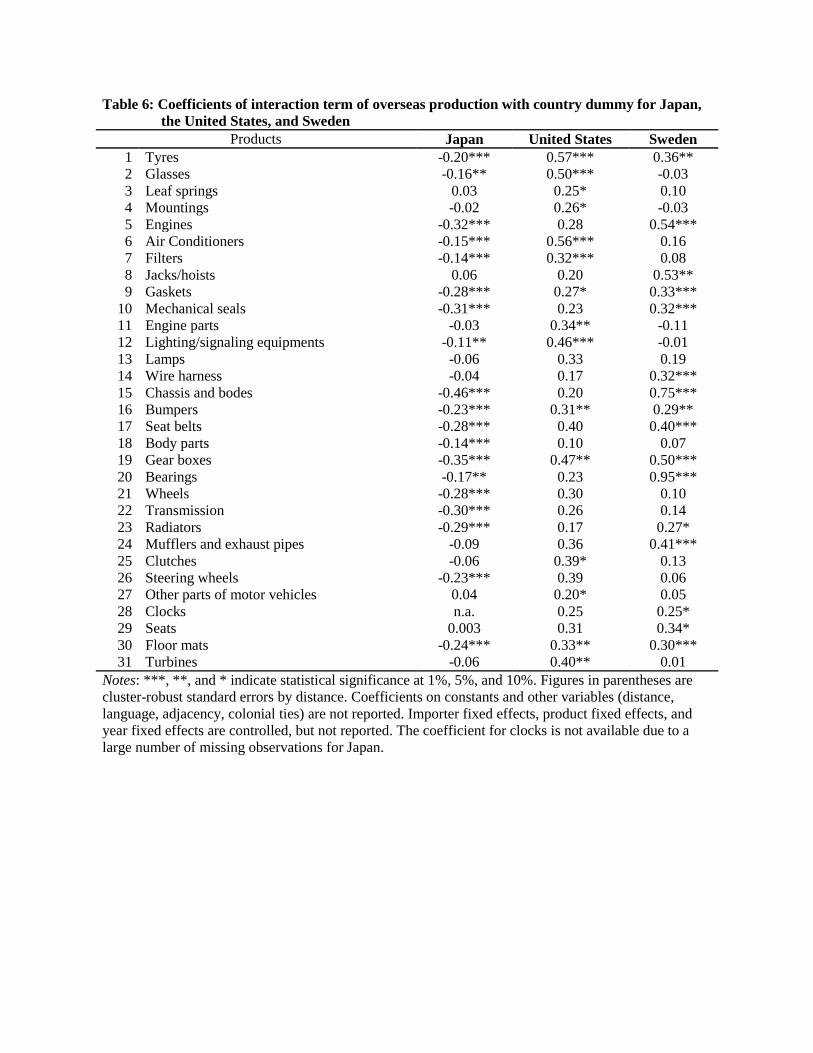
Table 6: Coefficients of interaction term of overseas production with country dummy for Japan,
the United States, and Sweden
Products Japan United States Sweden
1 Tyres -0.20*** 0.57*** 0.36**
2 Glasses -0.16** 0.50*** -0.03
3 Leaf springs 0.03 0.25* 0.10
4 Mountings -0.02 0.26* -0.03
5 Engines -0.32*** 0.28 0.54***
6 Air Conditioners -0.15*** 0.56*** 0.16
7 Filters -0.14*** 0.32*** 0.08
8 Jacks/hoists 0.06 0.20 0.53**
9 Gaskets -0.28*** 0.27* 0.33***
10 Mechanical seals -0.31*** 0.23 0.32***
11 Engine parts -0.03 0.34** -0.11
12 Lighting/signaling equipments -0.11** 0.46*** -0.01
13 Lamps -0.06 0.33 0.19
14 Wire harness -0.04 0.17 0.32***
15 Chassis and bodes -0.46*** 0.20 0.75***
16 Bumpers -0.23*** 0.31** 0.29**
17 Seat belts -0.28*** 0.40 0.40***
18 Body parts -0.14*** 0.10 0.07
19 Gear boxes -0.35*** 0.47** 0.50***
20 Bearings -0.17** 0.23 0.95***
21 Wheels -0.28*** 0.30 0.10
22 Transmission -0.30*** 0.26 0.14
23 Radiators -0.29*** 0.17 0.27*
24 Mufflers and exhaust pipes -0.09 0.36 0.41***
25 Clutches -0.06 0.39* 0.13
26 Steering wheels -0.23*** 0.39 0.06
27 Other parts of motor vehicles 0.04 0.20* 0.05
28 Clocks n.a. 0.25 0.25*
29 Seats 0.003 0.31 0.34*
30 Floor mats -0.24*** 0.33** 0.30***
31 Turbines -0.06 0.40** 0.01
Notes: ***, **, and * indicate statistical significance at 1%, 5%, and 10%. Figures in parentheses are
cluster-robust standard errors by distance. Coefficients on constants and other variables (distance,
language, adjacency, colonial ties) are not reported. Importer fixed effects, product fixed effects, and
year fixed effects are controlled, but not reported. The coefficient for clocks is not available due to a
large number of missing observations for Japan.

26
Appendix 1: List of trading countries
Asia Americas Europe Others
China Argentina Austria Australia India Brazil Belgium Botswana
Indonesia Canada Czech Republic. Egypt Iran Chile Finland Kenya
Japan Colombia France Morocco Malaysia Ecuador Germany Nigeria Pakistan Mexico Hungary South Africa
Philippines Uruguay Italy Tunisia
South Korea United States Netherlands
Thailand Venezuela Poland
Viet Nam Portugal
Romania
Russian Federation
Slovakia
Slovenia
Spain
Sweden
Turkey
United Kingdom
Uzbekistan
Note: The selection of trading countries is based on whether TPC automakers have one or more
overseas subsidiaries.

27
Appendix 2: List of automobile producers according to locations of headquarters
Japan United States Germany France Italy Sweden
Daihatsu Cadillac Audi Bugatti Alfa Romeo Saab Hino Chevrolet BMW Citroen Ferrari Scania
Honda Chrysler Evobus Renault Fiat Volvo
Isuzu Ford MAN Peugeot Iveco Trucks
Mazda Freightliner Mercedes-Benz Renault Trucks Lamborghini
Mitsubishi General Motors Mini Lancia
Mitsubishi Fuso Hummer Neoplan Maserati
Nissan Jeep Opel
Subaru Navistar Porsche
Suzuki Paccar Smart
Toyota Pontiac Unimog Sterling VolksWagen Western Star
Source: International Organization of Motor Vehicle Manufacturers (OICA): http://www.oica.net/
28
Appendix 3: List of definitions and data sources of variables
Variables Definition Data Source
EX Export value of auto parts measured in
nominal US dollars
UN Comtrade: (http://comtrade.un.org/)
VWR Value/weight ratio,
VWR = EX / NW where EX is nominal export value and NW
is net weight for each auto part
As above
DAP Gross output (converted to US dollars in
purchasing power parity terms) in the
automobile industry including manufacture
of motor vehicles (ISIC 341), manufacture
of bodies for motor vehicles (ISIC 342), and
manufacture of parts and components and
accessories for motor vehicles and their
engines (ISIC 343).
The International Yearbook of Industrial
Statistics of the United Nations Industrial
Development Organization (UNIDO) for
various years
OSP Volume of overseas production by
automobile producers headquartered in
traditional auto-producing countries (TPCs)
International Organisation of Motor Vehicle
Manufacturers:
(http://oica.net/category/about-us/)
NER Nominal exchange rate (calculated by local
currency units per US dollars) index (the
year 2002 is a base year)
World Development Indicators:
(http://www.worldbank.org/)
DIS Geographical distance between the capital
cities in kilometers
CEPII database:
(http://www.cepii.fr/anglaisgraph/bdd/fdi.htm)
ADJ Dummy variable indicating whether the two
countries are contiguous
As above
COL Dummy variable indicating whether the two
countries are colonially tied
As above
LAN Dummy variable indicating whether the two
countries share a common official language
As above

Working Papers in Trade and Development
List of Papers (as at 2014)
11/01 BUDY P RESOSUDARMO and SATOSHI YAMAZAKI, ‘Training and Visit (T&V) Extension
vs. Farmer Field School: The Indonesian’
11/02 BUDY P RESOSUDARMO and DANIEL SURYADARMA, ‘The Effect of Childhood Migration
on Human Capital Accumulation: Evidence from Rural-Urban Migrants in Indonesia’
11/03 PREMA-CHANDRA ATHUKORALA and EVELYN S DEVADASON, ‘The Impact of Foreign
Labour on Host Country Wages: The Experience of a Southern Host, Malaysia’
11/04 PETER WARR, ‘Food Security vs. Food Self-Sufficiency: The Indonesian Case’
11/05 PREMA-CHANDRA ATHUKORALA, ‘Asian Trade Flows: Trends, Patterns and Projections’
11/06 PAUL J BURKE, ‘Economic Growth and Political Survival’
11/07 HAL HILL and JUTHATHIP JONGWANICH, ‘Asia Rising: Emerging East Asian Economies as
Foreign Investors’
11/08 HAL HILL and JAYANT MENON, ‘Reducing Vulnerability in Transition Economies: Crises and
Adjustment in Cambodia’
11/09 PREMA-CHANDRA ATHUKORALA, ‘South-South Trade: An Asian Perspective’
11/10 ARMAND A SIM, DANIEL SURYADARMA and ASEP SURYAHADI, ‘The Consequences of
Child Market Work on the Growth of Human Capital’
11/11 HARYO ASWICAHYONO and CHRIS MANNING, ‘Exports and Job Creation in Indonesia
Before and After the Asian Financial Crisis’
11/12 PREMA-CHANDRA ATHUKORALA and ARCHANUN KOHPAIBOON, ‘Australia-Thailand
Trade: Has the FTA Made a Difference?
11/13 PREMA-CHANDRA ATHUKORALA, ‘Growing with Global Production Sharing: The Tale of
Penang Export Hub’
11/14 W. MAX CORDEN, ‘The Dutch Disease in Australia: Policy Options for a Three-Speed
Economy’
11/15 PAUL J BURKE and SHUHEI NISHITATENO, ‘Gasoline prices, gasoline consumption, and
new-vehicle fuel economy: Evidence for a large sample of countries’
12/01 BUDY P RESOSUDARMO, ANI A NAWIR, IDA AJU P RESOSUDARMO and NINA L
SUBIMAN, ‘Forest Land use Dynamics in Indonesia’
12/02 SHUHEI NISHITATENO, ‘Global Production Sharing in the Japanese Automobile Industry: A
Comparative Analysis’
12/03 HAL HILL, ‘The Best of Times and the Worst of Times: Indonesia and Economic Crises’
12/04 PREMA-CHANDRA ATHUKORALA, ‘Disaster, Generosity and Recovery: Indian Ocean
Tsunami’
12/05 KYM ANDERSON, ‘ Agricultural Trade Distortions During the Global Financial Crisis’
12/06 KYM ANDERSON and MARKUS BRUCKNER, ‘Distortions to Agriculture and Economic
Growth in Sub-Saharan Africa’

12/07 ROBERT SPARROW, ELLEN VAN DE POEL, GRACIA HANDIWIDJAJA, ATHIA YUMNA,
NILA WARDA and ASEP SURYAHADI, ‘Financial Consequences of Ill Health and Informal
Coping Mechanisms in Indonesia’
12/08 KYM ANDERSON, ‘Costing Global Trade Barriers, 1900 to 2050’
12/09 KYM ANDERSON, WILL MARTIN and DOMINIQUE VAN DER MENSBRUGGHE,
‘Estimating Effects of Price-distorting Policies Using Alternative Distortions Databases’
12/10 W. MAX CORDEN, ‘The Dutch Disease in Australia: Policy Options for a Three-Speed
Economy’ (revised version of Trade & Development Working Paper 2011/14)
12/11 KYM ANDERSON, ‘Policy Responses to Changing Perceptions of the Role of Agriculture in
Development’
12/12 PREMA-CHANDRA ATHUKORALA and SHAHBAZ NASIR, ‘Global Production Sharing and
South-South Trade’
12/13 SHUHEI NISHITATENO, ‘Global Production Sharing and the FDI–Trade Nexus: New Evidence
from the Japanese Automobile Industry’
12/14 PREMA-CHANDRA ATHUKORALA, ‘Sri Lanka’s Trade Policy: Reverting to Dirigisme?’
12/15 PREMA-CHANDRA ATHUKORALA and SISIRA JAYASURIYA, ‘Economic Policy Shifts in
Sri Lanka: The Post-conflict Development Challenge’
12/16 PREMA-CHANDRA ATHUKORALA and JUTHATHIP JONGWANICH, ‘How Effective are
Capital Controls? Evidence from Malaysia’
12/17 HAL HILL and JAYANT MENON, ‘Financial Safety Nets in Asia: Genesis, Evolution,
Adequacy, and Way Forward’
12/18 KYM ANDERSON, GORDON RAUSSER and JOHAN SWINNEN, ‘Political Economy of
Public Policies: Insights from Distortions to Agricultural and Food Markets’
13/01 KYM ANDERSON, ‘Agricultural Price Distortions: Trends and Volatility, Past and Prospective’
13/02 PREMA-CHANDRA ATHUKORALA and SWARNIM WAGLÉ, ‘Export Performance in
Transition: The Case of Georgia’
13/03 JAYANT MENON and THIAM HEE NG, ‘Are Government-Linked Corporations Crowding out
Private Investment in Malaysia?’
13/04 RAGHBENDRA JHA, HARI K. NAGARAJAN & KOLUMUM R. NAGARAJAN, ‘Fiscal
Federalism and Competitive Bidding for Foreign Investment as a Multistage Game’
13/05 PREMA-CHANDRA ATHUKORALA, ‘Intra-Regional FDI and Economic Integration in South
Asia: Trends, Patterns and Prospects’.
13/06 JAYANT MENON, ‘Can FTAs Support the Growth or Spread of International Production
Networks in Asia?’
13/07 PETER WARR and ARIEF ANSHORY YUSUF, ‘World Food Prices and Poverty in Indonesia’.
13/08 PETER WARR & ARIEF ANSHORY YUSUF, ‘Fertilizer Subsidies and Food Self-Sufficiency in
Indonesia’.
13/09 MIA AMALIA, BUDY P. RESOSUDARMO, & JEFF BENNETT, ‘The Consequences of Urban
Air Pollution for Child Health: What does self reporting data in the Jakarta metropolitan area
reveal?’
13/10 PREMA-CHANDRA ATHUKORALA, ‘Global Production Sharing and Trade Patterns in
East Asia’.
13/11 KYM ANDERSON, MAROS IVANIC & WILL MARTIN, ‘Food Price Spikes, Price Insulation,
and Poverty’.
13/12 MARCEL SCHRÖDER, ‘Should Developing Countries Undervalue Their Currencies?’.
13/13 PREMA-CHANDRA ATHUKORALA, ‘How India Fits into Global Production Sharing:
Experience, Prospects and Policy Options’.
13/14 PETER WARR, JAYANT MENON and SITTHIROTH RASPHONE, ‘Public Services and the
poor in Laos’.
13/15 SAMBIT BHATTACHARYYA and BUDY R. RESOSUDARMO, ‘Growth, Growth
Accelerations and the Poor: Lessons from Indonesia’
13/16 PREMA-CHANDRA ATHUKORALA and ARCHANUN KOPHAIBOON, ‘Trade and
Investment Patterns in Asia: Implications for Multilateralizing Regionalism’
13/17 KYM ANDERSON and ANNA STRUTT, ‘Emerging Economies, Productivity Growth, and
Trade with Resource-Rich Economies by 2030’
13/18 PREMA-CHANDRA ATHUKORALA and ARCHANUN KOHPAIBOON, ‘Global Production
Sharing, Trade Patterns and Industrialization in Southeast Asia’
13/19 HAL HILL, ‘Is There a Southeast Asian Development Model?’
14/01 RAMESH CHANDRA PAUDEL, ‘Economic Growth in Developing Countries: Is
Landlockedness Destiny?
14/02 ROSS McLEOD, ‘The ill-fated currency board proposal for Indonesia’
14/03 ALIN HALIMATUSSADIAH, BUDY P. RESOSUDARMO AND DIAH WIDYAWATI, ‘Social
Capital to Induce a Contribution to Environmental Collective Action in Indonesia: An
Experimental Method’
14/04 SHUHEI NISHITATENO and PAUL J. BURKE, ‘The motorcycle Kuznets curve’
14/05 PREMA-CHANDRA ATHUKORALA, ‘Sri Lanka’s Post-conflict Development Challenge:
Learning from the Past’
14/06 PREMA-CHANDRA ATHUKORALA, ‘Industrialisation through State-MNC Partnership:
Lessons from the Malaysia’s National Car Project’
14/07 DELWAR HOSSAIN, ‘Differential Impacts of Foreign Capital and Remittance Inflows on
Domestic Savings in the Developing Countries: A Dynamic Heterogeneous Panel Analysis’
14/08 NOBUAKI YAMASHITA, TOSHIYUKI MATSUURA and KENTARO
NAKAJIMA, ‘Agglomeration effects of inter-firm backward and forward linkages: evidence
from Japanese manufacturing investment in China’
14/09 SHUHEI NISHITATENO, ‘Network Effects on Trade in Intermediate Goods: Evidence from the
Automobile Industry’