UNIVERSITÀ DELLA CALABRIA Dipartimento di Economia e Statistica Ponte Pietro Bucci, Cubo 0/C 87036 Arcavacata di Rende (Cosenza) Italy http://www.ecostat.unical.it/ Working Paper n. 15 - 2009 TRADE IN INTERMEDIATE GOODS IN ITALIAN MANUFACTURING INDUSTRIES Fernanda Ricotta Dipartimento di Economia e Statistica Università della Calabria Ponte Pietro Bucci, Cubo 1/C Tel.: +39 0984 492445 Fax: +39 0984 492421 e-mail: [email protected] Ottobre 2009 Pubblicazione depositata ai sensi della L. 106 del 15-4-2004 e del DPR 252 del 3-5-2006

Welcome message from author
This document is posted to help you gain knowledge. Please leave a comment to let me know what you think about it! Share it to your friends and learn new things together.
Transcript

UNIVERSITÀ DELLA CALABRIA
Dipartimento di Economia e StatisticaPonte Pietro Bucci, Cubo 0/C
87036 Arcavacata di Rende (Cosenza)Italy
http://www.ecostat.unical.it/
Working Paper n. 15 - 2009
TRADE IN INTERMEDIATE GOODS IN ITALIAN MANUFACTURING INDUSTRIES
Fernanda Ricotta Dipartimento di Economia e Statistica
Università della Calabria Ponte Pietro Bucci, Cubo 1/C
Tel.: +39 0984 492445 Fax: +39 0984 492421
e-mail: [email protected]
Ottobre 2009
Pubblicazione depositata ai sensi della L. 106 del 15-4-2004 e del DPR 252 del 3-5-2006

1
Trade in Intermediate goods in Italian manufacturing industries
Fernanda Ricotta [email protected]
Università della Calabria, Dipartimento di Economia e Statistica 87030 Arcavacata di Rende (CS)
Abstract: Due to the emergence of global value chains, trade has increased in intermediates goods. The first objective of the paper is to provide a picture of Italian intermediate imports by industry and over time. Moreover, this paper attempts to study three possible factors than can influence the import of intermediate goods - global sourcing, outsourcing and MNE networks - using pooled cross-section data for the period 1985-2004 for Italian industries. The econometric results point to a different relationship for high and medium-high technology industries and medium-low and low technology industries relative to the role of inward and outward FDI in explaining the imported intermediate demand. The results suggest that outsourcing is important in explaining intermediate imports for medium-low and low technology industries. On the contrary, for high and medium-high technology industries the data give support to the global-sourcing hypothesis while the evidence for the MNE network hypothesis is weak. Key words: input-output tables, intermediate imports, multinational firms JEL: D57, F14, F23
1. Introduction Progress in communication and information technologies has enabled producers to slice up the value chain, breaking a production process into different stages. Countries can participate in global supply chain in which the various specialized intermediate goods are produced in different countries (Krugman, 1995, Grossman and Rossi Hausberg, 2006). As a consequence of this increasing international division of labour through disintegration of the production process, trade in intermediate goods plays an increasingly important role in trade, as several papers evidence (Yeats, 1998, Feenstra and Hanson, 1999; Hummel et al., 2001; Yi, 2003; OECD, 2008).
Three factors may have contributed to the growth of trade in intermediate goods (Kleinert, 2003). The first is linked to the greater use by firms of the cost advantages deriving from the purchase of materials from overseas suppliers with lower prices (global sourcing). The second is related to the strategy of transferring certain production phases to countries that enjoy comparative advantages in the production of particular products (foreign outsourcing). In this case the use of imported intermediate inputs is,

2
thus, linked to the increase of outward foreign direct investment (FDI) of the firms in industrialized countries. The final factor is connected with the increase in the importance of foreign multinational (MNE) networks. In this case it is the inward foreign direct investment that determines an increase in imported intermediate goods due to the intense trade between the foreign affiliates of the multinationals and other firms in the home country, including the parent company. The affiliates import specific intermediate goods from the home country in order to process and sell them abroad.
The first objective of the present study is to provide a picture of Italian intermediate imports by industry and over time. The second objective is to study the relationship between imported intermediate goods and outward and inward FDI. The analysis covers the years 1985, 1995, 2000 and 2004, distinguishing between high and medium-high technology industries and medium-low and low technology industries.
The structure of the paper is as follows. Section two provides description of how to measure the sectoral intermediate trade. This is followed by a short review of the theoretical bases of the relationship between imported intermediate goods and outward and inward FDI (section 3). Section 4 is devoted first to introducing the methodology, then to presenting the data used. Section 5 provides a picture of Italian intermediate imports by industry through several measures. Section 6 discuss the main results. Section 7 briefly concludes.
2. How to measure the sectoral intermediate trade Measuring intermediate imports is not straightforward, because these goods are defined by their use or function. Flour, for example, could be intermediate or final in its use. International trade data generally do not differentiate between components and assembled products. Yeats (1998), using the SITC Revision 2 classification, identified the product groups composed solely of components and parts of the machinery and transport equipment sector (SITC 7). However, outside this sector the SITC Classification fails to differentiate sufficiently between assembled goods and components.
Input-Output (I-O) tables are, on the contrary, organized around the uses of an industry output and can be, therefore, employed to measure intermediate goods imports. Input-Output tables describe the relationships between producers and consumers within an economy. The intermediate goods matrix provides data on the interactions between domestic suppliers and users of domestically produced raw materials, industrial components and services1. This information is complemented with the imported intermediate products matrix to cover all intermediate inputs. These data show how sectors of the economy provide input to and use output from, each other sectors to produce output. Domestic and imported intermediate tables are both square matrices of an equal number of supplying and user industries. A section of input-output table accounts for the supplies of goods that are not consumed by domestic industries, including, therefore, final consumption, gross fixed capital formation and exports. A key advantage of using I–O tables is that it avoids the arbitrariness of classification schemes that divide goods into ‘‘intermediate’’ and other categories. Input–output tables do not have this problem, because they classify the use as an input into another sector’s production or as final demand of each sector’s output. Another advantage is that
1 See Wixted et al. (2006) for a general overview of OECD input-output tables.

3
the data are available for disaggregated sectors. One criticism of I-O tables, however, is that they are invariably out-of-date. OECD I-O tables, for example, are updated every five years. Nevertheless, as Wixted et al. (2006) noted, input-output analyses have shown that input structures remain relatively stable for some years, so that periodic updates can provide a reliable picture of structural changes in production, consumption and trade.
Considering the imported intermediate matrix, where row i identifies supplying industries and column j identifies user industries, the total imported inputs of sector j is:
∑=i
mijj xII [1]
where mijx are imported transactions of intermediates from sector i to sector j.
However, a (large) part of the intermediates locally produced by suppliers, incorporate foreign raw materials, intermediaries such as parts and components, and semi-finished products produced abroad. In order to calculate the total import content, for example, of a nationally produced car, one has to consider the direct imports bought and used directly by the car makers, but also the indirect imports, i.e. the imports bought and used by domestic suppliers of these car makers. These total direct and indirect imports are known as “embodied imports” (EI) and are calculated as:
YAIAEI dm *)(* 1−−= [2]
where mA and dA are the input-output coefficients for imported and domestic
transactions, respectively, and Y is the diagonalised vector of outputs. Element mija of
mA denotes the imported inputs from sector i used to produce one unit of sector j 's
output. Element dija of dA is calculated as the ratio of industry usage of inputs relative
to total output. 1)( −− dAI is Leontief inverse matrix and describes how many units of
one good and service have to be produced at any stage of the value added chain in order to produce one unit of the final demand for goods and services. The Leontief matrix can be used to estimate the impacts on all industries resulting from a given increase in demand for goods and services from one particular industry. The sum of the elements contained in the columns of the EI matrix identifies the amount of the intermediate imports of all sectors that are directly and indirectly required to obtain the output of a sector.
Hummels et al. (1998, 2001) have, instead, considered a subset of intermediate imports, those used to produce goods that are exported, by introducing the term “vertical specialization”. As a result of global value chains and the corresponding geographical fragmentation of activities, countries become vertically specialised within the production process for some goods or services as companies tend to concentrate different production stages for a single good in each country. The vertical specialisation measure tries to reflect the process by which different countries become part of a single production chain, linking the imported inputs required by one country with its exports. The direct and indirect foreign content of countries’ exports (VS) is calculated as:
EAIAVS dm *)(* 1−−= [3]

4
where mA and dA , as in [2], contain, respectively, the input-output coefficients for
imported and domestic transactions and E is the diagonalised vector of exports2. In this fashion, the sum of the elements contained in the columns of the VS matrix identifies the amount of the intermediate imports of all sectors that are directly and indirectly required to obtain the export of a sector3.
The embodied imports and vertical specialisation are calculated assuming that all energy inputs are domestic, that is imported energy inputs4 are zero, for two reasons. First, a rise in the energy price implies an increase in import content of production and exports. Second, this effect could be relevant for a country highly dependent on imports of energy such as Italy.
3. Trade in Intermediate Goods and Foreign Direct Investment: Theoretical bases Progress in communication and information technologies has enabled a break-up of the production process. Countries participate in global supply chains in which the many inputs required to manufacture complex industrial goods are produced in different locations (Krugman, 1995; Grossman and Rossi Hausberg, 2006). Due to the emergence of global value chains, trade has increased not only in finished goods and services but also, and especially, in intermediates like primary goods, parts and components, and semi-finished goods, as several papers evidence (Yeats, 1998; Feenstra and Hanson, 1999; Hummel et al., 2001; Yi, 2003; OECD, 2008). As pointed out by Campa and Goldberg (1997), the use of the openness to trade indicator5 to measure the industry’s external orientation can be misleading because it fails to consider the growing use of foreign inputs in the production of domestic goods. This growth can be related to three possible causes. Globalisation should, in fact, be seen as a continuum of strategies that ranges from simply sourcing components from abroad to establishing globally distributed manufacturing networks. The first cause is associated to the deeper integration of goods markets that allow firms, in a quest for cost efficiency, to buy parts and components from foreign suppliers with lower purchase prices. In this case, trade on intermediate goods does not differ from trade in final goods. Following Kleinert (2003), this issue is defined as the global sourcing hypothesis.
However, imports of intermediate goods could be bound to the internationalization of production, therefore FDI could be a factor that influence the
2 In Hummels et al. (2001) E represents an nx1 vector of exports, instead Cadarso et al. (2007) introduced the diagonalised vector of exports to study the VS both by industry and product. 3 The calculation of the import content of exports or output using I-O information makes a number of implicit assumptions. First, the input-output coefficients of the matrix are treated as fixed and, thus, not responsive to price changes. Second, the same input-output requirements apply for the goods and services that are exported and those destined for final demand. Calculations are also based on the assumption that 100% of imports originate from foreign sources, which is not necessarily the case and may thus be a source of inaccuracy. Finally, the calculation assumes that the passing of a product back and forth among sectors occurs instantaneously or, at least, rapidly enough for the process to be completed within the time span measured in the input-output tables, typically a year (see US National Research Council of the National Academy of Science, 2006). 4 Energy and non-energy mining and quarrying have been excluded since this distinction was not available for 1985. 5 Openness to trade is calculated as imports plus exports revenues of final products divided by domestic production revenues.

5
demand of imported inputs. Two possible hypotheses could be identified: outsourcing and MNE networks.
The outsourcing hypothesis is identified whenever the use of resources located outside the national boundaries is motivated by geographic distribution of factor endowments. As Feenstra and Hanson (1995) illustrate by introducing in a Heckscher-Ohlin model the intermediate goods, firms respond to import competition from low-wage countries by moving non-skill intensive activities abroad6. This strategy allows firms to take advantages of difference in factor costs across countries. Therefore, foreign outsourcing may occur merely because firms replace domestic production of intermediate inputs with imports purchased from suppliers located abroad or may be related to vertical multinationals, as they move production of parts and components abroad. In this case, outward foreign direct investments (FDI) can be motivated by outsourcing motives and can, thus, be considered as a factor explaining the demand for intermediate imports.
For the MNE network hypothesis, the imports of intermediate goods can be driven also by inward FDI. Horizontal MNE build plants in multiple countries to produce products or services roughly similar to those the firm produces for its home market to serve the foreign market. The model of Kleinert (2001) stands in the tradition of Brainard (1993) but goes beyond in modelling the usage of intermediate goods in the production process of the final good. Brainard (1993) states that companies face the trade-off between transport costs to export or additional fixed costs for another plant if they decide to produce abroad. Since the manufacture of products involves the use of a greater variety of specialized intermediates, often specific to the company’s product, production in the foreign affiliate depends, to a certain extent, on the imports of intermediate goods from the MNE’s network.
This paper, following Kleinert (2003), tests the three hypotheses for Italian industries using an econometric pooled cross-section model described in the next section.
4. Econometric Model and Data Along the lines of Kleinert (2003) methodology, the role of global sourcing, outsourcing and MNE network is tested in the case of Italian manufacturing sectors using the following equation:
jtinwardjt
outwardjtjt DFDIFDIII εββββ ++++= 99_3210 [4]
where j indexes industries and t years, II are imported inputs, outwardFDI and inwardFDI represents employees of, respectively, foreign affiliates of Italian MNEs and
of Italian affiliates of foreign MNEs. D_99 is a dummy variable that assume value zero during the pre-Euro period and one during the Euro period and jtε is an error term.
The outsourcing hypothesis implies that 1β must be positive while for the MNE
network hypothesis to hold 2β must be positive. The dummy variable D_99 is included to consider the impact of the adoption of the Euro.
6 In the equilibrium, the South produces and exports a range of inputs up to some critical ratio of skilled to unskilled labor, with the North producing the remainder of the inputs. The Northern inputs will include activities which use skilled labor.

6
According to global-sourcing hypothesis, neither outward nor inward FDI is a determinant of imported inputs. This hypothesis will be tested in two different ways. In equation [4] the intercept contains information about global sourcing and, then, a positive and significant intercept is a signal of the importance of global sourcing. Moreover a growing positive intercept between different periods of time indicate an increasing propensity to global sourcing. A more direct test of global-sourcing hypothesis is to include a trend variable in [4]: if there is a tendency towards a more intense use of imported intermediate goods independent of FDI this should be reflected in the time trend variable. The estimated equation is:
jttinwardjt
outwardjtjt TFDIFDIII εβββ ++++= 210 [5]
T trend variable. Moreover, since high and medium-high technology industries may differ from medium-low and low technology industries, equation [4] and [5] are modified to account for sector technological status and the interaction of technological status, FDI variables and trend:
jtinwardjt
outwardjt
inwardjt
outwardjtjt
FDItecD
FDItecDtecDDFDIFDIII
εβ
ββββββ
++
++++++=
*_
*__99_
6
543210 [6]
jttinwardjt
outwardjtt
inwardjt
outwardjtjt
TtecDFDItecD
FDItecDtecDTFDIFDIII
εββ
ββββββ
+++
++++++=
*_*_
*__
76
543210 [7]
where D_tec is a dummy variable that is equal to zero for medium-low and low technology industries and one for high and medium-high technology industries. Some sector dummies are included in all the equations to control for difference among the sectors.
Models from [4] to [7] probably suffer from omitted variable problems since unit heterogeneity is not considered. A way to allow for unobserved heterogeneity is the fixed effects model, that is7:
jtjinwardjt
outwardjtjt aDFDIFDIII εββββ +++++= 99_3210 [8]
where ja captures all unobserved, time-constant factors that affect jtII .
While Kleinert (2003) tests the three hypotheses by using sectoral data of six countries8 for three time points (the late-1970s/early-1980s, the mid-1980s and 1990), the present study uses a pooled-cross section model. Pooled cross-section data allow the global sourcing hypothesis to be tested by the trend variable as in model [5] and [7], while Kleinert tests the global sourcing hypothesis by looking at the intercept in the different periods.
The present study uses harmonised input-output tables estimated by the OECD. The OECD Input-Output Database shows transactions in industry-by-industry9
7 The fixed effects specification is reported only for model [4] although it will be estimated for all models. 8 USA, Germany, Japan, France, UK and Australia. The first three countries for all the time points considered, the last three economies for the mid-1980s and 1990. 9 Input-output tables can be produced by illustrating flows between the sales and purchases of industry outputs or by illustrating the sales and purchases of product outputs. The OECD Input-Output database is based on the former, reflecting in part the collection mechanisms for many other data sources such as research and development data, employment statistics, pollution data, energy consumption, which are in the main collected by establishments, and so industry. More information on this aspect and on the OECD I-O tables in general is available in Yamano and Ahmad (2006).

7
symmetric tables10 at basic prices. The Input-Output tables consist of matrices of inter-industrial transaction flows of goods and services (domestically produced and imported) in current prices. The data are not deflated primarily due to the lack of price deflators at industry level for imported inputs.
The tables are based on ISIC Revision 3 industrial classifications. Material inputs include ISIC Rev. 3 from 1 to 3, that is agriculture, mining, manufacturing, electricity, gas and construction.
Individual industries have been grouped in high and medium-high technology industries and medium-low and low technology industries. High and medium-high technology sectors include refined petroleum products, chemical, machinery, office and computing machinery, electrical machinery, radio and communication equipment, medical and precision instruments, vehicles and non motor vehicles (24 and from 29 to 35 ISIC rev3), while low-technology sectors take in food related sectors, textiles and related industries, wood products, paper and publishing, non-metallic mineral products, iron and non ferrous metals, fabricated metal products, furniture and various other industries (from 15 to 23, 25 to 28 and 36 to 37 ISIC rev3).
On the basis of OECD I-O tables for the years 1985, 1995, 2000 and 2004 intermediate imports demand is analysed for individual Italian manufacturing industries. The results are reported in the next section.
For FDI data, the number of employees of foreign affiliates of Italian MNEs (outward FDI) and of Italian affiliates of foreign MNEs (inward FDI) are used. These data are different and preferable to using the FDI stocks as Kleinert (2003) since they are better at estimating the internationalization of production.11 The source of data for the number of employees12 of foreign affiliates of Italian parent companies and of Italian affiliates of foreign parent companies are CNEL (1999), CNEL (2002) and Mariotti and Mutinelli (2007) and refer to Reprint-Politecnico di Milano-ICE database.
5. Trade in Intermediate goods in Italian manufacturing industries Table 1 reports data on intermediate inputs in the manufacturing sector distinguishing between imported and domestic intermediate goods and for two different aggregates: total and material inputs except energy13. For the whole period (1985-2004), material imported inputs, excluding energy, grew at a faster rate than domestic inputs, especially due to the strong growth during the first decade, but declined from 2000 to 2004.
10 Several studies employ the use matrices of input-output tables (commodity by sector), instead of the symmetrical matrix. The main difference with respect to the symmetrical matrix is that in the latter secondary production for each sector is relocated in its corresponding “pure industry”. 11 The statistics on FDI derived from balance of payments tend, in fact, to underestimate economic activity of MNEs abroad for two main reasons. In the first place, the statistics on FDI only measure the flow associated with the financial investment by the foreign entrepreneur; hence, if the activity of the firms involved is financed by loans obtained on local financial markets, they will not be reported in the balance of payment statistics. Secondly, such data only reveal the country and the sector that are the primary destination of the financial flows: if, for example, the productive activity abroad is indirectly controlled through foreign financial companies, the location of the plants and the sector they belong to will not be reported correctly. For the difference between Reprint-Politecnico di Milano-ICE database and FDI data from Balance of payments see Mariotti and Mutinelli (2007). 12 For 2004 data refer to employed persons. 13 For definition see footnote 4.

8
Tab. 1 Intermediate inputs in the manufacturing sector (mill. euros) Annual growth rate
1985 1995 2000 2004
85-04 85-95 95-00 00-04
Intermediate Imports 59830 100503 139692 129149 4,1 5,3 6,8 -1,9 Intermediate Material Import without Energy 36825 84439 109262 97489 5,3 8,7 5,3 -2,8 Domestic Intermediate 157277 324986 375167 470488 5,9 7,5 2,9 5,8 Domestic Material Intermediate without Energy 104738 164039 216748 242237 4,5 4,6 5,7 2,8 Total Intermediate 217107 425489 514859 599637 5,5 7,0 3,9 3,9 Total Intermediate Material without Energy 141563 248478 326010 339726 4,7 5,8 5,6 1,0 Output 331914 623558 744838 853631 5,1 6,5 3,6 3,5
Source: Author’s calculations from OECD Input-Output tables.
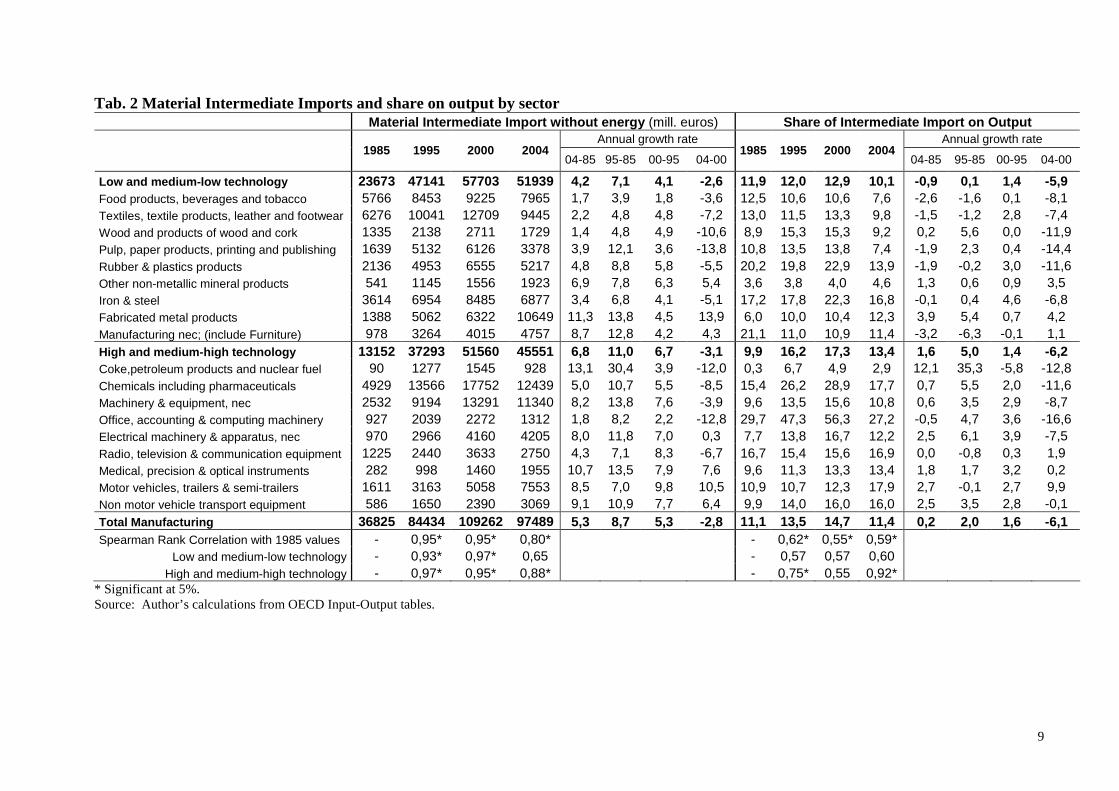
Table 2 focus on material intermediate imports by sector. All manufacturing branches experience a growth for the whole period and the first two sub-periods, on the contrary, almost all sectors show a negative annual growth rate during the last period. When aggregating by technological content, high and medium-high technology industries show the highest annual growth rates in all periods, excluding the final one. Between 2000 and 2004, high tech industries show the most pronounced fall both in value term and as share of output. Sectors that use more imported inputs are either high and medium-high technology industries, such as chemicals, office and computing machinery, communication equipment, non motor vehicle transport equipment and, for 2004, motor vehicles, or scale intensive industries (plastics products and iron, steel and non-ferrous metals).
Products characterising the Italian pattern of specialization (tab. 5) such as textiles, clothing and footwear, other manufacturing products and machinery and equipment are not among the sectors with the high imported inputs share (tab. 2).
In the last period (2000-2004), when almost all sectors show a negative annual growth rate of the share of imported inputs on output, the growth rate of the motor vehicles industry is remarkable (10%). Other sectors with a positive annual growth rate are, among the low tech industries, fabricated metal products (4.2%), other non metallic mineral products (3.5%), other manufacturing (1.1%) and, among high tech sectors, communication equipment (1.9%).
Table 3 reports embodied imports (EI) by sector, that is the amount of the intermediate imports of all industries directly and indirectly required to obtain the output of a sector. In the EI measure, material imported inputs (excluding mining) but also imported services directly and indirectly used by the sector are considered. For the manufacturing sector, embodied imports show an annual growth rate of 5.3% between 1985 and 2004 and amount to 21% of manufacturing output in 2004. In all years, except 1985, embodied imports are more prominent in high and medium-high intensive technology sectors (22.7% in 2004) than low and medium-low technology industries (19.4%). Sectors with the highest EI shares in 2004 are office and computing machinery, motor vehicles, chemicals and non motor vehicle transport equipment, among high tech industries, and iron and steel and plastics products, among low and medium-low technology industries.
9
Tab. 2 Material Intermediate Imports and share on output by sector Material Intermediate Import without energy (mill. euros) Share of Intermediate Import on Output Annual growth rate Annual growth rate
1985 1995 2000 2004
04-85 95-85 00-95 04-00 1985 1995 2000 2004
04-85 95-85 00-95 04-00
Low and medium-low technology 23673 47141 57703 51939 4,2 7,1 4,1 -2,6 11,9 12,0 12,9 10,1 -0,9 0,1 1,4 -5,9 Food products, beverages and tobacco 5766 8453 9225 7965 1,7 3,9 1,8 -3,6 12,5 10,6 10,6 7,6 -2,6 -1,6 0,1 -8,1 Textiles, textile products, leather and footwear 6276 10041 12709 9445 2,2 4,8 4,8 -7,2 13,0 11,5 13,3 9,8 -1,5 -1,2 2,8 -7,4 Wood and products of wood and cork 1335 2138 2711 1729 1,4 4,8 4,9 -10,6 8,9 15,3 15,3 9,2 0,2 5,6 0,0 -11,9 Pulp, paper products, printing and publishing 1639 5132 6126 3378 3,9 12,1 3,6 -13,8 10,8 13,5 13,8 7,4 -1,9 2,3 0,4 -14,4 Rubber & plastics products 2136 4953 6555 5217 4,8 8,8 5,8 -5,5 20,2 19,8 22,9 13,9 -1,9 -0,2 3,0 -11,6 Other non-metallic mineral products 541 1145 1556 1923 6,9 7,8 6,3 5,4 3,6 3,8 4,0 4,6 1,3 0,6 0,9 3,5 Iron & steel 3614 6954 8485 6877 3,4 6,8 4,1 -5,1 17,2 17,8 22,3 16,8 -0,1 0,4 4,6 -6,8 Fabricated metal products 1388 5062 6322 10649 11,3 13,8 4,5 13,9 6,0 10,0 10,4 12,3 3,9 5,4 0,7 4,2 Manufacturing nec; (include Furniture) 978 3264 4015 4757 8,7 12,8 4,2 4,3 21,1 11,0 10,9 11,4 -3,2 -6,3 -0,1 1,1 High and medium-high technology 13152 37293 51560 45551 6,8 11,0 6,7 -3,1 9,9 16,2 17,3 13,4 1,6 5,0 1,4 -6,2 Coke,petroleum products and nuclear fuel 90 1277 1545 928 13,1 30,4 3,9 -12,0 0,3 6,7 4,9 2,9 12,1 35,3 -5,8 -12,8 Chemicals including pharmaceuticals 4929 13566 17752 12439 5,0 10,7 5,5 -8,5 15,4 26,2 28,9 17,7 0,7 5,5 2,0 -11,6 Machinery & equipment, nec 2532 9194 13291 11340 8,2 13,8 7,6 -3,9 9,6 13,5 15,6 10,8 0,6 3,5 2,9 -8,7 Office, accounting & computing machinery 927 2039 2272 1312 1,8 8,2 2,2 -12,8 29,7 47,3 56,3 27,2 -0,5 4,7 3,6 -16,6 Electrical machinery & apparatus, nec 970 2966 4160 4205 8,0 11,8 7,0 0,3 7,7 13,8 16,7 12,2 2,5 6,1 3,9 -7,5 Radio, television & communication equipment 1225 2440 3633 2750 4,3 7,1 8,3 -6,7 16,7 15,4 15,6 16,9 0,0 -0,8 0,3 1,9 Medical, precision & optical instruments 282 998 1460 1955 10,7 13,5 7,9 7,6 9,6 11,3 13,3 13,4 1,8 1,7 3,2 0,2 Motor vehicles, trailers & semi-trailers 1611 3163 5058 7553 8,5 7,0 9,8 10,5 10,9 10,7 12,3 17,9 2,7 -0,1 2,7 9,9 Non motor vehicle transport equipment 586 1650 2390 3069 9,1 10,9 7,7 6,4 9,9 14,0 16,0 16,0 2,5 3,5 2,8 -0,1 Total Manufacturing 36825 84434 109262 97489 5,3 8,7 5,3 -2,8 11,1 13,5 14,7 11,4 0,2 2,0 1,6 -6,1 Spearman Rank Correlation with 1985 values - 0,95* 0,95* 0,80* - 0,62* 0,55* 0,59*
Low and medium-low technology - 0,93* 0,97* 0,65 - 0,57 0,57 0,60 High and medium-high technology - 0,97* 0,95* 0,88* - 0,75* 0,55 0,92*
* Significant at 5%. Source: Author’s calculations from OECD Input-Output tables.

10
Tab. 3 Embodied Imports (1) and share on output by sector Embodied Import (mill. euros) Share of Embodied Import on Output Annual growth rate Annual growth rate
1985 1995 2000 2004
04-85 95-85 00-95 04-00 1985 1995 2000 2004
04-85 95-85 00-95 04-00
Low and medium-low technology 42188 87727 102976 99880 4,6 7,6 3,3 -0,8 21,2 22,3 23,0 19,4 -0,5 0,5 0,6 -4,2 Food products, beverages and tobacco 9168 15880 17089 17521 3,5 5,6 1,5 0,6 19,8 19,9 19,7 16,7 -0,9 0,0 -0,2 -4,1 Textiles, textile products, leather and footwear 11040 19578 22822 18527 2,8 5,9 3,1 -5,1 22,9 22,5 23,8 19,2 -0,9 -0,2 1,2 -5,3 Wood and products of wood and cork 2601 3536 4505 3439 1,5 3,1 5,0 -6,5 17,3 25,3 25,4 18,3 0,3 3,8 0,1 -7,8 Pulp, paper products, printing and publishing 2914 9161 10855 7282 4,9 12,1 3,5 -9,5 19,1 24,2 24,5 16,0 -0,9 2,4 0,3 -10,1 Rubber & plastics products 3129 7721 9478 9063 5,8 9,5 4,2 -1,1 29,7 30,8 33,1 24,2 -1,1 0,4 1,4 -7,5 Other non-metallic mineral products 1570 3660 4751 5223 6,5 8,8 5,4 2,4 10,5 12,3 12,3 12,5 0,9 1,6 0,0 0,5 Iron & steel 6374 10766 11859 11114 3,0 5,4 2,0 -1,6 30,3 27,6 31,2 27,2 -0,6 -0,9 2,5 -3,3 Fabricated metal products 3914 10539 12984 18783 8,6 10,4 4,3 9,7 16,8 20,9 21,4 21,6 1,3 2,2 0,5 0,3 Manufacturing nec; (include Furniture) 1479 6886 8631 8928 9,9 16,6 4,6 0,8 31,9 23,2 23,5 21,4 -2,1 -3,1 0,3 -2,3
High and medium-high technology 24020 59706 78936 77177 6,3 9,5 5,7 -0,6 18,1 25,9 26,5 22,7 1,2 3,6 0,5 -3,8 Coke, petroleum products and nuclear fuel 260 1566 1960 1793 10,7 19,7 4,6 -2,2 0,9 8,2 6,3 5,5 9,7 24,1 -5,2 -3,2 Chemicals including pharmaceuticals 8128 17439 21690 19325 4,7 7,9 4,5 -2,8 25,4 33,7 35,3 27,5 0,4 2,9 1,0 -6,1 Machinery & equipment, nec 5397 16960 22768 22317 7,8 12,1 6,1 -0,5 20,4 24,9 26,7 21,3 0,2 2,0 1,4 -5,5 Office, accounting & computing machinery 1069 2318 2433 1745 2,6 8,1 1,0 -8,0 34,3 53,7 60,3 36,1 0,3 4,6 2,3 -12,0 Electrical machinery & apparatus, nec 2465 5497 6983 7601 6,1 8,3 4,9 2,1 19,5 25,6 28,1 22,1 0,7 2,8 1,8 -5,8 Radio, television & communication equipment 1750 3965 6020 3863 4,3 8,5 8,7 -10,5 23,8 25,1 25,9 23,7 0,0 0,5 0,7 -2,2 Medical, precision & optical instruments 557 1770 2378 3170 9,6 12,3 6,1 7,4 18,9 20,1 21,7 21,7 0,7 0,6 1,5 0,1 Motor vehicles, trailers & semi-trailers 3322 7190 11057 12264 7,1 8,0 9,0 2,6 22,5 24,4 26,8 29,1 1,4 0,8 1,9 2,0 Non motor vehicle transport equipment 1071 3001 3647 5101 8,6 10,8 4,0 8,7 18,1 25,4 24,4 26,6 2,0 3,4 -0,8 2,1
Total Manufacturing 66208 147433 181912 177058 5,3 8,3 4,3 -0,7 19,9 23,6 24,4 20,7 0,2 1,7 0,7 -4,0 (1) Excluding mining. Source: Author’s calculations from OECD Input-Output tables.
11
Comparing table 2 and 3, sectors where material imported inputs represent more than 60% of total imports of intermediaries, directly and indirectly used by sector, are office and computing machinery, communication equipments, chemicals, medical instruments, motor vehicles, for high tech industries and only iron and steel for low tech.
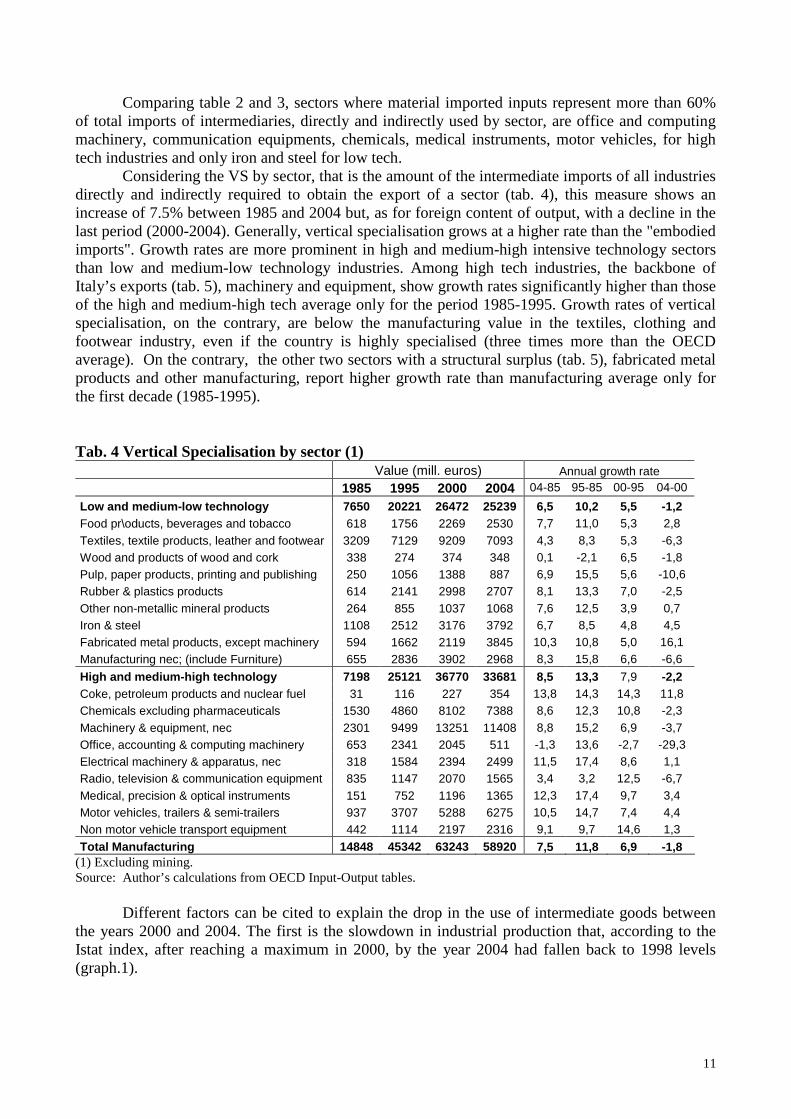
Considering the VS by sector, that is the amount of the intermediate imports of all industries directly and indirectly required to obtain the export of a sector (tab. 4), this measure shows an increase of 7.5% between 1985 and 2004 but, as for foreign content of output, with a decline in the last period (2000-2004). Generally, vertical specialisation grows at a higher rate than the "embodied imports". Growth rates are more prominent in high and medium-high intensive technology sectors than low and medium-low technology industries. Among high tech industries, the backbone of Italy’s exports (tab. 5), machinery and equipment, show growth rates significantly higher than those of the high and medium-high tech average only for the period 1985-1995. Growth rates of vertical specialisation, on the contrary, are below the manufacturing value in the textiles, clothing and footwear industry, even if the country is highly specialised (three times more than the OECD average). On the contrary, the other two sectors with a structural surplus (tab. 5), fabricated metal products and other manufacturing, report higher growth rate than manufacturing average only for the first decade (1985-1995).
Tab. 4 Vertical Specialisation by sector (1) Value (mill. euros) Annual growth rate
1985 1995 2000 2004 04-85 95-85 00-95 04-00
Low and medium-low technology 7650 20221 26472 25239 6,5 10,2 5,5 -1,2 Food pr\oducts, beverages and tobacco 618 1756 2269 2530 7,7 11,0 5,3 2,8 Textiles, textile products, leather and footwear 3209 7129 9209 7093 4,3 8,3 5,3 -6,3 Wood and products of wood and cork 338 274 374 348 0,1 -2,1 6,5 -1,8 Pulp, paper products, printing and publishing 250 1056 1388 887 6,9 15,5 5,6 -10,6 Rubber & plastics products 614 2141 2998 2707 8,1 13,3 7,0 -2,5 Other non-metallic mineral products 264 855 1037 1068 7,6 12,5 3,9 0,7 Iron & steel 1108 2512 3176 3792 6,7 8,5 4,8 4,5 Fabricated metal products, except machinery 594 1662 2119 3845 10,3 10,8 5,0 16,1 Manufacturing nec; (include Furniture) 655 2836 3902 2968 8,3 15,8 6,6 -6,6
High and medium-high technology 7198 25121 36770 33681 8,5 13,3 7,9 -2,2 Coke, petroleum products and nuclear fuel 31 116 227 354 13,8 14,3 14,3 11,8 Chemicals excluding pharmaceuticals 1530 4860 8102 7388 8,6 12,3 10,8 -2,3 Machinery & equipment, nec 2301 9499 13251 11408 8,8 15,2 6,9 -3,7 Office, accounting & computing machinery 653 2341 2045 511 -1,3 13,6 -2,7 -29,3 Electrical machinery & apparatus, nec 318 1584 2394 2499 11,5 17,4 8,6 1,1 Radio, television & communication equipment 835 1147 2070 1565 3,4 3,2 12,5 -6,7 Medical, precision & optical instruments 151 752 1196 1365 12,3 17,4 9,7 3,4 Motor vehicles, trailers & semi-trailers 937 3707 5288 6275 10,5 14,7 7,4 4,4 Non motor vehicle transport equipment 442 1114 2197 2316 9,1 9,7 14,6 1,3
Total Manufacturing 14848 45342 63243 58920 7,5 11,8 6,9 -1,8 (1) Excluding mining. Source: Author’s calculations from OECD Input-Output tables.
Different factors can be cited to explain the drop in the use of intermediate goods between
the years 2000 and 2004. The first is the slowdown in industrial production that, according to the Istat index, after reaching a maximum in 2000, by the year 2004 had fallen back to 1998 levels (graph.1).

12
Graf. 1 Industrial Production Index (Base 2000=100)
93.0
94.0
95.0
96.0
97.0
98.0
99.0
100.0
101.0
1998 1999 2000 2001 2002 2003 2004
Source: Based on data from ISTAT.
The rise in the cost of inputs could be another factor that might explain the drop in the demand for intermediate goods. The expansion of world demand for oil and raw materials, under the impetus of growing consumption in China and in the other emerging Asian economies, has put upward pressure on raw material prices. The rise in energy and raw material prices influenced the overall increase for import prices. However, the appreciation of the euro against the dollar has, in part, countered the upward pressure of import prices. On the other hand, even delocalization by Italian manufacturing industry, leading to a move towards flows of final products, could have contributed to a decline in the imports of intermediate good. Another factor could be the shift of firms strategies with a resizing of the recourse to the market and a re-orientation toward a verticalization of production. As underlined by the Italian employers’ association, Confindustria (2005), signs of an ending to the tendency of the Italian industrial system to abandon non-core activities and reduce the level of vertical integration, in an attempt to confront competitors and to cut fixed costs, began to emerge around the second half of the 1990s. The signs from the world of business draw attention to the fact that there was an excessive de-verticalization based on an overall undervaluation of the transaction costs. If, on the one hand, the operating costs of an organization are reduced through the move away from vertical organization, at the same time, recourse to the market is not a zero cost option, rather it entails a surge in the cost of reorganizing business activity that can offset any benefits. Moreover, the drive toward an ever increasing upgrading of production, induced by strong competition in the lower segments of the market, has had the effect of redefining, at least in part, the role played by cost factors vis-à-vis that played by quality factors, leading in many cases to the re-integration within the company of the production phases previously hived off, in an attempt to improve control throughout the entire production process.
Table 2 (bottom rows) reports Spearman rank correlations with 1985 values to detect the similarities or differences of industries over time. These statistics measure the correlation between two variables on the basis of the ordinal positions of the two variables. If the Spearman rank correlation statistic is high and positive then the industries with the highest values of intermediate imports in 1985 are also the industries that show high vale of the variable in the other year. If the Spearman rank correlation statistic is high and negative this suggests significant changes over time of the variable. The rank correlation in the case of material intermediate imports show that in 2004 the relative ranking is more similar to that of 1985 than in the other years, especially for high and

13
medium-high technology industries. In 2004 high and medium-high technology industries which use imported inputs the most are the same in 1985.
The Italian results are substantially in line with the evidence from other advanced economies (De Backer and Yamano, 2008; IFM, 2007) that imports of intermediate goods and vertical specialization are found to be the highest in basic industries and high-tech industries. For the latter group, parts and components are often produced in one country before being exported for assembly. This international division of labor is found in industries such as electrical machinery, radio and communication equipment, and office, accounting and computing machinery. But while for advanced countries the intensity of the use of imported intermediate goods in these industries is related to their comparative advantages (IMF, 2007), this is not the case for Italy (tab. 5). It is worth noting that employees of domestic affiliates of foreign MNEs in medium and medium-high tech firms represent more than 65% of the foreign MNE affiliates’ total employees (tab. 6). This intensive presence of domestic affiliates of foreign MNEs in high-tech industries could contribute to explaining the highest demand for intermediate imports of this group. This hypothesis will be tested in the next section.
Tab. 5 Contribution to trade as % of total manufacturing trade (1). 1985 1995 2000 2004 Low and medium-low technology Food products, beverages and tobacco -3.9 -2.6 -1.5 -1.3 Textiles, textile products, leather and footwear 6.2 4.6 3.9 2.5 Wood and products of wood and cork 0.6 -0.6 -0.5 -0.4 Pulp, paper products, printing and publishing -0.5 -1.0 -0.6 -0.3 Rubber & plastics products 0.4 0.7 0.6 0.8 Other non-metallic mineral products 1.2 1.1 1.1 0.9 Iron, steel & non-ferrous metals -2.9 -3.6 -2.9 -2.7 Fabricated metal products, except machinery 1.7 1.3 1.1 2.3 Manufacturing nec (include Furniture) 0.7 2.5 2.4 1.5
High and medium-high technology Coke, refined petroleum products and nuclear fuel -1.5 -1.0 -0.6 0.2 Chemicals including pharmaceuticals -3.4 -3.9 -2.8 -3.1 Machinery & equipment, nec 4.8 6.1 5.6 5.5 Office, accounting & computing machinery -0.6 -0.7 -1.4 -1.4 Electrical machinery & apparatus, nec 0.7 0.0 0.1 0.5 Radio, television & communication equipment -1.4 -1.3 -1.5 -1.7 Medical, precision & optical instruments -0.4 -0.6 -0.6 -0.5 Motor vehicles, trailers & semi-trailers -1.8 -1.1 -2.3 -3.1 Non motor vehicle transport equipment 0.3 0.1 0.0 0.3
Total Manufacturing - - - - (1) Contribution to trade is given by:
)(
)()()(
ME
MEMEMECT ii
iii ++
−−−=
If there were no comparative advantage or disadvantage for any industry i, a country’s total trade balance (surplus or deficit) should be distributed across industries according to their share in total trade. A positive value for an industry indicates a structural surplus and a negative one a structural deficit. Source: Author’s calculations from OECD Input-Output tables.

14
Tab. 6 Employees of foreign affiliates of Italian MNEs and of Italian affiliates of foreign MNEs
Employees of foreign affiliates of
Italian MNEs Annual growth rate Employees of Italian affiliates of
foreign MNEs Annual growth rate
1985 1995 2000 2004 04-85 95-85 00-95 04-00 1985 1995 2000 2004 04-85 95-85 00-95 04-00
Low and medium-low technology 101004 269127 332746 497150 8,7 10,3 4,3 10,6 134760 181525 198291 201993 2,2 3,0 1,8 0,5
Food products, beverages and tobacco 15056 60460 103110 121169 11,6 14,9 11,3 4,1 38001 49202 43847 38269 0,0 2,6 -2,3 -3,3
Textile products, leather and footwear 11899 52576 67667 132593 13,5 16,0 5,2 18,3 11232 13424 14110 14317 1,3 1,8 1,0 0,4
Wood and products of wood and cork 3430 6651 7791 9969 5,8 6,8 3,2 6,4 289 240 31 223 -1,4 -1,8 -33,6 63,8
Pulp, paper products, printing and publishing 6453 28532 29834 30633 8,5 16,0 0,9 0,7 10109 19372 22217 26796 5,3 6,7 2,8 4,8
Rubber & plastics products 32870 25763 29812 32369 -0,1 -2,4 3,0 2,1 23436 27867 34643 38038 2,6 1,7 4,4 2,4
Other non-metallic mineral products 6949 36333 32999 74183 13,3 18,0 -1,9 22,4 17711 24614 27261 24893 1,8 3,3 2,1 -2,2
Iron & steel 20684 39616 43779 52579 5,0 6,7 2,0 4,7 15279 24710 27657 22075 2,0 4,9 2,3 -5,5
Fabricated metal products, except machinery 2968 9411 10901 27752 12,5 12,2 3,0 26,3 14008 15342 20924 29916 4,1 0,9 6,4 9,3
Manufacturing nec; (include Furniture) 695 9785 6853 15903 17,9 30,3 -6,9 23,4 4695 6754 7601 7466 2,5 3,7 2,4 -0,4
High and medium-high technology 143184 320311 309777 354483 4,9 8,4 -0,7 3,4 332361 345786 361797 396996 0,9 0,4 0,9 2,3
Coke, petroleum products and nuclear fuel 11219 17112 12858 3865 -5,5 4,3 -5,6 -26,0 7787 5200 5216 6926 -0,6 -4,0 0,1 7,3
Chemicals excluding pharmaceuticals 17080 35058 28061 33920 3,7 7,5 -4,4 4,9 90022 99166 92296 98631 0,5 1,0 -1,4 1,7
Machinery & equipment, nec 16225 62381 86392 93216 9,6 14,4 6,7 1,9 73460 83801 92973 101600 1,7 1,3 2,1 2,2
Office, accounting & computing machinery 7744 6367 2846 2750 -5,3 -1,9 -14,9 -0,9 36626 15278 13694 4525 -10,4 -8,4 -2,2 -24,2
Electrical machinery & apparatus, nec 35319 40978 39583 49717 1,8 1,5 -0,7 5,9 46713 48684 51021 39965 -0,8 0,4 0,9 -5,9 Radio, television & communication equipment 6850 19444 30927 48330 10,8 11,0 9,7 11,8 40031 51724 46345 37480 -0,3 2,6 -2,2 -5,2
Medical, precision & optical instruments 2805 11403 9003 15223 9,3 15,1 -4,6 14,0 13422 14091 14296 17632 1,4 0,5 0,3 5,4
Motor vehicles, trailers & semi-trailers 45327 123830 99165 92040 3,8 10,6 -4,3 -1,8 22372 24506 41936 76161 6,7 0,9 11,3 16,1
Non motor vehicle transport equipment 615 3738 942 15422 18,5 19,8 -24,1 101,2 1928 3336 4020 14076 11,0 5,6 3,8 36,8
Total Manufacturing 244188 589438 642523 851633 6,8 9,2 1,7 7,3 467121 527311 560088 598989 1,3 1,2 1,2 1,7 Source: Author’s calculations from Reprint-Politecnico di Milano-ICE database.

15
6. Trade in Intermediate Goods and Foreign Direct Investment in Italian sectors The poolability of the data over time has been tested. The null hypothesis of the poolability test is that all time parameters are equal to corresponding pooled parameters. The resulting test statistic, F(9,60)=1.51, does not reject the null hypothesis in favour of poolable data with respect to time.
Table 7 shows the results of the pooled cross-section regressions, estimated using the White correction for heteroskedasticity. Model [4] supports the outsourcing hypothesis (column 1): 1β is positive and statistically significant. The intercept is positive and significant, moreover, when estimating the model for two sub-periods, before 2000 and after 2000, the size of the constant increases (from 2.99 to 3.99) giving support to the global-sourcing hypothesis. The coefficient of the dummy variable D_99 is positive and statistically significant, indicating that the introduction of the euro has had a significant impact on the demand of imported intermediate goods.
Model [5] (column 2) confirms the outsourcing as well as the global-sourcing hypothesis: the outward FDI variable and the trend have both a positive effect on intermediate imports. Including dummy variables to control for sectoral differences14 the same results hold true for model [4]15 in column (3) and [5] in column (4).
However, considering equation [6] (column 5) and equation [7] (column 6) coefficient 4β ,
5β , 6β and 7β are significantly different from zero supporting the idea that, in high and medium-
high technology industries, demand for imported inputs differs from that of medium-low and low technology industries. The outsourcing hypothesis finds support only in the case of medium-low and low technology industries. For high and medium-high technology industries, the results give support to the MNE network hypothesis as well as to the global-sourcing hypothesis.
The inclusion of some sector dummies does not change the results for model [7] (column 8, table 7) while for equation [6] only the outsourcing hypothesis receives support merely for medium-low and low technology industries (column 7 of tab. 7).
Estimations with fixed effects confirm the evidence for outsourcing and global sourcing (column 9 and 10, table 7) as a major driving force for the demand of intermediate imports for medium-low and low technology industries and high and medium-high technology industries (column 11 and 12, table 7), respectively.
These results are in contrast with the strong support for the MNE network hypothesis and the weak evidence for outsourcing hypothesis found by Kleinert (2003). For Italian manufacturing industries, the econometric results point to a different relationship for high and medium-high technology industries and medium-low and low technology industries relative to the role of inward and outward FDI in explaining the imported intermediate demand.
14 In model [4] and [5] dummy variables have been introduced for the sectors that show in 2004 a share of intermediate imports on output higher than the one of manufacturing. Sectors are: chemicals, plastics products, iron, steel and non-ferrous metals, fabricated metal products, office and computing machinery, electrical machinery, communication equipment, medical and precision instruments, motor vehicles and non motor vehicle transport equipment. Therefore, only sector dummies with a significant coefficient have been considered in regressions. 15 The size of intercept rises from 2.77 for period before 2000 an 3.00 after 2000.

16
Tab. 7 Intermediate Imports and Offshoring versus MNE Networks (1985, 1995, 2000, 2004) Pooled Cross-section Fixed Effects Dependent variable: ln(imported inputs)
(1) (2) (3) (4) (5) (6) (7) (8) (9) (10) (11) (12)
Costant 3.22*** 3.10*** 3.28*** 3.65*** 4.42*** 4.02*** 4.18*** 3.65*** 4.14*** 4.85*** 4.26*** 4.00*** FDI outward 0.39*** 0.35*** 0.43*** 0.44*** 0.30*** 0.36*** 0.35*** 0.44*** 0.34*** 0.20** 0.26** 0.38** FDI inward 0.08 0.09 0.02 0.00 0.07 0.05 0.03 0.00 0.03 0.05 0.11 0.08 D_99 0.46** 0.43*** 0.52*** 0.49*** 0.49*** 0.51*** Trend 0.22** 0.06 0.10 0.06 0.29*** 0.08 D_tec -2.33 -3.63** -3.83** -2.29 -2.33 D_tec*FDI outward -0.36** -0.20 -0.36** -0.14 -0.36* 0.19 -0.16 D_tec*FDI inward 0.47** 0.50*** 0.60*** 0.33 0.47** -0.21 -0.05 D_tec*Trend 0.35** 0.32** 0.35** 0.31** Chemicals 1.08*** 0.83*** 0.90*** 0.82*** Iron & steel 0.41** 0.30 0.33* 0.30 Fabbricated metal products 0.72*** 0.61** 0.52** 0.61** Electrical machinery -0.50* -0.29 -0.34 -0.29 Medical and precision instruments -0.80*** -0.66*** -0.63** -0.66*** Motor vehicles 0.47* -0.07 Fixed effects test 8.05*** 9.07*** 6.36*** 7.46*** No. observations 72 72 72 72 72 72 72 72 72 72 72 72 Adjusted R2 (1) 0.40 0.41 0.53 0.61 0.51 0.55 0.56 0.61 0.54 0.58 0.55 0.64 F-statistic 24.64*** 23.18*** 22.80*** 17.63*** 13.17*** 11.69*** 14.02*** 17.63*** 19.67*** 23.49*** 11.84*** 14.01*** White heteroskedasticity-consistent standard errors and covariance. *, **, *** significant at the 10%, 5% and 1% levels, respectively. (1) For fixed effects model within R-squared.

17
The evidence for the outsourcing hypothesis is strong but only for medium-low and low technology industries. For high and medium-high technology industries the results support the global-sourcing hypothesis. The Italian economy has not been able to foster the growth of competitive firms in high tech sectors, excluding machinery and equipment, and so this type of intermediate good cannot be provided by the domestic industry but has to be imported. This peculiarity of Italian industrial structure could explain the evidence for the global-sourcing hypothesis for high and medium-high technology industries. There is weak evidence for the MNE network hypothesis in high and medium-high technology industries only.
7. Conclusions Input-Output tables, since they are organized around the uses of an industry output, avoid the need to classify goods in often arbitrary ways and, thus, can be employed to measure imports of intermediate goods.
Generally, the use of intermediate imports increased in Italy sharply during the period 1985 until 2000 but declined thereafter (2000-2004). Vertical specialisation grows to a higher rate than the "embodied imports". A comparison of the high and medium-high technology industries and medium-low and low technology industries shows both a higher share on output and growth rates for the former group. Sectors that use more imported inputs are either high and medium-high technology industries, such as chemicals, office and computing machinery, communication equipment, non motor vehicle transport equipment and, for 2004, motor vehicles, or scale intensive industries (plastics products and iron, steel and non-ferrous metals). Products characterising the Italian pattern of specialization such as textiles, clothing and footwear, other manufacturing products and machinery and equipment are not among the sectors with the high share of imported inputs.
All measures analysed show a decline between 2000 and 2004 of imported inputs. Different factors can explain this drop. First, the slowdown in industrial production in the same period. Second, the rise in the cost of inputs, in part, countered by the appreciation of the euro. On the other hand, even delocalization by Italian manufacturing industry, leading to a move towards flows of final products, could have contributed to a decline in the imports of intermediate good. Another factor could be the shift of firms strategies with a resizing of the recourse to the market and a re-orientation toward a verticalization of production.
In this paper, three hypotheses explaining trade in intermediate products have been tested using pooled cross-section data for the period 1985-2004: global sourcing, outsourcing and MNE networks. The global sourcing hypothesis for trade in intermediate goods implies that firms buy the intermediate goods, which they use as inputs, from the cheapest supplier. The outsourcing hypothesis predicts a positive relationship of outward FDI to imported intermediate goods, whereas the MNE network hypothesis predicts a positive relationship of inward FDI stocks to imported intermediate goods.
The econometric results point to a different relationship for high and medium-high technology industries and medium-low and low technology industries relative to the role of inward and outward FDI in explaining the imported intermediate demand. The results suggest that outsourcing is important in explaining the intermediate imports for medium-low and low technology industries. For high and medium-high technology industries the data give support to the global-sourcing hypothesis. The Italian economy has not been able to foster the growth of competitive firms in high tech sectors, and so this type of intermediate good cannot be provided by the domestic industry but has to be imported. This peculiarity of Italian industrial structure could explain the evidence for the global-sourcing hypothesis for high and medium-high technology industries. There is weak evidence for the MNE network hypothesis in high and medium-high technology industries only.

18
References Brainard, S. L. (1993), “A Simple Theory of Multinational Corporations and Trade with a Tradeoff
between Proximity and Concentration”, NBER Working Paper No. 4269.
Campa, J. and L.S. Goldberg (1997), The evolving external orientation of manufacturing: a profile of four countries, Federal Reserve Bank New York, Economic Policy Review, July, 53-81.
Cadarso M.A., N. Gómez, L.A. López and M.A. Tobarra (2007), Vertical specialisation in EU
manufacturing and services sectors, Paper presented at 16th International Conference on Input-Output Techniques, Istanbul, 2-6 July.
CNEL (1999): “Italia Multinazionale 1998”, Documenti CNEL: Roma. CNEL (2002): “Italia Multinazionale 2000”, Documenti CNEL: Roma. Confindustria (2005), Crescere. Materiali di riflessione sullo sviluppo delle imprese italiane. Fiera
del Levante, Bari, 18-19 marzo. De Backer K. and N. Yamano (2008), The Measurement of Globalisation Using International
Input-Output Tables, in OECD, “Staying Competitive in the Global Economy: Moving up the Value Chain”, OECD Publications: Paris.
Feenstra, R. C. and G. H. Hanson (1995), “Foreign Investment, Outsourcing and Relative Wages”,
NBER Working Paper No. 5121. Feenstra R. C. and G. H. Hanson (1999), The impact of outsourcing and high-technology capital on
wages: Estimates for the United States, 1979-1990, The Quarterly Journal of Economics, 114(3), 907-940.
Grossman G. M. and E. Rossi-Hansberg (2006), The rise of offshoring: it's not wine for cloth
anymore, Proceedings, Federal Reserve Bank of Kansas City, 59-102. Hijzen A., H. Gorg and R. Hine (2005), International outsourcing and the skill structure of labour
demand in the United Kingdom, Economic Journal, vol. 115, 860-878. Hummels D., D. Rapoport and K. Yi (1998), Vertical Specialization and the Changing Nature of
World Trade, Federal Reserve Bank New York, Economic Policy Review, June, 79-99. Hummels, D., J. Ishii and K.Yi (2001), The nature and growth of vertical specialization in world
trade, Journal of International Economics, 54(1), 75-96. IMF (2007), World Economic Outlook, April: Washington, D.C. Kleinert, J. (2001), The Time Pattern of the Internationalization of Production, German Economic
Review, 2(1), 79–98. Kleinert J. (2003), Growing Trade in Intermediate Goods: Outsourcing, Global Sourcing, or
Increasing Importance of MNE Networks? Review of International Economics, 11(3), 464–482.
Krugman P. R. (1995), Growing World Trade: Causes and Consequences, Brookings Papers on
Economic Activity, 1,327–77.

19
Mariotti S. and M. Mutinelli (2007), “Italia Multinazionale 2005”, Rubbettino Editore: Soveria Mannelli.
OECD (2008), Staying Competitive in the Global Economy: Moving up the Value Chain, OECD
Publications: Paris. United States National Research Council (2006), Analyzing the U.S. Content of Imports and the
Foreign Content of Exports, National Academy of Sciences, <http://www.nap.edu/catalog/11612.html>.
Wixted B, N. Yamano and C. Webb (2006), “Input-Output Analysis in an Increasingly Globalised
World: Applications of OECD's Harmonised International Tables", OECD Science, Technology and Industry Working Papers , No. 7.
Yamano N. and N. Ahnad (2006), “The OECD Input-Output Database: 2006 Edition”, OECD
Science, Technology and Industry Working Papers No. 8. Yi K.M. (2003), Can vertical specialization explain the growth of world trade?, Journal of Political
Economy, 11(1), 52-102. Yeats A. (1998), “Just how big is global production sharing”, World Bank Policy Research
Working Paper No. 1871.

20
Appendix Tab. A1 Concordance Input-Output OECD data to FDI data Code I-O
OECD Description I-O OECD Code
Ateco Description FDI data
4 Food products, beverages and tobacco 15 Basic food products 5 Textiles, textile products, leather and footwear 17 Textiles 5 Textiles, textile products, leather and footwear 18 Clothing 5 Textiles, textile products, leather and footwear 19 Leather products and footwear 6 Wood and products of wood and cork 20 Wood and wood products 7 Pulp, paper products, printing and publishing 22 Printing and publishing
25 Manufacturing nec; recycling (include Furniture) 36 Furniture, other manufacturing n.e.c. 4 Food products, beverages and tobacco 15 Derived food products 4 Food products, beverages and tobacco 15 Beverages 4 Food products, beverages and tobacco 16 Tobacco 7 Pulp, paper products, printing and publishing 21 Pulp, paper and paper products 8 Coke, petroleum products and nuclear fuel 23 Coke, petroleum, nuclear fuel 9 Chemicals including pharmaceuticals 24 Basic chemical products 9 Chemicals including pharmaceuticals 24 Soaps, detergents and cosmetics 9 Chemicals including pharmaceuticals 24 Artificial and synthetic fibres
11 Rubber & plastics products 25 Tyres and other rubber products 11 Rubber & plastics products 25 Plastic products 12 Other non-metallic mineral products 26 Glass and glass products 12 Other non-metallic mineral products 26 Other non-metallic mineral products 13 Iron & steel 27 Basic metals 15 Fabricated metal products 28 Fabricated metal products 16 Machinery & equipment, nec 29 Household appliances 18 Electrical machinery & apparatus, nec 31 Wires and cables 18 Electrical machinery & apparatus, nec 31 Motor vehicle components (electrical) 18 Electrical machinery & apparatus, nec 31 Other electrical products and comp. 21 Motor vehicles, trailers & semi-trailers 35-34 Motor vehicles and bicycles 21 Motor vehicles, trailers & semi-trailers 34 Motor vehicle components (mechanical) 16 Machinery & equipment, nec 29 Mechanical machinery 18 Electrical machinery & apparatus, nec 31 Electrical machinery 22 Non motor vehicle transport equipment 35 Ships, boats, railway rolling stock 9 Chemicals including pharmaceuticals 24 Specialty chemical products 9 Chemicals including pharmaceuticals 24 Pharmaceuticals
17 Office, accounting & computing machinery 30 Office and computing equipment 19 Radio, television & communication equipment 32 Electronic equipment and products 20 Medical, precision & optical instruments 33 Instruments, watches and clocks 22 Non motor vehicle transport equipment 35 Aerospace
Related Documents