DOCUMENT RESUME
ED 052 851 RC 005 366
AUTHOR Beaulieu, David L.TITLE Native American Students in Standard Metropolitan
Statistical Areas: A Selective Analysis of 1968 HEWData.
INSTITUTION Minnesota Univ., Minneapolis.PUB DATE Dec 70NOTE 122p.
EDRS PRICE EDRS Price MF-$0.65 HC-$6.58DESCRIPTORS *American Indians, *Enrollment, *Metropolitan Areas,
National Surveys, Population Trends, *PublicSchools, *School Demography, School Districts,St "dents, Teachers
ABSTRACTAs part of a forthcoming report entitled "The
Education of Urban Indian Children in the United States," thisdocument is a selective summary of 1968 data from the Department ofHealth, Education, and Welfare concerning racial/ethnic breakdowns ofpublic school students in standard metropolitan statistical areas( SMSA's). Data for the overall survey were reported to the Office forCivil Rights by school district superintendents and/or stateeducation agencies. All school districts with 3,000 or moreenrollment (1967-68) were surveyed. Smaller school districts wereselected for inclusion in the survey in a statistically random mannerbased on district enrollment. This report provides information onurban American Indian student demography in 169 SMSA's in the UnitedStates (including the District of Columbia). Statistical chartsshowing the state, school district, and number of schools in thedistrict, number of Indian students and teachers, and other pertinentinformation make up the major portion of the report. (EL)
U.S. DEPARTMENT OF HEALTH,EDUCATION & WtLFAREOFFICE OF EDUCATIONr-4 THIS DOCUMENT HAS BEEN REPRO-
DUCED EXACTLY AS RECEIVED FROMTHE PERSON OR ORGANIZATION ORIG-
CO MATING a. POINTS OF VIEW OR OPIN-IONS STATED DO NOT NECESSARILY
C\J REPRESENT OFFICIAL OFFICE OF EDU-CATION POSITION OR POLICY.
i.
CD NATIVE AMERICAN STUDENTS IN STANDARDc:a METROPOLITAN STATISTICAL AREAS:1.1..i A SELECTIVE ANALYSIS OF 1968 HEW DATA
byDavid L. Beaulieu
edited by
Arthur M. HarkinsRichard G. WoodsI. Karon Sherarts
Training Center forCommunity Programs
in coordination withOffice of Community Programs
Center for Urban and Regional Affairs
University of MinnesotaMinneapolis, Minnesota
December, 1970
TABLE OF CONTENTS
Introduction 1
Survey Description and Source of Data 2
Survey Universe 3
Editing and Pro'essing of Data 3
An Overview of the Current Study 5
Footnotes 25
Appendix A - Northeast States
B - Southeast States
C - Mid North Central States
D - Mid South Central States
E - Southwest States
F - Northwest States

TABLE OF TABLES
SMSAs By Numbers of Indian Students in Public Schools 6
Distribution of SMSAs Ly Indian Student Population Frequenciesand Proportions 8
Detailed SMSA Data by Region 11
Mid North Central States 11
Northwest States 14
Southeast States 15
Mid South Central States 17
Northeast States 20
Southwest States 23
TABLE OF MAPS
Maps A - E follow p. 9
Map A - Surveyed State Totals
Map B - Estimate State Totals
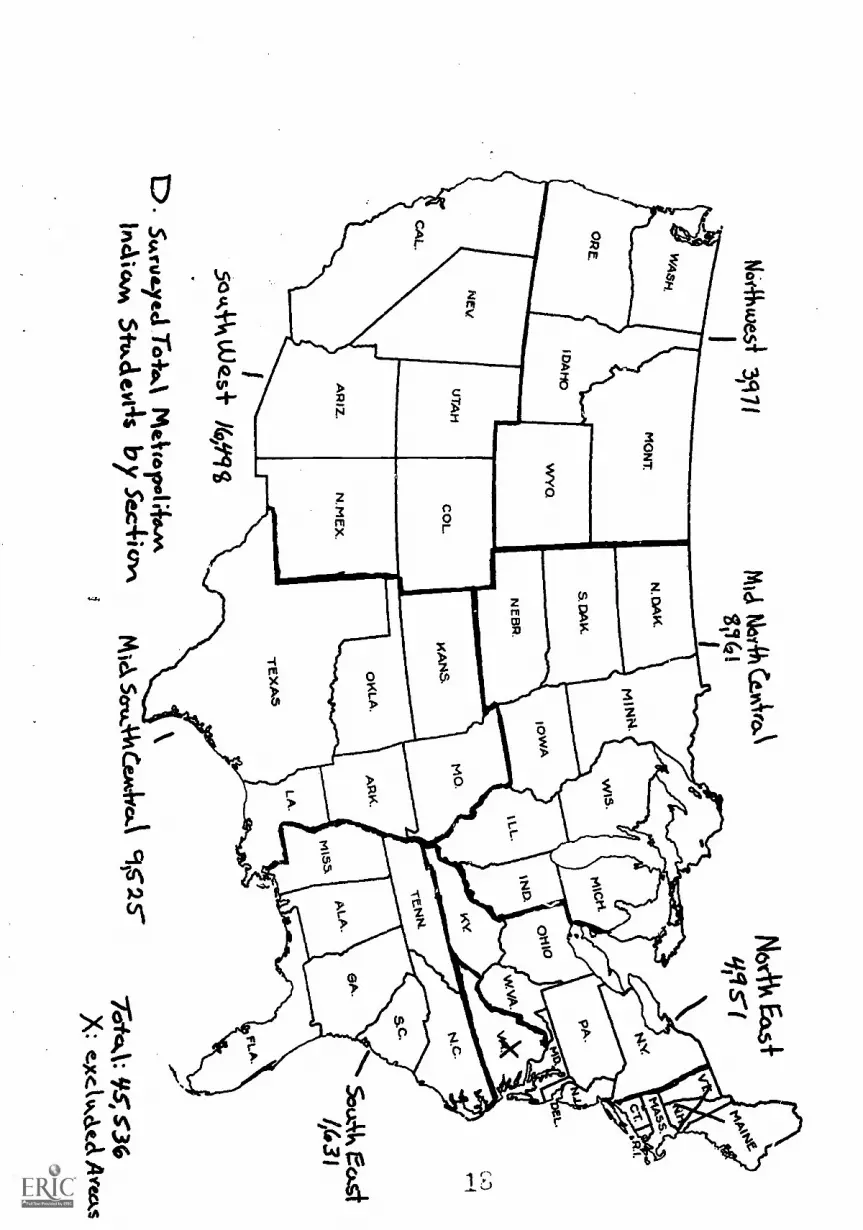
Map C - Surveyed Total Metropolitan Indian Students
Map D Surveyed Total Metropolitan Indian Students bySection
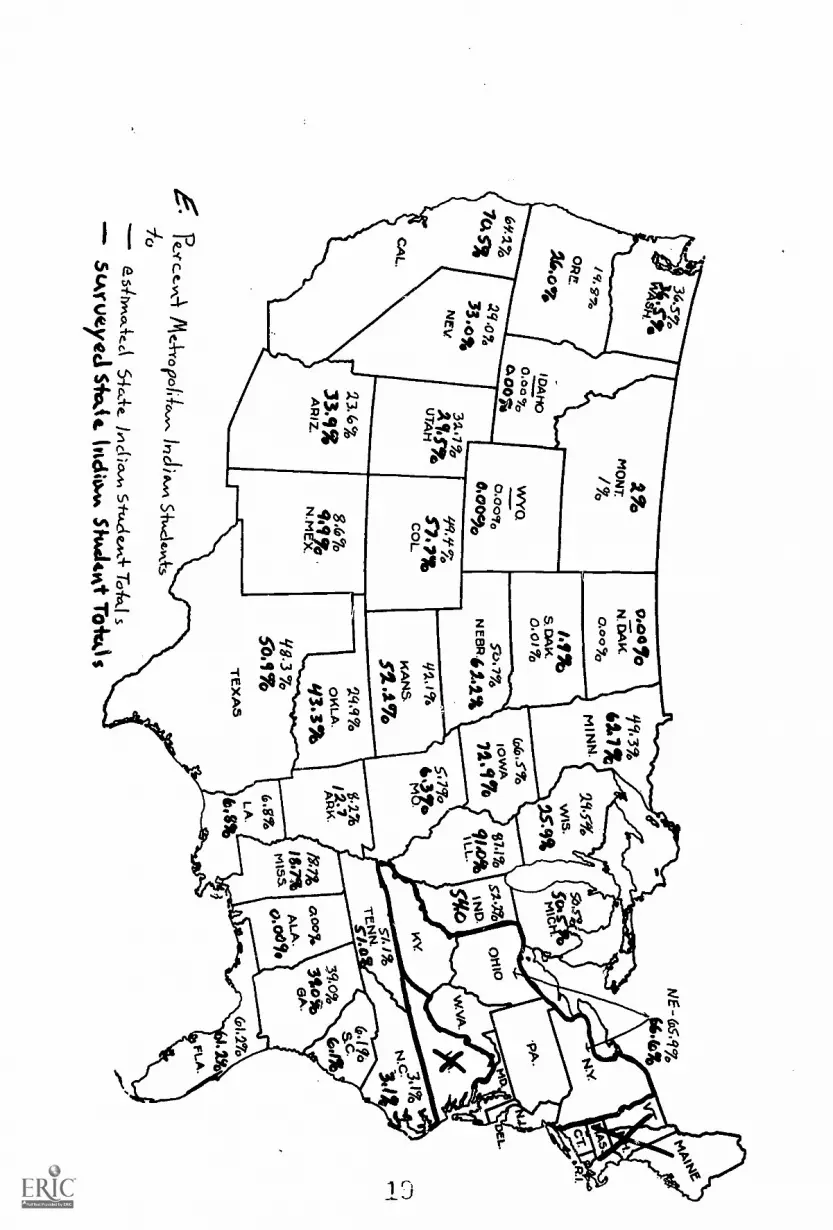
Map E - Percent Metropolitan Indian Students to:estimated State Indian Student Totalssurveyed State Indian Student Totals
4

FORWARD
This Training Center report consists of a selective summary
of 1968 HEW data concerning Native American public school students
in standard metropolitan statistical areas. A later report, to
be entitled The Education of Urban Indian Children in the United
States, takes account of these and many other data in a summarizing
fashion.
Arthur M. Harkins
Richard G. Woods
I. Karon Sherarts
5
Introduction
This report, a selective analysis of 1968 ethnic student data gathered
by the Office for Civil Rights, is designed to provide students of American
Indian demographics and urban education with an up-dated picture of urban
Indian student numbers, proportions, and distribution by districts. Before
commencing with this analysis, it would be proper to refer to the HEW report
(Directory of Public Elementary and Secondary Schools in Selected Districts:
Enrollment and Staff by Racial/Etnnic Group) for an overview of the reasons
for the survey and a discussion of its methodology:
The Office for Civil Rights (OCR) is responsible foradministering Title VI of the 1964 Civil Rights Act as itapplies to programs funded by the Department of Health,Education, and Welfare. Title VI prohibits discriminationbecause of race, color or national origin in any programor activity that receives Federal financial assistance.In partial fulfillment of this responsibility periodic racial/ethnic surveys of public elementary and secondary schoolsare conducted as authorized in regulations implementingTitle VI.
Results of the first national racial/ethnic survey of publicschools (in the fall of 1967) were published by the Officeof Education, National Center for Educational Statisticsand entitled Directory of Public Schools in Large DistrictsTIlth Enrollment and Staff, by Race -- Fall, 1967.
A second national survey was conducted in the fall of 1968and was based on an enlarged sample of public elementaryand secondary school districts and schools. The number ofminority racial/ethnic categories was expanded in the fall,1968 survey to include American ludian, Oriental, andSpanish Surnamed Americana as well as Negroes. White non-minority and undesignated minority groups are included inthe column headed "other". The Social Research Group ofthe George Washington University, under contract with andat the direction of the Office for Civil Rights, conductedthe fall, 1968 survey.
The Office for Civil Rights is appreciative of the considerabletime and effort expended by the state and local schoolofficials who participated in the survey.

-2--
Survey Description and Source of Data
This directory contains reported information, as of thebeginning of the 1968-1969 school year, on the racial/ethnic composition of pupils and full-time classroomteachers (assigned to one school) in approximately8,500 school districts in the continental United Statesincluding Alaska and the District of Columbia. Thesedata were reported to the Office for Civil Rights byschool district superintendents and/or State educationagencies. The reports were required under the regulationsimplementing Title VI of the Civil Rights Act of 1964.Hawaii and the Territories were not required to parti-cipate in this survey. Ninety-five school districts withFederal funds terminated (as of August, 1968) because ofnon-compliance with Title VI of the Civil Rights Act of1964 were also excluded from the survey.
All school districts with 3,000 or more enrollment (1967-1968) were surveyed. Smaller school districts were selectedfor inclusion in the survey in a statistically random mannerbased on district enrollment size in the preceding schoolyear (1967-1968) as determined by the United States Bureauof the Census (1967 Census of Governments, Volume I).
The sampling plan used was as follows:
District Enrollment Sampling RateProjected Total InEach Size Category
3,000 and larger 100% actual data1,200 - 2,999 75% 1 1/3 times actual data
600 - 1,199 50% 2 times actual data300 - 599 25% 4 times actual data
less than 300 0 none
In addition to the above sampled districts, all districtseliminating racially dual school systems under terms ofvoluntary plan agreements with the Department of Health,Education, and Welfare or under Federal court order weresurveyed regardless of school district enrollment size.Districts, in these categories, with total enrollments ofless than 300 are reported separately in Appendix B.
Several variations in reporting methods were used to provideinformation for the survey. Most school districts reporteddata directly to HEW by completing the school and schooldistrict report forms. Samples of the standard report formsare reproduced in Appendix A. Six states -- Michigan, NewYork, North Dakota, Ohio, Washington, Wisconsin, and severalcity school districts -- sent punched cards or computer tapes
-3-
containing similar data already available in their files.These six states elected to submit data for all districtsin their states and the surveyed and projected data forthese states are identical. Data for some court orderdistricts were derived from special forms previously filedwith the courts.
Sorvey Universe
The 8,491 school districts sampled covered an estimated 43.9%of the nation's public school districts but they enrolled anestimated 90.8% of the nation's public elementary andsecondary pupils.
The survey data are representative of a larger universe of11,496 districts -- the estimated total number of districtsenrolling 300 or more students. This includes an estimated96.8% of the nation's public elmentasy and secondary pupilenrollment.
Table I and II, show actual and projected survey enrollmentdata, by state. Table III shows the various racial/ethnicstate enrollment totals expressed as a percentage of totalstate enrollment. Table IV shows the various racial/ethnicstate enrollment totals expressed as a percentage of thenational total enrollment of particular racial/ethnic groups.
Editing and Processing of Data
Numerically additive data items were required to pass arigid computer check before accretion to the computer datatape. A frequent discrepancy occurred when the sums of iddi-vidual school data did not equal the district totals reportedon the district summary form. All such discrepancies werebrought to the attention of the school district or stateagency supplying the original data and were subsequentlyresolved by the originating organization. Some districtsoperating under Federal Court desegregation order wererequired to report statistics to the court in a particularcourt-designated format. These data were transcribed ontoOCR forms and processed onto the data tape.
Some schools are listed that offer specialized trainingsuch as remedial reading or vocational crafts. These schoolsare included since they contain full-time teachers butthe students are accounted for elsewhere in the districtin their regular academic school assignments :I

-4-
In 1970, Herbert A. Aurbach, Estelle Fuchs, and Gordon Macgregor
cooperated in a U.S. Office of Education study entitled, The Status of
American Indian Education. In chapter four of that document, which did
consider that data with which this report is concerned, the authors state:
In recent years, more and more of the responsibility foreducating Indian children has been taken over by the statesand recent BIA policy has been to encourage public schoolenrollment of Indian children.
In 1968, the BIA had contracts with fourteen states andschool districts in three other states providing assistanceunder [certain] laws. These states educated 88,000 Indianchildren (57.4% of all school -age Indians in those samestates).2 One-third were educated at no cost to the Bureauof Indian Affairs.
The education of Indian children in nine states (California,Idaho, Michigan, Minnesota, Nebraska, Oregon, Texas,Washington, and Wisconsin) where there once were federalschools was almost entirely the responsibility of the states.Several other states educate well over one-half of thosIndian children that are the responsibility of the BIA.
Since the survey universe of the 1968 Office of Civil Rights research
project covered an estimated 90.8% of the nation's public elementary and
secondary pupils, and an estimated 96.8% of these schools enrolling 300 or
more students, it seems fair to assert that the N OfIndian students not
covered by the OCR survey, but attending public schools, was small. For
readers wishing to study overview data of public, mission, and BIA schools,
and especially for those wishing to examine.., the role. of BIA schools, the
Aurbach-Fuchs-Macgregor report seems to be a useful reference. The current
report provides, however, a more current and detailed profile of Indian
students enrolled in public schools throughout the nation, and has the
added usefulness of focusing upon those Indian children attending public
4schools in Standard Metropolitan Statistical Areas.

-5-
An Overview of the Current Study
For the purposes of this study, it was determined that an "Indian
district" would be any district having at least one native American pupil
in the public schools. The total Indian student population in United States
Pub4cschools was estimated at 177,463 in 1968, of which 142,715 were surveyed
in the OCR study. The proportion of surveyed students was thus 80.4%.
The OCR survey of metropolitan Indian students did include the New
England States, Alaska. and Virginia, but for various reasons (see footnote
three) we have excluded these states from the current overview. Subtracting
the population of Indian students from these states leaves a survey base
population of 134,502, and a newly estimated base population of 169,947 for
Indian students in the United States.
The total surveyed metropolitan Indian student population for the United
States was 45,436. That total is 30.7% of the total survey base population,
and 27.1% of the total estimated base population.
The current overview of the OCR survey included 169 SMSAs (1960 defini-
tions). Indian students were enrolled in 91% of these SMSAs.
The average number of Indian students per SMSA covered in this over-
view was 269.40. SMSAs above this average numbered 35; SMSAs below the
average numbered 134. 79.28% of the districts were below the average number
of Indian students per SMSA. For the entire breakdown of Indian students
in public schools by SMSA, the reader is invited to view the following.

-6-
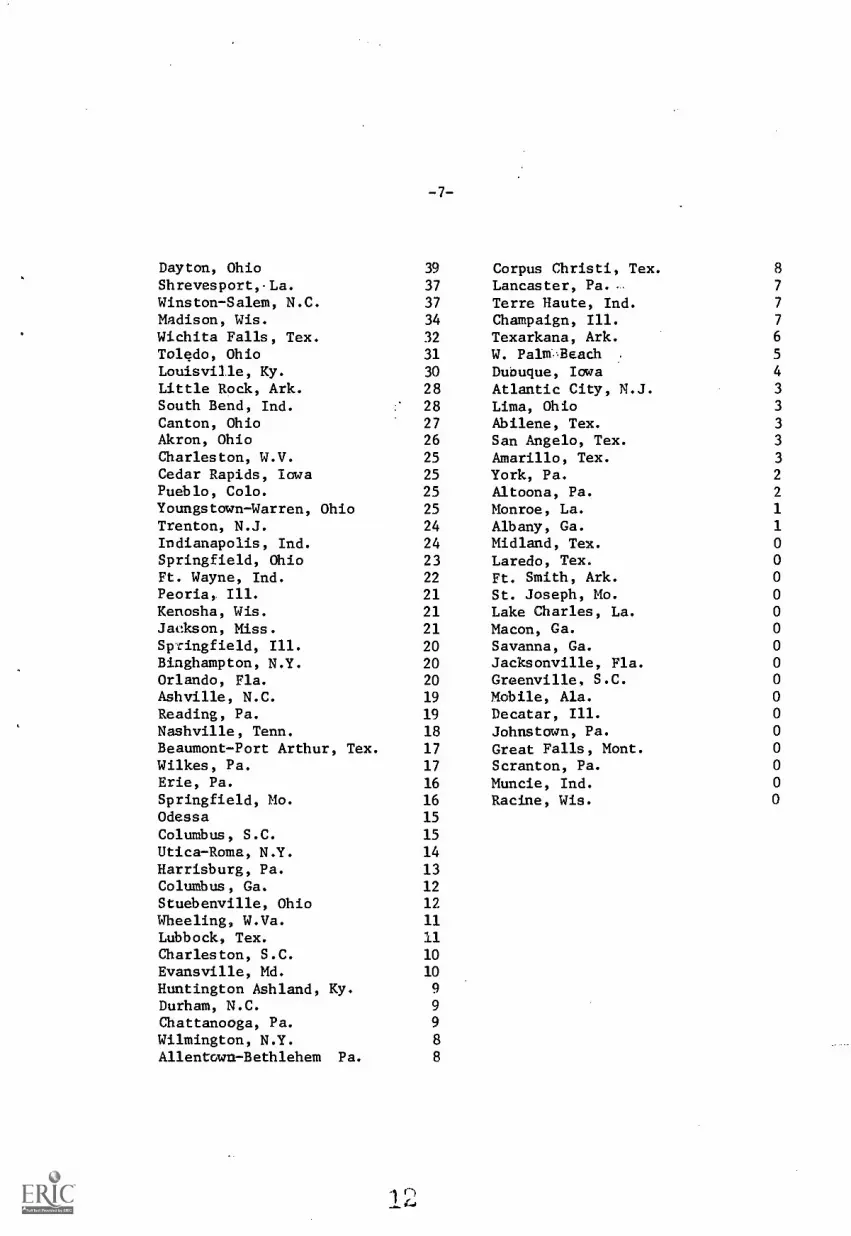
SMSAs By Numbers of Indian Students in Public Schools
Tulsa, Okla. 4244
Los Angeles-Long Beach, Calif. 3746
Phoenix, Ariz. 2387Minneapolis-St. Paul, Minn. 2200Oklahoma City, Okla. 2172
Seattle, Wash. 1979New York. N.Y. 1767Albuquerque, N.M. 1704San Francisco-Oakland, Calif. 1541Chicago, Ill. 1314Detroit, Mich. 1236Buffalo, N.Y. 1224San Bernardino-Riverside, Calif.1132
Tucson, Arix. 886
Tacoma, Wash. 788Lawton, Okla. 769San Diego- Calif. 737
Dallas, Tex. 660Milwaukee, Wis. 610
Salt Lake City, Utah 596Duluth, Minn. 587Denver, Colo. 582San Jose, Calif. 572Portland, Ore. 563Green Bay, Wis. 556Syracuse, N.Y. 537
Reno, Nev. 499Miami, Fla. 436Spokane, Wash, 428
Fresno, Calif. 385Wichita, Kan. 355
Sacramento, Wit. 343
Provo-Orem 332
Omaha, Neb. .
Houston, Tex.Tampa, Fla.Grand Rapids, Mich.Greensboro, N.C.Las Vegas, Nev.Ogden, Utah
2 89
2.85
,47
2442 19
15
206
Bakersfield, Calif. 196Ft. Worth, Tex. 190St. Louis, Mo. 172Wash., D.C. 171Galveston, Tex. 167Cleveland, Ohio 167Gary-Hammond, Ind. 163Muskegon, Mich. 159
Lansing, Mich. 157Eugene, Ore. 152Sioux Falls, Iowa 151Topeka, Kan. 141Philadelphia, Pa. 138Lincoln, Neb. 129
Sioux Falls, S.D. 123El Paso, Tex. 122Oxnard-Ventura, Calif. 122Santa Barbara, Calif. 121Ft. Lauderdale, Fla. 114Charlotte, N.C. 110Flint, Mich. 108New Orleans, La. 107
Kalamazoo, Mich. 106Stockton, Calif. 103
Rochester, N.Y. 102
Kansas City, Kan. 91Pittsburgh, Pa. 89
Paterson-Cliffton N.J. 74
Albany, N.Y. 74
Pennsacola, Fla. 69
Colorado Springs, Colo. 68
Knoxville, Tenn. 66
Atlanta, Ga. 61
Billings, Mont. 61
Cinncinati, Ohio 59
Bay City, Mich. 56
Saginaw, Mich. 56
Baltimore, Md. 56
Lorain-Elyria, Ohio 55
Jackson, Miss. 54
Des Moines, Iowa 52
Ann Arbor, Mich. 50
largo- Moorhead, Minn. SO
Memphis, Tenn. 46
Waterloo, Iowa 46
Raleigh, N.C. 44
Augusta, Ga. 43
San Antonio, Tex. 41
Davenport, Rock Island, Moline 41
Columbus, Ohio 40
-7-
Dayton, Ohio 39 Corpus Christi, Tex. 8
Shrevesport,La. 37 Lancaster, Pa. . 7
Winston-Salem, N.C. 37 Terre Haute, Ind. 7
Madison, Wis. 34 Champaign, Ill. 7
Wichita Falls, Tex. 32 Texarkana, Ark. 6
Toledo, Ohio 31 W. Palm.,Beach 5
Louisville, Ky. 30 Dubuque, Iowa 4
Little Rock, Ark. 28 Atlantic City, N.J. 3
South Bend, Ind. 28 Lima, Ohio 3
Canton, Ohio 27 Abilene, Tex. 3
Akron, Ohio 26 San Angelo, Tex. 3
Charleston, W.V. 25 Amarillo, Tex. 3
Cedar Rapids, Iowa 25 York, Pa. 2
Pueblo, Colo. 25 Altoona, Pa. 2
Youngstown-Warren, Ohio 25 Monroe, La. 1
Trenton, N.J. 24 Albany, Ga. 1
Indianapolis, Ind. 24 Midland, Tex. 0
Springfield, Ohio 23 Laredo, Tex. 0
Ft. Wayne, Ind. 22 Ft. Smith, Ark. 0
Peoria, Ill. 21 St. Joseph, Mo. 0
Kenosha, Wis. 21 Lake Charles, La. 0
Jackson, Miss. 21 Macon, Ga. 0
Springfield, Ill. 20 Savanna, Ga. 0
Binghampton, N.Y. 20 Jacksonville, Fla. 0
Orlando, Fla. 20 Greenville, S.C. 0
Ashville, N.C. 19 Mobile, Ala. 0
Reading, Pa. 19 Decatar, Ill. 0
Nashville, Tenn. 18 Johnstown, Pa. 0
Beaumont-Port Arthur, Tex. 17 Great Falls, Mont. 0
Wilkes, Pa. 17 Scranton, Pa. 0
Erie, Pa. 16 Muncie, Ind. 0
Springfield, Mo. 16 Racine, Wis.Odessa 15
Columbus, S.C. 15
Utica-Roma, N.Y. 14
Harrisburg, Pa. 13
Columbus, Ga. 12
Stuebenville, Ohio 12
Wheeling, W.Va. 11
Lubbock, Tex. 11Charleston, S.C. 10
Evansville, Md. 10
Huntington Ashland, Ky. 9
Durham, N.C. 9Chattanooga, Pa. 9
Wilmington, N.Y. 8
Allentown-Bethlehem Pa. 8
-8-
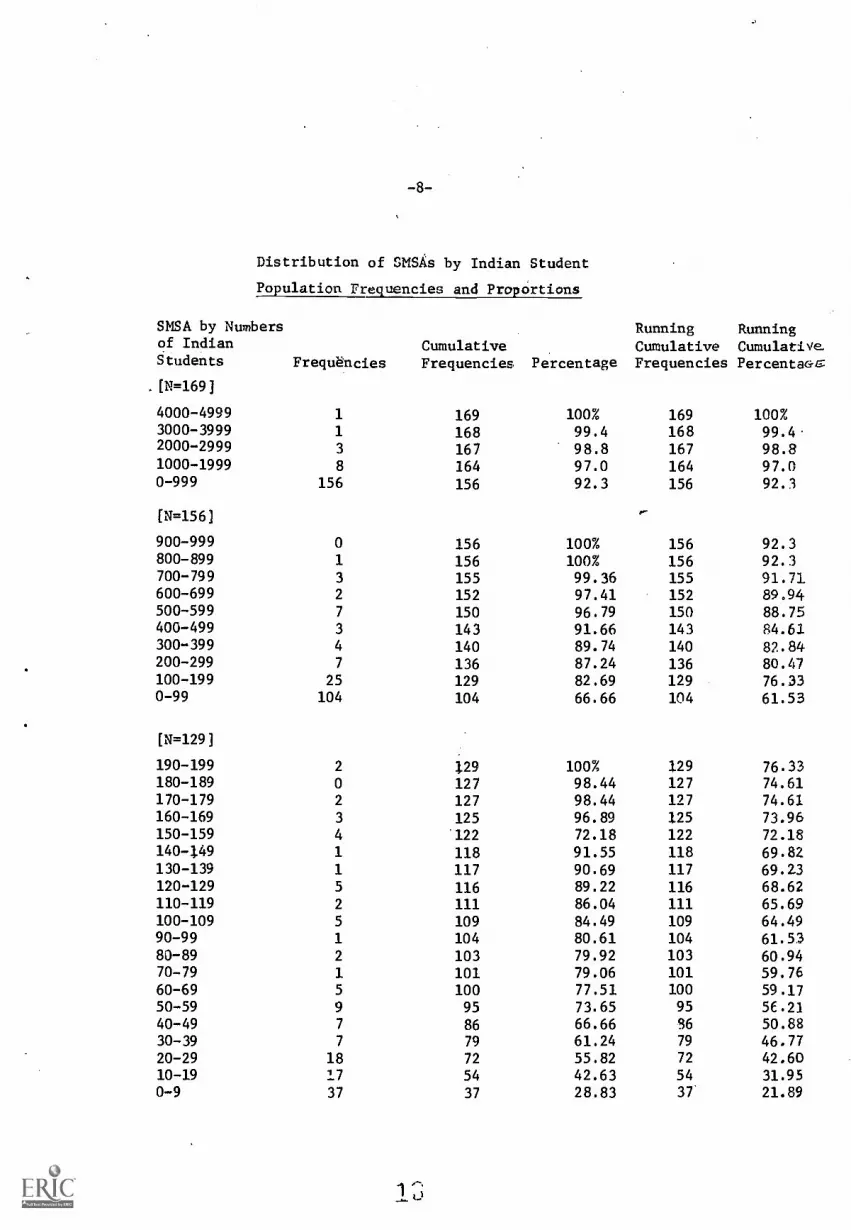
Distribution of SMSAs by Indian Student
Population Frequencies and Proportions
SMSA by Numbersof IndianStudents
.[N=169]
FrequenciesCumulativeFrequencies Percentage
Running RunningCumulative Cumulative.Frequencies Percenta&c
4000-4999 1 169 100% 169 100%3000-3999 1 168 99.4 168 99.42000-2999 3 167 98.8 167 98.81000-1999 8 164 97.0 164 97.00-999 156 156 92.3 156 92.3
[N=156]
900-999 0 156 100% 156 92.3800-899 1 156 100% 156 92.3700-799 3 155 99.36 155 91.71600-699 2 152 97.41 152 89.94500-599 7 150 96.79 150 88.75400-499 3 143 91.66 143 84.61300-399 4 140 89.74 140 82.84200-299 7 136 87.24 136 80.47100-199 25 129 82.69 129 76.330-99 104 104 66.66 104 61.53
[N=129]
190-199 2 129 100% 129 76.33180-189 0 127 98.44 127 74.61170-179 2 127 98.44 127 74.61160-169 3 125 96.89 125 73.96150-159 4 122 72.18 122 72.18140-149 1 118 91.55 118 69.82130-139 1 117 90.69 117 69.23120-129 5 116 89.22 116 68.62110-119 2 111 86.04 111 65.69100-109 5 109 84.49 109 64.4990-99 1 104 80.61 104 61.5380-89 2 103 79.92 103 60.9470-79 1 101 79.06 101 59.7660-69 5 100 77.51 100 59.1750-59 9 95 73.65 95 5E.2140-49 7 86 66.66 S6 50.8830-39 7 79 61.24 79 46.7720-29 18 72 55.82 72 42.6010-19 17 54 42.63 54 31.950-9 37 37 28.83 37' 21.89

The top ten percent of the SMSAs, according to numbers ol
Indian students, included a total of 29,732.3 students (or 54.4%
of the Indian student total). The top ten percent of the SMSAs
featured the folling regional distribution: Seven In the southwest;
three in the mid-northcentral; three in the mid-southcentral; two in
the northwest; and two in the northeast. Of the top 17 SMSAs,40 percent
were located in the southwest. The rest were rather evenly distributed.
A breakdown of the SMSA regional distribution within the top 17.SMSAs.:.
together with a percentage'dis.tribution of the 29,732 Indian students
appears as follows:
Region Percentage SMSA Percentage of 29,732
Southwest 40.1 40.7
Mid-North Central 17.0 15.9
Mid-South Central 17.0 24.1
Northwest 11.7 .9
Northeast 11.7 10.5
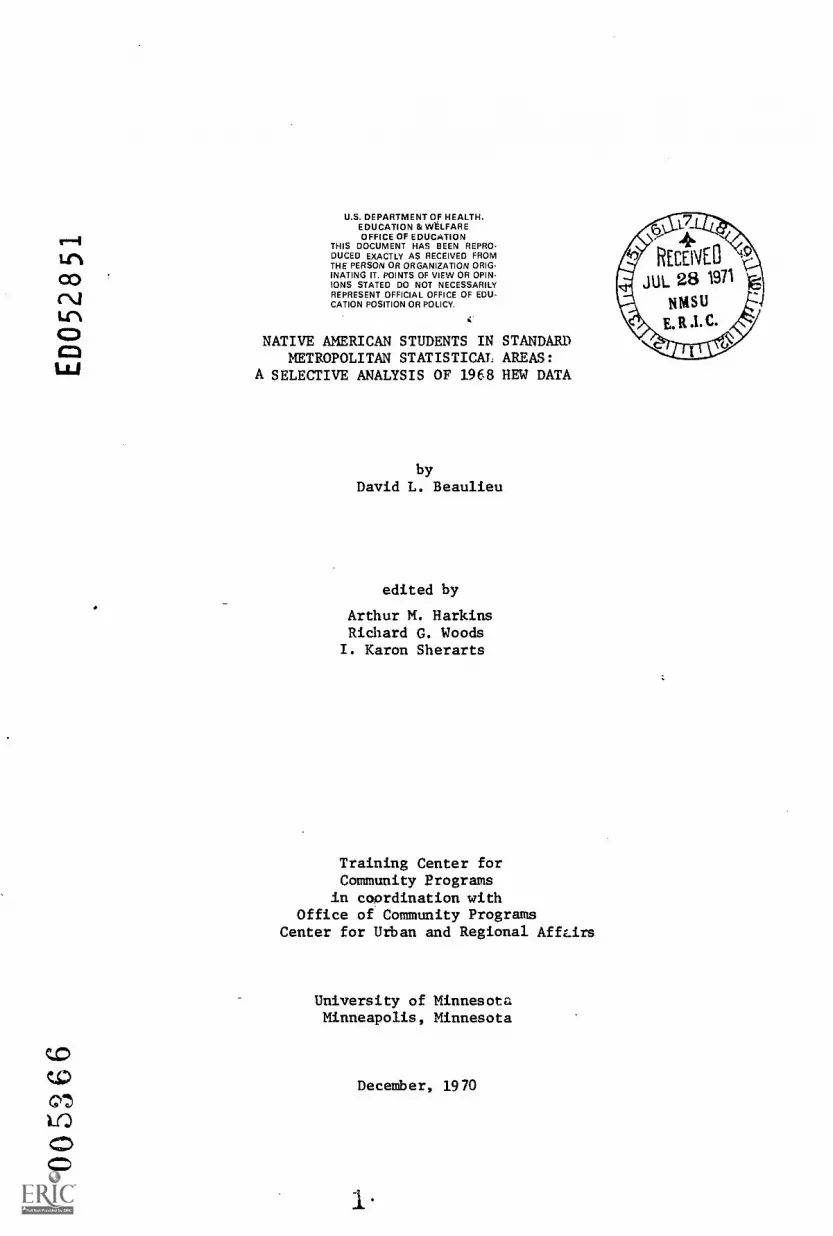
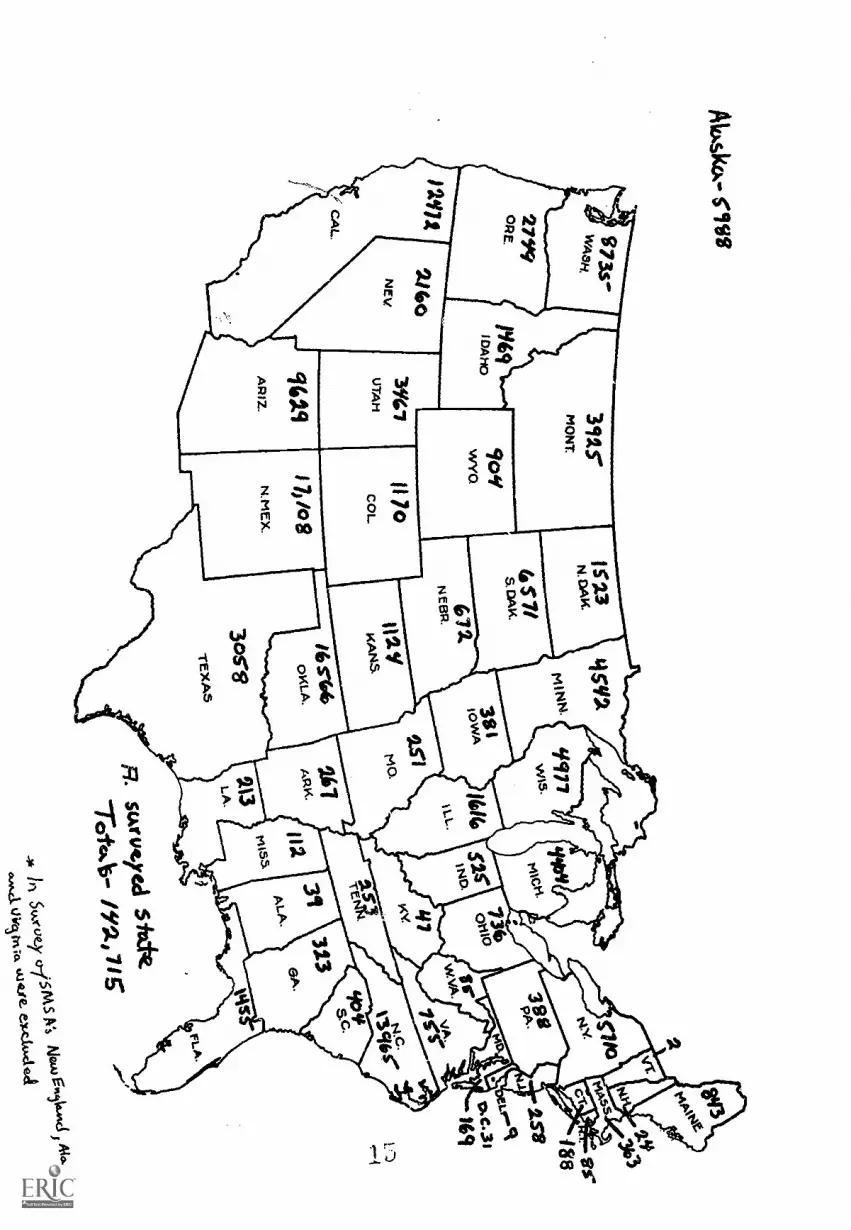
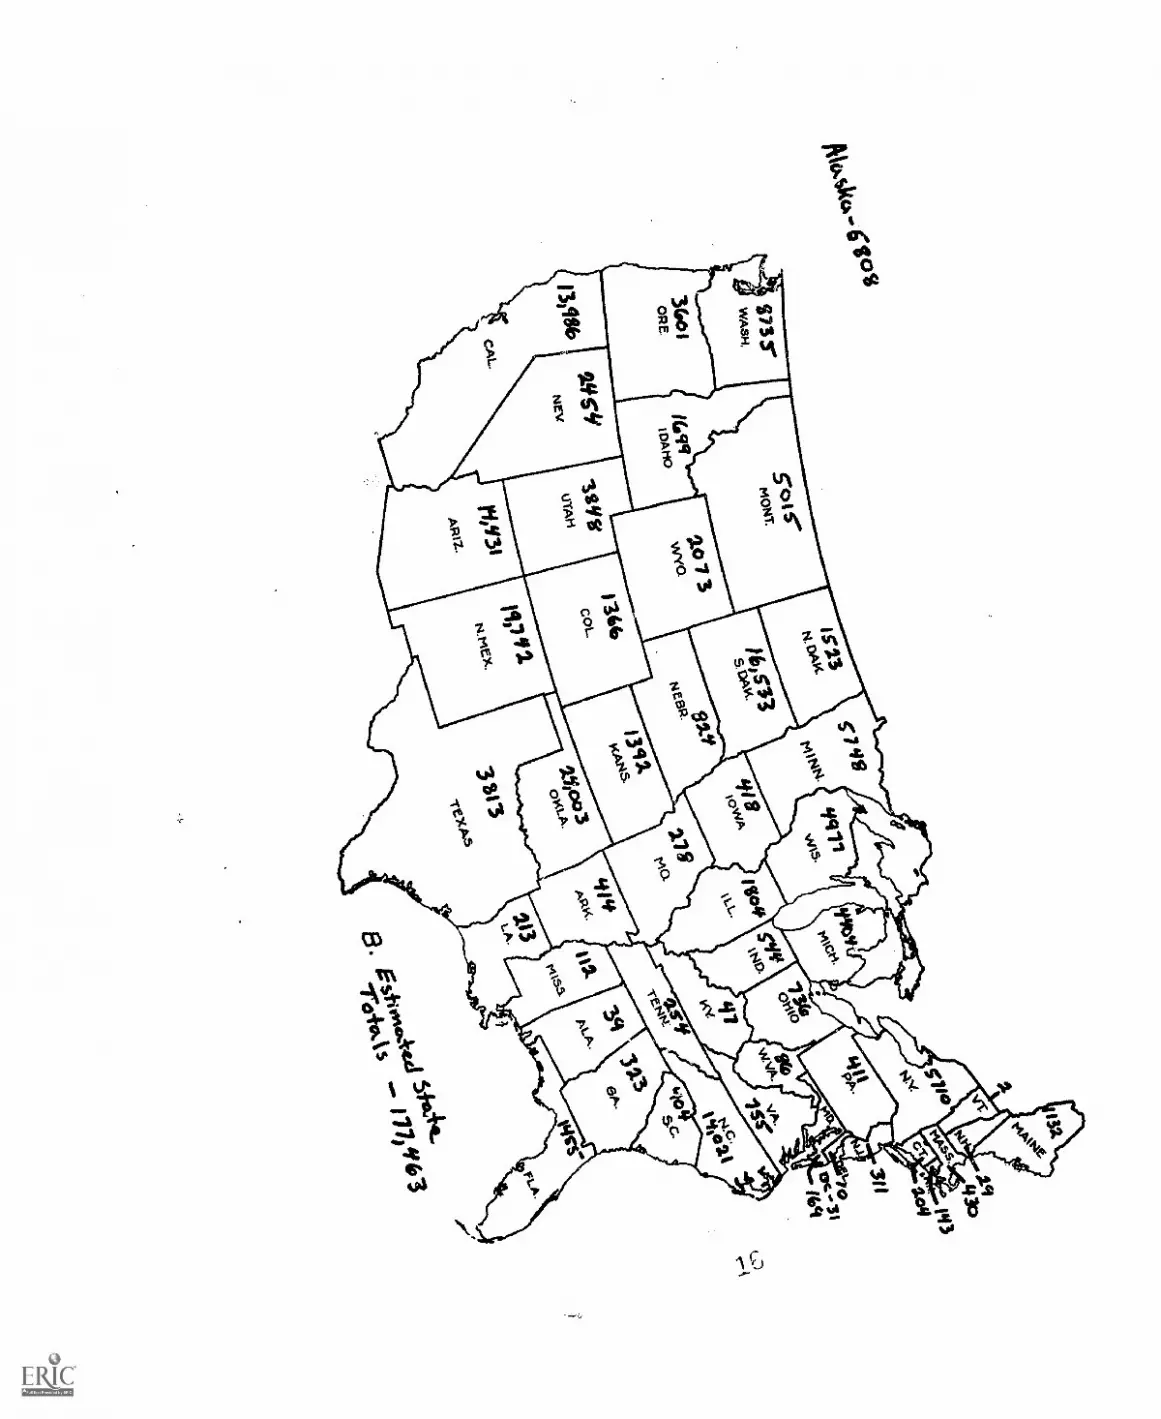
Maps A and B depict the total surveyed and estimated state public school
Indian student population for 1968. Maps C and D depict, respectively, the
total surveyed numbers of metropolitan Indian students (1968), and the
sectional breakdown of these surveyed students. Map E shows the percentage
of metropolitan public school Indian students to the estimated and surveyed
state totals.
Map E shows tremendous variation in the percentage of metropolitan
Indian students to both estimated and surveyed state Indian public school
student totals. From a low of zero percent in both estimated and surveyed
categories in Wyoming, the range covers the spectrum to a high of 87.1
and 91.0 percent in the two respective population categories.
4
AL
Ska- flys
4*irt Stm
-ucyoy5M
S R's
New
Eq6A
idA
t0416:t
...I. vitsfr.%),
wq.se- eaty..14.64
A1csk4.6-tou
8.
E$
tinie4cd
Shuk
"Tirickis
/7711163

Mid
Mari+
tatNicro.\
8,94!1}1951
AA
*I
.54..ruiled
To+
4 MeV
toroI ifaA
A
Indio" 5tv.devris bySex-lim
e.Sau,M
AC
eAtIco..k 4:1- 2
%toa: 95; r36
A: exduaecl A
re.cks
G re_.-rce,A4 pohlo $ -11.84.4.s10
a 5-IM. k-icct 54c-de bidicAA, Stucle.4,4- Tokl s5tArueyeci I ShAelant Mick% s
6R. I.

-10-
In one hundred seven of the one hundred sixty-nine SMSAs (63.3%) at
least 50% of the public school districts have enrolled Indian children.
Only ten of the SMSAs have an enrollment of Indian students over 1% of the
total of all students. These ten SMSAs constitute only 5.9% of all SMSAs of
interest to this report. A percentage breakdown of the SMSAs with over 1%
Indian student enrollment appears as follows:
Ten SMSAs with Indian student enrollment over 1% of total
Duluth, Minn. 1.30%Green Bay, Wis. 3.37Tacoma, Wash. 1.06Lawton, Okla. 15.40Oklahoma City, Okla. 3.50Tulsa, Okla. 5.61Syracuse, N.Y. 1.26Phoenix, Ariz. 1.32Tucson, Ariz. 3.58Albuquerque, N.M. 2.10Reno, Nev. 1.80
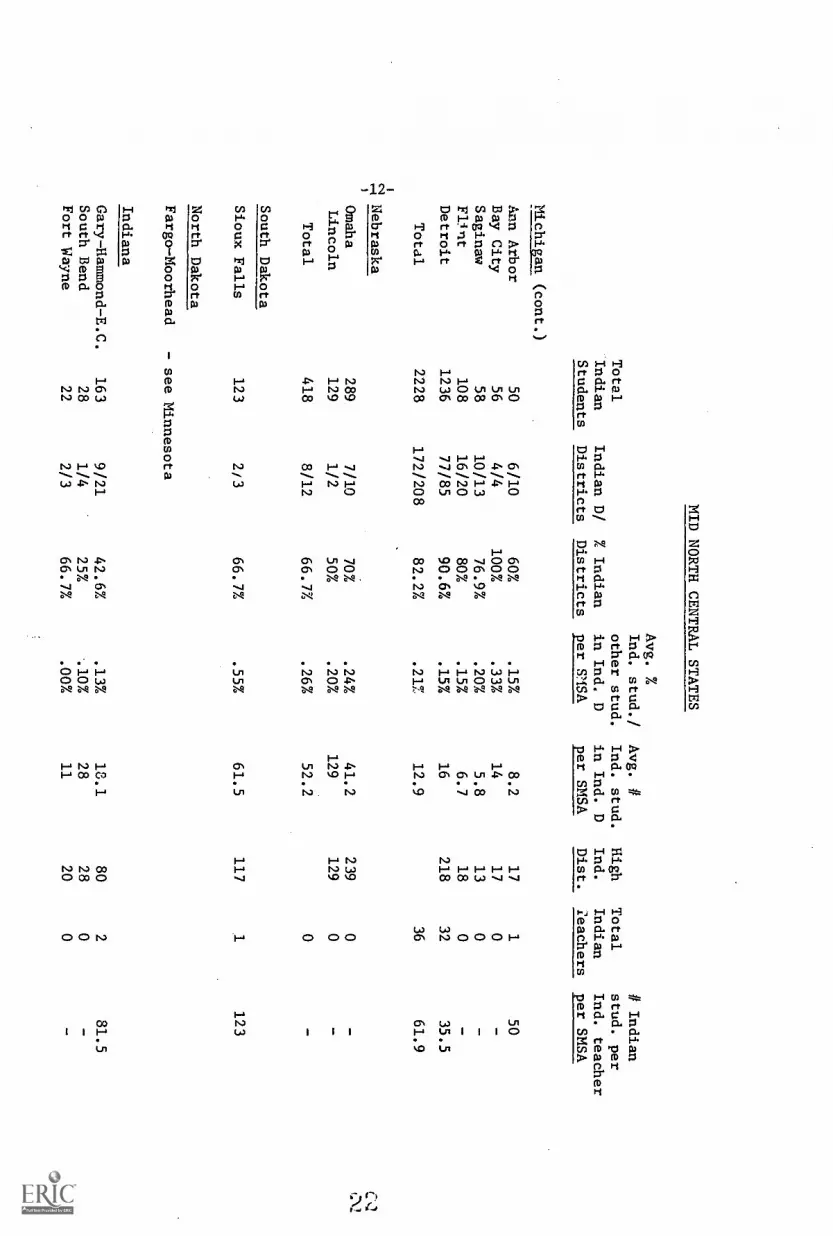
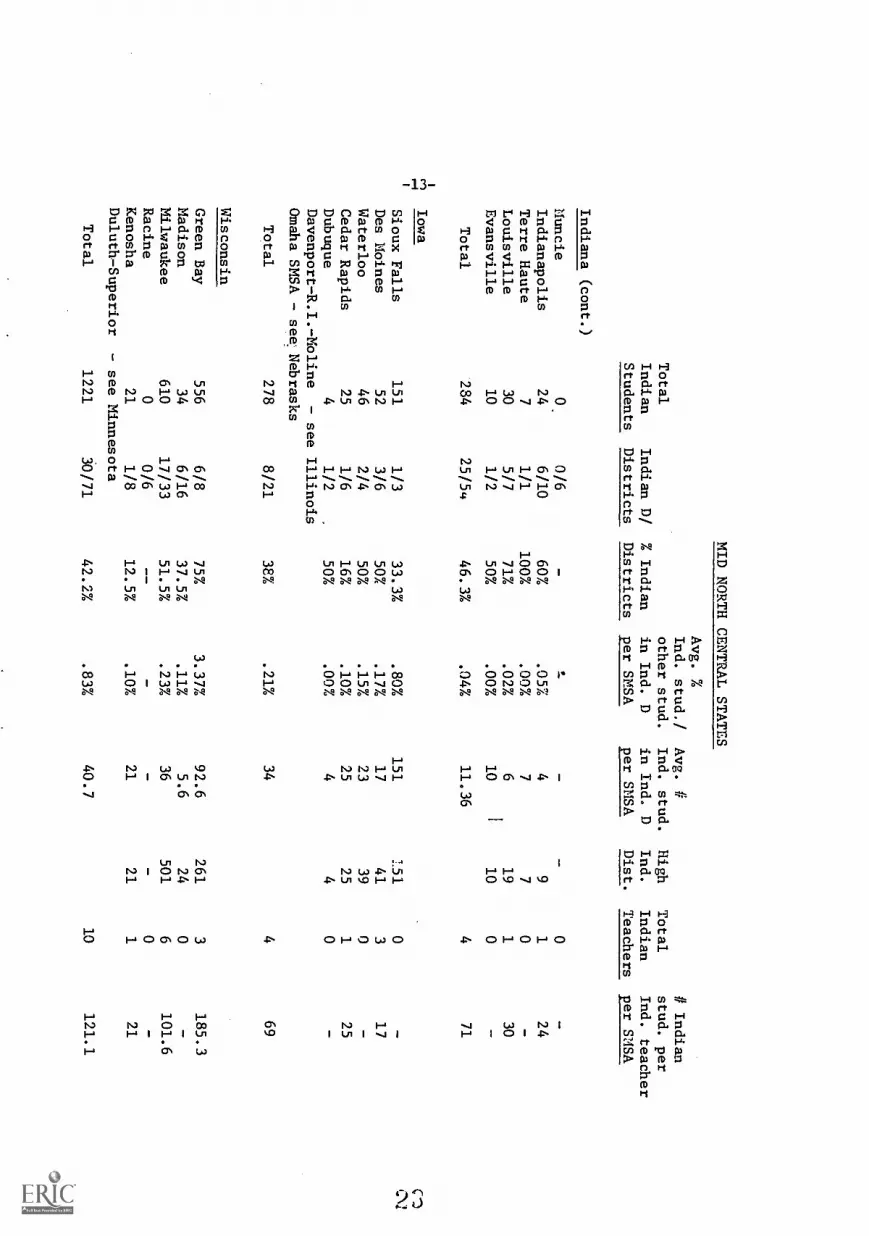
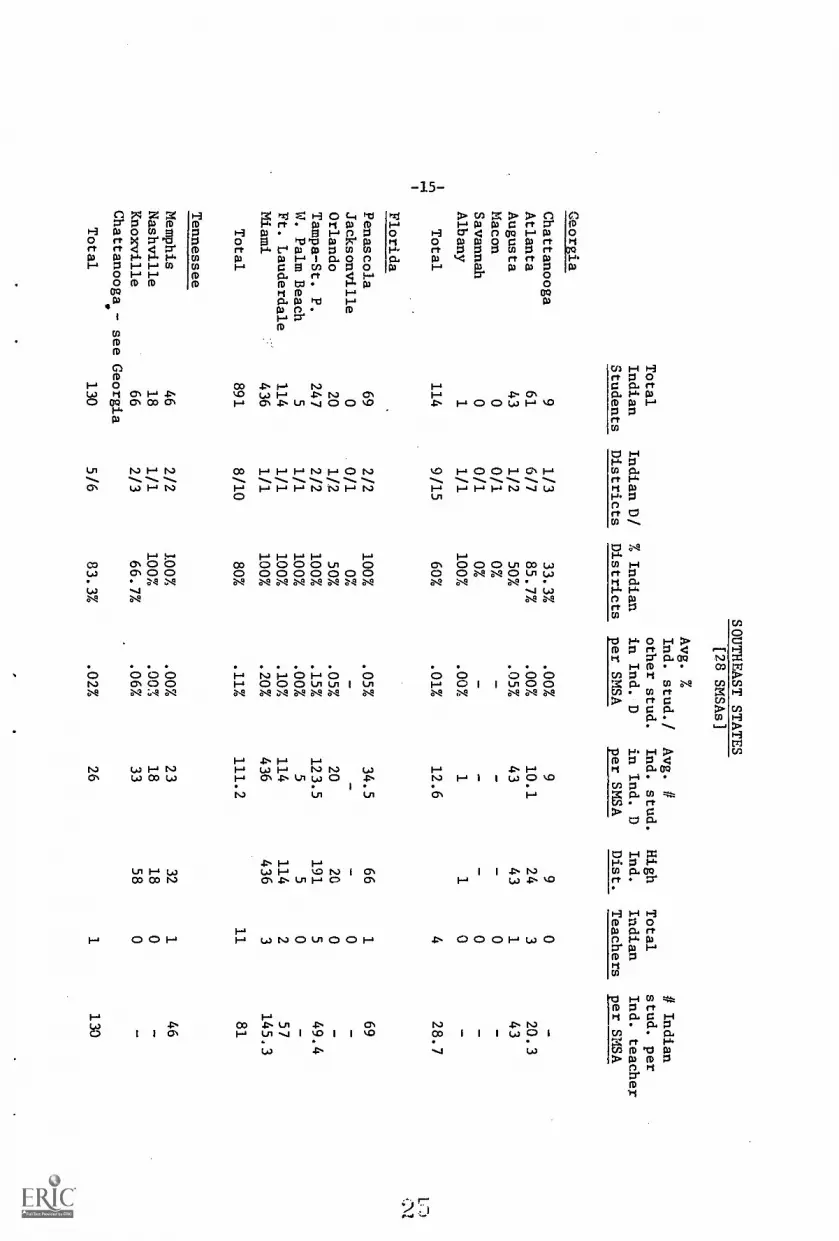
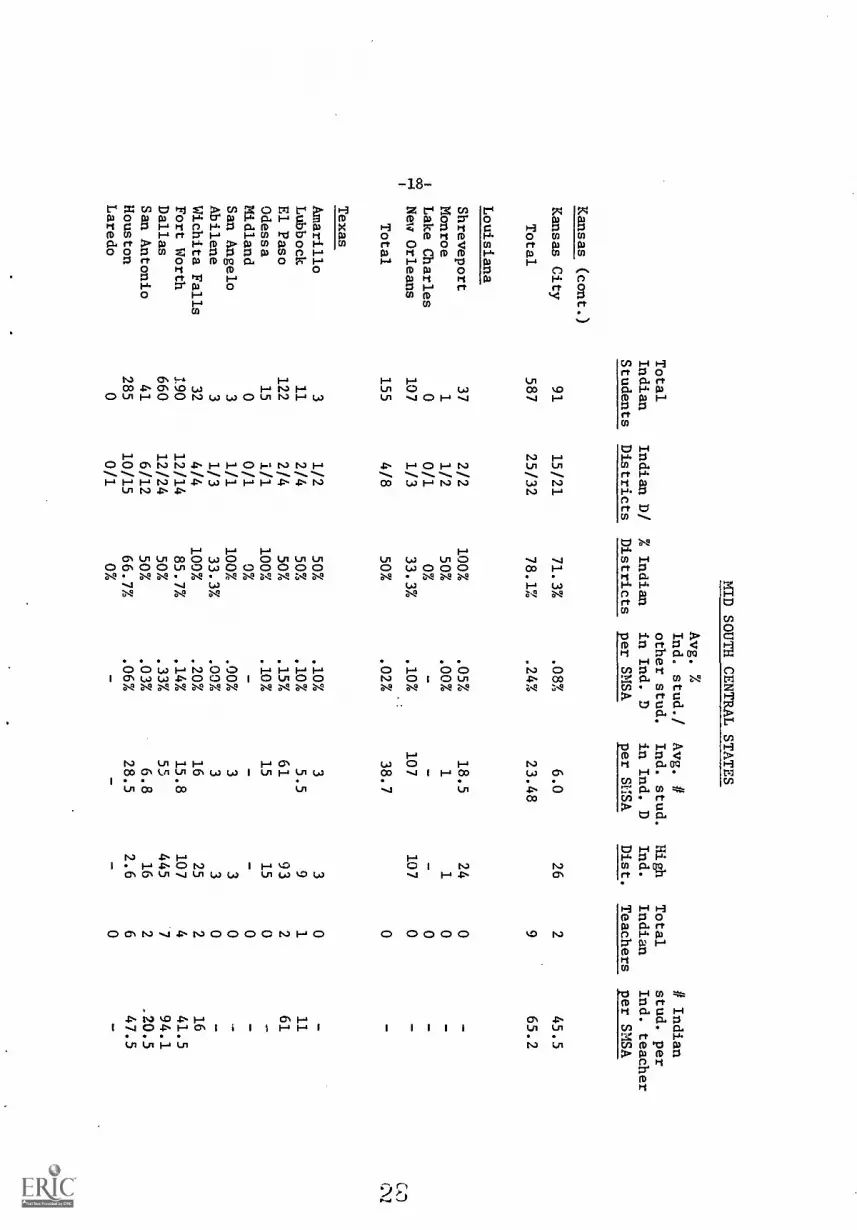
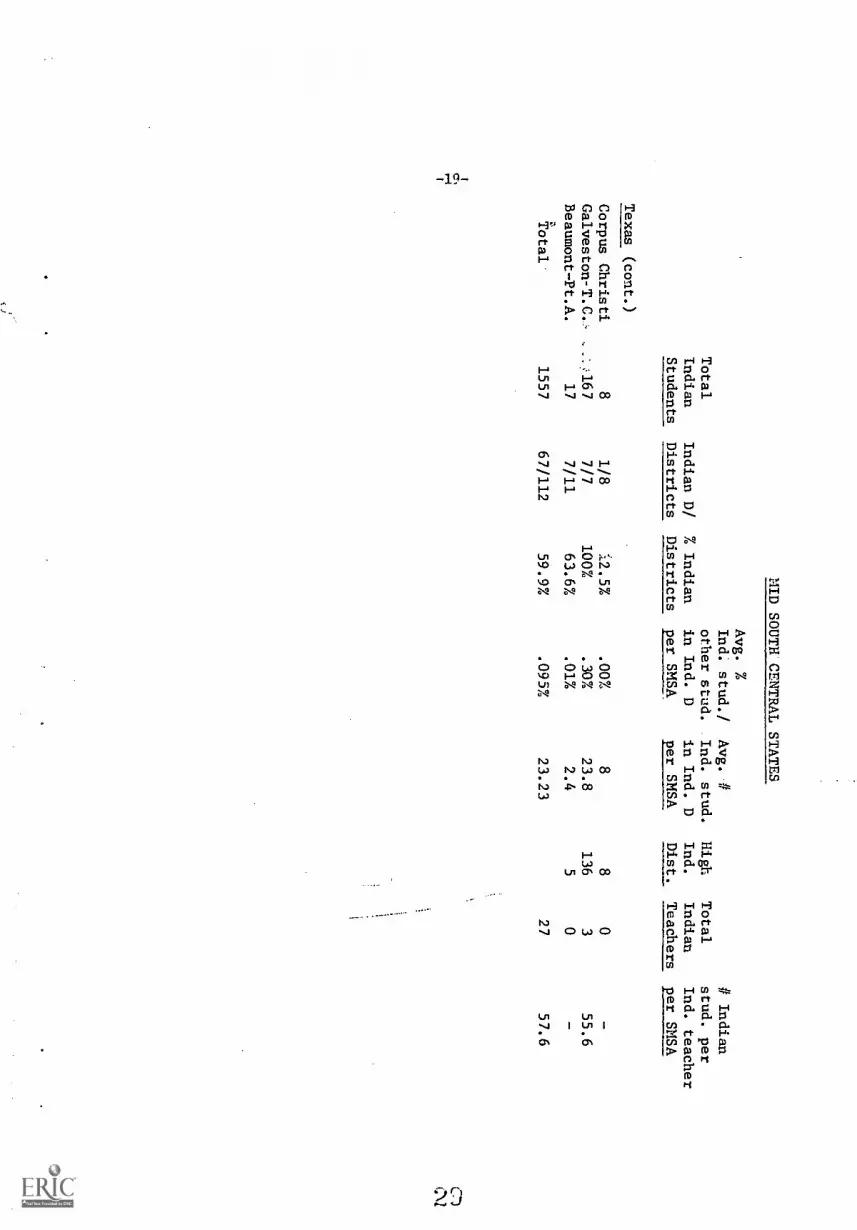
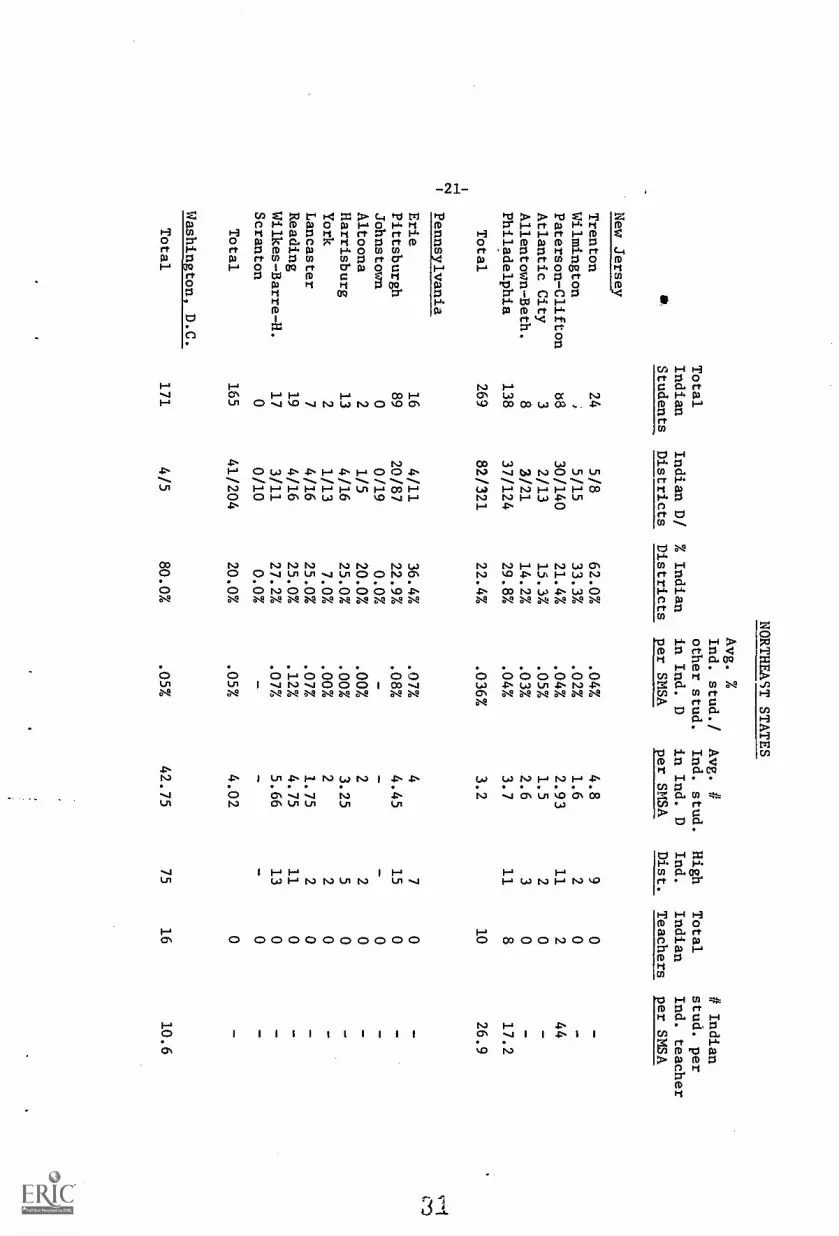
Since a narrative summary of the percentage of Indian districts to all
districts in sectional SMSAs would be cumbersome, it is useful to list in
the following pages section-by-section, and SMSA data that includes not only
the proportion of Indian to non-Indian districts, but also the following:
total number of Indian students; the approximate average of Indian students
to other students in Indian districts for each SMSA; the average number of
Indian students in each Indian district for each SMSA; the number of students
for each "high" Indian district; the total number of Indian teachers per
SMSA; and the number of Indian students for each Indian teacher in every SMSA.
The next section of the report concludes our selective summary of 1968
HEW data concerned with Native American public school students in standard
metropolitan statistical areas. A later Training Center report, to be
entitled The Education of Urban Indian Children in the United States, takes
account of these and many other data in a summarizing fashion.
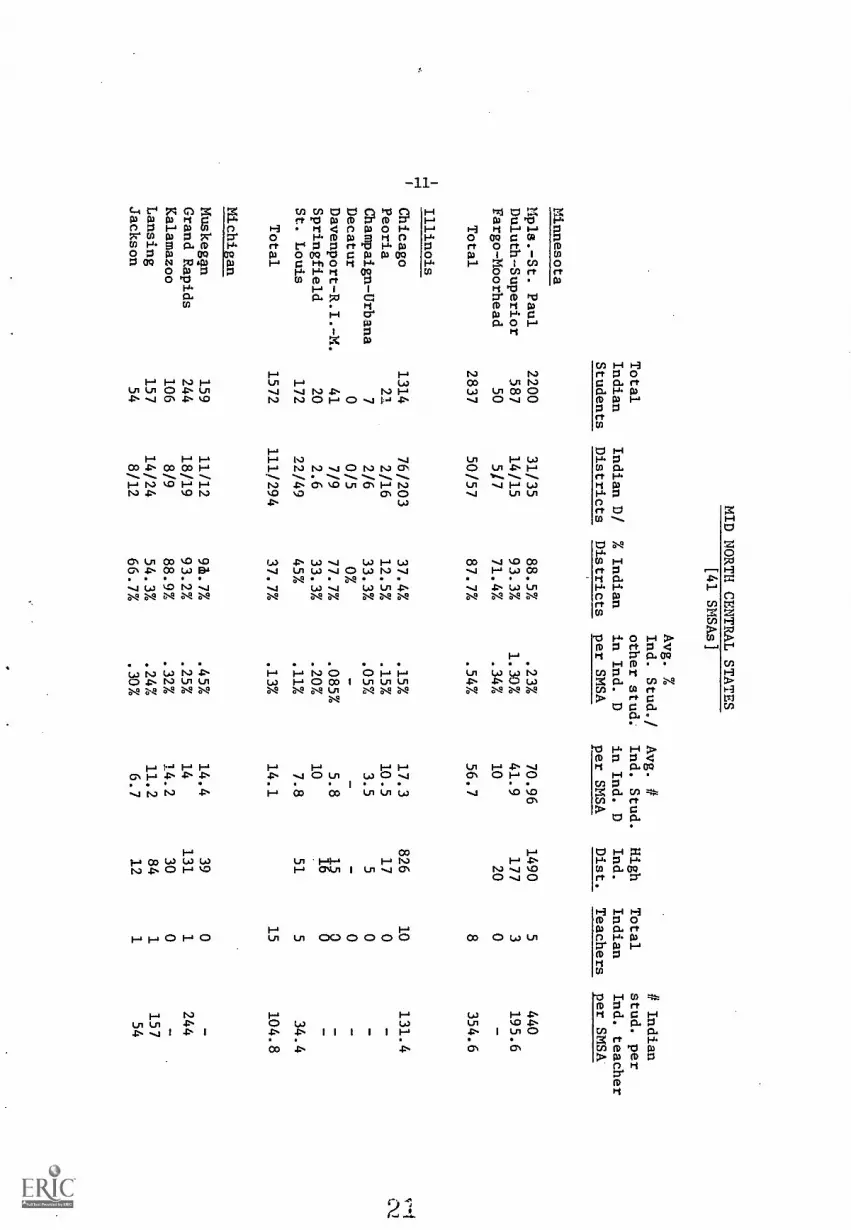
MID NORTH CENTRAL STATES
[41 SMSAs]Avg.
Ind. Stud./
Avg. #
# Indian
Total
other stud.
Ind. Stud.
High
Total
stud. per
Indian
Indian D/
% Indian
in Ind. D
in Ind. D
Ind.
Indian
Ind. teacher
Students
Districts
Districts
per SMSA
per SMSA
Dist.
Teachers
per SMSA
Minnesota
Mpls. -St. Paul
2200
31/35
88.5%
.23%
70.96
1490
Duluth -- Superior
587
14/15
93.3%
1.30%
41.9
177
Fargo-Moorhead
50
5/7
71.4%
.34%
10
20
Total
2837
50/57
87.7%
.54%
56.7
,.1_,
Illinois
I-4I
Chicago
1314
76/203
37.4%
.15%
17.3
826
Peoria
21
2/16
12.5%
.15%
10.5
17
Champaign - Urbana
72/6
33.3%
.05%
3.5
5
Decatur
00/5
0%
--
-
Davenport-R.I.-M.
Springfield
41
20
7/9
2.6
77.7%
33.3%
.085%
.20%
5.8
10
ig
St. Louis
172
22/49
45%
.11%
7.8
51
Total
1572
111/294
37.7%
.13%
14.1
Michigan
Muskegqn
159
11/12
9d1.7%
.45%
14.4
39
Grand Rapids
244
18/19
93.2%
.25%
14
131
Kalamazoo
106
8/9
88.9%
.32%
14.2
30
Lansing
157
14/24
54.3%
.24%
11.2
84
Jackson
54
8/12
66.7%
.30%
6.7
12
5440
3195.6
0-
8354.6
10
131.4
0-
00-
8-_
534.4
15
104.8
01244
0-
1157
154
MID NORTH CENTRAL STATES
Avg. %
Ind. stud./
Avg. #
# Indian
Total
other stud.
Ind. stud.
High
Total
stud, per
Indian
Indian D/
% Indian
in Ind. D
in Ind. D
Ind.
Indian
Ind. teacher
Students
Districts
Districts per SISA
per SMSA
Dist.
Leachers
per SMSA
Michigan (cont.)
Ann Arbor
50
6/10
60%
.15%
8.2
17
150
Bay City
56
4/4
100%
.33%
14
17
0
Saginaw
58
10/13
76.9%
.20%
5.8
13
0
Flint
108
16/20
80%
.15%
6.7
18
0-
Detroit
1236
77/85
90.6%
.15%
16
218
32
35.5
Total
2228
172/208
82.2%
.21Z
12.9
36
61.9
1
;II Nebraska
289
7/10
70%
.24%
41.2
239
0
1
Omaha
Lincoln
129
1/2
50%
.20%
129
129
0
Total
418
8/12
66.7%
.26%
52.2
0
South Dakota
Sioux Falls
123
2/3
66.7%
.55%
61.5
117
1123
North Dakota
Fargo-Moorhead
- see Minnesota
Indiana
Gary-Hammond-E.C.
163
9/21
42.6%
.13%
18.1
80
281.5
South Bend
28
1/4
25%
.10%
28
28
0
Fort Wayne
22
2/3
66.7%
.00%
11
20
0
MID NORTH CENTRAL STATES
Avg. %
Ind. stud./
Avg. #
# Indian
Total
other stud.
Ind. stud.
High
Total
stud. per
Indian
Indian D/
% Indian
in Ind. D
in Ind. D
Ind.
Indian
Ind. teacher
Students
Districts
Districts
per SMSA
per SMSA
Dist.
Teachers
per SMSA
Indiana (cont.)
Muncie
O0/6
-0
Indianapolis
24
6/10
60%
.05
49
124
Terre Haute
71/1
100%
.00%
77
0
Louisville
30
5/7
71%
.02%
619
130
Evansville
10
1/2
507
.00%
10
}10
0
v-Icn
Total
284
25/54
Iowa
46.3%
.04%
11.36
471
Sioux Falls
151
1/3
33.3%
.80%
151
151
0
Des Moines
52
3/6
50%
.17%
17
41
317
Waterloo
46
2/4
50%
.15%
23
39
0
Cedar Rapids
25
1/6
16%
.10%
25
25
125
Dubuque
41/2
.50%
.00%
44
0
Davenport-R.I.-Moline
- see Illinois
Omaha SMSA - see. Nebrasks
Total
278
8/21
38%
.21%
34
469
Wisconsin
Green Bay
556
6/8
75%
3.37%
92.6
261
3185.3
Madison
34
6/16
37.5%
.11%
5.6
24
0
Milwaukee
610
17/33
51.5%
.23%
36
501
6101.6
Racine
00/6
--
0
Kenosha
21
1/8
12.5%
.10%
21
21
121
Duluth-Superior
- see Minnesota
Total
1221
30/71
42.27
.83%
40.7
10
121.1

NORTHWEST STATES
[7 SMSAs]
Avg.
Ind. stud./
Avg. #
# Indian
Total
other stud.
Ind. stud.
High
Total
stud. per
Indian
Indian D/
% Indian
in Ind. D
in Ind. D
Ind.
Indian
Ind. teacher
Students
Districts
Districts
per SMSA
per SMSA
Dist.
Teachers
per SMSA
Washington
Spokane
428
10/11
91.0%
.68%
42.8
306
4107
Seattle
1979
30/32
93.7%
.80%
65.9
603
14
141.3
Tacoma
788
14/15
93.37
1.067
56.2
446
6131.3
Portland
- see Oregon
Total
3195
54/58
93.1%
.846%
57.3
24
141.4
Oregon
Portland
563
29/36
80.6%
.92%
19.45
302
16
35.2
Eugene
152
9/9
100%
.477%
16.9
49
625.3
Total
715
38/45
84.4%
.432%
20.4
22
32.5
Montana
Billings
61
1/1
100%
.4%
61
61
161
Great Falls
00/2
--
--
-
Total
61
1/3
33.3%
.4%
61
161
SOUTHEAST STATES
[28 SMSAs]
Avg. %
Ind. stud./
Avg. #
# Indian
Total
other stud.
Ind. stud.
High
Total
stud. per
Indian
Indian D/
% Indian
in Ind. D
in Ind. D
Ind.
Indian
Ind. teacher
Students
Districts
Districts
per SMSA
per SMSA
Dist.
Teachers
per SMSA
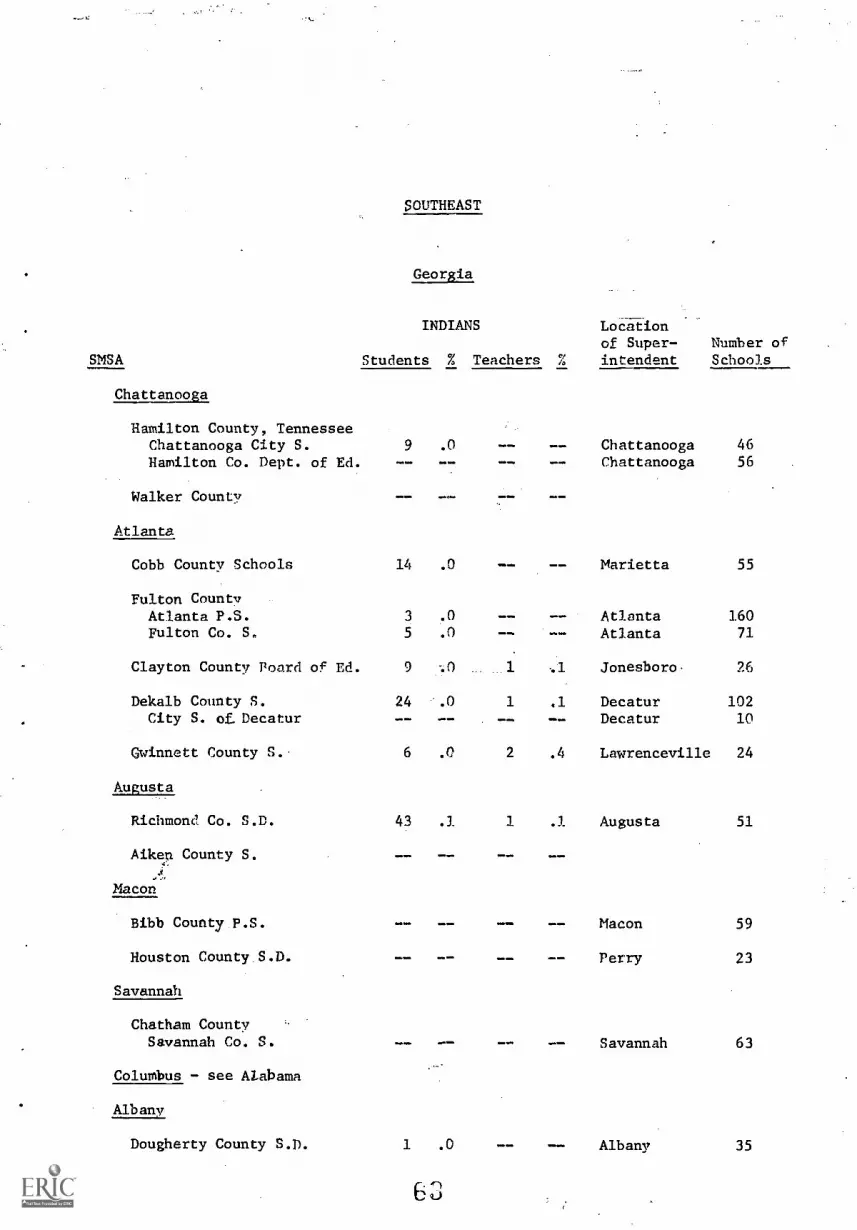
Georgia
Chattanooga
91/3
33.3%
.00%
99
0
Atlanta
61
6/7
85.7%
.00%
10.1
24
320.3
Augusta
43
1/2
50%
.05%
43
43
143
Macon
00/1
0%
--
0-
Savannah
00/1
0%
--
-0
-
Albany
11/1
100%
.00%
11
0
Total
114
9/15
60%
.01%
12.6
428.7
Florida
Penascola
69
2/2
100%
.05%
34.5
66
169
Jacksonville
00/1
0%
--
0
Orlando
20
1/2
50%
.05%
20
20
0-
Tampa -St. P.
247
2/2
100%
.15%
123.5
191
549.4
W. Palm Beach
51/1
100%
.00%
55
0-
Ft. Lauderdale
114
1/1
100%
.10%
114
114
257
Miami
436
1/1
100%
.20%
436
436
3145.3
Total
891
8/10
80%
.11%
111.2
11
81
Tennessee
Memphis
46
2/2
100%
.00%
23
32
146
Nashville
18
1/1
100%
.00%
18
18
0
Knoxville
66
2/3
66.7%
.06%
33
58
0
Chattanooga- see Georgia
Total
130
5/6
83.3%
.02%
26
1130

1
SOUTHEAST STATES
Total
Indian
Indian D/
% Indian
Students
Districts
Districts
Avg. %
Ind. stud./
other stud.
in Ind. D
per SMSA
Avg. #
# Indian
Ind. stud.
High
Total
stud. per
in Ind. D
Ind.
Indian
Ind. teacher
per SMSA
Dist.
Teachers
per SMSA
South Carolina
Charleston
10
1/2
50%
.00%
10
10
110
Columbia
15
3/7
42%
.10%
57
0
Greenville
00/1
0%
0
Total
25
4/10
40%
.05%
6.2
125
North Carolina
Ashville
19
2/2
100%
.05%
9.5
11
0
Charlotte
110
1/1
100%
.10%
110
110
255
Winston-Salem
37
1/1
100%
.10%
37
37
0
Durham
92/2
100%
.00%
4.5
60
Raleigh
44
3/3
100%
.14%
14.6
37
144
Greensboro
219
3/3
100%
.40%
73
83
636.5
Total
438
12/12
100%
.11%
36.5
948.1
Mississippi
Jackson
21
2/2
100%
.00%
10.5
17
0
Alabama
Colombus
12
1/7
14%
.00%
12
12
0
Mobile
00/1
0%
0
Total
12
1/8
12.5%
.00%
12
0

MID SOUTH CENTRAL STATES
[31 SMSAs]
Avg. %
Ind. stud./
Avg. #
# Indian
Total
other stud.
Ind. stud.
High
Total
stud. per
Indian
Indian D/
% Indian
in Ind. D
in Ind. D
Ind.
Indian
Ind. teacher
Students
Districts
Districts
per SMSA
per SMSA
Dist.
Teachers
per SMSA
Oklahoma
Lawton
769
2/2
100%
15.4%
384.5
604
6123.1
Oklahoma City
2172
11/13
84.6%
3.5%
197.4
890
44
49.3
Tulsa
4244
14/15
93.3%
5.61%
303.3
3196
112
37.89
Total
7185
27/30
90.0%
8.17
265.9
162
44.35
Arkansas
1
,-1 Little Rock
28
2/3
66.7%
.05%
14
17
0Fort Smith
00/3
0%
--
-0
Texarkana
63/8
36.4%
.06%
24
0
Total
34
5/14
35.7%
.055%
6.8
0
Missouri
St. Joseph
-0
0/1
0%
--
-0
Kansas City - see Kansas
St. Louis - see Illinois
Springfield
1L
1/3
33.3%
.10%
16
16
0
Total
16
1/4
25%
.10%
16
0
Kansas
Wichita
355
6/7
85.7%
.33%
59.1
299
750.7
Topeka
141
4/4
100%
.32%
35.2
116
0
co
MID SOUTH CENTRAL STATES
Avg. %
Ind. stud./
Total
other stud.
Indian
Indian D/
% Indian
in Ind. D
Students
Districts
Districts
per SMSA
Avg. #
I/ Indian
Ind. stud.
High
Total
stud, per
in Ind. D
Ind.
Indian
Ind. teacher
per SMSA
Dist.
Teachers
per SMSA
Kansas (cont.)
Kansas City
91
15/21
71.3%
.08%
6.0
26
245.5
Total
587
25/32
78.1%
.24%
23.48
965.2
Louisiana
Shreveport
37
2/2
100%
.05%
18.5
24
0
Monroe
11/2
50%
.00%
11
0Lake Charles
00/1
0%
0New Orleans
107
1/3
33.3%
.10%
107
107
0
Total
155
4/8
50%
.02%
38.7
0
Texas
Amarillo
31/2
50%
.10%
33
0
Lubbock
11
2/4
50%
.10%
5.5
91
11
El Paso
122
2/4
50%
.15%
61
93
261
Odessa
15
1/1
100%
.10%
15
15
0Midland
00/1
0%
0
San Angelo
31/1
100%
.00%
33
0
Abilene
31/3
33.3%
.00%
33
0
Wichita Falls
32
4/4
100%
.20%
16
25
216
Fort Worth
190
12/14
85.7%
.14%
15.8
107
441.5
Dallas
660
12/24
50%
.33%
55
445
794.1
San Antonio
41
6/12
50%
.03%
6.8
16
2.20.5
Houston
285
10/15
66.7%
.06%
28.5
2.6
647.5
Laredo
00/1
0%
0
MID SOUTH CENTRAL STATES
Avg. %
Ind. stud./
Avg.
I/
# Indian
Total
other stud.
Ind. stud.
High
Total
stud. per
Indian
Indian D/
% Indian
in Ind. D
in Ind. D
Ind.
Indian
Ind. teacher
Students
Districts
Districts
per SMSA
per SMSA
Dist.
Teachers
per SMSA
Texas (cont.)
Corpus Christi
81/8
:2.5%
.00%
88
0-
Galveston-T.C.:.1467
7/7
100%
.30%
23.8
136
355.6
Beaumont-Pt.A.
17
7/11
63.6%
.01%
2.4
50
-
Total
1557
67/112
59.9%
.095%
23.23
27
57.6

NORTHEAST STATES
[40 SMSAs]
Avg. %
Ind. stud./
Avg. #
# Indian
Total
other stud.
Ind. stud.
High
Total
stud. per
Indian
Indian D/
% Indian
in Ind. D
in Ind. D
Ind.
Indian
Ind. teacher
Students
Districts
Districts
per SMSA
per SMSA
Dist.
Teachers
per SMSA
New York
New York City
1767
45/161
27.9%
.22%
39.26
1526
51
34.6
Buffalo
1224
33/39
82.5%
.60%
37.06
429
13
94.1
Rochester
102
7/19
44.0%
.10%
14.5
69
251
Syracuse
537
21/37
56.7%
1.26%
25.5
311
4134.2
Utica-Rome
14
3/28
10.7%
.06%
4.6
81
14
Albany-Schenectady
74
14/40
35.0%
.11%
5.26
43
0-
I
i 2
Binghampton
Total
20
3738
5/12
128/336
41.6%
35.1%
.10%
.35%
4
29.2
75
76
4
49.1
Maryland
Baltimore
56
3/5
60%
.03%
18.6
54
228
West Virginia
Charleston
25
1/1
100%
.00%
25
25
125
Kentucky
Cincinnati
59
9/25
36.0%
.03%
6.5
33
0
Huntington-Ash.
92/8
25%
.15%
4.5
80
Total
68
11/33
33.3%
.09%
6.1
0
NORTHEAST STATES
Avg. %
Ind. stud./
Avg. #
# Indian
Total
other stud.
Ind. stud.
High
Total
stud, per
Indian
Indian D/
% Indian
in Ind. D
in Ind. D
Ind.
Indian
Ind. teacher
Students
Districts
Districts
per SMSA
per SMSA
Dist.
Teachers
per SMSA
New Jersey
Trenton
24
5/8
62.0%
.04%
4.8
90
Wilmington
5/15
33.3%
.02%
1.6
20
Paterson-Clifton
ts8
30/140
21.4%
.04%
2.93
11
244
Atlantic City
32/13
15.3%
.05%
1.5
20
Allentown -Beth.
83/21
14.2%
.03%
2.6
30
-
Philadelphia
138
37/124
29.8%
.04%
3.7
11
817.2
Total
269
82/321
22.4%
.036%
3.2
10
26.9
1
,-I
cv1
Pennsylvania
Erie
16
4/11
36.4%
.07%
47
0
Pittsburgh
89
20/87
22.9%
.08%
4.45
15
0
Johnstown
00/19
0.0%
--
0
Altoona
21/5
20.0%
.00%
22
0
Harrisburg
13
4/16
25.0%
.00%
3.25
50
York
21/13
7.0%
.00%
22
0
Lancaster
74/16
25.0%
.07%
1.75
20
Reading
19
4/16
25.0%
.12%
4.75
11
0Wilkes-Barre-H.
17
3/11
27.2%
.07%
5.66
13
0
Scranton
00/10
0.0%
-_
-0
Total
165
41/204
20.0%
.05%
4.02
0
Washington, D.C.
Total
171
4/5
80.0%
.05%
42.75
75
16
10.6

Total
Indian
Students
NORTHEAST STATES
Avg. %
Ind. stud./
Avg. #
# Indian
other stud.
Ind. stud.
High
Total
stud, per
Indian D/
% Indian
in Ind. D
in Ind. D
Ind.
Indian
Ind. teacher
Districts
Districts
per SMSA
per SMSA
Dist.
Teachers
per SMSA
Ohio
Toledo
31
5/7
71.4%
.00%
6.2
26
0
Lima
31/10
10.0%
.05%
33
13
Dayton
39
10/31
32.2%
.03%
3.9
15
0
Springfield
23
5/7
71.4%
.05%
4.6
14
0
Columbus
40
9/17
52.9%
.03%
4.4
19
140
Lorain-Elyria
55
5/15
33.3%
.14%
11
33
0
Akron
26
7/17
41.0%
.07%
3.71
60
Canton
27
8/17
47.0%
.11%
3.37
62
13.5
N Cincinnati - see Kentucky
1Cleveland
167
13/40
32.5%
.05%
12.8
128
627.8
Youngstown-Warren
25
6/37
16.2%
.10%
4.16
80
Sterbenville Weilton 12
5/7
71.4%
.01%
2.4
31
12
Wheeling
11
3/9
33.3%
.00%
3.66
10
0
Total
459
77/214
35.9%
.05%
5.6
11
41.7
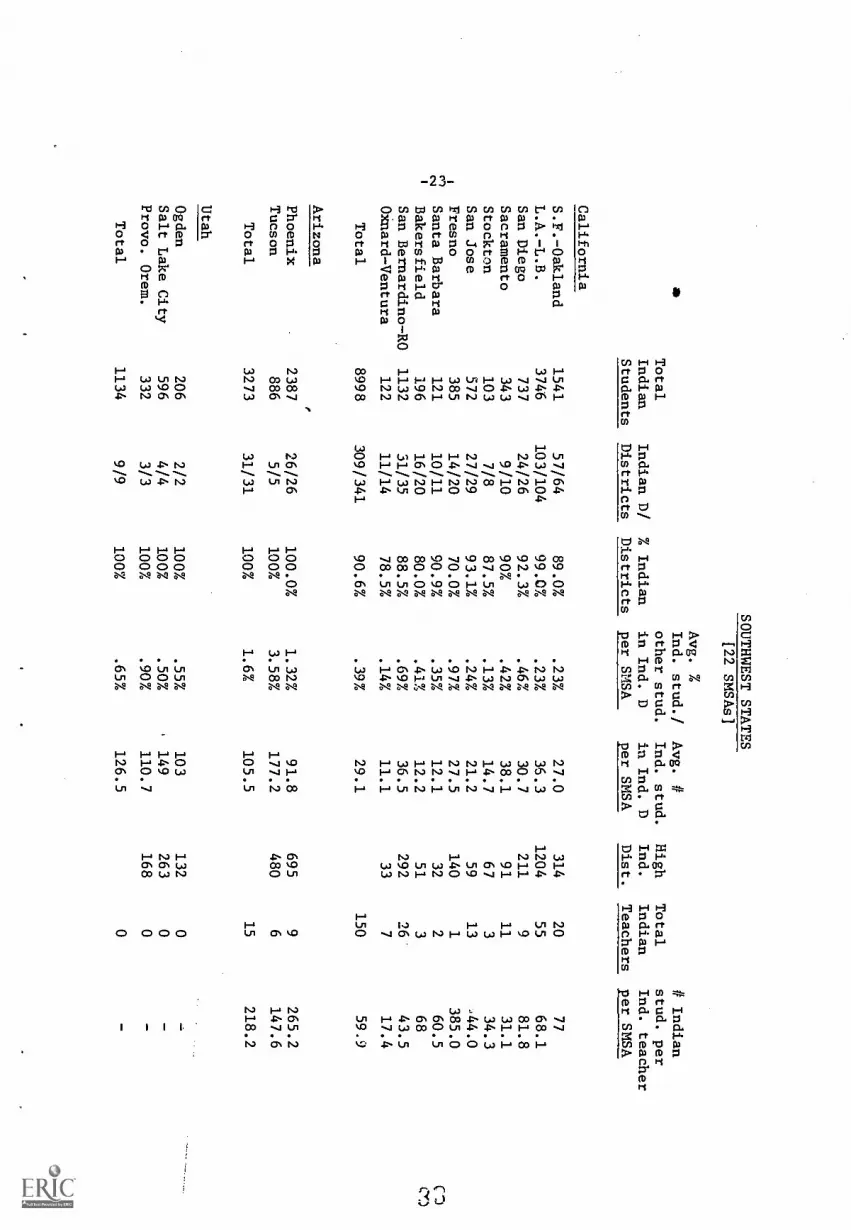
SOUTHWEST STATES
[22 SMSAs]
Avg. %
Ind. stud./
Avg. #
# Indian
Total
other stud.
Ind. stud.
High
Total
stud. per
Indian
Indian D/
% Indian
in Ind. D
in Ind. D
Ind.
Indian
Ind. teacher
Students
Districts
Districts
per SMSA
per SMSA
Dist.
Teachers
per SMSA
California
S.F.-Oakland
1541
57/64
89.0%
.23%
27.0
314
20
77
L.A.-L.B.
3746
103/104
99.0%
.23%
36.3
1204
55
68.1
San Diego
737
24/26
92.3%
.46%
30.7
211
981.8
Sacramento
343
9/10
90%
.42%
38.1
91
11
31.1
Stockton
103
7/8
87.5%
.13%
14.7
67
334.3
San Jose
572
27/29
93.1%
.24%
21.2
59
13
.44.0
1Fresno
385
14/20
70.0%
.97%
27.5
140
1385.0
''
c..1
Santa Barbara
121
10/11
90.9%
.35%
12.1
32
260.5
CD
1
Bakersfield
196
16/20
80.0%
.41%
12.2
51
368
C)
San Bernardino-RO
1132
31/35
88.5%
.69%
36.5
292
26
43.5
Oxnard-Ventura
122
11/14
78.5%
.14%
11.1
33
717.4
Total
8998
309/341
90.6%
.39%
29.1
150
59.9
Arizona
.
Phoenix
2387
26/26
100.0%
1.32%
91.8
695
9265.2
Tucson
886
5/5
100%
3.58%
177.2
480
6147.6
Total
3273
31/31
100%
1.6%
105.5
15
218.2
Utah
Ogden
206
2/2
100%
.55%
103
132
0
Salt Lake City
596
4/4
100%
.50%
,149
263
0-
Provo. Orem.
332
3/3
100%
.90%
110.7
168
0-
Total
1134
9/9
100 %
.65%
126.5
0-
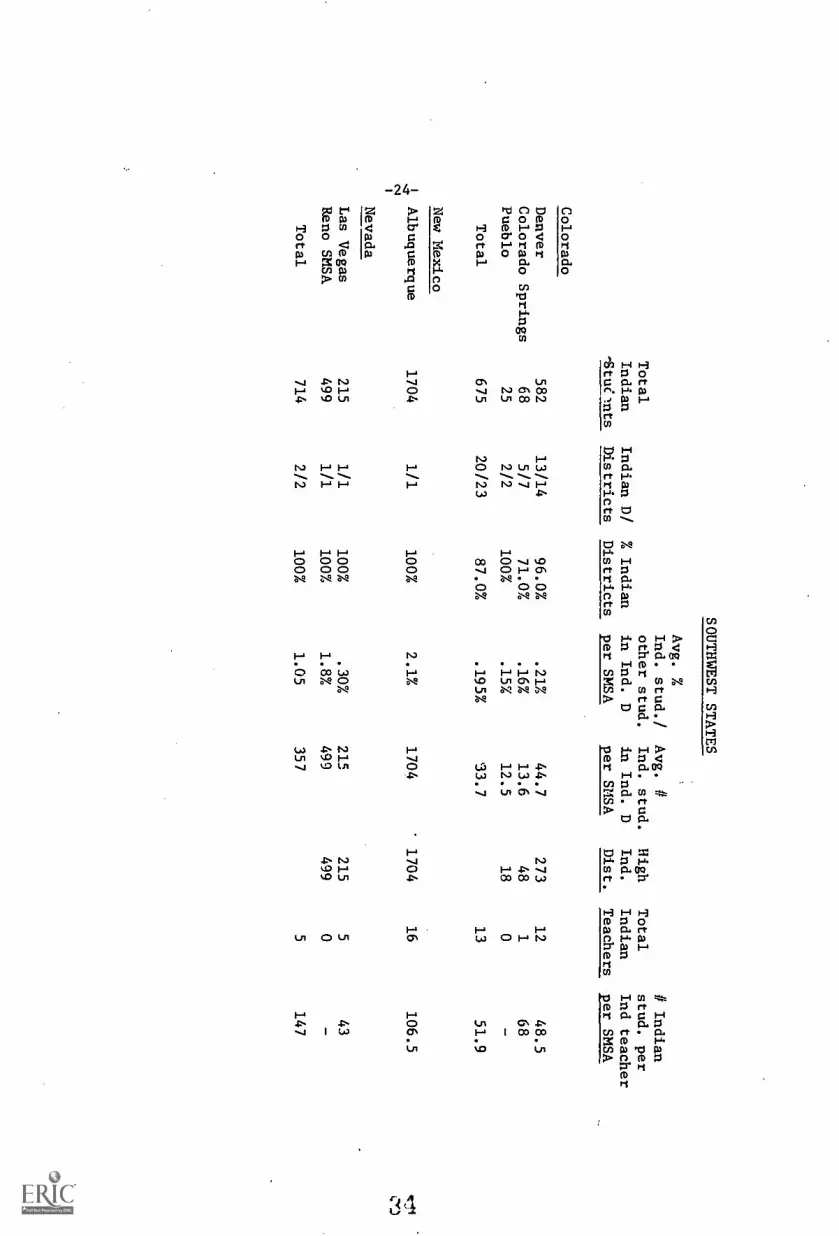
SOUTHWEST STATES
Avg.
Ind. stud./
Avg. #
# Indian
Total
other stud.
Ind. stud.
High
Total
stud, per
Indian
Indian D/
% Indian
in Ind. D
in Ind. D
Ind.
Indian
Ind teacher
-Stuelnts
Districts
Districts
per SMSA
per SMSA
Dist.
Teachers per SMSA
Colorado
Denver
582
13/14
96.0%
.21%
44.7
273
12
48.5
Colorado Springs
68
5/7
71.0%
.16%
13.6
48
168
Pueblo
25
2/2
100%
.15%
12.5
18
0-
Total
675
20/23
87.0%
.195%
33.7
13
51.9
New Mexico
4Albuquerque
1704
1/1
100%
2.1%
1704
1704
16
106.5
r''',1
N1
Cv.)
Nevada
Las Vegas
215
1/1
100%
.30%
215
215
543
Reno SMSA
499
1/1
1001
1.8%
499
499
0
Total
714
2/2
100%
1.05
357
5147
-25-
FOOTNOTES
1U.S. Department of Health, Education, and Welfare, Office for CivilRights, Directory of Public Elementary and Secondary Schools in SelectedDistricts: Enrollment and Staff by Racial/Ethnic Group, Fall 1968 (Washing-ton: U.S. Government Printing Office, 1970), pp. iii-v.
2Herbert Aurbach, Estelle Fuchs and Gordon Macgregor, The Status ofAmerican Indian Education: An Interim Report of the National. Study ofAmerican Indian Education. Office of Education, U.S. Department of Health,Education, and Welfare (University Park, Pennsylvania: Pennsylvania StateUniversity, January 1970), Chapter Four.
3Ibid., Chapter Four.
40ne of the limitations of the current study is that all SMSAs wereincluded except the New England states, since New England SMSAs are not bycounty. Alaska has no SMSAs, and so was eliminated; Virginia was alsoeliminated because of certain difficulties in determining urban location incounty settings. The last problem was related to the manner in which datawere stt%ctured.
APPENDIX A
NORTHEAST STATES
DelawareKentuckyMarylandNew JerseyNew YorkOhioPennsylvaniaWest VirginiaWashington D.C.
(Virginia)
SMSA
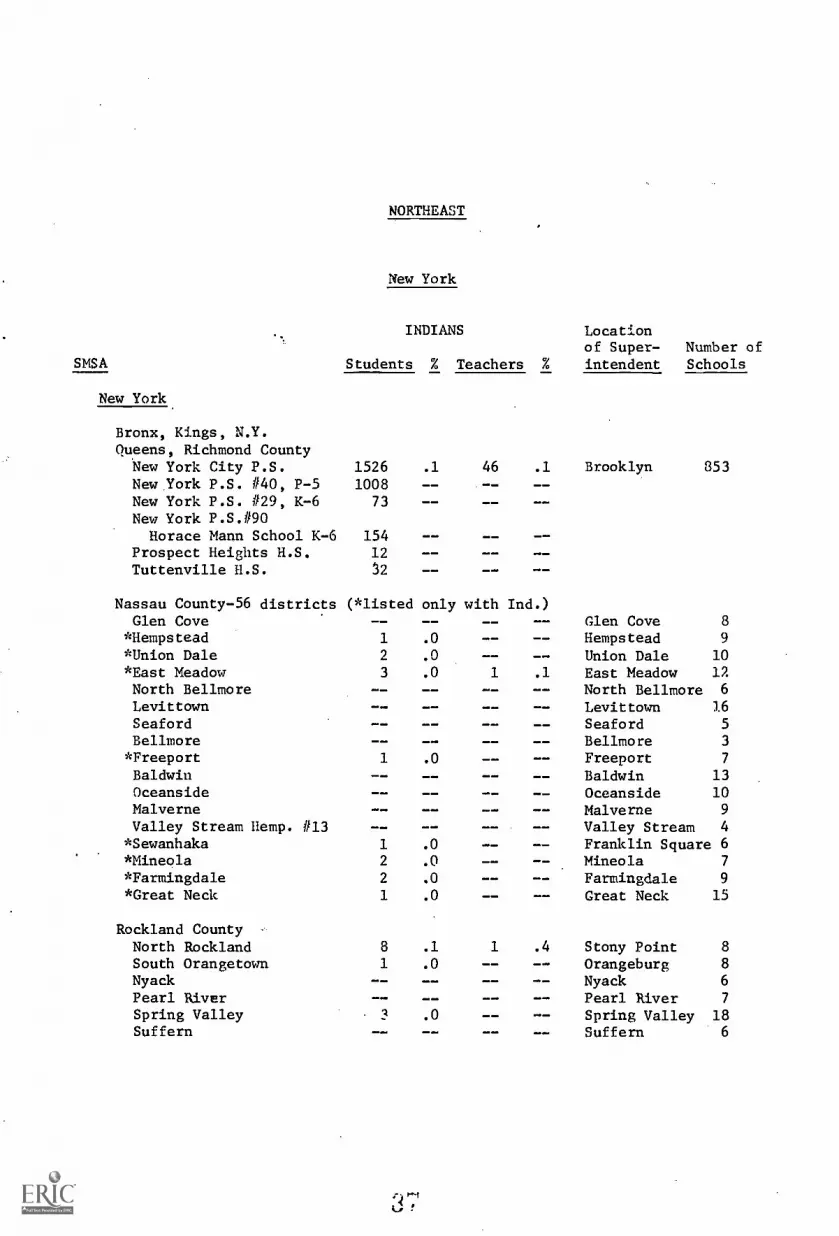
New York.
NORTHEAST
New York
INDIANS Locationof Super- Number of
Students 7 Teachers % intendent Schools
Bronx, Kings, N.Y.Queens, Richmond CountyNew York City P.S. 1526New.York P.S. #40, P-5 1008New York P.S. #29, K-6 73
New York P.S.#90Horace Mann School K-6 154
Prospect Heights H.S. 12Tuttenville H.S. 52
.1 46 .1 Brooklyn 353
Nassau County-56 districts (*listed only with Ind.)Glen Cove Glen Cove 8
*Hempstead 1 .0 Hempstead 9
*Union Dale 2 .0 Union Dale 10*East Meadow 3 .0 1 .1 East Meadow 17.
North Bellmore North Bellmore 6
Levittown -- Levittown 16
Seaford Seaford 5
Bellmore - - Bellmore 3
*Freeport 1 .0 Freeport 7
Baldwin Baldwin 13
Oceanside Oceanside 10Malverne Malverne 9
Valley Stream Hemp. #13 Valley Stream 4
*Sewanhaka 1 .0 Franklin Square 6
*Mineola 2 .0 Mineola 7
*Farmingdale 2 .0 Farmingdale 9
*Great Neck 1 .0 Great Neck 15
Rockland CountyNorth Rockland 8 .1 1 .4 Stony Point 8
South Orangetown 1 .0 Orangeburg 8
Nyack Nyack 6
Pearl River Pearl River 7
Spring Valley 3 .0 Spring Valley 18Suffern Suffern 6
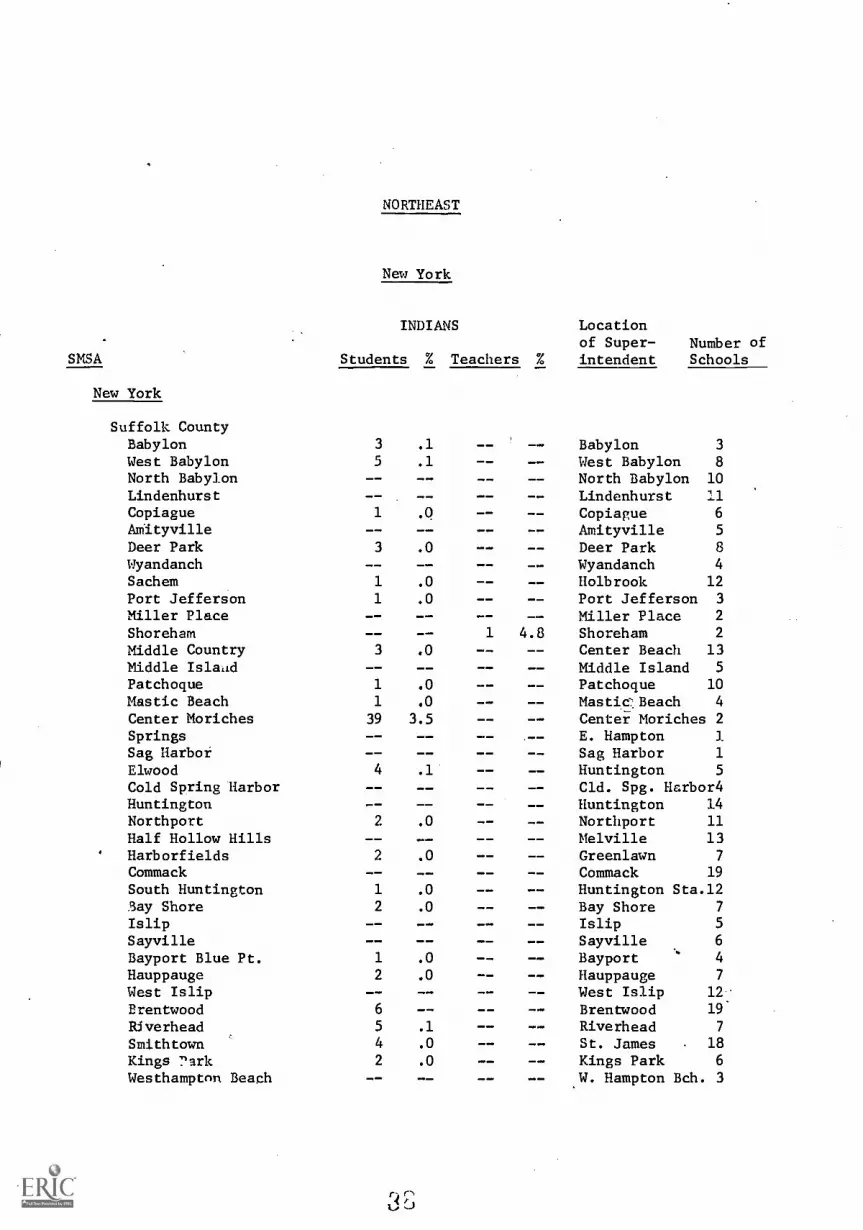
SMSA
New York
Suffolk CountyBabylonWest BabylonNorth BabylonLindenhurstCopiagueAmityvilleDeer ParkWyandanchSachemPort JeffersonMiller PlaceShorehamMiddle CountryMiddle Isla,tdPatchogueMastic BeachCenter MorichesSpringsSag HarborElwoodCold Spring HarborHuntingtonNorthportHalf Hollow HillsHarborfieldsCommackSouth Huntington.Bay Shore
IslipSayvilleBayport Blue Pt.HauppaugeWest IslipBrentwoodRiverheadSmithtownKings 7arkWesthampton Beach
NORTHEAST
New York
INDIANS Locationof Super- Number of
Students % Teachers % intendent Schools
3 .1
5 .1
1 .Q
3 .0
1 .0
1 .0
3 .0
1 .0
1 .0
39 3.5
4 .1
2 .0
2 .0
1 .0
2 .0
1 .0
2 .0
6
5 .1
4 .0
2 .0
Babylon 3
West Babylon 8
North Babylon 10
Lindenhurst 11
Copiague 6
Amityville 5
Deer Park 8
Wyandanch 4
Holbrook 12
Port Jefferson 3
Miller Place 2
1 4.8 Shoreham 2
Center Beach 13
Middle Island 5
Patchogue 10
Mastic:: Beach 4
Center Moriches 2E. Hampton 1
Sag Harbor 1
Huntington 5
Cld. Spg. Harbor4HuntingtonNorthportMelville
_ -
- -
14
11
13Greenlawn 7
Commack 19
Huntington Sta.12Bay Shore 7
Islip 5
Sayville 6
Bayport 4
Hauppauge 7
West Islip 12
Brentwood 19'
Riverhead 7
St. James 18Kings Park 6
W. Hampton Bch. 3
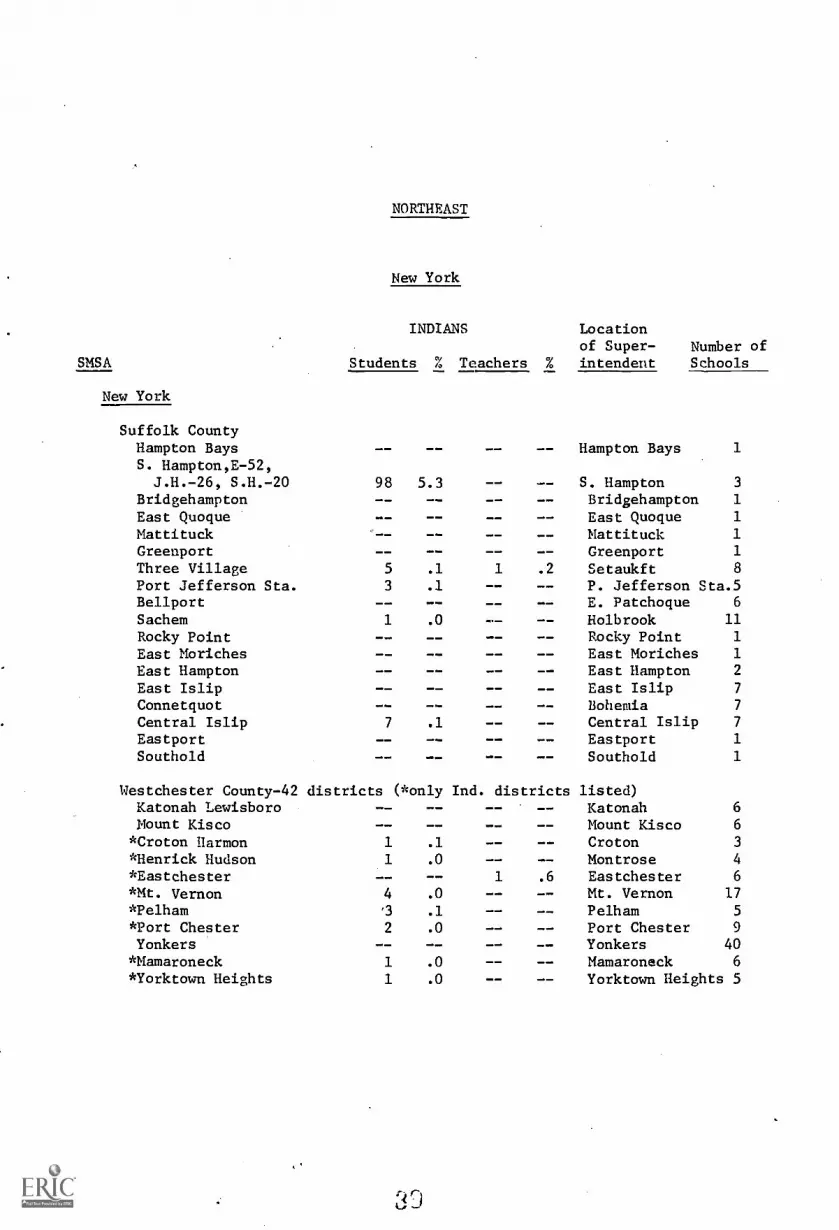
SMSA
New York
Suffolk CountyHampton BaysS. Hampton,E-52,J.H.-26, S.H.-20
BridgehamptonEast QuoqueMattituckGreenportThree VillagePort Jefferson Sta.BellportSachemRocky PointEast MorichesEast HamptonEast IslipConnetquotCentral IslipEastportSouthold
Westchester County-42Katonah LewisboroMount Kisco*Croton Harmon*Henrick Hudson*Eastchester*Mt. Vernon*Pelham*Port ChesterYonkers
*Mamaroneck*Yorktown Heights
NORTHEAST
New York
INDIANS Locationof Super- Number of
Students % Teachers % intendent Schools
98 5.3
5 .1
3 .1
1 .0
7 .1
Hampton Bays 1
S. Hampton 3
Bridgehampton 1
East Quoque 1
Mattituck 1
Greenport 1
1 .2 Setaukft 8
P. Jefferson Sta.5E. Patchogue 6
Holbrook 11
Rocky Point 1
East Moriches 1
East Hampton 2
East Islip 7
Bohemia 7
Central Islip 7
Eastport 1
Southold 1
_ -
districts (*only Ind. districts listed)
1 .0
1 .0
KatonahMount KiscoCrotonMontrose
1 .6 EastchesterMt. VernonPelhamPort ChesterYonkersMamaroneck
- -
6
6
3
4
6
17
5
9
40
6
Yorktown Heights 5
SMSA
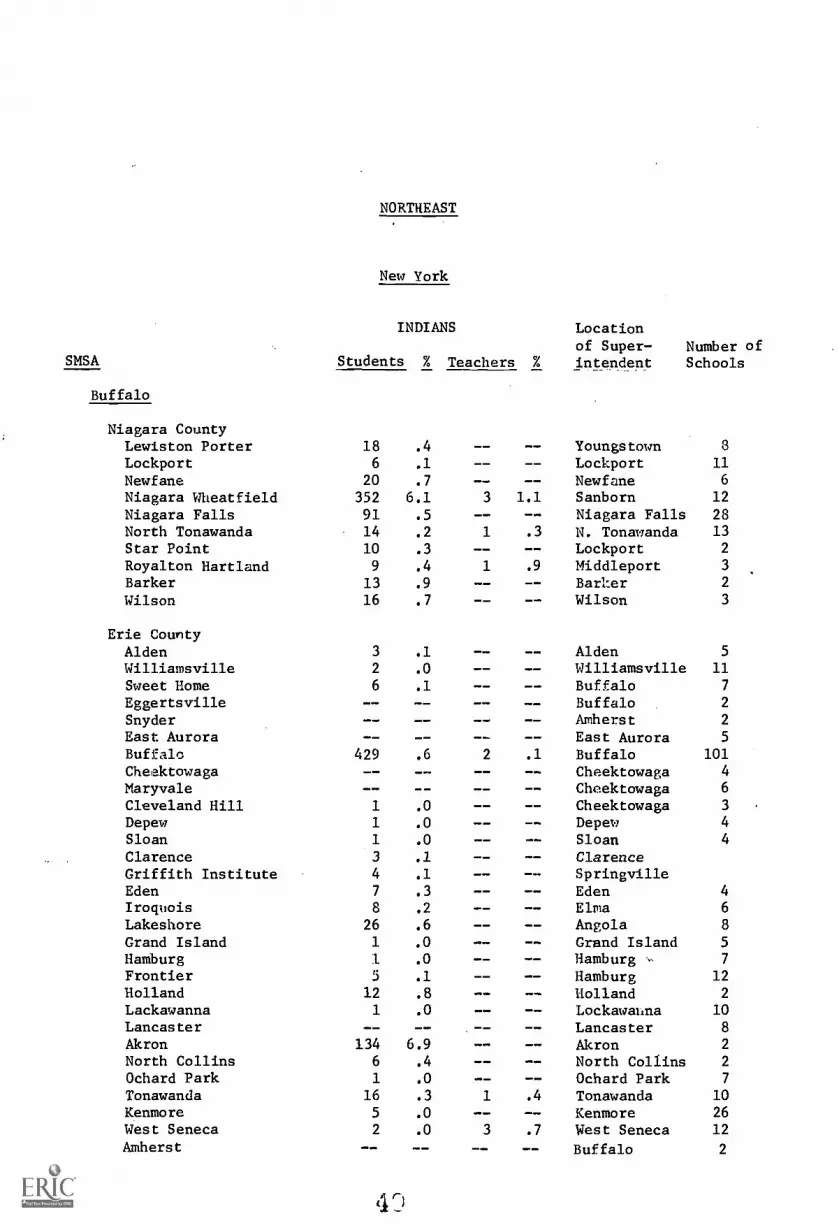
Buffalo
NORTHEAST
New York
INDIANS Locationof Super- Number of
Students % Teachers % intendant Schools
Niagara CountyLewiston Porter 18 .4 Youngstown 8
Lockport 6 .1 Lockport 11
Newfane 20 .7 Newfane 6
Niagara Wheat field 352 6.1 3 1.1 Sanborn 12
Niagara Falls 91 .5 Niagara Falls 28North Tonawanda 14 .2 1 .3 N. Tonawanda 13
Star Point 10 .3 Lockport 2
Royalton Hartland 9 .4 1 .9 Middleport 3
Barker 13 .9 Barker 2
Wilson 16 .7 Wilson 3
Erie CountyAlden 3 .1 Alden 5
Williamsville 2 .0 Williamsville 11
Sweet Home 6 .1 Buffalo 7
Eggertsville Buffalo 2
Snyder Amherst 2
East Aurora East Aurora 5
Buffalo 429 .6 2 .1 Buffalo 101
Cheektowaga Cheektowaga 4
Maryvale Cheektowaga 6
Cleveland Hill 1 .0 Cheektowaga 3
Depew 1 .0 Depew 4
Sloan 1 .0 Sloan 4
Clarence 3 .1 ClarenceGriffith Institute 4 .1 SpringvilleEden 7 .3 Eden 4
Iroquois 8 .2 Elms. 6
Lakeshore 26 .6 Angola 8
Grand Island 1 .0 Grand Island 5
Hamburg 1 .0 Hamburg 7
Frontier 5 .1 Hamburg 12Holland 12 .8 Holland 2
Lackawanna 1 .0 Lockawahna 10
Lancaster -- -- Lancaster 8
Akron 134 6.9 Akron 2
North Collins 6 .4 North Collins 2
Ochard Park 1 .0 Ochard Park 7
Tonawanda 16 .3 1 .4 Tonawanda 10
Kenmore 5 .0 Kenmore 26West Seneca 2 .0 3 .7 West Seneca 12
Amherst Buffalo 2
SMSA
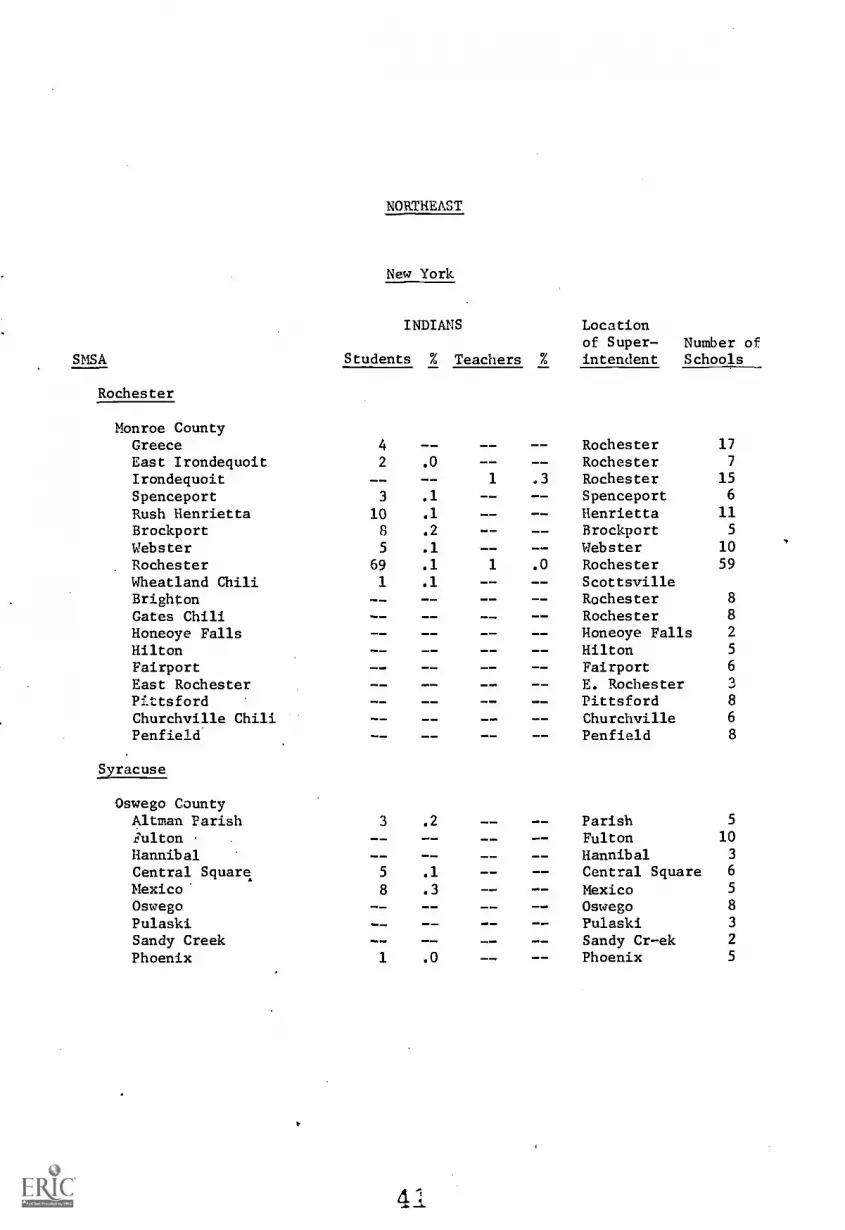
Rochester
NORTHEAST
New York
INDIANS Locationof Super- Number of.
Students % Teachers % intendent Schools
Monroe CountyGreece 4 Rochester 17
East Irondequoit 2 .0 Rochester 7
Irondequoit -- 1 .3 Rochester 15
Spenceport 3 .1 Spenceport 6
Rush Henrietta 10 .1 Henrietta 11
Brockport 8 .2 Brockport 5
Webster 5 .1 Webster 10
Rochester 69 .1 1 .0 Rochester 59
Wheatland Chili 1 .1 ScottsvilleBrighton Rochester 8
Gates Chili Rochester 8
Honeoye Falls Honeoye Falls 2
Hilton -- Hilton 5
Fairport Fairport 6
East Rochester E. Rochester 3
Pittsford -- Pittsford 8
Churchville Chili Churchville 6
Penfield Penfield 8
Syracuse
Oswego CountyAltman Parish 3 .2 -- Parish 5
iulton Fulton 10
Hannibal Hannibal 3
Central Square 5 .1 Central Square 6
Mexico' 8 .3 Mexico 5
Oswego Oswego 8
Pulaski -- Pulaski 3
Sandy Creek -- Sandy Cr-ek 2
Phoenix 1 .0 Phoenix 5
4

SMSA
Syracuse
Omondago CountyCamillusNorth SyracuseEast SyracuseJamesville DewittJordan ElbridgeFabiasWesthillSolvayLa FayetteBaldwinsvilleManliasMarcell'sLiverpoolLyncourtSkaneatelesSyracuseTullyOnondago
Madison CountyBrookfieldCazenoviaDe RuyterMorrisville EatonHamiltonCanastotaMadisonOneidaStr,ckbridge ValleyChittenango
Utica-Rome
NORTHEAST
New York
INDIANS Locationof Super- Number of
Students % Teachers % intendent Schools
Oneida County (17 districts)RomeSherrillUtica
4 .0
9 .1
2 .0
4 .1
5 .4
1 '.0
311 20.62 .0
1 .0
1 .0
109 .4
2 .1
61 3.6
- -
4 .0
8 .2
2 .0
1 .3 Camillus 10
1 .2 N. Syracuse 13
E. Syracuse 9
Dewitt 6
1 .9 Jordan 3
Fabias 3
Syracuse 4
Solvay 5
La Fayette 3
Baldwinsville 8
Manlias 8
Marcellus 4
0 .0 Liverpool 12
Syracuse 1
Skaneateles 4
1 .1 Syracuse 44
Tully 2
Nedrow 3
_ -
- -
- -
Brookfield 1
Cazenovia 4
De Royter 2
Morrisville 3
Hamilton 2
Canastota 4
Madison 3
Oneida 9
Mannsville 3
Chittenango 5
RomeVeronaUtica
216
22
Herkimer County (11 districts)Frankfort 1 1.3 Frankfort 4

NORTHEAST
New York
INDIANS
SMSA Students % Teachers %
Albany-Schenectady
Locationof Super- Number ofintedent Schools
Saratoga County (11 districts)Corinth 2 Corinth 5
South Glens Falls 3 .1 S. Glen Falls 6
Saratoga Springs 1 .0
Schenectady CountyDuansburg - - Delanson 2
Scotia Glenville ScotiaSchalmont 2 .1 Schenectady 9
Mottonasen Schenectady 6
Schenectady 2 .0 Schenectady 25
Niskayuna 2 .0 Schenectady 7
Albany CountyAlbany 8 .1 Albany 24
Bethlehem 1 .0 - - Delmar 9
Ravena Coeymans Selkirk 7
Cohoes 5 .2 Cohoes 6
South Colonie - - - - Albany 12
North Colonie Newtonville 9
Menando School Menando 1
Green Island Green Island 1
Guilderland 43 .8 -- Guilderland 7
Voorheesville 1 .0 0 -- - - Voorheesville 2
Watervliet - - Watervliet 4
Berne Knox Berne
Rensselaer County (11 districts)Hoosic Valley 1 .1 .1=1 Schaghicoke 2
Troy 2 .0 - - Troy 13
Brittonkill 1 .1 - - Troy 3
Binghampton
Broome CountyChenango Forks Chenango Fork 3
Binghampton 7 .1 5 .8 Binghampton 19
Harpersville Harpersville 2
Susquehanna Valley 2 .1 Conklin 6
Chenango Valley 1 .0 Binghampton 6
Maine Endwell Endwell 8
d '-
NORTHEAST
New York
INDIANS
SMSA Students % Teachers %
Binghampton
Locationof Super- Number ofintendent Schools
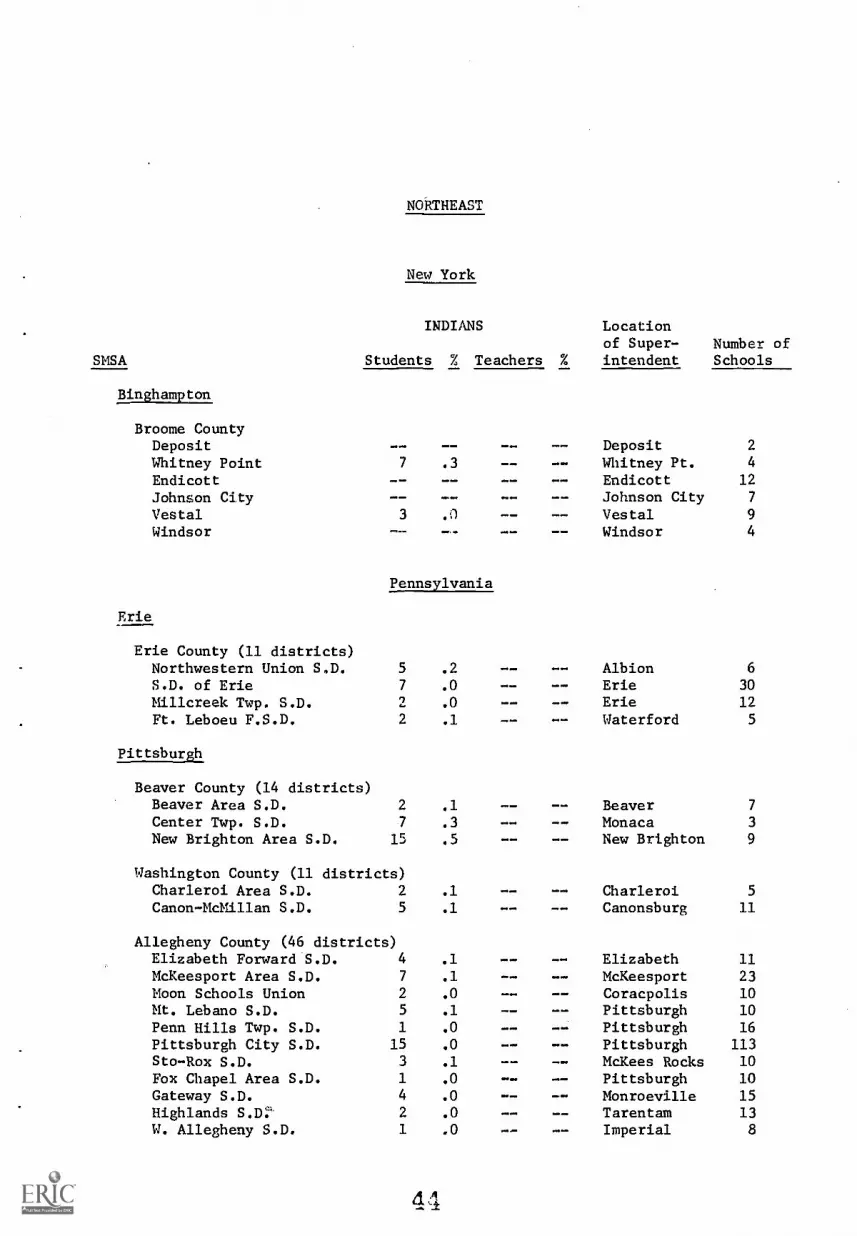
Broome CountyDeposit Deposit 2
Whitney Point 7 .3 Whitney Pt. 4
Endicott Endicott 12
Johnson City Johnson City 7
Vestal 3 .0 Vestal 9
Windsor Windsor 4
Pennsylvania
Erie
Erie County (11 districts)Northwestern Union S.D. 5
S.D. of Erie 7
Millcreek Twp. S.D. 2
Ft. Leboeu F.S.D. 2
.2
.0
.0
.1
AlbionErieErieWaterford
6
30
125
Pittsburgh
Beaver County (14 districts)Beaver Area S.D. 2 .1 Beaver 7
Center Twp. S.D. 7 .3 Monaca 3
New Brighton Area S.D. 15 .5 New Brighton 9
Washington County (11 districts)Charleroi Area S.D. 2 .1 Charleroi 5
Canon-McMillan S.D. 5 .1 Canonsburg 11
Allegheny County (46 districts)Elizabeth Forward S.D. 4 .1 Elizabeth 11
McKeesport Area S.D. 7 .1 McKeesport 23Moon Schools Union 2 .0 Coracpolis 10Mt. Lebano S.D. 5 .1 Pittsburgh 10
Penn Hills Twp. S.D. 1 .0 Pittsburgh 16
Pittsburgh City S.D. 15 .0 Pittsburgh 113Sto-Rox S.D. 3 .1 McKees Rocks 10
Fox Chapel Area S.D. 1 .0 - - -- Pittsburgh 10
Gateway S.D. 4 .0 Monroeville 15
Highlands S.D:' 2 .0 Tarentam 13W. Allegheny S.D. 1 .0 .em Imperial 8

SMSA
Pittsburgh
NORTHEAST
Pennsylvania
INDIANS Locationof Super- Number of
Students % Teachers % intendent Schools
Westmoreland County (16 districts)Hempfield Area S.D. 7 .1 Greensburg 18New Kensington-Arnold S.D. 1 .0 New Kensington 14Burrell S.D. 4 .1 Lower Burrell 8
Greater Latrobe S.D. 1 .0 Latrobe 14
Altoona
Blair County (5 districts)Altoon Area S.D. 2 .0 Altoona 26
Johnstown
Somerset County (9 districts) --Cambria County (10 districts) --
Harrisburg
Dauphin County (8 districts)Harrisburg City S.D. 2 .0 -- Harrisburg 18
Central Dauphin S.D. 5 .0 Harrisburg 22
Cumberland County (3 districts)Carlisle Area S.D. 1 .0 Carlisle 13W. Shore S.D. 5 .0 Lemoyne 19
York (13 districts)
York CountyS.D. of York 2 .0 York 15
Lancaster
Lancaster County (16 districts)Cocalico S.D. 2 .1 -- DenverColumbia Borough S.D. 2 .1 -- Columbia 4
Solanco 1 .0 -- Quarryville 9
Puquea Valley S.D. 2 .1 -- Kinser 5
11.5

SMSA
Reading
NORTHEAST
Pennsylvania
INDIANS Locationof Super- Number of
Students % Teachers % intendent Schools
Berks County (16 districts)Bayertown Area S.D. 4 .1 Bayertown 14
Reading 2 .0 Reading 21Wilson 2 .0 West Lawn 9
Twin Valley S.D. 11 .4 Elverson 5
Wilkes-Barre-Hazelton
Luzerne County (11 districts)Dallas S.D. 2 .1 Dallas 7
Wilkes-Barre'City S.D. 2 .0 -- Wilkes-Barre 18Wyoming Valley W. S.D. 13 .1 Kingston 27
Allentown-Bethlehem Easton - see New Jersey
Philadelphia - see New Jersey
Scranton
Lackawann County (10 districts}-
Ohio
Toledo
Lucus CountyOregon 1 .0 Oregon 8Sylvania 2 .0 -- -- Sylvania 10Toledo 26 .0 Toledo 76Anthony Wayne 1 .0 -- Whitehouse 5Ottawa Hills Toledo 2Springfield 1 .0 Holland 5
Washington Toledo 16
NORTHEAST
Ohio
INDIANS
SMSA Students % Teachers %
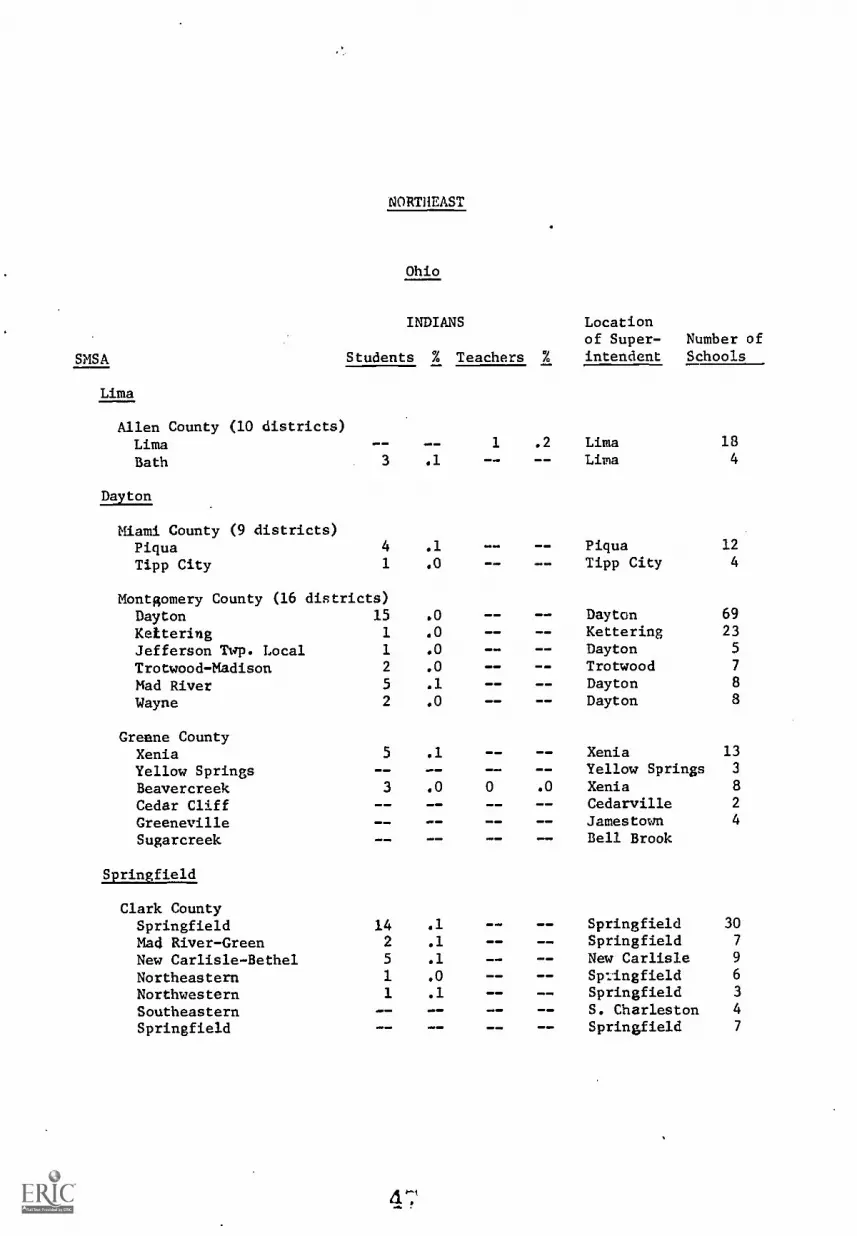
Lima
Locationof Super- Number ofintendent Schools
Allen County (10 districts).1/1.Lima 1 .2 Lima 18
Bath 3 .1 - - . Lima 4
Dayton
Miami County (9 districts)Piqua 4 .1 MO MO Piqua 12
Tipp City 1 .0 - - .11. Tipp City 4
Montgomery County (16 districts)Dayton 15 .0 - - Dayton 69
Kettering 1 .0 Kettering 23
Jefferson Twp. Local 1 .0 - - Dayton 5
Trotwood-Madison 2 .0 - - Trotwood 7
Mad River 5 .1 Dayton 8
Wayne 2 .0 Dayton 8
Greene CountyXenia 5 .1 1111. Xenia 13
Yellow Springs IOW 101111.11 Yellow Springs 3
Beavercreek 3 .0 0 .0 Xenia 8
Cedar Cliff Cedarville 2
Greeneville -_ Jamestown 4
Sugarcreek -_ Bell Brook
Springfield
Clark CountySpringfield 3.4 .1 Springfield 30
Mad River-Green 2 .1 - - Springfield 7
New Carlisle-Bethel 5 .1 New Carlisle 9
Northeastern 1 .0 Springfield 6
Northwestern 1 .1 Springfield 3
Southeastern 100 .,m1 - - S. Charleston 4
Springfield - _ .M.Ow Springfield 7

SMSA
Cincinnati - see Kentucky
Columbus
NORTHEAST
Ohio
INDIANS
Students % Teachers %
Locationof Super- Number ofintendent Schools
Franklin CountyBexley NM 7 -- Columbus 4
Columbus 19 .0 1 .0 Columbus 168
Grandview Heights -- =. Columbus 4
Southwestern 10 .1 Grove City 24
Upper Arlington -- -- Columbus 9
Westerville 1 .0 -- Westerville 11
Whitehall 1 .0 -- Columbus 7
Worthington - _ Worthington 9
Canal Winchester - _ - _ Can. Winchester 2
Hamilton 3 .1 -- -- Columbus . 6
Jefferson 2 .0 Gahanna 8
Madison 1 .0 -- Groveport 8
Mifflin 2 .1 -- Columbus 5
Plain - _ -- New Albany 2
Reynoldsburg 1 .0 -- Reynoldsburg 4
Scioto Darby Hilliard 9
Washington - - - - -- -- Dublin 3
Lorain-Elyria
Lorain County (15 districts)Elyria 7 .1 Elyria 20Lorain 33 .2 - - Lorain 23North Ridgeville 11 .3 N. Ridgeville 5
Amherst 2 .1 AmherstMidview 2 .0 77. - - Grafton
Cleveland
Cuyahoga County (31 districts)Bay Village -- 1 .6 Bay Village 6
Berea 1 .0 1 .2 Bera 21
Brecksville Brecksville 6
Cleveland 128 .1 3 .1
Cleveland Hts.-Univ. Hts. 2 .0 0 .0 Cleveland 17
Fairview Park 2 .1 - - Fairview Park 5

SMSA
Cleveland
NORTHEAST
Ohio
INDIANS Locationof Super- Number of
Students % Teachers % intendent Schools
Cuyahoga CountyLakewood 8 .1 -- Lakewood 14
North Olmsted 1 .0 -- -- N. Olmsted 9
Parma 4 .0 -- Parma 29
Shaker Heights 1 .3 Shaker Heights 12
Warrensville Heights 3 .1 -- Cleveland 5
Westlake 2 .1 -- Westlake 7
Lake CountyPlainesville 1 .0 Plainesville 8
Wickliffe 1 .0 Wickliffe 5
Willoughby Eastlake 4 .0 -- Willoughby 20
Fairport Harbor -- Fairport Harbor 2
Mentor 10 .1 -- -- Mentor 13
Kirtland -- -- Kirtland 4
Madison WM Mb Madison 5
Plainesville -- Plainesville 10
Perry ---1.
-- Perry 4
Akron
Summit County (17 districts)Akron 6 .0 -- -- Akron 71
Barberton 6 .1 -- -- Barberton 14
Cuyahoga Falls 6 .0 ... We Cuyahoga Falls 14
Stow 1 .0 ..... -- Stow 7
Boston-Northampton 2 .1 -- Cuyahoga Falls 3
Springfield 3 .1 -- -- Akron 9
Twinsburg 2 .1 -- Twinsburg 4
Canton
Stark County (17 districts)Canton 6 .0 Oft amie -- Canton 33
Massillon 1 .0 I.= Massillon 14
Fairless 1 .0 -- -- Navarre 7
Lake 6 .3 -- Hartiville 3
Louisville 3 .1 -- -- Louisville 6Minerva 3 .1 1 1.1 Minerva 6
Northwest 2 .1 Canal Fulton 4
Tuslaw 5 .3 1 1.5 Massillon 6
4
NORTHEAST
Ohio
INDIANS Locationof Super- Number of
SMSA Students % Teachers % intendent Schools
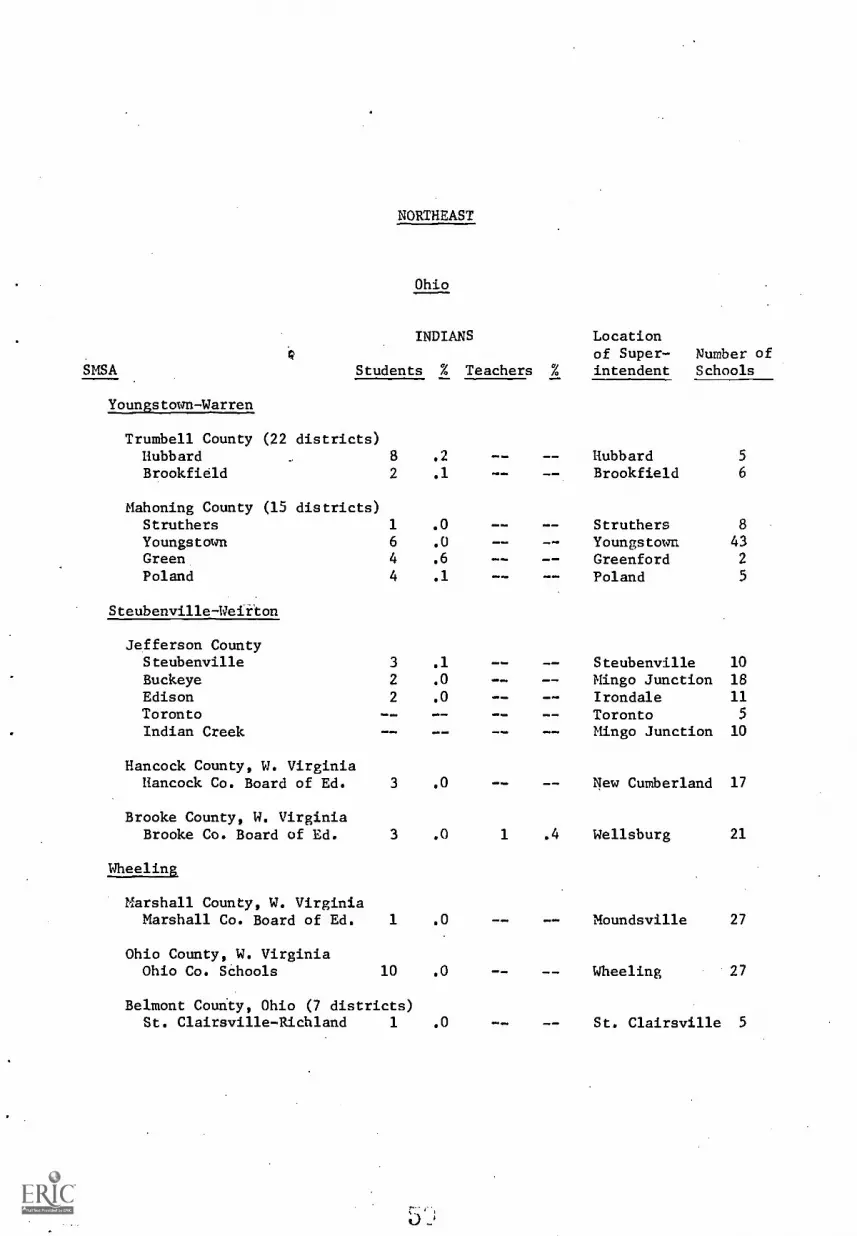
Youngstown-Warren
Trumbell County (22 districts)Hubbard 8 .2 Hubbard 5
Brookfield 2 .1 -- Brookfield 6
Mahoning County (15 districts)Struthers 1 .0 -- Struthers 8
Youngstown 6 .0 -- Youngstown 43Green 4 .6 Greenford 2
Poland 4 .1 -- -- Poland 5
Steubenville - Weirton
Jefferson CountySteubenville 3 .1 -- -- Steubenville 10
Buckeye 2 .0 -- -- Mingo Junction 18
Edison 2 .0 Irondale 11Toronto -- Toronto 5
Indian Creek -- -- Mingo Junction 10
Hancock County, W. VirginiaHancock Co. Board of Ed. 3 .0 New Cumberland 17
Brooke County, W. VirginiaBrooke Co. Board of Ed. 3 .0 1 .4 Wellsburg 21
Wheeling
Marshall County, W. VirginiaMarshall Co. Board of Ed. 1 .0 Moundsville 27
Ohio County, W. VirginiaOhio Co. Schools 10 .0 Wheeling 27
Belmont County, Ohio (7 districts)St. Clairsville-Richland 1 .0 St. Clairsville 5
NORTHEAST
New Jersey
INDIANS
SMSA Students % Teachers %
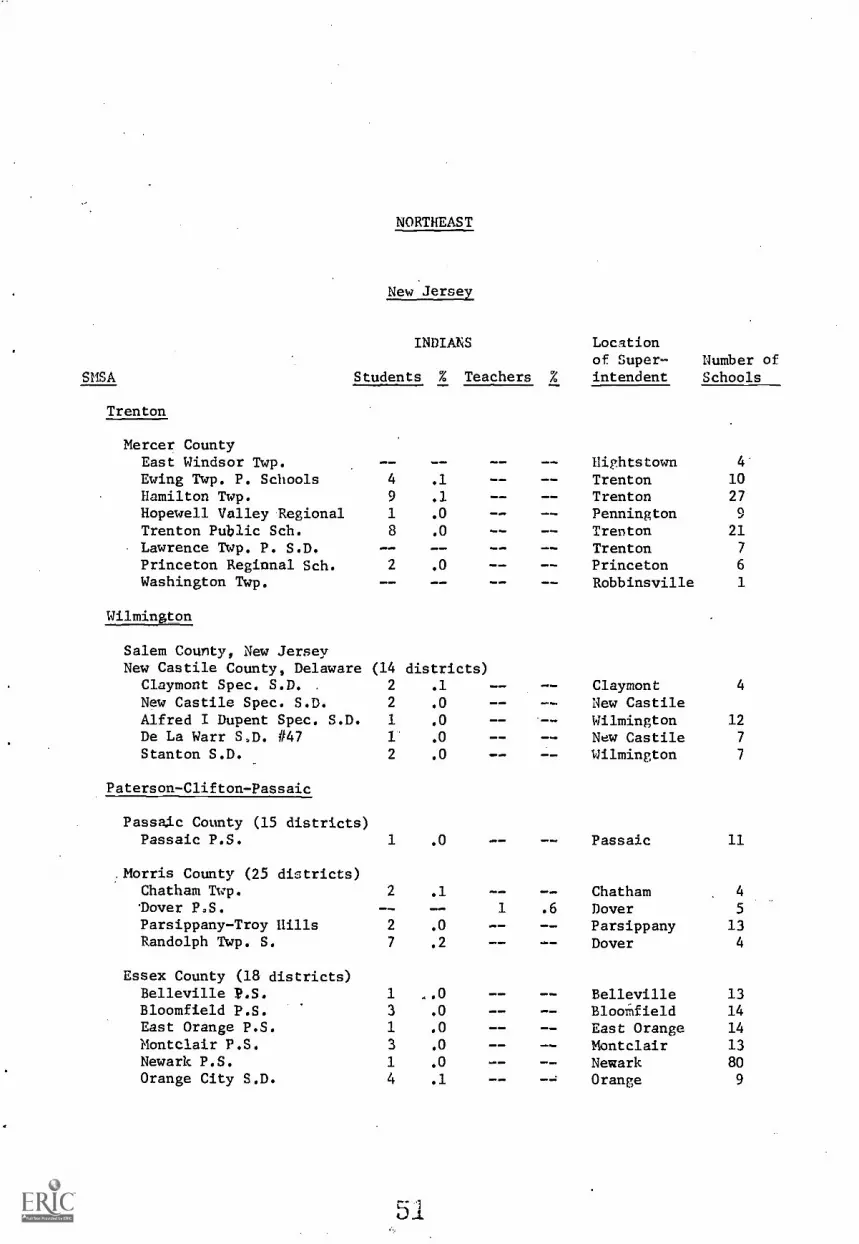
Trenton
Locationof. Super- Number ofintendent Schools
Mercer CountyEast Windsor Twp. Hiphtstown 4
Ewing Twp. P. Schools 4 .1 Trenton 10
Hamilton Twp. 9 .1 Trenton 27
Hopewell Valley Regional 1 .0 Pennington 9
Trenton Public Sch. 8 .0 Trenton 21
Lawrence Twp. P. S.D. Trenton 7
Princeton Reginnal Sch. 2 .0 Princeton 6
Washington Twp. Robbinsville 1
Wilmington
Salem County, New JerseyNew Castile County, Delaware (14 districts)
Claymont Spec. S.D. . 2 .1 - - Claymont 4
New Castile Spec. S.D. 2 .0 New CastileAlfred I Dupent Spec. S.D. 1 .0 Wilmington 12
De La Warr S.D. #47 1 .0 New Castile 7
Stanton S.D. 2 .0 - - Wilmington 7
Paterson-Clifton-Passaic
Passa.c. County (15 districts)Passaic P.S. 1 .0 - - Passaic 11
Morris County (25 districts)Chatham Twp. 2 .1 Chatham 4
Toyer P.S. 1 .6 Dover 5
Parsippany-Troy Hills 2 .0 Parsippany 13Randolph Twp. S. 7 .2 Dover 4
Essex County (18 districts)Belleville V.S. 1 0 Belleville 13Bloomfield P.S. 3 .0 - - Blooiafield 14East Orange P.S. 1 .0 East Orange 14
Montclair P.S. 3 .0 Montclair 13Newark P.S. 1 .0 Newark 80Orange City S.D. 4 .1 Orange 9
51

SMSA
NORTHEAST
New Jersey
INDIANS Locationof Super- Number of
Students % Teachers % intendent Schools
Paterson-Clifton-Passaic
.1
ElizabethClarkLindenPlainfieldRoselle
WeehawkenHarrisonHobokenJersey CityUnion City
AllendaleBergenfieldEnglewoodGlen RockHackensackLodiOaklandRutherfordTeaneckTenafly
Atlantic CityCologne
Hackettstown
Allentown
Bethlehem
25
5
1415
6
4
3
8
36
9
2
7
8
5
7
7
4
7
11
6
146
2
28
31
Union County (19 districts)Elizabeth P.S. 3 .0
Cl,rk P.S. 2 .1
Linden P.S. 2 .0
Plainfield City S.D. 5 .1
Roselle 1 .0
Hudson County (11 districts)Weehawken P.S. 2 .1
Harrison Town S.D. 2 .1
Hoboken P.S. 3 .0
Jersey City S.D. 10 .0 1
Union City P.S. 11 .1
Bergen County (50 districts)Allendale P.S. 2 '' .1
Bergenfield P.S. 3 .1
Englewood P.S. 1 .0
Borough of Glen Rock 1 .0
Hackensack P.S. 9 .2
Lodi P.S. 1 .0 --Oakland P.S. 1 .0
Rutherford P.S. 2 .1
Teaneck P.S. 1 .0
Tenafly P.S. 1 .0
Atlantic City
Atlantic County (13 districts)Atlantic City P.S. 2 .0
Galloway Twp. 1 .1
Allentown-Bethlehem-Easton
Warren County, New Jersey (6 districts)Hackettstown S.D. 3 .1
Lehigh County, Pennsylvania (7 districts)S.D. of Allentown 2 .0
Northhampton County, Pennsylvania (8 districts)Bethlehem Area S.D. 3 .0
5 2
NORTHEAST
New Jersey
INDIANS
SMSA Students % Teachers %
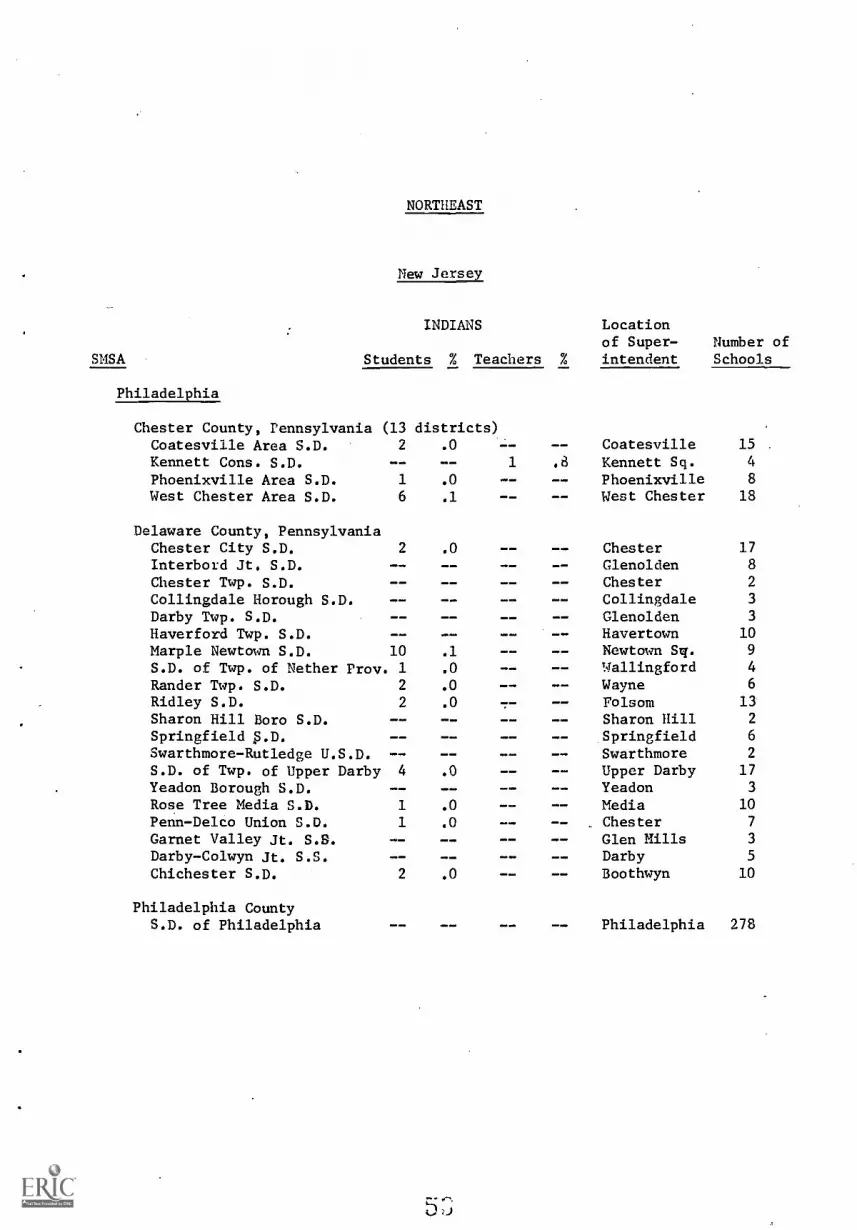
Philadelphia
Chester County, Pennsylvania (13 districts)
Locationof Super- Number ofintendent Schools
Coatesville Area S.D. 2 .0 -- Coatesville 15
Kennett Cons. S.D. 1 .3 Kennett Sq. 4
Phoenixville Area S.D. 1 .0 Phoenixville 8
West Chester Area S.D. 6 .1 West Chester 18
Delaware County, PennsylvaniaChester City S.D. 2 .0 Chester 17
Interbord Jt. S.D. Glenolden 8
Chester Twp. S.D. Chester 2
Collingdale Horough S.D. Collingdale 3
Darby Twp. S.D. Glenolden 3
Haverford Twp. S.D. Havertown 10
Marple Newtown S.D. 10 .1 Newtown Sq. 9
S.D. of Twp. of Nether Elroy. 1 .0 Wallingford 4
Rander Twp. S.D. 2 .0 Wayne 6
Ridley S.D. 2 .0 Folsom 13
Sharon Hill Boro S.D. Sharon Hill 2
Springfield p.p. Springfield 6
Swarthmore-Rutledge U.S.D. -- Swarthmore 2
S.D. of Twp. of Upper Darby 4 .0 Upper Darby 17
Yeadon Borough S.D. -- Yeadon 3
Rose Tree Media S.D. 1 .0 Media 10
Penn-Delco Union S.D. 1 .0 Chester 7
Garnet Valley Jt. S.S. -- Glen Mills 3
Darby- Colwyn Jt. S.S. Darby 5
Chichester S.D. 2 .0 Boothwyn 10
Philadelphia CountyS.D. of Philadelphia Philadelphia 278

NORTHEAST
New Jersey
INDIANS
SMSA Students % Teachers %
Philadelphia
Montgomery County, Pennsylvania (20 districts)Abington S.D. 3 .0
HatBoro-Horsham S.D. 7 .2
Upper Merion Area S.D. 7 .1
Upper Moreland Twp. S.D. 2 .0
Colonial S.D. 6 .1
North Penn S.D. 2 .0
Spring-Ford Area S.D. 1 .0
Bucks County, PennsylvaniaS.D. of Bensalem Twp.Bristol Borough D.Bristol Twp. S.D.S.D. Bor. of MorrisvilleNew Hope-SoleburyQuakertown Com. S.D.Centennial S.D.Central Bucks S.D.Council Rock S.D.Neshaminy S.D.Palisades S.D.Pennridge S.D.Pennsbury S.D.
4
9
2
6
1
5
Locationof. Super- Number ofintendent Schools
Abington 18
Horsham 8
King of Prussia 10Millow Grove 6
Plymouth Mtg. 11
Lansdale 16
Royersford 9
.1 Cornwells Hts.Bristol
.1 2 .4 BristolMorrisvilleNew Hope
.0 Quakertown
.1 Warminster
.0 DoylestownRichboro
.0 Langhorne1 1.1 Kintnersville
PerkasieFallsington
Gloucester County, New Jersey (14 districts)Dept Ford Twp. P.S. 1 .0 1
W. Dept Ford Twp. P.S. 1 .0 1
Camden County, New Jersey (21 districts)Collingswood P.S. 3 .1
Lower Camden Co. Reg. 11SD #1 1 .0
Pennsauken P.S. 5 .1
Camden City P.S. 6 .0
Cherry Hill P.S. 3 .0
Burlington County, New Jersey (20 districts)Burlington Twp. 4 .2
Pemberton Twp. 8 .1
WillingBoro Twp. Brd. of Ed. 4 .0
1
1
.4 Dept Ford
.7 Woodbury
7
3
15
5
2
11
1316
9
15
6
11
18
13
9
.8 Collingswood 7
AtcoPennsauken 15
.1 Camden 31
Cherry Hill 18
- - BurlingtonBrowns MillsWilling Boro
SMSA
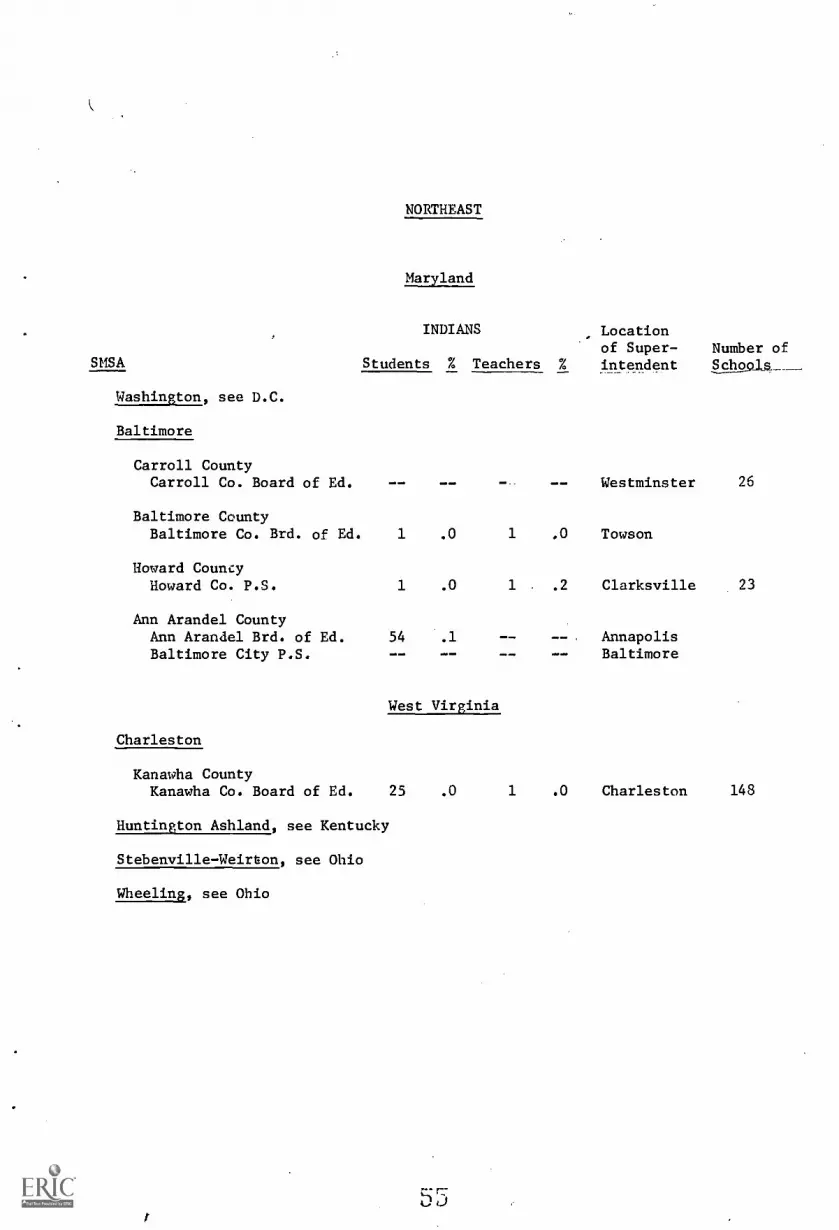
Washington, see D.C.
Baltimore
Carroll CountyCarroll Co. Board of Ed.
Baltimore CountyBaltimore Co. Brd. of Ed.
Howard CouncyHoward Co. P.S.
Ann Arandel CountyAnn Arandel Brd. of Ed.Baltimore City P.S.
NORTHEAST
Maryland
INDIANS Locationof Super- Number of
Students % Teachers % intendent School_s_
West Virginia
Charleston
Kanawha CountyKanawha Co. Board of Ed.
Huntington Ashland, see Kentucky
Stebenville-Weirton, see Ohio
Wheeling, see Ohio
Westminster 26
1 .0 Towson
1 . .2 Clarksville 23
AnnapolisBaltimore
25 .0 1 .0 Charleston 148
SMSA
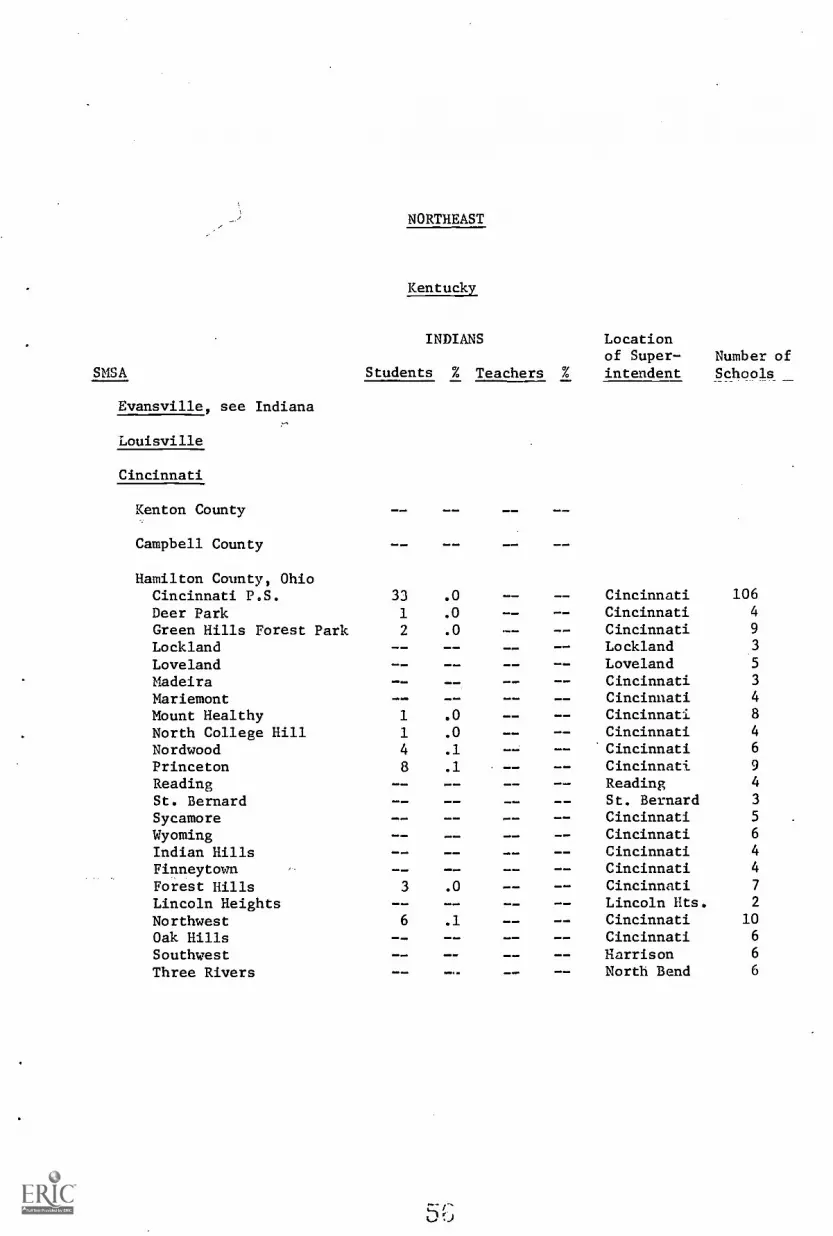
NORTHEAST
Kentucky
INDIANS Locationof Super-
Students % Teachers % intendent
Evansville, see Indiana
Louisville
Cincinnati
Kenton County
Campbell County
Hamilton County, Ohio
Number ofsSchool
.
Cincinnati P.S. 33 .0 Cincinnati 106
Deer Park 1 .0 Cincinnati 4
Green Hills Forest Park 2 .0 Cincinnati 9
Lockland Lockland 3
Loveland Loveland 5
Madeira Cincinnati 3
Mariemont Cincinnati 4
Mount Healthy 1 .0 Cincinnati 8
North College Hill 1 .0 Cincinnati 4
Nordwood 4 .1 Cincinnati 6
Princeton 8 .1 Cincinnati 9
Reading Reading 4
St. Bernard St. Bernard 3
Sycamore Cincinnati 5
Wyoming Cincinnati 6
Indian Hills Cincinnati 4
Finneytown Cincinnati 4
Forest Hills 3 .0 Cincinnati 7
Lincoln Heights Lincoln Hts. 2
Northwest 6 .1 Cincinnati 10
Oak Hills Cincinnati 6
Southwest Harrison 6
Three Rivers North Bend 6
'J
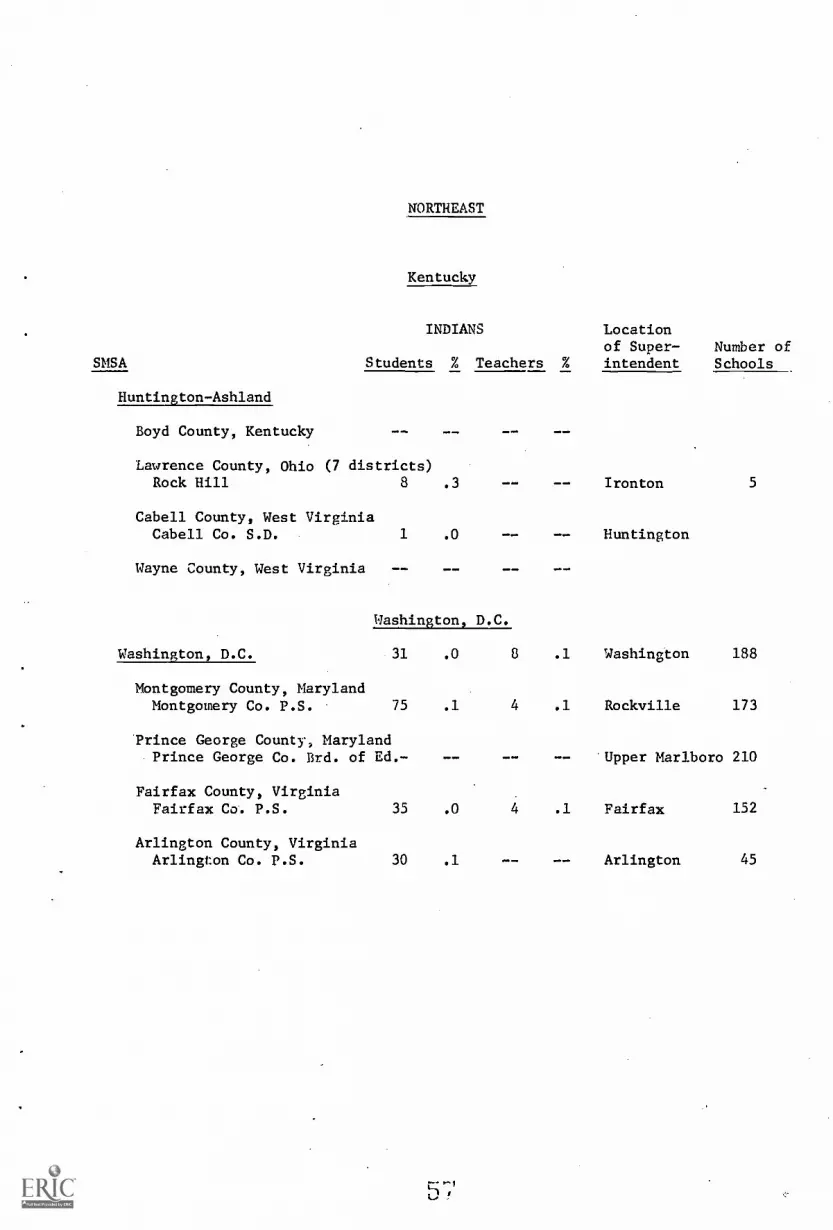
NORTHEAST
Kentucky
INDIANS Locationof Super- Number of
SMSA Students % Teachers % intendent Schools
Huntington-Ashland
Boyd County, Kentucky
Lawrence County, Ohio (7 districts)Rock Hill 8 .3 Ironton 5
Cabell County, West VirginiaCabell Co. S.D.
Wayne County, West Virginia
Washington, D.C.
1 .0 Huntington
Washington, D.C.
31 .0 8 .1 Washington 188
Montgomery County, MarylandMontgomery Co. P.S. 75 .1 4 .1 Rockville 173
'Prince George County, MarylandPrince George Co. Brd. of Ed.- 'Upper Marlboro 210
Fairfax County, VirginiaFairfax Co. P.S. 35 .0 4 .1 Fairfax 152
Arlington County, VirginiaArlington Co. P.S. 30 .1 Arlington 45
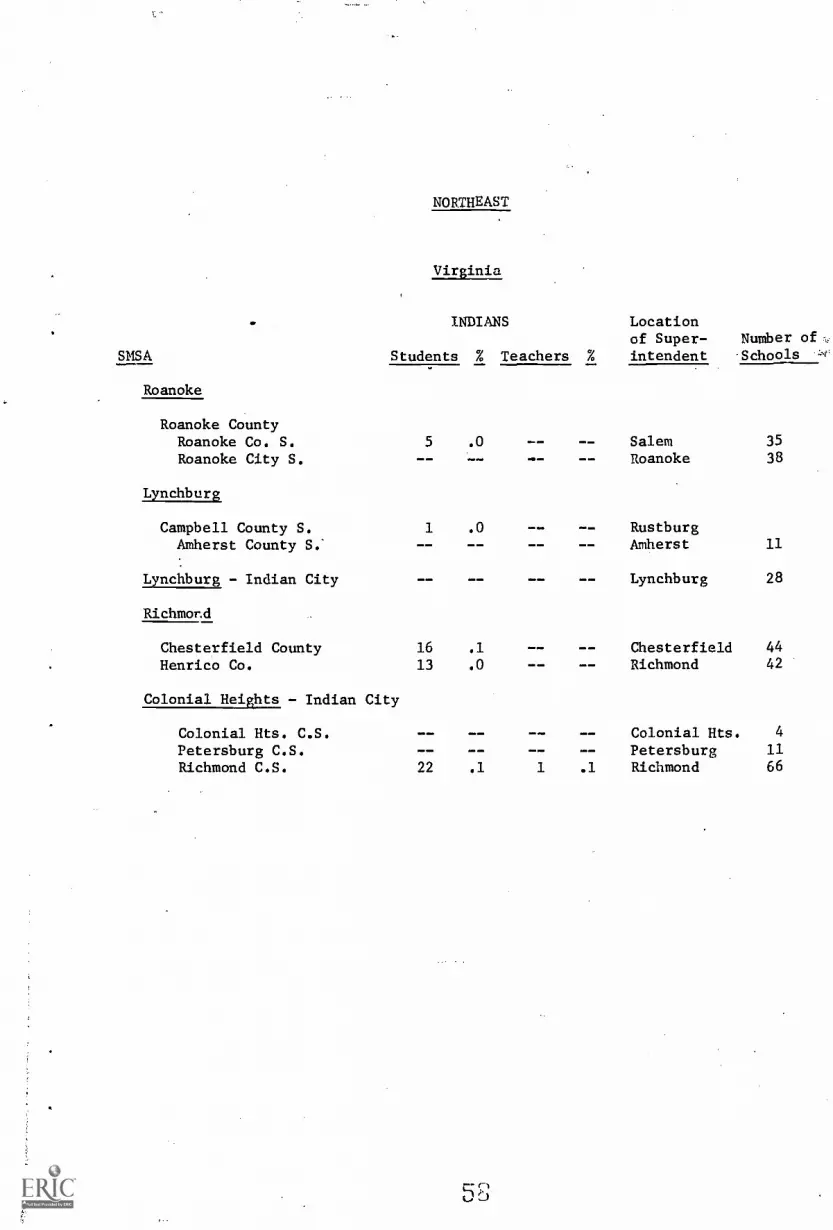
NORTHEAST
Virginia
INDIANS Locationof Super- Number of
SNSA Students % Teachers % intendent Schools
Roanoke
Roanoke CountyRoanoke Co. S.Roanoke City S.
Lynchburg
5
1
16
13
22
.0
.0
.1
.0
.1
--
--
1 .1
SalemRoanoke
RustburgAmherst
Lynchburg
ChesterfieldRichmond
Colonial Hts.PetersburgRichmond
35
38
11
28
4442
4
11
66
Campbell County S.Amherst County S.
Lynchburg - Indian City
Richmond
Chesterfield CountyHenrico Co.
Colonial Heights - Indian City
Colonial Hts. C.S.Petersburg C.S.Richmond C.S.
APPENDIX B
SOUTHEAST STATES
AlabamaFloridaGeorgiaMississippiNorth CarolinaSouth CarolinaTennessee

SOUTHEAST
Alabama
INDIANS Locationof Super- Number of
SMSA Students % Teachers % intendant Schools
Huntsville
Madison County
Gadsden
Etowah County --
Birmingham
Jefferddn County --
Tuscaloosa
Tuscaloosa County --
Montgomery
Montgomery County
Columbus
Russell County
Muscogee County, GeorgiaMuscogee Co. S.D.
Chattahoocee County, Georgiano listings
Mobile
Mobile County
12 .0
6 ri
Columbus 67

SMSA
SOUTHEAST
Mississippi
INDIANS Locationof Super- Number of
Students % Teachers % intendent Schools
Jackson
Hinds CountyJackson fun. Sep. S.D.Hinds Co. S.
Ashville
17 .0
4 .0
North Carolina
JacksonJackson
5621
..;auttitxxi
Buncombe CountyAshville City S. 11 .1 Ashville 14Buncombe City S. 8 .0 Ashville 33
Charlotte
Mecklenburg CountyCharlotte-Mecklenburg S. 110 .1 2 .1 Charlotte 112
Winston-Salem
Forsyth CountyWinston-Salem/Forsyth Co.S. 37 .1 Winston-Salem 67
Greensboro-Highpoint
Guilford CountyGreensboro P.S. 70 .2 Greensboro 46High Point City S. 83 .7 1 .2 High Point 18Guilford Co. S. 66 .3 5 .6 Greensboro 34
Durham
Durham CountyDurham City S. 6 .0 - - Durham 28Durham Co. S. 3 .0 Durham. 22
Raleigh
Wake CountyRaleigh City S. 5 .0 Raleigh 39Wake Co. S. 37 .1 1 .1 Raleigh 42
Governor ffoorhead S. 2 .4 Raleigh 3
61

SOUTHEAST
Florida
INDIANS Locationof Super- Number of.
SMSA Students % Teachers % intendant Schools
Pensacola
Escambia CountyEscambia Co. S. 66 .1 1 .1 Pensacola 76
Santa Rosa CountyBoard of Public Inst. 3 .0 Milton 19
Jacksonville
Duval County S.D. ....- -- -- Jacksonville
Orlando
Seminole County S. 20 .1 Sanford 25
Orange County S. Board -- Orlando 96
Tampa-St. Petersburg
Pinellas CountyBd. of. Public Inst. 56 .1 -- Clearwater 109
Hillsborough County S.D. 191 .2 5 .1 Tampa 131
West Palm Beach
Palm Beach CountyBoard of Public Inst. 5 .0 W. Palm Beach 91
Et. Lauderdale-Hollywood
Broward CountyBoard of Public Inst. 114 .1 2 .0 Ft. Lauderdale 107
Miami
Dade County P. S. 436 .2 3 .0 Miami 215
62
SMSA
Chattanooga
SOUTHEAST
Georgia
INDIANS Lociionof Super- Number of
Students % Teachers % intendant Schools
Hamilton County, TennesseeChattanooga City S. 9 .0 Chattanooga 46
Hamilton Co. Dept. of Ed. - - Chattanooga 56
Walker County
Atlanta
Cobb County Schools 14 .0 =11 Marietta 55
Fulton CountyAtlanta P.S. .0 Atlanta 160Fulton Co. S. .0 Atlanta 71
Clayton County hoard of Ed. 9 0 Jonesboro. 26
Dekalb County S. 24 .0 1 .1 Decatur 102City S. of. Decatur WO*. - _ Decatur 10
Gwinnett County S. 6 .0 2 .4 Lawrenceville 24
Augusta
Richmond Co. S.D. 43 .1 1 .1 Augusta 51
Aiken County S.
Macon_
Bibb County P.S. - - - _ Macon 59
Houston County. S.D. Perry 23
Savannah
Chatham CountySavannah Co. S. Savannah 63
Columbus - see Alabama
Albany
1 .0 - - Albany 35Dougherty County S.D.
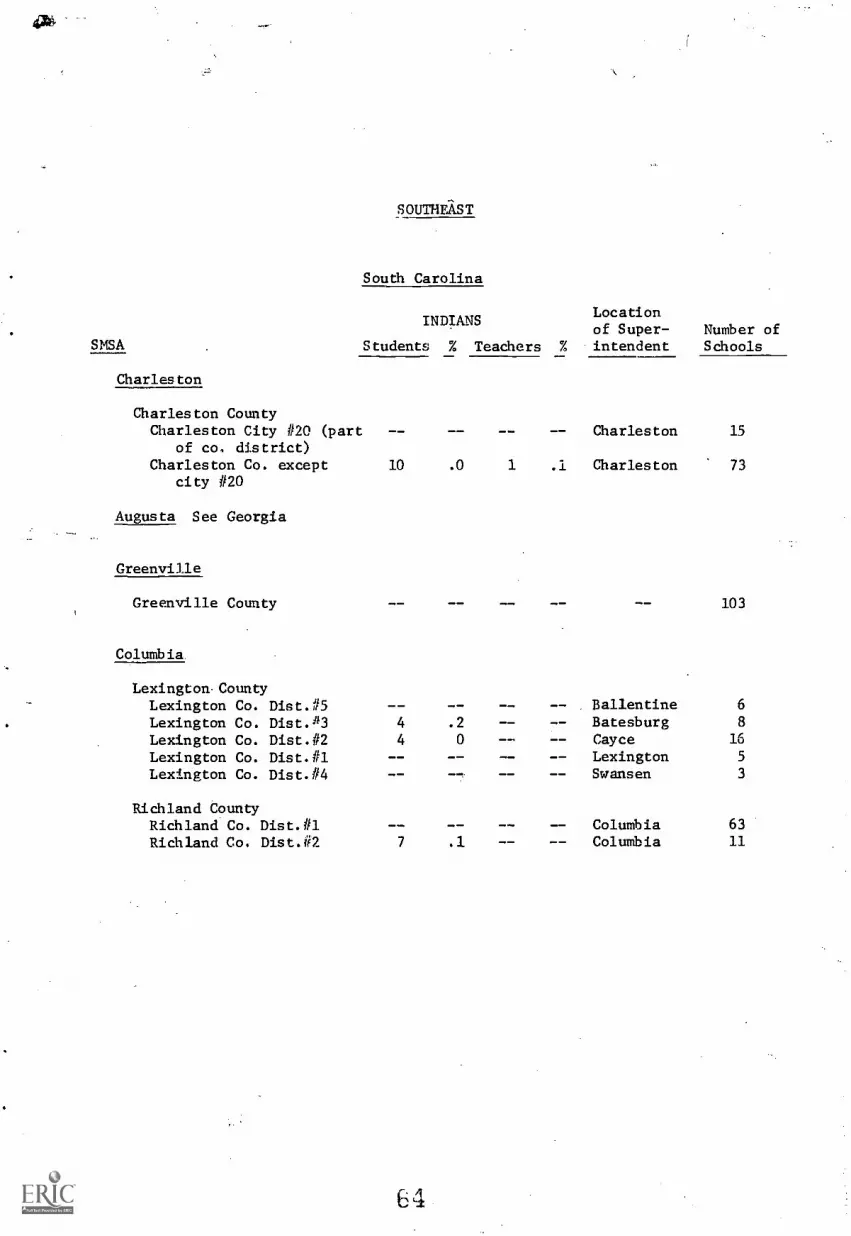
SOUTHEAST
South Carolina
SMSA
INDIANSLocationof Super- Number of
Students % Teachers % intendent Schools
Charleston
10
4
4
7
.0
.2
0
.1
1 .1
--
--
--
--
Charleston
Charleston
. BallentineBatesburgCayceLexingtonSwansen
ColumbiaColumbia
15
73
103
6
8
16
5
3
63
11
Charleston CountyCharleston City #20 (part
of co. district)Charleston Co. except
city #20
Augusta See Georgia
Greenville
Greenville County
Columbia.
Lexington. CountyLexington Co. Dist.I5Lexington Co. Dist.#3Lexington Co. Dist.#2Lexington Co. Dist.#1Lexington Co. Dist.1 /4
Richland dountyRichland Co. Dist.#1Richland Co. Dist.#2
64
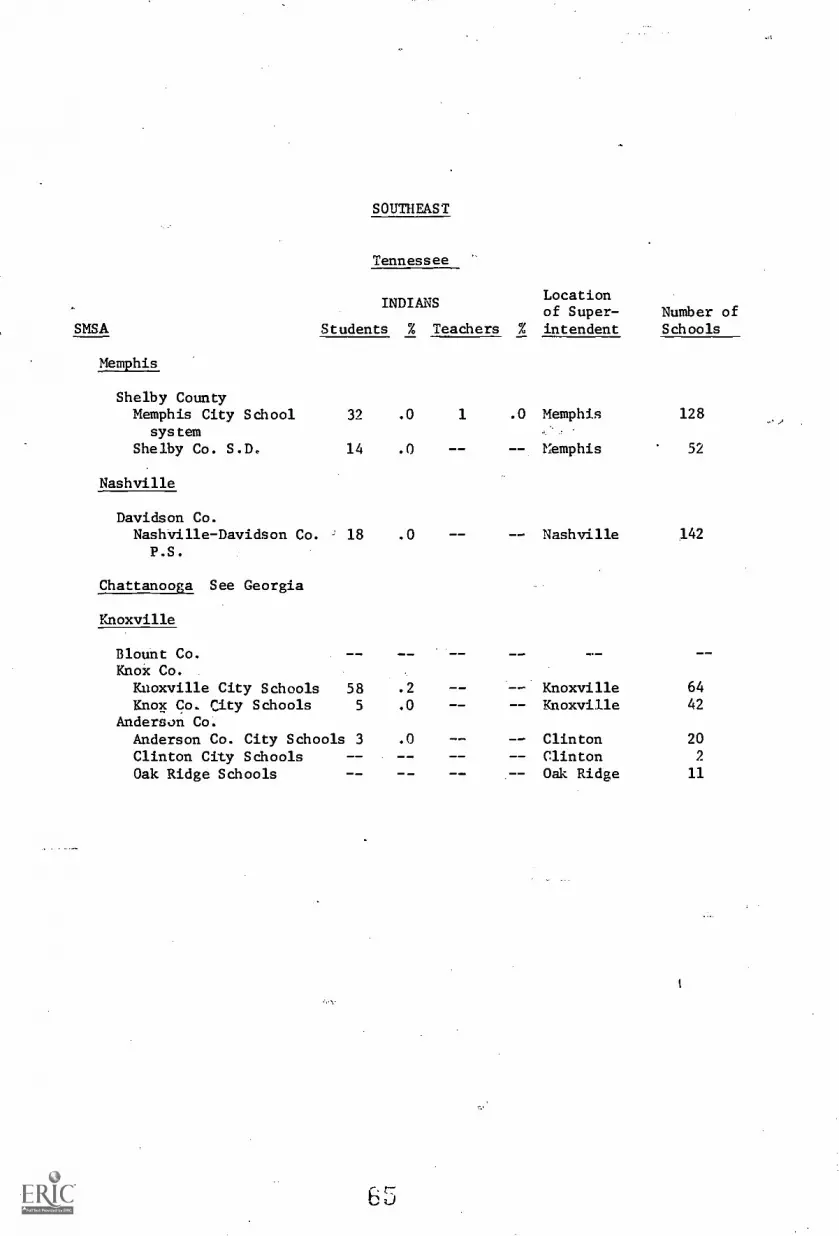
SMSA
Memphis
SOUTHEAST
Tennessee
INDIANSLocationof Super- Number of
Students % Teachers % intendent Schools
Shelby CountyMemphis City School 32
systemShelby Co. S.D. 14
Nashville
.0
.0
.0
.2
.0
.0
1 .0
--
--
--
----
----
Memphis
Memphis
Nashville
KnoxvilleKnoxville
ClintonClintonOak Ridge
128
52
142
64
42
20
2
11
Davidson Co.Nashville-Davidson Co. 18P.S.
Chattanooga See Georgia
Knoxville
Blount Co.Knox Co.Knoxville City Schools 58Knox Co. City Schools 5
Anderson Co.Anderson Co. City Schools 3Clinton City SchoolsOak Ridge Schools
65
APPENDIX C
MID NORTH CENTRAL STATES
IllinoisIndianaIowaMichiganMinnesotaNebraskaNorth DakotaSouth DakotaWisconsin
6G

SMS(Ik
MID NORTR. CENTRAL
North Dakota
INDIANS Locationof Super Number of
Students % Teachers % intendant Schools
FargoMoorehead see Minnesota
South Dakota
Sioux Falls
Minnehaha CountyBrandon Valley I.S.D.#150 .5 Brandon 3
W. Central I.S.D.#154 -- -- Hartford 2
Sioux Falls I.S.D.#1 117 .6 1 .1 Sioux Falls 29
Nebraska
Omaha
Pottawaltomie County, Iowa (4 districts)Council Bluffs Comm. S. 13 .1
Douglas County, Nebraska
Council Bluffs 29
Elkhorn P. S. 4 .5 -- Elkhorn 2
Omaha P.S.D. #1 239 .4 -- Omaha 95
Ralston P.S. 3 .1 -- Ralston 6
Westside S.D. 166 4 .0 -- ' Omaha 16
Sarpy County, Nebraska.Ballevue P.S. 23 .2 -- -- Bellevue 17
Springfield S.D. #46 3 .4 Springfield 4
Lincoln
Lancaster CountyNorris S.D. #160 Hickman 5
S.D. of Lincoln 129 .4 Lincoln 45
6

SMSA
Minneapolis-St. Paul
MID NORTH CENTRAL
Minnesota
INDIANS
Students % Teachers
Locationof Super- Number ofintendent Schools
Anoka CountyAnoka-Hennepin I.S.D.#1 35 .1 1 .1 Anoka 23
Centennial S.D. #12 8 .2 -- Circle Pines 5
I.S.D. #13 8 .1 Columbia Hts. 9
I.S.D. #14 6 .1 -- Fridley 8
St. Francis I.S.D. #15 8 .4 -- St. Francis 4
Spring Lake Park I.S.D.#16 2 .0 -- Minneapolis 6
Hennepin CountyI.S.D. #271 32 .1 BloomingtonBrooklyn Center I.S.D.#286 8 .3 Minneapolis 2
I.S.D. #272 -- .11 Eden Prairie 3
Edina P.S. 8 .1 Edina 11
I.S.D. #274 .6 .2 Hopkins 12
I.S.D. #275 -- -- Golden valley 3
Minneapolis S.S.D. #1 1490 2.1 2 .1 Minneapolis 98Minnteonka S.D. #276 2 .0 Excelsior 9
I.S.D. #277 15 .4 Mound 5
I.S.D. #279 14 .1 3 .2 Osseo 14
Richfield P.S. I.S.D.#280 18 .2 Richfield 11
Robbinsdale I.S.D. #281 44 .2 1 .1 New Hope 26
St. Anthony Vil.I.S.D. 1282 1 .0 - - Minneapolis 4
I.S.D. #283 25 .2 St. Louis Pk. 14
I.S.D. #284 7 .1 11., Wayzata 8
Dakota CountyI.S.D. #191 7 .1 Burnsville 9
Farrington I.S.D. #192 - - - - FarmingtonHastings P.S. 3 .1 HastingsRandolph P.S. 11. RandolphI.S.D. #196 5 .1 RosemountS. St. Paul P.S.S.D. #6 11 .2 Mal. S. St. PaulI.S.D. #197 3 .1 - - W. St. PaulInver Grove I.S.D. #199 11 .3 Mal. ft/0MM Inver Grove Hts.
6 E')
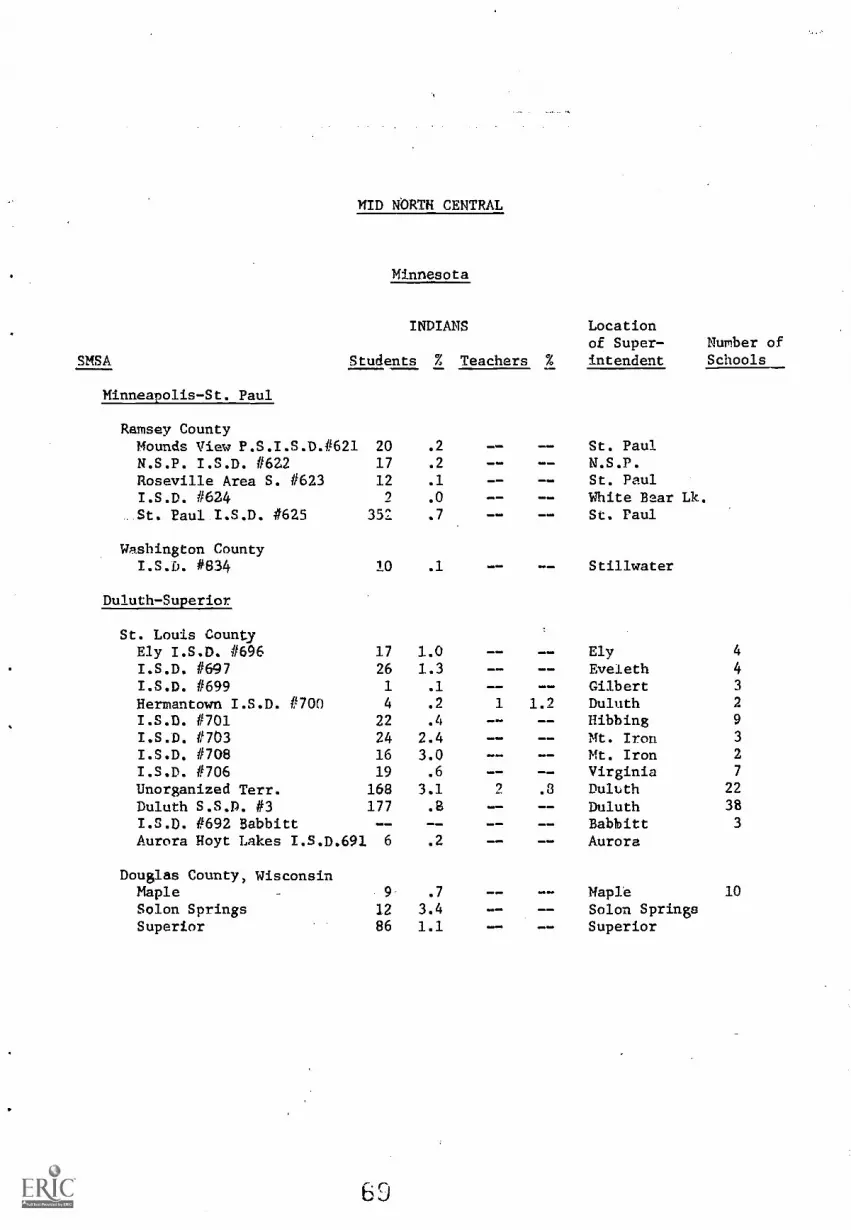
MID NORTH CENTRAL
Minnesota
INDIANS Locationof Super- Number of
SMSA Students % Teachers % intendent Schools
Minneapolis-St. Paul
Ramsey CountyMounds View P.S.I.S.D.#621 20 .2 -- St. PaulN.S.P. I.S.D. 41622 17 .2 -- N.S.P.Roseville Area S. #623 12 .1 St. PaulI.S.D. 41624 2 .0 ...... White Bear Lk.St. Paul I.S.D. #625 352 .7 St. Paul
Washington CountyI.S.D. #834 10 .1 Stillwater
Duluth- Superior.
St. Louis CountyEly I.S.D. 41696 17 1.0 -- Ely 4
I.S.D. #697 26 1.3 -- Eveleth 4
I.S.D. #699 1 .1 Gilbert 3
Hermantown I.S.D. #700 4 .2 1 1.2 Duluth 2
I.S.D. #701 22 .4 Hibbing 9
I.S.D. #703 24 2.4 Mt. Iron 3
I.S.D. #708 16 3.0 Mt. Iron 2
I.S.D. #706 19 .6 -- Virginia 7
Unorganized Terr.. 168 3.1 2 .3 Duluth 22
Duluth S.S.D. #3 177 .6 Duluth 38
I.S.D. #692 Babbitt -- -- Babbitt 3
Aurora Hoyt Lakes I.S.D.691 6 .2 -- -- Aurora
Douglas County, WisconsinMaple 9 .7 -- Maple 10
Solon Springs 12 3.4 Solon SpringsSuperior 86 1.1 Superior
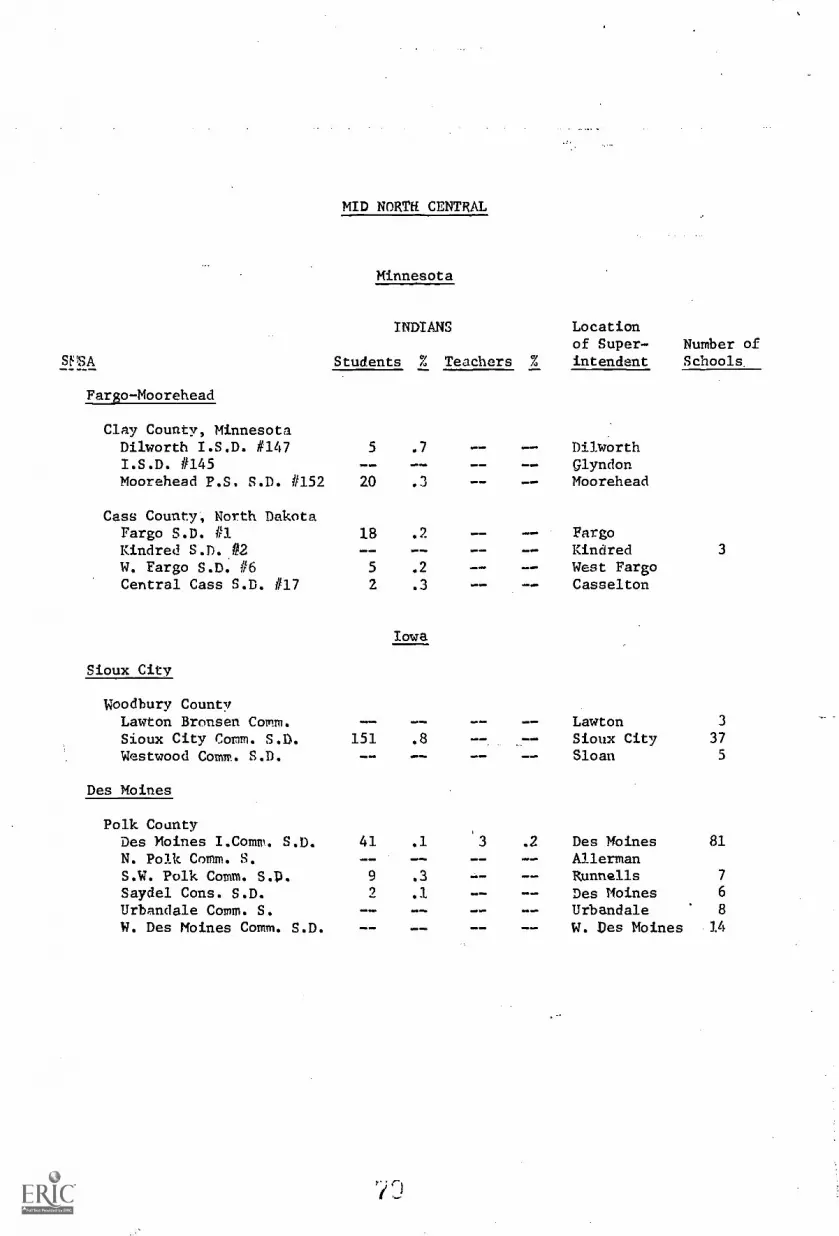
SF sA
Fargo-Moorehead
Clay County, MinnesotaDilworth I.S.D. #147I.S.D. #145Moorehead P.S. S.D. #152
Cass County, North DakotaFargo S.D. #1Kindred S.D. #2W. Fargo S.D. #6Central Cass S.D. 1117
Sioux City
Woodbury CountyLawton Bronsen Comm.Sioux City Comm. S.I.Westwood Comm. S.D.
Des Moines
Polk CountyDes Moines I.Comm. S.D.N. Polk Comm. S.S.W. Polk Comm. S.P.Saydel Cons. S.D.Urbandale Comm. S.W. Des Moines Comm. S.D.
MID NORTH CENTRAL
Minnesota
INDIANS Locationof Super- Number of
Students % Teachers % intendent Schools.
5 .7
20 .3
18 .2
5 .2
2 .3
Iowa
151 .8
=,
.11.11.11.
DilworthGlyndonMoorehead
- - FargoKindredWest FargoCasselton
10.
LawtonSioux CitySloan
3
3
37
5
.2 Des Moines 81
AllermanRunnells 7
Des Moines 6
Urbandale 8
W. Des Moines 14

MID NORTH CENTRAL
Iowa
INDIANS
SMSA Students % Teachers %
Waterloo
Locationof Super- Number ofintendent Schools
Blackhawk CountyCedar Falls Comm. S.D.Dankerton Comm. S.La Porte City Comm. S.Waterloo Comm. S.D.
Cedar PApids
7
39
25
4
.1
.1
.0
Imose.
1
M. ar.
.1
Cedar FallsDankertonLa Porte CityWaterloo
Cedar Rapids
DubuqueEpworth
122
. 3
37
39
17
8
Linn County (6 districts)Cedar Rapids Comm. $.
Dubuque
Dubuque CountyDubuque Comm. S.Western Dubuque Co. Com.S.
Davenport-Rock Island-Moline - see Illinois
Omaha - see Nebraska
Wisconsin
Duluth-Superior - see Minnesota
Green Bay
Brown CountyAshwaubenon 12 .4 Green BayDenmark Denmark 14De Pere 10 .5 De Pere 3
Green Bay 203 .4 1 .1 Green By 38
Howard, Suamico 13 .7 Green Bay 5
Pulaski 57 Pulaski 5
W. De Pere 261 15.2 2 2.9 W. DePere 6.
Wrightstown' - - WOO. - - Wrightstown 2
71
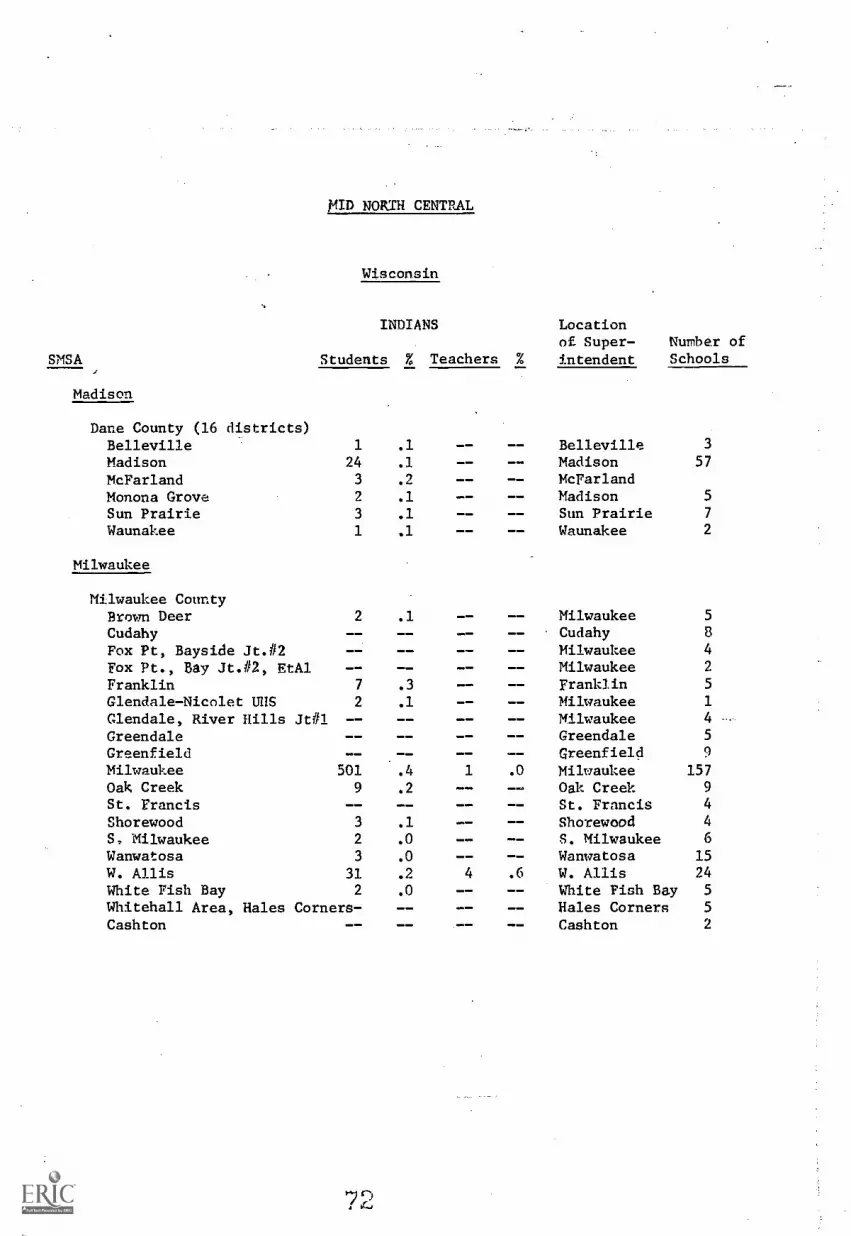
SMSA
Madison
ktID NORTH CENTRAL
Wisconsin
INDIANS Locationof Super- Number of
Students % Teachers % intendent Schools
Dane County (16 districts)Belleville 1 .1 Belleville 3
Madison 24 .1 Madison 57
McFarland 3 .2 McFarlandMonona Grove 2 .1 Madison 5
Sun Prairie 3 .1 Sun Prairie 7
Waunakee 1 .1 - - Waunakee 2
Milwaukee
Milwaukee CountyBrown Deer 2 .1 -- Milwaukee 5
Cudahy -- Cudahy 8
Fox Pt, Bayside Jt.#2 Milwaukee 4
Fox Pt., Bay Jt.#2, EtAl -- Milwaukee 2
Franklin 7 .3 -- Franklin 5
Glendale-Nicolet UIIS 2 .1 Milwaukee 1
Glendale, River Hills Jt#1 -- Milwaukee 4
Greendale Greendale 5
Greenfield -- Greenfield 9
Milwaukee 501 .4 1 .0 Milwaukee 157Oak Creek 9 .2 Oak Creek 9
St. Francis St. Francis 4
Shorewood 3 .1 -- -- Shorewood 4
S. Milwaukee 2 .0 -- -- S. Milwaukee 6
Wanwatosa 3 .0 -- -- Wanwatosa 15
W. Allis 31 .2 4 .6 W. Allis 24
White Fish Bay 2 .0 -- White Fish Bay 5
Whitehall Area, Hales Corners- Hales Corners 5
Cashton -- Cashton 2
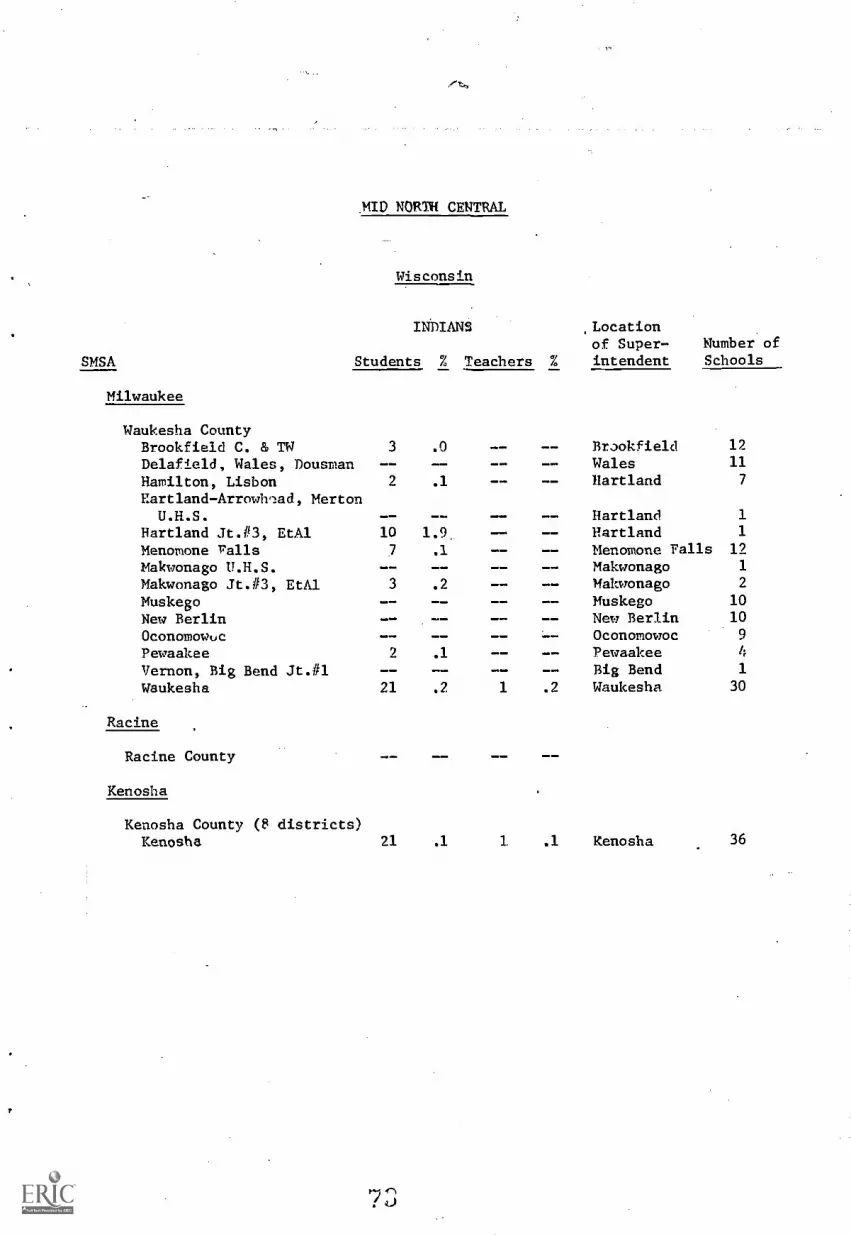
MID NORTH CENTRAL
Wisconsin
INDIANS ,Location
SMSA Students % Teachers %
of Super- Number ofintendent Schools
Milwaukee
Waukesha CountyBrookfield C. & TW 3 .0 Brookfield 12
Delafield, Wales, Dousman - - Wales 11
Hamilton, Lisbon 2 .1 Hartland 7
Rartland- Arrowh "ad, MertonU.H.S. Hartland 1
Hartland Jt.#3, EtAl 10 1.9 Hartland 1
Menomone Falls 7 .1 Menomone Falls 12
Makwonago U.H.S. -- Makwonago 1
Makwonago Jt.#3, EtAl 3 .2 Makwonago 2
Muskeg() Muskeg° 10
New Berlin -- -- New Berlin 10
Oconomowoc Oconomowoc 9
Pewaakee 2 .1 Pewaakee 4
Vernon, Big Bend Jt.#1 Big Bend 1
Waukesha 21 .2 1 .2 Waukesha 30
Racine
- -Racine County
Kenosha
Kenosha County (8 districts)Kenosha 21 .1 1 .1 Kenosha 36
7 3
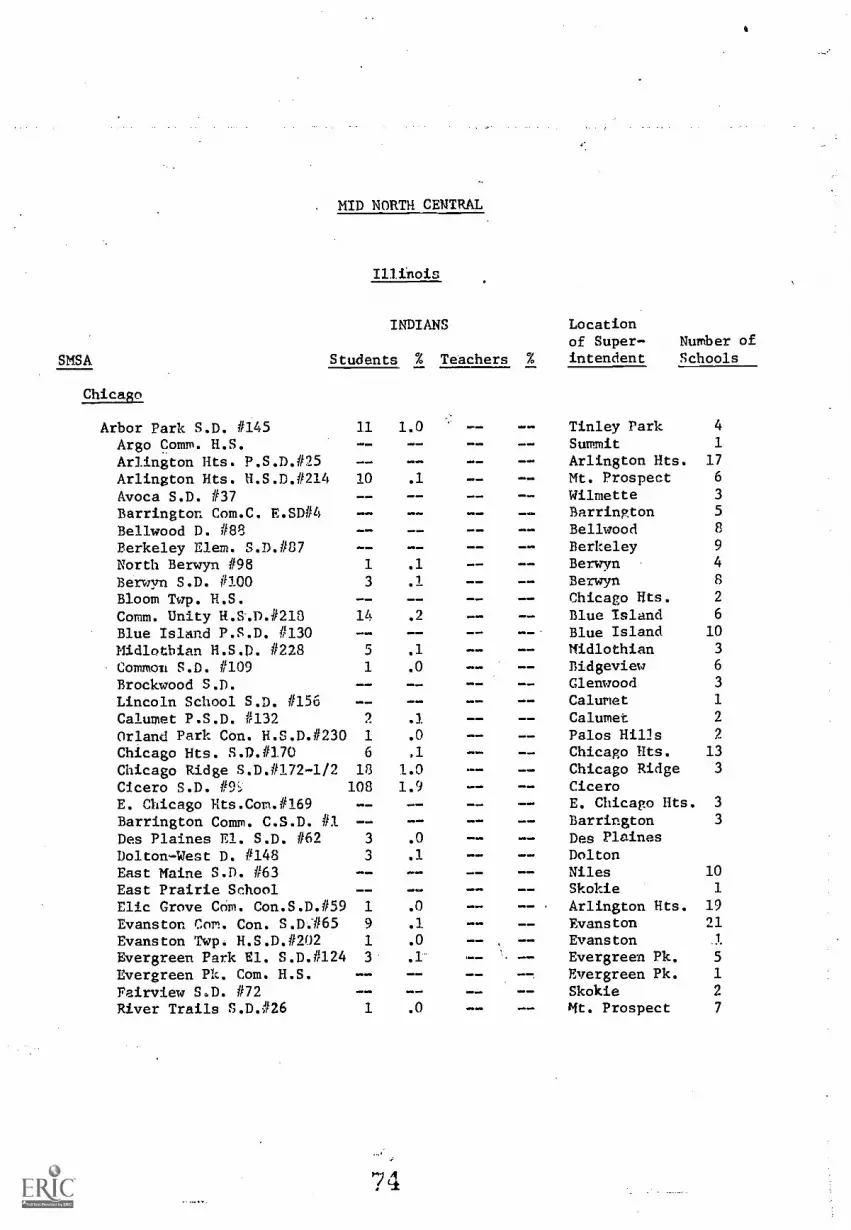
. MID NORTH CENTRAL
Illinois
INDIANS
SMSA Students % Teachers %
Chicago
Arbor Park S.D. #145 11 1.0
Argo Comm. H.S. --
Arlington Hts. P.S.D.#25 --Arlington Hts. H.S.D.#214 10 .1
Avoca S.D. #37Barrington Com.C. E.SD#4Bellwood D. #88Berkeley Elem. S.D.#87 -- --North Berwyn #98 1 .1
Berwyn S.D. #100 3 .1
Bloom Twp. H.S. --Comm. Unity H.S.D.#218 14 .2
Blue Island P.S.D. #130 -- --
Midlotbian H.S.D. #228 5 .1
Common S.D. #109 1 .0
Brockwood S.D. --Lincoln School S.D. #156Calumet P.S.D. #132 2 .1
Orland Park Con. H.S.D.#230 1 .0
Chicago Hts. S.D.#170 6 .1
Chicago Ridge S.D.#172-1/2 18 1.0
Cicero S.D. #91, 108 1.9
E. Chicago Hts.Com.#169 -- --Barrington Comm. C.S.D. #1 --Des Plaines El. S.D. #62 3 .0
Dolton-West D. #148 3 .1
East Maine S.D. #63 --East Prairie School --Elic Grove Com. Con.S.D.#59 1 .0
Evanston Com. Con. S.D.#65 9 .1
Evanston Twp. H.S.D.#202 1 .0
Evergreen Park El. S.D.#124 3 .1
Evergreen Pk. Com. H.S.Fairview S.D. #72River Trails S.D.#26 1 .0
74
- -
.111= %ND
- _
- _
- _
- _
- -
- _
- -
.11100..
- -
- -
- -
..1.
Locationof Super- Number ofintendent Schools
Tinley Park 4
Summit 1
Arlington Hts. 17
Mt. Prospect 6
Wilmette 3
Barrington 5
Bellwood 8
Berkeley 9
Berwyn 4
Berwyn 8
Chicago Hts. 2
Blue Island 6
Blue Island 10
Midlothian 3
Bidgeview 6
Glenwood 3
Calumet 1
Calumet 2
Palos Hills 2
Chicago Hts. 13
Chicago Ridge 3
CiceroE. Chicago Hts. 3
Barrington 3
Des PlainesDoltonNiles 10
Skokie 1
Arlington Hts. 19
Evanston 21
Evanston .1
Evergreen Pk. 5
Evergreen Pk. 1
Skokie 2
Mt. Prospect 7

?41D NORTH CENTRAL
Illinois
INDIANS
SMSA Students % Teachers %
Locationof Super-intendent
Number ofSchools
Chicago
Cook CountyFlossmoor S.D.11161 2 .1 1 .3 Flossmoor 7
Franklyn Pk. P.S.D.#84 Franklyn Pk. 5
Glenbrook Twp.H.S.D.#225 - _ Glenview 2
Glencoe P.S. Glencoe 4
Glenview P.S.C.C.S.D.1634 4 .1 Glenview 8
Golf. S.D. #67 -- Morton Grove 3
Grove S.D. 127 2 .1 North Brook 3
Harvey P.S.D.#152 Harvey 8
Homewood El. S.D. #153 Homewood 6
Calumet City C. S.D.#157 Calumet City 3
Jt. Sterling Morton H.S. -- Cicero 2
Norridge S.D. #80 2 .1 NOrridge 2
Kenilworth 138 -- Kenilworth 1
Komarek S.D. #94 N. Riverside 2
La Orange Com. S.D.11102. La Grange Pk. 9
La Grange (s.)S.D.1/105 La Grange 5
Alsip,Hazelgreen,OaklawnS.D.#126 2 .1 Alsip 4
Lansing P. El.S.D. #158 -- Lansing 7
Leyden Com. H.S. -- 1 .5 Franklyn Pk. 2
Lindop S.D. 1192 -- - _ BroadviewLyons Twp. H.S. -- La Grange 2
Lyons 1 .0 Lyons 7
Maine Twp. H.S.D. #207 Park Ridge 3
Mannheim D. #83 2 .1 1 .6 Franklyn Pk. 5
Northbrook Com. S.D.1130 -- Northbrook 3Markham Com. S.D.#144 3 .1 Markham 7
Matteson Matteson 7
Maywood Com. S.D.#89 1 .0 Maywood 10
Midlothian Com. S.P.#443 Midlothian 4
Mt. Prospect P.S. Mt. Prospect 8
New Trier. Twp. H.S.D. Winnetka 2
Niles El. S.D. #71 -- Niles 2
Niles Twp. Com. H.S.D.#219 1 .0 all Skokie 3
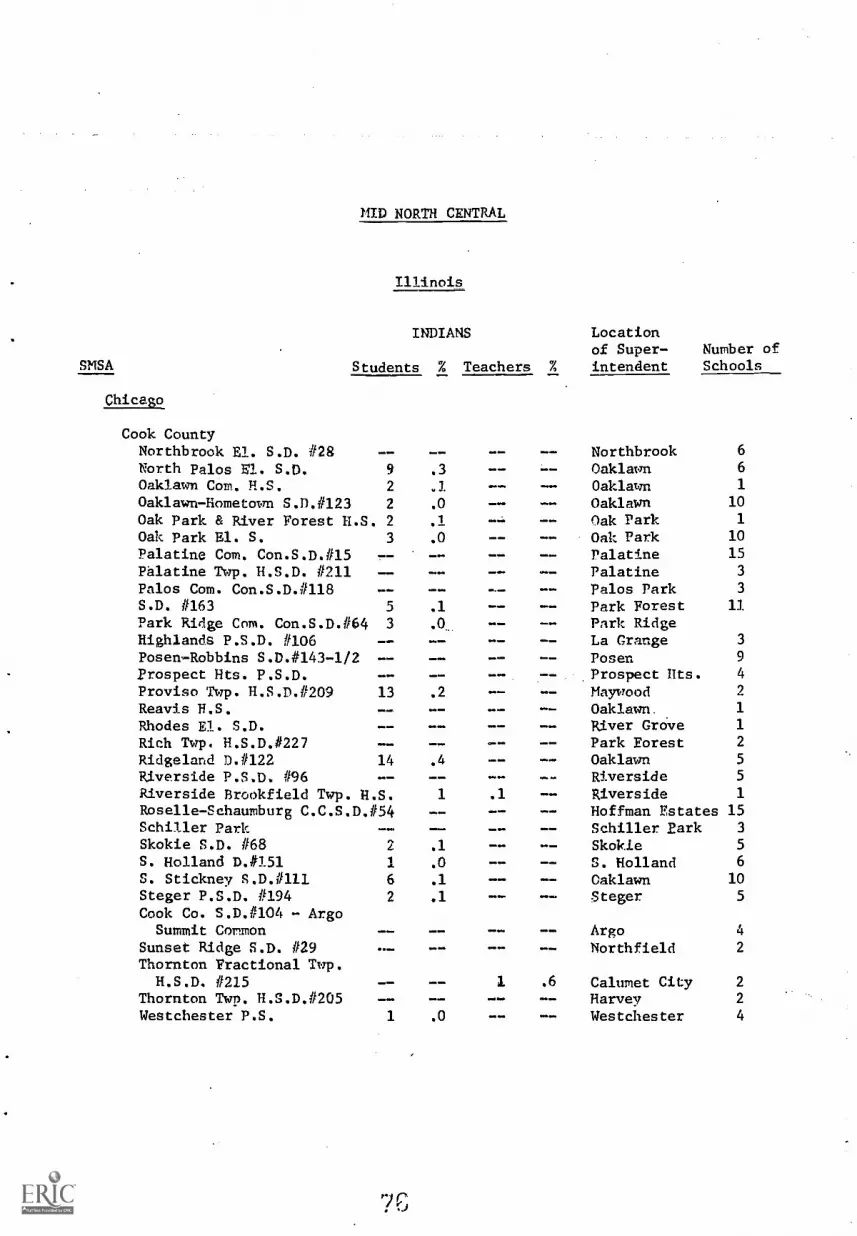
MID NORTH CENTRAL
Illinois
INDIANS
SMSA Students % Teachers %
Locationof Super- Number ofintendent Schools
Chicago
Cook CountyNorthbrook El. S.D. #28 Northbrook 6
North Palos El. S.D. 9 .3 Oaklawn 6
Oaklawn Com. H.S. 2 .1 Oaklawn 1
Oaklawn-Hometown S.D.#123 2 .0 Oaklawn 10
Oak Park & River Forest H.S. 2 .1 Oak Park 1
Oak Park El. S. 3 .0 Oak Park 10
Palatine Com. Con.S.D.#15 -- Palatine 15
Palatine Twp. H.S.D. #211 Palatine 3
Palos Com. Con.S.D.#118 -- Palos Park 3
S.D. #163 5 .1 Park Forest 11
Park Ridge Com. Con.S.D.#64 3 .0 Park RidgeHighlands P.S.D. #106 -- La Grange 3
Posen- Robbins S.D.#143-1/2 -- Posen 9
Prospect Hts. P.S.D. -- .Prospect Hts. 4
Proviso Twp. H.S.D.#209 13 .2 Maywood 2
Reavis H.S. Oaklawn. 1
Rhodes El. S.D. River Grove 1
Rich Twp. H.S.D.#227 Park Forest 2
Ridgeland D.#122 14 .4 Oaklawn 5
Riverside P.S.D. #96 -- Riverside 5
Riverside Brookfield Twp. H.S. 1 .1 Riverside 1
Roselle-Schaumburg C.C.S.D.#54 Hoffman Estates 15Schiller Park -- Schiller. Park 3
Skokie S.D. #68 2 .1 Skokie 5
S. Holland D.#151 1 .0 S. Holland 6
S. Stickney S.D.#111 6 .1 Oaklawn 10
Steger P.S.D. #194 2 .1 $teger. 5
Cook Co. S.D.#104 - ArgoSummit Common -- Argo 4
Sunset Ridge S.D. #29 Northfield 2
Thornton Fractional Twp.H.S.D. #215 1 .6 Calumet City 2
Thornton Twp. H.S.D.#205 .1111111. Harvey 2
Westchester P.S. 1 .0 Westchester 4
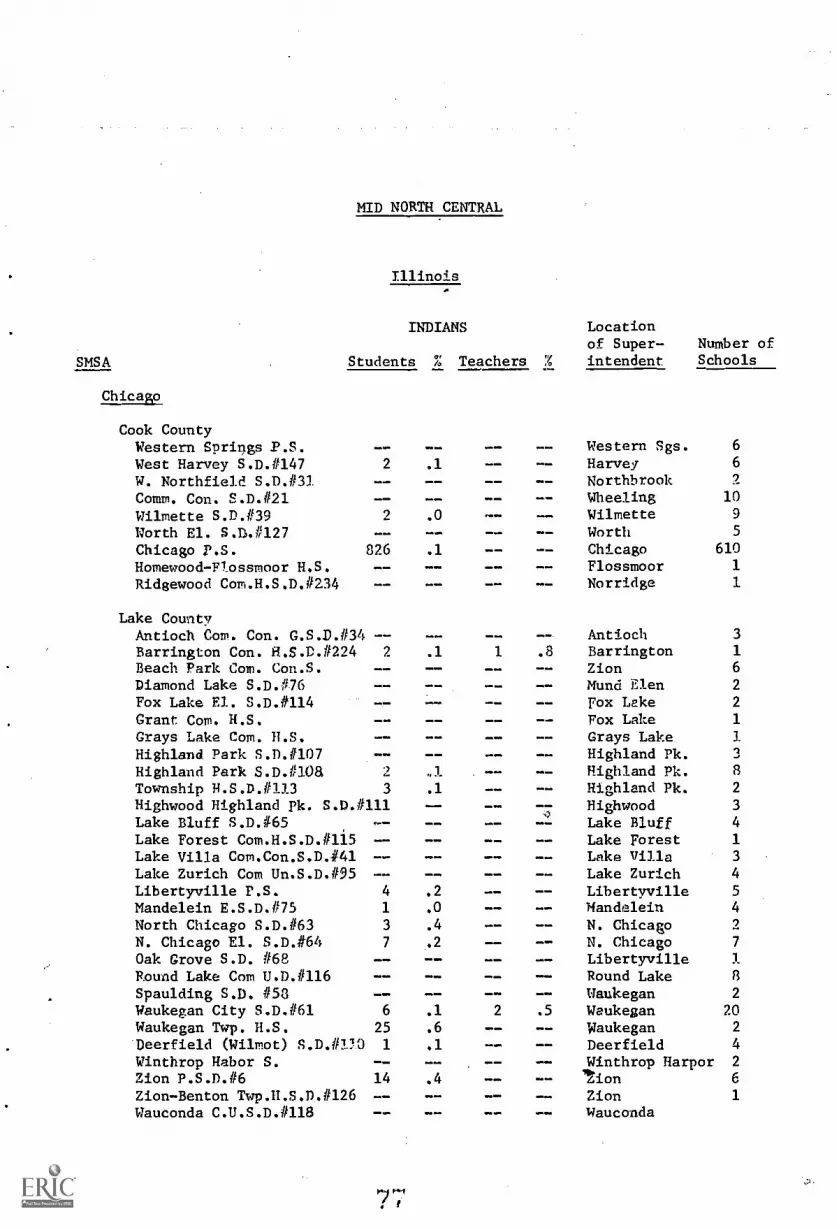
MID NORTH CENTRAL
Illinois
INDIANS
SMSA Students % Teachers %
Locationof Super- Number ofintendant Schools
Chicago
Cook CountyWestern Springs P.S. - _ Western Sgs. 6
West Harvey S.D.#147 2 .1 Harvey 6
W. Northfield S.D.#31 Northbrook 9
Comm. Con. S.D.#21 Wheeling 10
Wilmette S.D.#39 2 .0 Wilmette 9
Worth El. S.D.#127 Worth 5
Chicago P.S. 826 .1 Mb MOP - - Chicago 610
Homewood-Flossmoor H.S. Flossmoor 1
Ridgewood Con.H.S.D.#234 Norridge 1
Lake CountyAntioch Com. Con. G.S.D.#34 -- -- -- Antioch 3
Barrington Con. H.S.D.#224 2 .1 1 .8 Barrington 1
Beach Park Com. Con.S. Zion 6
Diamond Lake S.D.#76 - _ Mund Elan 2
Fox Lake El. S.D.#114 -- -- Fox Lake 2
Grant Com. H.S. Fox Lake 1
Grays Lake Com. H.S. -- Grays Lake 1.
Highland Park S.D.#107 -- -- Highland Pk. 3
Highland Park s.Daloa 2 1 -- Highland Pk. 8
Township H.S.D.#113 3 .1 Highland Pk. 2
Highwood Highland Pk. S.D.#111Lake Bluff S.D.#65
--)
HighwoodLake Bluff
3
4
Lake Forest Com.H.S.D.#115 -- Lake Forest 1
Lake Villa Com.Con.S.D.441 -- - - Lake Villa 3
Lake Zurich Com Un.S.D.#95 -- -- Lake Zurich 4
Libertyville F.S. 4 .2 -- Libertyville 5
Mandelein E.S.D.#75 1 .0 Mandelein 4
North Chicago S.D.#63 3 .4 N. Chicago 2
N. Chicago El. S.D.#64 7 .2 N. Chicago 7
Oak Grove S.D. #68 -- -- Libertyville 1
Round Lake Com U.D.#116 =11. -- Round Lake 8
Spaulding S.D. #53 - - Waukegan 2
Waukegan City S.D.#61 6 .1 2 .5 Waukegan 20
Waukegan Twp. H.S. 25 .6 -- Waukegan 2
'Deerfield (Wilmot) S.D. #!1O 1 .1 Deerfield /4
Winthrop Habor S. -- -- -- Winthrop Harpor 2
Zion P.S.D.#6 14 .4 -- 'Lion 6
Zion-Benton Twp.H.S.D.#126 -- 11= -- Zion 1
Wauconda C.U.S.D.#118 -- Wauconda
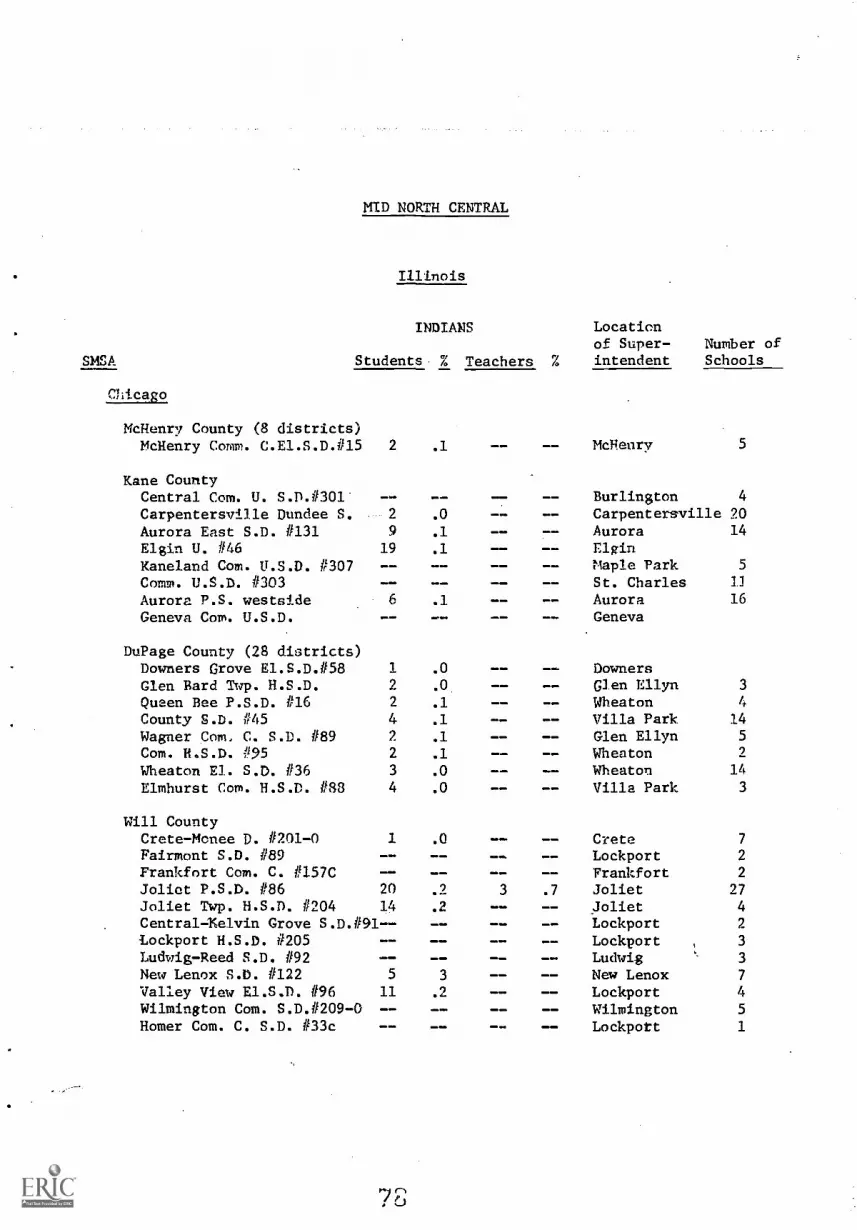
SMSA
Chicago
MID NORTH CENTRAL
Illinois
INDIANS
Students- % Teachers %
Locationof Super- Number ofintendent Schools
McHenry County (8 districts)McHenry Comm. C.E1.S.D.#15
Kane CountyCentral Com. U. S.D.#301'
2 .1 McHenry
Burlington
5
4
Carpentersyille Dundee S. , 2 .0 Carpenterville 20Aurora East S.D. #131 9 .1 Aurora 14
Elgin U. #46 19 .1 - _ ElginKaneland Com. U.S.D. #307 -- Maple Park 5
Comm. U.S.D. #303 - - - - St. Charles 11
Aurora P.S. westside 6 .1 Aurora 16
Geneva Com. U.S.D. Geneva
DuPage County (28 districts)Downers Grove El.S.D.#58 1 .0 DownersGlen Bard Twp. H.S.D. 9 .o Glen Ellyn 3
Queen Bee P.S.D. #16 2 .1 Wheaton 4
County S.D. #45 4 .1 41 Villa Park. 14
Wagner Com, C. S.D. #89 2 .1 deem& Glen Ellyn 5
Com. H.S.D. 195 2 .1 - - Wheaton 2
Wheaton El. S.D. #36 3 .0 Wheaton 14
Elmhurst Com. H.S.D. #88 4 .0 - - 01.1 Villa Park 3
Will CountyCrete -Mcnee D. #201-0 1 .0 Crete 7
Fairmont S.D. #89 Mae. Lockport 2
Frankfort Com. C. #157C Frankfort 2
Joliet P.S.D. #86 20 .9 3 .7 Joliet 27
Joliet Twp. H.S.D. #204 14 .2 Joliet 4
Centra1=1elvin Grove S.D.#91-- - _ Lockport 2
Lockport H.S.D. #205 -- - - Lockport 3
Ludwig- Reed S.D. #92 Ludwig 3
New Lenox S.D. #122 5 3 - - New Lenox 7
Valley View El.S.D. #96 11 .2 Lockport 4
Wilmington Com. S.D.#209-0 -- Wilmington 5
Homer Com. C. S.D. #33c - _ Lockport 1
7 E3

SMSA
Peoria
MID NORTH CENTRAL
Illinois
INDIANS
Students % Teachers %
Locationof Super- Number ofintendant Schools
Peoria County (6 districts)Peoria P.S.D. #150
Tazewell County (10 districts)Morton Com. C. S.
Champaign-Urbana
17
4
2
5
.1
.2
.0
.1
- -- -
Peoria
Morton
ChampaignRantoul
39
4
22
7
ChaMpaign County (6 districts)Champaign Com. U.S.D.Rantoul. City S.D.i137
Decatur
Macon County (5 districts)Mt. Zion Com. U.D. 465 - _ Mt. Zion 7
Davenport-Rock Island- Moline
Rock Island County, IllinoisE. Moline El. S. 2 .0 E. Moline 10
Moline P.S. 15 .1 Moline 25
Rockridge Com. S.D.#300 - - - - Taylor Ridge 7
Rock Island 1,'S.D.4641 1 .0 Rock Island 17
Silvis S.D. #34 2 .2 Silvis 2
United Twp. H.S. 2 .1 - - E. Moline 2
Scott County, IowaBettendorf Com. S.D. 6 .1 -- Dettendorf. 9
Davenport Com. S. 13 .1 Davenport 30
North Scott Com. S.D. - - - - Eldridge

MID NORTH CENTRAL
Illinois
INDIANS
SMSA Students % Teachers .%
Springfield
Sangamon County (6 districts)
Locationof Super- Number ofintendent Schools
Bell-Chalham U.S.D.#5 4 .3
Springfield P.S.D. #186 16 .1
St Louis
ChalhamSpringfield
4
41
Madison County, Illinois (12 districts)Alton Com. U.S.D.#11 24 .2 - - Alton 32
Collinsville Com. U.S.D.#10 1 .0 Collinsville 19
Granite City S.D. #9 6 .0
Triad Com. U.D. #2 3 .2 mGranite CitySt. Jacob
21
St. Clair CountyBelleville Com. S.D.#118 2 .0 - - - - Belleville 13
Belleville Trap. H.S.D.#201 3 .1 Belleville 2
Brooklyn .
1111 Lovejoy 1
Cahokia U.S.D. #187 1 .0 - - Cahokia 13
E. St. Louis S.D.#189 E. St. Louis 41
Grant Com. C. S.D.#110 E. St. Louis 4
Harmony-Emge S.D. #175 1 .1 MNifinab Belleville 3
High Mount Belleville 1
Lebanon Grade School Lebanon 1
Mascoutah Com. C.S.D.#10 .1 M. Mascoutah 3
Millstadt C. S. #160 1.1 - - Millstadt 2
O'Fallon Trip. H.S.D.#203 O'Fallon
Jefferson County, Missouri (8 districts)Northwest S.D. #R-1 3 .1 House Springs 8
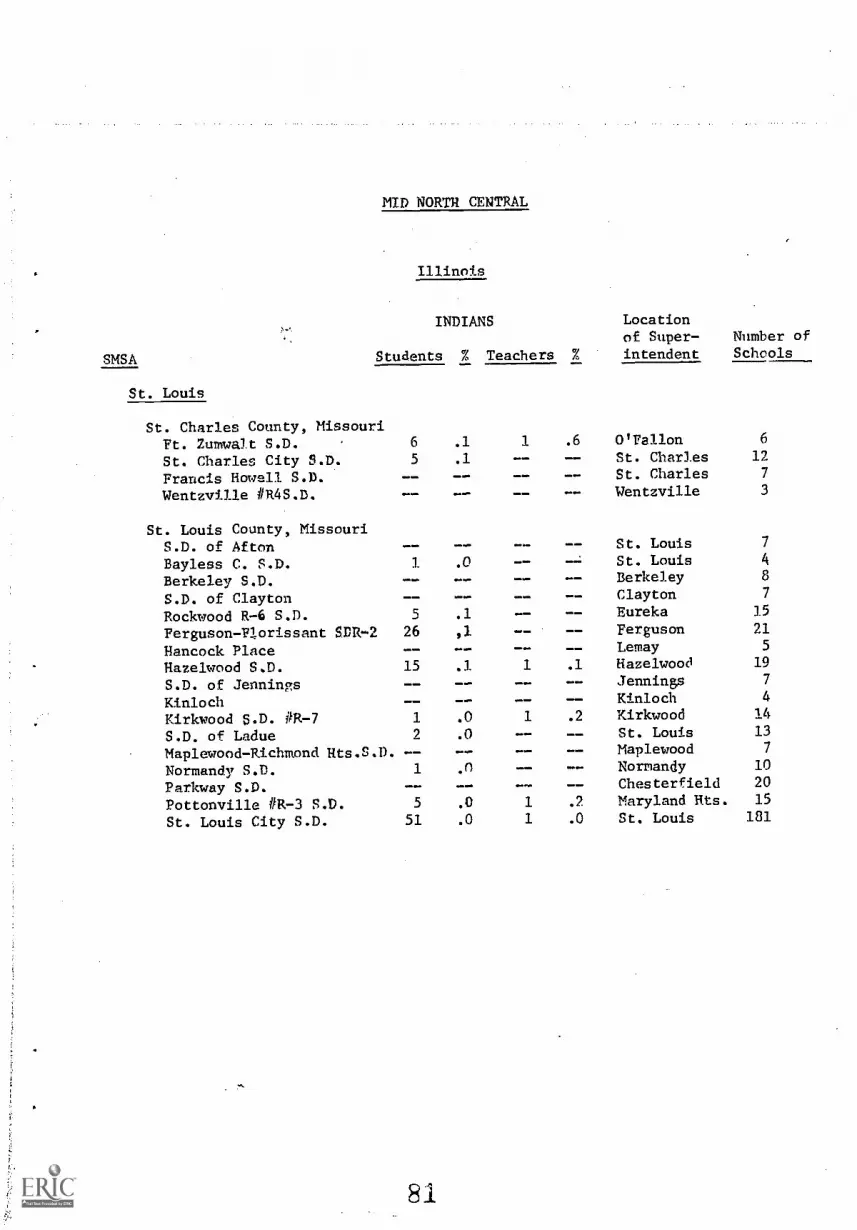
SMSA
St. Louis
MID NORTH CENTRAL
Illinois
INDIANS Locationof Super- Number of
Students % Teachers % intendent Schools
St. Charles County, MissouriFt. Zumwalt S.D. 6 .1 1 .6 O'Fallon 6
St. Charles City S.D. 5 .1 St. Charles 12
Francis Howell S.D. St. Charles 7
Wentzville iIR4S.D. .1 Wentzville 3
St. Louis County, MissouriS.D. of Afton St. Louis 7
Bayless C. S.D. 1 .0 St. Louis 4
Berkeley S.D. Berkeley 8
S.D. of Clayton -- 000.10. Clayton 7
Rockwood R-6 S.D.Ferguson-Florissant SVR-2
5
26
.1
,1 vINO
EurekaFerguson
15
21
Hancock Place Lemay 5
Hazelwood S.D. 15 .1 1 .1 Hazelwood 19
S.D. of Jennings ,-=. 0101, Jennings 7
Kinloch -- -- Kinloch 4
Kirkwood S.D. #R-7 1 .0 1 .2 Kirkwood 14
S.D. of Ladue 2 .0 St. Louis 13
Maplewood-Richmond Hts.S.D. -- Maplewood 7
Normandy S.D. 1 .0 Normandy 10
Parkway S.D. -- -- flo Chesterfield 20
Pottonville #R-3 S.D. 5 .0 1 .2 Maryland Hts. 15
St. Louis City S.D. 51 .0 1 .0 St. Louis 181
81
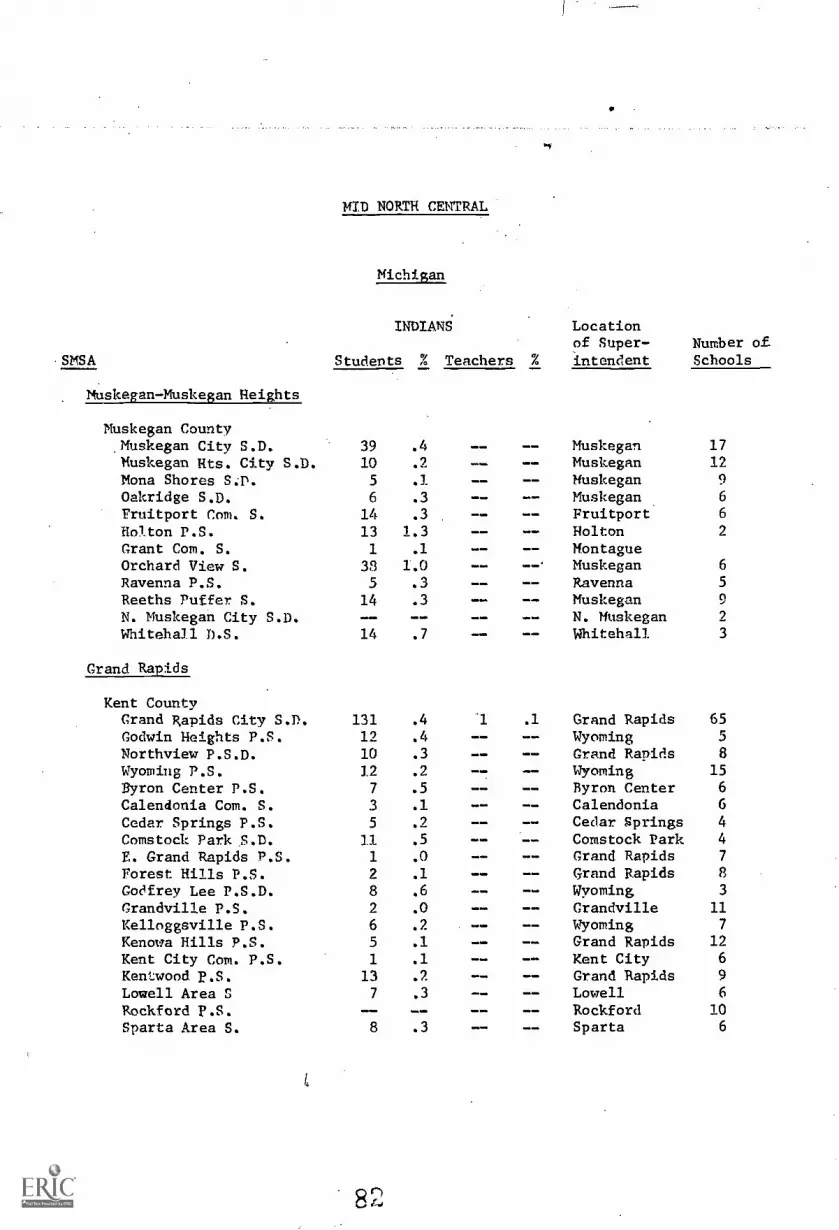
SMSA
Muskegan-Muskegan Heights
MID NORTH CENTRAL
Michigan
INDIANS Locationof Super- Number of
Students % Teachers % intendent Schools
Muskegan CountyMuskegan City S.D. 39 .4 Muskegan 17
Muskegan Fits. City S.D. 10 .2 Muskegan 12
Mona Shores S.D. 5 .1 Muskegan 9
Oakridge S.D. 6 .3 Muskegan 6
Fruitport Com. S. 14 .3 Fruitport 6
Holton P.S. 13 1.3 Holton 2
Grant Com. S. 1 .1 MontagueOrchard View S. 38 1.0 - - Muskegan 6
Ravenna P.S. 5 .3 Ravenna 5
Reeths Puffer. S. 14 .3 Muskegan 9
N. Muskegan City S.D. -- -- .00= wilmwa N. Muskegan 2
Whitehall D.S. 14 .7 Whitehall. 3
Grand Rapids
Kent CountyGrand Rapids City S.D. 131 .4 1 .1 Grand Rapids 65
Godwin Heights P.S. 12 .4 -- Wyoming 5
Northview P.S.D. 10 .3 Grand Rapids 8
Wyoming P.S. 12 .2 -- Wyoming 15
Byron Center P.S. 7 .5 -- Byron Center 6
Calendonia Com. S. 3 .1 Calendonia 6
Cedar. Springs P.S. 5 .2 Cedar. Springs 4
Comstock Park S.D. 11 .5 Comstock Park 4
E. Grand Rapids P.S. 1 .0 Grand Rapids 7
Forest Hills P.S. 2 .1 Grand Rapids 8
Godfrey Lee P.S.D. 8 .6 -- Wyoming 3
Grandville P.S. 2 .0 Grandville 11
Kelloggsville P.S. 6 .2 -- Wyoming 7
Kenowa Hills P.S. 5 .1 -- Grand Rapids 12
Kent City Com. P.S. 1 .1 -- Kent City 6
Kentwood p.S. 13 .2 -- Grand Rapids 9
Lowell Area S 7 .3 -- Lowell 6
Rockford P.S. -- -- -- Rockford 10
Sparta Area S. 8 .3 -- -- Sparta 6
L
8 2
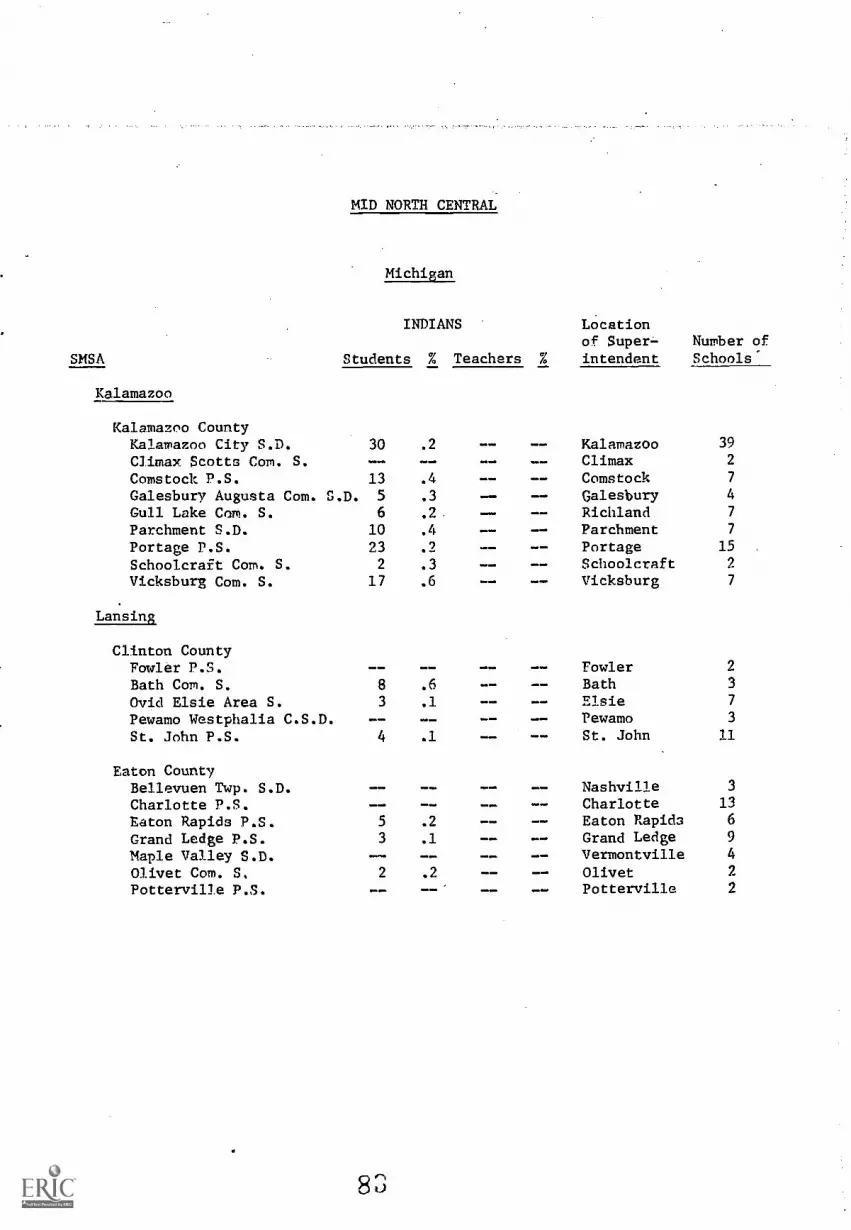
MID NORTH CENTRAL
Michigan
INDIANS
SMSA Students % Teachers %
Kalamazoo
Kalamazoo CountyKalamazoo City S.D. 30 .2
Climax. Scotts Com. S. --Comstock P.S. 13
Galesbury Augusta Com. S.D. 5
Gull Lake Com. S.Parchment S.D.Portage P.S.Schoolcraft Com. S.Vicksburg Com. S.
Lansing
Clinton CountyFowler P.S.Bath Com. S.Ovid Elsie Area S.Pewamo Westphalia C.S.D.St. John P.S.
Eaton CountyBellevuen Twp. S.D.Charlotte P.S.Eaton Rapids P.S.Grand Ledge P.S.Maple Valley S.D.Olivet Com. S.Potterville P.S.
.4
.3
6 .2.
10 .4
23 .2
2 .3
17 .6
8 .6
3 .1
- -4 .1
5 .2
3 .1
2 .2
- -
- -
- _
- _
- - - -
Locationof Super= Number ofintendant Schools
Kalamazoo 39
Climax 2
Comstock 7
Galesbury 4
Richland 7
Parchment 7
Portage 15
Schoolcraft 2
Vicksburg 7
FowlerBathElsiePewamoSt. John
2
3
7
3
11
Nashville 3
Charlotte 13
Eaton Rapids 6
Grand Ledge 9
Vermontville 4
Olivet 2
Potterville 2
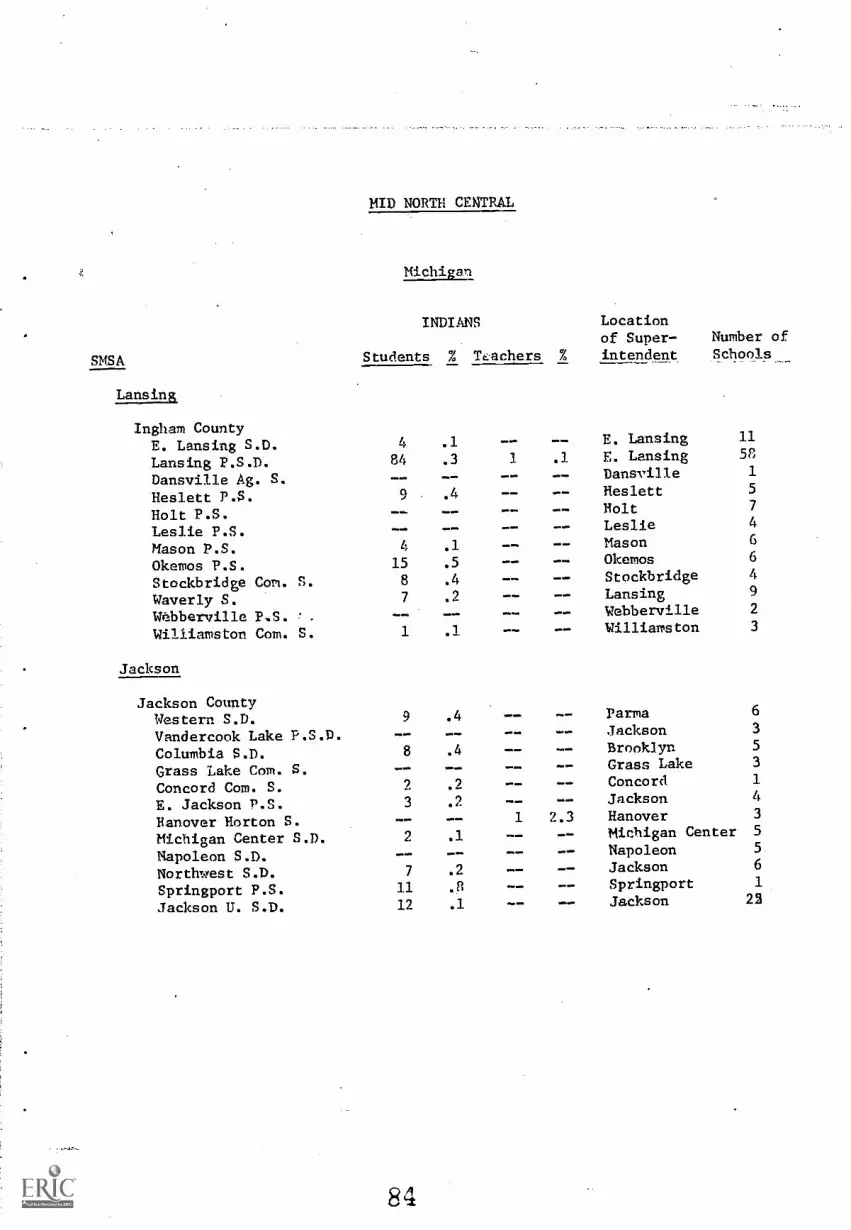
MID NORTH CENTRAL
Michigan
INDIANS Locationof Super- Number of.
SMSA Students % Teachers % intendent Schools
Lansing
Ingham CountyE. Lansing S.D. 4 .1 E. Lansing 11
Lansing P.S.D. 84 .3 1 .1 E. Lansing 58
Dansville Ag. S. ..im =N. Dansville 1
Heslett P.S. 9 .4 1.1,, Heslett 5
Holt P.S. Holt 7
Leslie P.S. Leslie 4
Mason P.S. 4 .1 Mason 6
Okemos P.S. 15 .5 m Okemos 6
Stockbridge Con. S. 8 .4 Stockbridge 4
Waverly S. 7 .2 Lansing 9
W6bberville P.S. .
Webberville 2
Williamston Com. S. 1 .1 Williamston 3
Jackson
Jackson CountyWestern S.D. 9 .4 Parma 6
Vandercook Lake P.S.D. Jackson 3
Columbia S.D. 8 .4 - _ Brooklyn 5
Grass Lake Com. S. Grass Lake 3
Concord Com. S. 2 .9 - - Concord 1
E. Jackson P.S. 3 .2 Ellb Jackson 4
Hanover Horton S. 1 2.3 Hanover 3
Michigan Center S.D. 2 .1 - - =1. Michigan Center 5
Napoleon S.D. Napoleon 5
Northwest S.D. 7 .2 Jackson 6
Springport P.S. 11 .5 Springport 1
Jackson U. S.D. 12 .1 Jackson 23
84

MID NORTH CENTRAL
Michigan
SMSA
INDIANS
Students % Teachers %
Locationof. Super-
intendantNumber ofSchools
Ann Arbor
Washtenaw CountyAnn Arbor City S.D. 16 .1 Ann Arbor 31
Ypsilanti City S.D. 17 .2 -- -- Ypsilanti 14
Chelsea S.D. 1 .0 Chelsea 4
Dexter Com. S.D. 5 .2 -- -- Dexter 4
Lincoln C. S.D. 8 .3 Ypsilanti 4
Manchester P.S.D. -- Manchester 4
Milan Area S. -- -- Milan 6
Saline Area S.D. -- -- Saline 4
Whitmore Lake P.S.D. -- -- Whitmore Lake 4
Willow Run P.S. 3 .1 1 c., Ypsilanti 8
Bay City
Bay CountyBay City S.D. 16 .1 -- Bay City 35
Bangor. Twp. S. 17 .4 -- Bay City 09
Essexville Hampton S.D. 7 .3 -- -- EssexvillePinconning Area S. 16 .5 -- Pinconning 5
Saginaw
Saginaw CountySaginaw City S.D. 8 .0 Saginaw 10Carrollton S.D. 7 .3 Saginaw 5
Saginaw Twp. Com. S. 2 .0 .Saginaw 12Buena Vista S.D. 1 .0 Saginaw 8
Chesanning U. S. 7 .2 *AIN& Chesanning 6
Birch Run Area S.D. 6 .3 Birch Run 3
Bridgeport Com. S.D. 11 .2 11 - - Bridgeport 11Frankemuth S.D. -- Frankemuth 3Freeland Com. S.D. 1 .1 - - Freeland 3
Hemlock P.S.D. HemlockMerrill Com. S.D. -- Merrill 2
St. Charles Com. S.D. 13 .8 St. Charles 3
Swan Valley S.D. 2 .1 Saginaw 6
85
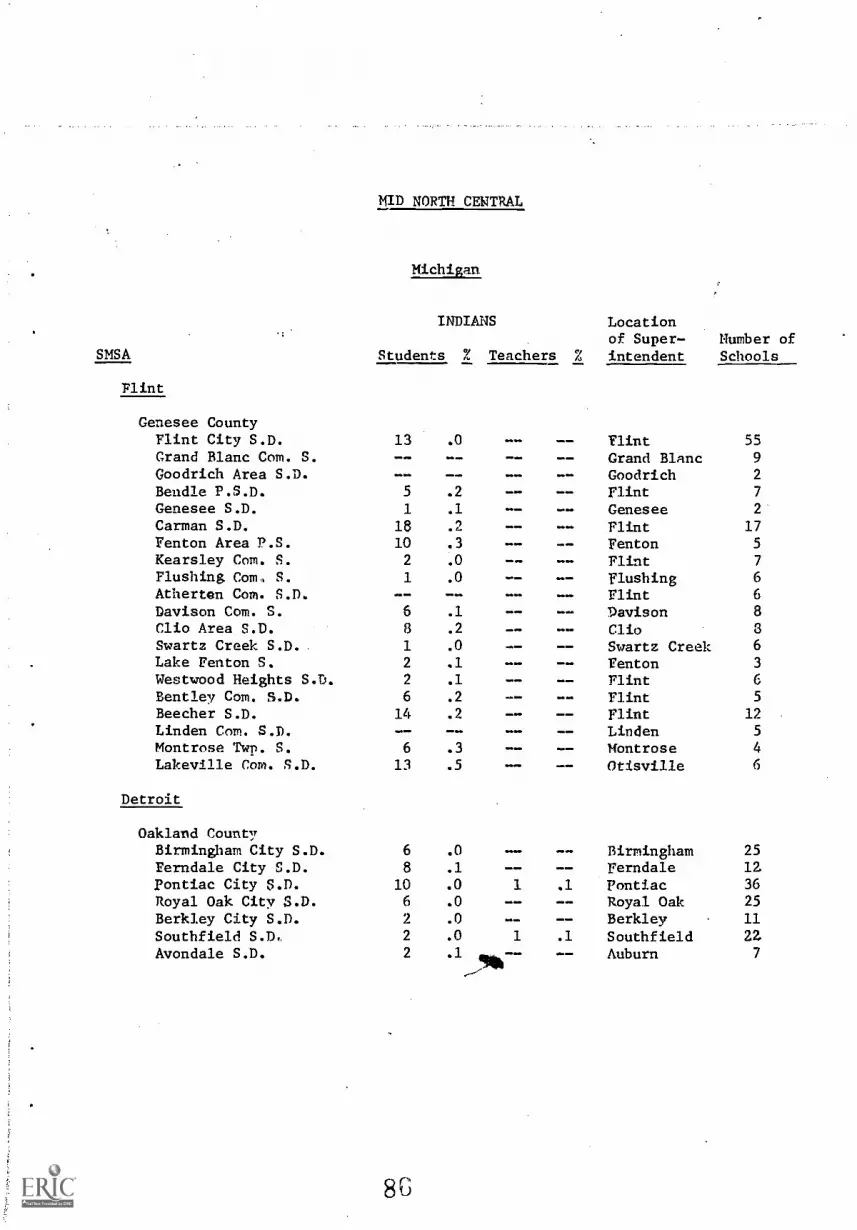
SMSA
Flint
MID NORTH CENTRAL
Michigan
INDIANS Locationof Super- Number of
Students % Teachers % intendent Schools
Genesee CountyFlint City S.D. 13 .0 Flint 55Grand Blanc Com. S. Grand Blanc 9
Goodrich Area S.D. Goodrich 2
Bendle P.S.D. 5 .2 - - - - Flint 7
Genesee S.D. 1 .1 - - Genesee 2
Carman S.D. 18 .2 Flint 17Fenton Area P.S. 10 .3 Fenton 5
Kearsley Com. S. 2 .0 - - Flint 7
Flushing Com S. 1 .0 flushing 6
Atherten Com. S.D. - - Flint 6
Davison Com. S. 6 .1 Davison 8Clio Area S.D. 8 .2 =1, CND Clio 3
Swartz Creek S.D.. 1 .0 - - Swartz Creek 6
Lake Fenton S. 2 .1 - - Fenton 3
Westwood Heights S.D. 2 .1 Faint 6
Bentley Com. S.D. 6 .2 Flint 5
Beecher S.D. 14 .2 Flint 12
Linden Com. S.D. Linden 5
Montrose Twp. S. 6 .3 - - - - Montrose 4
Lakeville Com. S.D. 13 .5 alm Otisville 6
Detroit
Oakland CountyBirmingham City S.D. 6 .0 .N. Birmingham 25
Ferndale City S.D. 8 .1 Ferndale 12Pontiac City S.D. 10 .0 1 .1 Pontiac 36
Royal Oak City S.D. 6 .0 -- Royal Oak 25
Berkley City S.D. 2 .0 Berkley 11
Southfield S.D,, 2 .0 1 .1 Southfield 22Avondale S.D. 2 .1 -- Auburn 7
8G
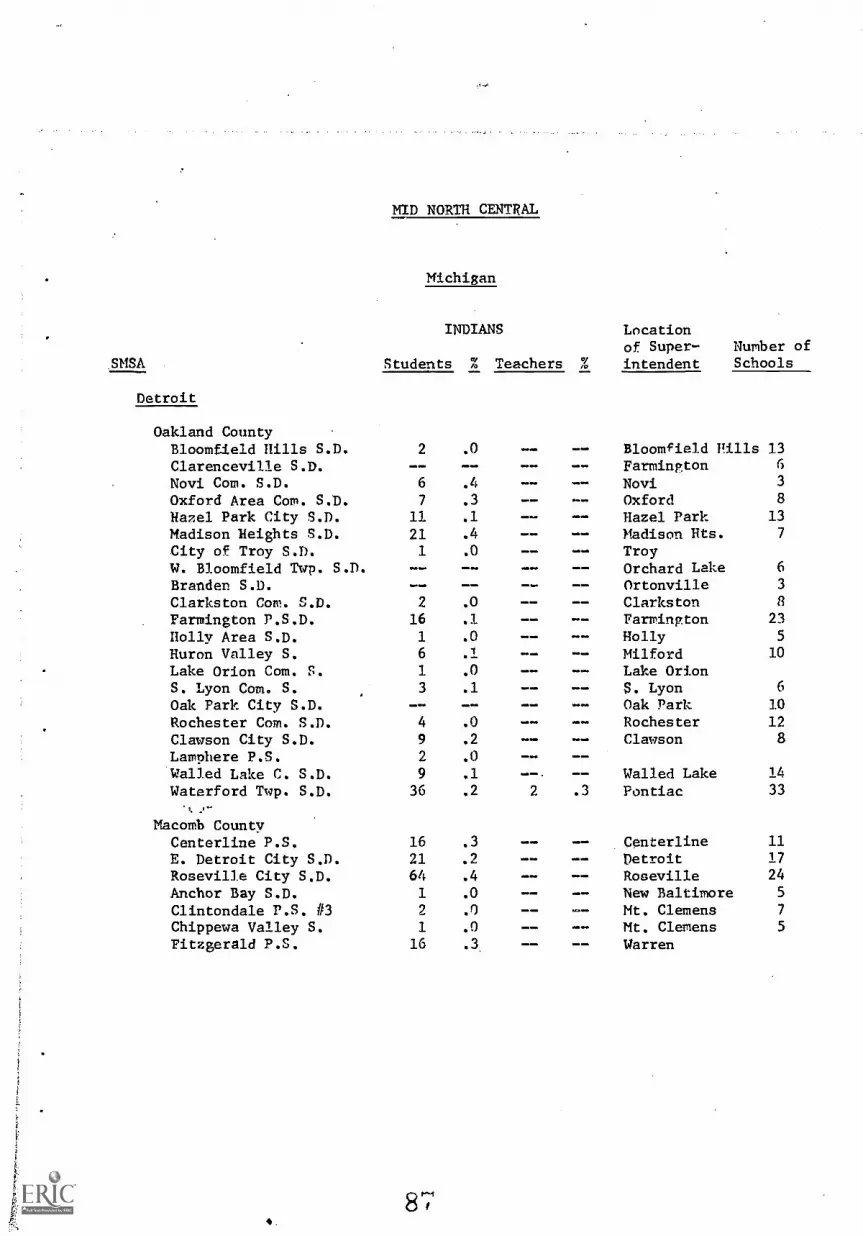
SMSA
Detroit
MID NORTH CENTRAL
Michigan
INDIANS Locationof Super- Number of
Students % Teachers % intendent Schools
Oakland CountyBloomfield Hills S.D. 2 .0 010=0 Bloomfield Hills 13
Clarenceville S.D. Farmington 6
Novi Com. S.D. 6 .4 Novi 3
Oxford Area Com. S.D. 7 .3 Oxford 8
Hazel Park City S.D. 11 .1 Hazel Park 13
Madison Heights S.D. 21 .4 - - Madison Hts. 7
City of Troy S.D. 1 .0 TroyW. Bloomfield Twp. S.D. Orchard Lake 6
Brander. S.D. Ortonville 3
Clarkston Com. S.D. 2 .0 Clarkston 8
Farmington P.S.D. 16 .1 Farmington 23
Holly Area S.D. 1 .0 - - Holly 5
Huron Valley S. 6 .1 - - Milford 10
Lake Orion Com. S. 1 .0 Lake OrionS. Lyon Com. S. 3 .1 S. Lyon 6
Oak Park City S.D. Oak Park 10
Rochester Com. S.D. 4 .0 Rochester 12
Clawson City S.D. 9 .2 1 Clawson 8
Lamphere P.S. 2 .0
Walled Lake C. S.D. 9 .1 Walled Lake 14
Waterford Twp. S.D. 36 .2 2 .3 Pontiac 33
Macomb CountyCenterline P.S. 16 .3 - - Centerline 11
E. Detroit City S.D. 21 .2 Detroit 17
Roseville City S.D. 64 .4 IOmmb Roseville 24
Anchor Bay S.D. 1 .0 - - New Baltimore 5
Clintondale P.S. #3 2 .0 . Mt. Clemens 7
Chippewa Valley S. 1 .0 Mt. Clemens 5
Fitzgerald P.S. 16 .3. Warren
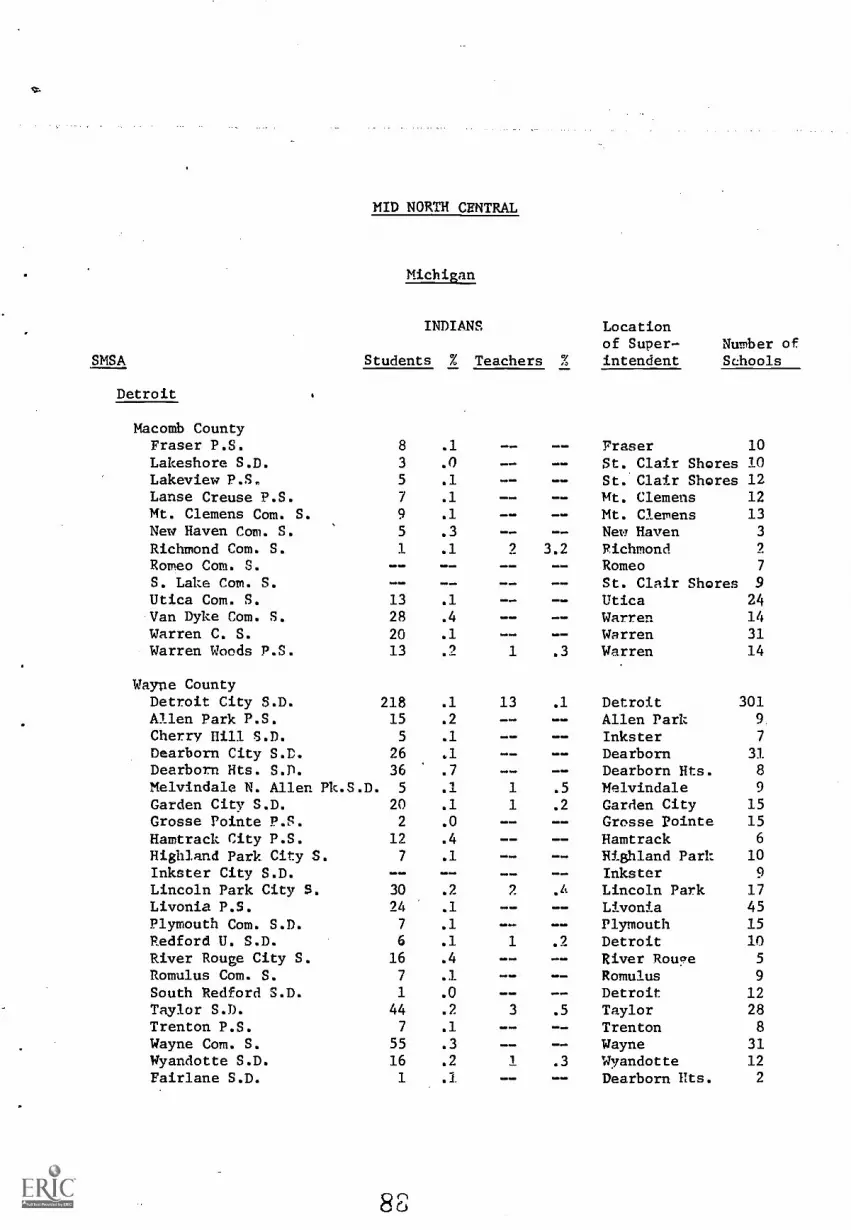
V:.
SMSA
Detroit
MID NORTH CENTRAL
Michigan
INDIANS Locationof Super- Number of
Students % Teachers % intendent Schools
Macomb CountyFraser P.S. 8 .1 Fraser 10
Lakeshore S.D. 3 .0 40.111. St. Clair Shores 10Lakeview P.S. 5 .1 St. Clair Shores 12
Lanse Creuse P.S. 7 .1 Mt. Clemens 12
Mt. Clemens Com. S. 9 .1 Mt. Clemens 13
New Haven Com. S. 5 .3 New Haven 3
Richmond Com. S. 1 .1 2 3.2 RichmondRomeo Com. S. Romeo 7
S. Lake Com. S. St. Clair Shores 9Utica Com. S. 13 .1 Utica 24Van Dyke Com. S. 28 .4 Warren 14
Warren C. S. 20 .1 Warren 31Warren Woods P.S. 13 .2 1 .3 Warren 14
Wayne CountyDetroit City S.D. 218 .1 13 .1 Detroit 301Allen Park P.S. 15 .2 Allen Park 9
Cherry Hill S.D. 5 .1 Inkster 7
Dearborn City S.D. 26 .1 , Dearborn 31
Dearborn Hts. S.D. 36 .7 Dearborn Hts. 8
Melvindale N. Allen Pk.S.D. 5 .1 1 .5 Melvindale 9
Garden City S.D. 20 .1 1 .2 Garden City 15
Grosse Pointe P.S. 2 .0 Grosse Pointe 15
Hamtrack City P.S. 12 .4 Hamtrack 6
Highland Park City S. 7 .1 .1011. Highland Park 10
Inkster City S.D. Inkster 9
Lincoln Park City S. 30 .2 2 Lincoln Park 17Livonia P.S. 24 .1 Livonia 45Plymouth Com. S.D. 7 .1 Plymouth 15Redford U. S.D. 6 .1 1 .2 Detroit 10River Rouge City S. 16 .4 River Rouge 5
Romulus Com. S. 7 .1 Romulus 9
South Redford S.D. 1 .0 Detroit 12Taylor S.D. 44 .2 3 .5 Taylor 28Trenton P.S. 7 .1 -- Trenton 8
Wayne Com. S. 55 .3 -- -- Wayne 31Wyandotte S.D. 16 .2 1 .3 Wyandotte 12
Fairlane S.D. 1 .1 . Dearborn Hts. 2
8F)
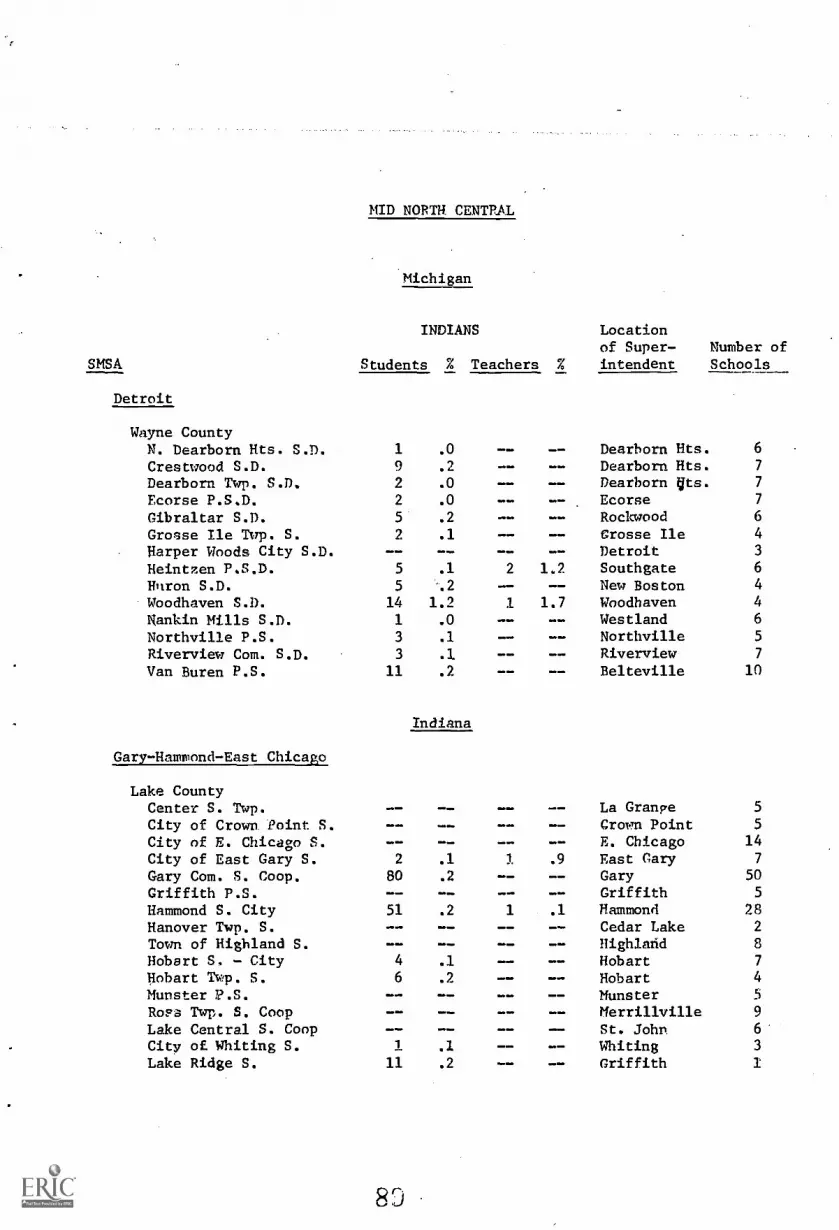
SMSA
Detroit
Wayne County
MID NORTH CENTRAL
Michigan
INDIANS Locationof Super- Number of
Students % Teachers % intendent Schools
N. Dearborn Hts. S.D. 1 .0 -- Dearborn Hts. 6
Crestwood S.D. 9 .2 Dearborn Hts. 7
Dearborn Twp. S.D. 2 .0 -- Dearborn {its. 7
Ecorse P.S.D. 2 .0 -- Ecorse 7
Gibraltar S.D. 5 .2 -- Rockwood 6
Grosse Ile Twp. S. 2 .1 -- Grosse Ile 4
Harper Woods City S.D. Detroit 3
Heintzen P.S.D. 5 .1 2 1.2 Southgate 6
Huron S.D. 5 .2 -- New Boston 4
Woodhaven S.D. 14 1.2 1 1.7 Woodhaven 4
Nankin Mills S.D. 1 .0 Westland 6
Northville P.S. 3 .1 Northville 5
Riverview Com. S.D. 3 .1 Riverview 7
Van Buren P.S. 11 .2 Belteville 10
Indiana
Gary - Hammond -East Chicago
Lake CountyCenter S. Twp. La Grange 5
City of Crown. Point S. Crown Point 5
City of E. Chicago S. E. Chicago 14
City of East Gary S. 2 .1 3. .9 East Cary 7
Gary Com. S. Coop. 80 .2 Gary 50
Griffith P.S. _ - Griffith 5
Hammond S. City 51 .2 1 .1 Hammond 28
Hanover. Twp. S. Cedar Lake 2
Town of Highland S. Highland 8
Hobart S. - City 4 .1 010. Hobart 7
Hobart Twp. S. 6 .2 Hobart 4
Munster P.S. Munster 5
RoPs Twp. S. Coop - - _ - Merrillville 9
Lake Central S. Coop mell St. John 6
City of Whiting S. 1 .1 Whiting 3
Lake Ridge S. 11 .2 - - Griffith
8
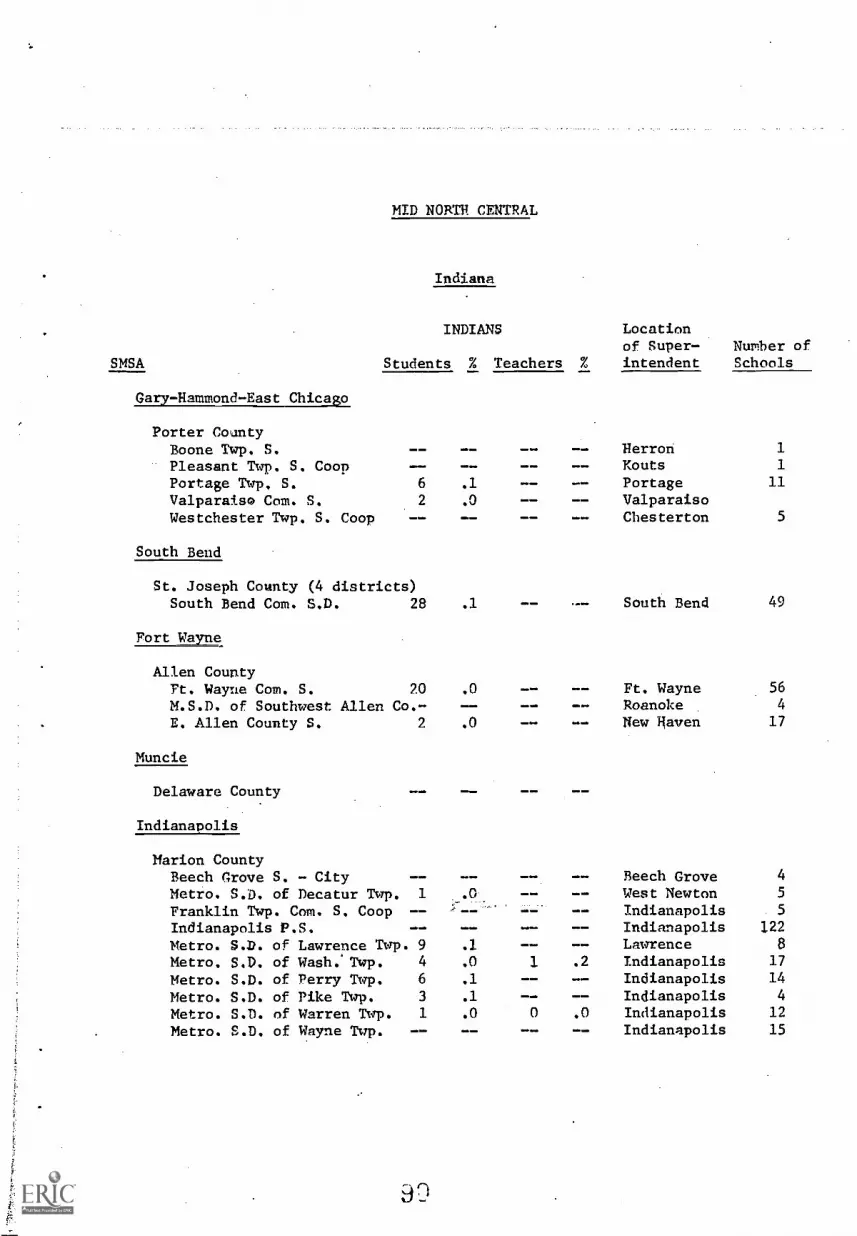
MID NORTH CENTRAL
Indiana
INDIANS
SMSA Students % Teachers %
Gary-Hammond-East Chicago
Porter CountyBoone Twp. S.Pleasant Twp. S. CoopPortage Twp. S.Valparaiso Com. S.Westchester Twp. S. Coop
South Bend
St. Joseph County (4 districts)South Bend Com. S.D. 28
Fort Wayne
Allen CountyFt. Wayne Com. S. 20
M.S.D. of Southwest Allen Co.-E. Allen County S. 2
Muncie
Delaware County
Indianapolis
Marion CountyBeech Grove S. - CityMetro. S.D. of Decatur Twp. 1
Franklin Twp. Com. S. Coop --Indianapolis P.S. --Metro. S.D. of Lawrence Twp. 9Metro. S.D. of Wash. Twp. 4
Metro. S.D. of Perry Twp. 6
Metro. S.D. of Pike Twp. 3
Metro. S.D. of Warren Twp. 1
Metro. S.D. of Wayne Twp.
Locationof. Super- Number ofintendent Schools
.1
HerronKoutsPortage
1
1
11
.0 ValparaisoChesterton 5
.1 South Bend 49
.0 Ft. Wayne 56
Roanoke 4
.0 New Haven 17
Beech Grove 4
.0 West Newton 5
Indianapolis 5
Indianapolis 122
.1 Lawrence 8
.0 1 .2 Indianapolis 17
.1 - - Indianapolis 14
.1 Indianapolis 4
.0 0 .0 Indianapolis 12
Indianapolis 15
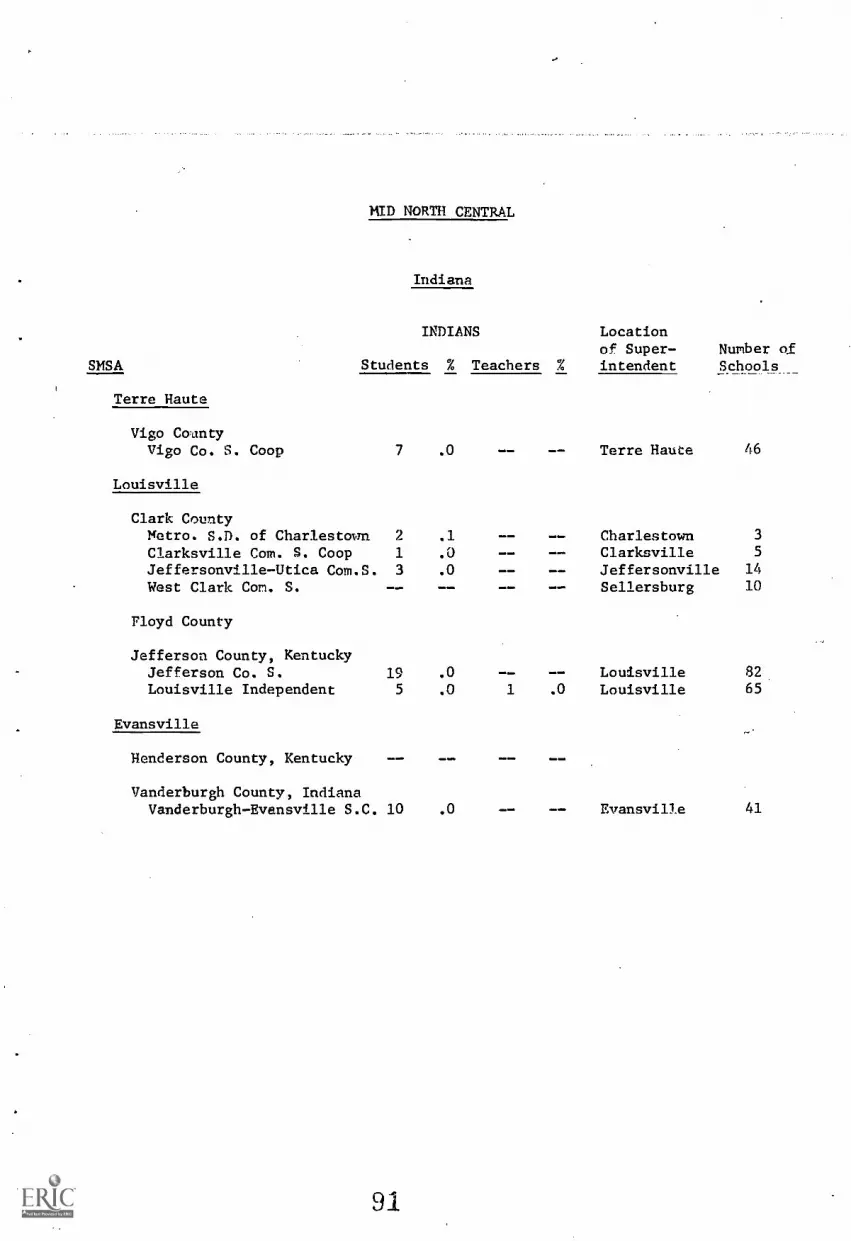
MID NORTH CENTRAL
Indiana
INDIANS Locationof. Super- Number of
SMSA Students % Teachers % intendent Schools
Terre Haute
Vigo CountyVigo Co. S. Coop 7 .0 Terre Haute 46
Louisville
Clark CountyMetro. S.D. of Charlestown 2 .1 -- Charlestown 3
Clarksville Com. S. Coop 1 .0 Clarksville 5
Jeffersonville-Utica Com.S. 3 .0 -- -- Jeffersonville 14
West Clark Con. S. -- Sellersburg 10
Floyd County
Jefferson County, KentuckyJefferson Co. S.Louisville Independent
195
.0
.0 1 .0
LouisvilleLouisville
82,65
Evansville
Henderson County, Kentucky
Vanderburgh County, IndianaVanderburgh-Evansville S.C. 10 .0 Evansville 41
91
APPENDIX D
MID SOUTH CENTRAL STATES
ArkansasKansasLouisianaMissouriOklahomaTexas
t

MTWS(yrITR,CENTRAL
Kansas
INDIANS
SMSA Students % Teachers %
Kansas City
Locationof Super- Number ofintendent Schools
Wyandotte CountyTurner Unified S.D. #202 15 .3 -- Kansas City 10
Kansas City U.S.D. #500 26 .1 1 .1 Kansas City 61
Bonner Springs USD #204 1 .0 Bonner Springs 10
Johnson CountyPrairie D.S. 2 .1 Prairie Village 4
Shawnee Mission H.S.D. #6 2 .0 Overland Park 14
U.S.D. #230 1 .1 Spring Hill 2
Valley View D. #49 2 .1 Overland Park 6
Olathe Unified D. #233 1 .0 Olathe 12
Jackson County, MissouriBlue Springs S.D. #4 8 .3 Blue Springs 3
Ft. Osage R-I.S.D. - - -- -- Independence 7
Center S.D. #58 -- Kansas City, Mo. 8Grandview S.D. 414 5 .1 1 .5 Grandview 8
Consolidated S.D. 4 #1 2 .0 -- Hickmann Mills 16
Independence S.D. #30 16 .1 -- -- Independence 24
Kansas City S.D. 11 -- Kansas City, Mo.99Lee's Summit S.D. #7 Lee's Summit 9
Raytown S.D. #2 4 .0 -- Raytown 16
Clay County, MissouriExcelsior Springs S.D. 440 3 .1 OwlmO Excelsior Springs6Liberty P. S. D. #53 111.1.0 _ - Liberty 7
N. Kansas City S.D. #74 3 .0 MIMI= - - Kansas City, Mo.35Smithville R-11 S.D. 11 Smithville 2
93
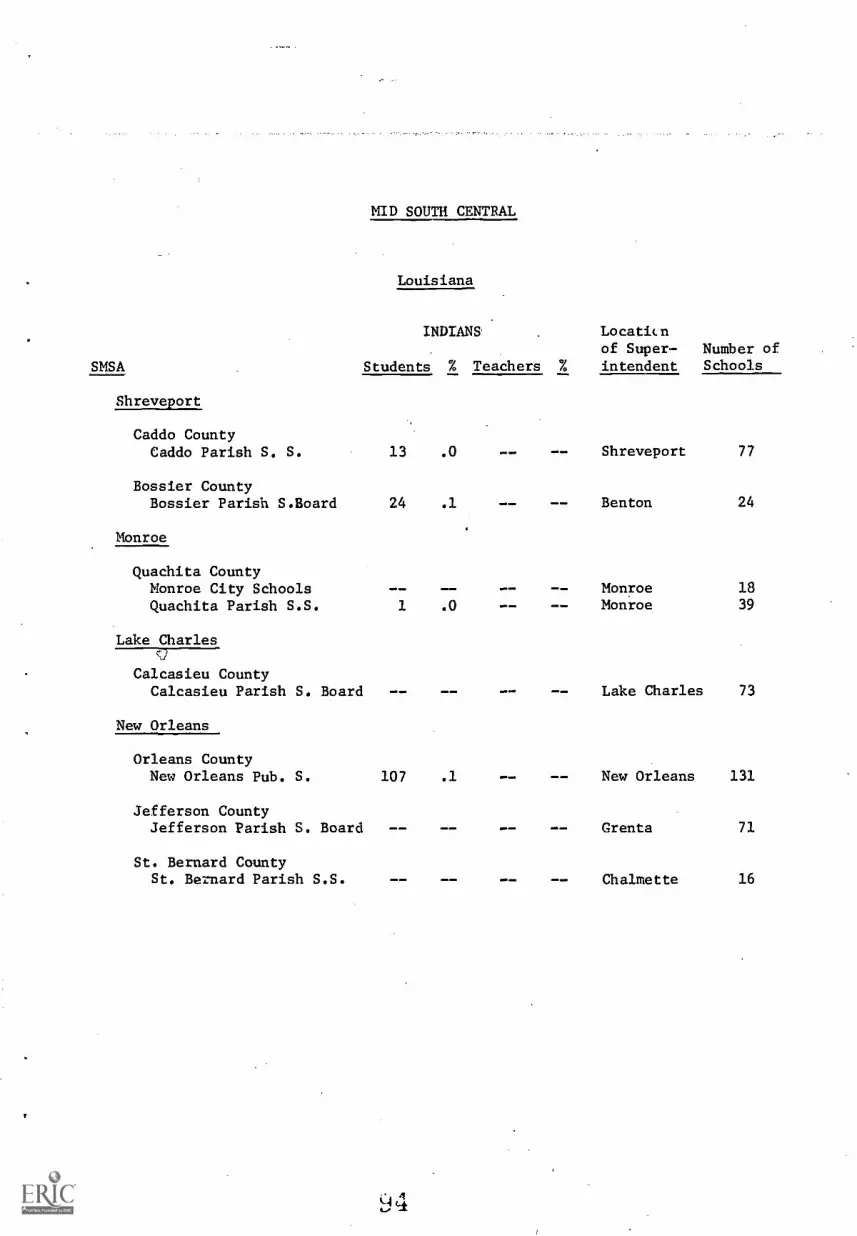
MID SOUTH CENTRAL
Louisiana
INDIANS. Locaticnof Super- Number of
SMSA Students % Teachers % intendent Schools
Shreveport
Caddo CountyCaddo Parish S. S.
Bossier CountyBossier Parish S.Board
Monroe
13
24
1
--
107
--
.0
.1
.0
.1
elle
W. win
=P.m
1.1,
=PANE
- -
Shreveport
Benton
MonroeMonroe
Lake Charles
New Orleans
Grenta
Chalmette
77
24
1839
73
131
71
16
Quachita CountyMonroe City SchoolsQuachita Parish S.S.
Lake Charlesc2
Calcasieu CountyCalcasieu Parish S. Board
New Orleans
Orleans CountyNew Orleans Pub. S.
Jefferson CountyJefferson Parish S. Board
St. Bernard CountySt. Bernard Parish S.S.

MID SOUTH CENTRAL .
Missouri
INDIANS Locationof Super- Number of
SMSA Students % Teachers % intendent Schools
St. Joseph
Buchanan CountyS.D. of St. Joseph
Kansas City (see Kansas)
St. Louis (see Illinois)
Springfield
Green CountySpringfield R-12Republic R-3Willard S.D. R-2
16 .1
Arkansas
- _
- -
- -- -
St. Joseph 32
Springfield 56
RepublicWillard 5
Little Rock-No. Little Rock
Palaski CountyLittle Rock S.D. -- Little Rock 44
No. Little Rock R.S.D. 17 .1 No. Little Rock 26Palaski Co. Spec. S.D. 11 .0 Little Rock 41
Ft. Smith
Sebastian County
Texarkana
Miller County 4 .1 Texarkana 10
Bowie'CoUntyHooks I.S.D. 1 .1 -- Hooks 4
Texarkana I.S.D. 1 .0 -- Texarkana 16
9g
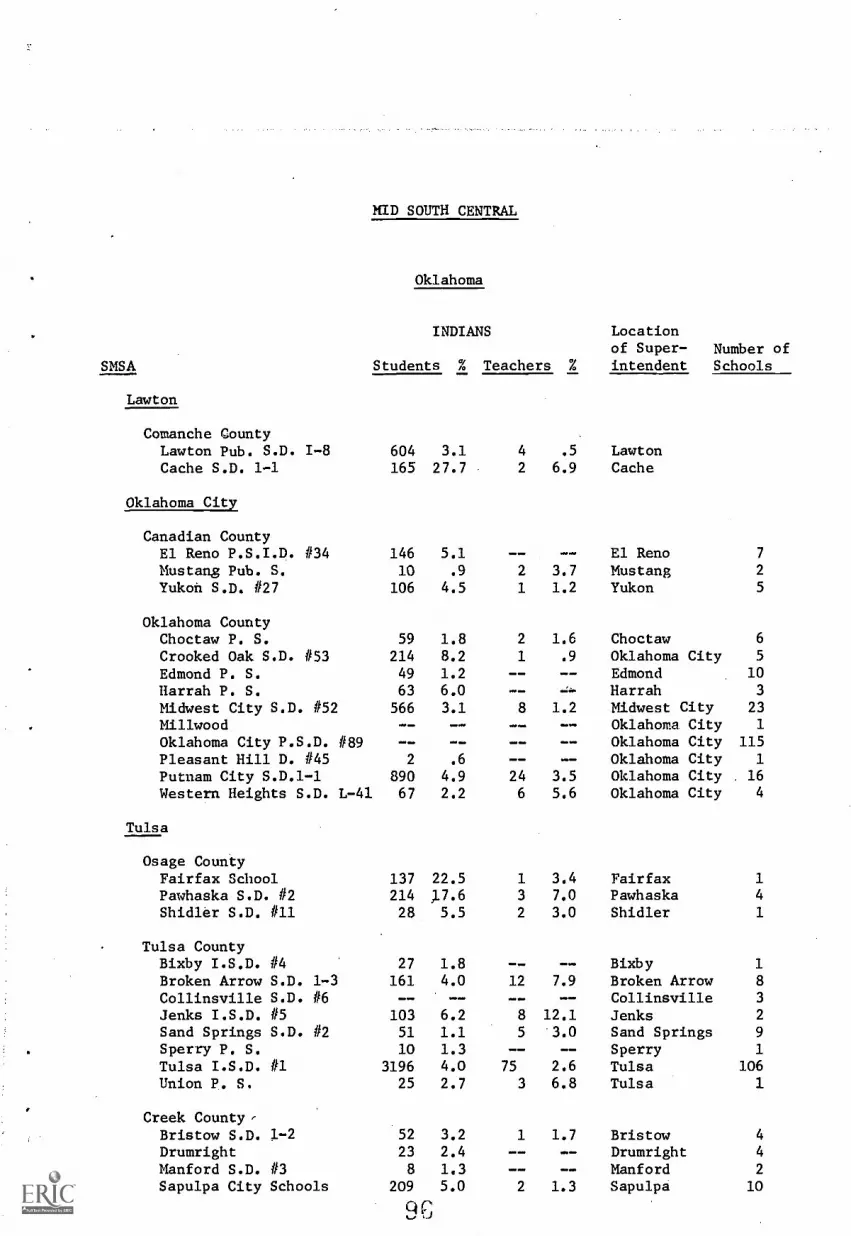
SMSA
Lawton
Comanche CountyLawton Pub. S.D. 1-8Cache S.D. 1-1
Oklahoma City
Canadian CountyEl Reno P.S.I.D. #34Mustang Pub. S.Yukon S.D. #27
MID SOUTH CENTRAL
Oklahoma
INDIANS Locationof Super- Number of
Students % Teachers % intendent Schools
604 3.1165 27.7
146 5.110 .9
106 4.5
Oklahoma CountyChoctaw P. S. 59 1.8Crooked Oak S.D. #53 214 8.2
Edmond P. S. 49 1.2Harrah P. S. 63 6.0Midwest City S.D. #52 566 3.1MillwoodOklahoma City P.S.D. #89Pleasant Hill D. #45 2 .6
Putnam City S.D.1-1 890 4.9Western Heights S.D. L-41 67 2.2
Tulsa
Osage CouniyFairfax SchoolPawhaska S.D. #2Shidler S.D. #11
Tulsa CountyBixby I.S.D. #4Broken Arrow S.D. 1-3Collinsville S.D. #6Jenks I.S.D. #5Sand Springs S.D. #2Sperry P. S.Tulsa I.S.D. #1Union P. S.
Creek County,Bristow S.D. 1-2DrumrightManford S.D. #3Sapulpa City Schools
137 22.5214 17.628 5.5
27 1.8161 4.0
103 6.251 1.110 1.3
3196 4.025 2.7
52 3.2
23 2.48 1.3
209 5.0
9G
4 .5 Lawton2 6.9 Cache
3.71.2
2 1.6
1 .9
8 1.2
24 3.5
6 5.6
1 3.43 7.0
2 3.0
12 7.9
8 12.15 3.0
75 2.6
3 6.8
1 1.7
--2 1.3
El RenoMustangYukon
7
2
5
Choctaw 6
Oklahoma City 5
Edmond 10
Harrah 3
Midwest City 23
Oklahoma City 1
Oklahoma City 115Oklahoma City 1
Oklahoma City 16
Oklahoma City 4
FairfaxPawhaskaShidler
BixbyBroken ArrowCollinsvilleJenksSand SpringsSperryTulsaTulsa
BristowDrumrightManfordSapulpa
1
4
1
1
8
3
2
9
1
106
4
4
2
10

MID SOUTH CENTRAL
Texas
SMSA
Amarillo
Potter CountyRandell County
Canyon I.S.D.
INDIANS Locationof Super- Number of
Students % Teachers % intendent Schools
3 .1 - - Canyon 4
LubbockLubbock County
Idalou Rural H.S.D. 2 .2 1 2.5 Idalou 3
Lubbock I.S.D. 9 .0 Lubbock 53
Roosevelt Rural H.S.D. Lubbock 1
Slaton I.S.D. Slaton 4
El Paso,1 Paso CountyFabens I.D.S. -- Fabens 4
Canatillo S.D. Canatillo 2
Ysleta I.S.D. 93 .3 El Paso 28
El Paso I.S.D. 29 .0 2 .1 El Paso 63
OdessaEctor County
Ector Co. I.S.D. 15 .1 Odessa 32
Midland
Midland County . --
San Angelo
Tom Green CountySan Angelo I.D.S. 3 .0 San Angelo 29
Abilene
Jones CountyTaylor County
MerkelAbilene I.S.D. 3 .0
AMIN.mIk
- - MerkelAbilene
3
32

SMSA
Wichita Falls
MID SOUTH CENTRAL
Texas
INDIANS Locationof Super- Number of
Students % Teachers % intendent Schools
Wichita CountyBarkburne H.I.S.D. 3 .1 Barkburne H. 5
Electra I.S.D. 2 .2 Electra 4
Wichita Falls I.S.D. 25 .1 2 .3 Wichita Falls 32
Archer CountyArcher City I.S.D. 2 .4 - - Archer City
Ft. Worth
Johnson CountyAlvarado I.S.D. Alvarado 4
Cleburne 4 .1 Cleburne 8
Tarrant Count),
Arlington I.S,D. 22 .1 Arlington 24
Azle I.S.D. 3 .1 1 1.1 Azle 4
Birdville I.S.D. 14 .1 1 .2 Ft. Worth 19
Castle Berry I.S.D. 10 .2 - - Ft. Worth 5
Everman I.S.D. 1 ,0 OM. OM. Everman 4
Ft. Worth I.S.D. 107 .1 Ft. Worth 118Harst-Euless I.S.D. 14 .1 Harst 18Keller I.S.D. Keller 3
Mansfield I.S.D. 5 .2 - - Mansfield 5
Lake Worth I.S.D. 2 .1 - - Ft. Worth 2
Eagle Mt.-Saginaw I.S.D. 5 .3 - - Saginaw 5
White Settlement I.S.D. 3 .1 White Settlement 5
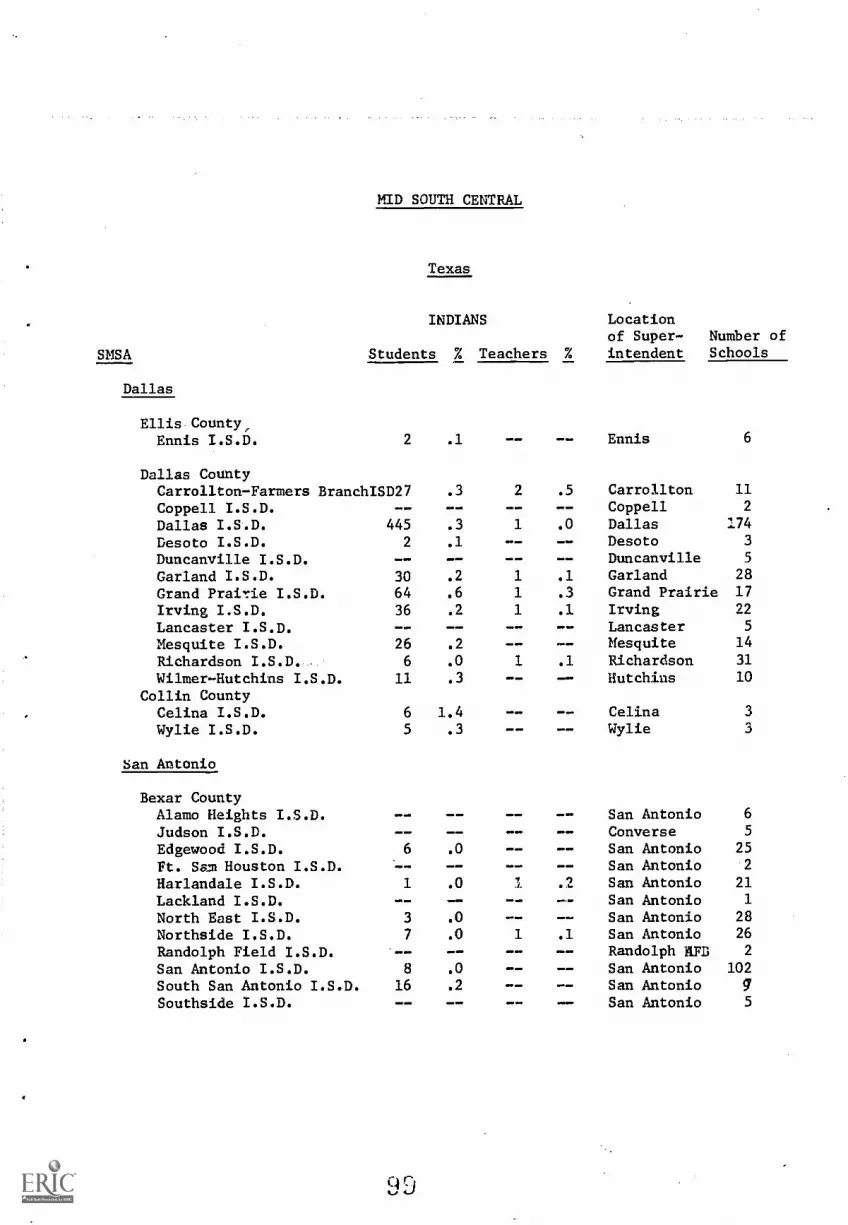
SMSA
Dallas
MID SOUTH CENTRAL
Texas
INDIANS
Students % Teachers %
Locationof Super- Number ofintendent Schools
Ellis County,Ennis I.S.D. 2 .1 -- -- Ennis 6
Dallas CountyCarrollton-Farmers BranchISD27 .3 2 .5 Carrollton 11
Coppell I.S.D. Coppell 2
Dallas I.S.D. 445 .3 1 .0 Dallas :74
Desoto I.S.D. 2 .1 -- Desoto 3
Duncanville I.S.D. Duncanville 5
Garland I.S.D. 30 .2 1 .1 Garland 28
Grand Prairie I.S.D. 64 .6 1 .3 Grand Prairie 17
Irving I.S.D. 36 .2 1 .1 Irving 22
Lancaster I.S.D. Lancaster 5
Mesquite I.S.D. 26 .2 Mesquite 14
Richardson I.S.D. 6 .0 1 .1 Richardson 31
Wilmer-Hutchins I.S.D. 11 .3 -- Hutchins 10
Collin CountyCelina I.S.D. 6 1.4 -- Celina 3
Wylie I.S.D. 5 .3 Wylie 3
San Antonio
Bexar CountyAlamo Heights I.S.D. San Antonio 6
Judson I.S.D. - _ Converse 5
Edgewood I.S.D. 6 .0 - - San Antonio 25
Ft. Sam Houston I.S.D. San Antonio 2
Harlandale I.S.D. 1 .0 San Antonio 21
Lackland I.S.D. - _ San Antonio 1
North East I.S.D. 3 .0 San Antonio 28
Northside I.S.D. 7 .0 1 .1 San Antonio 26
Randolph Field I.S.D. Randolph RFD 2
San Antonio I.S.D. 8 .0 - - San Antonio 102
South San Antonio I.S.D. 16 .2 San AntonioSouthside I.S.D. San Antonio 5
91)
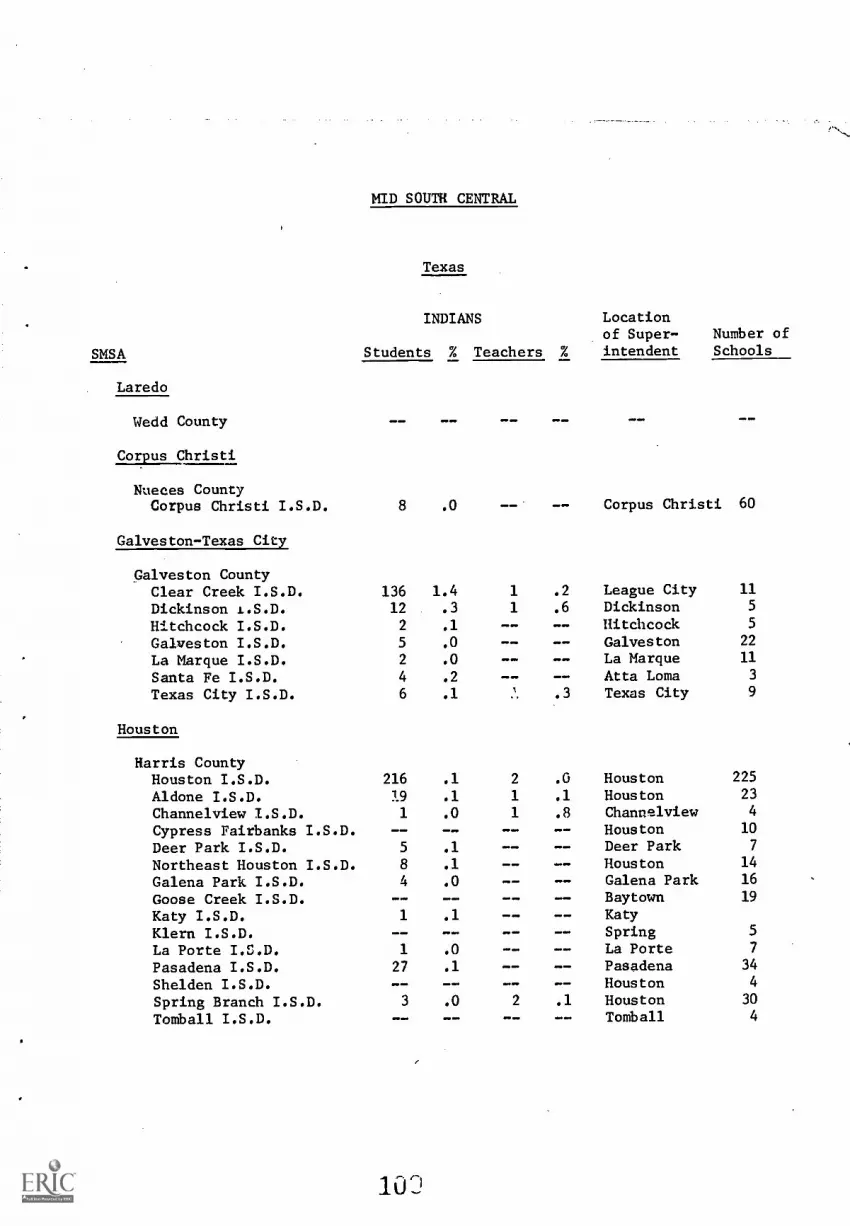
SMSA
Laredo
MID SOUTH CENTRAL
Texas
INDIANS Locationof Super- Number of
Students % Teachers % intendent Schools
Wedd County
Corpus Christi
MP,
Nueces CountyCorpus Christi I.S.D. 8 .0 Corpus Christi 60
Galveston-Texas City
Galveston CountyClear Creek I.S.D. 136 1.4 1 .2 League City 11
Dickinson .L.S.D. 12 .3 1 .6 Dickinson 5
Hitchcock I.S.D. 2 .1 Hitchcock 5
Galveston I.S.D. 5 .0 Galveston 22
La Marque I.S.D. 2 .0 La Marque 11
Santa Fe I.S.D. 4 .2 Atta Loma 3
Texas City I.S.D. 6 .1 .3 Texas City 9
Houston
Harris CountyHouston I.S.D. 216 .1 2 .0 Houston 225
Aldone I.S.D. 19 .1 1 .1 Houston 23
Channelview I.S.D. 1 .0 1 .8 Channelview 4
Cypress Fairbanks I.S.D. Houston 10
Deer Park I.S.D. 5 .1 - - Deer Park 7
Northeast Houston I.S.D. 8 .1 Houston 14
Galena Park I.S.D. 4 .0 Galena Park 16
Goose Creek I.S.D. Baytown 19
Katy I.S.D. 1 .1 Katy
Klern I.S.D. NM.= Spring 5
La Porte I.S.D. 1 .0 La Porte 7
Pasadena I.S.D. 27 .1 Pasadena 34
Shelden I.S.D. Houston 4
Spring Branch I.S.D. 3 .0 2 .1 Houston 30
Tomball I.S.D. - - - _ Tomball 4
10:1
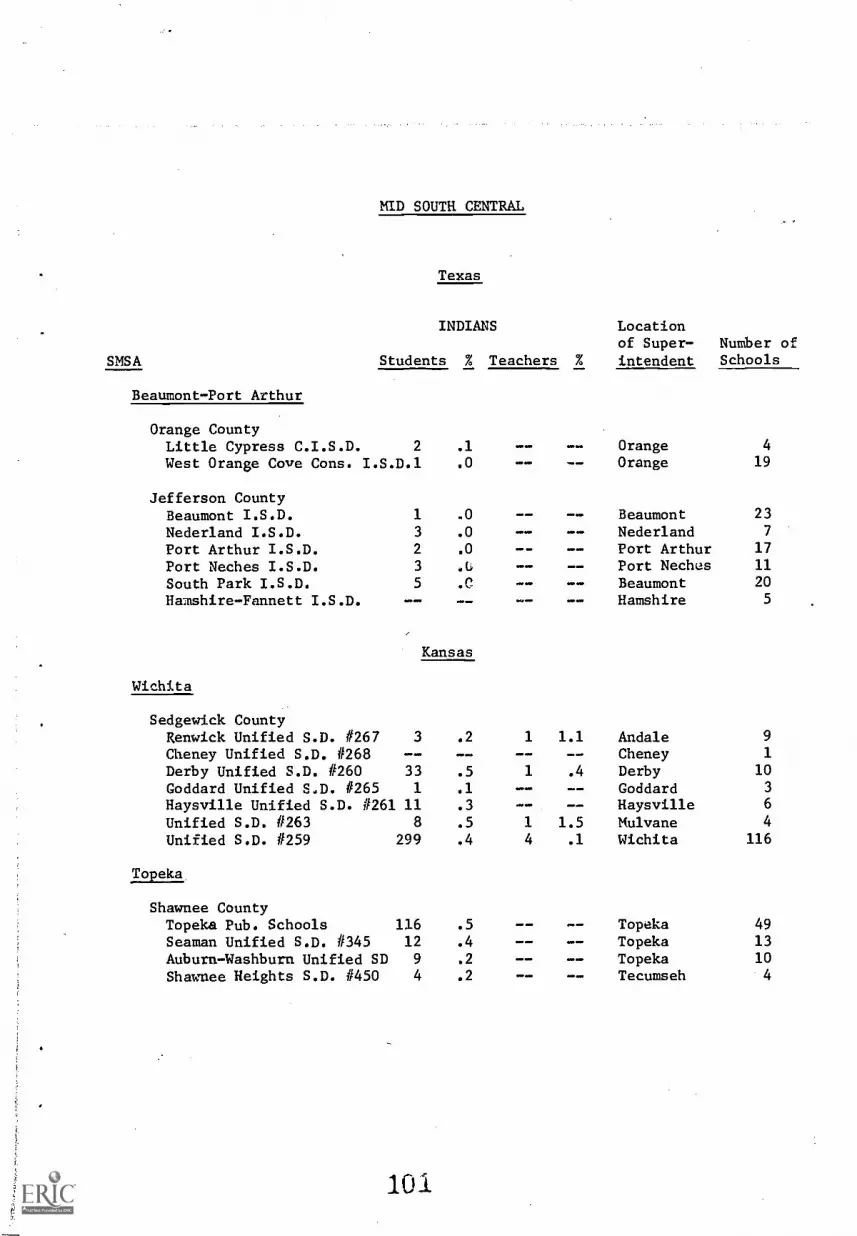
SMSA
Beaumont-Port Arthur
MID SOUTH CENTRAL
Texas
INDIANS Locationof Super- Number of
Students % Teachers % intendent Schools
Orange CountyLittle Cypress C.I.S.D. 2 .1 Orange 4
West Orange Cove Cons. I.S.D.1 .0 Orange 19
Jefferson CountyBeaumont I.S.D. 1 .0 -- Beaumont 23
Nederland I.S.D. 3 .0 Nederland 7
Port Arthur I.S.D. 2 .0 -- Port Arthur 17
Port Neches I.S.D. 3 .6 -- Port Neches 11
South Park I.S.D. 5 .0 Beaumont 20
Hamshire-Fannett I.S.D. Hamshire 5
Kansas
Wichita
Sedgewick CountyRenwick Unified S.D. #267 3 .2 1 1.1 Andale 9
Cheney Unified S.D. #268 -- -- Cheney 1
Derby Unified S.D. #260 33 .5 1 .4 Derby 10
Goddard Unified S.D. #265 1 .1 -- Goddard 3
Haysville Unified S.D. #261 11 .3 Haysville 6
Unified S.D. #263 8 .5 1 1.5 Mulvane 4
Unified S.D. #259 299 .4 4 .1 Wichita 116
Topeka,
Shawnee CountyTopeka Pub. Schools 116 .5 Topeka 49
Seaman Unified S.D. #345 12 .4 Topeka 13
Auburn-Washburn Unified SD 9 .2 Topeka 10
Shawnee Heights S.D. #450 4 .2 -- Tecumseh 4
101
APPENDIX E
SOUTHWEST STATES
ArizonaCaliforniaColoradoNevadaNew Mexico,Utah
102
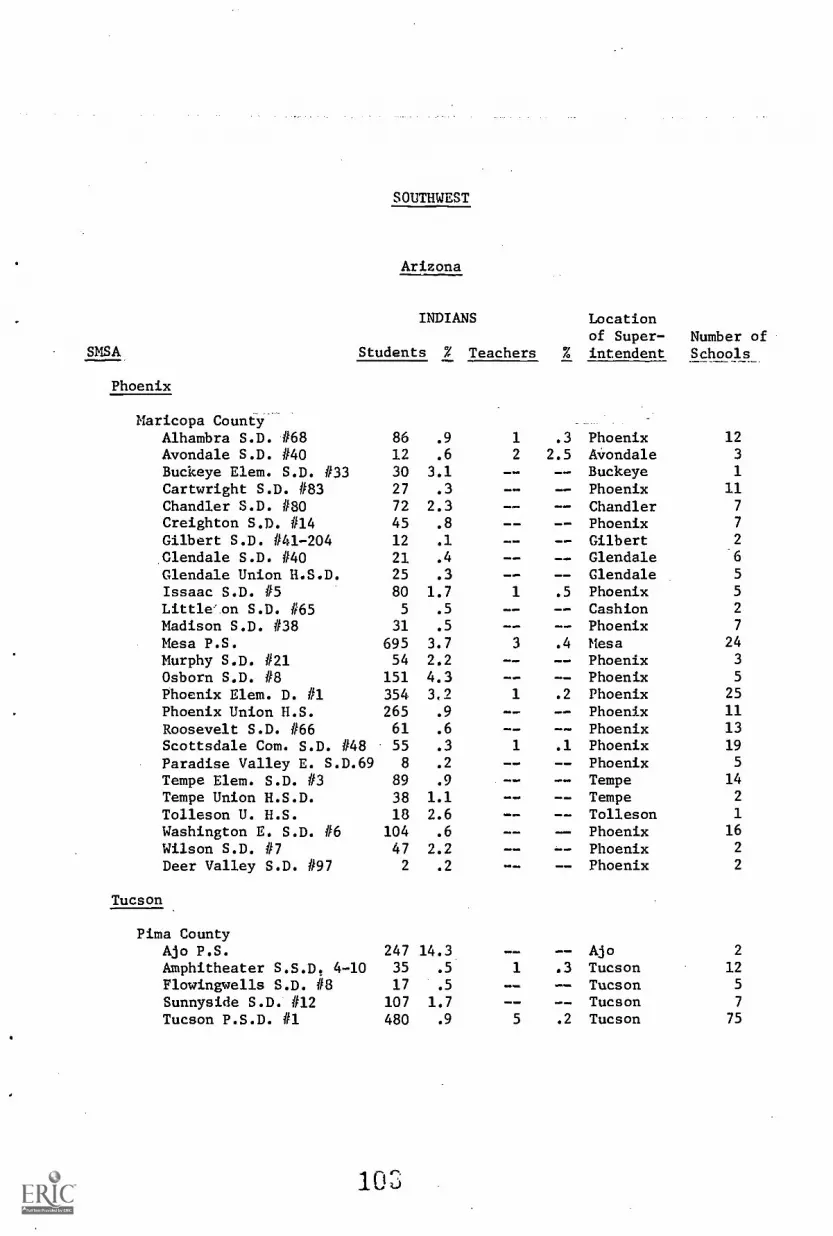
SOUTHWEST
Arizona
INDIANS
SMSA Students % Teachers
Phoenix
Maricopa Count-Y.
Locationof Super- Number of
% intendent Schools
Alhambra S.D. #68Avondale S.D. #40Buckeye Elem. S.D. #33
86
1230
.9
.6
3.1
1
2
.3
2.5--
PhoenixAvondaleBuckeye
12
3
1
Cartwright S.D. #83 27 .3 -- Phoenix 11Chandler S.D. #80 72 2.3 -- Chandler 7
Creighton S.D. #14 45 .8 -- -- Phoenix 7
Gilbert S.D. #41-204 12 .1 -- -- Gilbert.Glendale S.D. #40 21 .4 -- GlendaleGlendale Union H.S.D. 25 .3 -- Glendale 5
Issaac S.D. #5 80 1.7 1 .5 Phoenix 5
Little'.on S.D. #65 5 .5 -- Cashion 2
Madison S.D. #38 31 .5 -- Phoenix 7
Mesa P.S. 695 3.7 3 .4 Mesa 24
Murphy S.D. #21 54 2.2 -- Phoenix 3
Osborn S.D. #8 151 4.3 -- -- Phoenix 5
Phoenix Elem. D. #1 354 3,2 1 .2 Phoenix 25
Phoenix Union H.S. 265 .9 -- Phoenix 11
Roosevelt S.D. #66 61 .6 -- Phoenix 13
Scottsdale Com. S.D. #48 55 .3 1 .1 Phoenix 19
Paradise Valley E. S.D.69 8 .2 -- Phoenix 5
Tempe Elem. S.D. #3 89 .9 -- Tempe 14
Tempe Union H.S.D. 38 1.1 -- Tempe 2
Tolleson U. H.S. 18 2.6 -- Tolleson 1
Washington E. S.D. #6 104 .6 -- Phoenix 16
Wilson S.D. #7 47 2.2 -- Phoenix 2
Deer Valley S.D. #97 2 .2 -- Phoenix 2
Tucson
Pima CountyAjo P.S. 247 14.3 Ajo 2
Amphitheater S.S.D. 4-10 35 .5 1 .3 Tucson 12
Flowingwells S.D. #8 17 .5 a -- Tucson 5
Sunnyside S.D. #12 107 1.7 -- Tucson 7
Tucson P.S.D. #1 480 .9 5 .2 Tucson 75
103
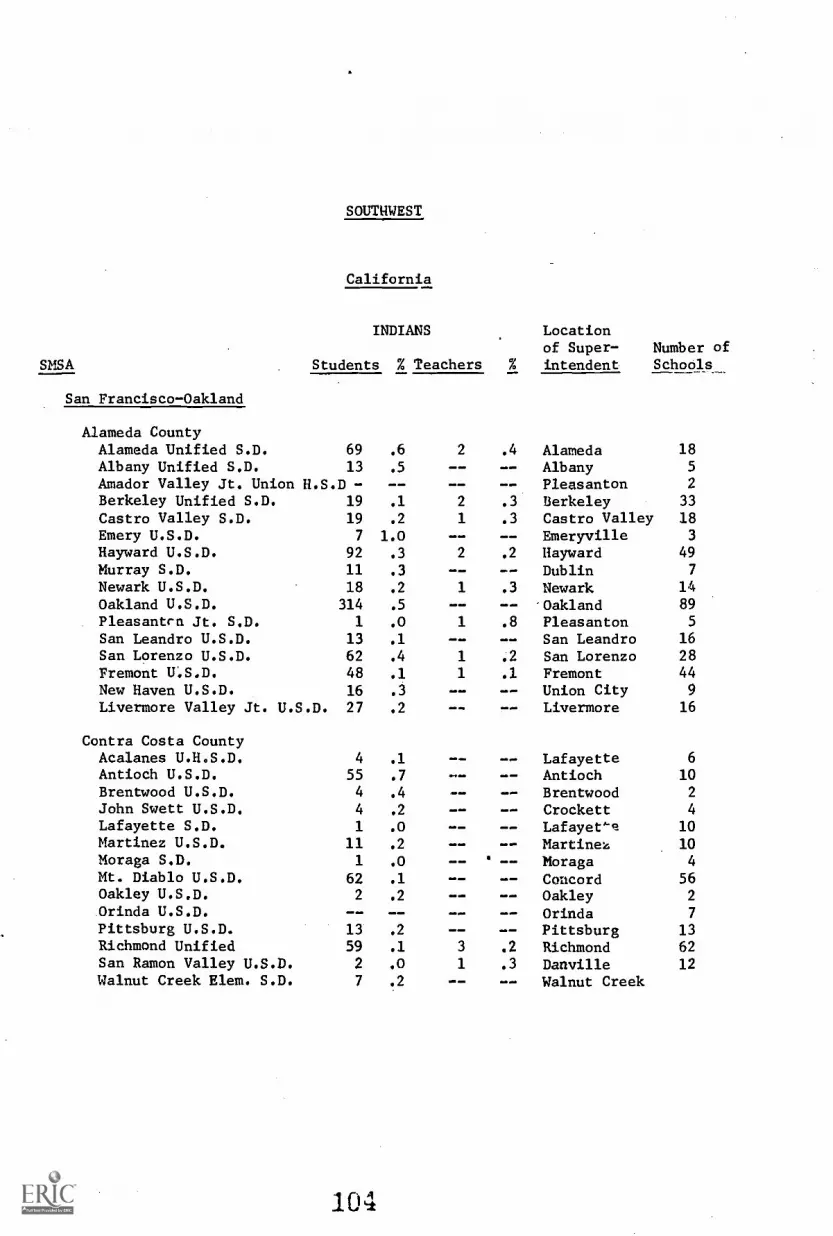
SMSA
San Francisco-Oakland
SOUTHWEST
California
INDIANS
Students % Teachers
Locationof Super- Number of
% intendent Schools__
Alameda CountyAlameda Unified S.D. 69 .6 2 .4 Alameda 18Albany Unified S.D. 13 .5 Albany 5
Amador Valley Jt. Union H.S.D - -- Pleasanton 2
Berkeley Unified S.D. 19 .1 2 .3 Berkeley 33Castro Valley S.D. 19 .2 1 .3 Castro Valley 18Emery U.S.D. 7 1.0 -- Emeryville 3
Hayward U.S.D. 92 .3 2 .2 Hayward 49Murray S.D. 11 .3 MN /MO -- Dublin 7
Newark U.S.D. 18 .2 1 .3 Newark 14Oakland U.S.D. 314 .5 -- Oakland 89
Pleasantra Jt. S.D 1 .0 1 .8 Pleasanton 5
San Leandro U.S.D. 13 .1 -- -- San Leandro 16
San Lorenzo U.S.D. 62 .4 1 .2 San Lorenzo 28
Fremont W.S.D. 48 .1 1 .1 Fremont 44New Haven U.S.D. 16 .3 -- -- Union City 9
Livermore Valley Jt. U.S.D. 27 .2 -- Livermore 16
Contra Costa CountyAcalanes U.H.S.D. 4 .1 Lafayette 6
Antioch U.S.D. 55 .7 Antioch 10Brentwood U.S.D. 4 .4 Brentwood 2
John Swett U.S.D. 4 .2 - - Crockett 4
Lafayette S.D. 1 .0 Lafayet'e 10Martinez U.S.D. 11 .2 Martinez 10Moraga S.D. 1 .0 Moraga 4
Mt. Diablo U.S.D. 62 .1 Concord 56Oakley U.S.D. 2 .2 MD NM Oakley 2
Orinda U.S.D. MD /ND Orinda 7
Pittsburg U.S.D. 13 .2 =.11m Pittsburg 13Richmond Unified 59 .1 3 .2 Richmond 62San Ramon Valley U.S.D. 2 .0 1 .3 Danville 12Walnut Creek Elem. S.D. 7 .2 NM Mb Walnut Creek
104
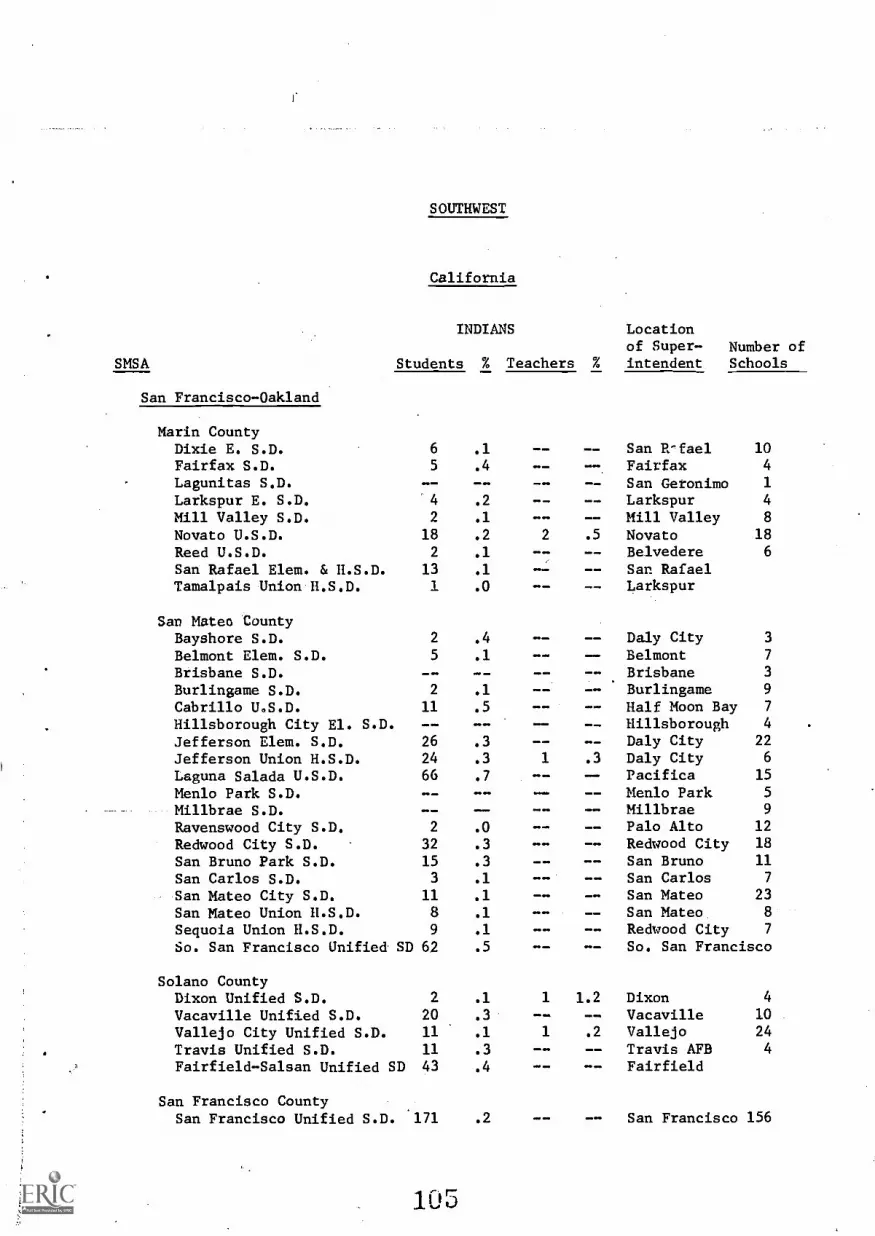
SOUTHWEST
California
INDIANS
SMSA Students % Teachers
San Francisco-Oakland
Marin County
Locationof Super- Number of
% intendent Schools
Dixie E. S.D.Fairfax S.D.Lagunitas S.D.Larkspur E. S.D.Mill Valley S.D.Novato U.S.D.Reed U.S.D.San Rafael Elem. & H.S.D.
6
5
4
2
18
2
13
.1
.4
.2
.1
.2
.1
.1
2
--
.5
San R-fael 10
Fairfax 4
San Geronimo 1
Larkspur 4
Mill Valley 8
Novato 18
Belvedere 6
San RafaelTamalpais Union H.S.D. 1 .0 Larkspur
San Mateo CountyBayshore S.D. 2 .4 -- Daly City 3
Belmont Elem. S.D. 5 .1 Belmont 7
Brisbane S.D. Brisbane 3
Burlingame S.D. 2 .1 Burlingame 9
Cabrillo U.S.D. 11 .5 -- -- Half Moon Bay 7
Hillsborough City El. S.D. Hillsborough 4
Jefferson Elem. S.D. 26 .3 Daly City 22
Jefferson Union H.S.D. 24 .3 1 .3 Daly City 6
Laguna Salada U.S.D. 66 .7 Pacifica 15
Menlo Park S.D. Menlo Park 5
Millbrae S.D. -- -- Millbrae 9
Ravenswood City S.D. 2 .0 Palo Alto 12
Redwood City S.D. 32 .3 Redwood City 18
San Bruno Park S.D. 15 .3 -- -- San Bruno 11
San Carlos S.D. 3 .1 San Carlos 7
San Mateo City S.D. 11 .1 -- San Mateo 23
San Mateo Union H.S.D. 8 .1 San Mateo. 8
Sequoia Union H.S.D. 9 .1 Redwood City 7
So. San Francisco Unified SD 62 .5 So. San Francisco
Solano CountyDixon Unified S.D. 2 .1 1 1.2 Dixon 4
Vacaville Unified S.D. 20 .3 Vacaville 10
Vallejo City Unified S.D. 11 .1 1 .2 Vallejo 24
Travis Unified S.D. 11 .3 - - Travis AFB 4
Fairfield-Salsan Unified SD 43 .4 Fairfield
San Francisco CountySan Francisco Unified S.D. 171 .2 OM -- San Francisco 156
105

SMSA
SOUTHWEST
California
INDIANS Locationof Super- Number of
Students % Teachers % intendent Schools
Los Angeles-Long Beach
Los Angeles CountyAlhambra City S.D. 26 .1 Alhambra 17
Antelope Valley Union HSD 35 .6 Lancaster 5
Arcadia Unified S.D. 3 .0 1 .3 Arcadia 13
Azusa Unified S.D. 20 .2 1 .2 Azusa 18
Baldwin Park Unified S.D. 40 .3 1 .2 Baldwin Park 19
Bassett Unified S.D. 23 .3 La Puente 13
Bellflower Unified S.D. 14 .1 Bellflower 19
Beverly Hills Unified S.D. 9 .2 1 .3 Beverly Hills 5
Bonita Unified S.D. 7 .1 San Dimas 11
Burbank Unified S.D. 41 .3 Burbank 21
Centinele Valley Union H.S.D.24 .3 Hawthorne 4
Charter Oak Unified S.D. ..11 .1 2 .7 Covina 14
Claremont Unified S.D. 3 .0 Claremont 12
Compton City Elem. 44 .3 Compton 20
Compton Union H.S.D. 20 .1 1 .2 Compton 11
Covina Valley Unified S.D. 76 .4 Covina 26
Culver City Unified S.D. 13 .2 Culver City 10
Downey Unified S.D. 32 .2 Downey 27Duarte Unified S.D. 8 .2 Duarte 8
East Whittier City S.D. 15 .1 Whittier 16
El Monte Elem. S.D. 54 .5 El Monte 17
El Monte Union H.S.D. 4 .1 1 .4 El Monte 4
El Segundo 2 .1 El Segundo 5
Enterprise City S.D. 1 .0 Compton 4
Garvey S.D. 9 .1 Rosemead 11
Glendale Unified S.D. 50 .2 Glendale 33
Glendora Unified S.D. 21 .2 Glendora 13Hawthorne Elem. S.D. 26 .5 Hawthorne 9
Hermosa Beach City S.D. 4 .2 -- -- Hermosa Beach 6
Hudsen Elem. S.D. 65 .3 1 .1 La Puente 32Inglewood Unified S.D. 56 .4 Inglewood 20Keppel Union S.D. 3 .3 Little Rock 3La Canada S.D. 3 .1 La Canada 8
Lancaster S.D. 19 .3 2 .8 Lancaster 10Las Virgenes Unified S.D. 1 .0 1 .7 Calabasas 7
Lawndale Elem. S.D. 89 1.3 Lawndale 11Little Lake City S.D. 8 .1 -- -- Santa Fe SpringsllLong Beach Unified S.D. 60 .1 1 .0 Long Beach 78Los Angeles Unified S.D. 1204 .2 13 .1 Los Angeles 591Los Nietos Elem. S.D. 3 .1 win 11=11, Santa Ee Springs 5
Lowell Jt. S.D. 8 .1 11=1,11=11, Whittier 11Lynwood Unified S.D. 48 .6 Lynwood 11

SMSA
SOUTHWEST
California
INDIANS Locationof Super-
Students % Teachers % .intendentNumber ofSchools
Los Angeles-Long Beach
8 .2 Manhatten Beach 10Los Angeles CountyManhatten Beach City S.D.Monrovia Unified S.D. 9 .1 1 .4 Monrovia 10
Montebello Unified S.D. 241 .9 Montebello 26
Mountain View S.D. 30 .5 2 .9 El Monte 10
Norwalk-La Mirada Unified SL 80 .2 Norwalk 38
Palmdale S.D. 19 .5 1 .7 Palmdale 7
Palos Verdes Peninsula USD 7 .0 Rolling Hills 26
Paramont Unified S.D. 26 .2 Paramont 14
Pasadena S.D. 28 .1 Pasadena 40
Pomona Unified S.D. 36 .2 Pomona 30
La 1.-suente Union H.S.D. 12 .1 La Puente 8
Redondo Beach City S.D. 106 1.1 1 .2 Redondo Beach 17
Rosemead S.D. 14 .5 Rosemead 5
ROwland S.D. 30 .2 1 .2 Rowland Heights 21
San Gabriel S.D. 4 .1 San Gabriel 7
San Marino Unified S.D. 1 .0 San Marino 5
Santa Monica Unified S.D. 34 .3 Santa Monica 17
Sangus Union S.D. 6 .2 Sangus 8
South Bay Union H.S.D. 12 .1 Hermosa Beach 5
South Pasadena Unified S.D. 5 .1 South Pasadena 7
South Whittier S.D. 20 .4 Whittier 8
Sulphur Springs Union S.D. 1 .1 Sangus 4
Temple City Unified S.D. 4 .1 Temple City 6
Torrance Unified S.D. 37 .1 2 .2 Torrance 41
Valle Lindo S.D. 3 .2 South El Monte 2
West Covina Unified S.D. 15 .1 West Covina 18
Westside Union S.D. 5 .2 Lancaster 4
Whittier City S.D. 24 .4 Whittier 14Whittier Union H.S.D. 13 .1 1 .2 Whittier 8
Willowbrook S.D. 1 .0 Los Angeles 5
Wiseburn S.D. 2 .1 Hawthorne 6
Wm. S. Hart Union H.S.D. 10 .2 Newhall 5
A.B.C. Unified S.D. 57 .4 2 .3 Artesia 21
El Rancho Unified S.D. 15 .1 2 .3 Pico Rivera 19
107

SOUTHWEST
California
SMSA
INDIANS
Students % Teachers %
Locationof Super- Number ofintendent Schools
Los Angeles-Long Beach
Orange CountyAnaheim City Elem. S.D. 27 .2 1 .2 Anaheim 22
Anaheim Union H.S.D. 51 .2 1 .1 Anaheim 24
Brea-Olinda Unified S.D. 11 .3 Brea 7
Buena Park S.D. 11 .2 Buena Park 10
Capistrano Unified S.D. 11 .2 Capistrano Beachl0Centralia Elem. S.D. 21 .3 Buena Park 10
Cypress S.D. 18 .3 Express 12
Fountain Valley Elem. S.D. 31 .4 2 .6 Fountain Valley 11Fullerton Elem. S.D. 18 .1 2 .4 Fullerton 21
Fullerton Union H.S.D. 27 .2 3 .5 Fullerton 8
Garden Grove Unified S.D. 102 .2 3 .2 Garden Grove 70
Huntington Beach City S.D. 13 .2 Huntington Beach 6
Huntington Beach Union HSD 3 .0 Huntington Beach 5Laguna Beach Unified S.D. 13 .5 Laguna Beach 5
La Habra City S.D. 11 .2 La Habra 11
Los Alamitos S.D. 3 .1 Los Alamitos 7
Magnolia S.D. 17 .3 2 .9 Anaheim 9
Ocean View Elem. S.D. 15 .1 Huntington Beachl9Orange Unified S.D. 24 .1 -- Orange 35
Placentia Unified 12 .1 1 .3 Placentia 16
San Joaquin Elem. S.D. 16 .3 East Irvine 8
Savanna S.D. 12 .4 Anaheim 6
Seal Beach Elem. S.D. _ - Seal Beach 2
Tustin Elem. S.D. 21 .2 Tustin 17
Tustin Union H.S.D. 6 .1 1 .4 Tustin 4
Westminster S.D. 52 .4 Westminster .22
Santa Ana Unified S.D. 52 .2 Santa Ana 32
Newport-Mesa Unified S.D. 31 .1 Newport Beach 37
1 CI S
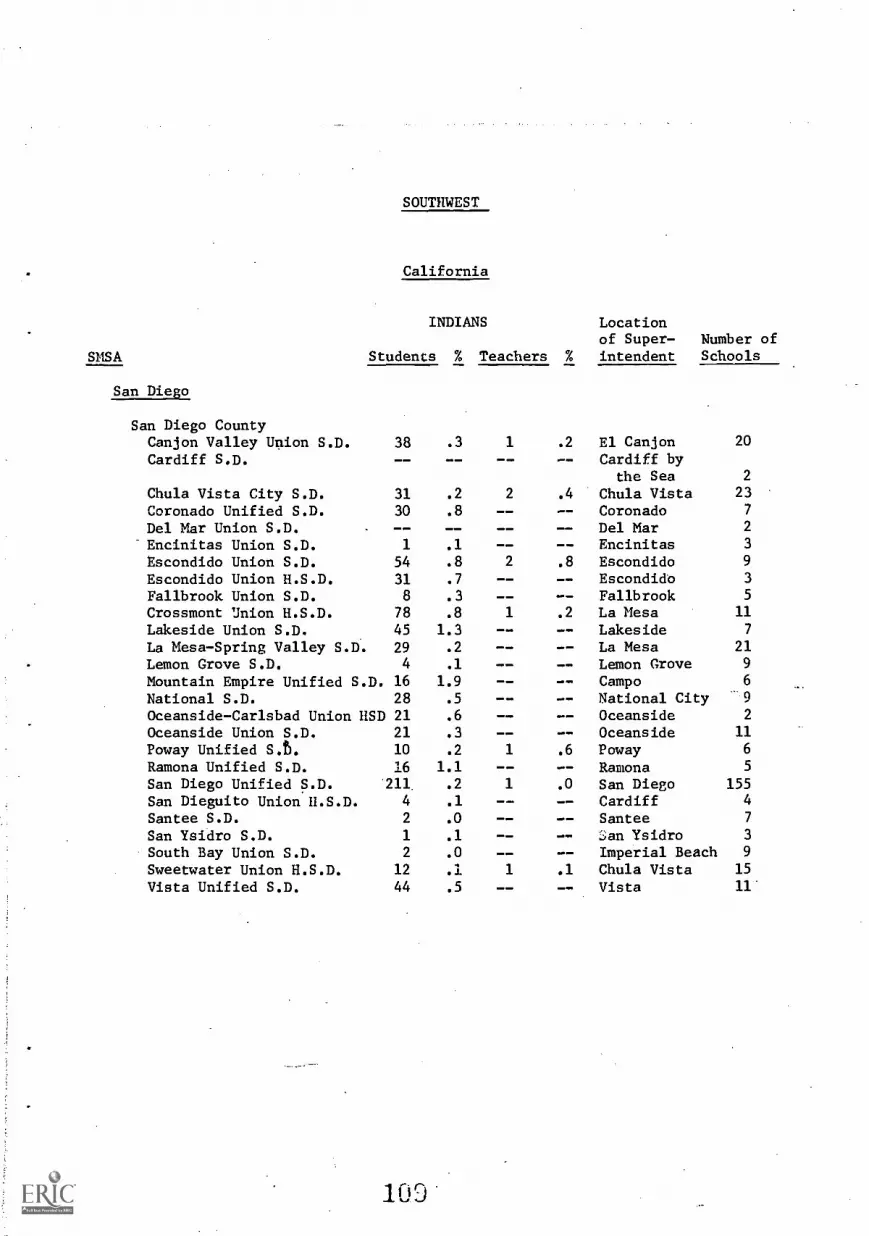
SOUTHWEST
California
INDIANS
SMSA Students % Teachers %
Locationof Super- Number ofintendent Schools
San Diego
San Diego CountyCanjon Valley Union S.D. 38 .3 1 .2 El Canjon 20
Cardiff S.D. Cardiff bythe Sea 2
Chula Vista City S.D. 31 .2 2 .4 Chula Vista 23
Coronado Unified S.D. 30 .8 -- Coronado 7
Del Mar Union S.D. -- -- Del Mar 2
Encinitas Union S.D. 1 .1 -- Encinitas 3
Escondido Union S.D. 54 .8 2 .8 Escondido 9
Escondido Union H.S.D. 31 .7 -- Escondido 3
Fallbrook Union S.D. 8 .3 -- -- Fallbrook 5
Crossmont Union H.S.D. 78 .8 1 .2 La Mesa 11
Lakeside Union S.D. 45 1.3 -- Lakeside 7
La Mesa-Spring Valley S.D. 29 .2 La Mesa 21
Lemon Grove S.D. 4 .1 -- Lemon Grove 9
Mountain Empire Unified S.D. 16 1.9 -- Campo 6
National S.D. 28 .5 National City 9
Oceanside-Carlsbad Union IISD 21 .6 -- Oceanside 2
Oceanside Union S.D. 21 .3 Oceanside 11
Poway Unified S.b. 10 .2 1 .6 Poway 6
Ramona Unified S.D. 16 1.1 Ramona 5
San Diego Unified S.D. 211. .2 1 .0 San Diego 155
San Dieguito Union H.S.D. 4 .1 Cardiff 4
Santee S.D. 2 .0 Santee 7
San Ysidro S.D. 1 .1 an Ysidro 3
South Bay Union S.D. 2 .0 Imperial Beach 9
Sweetwater Union H.S.D. 12 .1 1 .1 Chula Vista 15
Vista Unified S.D. 44 .5 -- Vista 11
109

SOUTHWEST
CaliforniaCalifornia
SMSA
INDIANS
Students % Teachers %
Locationof Super-intendent
Number ofSchools
Sacramento
Sacramento CountyDel Paso Heights Elem. 2 .1 Sacramento .5
Elk Grove Unified S.D. 49 .6 1 .3 Elk Grove 18
Folsom Cordova S.D. 22 '.2 3 .7 Folsom 22
Galt Jt. Union Elem. S.D. -- Galt 3
Grant Jt. Union H.S.D. 50 .4 1 .2 Sacramento 14
North Sacramento S.D. 43 .8 -- Sacramento 13
Rio Linda Union Elem. S.D. 36 .4 1 .3 Rio Linda 18
Robla S.D. 12 1.0 -- Sacramento 5
Sacramento City Unified SD 38 .1 -- Sacramento 77
San Juan Unified S.D. 91 .2 5 .3 Carmichael 77
Stockton
San Joaquin CountyLincoln Unified S.D. 1 .0 0 0 Stockton 7
Linden Unified S.D. 1 .0 1 1.4 Linden 7
Lodi Unified S.D. 22 .2 -- Lodi 27
Manteca Unified S.D. 4 .1 1 .4 Manteca 13
Ripon Unified S.D. -- -- 1 1.9 Ripon 5
Stockton Unified S.D. 67 .2 -- Stockton 43
Tracy Elem. S.D. 2 .1 =. -- Tracy 7
Escalon Unified S.D. 6 .3 0101m. Escalon 8
Fresno
Fresno CountyAmerican Uniot Elen. S.D. =ONO. Fresno 1
Central Union H.S. 17 1.3 Fresno 1
Clovis Unified S.D. 82 1.0 Clovis 12
Fowler Unified S.D. 3 .1 .1 Fowler 5
Fresno City Unified S.D. 140 .2 1 .0 Fresno 74
Kerman Union H.S. -- MO Wm Fresno 1
Kingsburg Jt. Union Elem. 3 .2 Kingsburg 3
Laton Unified S.D. - - Laton 3
McKinley-Roosevelt U.S.D. 6 .4 Fresno 3
Mendota Union Elem. S.D. 4 .3 Mendota 3
Kings Canyon Unified S.D. 42 .8 - - Reedley 17
Riverdale Jt. Union Elem. Riverdale 2
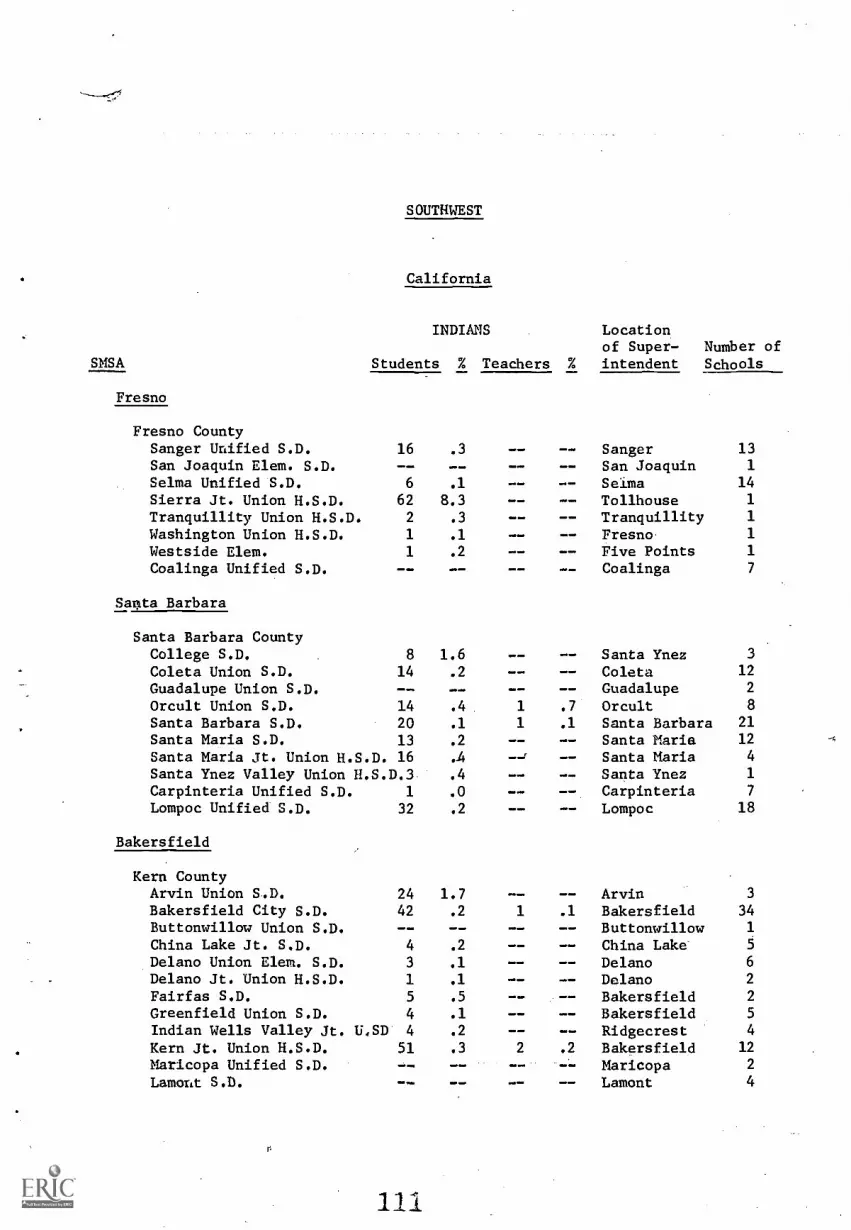
SOUTHWEST
California
SMSA
Fresno
INDIANS Locationof Super- Number of
Students % Teachers % intendent Schools
Fresno CountySanger Unified S.D. 16 .3
San Joaquin Elem. S.D. --Selma Unified S.D. 6 .1
Sierra Jt. Union H.S.D. 62 8.3Tranquillity Union H.S.D. 2 .3
Washington Union H.S.D. 1 .1
Westside Elem. 1 .2
Coalinga Unified S.D.
Santa Barbara
Santa Barbara CountyCollege S.D.Coleta Union S.D.Guadalupe Union S.D.Orcult Union S.D.Santa Barbara S.D.Santa Maria S.D.
8
14
142013
Santa Maria Jt. Union H.S.D. 16Santa Ynez Valley Union H.S.D.3Carpinteria Unified S.D. 1
Lompoc Unified S.D. 32
Bakersfield
SangerSan Joaquin
-- Selma-- Tollhouse-- Tranquillity- - Fresno- - Five Points-- Coalinga
131
1411117
1.6 -- -- Santa Ynez 3
.2 -- Coleta 12-- -- -- Guadalupe 2
. 4 , 1 .7 Orcult 8
.1 1 .1 Santa Barbara 21
.2 Santa Maria 12
.4 -= -- Santa Maria 4
.4 -- -- Santa Ynez 1
.0 -- Carpinteria 7
. 2 Lompoc 18
Kern CountyArvin Union S.D. 24 1.7Bakersfield City S.D. 42 .2
Buttonwillow Union S.D. --China Lake Jt. S.D. 4 .2
Delano Union Elem. S.D. 3 .1
Delano Jt. Union H.S.D. 1 .1
Fairfas S.D. 5 .5
Greenfield Union S.D. 4 .1
Indian Wells Valley Jt. U.SD 4
Kern Jt. Union H.S.D. 51Maricopa Unified S.D.Lamont S.D.
r.
111
.2
. 3
- -
-- Arvin1 .1 Bakersfield
Buttonwillow- - China Lake- - Delano- - Delano
Bakersfield-- Bakersfield
Ridgecrest2 .2 Bakersfield
MaricopaLamont
3
341
5
6
2
2
5
4
12
2
4
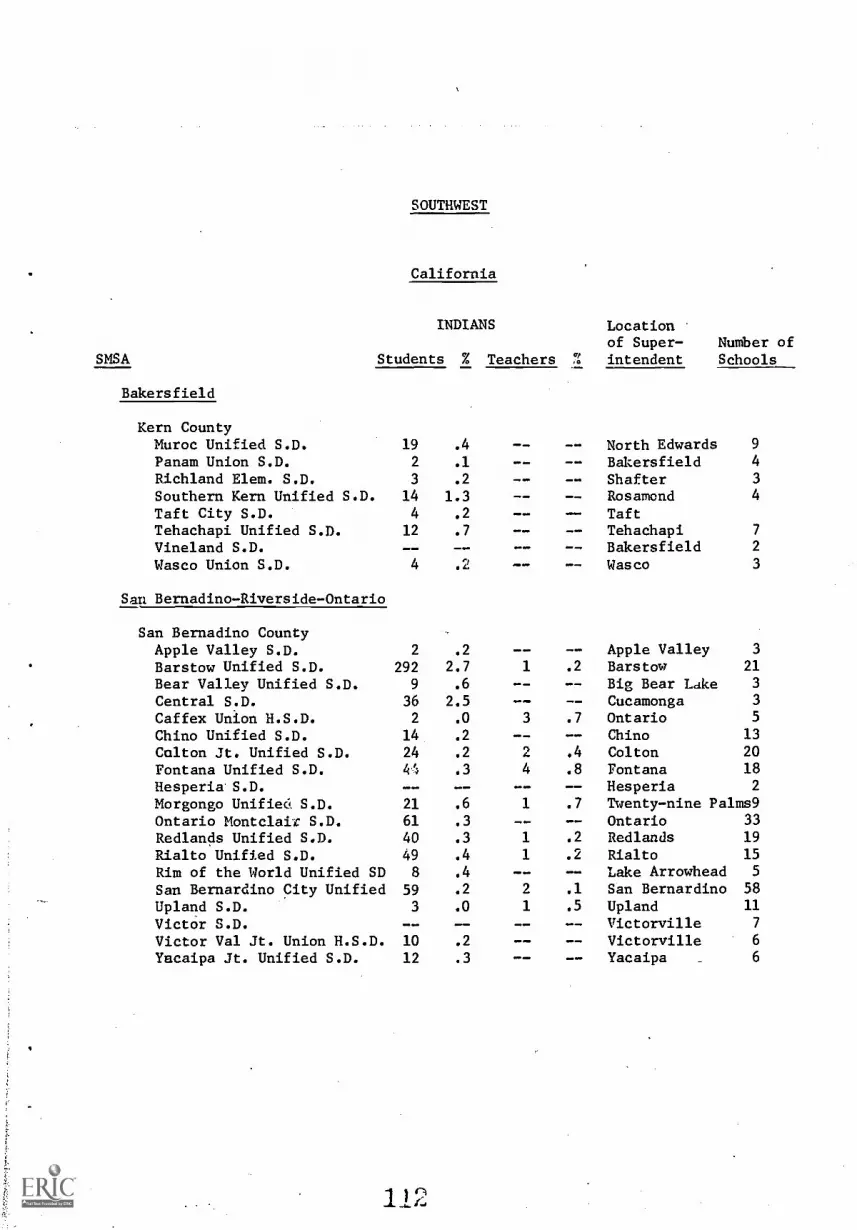
SMSA
Bakersfield
SOUTHWEST
California
INDIANS Locationof Super-
Students % Teachers % intendentNumber ofSchools
Kern CountyMuroc Unified S.D. 19 .4 -- North Edwards 9
Panam Union S.D. 2 .1 -- Bakersfield 4
Richland Elem. S.D. 3 .2 Shafter 3
Southern Kern Unified S.D. 14 1.3 -- Rosamond 4
Taft City S.D. 4 .2 -- TaftTehachapi Unified S.D. 12 .7 -- Tehachapi 7
Vineland S.D. -- Bakersfield 2
Wasco Union S.D. 4 .2 Wasco 3
San Bernadino-Riverside-Ontario
San Bernadino CountyApple Valley S.D. 2 .2 Apple Valley 3
Barstow Unified S.D. 292 2.7 1 .2 Barstow 21
Bear Valley Unified S.D. 9 .6 -- Big Bear Ldke 3
Central S.D. 36 2.5 -- Cucamonga 3
Caffex Union H.S.D. 2 .0 3 .7 Ontario 5
Chino Unified S.D. 14 .2 -- Chino 13
Colton Jt. Unified S.D. 24 .2 2 ,.. .4 Colton 20
Fontana Unified S.D. 44 .3 4 .8 Fontana 18
Hesperia S.D. -- -- -- Hesperia 2
Morgongo Unified. S.D. 21 .6 1 .7 Twenty-nine Palms9Ontario Montclair S.D. 61 .3 -- Ontario 33
Redlands Unified S.D. 40 .3 1 .2 Redlands 19
Rialto Unified S.D. 49 .4 1 .2 Rialto 15
Rim of the World Unified SD 8 .4 -- Lake Arrowhead 5
San Bernardino City Unified 59 .2 2 .1 San Bernardino 58
Upland S.D. 3 .0 1 .5 Upland 11
Victor S.D. -- Victorville 7
Victor Val Jt. Union H.S.D. 10 .2 -- Victorville 6
Yacaipa Jt. Unified S.D. 12 .3 -- -- Yacaipa _ 6
112
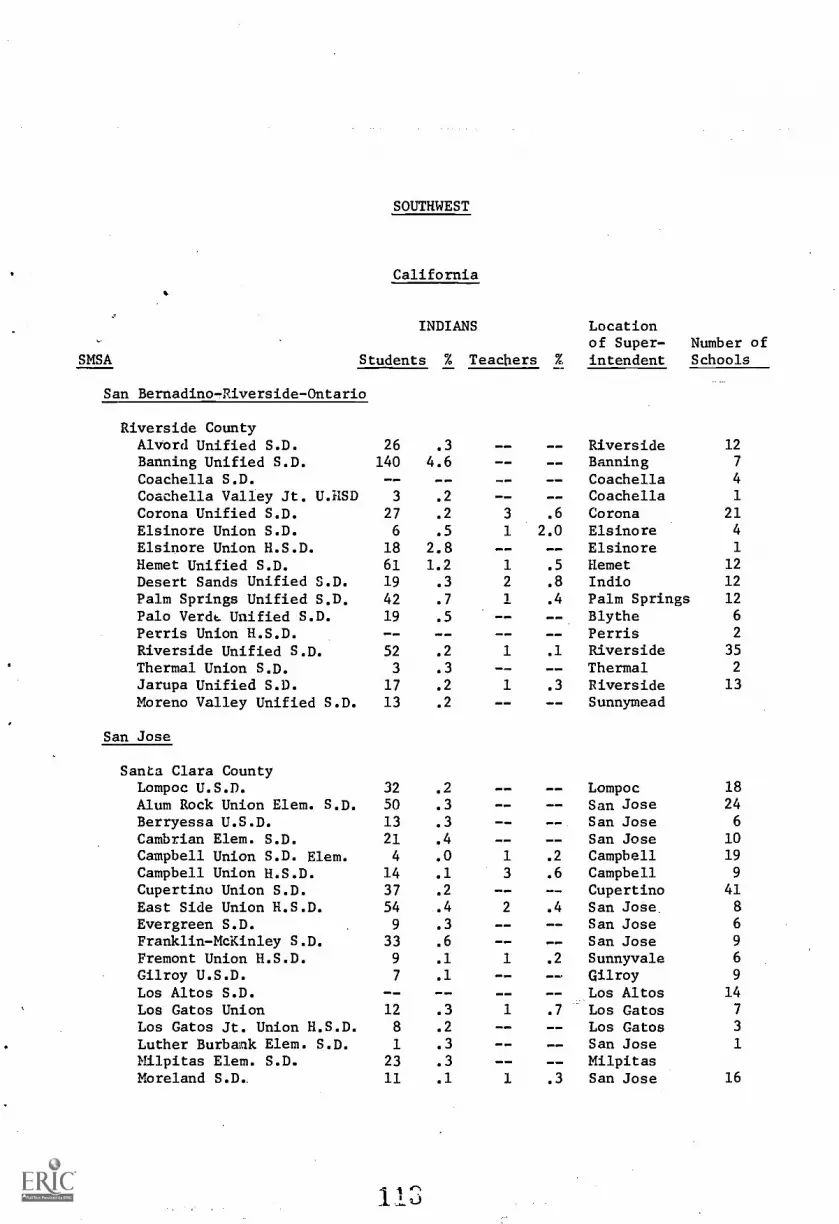
SOUTHWEST
California
SMSA
INDIANS
Students % Teachers %
Locationof Super-intendent
Number ofSchools
San Bernadino-Riverside-Ontario
Riverside CountyAlvord Unified S.D. 26 .3 Riverside 12
Banning Unified S.D. 140 4.6 Banning 7
Coachella S.D. -- Coachella 4
Coachella Valley Jt. U.RSD 3 .2 Coachella 1
Corona Unified S.D. 27 .2 3 .6 Corona 21
Elsinore Union S.D. 6 .5 1 2.0 Elsinore 4
Elsinore Union H.S.D. 18 2.8 -- -- Elsinore 1
Hemet Unified S.D. 61 1.2 1 .5 Hemet 12
Desert Sands Unified S.D. 19 .3 2 .8 Indio 12
Palm Springs Unified S.D. 42 .7 1 .4 Palm Springs 12
Palo VerdL Unified S.D. 19 .5 Blythe 6
Perris Union H.S.D. -- -- Perris 2
Riverside Unified S.D. 52 .2 1 .1 Riverside 35
Thermal Union S.D. 3 .3 -- -- Thermal 2
Jarupa Unified S.D. 17 .2 1 .3 Riverside 13
Moreno Valley Unified S.D. 13 .2 -- Sunnymead
San Jose
Santa Clara CountyLompoc U.S.D. 32 .2 Lompoc 18
Alum Rock Union Elem. S.D. 50 .3 San Jose 24
Berryessa U.S.D. 13 .3 San Jose 6
Cambrian Elem. S.D. 21 .4 San Jose 10
Campbell Union S.D. Elem. 4 .0 .2 Campbell 19
Campbell Union H.S.D. 14 .1 .6 Campbell 9
Cupertino Union S.D. 37 .2 Cupertino 41
East Side Union H.S.D. 54 .4 2 .4 San Jose 8
Evergreen S.D. 9 .3 - - San Jose 6
Franklin-McKinley S.D. 33 .6 San Jose 9
Fremont Union H.S.D. 9 .1 1 .2 Sunnyvale 6
Gilroy U.S.D. 7 .1 Gilroy 9
Los Altos S.D. -- -- Los Altos 14
Los Gatos Union 12 .3 1 .7 Los Gatos 7
Los Gatos Jt. Union H.S.D. 8 .2 Los Gatos 3
Luther Burbank Elem. S.D. 1 .3 San Jose 1
Milpitas Elem. S.D. 23 .3 MilpitasMoreland S.D. 11 .1 1 .3 San Jose 16
iv 3
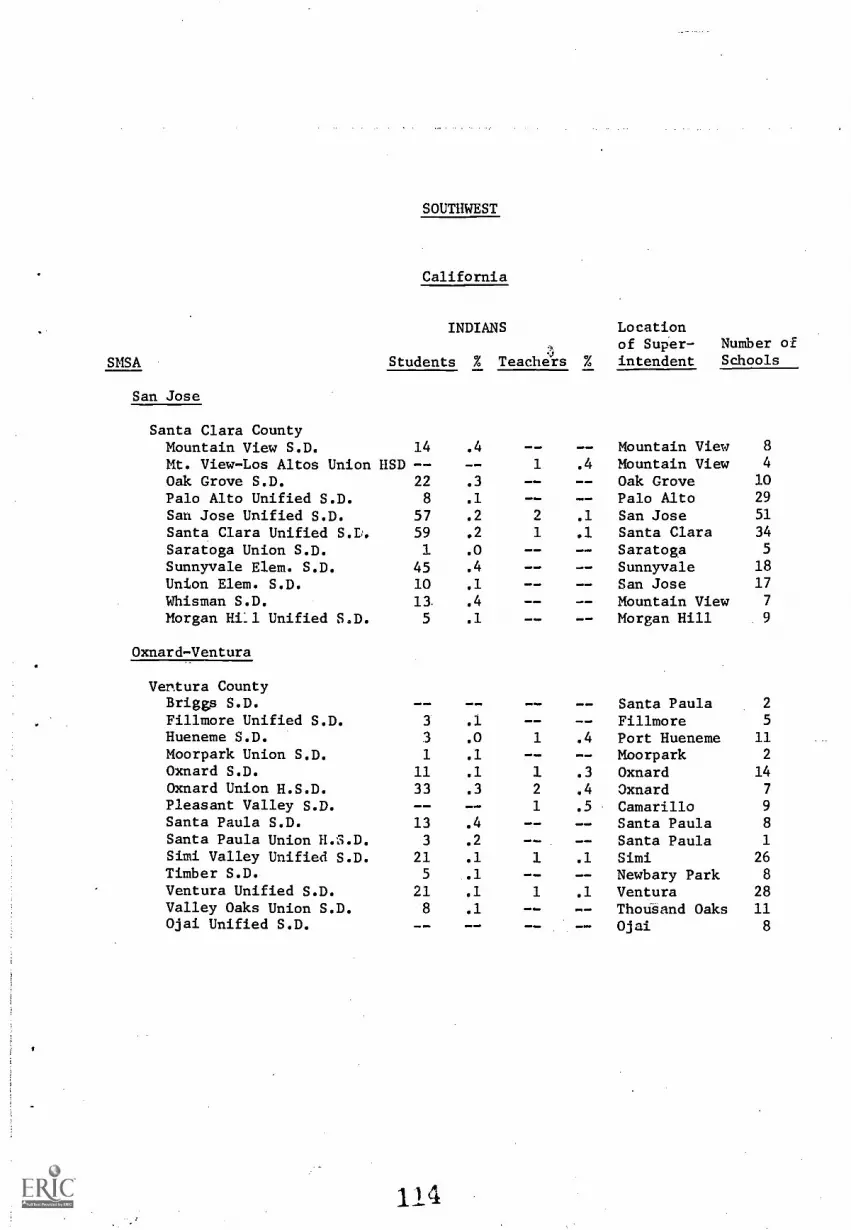
SOUTHWEST
California
INDIANS
SMSA Students % Teachers %
Locationof Super- Number ofintendent Schools
San Jose
Santa Clara CountyMountain View S.D. 14 .4 -- Mountain View 8
Mt. View-Los Altos Union IISD -- 1 .4 Mountain View 4
Oak Grove S.D. 22 .3 -- -- Oak Grove 10
Palo Alto Unified S.D. 8 .1 -- -- Palo Alto 29
Sari Jose Unified S.D. 57 .2 2 .1 San Jose 51
Santa Clara Unified S.D. 59 .2 1 .1 Santa Clara 34
Saratoga Union S.D. 1 .0 -- -- Saratoga 5
Sunnyvale Elem. S.D. 45 .4 -- -- Sunnyvale 18
Union Elem. S.D. 10 .1 -- San Jose 17
Whisman S.D. 13. .4 -- Mountain View 7
Morgan HiLl Unified S.D. 5 .1 -- -- Morgan Hill 9
Oxnard-Ventura
Ventura CountyBriggs S.D. -- -- -- Santa Paula 2
Fillmore Unified S.D. 3 .1 -- -- Fillmore 5
Hueneme S.D. 3 .0 1 .4 Port Hueneme 11
Moorpark Union S.D. 1 .1 -- -- Moorpark 2
Oxnard S.D. 11 .1 1 .3 Oxnard 14
Oxnard Union H.S.D. 33 .3 2 .4 Oxnard 7
Pleasant Valley S.D. -- -- 1 .5 Camarillo 9
Santa Paula S.D. 13 .4 -- Santa Paula 8
Santa Paula Union H.S.D. 3 .2 -- Santa Paula 1
Simi Valley Unified S.D. 21 .1 1 .1 Simi 26Timber S.D. 5 .1 -- -- Newbary Park 8
Ventura Unified S.D. 21 .1 1 .1 Ventura 28Valley Oaks Union S.D. 8 .1 -- -- Thousand Oaks 11Ojai Unified S.D. -- -- Ojai 8
1!4

SOUTHWEST
Colorado
INDIANS
SMSA Students % Teachers %
Locationof Super- Number ofintendent Schools
Colorado Springs
El Paso CountyColorado Springs S.D. 411 48 .2 Colorado Springs42El Paso Cc. S.D. #8 FountainHarrison S.D. #2 9 .2 Colorado Springs 6Lewis Palmer Cons. D. #38 -- Monament 2
Manitoc Springs S.D. #14 2 .2 Manitoc Springs 4
Air Academy S.D. #20 2 .1 USAF Academy 7
Widefield S.D. #3 7 .1 1 .4 Security 9
Pueblo
Pueblo CountyPueblo S.D. #60 18 .1 Pueblo 43
Pueblo S.D. #70 7 .2 Pueblo 15
115

SMSA
Albuquerque
SOUTHWEST
New Mexico
INDIANS
Students % Teachers %
Locatic.n
of SupeL- Number ofintendent Schools
Bernalillo CountyAlbuquerque Pub. S. S.
Denver
1704 2.1
Colorado
16 .6 Albuquerque 111
Adams CountyAdams Co. S.D. #14 36 .4 Commerce City 12
Brighton P.S. -- -- - Brighton 9
Mapleton P,S.D. #1 2 .0 Denver 12
Westminster S.D.#50 26 .2 2 .3 Westminster 25Eastlake S.D. #50 21 .2 1 .2 Denver 18
Arapahoe CountyCherry Creek Schools 2 .0 -- Englewood 11
Englewood S.D. #1 28 .4 -- -- Englewood 12
Arapahoe Co. S.D. 416 26 .2 -- -- Littleton 18Sheridan S.D. #2 11 .5 -- -- Ft. Logan 6
Adams-Arapahoe S.D.#28J 34 .2 2 .3 Aurora 26
Jefferson CountyJefferson Co. S.D. R-1 77 .1 2 .1 Lakewood 111
Boulder CountySt. Vrain Valley P.S.DRE-1J 18 .2 LongmontBoulder Valley S.D. RE2J 28 .1 1 .1 Boulder 41
Denver CountyDenver City & Co. S.D. 273 .3 4 .1 Denver 116
1iE
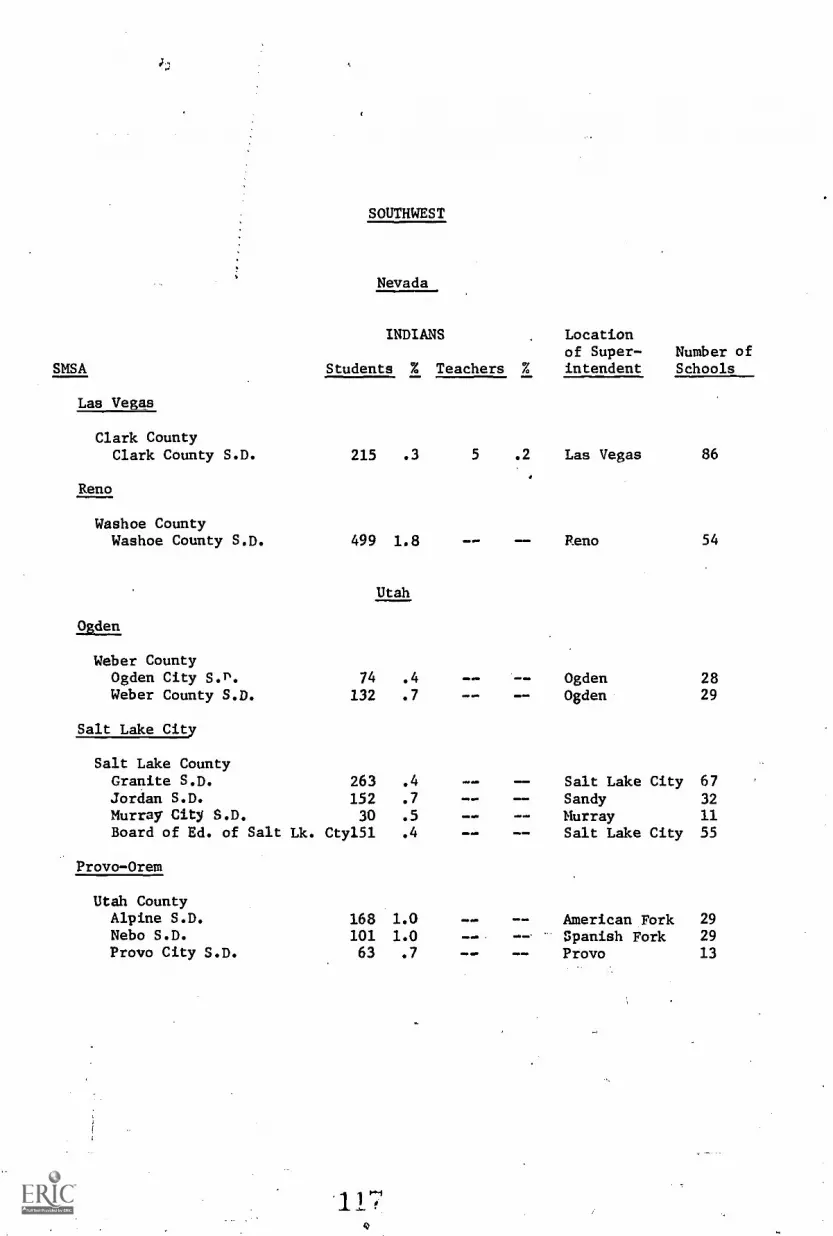
SOUTHWEST
Nevada
INDIANS Locationof Super- Number of
SMSA Students % Teachers % intendent Schools
Las Vegas
Clark CountyClark County S.D. 215 .3 5 .2 Las Vegas 86
Reno
Washoe CountyWashoe County S.D. 499 1.8 Reno 54
Utah
Ogden
Weber CountyOgden City S.P. 74 .4 Ogden 28Weber County S.D. 132 .7 Ogden 29
Salt Lake City
Salt Lake CountyGranite S.D. 263 .4 Salt Lake City 67Jordan S.D. 152 .7 00 Sandy 32Murray City S.D. 30 .5 Murray 11Board of Ed. of Salt Lk. Cty151 .4 Salt Lake City 55
Provo-Orem
Utah CountyAlpine S.D. 168 1.0 -- American Fork 29Nebo S.D. 101 1.0 Spanish Fork 29Provo City S.D. 63 .7 Provo 13
11.1

APPENDIX F
NORTHWEST STATES
IdahoMontanaOregonWashingtonWyoming
118
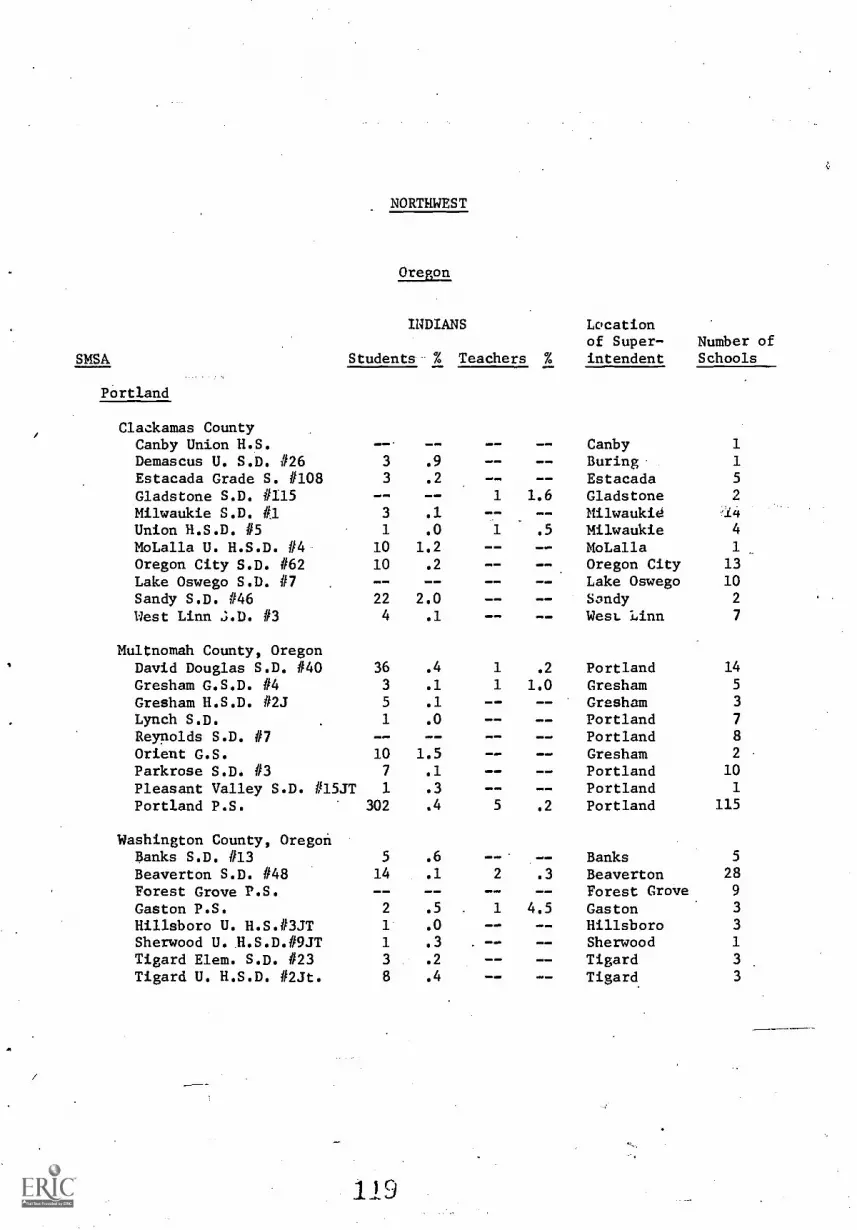
SMSA
NORTHWEST
Oregon
INDIANS Locationof Super- Number of
Students-. % Teachers % intendent Schools
Portland
Clackamas CountyCanby Union H.S. Canby 1
Damascus U. S.D. #26 3 .9 Buring 1
Estacada Grade S. #108 3 .2 :WOO Estacada 5
Gladstone S.D. #115 1 1.6 Gladstone 2
Milwaukie S.D. 4 #1 3 .1 Milwaukie '14
Union H.S.D. #5 1 .0 1 .5 Milwaukie 4
MoLalla U. H.S.D. #4 10 1.2 MoLalla 1
Oregon City S.D. #62 10 .2 - - Oregon City 13
Lake Oswego S.D. #7 - - - - Lake Oswego 10
Sandy S.D. #46 22 2.0 - - - - Sandy 2
West Linn 3.D. #3 4 .1 West Linn 7
Multnomah County, OregonDavid Douglas S.D. #40 36 .4 1 .2 Portland 14
Gresham G.S.D. #4 3 .1 1 1.0 Gresham 5
Gresham H.S.D. #2J 5 .1 -- Gresham 3
Lynch S.D. 1 .0 -- -- Portland 7
Reynolds S.D. #7 -- -- -- Portland 8
Orient G.S. 10 1.5 -- -- Gresham 2
Parkrose S.D. #3 7 .1 -- -- Portland 10
Pleasant Valley S.D. #15JT 1 .3 -- Portland 1
Portland P.S. 302 .4 5 .2 Portland 115
Washington County, OregonBanks S.D. #13 5 .6 Banks 5
Beaverton S.D. #48 14 .1 2 .3 Beaverton 28
Forest Grove P.S. Forest Grove 9
Gaston P.S. 2 .5 1 4.5 Gaston 3
Hillsboro U. H.S.#3JT 1 .0 Hillsboro 3
Sherwood U. H.S.D.#9JT 1 .3 Sherwood 1
Tigard Elem. S.D. #23 3 .2 Tigard 3
Tigard U. H.S.D. #2Jt. 8 .4 Tigard. 3
199
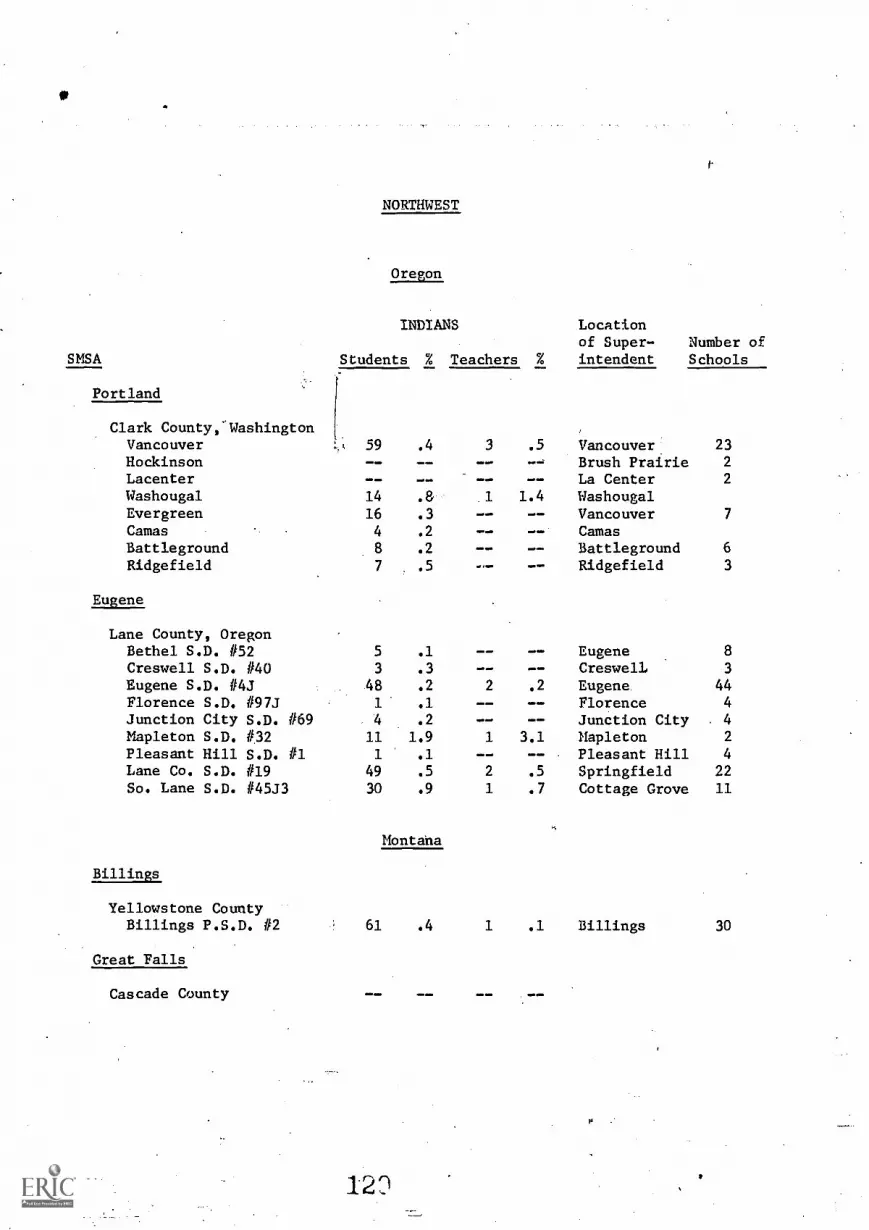
V
SMSA
r
NORTHWEST
Oregon
INDIANS Locationof Super- Number of
Students % Teachers % intendent Schools
Portland
Clark County,WashingtonVancouver lo 59 .4 3 .5 Vancouver 23
Hockinson Brush Prairie 2
Lacenter La Center 2
Washougal 14 .8. 1.4 WashougalEvergreen 16 .3 - - Vancouver 7
Camas 4 .2 CamasBattleground 8 .2 1 Battleground 6
Ridgefield 7 .5 Ridgefield 3
Eugene
Lane County, OregonBethel S.D. #52 5 .1 -- Eugene 8
Creswell S.D. #40 3 .3 1 -- Creswell 3
Eugene S.D. #4J 48 .2 2 .2 Eugene 44Florence S.D. 1/97J 1 .1 .1 Florence 4
Junction City S.D. #69 4 .2 -- Junction City 4
Mapleton S.D. #32 11 1.9 1 3.1 Mapleton 2
Pleasant Hill S.D. #1 1 .1 m -- Pleasant Hill 4
Lane Co. S.D. #19 49 .5 2 .5 Springfield 22
So. Lane S.D. 1/45J3 30 .9 1 .7 Cottage Grove 11
Montana
Billings
Yellowstone CountyBillings P.S.D. #2 61 .4 1 .1 Billings 30
Great Falls
Cascade County
12 r,)
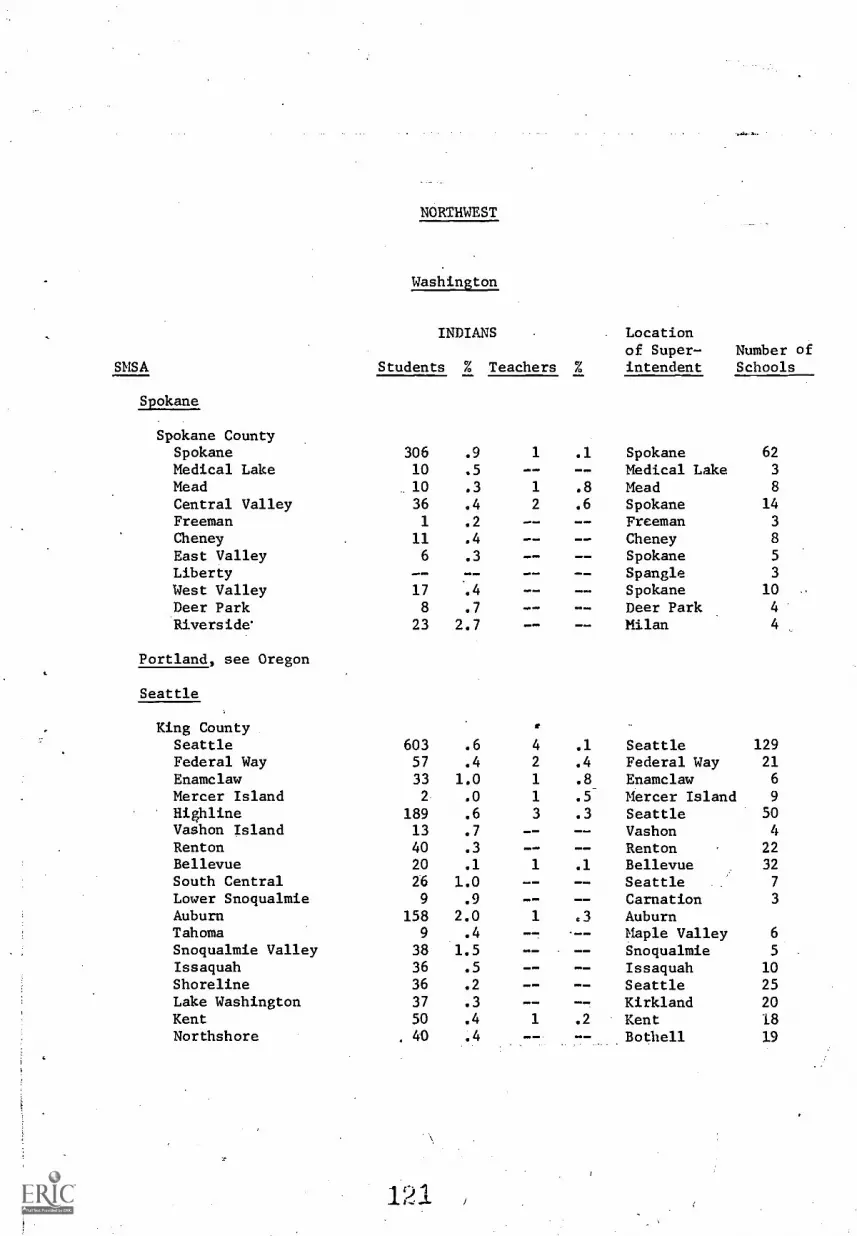
SMSA
Spokane
NORTHWEST
Washington
INDIANS Locationof Super- Number of
Students % Teachers % intendent Schools
Spokane CountySpokane 306 .9 1 .1 Spokane 62
Medical Lake 10 .5 Medical Lake 3
Mead 10 .3 1 .8 Mead 8
Central Valley 36 .4 2 .6 Spokane 14
Freeman 1 .2 - - Freeman 3
Cheney 11 .4 .111= Cheney 8
East Valley 6 .3 Spokane 5
Liberty .11 Spangle 3
West Valley 17 Spokane 10
Deer Park 8 .7 Deer Park 4
Riverside' 23 2.7 Milan 4
Portland, see Oregon
Seattle
fKing CountySeattle 603 .6 4 .1 Seattle 129Federal Way 57 .4 2 .4 Federal Way 21Enamclaw 33 1.0 1 .8 Enamclaw 6
Mercer Island 2 .0 1 .5 Mercer Island 9
Hihline 189 .6 3 .3 Seattle 50Vashon Island 13 .7 -- Vashon 4
Renton 40 .3 ..... Renton 22Bellevue 20 .1 1 .1 Bellevue 32
South Central 26 1.0 Seattle 7
Lower Snoqualmie 9 .9 -- Carnation 3
Auburn 158 2.0 1 .1 AuburnTahoma 9 .4 Maple Valley 6
Snoqualmie Valley 38 1.5 -- Snoqualmie 5
Issaquah 36 .5 -- Issaquah 10Shoreline 36 .2 -- Seattle 25Lake Washington 37 .3 -- Kirkland 20Kent 50 .4 1 .2 Kent 18Northshore , 40 .4 _- Bothell 19
121
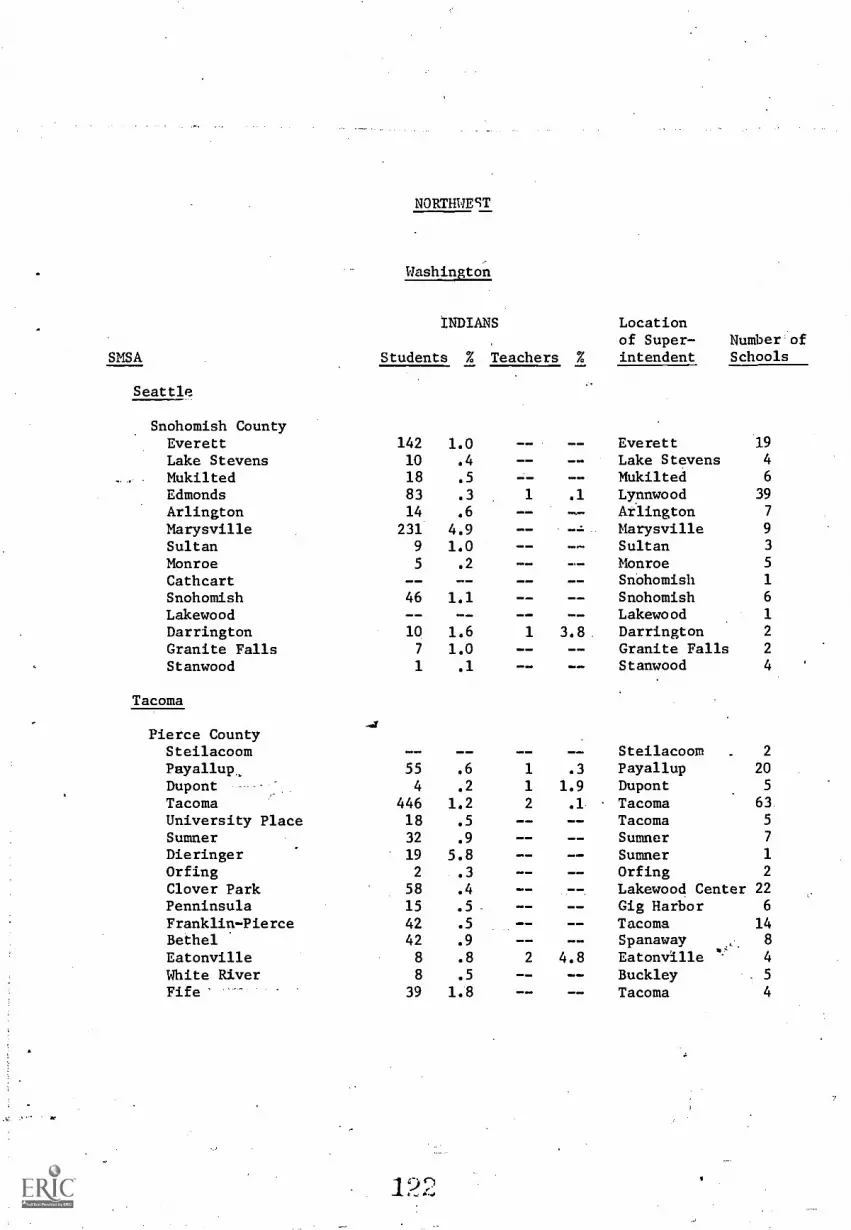
SMSA
Seattle
NORTHWEST
Washington
INDIANS Locationof Super-
Students % Teachers % intendentNumber'ofSchools
Snohomish CountyEverett 142 1.0 Everett 19
Lake Stevens 10 .4 Lake Stevens 4
Mukilted 18 .5 Mukilted 6
Edmonds 83 .3 .1 Lynnwood 39
Arlington 14 .6 Arlington 7
Marysville 231 4.9 - Marysville 9
Sultan 9 1.0 Sultan 3
Monroe 5 .2 Monroe 5
Cathcart Snohomish 1
Snohomish 46 1.1 Snohomish 6
Lakewood Lakewood 1
Darrington 10 1.6 1 3.8 Darrington 2
Granite Falls 7 1.0 Granite Falls 2
Stanwood 1 .1 Stanwood 4
Tacoma
Pierce CountySteilacoom Steilacoom 2
Payallup,, 55 .6 1 .3 Payallup 20
Dupont 4 .2 1 1.9 Dupont 5
Tacoma 446 1.2 2 .1 Tacoma 63
University Place 18 .5 Tacoma 5
Sumner 32 .9 Sumner 7
Dieringer 19 5.8 Sumner 1
Orfing 2 .3 Orfing 2
Clover Park 58 .4 Lakewood Center 22Penninsula 15 .5- Gig Harbor 6
Franklin-Pierce 42 .5 Tacoma 14Bethel 42 .9 WOO. Spanaway 8
Eatonville 8 .8 2 4.8 Eatonville 4
White River 8 .5 Buckley 5Fife 39 1.8 Tacoma 4


![[]MOEEEEEEIBIIE EEEEMhhEMhhEEE mEDBDBomEohhhI 'HEW](https://static.cupdf.com/doc/110x72/6230a28aec3e0f2f972e9688/moeeeeeeibiie-eeeemhhemhheee-medbdbomeohhhi-hew.jpg)