


Politicas macroeconomicas, handout, Miguel Lebre de Freitas ([email protected])
https://mlebredefreitas.wordpress.com , 10/06/2018 1
National Accounts
Index:
National Accounts..........................................................................................................1
1.1 Introduction........................................................................................3
1.2 Basic concepts....................................................................................3
1.3 Expenditure, production and income .................................................4
1.3.1 Gross National Expenditure (Final Domestic Demand) ............................4
1.3.2 Gross Domestic Product ............................................................................5
1.3.3 Gross National Income ..............................................................................6
Box 1: Three approaches to measure economic activity........................................8
1.4 The Current Account........................................................................10
1.4.1 From National Income to Disposable Income .........................................10
1.4.2 The Current Account................................................................................10
1.4.3 Savings and investment............................................................................11
1.5 The Balance of payments.................................................................12
1.5.1 The Capital Account ................................................................................13
1.5.2 The Financial Account.............................................................................14
1.5.3 The three components of the balance of payments ..................................14
1.5.4 The Balance of payments identity............................................................15
1.5.5 Net errors and omissions..........................................................................15
1.6 The Net International Investment Position ......................................16
1.6.1 Changes in NIIP.......................................................................................16
Box 2: The Net International Financial Position in Portugal...............................17
1.6.2 Reserve Asset Transactions .....................................................................18
1.6.3 The analytical presentation of the Balance of Payments .........................19
Box 3 – The Balance of Payments of Angola......................................................20
1.7 Budget constraints of institutional units ..........................................21
1.7.1 Non-Financial Private sector....................................................................21
1.7.2 Government..............................................................................................23
1.7.3 Central bank .............................................................................................24
Politicas macroeconomicas, handout, Miguel Lebre de Freitas ([email protected])
https://mlebredefreitas.wordpress.com , 10/06/2018 2
1.7.4 Commercial banks ...................................................................................25
1.7.5 Consolidated monetary sector..................................................................27
1.8 Aggregate relations ..........................................................................27
1.8.1 National wealth ........................................................................................27
1.8.2 National savings.......................................................................................28
Box 4: Savings and investment by institutional sector in Portugal .....................29
1.8.3 A consistency tool: the flow of funds map ..............................................31
1.8.4 Changes in national wealth ......................................................................32
Further reading.............................................................................................33
Politicas macroeconomicas, handout, Miguel Lebre de Freitas ([email protected])
https://mlebredefreitas.wordpress.com , 10/06/2018 3
1.1 Introduction
The National Accounts system registers the economic activities in a country’ based on
a standardized accounting system. Economic variables, such as incomes, expenditures,
deficits and surpluses, are recorded in national income accounting. The national accounts
play therefore a central role in macroeconomic analysis. In this note, we introduce the main
variables, aggregates, and accounting identities, in order to frame our discussion in a single
notational setup.
1.2 Basic concepts
Flows versus stocks - Flows are variables that are measured along a period of time.
Stocks variables are measured in a moment in time. Changes of stocks are flows. For
instance, deficit is a flow, debt is a stock, a debt increase is a flow.
Gross Domestic Product - is the main aggregate in National Accounts. It measures the
total production taking place within a country’ borders (geographical criterion). It is a
flow variable, so it is defined over a time interval (usually, a quarter or a year).
The geographical criterion versus the residence criterion - Some national account
aggregates refer to an economy defined by its geographical borders, while some
others refer to an economy defined by its resident units. Aggregates referring to a
geographical area are labelled as “Domestic”; aggregates referring to an economy’
resident units are labelled as “National”.
Resident and non-resident units: A unit is considered resident when it engages for an
extended period of time (one year or more) in economic activities on this territory.
The resident institutional sectors include households, non-financial corporations,
financial corporations, and the general government. Citizenship is not the criterion for
residence. Resident units engage in transactions with non-resident units (that is, units
which are resident in other economies). These transactions are the external
transactions of the economy and are grouped in the “rest of the world” account. This
account is similar to that of resident institutional sectors, but with the point of view
being that of the rest of the world.
Politicas macroeconomicas, handout, Miguel Lebre de Freitas ([email protected])
https://mlebredefreitas.wordpress.com , 10/06/2018 4
Gross versus Net - Fixed capital (machines, buildings, transport equipment)
depreciates over time. In the national accounts, the estimated wear and tear of
produced means of production is labelled “depreciation” or “consumption of physical
Capital”. When depreciation is subtracted to an aggregate, the later is labelled as
“net”. Aggregates labelled as “Gross” are “inclusive of depreciation”.
Transactions with and without counterparts: Transactions involving two agents are of
two kinds: ‘something for something’, or ‘something for nothing’. The first type
includes the provision of goods, services or assets in return for a counterpart, e.g.
money. The second type includes the provision of cash, assets, goods and services
without counterpart. The later are called “transfers” and include, for instance,
unemployment benefits, investment grants, and personal donations. The National
Accounts distinguish two types of transfers: transfers of capital, when there is a
transfer of ownership of an asset other than currency; and current transfers, that
correspond to transfers in the form of money. The former are accounted for in the
capital account, while the later are accounted for in the current account.
1.3 Expenditure, production and income
1.3.1 Gross National Expenditure (Final Domestic Demand)
The national spending in final goods and services by resident institutional sectors
(government, households and corporations) is usually known as “Absorption”. In National
Accounts it is measured by the Gross National Expenditure. It is defined as1:
GICA (1)
where C denotes for Private Consumption, I for Gross investment, and G for Government
Consumption.
1 In this note, all variables are defined in nominal terms.
Politicas macroeconomicas, handout, Miguel Lebre de Freitas ([email protected])
https://mlebredefreitas.wordpress.com , 10/06/2018 5
Private Consumption are expenditures by the private sector on final goods, including
durable and nondurable goods, and services.
Government Consumption refers to purchases of goods and services by the
government and compensations of public sector workers. G does not include any transfer
payments, such as unemployment benefits and family allowances, because these do not
correspond to payments for goods or services.
Gross Investment consists in additions to the stock of capital by resident units.
Investment has two main components: The first is the acquisition of fixed assets (that are
used in production over more than one year). These, in turn, can be tangible assets, such as
buildings, equipment, and vehicles; or intangible assets such as R&D. The second component
of investment is the net increases in inventories2. Thus,
InvGFCFI
The Investment aggregate is labelled as “gross” because it refers to the total
expenditure in new capital, regardless as to whether it is destined to increase the productive
capacity or just to replace the depreciation of existing equipment. Subtracting depreciation
from Gross Investment, one obtains the Net Investment. Since the depreciation of physical
capital is hard to measure, a common procedure is to assume that it corresponds to some
proportion of the capital stock. In that case, the net investment, which measures the change
in the capital stock, K, becomes
qKIKq .
In this expression, the term q is the relative price of capital, that is, how many units of
output are necessary to acquire one unit of physical capital. Subtracting depreciation from
GNE, we obtain the Net National Expenditure.
1.3.2 Gross Domestic Product
2 Note that investment does not include the acquisition of existing real assets nor of financial assets. Investment refers to expenditures that increase a country’ productive capacity, only.
Politicas macroeconomicas, handout, Miguel Lebre de Freitas ([email protected])
https://mlebredefreitas.wordpress.com , 10/06/2018 6
GNE measures the total purchases of goods and services by home entities,
irrespectively as to whether these goods and services are produced internally or imported.
Because some spending by resident units involves goods and services that are produced
outside the country borders, spending and production by resident units are not, in general,
equal.
To compute a country’ production, we first need to subtract from Absorption the
domestic expenditure in goods and services that are produced abroad (imports). Then, we add
the value of domestic production sold abroad (exports). The value of domestic production,
GDP at market prices, is therefore:
TBGICQ (2)
Where TB refers to the sum of two balances: the Balance of Trade in Goods
(merchandise trade) and the Balance of Trade in Services (invisibles, such as transport and
travel, insurance, and royalties). The TB (Balance of Goods and Services) does not
distinguish weather imported and exported goods and services are destined for investment or
for consumption purposes. Whenever spending by residents (absorption) exceeds domestic
production (GDP), the TB is negative.
GDP measures the market value of all final goods and services produced within a
country’ geographical borders in a given period of time, and is the key measure of an
economy’ production. Equation (2) describes the measurement of a country GDP using the
expenditure approach. Since the expenditure in goods and services is determined at the
purchaser’s prices, GDP is defined at “market prices”, that is, inclusive of all taxes.
1.3.3 Gross National Income
Gross Domestic Product (GDP) is concerned with where production is taking place. It
therefore looks at a country as defined by its geographical borders. In doing so, it treats the
production achieved by non-residents within the country borders the same way as it treats
production by residents.
A different approach is to look at who generated the income. The income approach
measures the production achieved by residents only, regardless as to whether it was generated
inside or outside country borders. For instance, the profits generated by a foreign company
Politicas macroeconomicas, handout, Miguel Lebre de Freitas ([email protected])
https://mlebredefreitas.wordpress.com , 10/06/2018 7
inside country borders correspond to domestic production, but not to production by resident
units.
In the National Accounts, adjustments from the country border criterion (Domestic) to
the factor residence criterion (National) are mediated by an item in the Current Account,
labelled “Primary Income Account”. The meaning of a primary income is that it is generated
completely in the production process.
The Primary Income Account registers the cross-border payments to factors of
production, the return to financial assets, and the rent of natural resources. Exports of primary
income include, for instance, wages paid by non-resident companies to workers residing in
the home country3. Reciprocally, the interest payments on external debt correspond to value
generated inside a country’ border by a factor owned by non-residents, and hence shall be
subtracted from GDP when the aim is to measure total income generated by resident units.
In the following, let’s use the label NFIA (Net Factor Incomes from Abroad, NFIA)
for the balance of Primary Income, that is, the difference between the value of factor services
exported minus the value of factor services imported. The Gross National Income (GNI) is
therefore computed as follows:
NFIATBGICGNI (3)
GNI (at market prices) measures the total income earned (or production by) by factors
owned by domestic resident units, irrespectively as to whether such income was generated
inside or outside the country borders. GNI looks at the ownership of production, rather than
to its location.
3 NFIA does not include migrant remittances because, by definition, migrants are residents in the host country. Hence, migrants contribute to both the domestic and the national income of the country where they reside.
Politicas macroeconomicas, handout, Miguel Lebre de Freitas ([email protected])
https://mlebredefreitas.wordpress.com , 10/06/2018 8
Box 1: Three approaches to measure economic activity
There are three main approaches to measure a country’ economic activity:
The first is the Production Approach. This consists in summing the value added of all
activities which produce goods and services (intermediate and final) on the territory of the
economy. A firm’ value added measures the value generated by its production and is
computed as the difference between the value of output and the acquisitions of all
intermediate goods and services consumed as inputs in the production process.
The value added approach avoids double counting by focusing on the contribution of
each firm to the economy’ production, regardless its stage in the production process (i.e, it
measures the contribution of the cheese-maker by the difference between sales of cheese and
purchases of milk and other inputs used in the production of cheese). The sum of all value
added generated by all firms in a given territory deliver the Gross Domestic Product at
production prices. To obtain the GDP at market prices, one must add indirect taxes and
subtract subsidies on products.
The second is the Final Expenditure Approach, This consists in summing the value of
all final expenditures made in either consuming the final output of the economy, or in
investment, plus exports less imports of goods and services. Purchases of intermediate goods
(e.g, the purchase of milk by a factory to produce cheese) are excluded, to avoid double
counting (the output value of the final good “cheese” already reflects the cost of the
intermediate input “milk”).
To see the relationship between the Production Approach and the Expenditure
approach, let’s start out with an equation stating that the value of output (total supply of
goods and services) must equal its total use (intermediate consumption, investment and final
consumption at home and abroad:
TBGCIConsIntTOutput i . .
Politicas macroeconomicas, handout, Miguel Lebre de Freitas ([email protected])
https://mlebredefreitas.wordpress.com , 10/06/2018 9
In this equation, the item iT denotes for Indirect taxes minus subsidies4. This term is
necessary to mediate the value paid by the buyer (which is tax inclusive) and the value
received by the producer (without taxes). The difference between output and intermediate
consumption is Gross Value Added at basic prices:
ConsIntOutputGVA . .
Using equation (2) we see that iTGVAGDP . Hence, GDP is no more than an
economy’ Gross Value Added measured at market prices.
The third way to measure production is the Income Approach. The Income Account
approach describes how the value added generated by production in the territory is distributed
to labour, capital and government. In particular, GVA is obtained as the sum of three items:
compensation of employees (gross wages and salaries plus social contributions paid by
firms); production taxes (less subsidies) other than indirect taxes5; and Gross Operating
Surplus, ie, the surplus or deficit accruing from production activities before account has been
taken on the interest, rents, and depreciation (from another angle, the GOS consists in the
sum of rents, interest, depreciation and profits6).
Note that the calculation of GVA by the income approach covers only incomes
generated within the borders of a country. To obtain the total income generated by residents,
one must add the net primary income from the rest of the world (NFIA). Then, one can add
indirect taxes (less subsidies), iT , to obtain the GNI.
4 These are taxes on products, meaning that they are payable per unit of a given product or service produced.
5 These are taxes and subsidies incurred by firms as a result of engaging in production, but that are independent of the quantity produced. For instance, taxes on the ownership of land and buildings, and taxes paid for business and professional licenses.
6 In the case of self-employed, the income generated has characteristics of both wages and operating surplus. Instead of trying to disentangle the two categories, the national accounts consider a third category, labelled “Mixed Income”, which is added together with the Gross Operating Surplus and Compensations of employees to obtain the gross value added.
Politicas macroeconomicas, handout, Miguel Lebre de Freitas ([email protected])
https://mlebredefreitas.wordpress.com , 10/06/2018 10
1.4 The Current Account
1.4.1 From National Income to Disposable Income
Apart from what people produce, people may spend money that was received as gift.
Gifts are transactions of the type ‘something for nothing’: cash, goods or services that are
provided to a beneficiary without counterpart. In National Accounts, gifts are labelled
transfers. Examples of current international transfers are emigrants’ remittances, international
aid, personal donations, payments to retired citizens living abroad, and lottery winnings.
In the Balance of Payments accounts, there is an item measuring the current transfers
received by residents in one country minus the current transfers sent to residents abroad. This
is the so-called “Balance of Secondary Income”, or simply Net Unilateral Transfers (NUT)7.
Considering Net Unilateral Transfers, we move from a concept of income related to
factor returns (GNI) to a concept of income related to “resources available to spend”,
irrespectively as to whether these resources were generated by factors owned by residents or
non-residents. This new measure is labelled Gross National Disposable Income (GNDI), or
simply Y:
NUTNFIATBGICY (4)
GNDI (Y), at market prices, measures the total resources available for spending by
home entities, without the need to borrow from (or lend to) abroad.
1.4.2 The Current Account
The Current Account records a country’ international transactions in goods, services,
and income (primary and secondary). The Current Account Balance is defined as:
NUTNFIATBCA (5)
7 The label Secondary Income arises because it refers to the redistribution of primary income.
Politicas macroeconomicas, handout, Miguel Lebre de Freitas ([email protected])
https://mlebredefreitas.wordpress.com , 10/06/2018 11
From the definition of GNDI, we have:
CAAY (6)
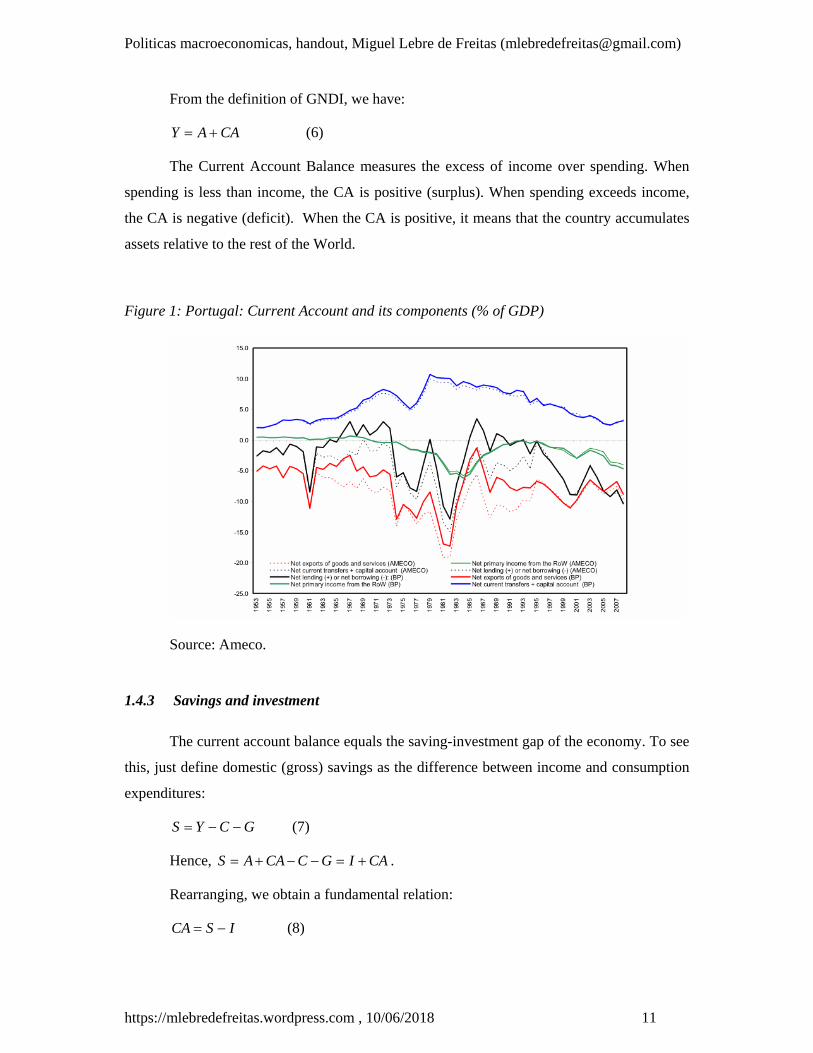
The Current Account Balance measures the excess of income over spending. When
spending is less than income, the CA is positive (surplus). When spending exceeds income,
the CA is negative (deficit). When the CA is positive, it means that the country accumulates
assets relative to the rest of the World.
Figure 1: Portugal: Current Account and its components (% of GDP)
Source: Ameco.
1.4.3 Savings and investment
The current account balance equals the saving-investment gap of the economy. To see
this, just define domestic (gross) savings as the difference between income and consumption
expenditures:
GCYS (7)
Hence, CAIGCCAAS .
Rearranging, we obtain a fundamental relation:
ISCA (8)
Politicas macroeconomicas, handout, Miguel Lebre de Freitas ([email protected])
https://mlebredefreitas.wordpress.com , 10/06/2018 12
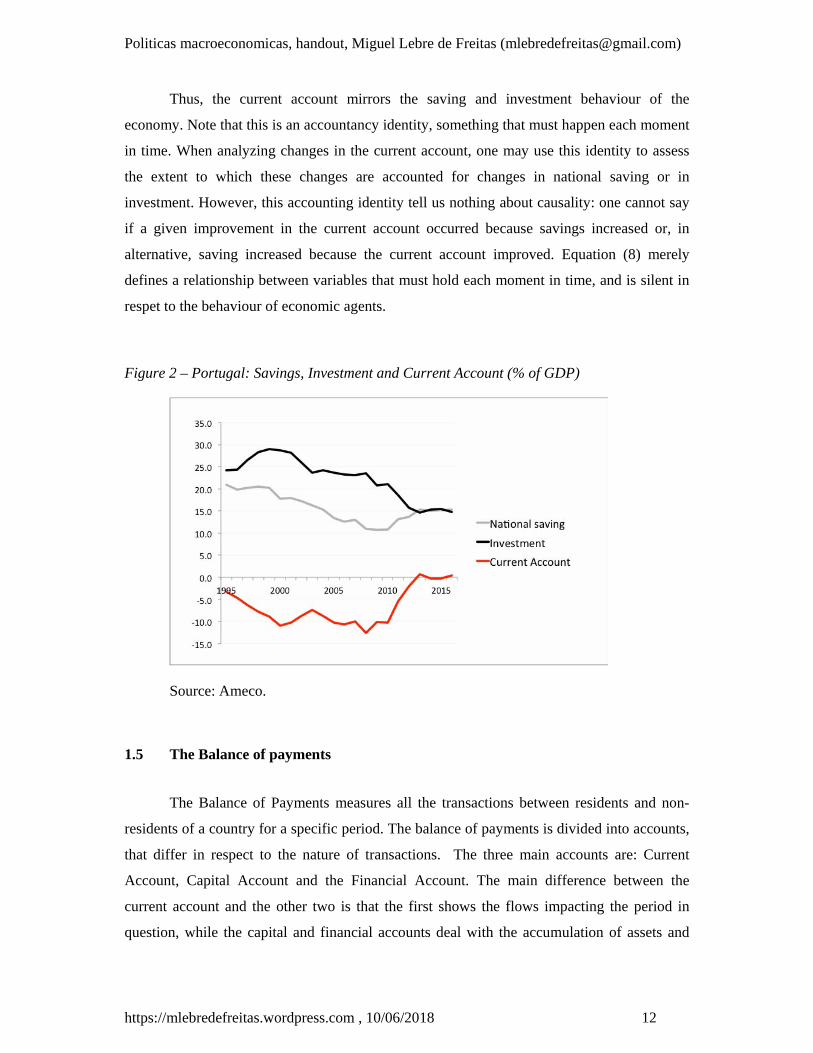
Thus, the current account mirrors the saving and investment behaviour of the
economy. Note that this is an accountancy identity, something that must happen each moment
in time. When analyzing changes in the current account, one may use this identity to assess
the extent to which these changes are accounted for changes in national saving or in
investment. However, this accounting identity tell us nothing about causality: one cannot say
if a given improvement in the current account occurred because savings increased or, in
alternative, saving increased because the current account improved. Equation (8) merely
defines a relationship between variables that must hold each moment in time, and is silent in
respet to the behaviour of economic agents.
Figure 2 – Portugal: Savings, Investment and Current Account (% of GDP)
Source: Ameco.
1.5 The Balance of payments
The Balance of Payments measures all the transactions between residents and non-
residents of a country for a specific period. The balance of payments is divided into accounts,
that differ in respect to the nature of transactions. The three main accounts are: Current
Account, Capital Account and the Financial Account. The main difference between the
current account and the other two is that the first shows the flows impacting the period in
question, while the capital and financial accounts deal with the accumulation of assets and
Politicas macroeconomicas, handout, Miguel Lebre de Freitas ([email protected])
https://mlebredefreitas.wordpress.com , 10/06/2018 13
liabilities in respect to the rest of the world. Thus, when an economy runs a surplus in the
Current Account, this means that it accumulates assets. In the National Accounts, this
accumulation is recorded in two different accounts, the Capital Account, and the Financial
Account8.
1.5.1 The Capital Account
The Capital Account (KA) is a minor component of the Balance of Payments
registering the “acquisitions or disposal of non-financial and non-produced assets”. By
exclusion, the financial assets are recorded in the Financial Account and the Produced Assets
(investment goods and services) are recorded in the Current Account.
The Capital Account is divided in two main categories: (a) acquisitions of non-
financial assets not accounted in the TB, such as permits to undertake specific activities (the
right to explore a natural resource), and marketing assets, such as brand names, trademarks,
and franchises9; and (b) capital transfers (i.e, transfers of assets) between residents and non-
residents: debt forgiveness, inheritance received, grants designed to finance capital formation,
such as those made by the European Agriculture Fund for Rural Development).
The sum of the balances on the current and capital accounts delivers the net lending
(surplus) or net borrowing (deficit) of the economy relative to the rest of the world. That is,
*BeKACA . (10)
8 The Capital Account and the Financial Account are labelled as “accumulation accounts”. Accumulation accounts cover international transactions of financial and non-financial assets. This differs from the current account, which deals with the production, redistribution, and use of income in the form of final expenditures.
9 These items are labelled “non-produced non-financial assets”. They are assets, because they can be bought and sold with resulting payment flows, but they differ from investment goods and valuables because they do not come into existence in result of any production processes. While international trade in produced non-financial assets (investment goods and valuables) is accounted for in the balance of goods and services (TB), this remaining category of non-financial assets is recorded in the capital account.
Politicas macroeconomicas, handout, Miguel Lebre de Freitas ([email protected])
https://mlebredefreitas.wordpress.com , 10/06/2018 14
Were *B denotes for the dollar value of the stock of net foreign assets owned by
residents, and e stands for the exchange rate. Whenever the right-hand side is positive, the
economy is accumulating financial assets relative to the rest of the world, in net terms.
1.5.2 The Financial Account
The current and capital accounts show the transactions that determines a country’
lending capacity. When the sum of the current and capital accounts is negative, this means
that the economy needs foreign financing. The financial account balance measures the net
debt accumulation of a country vis-à-vis the rest of the world. It registers the transactions
between residents and non-residents that involve financial assets and liabilities.
The financial account shows how net lending or borrowing is allocated or financed
across different types of assets or of financial transactions. It can be presented in terms of
type of assets (e.g, deposits, bonds, currency, etc) or in terms of functional categories (i.e,
what are the motives underlying these transactions).
In its manual for the Balance of Payments Statistics (BPM6), the IMF defines five
categories of financial transactions: (a) Direct Investment: cross-border asset transactions
(equity, loans, real state, reinvestment of profits) involving a resident in one economy having
influence on the management of an enterprise that is resident in another economy; (b)
Portfolio Investment: cross-border transactions of shares in business enterprises with no
influence in company management; purchases and issues of debt instruments not related to
Direct Investment; (c) Financial derivatives: international transactions of this separate group
of financial instruments. (d) Other investment: a very important item, as it corresponds to
operations of currency, deposits, trade, and credits – a foreign bank loan to a domestic
company, for instance, is registered here; (e) Reserve assets: Transactions involving foreign
assets owned by the monetary authority. The later include the purchase or sale, by the
monetary authorities, of gold, reserve positions at the IMF and foreign exchange reserves.
Since these assets belong to the central bank, they can be used to cover financial needs in the
balance of payments or to intervene in the foreign exchange markets. Note that when the
central bank swaps foreign money for domestic money, there is an impact in the domestic
money supply.
1.5.3 The three components of the balance of payments
Politicas macroeconomicas, handout, Miguel Lebre de Freitas ([email protected])
https://mlebredefreitas.wordpress.com , 10/06/2018 15
The Balance of Payments is therefore composed by 3 main accounts:
- The Current Account (CA), that measures the international flows of goods and
services, and factor incomes; if positive, it means that the country accumulates
assets.
- The Capital Account (KA), a minor item that records international capital
transfers, as well as the acquisition and disposals of special (non-produced non-
financial) assets.
- The Financial Account (FA), that measures the net acquisition and disposal of
financial assets and liabilities. A surplus in the financial account (FA>0) means
that the country is a net exporter of financial assets (net borrower).
1.5.4 The Balance of payments identity
The financial account and the capital account are flows of funds that shall be added to
home GNDI to calculate the total resources available for expenditure by home residents. The
value of the total resources available for national expenditure is therefore
Y+KA+FA=A. (11)
Since, on the other hand, Y=A+CA, one obtains the Balance of Payments Identity:
0 FAKACA (12)
The Balance of Payments Identity states that any CA surplus must be matched by an
equal deficit in the other two accounts, meaning that the country is accumulating financial
and non-produced assets.
1.5.5 Net errors and omissions
The data on merchandise trade originate with the customs authorities, while the
remaining components of the Balance of Payments are collected by central banks. Because
these data come from different sources, and some transactions are not reported, equality (12)
will not in general hold. To account for statistical discrepancy, the Balance of Payments
Statistics include a component, called Net Errors and Omissions (EO), which is defined as
follows:
FAKACAEO (12a)
Politicas macroeconomicas, handout, Miguel Lebre de Freitas ([email protected])
https://mlebredefreitas.wordpress.com , 10/06/2018 16
Because the EO captures hidden transactions, such as unreported capital movements,
it may occasionally be a meaningful indicator of financial stress, namely in economies under
capital controls.
1.6 The Net International Investment Position
A country’ Net International Investment Position is a measure that shows at a moment
in time the value of financial assets of residents of an economy that are claims on non-
residents minus the liabilities of residents to non-residents. This measure includes all types of
financial assets, namely, bonds, equity, gold, and financial derivatives, and is in general
measured in US dollar units.
In our framework, a country NIIP is summarised by the symbol *B . Because this
variable is defined in US dollars, the corresponding value in domestic currency is:
*eBNIIP (15)
Where e denotes for the exchange rate.
Whenever NIIP>0, external assets exceed external liabilities, so the country is a net
creditor relative to the rest of the World; when NIIP<0, external liabilities exceed external
assets, so the country is a net debtor relative to the rest of the World.
1.6.1 Changes in NIIP
The NIIP of a country is evaluated at market prices. Hence, changes in a country Net
International Investment Position may reflect both borrowing/lending (financial transactions)
and changes in the market value of the different assets that give rise to holding gains or losses
in the stock of assets held.
Politicas macroeconomicas, handout, Miguel Lebre de Freitas ([email protected])
https://mlebredefreitas.wordpress.com , 10/06/2018 17
For instance, a crash in the domestic stock market will increase the domestic country’
NIIP, through the losses faced by foreign investors at home; in turn, a crash in a stock market
abroad will reduce a country NIIP’ by the losses of domestic investors abroad. Thinking more
broadly, valuation changes can happen because of stock market fluctuations, because of
changes in bond yields, exchange rate movements, etc.
Abstracting from capital gains or losses other than those arising from movements in
the exchange rate, the change on NIIP will be10:
** eBBeNIIP (16)
The first component is related to a country’ net borrow and lending (-FA=CA+KA).
The second component captures eventual capital gains or losses due to changes in the value
of the assets comprising the NIIP (in equation 16, the valuation changes are attached to
exchange rate movements, only, for simplification).
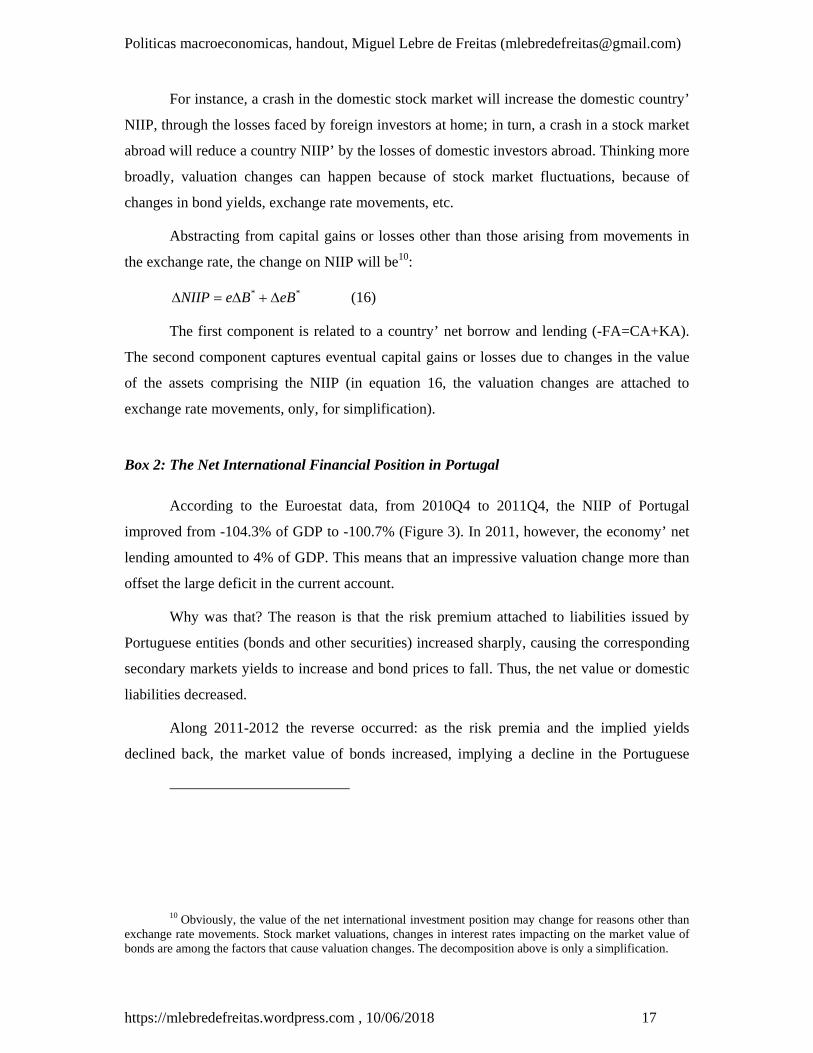
Box 2: The Net International Financial Position in Portugal
According to the Euroestat data, from 2010Q4 to 2011Q4, the NIIP of Portugal
improved from -104.3% of GDP to -100.7% (Figure 3). In 2011, however, the economy’ net
lending amounted to 4% of GDP. This means that an impressive valuation change more than
offset the large deficit in the current account.
Why was that? The reason is that the risk premium attached to liabilities issued by
Portuguese entities (bonds and other securities) increased sharply, causing the corresponding
secondary markets yields to increase and bond prices to fall. Thus, the net value or domestic
liabilities decreased.
Along 2011-2012 the reverse occurred: as the risk premia and the implied yields
declined back, the market value of bonds increased, implying a decline in the Portuguese
10 Obviously, the value of the net international investment position may change for reasons other than exchange rate movements. Stock market valuations, changes in interest rates impacting on the market value of bonds are among the factors that cause valuation changes. The decomposition above is only a simplification.
Politicas macroeconomicas, handout, Miguel Lebre de Freitas ([email protected])
https://mlebredefreitas.wordpress.com , 10/06/2018 18
NIIP. This example reveals how changes in asset prices impact on a country’ NIPP,
irrespectively of what happen to new borrowing.
Figure 3 - Portugal: Net International Investment Position (% of GDP)
Source: Eurostat
1.6.2 Reserve Asset Transactions
A key component of the financial account refers to trade in foreign assets involving
the central bank: these are the Reserve Assets. They are important, because they are a policy
variable: when the central bank buys foreign assets, the base money changes. Thus, for
analytical purposes, it is useful to disentangle in the Financial Account, those transactions
that involve the central bank (Reserve assets) from those that do not involve the central bank.
That is,
`*`*NRC BeBeFA (17)
In (17), *CBe denotes for the change in reserve assets and *
NRBe denotes for “non-
reserve transactions”. The change in central bank external reserves is therefore equal to the
sum of the current account, the capital account and the non-reserve portion of the Financial
Account:
**NRC BeEOKACABe (18)
When this sum is positive, this means that there was an excess supply of foreign
currency in non-reserve transactions at the existing exchange rate, requiring the central bank
to buy foreign exchange reserves. All else equal, this will cause the domestic monetary base
to expand.
Politicas macroeconomicas, handout, Miguel Lebre de Freitas ([email protected])
https://mlebredefreitas.wordpress.com , 10/06/2018 19
1.6.3 The analytical presentation of the Balance of Payments
The “standard” presentation of the Balance of Payments, as described in BPM6 and
ESA10, focuses on a major balancing item: the net lending/borrowing. Above this line, we
have the sum of the current account and capital account; below the line we have the financial
account. Thus, the main focus of the Balance of Payments presented that way is the impact of
international transactions in a country’ NIIP.
There are, however, other aspects one may want to emphasise when looking at the
balance of payments. One is the extent to which the central bank is intervening in the foreign
exchange market, buying and selling foreign exchange reserves, say, to influence the
exchange rate. The other is the extent to which the authorities in general (central bank and
government) are mobilizing international resources to fill a financing gap in the balance of
payments: when agents in an economy have sent more money abroad than they received
(through either trade of goods or trade in assets), the central bank can fill the gap, undertaking
“compensatory” operations, such as the mobilization of gold and reserves or the use of IMF
credit facilities. In plus, a country can use “exceptional financing” mechanisms, such as debt
forgiveness, debt restructuring, intergovernmental grants, and accumulation of arrears to
finance other “autonomous” international transactions.
In order to measure the extent to which these various “compensatory” instruments
have been used in a given period, a common practice by the IMF is to pull together these
items in a new account called “Reserves and Related Items”.
The analytical presentation of the Balance of Payments is therefore a reorganization
of the standard presentation to facilitate a basic distinction between (a) reserves and related
items; (b) other transactions. This presentation shows how reserves, along with other
exceptional financing mechanism are used to finance the autonomous international
transactions.
Politicas macroeconomicas, handout, Miguel Lebre de Freitas ([email protected])
https://mlebredefreitas.wordpress.com , 10/06/2018 20
When the Balance of Payments is presented that way, the sum of the items above the
line (CA, KA, FA, EO excluding Reserve and related items) is labelled “Overall balance”11.
Thus, while formally the total of the Balance of Payments should be zero, often by a Balance
of Payments surplus or deficit it is meant a surplus or a deficit in the “overall balance”.
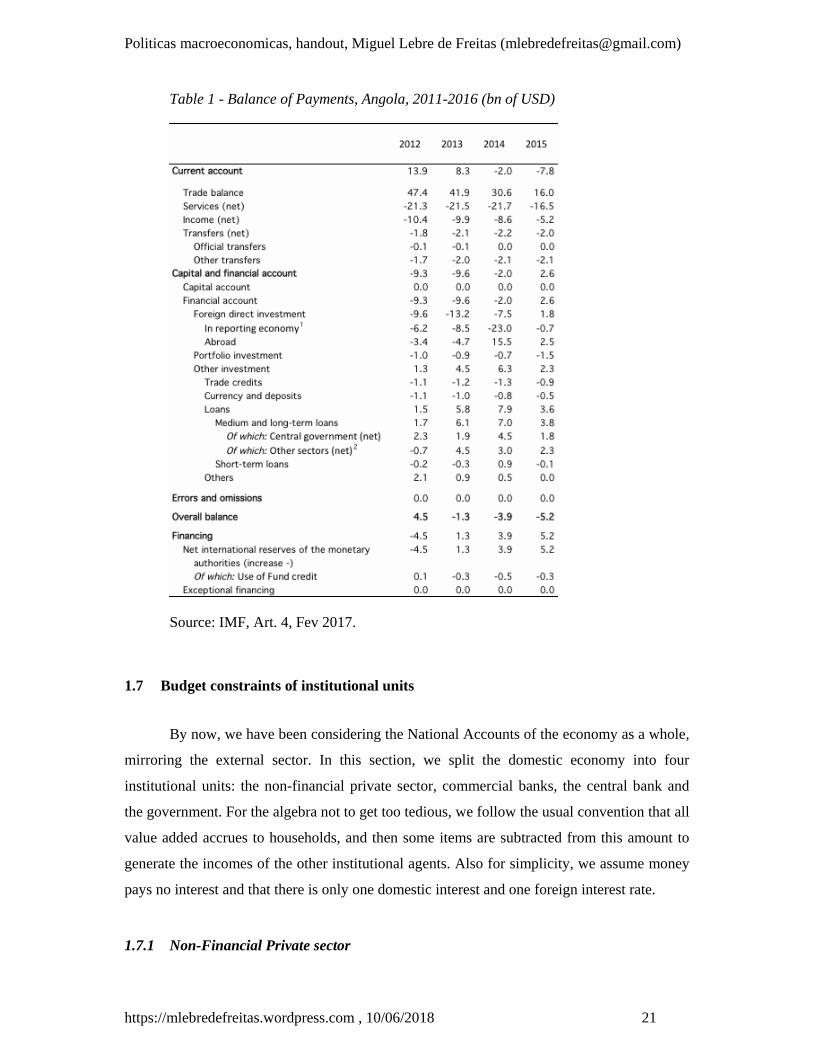
Box 3 – The Balance of Payments of Angola
Table 1 shows an “analytical” presentation of the Balance of Payments in Angola, as
reported in the 2006 IMF country review.
Thus, for instance, in 2012, there was a current account surplus amounting to 13.9bn
USD, that lead to a net acquisition of foreign assets by the non-monetary sector (the
“financial account has a deficit of 9.3bn). The difference was matched by an increase in
central bank reserves, by 4.5bn. Along 2013-2015, the fall in oil prices caused the current
account to deteriorate, and this was partially mitigated by a capital flow reversal (the
financial account turned positive in 2015, meaning that the country became a net borrower).
Still, the “overall balance” was negative, meaning that the central bank sold reserve assets.
This, in turn, implied a sharp contraction in the money base.
11 When this rearrangement is made, the items in the balance of payments from which transactions were taken are readjusted and marked with (n.i.e.): for instance, Capital Account (n.i.e.) does not include debt forgiveness; Financial Account (n.i.e.) does not include Reserve Assets.
Politicas macroeconomicas, handout, Miguel Lebre de Freitas ([email protected])
https://mlebredefreitas.wordpress.com , 10/06/2018 21
Table 1 - Balance of Payments, Angola, 2011-2016 (bn of USD)
Source: IMF, Art. 4, Fev 2017.
1.7 Budget constraints of institutional units
By now, we have been considering the National Accounts of the economy as a whole,
mirroring the external sector. In this section, we split the domestic economy into four
institutional units: the non-financial private sector, commercial banks, the central bank and
the government. For the algebra not to get too tedious, we follow the usual convention that all
value added accrues to households, and then some items are subtracted from this amount to
generate the incomes of the other institutional agents. Also for simplicity, we assume money
pays no interest and that there is only one domestic interest and one foreign interest rate.
1.7.1 Non-Financial Private sector
Politicas macroeconomicas, handout, Miguel Lebre de Freitas ([email protected])
https://mlebredefreitas.wordpress.com , 10/06/2018 22
The non-financial private sector comprises households and non-financial
corporations. The balance sheet identity of the private sector is defined as follows12:
PPP BMqKNW , (19)
Where PNW denotes for the Net Worth of the private sector, PK for the stock of real
assets held by the private sector, q for the relative price of real assets, M for monetary assets
and PB for non-monetary non-financial assets (equity, bonds) net of liabilities. The later can
be decomposed into government bonds held by the private sector ( PGD ), external assets net of
external liabilities ( *PeB ), credit from commercial banks ( P
BL ), and (if any), liabilities to the
central bank ( PCL ). Thus,
PC
PB
PGPP LLDeBB * . (20)
The private sector disposable income is:
TNUTeBiLLDiQY PPPC
PB
PG
dP ** (21)
The term PNUT refers to the net secondary income received from abroad (emigrants
remittances, for instance). For simplicity, we use a single item, T, to describe all taxes minus
subsidies: more precisely, T refers to the sum of indirect taxes, direct taxes, and social
security contributions, minus government transfers (such as unemployment benefits) and
subsidies to production.
The current (gross) saving of the private sector is13:
CYS dPP (22)
12 Private agents rely on equity and on lending from each other as a source of finance, but these transactions cancel out in the private sector aggregate.
13 Because we are pooling together households and non-financial corporations, the model hides the fact that part of private savings consists in earnings retained by corporations to finance their investment (corporate savings). The disposable income of households is equal to the disposable income of the private sector minus retained earnings and accordingly; households savings are equal to private savings minus retained earnings.
Politicas macroeconomicas, handout, Miguel Lebre de Freitas ([email protected])
https://mlebredefreitas.wordpress.com , 10/06/2018 23
Just like in the balance of payment accounting, mediating current savings and the
accumulation of financial assets there is a capital account. The sum of current savings with
eventual capital transfers received by the private sector, PKA (grants from the government
and from abroad, net) gives the net accumulation of real, monetary and financial assets by the
private sector (first column in Table 1):
PB
PC
PGPPPP LLDBeMIKAS * (23)
By the definition, the balance-sheet of the private sector (19) gives the stocks of
assets, liabilities, and net worth of a sector at a moment in time. By taking the change in
stocks between two balance-sheets we get the net flows over the corresponding time spam,
which define the sources-and-use-of-funds statement:
PPPP BMqKKqNW
Using the fact that net investment is equal to gross investment minus depreciation
( PPP qKIKq ) and differentiating (20), we get:
PB
PC
PGPPPPP LLDeBBeMqKqKINW **
Using (23), we see that the net-worth of the private sector increases with net savings
(first-term), gifts, and valuation changes (last term):
*PPPPP BeqKKAqKSNW (24)
1.7.2 Government
The Net Worth of the government sector is defined as follows:
GGG DqKNW (25)
Where GK stands for the public capital stock, and
*G
CG
BG
PG
G eDDDDD (26)
With jGD denoting for government debt placed at the institutional sector j.
The government current gross saving is:
GGCG
BG
PGG NUTeDiDDDiGTS ** (27)
Politicas macroeconomicas, handout, Miguel Lebre de Freitas ([email protected])
https://mlebredefreitas.wordpress.com , 10/06/2018 24
GNUT refers to the component of NUT that involves the government (official
transfers, like international assistance).
Denoting the net capital transfers received by the government by GKA (from abroad,
net, minus capital transfers paid to the private sector), the net borrowing of the general
government will be:
*G
CG
BG
PGGGG DeDDDIKAS (28)
The government sector sources-and-use-of-funds statement is:
GGGG DqKKqNW
Using **GG
CG
BG
PG
G eDDeDDDD , replacing in (27), and defining the
depreciation of capita as above, we get:
*GGGGGG eDKqKAqKSNW (29)
That is, the change in the new worth of the government sector is the sum of net
current savings, capital transfers received from abroad and capital gains or losses on physical
capital and foreign debt.
1.7.3 Central bank
The central bank balance sheet obeys to the following identity:
HBeBHLLDeBNW CCPC
BC
CGCC ** (30)
where, CNW denotes for the net worth of the central bank, *ceB for net foreign assets held by
the central bank expressed in domestic currency, CGD for government debt held by the CB,
BCL for loans to commercial banks, P
CL for loans to the private sector, and H for the Monetary
Base. The total amount of domestic assets held by the central bank is PC
BC
CGC LLDB .
The money base (H) is the most relevant liability of the central bank. It comprehends
notes and coins held by the public (X) and reserves held by commercial banks, R:
H=X+R (31)
Politicas macroeconomicas, handout, Miguel Lebre de Freitas ([email protected])
https://mlebredefreitas.wordpress.com , 10/06/2018 25
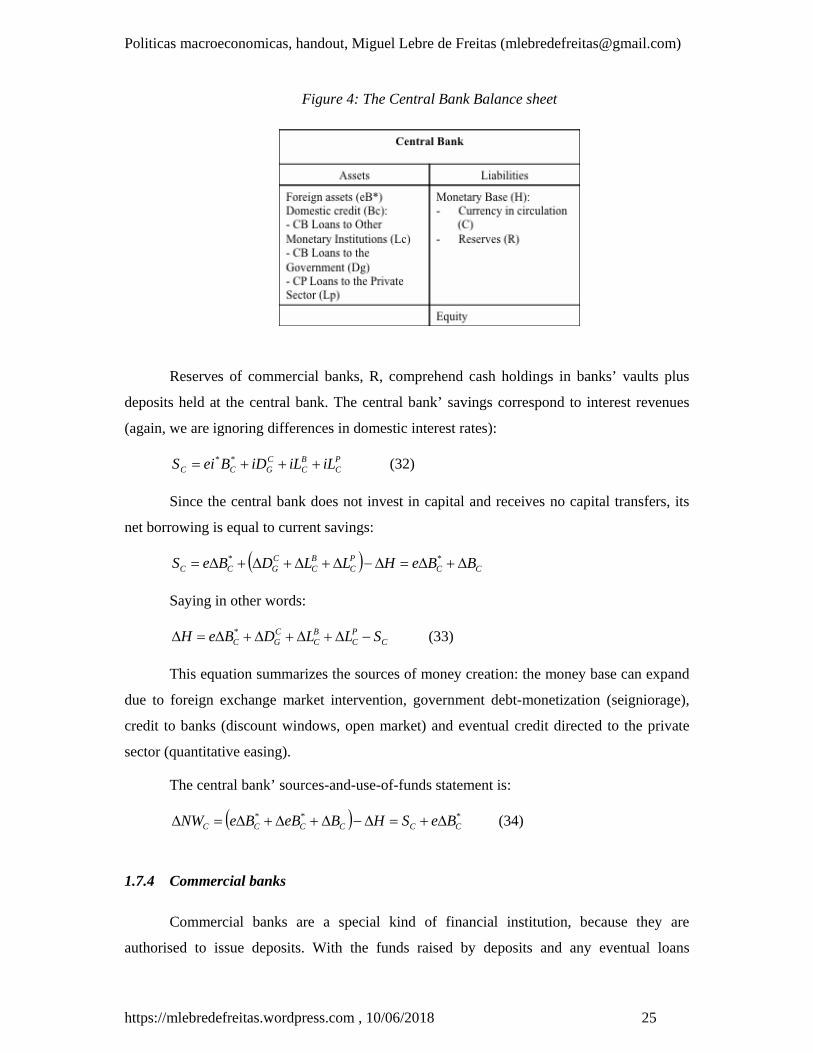
Figure 4: The Central Bank Balance sheet
Reserves of commercial banks, R, comprehend cash holdings in banks’ vaults plus
deposits held at the central bank. The central bank’ savings correspond to interest revenues
(again, we are ignoring differences in domestic interest rates):
PC
BC
CGCC iLiLiDBeiS ** (32)
Since the central bank does not invest in capital and receives no capital transfers, its
net borrowing is equal to current savings:
CCPC
BC
CGCC BBeHLLDBeS **
Saying in other words:
CPC
BC
CGC SLLDBeH * (33)
This equation summarizes the sources of money creation: the money base can expand
due to foreign exchange market intervention, government debt-monetization (seigniorage),
credit to banks (discount windows, open market) and eventual credit directed to the private
sector (quantitative easing).
The central bank’ sources-and-use-of-funds statement is:
*** CCCCCC BeSHBeBBeNW (34)
1.7.4 Commercial banks
Commercial banks are a special kind of financial institution, because they are
authorised to issue deposits. With the funds raised by deposits and any eventual loans
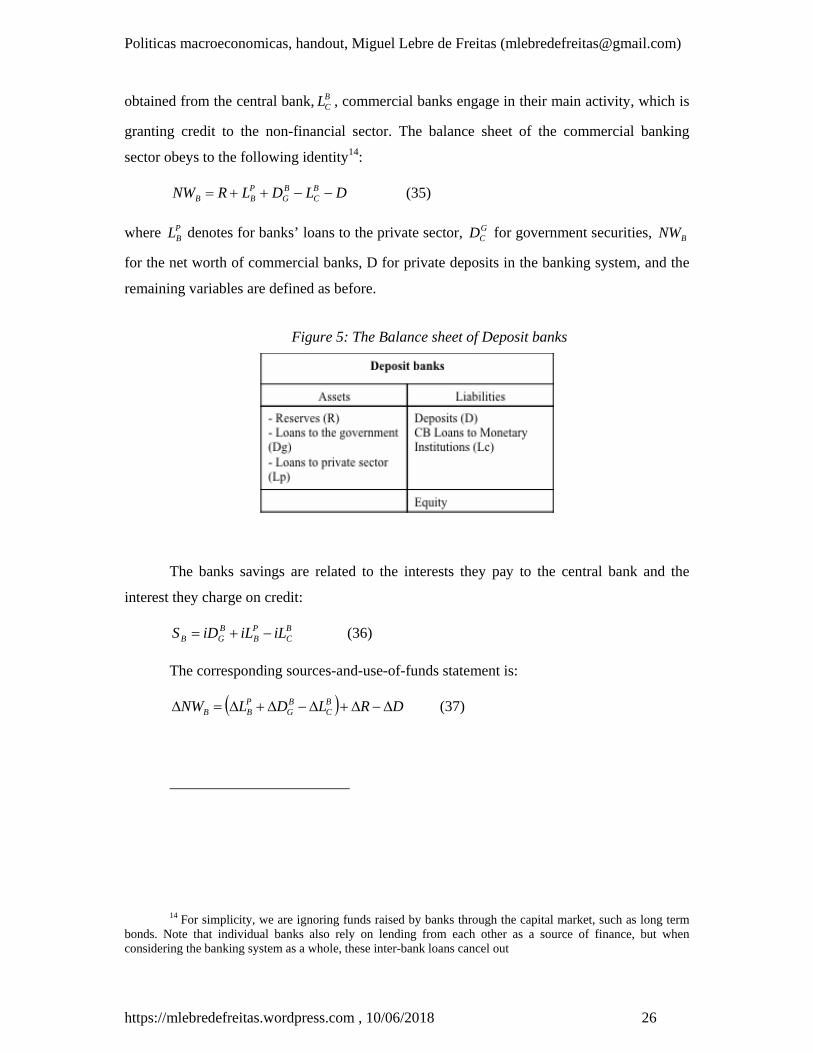
Politicas macroeconomicas, handout, Miguel Lebre de Freitas ([email protected])
https://mlebredefreitas.wordpress.com , 10/06/2018 26
obtained from the central bank, BCL , commercial banks engage in their main activity, which is
granting credit to the non-financial sector. The balance sheet of the commercial banking
sector obeys to the following identity14:
DLDLRNW BC
BG
PBB (35)
where PBL denotes for banks’ loans to the private sector, G
CD for government securities, BNW
for the net worth of commercial banks, D for private deposits in the banking system, and the
remaining variables are defined as before.
Figure 5: The Balance sheet of Deposit banks
The banks savings are related to the interests they pay to the central bank and the
interest they charge on credit:
BC
PB
BGB iLiLiDS (36)
The corresponding sources-and-use-of-funds statement is:
DRLDLNW BC
BG
PBB (37)
14 For simplicity, we are ignoring funds raised by banks through the capital market, such as long term bonds. Note that individual banks also rely on lending from each other as a source of finance, but when considering the banking system as a whole, these inter-bank loans cancel out
Politicas macroeconomicas, handout, Miguel Lebre de Freitas ([email protected])
https://mlebredefreitas.wordpress.com , 10/06/2018 27
1.7.5 Consolidated monetary sector
Taking together the central bank and the commercial banks balance sheets, one
obtains the consolidated balance sheet of the monetary sector:
DXDDLLeBNW CG
BG
PC
PBCCB
* (38)
The specific characteristic of bank deposits is that they are so liquid that they can
serve as means of payment. Because of this, bank deposits are part of what we call “money”,
together with currency in circulation (X). The money supply is, therefore: 15
DXM , (39)
equation (33) can be rearranged to:
CBGC
GB
PC
PBC NWDDLLeBM * (38a)
Equation (38a) reveals that the counterparts of money supply are foreign assets and
total domestic credit (government plus the private sector).
1.8 Aggregate relations
1.8.1 National wealth
Summing the newt worth of all national units, one gets the net worth of the economy
as a whole:
qKBDBeNWNWNWNWNW PGCBCGP *** (41)
The first component in the right hand side is the country’ International Investment
Position, because resident-to-resident claims net to zero in the national balance sheet:
15 In the real world, central banks monitor wider monetary aggregates, including short term securities held by the public (e.g, treasuries). For convenience, we ignore this complication.
Politicas macroeconomicas, handout, Miguel Lebre de Freitas ([email protected])
https://mlebredefreitas.wordpress.com , 10/06/2018 28
****PGC BDBB (42)
Hence:
qKeBNW * (41a)
A country total wealth is composed by the country stock of non-financial assets (K)
and the net holdings of financial assets (NIIP).
1.8.2 National savings
Summing the current savings across all agents (22, 27, 32, 36), we get national
savings:
* * * *P G C B C G PS S S S S Q C G NUT ei B D B
Rearranging, the sum of savings and consumption gives the Gross National
Disposable Income (GDNI):
YBeiNUTQGCS ** (43)
Note that the term **eBi corresponds to the Primary Income account of the Balance of
Payments (NFIA). The term NUT is, as we know, the Secondary Income Account. Then,
using the definition of CA and GDP by the spending approach, we are back to the main
identity of the national accounts:
CAIS (8)
Disentangling how savings and investment are split across institutional sectors, one
can learn on what is behind a current account deficit. In our framework:
GGPBCP ISISSSCA . (8a)
This identity shows that the budgetary balance of the government may be an
important factor influencing the current account balance. A situation in which a sustained
Politicas macroeconomicas, handout, Miguel Lebre de Freitas ([email protected])
https://mlebredefreitas.wordpress.com , 10/06/2018 29
current account deficit is matched by a persistent government spending in excess of receipts
is labelled “twin deficit”16.
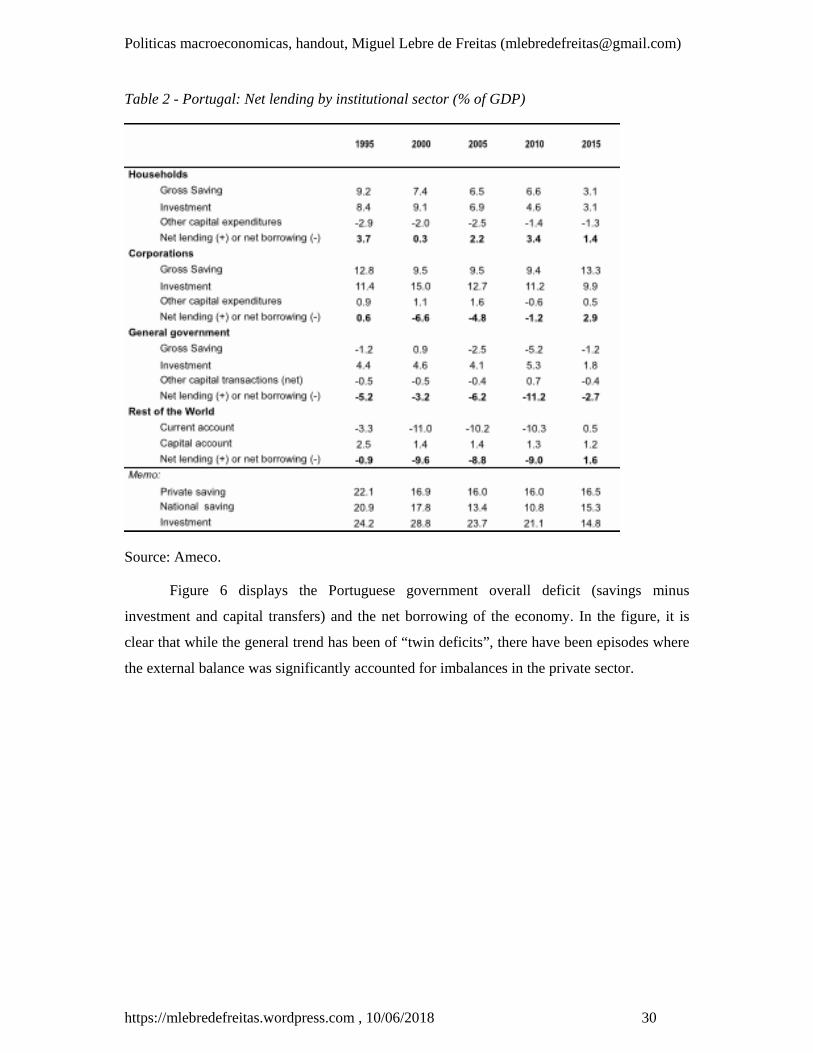
Box 4: Savings and investment by institutional sector in Portugal
Table 2 describes the net lending or borrowing by institutional sector in Portugal. In
the table, the private sector is split into households and corporations, only. For each resident
unit, under-spending or overspending on the acquisition of real assets (capital) relative to
savings and capital transfers, results in the balancing item “net lending or borrowing”. In the
case of the rest of the world, net lending is obtained as the difference between the
symmetrical of the current account corresponding savings (external saving), and the capital
account.
In the table, we see that 2010 can be categorized as a year of twin deficits: in that
year, the economy’ net borrowing (9% of GDP) was totally accounted for the government
sector deficit (-11.2% of GDP), while the private sector as a whole (i.e, the consolidation of
households with the firms that they own) exhibited a surplus (2.2% of GDP).
16 At the first sight this suggests that fiscal tightening could be used to achieve external balance. Note however that private savings are not independent of government savings: if taxes increase, for instance, it is possible that private savings decrease in response. This means that the accounting identity (8a) provides only a starting point for an analysis of the interaction between savings, investment and the current account. A more enlightened analysis must be supplemented with information regarding the behaviour of economic agents.
Politicas macroeconomicas, handout, Miguel Lebre de Freitas ([email protected])
https://mlebredefreitas.wordpress.com , 10/06/2018 30
Table 2 - Portugal: Net lending by institutional sector (% of GDP)
Source: Ameco.
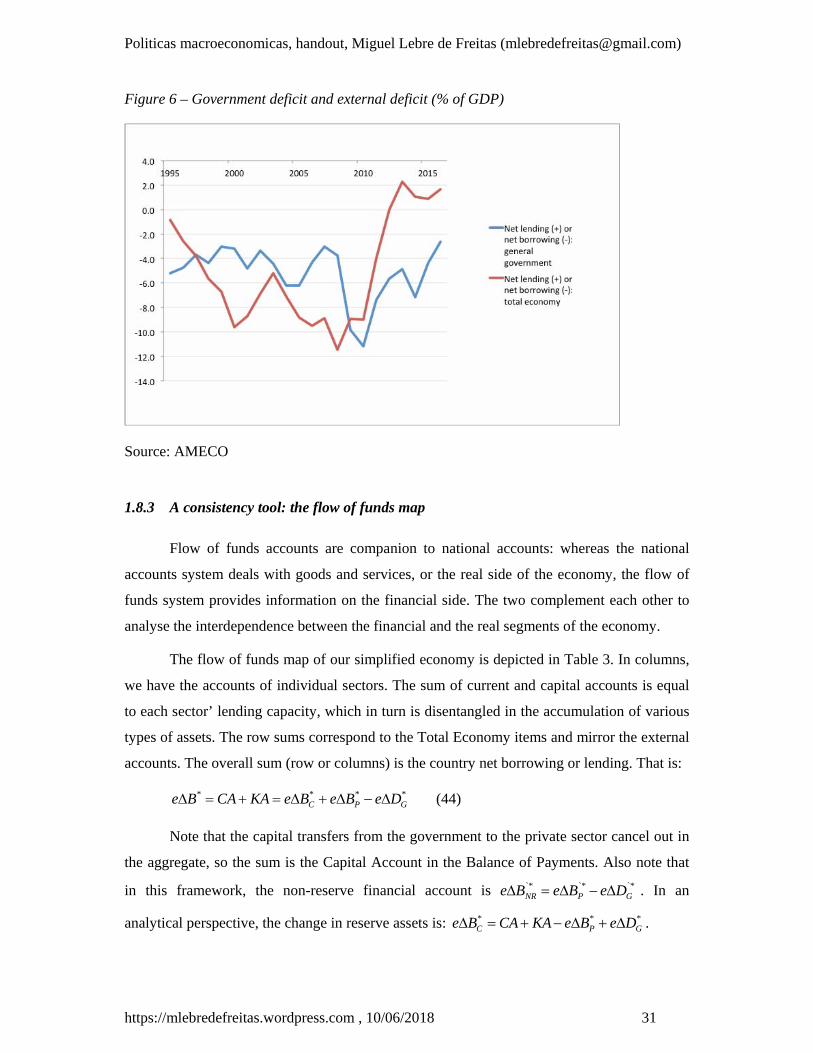
Figure 6 displays the Portuguese government overall deficit (savings minus
investment and capital transfers) and the net borrowing of the economy. In the figure, it is
clear that while the general trend has been of “twin deficits”, there have been episodes where
the external balance was significantly accounted for imbalances in the private sector.
Politicas macroeconomicas, handout, Miguel Lebre de Freitas ([email protected])
https://mlebredefreitas.wordpress.com , 10/06/2018 31
Figure 6 – Government deficit and external deficit (% of GDP)
Source: AMECO
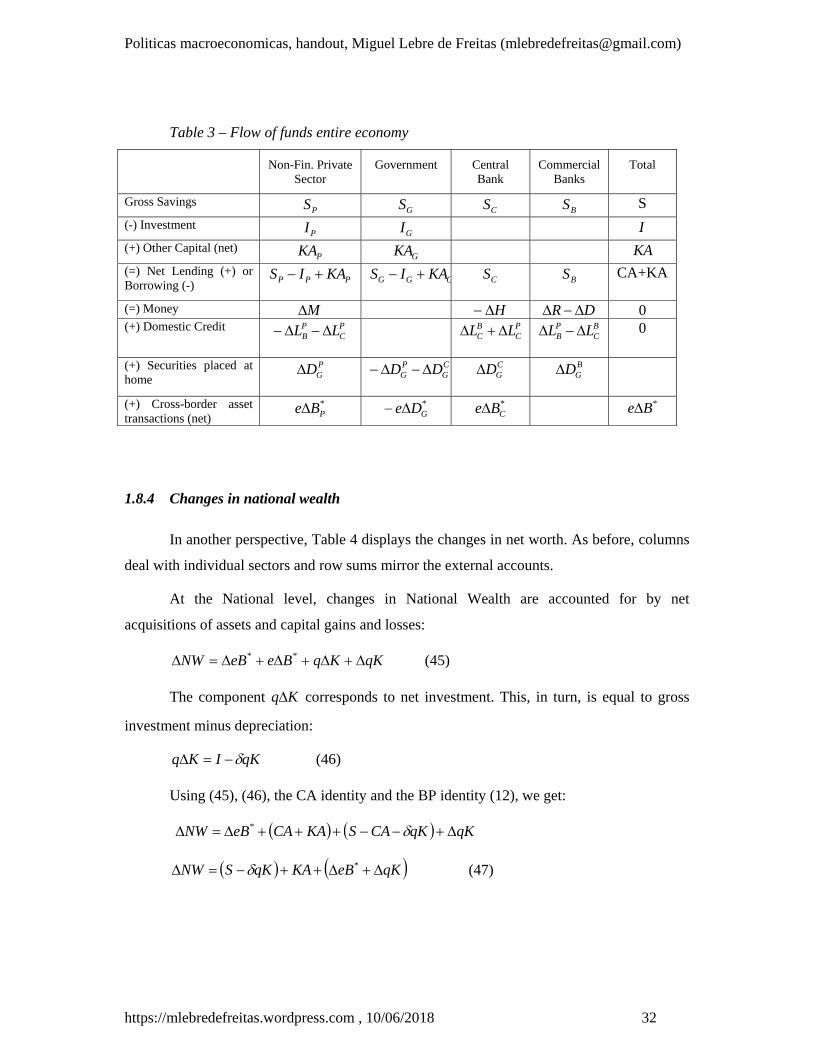
1.8.3 A consistency tool: the flow of funds map
Flow of funds accounts are companion to national accounts: whereas the national
accounts system deals with goods and services, or the real side of the economy, the flow of
funds system provides information on the financial side. The two complement each other to
analyse the interdependence between the financial and the real segments of the economy.
The flow of funds map of our simplified economy is depicted in Table 3. In columns,
we have the accounts of individual sectors. The sum of current and capital accounts is equal
to each sector’ lending capacity, which in turn is disentangled in the accumulation of various
types of assets. The row sums correspond to the Total Economy items and mirror the external
accounts. The overall sum (row or columns) is the country net borrowing or lending. That is:
****GPC DeBeBeKACABe (44)
Note that the capital transfers from the government to the private sector cancel out in
the aggregate, so the sum is the Capital Account in the Balance of Payments. Also note that
in this framework, the non-reserve financial account is `*`*`*GPNR DeBeBe . In an
analytical perspective, the change in reserve assets is: ***GPC DeBeKACABe .
Politicas macroeconomicas, handout, Miguel Lebre de Freitas ([email protected])
https://mlebredefreitas.wordpress.com , 10/06/2018 32
Table 3 – Flow of funds entire economy
Non-Fin. Private Sector
Government Central Bank
Commercial Banks
Total
Gross Savings PS GS CS BS S
(-) Investment PI GI I
(+) Other Capital (net) PKA GKA KA
(=) Net Lending (+) or Borrowing (-)
PPP KAIS GGG KAIS
CS BS CA+KA
(=) Money M H DR 0 (+) Domestic Credit P
CPB LL P
CBC LL
BC
PB LL
0
(+) Securities placed at home
PGD C
GPG DD
CGD B
GD
(+) Cross-border asset transactions (net)
*PBe *
GDe *CBe *Be
1.8.4 Changes in national wealth
In another perspective, Table 4 displays the changes in net worth. As before, columns
deal with individual sectors and row sums mirror the external accounts.
At the National level, changes in National Wealth are accounted for by net
acquisitions of assets and capital gains and losses:
qKKqBeeBNW ** (45)
The component Kq corresponds to net investment. This, in turn, is equal to gross
investment minus depreciation:
qKIKq (46)
Using (45), (46), the CA identity and the BP identity (12), we get:
qKqKCASKACAeBNW *
qKeBKAqKSNW * (47)
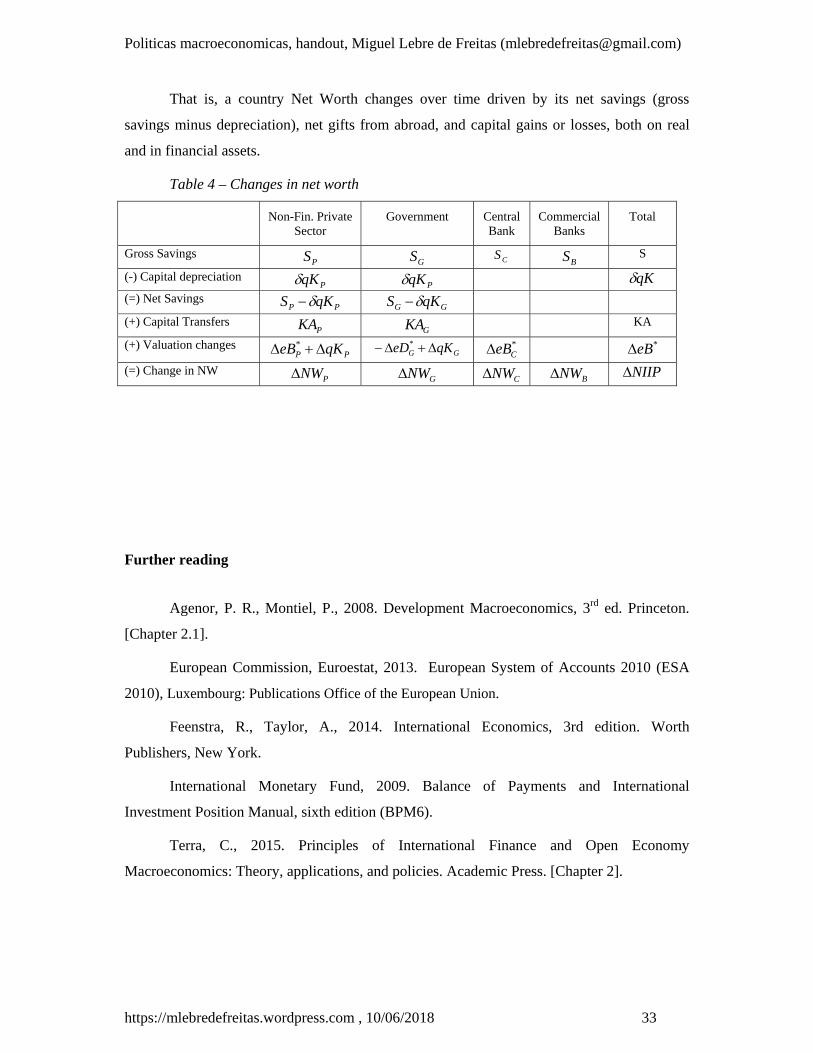
Politicas macroeconomicas, handout, Miguel Lebre de Freitas ([email protected])
https://mlebredefreitas.wordpress.com , 10/06/2018 33
That is, a country Net Worth changes over time driven by its net savings (gross
savings minus depreciation), net gifts from abroad, and capital gains or losses, both on real
and in financial assets.
Table 4 – Changes in net worth
Non-Fin. Private Sector
Government Central Bank
Commercial Banks
Total
Gross Savings PS GS CS
BS S
(-) Capital depreciation PqK PqK qK
(=) Net Savings PP qKS GG qKS
(+) Capital Transfers PKA GKA KA
(+) Valuation changes PP qKeB * GG qKeD * *
CeB *eB
(=) Change in NW PNW GNW CNW BNW NIIP
Further reading
Agenor, P. R., Montiel, P., 2008. Development Macroeconomics, 3rd ed. Princeton.
[Chapter 2.1].
European Commission, Euroestat, 2013. European System of Accounts 2010 (ESA
2010), Luxembourg: Publications Office of the European Union.
Feenstra, R., Taylor, A., 2014. International Economics, 3rd edition. Worth
Publishers, New York.
International Monetary Fund, 2009. Balance of Payments and International
Investment Position Manual, sixth edition (BPM6).
Terra, C., 2015. Principles of International Finance and Open Economy
Macroeconomics: Theory, applications, and policies. Academic Press. [Chapter 2].


![i µ u v } u } } v u ] } - SWEETsweet.ua.pt/afreitas/aulas/port/anos60.pdf · Microsoft PowerPoint - anos60.pptx Author: mlebr Created Date: 4/11/2019 9:56:03 AM ...](https://static.cupdf.com/doc/110x72/5f4fffaf5f1a036794327147/i-u-v-u-v-u-microsoft-powerpoint-anos60pptx-author-mlebr-created.jpg)


