Module 1 Lesson 6 Proportional Graphs.notebook
1
December 12, 2016
HW• Module 1 Lesson 6 Problem Set
# 1, 2, 3• CR # 8 Due Wed 12/14
Module 1 Lesson 6 Identifying Proportional
and Non-Proportional Relationships in Graphs
Do Now

Module 1 Lesson 6 Proportional Graphs.notebook
2
December 12, 2016
Do Now Extention
Tap

Module 1 Lesson 6 Proportional Graphs.notebook
3
December 12, 2016
Lesson 4 Problem Set 21
Module 1 Lesson 6 Proportional Graphs.notebook
4
December 12, 2016
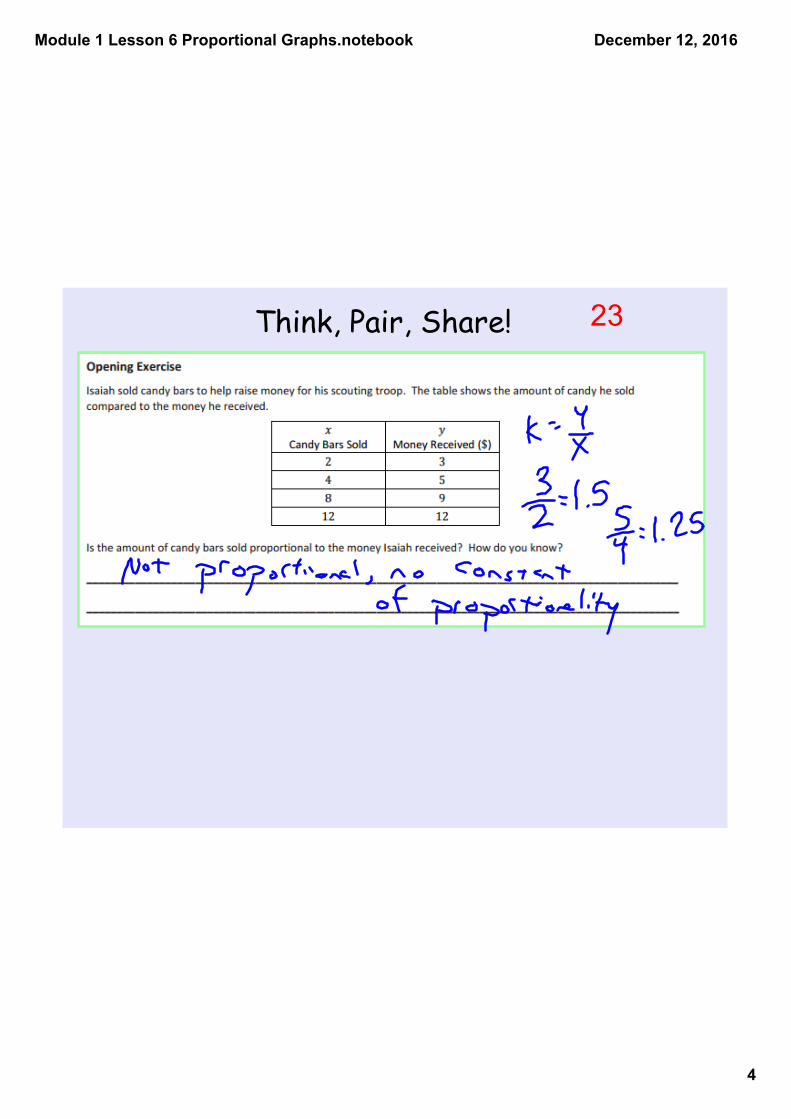
Think, Pair, Share! 23

Module 1 Lesson 6 Proportional Graphs.notebook
5
December 12, 2016
4 6
6 9
8 12
Work with your partner...
1) The points appear on a line
2) The line goes through the origin.
4 6
6 9
8 12
tap
23

Module 1 Lesson 6 Proportional Graphs.notebook
6
December 12, 2016
Important Note:
Characteristics of graphs of proportional relationships:
1. Points lie in a straight line.2. Line goes through the origin.
24
Module 1 Lesson 6 Proportional Graphs.notebook
7
December 12, 2016
tap
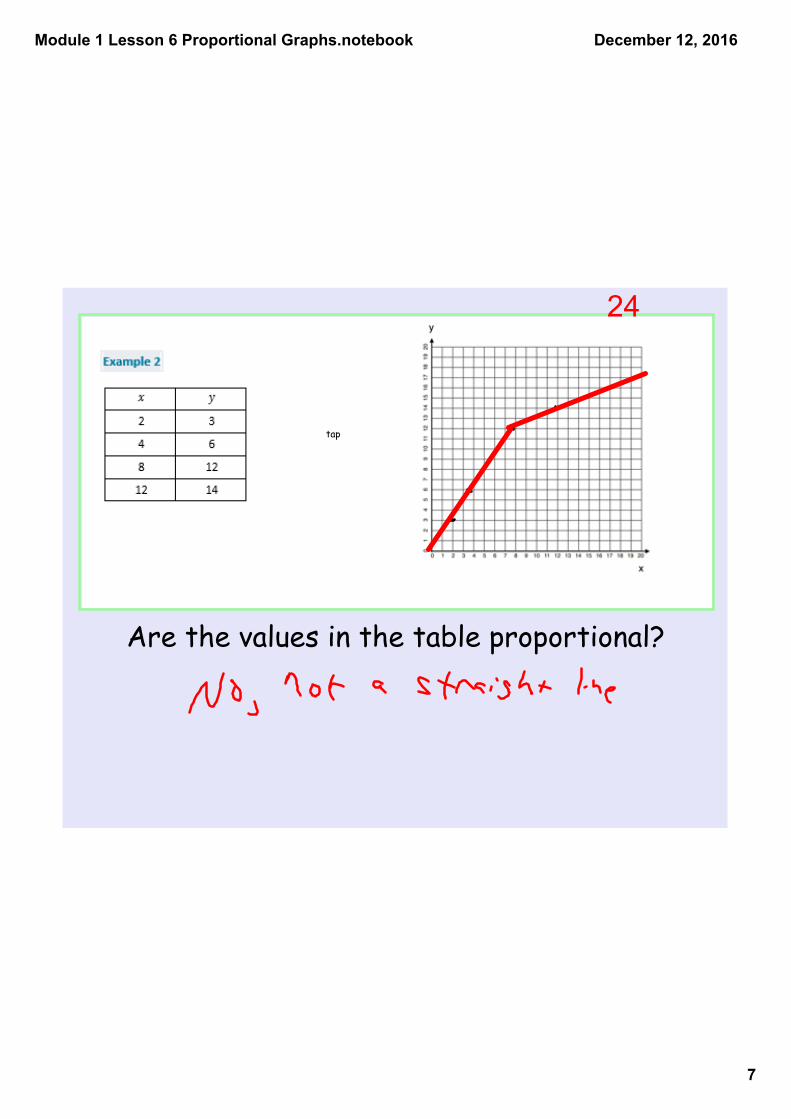
Are the values in the table proportional?
24

Module 1 Lesson 6 Proportional Graphs.notebook
8
December 12, 2016
tap
• What do you know about the ratios in this table?
• What can you predict about the graph of this ratio table?
24

Module 1 Lesson 6 Proportional Graphs.notebook
9
December 12, 2016
Compare Example 1 and Example 3

Module 1 Lesson 6 Proportional Graphs.notebook
10
December 12, 2016
Closing Questions1. How are proportional quantities represented in a graph? They are represented in a graph where the points lie on a straight
line that passes through the origin.
2. What is a common mistake a student might make when deciding whether a graph of two quantities shows that they are proportional to each other? Both graphs can have points that lie on a straight line, but the graph
of the quantities that are proportional to each other also goes through the origin. In addition the graph could go through the origin, but the points do not lie on a straight line.

Module 1 Lesson 6 Proportional Graphs.notebook
11
December 12, 2016
Module 1 Lesson 6 Proportional Graphs.notebook
12
December 12, 2016
Trade a Problem
Make two graphs, one that is proportional and one that is not. Trade with your partner and determine which of their examples is proportional.