Microwave Wireless Power Transmission Techniques
with
Microstrip Antennas in Human Tissue
for
Biomedical Applications
Robert Shuhdi Salama, BEng. (Hons. 1)
A thesis submitted for the degree of
Doctor of Philosophy in Engineering
SCHOOL OF COMPUTING, ENGINEERING AND MATHEMATICS
UNIVERSITY OF WESTERN SYDNEY
SYDNEY, AUSTRALIA
July 2015
©Robert Shuhdi Salama, 2015

To: The Lord, Shuhdi, Suhair, Salwa, Selvia, Tatiana,
Parthenia, and Gabriella

DECLARATION
Date: July 2015
Author: Robert Shuhdi Salama
Title: Microwave Wireless Power Transmission Techniques with Microstrip
Antennas in Human Tissue for Biomedical Applications
Degree: Ph.D.
I certify that the work presented in this thesis is, to the best of my knowledge and belief,original, except as acknowledged in the text, and that the material has not been submitted, eitherin full or in part, for a degree at this or any other institution.
I certify that I have complied with the rules, requirements, procedures and policy relatingto my higher degree research award at the University of Western Sydney.
Author’s Signature

ACKNOWLEDGEMENTS
I express my deepest gratitude to my principal supervisor, Dr Ranjith Liyanapathirana,
for his continuous guidance, advice, encouragement and support.
I am thankful and truly indebted to my co-supervisor, Dr. Sergey Kharkovsky, who
has been a source of generosity, insight and inspiration for all my efforts during the last
three years of my candidature. I owe my research achievements to his expert guidance,
consistent support and motivation.
I would like to thank my co-supervisor, Dr. Upul Gunawardana, for his continuous
support and valuable advice throughout my candidature.
I would also like to acknowledge Dr. Antonio Lauto, School of Science and Health,
University of Western Sydney, whose ideas inspired and initiated this work.
I gratefully acknowledge the University of Western Sydney (UWS) for granting me
the UWS Postgraduate Award Scholarship which has been a keystone for the completion
of this work. I sincerely appreciate the travel grants provided by the School of Comput-
ing, Engineering and Mathematics (SCEM) that supported publication of my research
results in national and international conferences.
I am thankful to all technical, administrative and academic staff at SCEM who di-
rectly or indirectly helped me during my candidature. I am also thankful to all my
research colleagues for their support, encouragement and friendship.
I am always grateful and truly indebted to my beloved parents who have not spared
an effort on my education since my childhood. I am also deeply grateful to my loving
wife and daughters who have always been supportive, patient, and encouraging.
ABSTRACT
The main aim of this thesis is the investigation and optimisation of microstrip antennas
and microwave techniques for wireless power transmission in human tissue at 2.45 GHz
(i.e., in the Industrial, Scientific, and Medical band). For this purpose, microstrip anten-
nas of different geometries and sizes and a microwave two-antenna setup that includes
an implantable encased antenna and an external antenna, are designed and investigated
computationally and experimentally.
An implantable antenna module was designed by enclosing a microstrip rectangular
patch antenna inside a protective dielectric housing. The simulation results showed that,
by optimising the dimensions and the dielectric properties of the protective housing, the
influence of the surrounding material on the performance of the implanted antenna can
be reduced and the efficiency of wireless power transmission can be increased.
The performance of wireless power transmission in different materials including tis-
sue mimicking gel and fresh minced meat was experimentally investigated using a mea-
surement system with the two-antenna setup. A parametric study was performed using
the measured and simulated transmission coefficients to determine the unknown elec-
trical properties of the materials. The measurement and simulation results are in good
agreement.
An implantable miniature encased microstrip ring disk antenna was designed and
optimised for wireless power transmission in human tissue, and a computational model
of a measurement system was proposed and used to characterise microwave two-antenna
setup techniques. It was found that, by matching the resonant frequencies, aligning the
directions of propagation of the electromagnetic waves and electric field polarisation
vectors of the external and implanted antennas, maximum wireless power transmission in
human tissue can be achieved even if the external and implanted antennas have different
geometries and sizes. It was also found that reflections of the electromagnetic waves at
the air-tissue interface can be reduced and the efficiency of microwave wireless power
transmission techniques can be significantly enhanced by adding a matching dielectric
layer between the external antenna and human tissue.
A novel implantable open cylindrical-rectangular microstrip patch antenna was pro-

v
posed and investigated. This antenna has a geometry and size that facilitates its direct
implantation on nerves for the purpose of nerve stimulation. The simulation results
showed that the two-antenna setup with the proposed antenna and a rectifier is capa-
ble of delivering a DC stimulus that can be used for nerve regeneration with a specific
absorption rate that conforms to the IEEE safety standards.
The results in this thesis showed that wireless power transmission in human tissue
using microwave techniques with implantable microstrip antennas can provide sufficient
power levels to be used for biomedical applications such as nerve stimulation. The use
of microwave wireless power transmission with miniature implanted antennas can result
in significant miniaturisation of implantable medical devices by eliminating the need for
the implanted battery.

Contents
Acknowledgement iii
Abstract iv
Contents vi
Abbreviations x
Notation xi
List of Figures xiii
List of Tables xxii
1 Introduction 1
1.1 Motivation and Research Objectives . . . . . . . . . . . . . . . . . . . 3
1.1.1 Motivation . . . . . . . . . . . . . . . . . . . . . . . . . . . . 3
1.1.2 Research Objectives . . . . . . . . . . . . . . . . . . . . . . . 4
1.2 Major Contributions . . . . . . . . . . . . . . . . . . . . . . . . . . . . 5
1.3 Publications . . . . . . . . . . . . . . . . . . . . . . . . . . . . . . . . 6
1.4 Thesis Organisation . . . . . . . . . . . . . . . . . . . . . . . . . . . . 8
2 Literature Review 11
2.1 Introduction . . . . . . . . . . . . . . . . . . . . . . . . . . . . . . . . 11
2.2 Electrical Stimulation of Nerves . . . . . . . . . . . . . . . . . . . . . 11
2.3 Active Implantable Medical Devices . . . . . . . . . . . . . . . . . . . 14
2.4 Wireless Power Transmission in Human Tissue . . . . . . . . . . . . . 15

vii
2.5 Implantable Antennas . . . . . . . . . . . . . . . . . . . . . . . . . . . 17
2.6 Specific Absorption Rate (SAR) . . . . . . . . . . . . . . . . . . . . . 21
2.7 Research Methodology . . . . . . . . . . . . . . . . . . . . . . . . . . 22
2.8 Conclusion . . . . . . . . . . . . . . . . . . . . . . . . . . . . . . . . 24
3 Microwave Wireless Power Transmission with Microstrip Rectangular Patch
Antennas: Simulation 26
3.1 Introduction . . . . . . . . . . . . . . . . . . . . . . . . . . . . . . . . 26
3.2 Background . . . . . . . . . . . . . . . . . . . . . . . . . . . . . . . . 27
3.2.1 Microstrip Rectangular Patch Antennas . . . . . . . . . . . . . 27
3.2.2 Wireless Power Transmission in Lossy Materials . . . . . . . . 32
3.3 Simulation Approach . . . . . . . . . . . . . . . . . . . . . . . . . . . 35
3.4 Electromagnetic Performance in Free Space . . . . . . . . . . . . . . . 37
3.4.1 Design of Microstrip Patch Antenna Module . . . . . . . . . . 37
3.4.2 Wireless Power Transmission in Free Space . . . . . . . . . . . 52
3.5 Electromagnetic Performance in Human Tissue . . . . . . . . . . . . . 63
3.5.1 Microstrip Patch Antenna Module . . . . . . . . . . . . . . . . 63
3.5.2 Wireless Power Transmission in Human Tissue . . . . . . . . . 71
3.6 Electromagnetic Performance in Other Material . . . . . . . . . . . . . 82
3.6.1 Microstrip Patch Antenna Module . . . . . . . . . . . . . . . . 82
3.6.2 Wireless Power Transmission . . . . . . . . . . . . . . . . . . 89
3.7 Sensitivity Study: Parametric Variability . . . . . . . . . . . . . . . . . 99
3.7.1 Parametric Variability: Free Space . . . . . . . . . . . . . . . . 100
3.7.2 Parametric Variability: Human Tissue . . . . . . . . . . . . . . 103
3.8 Conclusion . . . . . . . . . . . . . . . . . . . . . . . . . . . . . . . . 107
4 Microwave Wireless Power Transmission with Microstrip Rectangular Patch
Antennas: Measurement 109
4.1 Introduction . . . . . . . . . . . . . . . . . . . . . . . . . . . . . . . . 109
4.2 Measurement Approach . . . . . . . . . . . . . . . . . . . . . . . . . . 110
4.3 Measurements in Free Space . . . . . . . . . . . . . . . . . . . . . . . 111
4.3.1 Fabricated Microstrip Patch Antenna Module . . . . . . . . . . 111

viii
4.3.2 Wireless Power Transmission in Free Space . . . . . . . . . . . 115
4.4 Measurements with Tissue Mimicking Gel . . . . . . . . . . . . . . . . 116
4.4.1 Performance of Implanted Microstrip Patch Antenna Module . . 116
4.4.2 Wireless Power Transmission in Tissue Mimicking Gel . . . . . 121
4.5 Measurements with Other Materials . . . . . . . . . . . . . . . . . . . 123
4.5.1 Microwave Wireless Power Transmission in Fresh Minced Meat 123
4.5.2 Microwave Wireless Power Transmission in Concrete . . . . . . 126
4.6 Electrical Properties of Material: Measurement and Simulation Results . 130
4.7 Conclusion . . . . . . . . . . . . . . . . . . . . . . . . . . . . . . . . 138
5 Implantable Miniature Encased Microstrip Ring Disk Antenna 140
5.1 Introduction . . . . . . . . . . . . . . . . . . . . . . . . . . . . . . . . 140
5.2 Performance of Miniature Microstrip Ring Disk Antenna: Free Space . 140
5.3 Performance of Encased Miniature Microstrip Disk Antenna: Free Space 145
5.4 Performance of Encased Miniature Microstrip Disk Antenna: Human
Tissue . . . . . . . . . . . . . . . . . . . . . . . . . . . . . . . . . . . 149
5.5 Parametric Study and Optimisation . . . . . . . . . . . . . . . . . . . . 153
5.6 Conclusion . . . . . . . . . . . . . . . . . . . . . . . . . . . . . . . . 169
6 Microwave Wireless Power Transmission Techniques with Miniature En-
cased Microstrip Ring Disk Antenna 172
6.1 Introduction . . . . . . . . . . . . . . . . . . . . . . . . . . . . . . . . 172
6.2 Simulation Approach . . . . . . . . . . . . . . . . . . . . . . . . . . . 173
6.3 Plane Wave Excitation . . . . . . . . . . . . . . . . . . . . . . . . . . 174
6.4 Microwave Technique with Two-Antenna Setup . . . . . . . . . . . . . 177
6.5 Sensitivity Study: Parametric Variability . . . . . . . . . . . . . . . . . 186
6.6 Computational Model of a Measurement System to Characterise and Op-
timise Microwave Techniques in Human Tissue . . . . . . . . . . . . . 189
6.6.1 Measures of Efficiency: S-parameters . . . . . . . . . . . . . . 190
6.6.2 Optimisation using a Dielectric Layer . . . . . . . . . . . . . . 196
6.6.3 Measures of Efficiency: DC Output . . . . . . . . . . . . . . . 201
6.7 Microwave Technique for Nerve Stimulation . . . . . . . . . . . . . . . 202

ix
6.8 Conclusion . . . . . . . . . . . . . . . . . . . . . . . . . . . . . . . . 216
7 Microwave Technique with Implantable Open Cylindrical-Rectangular Mi-
crostrip Patch Antenna for Nerve Stimulation 218
7.1 Introduction . . . . . . . . . . . . . . . . . . . . . . . . . . . . . . . . 218
7.2 Simulation Approach . . . . . . . . . . . . . . . . . . . . . . . . . . . 219
7.3 An Implantable Cylindrical-Rectangular Microstrip Patch Antenna . . . 219
7.3.1 Free Space . . . . . . . . . . . . . . . . . . . . . . . . . . . . 219
7.3.2 Encased Antenna in Human Tissue . . . . . . . . . . . . . . . 225
7.4 An Implantable Encased Open Cylindrical-Rectangular Microstrip Patch
Antenna . . . . . . . . . . . . . . . . . . . . . . . . . . . . . . . . . . 229
7.4.1 Free Space . . . . . . . . . . . . . . . . . . . . . . . . . . . . 229
7.4.2 Optimisation of the Antenna in Human Tissue . . . . . . . . . . 232
7.5 Microwave Wireless Power Transmission in Human Tissue . . . . . . . 239
7.5.1 Two-Antenna Setup . . . . . . . . . . . . . . . . . . . . . . . . 243
7.5.2 Sensitivity Study: Parametric Variability . . . . . . . . . . . . . 247
7.5.3 Two-Antenna Setup with a Rectifier for Nerve Stimulation . . . 248
7.6 Conclusion . . . . . . . . . . . . . . . . . . . . . . . . . . . . . . . . 254
8 Summary and Conclusion 256
8.1 Summary . . . . . . . . . . . . . . . . . . . . . . . . . . . . . . . . . 256
8.2 Conclusion . . . . . . . . . . . . . . . . . . . . . . . . . . . . . . . . 258
8.3 Future Work . . . . . . . . . . . . . . . . . . . . . . . . . . . . . . . . 259
References 261

Abbreviations
AC alternating current
AIMD active implantable medical device
CRMA cylindrical-rectangular microstrip patch antenna
DC direct current
ISM Industrial, Scientific and Medical
MICS Medical Implant Communication Service
MRDA miniature microstrip ring disk antenna
MRPA microstrip rectangular patch antenna
MWS Microwave Studio
PIFA planar inverted-F antenna
RF Radio Frequency
SAR specific absorption rate
SCI spinal cord injury
SMA SubMiniature Version A
VNA vector network analyser

Notation
S11 magnitude of the reflection coefficient (dB) at port 1
S12 magnitude of the transmission coefficient (dB) from port 2 to port 1
S21 magnitude of the transmission coefficient (dB) from port 1 to port 2
S22 magnitude of the reflection coefficient (dB) at port 2
εm relative dielectric constant of the matching layer
εrs relative dielectric constant of the substrate
tan δm loss tangent of the matching layer
Lel electrical length of the rectangular patch antenna
Le separation distance of the two-antenna setup with medium lossy material
Lf separation distance of the two-antenna setup in free space
Lp length of the rectangular patch
Ls length of the substrate of the microstrip rectangular patch antenna (MRPA)
Lt separation distance of the two-antenna setup with human tissue
Vdc received DC voltage at the rectenna’s output
Vr received AC voltage at the implanted antenna’s output
Wf width of the microstrip line
Wp width of the rectangular patch
Ws width of the substrate of the MRPA
Ψpx angle of the electric field polarisation vector at θ = 0o
Ψpz angle of the electric field polarisation vector at θ = 87o
εrg relative dielectric constant of the tissue mimicking gel
εrt relative dielectric constant of human tissue

xii
φ azimuthal angle in degrees
σg conductivity of the tissue mimicking gel
σt conductivity of human tissue
θ elevation angle in degrees
di implantation depth of the implanted open CRMA in human tissue
fif resonant frequency of the MRPA module in free space
fim resonant frequency of the implanted MRPA module in medium lossy material
fit resonant frequency of the implanted MRPA module in human tissue
fr resonant frequency
li length of the inset feed of the MRPA
t1 thickness of the top air-gap
t2 thickness of the bottom air-gap
tg thickness of the tissue block
tan δs loss tangent of the substrate
tan δc loss tangent of concrete
wi width of the inset feed of the MRPA

List of Figures
3.1 Schematic of a classical MRPA. . . . . . . . . . . . . . . . . . . . . . 28
3.2 Electric field intensity distribution under the patch of a classical MRPA
operating in the dominant mode. . . . . . . . . . . . . . . . . . . . . . 28
3.3 Several feeding techniques for microstrip patch antennas. . . . . . . . . 31
3.4 Schematic of wireless power transmission in lossy material. . . . . . . . 32
3.5 Layered structure of an implanted MRPA in lossy material. . . . . . . . 34
3.6 Layered structure of an implanted MRPA in human tissue. . . . . . . . 35
3.7 CST models of the MRPA without and with SMA connector. . . . . . . 38
3.8 S11 of MRPA without and with SMA connector. . . . . . . . . . . . . . 40
3.9 CST model of the MRPA in free space. . . . . . . . . . . . . . . . . . . 41
3.10 Resonant response of the MRPA vs the length for various widths of the
inset feed. . . . . . . . . . . . . . . . . . . . . . . . . . . . . . . . . . 42
3.11 S11 vs frequency of the MRPA with inset feed in free space. . . . . . . 42
3.12 Electric field intensity distribution at 2.45 GHz and 4.05 GHz of the
MRPA in free space. . . . . . . . . . . . . . . . . . . . . . . . . . . . 44
3.13 Far-field pattern at 2.5 GHz of the MRPA in free space. . . . . . . . . . 45
3.14 Schematic of the MRPA module without and with an air-gap. . . . . . . 46
3.15 CST model of the MRPA module with and without SMA connector. . . 47
3.16 fif and S11 vs t1 for various t2 of the MRPA module in free space. . . . 48
3.17 CST model of the MRPA module in free space. . . . . . . . . . . . . . 49
3.18 S11 vs frequency of the MRPA module in free space. . . . . . . . . . . 49
3.19 Electric field intensity distribution of the MRPA module in free space. . 50
3.20 Far-field pattern of the MRPA module in free space. . . . . . . . . . . . 51

xiv
3.21 CST model the antenna module in free space when excited by an incident
plane wave. . . . . . . . . . . . . . . . . . . . . . . . . . . . . . . . . 53
3.22 Electric field intensity distribution in free space due to an incident plane
wave. . . . . . . . . . . . . . . . . . . . . . . . . . . . . . . . . . . . 54
3.23 CST model of the microstrip rectangular patch rectenna in free space. . 55
3.24 AC and DC signals at the output of the antenna module in free space
when excited by an incident plane wave. . . . . . . . . . . . . . . . . . 56
3.25 CST model of the two-antenna setup with MRPAs in free space. . . . . 57
3.26 S-parameters of the two-antenna setup with MRPAs in free space. . . . 59
3.27 Electric field intensity distribution of the two-antenna setup with MRPAs
in free space. . . . . . . . . . . . . . . . . . . . . . . . . . . . . . . . 60
3.28 Far-field pattern of the two-antenna setup with MRPAs in free space. . . 62
3.29 CST model of the implanted MRPA module without SMA connector in
human tissue. . . . . . . . . . . . . . . . . . . . . . . . . . . . . . . . 64
3.30 fit and S11 vs t1 for various t2 of the implanted MRPA module in human
tissue. . . . . . . . . . . . . . . . . . . . . . . . . . . . . . . . . . . . 65
3.31 CST model of the implanted MRPA module in human tissue. . . . . . . 67
3.32 S11 of the implanted MRPA module in human tissue. . . . . . . . . . . 67
3.33 Electric field intensity distribution of the implanted MRPA module in
human tissue. . . . . . . . . . . . . . . . . . . . . . . . . . . . . . . . 68
3.34 Electric field intensity distribution at 2.56 GHz in the vicinity of the
MRPA module in human tissue . . . . . . . . . . . . . . . . . . . . . . 69
3.35 Far-field pattern of the implanted MRPA module in human tissue. . . . 70
3.36 S11 versus frequency of the implanted MRPA module in human tissue
with high and low number of mesh cells in CST MWS. . . . . . . . . . 71
3.37 CST model of the implanted antenna module in human tissue when ex-
cited by an incident plane wave. . . . . . . . . . . . . . . . . . . . . . 72
3.38 Electric field intensity distribution in human tissue within the vicinity of
the MRPA when excited by an incident plane wave. . . . . . . . . . . . 73
3.39 AC and DC signals at the output of the implanted MRPA module in
human tissue due to an incident plane wave. . . . . . . . . . . . . . . . 74
xv
3.40 CST model of the two-antenna setup with MRPAs in human tissue. . . . 76
3.41 S-parameters of the two-antenna setup with MRPAs in human tissue. . . 77
3.42 Electric field intensity distribution of the two-antenna setup with MRPAs
in human tissue. . . . . . . . . . . . . . . . . . . . . . . . . . . . . . . 79
3.43 Far-field pattern of the two-antenna setup with MRPAs in human tissue. 80
3.44 CST model of the implanted MRPA module in medium lossy material
without the SMA connector. . . . . . . . . . . . . . . . . . . . . . . . 83
3.45 fim and S11 vs t1 for various t2 of the implanted MRPA module in
medium lossy material. . . . . . . . . . . . . . . . . . . . . . . . . . . 84
3.46 CST model of the implanted MRPA module with air-gaps in medium
lossy material. . . . . . . . . . . . . . . . . . . . . . . . . . . . . . . . 85
3.47 S11 of the implanted MRPA module in medium lossy material. . . . . . 86
3.48 Electric field intensity distribution of the implanted MRPA module in
medium lossy. . . . . . . . . . . . . . . . . . . . . . . . . . . . . . . . 87
3.49 Far-field pattern of the implanted MRPA module in medium lossy material. 88
3.50 CST model of the implanted antenna module in a medium lossy material
when excited by an incident plane wave. . . . . . . . . . . . . . . . . . 90
3.51 Electric field intensity distribution within the vicinity of the MRPA in
medium lossy material from an incident plane wave. . . . . . . . . . . 91
3.52 AC and DC signals at the output of the implanted MRPA module in
medium lossy material from an incident plane wave. . . . . . . . . . . 92
3.53 CST model of the two-antenna setup with MRPAs in medium lossy ma-
terial. . . . . . . . . . . . . . . . . . . . . . . . . . . . . . . . . . . . 93
3.54 S-parameters of the two-antenna setup with MRPAs in medium lossy
material . . . . . . . . . . . . . . . . . . . . . . . . . . . . . . . . . . 94
3.55 Electric field intensity distribution of the two-antenna setup MRPAs in
medium lossy material. . . . . . . . . . . . . . . . . . . . . . . . . . . 96
3.56 Far-field pattern of the two-antenna setup with MRPAs in medium lossy
material. . . . . . . . . . . . . . . . . . . . . . . . . . . . . . . . . . . 97
3.57 CST model of the two-antenna setup with MRPAs in free space used in
the sensitivity study. . . . . . . . . . . . . . . . . . . . . . . . . . . . . 100

xvi
3.58 CST model of the two-antenna setup with MRPAs in human tissue used
in the sensitivity study. . . . . . . . . . . . . . . . . . . . . . . . . . . 104
4.1 Manufactured MRPA in free space. . . . . . . . . . . . . . . . . . . . . 112
4.2 Measured and simulated S11 of the MRPA in free space. . . . . . . . . 112
4.3 Manufactured MRPA module in free space. . . . . . . . . . . . . . . . 114
4.4 Measured S11 of the MRPA module in free space. . . . . . . . . . . . . 114
4.5 Measurement system with the two-antenna setup in free space. . . . . . 115
4.6 Measured S-parameters of the two-antenna setup with MRPAs in free
space. . . . . . . . . . . . . . . . . . . . . . . . . . . . . . . . . . . . 117
4.7 Implanted MRPA module in fabricated tissue mimicking liquid. . . . . 118
4.8 Manufactured MRPA implanted module in tissue mimicking gel. . . . . 120
4.9 Measured S11 of the MRPA implanted in tissue mimicking gel. . . . . . 120
4.10 Measurement system with the two-antenna setup in tissue mimicking gel. 121
4.11 Measured S-parameters of the two-antenna setup with MRPAs in tissue
mimicking gel. . . . . . . . . . . . . . . . . . . . . . . . . . . . . . . 122
4.12 Measurement system of the two-antenna setup in fresh minced meat. . . 124
4.13 S-parameters of the two-antenna setup with MRPAs in fresh minced meat. 125
4.14 Fabricated MRPA module implanted in a concrete cube. . . . . . . . . . 127
4.15 Measured S11 of the implanted MRPA module in a concrete cube. . . . 128
4.16 Measurement system with the two-antenna setup in a 250-mm concrete
specimen. . . . . . . . . . . . . . . . . . . . . . . . . . . . . . . . . . 128
4.17 Measured S-parameters of the two-antenna setup with MRPA module in
concrete. . . . . . . . . . . . . . . . . . . . . . . . . . . . . . . . . . . 129
4.18 Measured and simulated S-parameters in free space, tissue mimicking
gel and concrete for various separation distances. . . . . . . . . . . . . 134
4.19 S21 vs the conductivity σg of the simulated human tissue. . . . . . . . . 135
4.20 Measured and simulated S21 vs Lt of the two-antenna setup with MRPA
module in tissue mimicking gel. . . . . . . . . . . . . . . . . . . . . . 137
4.21 S21 vs the loss tangent tan δc of the concrete cube. . . . . . . . . . . . 137
xvii
4.22 Measured and simulated S21 vsLe of the two-antenna setup with MRPAs
in concrete. . . . . . . . . . . . . . . . . . . . . . . . . . . . . . . . . 138
5.1 Geometry of the miniature microstrip ring disk antenna (MRDA) in free
space. . . . . . . . . . . . . . . . . . . . . . . . . . . . . . . . . . . . 141
5.2 S11 vs frequency of the MRDA in free space. . . . . . . . . . . . . . . 142
5.3 Schematic of the MRDA without and with a 50 Ω resistor. . . . . . . . 143
5.4 S11 vs the value R of the resistive load. . . . . . . . . . . . . . . . . . . 144
5.5 S11 of the MRDA in free space with a 50 Ω resistor. . . . . . . . . . . . 144
5.6 Schematic of the encased MRDA. . . . . . . . . . . . . . . . . . . . . 146
5.7 S11 of the encased MRDA in free space. . . . . . . . . . . . . . . . . . 147
5.8 Electric field intensity distribution of the encased MRDA in free space. . 148
5.9 Far-field pattern in polar and 3-D formats of the encased MRDA in free
space. . . . . . . . . . . . . . . . . . . . . . . . . . . . . . . . . . . . 148
5.10 CST model of the implantable encased MRDA. . . . . . . . . . . . . . 150
5.11 S11 of the MRDA implanted in 24-mm cube of human tissue. . . . . . . 150
5.12 Electric field intensity distribution of the MRDA implanted in human
tissue. . . . . . . . . . . . . . . . . . . . . . . . . . . . . . . . . . . . 151
5.13 Far-field pattern of the MRDA implanted in human tissue. . . . . . . . 152
5.14 Effect of the length of the annular ring α on fr and S11 . . . . . . . . . 154
5.15 Effect of εrs on fr and S11 . . . . . . . . . . . . . . . . . . . . . . . . 156
5.16 S11 of the implanted optimised MRDA. . . . . . . . . . . . . . . . . . 158
5.17 Electric field intensity distribution of the implanted optimised MRDA in
human tissue. . . . . . . . . . . . . . . . . . . . . . . . . . . . . . . . 158
5.18 Far-field pattern of the implanted optimised MRDA in human tissue. . . 159
5.19 Electric field intensity distribution of the implanted optimised MRDA in
human tissue. . . . . . . . . . . . . . . . . . . . . . . . . . . . . . . . 160
5.20 CST model of the implanted optimised MRDA in 500-mm cube of hu-
man tissue. . . . . . . . . . . . . . . . . . . . . . . . . . . . . . . . . 161
5.21 S11 of the MRDA implanted in 500-mm cube of human tissue. . . . . . 161
xviii
5.22 Electric field intensity distribution of the implanted optimised MRDA in
500-mm cube of human tissue. . . . . . . . . . . . . . . . . . . . . . . 162
5.23 Far-field pattern of the implanted optimised MRDA in 500-mm cube of
human tissue. . . . . . . . . . . . . . . . . . . . . . . . . . . . . . . . 163
5.24 S11 of the MRDA with εrs = 2.6 implanted in human tissue. . . . . . . 164
5.25 Electric field intensity distribution of the MRDA with εrs = 2.6 im-
planted in human tissue. . . . . . . . . . . . . . . . . . . . . . . . . . 165
5.26 Far-field pattern of the MRDA with εrs = 2.6 implanted in human tissue. 166
5.27 S11 of the MRDA (εrs = 2.6) implanted at a depth of 3 mm from the
surface of human tissue. . . . . . . . . . . . . . . . . . . . . . . . . . 167
5.28 Electric field intensity distribution of the MRDA (εrs = 2.6) implanted
at a depth of 3 mm in human tissue. . . . . . . . . . . . . . . . . . . . 168
5.29 Far-field pattern of the MRDA (εrs = 2.6) implanted at a depth of 3.0
mm in human tissue. . . . . . . . . . . . . . . . . . . . . . . . . . . . 169
6.1 Schematic of the wireless power transmission technique with plane wave
excitation. . . . . . . . . . . . . . . . . . . . . . . . . . . . . . . . . . 174
6.2 Vr vs the angle of the electric field polarisation vector of the inciden
plane wave at θ = 00. . . . . . . . . . . . . . . . . . . . . . . . . . . . 176
6.3 Vr vs the elevation angle for Ψpx = 0o. . . . . . . . . . . . . . . . . . . 176
6.4 Vr vs the angle of the electric field polarisation vector of the incident
plane wave at θ = 870. . . . . . . . . . . . . . . . . . . . . . . . . . . 177
6.5 S11 of the external MRPA in free space. . . . . . . . . . . . . . . . . . 178
6.6 CST model of the two-antenna setup in two different arrangements. . . 179
6.7 S-parameters for the two-antenna setup when the external MRPA is placed
at θ = 0o. . . . . . . . . . . . . . . . . . . . . . . . . . . . . . . . . . 180
6.8 Electric field distribution for the two-antenna with the MRPA at θ = 0o. 181
6.9 Far-field pattern in the 3-D format of the two-antenna setup at θ = 0o. . 182
6.10 S21 vs the elevation angle of the external MRPA. . . . . . . . . . . . . 182
6.11 S21 vs the angle of the electric field polarisation vector of the external
MRPA. . . . . . . . . . . . . . . . . . . . . . . . . . . . . . . . . . . 183
xix
6.12 S-parameters for the two-antenna setup when the external MRPA is placed
at θ = 87o. . . . . . . . . . . . . . . . . . . . . . . . . . . . . . . . . . 184
6.13 Electric field distribution for the two-antenna with the external MRPA at
θ = 87o. . . . . . . . . . . . . . . . . . . . . . . . . . . . . . . . . . . 184
6.14 Far-field pattern in 3-D format of the two-antenna setup at θ = 87o. . . . 185
6.15 S21 vs the relative dielectric constant of the human tissue for various tan δt.187
6.16 Schematic of the computational model of the measurement system to
characterise microwave techniques in human tissue. . . . . . . . . . . . 190
6.17 CST model of the wireless power transmission technique in a 500-mm
cube of human tissue. . . . . . . . . . . . . . . . . . . . . . . . . . . . 191
6.18 S-parameters of the wireless power transmission technique for two rela-
tive dielectric constants of the substrates. . . . . . . . . . . . . . . . . . 192
6.19 S21 vs the separation distance of the external MRPA. . . . . . . . . . . 194
6.20 Electric field distribution of the two-antenna setup in human tissue. . . . 194
6.21 Electric field distribution of the two-antenna setup (close view). . . . . 195
6.22 CST model of the wireless power transmission technique with a match-
ing layer. . . . . . . . . . . . . . . . . . . . . . . . . . . . . . . . . . 196
6.23 S-parameters of the wireless power transmission technique with a match-
ing layer. . . . . . . . . . . . . . . . . . . . . . . . . . . . . . . . . . 197
6.24 Electric field distribution of the two-antenna setup with a matching layer. 198
6.25 CST model of the wireless power transmission technique with the match-
ing layer and with the external MRPA module at θ = 90o. . . . . . . . . 198
6.26 S-parameters of the wireless power transmission technique with the match-
ing layer and with the external MRPA module at θ = 90o. . . . . . . . . 199
6.27 Electric field distribution of the wireless power transmission technique
with the matching layer and with the external MRPA module at θ = 90o. 200
6.28 S21 vs the loss tangent tan δm of the matching layer. . . . . . . . . . . 201
6.29 CST model of the wireless power transmission technique with the im-
planted miniature microstrip ring disk rectenna. . . . . . . . . . . . . . 203
6.30 DC signal at the implanted rectenna’s output. . . . . . . . . . . . . . . 203
6.31 CST model of the two-antenna setup with a matching box. . . . . . . . 204

xx
6.32 S-parameters of the two-antenna setup with the matching box. . . . . . 205
6.33 Electric field distribution of the two-antenna setup with the matching box. 206
6.34 CST model of the wireless power transmission technique when the ex-
ternal MRPA is inside the modified matching box. . . . . . . . . . . . . 207
6.35 S-parameters of the two-antenna setup with the modified matching box. 208
6.36 Electric field distribution of the two-antenna setup with the modified
matching box (d = 50 mm). . . . . . . . . . . . . . . . . . . . . . . . 210
6.37 Electric field distribution of the two-antenna setup with the modified
matching box (d = 20 mm). . . . . . . . . . . . . . . . . . . . . . . . 211
6.38 Vdc of the two-antenna setup with the modified matching box. . . . . . . 214
6.39 SAR distribution in human tissue at 2.45 GHz. . . . . . . . . . . . . . . 215
6.40 SAR in human tissue from different types of external power sources. . . 215
7.1 CST model of the cylindrical-rectangular microstrip patch antenna (CRMA)
in free space. . . . . . . . . . . . . . . . . . . . . . . . . . . . . . . . 220
7.2 fr and S11 versus fp of the CRMA in free space. . . . . . . . . . . . . . 222
7.3 S11 vs frequency of the CRMA in free space. . . . . . . . . . . . . . . 222
7.4 Electric field distribution of the CRMA in free space. . . . . . . . . . . 223
7.5 Far-field pattern of the CRMA in free space. . . . . . . . . . . . . . . . 224
7.6 CST model of the CRMA implanted in human tissue. . . . . . . . . . . 226
7.7 S11 vs frequency of the CRMA implanted in human tissue. . . . . . . . 227
7.8 Electric field distribution of the CRMA implanted in human tissue. . . . 227
7.9 Far-field pattern of the CRMA implanted in human tissue. . . . . . . . 228
7.10 CST model of the open CRMA in free space. . . . . . . . . . . . . . . 230
7.11 S11 vs frequency of the open CRMA in free space. . . . . . . . . . . . 230
7.12 Electric field distribution of the open CRMA in free space. . . . . . . . 231
7.13 Far-field pattern of the open CRMA in free space. . . . . . . . . . . . . 232
7.14 CST model of the open CRMA implanted in human tissue. . . . . . . . 233
7.15 fr and S11 vs fp of the open CRMA implanted in human tissue. . . . . . 234
7.16 fr and S11 vs εrs of the open CRMA implanted in human tissue. . . . . 235
7.17 S11 vs frequency of the implanted optimised open CRMA in human tissue.236

xxi
7.18 Electric field distribution of the open CRMA implanted in human tissue. 237
7.19 Far-field pattern of the open CRMA implanted in human tissue. . . . . . 238
7.20 CST model of the open CRMA implanted in a 300-mm cube of human
tissue. . . . . . . . . . . . . . . . . . . . . . . . . . . . . . . . . . . . 240
7.21 S11 vs frequency of the open CRMA in a 300-mm cube of human tissue. 240
7.22 Electric field distribution of the open CRMA in a 300-mm cube of hu-
man tissue. . . . . . . . . . . . . . . . . . . . . . . . . . . . . . . . . 241
7.23 Far-field pattern of the open CRMA implanted in a 300-mm cube of
human tissue. . . . . . . . . . . . . . . . . . . . . . . . . . . . . . . . 242
7.24 CST model of the wireless power transmission technique with the match-
ing box used in the sensitivity study. . . . . . . . . . . . . . . . . . . . 243
7.25 Magnitudes of the S-parameters of the two-antenna setup with the match-
ing box. . . . . . . . . . . . . . . . . . . . . . . . . . . . . . . . . . . 244
7.26 Electric field distribution in human tissue of the two-antenna setup. . . . 245
7.27 Far-field pattern of the two-antenna setup with the open CRMA im-
planted in human tissue. . . . . . . . . . . . . . . . . . . . . . . . . . 246
7.28 S21 vs implantation depth di of the CRMA in human tissue. . . . . . . . 248
7.29 S21 of the microwave technique with the open CRMA under variations
in εrt. . . . . . . . . . . . . . . . . . . . . . . . . . . . . . . . . . . . 249
7.30 S21 of the microwave technique with the open CRMA under variations
in tan δt. . . . . . . . . . . . . . . . . . . . . . . . . . . . . . . . . . 249
7.31 CST model of the open cylindrical-rectangular microstrip patch rectenna. 250
7.32 Vdc at the output of the implanted open cylindrical rectenna for different
Pe. . . . . . . . . . . . . . . . . . . . . . . . . . . . . . . . . . . . . . 251
7.33 SAR in human tissue at different power levels Pe of the external MRPA
module. . . . . . . . . . . . . . . . . . . . . . . . . . . . . . . . . . . 251
7.34 Vdc from the implanted cylindrical rectenna for Pe = 0.5 W . . . . . . . 252
7.35 SAR in human tissue from the microwave technique with the open cylin-
drical antenna. . . . . . . . . . . . . . . . . . . . . . . . . . . . . . . . 253

List of Tables
3.1 Resonant performance of the two-antenna setup with MRPAs in free space. 63
3.2 Resonant response of the two-antenna setup with MRPAs in human tissue. 81
3.3 Resonant performance of the two-antenna setup with MRPAs in medium
lossy material. . . . . . . . . . . . . . . . . . . . . . . . . . . . . . . . 98
3.4 Influence of variations in some of the physical and electrical properties
of the MRPA module on selected resonant parameters of the two-antenna
setup with MRPAs in free space. . . . . . . . . . . . . . . . . . . . . . 102
3.5 Influence of variations in some of the physical and electrical properties
of the implanted MRPA module and the electrical properties of human
tissue on selected resonant parameters of the two-antenna setup. . . . . 105
4.1 Measured and simulated results of the resonant frequencies and mag-
nitudes of the S-parameters of the two-antenna setup with MRPAs in
different materials. . . . . . . . . . . . . . . . . . . . . . . . . . . . . 132
5.1 Performance of three miniature MRDAs in human tissue. . . . . . . . . 157
6.1 Summary of the results on the effect of parametric variability on the
performance of the microwave technique with the two-antenna setup in
human tissue. . . . . . . . . . . . . . . . . . . . . . . . . . . . . . . . 188
6.2 Summary of the performance of the wireless power transmission tech-
nique when the external MRPA is inside the modified matching box. . . 209
6.3 Summary of the received DC signals and corresponding SAR values for
different power levels Pe. . . . . . . . . . . . . . . . . . . . . . . . . . 213

Chapter 1
Introduction
The efficacy of electrical stimulation in addressing a number of neurological disorders
has strongly motivated the development of active (battery operated) implantable medical
devices for a variety of biomedical applications. In this context, a low intensity electrical
stimulus is delivered to a specific location (referred to as the stimulation site) inside
the human body. Current active implantable medical devices (AIMDs) consist of an
implanted battery (as a power source) with the device, an electronic circuitry, and a pair
of electrodes for delivering the electrical stimulus to the stimulation site.
The research community and biomedical industry have explored other non-conventional
interdisciplinary methods such as nerve stimulation because the current conventional
medical methods have shown low efficacy in the treatment of a number of neurological
disorders such as severe pain, epilepsy and Parkinson’s disease, drug resistant depres-
sion, and nerve regeneration. For example, it is known that after an initial delay period
that can reach up to 28 days, damaged peripheral nerves start to regenerate at an average
rate of 1.5 mm per day [1–5]. With such long delay period and slow regeneration rate,
loss of functionality and paralysis may be inevitable, and hence, human intervention is
crucially needed. Current conventional medical methods such as surgery, nerve grafts,
and drugs (medication) have low efficacy in nerve regeneration. On the other hand, elec-
trical stimulation have shown high efficacy in accelerating the regeneration process of
damaged nerves [4, 6–8].

2
Leading companies such as Medtronic, Boston Scientific, and Cyberonics use elec-
trical stimulation from battery operated AIMDs for the treatment of severe pain, epilepsy
and Parkinson’s disease, and drug resistant depression, respectively. The current battery
operated AIMDs have continuous issues with battery depletion and recharging. For ex-
ample, in March 2014 Medtronic Australasia in consultation with Therapeutic Goods
Administration (part of the Australian Government Department of Health) has issued
a hazard alert in regards to multiple models of its implantable neuro-stimulators which
resulted in premature depletion of the battery [9].
In addition to battery depletion and recharging issues, the battery adds a considerable
size to the overall size of the AIMD and also increases the risk of toxicity. Due to the
considerable size of current AIMDs, the surgical procedure is complicated by installing
the battery pack in a different (usually in the thigh or chest area) location of the human
body, and the electrical stimulus is delivered via wired electrodes that are channelled
through the body to the stimulation site.
The overall size of AIMDs can be significantly reduced, by using wireless power
transmission in human tissue. In wireless power transmission, an external (outside of
the human body) power source transmits a wireless electromagnetic signal towards an
implanted medical device which receives the electromagnetic signal and uses it to power
the associated circuitry. In most cases of wireless power transmission an external an-
tenna is used to transmit the electromagnetic signal which is received by another antenna
implanted inside the human body.
There are two main approaches for wireless power transmission in human tissue.
The first approach is based on a low-frequency (up to 13.56 MHz) magnetic field cou-
pling (referred to as inductive coupling) between an external coil (i.e., an external power
source) and an implanted coil. Inductive coupling has been thoroughly investigated in
the literature and is being used for a number of practical applications such as wirelessly
recharging battery operated AIMDs. Lower losses in human tissue with lower frequency
has been the motivation for using inductive coupling in biomedical applications. How-
3
ever, the disadvantages of using low-frequency is the need for large transmitting and re-
ceiving coils. Some of the other disadvantages of inductive coupling include significant
attenuation with distance and high sensitivity to misalignment between the transmitting
and receiving coils.
Recent emerging research is exploring high-frequency (in the microwave range)
wireless power transmission techniques in human tissue. Several studies have shown
that optimum wireless power transmission can be achieved around 1-2 GHz in lossy ma-
terials [10,11]. Unlike inductive coupling, at these frequencies electromagnetic energy is
radiated from the external antenna and is received by the implanted antenna. Microwave
wireless power transmission enables the use of miniaturised implanted antennas when
compared to the large implanted coils with inductive coupling. The removal of the im-
planted battery and the use of microwave wireless power transmission can result in a
significant reduction in the overall size of AIMDs and enables their installation on the
stimulation site which simplifies the surgical procedure.
1.1 Motivation and Research Objectives
1.1.1 Motivation
The performance of microwave wireless power transmission techniques in human tissue
is strongly dependent on the performance of the transmitting (external) and receiving
(implanted) antennas, reflection and scattering of electromagnetic signals at the air-tissue
interface, implantation depth of the receiving antenna and losses in the human tissue. Im-
plantable microstrip antennas of different geometries and sizes have been designed and
investigated in the literature to operate in the Industrial, Scientific and Medical (ISM)
band. However, the performance of these implanted microstrip antennas have been in-
vestigated when operating as single antennas only and not as part of full microwave
wireless power transmission techniques.
The work in this thesis is motivated by the lack of information on the performance

4
of microwave wireless power transmission techniques in human tissue at 2.45 GHz in
the ISM band. Part of the work in this thesis has, been inspired by and contributed to, a
patent application [12] for an apparatus that facilitates the treatment of tissue.
1.1.2 Research Objectives
Characterisation and optimisation of microwave techniques for wireless power transmis-
sion in human tissue using in-vivo performance measurements is complicated, risky, and
time consuming. However, the use of tissue mimicking gel [13] and advanced compu-
tational tools for electromagnetic applications can significantly facilitate the simulation
and optimisation of microwave techniques for implantable applications [10,11,14]. The
research objectives of this thesis are:
• Investigate and optimise microstrip antennas and microwave techniques for wire-
less power transmission in human tissue at 2.45 GHz.
• Create simulation models of microwave wireless power transmission techniques
with microstrip antennas, and provide extensive simulation and optimisation of
these techniques with different materials followed by experimental verifications
of these models.
• Develop and apply a computational model of a measurement system to evaluate the
efficiency of microwave wireless power transmission techniques in human tissue
using a two-antenna setup with implantable miniature microstrip antennas.
• Develop advanced implantable antennas and rectennas for wireless power trans-
mission in human tissue for the purpose of nerve stimulation with a specific ab-
sorption rate (SAR) that satisfies the IEEE safety standards.

5
1.2 Major Contributions
In this thesis, microstrip antennas and microwave techniques for wireless power trans-
mission in human tissue are investigated and optimised at 2.45 GHz. For this purpose,
microstrip antennas of different geometries and sizes have been designed, manufactured,
and investigated in simulated human tissue, manufactured tissue mimicking gel, and
fresh minced meat.
The major contributions include:
• It is shown that symmetry in the electromagnetic performances which includes
matching the resonant frequencies, aligning the directions of propagation of the
electromagnetic waves and electric field polarisation vectors of both the external
and implanted antennas, is essential to achieve maximum wireless power transmis-
sion in human tissue. It is also shown that when symmetry is obtained, effective
microwave wireless power transmission can be achieved even if the external and
implanted antennas have different geometries and sizes.
• Measurement results of the performance of microwave wireless power transmis-
sion in tissue mimicking gel and minced meat are presented and compared to sim-
ulation results. It is shown that measurement and simulation results can be used to
determine the electrical properties of the manufactured tissue mimicking gel and
minced meat.
• Good agreement between measurement and simulation results verifies the simu-
lation models and shows that electromagnetic computational tools can be used to
investigate the performance of microwave wireless power transmission in human
tissue and in other materials of different lossiness. Correct mesh and accuracy set-
tings in the simulation models that are needed to obtain accurate simulation results
are also identified and discussed.
• A sensitivity study is performed to show the effect of variations in the physical di-
6
mensions and electrical properties of the implanted antenna and the human tissue
on the performance of the microwave wireless power transmission technique. The
results of this study show that microwave wireless power transmission in human
tissue can have stable and reliable performance that relates to the design perfor-
mance. The stability in the performance of the microwave technique shows its po-
tential to be used as a power source for battery-less AIMDs in practical biomedical
applications.
• A computational model of a measurement system is proposed and used to eval-
uate the efficiency of microwave wireless power transmission techniques. It is
shown that the performance, particularly the efficiency, of microwave wireless
power transmission in human tissue is affected by reflections of the electromag-
netic signal radiated from the external antenna at the air-tissue interface. However,
it is also shown that by inserting a matching layer between the human tissue and
the external antenna the amount of reflections can be reduced and the efficiency of
microwave wireless power transmission can be significantly enhanced.
• A novel open cylindrical-rectangular microstrip patch antenna that can be installed
directly on nerves is proposed and investigated at 2.45 GHz when implanted in
human tissue. It is shown that microwave wireless power transmission with the
implantable open cylindrical-rectangular microstrip patch antenna is capable of
delivering an electrical stimulus that can be used for biomedical applications such
as nerve regeneration with a SAR that conforms to the IEEE standards.
1.3 Publications
The following papers that were either published by or submitted to peer-reviewed jour-
nals or conference proceedings , patent application, and award are the outcomes of this
thesis:
7
1. R. Salama, S. Kharkovsky, R. Liyanapathirana and U. Gunawardana, "Optimiza-
tion of microwave technique for wireless power transmission in human tissue",
IEEE Transactions on Antennas and Propagation, submitted Nov. 2014, under
review.
2. R. Salama, S. Kharkovsky, R. Liyanapathirana and U. Gunawardana, "An im-
plantable encased microstrip ring rectenna for wireless biomedical applications,"
in Proceedings of the IEEE International Instrumentation and Measurement Tech-
nology Conference (I2MTC), pp. 667-670, 6-9 May 2013, Minneapolis, USA,
doi:10.1109/I2MTC.2013.6555499.
3. R. Salama and S. Kharkovsky, "An embeddable microwave patch antenna mod-
ule for civil engineering applications," in Proceedings of the IEEE International
Instrumentation and Measurement Technology Conference (I2MTC), pp. 27-30,
6-9 May 2013, Minneapolis, USA, doi:10.1109/I2MTC.2013.6555374.
4. A. Lauto, G. Gargiulo, U. Gunawardana, R. Salama and R. Liyanapathirana. Inter-
national Patent Application No.: PCT/AU2013/000028, Patent Publication Date:
25.07.2013 "An apparatus and method for facilitating treatment of tissue", Avail-
able: http://patentscope.wipo.int/search/en/WO2013106884.
5. R. Salama, S. Kharkovsky, R. Liyanapathirana and U. Gunawardana, "An im-
plantable encased microstrip ring disk antenna," in Proceedings of the Interna-
tional Symposium on Communication Information Technology (ISCIT), pp. 649-
653, 2-5 Oct. 2012, Gold Coast, Australia, doi:10.1109/ISCIT.2012.6380980.
6. R. Salama, S. Kharkovsky, R. Liyanapathirana and U. Gunawardana, "An im-
plantable miniature microstrip disk antenna," in Proceedings of the IEEE Inter-
national Symposium on Antennas and Propagation, 2 pages, Jul. 2012, Chicago,
USA, doi: 10.1109/APS.2012.6349414.
Awards:

8
International Instrumentation and Measurement Technology Conference (I2MTC)
2013, Graduate Student Best Poster Award - 2nd Place -, May 6-9, 2013, Min-
neapolis, USA.
1.4 Thesis Organisation
The remainder of this thesis is organised as follows:
• Chapter 2 provides a comprehensive review on wireless power transmission and
implantable microstrip antennas. The large size of current implantable active (bat-
tery operated) medical devices are highlighted. Wireless power transmission with
inductive coupling and the emerging microwave techniques in human tissue are
also discussed. The specific absorption rate from several implantable antennas is
also reviewed. Finally, motivation for this thesis and the research methodology are
also discussed.
• In Chapter 3, simulation results on wireless power transmission with microstrip
rectangular patch antennas are provided. First, a background on the design of mi-
crostrip rectangular patch antennas from first principles and wireless power trans-
mission in lossy materials is discussed. Second, a rectangular microstrip patch an-
tenna module that operates in the ISM band is designed and simulation models are
created. Third, the performance of the microstrip rectangular patch antenna mod-
ule and the performance of microwave wireless power transmission techniques
are both investigated in different lossy materials. Finally, a sensitivity study is
performed to ensure that, in practice, the microwave wireless power transmission
technique has a reliable performance that corresponds to the design performance.
• Chapter 4 provides measurement results on the performance of the microwave
wireless power transmission in lossy materials with microstrip rectangular patch
antennas. First, an external microstrip rectangular patch antenna and an implantable
9
antenna module are manufactured. Next, the performances of the microstrip patch
antenna module and wireless power transmission techniques are investigated in
free space, with tissue mimicking gel and fresh minced meat. Finally, a compari-
son between the measured and simulated (from Chapter 3) results is provided and
the electrical properties of both the manufactured tissue mimicking gel and fresh
minced meat are determined.
• In Chapter 5, an implantable miniature microstrip ring disk antenna is designed
and investigated. A parametric study is performed to optimise the performance of
the implanted miniature microstrip ring disk antenna at 2.45 GHz in human tissue.
• Chapter 6 investigates the performance of the microwave wireless power transmis-
sion technique with the miniature microstrip ring disk antenna in human tissue. A
computational model of a measurement system is proposed and used to evaluate
the efficiency of microwave wireless power transmission techniques in human tis-
sue. A sensitivity study is also performed to investigate the effect of variations
in the physical dimensions and electrical properties of the disk antenna and the
electrical dimensions of human tissue on the performance of the wireless power
transmission technique. Furthermore, the capability of the wireless power trans-
mission technique with the microstrip ring disk antenna and a rectifier to provide
an electrical stimulus that can be used for nerve stimulation is also demonstrated.
Finally, safety issues in regards to radiation hazards are evaluated by computing
the SAR in human tissue.
• Chapter 7 presents a novel implantable encased open cylindrical-rectangular mi-
crostrip patch antenna. The main feature in the design of this antenna is a lon-
gitudinal vertical slot along the full height of the antenna. The open cylindrical
antenna is completely encased and its performance is investigated in free space
and in human tissue. The capability of the microwave wireless power transmission
technique with the open cylindrical antenna and a rectifier to deliver an electrical

10
stimulus that can be used for nerve stimulation with a SAR that conforms to the
IEEE standards is demonstrated.
• In chapter 8, a conclusion and summary on the investigations, research findings
and outcomes, and recommendations for future work are presented.
Chapter 2
Literature Review
2.1 Introduction
Battery operated AIMDs that provide a stimulating electrical current are currently being
developed and used for a variety of biomedical applications. In this context, electrical
stimulation is used in the effective treatment of neurological disorders that could not
be treated by using conventional medical methods such as surgery or medication. In
this chapter the current need for AIMDs for the purpose of nerve regeneration and the
problem with the size of current devices are highlighted. An overview on the current
wireless power transmission approaches and their main components is also provided.
Furthermore, a research problem pertaining to the lack of information on the electro-
magnetic performance of microwave wireless power transmission in human tissue is
formulated. In addition, research tools that can be used to investigate the electromag-
netic performance of microwave wireless power transmission in human tissue are also
reviewed.
2.2 Electrical Stimulation of Nerves
Damage to peripheral nerves and the spinal cord can result in severe health problems
and in some cases may lead to permanent disability (e.g., paralysis) or death. In Europe
12
alone over 300,000 cases per year of peripheral nerve injury are recorded [15]. The
estimated annual costs attributed to spinal cord injury (SCI) was $9.7 billion in 1998
and significantly increased by 317% to $40.5 billion (not including losses in wages and
productivity) in 2008 [16].
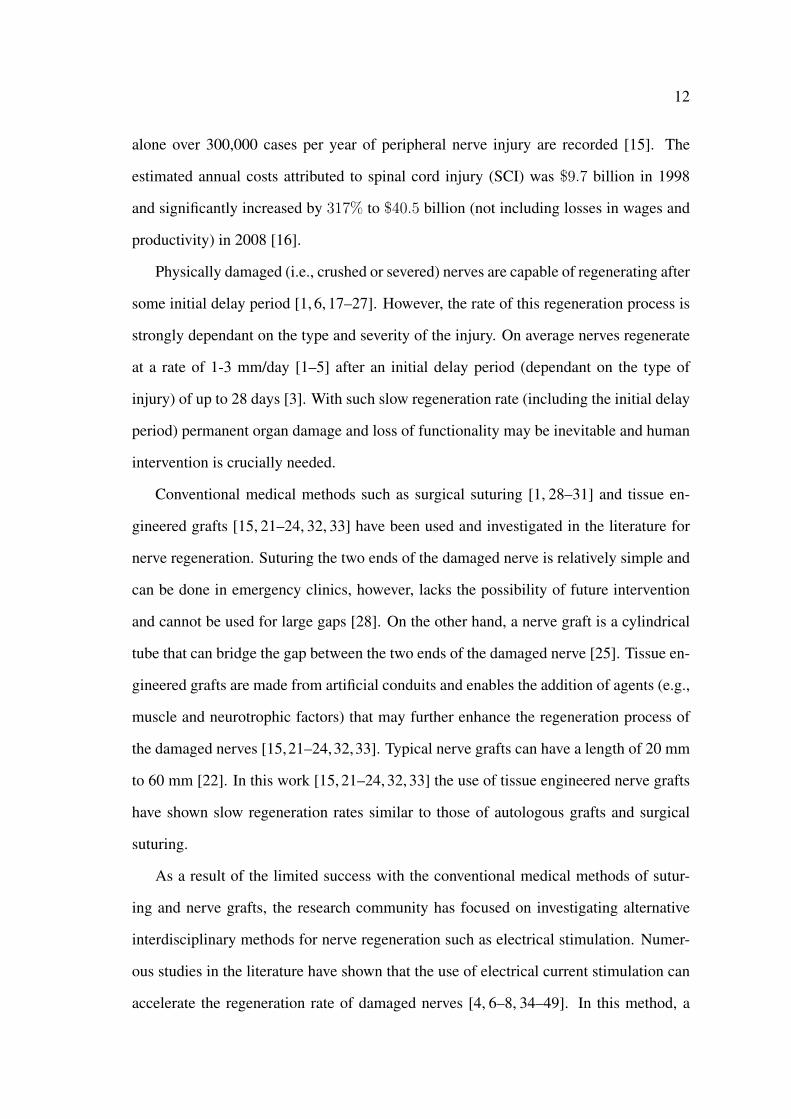
Physically damaged (i.e., crushed or severed) nerves are capable of regenerating after
some initial delay period [1, 6, 17–27]. However, the rate of this regeneration process is
strongly dependant on the type and severity of the injury. On average nerves regenerate
at a rate of 1-3 mm/day [1–5] after an initial delay period (dependant on the type of
injury) of up to 28 days [3]. With such slow regeneration rate (including the initial delay
period) permanent organ damage and loss of functionality may be inevitable and human
intervention is crucially needed.
Conventional medical methods such as surgical suturing [1, 28–31] and tissue en-
gineered grafts [15, 21–24, 32, 33] have been used and investigated in the literature for
nerve regeneration. Suturing the two ends of the damaged nerve is relatively simple and
can be done in emergency clinics, however, lacks the possibility of future intervention
and cannot be used for large gaps [28]. On the other hand, a nerve graft is a cylindrical
tube that can bridge the gap between the two ends of the damaged nerve [25]. Tissue en-
gineered grafts are made from artificial conduits and enables the addition of agents (e.g.,
muscle and neurotrophic factors) that may further enhance the regeneration process of
the damaged nerves [15,21–24,32,33]. Typical nerve grafts can have a length of 20 mm
to 60 mm [22]. In this work [15, 21–24, 32, 33] the use of tissue engineered nerve grafts
have shown slow regeneration rates similar to those of autologous grafts and surgical
suturing.
As a result of the limited success with the conventional medical methods of sutur-
ing and nerve grafts, the research community has focused on investigating alternative
interdisciplinary methods for nerve regeneration such as electrical stimulation. Numer-
ous studies in the literature have shown that the use of electrical current stimulation can
accelerate the regeneration rate of damaged nerves [4, 6–8, 34–49]. In this method, a
13
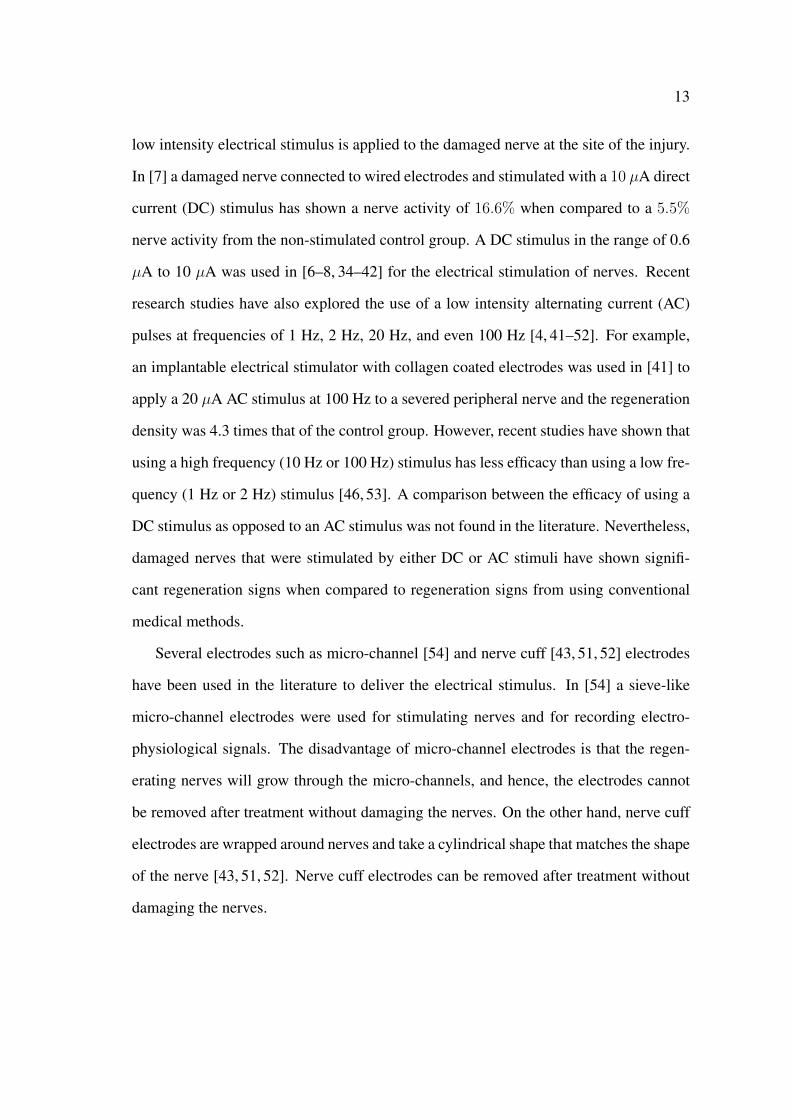
low intensity electrical stimulus is applied to the damaged nerve at the site of the injury.
In [7] a damaged nerve connected to wired electrodes and stimulated with a 10 µA direct
current (DC) stimulus has shown a nerve activity of 16.6% when compared to a 5.5%
nerve activity from the non-stimulated control group. A DC stimulus in the range of 0.6
µA to 10 µA was used in [6–8, 34–42] for the electrical stimulation of nerves. Recent
research studies have also explored the use of a low intensity alternating current (AC)
pulses at frequencies of 1 Hz, 2 Hz, 20 Hz, and even 100 Hz [4, 41–52]. For example,
an implantable electrical stimulator with collagen coated electrodes was used in [41] to
apply a 20 µA AC stimulus at 100 Hz to a severed peripheral nerve and the regeneration
density was 4.3 times that of the control group. However, recent studies have shown that
using a high frequency (10 Hz or 100 Hz) stimulus has less efficacy than using a low fre-
quency (1 Hz or 2 Hz) stimulus [46, 53]. A comparison between the efficacy of using a
DC stimulus as opposed to an AC stimulus was not found in the literature. Nevertheless,
damaged nerves that were stimulated by either DC or AC stimuli have shown signifi-
cant regeneration signs when compared to regeneration signs from using conventional
medical methods.
Several electrodes such as micro-channel [54] and nerve cuff [43, 51, 52] electrodes
have been used in the literature to deliver the electrical stimulus. In [54] a sieve-like
micro-channel electrodes were used for stimulating nerves and for recording electro-
physiological signals. The disadvantage of micro-channel electrodes is that the regen-
erating nerves will grow through the micro-channels, and hence, the electrodes cannot
be removed after treatment without damaging the nerves. On the other hand, nerve cuff
electrodes are wrapped around nerves and take a cylindrical shape that matches the shape
of the nerve [43, 51, 52]. Nerve cuff electrodes can be removed after treatment without
damaging the nerves.
14
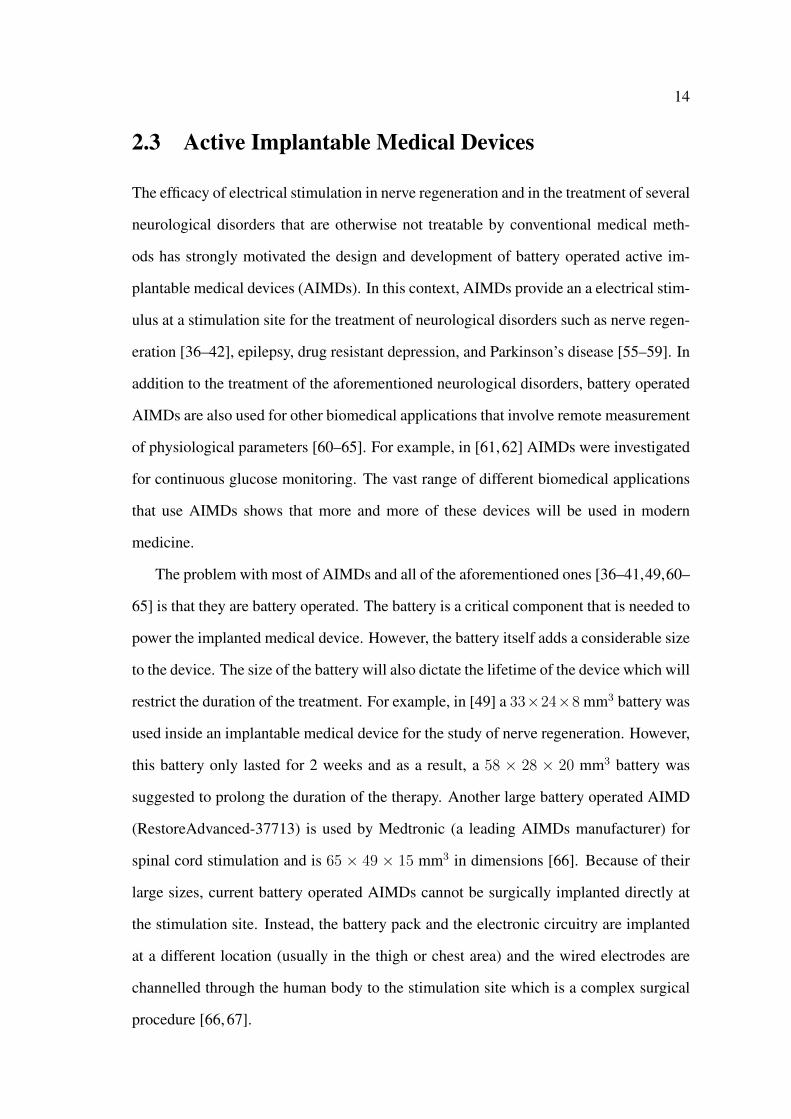
2.3 Active Implantable Medical Devices
The efficacy of electrical stimulation in nerve regeneration and in the treatment of several
neurological disorders that are otherwise not treatable by conventional medical meth-
ods has strongly motivated the design and development of battery operated active im-
plantable medical devices (AIMDs). In this context, AIMDs provide an a electrical stim-
ulus at a stimulation site for the treatment of neurological disorders such as nerve regen-
eration [36–42], epilepsy, drug resistant depression, and Parkinson’s disease [55–59]. In
addition to the treatment of the aforementioned neurological disorders, battery operated
AIMDs are also used for other biomedical applications that involve remote measurement
of physiological parameters [60–65]. For example, in [61,62] AIMDs were investigated
for continuous glucose monitoring. The vast range of different biomedical applications
that use AIMDs shows that more and more of these devices will be used in modern
medicine.
The problem with most of AIMDs and all of the aforementioned ones [36–41,49,60–
65] is that they are battery operated. The battery is a critical component that is needed to
power the implanted medical device. However, the battery itself adds a considerable size
to the device. The size of the battery will also dictate the lifetime of the device which will
restrict the duration of the treatment. For example, in [49] a 33×24×8 mm3 battery was
used inside an implantable medical device for the study of nerve regeneration. However,
this battery only lasted for 2 weeks and as a result, a 58 × 28 × 20 mm3 battery was
suggested to prolong the duration of the therapy. Another large battery operated AIMD
(RestoreAdvanced-37713) is used by Medtronic (a leading AIMDs manufacturer) for
spinal cord stimulation and is 65 × 49 × 15 mm3 in dimensions [66]. Because of their
large sizes, current battery operated AIMDs cannot be surgically implanted directly at
the stimulation site. Instead, the battery pack and the electronic circuitry are implanted
at a different location (usually in the thigh or chest area) and the wired electrodes are
channelled through the human body to the stimulation site which is a complex surgical
procedure [66, 67].
15
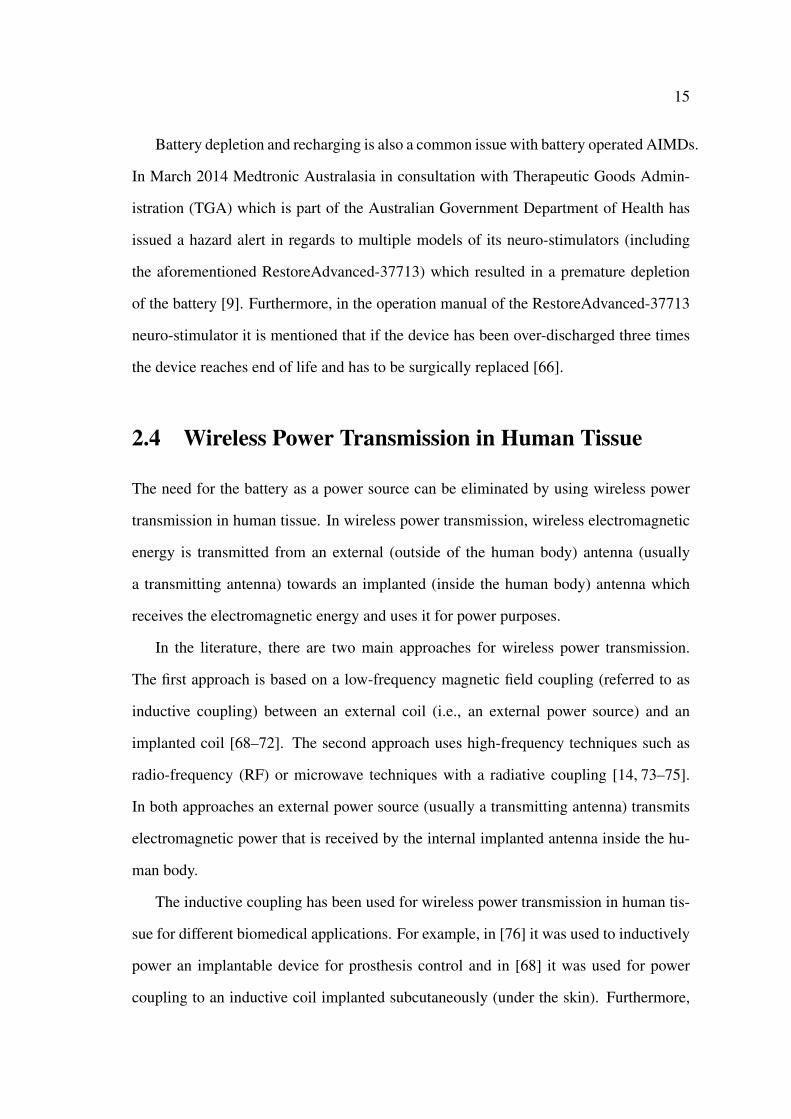
Battery depletion and recharging is also a common issue with battery operated AIMDs.
In March 2014 Medtronic Australasia in consultation with Therapeutic Goods Admin-
istration (TGA) which is part of the Australian Government Department of Health has
issued a hazard alert in regards to multiple models of its neuro-stimulators (including
the aforementioned RestoreAdvanced-37713) which resulted in a premature depletion
of the battery [9]. Furthermore, in the operation manual of the RestoreAdvanced-37713
neuro-stimulator it is mentioned that if the device has been over-discharged three times
the device reaches end of life and has to be surgically replaced [66].
2.4 Wireless Power Transmission in Human Tissue
The need for the battery as a power source can be eliminated by using wireless power
transmission in human tissue. In wireless power transmission, wireless electromagnetic
energy is transmitted from an external (outside of the human body) antenna (usually
a transmitting antenna) towards an implanted (inside the human body) antenna which
receives the electromagnetic energy and uses it for power purposes.
In the literature, there are two main approaches for wireless power transmission.
The first approach is based on a low-frequency magnetic field coupling (referred to as
inductive coupling) between an external coil (i.e., an external power source) and an
implanted coil [68–72]. The second approach uses high-frequency techniques such as
radio-frequency (RF) or microwave techniques with a radiative coupling [14, 73–75].
In both approaches an external power source (usually a transmitting antenna) transmits
electromagnetic power that is received by the internal implanted antenna inside the hu-
man body.
The inductive coupling has been used for wireless power transmission in human tis-
sue for different biomedical applications. For example, in [76] it was used to inductively
power an implantable device for prosthesis control and in [68] it was used for power
coupling to an inductive coil implanted subcutaneously (under the skin). Furthermore,
16
in [77] inductive coupling was used to wirelessly recharge a battery operated implantable
acquisition system for neural firing patterns. It was also used to power wireless capsule
endoscopy devices in a two-hop scheme where large coils wrapped around the human
body relayed power from transmitting coils under the room floor to the ingested en-
doscopy capsule [72].
Due to tissue absorption loss most implantable medical devices that use inductive
coupling for wireless power transmission into human tissue operate at frequencies be-
low 13.56 MHz which requires the use of relatively large implantable coils [68–72].
Some of the disadvantages of inductive coupling include short transmission range (a few
centimetres) [14], a relatively large size of the implanted coil (due to the low frequency
of operation), and the restriction to human or animal motion [72, 77].
Therefore, recent investigations into wireless power transmission with coils demon-
strate a trend of using higher frequency that includes radio and microwave frequen-
cies [10, 14, 73, 74, 78]. At these frequencies part of the energy is transferred by ra-
diation in addition to the inductive coupling [10]. For instance, it was shown that the
optimal power transfer between an external coil and an implanted coil occurred at ∼1
GHz where energy is exchanged through a combination of inductive and radiative cou-
pling [10]. In [11] a numerical study of wireless power transmission to a cardiac implant
showed that for this application the maximum efficiency of energy transfer occurred at
the optimal frequency of ∼1.7 GHz. Another study on wireless power transmission to
miniature implants showed that the maximum power transmission can be achieved at
∼ 1.6 GHz [79].
In addition to high frequency inductive coupling with coils, wireless power trans-
mission in human tissue can also be achieved using radiating antennas where an electro-
magnetic signal is radiated from the external antenna and is received by the implanted
antenna. In [75] the safety implications of RF power to implantable devices at 2.4 GHz
was considered. Nevertheless, in [75] only an external transmitting dipole antenna was
used and an entire microwave wireless power transmission technique was not investi-
17
gated. One of the challenges with using microwave techniques with radiating antennas
is reflections and scattering of the radiated electromagnetic signal from the external an-
tenna at the tissue-air interface [75].
RF and microwave techniques have a great potential in providing robust and reli-
able wireless power transmission using significantly miniaturised implantable medical
devices [14, 80]. Furthermore, the significant miniaturisation of the overall AIMD sim-
plifies the surgical procedure by enabling the direct implantation of the device on the site
of installation. However, there is lack of information in the literature on the electromag-
netic performance of microwave wireless power transmission techniques.
2.5 Implantable Antennas
The electromagnetic performance of microwave wireless power transmission techniques
is strongly dependent on the performance of both the external and implanted antennas.
Different types of antennas can be used for wireless power transmission. Microstrip an-
tennas have shown strong potential for several wireless biomedical applications. Because
of their conformability and small size [81], microstrip patch antennas can be designed in
different geometries and sizes. In the literature, microstrip antennas of different geome-
tries and sizes have been thoroughly investigated, [13,82–132] for different applications.
For example, a planar inverted-F antenna (PIFA) (32 × 24 × 8 mm3) operating at
400 MHz, i.e., in the Medical Implant Communication Service (MICS) band was inves-
tigated in [82] for implantable applications. In [128] a partially-folded PIFA (26.0 ×
19.0 × 4.4 mm3) operating at 900 MHz was proposed for recording physiological sig-
nals in rats. A smaller size (9.25 × 8.0 × 3.2 mm3) PIFA was investigated as part of
an implantable biotelemetry system in [133]. However, being a battery operated RF
identification (RFID) system resulted in an implantable device with an overall size of
62.0× 35.0× 7.8 mm3. In [83] a spiral 26.6× 16.8× 6.0 mm3 implantable antenna op-
erating in the MICS band was investigated for telemetry and command to a pacemaker
18
implant. Another spiral antenna (11.9×18.2×1.9 mm3) was investigated in [13] for dual
band operation in both the MICS and ISM bands. The antenna in [13] was implanted at a
depth of 3 mm under a layer of skin. In [129] the performance of an implantable serpen-
tine antenna was investigated in the MICS band for the purpose of communicating with
medical implants such as an artificial cardiac pacemaker. The size of this antenna was
similar to the size of the spiral antenna investigated in [83] i.e., 26.6× 16.8× 6.0 mm3.
Another implanted antenna designed for an artificial cardiac pacemaker is a PIFA which
was 35 mm by 20 mm by 3 mm in dimensions and resonated at 400 MHz [85].
A PIFA (15.0 × 15.0 × 1.2 mm3) operating at 2.45 GHz in the Industrial, Scientific
and Medical (ISM) band was investigated in [130] for intracranial pressure monitoring.
In [132] another ISM band implantable antenna (20×20×1.5 mm3) intended to operate
in the range of 2.40-2.48 GHz was designed and investigated. The measurement and
simulation results of this antenna showed that the resonant frequency of the implanted
antenna was 3.75 GHz and 4.30 GHz [132], respectively, which is not within the desired
frequency range of 2.40-2.48 GHz. In [74,131] a cardiovascular stent was configured as
dipole antenna for cardiovascular implantable devices. The stent antenna had a cylindri-
cal shape of 35 mm long and 5-6 mm in diameter.
Miniature Antennas
Implantable antennas have to be of miniature sizes and suitable geometries to be consid-
ered for direct installation on the stimulation site. All of the aforementioned antennas
are of relatively large size to be considered for direct installation on the stimulation site.
On the other hand, miniaturisation of microstrip antennas is not an easy task because
the performance of microstrip antennas deteriorates with miniaturisation. In the litera-
ture, a number of miniature antennas have been designed and investigated for different
non-biomedical and biomedical applications.

19
Free Space
A circular microstrip patch with a shorting pin was investigated in [107]. The antenna
was built on a substrate with a relative dielectric constant εr of 2.2 and resonated at
1.9 GHz with a gain of 3.8 dBi which is slightly lower than the 5.3 dBi gain of a non-
miniaturised conventional half-wavelength circular microstrip antenna. Another minia-
turised circular microstrip antenna was also designed in [107] and this antenna also had
a low gain of 1.9 dBi. A similar circular microstrip antenna with a shorting pin operat-
ing at 1.66 GHz achieved a size reduction of 88.5% in [112]. However, the miniaturised
antenna had a gain of 2.9 dBi which is lower than the 4.0 dBi gain of conventional
half-wavelength circular microstrip antenna.
In [120] a multi-layer (2-layer and 6-layer) folded microstrip patch antenna operating
at 2.4 GHz was investigated. The 2-layer antenna had a patch length, patch width, and
an antenna height of 15.5 mm, 17.5 mm, and 3 mm, respectively, with a ground plane of
21.5 mm by 21.5 mm. This 2-layer antenna had a gain of 1.59 dBi. On the other hand,
the 6-layer antenna had a patch length, patch width, and an antenna height of 5.0 mm,
6.0 mm, and 3 mm, respectively, with a ground plane 11 mm by 10 mm. The 6-layer
antenna a gain of -0.52 dBi.
Human Tissue
It can be seen from the this discussion that the performance of microstrip antennas de-
teriorates with miniaturisation even if the antenna is operating in free space. For im-
plantable antennas, this deterioration in performance is further worsened by the lossy
human tissue.
In [126] an implantable stacked disk antenna with a diameter of 15 mm and a height
of 2.5 mm operating at 402 MHz was investigated for bio-telemetry with medical im-
plants. The antenna had a low gain of -26 dBi and the resonant frequency shifted from
402 MHz to 384 MHz when implanted inside muscle tissue. Another, miniature stacked
disk shaped PIFA (with a height of 2.5 mm and a radius of 5 mm) operating in the MICS

20
band was proposed in [84] for skin tissue implantation. This antenna also had a low gain
of -34.3 dBi.
A dual band implantable antenna operating at 401 MHz and 2.45 GHz (i.e., in the
MICS and the ISM bands) was designed and investigated in [127]. The size of this
antenna was 10 mm by 32 by mm 5.2 by mm and the antenna also had a low gain of
-28.8 dBi and -18.1 dBi at 401 MHz and 2.45 GHz, respectively. In [123] a folded
cylindrical helical antenna for implantable communication devices was designed and
investigated. The antenna had a length of 17.7 mm and a diameter of 1.0 mm with a low
gain of -14.0 dBi. Another implantable miniature antenna that operated at 401 MHz with
a size of 8.2 × 8.1 × 1.0 mm3 was designed in [124]. This antenna had a significantly
low gain of -61.0 dB at 401 MHz.
It can be seen from this review that the performance of microstrip antennas in both
human tissue and free space deteriorates with miniaturisation. Furthermore, the perfor-
mance of miniaturised implantable antennas is further deteriorated by the lossy human
tissue which makes the design and investigation of miniature implantable microstrip an-
tennas a challenging task. In essence, to provide a practical and reliable microwave wire-
less power transmission technique with a microstrip antenna that is directly implanted
on the stimulation site, the geometry, size, and performance of the implanted antenna
have to be considered.
In the scope of this thesis, the main problem with all of the aforementioned im-
plantable microstrip antennas is that their performance was investigated as single trans-
mitting antennas only and not as part of an entire microwave wireless power transmis-
sion technique. The lack of information on the electromagnetic performance of wireless
power transmission with microstrip antennas and the challenges in the design of minia-
ture implantable microstrip antennas emphasises the need for the work in this thesis.
21
2.6 Specific Absorption Rate (SAR)
Since implantable antennas operate within close proximity of human tissue their safety
implications have to be evaluated. As the radiated electromagnetic signal from the ex-
ternal antenna interacts with the human tissue, some of its electromagnetic energy will
be absorbed by the tissue. This absorbed energy may give rise to the tissue’s temper-
ature and may raise serious health concerns. The amount of absorbed energy can be
determined by the specific absorption rate (SAR) which is given in W/kg as [134]:
SAR =σ|E|2
ρ(2.1)
where σ and ρ are the conductivity (S/m) and the mass density (kg/m3) of human tissue,
respectively, and E is the root mean squared (rms) electric field strength (V/m). The
specific absorption rate is averaged over a cube of tissue that has a mass of 10 gram [134].
According to the IEEE (C95.1) standards the maximum allowed SAR due to an electric
field in the frequency range of 100 kHz to 6 GHz is 2.0 W/kg [134].
The SAR of several implantable antennas have been investigated in the literature
[82–84, 91, 124–126]. In [125] the SAR of an implantable PIFA was investigated to
evaluate the capability of using microwave signals at 900 MHz for cancer treatment.
Another implantable PIFA was investigated in [82] and imposed a SAR of 209 W/kg
when excited by a 1 W input power and to conform with the IEEE standards the input
power was reduced to 7.6 mW. An analysis on the effect of the reduction of the input
power on the performance of the antenna was not given in [82].
A spiral implantable antenna was presented in [83] with a SAR of 2.75 W/kg (due
to 1 W input power) and the input power was reduced to 5.8 mW to reduce the SAR to
a safe level. In [83] the effect of the power reduction on the performance of the antenna
was not mentioned. A novel miniature stacked disk shaped antenna proposed in [84]
for skin tissue implantation imposed a SAR of 400 W/kg when the input power to the
antenna was 1 W. Hence, to comply with the IEEE standards in [84] the input power

22
to the antenna was restricted to 2.35 mW which significantly affected the performance
of the antenna with a resulting gain of -34.3 dBi. In [75] results from both theoretical
and simulation analysis were provided and used to identify the closest distance to layers
of human tissue an external antenna can be placed without exceeding the recommended
SAR at 2.4 GHz. However, in [75] the SAR was evaluated by calculating the power
density at the top layer of the human tissue and not within the vicinity of an implanted
receiving antenna inside human tissue.
2.7 Research Methodology
The electromagnetic performance of microwave wireless power transmission techniques
in human tissue can be investigated by taking one or more of the following approaches;
analytical, experimental, and/or simulation approaches. An analytical approach involves
solving Maxwell’s equations by hand, and for such complicated structures (i.e., mi-
crostrip antennas with human tissue) complicated differential equations can not be solved
by analytical methods [135–137].
An in-vivo (i.e, inside living organisms, e.g, animals and humans) experimental ap-
proach of wireless power transmission in human subjects or laboratory animals provides
the most reliable measurement results. However, such approach is complicated, risky,
time consuming, and is limited in the type of the results that can be recorded. In addition,
when working with human subjects there are significant risks associated with surgery,
toxicity, and radiation hazards. For these reasons, tissue mimicking gels have been used
in the literature as an alternative to in-vivo experimental approaches. Tissue mimicking
gels are manufactured in a way so that their constituent electrical (dielectric and con-
ductor) properties are similar to the electrical properties of human tissue at a specific
frequency. Different materials can be used to manufacture the tissue mimicking gel, for
example, in [13] a skin mimicking gel was manufactured from water, salt, and a thicken-
ing agent to investigate the performance of implantable antennas for continuous glucose
23
monitoring.
An in-house program code was used in [13] to simulate the performance of the ser-
pentine antenna when implanted in a homogeneous and isotropic block of human tissue.
The simulation and measurement results obtained in [13] were in good agreement which
indicates that computational tools can be used to obtain simulation results that are com-
parable to the measurement results. High frequency electromagnetic computational tools
such as Ansys High-Frequency Structural Simulator (HFSS) [138] and Computer Sim-
ulation Technology (CST) Microwave Studio (MWS) [139] can significantly facilitate
simulation of the performance of implantable antennas [14,74,75,78,131,137,140,141].
For example, in [131] Ansys HFSS was used to investigate the performance of cardio-
vascular stents as antennas for implantable wireless applications, where measurement
and simulation results of the gain of the implanted antenna in a HFSS model of detailed
(including the heart and veins) human lungs had good agreement.
Using a detailed human model does not guarantee that the obtained results are more
accurate than the ones obtained with a homogeneous isotropic block of human tissue. In
fact, the accuracy of the results in any computational tool is dependent on the number of
cells that the simulation model is subdivided into [137, 139]. In all numerical tools the
simulation space is subdivided into small cells (referred to as mesh cells in CST MWS)
and Maxwell’s equations are applied to these cells. The main approach to obtain ac-
curate simulation results can be summarised into few steps which include; creating the
geometrical model with correct material specifications (e.g., correct electrical properties
at the desired frequency), correct choice of the boundary conditions and excitation ports,
ensuring that small dimensions in the model are subdivided into enough mesh cells (at
least 3 [139]) that has a minimum size of one eighth of a wavelength of the highest fre-
quency in the model, and the correct choice of the simulation solver to solve Maxwell’s
equations [135–137, 139].
Few solvers are available in CST MWS, two of which include the Time Domain and
the Frequency Domain Solvers. The Frequency Domain Solver computes the reflection
24
coefficient of a resonant structure at a single point per simulation run. In most cases the
resonance response is desired over a frequency range which means that the simulation
has to be run a number of times that is dependent on the number of intervals in the
frequency range which will also determine the accuracy of the results. On the other
hand, the Time Domain Solver is capable of computing the resonance response over a
frequency range in a single run. Furthermore, the Time Domain Solver is more suitable
for solving detailed structures with large electrical lengths [137, 139]. Human tissue is
considered of high electrical length due to its high permittivity [142–144].
In this thesis the computational tool CST MWS and the tissue mimicking gel will
be used to investigate the electromagnetic performance of microwave wireless power
transmission with microstrip antennas in human tissue. Furthermore, to obtain accurate
simulation results, the mesh settings in the CST models are modified manually to obtain
a high number of mesh cells on critical parts of the model (e.g., the rectangular patch
antenna) and less, yet sufficient (minimum of 3 cells per layer [139]), number of cells on
the rest of the model (e.g., free space). This manual modification of the number of mesh
cells provides accurate results within a practical simulation time.
2.8 Conclusion
Electrical stimulation from AIMDs have shown promising results that could not be
achieved with conventional medical techniques in the treatment of a number of neu-
rological disorders such as nerve regeneration. The current issue with active implantable
medical devices is that they are battery operated. The battery adds a significant size to
the implantable device. The battery can be removed by using wireless power transmis-
sion in human tissue. One of the main approaches of wireless power transmission is the
low frequency inductive coupling with coils. Some of the disadvantages of inductive
coupling include short transmission distance, severe sensitivity to coils’ alignment, and
large size of the implantable coils.

25
On the other hand, emerging research has shown that using high frequency mi-
crowave wireless power transmission can result in significant miniaturisation of the en-
tire AIMD. However, there is lack of information in the literature on the electromagnetic
performance of entire microwave wireless power transmission in human tissue. The
lack of information on the electromagnetic performance of microwave wireless power
transmission in human tissue has motivated this work.

Chapter 3
Microwave Wireless Power
Transmission with Microstrip
Rectangular Patch Antennas:
Simulation
3.1 Introduction
The electromagnetic performance of microwave wireless power transmission with mi-
crostrip rectangular patch antennas in lossless, medium and high lossy materials is in-
vestigated. For this purpose, a microstrip rectangular patch antenna is designed and in-
vestigated to operate at ∼ 2.45 GHz in lossless, medium lossy, and high lossy materials
which represent free space, dry concrete, and human tissue.
First, a background section on analytical equations to design microstrip rectangular
patch antennas and the effect of the electrical properties of lossy materials on wireless
power transmission is provided. Next, a microstrip rectangular patch antenna inside a
protective housing is designed to operate at ∼ 2.45 GHz in human tissue (i.e., high
lossy material). Then, the electromagnetic performance of microwave wireless power
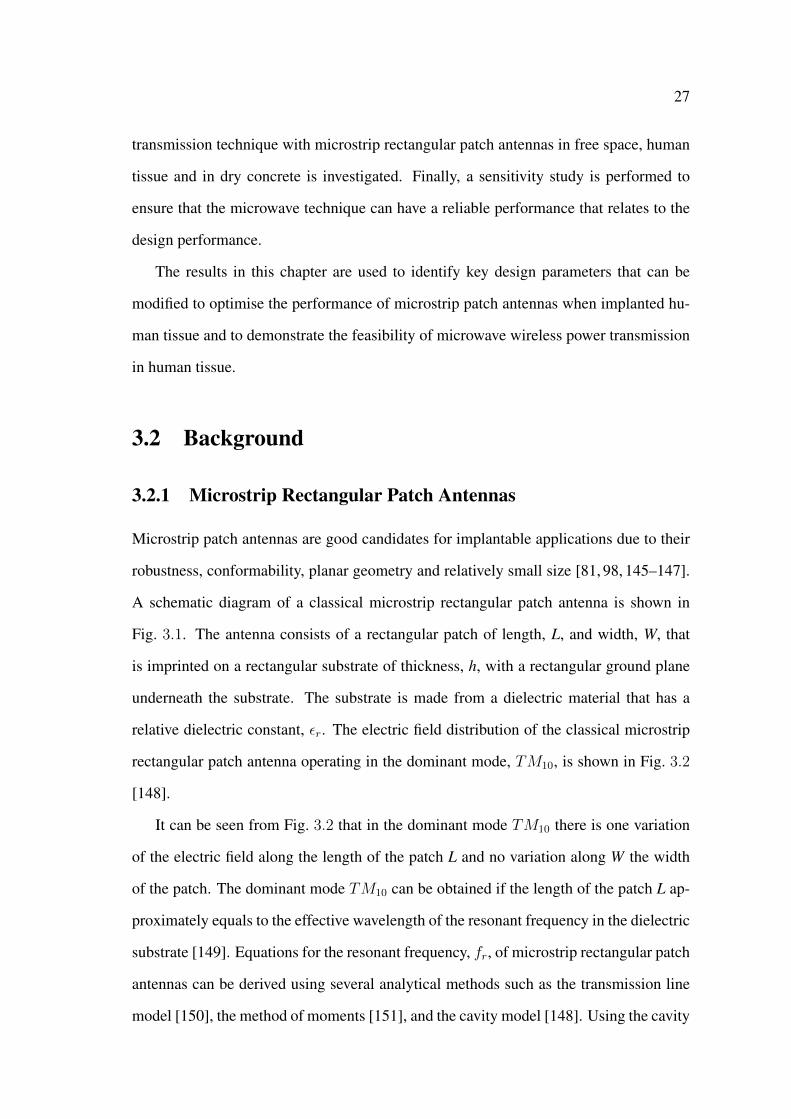
27
transmission technique with microstrip rectangular patch antennas in free space, human
tissue and in dry concrete is investigated. Finally, a sensitivity study is performed to
ensure that the microwave technique can have a reliable performance that relates to the
design performance.
The results in this chapter are used to identify key design parameters that can be
modified to optimise the performance of microstrip patch antennas when implanted hu-
man tissue and to demonstrate the feasibility of microwave wireless power transmission
in human tissue.
3.2 Background
3.2.1 Microstrip Rectangular Patch Antennas
Microstrip patch antennas are good candidates for implantable applications due to their
robustness, conformability, planar geometry and relatively small size [81, 98, 145–147].
A schematic diagram of a classical microstrip rectangular patch antenna is shown in
Fig. 3.1. The antenna consists of a rectangular patch of length, L, and width, W, that
is imprinted on a rectangular substrate of thickness, h, with a rectangular ground plane
underneath the substrate. The substrate is made from a dielectric material that has a
relative dielectric constant, εr. The electric field distribution of the classical microstrip
rectangular patch antenna operating in the dominant mode, TM10, is shown in Fig. 3.2
[148].
It can be seen from Fig. 3.2 that in the dominant mode TM10 there is one variation
of the electric field along the length of the patch L and no variation along W the width
of the patch. The dominant mode TM10 can be obtained if the length of the patch L ap-
proximately equals to the effective wavelength of the resonant frequency in the dielectric
substrate [149]. Equations for the resonant frequency, fr, of microstrip rectangular patch
antennas can be derived using several analytical methods such as the transmission line
model [150], the method of moments [151], and the cavity model [148]. Using the cavity
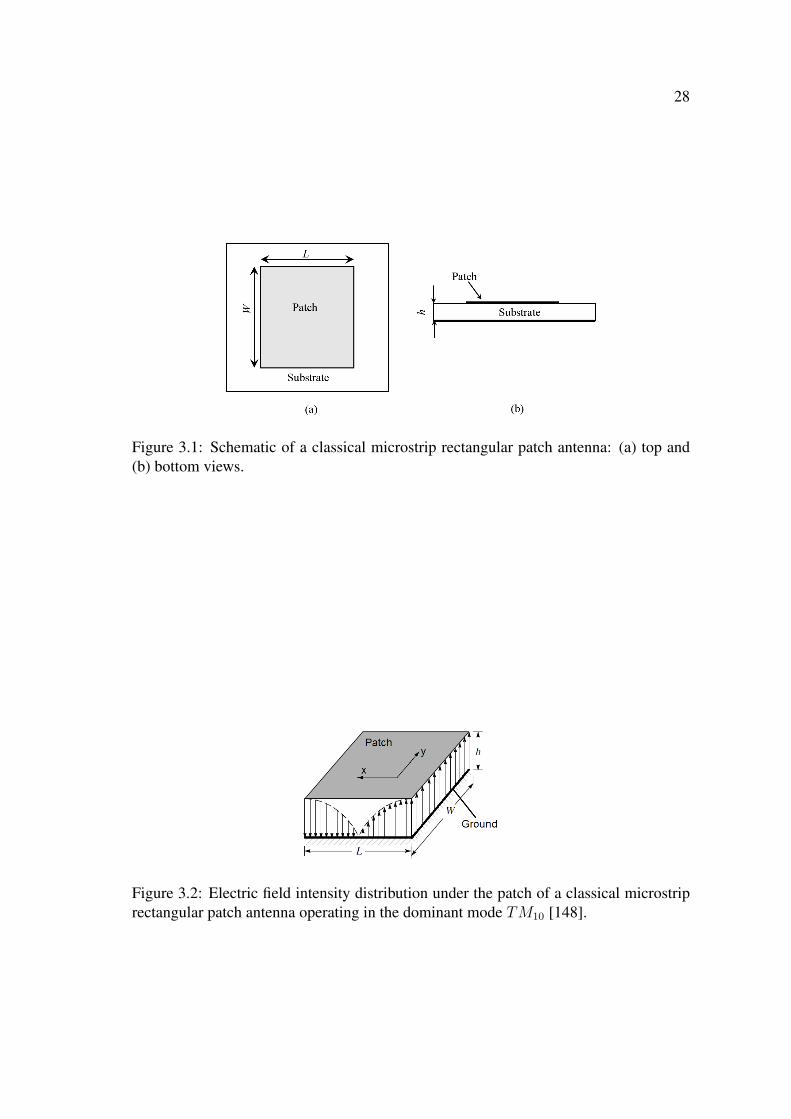
28
Figure 3.1: Schematic of a classical microstrip rectangular patch antenna: (a) top and(b) bottom views.
Figure 3.2: Electric field intensity distribution under the patch of a classical microstriprectangular patch antenna operating in the dominant mode TM10 [148].

29
model approximation the resonant frequency of a microstrip rectangular patch antenna
operating at any TMmn mode is given as [148]:
fr =c
2√εre
[(mL
)2+( nW
)2]1/2, (3.1)
where c is the speed of light, εre is the effective relative dielectric constant, m and n
are the modes along the physical length L and the width W of the rectangular patch,
respectively. The effective relative dielectric constant can be interpreted as the dielectric
constant of a homogeneous medium that replaces the air and dielectric regions, and
can be approximated in terms of the relative dielectric constant of the substrate εr, the
thickness of the substrate h, and the width of the patch W as [152]:
εre =εr + 1
2+εr − 1
2
[1 +
12h
W
]−1/2. (3.2)
To achieve good radiation from a microstrip rectangular patch antenna the width of the
patch W can be calculated as [153]:
W =c
2fr
√2
εr + 1. (3.3)
It can be seen from Eq. (3.1) that the resonant frequency fr of the rectangular patch
antenna operating in the dominant mode TM10 (i.e.,m = 1 and n = 0) is only dependent
on the length of the patch L. In fact, fr is dependent on the electrical length, Lel, of the
antenna, which due to the fringing of the electromagnetic field around the radiating edges
of the patch, is longer than the physical length of the patch L. Thereby, for a rectangular
patch antenna operating in the dominant mode TM10 Eq. (3.1) can be re-written as:
fr =c
2Lel√εre. (3.4)

30
By rearranging Eq. (3.4) the electrical length Lel can be written as:
Lel =c
2fr√εre. (3.5)
On the other hand, the physical length L is related to the length of the fringing fields,
∆L, as:
L = Lel − 2∆L =c
2fr√εre− 2∆L, (3.6)
where ∆L is given in [154] as:
∆L = 0.412h(εre + 0.3) (W/h+ 0.264)
(εre − 0.258) (W/h+ 0.8). (3.7)
If the input port (labelled Port 1) of the antenna is connected to a microwave circuit
that has an input impedance, Zs, and the antenna has an input impedance, Zin. Then,
the magnitude of the voltage reflection coefficient, |S11|, which is defined as the ratio
of the reflected voltage from Port 1 to the incident voltage at Port 1 [150] is related to
the antenna’s input impedance and the impedance of the microwave circuit by |S11| =
(Zin − Zs)/(Zin + Zs). A low |S11| is a key performance parameter at the resonant
frequency of antennas. Another key performance parameter is the antenna’s frequency
band which is often defined as the impedance match band, where the magnitude of the
reflection coefficient in decibels (dB), S11 = 20 log10 (|S11|), is below -10 dB. An S11 of
-10 dB corresponds to 36.1% reflected voltage or 10% reflected power [150].
The magnitude of the reflection coefficient S11, can be significantly affected by the
type of feed that is used to couple the power from the microwave circuit to the antenna.
There are different types of feeding techniques that can be used to connect microstrip
patch antennas to microwave circuits [81, 148, 150, 154, 155]. Fig. 3.3 shows some of
these techniques which include a microstrip line feed [150] (c.f. Fig. 3.3(a)), a mi-
crostrip line feed with an inset [156] (c.f. Fig. 3.3(b)), and a coaxial feed [154] (c.f.
Fig. 3.3(c)).
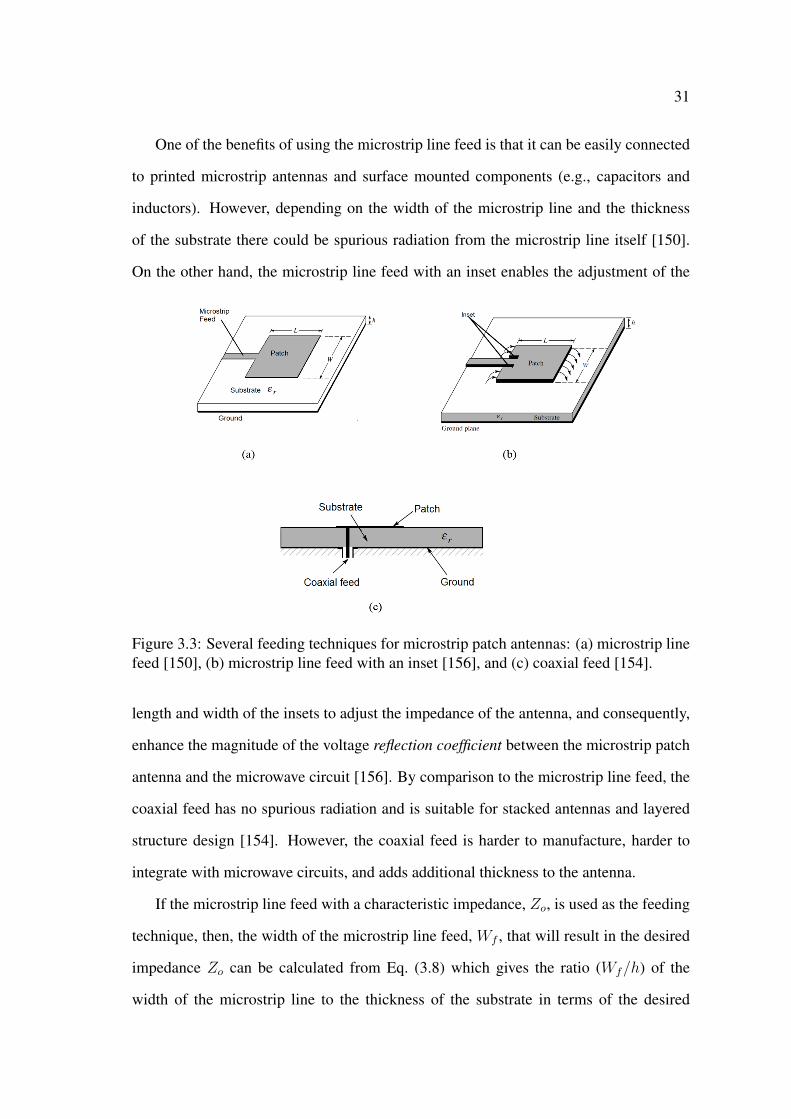
31
One of the benefits of using the microstrip line feed is that it can be easily connected
to printed microstrip antennas and surface mounted components (e.g., capacitors and
inductors). However, depending on the width of the microstrip line and the thickness
of the substrate there could be spurious radiation from the microstrip line itself [150].
On the other hand, the microstrip line feed with an inset enables the adjustment of the
Figure 3.3: Several feeding techniques for microstrip patch antennas: (a) microstrip linefeed [150], (b) microstrip line feed with an inset [156], and (c) coaxial feed [154].
length and width of the insets to adjust the impedance of the antenna, and consequently,
enhance the magnitude of the voltage reflection coefficient between the microstrip patch
antenna and the microwave circuit [156]. By comparison to the microstrip line feed, the
coaxial feed has no spurious radiation and is suitable for stacked antennas and layered
structure design [154]. However, the coaxial feed is harder to manufacture, harder to
integrate with microwave circuits, and adds additional thickness to the antenna.
If the microstrip line feed with a characteristic impedance, Zo, is used as the feeding
technique, then, the width of the microstrip line feed, Wf , that will result in the desired
impedance Zo can be calculated from Eq. (3.8) which gives the ratio (Wf/h) of the
width of the microstrip line to the thickness of the substrate in terms of the desired
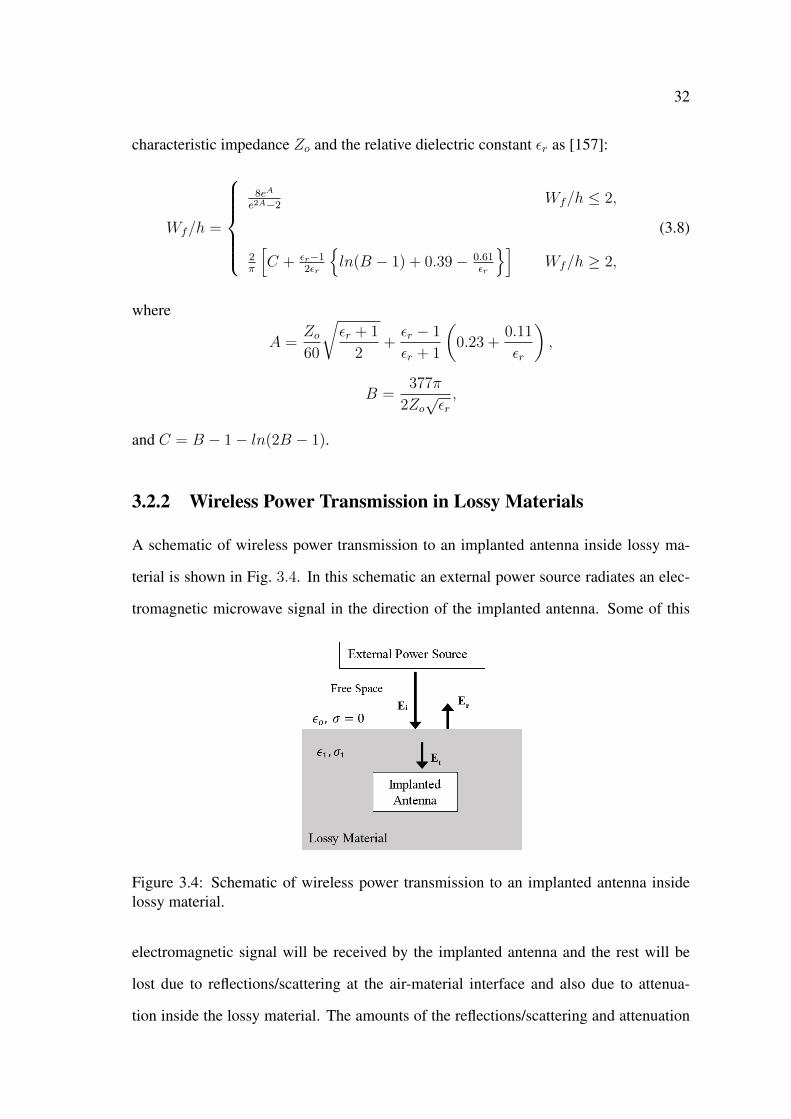
32
characteristic impedance Zo and the relative dielectric constant εr as [157]:
Wf/h =
8eA
e2A−2 Wf/h ≤ 2,
2π
[C + εr−1
2εr
ln(B − 1) + 0.39− 0.61
εr
]Wf/h ≥ 2,
(3.8)
where
A =Zo60
√εr + 1
2+εr − 1
εr + 1
(0.23 +
0.11
εr
),
B =377π
2Zo√εr,
and C = B − 1− ln(2B − 1).
3.2.2 Wireless Power Transmission in Lossy Materials
A schematic of wireless power transmission to an implanted antenna inside lossy ma-
terial is shown in Fig. 3.4. In this schematic an external power source radiates an elec-
tromagnetic microwave signal in the direction of the implanted antenna. Some of this
Figure 3.4: Schematic of wireless power transmission to an implanted antenna insidelossy material.
electromagnetic signal will be received by the implanted antenna and the rest will be
lost due to reflections/scattering at the air-material interface and also due to attenua-
tion inside the lossy material. The amounts of the reflections/scattering and attenuation
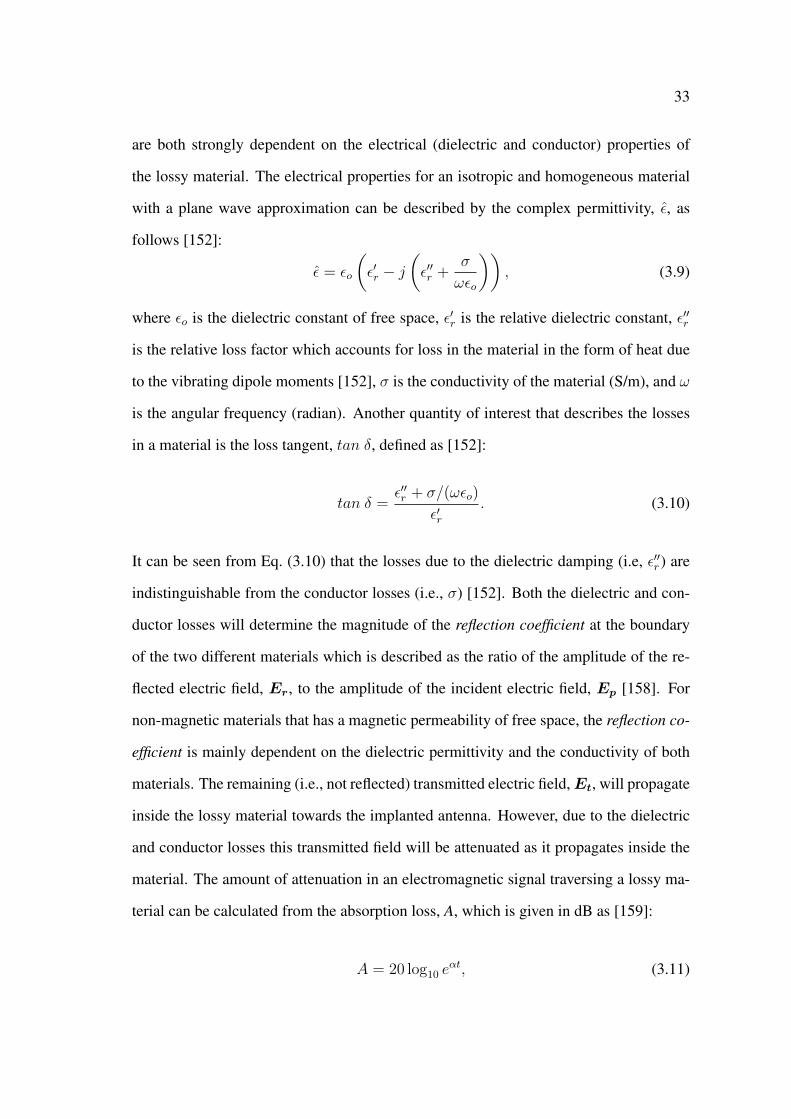
33
are both strongly dependent on the electrical (dielectric and conductor) properties of
the lossy material. The electrical properties for an isotropic and homogeneous material
with a plane wave approximation can be described by the complex permittivity, ε, as
follows [152]:
ε = εo
(ε′r − j
(ε′′r +
σ
ωεo
)), (3.9)
where εo is the dielectric constant of free space, ε′r is the relative dielectric constant, ε′′r
is the relative loss factor which accounts for loss in the material in the form of heat due
to the vibrating dipole moments [152], σ is the conductivity of the material (S/m), and ω
is the angular frequency (radian). Another quantity of interest that describes the losses
in a material is the loss tangent, tan δ, defined as [152]:
tan δ =ε′′r + σ/(ωεo)
ε′r. (3.10)
It can be seen from Eq. (3.10) that the losses due to the dielectric damping (i.e, ε′′r ) are
indistinguishable from the conductor losses (i.e., σ) [152]. Both the dielectric and con-
ductor losses will determine the magnitude of the reflection coefficient at the boundary
of the two different materials which is described as the ratio of the amplitude of the re-
flected electric field, Er, to the amplitude of the incident electric field, Ep [158]. For
non-magnetic materials that has a magnetic permeability of free space, the reflection co-
efficient is mainly dependent on the dielectric permittivity and the conductivity of both
materials. The remaining (i.e., not reflected) transmitted electric field,Et, will propagate
inside the lossy material towards the implanted antenna. However, due to the dielectric
and conductor losses this transmitted field will be attenuated as it propagates inside the
material. The amount of attenuation in an electromagnetic signal traversing a lossy ma-
terial can be calculated from the absorption loss, A, which is given in dB as [159]:
A = 20 log10 eαt, (3.11)
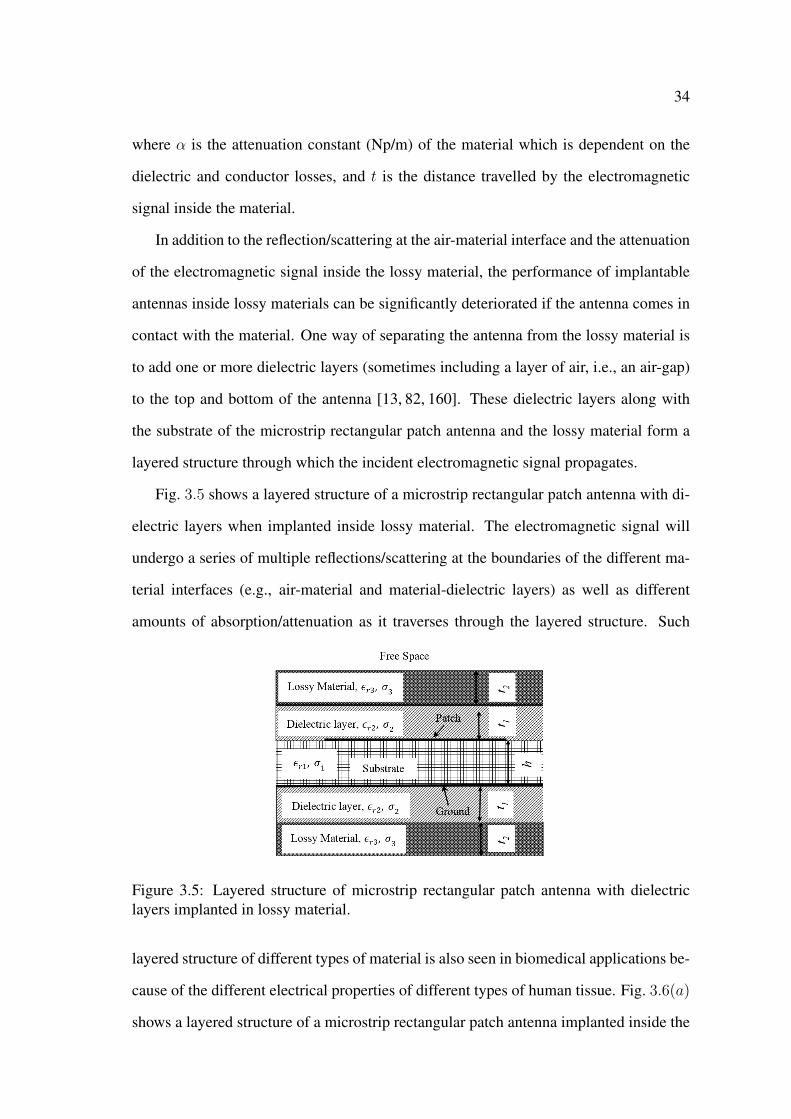
34
where α is the attenuation constant (Np/m) of the material which is dependent on the
dielectric and conductor losses, and t is the distance travelled by the electromagnetic
signal inside the material.
In addition to the reflection/scattering at the air-material interface and the attenuation
of the electromagnetic signal inside the lossy material, the performance of implantable
antennas inside lossy materials can be significantly deteriorated if the antenna comes in
contact with the material. One way of separating the antenna from the lossy material is
to add one or more dielectric layers (sometimes including a layer of air, i.e., an air-gap)
to the top and bottom of the antenna [13, 82, 160]. These dielectric layers along with
the substrate of the microstrip rectangular patch antenna and the lossy material form a
layered structure through which the incident electromagnetic signal propagates.
Fig. 3.5 shows a layered structure of a microstrip rectangular patch antenna with di-
electric layers when implanted inside lossy material. The electromagnetic signal will
undergo a series of multiple reflections/scattering at the boundaries of the different ma-
terial interfaces (e.g., air-material and material-dielectric layers) as well as different
amounts of absorption/attenuation as it traverses through the layered structure. Such
Figure 3.5: Layered structure of microstrip rectangular patch antenna with dielectriclayers implanted in lossy material.
layered structure of different types of material is also seen in biomedical applications be-
cause of the different electrical properties of different types of human tissue. Fig. 3.6(a)
shows a layered structure of a microstrip rectangular patch antenna implanted inside the
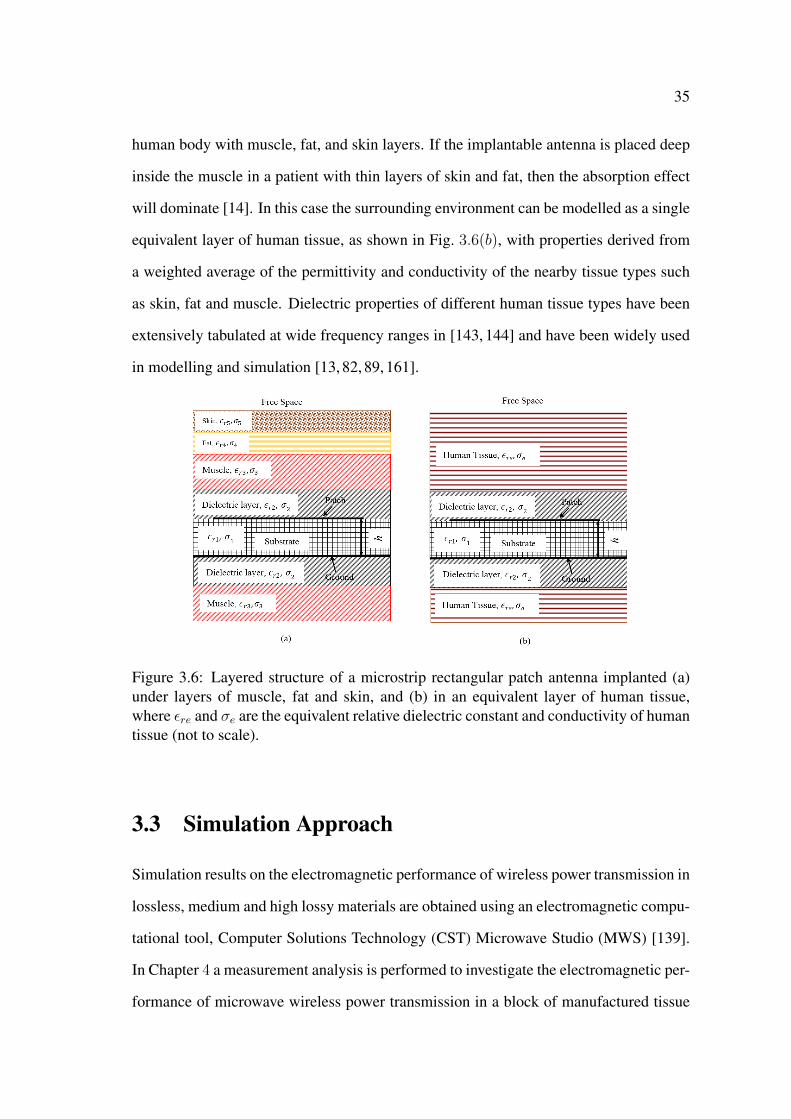
35
human body with muscle, fat, and skin layers. If the implantable antenna is placed deep
inside the muscle in a patient with thin layers of skin and fat, then the absorption effect
will dominate [14]. In this case the surrounding environment can be modelled as a single
equivalent layer of human tissue, as shown in Fig. 3.6(b), with properties derived from
a weighted average of the permittivity and conductivity of the nearby tissue types such
as skin, fat and muscle. Dielectric properties of different human tissue types have been
extensively tabulated at wide frequency ranges in [143, 144] and have been widely used
in modelling and simulation [13, 82, 89, 161].
Figure 3.6: Layered structure of a microstrip rectangular patch antenna implanted (a)under layers of muscle, fat and skin, and (b) in an equivalent layer of human tissue,where εre and σe are the equivalent relative dielectric constant and conductivity of humantissue (not to scale).
3.3 Simulation Approach
Simulation results on the electromagnetic performance of wireless power transmission in
lossless, medium and high lossy materials are obtained using an electromagnetic compu-
tational tool, Computer Solutions Technology (CST) Microwave Studio (MWS) [139].
In Chapter 4 a measurement analysis is performed to investigate the electromagnetic per-
formance of microwave wireless power transmission in a block of manufactured tissue

36
mimicking gel (high lossy material) and free space (lossless). Ideally, a medium lossy
material that is part of the human body, for example, bones, should be used. However
and due to limited resources, such material is not available. Therefore, in Chapter 4, a
concrete specimen is used as a medium lossy material. As a result, in this chapter the
medium lossy material is modelled with electrical properties of dry concrete.
First, a microstrip rectangular patch antenna that operates in the dominant mode at
2.45 GHz is designed and investigated in free space. The antenna is isolated from the
lossy material by enclosing the antenna inside a protective dielectric housing. The en-
closed microstrip antenna inside the protective housing is referred to as the microstrip
rectangular patch antenna module. Second, the performance of the microstrip rectan-
gular patch antenna module in free space, human tissue, and concrete is investigated.
Design parameters are changed to ensure that the antenna module has an acceptable
performance when implanted in human tissue.
Third, a plane wave approximation of the external power source is used to investi-
gate the receiving capabilities of the antenna module in lossless, medium lossy, and high
lossy materials. In addition, a rectenna is formed by connecting the antenna module
to a rectifying circuit, and the capability of microwave wireless power transmission in
human tissue to deliver sufficient wireless power that can energise electronic circuits
and to deliver an electrical stimulus that can be used for biomedical applications is
demonstrated. Fourth, a microwave wireless power transmission technique that com-
prises a two-antenna setup with an external microstrip rectangular patch antenna and an
implantable microstrip rectangular patch antenna module is used and investigated in free
space, human tissue, and dry concrete.
Finally, a sensitivity study is performed on the electromagnetic performance of the
microwave technique under variations in the electrical properties of both the implantable
antenna module and human tissue and variations in the physical dimensions of the im-
plantable antenna module.

37
3.4 Electromagnetic Performance in Free Space
3.4.1 Design of Microstrip Patch Antenna Module
In this section a microstrip rectangular patch antenna is designed to operate in the dom-
inant mode TM10 at 2.45 GHz in the ISM band.
The microstrip rectangular patch antenna is modelled with an FR4 substrate material
that has a thickness, h, of 1.5 mm, a relative dielectric constant, εrs, of 4.3, and a loss tan-
gent, tan δs, of 0.025. These values of the electrical properties and physical dimensions
are similar to those which will be used in the planned experimental setup (discussed in
Chapter 4). In addition, the microstrip line feed with an inset is chosen due to its planar
structure and its fabrication simplicity which enables the manufacturing of the microstrip
rectangular patch antenna with the microstrip inset feed using the local facilities at the
University of Western Sydney (UWS). Furthermore, in the experimental setup the mi-
crostrip patch antenna is attached to a SubMiniature Version A (SMA) connector which
facilitates the use of a vector network analyser for measurements.
In the simulation models the microstrip rectangular patch antenna is also connected
to an SMA connector. First, computational models of the microstrip rectangular patch
antenna without the SMA connector are created and simulated in CST MWS. Then, the
influence of the SMA connector on the input impedance of the microstrip rectangular
antenna is investigated. Finally, a parametric study on the width and length of the inset
feed is performed to determine the desired width and length that will enhance the mag-
nitude of the reflection coefficient of the microstrip rectangular antenna (with the SMA
connector).
The initial dimensions of the rectangular patch antenna operating in the dominant
mode TM10 at 2.45 GHz in free space can be calculated from Eqs. (3.2) − (3.7). From
these equations the effective relative dielectric constant εre, the width of the rectangular
patch, Wp, and the length of the rectangular patch, Lp, were calculated to be 4.01, ∼
37 mm, and ∼ 29 mm, respectively. CST models of the microstrip rectangular patch
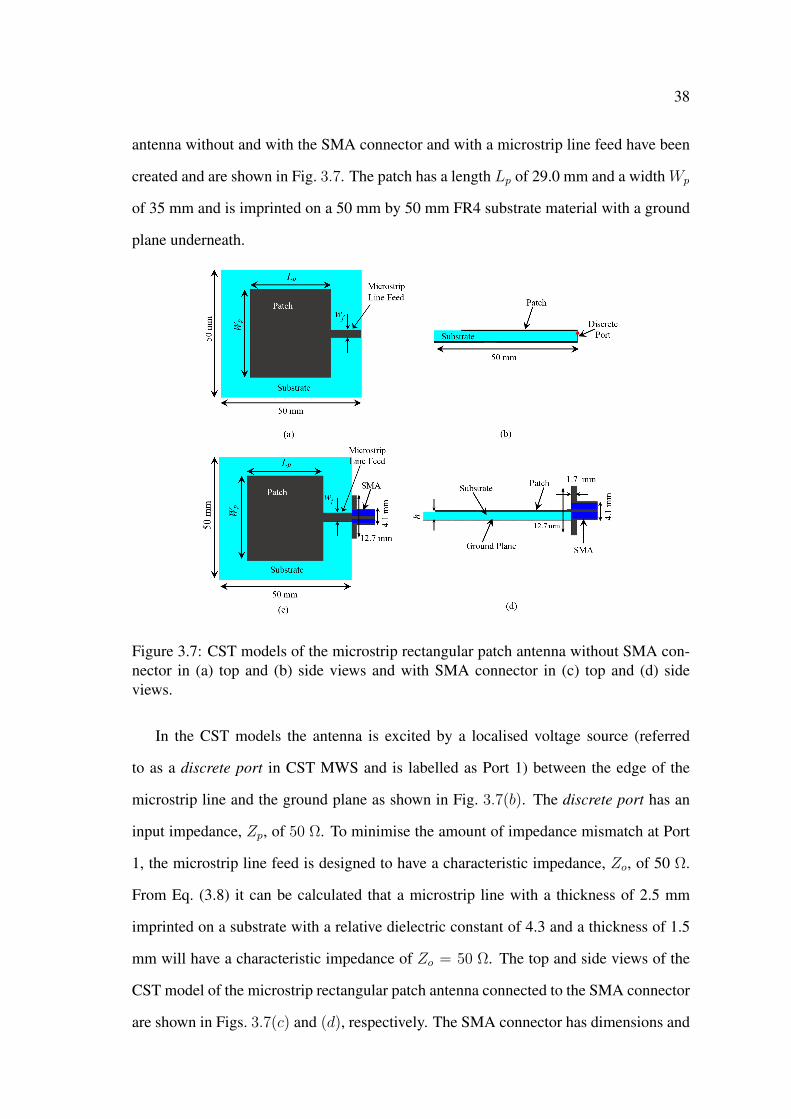
38
antenna without and with the SMA connector and with a microstrip line feed have been
created and are shown in Fig. 3.7. The patch has a length Lp of 29.0 mm and a width Wp
of 35 mm and is imprinted on a 50 mm by 50 mm FR4 substrate material with a ground
plane underneath.
Figure 3.7: CST models of the microstrip rectangular patch antenna without SMA con-nector in (a) top and (b) side views and with SMA connector in (c) top and (d) sideviews.
In the CST models the antenna is excited by a localised voltage source (referred
to as a discrete port in CST MWS and is labelled as Port 1) between the edge of the
microstrip line and the ground plane as shown in Fig. 3.7(b). The discrete port has an
input impedance, Zp, of 50 Ω. To minimise the amount of impedance mismatch at Port
1, the microstrip line feed is designed to have a characteristic impedance, Zo, of 50 Ω.
From Eq. (3.8) it can be calculated that a microstrip line with a thickness of 2.5 mm
imprinted on a substrate with a relative dielectric constant of 4.3 and a thickness of 1.5
mm will have a characteristic impedance of Zo = 50 Ω. The top and side views of the
CST model of the microstrip rectangular patch antenna connected to the SMA connector
are shown in Figs. 3.7(c) and (d), respectively. The SMA connector has dimensions and
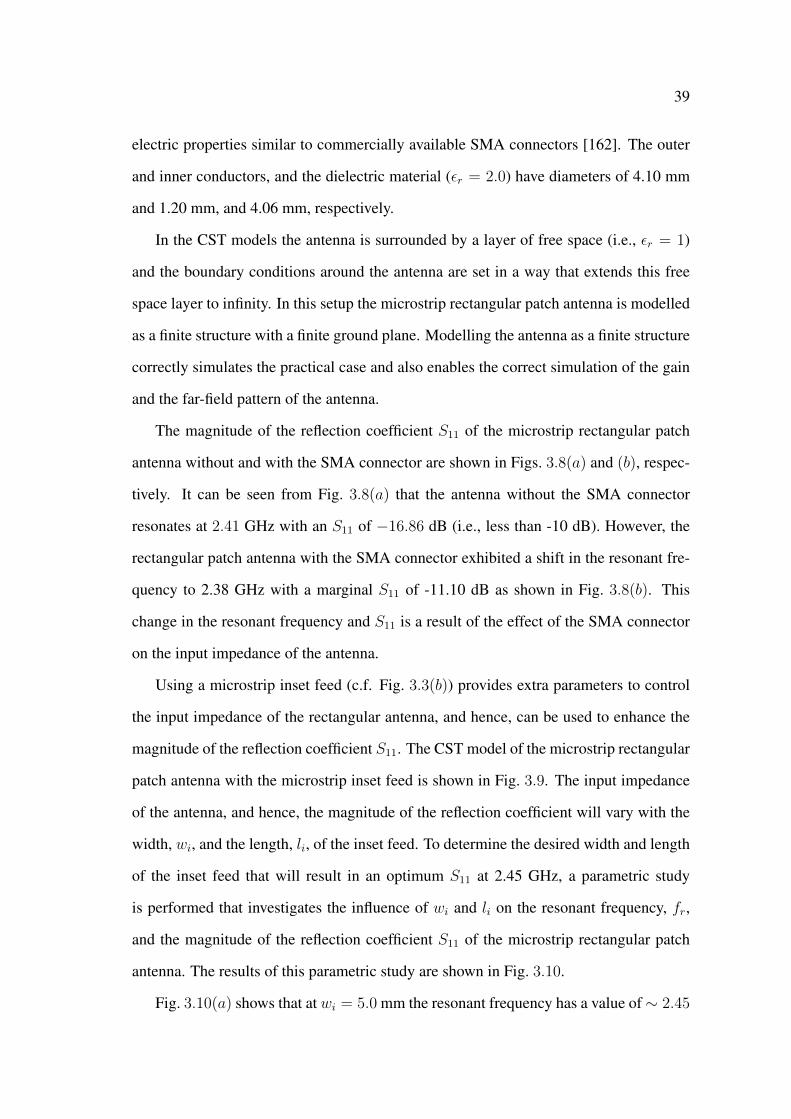
39
electric properties similar to commercially available SMA connectors [162]. The outer
and inner conductors, and the dielectric material (εr = 2.0) have diameters of 4.10 mm
and 1.20 mm, and 4.06 mm, respectively.
In the CST models the antenna is surrounded by a layer of free space (i.e., εr = 1)
and the boundary conditions around the antenna are set in a way that extends this free
space layer to infinity. In this setup the microstrip rectangular patch antenna is modelled
as a finite structure with a finite ground plane. Modelling the antenna as a finite structure
correctly simulates the practical case and also enables the correct simulation of the gain
and the far-field pattern of the antenna.
The magnitude of the reflection coefficient S11 of the microstrip rectangular patch
antenna without and with the SMA connector are shown in Figs. 3.8(a) and (b), respec-
tively. It can be seen from Fig. 3.8(a) that the antenna without the SMA connector
resonates at 2.41 GHz with an S11 of −16.86 dB (i.e., less than -10 dB). However, the
rectangular patch antenna with the SMA connector exhibited a shift in the resonant fre-
quency to 2.38 GHz with a marginal S11 of -11.10 dB as shown in Fig. 3.8(b). This
change in the resonant frequency and S11 is a result of the effect of the SMA connector
on the input impedance of the antenna.
Using a microstrip inset feed (c.f. Fig. 3.3(b)) provides extra parameters to control
the input impedance of the rectangular antenna, and hence, can be used to enhance the
magnitude of the reflection coefficient S11. The CST model of the microstrip rectangular
patch antenna with the microstrip inset feed is shown in Fig. 3.9. The input impedance
of the antenna, and hence, the magnitude of the reflection coefficient will vary with the
width, wi, and the length, li, of the inset feed. To determine the desired width and length
of the inset feed that will result in an optimum S11 at 2.45 GHz, a parametric study
is performed that investigates the influence of wi and li on the resonant frequency, fr,
and the magnitude of the reflection coefficient S11 of the microstrip rectangular patch
antenna. The results of this parametric study are shown in Fig. 3.10.
Fig. 3.10(a) shows that at wi = 5.0 mm the resonant frequency has a value of∼ 2.45
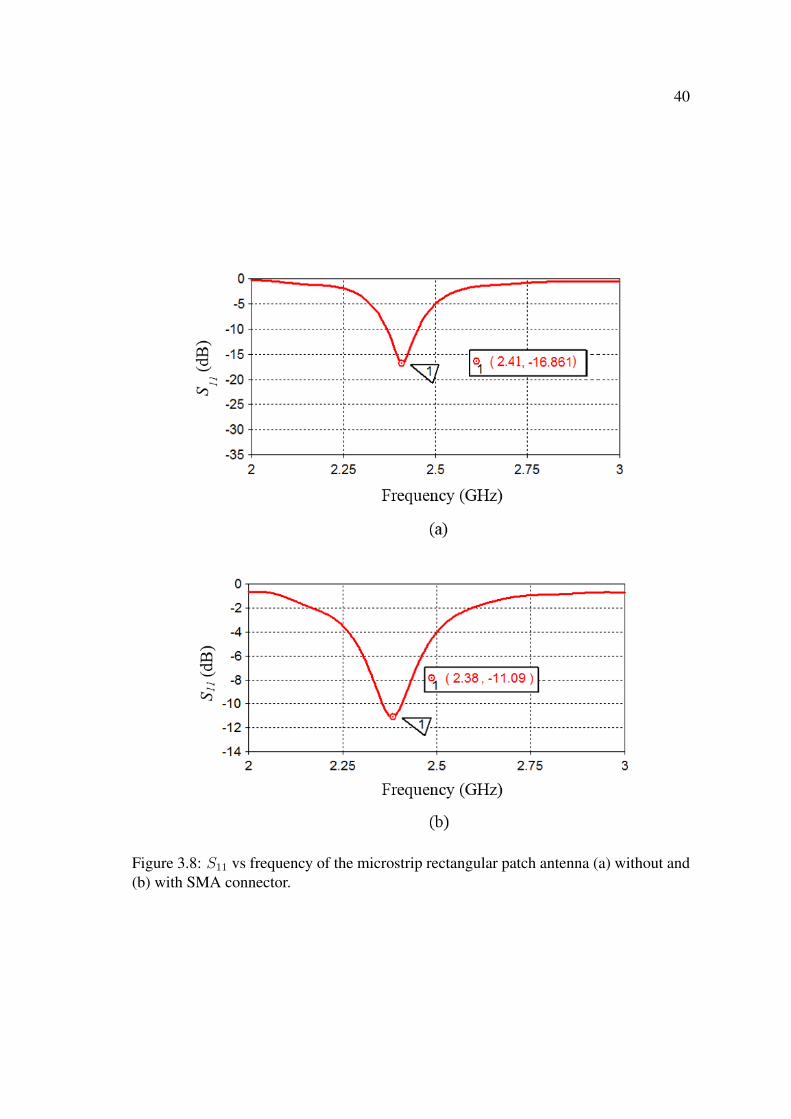
40
Figure 3.8: S11 vs frequency of the microstrip rectangular patch antenna (a) without and(b) with SMA connector.
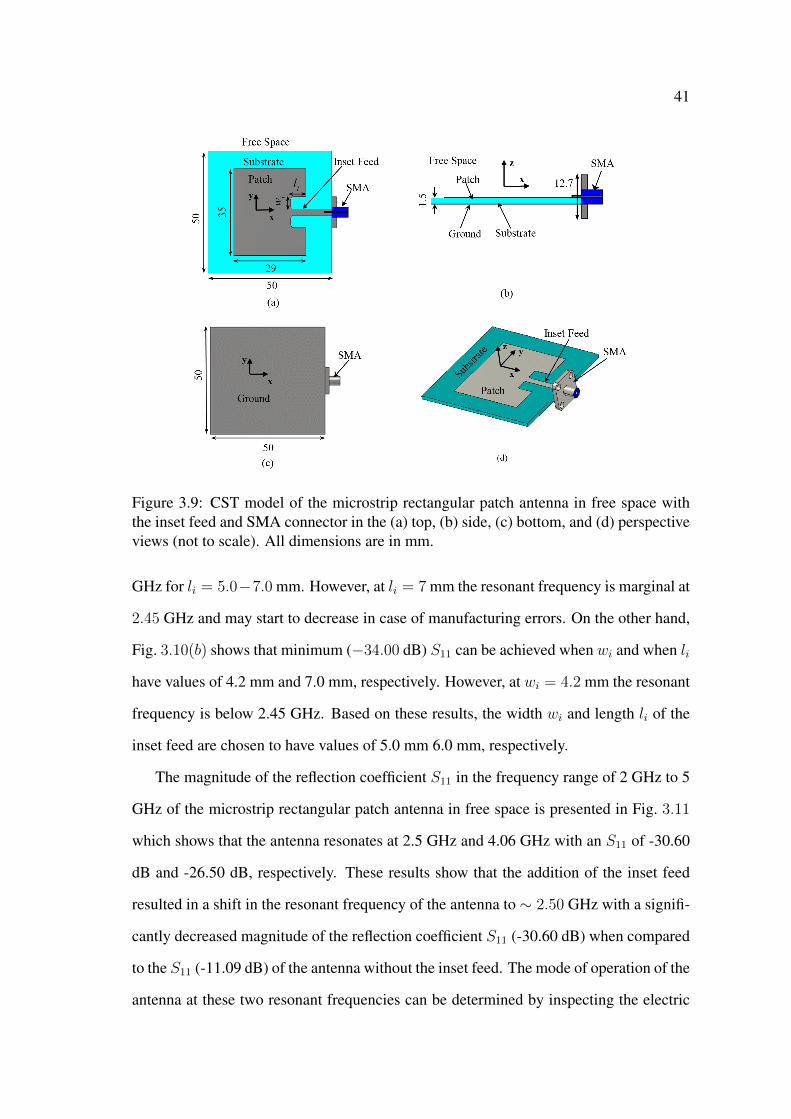
41
Figure 3.9: CST model of the microstrip rectangular patch antenna in free space withthe inset feed and SMA connector in the (a) top, (b) side, (c) bottom, and (d) perspectiveviews (not to scale). All dimensions are in mm.
GHz for li = 5.0−7.0 mm. However, at li = 7 mm the resonant frequency is marginal at
2.45 GHz and may start to decrease in case of manufacturing errors. On the other hand,
Fig. 3.10(b) shows that minimum (−34.00 dB) S11 can be achieved when wi and when li
have values of 4.2 mm and 7.0 mm, respectively. However, at wi = 4.2 mm the resonant
frequency is below 2.45 GHz. Based on these results, the width wi and length li of the
inset feed are chosen to have values of 5.0 mm 6.0 mm, respectively.
The magnitude of the reflection coefficient S11 in the frequency range of 2 GHz to 5
GHz of the microstrip rectangular patch antenna in free space is presented in Fig. 3.11
which shows that the antenna resonates at 2.5 GHz and 4.06 GHz with an S11 of -30.60
dB and -26.50 dB, respectively. These results show that the addition of the inset feed
resulted in a shift in the resonant frequency of the antenna to ∼ 2.50 GHz with a signifi-
cantly decreased magnitude of the reflection coefficient S11 (-30.60 dB) when compared
to the S11 (-11.09 dB) of the antenna without the inset feed. The mode of operation of the
antenna at these two resonant frequencies can be determined by inspecting the electric
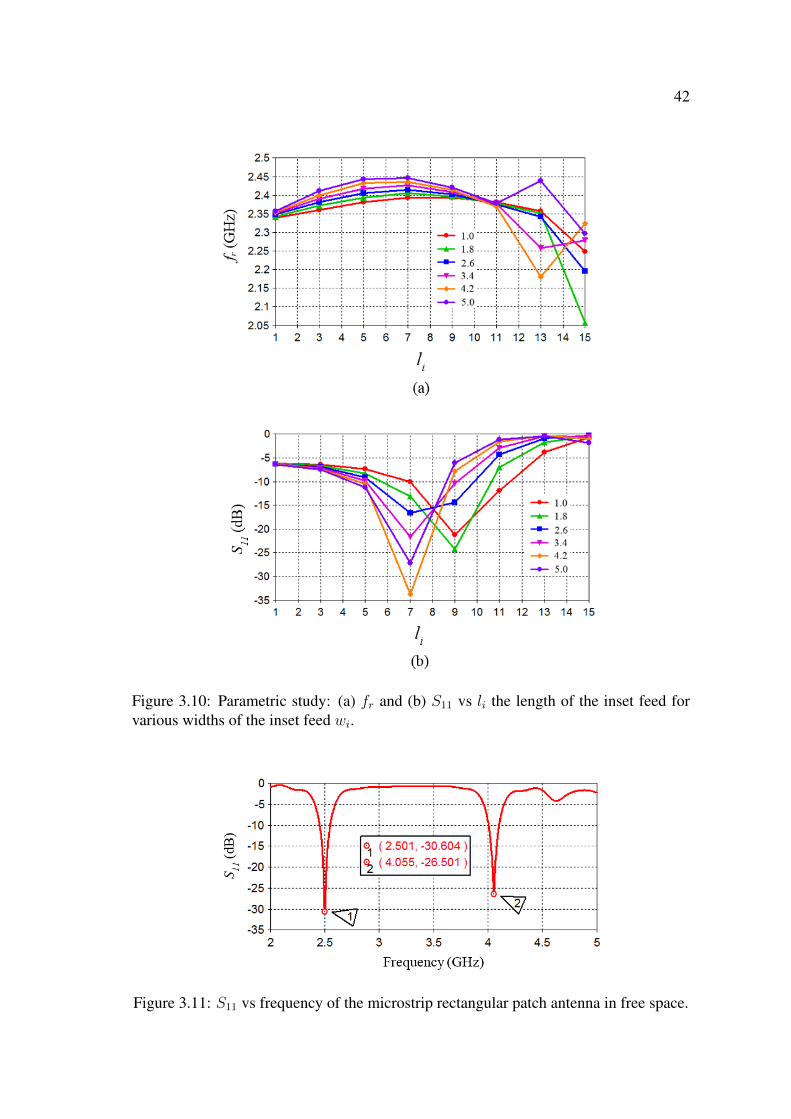
42
Figure 3.10: Parametric study: (a) fr and (b) S11 vs li the length of the inset feed forvarious widths of the inset feed wi.
Figure 3.11: S11 vs frequency of the microstrip rectangular patch antenna in free space.
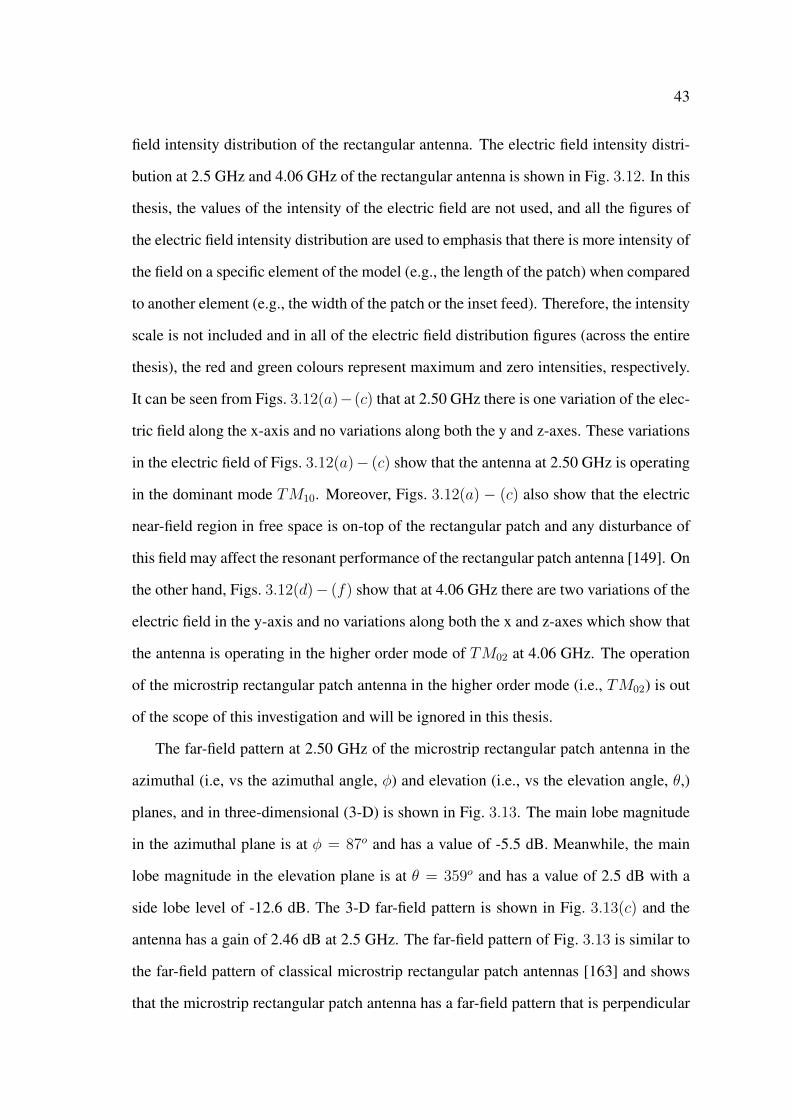
43
field intensity distribution of the rectangular antenna. The electric field intensity distri-
bution at 2.5 GHz and 4.06 GHz of the rectangular antenna is shown in Fig. 3.12. In this
thesis, the values of the intensity of the electric field are not used, and all the figures of
the electric field intensity distribution are used to emphasis that there is more intensity of
the field on a specific element of the model (e.g., the length of the patch) when compared
to another element (e.g., the width of the patch or the inset feed). Therefore, the intensity
scale is not included and in all of the electric field distribution figures (across the entire
thesis), the red and green colours represent maximum and zero intensities, respectively.
It can be seen from Figs. 3.12(a)−(c) that at 2.50 GHz there is one variation of the elec-
tric field along the x-axis and no variations along both the y and z-axes. These variations
in the electric field of Figs. 3.12(a)− (c) show that the antenna at 2.50 GHz is operating
in the dominant mode TM10. Moreover, Figs. 3.12(a) − (c) also show that the electric
near-field region in free space is on-top of the rectangular patch and any disturbance of
this field may affect the resonant performance of the rectangular patch antenna [149]. On
the other hand, Figs. 3.12(d)− (f) show that at 4.06 GHz there are two variations of the
electric field in the y-axis and no variations along both the x and z-axes which show that
the antenna is operating in the higher order mode of TM02 at 4.06 GHz. The operation
of the microstrip rectangular patch antenna in the higher order mode (i.e., TM02) is out
of the scope of this investigation and will be ignored in this thesis.
The far-field pattern at 2.50 GHz of the microstrip rectangular patch antenna in the
azimuthal (i.e, vs the azimuthal angle, φ) and elevation (i.e., vs the elevation angle, θ,)
planes, and in three-dimensional (3-D) is shown in Fig. 3.13. The main lobe magnitude
in the azimuthal plane is at φ = 87o and has a value of -5.5 dB. Meanwhile, the main
lobe magnitude in the elevation plane is at θ = 359o and has a value of 2.5 dB with a
side lobe level of -12.6 dB. The 3-D far-field pattern is shown in Fig. 3.13(c) and the
antenna has a gain of 2.46 dB at 2.5 GHz. The far-field pattern of Fig. 3.13 is similar to
the far-field pattern of classical microstrip rectangular patch antennas [163] and shows
that the microstrip rectangular patch antenna has a far-field pattern that is perpendicular
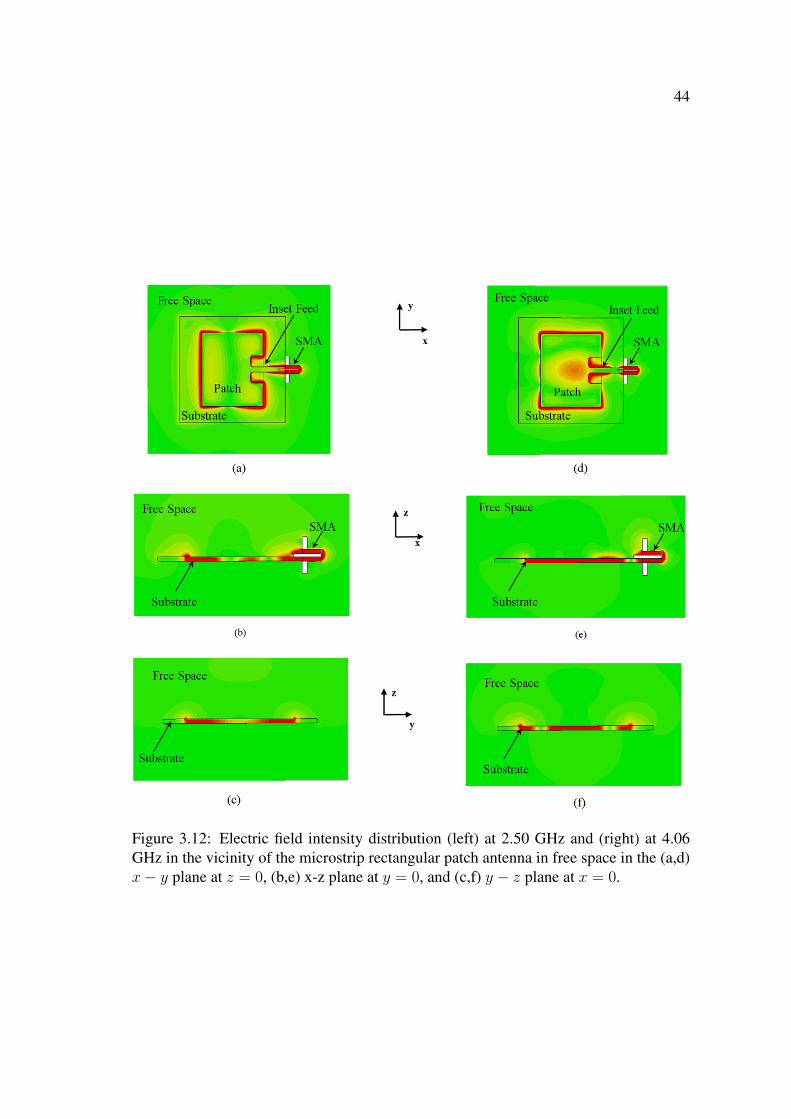
44
Figure 3.12: Electric field intensity distribution (left) at 2.50 GHz and (right) at 4.06GHz in the vicinity of the microstrip rectangular patch antenna in free space in the (a,d)x− y plane at z = 0, (b,e) x-z plane at y = 0, and (c,f) y − z plane at x = 0.
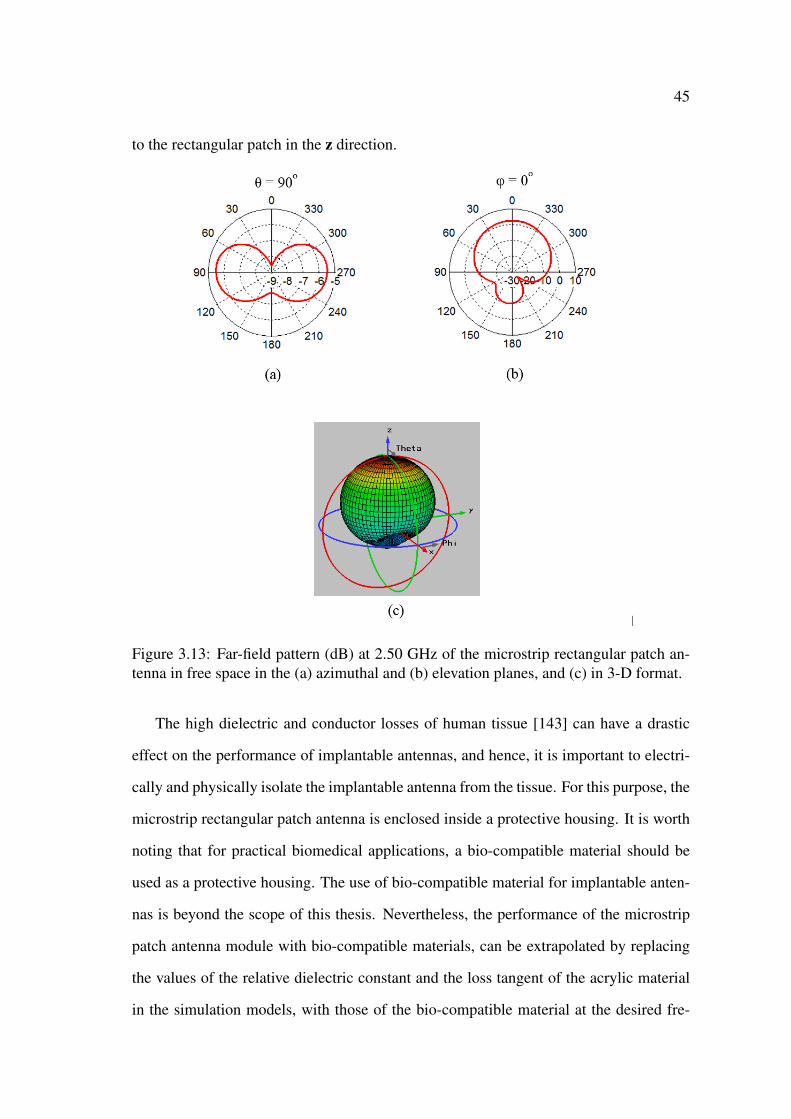
45
to the rectangular patch in the z direction.
Figure 3.13: Far-field pattern (dB) at 2.50 GHz of the microstrip rectangular patch an-tenna in free space in the (a) azimuthal and (b) elevation planes, and (c) in 3-D format.
The high dielectric and conductor losses of human tissue [143] can have a drastic
effect on the performance of implantable antennas, and hence, it is important to electri-
cally and physically isolate the implantable antenna from the tissue. For this purpose, the
microstrip rectangular patch antenna is enclosed inside a protective housing. It is worth
noting that for practical biomedical applications, a bio-compatible material should be
used as a protective housing. The use of bio-compatible material for implantable anten-
nas is beyond the scope of this thesis. Nevertheless, the performance of the microstrip
patch antenna module with bio-compatible materials, can be extrapolated by replacing
the values of the relative dielectric constant and the loss tangent of the acrylic material
in the simulation models, with those of the bio-compatible material at the desired fre-
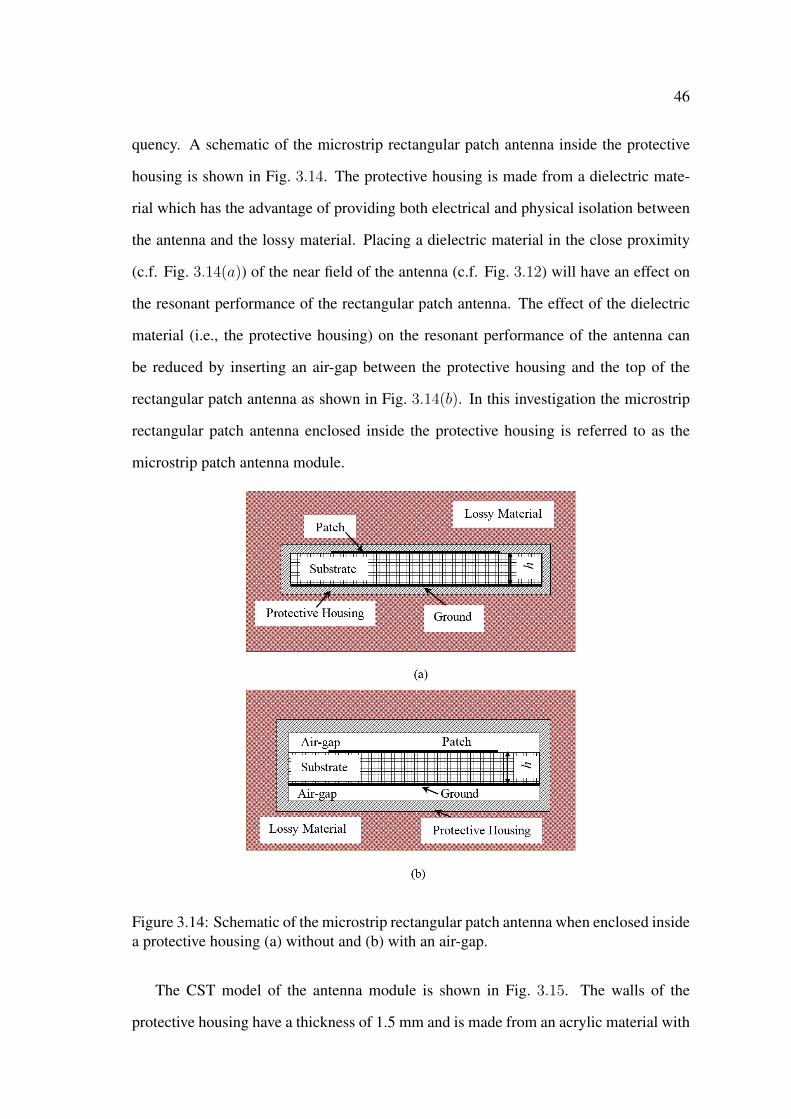
46
quency. A schematic of the microstrip rectangular patch antenna inside the protective
housing is shown in Fig. 3.14. The protective housing is made from a dielectric mate-
rial which has the advantage of providing both electrical and physical isolation between
the antenna and the lossy material. Placing a dielectric material in the close proximity
(c.f. Fig. 3.14(a)) of the near field of the antenna (c.f. Fig. 3.12) will have an effect on
the resonant performance of the rectangular patch antenna. The effect of the dielectric
material (i.e., the protective housing) on the resonant performance of the antenna can
be reduced by inserting an air-gap between the protective housing and the top of the
rectangular patch antenna as shown in Fig. 3.14(b). In this investigation the microstrip
rectangular patch antenna enclosed inside the protective housing is referred to as the
microstrip patch antenna module.
Figure 3.14: Schematic of the microstrip rectangular patch antenna when enclosed insidea protective housing (a) without and (b) with an air-gap.
The CST model of the antenna module is shown in Fig. 3.15. The walls of the
protective housing have a thickness of 1.5 mm and is made from an acrylic material with
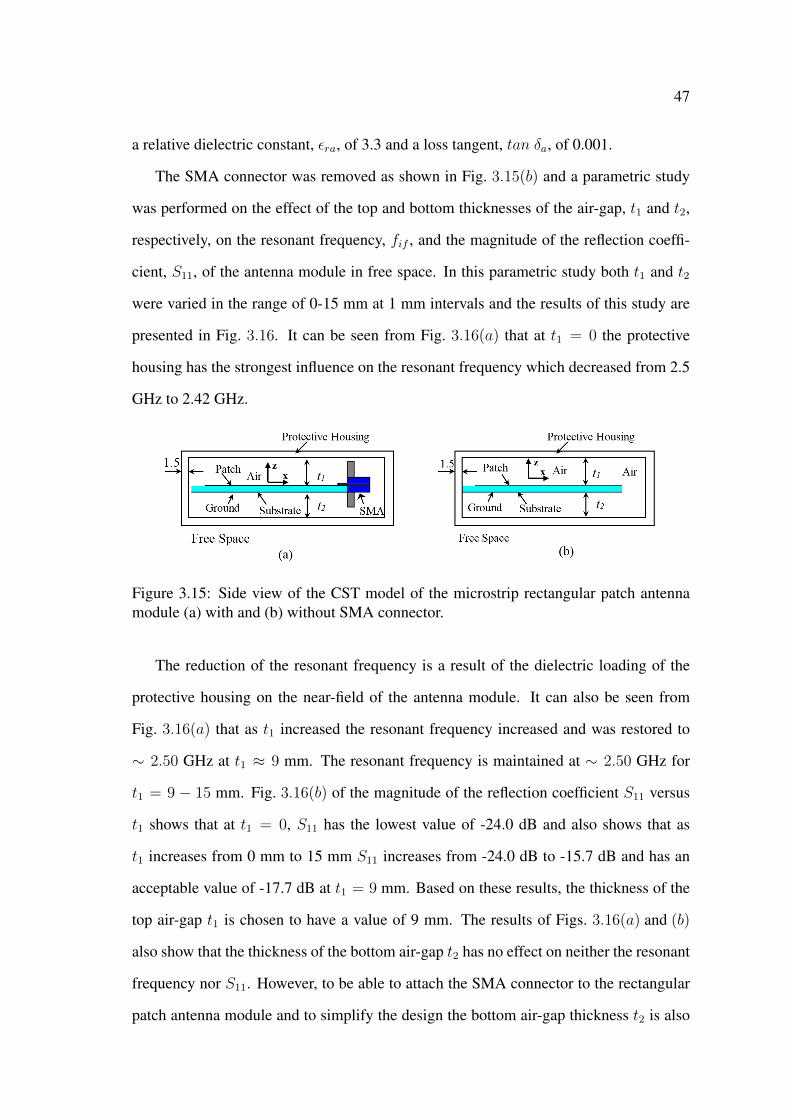
47
a relative dielectric constant, εra, of 3.3 and a loss tangent, tan δa, of 0.001.
The SMA connector was removed as shown in Fig. 3.15(b) and a parametric study
was performed on the effect of the top and bottom thicknesses of the air-gap, t1 and t2,
respectively, on the resonant frequency, fif , and the magnitude of the reflection coeffi-
cient, S11, of the antenna module in free space. In this parametric study both t1 and t2
were varied in the range of 0-15 mm at 1 mm intervals and the results of this study are
presented in Fig. 3.16. It can be seen from Fig. 3.16(a) that at t1 = 0 the protective
housing has the strongest influence on the resonant frequency which decreased from 2.5
GHz to 2.42 GHz.
Figure 3.15: Side view of the CST model of the microstrip rectangular patch antennamodule (a) with and (b) without SMA connector.
The reduction of the resonant frequency is a result of the dielectric loading of the
protective housing on the near-field of the antenna module. It can also be seen from
Fig. 3.16(a) that as t1 increased the resonant frequency increased and was restored to
∼ 2.50 GHz at t1 ≈ 9 mm. The resonant frequency is maintained at ∼ 2.50 GHz for
t1 = 9 − 15 mm. Fig. 3.16(b) of the magnitude of the reflection coefficient S11 versus
t1 shows that at t1 = 0, S11 has the lowest value of -24.0 dB and also shows that as
t1 increases from 0 mm to 15 mm S11 increases from -24.0 dB to -15.7 dB and has an
acceptable value of -17.7 dB at t1 = 9 mm. Based on these results, the thickness of the
top air-gap t1 is chosen to have a value of 9 mm. The results of Figs. 3.16(a) and (b)
also show that the thickness of the bottom air-gap t2 has no effect on neither the resonant
frequency nor S11. However, to be able to attach the SMA connector to the rectangular
patch antenna module and to simplify the design the bottom air-gap thickness t2 is also

48
chosen to have a value of 9 mm.
Figure 3.16: (a) fif and (b) S11 vs t1 the thickness of the top air-gap for various thick-nesses of the bottom air-gap t2 of the antenna module in free space.
The CST model of the microstrip rectangular patch antenna module with the SMA
connector is shown in Fig. 3.17. Both the top and bottom air-gap thicknesses t1 and t2,
respectively, have a value of 9.0 mm. The antenna has physical dimensions and electric
properties similar to the antenna shown in Fig. 3.9. The resulting magnitude of the
reflection coefficient S11 plotted versus frequency in Fig. 3.18 shows that the antenna
module resonates at 2.50 GHz and 4.06 GHz with an S11 of -26.6 dB and -20.37 dB,
respectively. These results show that at t1 = t2 = 9.0 mm the influence of the dielectric
housing on the resonant frequency of the antenna can be reduced.
The electric field distribution of Fig. 3.19 shows that the antenna module operates
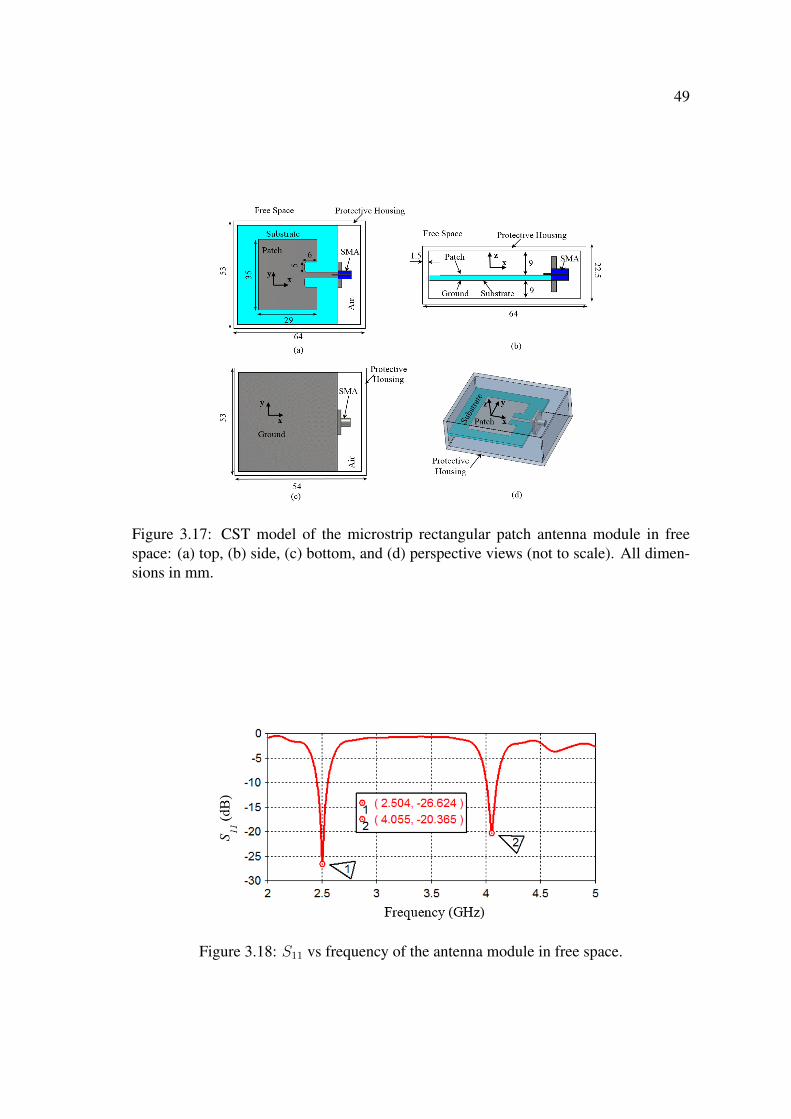
49
Figure 3.17: CST model of the microstrip rectangular patch antenna module in freespace: (a) top, (b) side, (c) bottom, and (d) perspective views (not to scale). All dimen-sions in mm.
Figure 3.18: S11 vs frequency of the antenna module in free space.
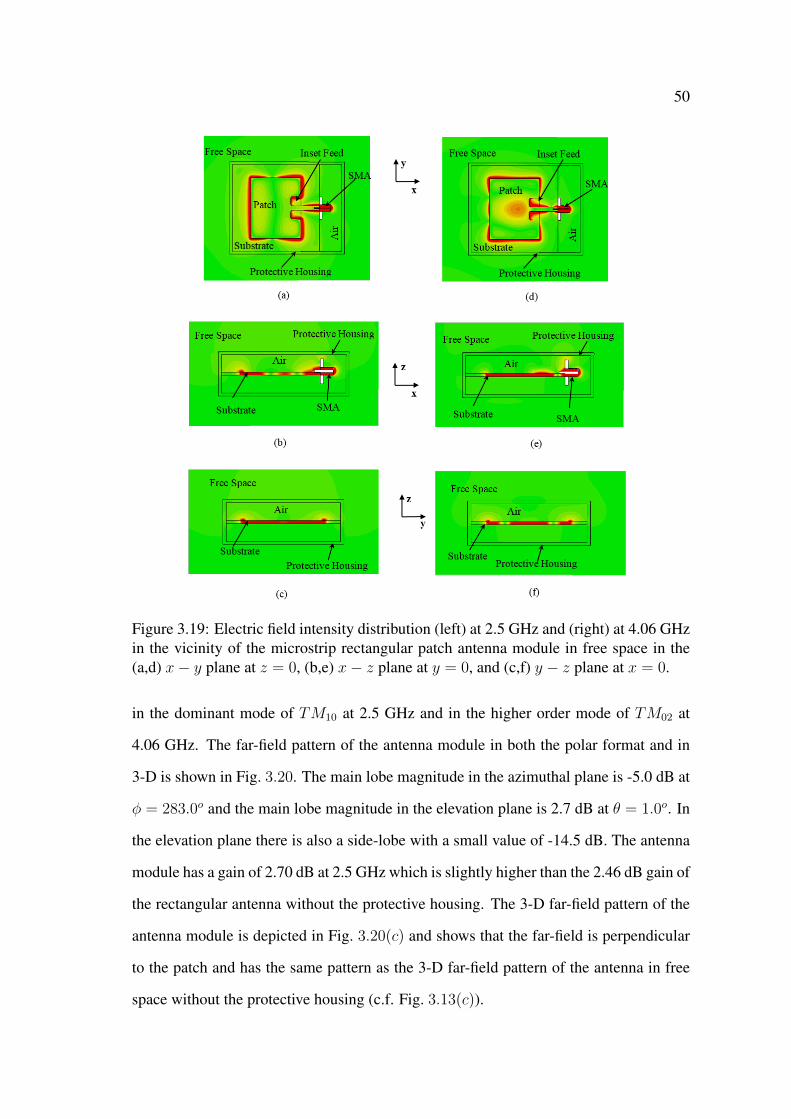
50
Figure 3.19: Electric field intensity distribution (left) at 2.5 GHz and (right) at 4.06 GHzin the vicinity of the microstrip rectangular patch antenna module in free space in the(a,d) x− y plane at z = 0, (b,e) x− z plane at y = 0, and (c,f) y − z plane at x = 0.
in the dominant mode of TM10 at 2.5 GHz and in the higher order mode of TM02 at
4.06 GHz. The far-field pattern of the antenna module in both the polar format and in
3-D is shown in Fig. 3.20. The main lobe magnitude in the azimuthal plane is -5.0 dB at
φ = 283.0o and the main lobe magnitude in the elevation plane is 2.7 dB at θ = 1.0o. In
the elevation plane there is also a side-lobe with a small value of -14.5 dB. The antenna
module has a gain of 2.70 dB at 2.5 GHz which is slightly higher than the 2.46 dB gain of
the rectangular antenna without the protective housing. The 3-D far-field pattern of the
antenna module is depicted in Fig. 3.20(c) and shows that the far-field is perpendicular
to the patch and has the same pattern as the 3-D far-field pattern of the antenna in free
space without the protective housing (c.f. Fig. 3.13(c)).
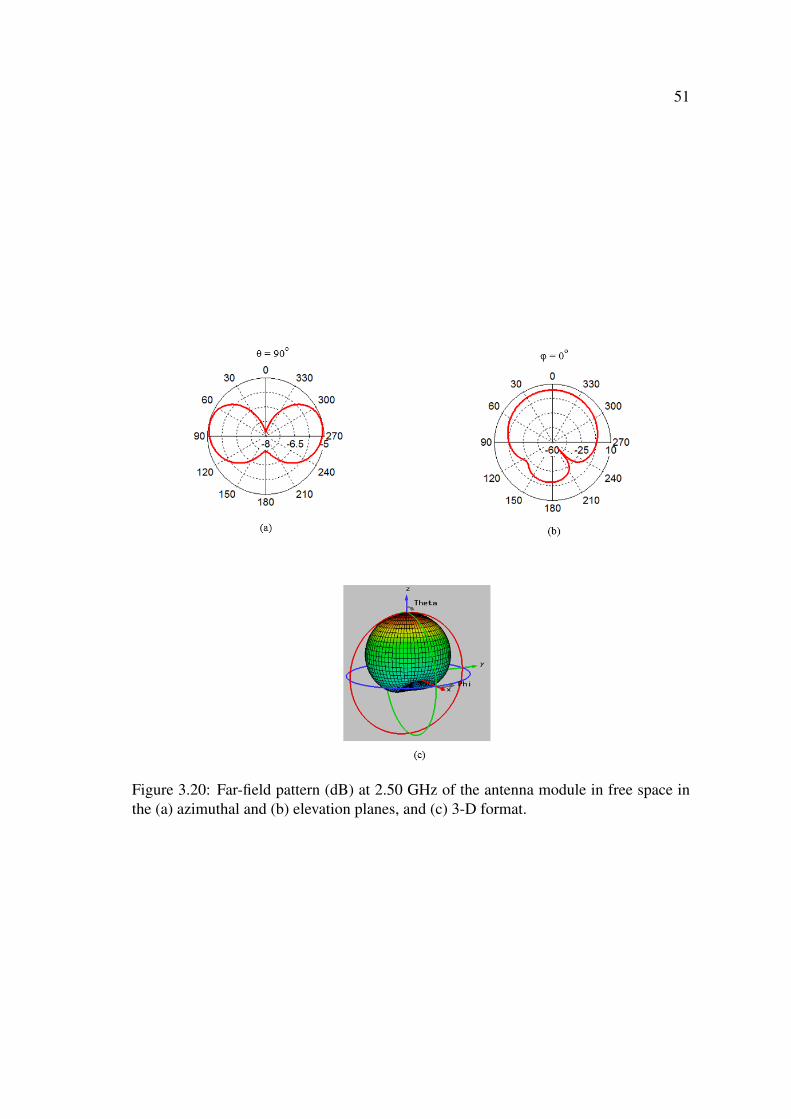
51
Figure 3.20: Far-field pattern (dB) at 2.50 GHz of the antenna module in free space inthe (a) azimuthal and (b) elevation planes, and (c) 3-D format.
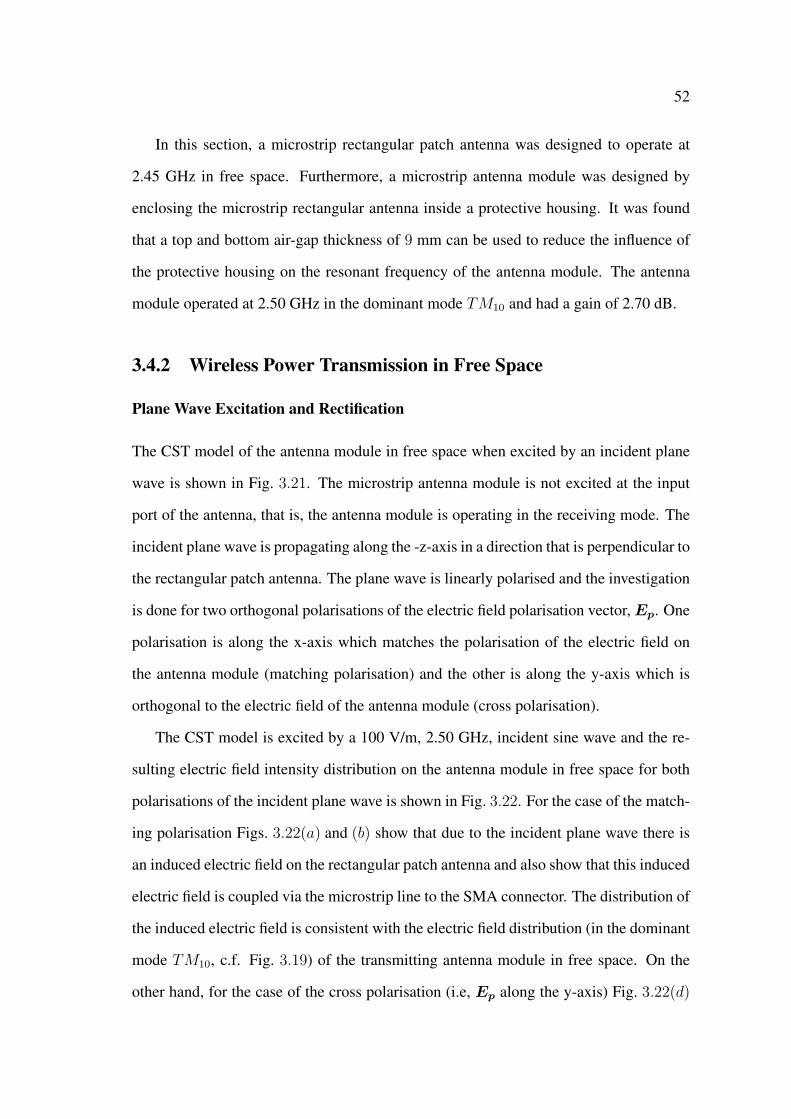
52
In this section, a microstrip rectangular patch antenna was designed to operate at
2.45 GHz in free space. Furthermore, a microstrip antenna module was designed by
enclosing the microstrip rectangular antenna inside a protective housing. It was found
that a top and bottom air-gap thickness of 9 mm can be used to reduce the influence of
the protective housing on the resonant frequency of the antenna module. The antenna
module operated at 2.50 GHz in the dominant mode TM10 and had a gain of 2.70 dB.
3.4.2 Wireless Power Transmission in Free Space
Plane Wave Excitation and Rectification
The CST model of the antenna module in free space when excited by an incident plane
wave is shown in Fig. 3.21. The microstrip antenna module is not excited at the input
port of the antenna, that is, the antenna module is operating in the receiving mode. The
incident plane wave is propagating along the -z-axis in a direction that is perpendicular to
the rectangular patch antenna. The plane wave is linearly polarised and the investigation
is done for two orthogonal polarisations of the electric field polarisation vector,Ep. One
polarisation is along the x-axis which matches the polarisation of the electric field on
the antenna module (matching polarisation) and the other is along the y-axis which is
orthogonal to the electric field of the antenna module (cross polarisation).
The CST model is excited by a 100 V/m, 2.50 GHz, incident sine wave and the re-
sulting electric field intensity distribution on the antenna module in free space for both
polarisations of the incident plane wave is shown in Fig. 3.22. For the case of the match-
ing polarisation Figs. 3.22(a) and (b) show that due to the incident plane wave there is
an induced electric field on the rectangular patch antenna and also show that this induced
electric field is coupled via the microstrip line to the SMA connector. The distribution of
the induced electric field is consistent with the electric field distribution (in the dominant
mode TM10, c.f. Fig. 3.19) of the transmitting antenna module in free space. On the
other hand, for the case of the cross polarisation (i.e, Ep along the y-axis) Fig. 3.22(d)
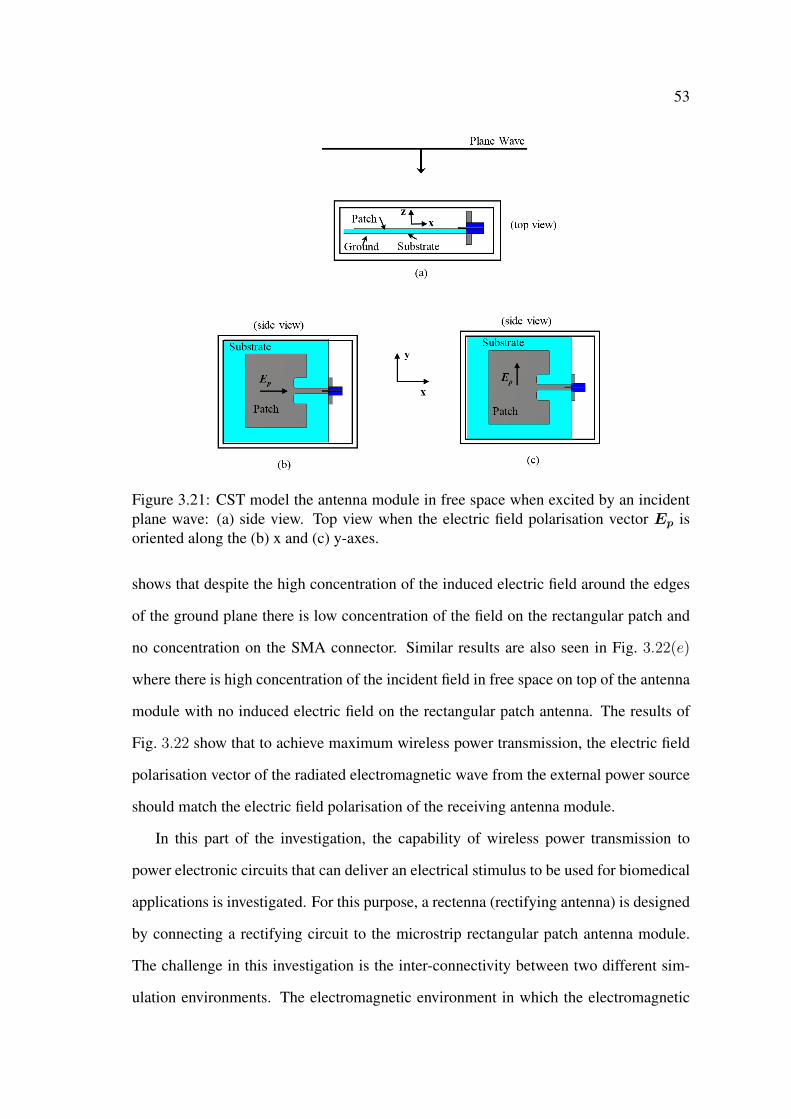
53
Figure 3.21: CST model the antenna module in free space when excited by an incidentplane wave: (a) side view. Top view when the electric field polarisation vector Ep isoriented along the (b) x and (c) y-axes.
shows that despite the high concentration of the induced electric field around the edges
of the ground plane there is low concentration of the field on the rectangular patch and
no concentration on the SMA connector. Similar results are also seen in Fig. 3.22(e)
where there is high concentration of the incident field in free space on top of the antenna
module with no induced electric field on the rectangular patch antenna. The results of
Fig. 3.22 show that to achieve maximum wireless power transmission, the electric field
polarisation vector of the radiated electromagnetic wave from the external power source
should match the electric field polarisation of the receiving antenna module.
In this part of the investigation, the capability of wireless power transmission to
power electronic circuits that can deliver an electrical stimulus to be used for biomedical
applications is investigated. For this purpose, a rectenna (rectifying antenna) is designed
by connecting a rectifying circuit to the microstrip rectangular patch antenna module.
The challenge in this investigation is the inter-connectivity between two different sim-
ulation environments. The electromagnetic environment in which the electromagnetic

54
Figure 3.22: Electric field intensity distribution at 2.50 GHz in free space when theelectric field polarisation vector of the incident plane wave is oriented along the (left) xand (right) y-axes in the (a,d) x − y plane at z = 0, (b,e) x − z plane at y = 0 and (c,f)y − z plane at x = 0.
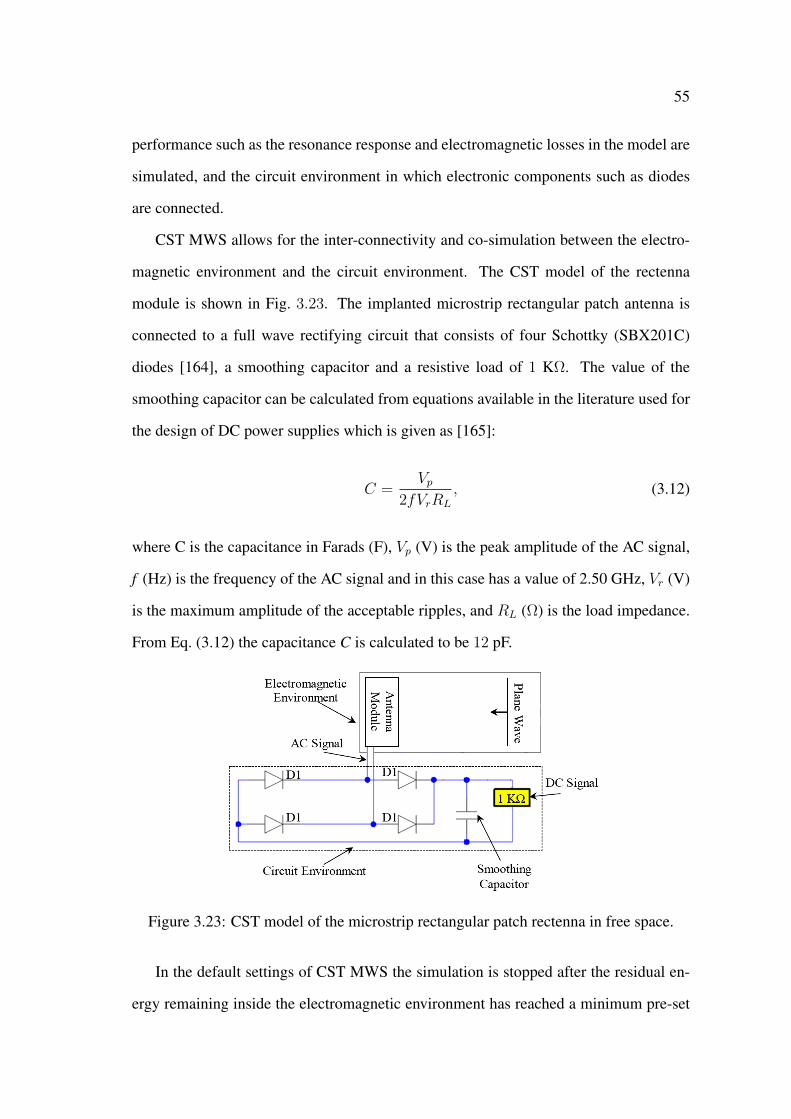
55
performance such as the resonance response and electromagnetic losses in the model are
simulated, and the circuit environment in which electronic components such as diodes
are connected.
CST MWS allows for the inter-connectivity and co-simulation between the electro-
magnetic environment and the circuit environment. The CST model of the rectenna
module is shown in Fig. 3.23. The implanted microstrip rectangular patch antenna is
connected to a full wave rectifying circuit that consists of four Schottky (SBX201C)
diodes [164], a smoothing capacitor and a resistive load of 1 KΩ. The value of the
smoothing capacitor can be calculated from equations available in the literature used for
the design of DC power supplies which is given as [165]:
C =Vp
2fVrRL
, (3.12)
where C is the capacitance in Farads (F), Vp (V) is the peak amplitude of the AC signal,
f (Hz) is the frequency of the AC signal and in this case has a value of 2.50 GHz, Vr (V)
is the maximum amplitude of the acceptable ripples, and RL (Ω) is the load impedance.
From Eq. (3.12) the capacitance C is calculated to be 12 pF.
Figure 3.23: CST model of the microstrip rectangular patch rectenna in free space.
In the default settings of CST MWS the simulation is stopped after the residual en-
ergy remaining inside the electromagnetic environment has reached a minimum pre-set
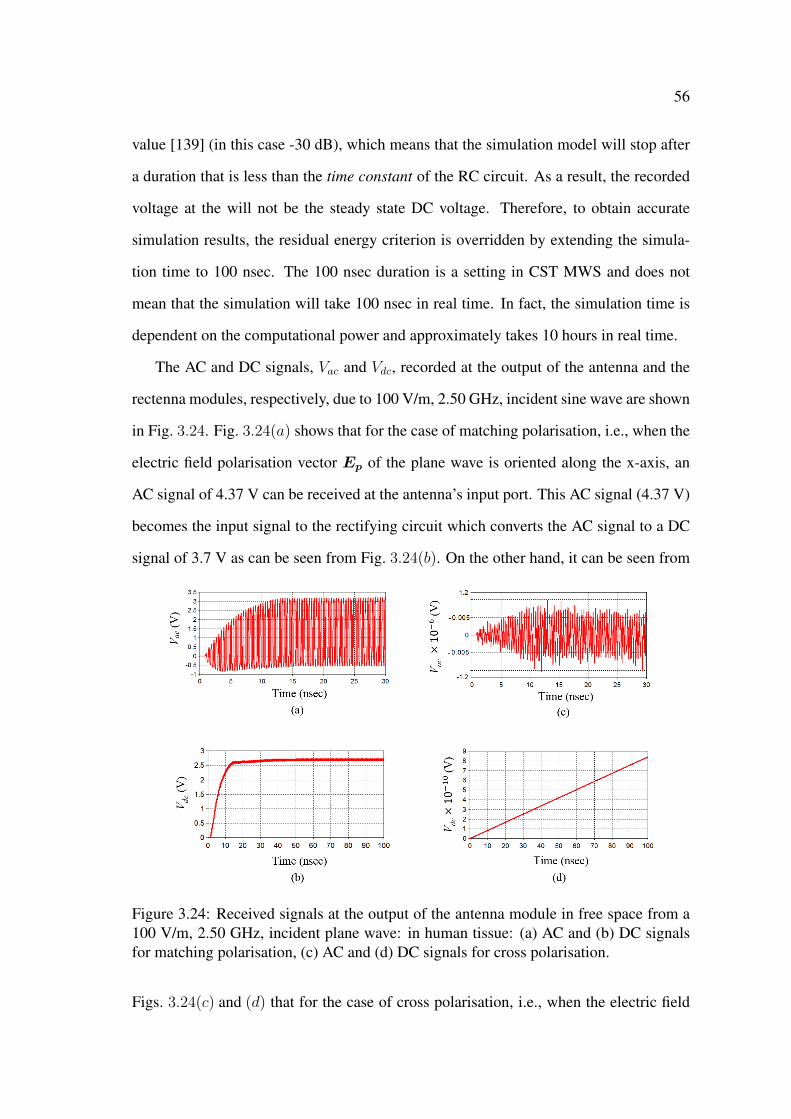
56
value [139] (in this case -30 dB), which means that the simulation model will stop after
a duration that is less than the time constant of the RC circuit. As a result, the recorded
voltage at the will not be the steady state DC voltage. Therefore, to obtain accurate
simulation results, the residual energy criterion is overridden by extending the simula-
tion time to 100 nsec. The 100 nsec duration is a setting in CST MWS and does not
mean that the simulation will take 100 nsec in real time. In fact, the simulation time is
dependent on the computational power and approximately takes 10 hours in real time.
The AC and DC signals, Vac and Vdc, recorded at the output of the antenna and the
rectenna modules, respectively, due to 100 V/m, 2.50 GHz, incident sine wave are shown
in Fig. 3.24. Fig. 3.24(a) shows that for the case of matching polarisation, i.e., when the
electric field polarisation vector Ep of the plane wave is oriented along the x-axis, an
AC signal of 4.37 V can be received at the antenna’s input port. This AC signal (4.37 V)
becomes the input signal to the rectifying circuit which converts the AC signal to a DC
signal of 3.7 V as can be seen from Fig. 3.24(b). On the other hand, it can be seen from
Figure 3.24: Received signals at the output of the antenna module in free space from a100 V/m, 2.50 GHz, incident plane wave: in human tissue: (a) AC and (b) DC signalsfor matching polarisation, (c) AC and (d) DC signals for cross polarisation.
Figs. 3.24(c) and (d) that for the case of cross polarisation, i.e., when the electric field
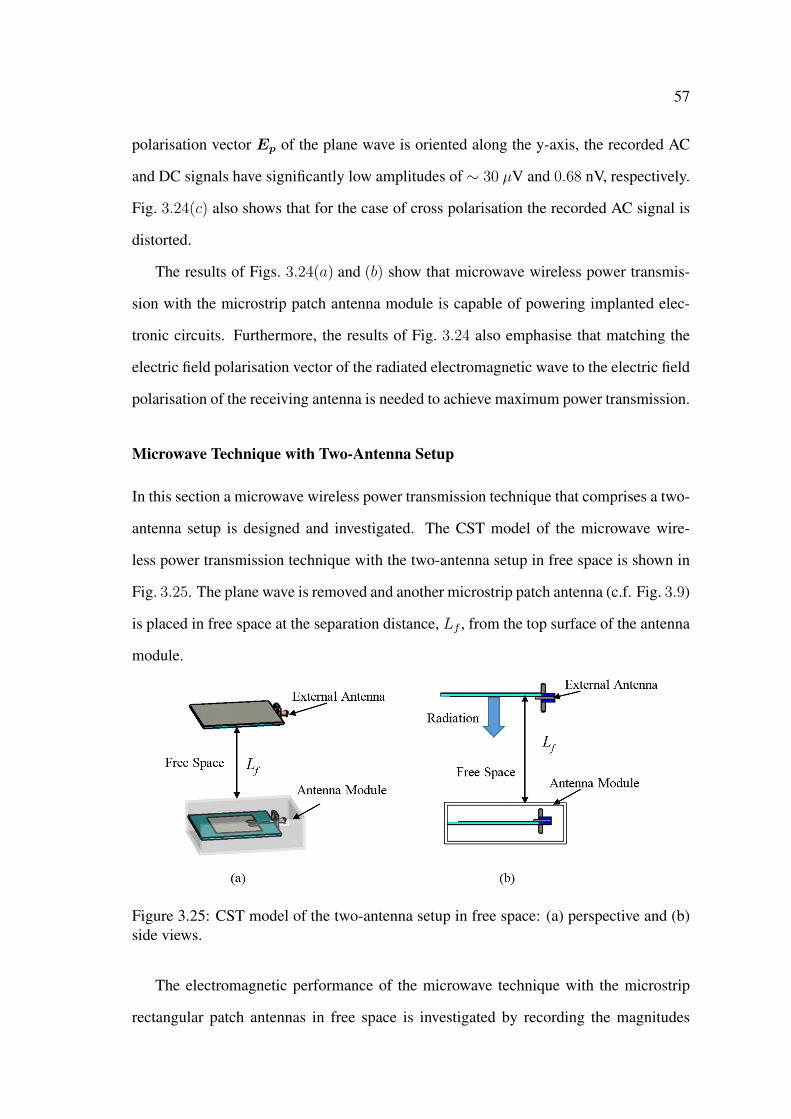
57
polarisation vector Ep of the plane wave is oriented along the y-axis, the recorded AC
and DC signals have significantly low amplitudes of ∼ 30 µV and 0.68 nV, respectively.
Fig. 3.24(c) also shows that for the case of cross polarisation the recorded AC signal is
distorted.
The results of Figs. 3.24(a) and (b) show that microwave wireless power transmis-
sion with the microstrip patch antenna module is capable of powering implanted elec-
tronic circuits. Furthermore, the results of Fig. 3.24 also emphasise that matching the
electric field polarisation vector of the radiated electromagnetic wave to the electric field
polarisation of the receiving antenna is needed to achieve maximum power transmission.
Microwave Technique with Two-Antenna Setup
In this section a microwave wireless power transmission technique that comprises a two-
antenna setup is designed and investigated. The CST model of the microwave wire-
less power transmission technique with the two-antenna setup in free space is shown in
Fig. 3.25. The plane wave is removed and another microstrip patch antenna (c.f. Fig. 3.9)
is placed in free space at the separation distance, Lf , from the top surface of the antenna
module.
Figure 3.25: CST model of the two-antenna setup in free space: (a) perspective and (b)side views.
The electromagnetic performance of the microwave technique with the microstrip
rectangular patch antennas in free space is investigated by recording the magnitudes
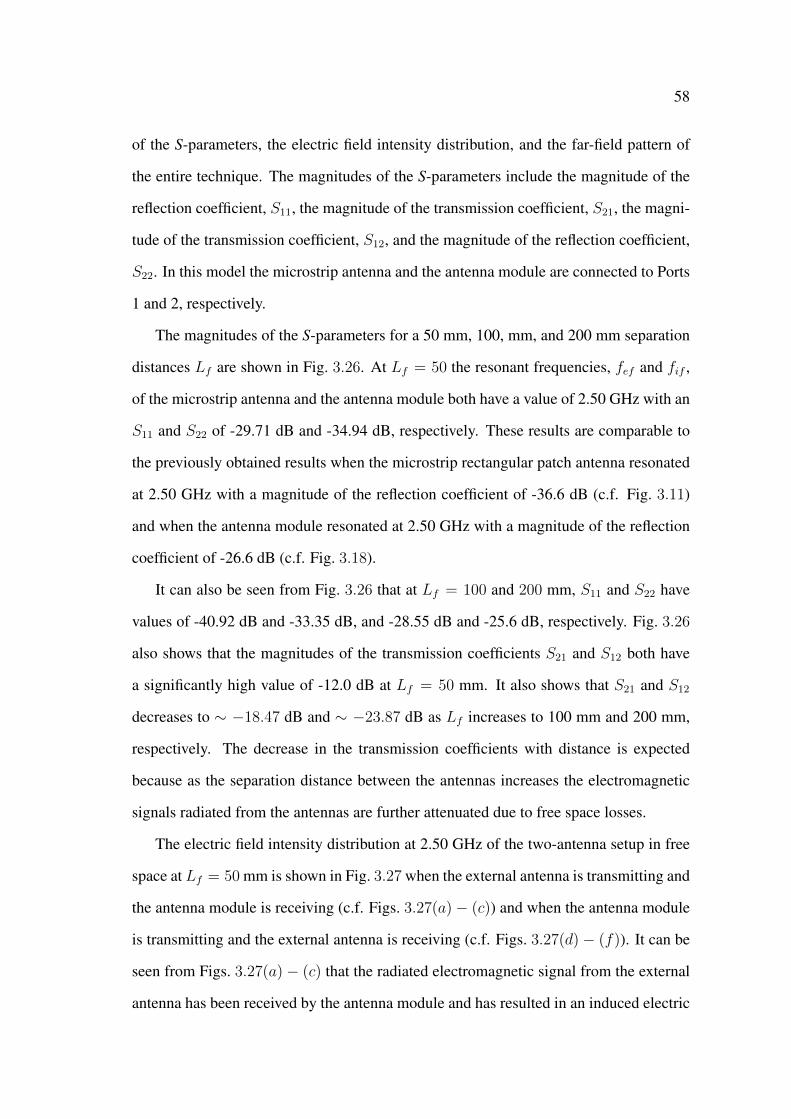
58
of the S-parameters, the electric field intensity distribution, and the far-field pattern of
the entire technique. The magnitudes of the S-parameters include the magnitude of the
reflection coefficient, S11, the magnitude of the transmission coefficient, S21, the magni-
tude of the transmission coefficient, S12, and the magnitude of the reflection coefficient,
S22. In this model the microstrip antenna and the antenna module are connected to Ports
1 and 2, respectively.
The magnitudes of the S-parameters for a 50 mm, 100, mm, and 200 mm separation
distances Lf are shown in Fig. 3.26. At Lf = 50 the resonant frequencies, fef and fif ,
of the microstrip antenna and the antenna module both have a value of 2.50 GHz with an
S11 and S22 of -29.71 dB and -34.94 dB, respectively. These results are comparable to
the previously obtained results when the microstrip rectangular patch antenna resonated
at 2.50 GHz with a magnitude of the reflection coefficient of -36.6 dB (c.f. Fig. 3.11)
and when the antenna module resonated at 2.50 GHz with a magnitude of the reflection
coefficient of -26.6 dB (c.f. Fig. 3.18).
It can also be seen from Fig. 3.26 that at Lf = 100 and 200 mm, S11 and S22 have
values of -40.92 dB and -33.35 dB, and -28.55 dB and -25.6 dB, respectively. Fig. 3.26
also shows that the magnitudes of the transmission coefficients S21 and S12 both have
a significantly high value of -12.0 dB at Lf = 50 mm. It also shows that S21 and S12
decreases to ∼ −18.47 dB and ∼ −23.87 dB as Lf increases to 100 mm and 200 mm,
respectively. The decrease in the transmission coefficients with distance is expected
because as the separation distance between the antennas increases the electromagnetic
signals radiated from the antennas are further attenuated due to free space losses.
The electric field intensity distribution at 2.50 GHz of the two-antenna setup in free
space at Lf = 50 mm is shown in Fig. 3.27 when the external antenna is transmitting and
the antenna module is receiving (c.f. Figs. 3.27(a)− (c)) and when the antenna module
is transmitting and the external antenna is receiving (c.f. Figs. 3.27(d)− (f)). It can be
seen from Figs. 3.27(a)− (c) that the radiated electromagnetic signal from the external
antenna has been received by the antenna module and has resulted in an induced electric

59
Figure 3.26: Magnitudes of the S-parameters in dB vs frequency of the two-antennasetup in free space when the external antenna is at the separation distance Lf of (a) 50mm, (b) 100 mm, (c) 200 mm.
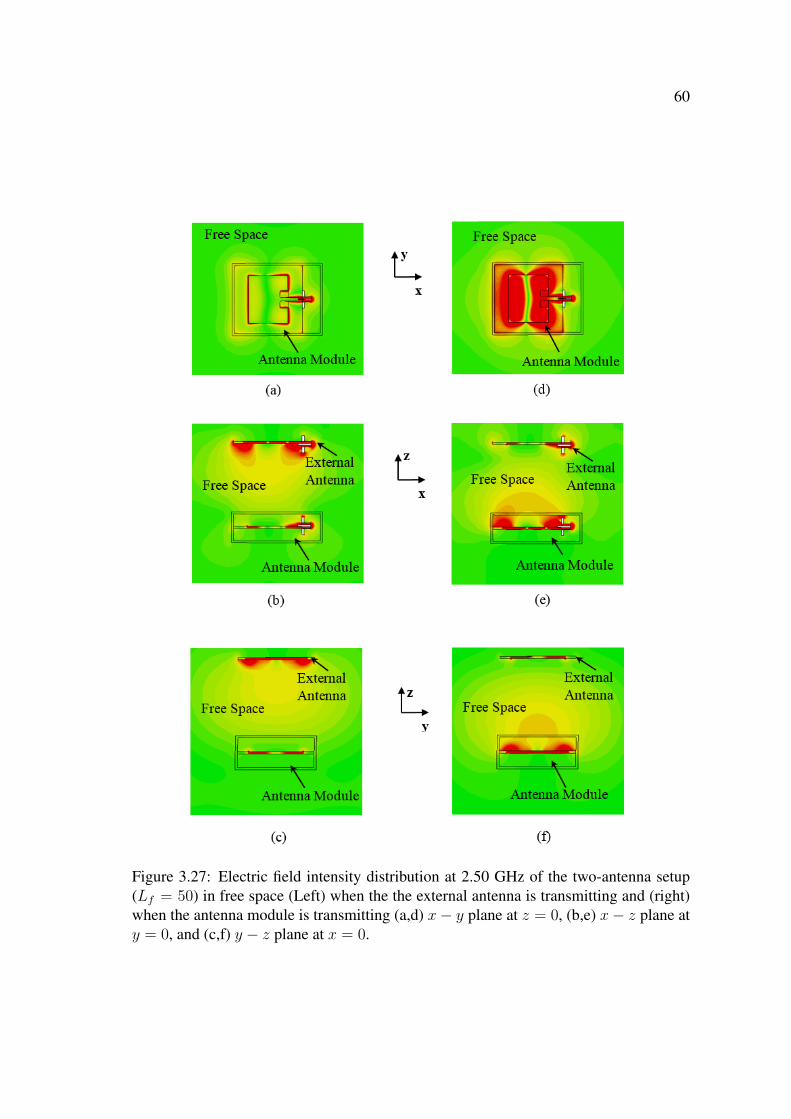
60
Figure 3.27: Electric field intensity distribution at 2.50 GHz of the two-antenna setup(Lf = 50) in free space (Left) when the the external antenna is transmitting and (right)when the antenna module is transmitting (a,d) x− y plane at z = 0, (b,e) x− z plane aty = 0, and (c,f) y − z plane at x = 0.

61
field on the rectangular patch of the antenna module. Figs. 3.27(d) − (f) also show
that the electromagnetic signal radiated from the implanted antenna is being received by
the the external antenna and results in an electric field on the rectangular patch of the
external antenna (c.f. Figs. 3.27(d) and (e)).
The far-field pattern at Lf = 50 mm of the two-antenna setup is shown in Fig. 3.28.
The external antenna and the antenna module have main lobe magnitudes in the az-
imuthal plane of -1.7 dB and -1.9 dB and main lobe magnitudes in the elevation plane
of 0.8 dB and 2.7 dB, respectively. In the elevation plane the external antenna and the
antenna modules have side-lobe levels of -2.4 dB and -3.2 dB, respectively. The external
antenna and the antenna module in the two-antenna setup have gains of 0.76 dB and
1.51 dB which are lower than the gains of the external antenna (2.46 dB) and the an-
tenna module (2.7 dB) when operating as single antennas in the transmitting mode. This
reduction in the gains of the antennas is a result of placing the antennas in the direction
of the radiation paths of each other. Placing the antennas in the radiation paths of each
other resulted in reflections of the radiated electromagnetic signals from each antenna to
the side of the antenna as can be seen from Figs. 3.28(c) and (f).
A summary of the resonant performance of the two-antenna setup which includes the
resonant frequency of the external antenna fef , the resonant frequency of the antenna
module fif , the magnitude of the S-parameters, the gains of the external antenna and the
antenna module, for a 50 mm, 100 mm, and 200 mm separation distances is shown in
Table 3.1.
From Table 3.1 it can be seen that the gain of the external antenna increases from 0.76
dB to 2.31 dB as Lf increases from 50 mm to 200 mm. Similarly, the gain of the antenna
module also increases from 1.51 dB to 2.57 dB as Lf increases from 50 mm to 200 mm.
The 2.31 dB gain of the external antenna and the 2.57 dB gain of the antenna module at
Lf = 200 mm are comparable to the 2.46 dB gain of the external antenna and the 2.7 dB
gain of the antenna module in the transmitting mode (c.f., Section 3.4.1). Furthermore, it
can be seen from Table 3.1 that as the separation distance increases from 50 mm to 200
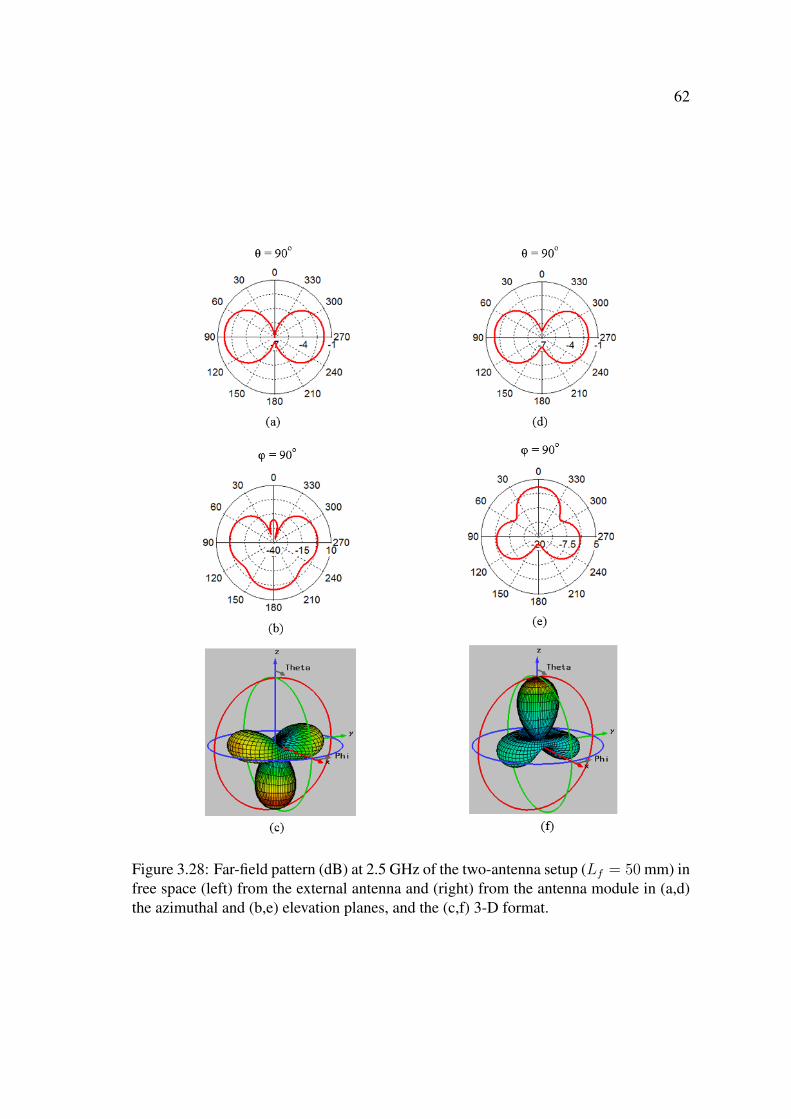
62
Figure 3.28: Far-field pattern (dB) at 2.5 GHz of the two-antenna setup (Lf = 50 mm) infree space (left) from the external antenna and (right) from the antenna module in (a,d)the azimuthal and (b,e) elevation planes, and the (c,f) 3-D format.
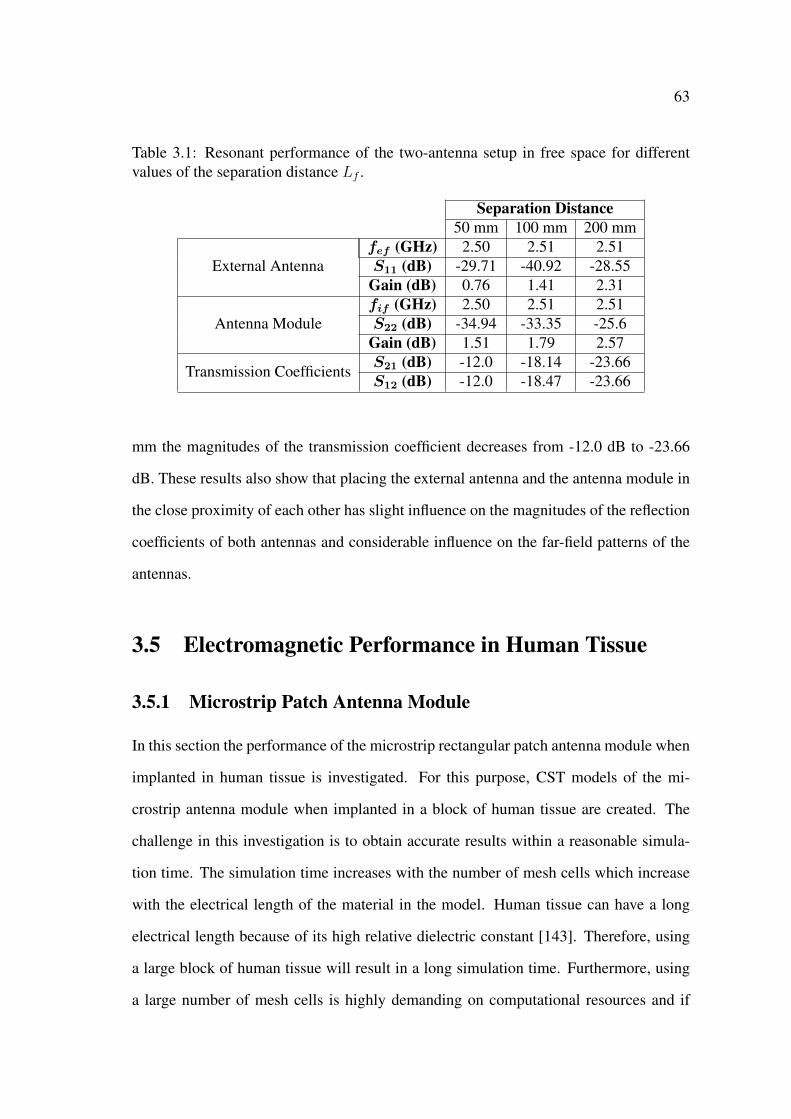
63
Table 3.1: Resonant performance of the two-antenna setup in free space for differentvalues of the separation distance Lf .
Separation Distance50 mm 100 mm 200 mm
External Antennafef (GHz) 2.50 2.51 2.51S11 (dB) -29.71 -40.92 -28.55
Gain (dB) 0.76 1.41 2.31
Antenna Modulefif (GHz) 2.50 2.51 2.51S22 (dB) -34.94 -33.35 -25.6
Gain (dB) 1.51 1.79 2.57
Transmission CoefficientsS21 (dB) -12.0 -18.14 -23.66S12 (dB) -12.0 -18.47 -23.66
mm the magnitudes of the transmission coefficient decreases from -12.0 dB to -23.66
dB. These results also show that placing the external antenna and the antenna module in
the close proximity of each other has slight influence on the magnitudes of the reflection
coefficients of both antennas and considerable influence on the far-field patterns of the
antennas.
3.5 Electromagnetic Performance in Human Tissue
3.5.1 Microstrip Patch Antenna Module
In this section the performance of the microstrip rectangular patch antenna module when
implanted in human tissue is investigated. For this purpose, CST models of the mi-
crostrip antenna module when implanted in a block of human tissue are created. The
challenge in this investigation is to obtain accurate results within a reasonable simula-
tion time. The simulation time increases with the number of mesh cells which increase
with the electrical length of the material in the model. Human tissue can have a long
electrical length because of its high relative dielectric constant [143]. Therefore, using
a large block of human tissue will result in a long simulation time. Furthermore, using
a large number of mesh cells is highly demanding on computational resources and if
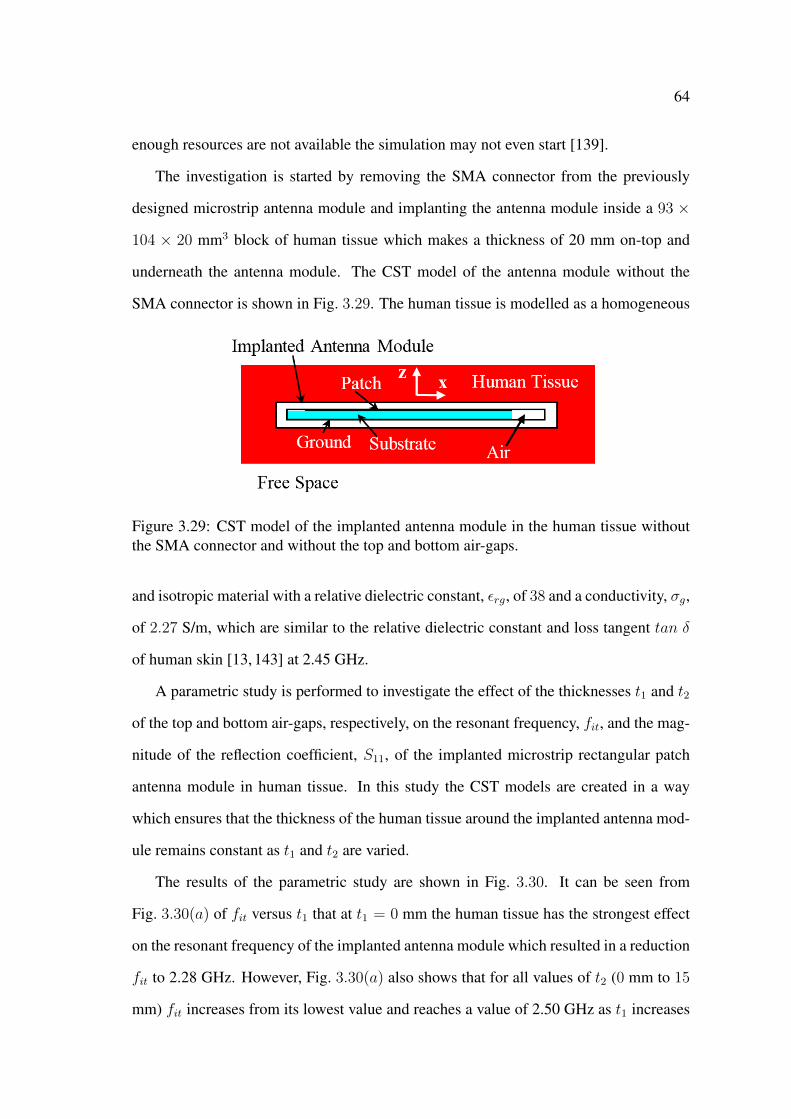
64
enough resources are not available the simulation may not even start [139].
The investigation is started by removing the SMA connector from the previously
designed microstrip antenna module and implanting the antenna module inside a 93 ×
104 × 20 mm3 block of human tissue which makes a thickness of 20 mm on-top and
underneath the antenna module. The CST model of the antenna module without the
SMA connector is shown in Fig. 3.29. The human tissue is modelled as a homogeneous
Figure 3.29: CST model of the implanted antenna module in the human tissue withoutthe SMA connector and without the top and bottom air-gaps.
and isotropic material with a relative dielectric constant, εrg, of 38 and a conductivity, σg,
of 2.27 S/m, which are similar to the relative dielectric constant and loss tangent tan δ
of human skin [13, 143] at 2.45 GHz.
A parametric study is performed to investigate the effect of the thicknesses t1 and t2
of the top and bottom air-gaps, respectively, on the resonant frequency, fit, and the mag-
nitude of the reflection coefficient, S11, of the implanted microstrip rectangular patch
antenna module in human tissue. In this study the CST models are created in a way
which ensures that the thickness of the human tissue around the implanted antenna mod-
ule remains constant as t1 and t2 are varied.
The results of the parametric study are shown in Fig. 3.30. It can be seen from
Fig. 3.30(a) of fit versus t1 that at t1 = 0 mm the human tissue has the strongest effect
on the resonant frequency of the implanted antenna module which resulted in a reduction
fit to 2.28 GHz. However, Fig. 3.30(a) also shows that for all values of t2 (0 mm to 15
mm) fit increases from its lowest value and reaches a value of 2.50 GHz as t1 increases

65
Figure 3.30: Parametric study results: (a) fit and (b) S11 vs t1 the thickness of thetop air-gap for various thicknesses of the bottom air-gap t2 of the implanted microstriprectangular patch antenna module in human tissue.
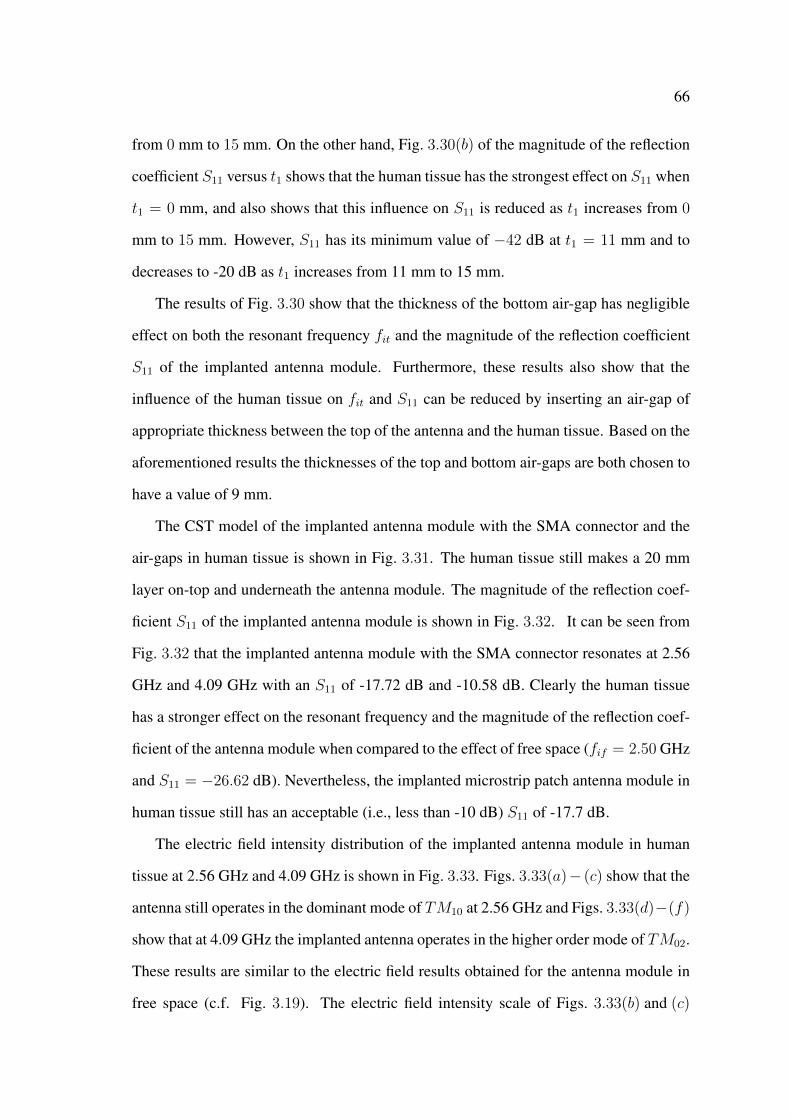
66
from 0 mm to 15 mm. On the other hand, Fig. 3.30(b) of the magnitude of the reflection
coefficient S11 versus t1 shows that the human tissue has the strongest effect on S11 when
t1 = 0 mm, and also shows that this influence on S11 is reduced as t1 increases from 0
mm to 15 mm. However, S11 has its minimum value of −42 dB at t1 = 11 mm and to
decreases to -20 dB as t1 increases from 11 mm to 15 mm.
The results of Fig. 3.30 show that the thickness of the bottom air-gap has negligible
effect on both the resonant frequency fit and the magnitude of the reflection coefficient
S11 of the implanted antenna module. Furthermore, these results also show that the
influence of the human tissue on fit and S11 can be reduced by inserting an air-gap of
appropriate thickness between the top of the antenna and the human tissue. Based on the
aforementioned results the thicknesses of the top and bottom air-gaps are both chosen to
have a value of 9 mm.
The CST model of the implanted antenna module with the SMA connector and the
air-gaps in human tissue is shown in Fig. 3.31. The human tissue still makes a 20 mm
layer on-top and underneath the antenna module. The magnitude of the reflection coef-
ficient S11 of the implanted antenna module is shown in Fig. 3.32. It can be seen from
Fig. 3.32 that the implanted antenna module with the SMA connector resonates at 2.56
GHz and 4.09 GHz with an S11 of -17.72 dB and -10.58 dB. Clearly the human tissue
has a stronger effect on the resonant frequency and the magnitude of the reflection coef-
ficient of the antenna module when compared to the effect of free space (fif = 2.50 GHz
and S11 = −26.62 dB). Nevertheless, the implanted microstrip patch antenna module in
human tissue still has an acceptable (i.e., less than -10 dB) S11 of -17.7 dB.
The electric field intensity distribution of the implanted antenna module in human
tissue at 2.56 GHz and 4.09 GHz is shown in Fig. 3.33. Figs. 3.33(a)− (c) show that the
antenna still operates in the dominant mode of TM10 at 2.56 GHz and Figs. 3.33(d)−(f)
show that at 4.09 GHz the implanted antenna operates in the higher order mode of TM02.
These results are similar to the electric field results obtained for the antenna module in
free space (c.f. Fig. 3.19). The electric field intensity scale of Figs. 3.33(b) and (c)

67
Figure 3.31: (a) Top, (b) side, (c) bottom, and (d) perspective views of the CST model ofthe implanted microstrip rectangular patch antenna module in a block of human tissue(not to scale). All dimensions are in mm.
Figure 3.32: S11 vs frequency of the implanted microstrip rectangular patch antennamodule in human tissue.
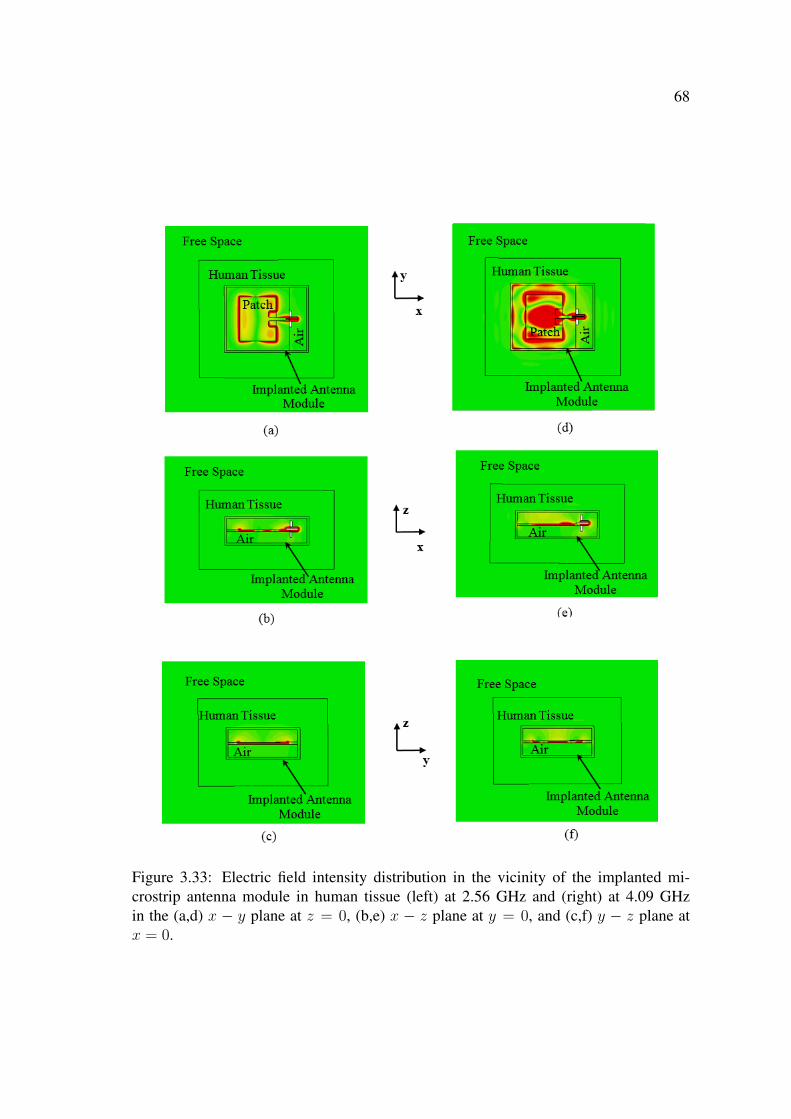
68
Figure 3.33: Electric field intensity distribution in the vicinity of the implanted mi-crostrip antenna module in human tissue (left) at 2.56 GHz and (right) at 4.09 GHzin the (a,d) x − y plane at z = 0, (b,e) x − z plane at y = 0, and (c,f) y − z plane atx = 0.
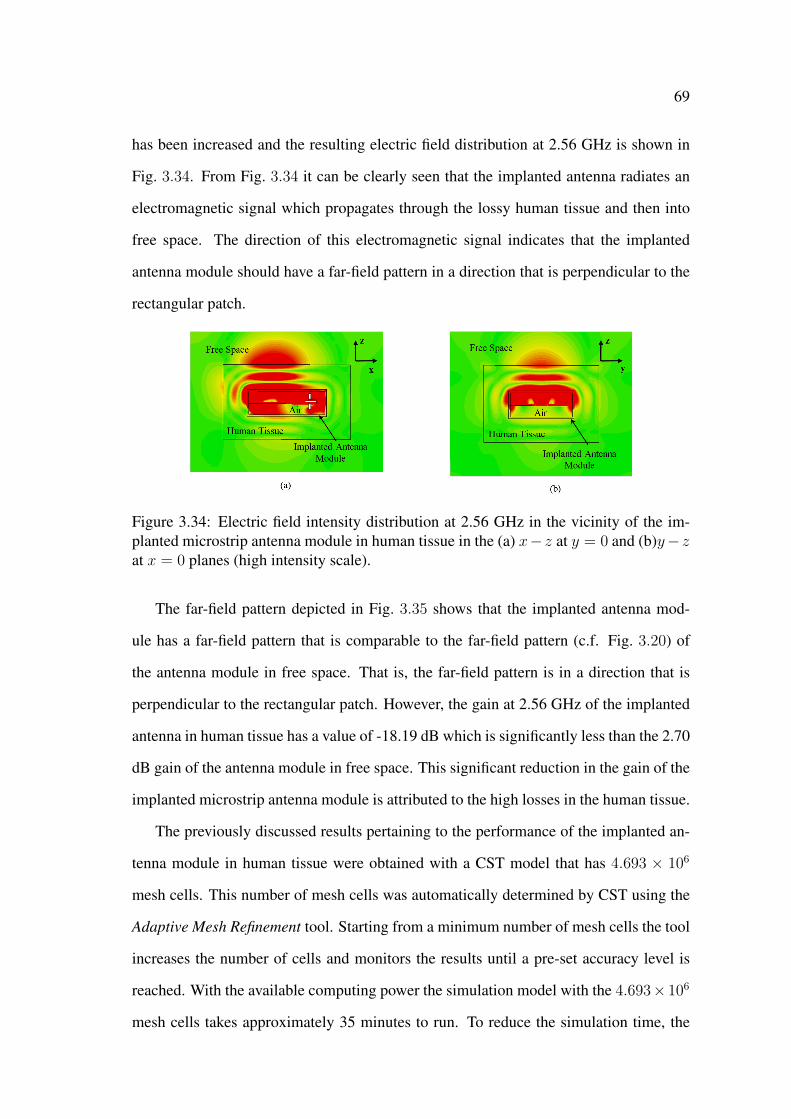
69
has been increased and the resulting electric field distribution at 2.56 GHz is shown in
Fig. 3.34. From Fig. 3.34 it can be clearly seen that the implanted antenna radiates an
electromagnetic signal which propagates through the lossy human tissue and then into
free space. The direction of this electromagnetic signal indicates that the implanted
antenna module should have a far-field pattern in a direction that is perpendicular to the
rectangular patch.
Figure 3.34: Electric field intensity distribution at 2.56 GHz in the vicinity of the im-planted microstrip antenna module in human tissue in the (a) x− z at y = 0 and (b)y− zat x = 0 planes (high intensity scale).
The far-field pattern depicted in Fig. 3.35 shows that the implanted antenna mod-
ule has a far-field pattern that is comparable to the far-field pattern (c.f. Fig. 3.20) of
the antenna module in free space. That is, the far-field pattern is in a direction that is
perpendicular to the rectangular patch. However, the gain at 2.56 GHz of the implanted
antenna in human tissue has a value of -18.19 dB which is significantly less than the 2.70
dB gain of the antenna module in free space. This significant reduction in the gain of the
implanted microstrip antenna module is attributed to the high losses in the human tissue.
The previously discussed results pertaining to the performance of the implanted an-
tenna module in human tissue were obtained with a CST model that has 4.693 × 10⁶
mesh cells. This number of mesh cells was automatically determined by CST using the
Adaptive Mesh Refinement tool. Starting from a minimum number of mesh cells the tool
increases the number of cells and monitors the results until a pre-set accuracy level is
reached. With the available computing power the simulation model with the 4.693× 10⁶
mesh cells takes approximately 35 minutes to run. To reduce the simulation time, the

70
Figure 3.35: Far-field pattern (dB) at 2.56 GHz of the implanted microstrip rectangularpatch antenna module in human tissue in the (a) azimuthal and (b) elevation planes, and(c) 3-D format.
71
mesh cells were manually modified to ensure that the critical components of the sim-
ulation model (such as the substrate of the antenna) has higher number of mesh cells
than the number of mesh cells on the non-critical components such as the free space
layer surrounding the block of human tissue. The manually modified CST model has
1.805 × 10⁶ mesh cells and the simulation time of this model is approximately 5 min-
utes. The magnitudes of the reflection coefficient S11 of the antenna module in free
space of both simulation models is shown in Fig. 3.36. It can be seen from Fig. 3.36 that
both plots of S11 versus frequency are identical. Furthermore, both antennas have a gain
of approximately -18.00 dB at 2.56 GHz which shows that by manually modifying the
mesh cells in CST, the simulation time can be significantly reduced while still obtaining
accurate simulation results.
Figure 3.36: S11 versus frequency of the implanted antenna module in human tissue withhigh and low number of mesh cells in CST MWS.
3.5.2 Wireless Power Transmission in Human Tissue
Plane Wave Excitation and Rectification
The CST model of the implanted antenna module in human tissue when excited by an
incident plane wave is shown in Fig. 3.37. The implanted antenna module is operating
in the receiving mode and is excited by a 100 V/m, 2.56 GHz, incident sine wave for

72
both the matching (Fig. 3.37(b)) and cross (Fig. 3.37(c)) polarisation of the electric field
vector Ep.
Figure 3.37: CST model of the implanted antenna module in human tissue when excitedby an incident plane wave : (a) side view. Top view when the electric field polarisationvector Ep is oriented along the (b) x and (c) y-axes.
The incident plane wave is propagating along the -z-axis in a direction that is per-
pendicular to the top side of the rectangular patch antenna. The induced electric field
intensity distribution on the implanted antenna module due to the plane wave excitation
for both polarisations is shown in Fig. 3.38. Figs. 3.38(a) and (b) show that there is
a one variation of the electric field in the x-axis and no variations in the y-axis which
means that in the receiving mode, the implanted antenna module in human tissue is still
operating in the dominant mode TM10 at 2.56 GHz.
On the other hand it can be seen from Fig. 3.38 that despite the high intensity of the
electric field outside the human tissue, there is low intensity of the electric field inside
the tissue. The low intensity of the field inside the human tissue is attributed to the
high losses of the tissue. However, Figs. 3.38(a) and (b) both show that despite the low
intensity of the electric field inside the human tissue, there is high concentration of the

73
Figure 3.38: Electric field intensity distribution at 2.56 GHz within the vicinity of themicrostrip patch antenna module in human tissue when the electric field polarisationvector of the incident plane wave is oriented along the (left) x and (right) y-axes in the(a,d) x− y plane at z = 0, (b,e) x− z plane at y = 0 and (c,f) y − z plane at x = 0.
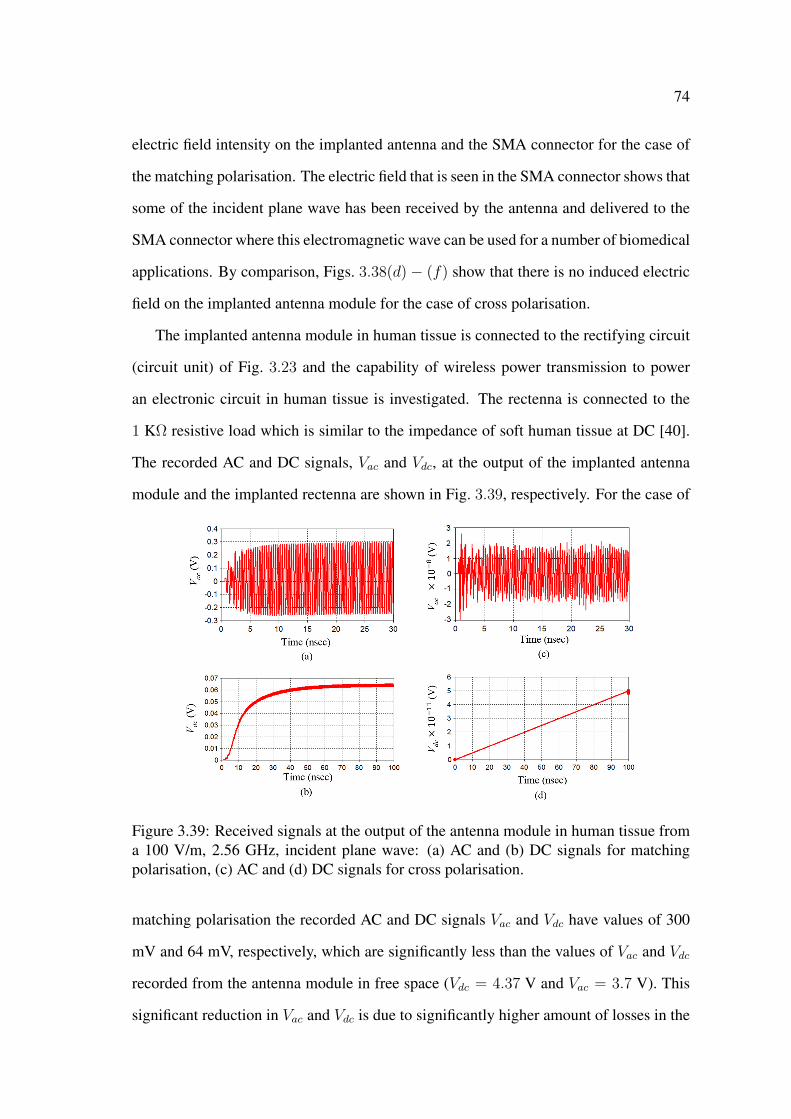
74
electric field intensity on the implanted antenna and the SMA connector for the case of
the matching polarisation. The electric field that is seen in the SMA connector shows that
some of the incident plane wave has been received by the antenna and delivered to the
SMA connector where this electromagnetic wave can be used for a number of biomedical
applications. By comparison, Figs. 3.38(d)− (f) show that there is no induced electric
field on the implanted antenna module for the case of cross polarisation.
The implanted antenna module in human tissue is connected to the rectifying circuit
(circuit unit) of Fig. 3.23 and the capability of wireless power transmission to power
an electronic circuit in human tissue is investigated. The rectenna is connected to the
1 KΩ resistive load which is similar to the impedance of soft human tissue at DC [40].
The recorded AC and DC signals, Vac and Vdc, at the output of the implanted antenna
module and the implanted rectenna are shown in Fig. 3.39, respectively. For the case of
Figure 3.39: Received signals at the output of the antenna module in human tissue froma 100 V/m, 2.56 GHz, incident plane wave: (a) AC and (b) DC signals for matchingpolarisation, (c) AC and (d) DC signals for cross polarisation.
matching polarisation the recorded AC and DC signals Vac and Vdc have values of 300
mV and 64 mV, respectively, which are significantly less than the values of Vac and Vdc
recorded from the antenna module in free space (Vdc = 4.37 V and Vac = 3.7 V). This
significant reduction in Vac and Vdc is due to significantly higher amount of losses in the
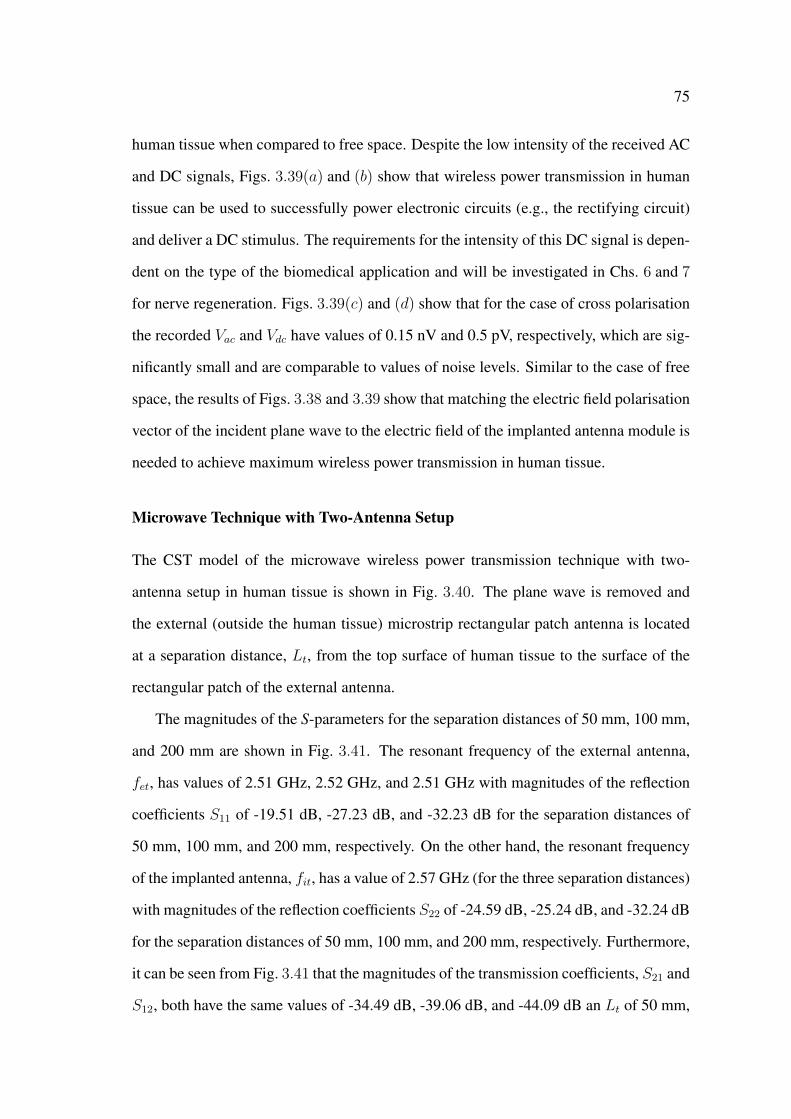
75
human tissue when compared to free space. Despite the low intensity of the received AC
and DC signals, Figs. 3.39(a) and (b) show that wireless power transmission in human
tissue can be used to successfully power electronic circuits (e.g., the rectifying circuit)
and deliver a DC stimulus. The requirements for the intensity of this DC signal is depen-
dent on the type of the biomedical application and will be investigated in Chs. 6 and 7
for nerve regeneration. Figs. 3.39(c) and (d) show that for the case of cross polarisation
the recorded Vac and Vdc have values of 0.15 nV and 0.5 pV, respectively, which are sig-
nificantly small and are comparable to values of noise levels. Similar to the case of free
space, the results of Figs. 3.38 and 3.39 show that matching the electric field polarisation
vector of the incident plane wave to the electric field of the implanted antenna module is
needed to achieve maximum wireless power transmission in human tissue.
Microwave Technique with Two-Antenna Setup
The CST model of the microwave wireless power transmission technique with two-
antenna setup in human tissue is shown in Fig. 3.40. The plane wave is removed and
the external (outside the human tissue) microstrip rectangular patch antenna is located
at a separation distance, Lt, from the top surface of human tissue to the surface of the
rectangular patch of the external antenna.
The magnitudes of the S-parameters for the separation distances of 50 mm, 100 mm,
and 200 mm are shown in Fig. 3.41. The resonant frequency of the external antenna,
fet, has values of 2.51 GHz, 2.52 GHz, and 2.51 GHz with magnitudes of the reflection
coefficients S11 of -19.51 dB, -27.23 dB, and -32.23 dB for the separation distances of
50 mm, 100 mm, and 200 mm, respectively. On the other hand, the resonant frequency
of the implanted antenna, fit, has a value of 2.57 GHz (for the three separation distances)
with magnitudes of the reflection coefficients S22 of -24.59 dB, -25.24 dB, and -32.24 dB
for the separation distances of 50 mm, 100 mm, and 200 mm, respectively. Furthermore,
it can be seen from Fig. 3.41 that the magnitudes of the transmission coefficients, S21 and
S12, both have the same values of -34.49 dB, -39.06 dB, and -44.09 dB an Lt of 50 mm,

76
100 mm, and 200 mm, respectively. It can be seen from the results of the magnitudes
of the transmission coefficients that similar to the cases of the two-antenna setup in free
space, the magnitudes of the transmission coefficients decrease as the separation distance
increases.
These results also show that S21 and S12 have magnitudes that are significantly lower
than the magnitudes of the corresponding transmission coefficients for the two-antenna
setup in free space. The significant reduction in S21 and S12 is attributed to the high lossi-
ness of the human tissue and the mismatch in the resonant frequency fit (2.57 GHz) of
the implanted antenna and the resonant frequency fet (2.51 GHz) of the external antenna.
The effect of the mismatch in the resonant frequencies of the implanted and external an-
tennas can be seen from Fig. 3.41 where S21 and S12 have maximum values at the point
of intersection between the plots of S11 and S22, i.e., 2.54 GHz. Therefore, it can be
deduced that matching the resonant frequencies of the implanted and external antennas
will enhance the magnitudes of the transmission coefficients, and thereby, optimise the
microwave wireless power transmission technique in human tissue. The optimisation of
the microwave wireless power transmission technique will be carried out in Chs. 6 and 7.
Figure 3.40: CST model of the two-antenna setup in human tissue: (a) perspective and(b) side views.
Despite the significant reduction in the magnitudes of the transmission coefficient, it
77
Figure 3.41: Magnitudes of the S-parameters in dB vs frequency of the two-antennasetup in human tissue when the external antenna is at the separation distance Lt of (a)50 mm, (b) 100 mm, (c) 200 mm.
78
can be seen from Figs. 3.42(a) − (c) which shows the electric field distribution of the
two-antenna setup (at Lt = 50 mm) in human tissue that there is an induced electric field
on the implanted microstrip rectangular patch antenna module as a result of the radiated
electromagnetic signal from the external antenna. Figs. 3.42(a) and (b) also show that
there is a an electromagnetic signal that is being delivered to the SMA connector which
demonstrates the feasibility of wireless power transmission in human tissue.
Figs. 3.42(b) and (c) show that due to the lossiness of the human tissue there is sig-
nificantly lower intensity of the electric field propagating inside the human tissue when
compared to the intensity of the electric field radiated from the external antenna in free
space. Figs. 3.42(b) and (c) also show that placing the block of human tissue in the di-
rection of the radiated electromagnetic signal from the external antenna has resulted in
considerable reflections of this radiated signal towards the sides of the external antenna
which implies that the far-field pattern of the external antenna will have considerable
side lobes. By comparison, Figs. 3.42(e) and (f) clearly show that the radiated electro-
magnetic signal from the implanted antenna propagates through the human tissue and the
free space region in a direction that is perpendicular to the rectangular patch of the im-
planted antenna and towards the external antenna. This implies that the far-field pattern
of the implanted antenna will have a pattern that is comparable to the far-field pattern
(c.f. Fig. 3.35(c)) of the implanted antenna when operating in the transmitting mode.
The far-field pattern of the two-antenna setup with the 50 mm separation distance is
shown in Fig. 3.43. It can be seen from Figs. 3.43(a)− (c), and as expected (relating to
the electric field distribution of Figs. 3.42(b) and (c)), that the main lobe of the far-field
pattern is to the side of the external antenna at 72o. The external antenna has a gain of
-3.4 dB at 2.51 GHz. On the other hand, Figs. 3.43(d)− (f) show that, and as expected
(relating to the electric field distribution of Figs. 3.42(e) and (f)), that the far-field pat-
tern is comparable to the far-field pattern (c.f. Fig. 3.35(c)) of the implanted antenna
in the transmitting mode. At 2.57 GHz the implanted antenna has a gain of -20.89 dB
which is slightly lower than the -18.19 dB gain of the implanted antenna in the trans-

79
Figure 3.42: Electric field intensity distribution at 2.57 GHz of the two-antenna setup(Lt = 50) in human tissue (left) when the the external antenna is transmitting and (right)when the implanted antenna is transmitting in the (a,d) x− y plane at z = 0, (b,e) x− zplane at y = 0, and (c,f) y − z plane at x = 0.

80
Figure 3.43: Far-field pattern (dB) of the two-antenna setup (Lt = 50 mm) in humantissue (left) from the external antenna at 2.51 GHz and (right) from the implanted antennamodule at 2.57 GHz in (a) the azimuthal and (b) elevation planes, and the (c) 3-D format.
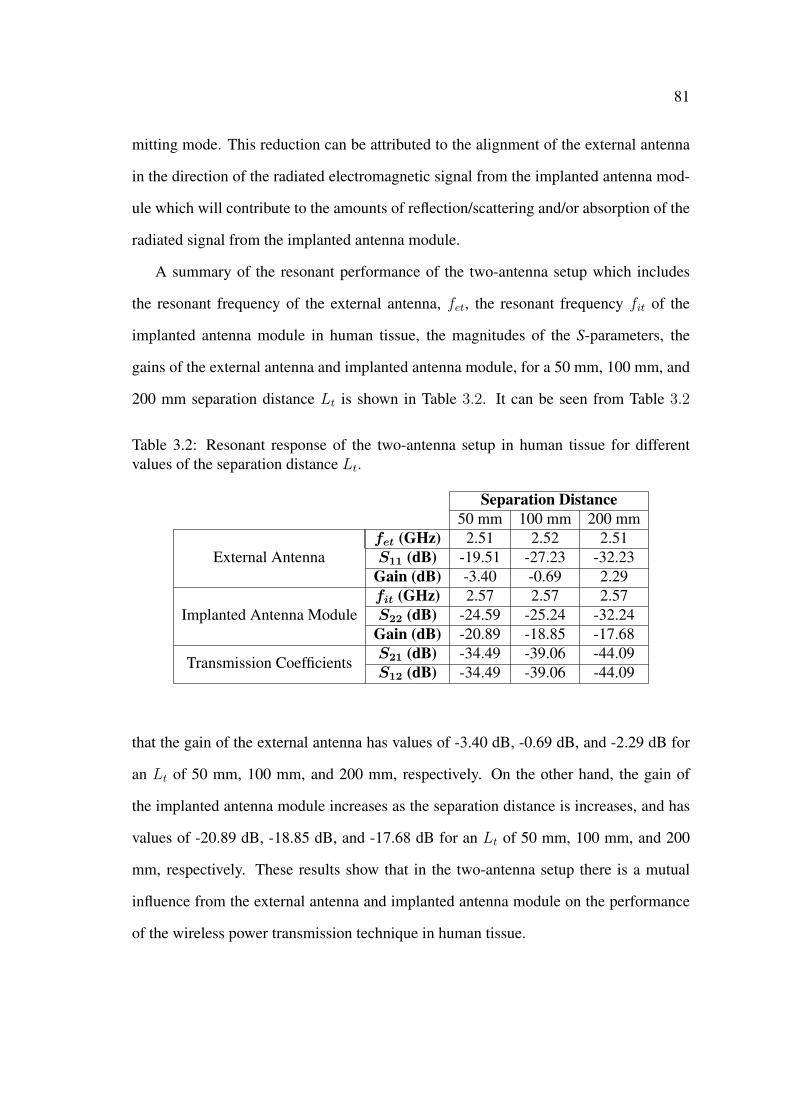
81
mitting mode. This reduction can be attributed to the alignment of the external antenna
in the direction of the radiated electromagnetic signal from the implanted antenna mod-
ule which will contribute to the amounts of reflection/scattering and/or absorption of the
radiated signal from the implanted antenna module.
A summary of the resonant performance of the two-antenna setup which includes
the resonant frequency of the external antenna, fet, the resonant frequency fit of the
implanted antenna module in human tissue, the magnitudes of the S-parameters, the
gains of the external antenna and implanted antenna module, for a 50 mm, 100 mm, and
200 mm separation distance Lt is shown in Table 3.2. It can be seen from Table 3.2
Table 3.2: Resonant response of the two-antenna setup in human tissue for differentvalues of the separation distance Lt.
Separation Distance50 mm 100 mm 200 mm
External Antennafet (GHz) 2.51 2.52 2.51S11 (dB) -19.51 -27.23 -32.23
Gain (dB) -3.40 -0.69 2.29
Implanted Antenna Modulefit (GHz) 2.57 2.57 2.57S22 (dB) -24.59 -25.24 -32.24
Gain (dB) -20.89 -18.85 -17.68
Transmission CoefficientsS21 (dB) -34.49 -39.06 -44.09S12 (dB) -34.49 -39.06 -44.09
that the gain of the external antenna has values of -3.40 dB, -0.69 dB, and -2.29 dB for
an Lt of 50 mm, 100 mm, and 200 mm, respectively. On the other hand, the gain of
the implanted antenna module increases as the separation distance is increases, and has
values of -20.89 dB, -18.85 dB, and -17.68 dB for an Lt of 50 mm, 100 mm, and 200
mm, respectively. These results show that in the two-antenna setup there is a mutual
influence from the external antenna and implanted antenna module on the performance
of the wireless power transmission technique in human tissue.

82
3.6 Electromagnetic Performance in Other Material
In the previous sections, the performance of microwave wireless power transmission
was investigated in lossless (free space) and high lossy (human tissue) materials. In
some applications, the microstrip antenna may also be implanted inside human tissue
with low/medium losses such as bones and fat. For example, fat has a relative dielectric
constant of of 5.28 and a loss tangent tan δ of 0.145 at 2.45 GHz [143].
In the simulation models, it is relatively easy to implant the microstrip patch antenna
module in medium lossy material that simulates the influence of bones and fat on the per-
formance of the antenna and wireless power transmission. However, implanting the mi-
crostrip antenna module in low/medium losses human tissue for measurement purposes
(which will be discussed in Chapter 4) is not possible due to the limited resources. On the
other hand, measuring the performance of wireless power transmission in low/medium
lossy material can be done by using any material that has low to medium dielectric and
conductor losses at 2.45 GHz. For instance, dry concrete is a low/medium lossy material
with a relative dielectric constant of 4 and a loss tangent tan δ of 0.0125 [166], and can
be easily manufactured in the local laboratory at UWS.
3.6.1 Microstrip Patch Antenna Module
The CST model of the implanted antenna module without the SMA connector in a
medium lossy material is shown in Fig. 3.44. The antenna module is implanted in the
middle of a 250 mm cube of medium lossy material. The material has a relative dielec-
tric constant, εrc, of 4 and a loss tangent, tan δc, of 0.0125 [166]. The 250 mm cube of
medium lossy material matches the size of standard concrete specimens that is used in
the measurement setup of Chapter 4.
A parametric study is performed on the effect of the top and bottom thicknesses of the
air-gaps t1 and t2, respectively, on the resonant frequency, fim, and the magnitude of the
reflection coefficient, S11, of the implanted antenna module in medium lossy material.
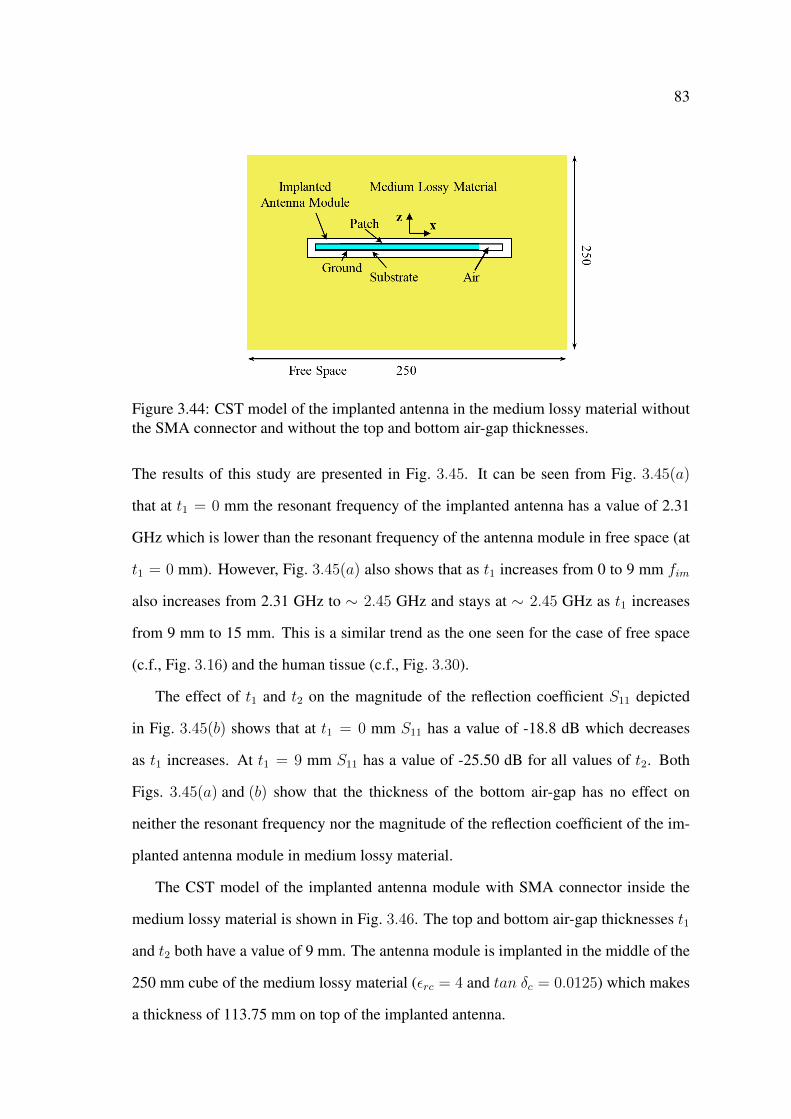
83
Figure 3.44: CST model of the implanted antenna in the medium lossy material withoutthe SMA connector and without the top and bottom air-gap thicknesses.
The results of this study are presented in Fig. 3.45. It can be seen from Fig. 3.45(a)
that at t1 = 0 mm the resonant frequency of the implanted antenna has a value of 2.31
GHz which is lower than the resonant frequency of the antenna module in free space (at
t1 = 0 mm). However, Fig. 3.45(a) also shows that as t1 increases from 0 to 9 mm fim
also increases from 2.31 GHz to ∼ 2.45 GHz and stays at ∼ 2.45 GHz as t1 increases
from 9 mm to 15 mm. This is a similar trend as the one seen for the case of free space
(c.f., Fig. 3.16) and the human tissue (c.f., Fig. 3.30).
The effect of t1 and t2 on the magnitude of the reflection coefficient S11 depicted
in Fig. 3.45(b) shows that at t1 = 0 mm S11 has a value of -18.8 dB which decreases
as t1 increases. At t1 = 9 mm S11 has a value of -25.50 dB for all values of t2. Both
Figs. 3.45(a) and (b) show that the thickness of the bottom air-gap has no effect on
neither the resonant frequency nor the magnitude of the reflection coefficient of the im-
planted antenna module in medium lossy material.
The CST model of the implanted antenna module with SMA connector inside the
medium lossy material is shown in Fig. 3.46. The top and bottom air-gap thicknesses t1
and t2 both have a value of 9 mm. The antenna module is implanted in the middle of the
250 mm cube of the medium lossy material (εrc = 4 and tan δc = 0.0125) which makes
a thickness of 113.75 mm on top of the implanted antenna.
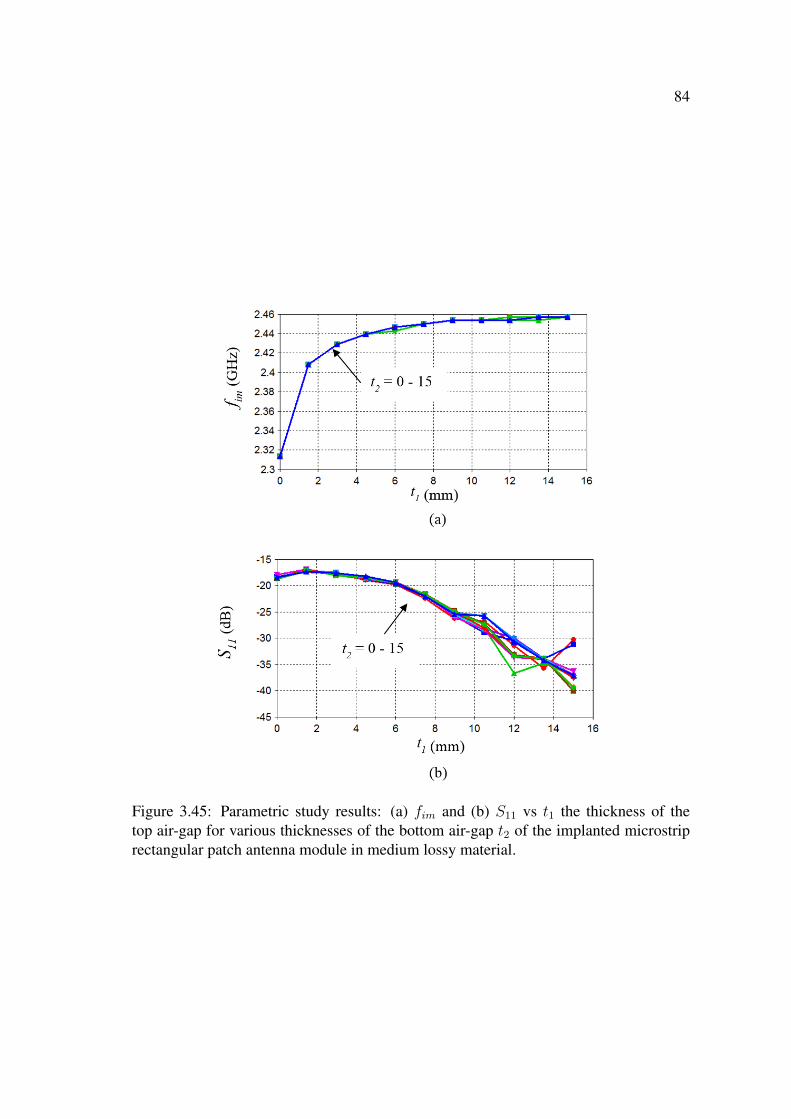
84
Figure 3.45: Parametric study results: (a) fim and (b) S11 vs t1 the thickness of thetop air-gap for various thicknesses of the bottom air-gap t2 of the implanted microstriprectangular patch antenna module in medium lossy material.
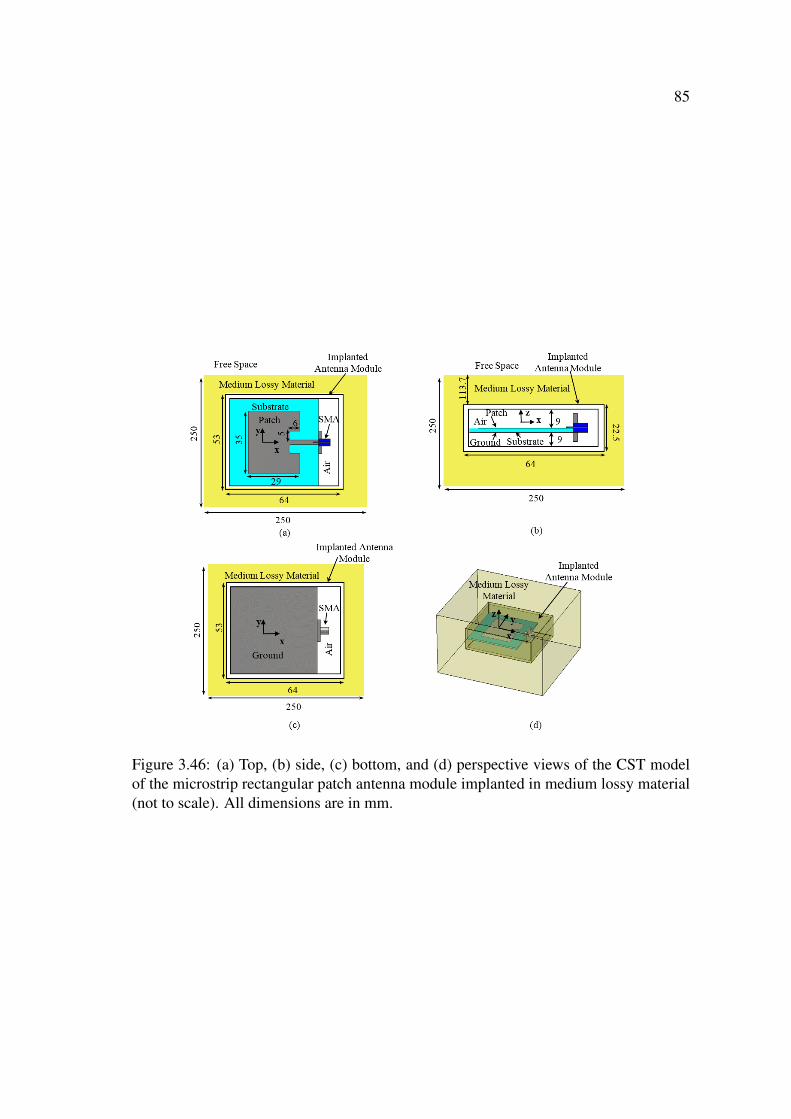
85
Figure 3.46: (a) Top, (b) side, (c) bottom, and (d) perspective views of the CST modelof the microstrip rectangular patch antenna module implanted in medium lossy material(not to scale). All dimensions are in mm.

86
The magnitude of the reflection coefficient S11 of the antenna module in medium
lossy material is shown in Fig. 3.47. The implanted antenna module resonates at 2.53
GHz and 4.09 GHz with an S11 of -20.23 dB and -12.93 dB, respectively. The 2.53 GHz
frequency of the implantable antenna module in medium lossy material is different from
the 2.50 GHz and 2.56 GHz resonant frequencies of the antenna module in free space
and in human tissue, respectively.
Figure 3.47: S11 vs frequency of the implanted microstrip rectangular patch antennamodule in medium lossy material.
The electric field intensity distribution of the implanted antenna inside the medium
lossy material is shown in Fig. 3.48. It can be seen from Figs. 3.48(a) and (b) that
the implanted antenna module still operates in the dominant mode of TM10 and the
higher order mode of TM02 at 2.53 GHz and 4.09 GHz, respectively. Furthermore,
Figs. 3.48(b) and (c) clearly show that there is an electromagnetic signal radiated from
the implanted antenna module and that the direction of this signal is perpendicular to the
rectangular patch along the z-axis. The direction of this radiated electromagnetic signal
is similar to the direction of the far-field of the antenna module shown in Fig. 3.20 which
shows that the implanted antenna is operating as expected. In addition, the radiated
electromagnetic signal propagates through the top layer (113.75 mm) of the medium
lossy material and reaches the free space layer.
The far-field pattern of the implanted antenna module in the medium lossy material is
shown in Fig. 3.49. Unlike the far-field patterns of the antenna module in free space and

87
Figure 3.48: Electric field intensity distribution in the vicinity of the implanted mi-crostrip rectangular patch antenna module in medium lossy material (left) at 2.53 GHzand (right) at 4.09 GHz in the (a,d) x− y plane at z = 0, (b,e) x− z plane at y = 0, and(c,f) y − z plane at x = 0.

88
human tissue, c.f., Figs. 3.20 and 3.35, respectively, the 3-D far-field pattern presented
in Fig. 3.49(c) shows that there is a higher concentration of the far-field in the directions
of the corners of the medium lossy material cube.
Figure 3.49: Far-field pattern (dB) at 2.53 GHz of the implanted microstrip rectangularpatch antenna module in medium lossy material in the (a) azimuthal and (b) elevationplanes, and (c) 3-D format.
Since the electromagnetic signal radiated from the implanted antenna is along the
z-axis (c.f. Figs. 3.48(b) and (c)) which shows that the implanted antenna is operating
as expected, the far-field pattern of Fig. 3.20(c) implies that there is a focusing effect
from the corners of the medium lossy material cube. The implanted antenna module in
medium lossy material has a gain of 3.10 dB at 2.53 GHz which is higher than the 2.7
dB and -18.19 dB gains of of the antenna module in free space and in human tissue,
respectively. Because of the higher losses of the medium lossy material when compared
to free space, it was expected that the antenna module in medium lossy material will
have a less gain than the gain of the antenna module in free space. The increase in the
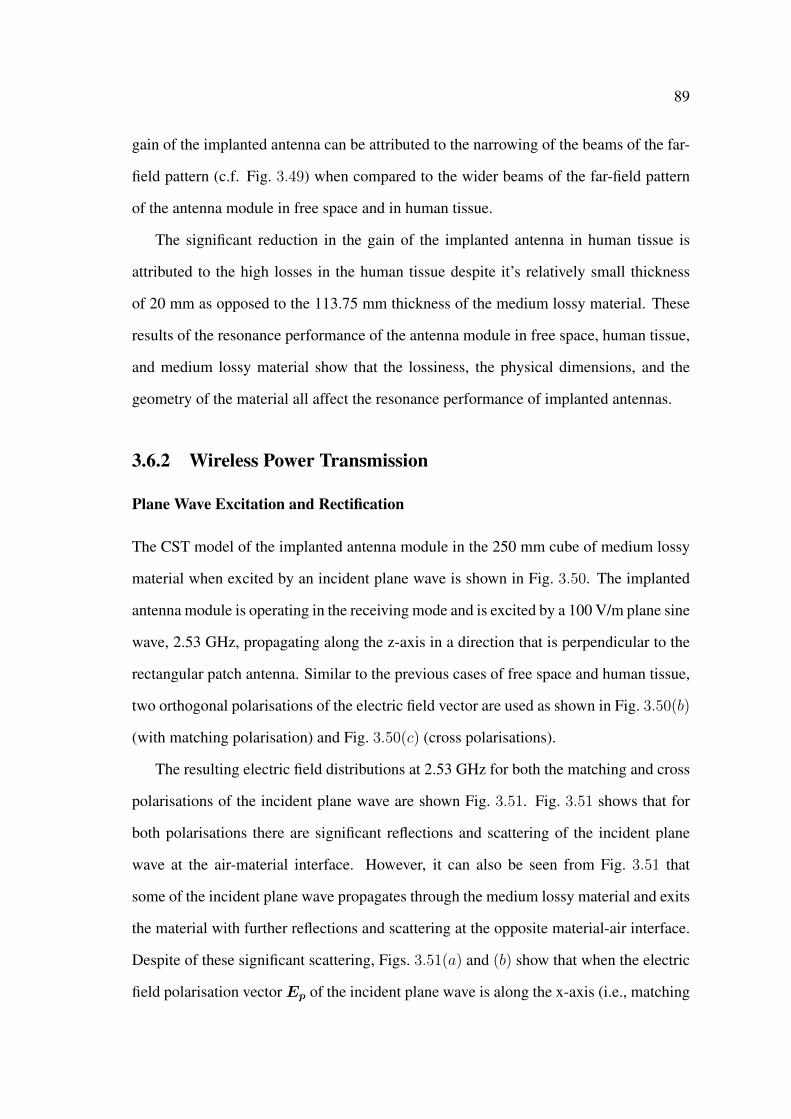
89
gain of the implanted antenna can be attributed to the narrowing of the beams of the far-
field pattern (c.f. Fig. 3.49) when compared to the wider beams of the far-field pattern
of the antenna module in free space and in human tissue.
The significant reduction in the gain of the implanted antenna in human tissue is
attributed to the high losses in the human tissue despite it’s relatively small thickness
of 20 mm as opposed to the 113.75 mm thickness of the medium lossy material. These
results of the resonance performance of the antenna module in free space, human tissue,
and medium lossy material show that the lossiness, the physical dimensions, and the
geometry of the material all affect the resonance performance of implanted antennas.
3.6.2 Wireless Power Transmission
Plane Wave Excitation and Rectification
The CST model of the implanted antenna module in the 250 mm cube of medium lossy
material when excited by an incident plane wave is shown in Fig. 3.50. The implanted
antenna module is operating in the receiving mode and is excited by a 100 V/m plane sine
wave, 2.53 GHz, propagating along the z-axis in a direction that is perpendicular to the
rectangular patch antenna. Similar to the previous cases of free space and human tissue,
two orthogonal polarisations of the electric field vector are used as shown in Fig. 3.50(b)
(with matching polarisation) and Fig. 3.50(c) (cross polarisations).
The resulting electric field distributions at 2.53 GHz for both the matching and cross
polarisations of the incident plane wave are shown Fig. 3.51. Fig. 3.51 shows that for
both polarisations there are significant reflections and scattering of the incident plane
wave at the air-material interface. However, it can also be seen from Fig. 3.51 that
some of the incident plane wave propagates through the medium lossy material and exits
the material with further reflections and scattering at the opposite material-air interface.
Despite of these significant scattering, Figs. 3.51(a) and (b) show that when the electric
field polarisation vectorEp of the incident plane wave is along the x-axis (i.e., matching
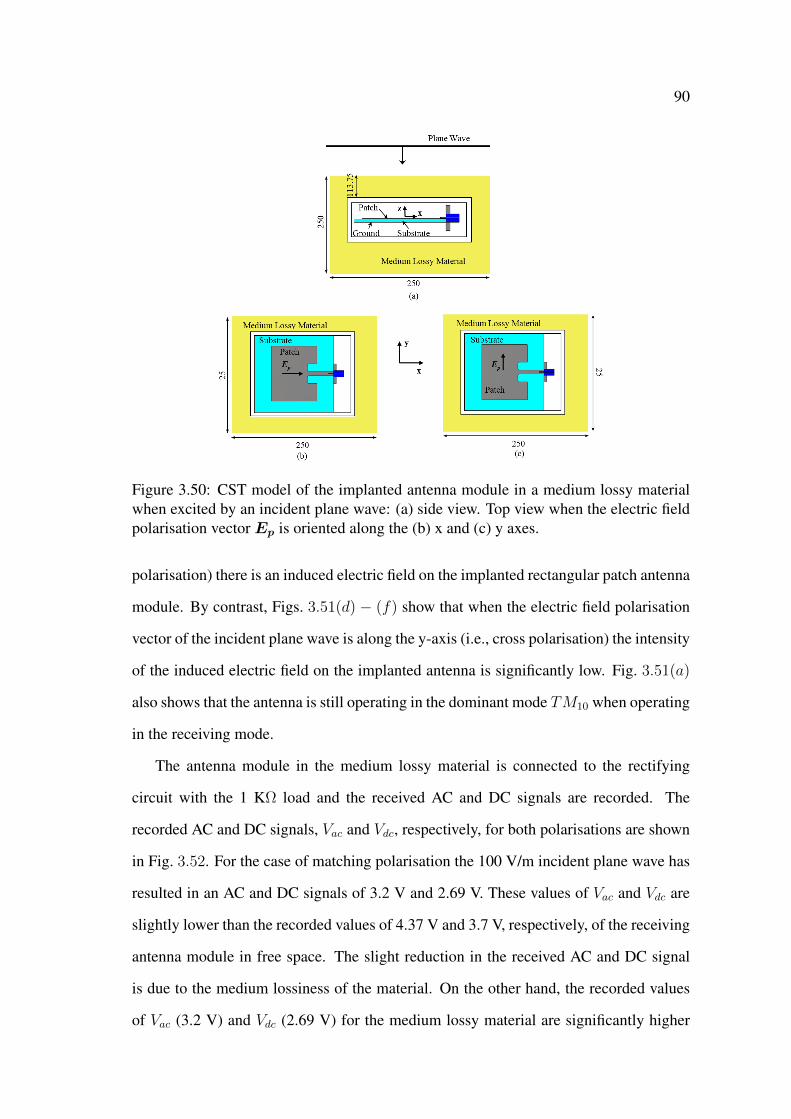
90
Figure 3.50: CST model of the implanted antenna module in a medium lossy materialwhen excited by an incident plane wave: (a) side view. Top view when the electric fieldpolarisation vector Ep is oriented along the (b) x and (c) y axes.
polarisation) there is an induced electric field on the implanted rectangular patch antenna
module. By contrast, Figs. 3.51(d) − (f) show that when the electric field polarisation
vector of the incident plane wave is along the y-axis (i.e., cross polarisation) the intensity
of the induced electric field on the implanted antenna is significantly low. Fig. 3.51(a)
also shows that the antenna is still operating in the dominant mode TM10 when operating
in the receiving mode.
The antenna module in the medium lossy material is connected to the rectifying
circuit with the 1 KΩ load and the received AC and DC signals are recorded. The
recorded AC and DC signals, Vac and Vdc, respectively, for both polarisations are shown
in Fig. 3.52. For the case of matching polarisation the 100 V/m incident plane wave has
resulted in an AC and DC signals of 3.2 V and 2.69 V. These values of Vac and Vdc are
slightly lower than the recorded values of 4.37 V and 3.7 V, respectively, of the receiving
antenna module in free space. The slight reduction in the received AC and DC signal
is due to the medium lossiness of the material. On the other hand, the recorded values
of Vac (3.2 V) and Vdc (2.69 V) for the medium lossy material are significantly higher

91
Figure 3.51: Electric field intensity distribution at 2.53 GHz within the vicinity of themicrostrip patch antenna module in medium lossy material when the electric field po-larisation vector of the incident plane wave is oriented along the (left) x-axis and (right)y-axis in the (a,d) x− y plane at z = 0, (b,e) x− z plane at y = 0 and (c,f) y − z planeat x = 0.
92
than the values (Vac = 300 mV and Vdc = 64 mV) received from the implanted antenna
module in human tissue. As expected, in the medium lossy material the recorded Vac
and Vdc for the case of the cross polarisation have significantly low values of 6 nV and
0.84 nV, respectively.
Figure 3.52: Received signals at the output of the antenna module in medium lossymaterial from a 100 V/m, 2.53 GHz, incident plane wave: (a) AC and (b) DC signals formatching polarisation, (c) AC and (d) DC signals for cross polarisation.
Microwave Technique with Two-Antenna Setup
The CST model of the two-antenna setup in medium lossy material is shown in Fig. 3.53.
The plane wave is removed and the microstrip rectangular patch antenna was placed in
free space at a separation distance, Le, from the top surface of the medium lossy material
as shown in Fig. 3.53. Fig. 3.54 shows the magnitude of the S-parameters for the two-
antenna setup in the medium lossy material. Since the implanted antenna module is
placed at the depth of 113.75 mm from the surface of the medium lossy material, in this
section the investigation is done for a 10 mm, 50 mm, and 100 mm separation distanceLe
which match the separation distances of the experimental setup discussed in Chapter 4.
At Le = 10 mm the external antenna has a resonant frequency, fem, of 2.52 GHz

93
Figure 3.53: CST model of the two-antenna setup in medium lossy material: (a) per-spective and (b) side views.
with an S11 of -18.36 dB. Moreover, it can be seen from Figs. 3.54(b) and (c) that fem
has values of 2.49 GHz and 2.50 GHz with an S11 of -30.6 dB and -32.74 dB for Lf
of 50 mm and 100 mm, respectively. At Le = 10 mm the resonant frequency of the
external antenna shifted from ∼ 2.50 GHz to 2.52 GHz which is similar the resonant
frequency (2.53 GHz) of the implanted antenna module in medium lossy material. This
similarity is due to the 10 mm separation distance which is comparable to the 10.5 mm
(9 mm thickness of the top air-gap plus the 1.5 mm thickness of the protective hous-
ing) separation distance between the rectangular patch of the implanted antenna module
and the medium lossy material. Furthermore, it was shown in Section 3.6.1 that when
the antenna module (resonating at 2.50 GHz in free space) was implanted in the cube
of medium lossy material the resonant frequency shifted from 2.50 GHz to 2.53 GHz.
These results shows that placing the external antenna in close proximity of lossy material
will also influence the performance of the external antenna, and as a result, can influence
the performance of the entire microwave technique. On the other hand, the resonant
frequency, fim, of the implanted antenna module has values of 2.53 GHz, 2.52 GHz,
and 2.53 GHz with an S11 of -23.11 dB, -26.09 dB, and -25.19 dB for the separation
distances of 10 mm, 50 mm, and 100 mm, respectively.
Fig. 3.54 also shows that the magnitudes of the transmission coefficients S21 and S12

94
Figure 3.54: Magnitudes of the S-parameters in dB vs frequency of the two-antennasetup in medium lossy material when the external antenna is at the separation distanceLe of (a) 10 mm, (b) 50 mm, (c) 100 mm.
95
have values of -13.15 dB, -17.92 dB, and -22.28 dB for the separation distance Lf of 10
mm, 50 mm, and 100 mm, respectively. It can be seen that for the separation distance
of 50 mm and 100 mm the -17.92 dB and -25.19 dB magnitudes of the transmission
coefficients of the two-antenna setup in the medium lossy material have lower values
than the -12.0 dB and -18.47 dB magnitudes of the transmission coefficient in free space
and higher values than the -34.49 dB and -39.06 dB magnitudes of the transmission
coefficients in human tissue. These results show, and as expected, that the magnitudes
of the transmission coefficients, and consequently, the performance microwave wireless
power transmission technique, are dependant on the lossiness of the material.
The electric field intensity distribution for the two-antenna setup in the medium lossy
material at Le = 50 mm is shown in Fig. 3.55. The radiated electromagnetic signal from
the external antenna has resulted in an induced electric field on the rectangular patch
and on the SMA connector as can be seen from Figs. 3.55(a) and (b). Furthermore,
Figs. 3.55(b) and (c) show that the radiated electromagnetic signal propagates through
the medium lossy material, is further scattered inside the medium lossy material by the
implanted antenna module, and continues to propagate out of the medium loss material
into free space. Similarly, Figs. 3.55(e) and (f) show that most of the electromagnetic
signal radiated from the implanted antenna module propagates through the medium lossy
material in the direction that is perpendicular to the patch towards the external antenna,
however, it can also be seen from Figs. 3.55(e) and (f) that some of this electromagnetic
signal is scattered to the sides and the bottom of the medium lossy material.
This scattering of the electromagnetic signal radiated from both antennas explains
the non-uniform far-field pattern of the two-antenna setup (at Le = 50 mm) shown in
Fig. 3.56. At 2.50 GHz the external antenna has main lobe magnitudes of -4.6 dB and
8.70 dB in the azimuthal and elevation planes, respectively. The side-lobe level in the
elevation plane is -7.4 dB and the external antenna has a gain of 8.73 dB. By contrast,
the implanted antenna module has main lobe magnitudes of -3.9 and 1.1 dB at 2.53 GHz
in the azimuthal and elevation planes, respectively. The side-lobe level in the elevation
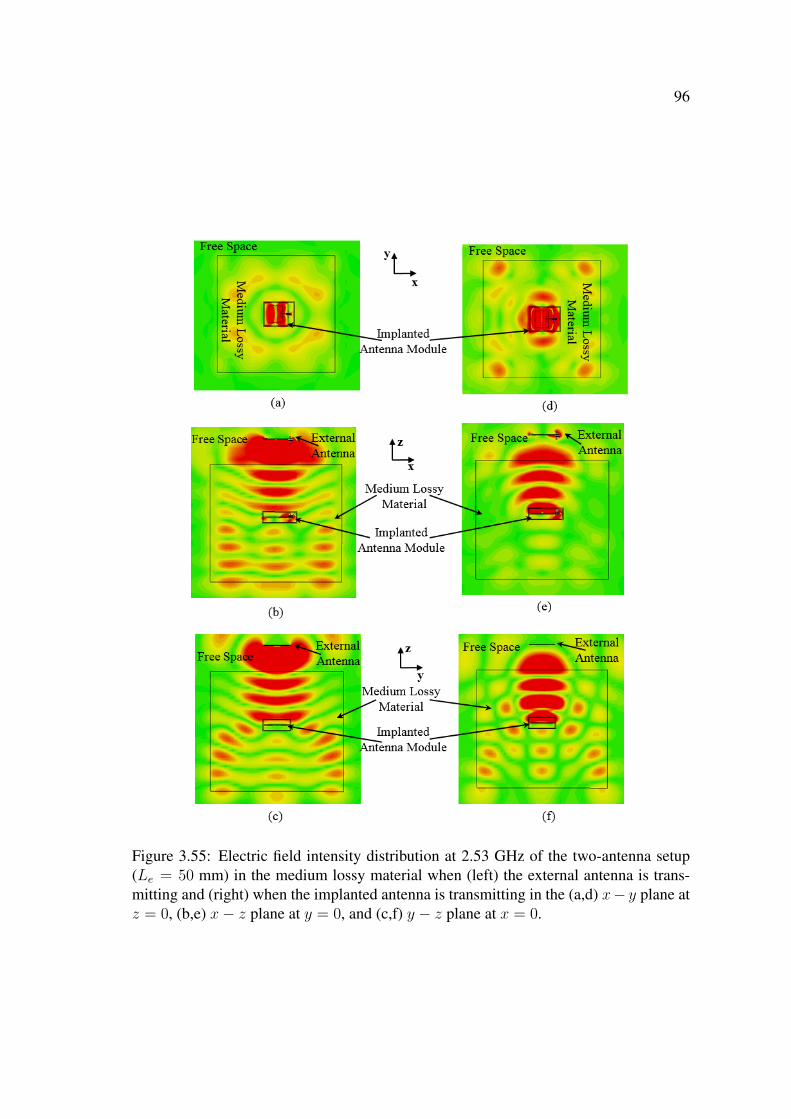
96
Figure 3.55: Electric field intensity distribution at 2.53 GHz of the two-antenna setup(Le = 50 mm) in the medium lossy material when (left) the external antenna is trans-mitting and (right) when the implanted antenna is transmitting in the (a,d) x− y plane atz = 0, (b,e) x− z plane at y = 0, and (c,f) y − z plane at x = 0.
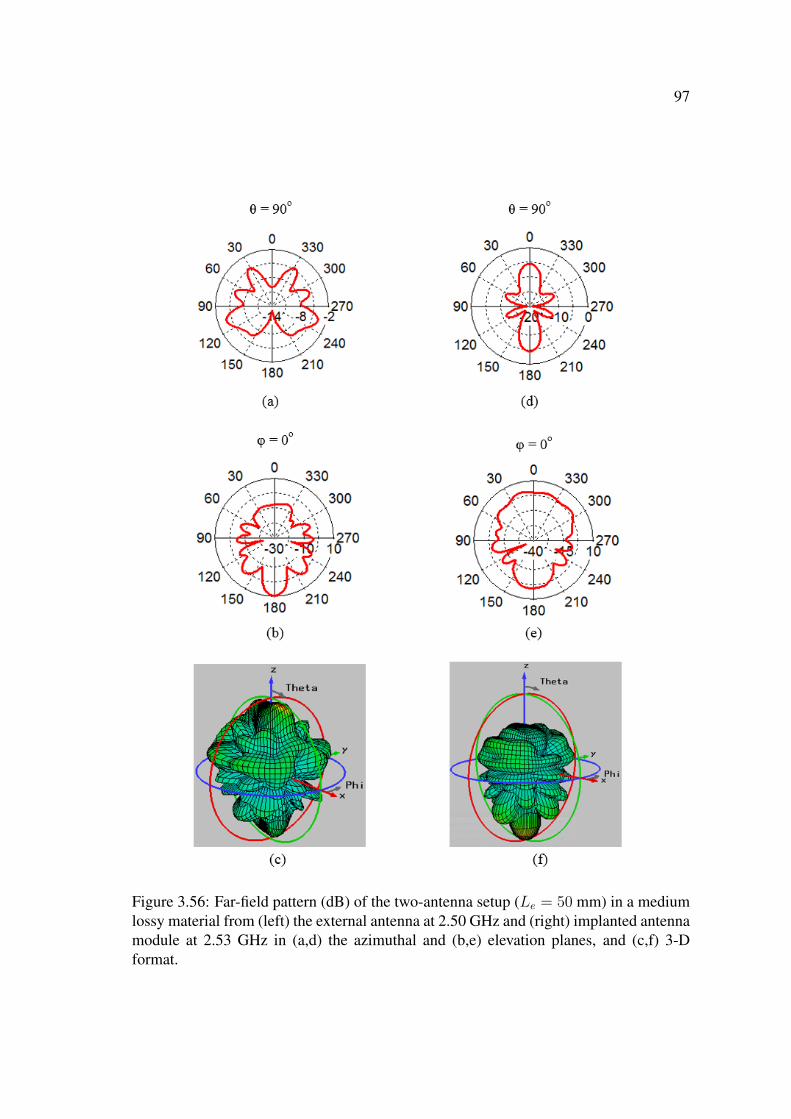
97
Figure 3.56: Far-field pattern (dB) of the two-antenna setup (Le = 50 mm) in a mediumlossy material from (left) the external antenna at 2.50 GHz and (right) implanted antennamodule at 2.53 GHz in (a,d) the azimuthal and (b,e) elevation planes, and (c,f) 3-Dformat.
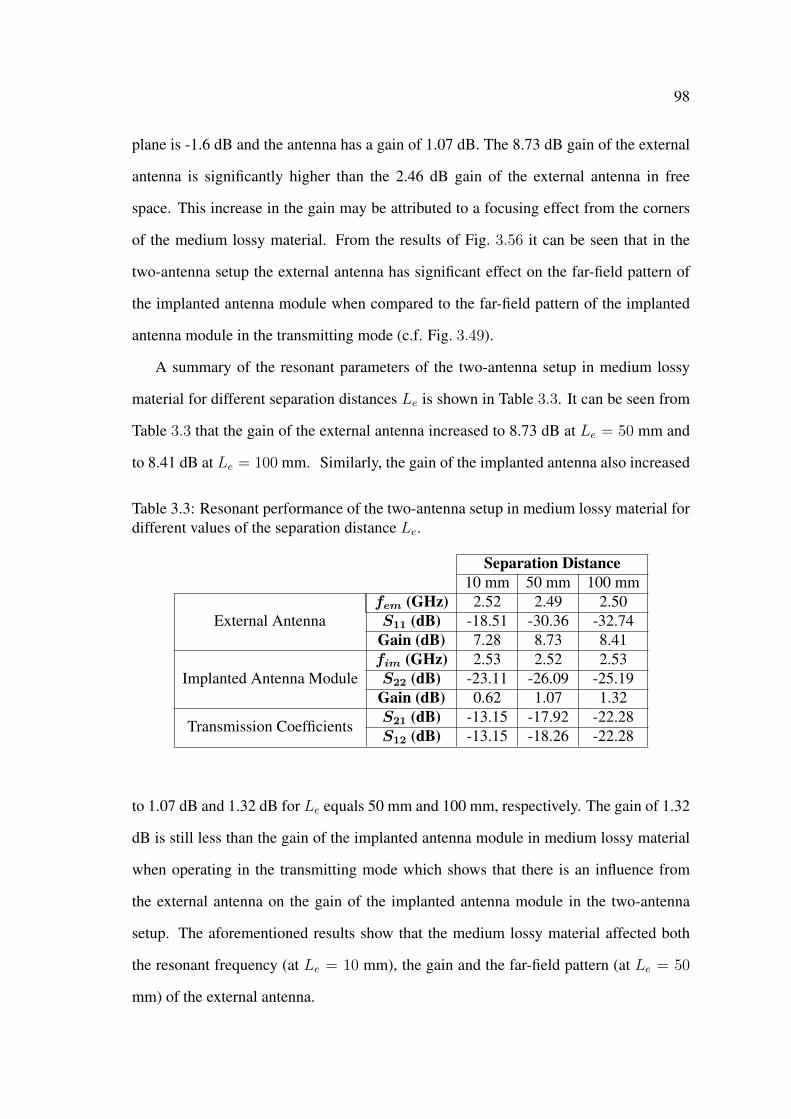
98
plane is -1.6 dB and the antenna has a gain of 1.07 dB. The 8.73 dB gain of the external
antenna is significantly higher than the 2.46 dB gain of the external antenna in free
space. This increase in the gain may be attributed to a focusing effect from the corners
of the medium lossy material. From the results of Fig. 3.56 it can be seen that in the
two-antenna setup the external antenna has significant effect on the far-field pattern of
the implanted antenna module when compared to the far-field pattern of the implanted
antenna module in the transmitting mode (c.f. Fig. 3.49).
A summary of the resonant parameters of the two-antenna setup in medium lossy
material for different separation distances Le is shown in Table 3.3. It can be seen from
Table 3.3 that the gain of the external antenna increased to 8.73 dB at Le = 50 mm and
to 8.41 dB at Le = 100 mm. Similarly, the gain of the implanted antenna also increased
Table 3.3: Resonant performance of the two-antenna setup in medium lossy material fordifferent values of the separation distance Le.
Separation Distance10 mm 50 mm 100 mm
External Antennafem (GHz) 2.52 2.49 2.50S11 (dB) -18.51 -30.36 -32.74
Gain (dB) 7.28 8.73 8.41
Implanted Antenna Modulefim (GHz) 2.53 2.52 2.53S22 (dB) -23.11 -26.09 -25.19
Gain (dB) 0.62 1.07 1.32
Transmission CoefficientsS21 (dB) -13.15 -17.92 -22.28S12 (dB) -13.15 -18.26 -22.28
to 1.07 dB and 1.32 dB for Le equals 50 mm and 100 mm, respectively. The gain of 1.32
dB is still less than the gain of the implanted antenna module in medium lossy material
when operating in the transmitting mode which shows that there is an influence from
the external antenna on the gain of the implanted antenna module in the two-antenna
setup. The aforementioned results show that the medium lossy material affected both
the resonant frequency (at Le = 10 mm), the gain and the far-field pattern (at Le = 50
mm) of the external antenna.
99
3.7 Sensitivity Study: Parametric Variability
Different biomedical applications require that the antenna module to be implanted in dif-
ferent areas of the human body which will have different lossiness that is dependent on
the type of tissue and its distance from the implanted antenna module. Furthermore, the
results discussed in Section 3.4, 3.5, and 3.6 show that the performance of the antenna
module and the microwave wireless power transmission techniques can be affected by
the lossiness of the surrounding material. In addition, it is important that the wireless
power transmission in human tissue has a reliable and stable performance that corre-
sponds to the design performance when used for implantable biomedical applications.
In practice, there are several factors that can affect the performance of wireless trans-
mission in human tissue. Some of these factors include the variations in the physical
dimensions and electrical properties of the implanted antenna and the human tissue. The
variations in the physical dimensions and the electrical properties of the antenna can oc-
cur due to manufacturing errors and tolerances in material specifications. The variations
in the electrical (dielectric and conductor) properties of the human tissue can occur due
to different conditions of the human body, different human bodies and even different
types of tissue in the same human body. For this purpose, a sensitivity study is per-
formed to investigate the effect of these variations on the performance of the microwave
wireless power transmission technique with the two-antenna setup in free space and in
human tissue.
The study is performed on selected resonant parameters which include the resonant
frequency of the antenna module in free space and in human tissue, the magnitude of the
reflection coefficient, and the magnitude of the transmission coefficient. The ranges of
the variations in the physical dimensions and the electrical properties of the antenna can
be anticipated from both machinery and material specifications. For example, a typical
specification of the relative dielectric constant of a substrate material provides a tolerance
of ±0.05 [167]. From the machinery and material specifications it is expected that these
variations will be of small ranges. It was previously mentioned in this chapter that the

100
SMA connector is attached to the implanted antenna module to match the simulation
models with the experimental setup that will be discussed in Chapter 4. Nevertheless,
in typical biomedical applications the implanted antenna module is connected directly
to an electronic circuitry, e.g., the rectifying circuit (c.f. Fig. 3.23), without the SMA
connector. Therefore, in this section the SMA connector is removed from the antenna
module and the sensitivity study is performed. Furthermore, to minimise the mismatch
in the resonant frequencies of the implanted antenna module and the external antenna
the SMA connector is also removed from the external antenna.
3.7.1 Parametric Variability: Free Space
The CST model of the two-antenna setup in free space used for the analysis of uncer-
tainties is shown in Fig. 3.57. Both the external and the antenna module are modelled
with a rectangular patch that has a width and length, Wp and Lp, of 35 mm and 29 mm,
respectively. The patch is imprinted on a substrate material that has a width and length,
Figure 3.57: Side view of the CST model used in the sensitivity study of the two-antennasetup in free space (not to scale).
Ws and Ls, respectively, of 50 with a relative dielectric constant, εrs, of 4.3 and a loss
tangent, tan δs, of 0.025, and underneath the patch there is a 50 mm by 50 mm ground
plane. The thickness of the substrate, h, is 1.5 mm. The rectangular patch is fed with

101
microstrip inset feed that has a width, wi, and a length, li, of 5.0 mm and 6.0 mm, re-
spectively, and the width, Wf , of the microstrip line is 2.5 mm. The antenna module
consists of the rectangular patch enclosed in a 1.5 mm protective box with a relative di-
electric constant, εra, of 3.3 and a loss tangent, tan δa, of 0.001. The separation distance
between the external antenna and the top of the protective box is 50 mm. The antenna
module is connected to Port 2 and the external antenna is connected to Port 1.
A summary of the effect of variations in the physical dimensions and the electrical
properties of the antenna module on the resonant frequency, fif , and the magnitude of the
reflection coefficient, S22, of the antenna module, and the magnitude of the transmission
coefficient S21 of the two-antenna setup in free space is tabulated in Table 3.4.
It can be seen from Table 3.4 that there is a negligible effect from the variations in
the loss tangent tan δs (0.01 to 0.05), the thickness h (1.45 mm to 1.55 mm), the length
Ls (49.45 mm to 50.55 mm) and the width Ws (49.45 mm to 50.55 mm) of the substrate,
the relative dielectric constant εra (2.3 to 4.3) and the loss tangent tan δa (0 to 0.005)
of the protective housing, the length Lp (28.90 mm to 29.10 mm) and the width Wp
(34.8 mm to 35.2 mm) of the rectangular patch, the length of the inset feed li (5.5 mm
to 6.5 mm) and the width of the microstrip line feed Wf (2.2 mm to 2.8 mm) on the
resonant frequency of the antenna module fif which ranged between 2.49 GHz to 2.50
GHz as a result of the aforementioned variations. However, when the relative dielectric
constant of the substrate εrs varied from 4 to 4.6 the resonant frequency of the antenna
module decreased from 2.58 GHz to 2.41 GHz, nevertheless and despite the change in
fif , at this range of εrs the magnitude of the reflection coefficient S22 remained constant
with a value of -28.72 dB. Similarly, the variations in εrs, tan δa, h, Ls,Ws, andWp have
negligible effect on the magnitude of the reflection coefficient S22 which had a minimum
value of -15.41 dB at h = 1.45 mm and a maximum value of -14.09 dB at εra = 0.005.
By contrast, the variations in the loss tangent of the substrate tan δs (0.01 to 0.05),
the length of the inset feed li (5.5 mm to 6.5 mm), and the width of the microstrip line
Wf (2.2 mm to 2.8 mm), have a considerable effect on S22 which changed from -21.37
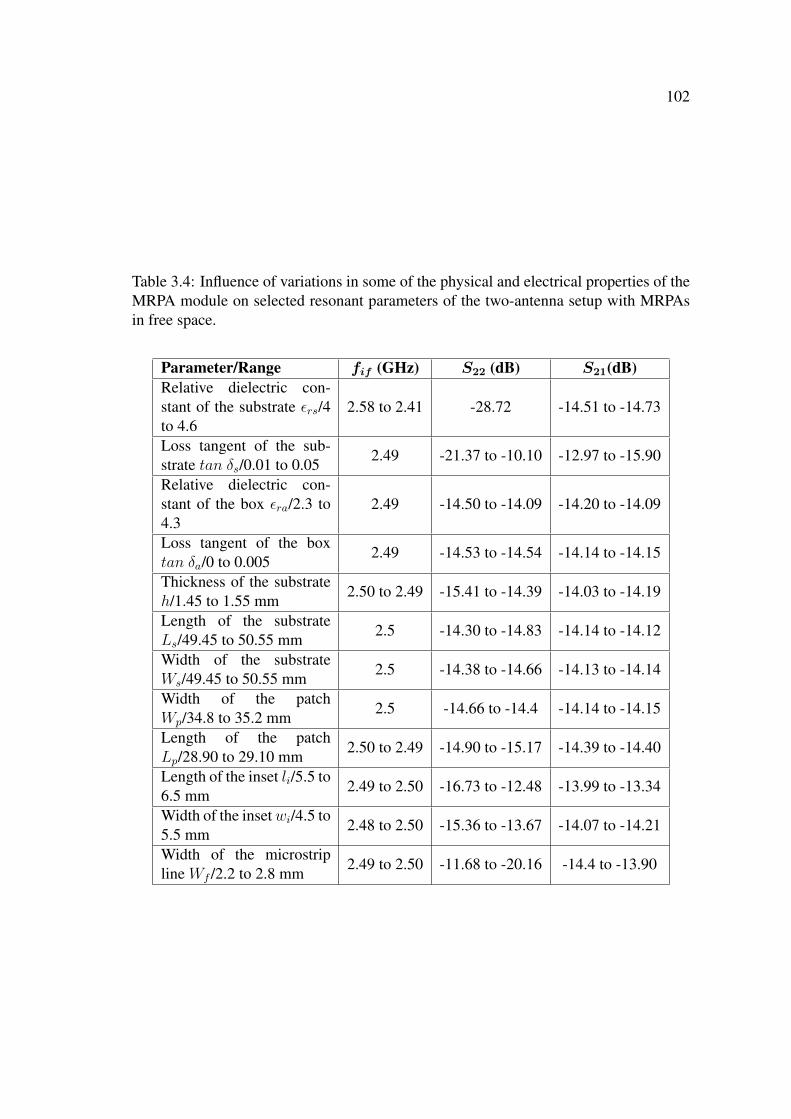
102
Table 3.4: Influence of variations in some of the physical and electrical properties of theMRPA module on selected resonant parameters of the two-antenna setup with MRPAsin free space.
Parameter/Range fif (GHz) S22 (dB) S21(dB)Relative dielectric con-stant of the substrate εrs/4to 4.6
2.58 to 2.41 -28.72 -14.51 to -14.73
Loss tangent of the sub-strate tan δs/0.01 to 0.05 2.49 -21.37 to -10.10 -12.97 to -15.90
Relative dielectric con-stant of the box εra/2.3 to4.3
2.49 -14.50 to -14.09 -14.20 to -14.09
Loss tangent of the boxtan δa/0 to 0.005 2.49 -14.53 to -14.54 -14.14 to -14.15
Thickness of the substrateh/1.45 to 1.55 mm 2.50 to 2.49 -15.41 to -14.39 -14.03 to -14.19
Length of the substrateLs/49.45 to 50.55 mm 2.5 -14.30 to -14.83 -14.14 to -14.12
Width of the substrateWs/49.45 to 50.55 mm 2.5 -14.38 to -14.66 -14.13 to -14.14
Width of the patchWp/34.8 to 35.2 mm 2.5 -14.66 to -14.4 -14.14 to -14.15
Length of the patchLp/28.90 to 29.10 mm 2.50 to 2.49 -14.90 to -15.17 -14.39 to -14.40
Length of the inset li/5.5 to6.5 mm 2.49 to 2.50 -16.73 to -12.48 -13.99 to -13.34
Width of the insetwi/4.5 to5.5 mm 2.48 to 2.50 -15.36 to -13.67 -14.07 to -14.21
Width of the microstripline Wf /2.2 to 2.8 mm 2.49 to 2.50 -11.68 to -20.16 -14.4 to -13.90
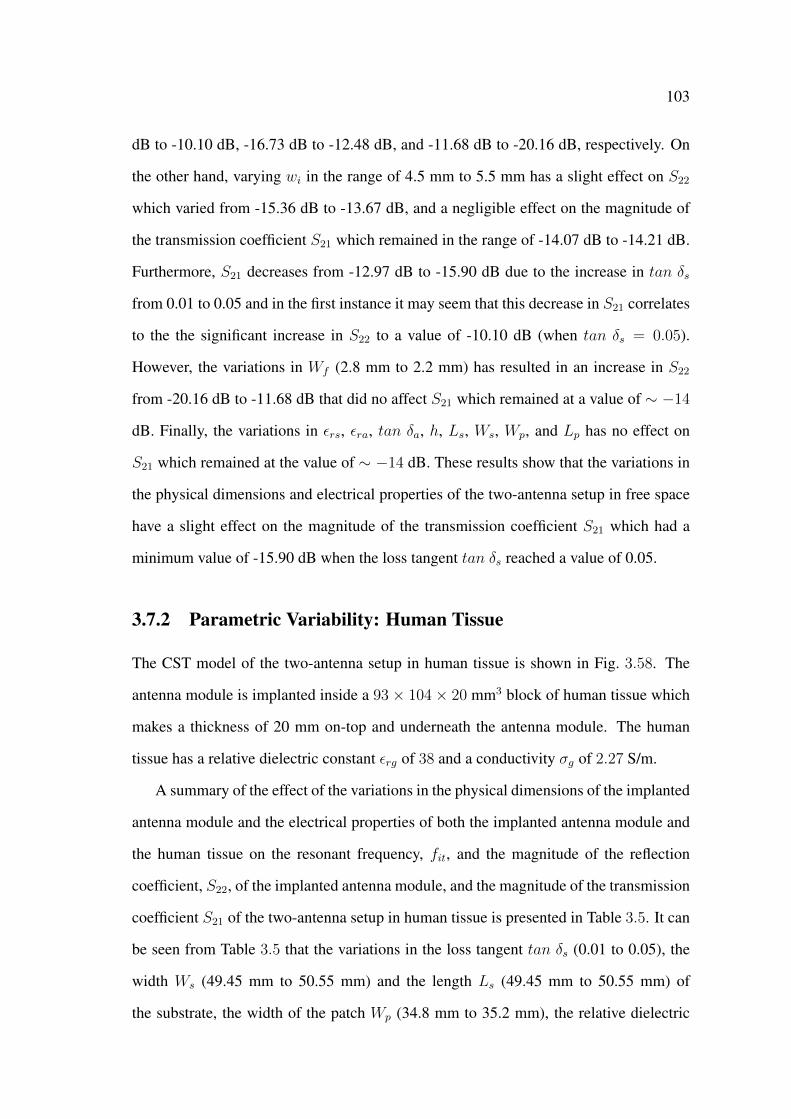
103
dB to -10.10 dB, -16.73 dB to -12.48 dB, and -11.68 dB to -20.16 dB, respectively. On
the other hand, varying wi in the range of 4.5 mm to 5.5 mm has a slight effect on S22
which varied from -15.36 dB to -13.67 dB, and a negligible effect on the magnitude of
the transmission coefficient S21 which remained in the range of -14.07 dB to -14.21 dB.
Furthermore, S21 decreases from -12.97 dB to -15.90 dB due to the increase in tan δs
from 0.01 to 0.05 and in the first instance it may seem that this decrease in S21 correlates
to the the significant increase in S22 to a value of -10.10 dB (when tan δs = 0.05).
However, the variations in Wf (2.8 mm to 2.2 mm) has resulted in an increase in S22
from -20.16 dB to -11.68 dB that did no affect S21 which remained at a value of ∼ −14
dB. Finally, the variations in εrs, εra, tan δa, h, Ls, Ws, Wp, and Lp has no effect on
S21 which remained at the value of ∼ −14 dB. These results show that the variations in
the physical dimensions and electrical properties of the two-antenna setup in free space
have a slight effect on the magnitude of the transmission coefficient S21 which had a
minimum value of -15.90 dB when the loss tangent tan δs reached a value of 0.05.
3.7.2 Parametric Variability: Human Tissue
The CST model of the two-antenna setup in human tissue is shown in Fig. 3.58. The
antenna module is implanted inside a 93× 104× 20 mm3 block of human tissue which
makes a thickness of 20 mm on-top and underneath the antenna module. The human
tissue has a relative dielectric constant εrg of 38 and a conductivity σg of 2.27 S/m.
A summary of the effect of the variations in the physical dimensions of the implanted
antenna module and the electrical properties of both the implanted antenna module and
the human tissue on the resonant frequency, fit, and the magnitude of the reflection
coefficient, S22, of the implanted antenna module, and the magnitude of the transmission
coefficient S21 of the two-antenna setup in human tissue is presented in Table 3.5. It can
be seen from Table 3.5 that the variations in the loss tangent tan δs (0.01 to 0.05), the
width Ws (49.45 mm to 50.55 mm) and the length Ls (49.45 mm to 50.55 mm) of
the substrate, the width of the patch Wp (34.8 mm to 35.2 mm), the relative dielectric
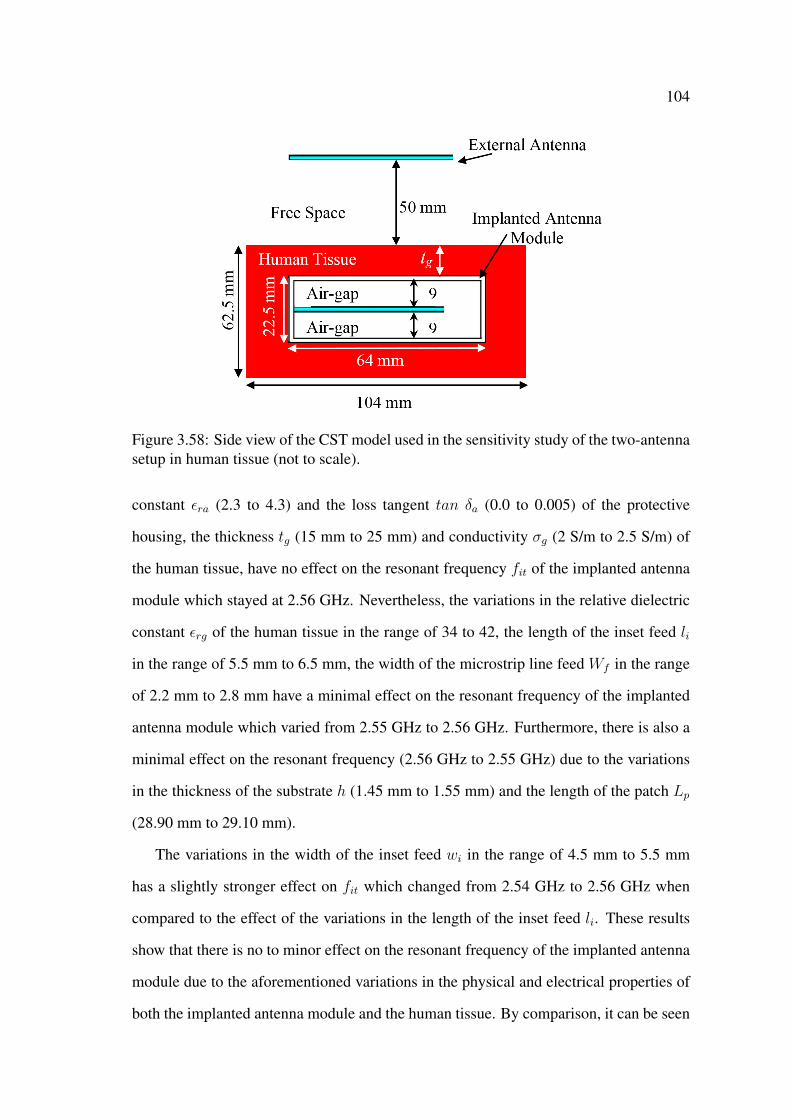
104
Figure 3.58: Side view of the CST model used in the sensitivity study of the two-antennasetup in human tissue (not to scale).
constant εra (2.3 to 4.3) and the loss tangent tan δa (0.0 to 0.005) of the protective
housing, the thickness tg (15 mm to 25 mm) and conductivity σg (2 S/m to 2.5 S/m) of
the human tissue, have no effect on the resonant frequency fit of the implanted antenna
module which stayed at 2.56 GHz. Nevertheless, the variations in the relative dielectric
constant εrg of the human tissue in the range of 34 to 42, the length of the inset feed li
in the range of 5.5 mm to 6.5 mm, the width of the microstrip line feed Wf in the range
of 2.2 mm to 2.8 mm have a minimal effect on the resonant frequency of the implanted
antenna module which varied from 2.55 GHz to 2.56 GHz. Furthermore, there is also a
minimal effect on the resonant frequency (2.56 GHz to 2.55 GHz) due to the variations
in the thickness of the substrate h (1.45 mm to 1.55 mm) and the length of the patch Lp
(28.90 mm to 29.10 mm).
The variations in the width of the inset feed wi in the range of 4.5 mm to 5.5 mm
has a slightly stronger effect on fit which changed from 2.54 GHz to 2.56 GHz when
compared to the effect of the variations in the length of the inset feed li. These results
show that there is no to minor effect on the resonant frequency of the implanted antenna
module due to the aforementioned variations in the physical and electrical properties of
both the implanted antenna module and the human tissue. By comparison, it can be seen
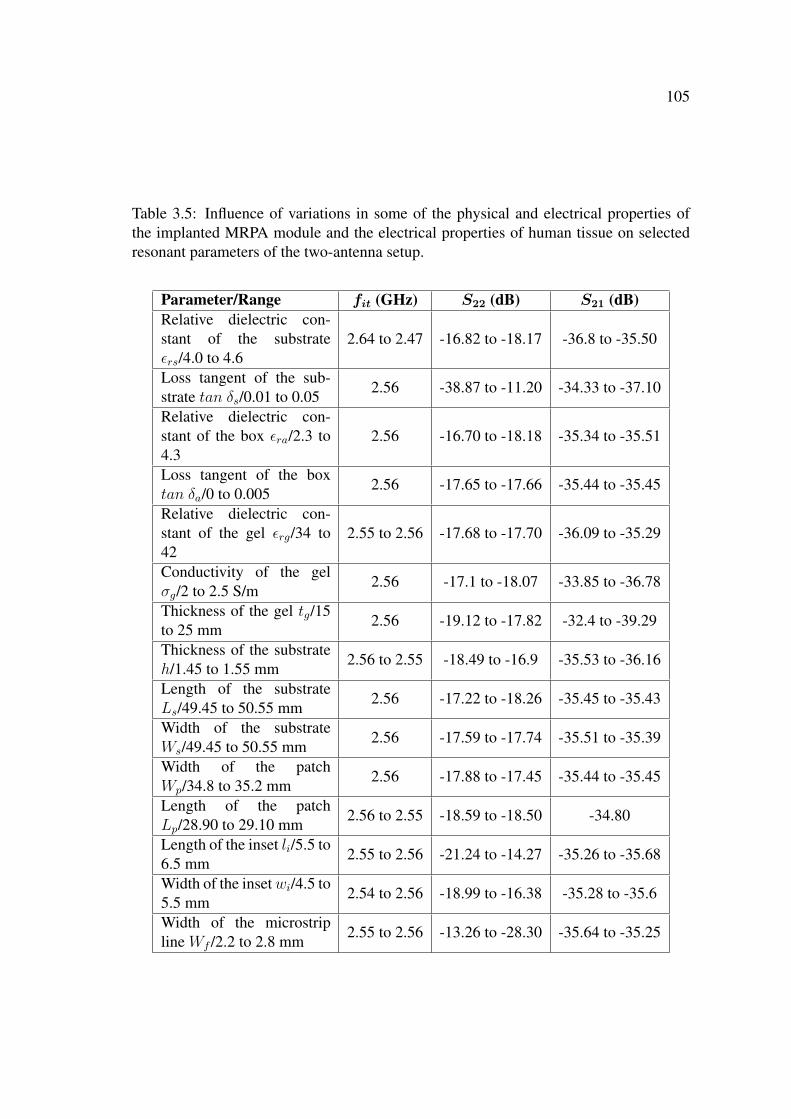
105
Table 3.5: Influence of variations in some of the physical and electrical properties ofthe implanted MRPA module and the electrical properties of human tissue on selectedresonant parameters of the two-antenna setup.
Parameter/Range fit (GHz) S22 (dB) S21 (dB)Relative dielectric con-stant of the substrateεrs/4.0 to 4.6
2.64 to 2.47 -16.82 to -18.17 -36.8 to -35.50
Loss tangent of the sub-strate tan δs/0.01 to 0.05 2.56 -38.87 to -11.20 -34.33 to -37.10
Relative dielectric con-stant of the box εra/2.3 to4.3
2.56 -16.70 to -18.18 -35.34 to -35.51
Loss tangent of the boxtan δa/0 to 0.005 2.56 -17.65 to -17.66 -35.44 to -35.45
Relative dielectric con-stant of the gel εrg/34 to42
2.55 to 2.56 -17.68 to -17.70 -36.09 to -35.29
Conductivity of the gelσg/2 to 2.5 S/m 2.56 -17.1 to -18.07 -33.85 to -36.78
Thickness of the gel tg/15to 25 mm 2.56 -19.12 to -17.82 -32.4 to -39.29
Thickness of the substrateh/1.45 to 1.55 mm 2.56 to 2.55 -18.49 to -16.9 -35.53 to -36.16
Length of the substrateLs/49.45 to 50.55 mm 2.56 -17.22 to -18.26 -35.45 to -35.43
Width of the substrateWs/49.45 to 50.55 mm 2.56 -17.59 to -17.74 -35.51 to -35.39
Width of the patchWp/34.8 to 35.2 mm 2.56 -17.88 to -17.45 -35.44 to -35.45
Length of the patchLp/28.90 to 29.10 mm 2.56 to 2.55 -18.59 to -18.50 -34.80
Length of the inset li/5.5 to6.5 mm 2.55 to 2.56 -21.24 to -14.27 -35.26 to -35.68
Width of the insetwi/4.5 to5.5 mm 2.54 to 2.56 -18.99 to -16.38 -35.28 to -35.6
Width of the microstripline Wf /2.2 to 2.8 mm 2.55 to 2.56 -13.26 to -28.30 -35.64 to -35.25
106
from Table 3.5 that the variations in the relative dielectric constant of the substrate εrs
in the range of 4.0 to 4.6 has resulted in stronger effect on fit which decreased from
2.64 GHz to 2.47 GHz. The decrease in the resonant frequency of the implanted antenna
module with the increase in εrs is an expected result. On the other hand, these variations
in εrs have a negligible effect on the magnitude of the reflection coefficient S22 and the
magnitude of the transmission coefficient S21 which changed from -16.82 dB to -18.17
dB and -36.8 dB to -35.50 dB, respectively. The variations in εra, tan δa, εrg, σg, tg,
h, Ls, Ws, Wp, Lp, and wi, have a small effect on S22 which had a maximum value of
-16.38 dB at wi = 5.5 mm and a minimum value of -19.12 dB at tg = 15 mm. However,
the variations in li (5.5 mm to 6.5 mm), Wf (2.2 mm to 2.8 mm), and tan δs (0.01 to
0.05) have a significant effect on S22 which shifted between -21.24 dB to -14.27 dB,
-13.26 dB to -28.30 dB, and -38.87 dB to -11.20 dB, respectively.
These results show that tan δs has the most effect on S22 which reached -11.20 dB
for tan δs = 0.05, nevertheless, this value of S22 is still below -10 dB. Furthermore, and
despite the significant increase in S22 to -11.20 dB, the magnitude of the transmission
coefficient S21 has an acceptable value of -37.10 dB (at tan δs = 0.05). This value of S21
slightly increased to -34.33 dB when tan δs decreased to 0.01. Table 3.5 also shows that
there is a negligible effect from the variations in εra, tan δa, εrg, h, Ls, Ws, Wp, Lp, li,
wi, and Wf on the magnitude of the transmission coefficient S21 which had a maximum
value of -34.8 dB for Lp = 28.9−29.10 mm and a minimum value of -35.68 for li = 6.5
mm. On the other hand, S21 decreased from -33.85 dB to -36.78 dB when σg varied from
2.0 S/m to 2.5 S/m. Furthermore, the variations in the thickness of the gel tg in the range
of 15 mm to 25 mm has also resulted in a considerable decrease in S21 from -32.40 dB
to -39.9 dB.
The aforementioned results show that wireless power transmission can be affected by
the variations in the loss tangent tan δs of the substrate, conductivity σg and thickness
tg of the human tissue. However, for the ranges of the variations used in this study, there
are acceptable values of the magnitude of the transmission coefficient S21 which shows
107
that microwave wireless power transmission in human tissue is still achievable under
variations in the physical dimensions and electrical properties of the implanted antenna
module and the electrical properties of the human tissue.
3.8 Conclusion
The electromagnetic performance of microwave wireless power transmission techniques
with microstrip rectangular patch antennas in lossless, high and medium lossy mate-
rials was investigated. First, an implantable microstrip rectangular patch antenna was
designed and investigated to operate at 2.45 GHz in the ISM band. The antenna was
fed with microstrip inset feed and the width and length of the inset feed were modified
to ensure that the antenna module resonates at the desired frequency with an acceptable
magnitude of the reflection coefficient S11. Furthermore, an antenna module is designed
by enclosing the microstrip rectangular patch antenna in protective dielectric housing. A
top and bottom air-gap thicknesses of 9 mm were used to reduce the influence of the high
and medium lossy materials on the performance of the implantable antenna module. In
addition, the number of mesh cells were manually modified to significantly reduce the
simulation time without compromising the accuracy of the simulation results.
Second, the receiving performance of the antenna module was investigated by using
an incident plane sine wave. It was found that to achieve maximum wireless power
transmission the electric field polarisation vector of the incident plane wave has to match
the electric field polarisation vector of the receiving antenna module. Furthermore, a
receiving rectenna is designed by connecting a rectifying circuit to the antenna module
and the feasibility of using wireless power transmission to power an electronic circuit
and deliver an AC and DC stimulus was demonstrated. The default settings in CST were
modified to ensure that simulation time is longer than the time constant of the resistor
and capacitor (RC) circuit used with the rectifying circuit.
Third, the electromagnetic performance of a microwave wireless power transmission
108
technique with a two-antenna setup was investigated in free space, human tissue, and a
medium lossy material, and the obtained results demonstrated the feasibility of wireless
power transmission in human tissue. It was shown in this investigation that the reflections
and scattering of the radiated electromagnetic signal from the external antenna at the
material-air interface affects the performance of the microwave technique. It was also
shown, that the medium lossy material affected the external antenna when the external
antenna was brought in close proximity of the lossy material.
Finally, a sensitivity study was performed to investigate the effect of the variations in
the physical dimensions and the electrical properties of the microstrip rectangular patch
antenna and the variations in the electrical properties of human tissue on the performance
of the wireless power transmission with the two-antenna setup. The results of this anal-
ysis showed that wireless power transmission in human tissue with the microstrip rect-
angular patch antenna can have a reliable and stable performance that corresponds to
the design performance. However, the implanted microstrip rectangular patch antenna
module in human tissue is relatively of large size to be used for implantable biomedical
applications.
Chapter 4
Microwave Wireless Power
Transmission with Microstrip
Rectangular Patch Antennas:
Measurement
4.1 Introduction
In this chapter a measurement approach is taken to investigate the performance of wire-
less power transmission with microstrip rectangular patch antennas in human tissue. For
this purpose, the external microstrip rectangular patch antenna and the microstrip rect-
angular patch antenna module (i.e., the microstrip rectangular patch antenna with the
protective housing) that were designed in Chapter 3 are manufactured and used. Fur-
thermore, the electromagnetic performance of wireless power transmission in different
materials which include tissue mimicking gel, fresh minced meat, and a concrete speci-
men is also investigated. Measurement and simulation (obtained in Chapter 3) results are
used to determine the unknown electrical properties of the materials and to validate the
simulation models created in Chapter 3. The good agreement between the measurement

110
and simulation results with the determined electrical properties show that the created
simulation models including the geometry of the models, the electrical properties of the
materials, and the model’s settings (e.g., boundary conditions and mesh cells) are correct
and can be used to accurately investigate the performance of microwave wireless power
transmission and implantable microstrip antennas in human tissue.
4.2 Measurement Approach
First, a microstrip rectangular patch antenna, a microstrip rectangular patch antenna
module, tissue mimicking gel and a concrete specimen are fabricated. Then, a mea-
surement system that comprises a two-antenna setup and a Hewlett Packard (HP 8150
C) vector network analyser (VNA) is used to investigate the performance of wireless
power transmission in free space, tissue mimicking gel, fresh minced meat, and a con-
crete specimen (used to represent a medium lossy material). Finally, the measured and
simulated results are used to determine the unknown values of the electrical properties
of the tissue mimicking gel, fresh minced meat and concrete specimen, and to validate
the simulation models that were developed in Chapter 3.
At the beginning of each experiment the vector network analyser (VNA) was cal-
ibrated (using short circuit, open circuit, and a 50 Ω matched load) according to the
manufacturer’s manual. The SMA connector was used as the reference plane in the
calibration process. Measurement results from the VNA are transferred to a personal
computer using a 3.5 inch floppy disk and are plotted using a computational software
MATLAB [168].
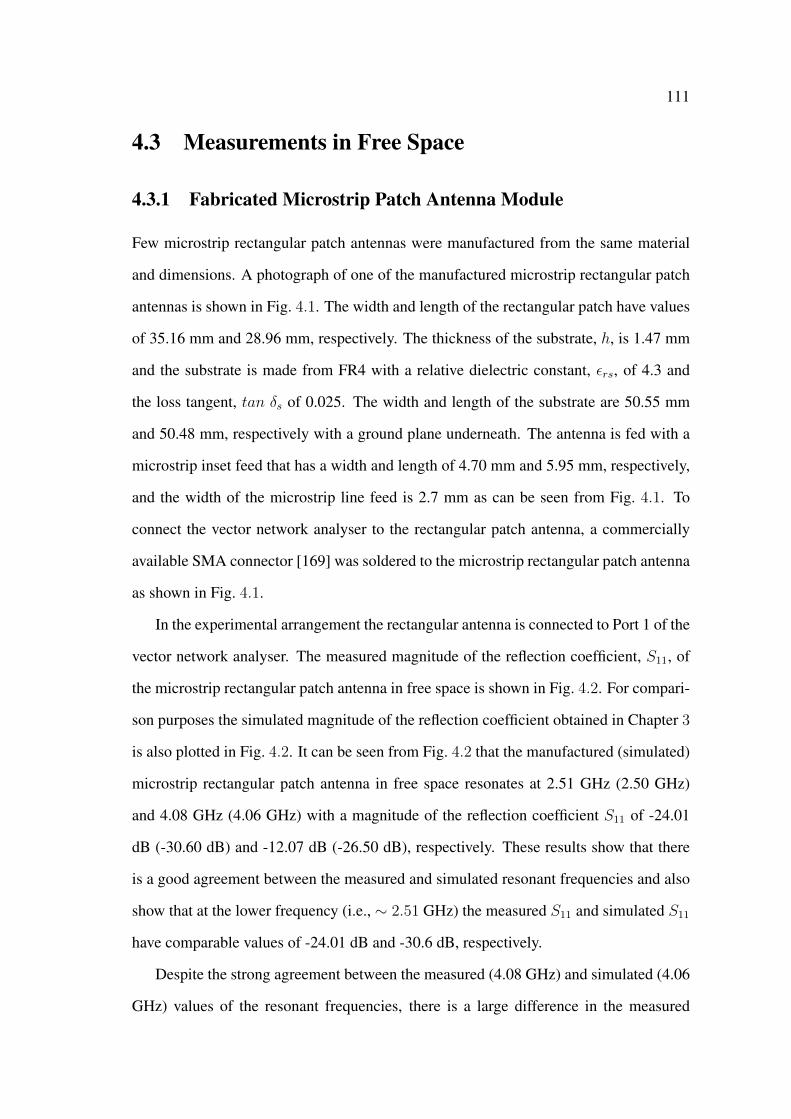
111
4.3 Measurements in Free Space
4.3.1 Fabricated Microstrip Patch Antenna Module
Few microstrip rectangular patch antennas were manufactured from the same material
and dimensions. A photograph of one of the manufactured microstrip rectangular patch
antennas is shown in Fig. 4.1. The width and length of the rectangular patch have values
of 35.16 mm and 28.96 mm, respectively. The thickness of the substrate, h, is 1.47 mm
and the substrate is made from FR4 with a relative dielectric constant, εrs, of 4.3 and
the loss tangent, tan δs of 0.025. The width and length of the substrate are 50.55 mm
and 50.48 mm, respectively with a ground plane underneath. The antenna is fed with a
microstrip inset feed that has a width and length of 4.70 mm and 5.95 mm, respectively,
and the width of the microstrip line feed is 2.7 mm as can be seen from Fig. 4.1. To
connect the vector network analyser to the rectangular patch antenna, a commercially
available SMA connector [169] was soldered to the microstrip rectangular patch antenna
as shown in Fig. 4.1.
In the experimental arrangement the rectangular antenna is connected to Port 1 of the
vector network analyser. The measured magnitude of the reflection coefficient, S11, of
the microstrip rectangular patch antenna in free space is shown in Fig. 4.2. For compari-
son purposes the simulated magnitude of the reflection coefficient obtained in Chapter 3
is also plotted in Fig. 4.2. It can be seen from Fig. 4.2 that the manufactured (simulated)
microstrip rectangular patch antenna in free space resonates at 2.51 GHz (2.50 GHz)
and 4.08 GHz (4.06 GHz) with a magnitude of the reflection coefficient S11 of -24.01
dB (-30.60 dB) and -12.07 dB (-26.50 dB), respectively. These results show that there
is a good agreement between the measured and simulated resonant frequencies and also
show that at the lower frequency (i.e., ∼ 2.51 GHz) the measured S11 and simulated S11
have comparable values of -24.01 dB and -30.6 dB, respectively.
Despite the strong agreement between the measured (4.08 GHz) and simulated (4.06
GHz) values of the resonant frequencies, there is a large difference in the measured

112
Figure 4.1: Photograph of the manufactured microstrip rectangular patch antenna in the(a) top, (b) bottom, and (c) side views (all dimensions in mm).
Figure 4.2: S11 vs frequency of the manufactured microstrip rectangular patch antennain free space (measured and simulated results).
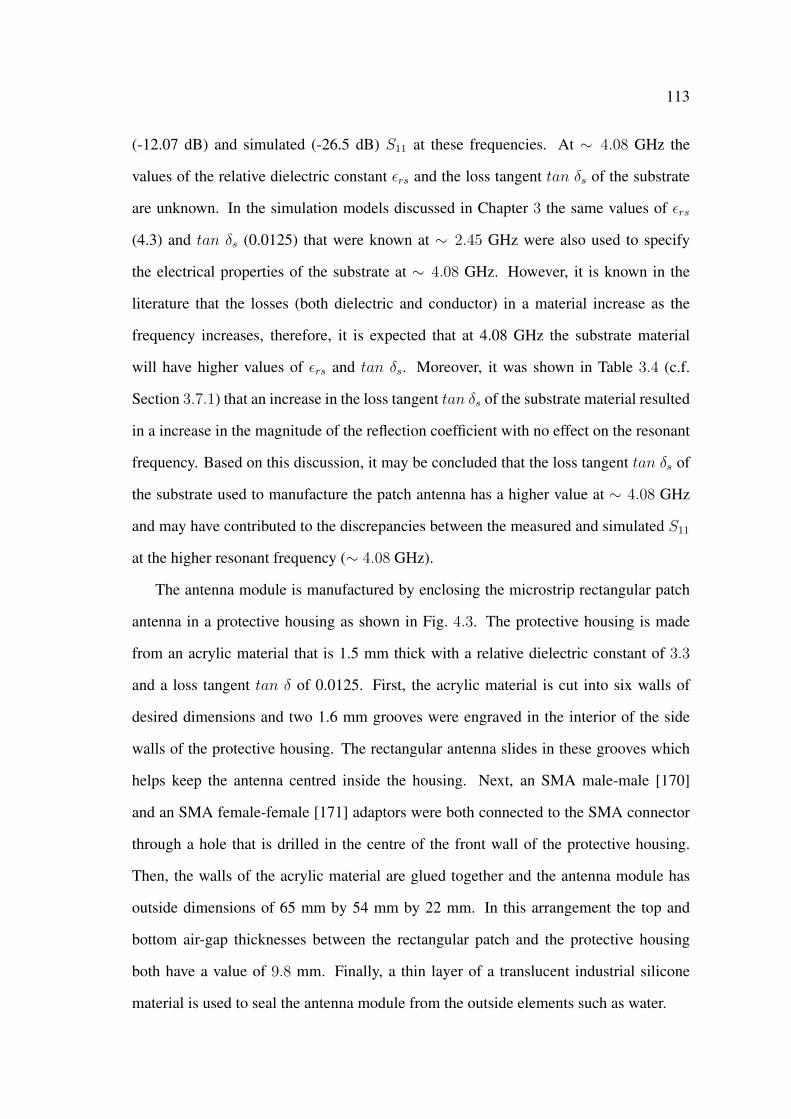
113
(-12.07 dB) and simulated (-26.5 dB) S11 at these frequencies. At ∼ 4.08 GHz the
values of the relative dielectric constant εrs and the loss tangent tan δs of the substrate
are unknown. In the simulation models discussed in Chapter 3 the same values of εrs
(4.3) and tan δs (0.0125) that were known at ∼ 2.45 GHz were also used to specify
the electrical properties of the substrate at ∼ 4.08 GHz. However, it is known in the
literature that the losses (both dielectric and conductor) in a material increase as the
frequency increases, therefore, it is expected that at 4.08 GHz the substrate material
will have higher values of εrs and tan δs. Moreover, it was shown in Table 3.4 (c.f.
Section 3.7.1) that an increase in the loss tangent tan δs of the substrate material resulted
in a increase in the magnitude of the reflection coefficient with no effect on the resonant
frequency. Based on this discussion, it may be concluded that the loss tangent tan δs of
the substrate used to manufacture the patch antenna has a higher value at ∼ 4.08 GHz
and may have contributed to the discrepancies between the measured and simulated S11
at the higher resonant frequency (∼ 4.08 GHz).
The antenna module is manufactured by enclosing the microstrip rectangular patch
antenna in a protective housing as shown in Fig. 4.3. The protective housing is made
from an acrylic material that is 1.5 mm thick with a relative dielectric constant of 3.3
and a loss tangent tan δ of 0.0125. First, the acrylic material is cut into six walls of
desired dimensions and two 1.6 mm grooves were engraved in the interior of the side
walls of the protective housing. The rectangular antenna slides in these grooves which
helps keep the antenna centred inside the housing. Next, an SMA male-male [170]
and an SMA female-female [171] adaptors were both connected to the SMA connector
through a hole that is drilled in the centre of the front wall of the protective housing.
Then, the walls of the acrylic material are glued together and the antenna module has
outside dimensions of 65 mm by 54 mm by 22 mm. In this arrangement the top and
bottom air-gap thicknesses between the rectangular patch and the protective housing
both have a value of 9.8 mm. Finally, a thin layer of a translucent industrial silicone
material is used to seal the antenna module from the outside elements such as water.
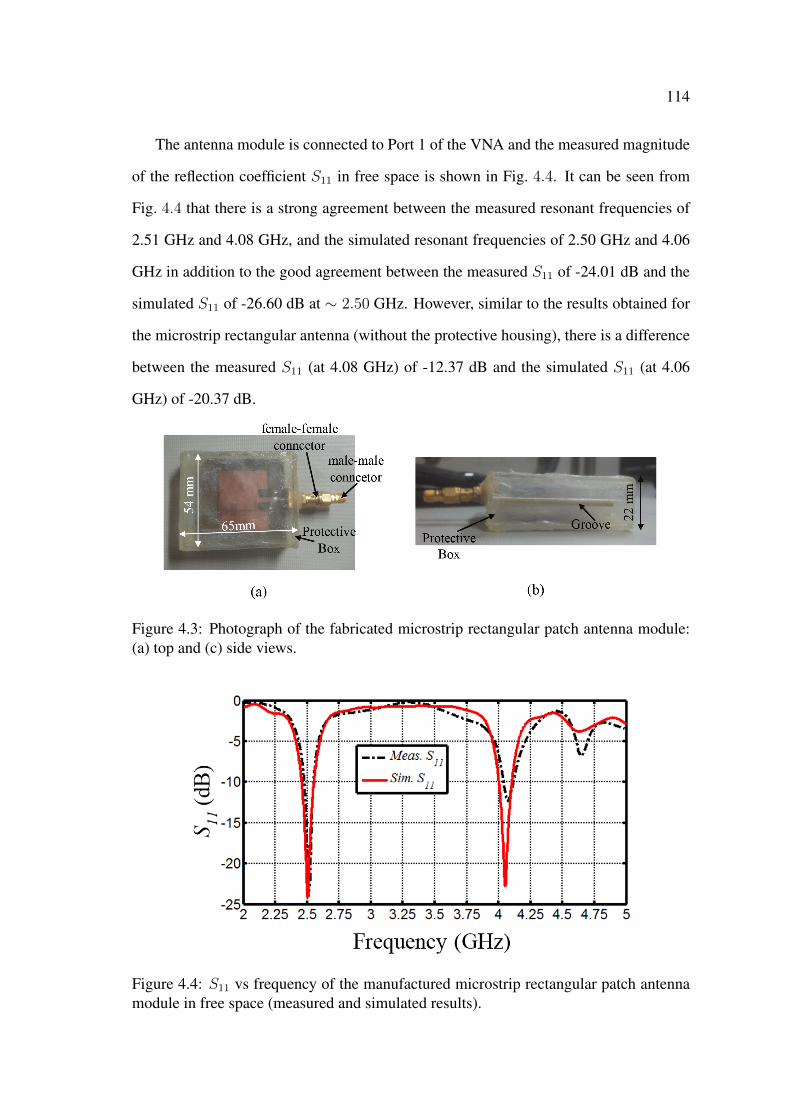
114
The antenna module is connected to Port 1 of the VNA and the measured magnitude
of the reflection coefficient S11 in free space is shown in Fig. 4.4. It can be seen from
Fig. 4.4 that there is a strong agreement between the measured resonant frequencies of
2.51 GHz and 4.08 GHz, and the simulated resonant frequencies of 2.50 GHz and 4.06
GHz in addition to the good agreement between the measured S11 of -24.01 dB and the
simulated S11 of -26.60 dB at ∼ 2.50 GHz. However, similar to the results obtained for
the microstrip rectangular antenna (without the protective housing), there is a difference
between the measured S11 (at 4.08 GHz) of -12.37 dB and the simulated S11 (at 4.06
GHz) of -20.37 dB.
Figure 4.3: Photograph of the fabricated microstrip rectangular patch antenna module:(a) top and (c) side views.
Figure 4.4: S11 vs frequency of the manufactured microstrip rectangular patch antennamodule in free space (measured and simulated results).
115
4.3.2 Wireless Power Transmission in Free Space
The experimental arrangement of the microwave technique with the two-antenna setup
in free space is shown in Fig. 4.5. The antennas are placed in a vertical alignment to
reduce reflections from the bottom bench attached to the VNA. The antennas are held
by retort stands and the external antenna is placed at a separation distance, Lf , from the
top surface of the antenna module. The external microstrip rectangular patch antenna is
connected to Port 1 and the antenna module is connected to Port 2 of the VNA.
Figure 4.5: Measurement system with the two-antenna setup in free space.
Measurement results of the magnitudes of the S-parameters which include the mag-
nitude of the reflection coefficient, S11, the magnitude of the transmission coefficient,
S21, the magnitude of the transmission coefficient, S12, and the magnitude of the reflec-
tion coefficient, S22, were recorded for different separation distances Lf . The measured
magnitudes of the S-parameters are shown in Fig. 4.6 where it can be seen that the res-
onant frequency of the external antenna has a value of 2.51 GHz, 2.51 GHz, and 2.52

116
GHz with an S11 of -28.80 dB, -27.11 dB, and -23.00 dB for the separation distances
Lf of 50 mm, 100 mm, and 200 mm, respectively. On the other hand, it can be seen
that the antenna module has a resonant frequency of 2.54 GHz with an S11 of -17.54 dB,
-17.84 dB, and -15.53 dB for the separation distances of 50 mm, 100 mm, and 200 mm,
respectively. The resonant frequency of the antenna module in the two-antenna setup
has increased to 2.54 GHz (for the three separation distances) when compared to the
resonant frequency of 2.51 GHz (c.f. Fig. 4.4) of the antenna module when operating as
a single transmitting antenna. This shift in the resonant frequency of the antenna module
can be attributed to the influence of the external antenna.
Fig. 4.6 also shows that the magnitudes of the transmission coefficients S21 and S12
both have high values of -11.89 dB, -15.99 dB, and -20.14 dB at the separation distances
of 50 mm, 100 mm, and 200 mm, respectively. The maximum magnitude of the trans-
mission coefficients occur at the point of intersection between the plots of S11 and S22 of
the external antenna and the antenna module, respectively. Furthermore and as expected,
due to the free space losses it can be seen from these results that the magnitude of the
transmission coefficient decreases as the separation distance increases. The reduction in
the transmission coefficient with distance and the occurrence of the maximum transmis-
sion coefficients at the point of intersection of the reflection coefficients were also seen
in the simulation results shown in Fig. 3.26.
4.4 Measurements with Tissue Mimicking Gel
4.4.1 Performance of Implanted Microstrip Patch Antenna Module
In this section, the performance of the implantable microstrip rectangular patch antenna
module in tissue mimicking gel is investigated. The tissue mimicking gel is manufac-
tured from a mixture of 53% sugar, 47% deionised water, 1 gram per 100 mL agar-agar
(a thickening agent). The recipe of this mixture is taken from [13] where measurement
results showed that with the aforementioned percentages the tissue mimicking gel has

117
Figure 4.6: Magnitudes of the S-parameters of the two-antenna setup in free space whenthe external antenna is at the separation distance Lf of (a) 50 mm, (b) 100 mm, (c) 200mm.
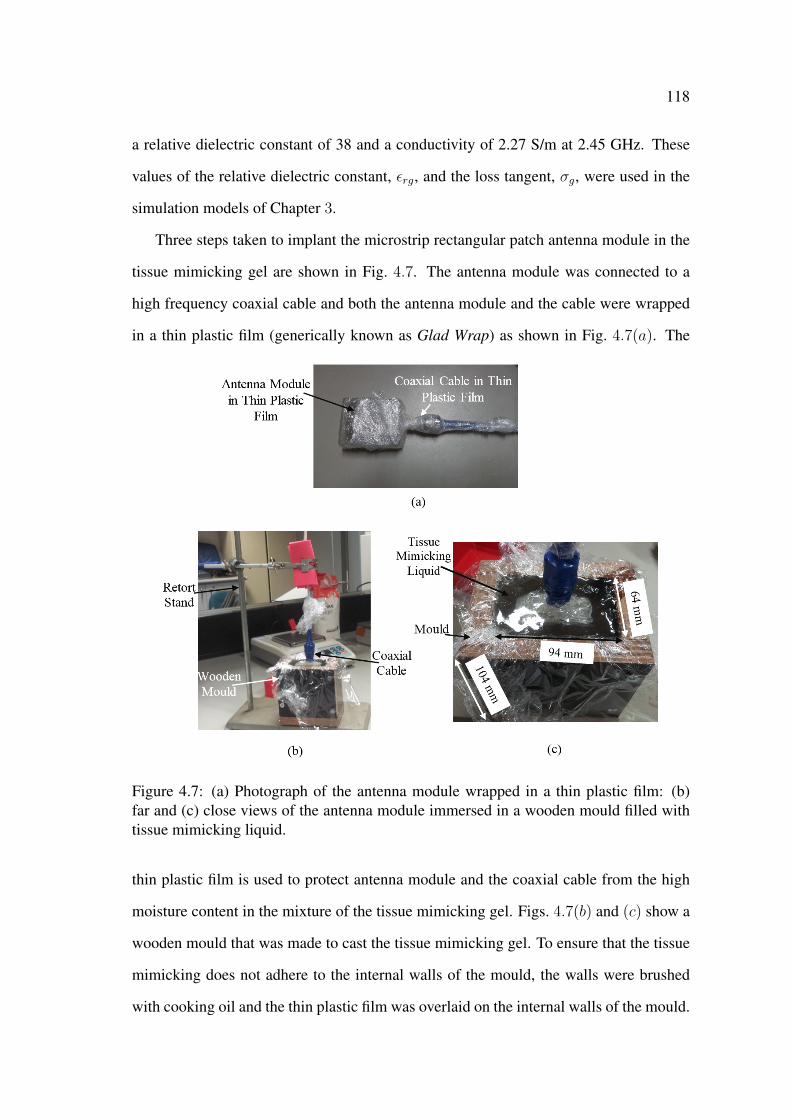
118
a relative dielectric constant of 38 and a conductivity of 2.27 S/m at 2.45 GHz. These
values of the relative dielectric constant, εrg, and the loss tangent, σg, were used in the
simulation models of Chapter 3.
Three steps taken to implant the microstrip rectangular patch antenna module in the
tissue mimicking gel are shown in Fig. 4.7. The antenna module was connected to a
high frequency coaxial cable and both the antenna module and the cable were wrapped
in a thin plastic film (generically known as Glad Wrap) as shown in Fig. 4.7(a). The
Figure 4.7: (a) Photograph of the antenna module wrapped in a thin plastic film: (b)far and (c) close views of the antenna module immersed in a wooden mould filled withtissue mimicking liquid.
thin plastic film is used to protect antenna module and the coaxial cable from the high
moisture content in the mixture of the tissue mimicking gel. Figs. 4.7(b) and (c) show a
wooden mould that was made to cast the tissue mimicking gel. To ensure that the tissue
mimicking does not adhere to the internal walls of the mould, the walls were brushed
with cooking oil and the thin plastic film was overlaid on the internal walls of the mould.
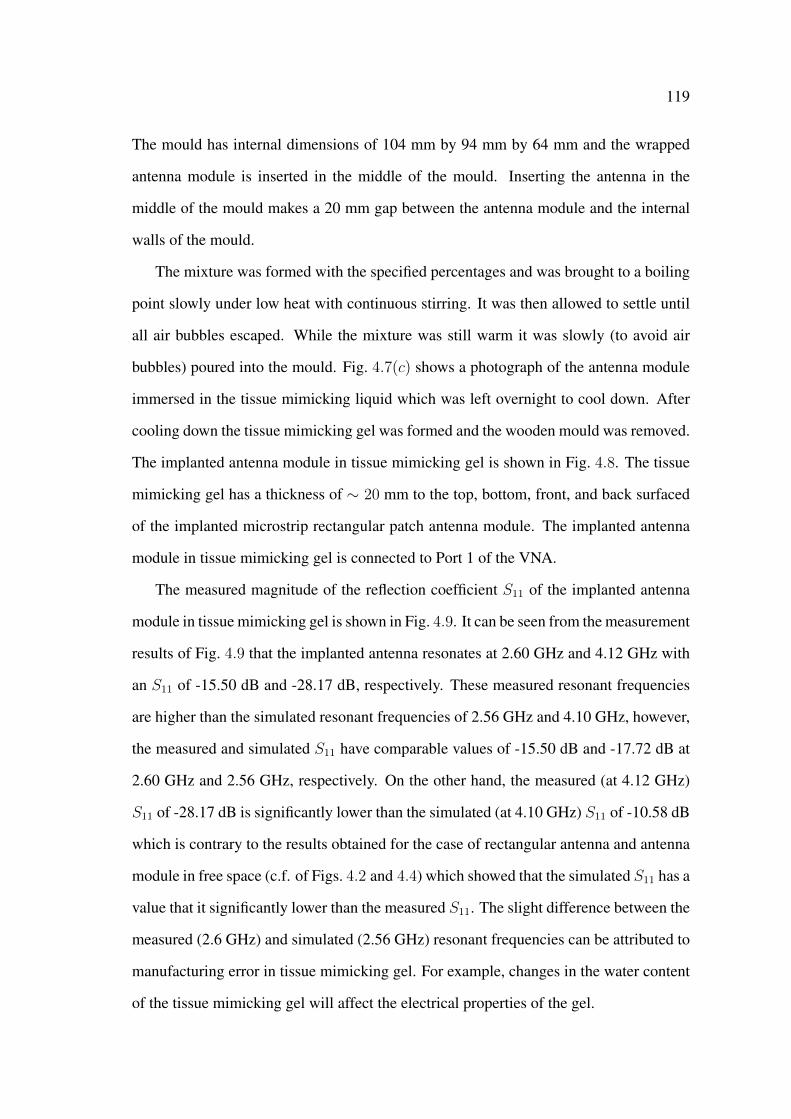
119
The mould has internal dimensions of 104 mm by 94 mm by 64 mm and the wrapped
antenna module is inserted in the middle of the mould. Inserting the antenna in the
middle of the mould makes a 20 mm gap between the antenna module and the internal
walls of the mould.
The mixture was formed with the specified percentages and was brought to a boiling
point slowly under low heat with continuous stirring. It was then allowed to settle until
all air bubbles escaped. While the mixture was still warm it was slowly (to avoid air
bubbles) poured into the mould. Fig. 4.7(c) shows a photograph of the antenna module
immersed in the tissue mimicking liquid which was left overnight to cool down. After
cooling down the tissue mimicking gel was formed and the wooden mould was removed.
The implanted antenna module in tissue mimicking gel is shown in Fig. 4.8. The tissue
mimicking gel has a thickness of ∼ 20 mm to the top, bottom, front, and back surfaced
of the implanted microstrip rectangular patch antenna module. The implanted antenna
module in tissue mimicking gel is connected to Port 1 of the VNA.
The measured magnitude of the reflection coefficient S11 of the implanted antenna
module in tissue mimicking gel is shown in Fig. 4.9. It can be seen from the measurement
results of Fig. 4.9 that the implanted antenna resonates at 2.60 GHz and 4.12 GHz with
an S11 of -15.50 dB and -28.17 dB, respectively. These measured resonant frequencies
are higher than the simulated resonant frequencies of 2.56 GHz and 4.10 GHz, however,
the measured and simulated S11 have comparable values of -15.50 dB and -17.72 dB at
2.60 GHz and 2.56 GHz, respectively. On the other hand, the measured (at 4.12 GHz)
S11 of -28.17 dB is significantly lower than the simulated (at 4.10 GHz) S11 of -10.58 dB
which is contrary to the results obtained for the case of rectangular antenna and antenna
module in free space (c.f. of Figs. 4.2 and 4.4) which showed that the simulated S11 has a
value that it significantly lower than the measured S11. The slight difference between the
measured (2.6 GHz) and simulated (2.56 GHz) resonant frequencies can be attributed to
manufacturing error in tissue mimicking gel. For example, changes in the water content
of the tissue mimicking gel will affect the electrical properties of the gel.

120
Figure 4.8: Manufactured implanted microstrip rectangular patch antenna module intissue mimicking gel: (a) close view and (b) far view when connected to the VNA (alldimensions in mm).
Figure 4.9: S11 vs frequency of the implanted microstrip rectangular patch antenna mod-ule in tissue mimicking gel (measured and simulated results).

121
4.4.2 Wireless Power Transmission in Tissue Mimicking Gel
A photograph of the microwave wireless power transmission technique with the two-
antenna setup and the manufactured tissue mimicking gel is shown in Fig. 4.10. In this
arrangement the external antenna is placed at the separation distance, Lt, from the top
surface of the tissue mimicking gel. To avoid damage to the tissue mimicking gel it was
placed flat on the bench and the external antenna was held by the retort stand. Both the
external and the implanted antennas are aligned horizontally and are pointing at each
other. The external antenna module and the implanted antenna are connected to Port 1
and 2, respectively, of the VNA.
Figure 4.10: Measurement system with the two-antenna setup in a block of tissue mim-icking gel: (a) close and (b) far views.
The measured magnitudes of the S-parameters of the two-antenna setup in tissue
mimicking gel are shown in Fig. 4.11. The external antenna resonates at 2.52 GHz, 2.52
GHz, and 2.51 GHz, with magnitudes of the reflection coefficients S11 of -19.20 dB, -
27.05 dB, and -28.09 dB, for Lt of 50 mm, 100 mm, 200 mm, respectively. These results
show that the separation distance Lt has a negligible effect on the resonant frequency
(∼ 2.52 GHz) and the magnitude of the reflection coefficient S11 of the external an-
tenna. Fig. 4.11 also shows that the separation distance Lt has no effect on the resonant
frequency of the implanted antenna module which has a value of 2.60 GHz for all the
separation distances of 50 mm, 100 mm, and 200 mm, with magnitudes of the reflection
coefficients S22 of -15.38 dB, -15.36 dB, and -15.50 dB, respectively.
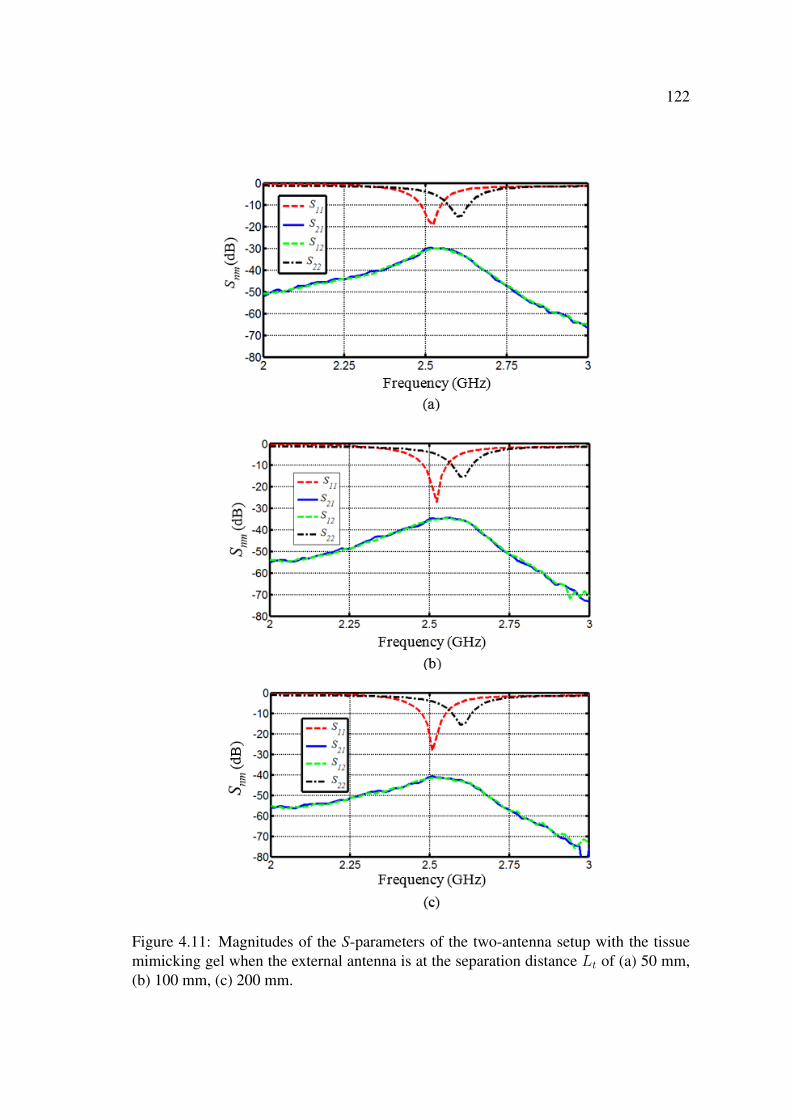
122
Figure 4.11: Magnitudes of the S-parameters of the two-antenna setup with the tissuemimicking gel when the external antenna is at the separation distance Lt of (a) 50 mm,(b) 100 mm, (c) 200 mm.

123
On the other hand, the magnitudes of the transmission coefficients S21 and S12 both
have values of -30.15 dB, -34.42 dB, and -41.52 dB for the separation distances of 50
mm, 100 mm, and 200 mm, respectively. These magnitudes of S21 and S12 are sig-
nificantly lower than the measured magnitudes of the transmission coefficients of the
two-antenna setup in free space for the corresponding distances. For example, at the
separation distance of 50 mm S21 has values of -15.99 dB and -34.42 dB in free space
and in tissue mimicking gel, respectively. The reduction in the magnitude of the trans-
mission coefficients in tissue mimicking gel is attributed to the high losses in the gel.
Furthermore and similar to the simulation results of Fig. 3.41, the maximum values of
S21 and S12 are seen at the point of intersection between the plots of the reflection coef-
ficients S11 and S22, which means that matching the resonant frequencies of the external
antenna and the implanted antenna module can result in further enhancement of the mag-
nitudes of the transmission coefficients.
4.5 Measurements with Other Materials
4.5.1 Microwave Wireless Power Transmission in Fresh Minced Meat
In this section the performance of the two-antenna setup in fresh (not thawed) minced
meat is investigated. The use of fresh minced meat in this experiment ensures that the
meat retains its water content as opposed to thawing frozen meat which will result in
a significant water loss from the meat, and hence, will affect the electrical properties
(i.e., the relative dielectric constant and the conductivity) of the meat. The microwave
wireless power transmission technique with the two-antenna setup in fresh minced meat
is shown in Fig. 4.12. The implanted antenna module (65 mm by 54 mm by 22 mm)
used in the two-antenna setup of Fig. 4.10 was implanted inside minced meat as shown
in Fig. 4.12. First a 35 mm layer of minced meat was compacted at the bottom of a 125
mm by 90 mm by 80 mm plastic container. Next, the antenna module with the plastic
film was placed inside the container and on-top of the 35 mm layer of the minced meat.

124
Then, minced meat was filled around and on-top of the antenna module. The minced
meat makes a layer of 18 mm, 25 mm, 35 mm, and 21 mm to the sides, front, back, and
top of the antenna module, respectively, as shown in Fig. 4.12. The external antenna
is placed at the separation distance, Lm, from the top surface of the minced meat. The
external and implanted antennas are connected to Port 1 and 2, of the vector network
analyser, respectively.
Figure 4.12: Measurement system of the two-antenna setup in fresh minced meat (a)without the top layer and with a 21 mm top layer in (b) far and (c) close views.
The VNA was calibrated and the measured magnitudes of the S-parameters for a
separation distance of 50 mm, 100 mm, and 200 mm are shown in Fig. 4.13. It can be
seen from Fig. 4.13 that the external antenna resonates at 2.52 GHz (for all the separation
distances) with a magnitude of the reflection coefficient S11 of -18.52 dB, -27.74 dB, and
-24.68 dB, for Lm of 50 mm, 100 mm, and 200 mm, respectively. On the other hand,
the implanted antenna module in fresh minced meat resonates at 2.60 GHz for all the
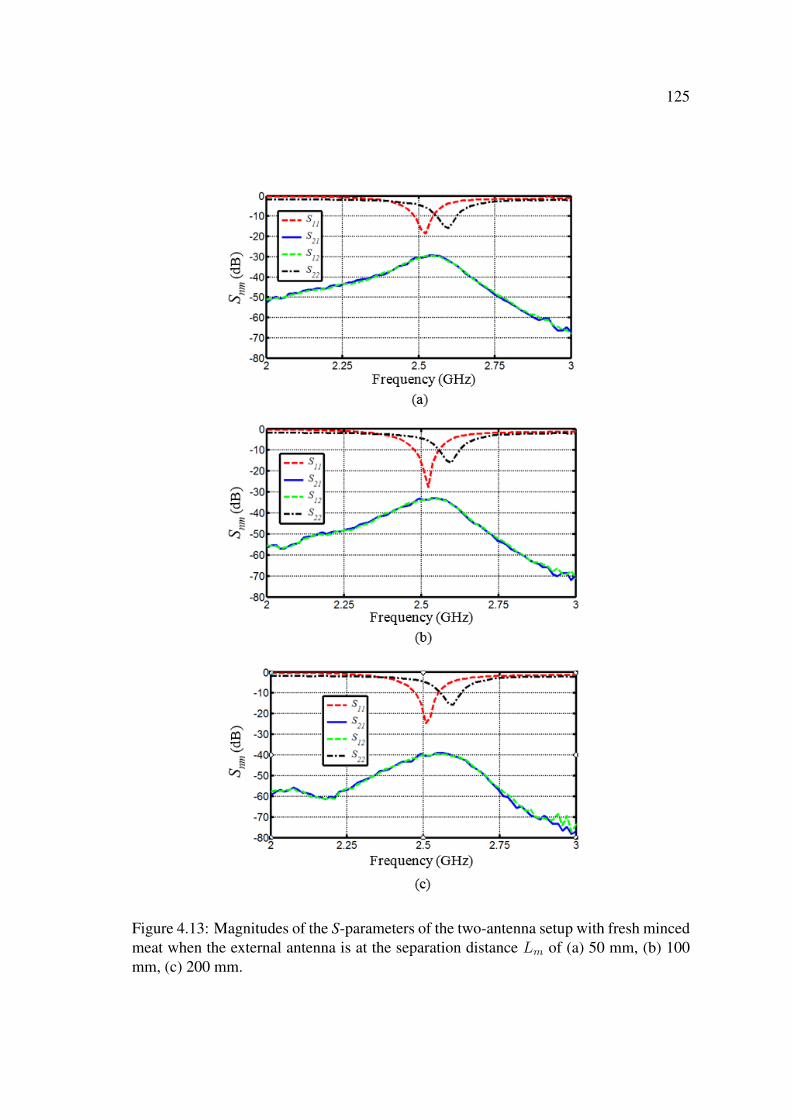
125
Figure 4.13: Magnitudes of the S-parameters of the two-antenna setup with fresh mincedmeat when the external antenna is at the separation distance Lm of (a) 50 mm, (b) 100mm, (c) 200 mm.

126
separation distances of 50 mm, 100 mm, and 200 mm with a magnitude of the reflection
coefficient S22 of -15.85 dB, -15.86 dB, and - 15.75 dB, respectively. These results are
very close to the measured results of the two-antenna setup with tissue mimicking gel.
For example, at the separation distance of 50 mm for the two-antenna setup with minced
meat (tissue mimicking gel) the external antenna resonates at 2.52 GHz (2.52 GHz) with
an S11 of -18.52 dB (-19.20 dB) and the implanted antenna module resonates at 2.60
GHz (2.60 GHz) with an S22 of -15.85 GHz (-15.38 dB).
Fig. 4.13 also shows that for the two-antenna setup in minced meat both the magni-
tudes of the transmission coefficients S21 and S12 have values of -29.49 dB, -33.13 dB,
and -38.81 dB which are also very close to the -30.15 dB, -34.42 dB, and -41.52 dB
magnitudes of the transmission coefficients in tissue mimicking gel for the separation
distances of 50 mm, 100 mm, and 200 mm, respectively. These results show that the
fresh minced meat has electrical properties (i.e, relative dielectric constant and conduc-
tivity) that are close to the electrical properties of the manufactured tissue mimicking
gel.
4.5.2 Microwave Wireless Power Transmission in Concrete
A specimen of commercial Australian standard concrete material was formed in the
laboratory at the University of Western Sydney and was left to harden for 15 days. The
implanted antenna module inside the concrete specimen is shown in Fig. 4.14. The
specimen consists of two parts; a 250-mm concrete cube (bottom part) and a 250 mm
by 250 mm by 115 mm top part. An 85 mm by 55 mm by 26 mm groove was cut
out of the concrete using an angle grinder and a chisel. The implanted antenna module
is placed inside the groove as shown in Fig. 4.14. The electrical properties, i.e., the
relative dielectric constant and the loss tangent of the manufactured concrete specimen
are unknown and are dependent on the water content inside the concrete specimen.
The implanted antenna module is connected to Port 1 of the VNA. The measured
magnitude of the reflection coefficients S11 versus frequency of the implanted antenna

127
Figure 4.14: Photograph of the implanted microstrip rectangular patch antenna modulein a 250-mm cube of a concrete specimen (a) without (top view) and (b) with the toppart (perspective view). All dimensions are in mm.
module in the concrete specimen is shown in Fig. 4.15. From the measurement (simula-
tion) results it can be seen that the implanted microstrip rectangular antenna module in
the concrete specimen resonates at 2.51 GHz (2.53 GHz) and 4.08 GHz (4.09 GHz) with
an S11 of -16.71 dB (-20.23 dB) and -21.46 dB (-12.92 dB), respectively.
These results show that there is a slight difference between the measured resonant
frequency of 2.51 GHz and the simulated frequency of 2.53 GHz with a larger difference
between the measured S11 of -16.71 dB (at 2.51 GHz) and the simulated S11 of -20.23
dB (at 2.53 GHz). Similar to the results obtained for the implanted antenna module in
tissue mimicking gel (c.f., Fig. 4.9) it can be seen from Fig. 4.15 that the measured S11
has a value of -21.46 dB at 4.08 GHz which is significantly less than the simulated S11
of -12.92 dB at 4.09 GHz, as discussed in the previous section these results are contrary
to the results obtained for the case of the rectangular antenna and antenna module in free
space.
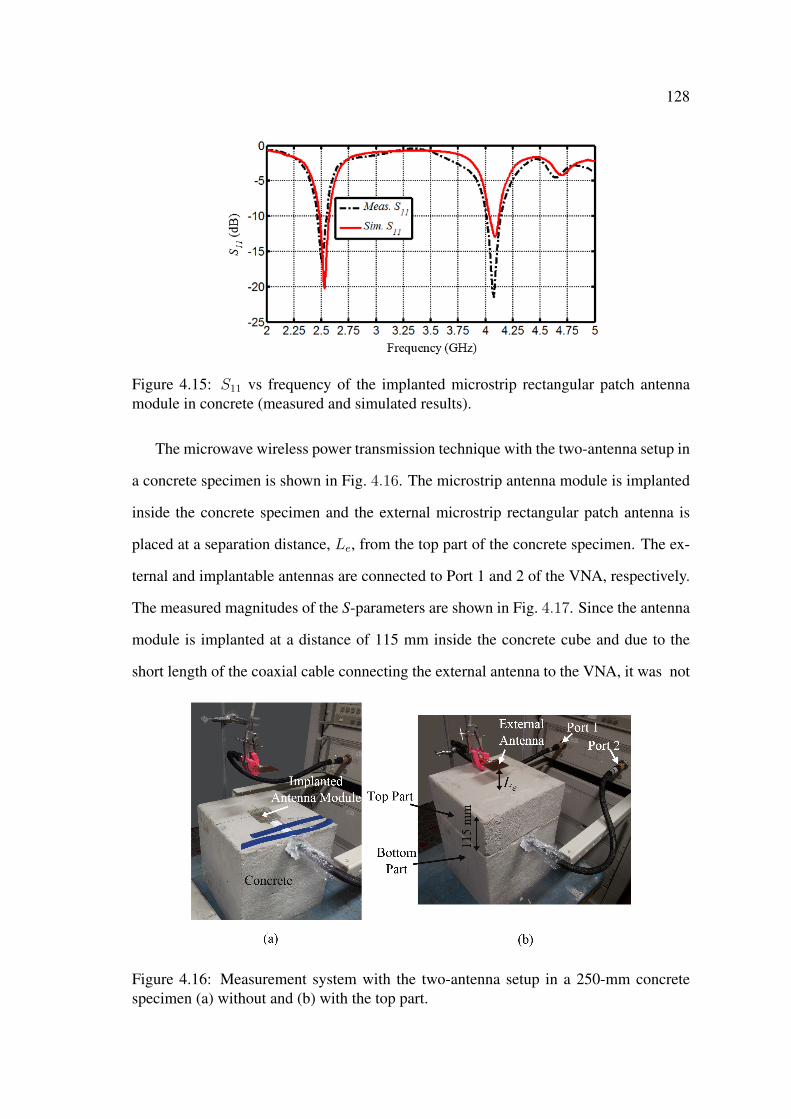
128
Figure 4.15: S11 vs frequency of the implanted microstrip rectangular patch antennamodule in concrete (measured and simulated results).
The microwave wireless power transmission technique with the two-antenna setup in
a concrete specimen is shown in Fig. 4.16. The microstrip antenna module is implanted
inside the concrete specimen and the external microstrip rectangular patch antenna is
placed at a separation distance, Le, from the top part of the concrete specimen. The ex-
ternal and implantable antennas are connected to Port 1 and 2 of the VNA, respectively.
The measured magnitudes of the S-parameters are shown in Fig. 4.17. Since the antenna
module is implanted at a distance of 115 mm inside the concrete cube and due to the
short length of the coaxial cable connecting the external antenna to the VNA, it was not
Figure 4.16: Measurement system with the two-antenna setup in a 250-mm concretespecimen (a) without and (b) with the top part.
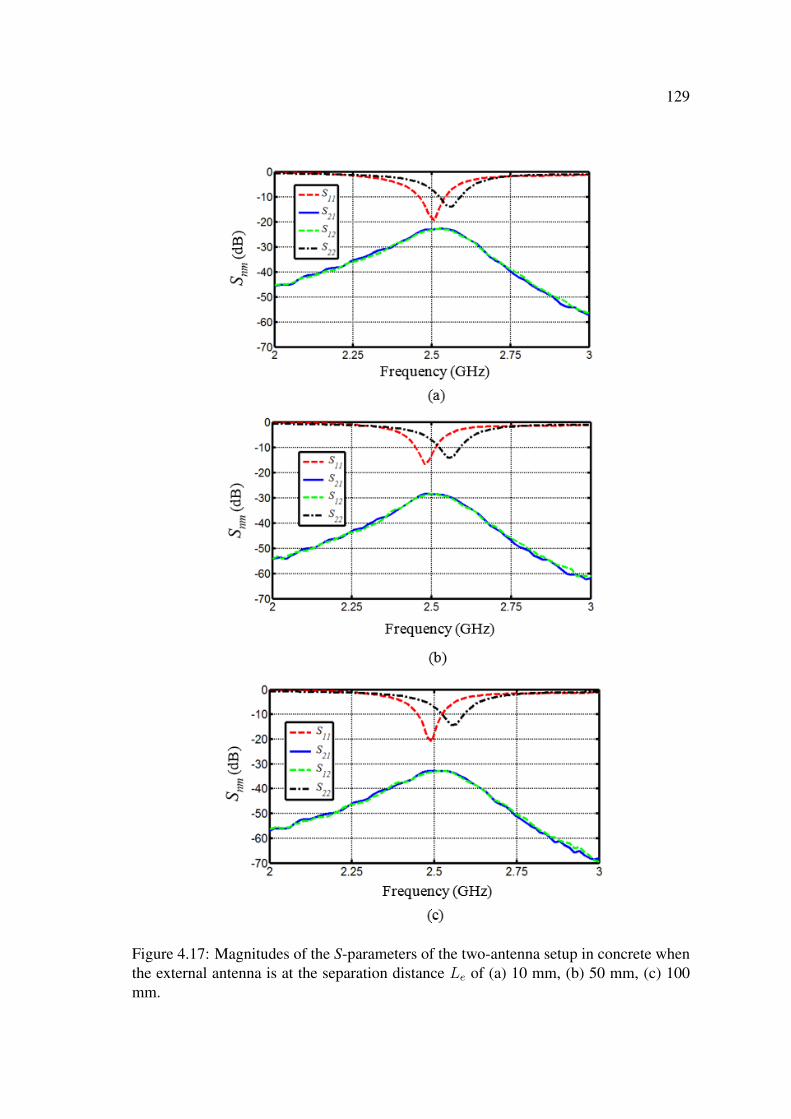
129
Figure 4.17: Magnitudes of the S-parameters of the two-antenna setup in concrete whenthe external antenna is at the separation distance Le of (a) 10 mm, (b) 50 mm, (c) 100mm.

130
possible to take measurements of the S-parameters at the separation distance of 200 mm.
Therefore, measurement results of the magnitudes of the S-parameters were recorded for
the separation distance Le of 10 mm, 50 mm, and 100 mm.
Fig. 4.17 shows that at Le equals 10 mm, 50 mm, and 100 mm, the resonant fre-
quency of the external antenna has values of 2.51 GHz, 2.48 GHz, and 2.49 GHz with
S11 of -19.26 dB, -16.65 dB, and -20.94 dB, respectively. On the other hand, the mea-
sured resonant frequency of the implanted antenna module in concrete has values of 2.55
GHz, 2.55 GHz, and 2.57 GHz with S11 of -14.06 dB, -14.27 dB, and -13.83 dB for the
separation distances of 10 mm, 50 mm, and 100 mm, respectively. Fig. 4.17 also shows
that the magnitudes of the transmission coefficients S21 and S12 both have values of -
22.87 dB, -28.40 dB, and -32.88 dB at the separation distance Le of 10 mm, 50 mm, and
100 mm, respectively. Similar to the case of the two-antenna setup in free space, with
tissue mimicking gel, and with minced meat, it can be seen from Fig. 4.17 that the max-
imum values of S21 and S12 occur at the point of intersection between the plots of S11
and S22. It can also be seen that the magnitudes of the transmission coefficients decrease
with the increase in the separation distance. The occurrence of maximum transmission
coefficients at the points of intersection of S21 and S12 was also seen in the simulation
results of Fig. 3.54.
4.6 Electrical Properties of Material: Measurement and
Simulation Results
In this section a comparison between the measurement and simulation results of the
wireless power transmission with the two-antenna setup is performed to determine the
unknown electrical properties of the tissue mimicking gel and the concrete specimen. A
summary of selected measurement and simulation results which include the measured
and simulated resonant frequency, fif , of the antenna module in free space, the mea-
sured and simulated resonant frequency, fit, of the implanted antenna module in tissue
131
mimicking gel, the measured and simulated resonant frequency, fim, of the implanted an-
tenna module in concrete, and the corresponding measured and simulated magnitudes of
the reflection and transmission coefficients of the two-antenna setup in free space, tissue
mimicking gel, and concrete for different separation distances is tabulated in Table 4.1.
It can be seen from Table 4.1 that there are some discrepancies and agreement be-
tween the measured and simulated results. For example, the measured resonant fre-
quency fif of the antenna module in free space has a value of 2.54 GHz for all the
separation distances Lf is higher (by ∼ 0.03 GHz) than simulated fif which has values
of 2.50 GHz, 2.51 GHz, and 2.51 GHz for the separation distances of 50 mm, 100 mm,
and 200 mm, respectively. The discrepancies between the measured and simulated fif
of the antenna module can be related to manufacturing errors and slight variation in the
electrical properties of the substrate material and the protective housing. It can also be
seen from Table 4.1 that the measured magnitude of the transmission coefficient S21 of
the two-antenna setup in free space has a value of -11.89 dB at Lf = 50 mm which is
very close to the simulated value of -12.0 dB. However, there are slight discrepancies be-
tween the -15.99 dB and -20.14 dB measured and the -18.14 dB and -23.66 dB simulated
magnitudes of the transmission coefficients for both the 100 mm and 200 mm separation
distances, respectively. The discrepancies between the measured and simulated resonant
frequencies and the measured and simulated S21 at the 100 mm and 200 mm separation
distances can be attributed to the experimental arrangement (c.f. Fig. 4.5) since it is
open in this case and does not minimise the amounts of reflection and scattering of the
electromagnetic signals from the surrounding objects.
Table 4.1 also shows that the measured resonant frequency fit of the implanted an-
tenna module in the manufactured tissue mimicking gel has a value of 2.60 GHz (for all
the three values of the separation distance Lt) which is higher (by 0.03 GHz) than the
simulated resonant frequency of 2.57 GHz. Furthermore, the measured magnitude of the
transmission coefficient S21 has higher values of -30.15 dB, -34.42 dB, and -41.52 dB
when compared to the simulated S21 of -34.49 dB, -39.06 dB, and -44.09 dB for the
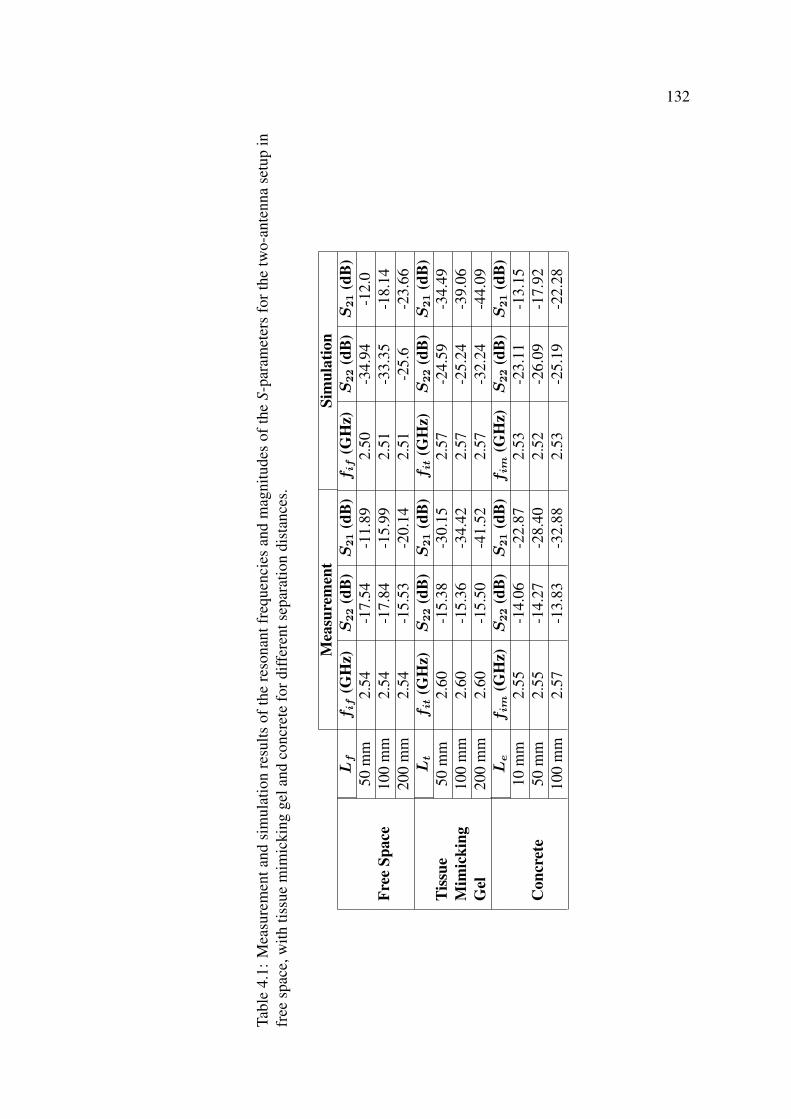
132
Tabl
e4.
1:M
easu
rem
enta
ndsi
mul
atio
nre
sults
ofth
ere
sona
ntfr
eque
ncie
san
dm
agni
tude
sof
the
S-pa
ram
eter
sfo
rthe
two-
ante
nna
setu
pin
free
spac
e,w
ithtis
sue
mim
icki
ngge
land
conc
rete
ford
iffer
ents
epar
atio
ndi
stan
ces.
Mea
sure
men
tSi
mul
atio
nL
ffif
(GH
z)S
22
(dB
)S
21
(dB
)fif
(GH
z)S
22
(dB
)S
21
(dB
)
Free
Spac
e50
mm
2.54
-17.
54-1
1.89
2.50
-34.
94-1
2.0
100
mm
2.54
-17.
84-1
5.99
2.51
-33.
35-1
8.14
200
mm
2.54
-15.
53-2
0.14
2.51
-25.
6-2
3.66
Lt
fit
(GH
z)S
22
(dB
)S
21
(dB
)fit
(GH
z)S
22
(dB
)S
21
(dB
)Ti
ssue
Mim
icki
ngG
el
50m
m2.
60-1
5.38
-30.
152.
57-2
4.59
-34.
4910
0m
m2.
60-1
5.36
-34.
422.
57-2
5.24
-39.
0620
0m
m2.
60-1
5.50
-41.
522.
57-3
2.24
-44.
09L
efim
(GH
z)S
22
(dB
)S
21
(dB
)fim
(GH
z)S
22
(dB
)S
21
(dB
)
Con
cret
e10
mm
2.55
-14.
06-2
2.87
2.53
-23.
11-1
3.15
50m
m2.
55-1
4.27
-28.
402.
52-2
6.09
-17.
9210
0m
m2.
57-1
3.83
-32.
882.
53-2
5.19
-22.
28
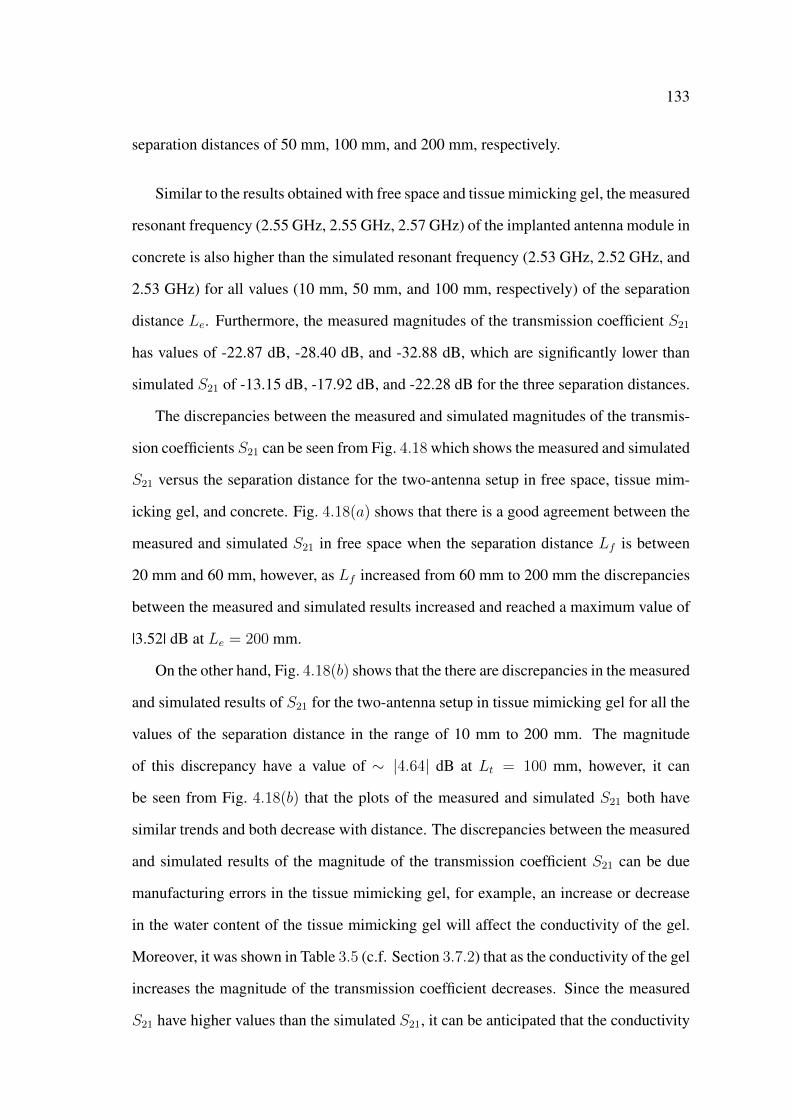
133
separation distances of 50 mm, 100 mm, and 200 mm, respectively.
Similar to the results obtained with free space and tissue mimicking gel, the measured
resonant frequency (2.55 GHz, 2.55 GHz, 2.57 GHz) of the implanted antenna module in
concrete is also higher than the simulated resonant frequency (2.53 GHz, 2.52 GHz, and
2.53 GHz) for all values (10 mm, 50 mm, and 100 mm, respectively) of the separation
distance Le. Furthermore, the measured magnitudes of the transmission coefficient S21
has values of -22.87 dB, -28.40 dB, and -32.88 dB, which are significantly lower than
simulated S21 of -13.15 dB, -17.92 dB, and -22.28 dB for the three separation distances.
The discrepancies between the measured and simulated magnitudes of the transmis-
sion coefficients S21 can be seen from Fig. 4.18 which shows the measured and simulated
S21 versus the separation distance for the two-antenna setup in free space, tissue mim-
icking gel, and concrete. Fig. 4.18(a) shows that there is a good agreement between the
measured and simulated S21 in free space when the separation distance Lf is between
20 mm and 60 mm, however, as Lf increased from 60 mm to 200 mm the discrepancies
between the measured and simulated results increased and reached a maximum value of
|3.52| dB at Le = 200 mm.
On the other hand, Fig. 4.18(b) shows that the there are discrepancies in the measured
and simulated results of S21 for the two-antenna setup in tissue mimicking gel for all the
values of the separation distance in the range of 10 mm to 200 mm. The magnitude
of this discrepancy have a value of ∼ |4.64| dB at Lt = 100 mm, however, it can
be seen from Fig. 4.18(b) that the plots of the measured and simulated S21 both have
similar trends and both decrease with distance. The discrepancies between the measured
and simulated results of the magnitude of the transmission coefficient S21 can be due
manufacturing errors in the tissue mimicking gel, for example, an increase or decrease
in the water content of the tissue mimicking gel will affect the conductivity of the gel.
Moreover, it was shown in Table 3.5 (c.f. Section 3.7.2) that as the conductivity of the gel
increases the magnitude of the transmission coefficient decreases. Since the measured
S21 have higher values than the simulated S21, it can be anticipated that the conductivity
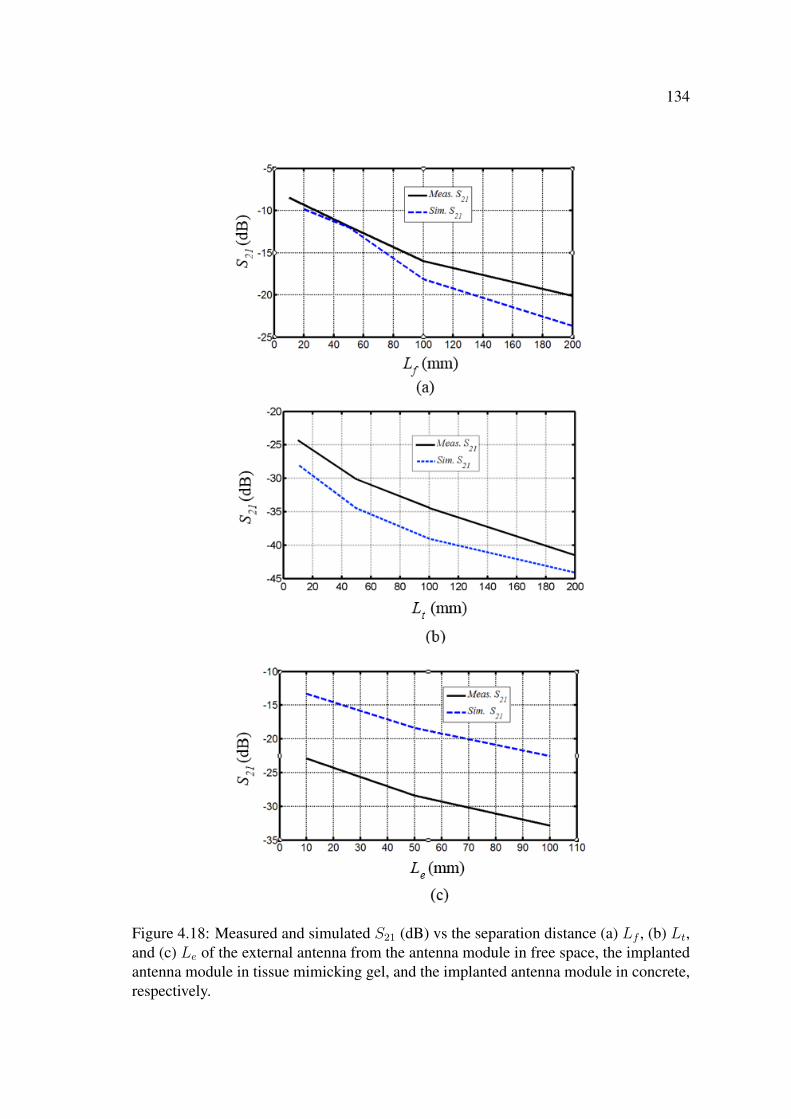
134
Figure 4.18: Measured and simulated S21 (dB) vs the separation distance (a) Lf , (b) Lt,and (c) Le of the external antenna from the antenna module in free space, the implantedantenna module in tissue mimicking gel, and the implanted antenna module in concrete,respectively.
135
of the human tissue used in the simulation model have a value that is higher than the
conductivity of the manufactured tissue mimicking gel. In the simulation models the
tissue mimicking gel was modelled with a conductivity of 2.27 S/m.
Fig. 4.18(c) shows that there are considerable discrepancies between the measured
and simulated S21 that reaches a value of ∼ |10.60| dB at Le = 200 mm for the two-
antenna setup in concrete. Nevertheless, both plots of the measured and simulated S21
have the same trends. It is expected that the measured S21 should have lower values
than the simulated coefficients because the loss tangent of the concrete cube used in the
simulation models has a value of 0.0125 which is similar to the value of dry concrete.
However, the measurement results were taken using a 15-day-old concrete cube which
means that there could be a considerable amount of water inside the concrete cube which
will significantly increase the amount of losses, and hence, decrease S21.
To determine the value of the conductivity, σg, of the manufactured tissue mimicking
gel a parametric study on the effect of σg on the magnitude transmission coefficient S21
for the two-antenna setup in the block of human tissue (c.f. Fig. 3.40) with a separation
distance of 50 mm was performed in CST MWS. The results of this study are shown
in Fig. 4.19. It can be seen from Fig. 4.19 that S21 decrease as the conductivity of the
Figure 4.19: S21 vs the conductivity σg of the simulated human tissue.
gel σg increases. Furthermore, Fig. 4.19 shows that S21 has a value of ∼ −35 dB at
σg = 2.25 S/m which matches the value of the simulated S21 (c.f., Table 4.1) and shows
136
that the CST model for the parametric study is correct and can be used to determine
the conductivity of the manufactured tissue mimicking gel. It can also be seen from
Fig. 4.19 that at σg ≈ 1.4 S/m and σg ≈ 1.5 S/m the magnitude of the transmission
coefficient S21 has a value of ∼ −29.80 dB ∼ −30.15 dB which is close to the S21 of
minced meat (-29.49 dB, c.f. Fig. 4.13(a)) and tissue mimicking gel (-30.15 dB, c.f.
Fig. 4.11), respectively. For simplicity, the conductivity of both the fresh minced meat
and the tissue mimicking gel is taken as∼ 1.4 S/m. The CST models of the two-antenna
setup in human tissue (c.f. Chapter 3) was re-simulated with a conductivity of 1.4 S/m
for different separation distance Lt and the new simulated and the measured results are
shown in Fig. 4.20. It can be seen from Fig. 4.20 that there is now a good agreement
between the measured and simulated results of S21 for values of the separation distance
Lt from 10 mm to 200 mm.
The unknown value of the loss tangent tan δc of the manufactured concrete speci-
men can be determined by performing another parametric study on the effect of the loss
tangent tan δc on the magnitude of the transmission coefficient S21 of the two-antenna
setup in concrete with a separation distance Le of 50 mm and the results of this study
are shown in Fig. 4.21. It can be seen from Fig. 4.21, and as expected, that as tan δc
increases the magnitude of the transmission coefficient decreases and it can also be seen
that at tan δc = 0.0125 S21 has a value of -18.26 dB which matches the simulated value
of -17.92 dB for the case of Le = 50 mm (c.f. Table 4.1 and Fig. 3.54(b)).
Furthermore, Fig. 4.21 also shows that at tan δc ≈ 0.18 the magnitude of the trans-
mission coefficient S21 has a value of -27.60 dB which matches the measured -28.40 dB
value of S21 (c.f. Table 4.1). These results show that the manufactured 15-day-old con-
crete specimen is relatively lossy (due to the high water content) and has a loss tangent
tan δc approximately 0.18. The CST model of the two-antenna setup in concrete was re-
simulated with the new value of tan δc and Fig. 4.22 shows the measured and simulated
S21 versus the separation distance Le. It can be seen from Fig. 4.22 that at this value of
tan δc (i.e., 0.18) there is a good agreement between the simulated and measured S21.
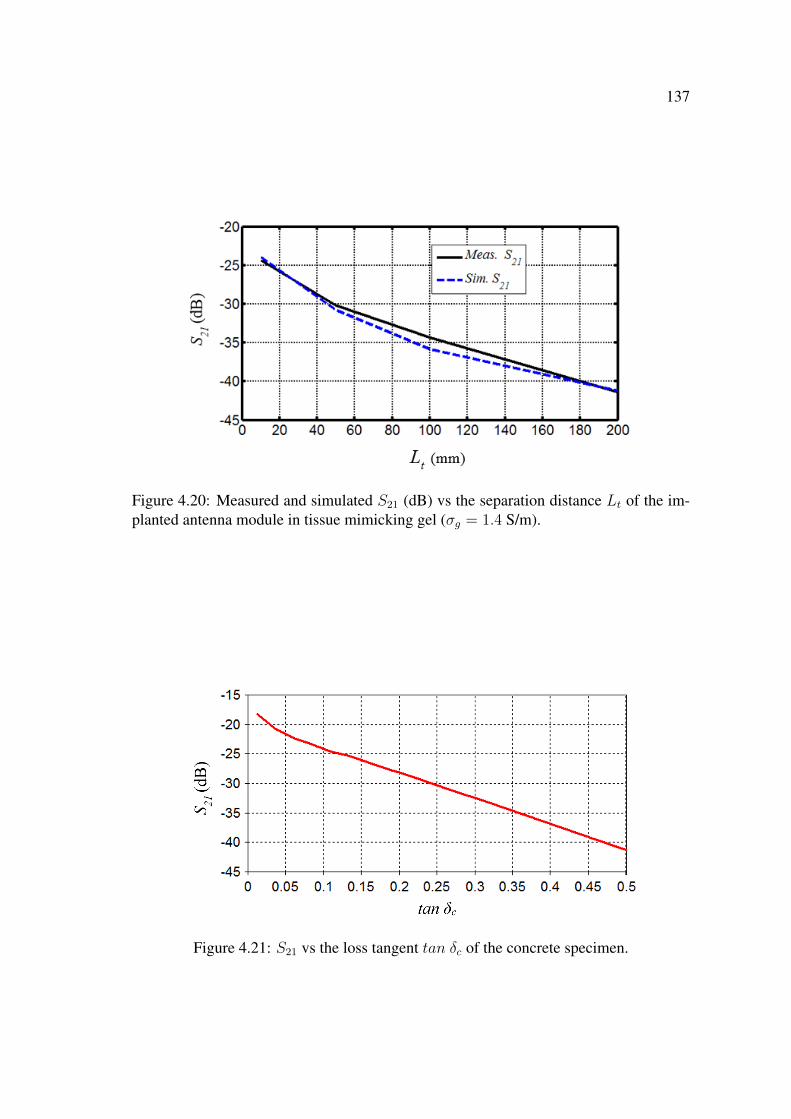
137
Figure 4.20: Measured and simulated S21 (dB) vs the separation distance Lt of the im-planted antenna module in tissue mimicking gel (σg = 1.4 S/m).
Figure 4.21: S21 vs the loss tangent tan δc of the concrete specimen.

138
Figure 4.22: Measured and simulated S21 (dB) vs the separation distance Le of theimplanted antenna module in concrete (tan δc = 0.18).
4.7 Conclusion
In this chapter a microstrip rectangular patch antenna, a microstrip rectangular patch
antenna module, a block of tissue mimicking gel, and a concrete specimen were man-
ufactured to measure the performance of wireless power transmission in free space and
different materials. For this purpose, a microwave wireless power transmission tech-
nique with a two-antenna setup was used and the magnitudes of the S-parameters were
measured using a vector network analyser. The measured magnitudes of the transmission
coefficients of the two-antenna setup in tissue mimicking gel demonstrated the feasibil-
ity of wireless power transmission in human tissue. Furthermore, the antenna module
was implanted in minced meat and the measured magnitudes of the S-parameters have
values that are similar to the values of the magnitudes of the S-parameters measured with
the tissue mimicking gel.
A comparison between the measured and simulated (obtained in Chapter 3) results
of the magnitude of the transmission coefficient S21 was performed. This comparison
showed that there are discrepancies between the measured and simulated S21 for both
cases of tissue mimicking gel and concrete. The discrepancies in the case of the tissue
mimicking gel are attributed to manufacturing errors which resulted in different values

139
of the electrical properties of the gel when compared to the values used in the simulation
models. On the other hand, the discrepancies in the case of the concrete specimen are
attributed to the unknown electrical properties of the 15-day-old concrete specimen. Two
parametric studies were performed to determine the unknown values of the electrical
properties of the tissue mimicking gel and the concrete specimen. The result of these
parametric studies showed that the manufactured tissue mimicking gel has a loss tangent
σg of 1.4 S/m when compared to the 2.27 S/m value used in the simulation models, and
also showed that the concrete specimen has loss tangent tan δc of 0.18 when compared
to the loss tangent of 0.0125 used in the simulation models. The CST models were
re-simulated with the determined values of σg and tan δc and the new measured and
simulated results of S21 are in good agreement.
It can be concluded from the strong agreement between the measured and simulated
results of S21 that the created CST models (c.f. Chapter 3) are correct in regards to;
the geometry and physical dimensions of the simulation model, the specified electrical
properties (at the desired frequency) of different materials in the model, the number of
mesh cells, and the type of boundary conditions used in the models. These agreement
also shows that the CST models can be used to accurately simulate the performance of
microwave wireless power transmission in human tissue with microstrip antennas.
Chapter 5
Implantable Miniature Encased
Microstrip Ring Disk Antenna
5.1 Introduction
In this chapter a miniature implantable microstrip ring disk antenna is designed, inves-
tigated, and optimised to operate at 2.45 GHz in the ISM band. The computational tool
CST MWS [139] is used to design and investigate the performance of an implantable
miniature microstrip ring disk antenna in human tissue. First, the performance of the
miniature microstrip ring disk antenna in free space without and with a dielectric en-
casement is investigated at 2.45 GHz. Then, the encased miniature microstrip ring disk
antenna is implanted in human tissue and a parametric study is performed to optimise
the implanted antenna’s performance at 2.45 GHz.
5.2 Performance of Miniature Microstrip Ring Disk An-
tenna: Free Space
The microstrip ring disk antenna is chosen because of its disk shape which is comparable
to the shape of nerves. The initial dimensions and electrical properties of a miniature
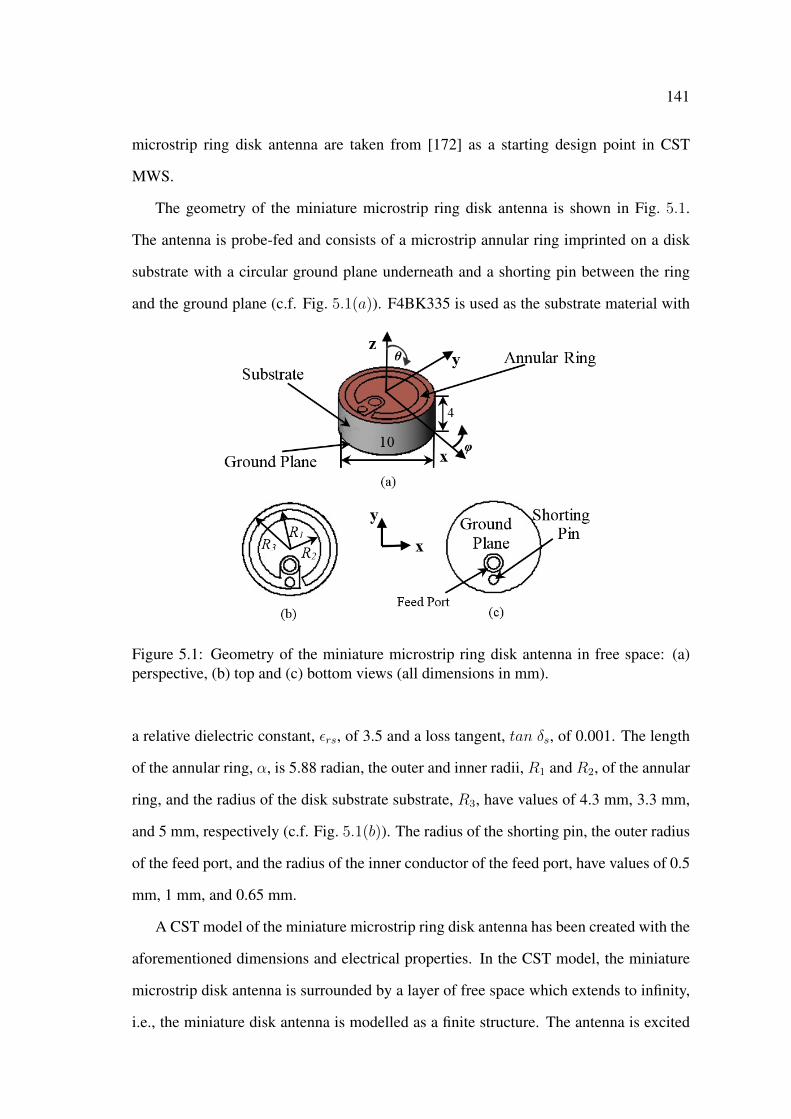
141
microstrip ring disk antenna are taken from [172] as a starting design point in CST
MWS.
The geometry of the miniature microstrip ring disk antenna is shown in Fig. 5.1.
The antenna is probe-fed and consists of a microstrip annular ring imprinted on a disk
substrate with a circular ground plane underneath and a shorting pin between the ring
and the ground plane (c.f. Fig. 5.1(a)). F4BK335 is used as the substrate material with
Figure 5.1: Geometry of the miniature microstrip ring disk antenna in free space: (a)perspective, (b) top and (c) bottom views (all dimensions in mm).
a relative dielectric constant, εrs, of 3.5 and a loss tangent, tan δs, of 0.001. The length
of the annular ring, α, is 5.88 radian, the outer and inner radii, R1 and R2, of the annular
ring, and the radius of the disk substrate substrate, R3, have values of 4.3 mm, 3.3 mm,
and 5 mm, respectively (c.f. Fig. 5.1(b)). The radius of the shorting pin, the outer radius
of the feed port, and the radius of the inner conductor of the feed port, have values of 0.5
mm, 1 mm, and 0.65 mm.
A CST model of the miniature microstrip ring disk antenna has been created with the
aforementioned dimensions and electrical properties. In the CST model, the miniature
microstrip disk antenna is surrounded by a layer of free space which extends to infinity,
i.e., the miniature disk antenna is modelled as a finite structure. The antenna is excited
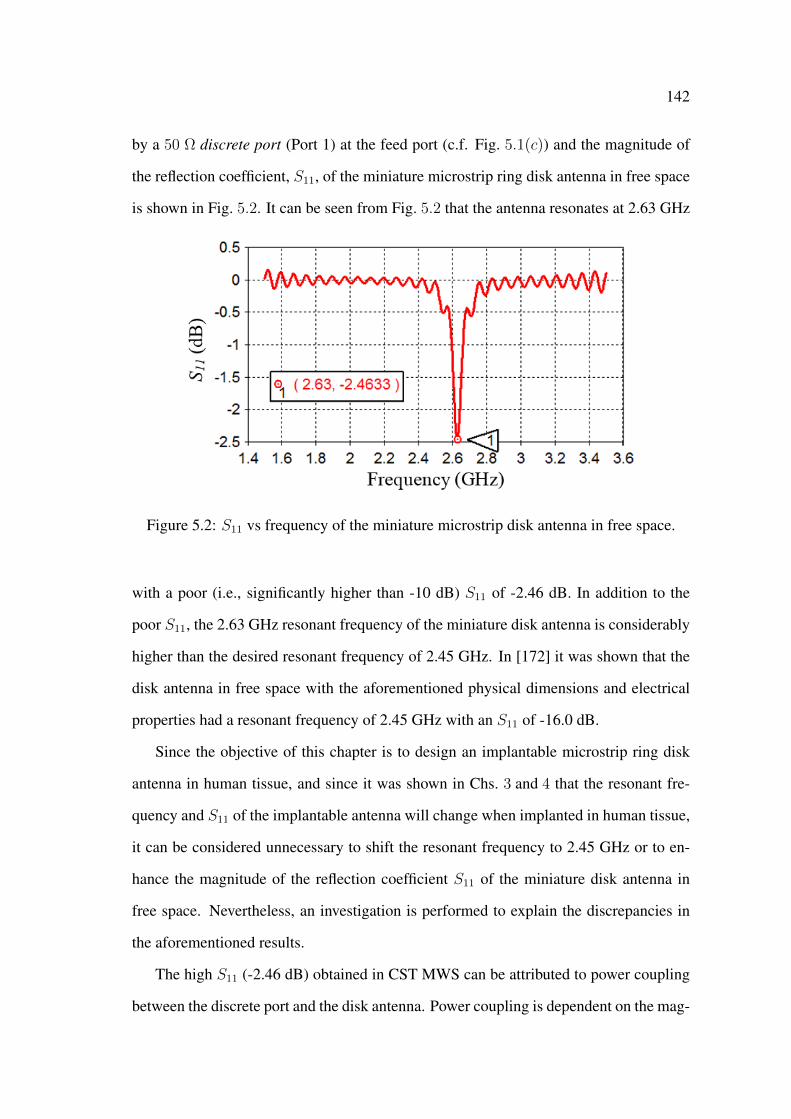
142
by a 50 Ω discrete port (Port 1) at the feed port (c.f. Fig. 5.1(c)) and the magnitude of
the reflection coefficient, S11, of the miniature microstrip ring disk antenna in free space
is shown in Fig. 5.2. It can be seen from Fig. 5.2 that the antenna resonates at 2.63 GHz
Figure 5.2: S11 vs frequency of the miniature microstrip disk antenna in free space.
with a poor (i.e., significantly higher than -10 dB) S11 of -2.46 dB. In addition to the
poor S11, the 2.63 GHz resonant frequency of the miniature disk antenna is considerably
higher than the desired resonant frequency of 2.45 GHz. In [172] it was shown that the
disk antenna in free space with the aforementioned physical dimensions and electrical
properties had a resonant frequency of 2.45 GHz with an S11 of -16.0 dB.
Since the objective of this chapter is to design an implantable microstrip ring disk
antenna in human tissue, and since it was shown in Chs. 3 and 4 that the resonant fre-
quency and S11 of the implantable antenna will change when implanted in human tissue,
it can be considered unnecessary to shift the resonant frequency to 2.45 GHz or to en-
hance the magnitude of the reflection coefficient S11 of the miniature disk antenna in
free space. Nevertheless, an investigation is performed to explain the discrepancies in
the aforementioned results.
The high S11 (-2.46 dB) obtained in CST MWS can be attributed to power coupling
between the discrete port and the disk antenna. Power coupling is dependent on the mag-
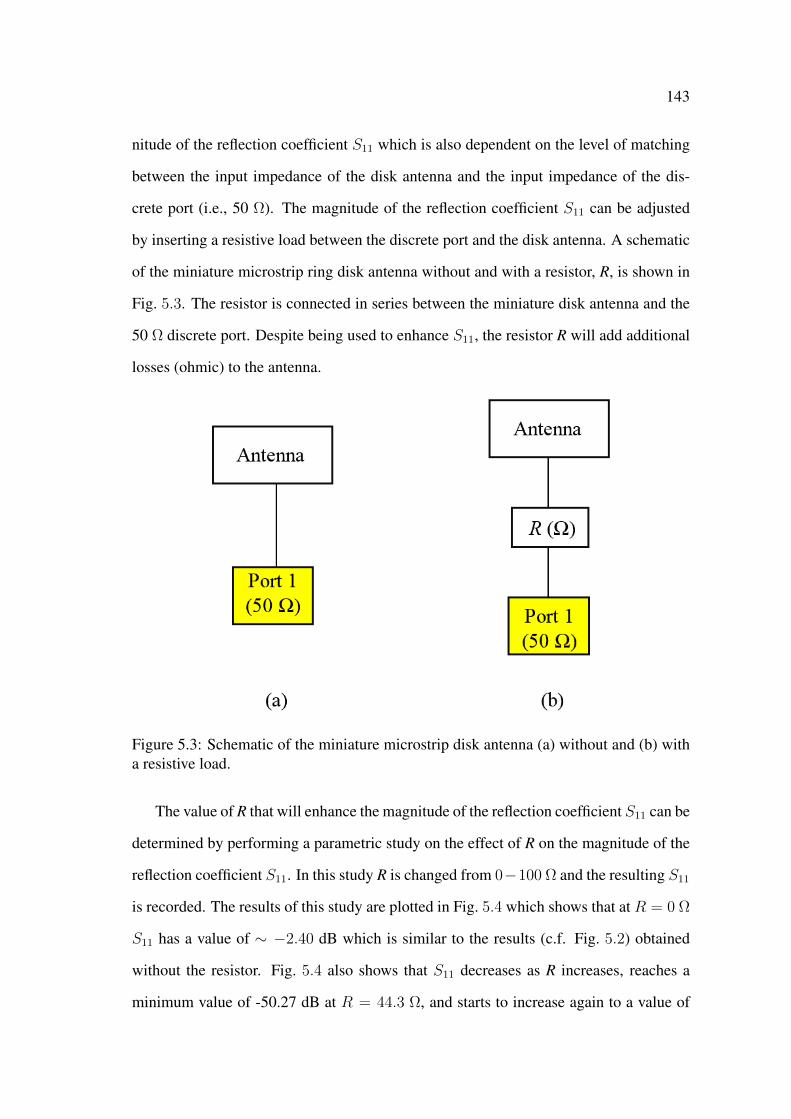
143
nitude of the reflection coefficient S11 which is also dependent on the level of matching
between the input impedance of the disk antenna and the input impedance of the dis-
crete port (i.e., 50 Ω). The magnitude of the reflection coefficient S11 can be adjusted
by inserting a resistive load between the discrete port and the disk antenna. A schematic
of the miniature microstrip ring disk antenna without and with a resistor, R, is shown in
Fig. 5.3. The resistor is connected in series between the miniature disk antenna and the
50 Ω discrete port. Despite being used to enhance S11, the resistor R will add additional
losses (ohmic) to the antenna.
Figure 5.3: Schematic of the miniature microstrip disk antenna (a) without and (b) witha resistive load.
The value of R that will enhance the magnitude of the reflection coefficient S11 can be
determined by performing a parametric study on the effect of R on the magnitude of the
reflection coefficient S11. In this study R is changed from 0−100 Ω and the resulting S11
is recorded. The results of this study are plotted in Fig. 5.4 which shows that at R = 0 Ω
S11 has a value of ∼ −2.40 dB which is similar to the results (c.f. Fig. 5.2) obtained
without the resistor. Fig. 5.4 also shows that S11 decreases as R increases, reaches a
minimum value of -50.27 dB at R = 44.3 Ω, and starts to increase again to a value of

144
-9 dB as R increases from 44.3 Ω to 100 Ω. It can be seen from these results that S11 is
minimum when R = 44.3 Ω. For simplicity the value of the R is chosen as 50 Ω and the
resulting magnitude of the reflection coefficient S11 of the miniature disk antenna (with
the 50 Ω resistor) is shown in Fig. 5.5. It can be seen from Fig. 5.5 that by inserting the
50 Ω resistor the magnitude of the reflection coefficient has a value of -25.86 dB at the
resonant frequency of 2.61 GHz.
Figure 5.4: S11 vs the value R of the resistive load.
Figure 5.5: S11 vs frequency of the miniature microstrip disk antenna in free space witha 50 Ω resistor.
The effect of the 50 Ω resistor on the gain of disk antenna can be found by simulating
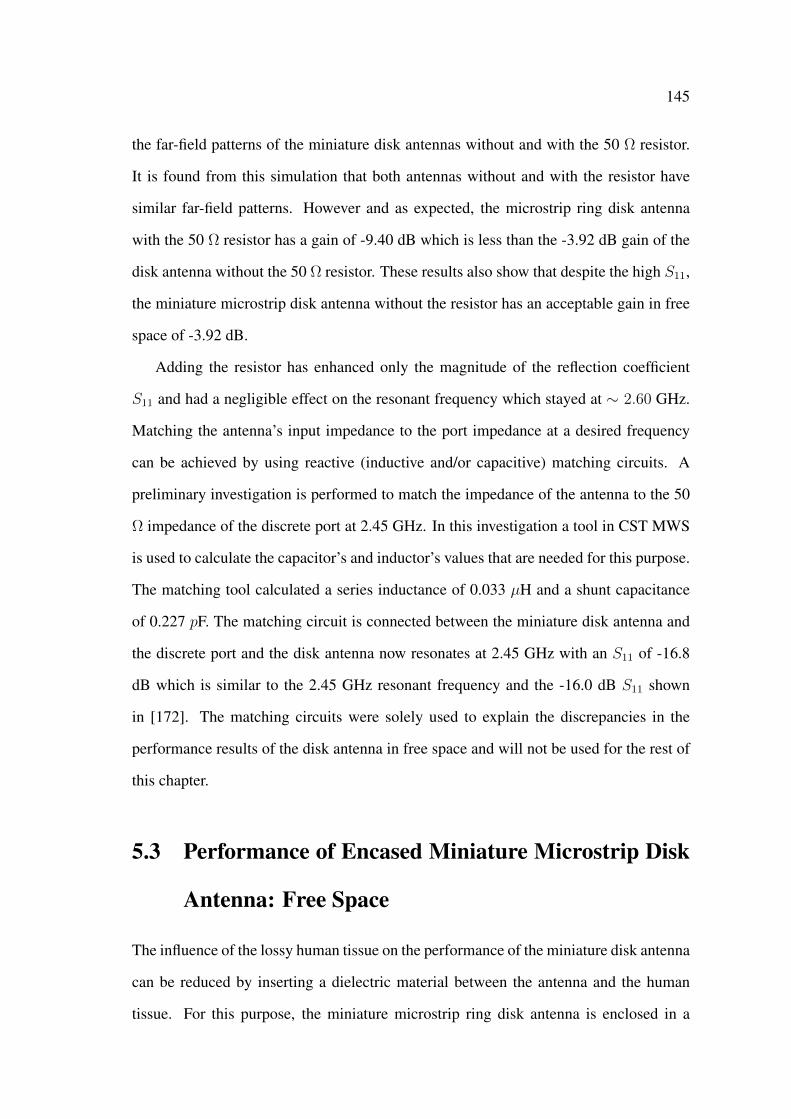
145
the far-field patterns of the miniature disk antennas without and with the 50 Ω resistor.
It is found from this simulation that both antennas without and with the resistor have
similar far-field patterns. However and as expected, the microstrip ring disk antenna
with the 50 Ω resistor has a gain of -9.40 dB which is less than the -3.92 dB gain of the
disk antenna without the 50 Ω resistor. These results also show that despite the high S11,
the miniature microstrip disk antenna without the resistor has an acceptable gain in free
space of -3.92 dB.
Adding the resistor has enhanced only the magnitude of the reflection coefficient
S11 and had a negligible effect on the resonant frequency which stayed at ∼ 2.60 GHz.
Matching the antenna’s input impedance to the port impedance at a desired frequency
can be achieved by using reactive (inductive and/or capacitive) matching circuits. A
preliminary investigation is performed to match the impedance of the antenna to the 50
Ω impedance of the discrete port at 2.45 GHz. In this investigation a tool in CST MWS
is used to calculate the capacitor’s and inductor’s values that are needed for this purpose.
The matching tool calculated a series inductance of 0.033 µH and a shunt capacitance
of 0.227 pF. The matching circuit is connected between the miniature disk antenna and
the discrete port and the disk antenna now resonates at 2.45 GHz with an S11 of -16.8
dB which is similar to the 2.45 GHz resonant frequency and the -16.0 dB S11 shown
in [172]. The matching circuits were solely used to explain the discrepancies in the
performance results of the disk antenna in free space and will not be used for the rest of
this chapter.
5.3 Performance of Encased Miniature Microstrip Disk
Antenna: Free Space
The influence of the lossy human tissue on the performance of the miniature disk antenna
can be reduced by inserting a dielectric material between the antenna and the human
tissue. For this purpose, the miniature microstrip ring disk antenna is enclosed in a

146
capsule shaped dielectric encasement that physically and electrically isolates the antenna
from the lossy human tissue. A schematic of the miniature microstrip ring disk antenna
with the dielectric encasement is shown in Fig. 5.6.
Figure 5.6: Schematic of the miniature microstrip ring disk antenna with a dielectricencasement in the (a) x− y plane at z = 0, (b) y− z plane at x = 0, and (c) x− z planeat y = 0 (not to scale). All dimensions are in mm.
To reduce the overall dimensions of the encased disk antenna, the encasement is
modelled with a side-wall thickness of 0.5 mm. On the other hand, it was shown in
Section 3.5.1 (c.f. Fig. 3.30) that the closer the human tissue to the rectangular patch the
stronger it is effect on the resonant frequency of the antenna. From this perspective, to
reduce the influence of human tissue on the disk antenna the top and bottom thicknesses
of the encasement are chosen to be 2.0 mm. Furthermore, to simplify the design the
encasement is modelled from the same material as the substrate of the disk antenna (i.e.,
F4BK335) with a relative dielectric constant, εre, of 3.5 and a loss tangent, tan δe, of
0.001. The miniature encased microstrip disk antenna has an overall diameter and height
of 11 mm and 8 mm, respectively, as depicted in Fig. 5.6(b).
The magnitude of the reflection coefficient S11 of the miniature encased microstrip
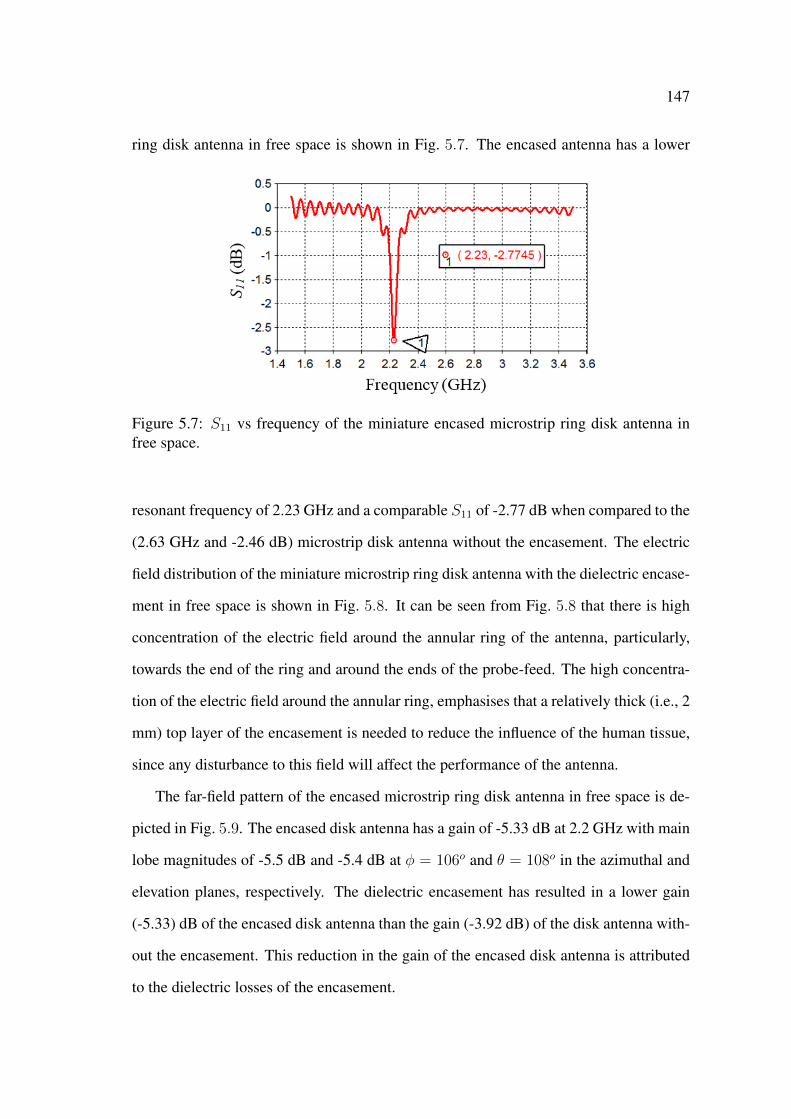
147
ring disk antenna in free space is shown in Fig. 5.7. The encased antenna has a lower
Figure 5.7: S11 vs frequency of the miniature encased microstrip ring disk antenna infree space.
resonant frequency of 2.23 GHz and a comparable S11 of -2.77 dB when compared to the
(2.63 GHz and -2.46 dB) microstrip disk antenna without the encasement. The electric
field distribution of the miniature microstrip ring disk antenna with the dielectric encase-
ment in free space is shown in Fig. 5.8. It can be seen from Fig. 5.8 that there is high
concentration of the electric field around the annular ring of the antenna, particularly,
towards the end of the ring and around the ends of the probe-feed. The high concentra-
tion of the electric field around the annular ring, emphasises that a relatively thick (i.e., 2
mm) top layer of the encasement is needed to reduce the influence of the human tissue,
since any disturbance to this field will affect the performance of the antenna.
The far-field pattern of the encased microstrip ring disk antenna in free space is de-
picted in Fig. 5.9. The encased disk antenna has a gain of -5.33 dB at 2.2 GHz with main
lobe magnitudes of -5.5 dB and -5.4 dB at φ = 106o and θ = 108o in the azimuthal and
elevation planes, respectively. The dielectric encasement has resulted in a lower gain
(-5.33) dB of the encased disk antenna than the gain (-3.92 dB) of the disk antenna with-
out the encasement. This reduction in the gain of the encased disk antenna is attributed
to the dielectric losses of the encasement.
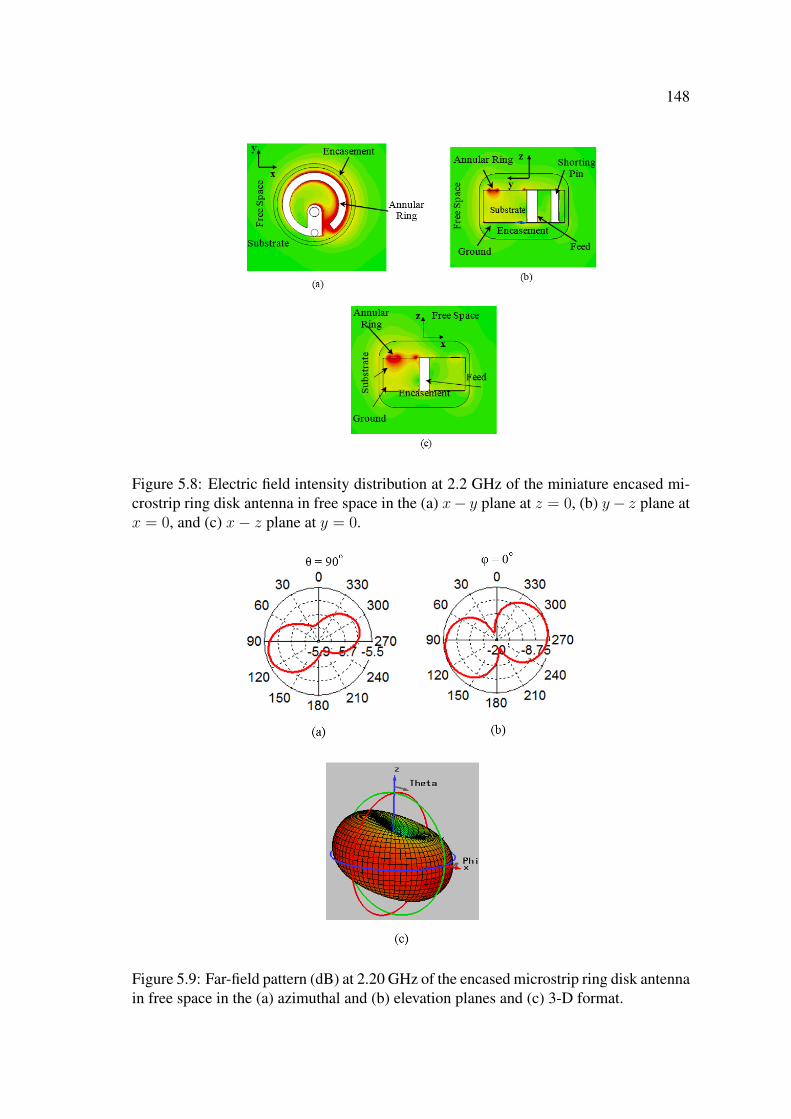
148
Figure 5.8: Electric field intensity distribution at 2.2 GHz of the miniature encased mi-crostrip ring disk antenna in free space in the (a) x− y plane at z = 0, (b) y− z plane atx = 0, and (c) x− z plane at y = 0.
Figure 5.9: Far-field pattern (dB) at 2.20 GHz of the encased microstrip ring disk antennain free space in the (a) azimuthal and (b) elevation planes and (c) 3-D format.

149
5.4 Performance of Encased Miniature Microstrip Disk
Antenna: Human Tissue
In this section the performance of the miniature encased microstrip ring disk antenna is
investigated when implanted in human tissue. First, the miniature encased microstrip
ring disk antenna is implanted in a small cube of human tissue and a parametric study is
performed to optimise the performance of the implanted miniature antenna. The small
cube is used in this part of the investigation to reduce the simulation time of the para-
metric study. Second, a large cube of human tissue is used to provide a more practi-
cal approximation of the human body and the performance of the optimised implanted
miniature encased microstrip ring disk antenna in the large cube is also investigated.
The CST model of the implanted miniature microstrip disk antenna in a small cube of
human tissue is shown in Fig. 5.10. The miniature encased microstrip ring disk antenna
is implanted inside a 24×24×24 mm3 cube of human tissue that has a relative dielectric
constant, εrt, of 52.73 and a loss tangent, tan δt, of 0.242 at 2.45 GHz [127]. These
values of εrt and tan δt are similar to the values of the relative dielectric constant and the
loss tangent of muscle tissue at 2.45 GHz [127, 143]. The human tissue forms a 6.5 mm
layer to the sides and an 8.5 mm layer to the top and bottom surfaces of the implanted
encased microstrip disk antenna.
Fig. 5.11 shows the magnitude of the reflection coefficient S11 versus frequency of
the miniature implanted encased disk antenna in the small cube of human tissue. From
Fig. 5.11 it can be seen that the human tissue has a strong effect on the resonant frequency
of the encased microstrip disk antenna which shifted to 1.79 GHz with an S11 of -9.49
dB. Similar to the case of enclosing the disk antenna inside the dielectric encasement,
this reduction in the resonant frequency is a result of the dielectric loading of the human
tissue on the miniature disk antenna. Moreover, the human tissue has resulted in a higher
reduction in the frequency of the implanted antenna when compared to the case of the
dielectric encasement because the tissue has a relative dielectric constant (52.73) that is
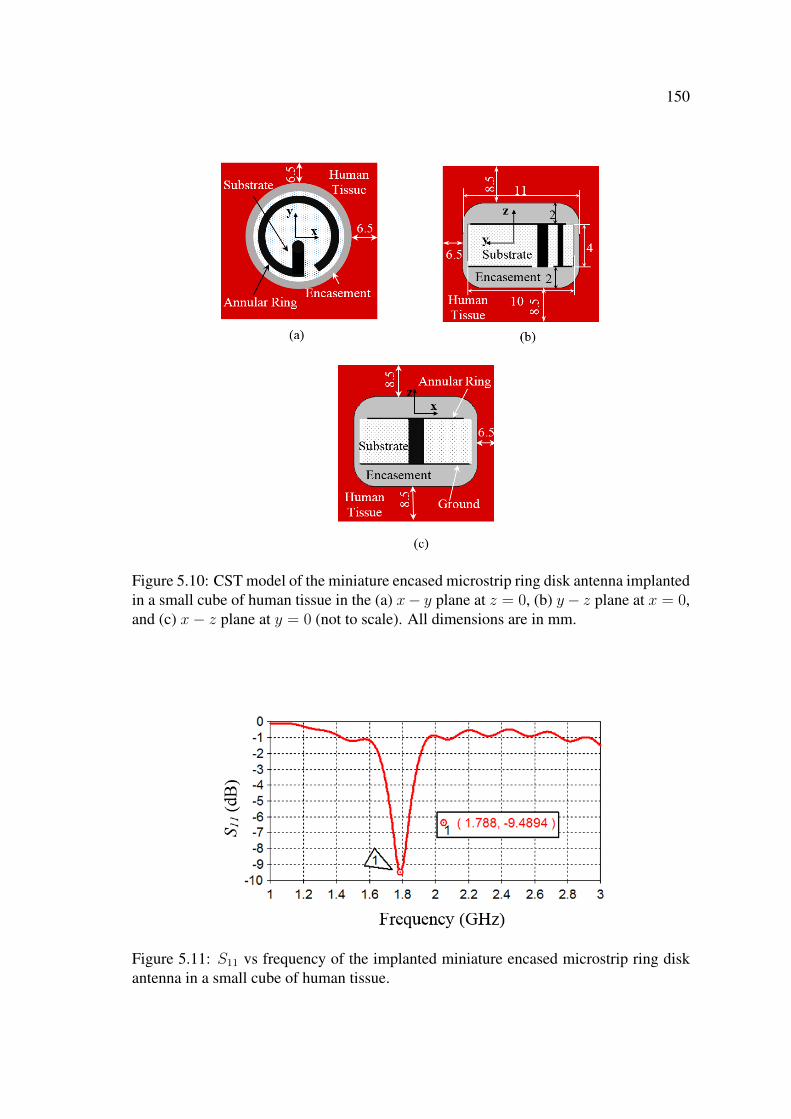
150
Figure 5.10: CST model of the miniature encased microstrip ring disk antenna implantedin a small cube of human tissue in the (a) x− y plane at z = 0, (b) y− z plane at x = 0,and (c) x− z plane at y = 0 (not to scale). All dimensions are in mm.
Figure 5.11: S11 vs frequency of the implanted miniature encased microstrip ring diskantenna in a small cube of human tissue.
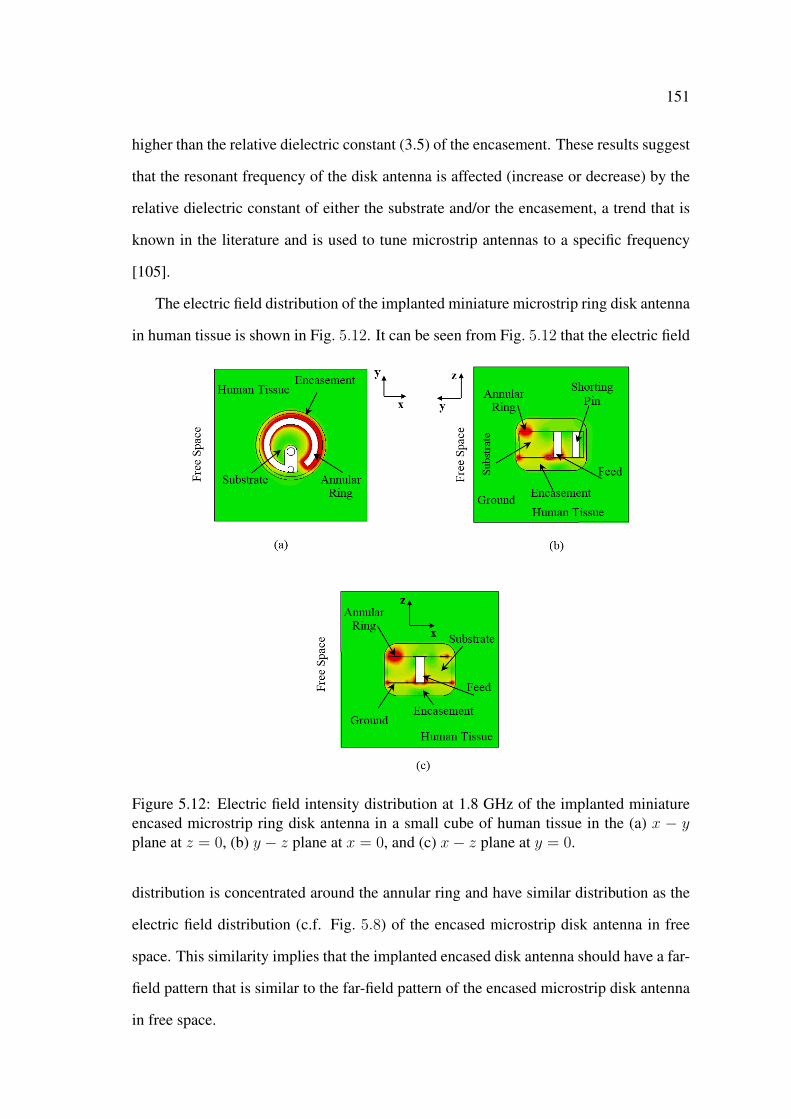
151
higher than the relative dielectric constant (3.5) of the encasement. These results suggest
that the resonant frequency of the disk antenna is affected (increase or decrease) by the
relative dielectric constant of either the substrate and/or the encasement, a trend that is
known in the literature and is used to tune microstrip antennas to a specific frequency
[105].
The electric field distribution of the implanted miniature microstrip ring disk antenna
in human tissue is shown in Fig. 5.12. It can be seen from Fig. 5.12 that the electric field
Figure 5.12: Electric field intensity distribution at 1.8 GHz of the implanted miniatureencased microstrip ring disk antenna in a small cube of human tissue in the (a) x − yplane at z = 0, (b) y − z plane at x = 0, and (c) x− z plane at y = 0.
distribution is concentrated around the annular ring and have similar distribution as the
electric field distribution (c.f. Fig. 5.8) of the encased microstrip disk antenna in free
space. This similarity implies that the implanted encased disk antenna should have a far-
field pattern that is similar to the far-field pattern of the encased microstrip disk antenna
in free space.
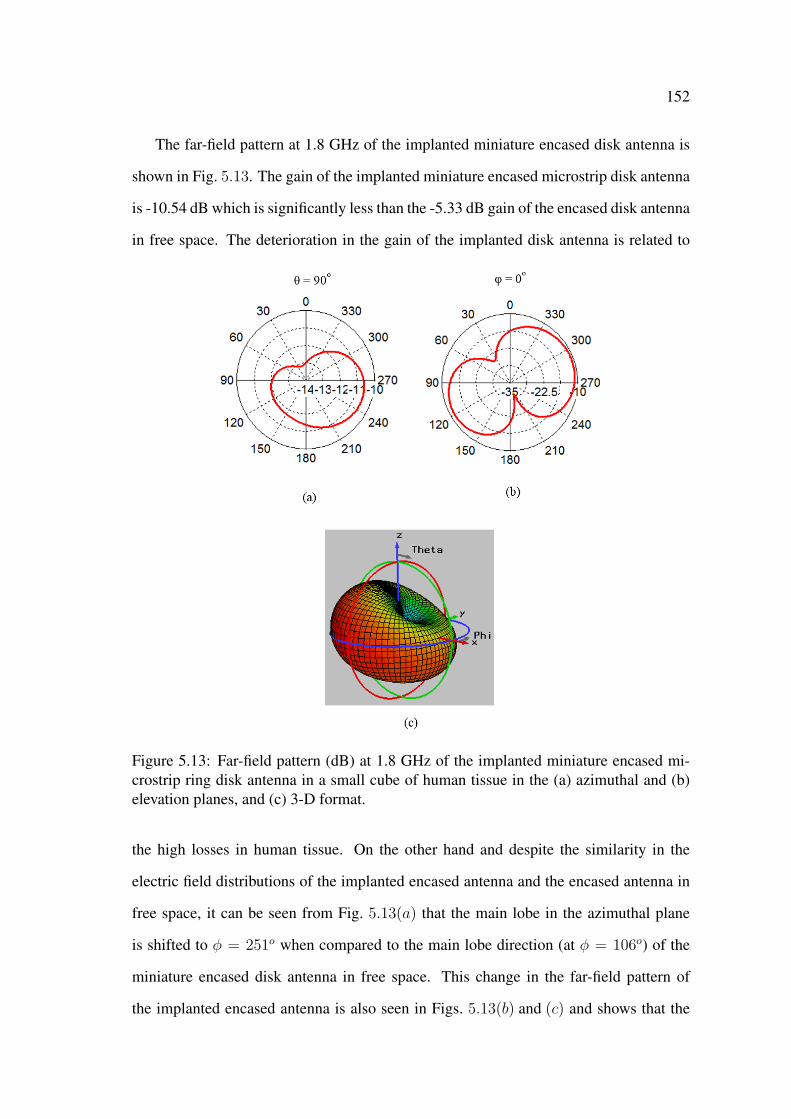
152
The far-field pattern at 1.8 GHz of the implanted miniature encased disk antenna is
shown in Fig. 5.13. The gain of the implanted miniature encased microstrip disk antenna
is -10.54 dB which is significantly less than the -5.33 dB gain of the encased disk antenna
in free space. The deterioration in the gain of the implanted disk antenna is related to
Figure 5.13: Far-field pattern (dB) at 1.8 GHz of the implanted miniature encased mi-crostrip ring disk antenna in a small cube of human tissue in the (a) azimuthal and (b)elevation planes, and (c) 3-D format.
the high losses in human tissue. On the other hand and despite the similarity in the
electric field distributions of the implanted encased antenna and the encased antenna in
free space, it can be seen from Fig. 5.13(a) that the main lobe in the azimuthal plane
is shifted to φ = 251o when compared to the main lobe direction (at φ = 106o) of the
miniature encased disk antenna in free space. This change in the far-field pattern of
the implanted encased antenna is also seen in Figs. 5.13(b) and (c) and shows that the

153
human tissue has affected the far-field pattern as well as the resonant frequency of the
implanted miniature encased microstrip disk antenna. The effect of the human tissue on
the far-field pattern could be related to the geometry and the size of the small cube of
human tissue since both the implanted encased antenna and the encased antenna in free
space have similar electric field distributions.
5.5 Parametric Study and Optimisation
The results obtained in Section 5.4 show that the human tissue had a significant effect
on the resonant frequency of the implanted miniature microstrip disk antenna. In this
section, design parameters which include the length of the annular ring α, the relative
dielectric constant of the substrate εrs, and the relative dielectric constant of the encase-
ment εre, are modified to shift the resonant frequency from 1.8 GHz to 2.45 GHz and
enhance (below -10 dB) the magnitude of the reflection coefficient S11 of the implanted
miniature encased disk antenna in human tissue. For this purpose, a parametric study
on the aforementioned design parameters and their effect on the resonant frequency, fr,
and the magnitude of the reflection coefficient S11 of the implanted encased microstrip
disk antenna has been performed. The results of this parametric study are shown in
Figs. 5.14 and 5.15.
Fig. 5.14 shows the effect of the length of the annular ring α on fr and S11 for
different values of the relative dielectric constant of the substrate εrs when the relative
dielectric constant of the encasement εre = 3.5. It can be seen from Fig. 5.14(a) that
as the length of the ring decreases the resonant frequency increases for a given εrs. For
example, for εrs = 3.0 the resonant frequency fr increases from 1.67 GHz to 3.0 GHz
as α decreases from 5.88 radian to 2.8 radian.
This trend is expected because the length of the resonator (the annular ring) is directly
proportional to the wavelength of the resonant frequency [154]. It can also be seen from
Fig. 5.14(a) that at α = 5.88 radian fr has a low range of 1.6 GHz to 1.8 GHz when
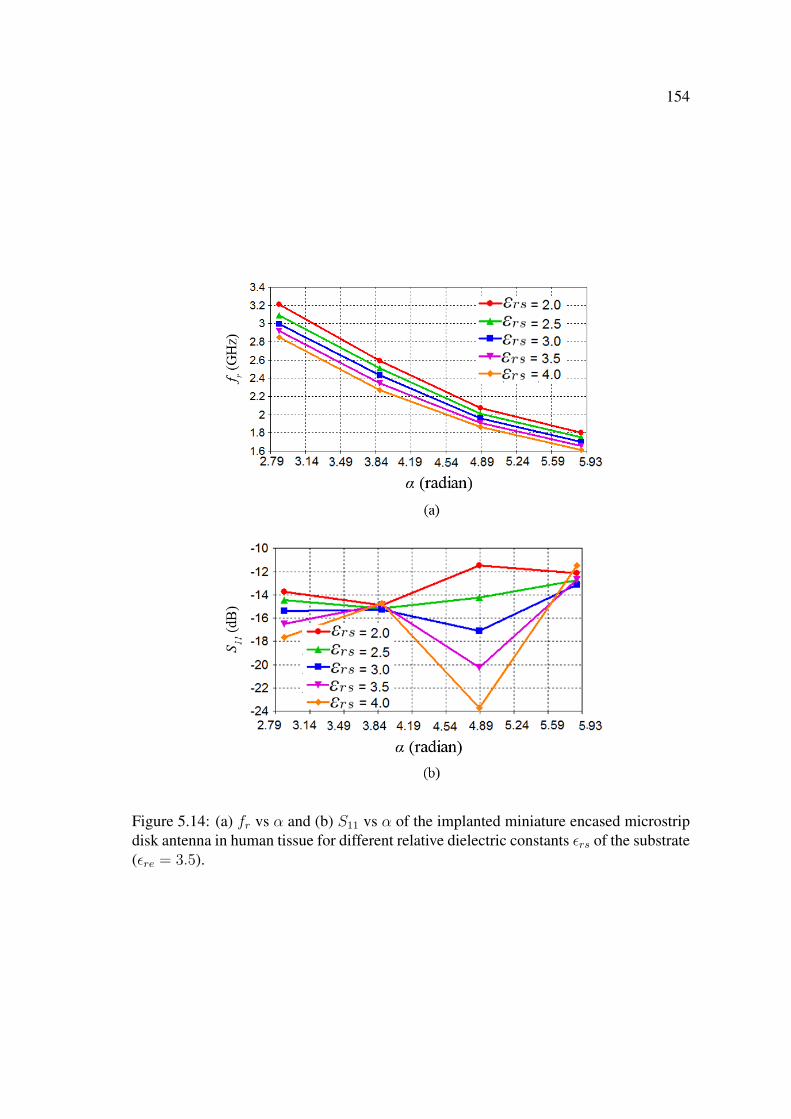
154
Figure 5.14: (a) fr vs α and (b) S11 vs α of the implanted miniature encased microstripdisk antenna in human tissue for different relative dielectric constants εrs of the substrate(εre = 3.5).

155
εrs is in the range of 2.0 to 4.0. The range of fr can be increased by reducing the
length of the annular ring α. For example, at α = 4.89 radian fr has a higher frequency
range of 1.9 GHz to 2.1 GHz when εrs is in the range of 2.0 to 4.0. Fig. 5.14(a) also
shows that the resonant frequency decreases as εrs increases which is also an expected
trend [104–106]. The effect of α on the magnitude of the reflection coefficient S11 (at
the corresponding fr c.f. Fig. 5.14(a)) of the implanted encased microstrip disk antenna
is shown in Fig. 5.14(b). It can be seen from Fig. 5.14(b) that S11 has a good value of
∼ −24 dB for α = 4.89 radian and εrs = 4.0, however, at these values of α and εrs
the resonant frequency of the implanted encased microstrip disk antenna has a value of
∼ 1.9 GHz (c.f. Fig. 5.14(a)).
The effect of the relative dielectric constants of the encasement and the substrate
εre and εrs respectively, on the resonant frequency fr and the magnitude of the reflection
coefficient S11 at α = 4.89 radian are shown in Fig. 5.15. It can be seen from Fig. 5.15(a)
that as the relative dielectric constant of the encasement increases the resonant frequency
decreases. For instance, at εrs = 2.1 fr decreases from 2.54 GHz to 2.34 GHz as εre
increases from 2.0 to 2.4 and has a value of 2.45 GHz at εre = 2.3. On the other hand,
Fig. 5.15(b) shows that for εrs = 2.1 S11 increases from -13.90 dB to -12 dB as εre
increases from 2.0 to 2.4 and indicates that S11 deteriorates as εre increases. Based on
these results it can be summarised that a decrease in the length of the annular ring α,
a decrease in the relative dielectric constant εrs of the substrate, or a decrease in the
relative dielectric constant εre of the encasement results in an increase in the resonant
frequency of the microstrip ring disk antenna.
The results of the aforementioned parametric study show that there is a number of
combinations of different values of the design parameters that can be used to design
implantable miniature microstrip ring disk antennas that resonate at 2.45 GHz with an
acceptable magnitude of the reflection coefficient S11. A summary of the design pa-
rameters of three of the implantable miniature microstrip disk antennas and their corre-
sponding resonant parameters which include the resonant frequency fr, the magnitude
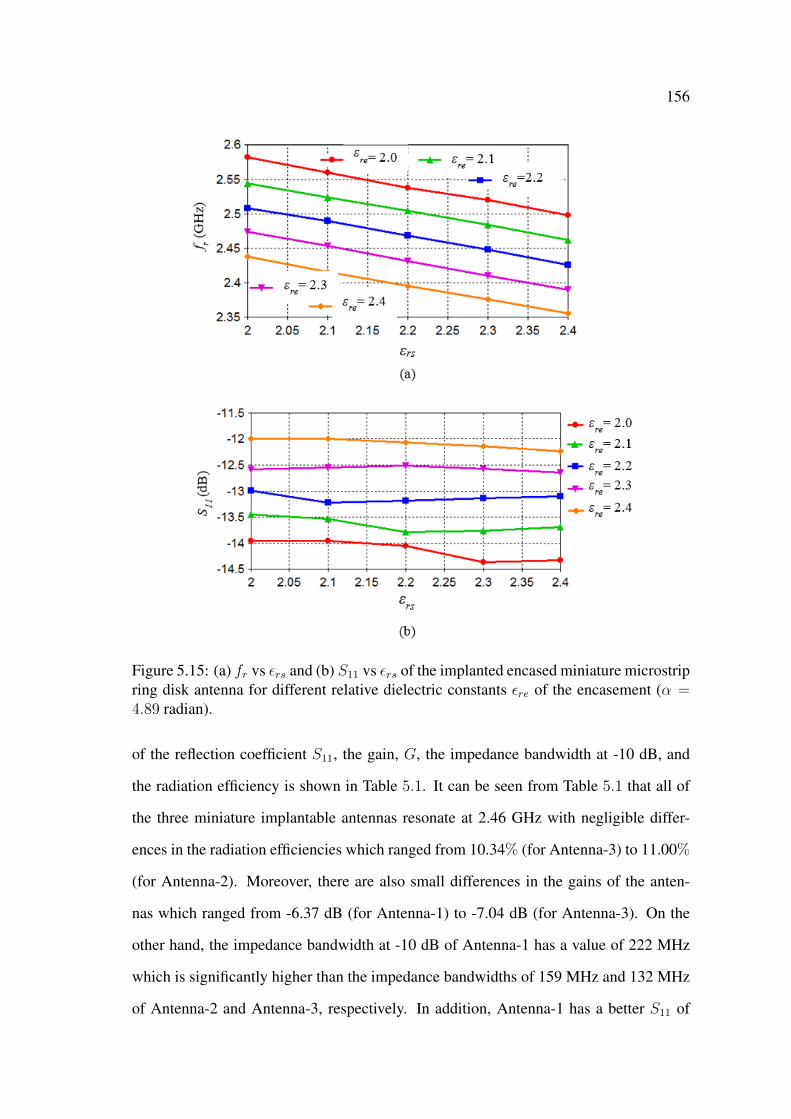
156
Figure 5.15: (a) fr vs εrs and (b) S11 vs εrs of the implanted encased miniature microstripring disk antenna for different relative dielectric constants εre of the encasement (α =4.89 radian).
of the reflection coefficient S11, the gain, G, the impedance bandwidth at -10 dB, and
the radiation efficiency is shown in Table 5.1. It can be seen from Table 5.1 that all of
the three miniature implantable antennas resonate at 2.46 GHz with negligible differ-
ences in the radiation efficiencies which ranged from 10.34% (for Antenna-3) to 11.00%
(for Antenna-2). Moreover, there are also small differences in the gains of the anten-
nas which ranged from -6.37 dB (for Antenna-1) to -7.04 dB (for Antenna-3). On the
other hand, the impedance bandwidth at -10 dB of Antenna-1 has a value of 222 MHz
which is significantly higher than the impedance bandwidths of 159 MHz and 132 MHz
of Antenna-2 and Antenna-3, respectively. In addition, Antenna-1 has a better S11 of

157
-16.07 dB when compared to the -12.27 dB and -12.60 dB magnitudes of the reflection
coefficients of Antenna-2 and Antenna-3, respectively. Hence, Antenna-1 is chosen as
the optimised implantable miniature microstrip ring disk antenna with α = 3.81 radian,
εrs = 3.0, and εre = 3.5. The wide impedance bandwidth of Antenna-1 means that the
implanted antenna will still have a minimum S11 of -10 dB even if there is a shift in
the operating frequency (i.e., 2.45 ± 0.11 GHz). The magnitude of the reflection coef-
Table 5.1: Performance of three miniature microstrip ring disk antennas implanted inhuman tissue.
Antenna fr S11 Gain Imp. BW? Rad. Eff.†α(rad.)/εrs/εre (GHz) (dB) (dB) (MHz) (%)
Antenna-1 2223.81/3.0/3.5 2.46 -16.07 -6.37 (9.02%) 10.88
Antenna-2 1594.17/2.0/3.5 2.46 -12.27 -6.62 (6.50 %) 11.00
Antenna-3 1324.89/2.1/2.3 2.46 -12.60 -7.04 (5.4%) 10.34
?Impedance bandwidth at -10 dB, †Radiation Efficiency.
ficient, the electric field distribution, and the far-field pattern of the optimised miniature
microstrip ring disk antenna (Antenna-1) implanted in a small cube of human tissue are
shown in Fig. 5.16, Fig. 5.17, and Fig. 5.18, respectively. It can be seen from Fig. 5.16
that the antenna resonates at 2.46 GHz with an S11 of -16.04 dB and an impedance
bandwidth of 222 MHz. On the other hand, Fig. 5.17 of the electric field distribution
in the vicinity Antenna-1 in human tissue shows that there is high intensity of the elec-
tric field around the annular ring of the disk antenna, and also shows that this electric
field distribution is similar to the field distribution of the encased antenna in free space
(c.f. Fig. 5.12). The similarity between the electric field distributions of the encased
microstrip ring disk antenna in human tissue and in free space implies that the antennas
will have similar far-field patterns.
However, Fig. 5.18 shows that the far-field pattern (at 2.45 GHz) of Antenna-1 in
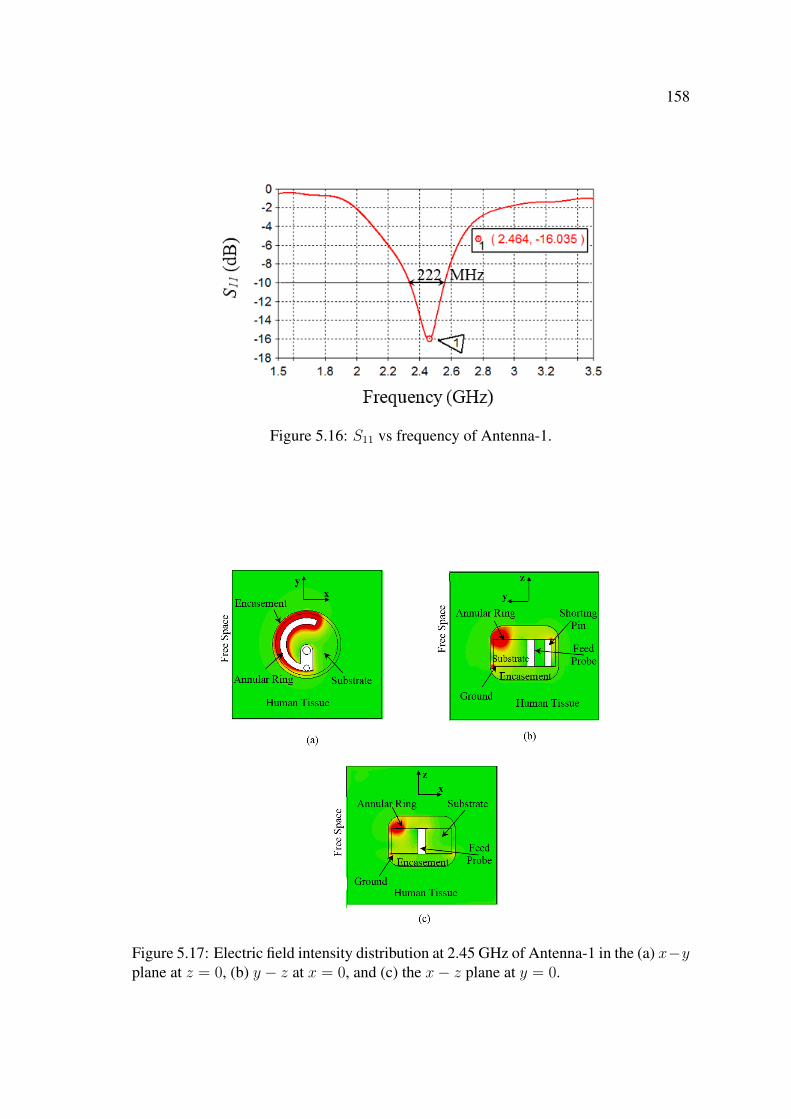
158
Figure 5.16: S11 vs frequency of Antenna-1.
Figure 5.17: Electric field intensity distribution at 2.45 GHz of Antenna-1 in the (a) x−yplane at z = 0, (b) y − z at x = 0, and (c) the x− z plane at y = 0.
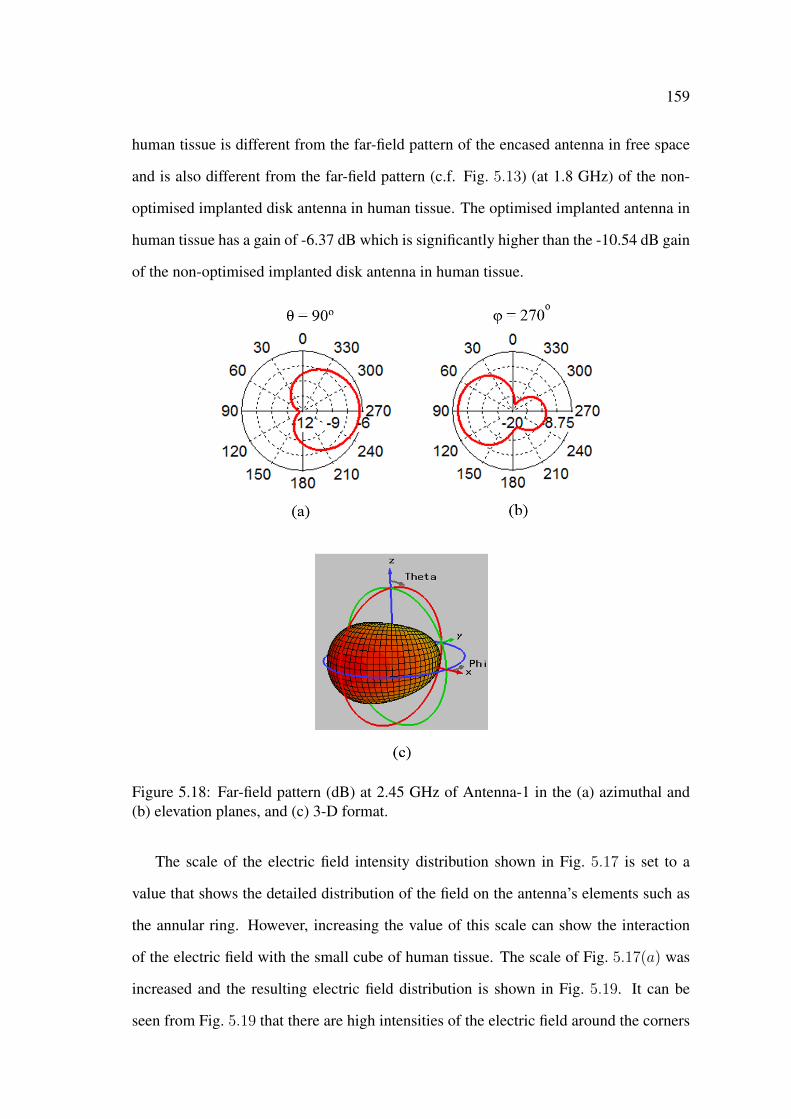
159
human tissue is different from the far-field pattern of the encased antenna in free space
and is also different from the far-field pattern (c.f. Fig. 5.13) (at 1.8 GHz) of the non-
optimised implanted disk antenna in human tissue. The optimised implanted antenna in
human tissue has a gain of -6.37 dB which is significantly higher than the -10.54 dB gain
of the non-optimised implanted disk antenna in human tissue.
Figure 5.18: Far-field pattern (dB) at 2.45 GHz of Antenna-1 in the (a) azimuthal and(b) elevation planes, and (c) 3-D format.
The scale of the electric field intensity distribution shown in Fig. 5.17 is set to a
value that shows the detailed distribution of the field on the antenna’s elements such as
the annular ring. However, increasing the value of this scale can show the interaction
of the electric field with the small cube of human tissue. The scale of Fig. 5.17(a) was
increased and the resulting electric field distribution is shown in Fig. 5.19. It can be
seen from Fig. 5.19 that there are high intensities of the electric field around the corners

160
of the small cube of human tissue which can have a focusing effect on the radiated
electromagnetic signal from the implanted antenna. This focusing effect can increase
the gain of the antenna in the -y direction and can affect the accuracy of the results
pertaining to the gain of the implanted miniature disk antenna in human tissue.
Figure 5.19: Electric field intensity distribution at 2.45 GHz in the x − y plane atz = 0in the vicinity of Antenna-1 in the small cube of human tissue.
Optimised Miniature Encased Microstrip Ring Disk Antenna in Hu-
man Tissue
Cross sectional views of the CST model of the implanted miniature encased microstrip
disk antenna in a large cube of human tissue are shown in Fig. 5.20. The optimised
miniature disk antenna (Antenna-1) is located at a distance of 6.5 mm from the outer
surface of a 500-mm cube of human tissue as can be seen from Figs. 5.20(a) and (b).
The human tissue has a relative dielectric constant εrt and a loss tangent tan δt of 52.73
and 0.242, respectively. The magnitude of the reflection coefficient S11 of the implanted
miniature encased microstrip ring disk antenna in the large cube of human tissue is
shown in Fig. 5.21. The implanted antenna in the large cube of human tissue has a
lower resonant frequency of 2.34 GHz when compared to the 2.46 GHz resonant fre-
quency of the same implanted antenna in the small cube of human tissue. The increase
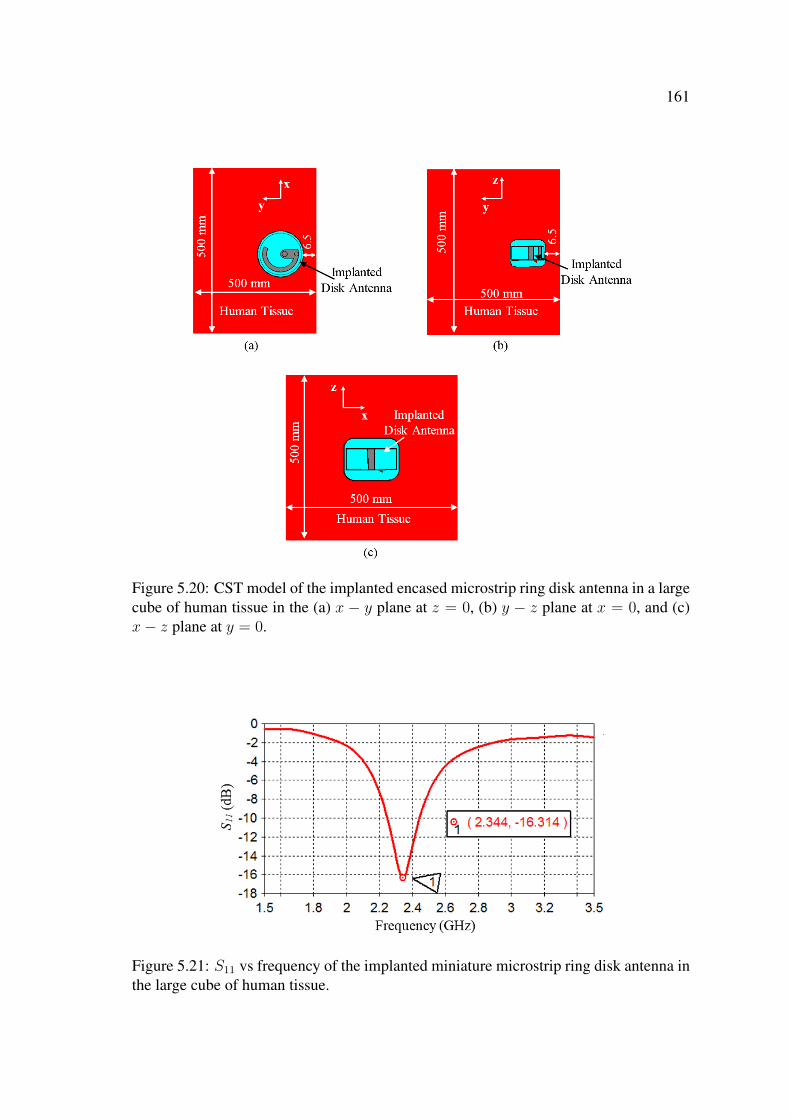
161
Figure 5.20: CST model of the implanted encased microstrip ring disk antenna in a largecube of human tissue in the (a) x − y plane at z = 0, (b) y − z plane at x = 0, and (c)x− z plane at y = 0.
Figure 5.21: S11 vs frequency of the implanted miniature microstrip ring disk antenna inthe large cube of human tissue.

162
in the size of the human tissue has increased the dielectric loading on the implanted an-
tenna and resulted in the further reduction in fr. On the other hand, it can be seen from
Fig. 5.21 that the large cube of human tissue has a negligible effect on the magnitude of
the reflection coefficient S11 which has a value of -16.04 dB.
The electric field distribution of the implanted miniature disk antenna in the large
cube of human tissue is shown in Fig. 5.22. It can be seen from Figs. 5.22(a) and (b)
that the implanted antenna radiates an electromagnetic signal that propagates through
the tissue-air interface and into free space along the -y axis. It can also be seen from
Fig. 5.22(c) that some of the radiated electromagnetic signal is along the x and z axes,
however, due to the high losses in human tissue this signal gets significantly attenuated
and does not propagate into free space.
Figure 5.22: Electric field intensity distribution at 2.45 GHz of the optimised implantedminiature microstrip ring disk antenna in the large cube of human tissue in the (a) x− yplane at z = 0, (b) y − z at x = 0, and (c) the x− z plane at y = 0.
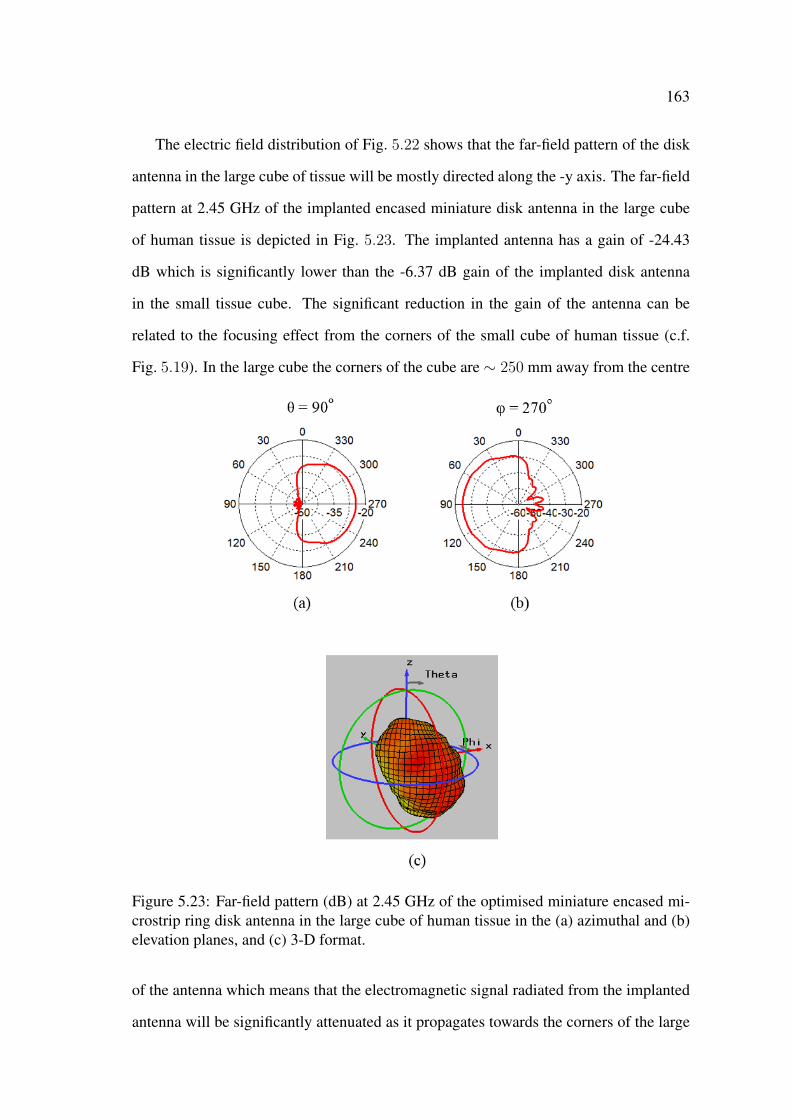
163
The electric field distribution of Fig. 5.22 shows that the far-field pattern of the disk
antenna in the large cube of tissue will be mostly directed along the -y axis. The far-field
pattern at 2.45 GHz of the implanted encased miniature disk antenna in the large cube
of human tissue is depicted in Fig. 5.23. The implanted antenna has a gain of -24.43
dB which is significantly lower than the -6.37 dB gain of the implanted disk antenna
in the small tissue cube. The significant reduction in the gain of the antenna can be
related to the focusing effect from the corners of the small cube of human tissue (c.f.
Fig. 5.19). In the large cube the corners of the cube are ∼ 250 mm away from the centre
Figure 5.23: Far-field pattern (dB) at 2.45 GHz of the optimised miniature encased mi-crostrip ring disk antenna in the large cube of human tissue in the (a) azimuthal and (b)elevation planes, and (c) 3-D format.
of the antenna which means that the electromagnetic signal radiated from the implanted
antenna will be significantly attenuated as it propagates towards the corners of the large
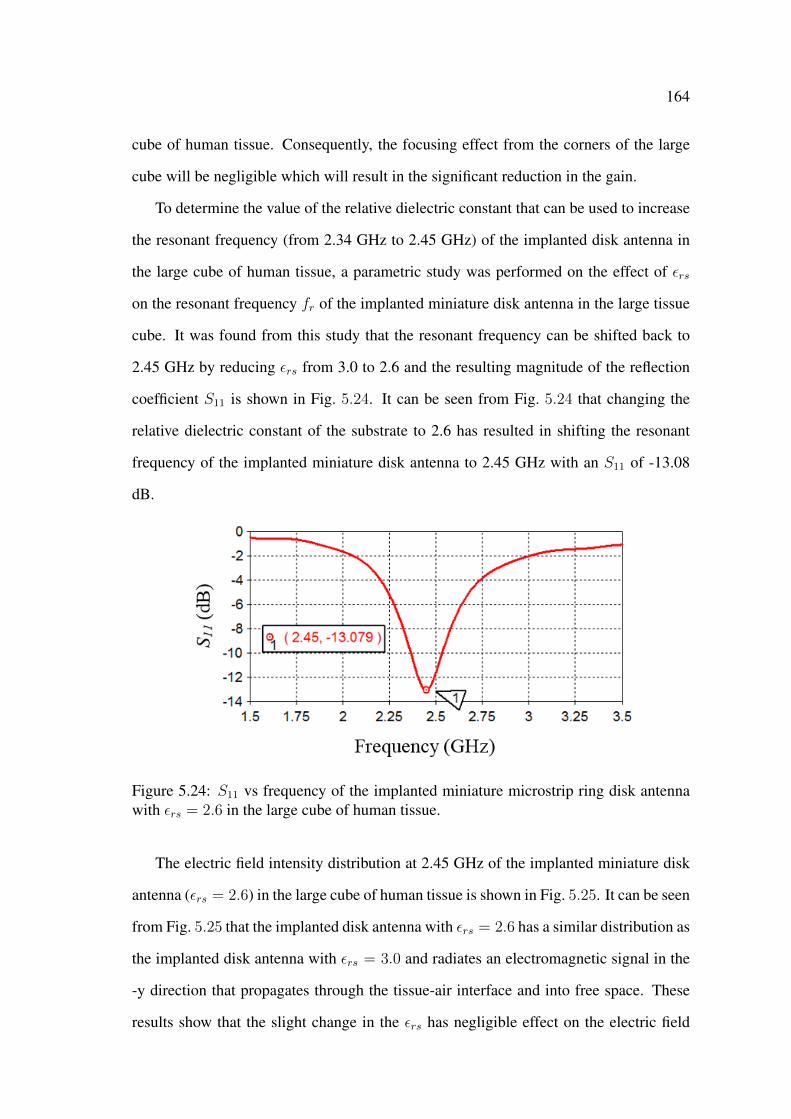
164
cube of human tissue. Consequently, the focusing effect from the corners of the large
cube will be negligible which will result in the significant reduction in the gain.
To determine the value of the relative dielectric constant that can be used to increase
the resonant frequency (from 2.34 GHz to 2.45 GHz) of the implanted disk antenna in
the large cube of human tissue, a parametric study was performed on the effect of εrs
on the resonant frequency fr of the implanted miniature disk antenna in the large tissue
cube. It was found from this study that the resonant frequency can be shifted back to
2.45 GHz by reducing εrs from 3.0 to 2.6 and the resulting magnitude of the reflection
coefficient S11 is shown in Fig. 5.24. It can be seen from Fig. 5.24 that changing the
relative dielectric constant of the substrate to 2.6 has resulted in shifting the resonant
frequency of the implanted miniature disk antenna to 2.45 GHz with an S11 of -13.08
dB.
Figure 5.24: S11 vs frequency of the implanted miniature microstrip ring disk antennawith εrs = 2.6 in the large cube of human tissue.
The electric field intensity distribution at 2.45 GHz of the implanted miniature disk
antenna (εrs = 2.6) in the large cube of human tissue is shown in Fig. 5.25. It can be seen
from Fig. 5.25 that the implanted disk antenna with εrs = 2.6 has a similar distribution as
the implanted disk antenna with εrs = 3.0 and radiates an electromagnetic signal in the
-y direction that propagates through the tissue-air interface and into free space. These
results show that the slight change in the εrs has negligible effect on the electric field
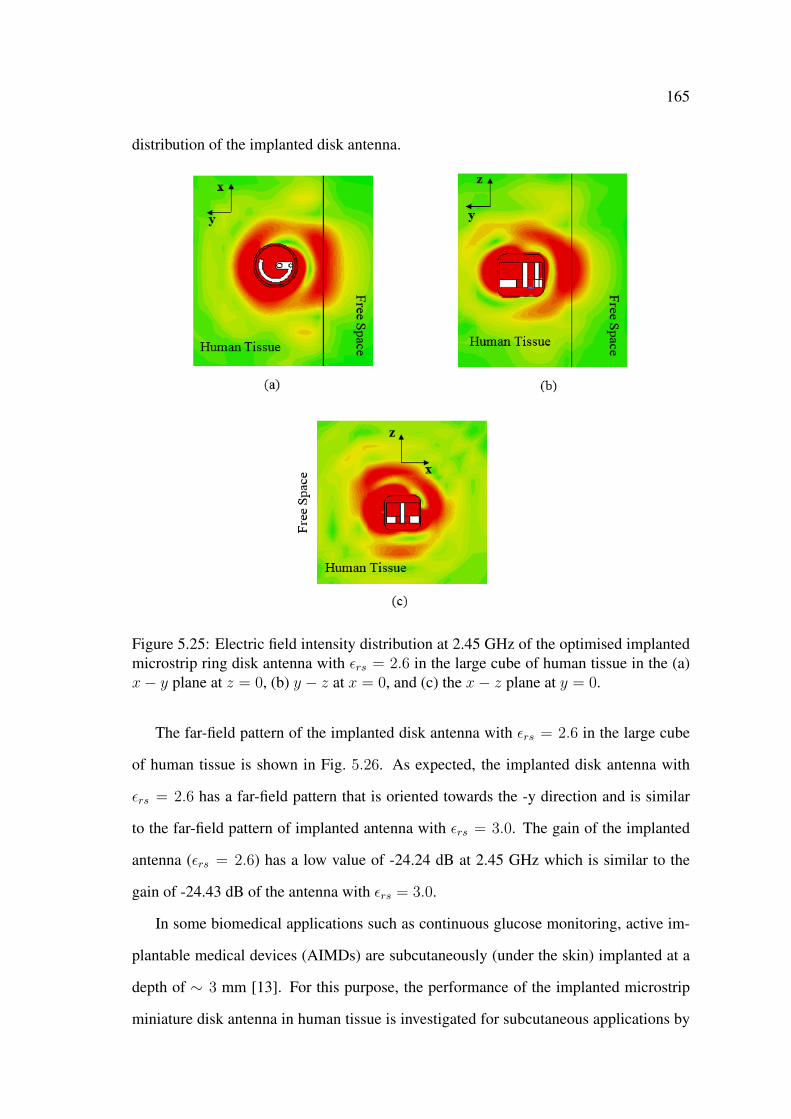
165
distribution of the implanted disk antenna.
Figure 5.25: Electric field intensity distribution at 2.45 GHz of the optimised implantedmicrostrip ring disk antenna with εrs = 2.6 in the large cube of human tissue in the (a)x− y plane at z = 0, (b) y − z at x = 0, and (c) the x− z plane at y = 0.
The far-field pattern of the implanted disk antenna with εrs = 2.6 in the large cube
of human tissue is shown in Fig. 5.26. As expected, the implanted disk antenna with
εrs = 2.6 has a far-field pattern that is oriented towards the -y direction and is similar
to the far-field pattern of implanted antenna with εrs = 3.0. The gain of the implanted
antenna (εrs = 2.6) has a low value of -24.24 dB at 2.45 GHz which is similar to the
gain of -24.43 dB of the antenna with εrs = 3.0.
In some biomedical applications such as continuous glucose monitoring, active im-
plantable medical devices (AIMDs) are subcutaneously (under the skin) implanted at a
depth of ∼ 3 mm [13]. For this purpose, the performance of the implanted microstrip
miniature disk antenna in human tissue is investigated for subcutaneous applications by
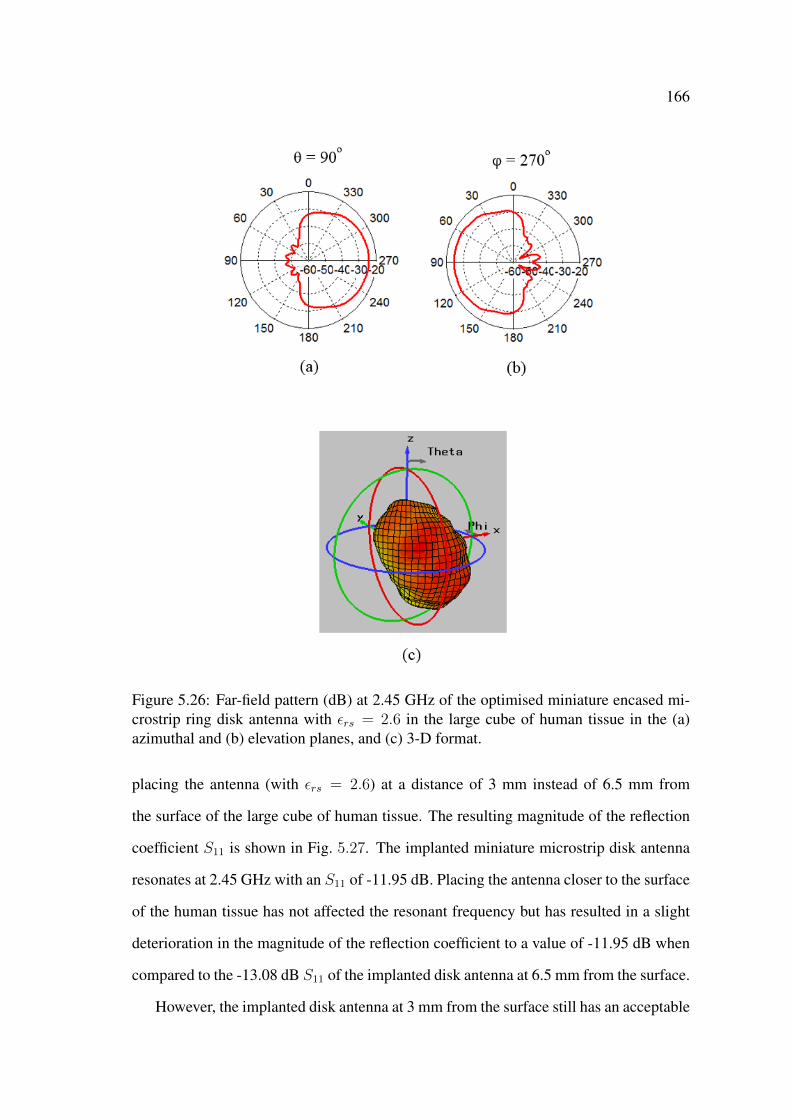
166
Figure 5.26: Far-field pattern (dB) at 2.45 GHz of the optimised miniature encased mi-crostrip ring disk antenna with εrs = 2.6 in the large cube of human tissue in the (a)azimuthal and (b) elevation planes, and (c) 3-D format.
placing the antenna (with εrs = 2.6) at a distance of 3 mm instead of 6.5 mm from
the surface of the large cube of human tissue. The resulting magnitude of the reflection
coefficient S11 is shown in Fig. 5.27. The implanted miniature microstrip disk antenna
resonates at 2.45 GHz with an S11 of -11.95 dB. Placing the antenna closer to the surface
of the human tissue has not affected the resonant frequency but has resulted in a slight
deterioration in the magnitude of the reflection coefficient to a value of -11.95 dB when
compared to the -13.08 dB S11 of the implanted disk antenna at 6.5 mm from the surface.
However, the implanted disk antenna at 3 mm from the surface still has an acceptable
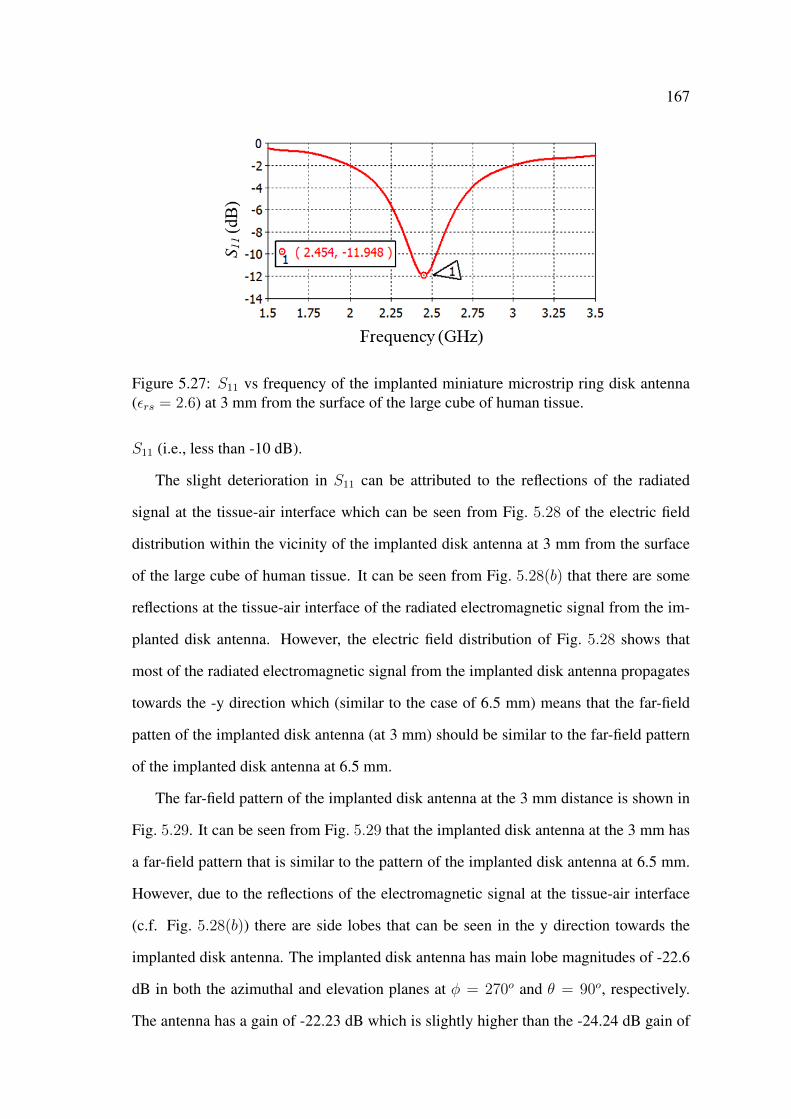
167
Figure 5.27: S11 vs frequency of the implanted miniature microstrip ring disk antenna(εrs = 2.6) at 3 mm from the surface of the large cube of human tissue.
S11 (i.e., less than -10 dB).
The slight deterioration in S11 can be attributed to the reflections of the radiated
signal at the tissue-air interface which can be seen from Fig. 5.28 of the electric field
distribution within the vicinity of the implanted disk antenna at 3 mm from the surface
of the large cube of human tissue. It can be seen from Fig. 5.28(b) that there are some
reflections at the tissue-air interface of the radiated electromagnetic signal from the im-
planted disk antenna. However, the electric field distribution of Fig. 5.28 shows that
most of the radiated electromagnetic signal from the implanted disk antenna propagates
towards the -y direction which (similar to the case of 6.5 mm) means that the far-field
patten of the implanted disk antenna (at 3 mm) should be similar to the far-field pattern
of the implanted disk antenna at 6.5 mm.
The far-field pattern of the implanted disk antenna at the 3 mm distance is shown in
Fig. 5.29. It can be seen from Fig. 5.29 that the implanted disk antenna at the 3 mm has
a far-field pattern that is similar to the pattern of the implanted disk antenna at 6.5 mm.
However, due to the reflections of the electromagnetic signal at the tissue-air interface
(c.f. Fig. 5.28(b)) there are side lobes that can be seen in the y direction towards the
implanted disk antenna. The implanted disk antenna has main lobe magnitudes of -22.6
dB in both the azimuthal and elevation planes at φ = 270o and θ = 90o, respectively.
The antenna has a gain of -22.23 dB which is slightly higher than the -24.24 dB gain of
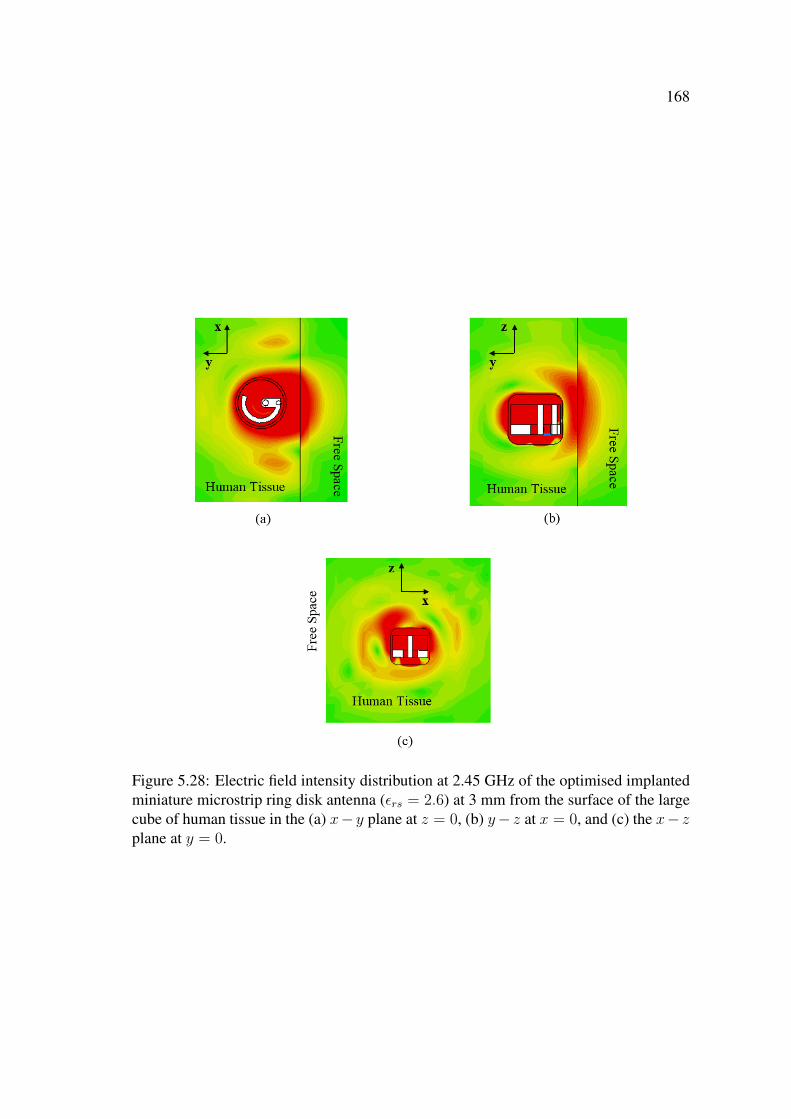
168
Figure 5.28: Electric field intensity distribution at 2.45 GHz of the optimised implantedminiature microstrip ring disk antenna (εrs = 2.6) at 3 mm from the surface of the largecube of human tissue in the (a) x− y plane at z = 0, (b) y− z at x = 0, and (c) the x− zplane at y = 0.

169
the implanted disk antenna at 6.5 mm. The increase in the gain of the disk antenna (at 3
mm) is related to the shorter implantation distance.
Figure 5.29: Far-field pattern (dB) at 2.45 GHz of the implanted miniature encased mi-crostrip ring disk antenna (εrs = 2.6) at 3.0 mm from the surface of the large cube ofhuman tissue in the (a) azimuthal and (b) elevation planes, and (c) 3-D format.
5.6 Conclusion
In this chapter, simulation models of a miniature microstrip ring disk antenna were cre-
ated in CST MWS. The microstrip ring disk antenna had a 5.88 radian annular ring that
was imprinted on a disk substrate with a relative dielectric constant εrs of 3.5. The minia-
ture microstrip disk antenna resonated at 2.63 GHz with a magnitude of the reflection
coefficient S11 of -2.46 dB in free space. To isolate the miniature disk antenna from
170
the lossy human tissue it was enclosed inside a dielectric encasement that had a relative
dielectric constant of 3.5. The encased miniature microstrip ring disk antenna resonated
at 2.23 GHz with an S11 of -2.77 dB. The reduction in the resonant frequency of the
encased miniature disk antenna is due to the dielectric loading of the encasement.
The encased antenna was then implanted inside a small cube (24 mm) of human
tissue which had a significant effect on the resonant frequency of the implanted antenna.
The implanted encased disk antenna in the small cube of human tissue resonated at 1.79
GHz with an S11 of -9.49 dB. A parametric study was performed on the effect of the
design parameters which included the length of the annular ring α, the relative dielectric
constant of the substrate εrs, and the relative dielectric constant of the encasement εre
on the resonant frequency fr and the magnitude of the reflection coefficient S11 of the
implanted miniature disk antenna in human tissue. The results of the parametric study
showed that the resonant frequency of the implanted disk antenna can be increased by
reducing the length of the annular ring α or by reducing either the relative dielectric
constant of the substrate and/or the relative dielectric constant of the encasement. The
performance of the implanted disk antenna was optimised by reducing the length of the
annular ring to 3.81 radian and by reducing εrs to 3.0, which resulted in a shift in the
resonant frequency to 2.45 GHz with a magnitude of the reflection coefficient S11 of
-16.04 dB. The optimised antenna had a gain of -6.37 dB which is higher than the -9.49
dB gain of the non-optimised antenna.
The electric field distribution of the optimised implanted disk antenna in the small
cube of human tissue showed that there are some scattering of the electric field from
corners of the small cube which may have a focusing effect that will affect the accuracy
of the simulation results. The scattering effect was removed by implanting the optimised
miniature microstrip ring disk antenna in a large (500-mm) cube of human tissue at a
distance of 6.5 mm from the surface of the cube. The optimised implanted disk antenna
in the large cube of human tissue resonated at a lower (than 2.45 GHz in the small cube)
frequency of 2.34 GHz with an S11 of -16.31 dB. The implanted miniature disk antenna
171
had a significantly less gain of -24.24 dB when compared to the -6.37 dB gain of the
implanted disk antenna in the small cube of human tissue. The significant reduction in
the gain of the implanted antenna in the large cube of human tissue was attributed to a
focusing effect that was only seen at the corners of the small cube of human tissue. The
resonant frequency of the implanted miniature disk antenna in the large cube of human
tissue was restored to 2.45 GHz with an S11 of -13.08 dB by reducing (from εrs = 3.0)
the relative dielectric constant of the substrate to a value of 2.6.
The performance of the optimised implanted miniature microstrip ring disk antenna
(with εrs = 2.6) was investigated for subcutaneous applications by moving the implanted
disk antenna to a distance of 3 mm from the surface of the large cube of human tissue.
The results of this investigation showed that the implanted disk antenna (at 3 mm) res-
onated at 2.45 GHz with an acceptable S11 of -11.95 dB. The implanted antenna at 3 mm
had a gain of -22.23 dB which was slightly higher than the gain of the implanted antenna
at the distance of 6.5 mm.
A miniature microstrip ring disk antenna was encased and implanted in human tissue.
The antenna has a miniature size and geometry that makes it suitable for implantable
biomedical applications such as nerve stimulation. Design parameters were identified
and used to optimise the performance of the implanted miniature encased microstrip
ring disk antenna in human tissue at 2.45 GHz in the ISM band. The implanted miniature
disk antenna in the large cube of human tissue had a gain of -22.23 dB. The low gain
may indicate that the miniature encased disk antenna may have a poor performance in
human tissue. However, since the miniature disk antenna is intended to be used for
microwave wireless power transmission, the receiving performance of this antenna and
its capability to be used as part of a microwave wireless power transmission technique
has to be investigated.
Chapter 6
Microwave Wireless Power
Transmission Techniques with
Miniature Encased Microstrip Ring
Disk Antenna
6.1 Introduction
The implantable miniature encased microstrip ring disk antenna designed in Chapter 5
is of suitable size and geometry to be used for implantable applications. In this chap-
ter the performance of microwave wireless power transmission to the miniature encased
microstrip ring disk antenna is investigated in human tissue at 2.45 GHz. Furthermore,
a two-antenna setup is used to investigate the capability of a microwave wireless power
transmission technique to deliver an electrical stimulus that can be used for nerve stim-
ulation while having a specific absorption rate that conforms with IEEE standards.

173
6.2 Simulation Approach
In this chapter, CST Microwave Studio is used to investigate and optimise the electro-
magnetic performance of microwave wireless power transmission at 2.45 GHz in hu-
man tissue. The performance, and particularly the efficiency, of the microwave wireless
power transmission technique in human tissue depends on the performance of both the
implanted and the external antennas, their matching in terms of the electric field polar-
isation vectors and the radiation patterns, the electrical dimensions of the antennas and
the distance between them, and the electrical properties of human tissue.
The goal is to optimise the efficiency of the entire technique by controlling both the
implanted and external antennas such that their electromagnetic performances including
the resonant frequencies and far-field patterns are symmetric even if the antennas are of
different sizes and geometries. First, a plane wave approximation for a linear polarised
external antenna is used to identify the optimum location and orientation of the external
antenna with respect to the implanted antenna. Second, a two-antenna setup that includes
the implantable miniature microstrip ring disk antenna in human tissue and an external
antenna in free space is proposed and investigated. Third, a parametric variability is
performed on the two-antenna setup to ensure that in practice, a reliable performance of
the wireless power transmission technique that corresponds to the design performance
can be achieved. Fourth, a computational model of a measurement system to charac-
terise microwave wireless power transmission techniques in human tissue is proposed
and used. Finally, the capability of the wireless power transmission technique to deliver
an electrical stimulus that can be used for nerve stimulation while conforming with the
IEEE safety standards is also investigated. To reduce the simulation time, the first, sec-
ond, and third steps are done using a small cube of human tissue. On the other hand, to
provide a more practical approximation of the human body, the fourth and the last steps
are done with a large cube of human tissue.
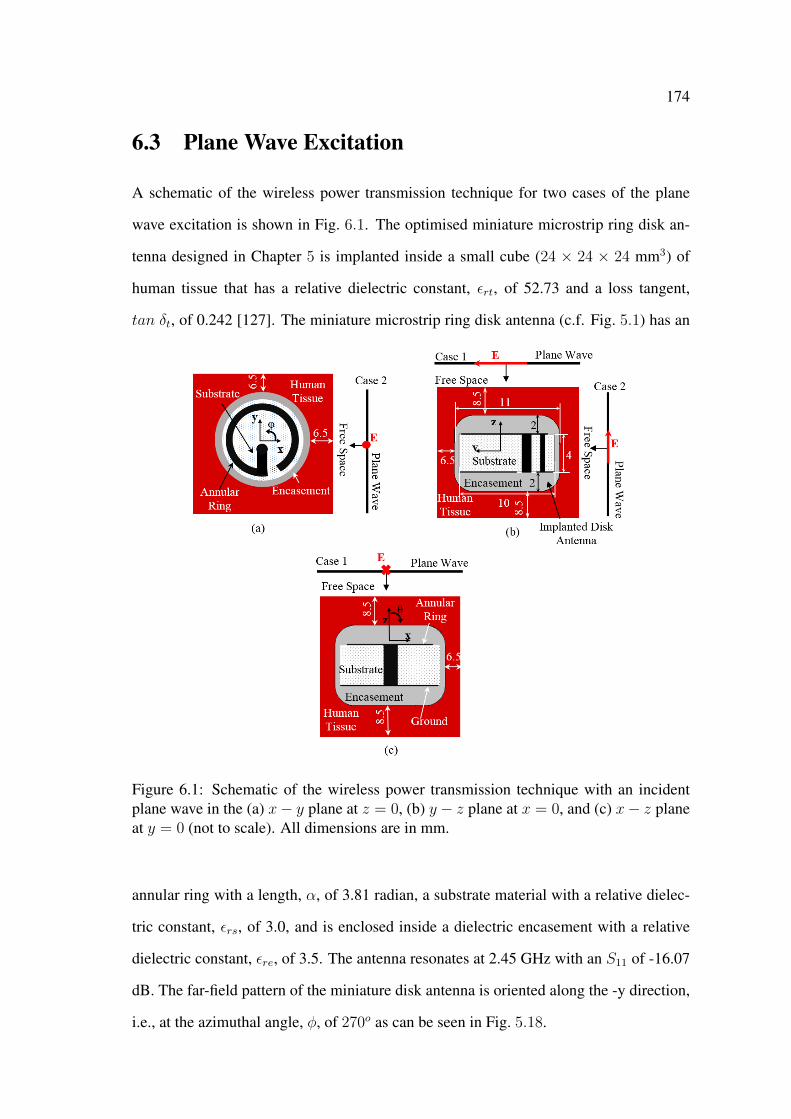
174
6.3 Plane Wave Excitation
A schematic of the wireless power transmission technique for two cases of the plane
wave excitation is shown in Fig. 6.1. The optimised miniature microstrip ring disk an-
tenna designed in Chapter 5 is implanted inside a small cube (24 × 24 × 24 mm3) of
human tissue that has a relative dielectric constant, εrt, of 52.73 and a loss tangent,
tan δt, of 0.242 [127]. The miniature microstrip ring disk antenna (c.f. Fig. 5.1) has an
Figure 6.1: Schematic of the wireless power transmission technique with an incidentplane wave in the (a) x− y plane at z = 0, (b) y − z plane at x = 0, and (c) x− z planeat y = 0 (not to scale). All dimensions are in mm.
annular ring with a length, α, of 3.81 radian, a substrate material with a relative dielec-
tric constant, εrs, of 3.0, and is enclosed inside a dielectric encasement with a relative
dielectric constant, εre, of 3.5. The antenna resonates at 2.45 GHz with an S11 of -16.07
dB. The far-field pattern of the miniature disk antenna is oriented along the -y direction,
i.e., at the azimuthal angle, φ, of 270o as can be seen in Fig. 5.18.
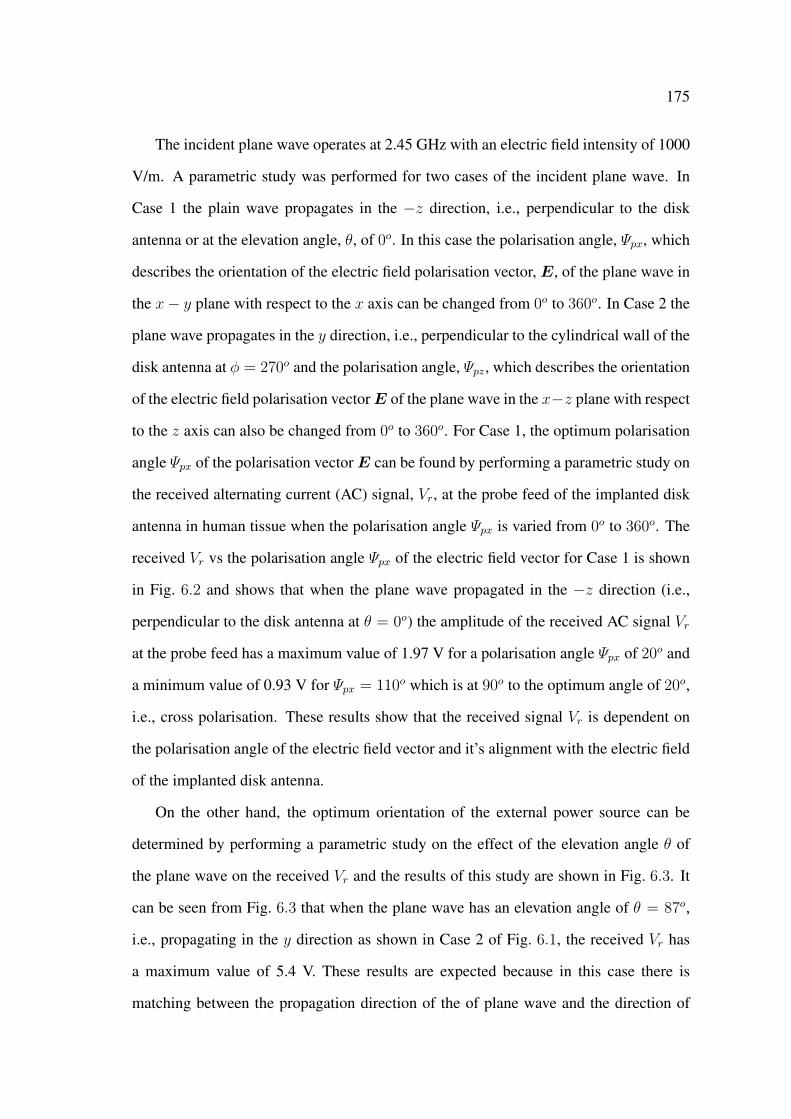
175
The incident plane wave operates at 2.45 GHz with an electric field intensity of 1000
V/m. A parametric study was performed for two cases of the incident plane wave. In
Case 1 the plain wave propagates in the −z direction, i.e., perpendicular to the disk
antenna or at the elevation angle, θ, of 0o. In this case the polarisation angle, Ψpx, which
describes the orientation of the electric field polarisation vector, E, of the plane wave in
the x− y plane with respect to the x axis can be changed from 0o to 360o. In Case 2 the
plane wave propagates in the y direction, i.e., perpendicular to the cylindrical wall of the
disk antenna at φ = 270o and the polarisation angle, Ψpz, which describes the orientation
of the electric field polarisation vectorE of the plane wave in the x−z plane with respect
to the z axis can also be changed from 0o to 360o. For Case 1, the optimum polarisation
angle Ψpx of the polarisation vectorE can be found by performing a parametric study on
the received alternating current (AC) signal, Vr, at the probe feed of the implanted disk
antenna in human tissue when the polarisation angle Ψpx is varied from 0o to 360o. The
received Vr vs the polarisation angle Ψpx of the electric field vector for Case 1 is shown
in Fig. 6.2 and shows that when the plane wave propagated in the −z direction (i.e.,
perpendicular to the disk antenna at θ = 0o) the amplitude of the received AC signal Vr
at the probe feed has a maximum value of 1.97 V for a polarisation angle Ψpx of 20o and
a minimum value of 0.93 V for Ψpx = 110o which is at 90o to the optimum angle of 20o,
i.e., cross polarisation. These results show that the received signal Vr is dependent on
the polarisation angle of the electric field vector and it’s alignment with the electric field
of the implanted disk antenna.
On the other hand, the optimum orientation of the external power source can be
determined by performing a parametric study on the effect of the elevation angle θ of
the plane wave on the received Vr and the results of this study are shown in Fig. 6.3. It
can be seen from Fig. 6.3 that when the plane wave has an elevation angle of θ = 87o,
i.e., propagating in the y direction as shown in Case 2 of Fig. 6.1, the received Vr has
a maximum value of 5.4 V. These results are expected because in this case there is
matching between the propagation direction of the of plane wave and the direction of
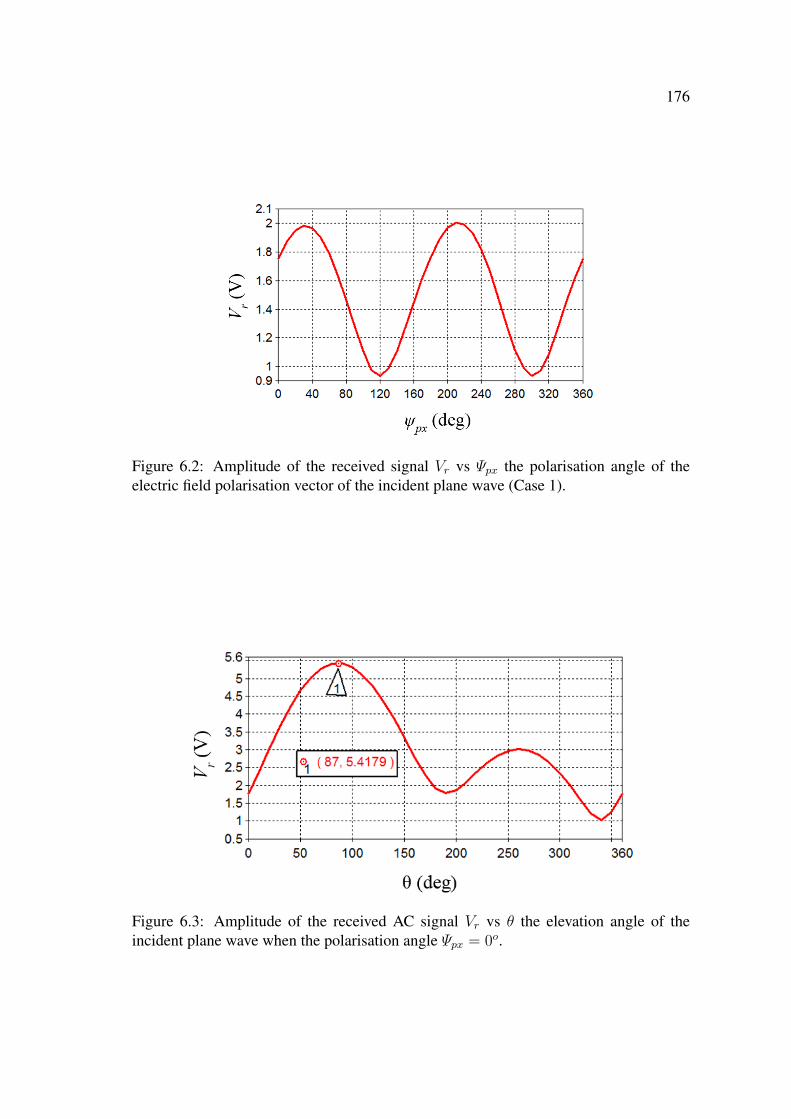
176
Figure 6.2: Amplitude of the received signal Vr vs Ψpx the polarisation angle of theelectric field polarisation vector of the incident plane wave (Case 1).
Figure 6.3: Amplitude of the received AC signal Vr vs θ the elevation angle of theincident plane wave when the polarisation angle Ψpx = 0o.

177
the far-field pattern of the implanted disk antenna (c.f. Fig. 5.18). Fig. 6.4 shows the
effect of the polarisation angle Ψpz on Vr for Case 2 where it can be seen that Vr has a
maximum value of 5.8 V at Ψpz = 20o and a minimum value of 0.53 V at Ψpz = 110o
(cross polarisation). Nevertheless, it can also be seen from Fig. 6.4 that at Ψpz = 0
Vr still has a high value of 5.4 V and indicates that wireless power transmission can
still be achieved under slight misalignment between the external power source and the
implanted disk antenna. However, the aforementioned results show that to achieve an
efficient wireless power transmission technique, the polarisation angle of the electric
field vector E and the direction of the radiated electromagnetic signal from the external
power source have to match the polarisation angle of the electric vector and the direction
of the far-field pattern of the implanted disk antenna in human tissue.
Figure 6.4: Amplitude of the received AC signal Vr vs Ψpz the polarisation angle of theelectric field polarisation vector of the incident plane wave (Case 2).
6.4 Microwave Technique with Two-Antenna Setup
In this section, the electromagnetic performance of microwave wireless power transmis-
sion technique with two-antenna setup is investigated in human tissue. Since there is no
restriction on the size of the external antenna, in this investigation a large (relative to the
miniature implanted disk antenna) external antenna can be used as the external power

178
source. For this purpose, the 50 × 50 × 1.5 mm3 microstrip rectangular patch (29 × 35
mm2) antenna that was designed and investigated in Chapter 3 is used. To match the
resonant frequency of the external patch antenna to the 2.45 GHz resonant frequency of
the implanted disk antenna, the relative dielectric constant of the patch antenna’s sub-
strate was changed to 4.5 (was 4.3 in Chapter 3) with a loss tangent tan δ of 0.001.
The magnitude of the reflection coefficient S11 of the external patch antenna is shown in
Fig. 6.5 where it can be seen that the external antenna resonates at 2.45 GHz with an S11
of -33.41 dB. The external patch antenna has a gain of 2.39 dB and radiates a linearly
Figure 6.5: S11 vs frequency of the external rectangular microstrip patch antenna in freespace.
polarised microwave signal in the direction that is perpendicular to its patch. That is, it
has a far-field pattern similar to that depicted in Fig. 3.13, and means that, similar to the
implanted disk antenna the external patch antenna has a directional far-field pattern.
CST models of the wireless power transmission technique with the two-antenna setup
for two orientations of the external patch antenna are shown in Fig. 6.6. In Fig. 6.6(a)
the external patch antenna is vertically aligned with the implanted antenna along the z
axis (at the elevation angle θ = 0o) and is located at the separation distance, d, of 50 mm
from the top surface of the human tissue. On the other hand, in Fig. 6.6(b) the external
patch antenna is horizontally aligned with the implanted antenna along the y axis (at the
elevation angle θ = 87o) and is also located at d = 50 mm.

179
Figure 6.6: CST models of the two-antenna setup with the external patch antenna at theelevation angle (a) θ = 0o and (b) θ = 87o (not to scale).

180
In the CST model the external patch antenna is connected to Port 1 and the implanted
disk antenna is connected to Port 2. The performance of the two-antenna setup can be
investigated by recording the full set of the S-parameters which include the magnitude
of the reflection coefficient, S11, of the external patch antenna, the magnitude of the
transmission coefficient, S12, the magnitude of the transmission coefficient, S21, and the
magnitude of the reflection coefficient, S22, of the implanted disk antenna. The magni-
tudes of the S-parameters for the two-antenna setup when the external patch antenna is
located at θ = 0o (c.f. Fig. 6.6(a)) are shown in Fig. 6.7. It can be seen from Fig. 6.7
that both antennas resonate at∼2.44 GHz with the external and implanted antennas hav-
ing magnitudes of the reflection coefficients S11 and S22 of -42.64 dB and -13.75 dB,
respectively. On the other hand, the magnitudes of the transmission coefficients S12 and
S21 have values of -34.79 dB and -34.51 dB, respectively.
Figure 6.7: Magnitudes of the S-parameters vs frequency for the two-antenna setup whenthe external patch antenna is placed at θ = 0o and located at the separation distance of50 mm.
The electric field distribution at 2.45 GHz in the y − z plane at x = 0 for the two-
antenna setup when the external antenna is transmitting and the implanted antenna is
receiving is shown in Fig. 6.8. It can be seen from Fig. 6.8 that there is a high intensity
electric field radiated from the external patch antenna towards the implanted disk an-
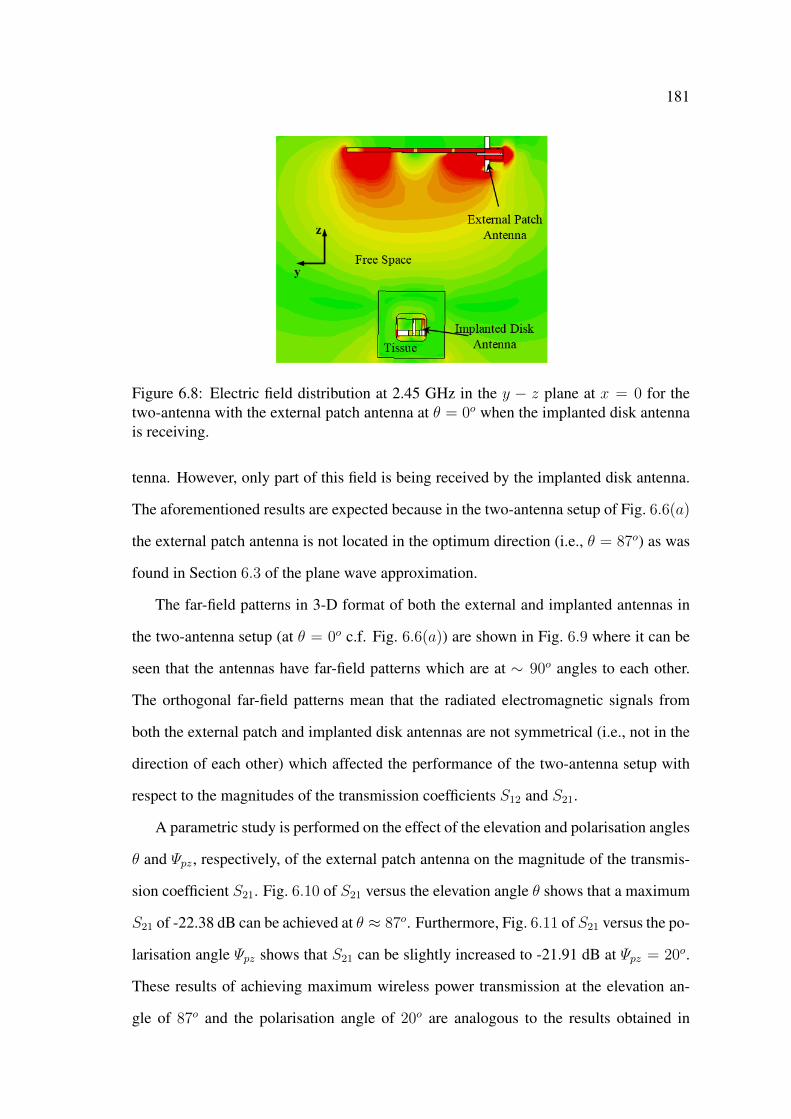
181
Figure 6.8: Electric field distribution at 2.45 GHz in the y − z plane at x = 0 for thetwo-antenna with the external patch antenna at θ = 0o when the implanted disk antennais receiving.
tenna. However, only part of this field is being received by the implanted disk antenna.
The aforementioned results are expected because in the two-antenna setup of Fig. 6.6(a)
the external patch antenna is not located in the optimum direction (i.e., θ = 87o) as was
found in Section 6.3 of the plane wave approximation.
The far-field patterns in 3-D format of both the external and implanted antennas in
the two-antenna setup (at θ = 0o c.f. Fig. 6.6(a)) are shown in Fig. 6.9 where it can be
seen that the antennas have far-field patterns which are at ∼ 90o angles to each other.
The orthogonal far-field patterns mean that the radiated electromagnetic signals from
both the external patch and implanted disk antennas are not symmetrical (i.e., not in the
direction of each other) which affected the performance of the two-antenna setup with
respect to the magnitudes of the transmission coefficients S12 and S21.
A parametric study is performed on the effect of the elevation and polarisation angles
θ and Ψpz, respectively, of the external patch antenna on the magnitude of the transmis-
sion coefficient S21. Fig. 6.10 of S21 versus the elevation angle θ shows that a maximum
S21 of -22.38 dB can be achieved at θ ≈ 87o. Furthermore, Fig. 6.11 of S21 versus the po-
larisation angle Ψpz shows that S21 can be slightly increased to -21.91 dB at Ψpz = 20o.
These results of achieving maximum wireless power transmission at the elevation an-
gle of 87o and the polarisation angle of 20o are analogous to the results obtained in
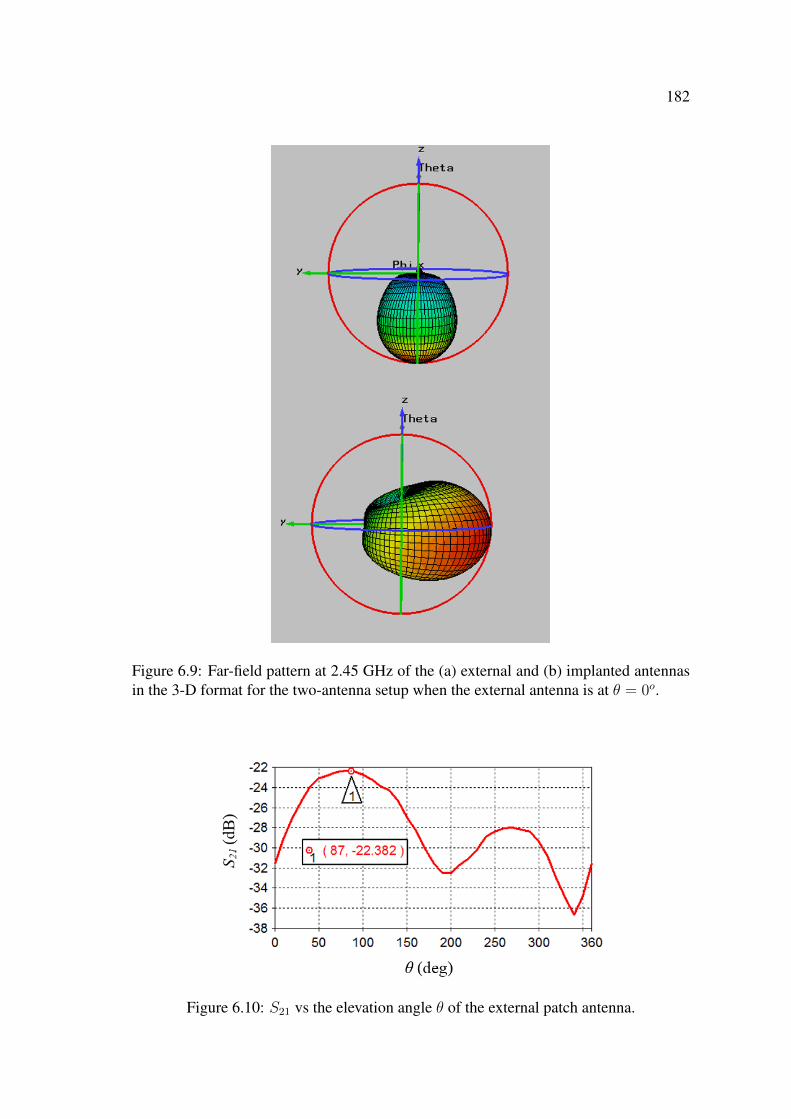
182
Figure 6.9: Far-field pattern at 2.45 GHz of the (a) external and (b) implanted antennasin the 3-D format for the two-antenna setup when the external antenna is at θ = 0o.
Figure 6.10: S21 vs the elevation angle θ of the external patch antenna.

183
Section 6.3 (c.f., Fig. 6.3 and Fig. 6.4, respectively).
Figure 6.11: S21 vs the polarisation angle Ψpz of the electric field polarisation vector ofthe external patch antenna placed at θ = 870.
The external patch antenna was placed at θ = 87o (c.f. Fig. 6.6(b)) and the resulting
magnitudes of the S-parameters are shown in Fig. 6.12 where it can be seen that both
antennas resonate at 2.44 GHz with an S11 and S22 of -33.42 dB and -13.09 dB, respec-
tively, which are similar to the resonant frequencies and the magnitudes of the reflection
coefficients of the two-antenna setup at θ = 0o. However, placing the external patch
antenna at θ = 87o has resulted in a significant increase in the magnitude of the trans-
mission coefficients S21 and S12 to a value of -21.99 dB when compared to the previous
values (c.f. Fig. 6.7) of ∼ −34.55 dB.
The effect of placing the external antenna at θ = 87o can also be seen in Fig. 6.13 of
the electric field distribution in the y−z plane at x = 0 of the two-antenna setup when the
external antenna is placed at θ = 87o. It can be seen from Fig. 6.13 that in this case the
received electric field in the vicinity of the implanted disk antenna is significantly higher
than the intensity of the field shown in Fig. 6.8, particularly, around the annular ring,
and most importantly, at the receiving end of the probe feed of the implanted microstrip
ring disk antenna. These results show that electromagnetic power has been wirelessly
transmitted from the external patch antenna and received by the implanted disk antenna.
The increase in the magnitudes of the transmission coefficients of the two-antenna

184
Figure 6.12: Magnitudes of the full S-parameters in dB vs frequency for the two-antennasetup when the external patch antenna is placed at θ = 87o and is located at the separationdistance of 50 mm.
Figure 6.13: Electric field distribution at 2.45 GHz in the y − z plane at x = 0 for thetwo-antenna setup with the external patch antenna at θ = 87o when the implanted diskantenna is receiving.
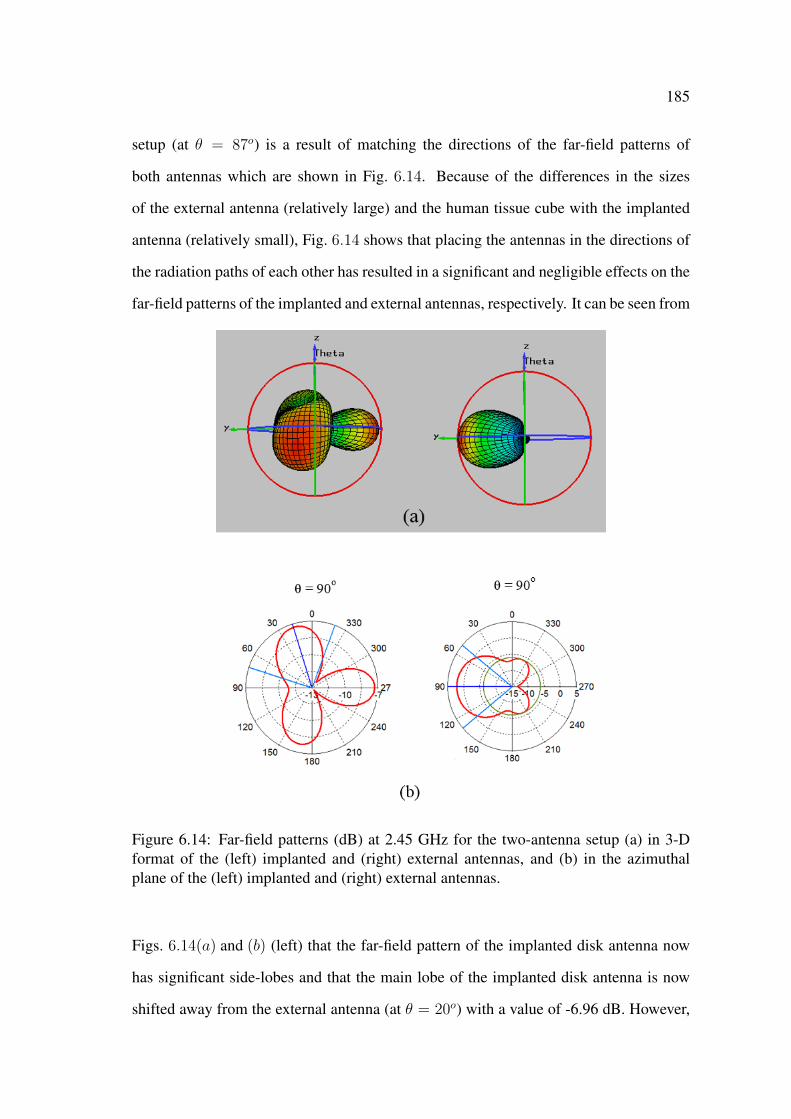
185
setup (at θ = 87o) is a result of matching the directions of the far-field patterns of
both antennas which are shown in Fig. 6.14. Because of the differences in the sizes
of the external antenna (relatively large) and the human tissue cube with the implanted
antenna (relatively small), Fig. 6.14 shows that placing the antennas in the directions of
the radiation paths of each other has resulted in a significant and negligible effects on the
far-field patterns of the implanted and external antennas, respectively. It can be seen from
Figure 6.14: Far-field patterns (dB) at 2.45 GHz for the two-antenna setup (a) in 3-Dformat of the (left) implanted and (right) external antennas, and (b) in the azimuthalplane of the (left) implanted and (right) external antennas.
Figs. 6.14(a) and (b) (left) that the far-field pattern of the implanted disk antenna now
has significant side-lobes and that the main lobe of the implanted disk antenna is now
shifted away from the external antenna (at θ = 20o) with a value of -6.96 dB. However,
186
the side-lobe at 270o (i.e., in the direction of the external antenna) has a comparable (to
the main-lobe) value of -7.36 dB. In this two-antenna setup the implanted and external
antennas have gains of -7.07 dB and 2.38 dB, respectively.
6.5 Sensitivity Study: Parametric Variability
The influence of human tissue on the wireless power transmission technique can be
demonstrated by the dependency of the magnitude of the transmission coefficient S21
on the electrical properties of human tissue, i.e., the relative dielectric constant εrt and
the loss tangent tan δt as shown in Fig. 6.15. It can be seen from Fig. 6.15 that S21
decreases with an increase in either εrt and/or tan δt. It can also be seen from Fig. 6.15
that at εrt ≈ 52 and tan δt ≈ 0.24 the transmission coefficient has an approximate value
of -22 dB which agrees with the results shown in Fig. 6.12 and shows that there is a
decrease in the efficiency of the wireless power transmission technique with the increase
in the relative dielectric constant and loss tangent of the human tissue. However, for the
maximum increase in the electrical properties (εrt = 54.8 and tan δt = 0.50) S21 has a
minimum acceptable value of -27.5 dB.
The ranges of the variations in the electrical properties (i.e., εrt, tan δt) chosen in this
investigation are of wider ranges than the ranges that can occur in practice. These wider
ranges are chosen to provide a thorough understanding of the performance of microwave
wireless power transmission technique in human tissue.
In practice, it is very important for the investigated two-antenna setup to have a sta-
ble and reliable performance that corresponds to the design performance which ensures a
reliable and robust performance of the wireless power transmission technique. There are
several sources of uncertainty that can affect the performance of the wireless power trans-
mission technique. Uncertainty can affect the applicability of the computational model,
and one of its sources in this context is parametric variability which comes from the vari-
ations in the parameters of the computational model. For example, the dimensions and

187
Figure 6.15: Magnitude of the transmission coefficient S21 in dB vs the relative dielectricconstant εrt of the human tissue at different values of the loss tangent tan δt.
electrical properties of the implanted antenna and the human tissue in the computational
model may not be exactly as designed and constructed, which would cause uncertainty
in the performance of the technique. The variations in the physical dimensions and the
electrical properties of the antenna can occur due to manufacturing errors and to toler-
ances in material specifications, respectively. The variations in the electrical (dielectric
and conducting) properties of the human tissue can be due to different conditions of the
human body, different human bodies and even different parts of the same human body.
Hence, a sensitivity study is performed to evaluate the changes in the performance of the
wireless power transmission technique due to these variations. This evaluation can be
done by investigating the effect of these variations on the resonant performance which
include the resonant frequency of the implanted disk antenna fr, the magnitude of the
reflection coefficient S22, and the magnitude of the transmission coefficient S21. The
ranges of the variations in the physical dimensions and the electrical properties of the
antenna can be anticipated from both machinery and material specifications. For ex-
ample, a typical specification of the relative dielectric constant of a substrate material
provides a tolerance of ±0.05 [167]. From the machinery and material specifications it
is expected that these variations will be of small ranges.
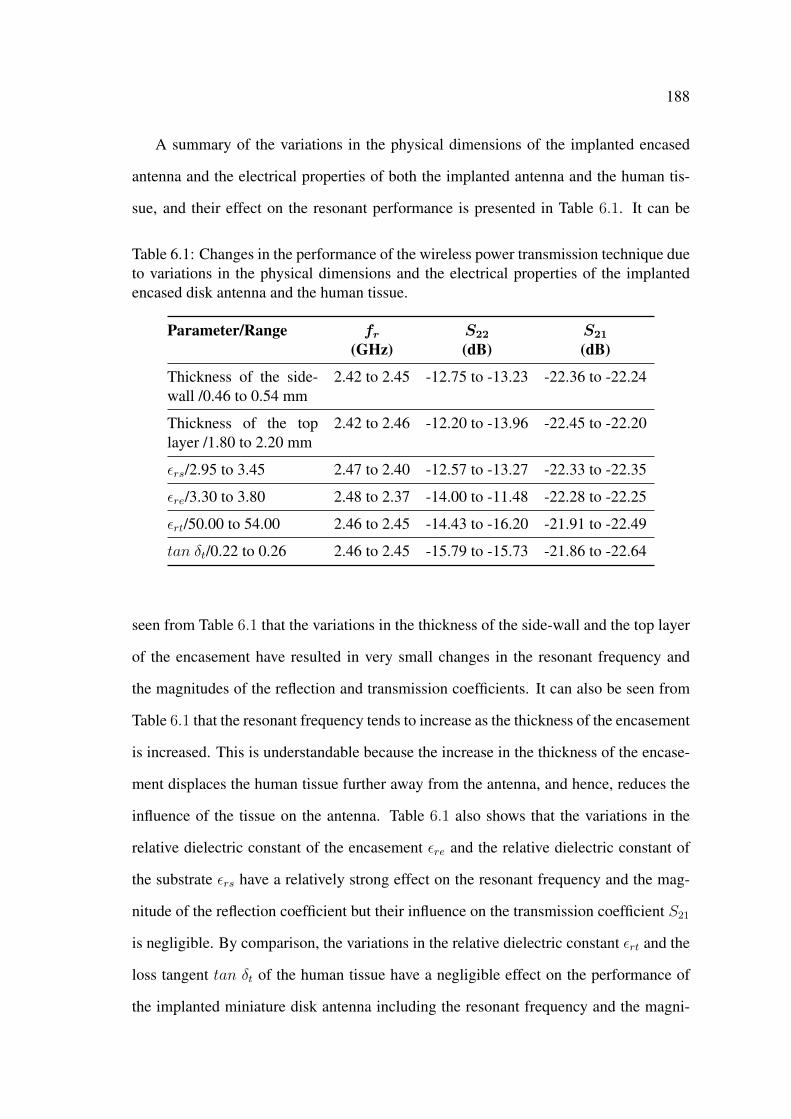
188
A summary of the variations in the physical dimensions of the implanted encased
antenna and the electrical properties of both the implanted antenna and the human tis-
sue, and their effect on the resonant performance is presented in Table 6.1. It can be
Table 6.1: Changes in the performance of the wireless power transmission technique dueto variations in the physical dimensions and the electrical properties of the implantedencased disk antenna and the human tissue.
Parameter/Range fr S22 S21
(GHz) (dB) (dB)
Thickness of the side-wall /0.46 to 0.54 mm
2.42 to 2.45 -12.75 to -13.23 -22.36 to -22.24
Thickness of the toplayer /1.80 to 2.20 mm
2.42 to 2.46 -12.20 to -13.96 -22.45 to -22.20
εrs/2.95 to 3.45 2.47 to 2.40 -12.57 to -13.27 -22.33 to -22.35
εre/3.30 to 3.80 2.48 to 2.37 -14.00 to -11.48 -22.28 to -22.25
εrt/50.00 to 54.00 2.46 to 2.45 -14.43 to -16.20 -21.91 to -22.49
tan δt/0.22 to 0.26 2.46 to 2.45 -15.79 to -15.73 -21.86 to -22.64
seen from Table 6.1 that the variations in the thickness of the side-wall and the top layer
of the encasement have resulted in very small changes in the resonant frequency and
the magnitudes of the reflection and transmission coefficients. It can also be seen from
Table 6.1 that the resonant frequency tends to increase as the thickness of the encasement
is increased. This is understandable because the increase in the thickness of the encase-
ment displaces the human tissue further away from the antenna, and hence, reduces the
influence of the tissue on the antenna. Table 6.1 also shows that the variations in the
relative dielectric constant of the encasement εre and the relative dielectric constant of
the substrate εrs have a relatively strong effect on the resonant frequency and the mag-
nitude of the reflection coefficient but their influence on the transmission coefficient S21
is negligible. By comparison, the variations in the relative dielectric constant εrt and the
loss tangent tan δt of the human tissue have a negligible effect on the performance of
the implanted miniature disk antenna including the resonant frequency and the magni-
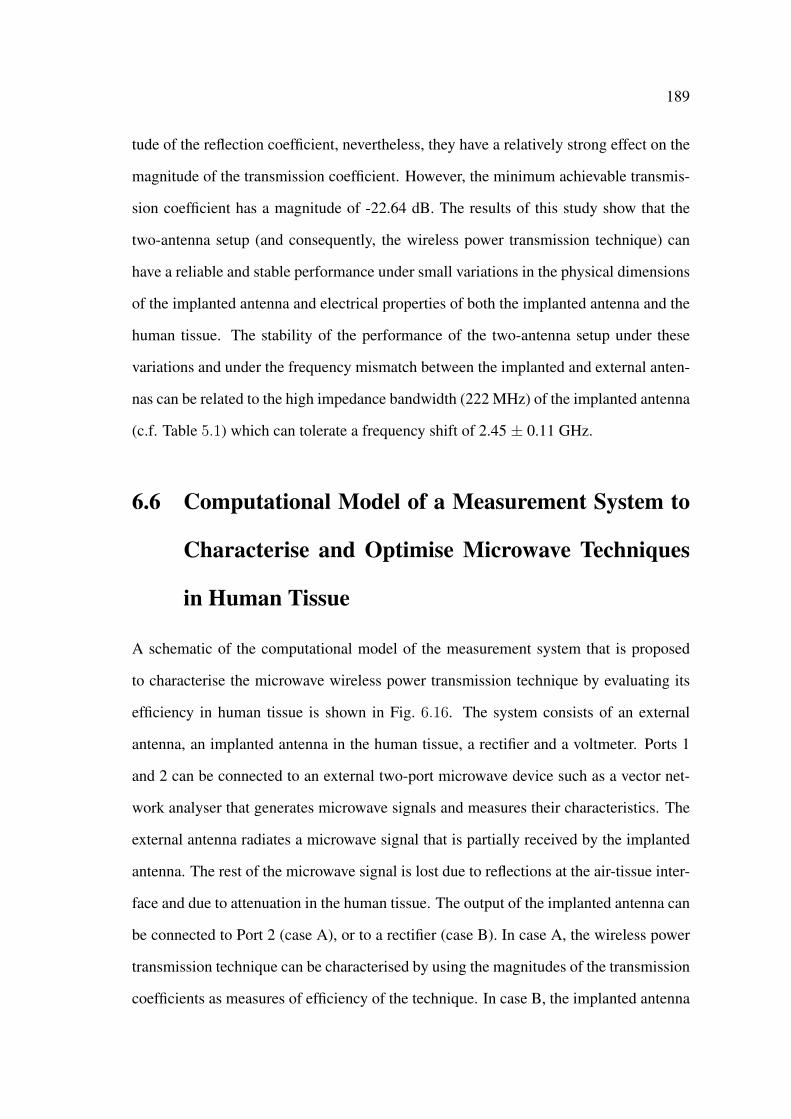
189
tude of the reflection coefficient, nevertheless, they have a relatively strong effect on the
magnitude of the transmission coefficient. However, the minimum achievable transmis-
sion coefficient has a magnitude of -22.64 dB. The results of this study show that the
two-antenna setup (and consequently, the wireless power transmission technique) can
have a reliable and stable performance under small variations in the physical dimensions
of the implanted antenna and electrical properties of both the implanted antenna and the
human tissue. The stability of the performance of the two-antenna setup under these
variations and under the frequency mismatch between the implanted and external anten-
nas can be related to the high impedance bandwidth (222 MHz) of the implanted antenna
(c.f. Table 5.1) which can tolerate a frequency shift of 2.45 ± 0.11 GHz.
6.6 Computational Model of a Measurement System to
Characterise and Optimise Microwave Techniques
in Human Tissue
A schematic of the computational model of the measurement system that is proposed
to characterise the microwave wireless power transmission technique by evaluating its
efficiency in human tissue is shown in Fig. 6.16. The system consists of an external
antenna, an implanted antenna in the human tissue, a rectifier and a voltmeter. Ports 1
and 2 can be connected to an external two-port microwave device such as a vector net-
work analyser that generates microwave signals and measures their characteristics. The
external antenna radiates a microwave signal that is partially received by the implanted
antenna. The rest of the microwave signal is lost due to reflections at the air-tissue inter-
face and due to attenuation in the human tissue. The output of the implanted antenna can
be connected to Port 2 (case A), or to a rectifier (case B). In case A, the wireless power
transmission technique can be characterised by using the magnitudes of the transmission
coefficients as measures of efficiency of the technique. In case B, the implanted antenna
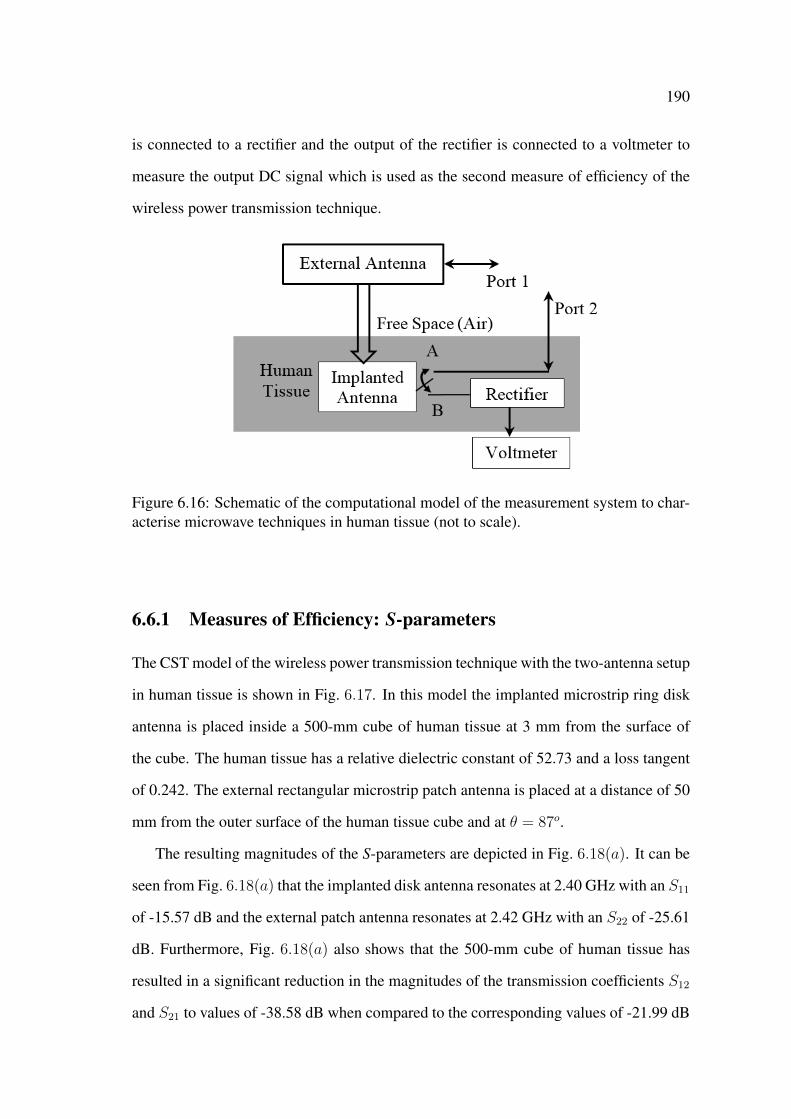
190
is connected to a rectifier and the output of the rectifier is connected to a voltmeter to
measure the output DC signal which is used as the second measure of efficiency of the
wireless power transmission technique.
Figure 6.16: Schematic of the computational model of the measurement system to char-acterise microwave techniques in human tissue (not to scale).
6.6.1 Measures of Efficiency: S-parameters
The CST model of the wireless power transmission technique with the two-antenna setup
in human tissue is shown in Fig. 6.17. In this model the implanted microstrip ring disk
antenna is placed inside a 500-mm cube of human tissue at 3 mm from the surface of
the cube. The human tissue has a relative dielectric constant of 52.73 and a loss tangent
of 0.242. The external rectangular microstrip patch antenna is placed at a distance of 50
mm from the outer surface of the human tissue cube and at θ = 87o.
The resulting magnitudes of the S-parameters are depicted in Fig. 6.18(a). It can be
seen from Fig. 6.18(a) that the implanted disk antenna resonates at 2.40 GHz with an S11
of -15.57 dB and the external patch antenna resonates at 2.42 GHz with an S22 of -25.61
dB. Furthermore, Fig. 6.18(a) also shows that the 500-mm cube of human tissue has
resulted in a significant reduction in the magnitudes of the transmission coefficients S12
and S21 to values of -38.58 dB when compared to the corresponding values of -21.99 dB
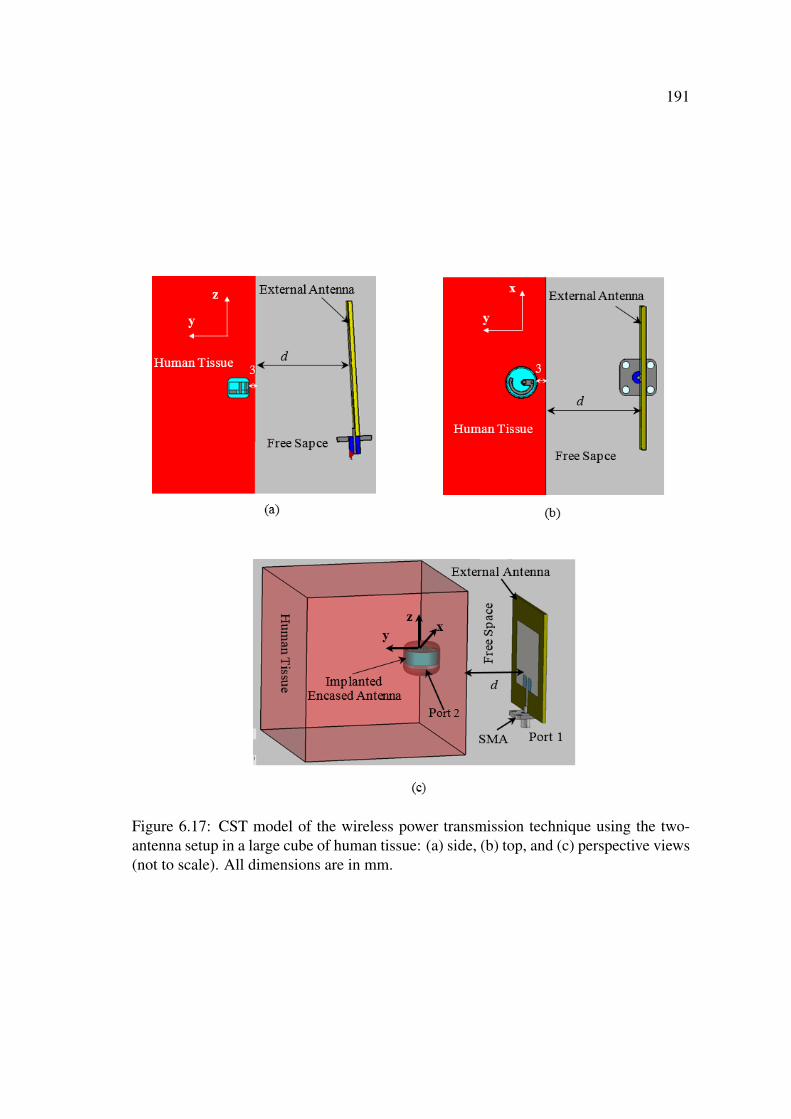
191
Figure 6.17: CST model of the wireless power transmission technique using the two-antenna setup in a large cube of human tissue: (a) side, (b) top, and (c) perspective views(not to scale). All dimensions are in mm.
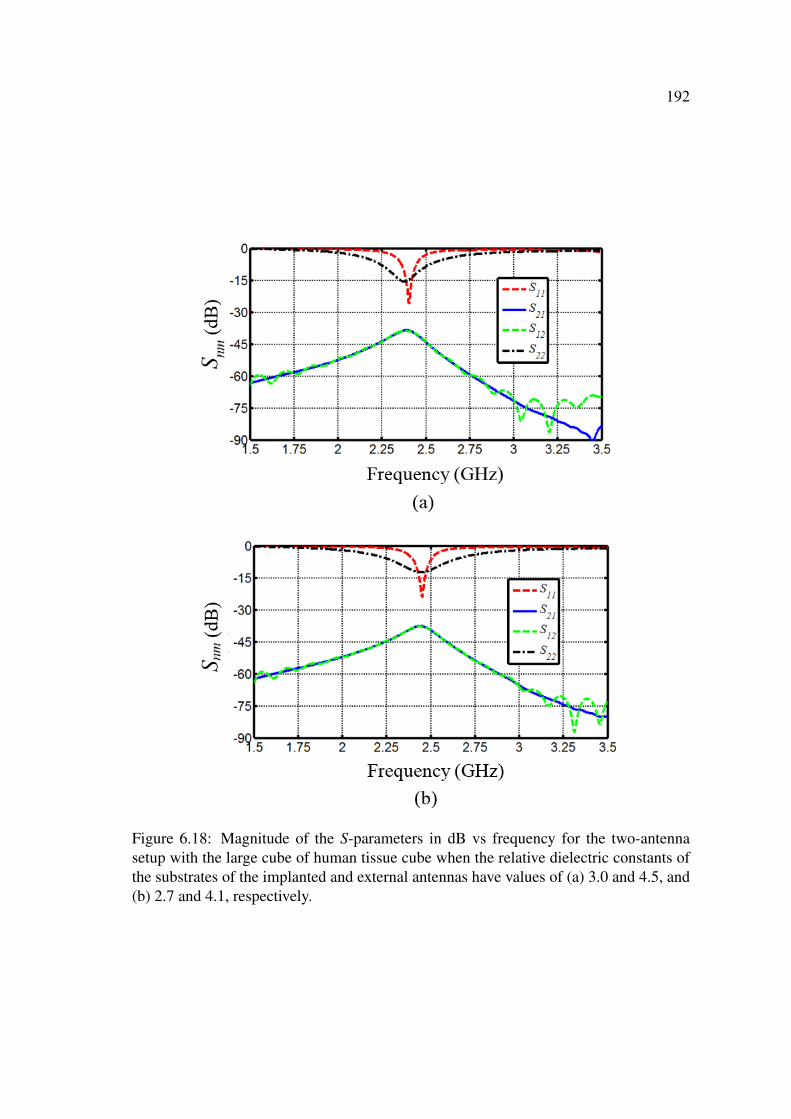
192
Figure 6.18: Magnitude of the S-parameters in dB vs frequency for the two-antennasetup with the large cube of human tissue cube when the relative dielectric constants ofthe substrates of the implanted and external antennas have values of (a) 3.0 and 4.5, and(b) 2.7 and 4.1, respectively.

193
(c.f. Fig. 6.12) for the two-antenna setup with the smaller human tissue cube. This effect
can be attributed to the larger surface area of the 500-mm tissue cube which increased
the amount of reflections and scattering at the air-tissue interface, and in addition, to the
absence of the focusing effect (c.f. Fig. 5.19) as discussed earlier. The resonant frequen-
cies of the implanted and external antennas can be tuned to 2.45 GHz by changing the
relative dielectric constant of the antennas’ substrates to 2.7 and 4.1, respectively. The
resulting magnitudes of the reflection coefficient are shown in Fig. 6.18(b) where it can
be seen that both antennas resonate at 2.45 GHz with an S11 and S22 of -23.94 dB and
-12.40 dB. Matching of the resonant frequencies of the antennas has resulted in a slight
increase in the magnitudes of the transmission coefficients to a value of -37.60 dB.
The magnitudes of the transmission coefficients are dependent on the amount of
reflections at the interface of two different materials which is dependent on a number
of factors such as the separation distance d between the external patch antenna and the
surface of the human tissue. A parametric study on the effect of the separation distance d
on the magnitude of the transmission coefficient S21 has been performed and the results
of this study are shown in Fig. 6.19. As expected, it can be seen from Fig. 6.19 that
S21 decreases as the separation distance increases which is a result of the increase in
the amount of attenuation (due to the frees space losses) in the radiated electromagnetic
signal from the external patch antenna with distance.
The electric field intensity distribution of the two-antenna setup is shown in Fig. 6.20
and 6.21. It can be seen from Fig. 6.20 that there is a significant amount of reflections
at the air-tissue interface of the radiated electromagnetic signal. These reflections are
attributed to the large difference between the relative dielectric constants of human tis-
sue and free space. It is also apparent from Fig. 6.21 that the electromagnetic signal
significantly attenuates across a short distance of approximately few tens of millimetres.
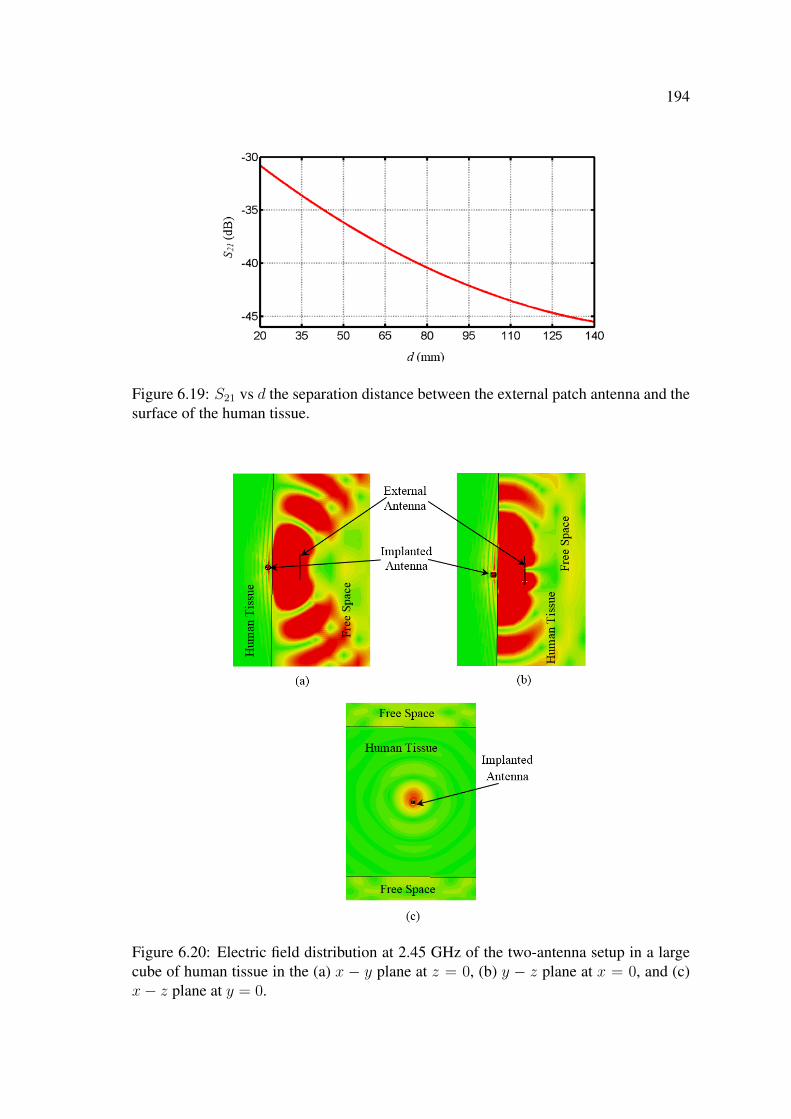
194
Figure 6.19: S21 vs d the separation distance between the external patch antenna and thesurface of the human tissue.
Figure 6.20: Electric field distribution at 2.45 GHz of the two-antenna setup in a largecube of human tissue in the (a) x − y plane at z = 0, (b) y − z plane at x = 0, and (c)x− z plane at y = 0.
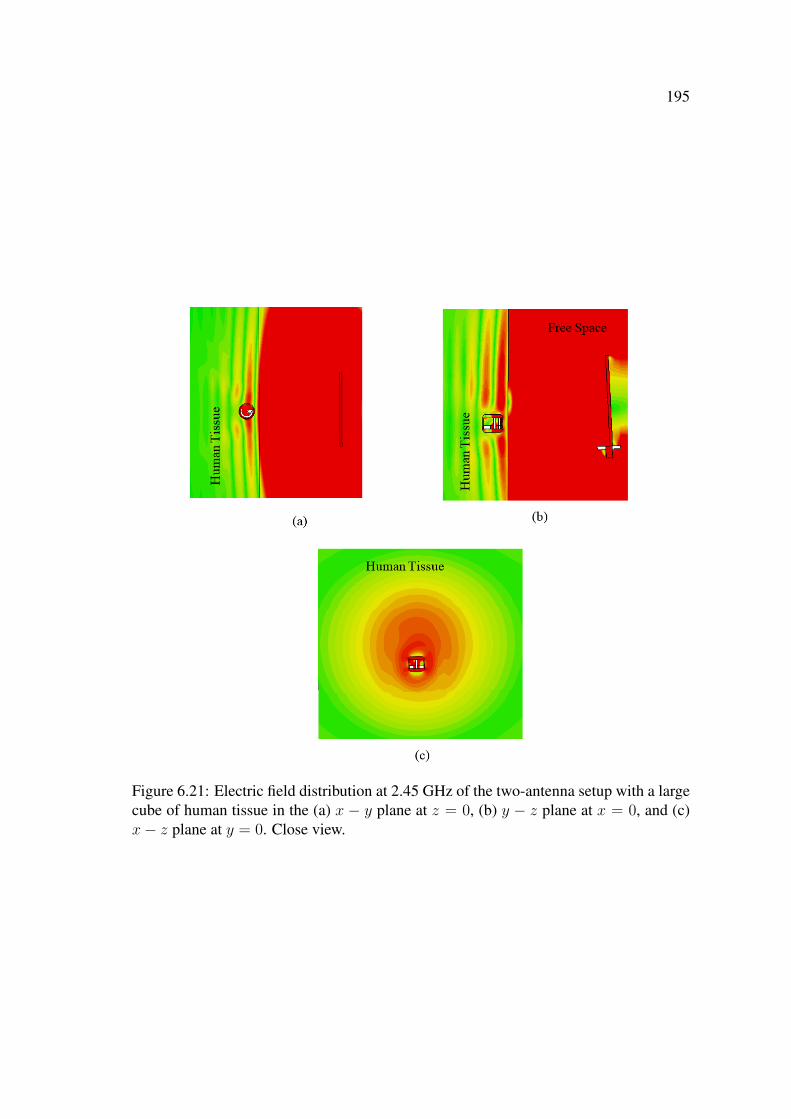
195
Figure 6.21: Electric field distribution at 2.45 GHz of the two-antenna setup with a largecube of human tissue in the (a) x − y plane at z = 0, (b) y − z plane at x = 0, and (c)x− z plane at y = 0. Close view.

196
6.6.2 Optimisation using a Dielectric Layer
The significant attenuation of the electric field inside the human tissue is dependent on
the lossiness of the human tissue and is relatively uncontrollable. However, the amount
of the reflections and scattering at the air-tissue interface can be reduced by inserting
a matching layer between the external patch antenna and the human tissue. The CST
model of the two-antenna setup with the matching layer is shown in Fig. 6.22. The
matching layer is 500×500×50 mm3 in dimensions and has a relative dielectric constant,
εrm, of 52.72 and a loss tangent, tan δm, of 0.001. The external patch antenna is placed at
a distance of 7.5 mm from the matching layer. Inserting the matching layer has resulted
in a significant increase in the magnitudes of the transmission coefficients S21 and S12 to
a value of -23.54 dB when compared to the -37.60 dB coefficients for the two-antenna
setup without the matching layer. However, the close proximity of the high εrm of the
matching layer has affected the performance of the external patch antenna and resulted
in a shift in its resonant frequency to 2.28 GHz with an S11 of -7.94 dB.
Figure 6.22: CST model in the (a) x− y plane at z = 0 and (b) y − z plane at x = 0 ofthe two-antenna setup with a 50 mm thick matching layer (not to scale).
To reduce the influence of εrm on the external patch antenna the separation distance
between the antenna and the matching layer was increased to 9.0 mm and 10.5 mm.
At a distance of 9.0 mm there were no changes in the S-parameters and the external
patch antenna still resonated at ∼ 2.28 GHz. The magnitudes of the S-parameters of
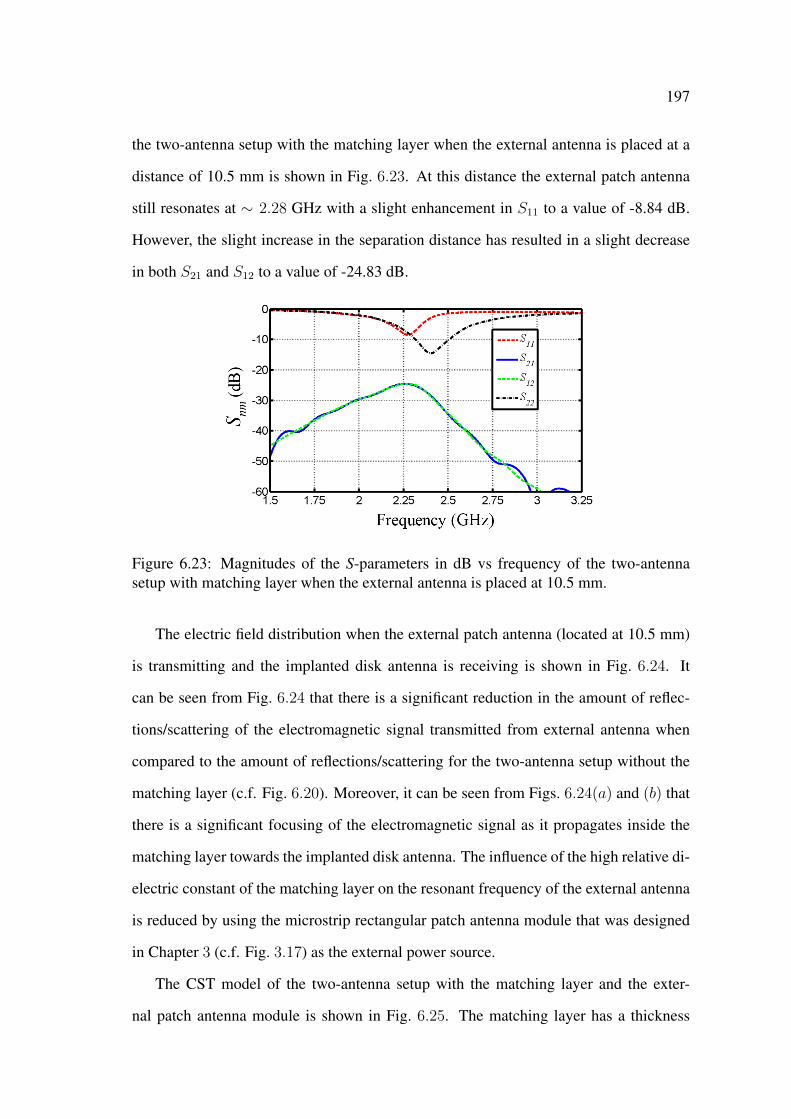
197
the two-antenna setup with the matching layer when the external antenna is placed at a
distance of 10.5 mm is shown in Fig. 6.23. At this distance the external patch antenna
still resonates at ∼ 2.28 GHz with a slight enhancement in S11 to a value of -8.84 dB.
However, the slight increase in the separation distance has resulted in a slight decrease
in both S21 and S12 to a value of -24.83 dB.
Figure 6.23: Magnitudes of the S-parameters in dB vs frequency of the two-antennasetup with matching layer when the external antenna is placed at 10.5 mm.
The electric field distribution when the external patch antenna (located at 10.5 mm)
is transmitting and the implanted disk antenna is receiving is shown in Fig. 6.24. It
can be seen from Fig. 6.24 that there is a significant reduction in the amount of reflec-
tions/scattering of the electromagnetic signal transmitted from external antenna when
compared to the amount of reflections/scattering for the two-antenna setup without the
matching layer (c.f. Fig. 6.20). Moreover, it can be seen from Figs. 6.24(a) and (b) that
there is a significant focusing of the electromagnetic signal as it propagates inside the
matching layer towards the implanted disk antenna. The influence of the high relative di-
electric constant of the matching layer on the resonant frequency of the external antenna
is reduced by using the microstrip rectangular patch antenna module that was designed
in Chapter 3 (c.f. Fig. 3.17) as the external power source.
The CST model of the two-antenna setup with the matching layer and the exter-
nal patch antenna module is shown in Fig. 6.25. The matching layer has a thickness
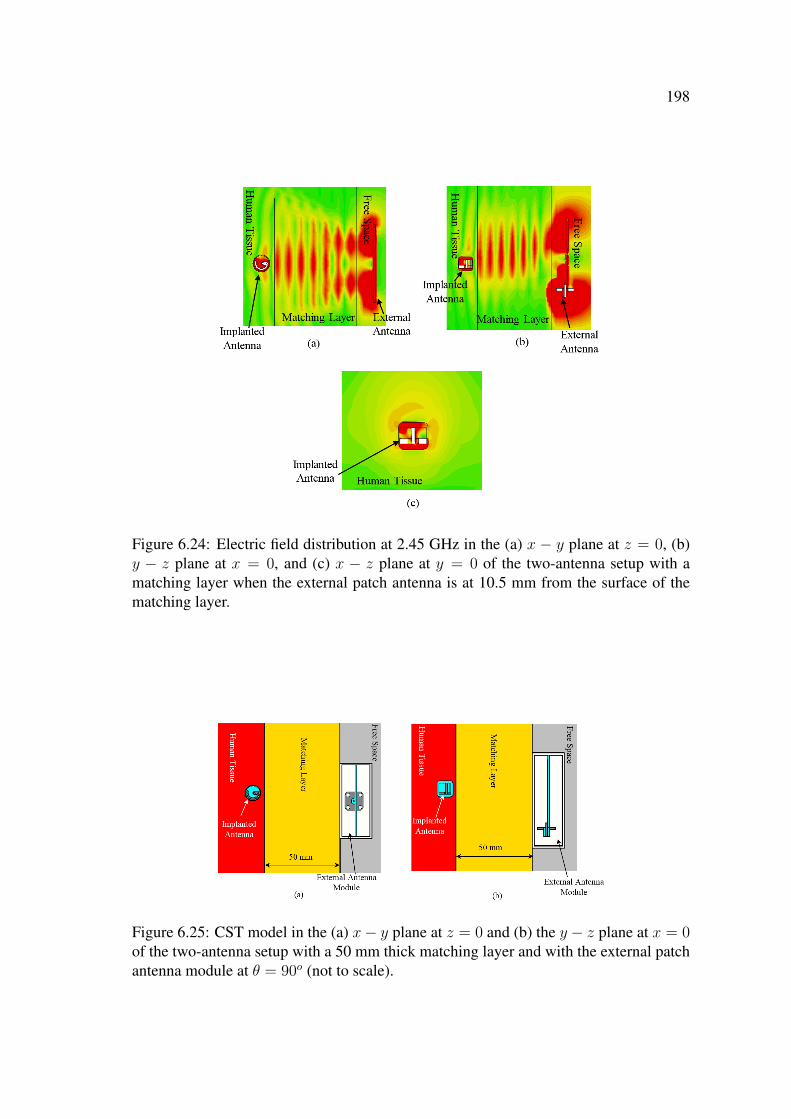
198
Figure 6.24: Electric field distribution at 2.45 GHz in the (a) x − y plane at z = 0, (b)y − z plane at x = 0, and (c) x − z plane at y = 0 of the two-antenna setup with amatching layer when the external patch antenna is at 10.5 mm from the surface of thematching layer.
Figure 6.25: CST model in the (a) x− y plane at z = 0 and (b) the y − z plane at x = 0of the two-antenna setup with a 50 mm thick matching layer and with the external patchantenna module at θ = 90o (not to scale).
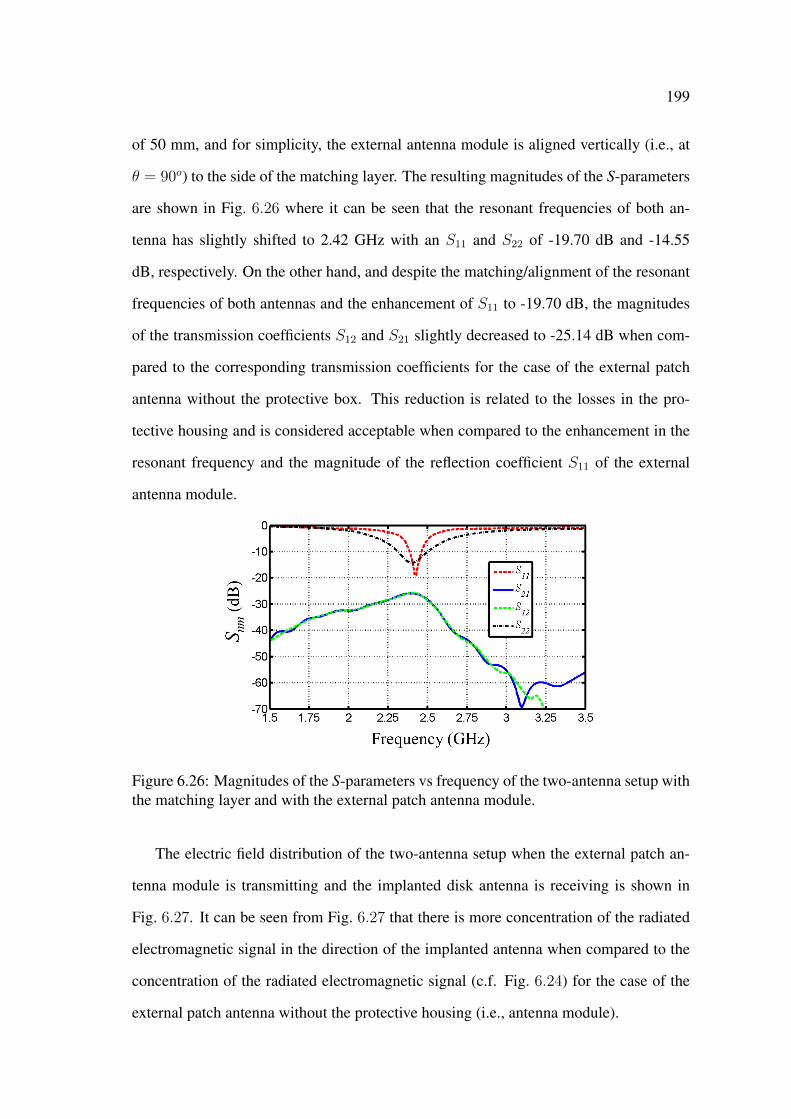
199
of 50 mm, and for simplicity, the external antenna module is aligned vertically (i.e., at
θ = 90o) to the side of the matching layer. The resulting magnitudes of the S-parameters
are shown in Fig. 6.26 where it can be seen that the resonant frequencies of both an-
tenna has slightly shifted to 2.42 GHz with an S11 and S22 of -19.70 dB and -14.55
dB, respectively. On the other hand, and despite the matching/alignment of the resonant
frequencies of both antennas and the enhancement of S11 to -19.70 dB, the magnitudes
of the transmission coefficients S12 and S21 slightly decreased to -25.14 dB when com-
pared to the corresponding transmission coefficients for the case of the external patch
antenna without the protective box. This reduction is related to the losses in the pro-
tective housing and is considered acceptable when compared to the enhancement in the
resonant frequency and the magnitude of the reflection coefficient S11 of the external
antenna module.
Figure 6.26: Magnitudes of the S-parameters vs frequency of the two-antenna setup withthe matching layer and with the external patch antenna module.
The electric field distribution of the two-antenna setup when the external patch an-
tenna module is transmitting and the implanted disk antenna is receiving is shown in
Fig. 6.27. It can be seen from Fig. 6.27 that there is more concentration of the radiated
electromagnetic signal in the direction of the implanted antenna when compared to the
concentration of the radiated electromagnetic signal (c.f. Fig. 6.24) for the case of the
external patch antenna without the protective housing (i.e., antenna module).
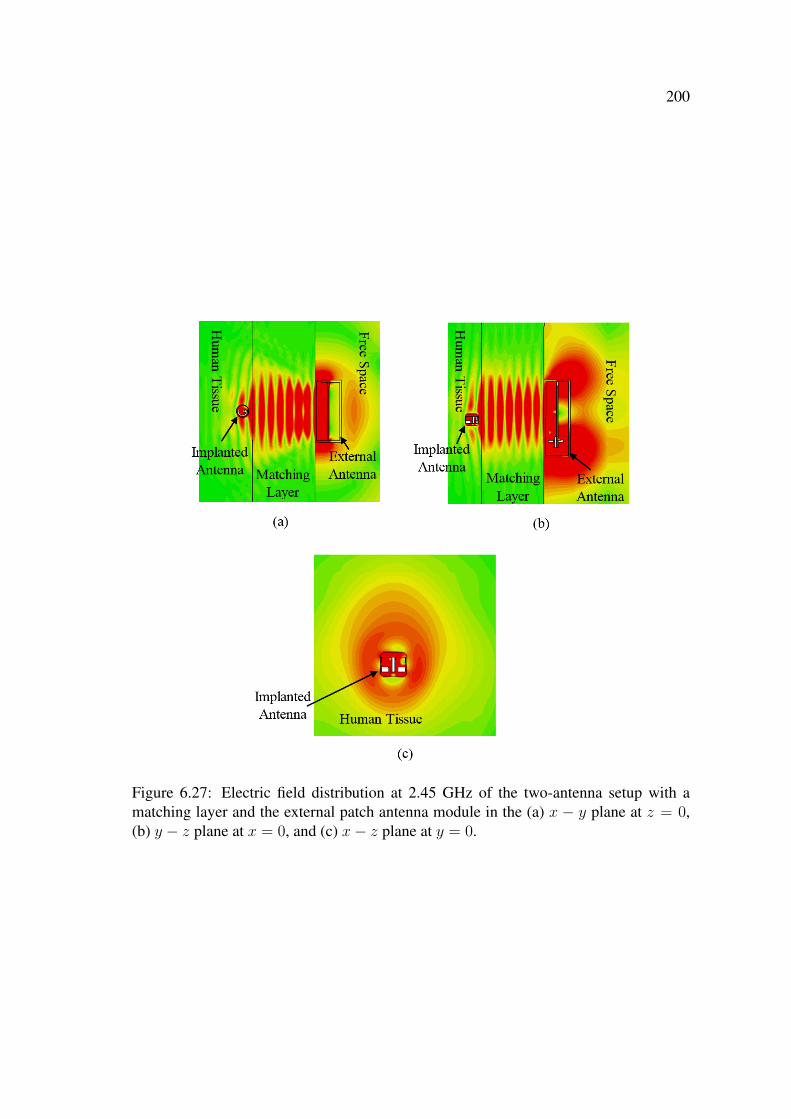
200
Figure 6.27: Electric field distribution at 2.45 GHz of the two-antenna setup with amatching layer and the external patch antenna module in the (a) x − y plane at z = 0,(b) y − z plane at x = 0, and (c) x− z plane at y = 0.
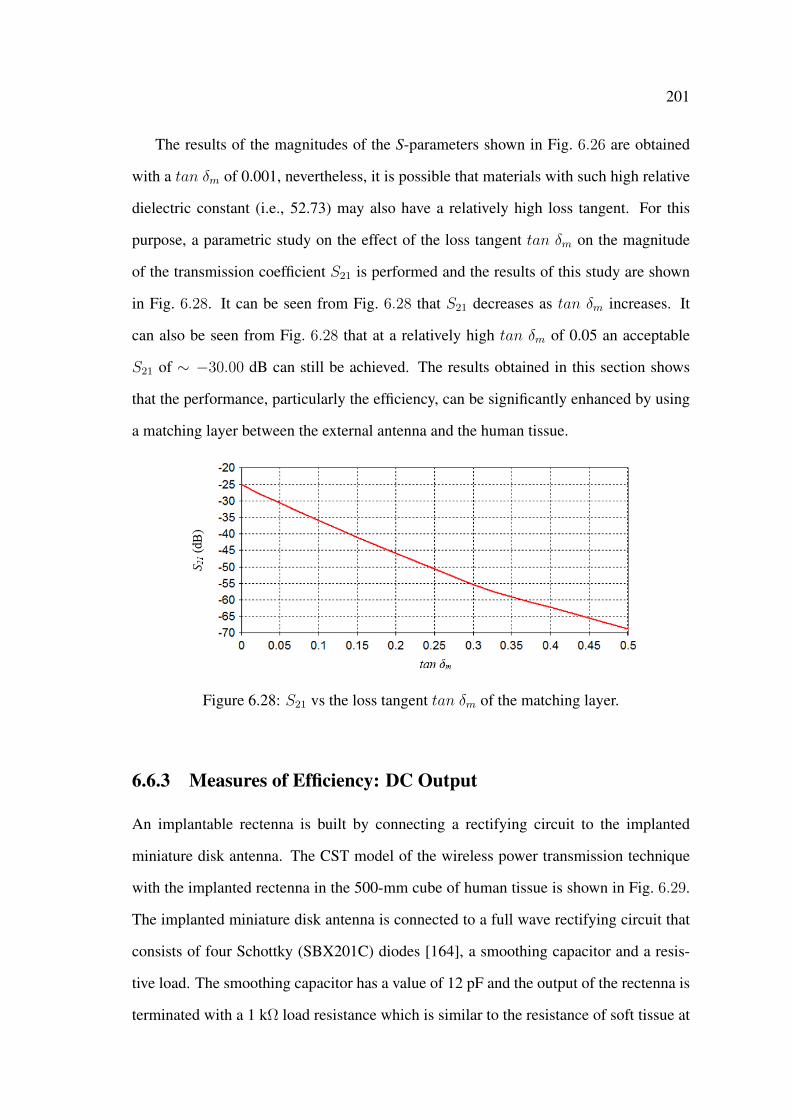
201
The results of the magnitudes of the S-parameters shown in Fig. 6.26 are obtained
with a tan δm of 0.001, nevertheless, it is possible that materials with such high relative
dielectric constant (i.e., 52.73) may also have a relatively high loss tangent. For this
purpose, a parametric study on the effect of the loss tangent tan δm on the magnitude
of the transmission coefficient S21 is performed and the results of this study are shown
in Fig. 6.28. It can be seen from Fig. 6.28 that S21 decreases as tan δm increases. It
can also be seen from Fig. 6.28 that at a relatively high tan δm of 0.05 an acceptable
S21 of ∼ −30.00 dB can still be achieved. The results obtained in this section shows
that the performance, particularly the efficiency, can be significantly enhanced by using
a matching layer between the external antenna and the human tissue.
Figure 6.28: S21 vs the loss tangent tan δm of the matching layer.
6.6.3 Measures of Efficiency: DC Output
An implantable rectenna is built by connecting a rectifying circuit to the implanted
miniature disk antenna. The CST model of the wireless power transmission technique
with the implanted rectenna in the 500-mm cube of human tissue is shown in Fig. 6.29.
The implanted miniature disk antenna is connected to a full wave rectifying circuit that
consists of four Schottky (SBX201C) diodes [164], a smoothing capacitor and a resis-
tive load. The smoothing capacitor has a value of 12 pF and the output of the rectenna is
terminated with a 1 kΩ load resistance which is similar to the resistance of soft tissue at
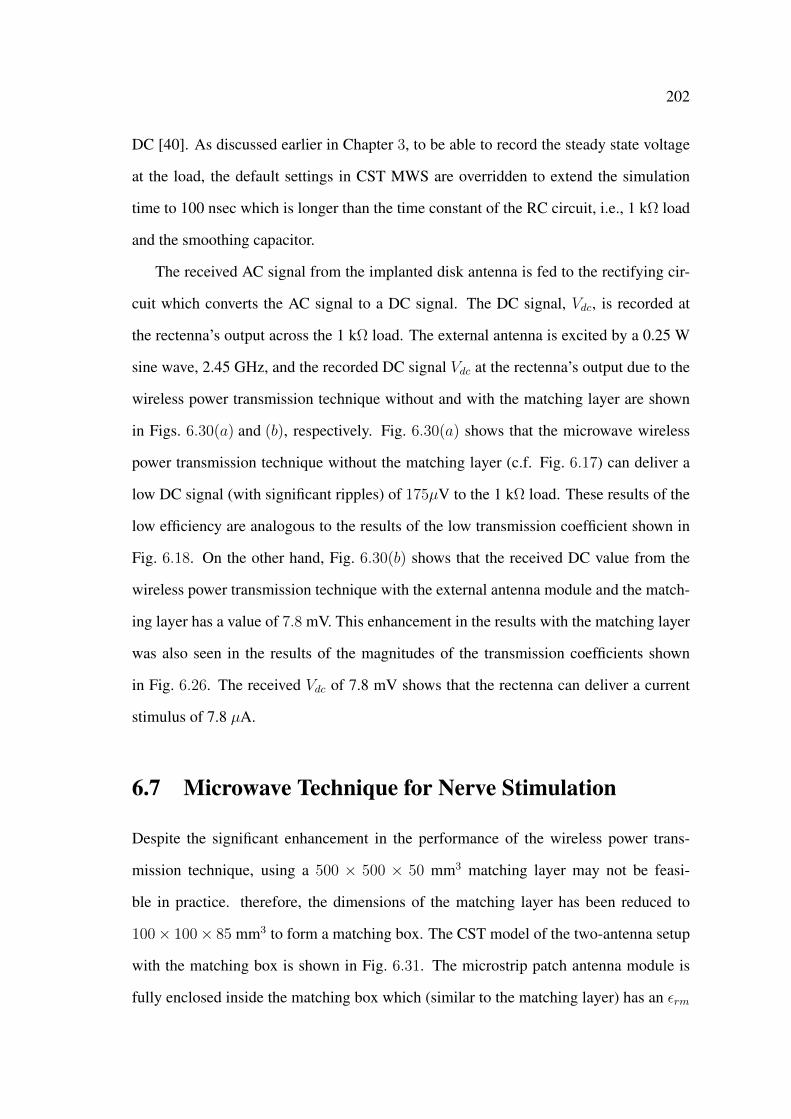
202
DC [40]. As discussed earlier in Chapter 3, to be able to record the steady state voltage
at the load, the default settings in CST MWS are overridden to extend the simulation
time to 100 nsec which is longer than the time constant of the RC circuit, i.e., 1 kΩ load
and the smoothing capacitor.
The received AC signal from the implanted disk antenna is fed to the rectifying cir-
cuit which converts the AC signal to a DC signal. The DC signal, Vdc, is recorded at
the rectenna’s output across the 1 kΩ load. The external antenna is excited by a 0.25 W
sine wave, 2.45 GHz, and the recorded DC signal Vdc at the rectenna’s output due to the
wireless power transmission technique without and with the matching layer are shown
in Figs. 6.30(a) and (b), respectively. Fig. 6.30(a) shows that the microwave wireless
power transmission technique without the matching layer (c.f. Fig. 6.17) can deliver a
low DC signal (with significant ripples) of 175µV to the 1 kΩ load. These results of the
low efficiency are analogous to the results of the low transmission coefficient shown in
Fig. 6.18. On the other hand, Fig. 6.30(b) shows that the received DC value from the
wireless power transmission technique with the external antenna module and the match-
ing layer has a value of 7.8 mV. This enhancement in the results with the matching layer
was also seen in the results of the magnitudes of the transmission coefficients shown
in Fig. 6.26. The received Vdc of 7.8 mV shows that the rectenna can deliver a current
stimulus of 7.8 µA.
6.7 Microwave Technique for Nerve Stimulation
Despite the significant enhancement in the performance of the wireless power trans-
mission technique, using a 500 × 500 × 50 mm3 matching layer may not be feasi-
ble in practice. therefore, the dimensions of the matching layer has been reduced to
100× 100× 85 mm3 to form a matching box. The CST model of the two-antenna setup
with the matching box is shown in Fig. 6.31. The microstrip patch antenna module is
fully enclosed inside the matching box which (similar to the matching layer) has an εrm
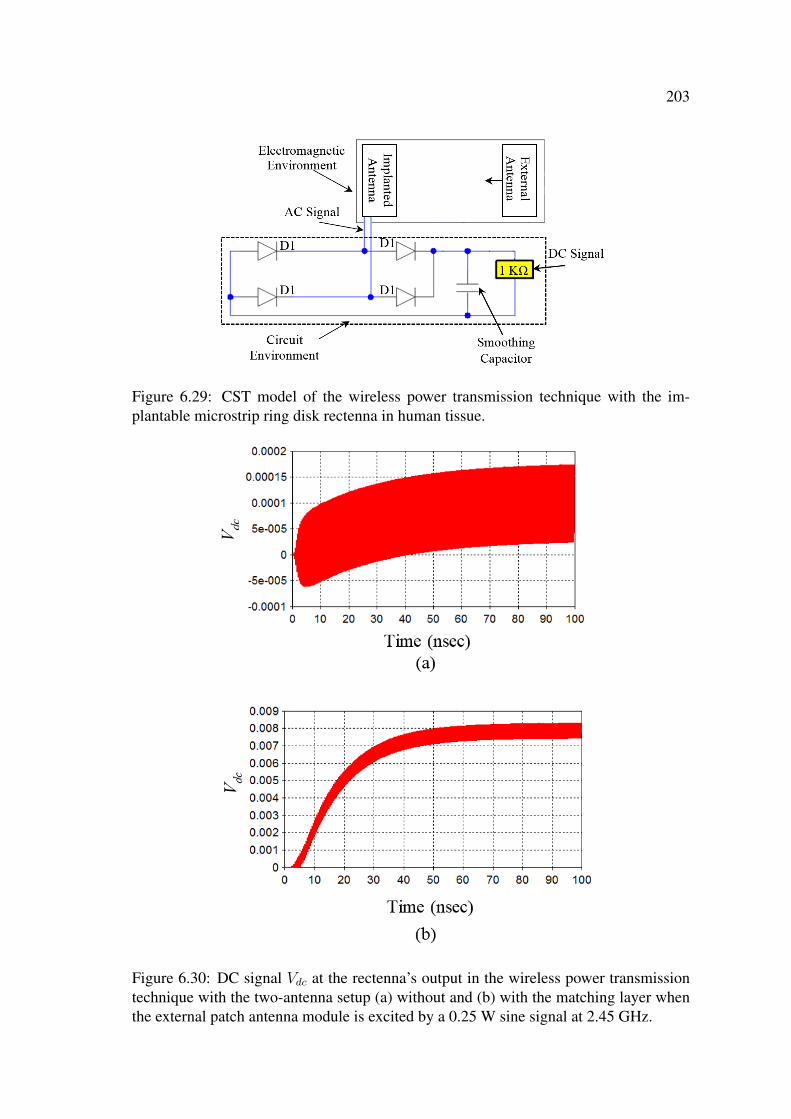
203
Figure 6.29: CST model of the wireless power transmission technique with the im-plantable microstrip ring disk rectenna in human tissue.
Figure 6.30: DC signal Vdc at the rectenna’s output in the wireless power transmissiontechnique with the two-antenna setup (a) without and (b) with the matching layer whenthe external patch antenna module is excited by a 0.25 W sine signal at 2.45 GHz.
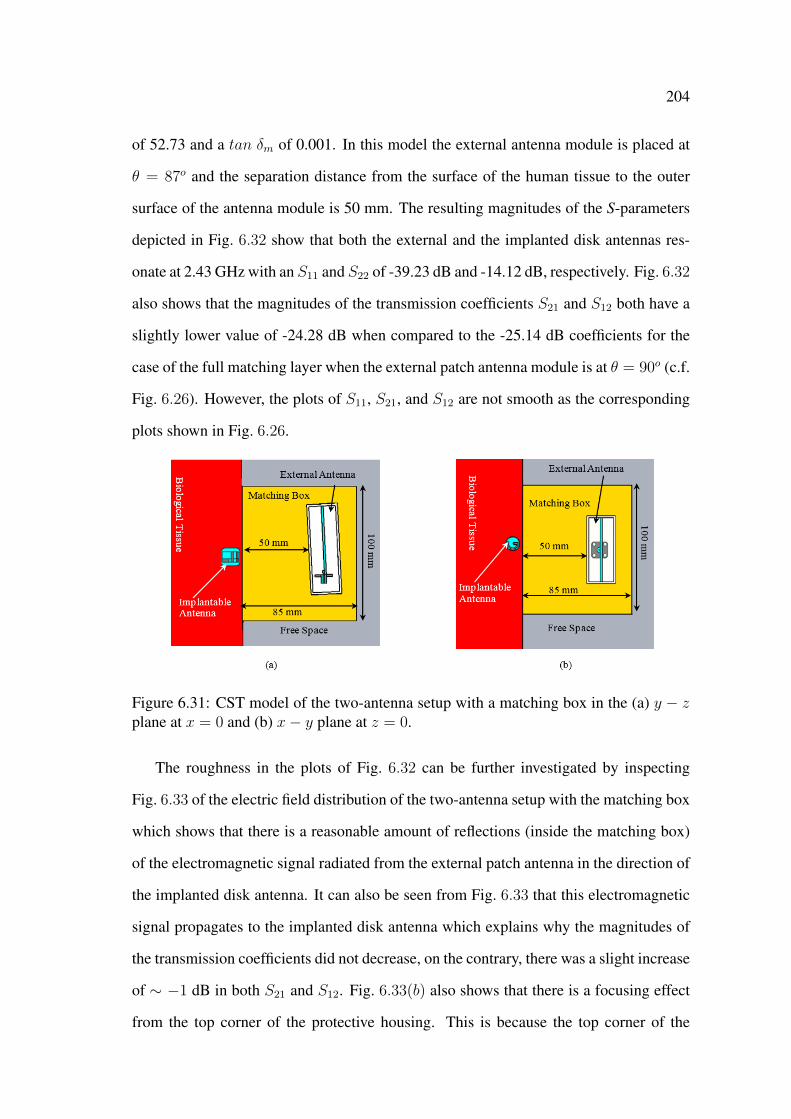
204
of 52.73 and a tan δm of 0.001. In this model the external antenna module is placed at
θ = 87o and the separation distance from the surface of the human tissue to the outer
surface of the antenna module is 50 mm. The resulting magnitudes of the S-parameters
depicted in Fig. 6.32 show that both the external and the implanted disk antennas res-
onate at 2.43 GHz with an S11 and S22 of -39.23 dB and -14.12 dB, respectively. Fig. 6.32
also shows that the magnitudes of the transmission coefficients S21 and S12 both have a
slightly lower value of -24.28 dB when compared to the -25.14 dB coefficients for the
case of the full matching layer when the external patch antenna module is at θ = 90o (c.f.
Fig. 6.26). However, the plots of S11, S21, and S12 are not smooth as the corresponding
plots shown in Fig. 6.26.
Figure 6.31: CST model of the two-antenna setup with a matching box in the (a) y − zplane at x = 0 and (b) x− y plane at z = 0.
The roughness in the plots of Fig. 6.32 can be further investigated by inspecting
Fig. 6.33 of the electric field distribution of the two-antenna setup with the matching box
which shows that there is a reasonable amount of reflections (inside the matching box)
of the electromagnetic signal radiated from the external patch antenna in the direction of
the implanted disk antenna. It can also be seen from Fig. 6.33 that this electromagnetic
signal propagates to the implanted disk antenna which explains why the magnitudes of
the transmission coefficients did not decrease, on the contrary, there was a slight increase
of ∼ −1 dB in both S21 and S12. Fig. 6.33(b) also shows that there is a focusing effect
from the top corner of the protective housing. This is because the top corner of the
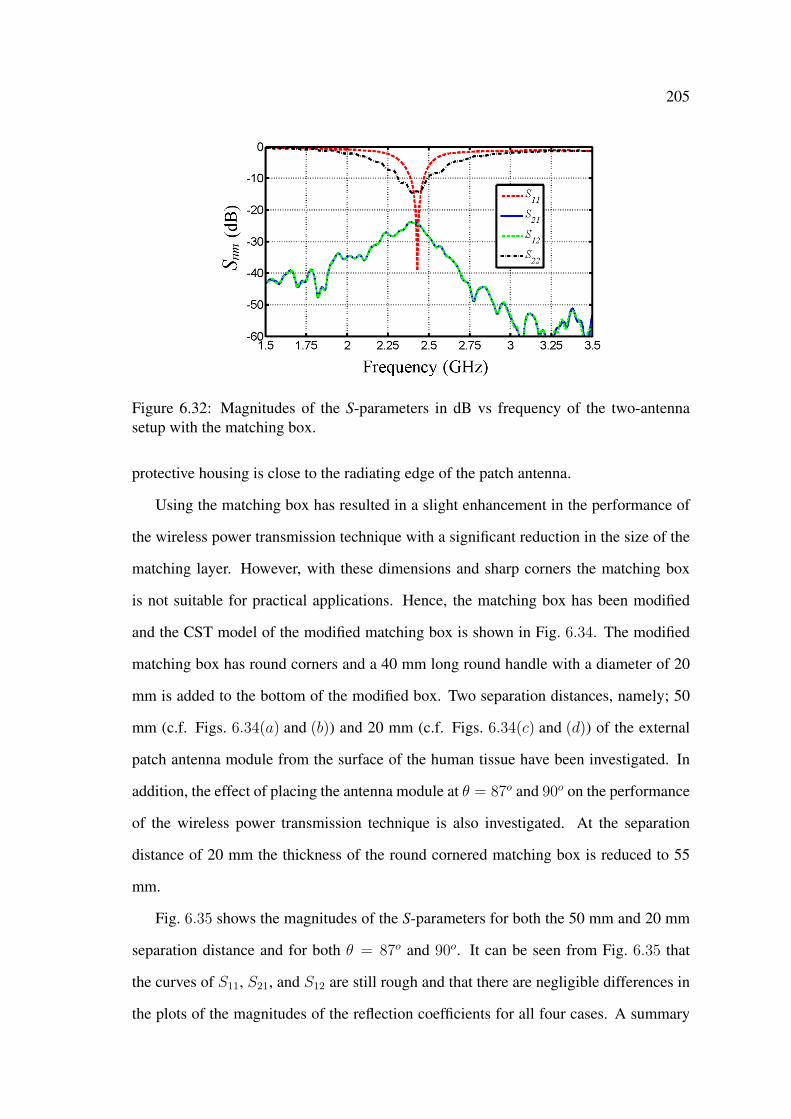
205
Figure 6.32: Magnitudes of the S-parameters in dB vs frequency of the two-antennasetup with the matching box.
protective housing is close to the radiating edge of the patch antenna.
Using the matching box has resulted in a slight enhancement in the performance of
the wireless power transmission technique with a significant reduction in the size of the
matching layer. However, with these dimensions and sharp corners the matching box
is not suitable for practical applications. Hence, the matching box has been modified
and the CST model of the modified matching box is shown in Fig. 6.34. The modified
matching box has round corners and a 40 mm long round handle with a diameter of 20
mm is added to the bottom of the modified box. Two separation distances, namely; 50
mm (c.f. Figs. 6.34(a) and (b)) and 20 mm (c.f. Figs. 6.34(c) and (d)) of the external
patch antenna module from the surface of the human tissue have been investigated. In
addition, the effect of placing the antenna module at θ = 87o and 90o on the performance
of the wireless power transmission technique is also investigated. At the separation
distance of 20 mm the thickness of the round cornered matching box is reduced to 55
mm.
Fig. 6.35 shows the magnitudes of the S-parameters for both the 50 mm and 20 mm
separation distance and for both θ = 87o and 90o. It can be seen from Fig. 6.35 that
the curves of S11, S21, and S12 are still rough and that there are negligible differences in
the plots of the magnitudes of the reflection coefficients for all four cases. A summary

206
Figure 6.33: Electric field distribution at 2.45 GHz of the wireless power transmissiontechnique with the matching box in the (a) x−y plane at z = 0, (b) y−z plane at x = 0,and (c) x− z plane at y = 0.

207
Figure 6.34: CST model of the wireless power transmission technique with the modifiedmatching box when the external patch antenna module is at a distance of 50 mm and atthe elevation angle (a) θ = 87o and (b) θ = 90o, and at a distance of 20 mm with (c)θ = 87o and (d) θ = 90o.
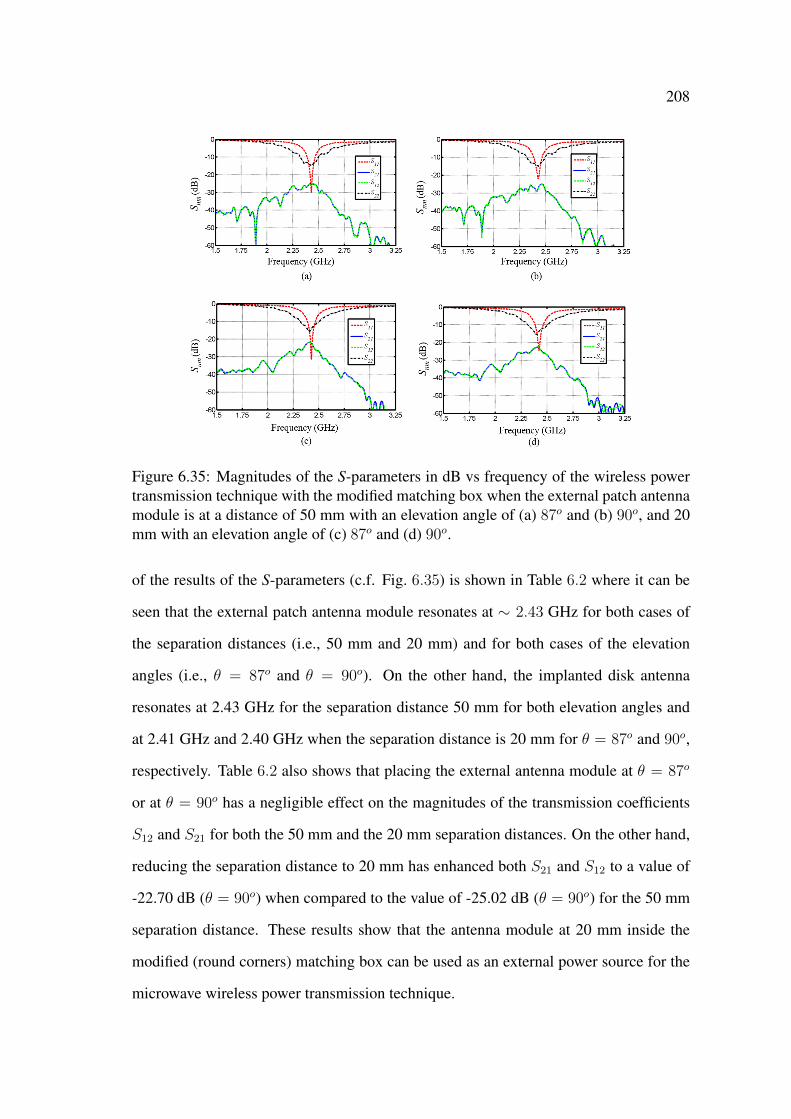
208
Figure 6.35: Magnitudes of the S-parameters in dB vs frequency of the wireless powertransmission technique with the modified matching box when the external patch antennamodule is at a distance of 50 mm with an elevation angle of (a) 87o and (b) 90o, and 20mm with an elevation angle of (c) 87o and (d) 90o.
of the results of the S-parameters (c.f. Fig. 6.35) is shown in Table 6.2 where it can be
seen that the external patch antenna module resonates at ∼ 2.43 GHz for both cases of
the separation distances (i.e., 50 mm and 20 mm) and for both cases of the elevation
angles (i.e., θ = 87o and θ = 90o). On the other hand, the implanted disk antenna
resonates at 2.43 GHz for the separation distance 50 mm for both elevation angles and
at 2.41 GHz and 2.40 GHz when the separation distance is 20 mm for θ = 87o and 90o,
respectively. Table 6.2 also shows that placing the external antenna module at θ = 87o
or at θ = 90o has a negligible effect on the magnitudes of the transmission coefficients
S12 and S21 for both the 50 mm and the 20 mm separation distances. On the other hand,
reducing the separation distance to 20 mm has enhanced both S21 and S12 to a value of
-22.70 dB (θ = 90o) when compared to the value of -25.02 dB (θ = 90o) for the 50 mm
separation distance. These results show that the antenna module at 20 mm inside the
modified (round corners) matching box can be used as an external power source for the
microwave wireless power transmission technique.
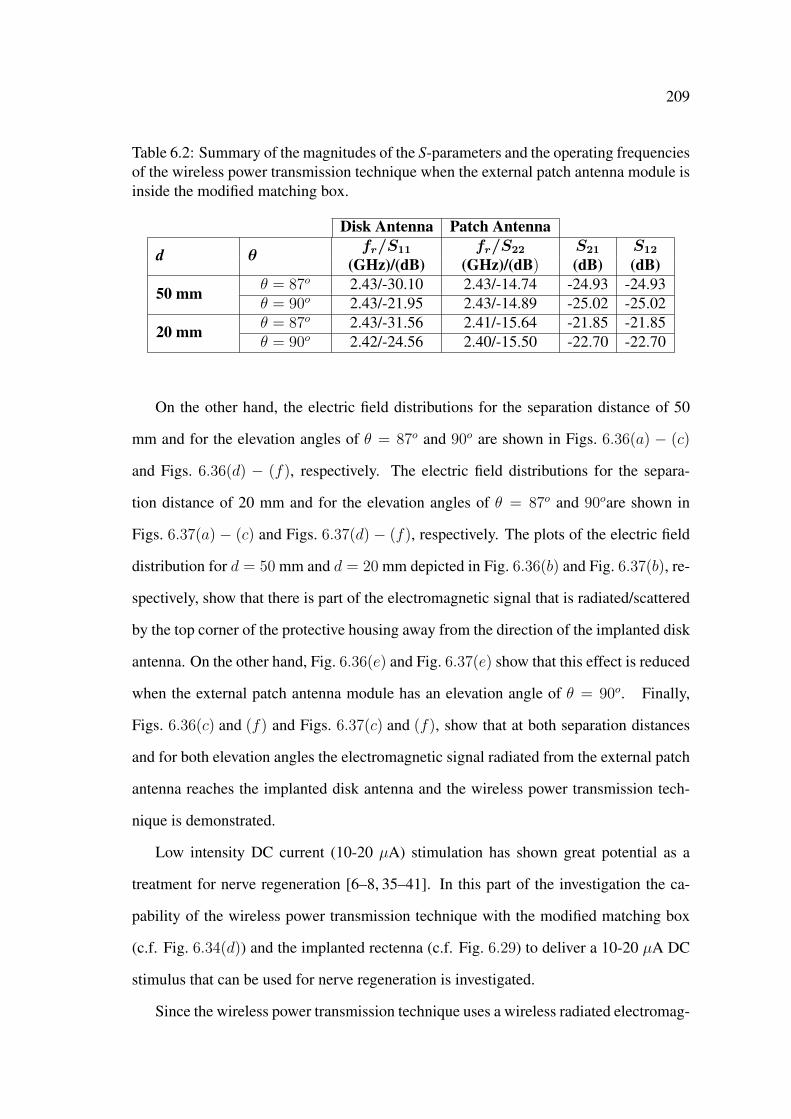
209
Table 6.2: Summary of the magnitudes of the S-parameters and the operating frequenciesof the wireless power transmission technique when the external patch antenna module isinside the modified matching box.
Disk Antenna Patch Antenna
d θfr/S11 fr/S22 S21 S12
(GHz)/(dB) (GHz)/(dB) (dB) (dB)
50 mm θ = 87o 2.43/-30.10 2.43/-14.74 -24.93 -24.93θ = 90o 2.43/-21.95 2.43/-14.89 -25.02 -25.02
20 mm θ = 87o 2.43/-31.56 2.41/-15.64 -21.85 -21.85θ = 90o 2.42/-24.56 2.40/-15.50 -22.70 -22.70
On the other hand, the electric field distributions for the separation distance of 50
mm and for the elevation angles of θ = 87o and 90o are shown in Figs. 6.36(a) − (c)
and Figs. 6.36(d) − (f), respectively. The electric field distributions for the separa-
tion distance of 20 mm and for the elevation angles of θ = 87o and 90oare shown in
Figs. 6.37(a) − (c) and Figs. 6.37(d) − (f), respectively. The plots of the electric field
distribution for d = 50 mm and d = 20 mm depicted in Fig. 6.36(b) and Fig. 6.37(b), re-
spectively, show that there is part of the electromagnetic signal that is radiated/scattered
by the top corner of the protective housing away from the direction of the implanted disk
antenna. On the other hand, Fig. 6.36(e) and Fig. 6.37(e) show that this effect is reduced
when the external patch antenna module has an elevation angle of θ = 90o. Finally,
Figs. 6.36(c) and (f) and Figs. 6.37(c) and (f), show that at both separation distances
and for both elevation angles the electromagnetic signal radiated from the external patch
antenna reaches the implanted disk antenna and the wireless power transmission tech-
nique is demonstrated.
Low intensity DC current (10-20 µA) stimulation has shown great potential as a
treatment for nerve regeneration [6–8, 35–41]. In this part of the investigation the ca-
pability of the wireless power transmission technique with the modified matching box
(c.f. Fig. 6.34(d)) and the implanted rectenna (c.f. Fig. 6.29) to deliver a 10-20 µA DC
stimulus that can be used for nerve regeneration is investigated.
Since the wireless power transmission technique uses a wireless radiated electromag-
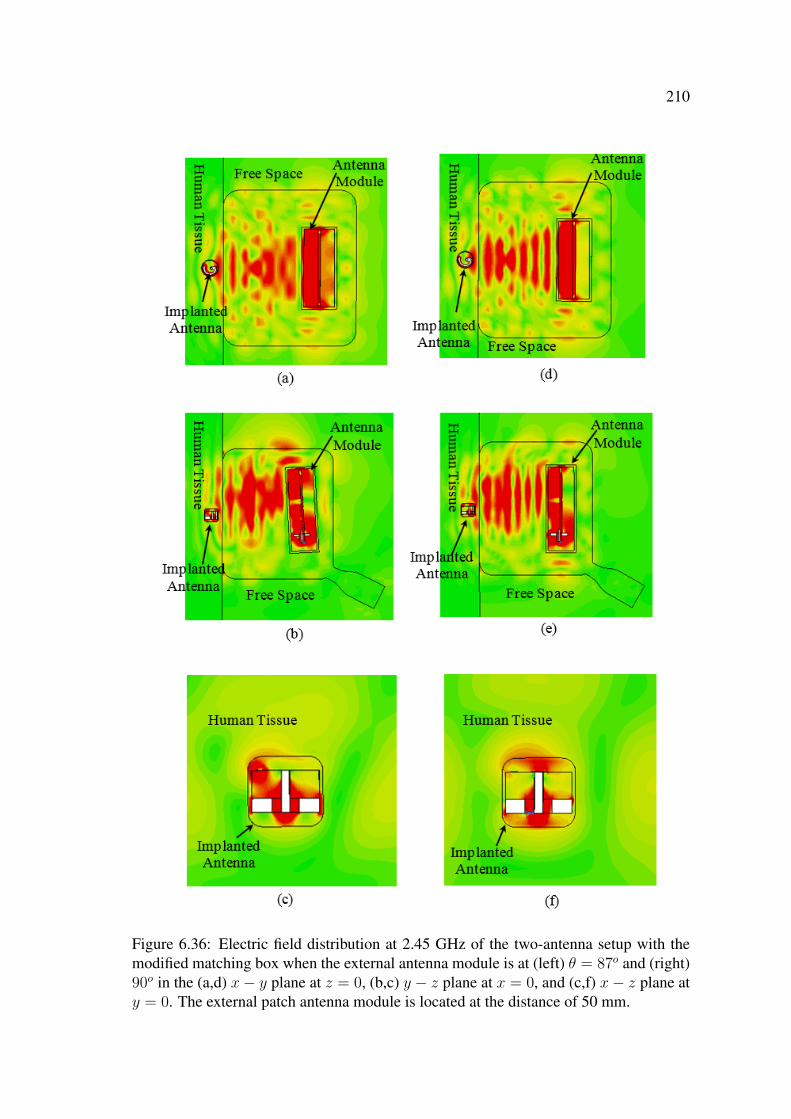
210
Figure 6.36: Electric field distribution at 2.45 GHz of the two-antenna setup with themodified matching box when the external antenna module is at (left) θ = 87o and (right)90o in the (a,d) x− y plane at z = 0, (b,c) y − z plane at x = 0, and (c,f) x− z plane aty = 0. The external patch antenna module is located at the distance of 50 mm.

211
Figure 6.37: Electric field distribution at 2.45 GHz of the two-antenna setup with themodified matching box when the external antenna module is at (left) θ = 87o and (right)90o in the (a,d) x− y plane at z = 0, (b,c) y − z plane at x = 0, and (c,f) x− z plane aty = 0. The external patch antenna module is located at the distance of 20 mm.
212
netic signal that traverses the human tissue, the amount of energy absorbed in the human
tissue has to be evaluated for safety reasons. For this purpose, the specific absorption
rate (SAR) is computed in CST MWS. According to the IEEE (C95.1) standards the
maximum allowed SAR, in an averaged cube of tissue that has a mass of 10 gram, due
to an electric field in the frequency range of 100 kHz to 6 GHz is 2 W/kg [173]. In CST
the SAR is calculated based on the IEEE Recommended Practice for Measurements and
Computations of Radio Frequency Electromagnetic Fields With Respect to Human Expo-
sure to Such Fields, 100 kHz - 300 GHz [173,174]. The 10-20 µA DC stimulus and the 2
W/kg SAR form the design criteria for the microwave wireless power transmission tech-
nique to be used for nerve regeneration. That is, the microwave technique should deliver
the required intensity of the DC stimulus while conforming with the IEEE standards’
safety recommendations.
The external antenna module with the modified matching box is excited by a 100
nsec, 2.45 GHz, sine wave at different power levels, Pe, and the resulting DC signal
Vdc at the implanted rectenna’s output (across the 1 kΩ load) is recorded. The 100 nsec
duration of the sine wave is sufficient (i.e., longer than the time constant of the RC
circuit) to record the received DC signal at the load. However, the average delivered
power from this sine wave is not sufficient (due to its relatively short 100 nsec duration)
to provide accurate computation of the imposed SAR. The built-in tool box in CST MWS
takes this into consideration and can accurately calculate the SAR due to an incident
Gaussian pulse [139]. For this purpose, two exact CST models of the wireless power
transmission technique with the two-antenna setup were created. One model is excited
by the 100 nsec sine wave (to record the DC signal) with a power level Pe and the other is
excited by a Gaussian pulse (to compute the SAR) at the same power level. A summary
of the recorded Vdc at the 1 kΩ load and the corresponding SAR for different power
levels Pe are shown in Table 6.3. As expected, it can be seen from Table 6.3 that as Pe
increased from 0.125 W to 1 W the DC stimulus at the load increased from 10.5 mV to
706 mV and the SAR also increased from 0.40 W/kg to 25.8 W/kg. It can also be seen
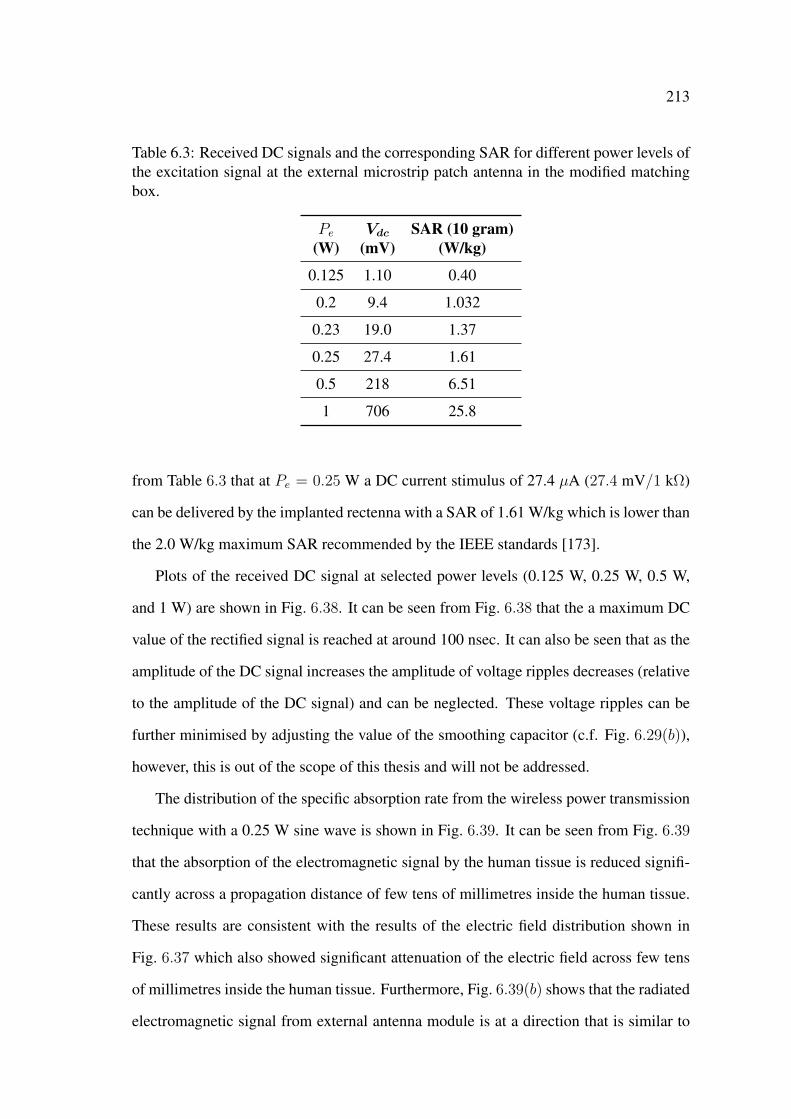
213
Table 6.3: Received DC signals and the corresponding SAR for different power levels ofthe excitation signal at the external microstrip patch antenna in the modified matchingbox.
Pe Vdc SAR (10 gram)(W) (mV) (W/kg)
0.125 1.10 0.40
0.2 9.4 1.032
0.23 19.0 1.37
0.25 27.4 1.61
0.5 218 6.51
1 706 25.8
from Table 6.3 that at Pe = 0.25 W a DC current stimulus of 27.4 µA (27.4 mV/1 kΩ)
can be delivered by the implanted rectenna with a SAR of 1.61 W/kg which is lower than
the 2.0 W/kg maximum SAR recommended by the IEEE standards [173].
Plots of the received DC signal at selected power levels (0.125 W, 0.25 W, 0.5 W,
and 1 W) are shown in Fig. 6.38. It can be seen from Fig. 6.38 that the a maximum DC
value of the rectified signal is reached at around 100 nsec. It can also be seen that as the
amplitude of the DC signal increases the amplitude of voltage ripples decreases (relative
to the amplitude of the DC signal) and can be neglected. These voltage ripples can be
further minimised by adjusting the value of the smoothing capacitor (c.f. Fig. 6.29(b)),
however, this is out of the scope of this thesis and will not be addressed.
The distribution of the specific absorption rate from the wireless power transmission
technique with a 0.25 W sine wave is shown in Fig. 6.39. It can be seen from Fig. 6.39
that the absorption of the electromagnetic signal by the human tissue is reduced signifi-
cantly across a propagation distance of few tens of millimetres inside the human tissue.
These results are consistent with the results of the electric field distribution shown in
Fig. 6.37 which also showed significant attenuation of the electric field across few tens
of millimetres inside the human tissue. Furthermore, Fig. 6.39(b) shows that the radiated
electromagnetic signal from external antenna module is at a direction that is similar to
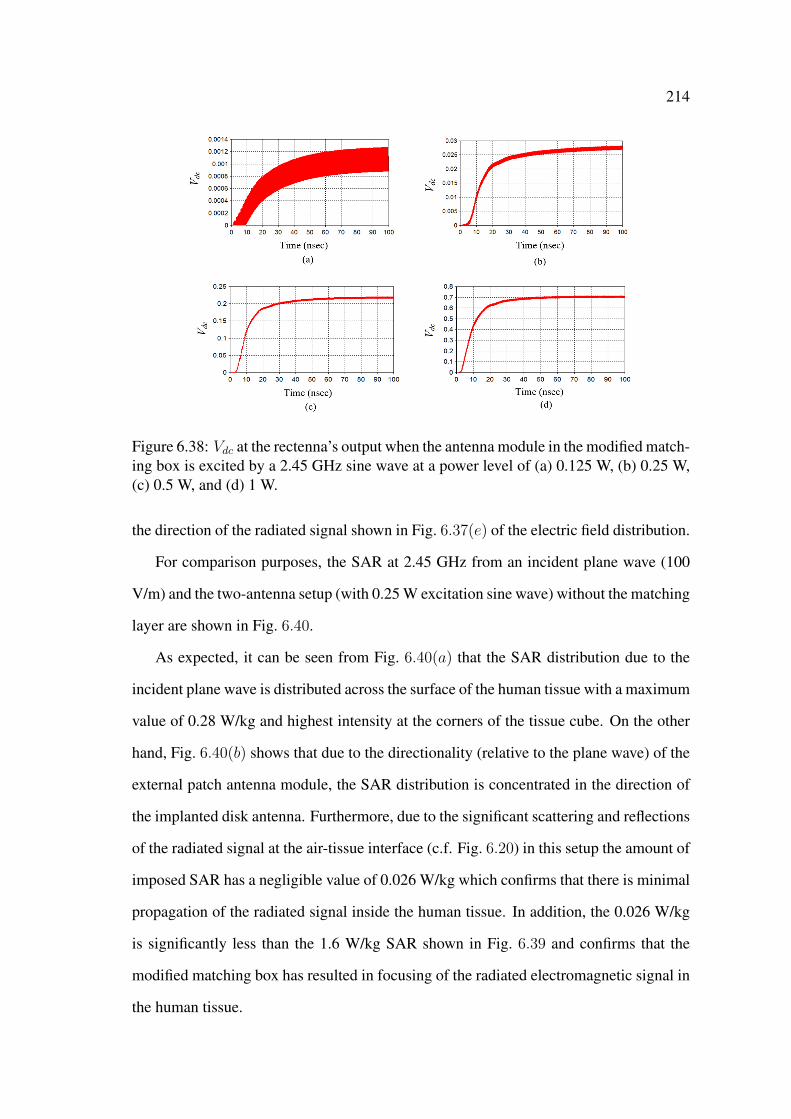
214
Figure 6.38: Vdc at the rectenna’s output when the antenna module in the modified match-ing box is excited by a 2.45 GHz sine wave at a power level of (a) 0.125 W, (b) 0.25 W,(c) 0.5 W, and (d) 1 W.
the direction of the radiated signal shown in Fig. 6.37(e) of the electric field distribution.
For comparison purposes, the SAR at 2.45 GHz from an incident plane wave (100
V/m) and the two-antenna setup (with 0.25 W excitation sine wave) without the matching
layer are shown in Fig. 6.40.
As expected, it can be seen from Fig. 6.40(a) that the SAR distribution due to the
incident plane wave is distributed across the surface of the human tissue with a maximum
value of 0.28 W/kg and highest intensity at the corners of the tissue cube. On the other
hand, Fig. 6.40(b) shows that due to the directionality (relative to the plane wave) of the
external patch antenna module, the SAR distribution is concentrated in the direction of
the implanted disk antenna. Furthermore, due to the significant scattering and reflections
of the radiated signal at the air-tissue interface (c.f. Fig. 6.20) in this setup the amount of
imposed SAR has a negligible value of 0.026 W/kg which confirms that there is minimal
propagation of the radiated signal inside the human tissue. In addition, the 0.026 W/kg
is significantly less than the 1.6 W/kg SAR shown in Fig. 6.39 and confirms that the
modified matching box has resulted in focusing of the radiated electromagnetic signal in
the human tissue.

215
Figure 6.39: Distribution of the specific absorption rate at 2.45 GHz for the two-antennasetup with the modified matching box in the (a) y − z plane at x = 0, (b) x− z plane aty = 0, and (c) x− y plane at z = 0 (not to scale).
Figure 6.40: Distribution of the specific absorption rate from (a) a 100 V/m incidentplane wave and (b) the two-antenna setup without matching the matching layer with anexcitation sine wave of 0.25 W.
216
6.8 Conclusion
A microwave wireless power transmission technique with a miniature microstrip ring
disk antenna was proposed and investigated at 2.45 GHz in the ISM band. The wireless
power transmission technique comprised a two-antenna setup with an external microstrip
patch antenna and an implanted microstrip ring disk antenna in human tissue. A simple
plane wave approximation was used to determine the optimum direction and polarisation
angle. It was found that maximum wireless power transmission can be achieved when
the incident plane wave is propagating towards the implanted disk antenna in human
tissue at a direction that matches the direction of the far-field pattern of the antenna, i.e.,
at the azimuthal angle φ = 270o and at the elevation angle θ = 87o with respect to the
implanted disk antenna. It was also found that the optimum polarisation angle is at 20o
with respect to the z axis.
An external microstrip rectangular patch antenna (designed in Chapter 3) was used
as the external power source and the performance of the wireless power transmission
technique with the two-antenna setup was investigated by recording the magnitudes of
the S-parameters when the disk antenna is implanted inside a small (24 mm) and a large
(500-mm) cube of human tissue. The small cube of human tissue was used to reduce
the simulation time. In this investigation it was found that when the external patch an-
tenna was placed at φ = 270o and θ = 87o the magnitude of the transmission coefficient
S21 had a value of -21.99 dB. A sensitivity study was performed on the effect of varia-
tions in the physical dimensions and electrical properties of both the human tissue and
the implanted disk antenna on the performance of the wireless power transmission tech-
nique. The results of this study showed that the two-antenna setup (and consequently,
the wireless power transmission technique) had a reliable and stable performance under
small variations in the physical dimensions of the implanted disk antenna and electrical
properties of both the implanted disk antenna and the human tissue.
A computational model of a measurement system was used to characterise the wire-
less power transmission technique in the large cube of human tissue by evaluating its
217
efficiency in human tissue is proposed and used. In this system the implanted disk an-
tenna was connected to a rectifying circuit and the received DC signal was recorded.
The magnitude of the transmission coefficient S21 and the received DC signal were used
as measures of the efficiency of the microwave wireless power transmission technique
in a large cube of human tissue. Using the large cube of human tissue has resulted in
a significant reduction in the magnitude of the transmission coefficient S21 to a value
of -38.58 dB and there was a significant amount of reflections/scattering of the radiated
electromagnetic signal from the external antenna at the air-tissue interface. The amount
of reflections/scattering was reduced by inserting a (500×500×50 mm3) matching layer
between the external patch antenna and the large cube of human tissue. The matching
layer resulted in a significant increase in S21 to a value of -23.54 dB.
The capability of the wireless power transmission technique to deliver a DC stimulus
that can be used for nerve stimulation was also investigated. In this investigation the ex-
ternal patch antenna module (designed in Chapter 3) was placed inside a round cornered
matching box, excited by a 0.25 W sine signal, and the resulting DC stimulus at a 1
kΩ load and the specific absorption rate were recorded. The results of this investigation
showed that the wireless power transmission technique with the miniature disk antenna
is capable of delivering a DC stimulus of 27.4 µA with a specific absorption rate of 1.61
W/kg. The 27.4 µA stimulus is comparable to the 10-20 µA stimuli used in the literature
for nerve stimulation and the 1.61 W/kg SAR conforms with the IEEE standards. The
results in this chapter show that if there is symmetry between the electromagnetic per-
formances of the implanted and external antennas, efficient microwave wireless power
transmission to miniature microstrip antennas in human tissue can be achieved, even if
the antennas have different geometries and sizes.
Because of its miniature size and shape (no sharp edges), the miniature microstrip
ring disk antenna can be used for implantable applications such as nerve regeneration.
However, its closed cylindrical shape doesn’t make it ideal for the direct implantation on
nerves.
Chapter 7
Microwave Technique with
Implantable Open
Cylindrical-Rectangular Microstrip
Patch Antenna for Nerve Stimulation
7.1 Introduction
In Chapter 6, it was shown that the implanted miniature microstrip ring disk antenna can
be used in wireless power transmission techniques for nerve stimulation. However and
despite the miniature size of the disk antenna, the geometry of the antenna is not ideal for
direct implantation at the stimulation site (i.e., on nerves) for nerve stimulation applica-
tions. In this chapter a novel implantable open cylindrical-rectangular microstrip patch
antenna is proposed for the direct implantation on nerves. Microwave wireless power
transmission technique with the open cylindrical-rectangular microstrip patch antenna
in human tissue is optimised at 2.45 GHz for nerve stimulation. The open cylindrical
antenna has a length that is comparable to the length of current nerve grafts (e.g., tissue
engineered nerve grafts) used for nerve regeneration.
219
7.2 Simulation Approach
CST Microwave Studio (MWS) is used to investigate the electromagnetic performance
of a microwave wireless power transmission technique with the open cylindrical-rectangular
microstrip patch antenna in human tissue at 2.45 GHz (i.e., in theISM) band.
First, a conventional cylindrical-rectangular microstrip patch antenna is designed and
investigated in free space and in human tissue. Second, the cylindrical-rectangular mi-
crostrip patch antenna is opened by adding a longitudinal slot along the full length of
the antenna and the performance of the open cylindrical antenna in human tissue is
investigated and optimised at 2.45 GHz. Finally, the electromagnetic performance of
a microwave wireless power transmission technique that includes the implanted open
cylindrical antenna and an external antenna in free space is investigated for nerve stimu-
lation.
7.3 An Implantable Cylindrical-Rectangular Microstrip
Patch Antenna
7.3.1 Free Space
The CST model of the cylindrical-rectangular microstrip patch antenna in free space is
shown in Fig. 7.1. The antenna has a rectangular patch that is imprinted on a cylindrical
substrate with a cylindrical ground underneath. To design the antenna with small thick-
ness, the radii of the ground cylinder and the substrate are chosen to be 1.5 mm and 2.5
mm, respectively, i.e., the substrate has a thickness of 1 mm. Similar to the miniature
microstrip ring disk antenna (c.f. Chapter 5), the substrate is modelled from F4BK335
with a relative dielectric constant, εrs, of 3.5 and a loss tangent, tan δs, of 0.001. Both
the substrate and the ground cylinders have a height of 44 mm which is slightly shorter
than the 50 mm substrate and ground plane of the microstrip rectangular patch antenna
designed in Chapter 3. The cylindrical antenna has a rectangular patch that is imprinted
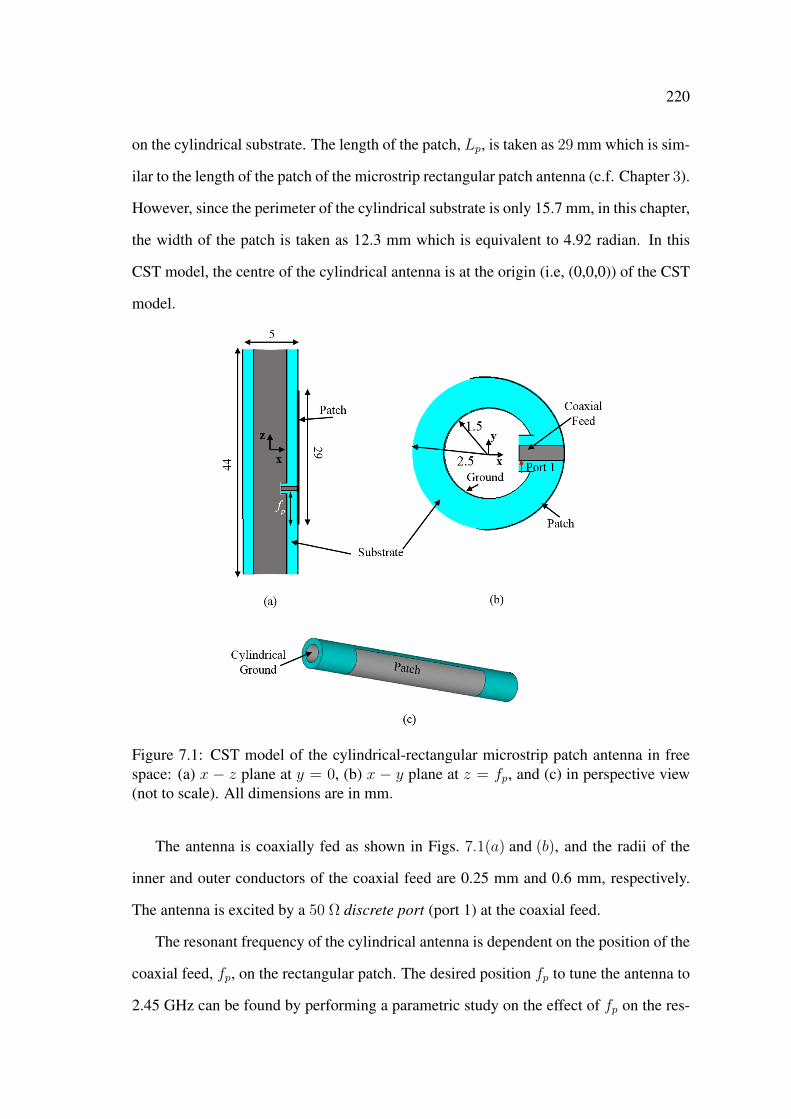
220
on the cylindrical substrate. The length of the patch, Lp, is taken as 29 mm which is sim-
ilar to the length of the patch of the microstrip rectangular patch antenna (c.f. Chapter 3).
However, since the perimeter of the cylindrical substrate is only 15.7 mm, in this chapter,
the width of the patch is taken as 12.3 mm which is equivalent to 4.92 radian. In this
CST model, the centre of the cylindrical antenna is at the origin (i.e, (0,0,0)) of the CST
model.
Figure 7.1: CST model of the cylindrical-rectangular microstrip patch antenna in freespace: (a) x − z plane at y = 0, (b) x − y plane at z = fp, and (c) in perspective view(not to scale). All dimensions are in mm.
The antenna is coaxially fed as shown in Figs. 7.1(a) and (b), and the radii of the
inner and outer conductors of the coaxial feed are 0.25 mm and 0.6 mm, respectively.
The antenna is excited by a 50 Ω discrete port (port 1) at the coaxial feed.
The resonant frequency of the cylindrical antenna is dependent on the position of the
coaxial feed, fp, on the rectangular patch. The desired position fp to tune the antenna to
2.45 GHz can be found by performing a parametric study on the effect of fp on the res-
221
onant frequency, fr, and the magnitude of the reflection coefficient, S11. Typically, fr is
affected by the position of the coaxial feed along both the length and width of the patch.
However, because of the antenna’s cylindrical geometry it is difficult to parametrise fp
along the width of the rectangular patch. Hence, the parametric study is performed only
along the vertical length of the rectangular patch. In this study, fp refers to the relative
displacement from the bottom edge of the rectangular patch. That is, at fp = 0 the centre
of the inner conductor of the coaxial feed is at the bottom edge of the rectangular patch
and at fp = −14.5 mm the coaxial feed is at the centre of the patch.
The results of the parametric study are shown in Fig. 7.2. It can be seen from
Fig. 7.2(a) that at fp = 8.5 mm (marker-1) the cylindrical antenna resonates at 2.46
GHz. However, Fig. 7.2(b) shows that at fp = 8.5 mm the antenna has a high S11 of
-6.67 dB. On the other hand, Fig. 7.2 shows that at fp = 4.5 mm the cylindrical antenna
has a good S11 of -53.7 dB and an fr of 2.49 GHz. Furthermore, Fig. 7.2(a) shows that
because of the symmetry in the geometry of the antenna there is symmetry in the plot of
the resonant frequency as fp varies around the centre of the patch. Since the previously
obtained results in Chs. 3 and 5 showed that the human tissue can result in a significant
reduction in the resonant frequency of the implanted antenna, it is logical that antennas
which are designed for implantable applications should resonate at a slightly higher fre-
quency in free space than the desired frequency in human tissue. Hence, the coaxial feed
is placed at fp = 4.5 mm (marker-2) and the resulting S11 versus frequency is depicted
in Fig. 7.3. In free space the cylindrical-rectangular microstrip patch antenna resonates
at 2.49 GHz with a good S11 of -46.68 dB.
The electric field intensity distribution at 2.49 GHz of the cylindrical-rectangular mi-
crostrip patch antenna in free space is shown in Fig. 7.4. It can be seen from Fig. 7.4(a)
and (b) that there is high concentration of the electric field around the top and bottom
edges of the cylindrical antenna. Furthermore, Fig. 7.4(b) shows that in the y − z plane
the field is symmetrical around the top and bottom of the cylindrical antenna. How-
ever, this symmetry is not seen in Figs. 7.4(a) and (c) which show that there is more

222
Figure 7.2: (a) Resonant frequency fr and (b) S11 vs fp of the coaxial feed of thecylindrical-rectangular microstrip patch antenna in free space.
Figure 7.3: S11 vs frequency of the cylindrical-rectangular microstrip patch antenna infree space.
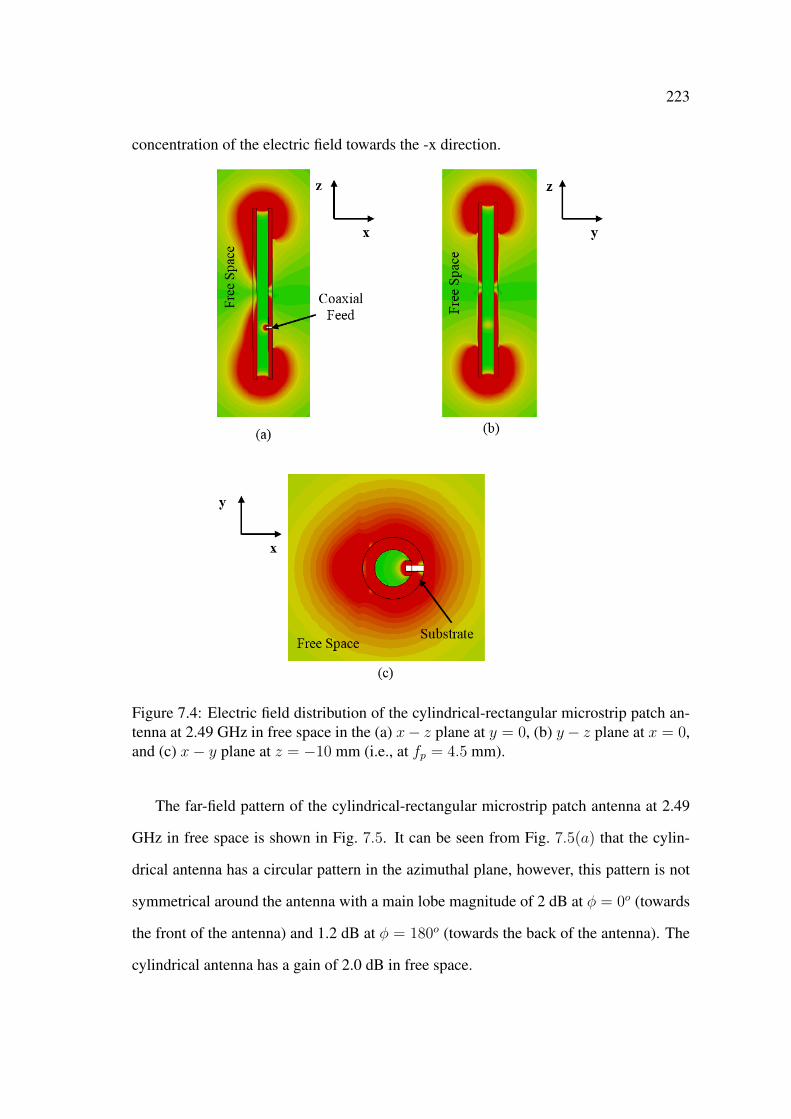
223
concentration of the electric field towards the -x direction.
Figure 7.4: Electric field distribution of the cylindrical-rectangular microstrip patch an-tenna at 2.49 GHz in free space in the (a) x− z plane at y = 0, (b) y− z plane at x = 0,and (c) x− y plane at z = −10 mm (i.e., at fp = 4.5 mm).
The far-field pattern of the cylindrical-rectangular microstrip patch antenna at 2.49
GHz in free space is shown in Fig. 7.5. It can be seen from Fig. 7.5(a) that the cylin-
drical antenna has a circular pattern in the azimuthal plane, however, this pattern is not
symmetrical around the antenna with a main lobe magnitude of 2 dB at φ = 0o (towards
the front of the antenna) and 1.2 dB at φ = 180o (towards the back of the antenna). The
cylindrical antenna has a gain of 2.0 dB in free space.

224
Figure 7.5: Far-field pattern (dB) of the cylindrical-rectangular microstrip patch antennaat 2.49 GHz in free space in the (a) azimuthal and (b) elevation planes, and (c) 3-Dformat.
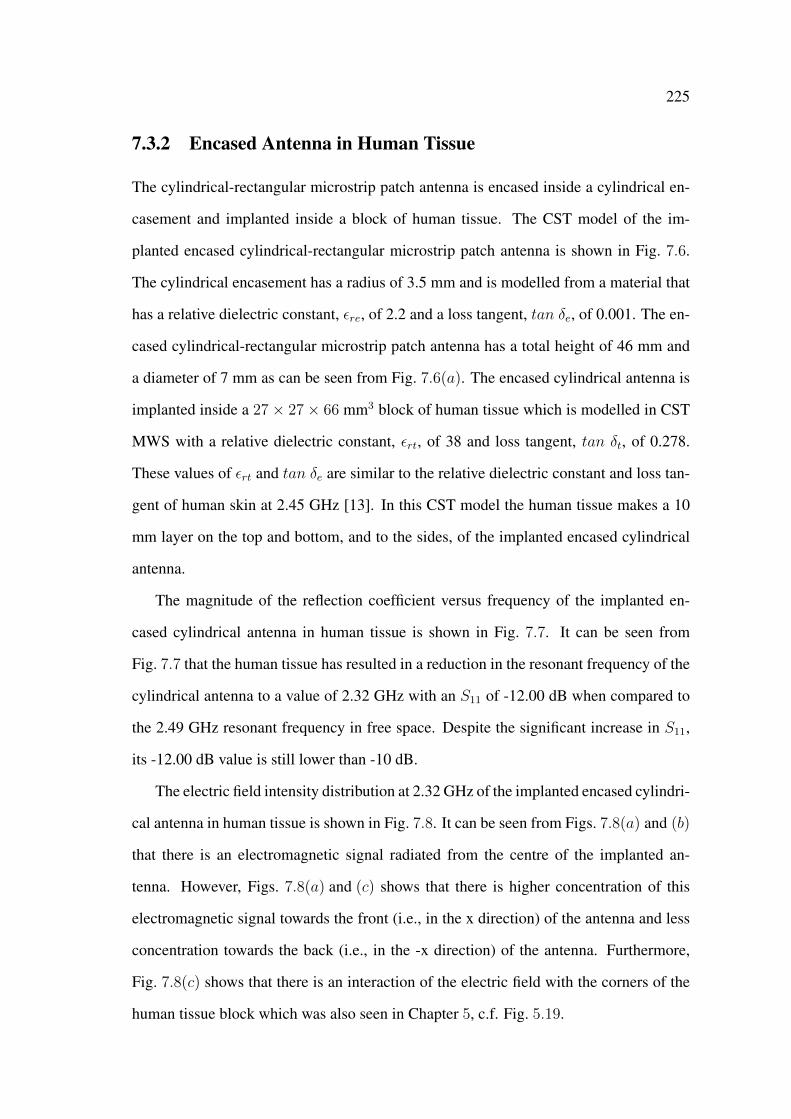
225
7.3.2 Encased Antenna in Human Tissue
The cylindrical-rectangular microstrip patch antenna is encased inside a cylindrical en-
casement and implanted inside a block of human tissue. The CST model of the im-
planted encased cylindrical-rectangular microstrip patch antenna is shown in Fig. 7.6.
The cylindrical encasement has a radius of 3.5 mm and is modelled from a material that
has a relative dielectric constant, εre, of 2.2 and a loss tangent, tan δe, of 0.001. The en-
cased cylindrical-rectangular microstrip patch antenna has a total height of 46 mm and
a diameter of 7 mm as can be seen from Fig. 7.6(a). The encased cylindrical antenna is
implanted inside a 27× 27× 66 mm3 block of human tissue which is modelled in CST
MWS with a relative dielectric constant, εrt, of 38 and loss tangent, tan δt, of 0.278.
These values of εrt and tan δe are similar to the relative dielectric constant and loss tan-
gent of human skin at 2.45 GHz [13]. In this CST model the human tissue makes a 10
mm layer on the top and bottom, and to the sides, of the implanted encased cylindrical
antenna.
The magnitude of the reflection coefficient versus frequency of the implanted en-
cased cylindrical antenna in human tissue is shown in Fig. 7.7. It can be seen from
Fig. 7.7 that the human tissue has resulted in a reduction in the resonant frequency of the
cylindrical antenna to a value of 2.32 GHz with an S11 of -12.00 dB when compared to
the 2.49 GHz resonant frequency in free space. Despite the significant increase in S11,
its -12.00 dB value is still lower than -10 dB.
The electric field intensity distribution at 2.32 GHz of the implanted encased cylindri-
cal antenna in human tissue is shown in Fig. 7.8. It can be seen from Figs. 7.8(a) and (b)
that there is an electromagnetic signal radiated from the centre of the implanted an-
tenna. However, Figs. 7.8(a) and (c) shows that there is higher concentration of this
electromagnetic signal towards the front (i.e., in the x direction) of the antenna and less
concentration towards the back (i.e., in the -x direction) of the antenna. Furthermore,
Fig. 7.8(c) shows that there is an interaction of the electric field with the corners of the
human tissue block which was also seen in Chapter 5, c.f. Fig. 5.19.
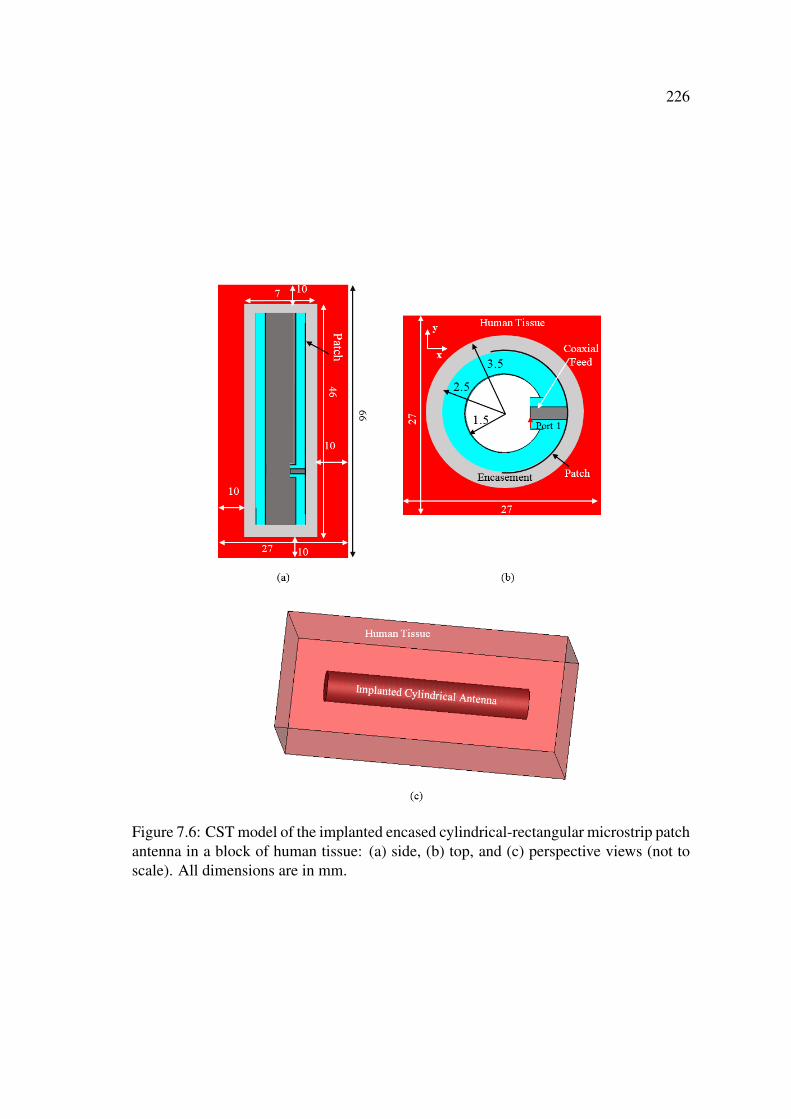
226
Figure 7.6: CST model of the implanted encased cylindrical-rectangular microstrip patchantenna in a block of human tissue: (a) side, (b) top, and (c) perspective views (not toscale). All dimensions are in mm.
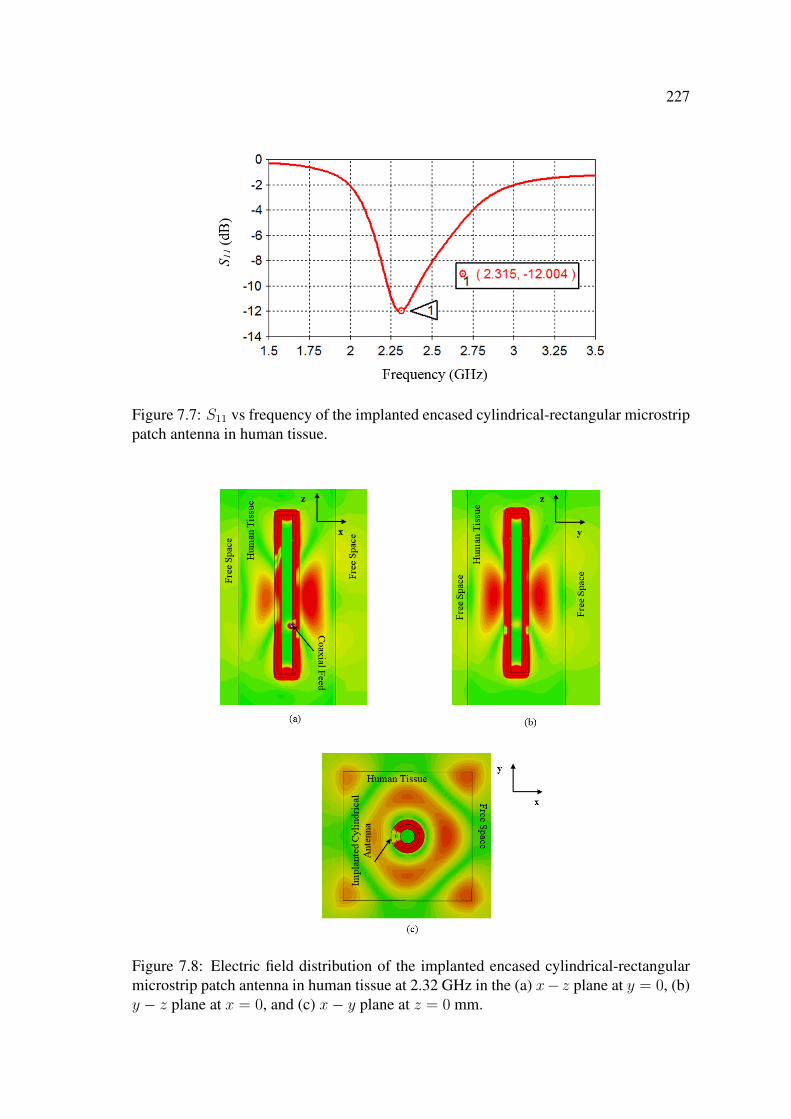
227
Figure 7.7: S11 vs frequency of the implanted encased cylindrical-rectangular microstrippatch antenna in human tissue.
Figure 7.8: Electric field distribution of the implanted encased cylindrical-rectangularmicrostrip patch antenna in human tissue at 2.32 GHz in the (a) x− z plane at y = 0, (b)y − z plane at x = 0, and (c) x− y plane at z = 0 mm.

228
The far-field pattern at 2.32 GHz of the implanted encased cylindrical antenna in
human tissue is shown in Fig. 7.9. The implanted antenna has a far-field pattern that
is similar to the far-field pattern (c.f. Fig. 7.5) of the cylindrical antenna in free space.
However, the asymmetry of the far-field patterns is more apparent around the implanted
antenna when compared to the free space antenna. Furthermore and as expected, due to
the lossiness of the human tissue the implanted antenna has a gain of -6.6 dB which is
significantly less than the free space gain of 2.0 dB and is comparable to the -6.37 dB
gain of the implanted miniature encased disk antenna in human tissue (c.f. Fig. 5.18).
Figure 7.9: Far-field pattern (dB) of the implanted cylindrical-rectangular microstrippatch antenna in human tissue at 2.32 GHz in the (a) azimuthal and (b) elevation planes,and (c) 3-D format.

229
7.4 An Implantable Encased Open Cylindrical-Rectangular
Microstrip Patch Antenna
The similarity between the geometry of the cylindrical-rectangular microstrip patch an-
tenna and the cylindrical shape of nerves makes the cylindrical antenna a good candidate
for direct installation of the antenna on the nerve, i.e., on the stimulation site without
the need for the wired electrodes. However, fully closed cylindrical antennas can only
be installed on fully severed nerves. Fully severing the nerves to install the antenna can
be problematic and defies the purpose of the treatment. The problem can be solved by
adding a longitudinal slot along the full length of the cylindrical-rectangular microstrip
patch antenna. In this chapter, the cylindrical-rectangular microstrip patch antenna with
the longitudinal slot is referred to as the open cylindrical-rectangular microstrip patch
antenna.
7.4.1 Free Space
The CST model of the encased open cylindrical-rectangular microstrip patch antenna
with a longitudinal slot is shown in Fig. 7.10. The slot has a width of 1.5 mm and a
length of 46 mm as can be seen from Fig. 7.10(a). The slot enables the installation of
the open cylindrical antenna on non-fully severed nerves.
The magnitude of the reflection coefficient S11 of the open cylindrical-rectangular
microstrip patch antenna in free space is shown in Fig. 7.11. The antenna resonates at
2.39 GHz with an S11 of -31.22 dB, i.e., the longitudinal slot has resulted in a slight
decrease in the resonant frequency of the open cylindrical antenna when compared to
the resonant frequency of the closed cylindrical antenna in free (2.49 GHz, c.f. Fig. 7.3).
The electric field intensity distribution at 2.39 GHz of the open cylindrical antenna
in free space depicted in Fig. 7.12 shows that the antenna has an electric field intensity
distribution which is similar to that of the closed cylindrical antenna (c.f. Fig. 7.4).
However, Fig. 7.12(c) shows that in the x − y plane the electric field around the open

230
Figure 7.10: CST model of the open cylindrical-rectangular microstrip patch antenna infree space in the (a) x − z plane at y = 0, (b) x − y plane at z = −10 mm, (c) y − zplane at x = 0, and (d) in the perspective view (not to scale). All dimensions are in mm.
Figure 7.11: S11 vs frequency of the open cylindrical-rectangular microstrip patch an-tenna in free space.
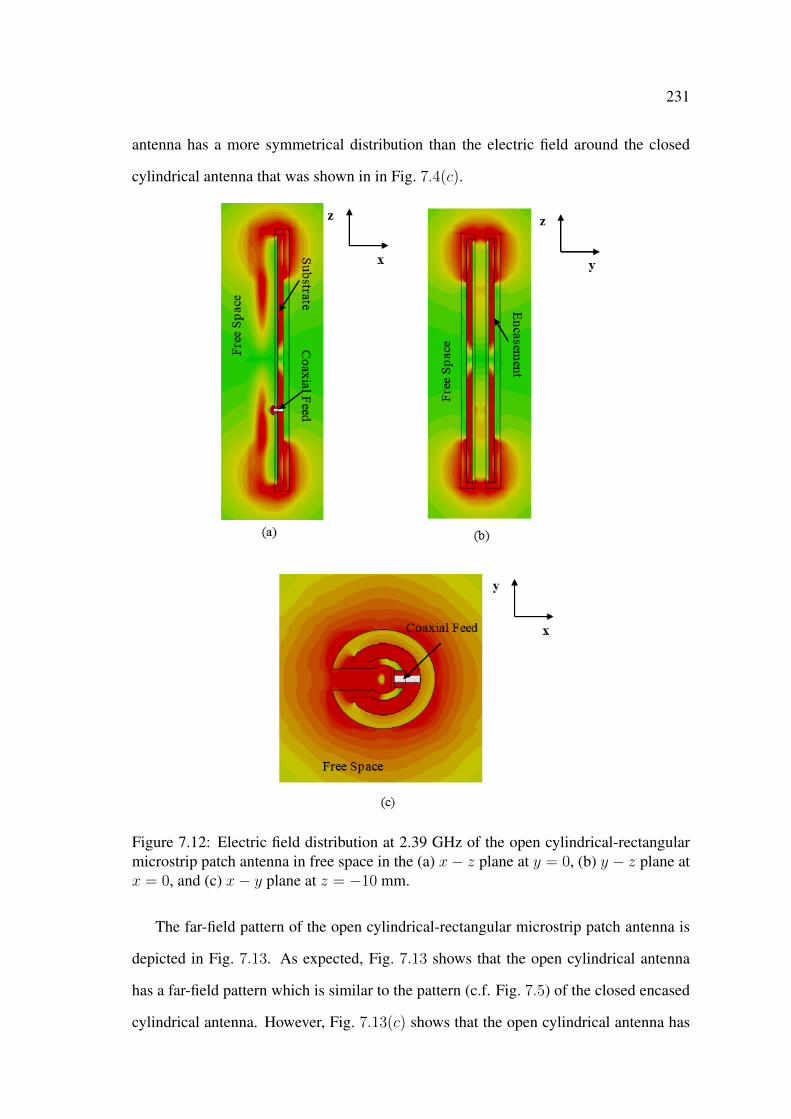
231
antenna has a more symmetrical distribution than the electric field around the closed
cylindrical antenna that was shown in in Fig. 7.4(c).
Figure 7.12: Electric field distribution at 2.39 GHz of the open cylindrical-rectangularmicrostrip patch antenna in free space in the (a) x− z plane at y = 0, (b) y − z plane atx = 0, and (c) x− y plane at z = −10 mm.
The far-field pattern of the open cylindrical-rectangular microstrip patch antenna is
depicted in Fig. 7.13. As expected, Fig. 7.13 shows that the open cylindrical antenna
has a far-field pattern which is similar to the pattern (c.f. Fig. 7.5) of the closed encased
cylindrical antenna. However, Fig. 7.13(c) shows that the open cylindrical antenna has
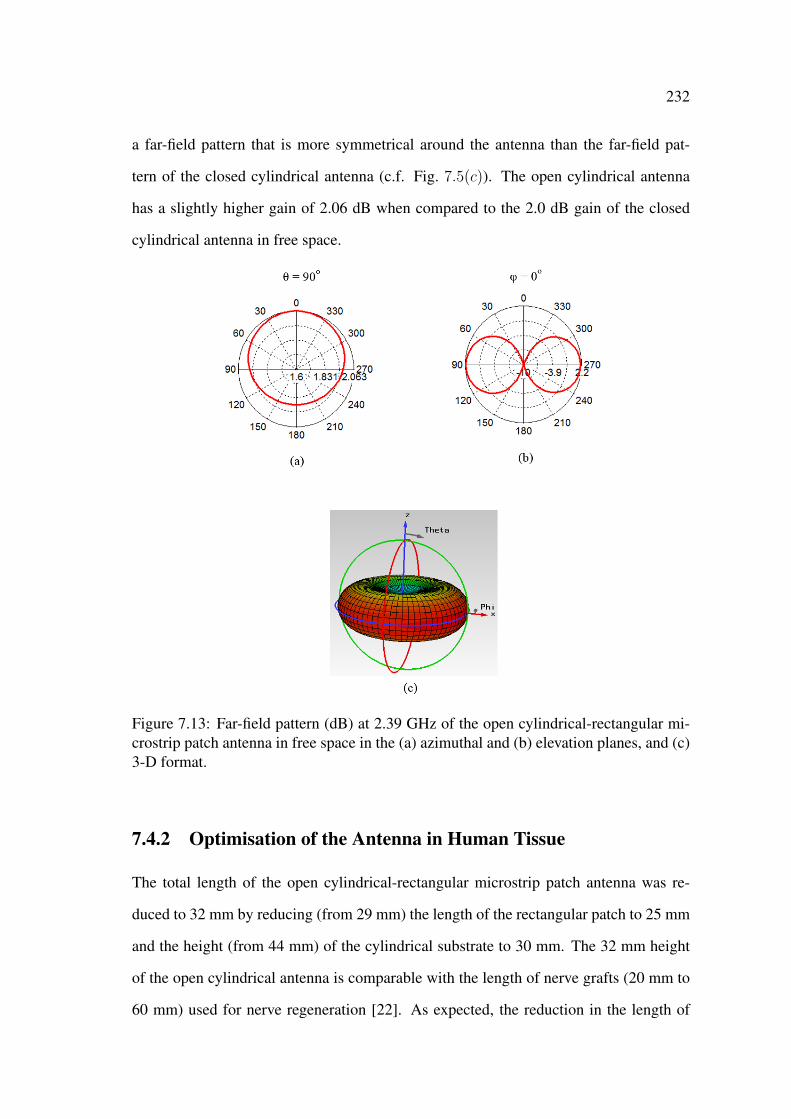
232
a far-field pattern that is more symmetrical around the antenna than the far-field pat-
tern of the closed cylindrical antenna (c.f. Fig. 7.5(c)). The open cylindrical antenna
has a slightly higher gain of 2.06 dB when compared to the 2.0 dB gain of the closed
cylindrical antenna in free space.
Figure 7.13: Far-field pattern (dB) at 2.39 GHz of the open cylindrical-rectangular mi-crostrip patch antenna in free space in the (a) azimuthal and (b) elevation planes, and (c)3-D format.
7.4.2 Optimisation of the Antenna in Human Tissue
The total length of the open cylindrical-rectangular microstrip patch antenna was re-
duced to 32 mm by reducing (from 29 mm) the length of the rectangular patch to 25 mm
and the height (from 44 mm) of the cylindrical substrate to 30 mm. The 32 mm height
of the open cylindrical antenna is comparable with the length of nerve grafts (20 mm to
60 mm) used for nerve regeneration [22]. As expected, the reduction in the length of
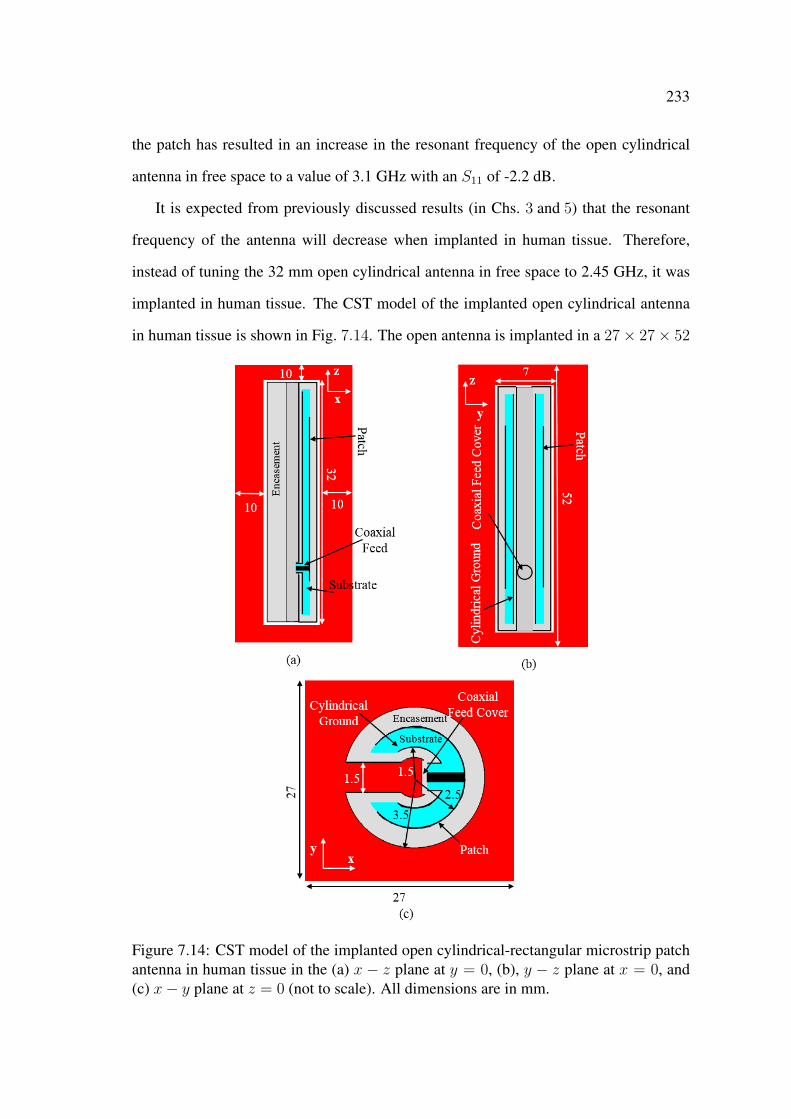
233
the patch has resulted in an increase in the resonant frequency of the open cylindrical
antenna in free space to a value of 3.1 GHz with an S11 of -2.2 dB.
It is expected from previously discussed results (in Chs. 3 and 5) that the resonant
frequency of the antenna will decrease when implanted in human tissue. Therefore,
instead of tuning the 32 mm open cylindrical antenna in free space to 2.45 GHz, it was
implanted in human tissue. The CST model of the implanted open cylindrical antenna
in human tissue is shown in Fig. 7.14. The open antenna is implanted in a 27× 27× 52
Figure 7.14: CST model of the implanted open cylindrical-rectangular microstrip patchantenna in human tissue in the (a) x − z plane at y = 0, (b), y − z plane at x = 0, and(c) x− y plane at z = 0 (not to scale). All dimensions are in mm.
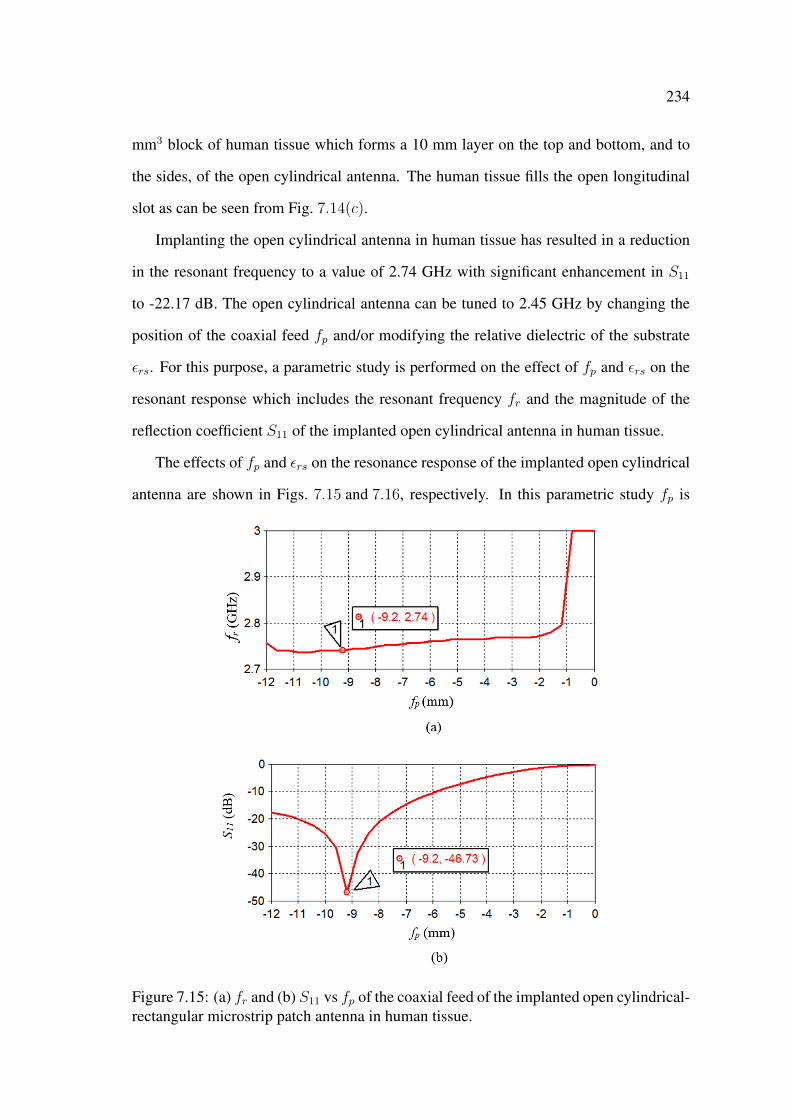
234
mm3 block of human tissue which forms a 10 mm layer on the top and bottom, and to
the sides, of the open cylindrical antenna. The human tissue fills the open longitudinal
slot as can be seen from Fig. 7.14(c).
Implanting the open cylindrical antenna in human tissue has resulted in a reduction
in the resonant frequency to a value of 2.74 GHz with significant enhancement in S11
to -22.17 dB. The open cylindrical antenna can be tuned to 2.45 GHz by changing the
position of the coaxial feed fp and/or modifying the relative dielectric of the substrate
εrs. For this purpose, a parametric study is performed on the effect of fp and εrs on the
resonant response which includes the resonant frequency fr and the magnitude of the
reflection coefficient S11 of the implanted open cylindrical antenna in human tissue.
The effects of fp and εrs on the resonance response of the implanted open cylindrical
antenna are shown in Figs. 7.15 and 7.16, respectively. In this parametric study fp is
Figure 7.15: (a) fr and (b) S11 vs fp of the coaxial feed of the implanted open cylindrical-rectangular microstrip patch antenna in human tissue.
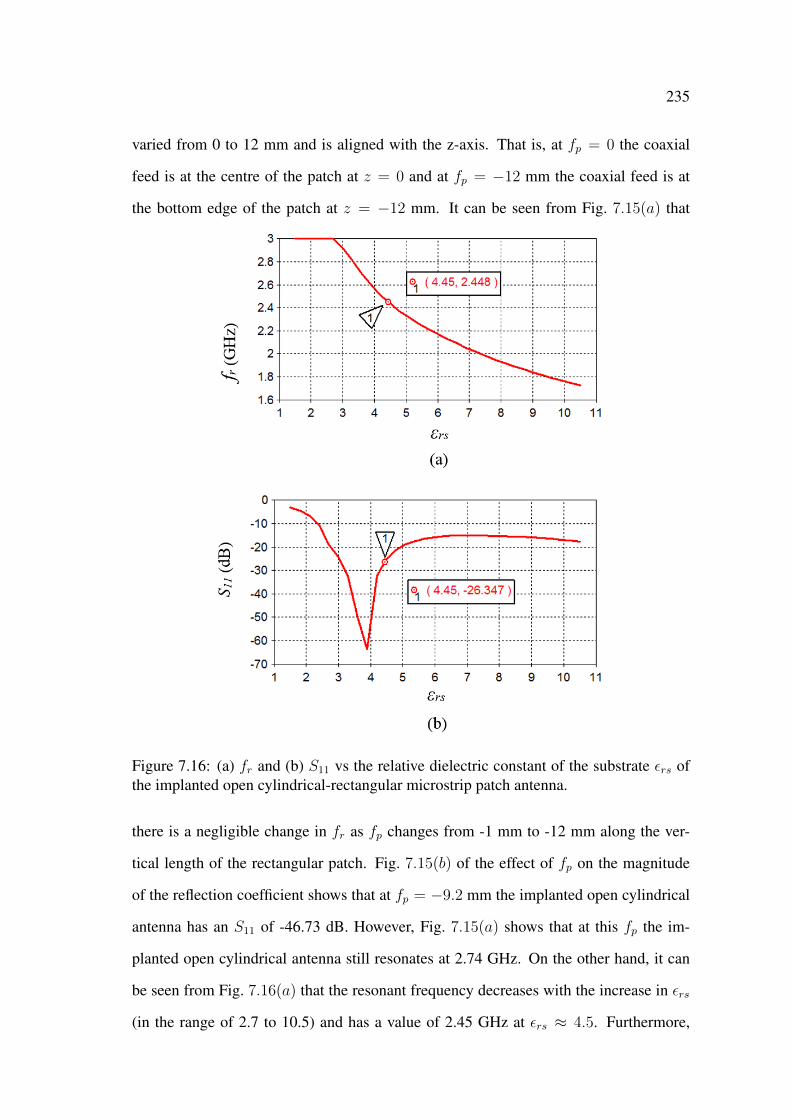
235
varied from 0 to 12 mm and is aligned with the z-axis. That is, at fp = 0 the coaxial
feed is at the centre of the patch at z = 0 and at fp = −12 mm the coaxial feed is at
the bottom edge of the patch at z = −12 mm. It can be seen from Fig. 7.15(a) that
Figure 7.16: (a) fr and (b) S11 vs the relative dielectric constant of the substrate εrs ofthe implanted open cylindrical-rectangular microstrip patch antenna.
there is a negligible change in fr as fp changes from -1 mm to -12 mm along the ver-
tical length of the rectangular patch. Fig. 7.15(b) of the effect of fp on the magnitude
of the reflection coefficient shows that at fp = −9.2 mm the implanted open cylindrical
antenna has an S11 of -46.73 dB. However, Fig. 7.15(a) shows that at this fp the im-
planted open cylindrical antenna still resonates at 2.74 GHz. On the other hand, it can
be seen from Fig. 7.16(a) that the resonant frequency decreases with the increase in εrs
(in the range of 2.7 to 10.5) and has a value of 2.45 GHz at εrs ≈ 4.5. Furthermore,
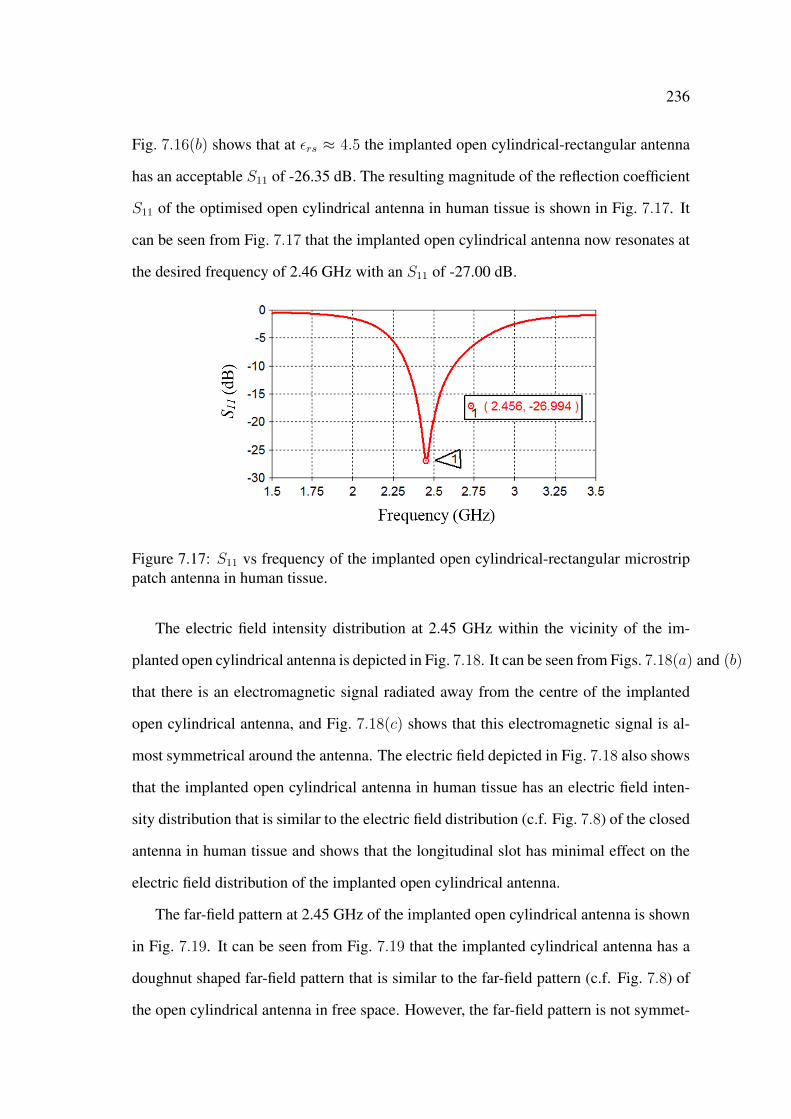
236
Fig. 7.16(b) shows that at εrs ≈ 4.5 the implanted open cylindrical-rectangular antenna
has an acceptable S11 of -26.35 dB. The resulting magnitude of the reflection coefficient
S11 of the optimised open cylindrical antenna in human tissue is shown in Fig. 7.17. It
can be seen from Fig. 7.17 that the implanted open cylindrical antenna now resonates at
the desired frequency of 2.46 GHz with an S11 of -27.00 dB.
Figure 7.17: S11 vs frequency of the implanted open cylindrical-rectangular microstrippatch antenna in human tissue.
The electric field intensity distribution at 2.45 GHz within the vicinity of the im-
planted open cylindrical antenna is depicted in Fig. 7.18. It can be seen from Figs. 7.18(a) and (b)
that there is an electromagnetic signal radiated away from the centre of the implanted
open cylindrical antenna, and Fig. 7.18(c) shows that this electromagnetic signal is al-
most symmetrical around the antenna. The electric field depicted in Fig. 7.18 also shows
that the implanted open cylindrical antenna in human tissue has an electric field inten-
sity distribution that is similar to the electric field distribution (c.f. Fig. 7.8) of the closed
antenna in human tissue and shows that the longitudinal slot has minimal effect on the
electric field distribution of the implanted open cylindrical antenna.
The far-field pattern at 2.45 GHz of the implanted open cylindrical antenna is shown
in Fig. 7.19. It can be seen from Fig. 7.19 that the implanted cylindrical antenna has a
doughnut shaped far-field pattern that is similar to the far-field pattern (c.f. Fig. 7.8) of
the open cylindrical antenna in free space. However, the far-field pattern is not symmet-
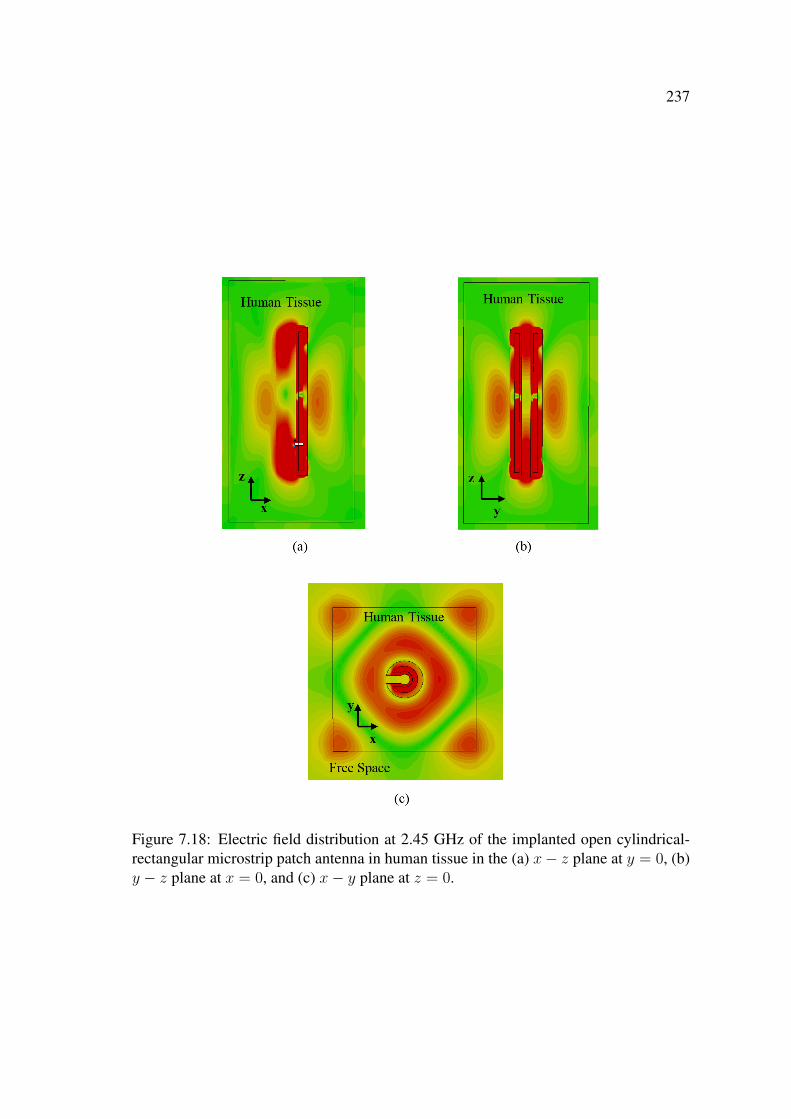
237
Figure 7.18: Electric field distribution at 2.45 GHz of the implanted open cylindrical-rectangular microstrip patch antenna in human tissue in the (a) x− z plane at y = 0, (b)y − z plane at x = 0, and (c) x− y plane at z = 0.
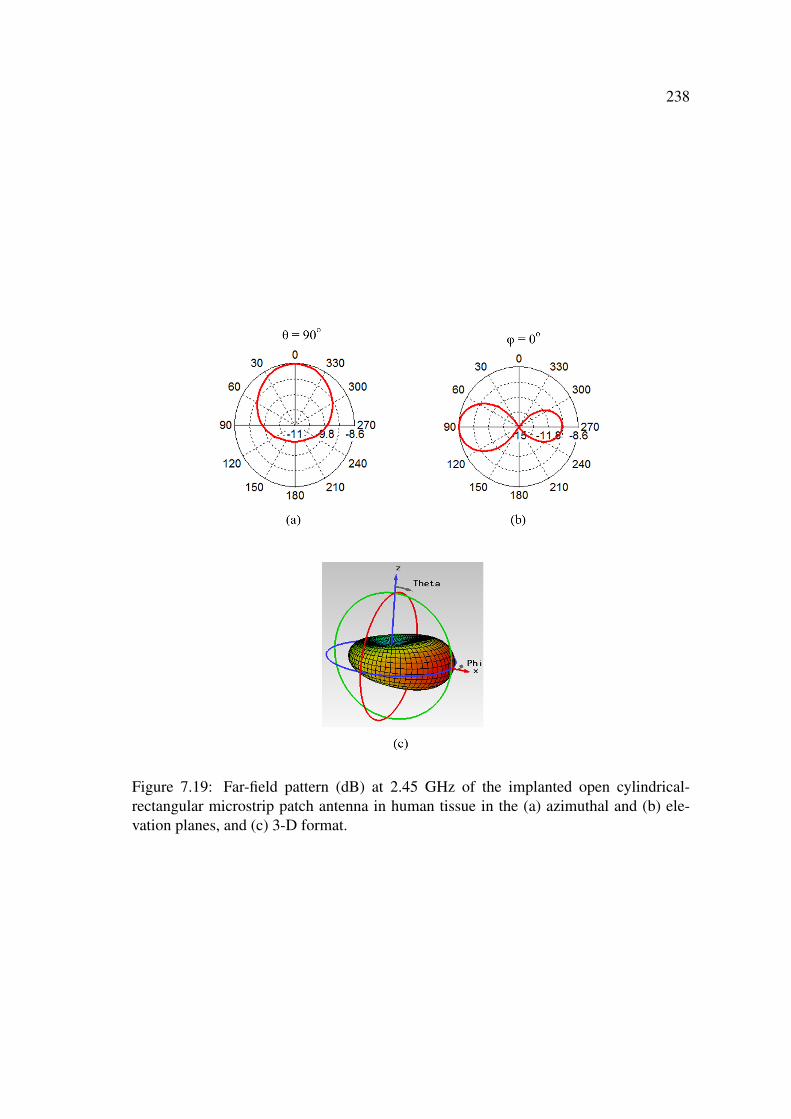
238
Figure 7.19: Far-field pattern (dB) at 2.45 GHz of the implanted open cylindrical-rectangular microstrip patch antenna in human tissue in the (a) azimuthal and (b) ele-vation planes, and (c) 3-D format.
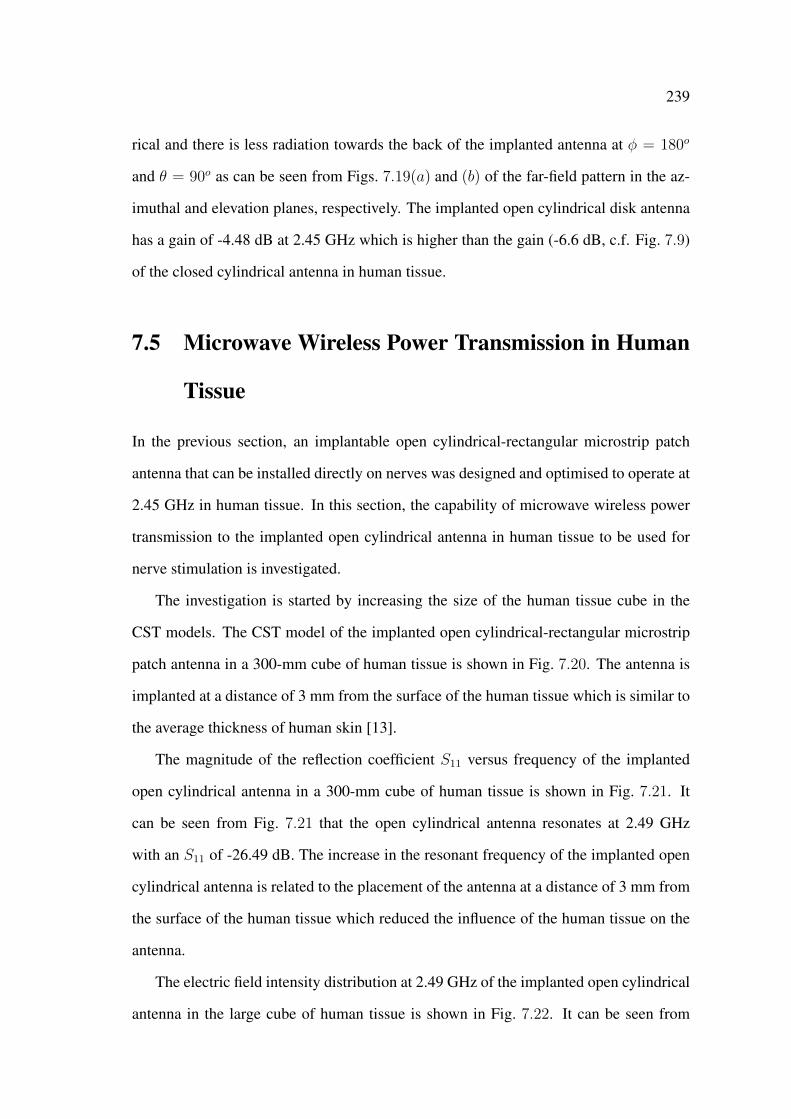
239
rical and there is less radiation towards the back of the implanted antenna at φ = 180o
and θ = 90o as can be seen from Figs. 7.19(a) and (b) of the far-field pattern in the az-
imuthal and elevation planes, respectively. The implanted open cylindrical disk antenna
has a gain of -4.48 dB at 2.45 GHz which is higher than the gain (-6.6 dB, c.f. Fig. 7.9)
of the closed cylindrical antenna in human tissue.
7.5 Microwave Wireless Power Transmission in Human
Tissue
In the previous section, an implantable open cylindrical-rectangular microstrip patch
antenna that can be installed directly on nerves was designed and optimised to operate at
2.45 GHz in human tissue. In this section, the capability of microwave wireless power
transmission to the implanted open cylindrical antenna in human tissue to be used for
nerve stimulation is investigated.
The investigation is started by increasing the size of the human tissue cube in the
CST models. The CST model of the implanted open cylindrical-rectangular microstrip
patch antenna in a 300-mm cube of human tissue is shown in Fig. 7.20. The antenna is
implanted at a distance of 3 mm from the surface of the human tissue which is similar to
the average thickness of human skin [13].
The magnitude of the reflection coefficient S11 versus frequency of the implanted
open cylindrical antenna in a 300-mm cube of human tissue is shown in Fig. 7.21. It
can be seen from Fig. 7.21 that the open cylindrical antenna resonates at 2.49 GHz
with an S11 of -26.49 dB. The increase in the resonant frequency of the implanted open
cylindrical antenna is related to the placement of the antenna at a distance of 3 mm from
the surface of the human tissue which reduced the influence of the human tissue on the
antenna.
The electric field intensity distribution at 2.49 GHz of the implanted open cylindrical
antenna in the large cube of human tissue is shown in Fig. 7.22. It can be seen from
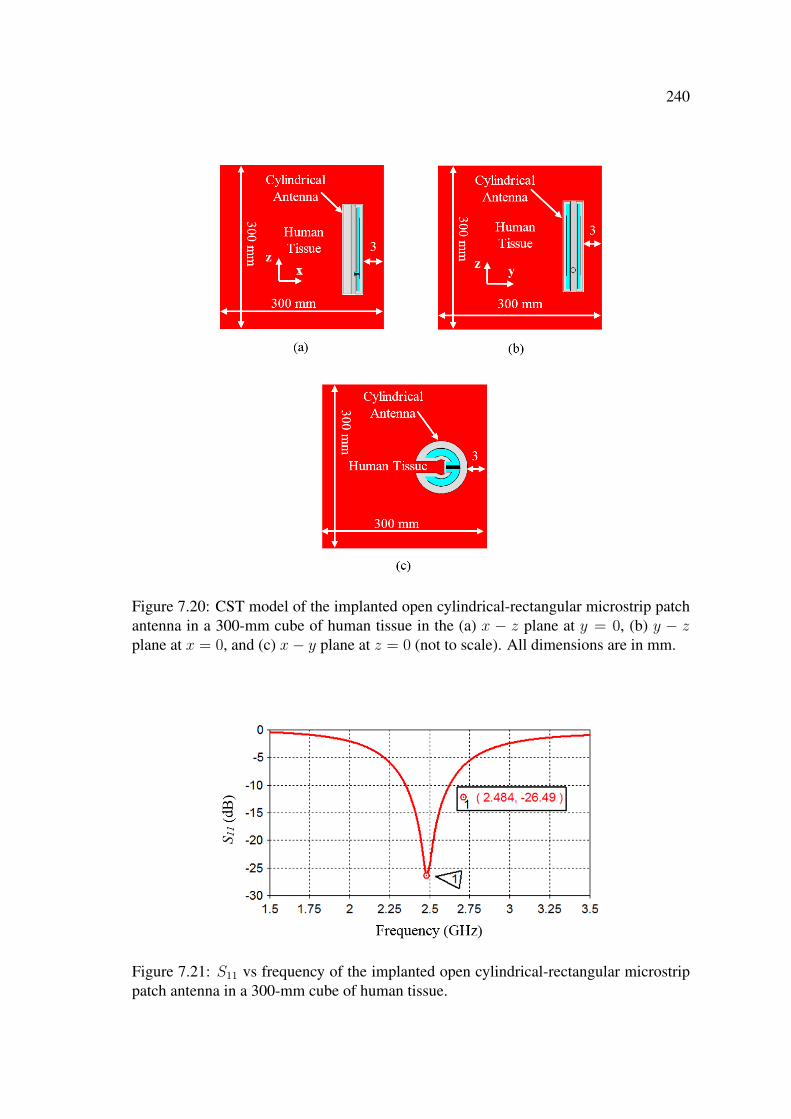
240
Figure 7.20: CST model of the implanted open cylindrical-rectangular microstrip patchantenna in a 300-mm cube of human tissue in the (a) x − z plane at y = 0, (b) y − zplane at x = 0, and (c) x− y plane at z = 0 (not to scale). All dimensions are in mm.
Figure 7.21: S11 vs frequency of the implanted open cylindrical-rectangular microstrippatch antenna in a 300-mm cube of human tissue.

241
Figs. 7.22(a) and (b) that the implanted open cylindrical antenna radiates an electro-
magnetic signal that traverses the human tissue and propagates to free space through the
tissue-air interface. Furthermore, it can also be seen from Figs. 7.22(a) and (b) that part
of this radiated electromagnetic signal is reflected back towards the human tissue from
the tissue-air interface.
Figure 7.22: Electric field distribution at 2.49 GHz of the implanted open cylindrical-rectangular microstrip patch antenna in a 300-mm cube of human tissue in the (a) x− zplane at y = 0, (b) x− y plane at z = 0, and (c) y − z plane at x = 0.
It is expected that due to the high losses in human tissue, most of the electromagnetic
signal radiated away from the tissue-air interface will be significantly attenuated as it
propagates through the human tissue. This significant attenuation will affect the far-
field pattern of the implanted open cylindrical antenna which is shown in Fig. 7.23. As
expected, it can be seen from Fig. 7.23 that direction of the far-field pattern is towards
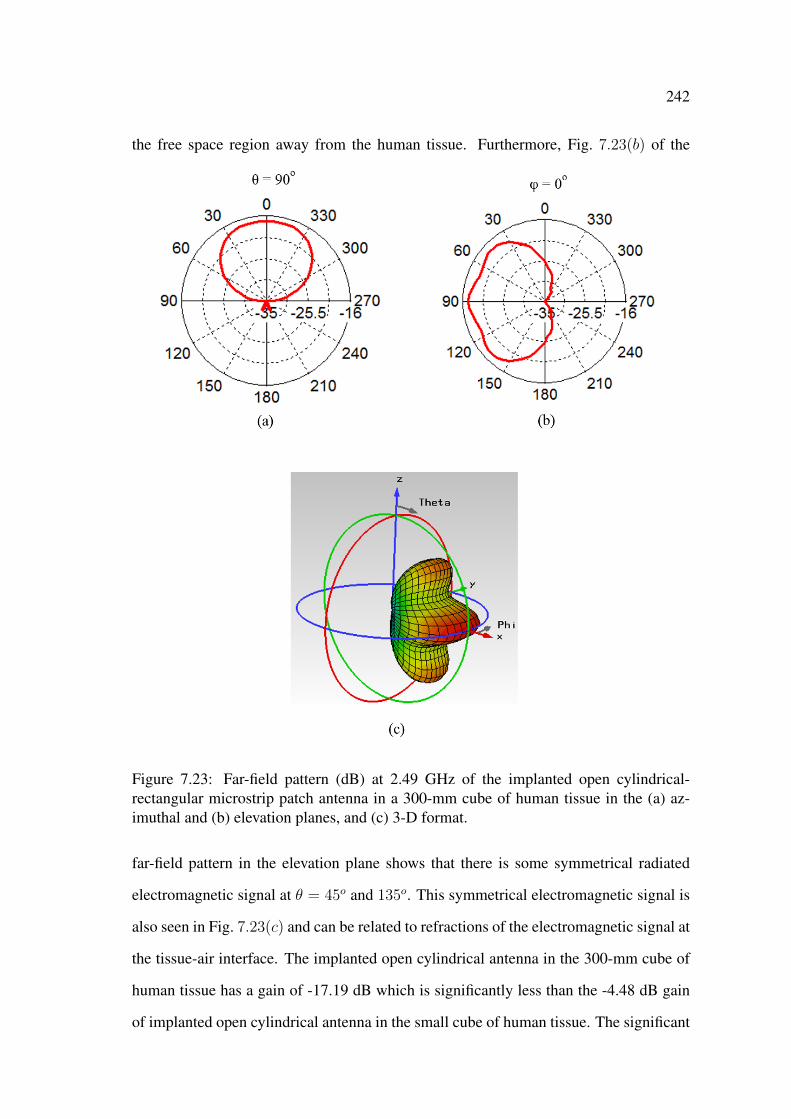
242
the free space region away from the human tissue. Furthermore, Fig. 7.23(b) of the
Figure 7.23: Far-field pattern (dB) at 2.49 GHz of the implanted open cylindrical-rectangular microstrip patch antenna in a 300-mm cube of human tissue in the (a) az-imuthal and (b) elevation planes, and (c) 3-D format.
far-field pattern in the elevation plane shows that there is some symmetrical radiated
electromagnetic signal at θ = 45o and 135o. This symmetrical electromagnetic signal is
also seen in Fig. 7.23(c) and can be related to refractions of the electromagnetic signal at
the tissue-air interface. The implanted open cylindrical antenna in the 300-mm cube of
human tissue has a gain of -17.19 dB which is significantly less than the -4.48 dB gain
of implanted open cylindrical antenna in the small cube of human tissue. The significant
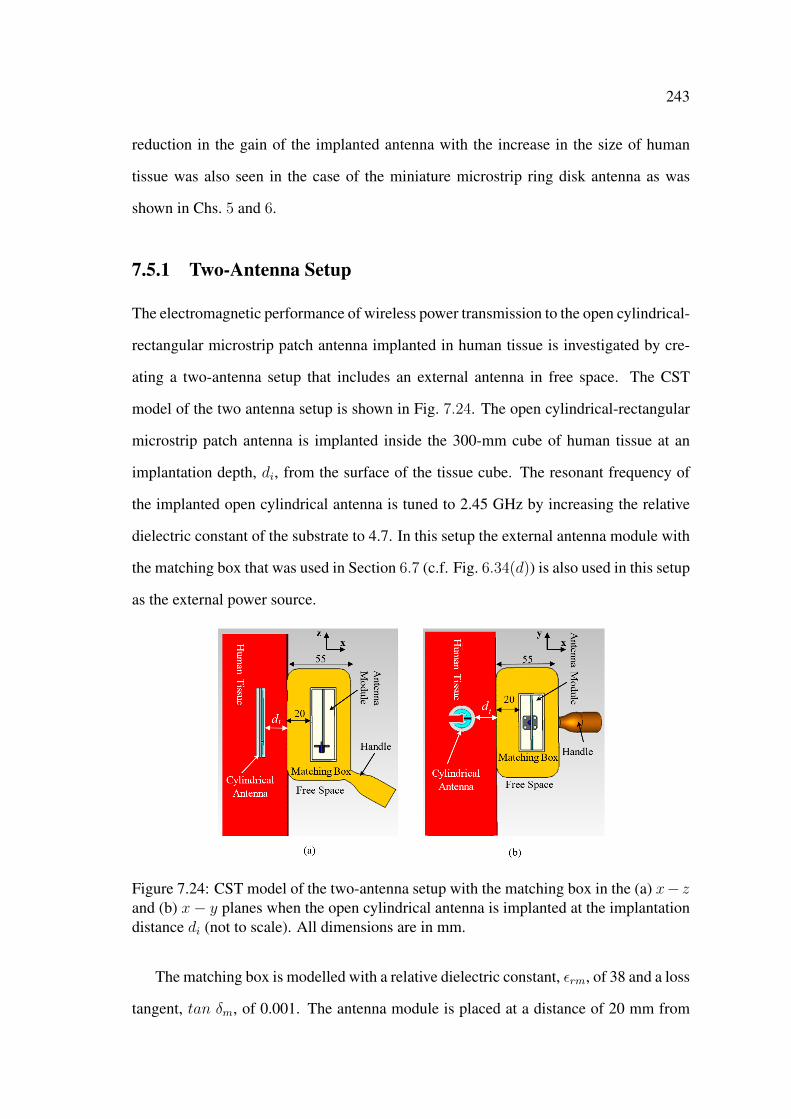
243
reduction in the gain of the implanted antenna with the increase in the size of human
tissue was also seen in the case of the miniature microstrip ring disk antenna as was
shown in Chs. 5 and 6.
7.5.1 Two-Antenna Setup
The electromagnetic performance of wireless power transmission to the open cylindrical-
rectangular microstrip patch antenna implanted in human tissue is investigated by cre-
ating a two-antenna setup that includes an external antenna in free space. The CST
model of the two antenna setup is shown in Fig. 7.24. The open cylindrical-rectangular
microstrip patch antenna is implanted inside the 300-mm cube of human tissue at an
implantation depth, di, from the surface of the tissue cube. The resonant frequency of
the implanted open cylindrical antenna is tuned to 2.45 GHz by increasing the relative
dielectric constant of the substrate to 4.7. In this setup the external antenna module with
the matching box that was used in Section 6.7 (c.f. Fig. 6.34(d)) is also used in this setup
as the external power source.
Figure 7.24: CST model of the two-antenna setup with the matching box in the (a) x− zand (b) x− y planes when the open cylindrical antenna is implanted at the implantationdistance di (not to scale). All dimensions are in mm.
The matching box is modelled with a relative dielectric constant, εrm, of 38 and a loss
tangent, tan δm, of 0.001. The antenna module is placed at a distance of 20 mm from
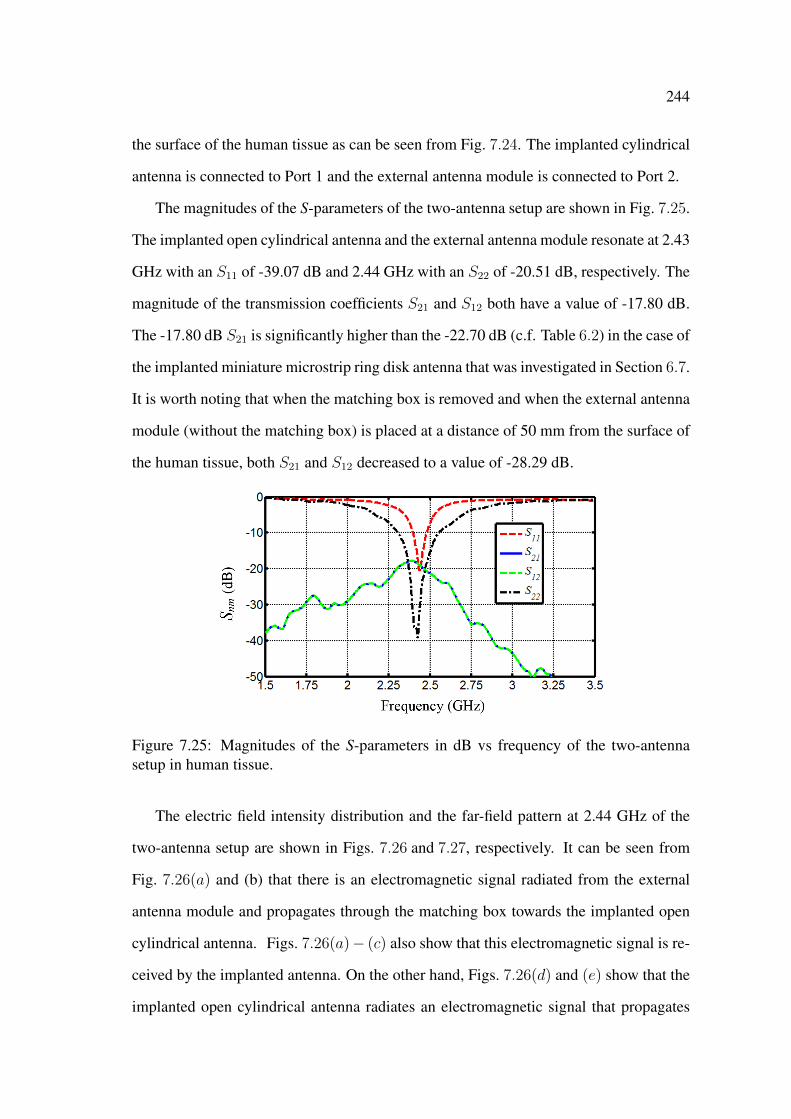
244
the surface of the human tissue as can be seen from Fig. 7.24. The implanted cylindrical
antenna is connected to Port 1 and the external antenna module is connected to Port 2.
The magnitudes of the S-parameters of the two-antenna setup are shown in Fig. 7.25.
The implanted open cylindrical antenna and the external antenna module resonate at 2.43
GHz with an S11 of -39.07 dB and 2.44 GHz with an S22 of -20.51 dB, respectively. The
magnitude of the transmission coefficients S21 and S12 both have a value of -17.80 dB.
The -17.80 dB S21 is significantly higher than the -22.70 dB (c.f. Table 6.2) in the case of
the implanted miniature microstrip ring disk antenna that was investigated in Section 6.7.
It is worth noting that when the matching box is removed and when the external antenna
module (without the matching box) is placed at a distance of 50 mm from the surface of
the human tissue, both S21 and S12 decreased to a value of -28.29 dB.
Figure 7.25: Magnitudes of the S-parameters in dB vs frequency of the two-antennasetup in human tissue.
The electric field intensity distribution and the far-field pattern at 2.44 GHz of the
two-antenna setup are shown in Figs. 7.26 and 7.27, respectively. It can be seen from
Fig. 7.26(a) and (b) that there is an electromagnetic signal radiated from the external
antenna module and propagates through the matching box towards the implanted open
cylindrical antenna. Figs. 7.26(a)− (c) also show that this electromagnetic signal is re-
ceived by the implanted antenna. On the other hand, Figs. 7.26(d) and (e) show that the
implanted open cylindrical antenna radiates an electromagnetic signal that propagates
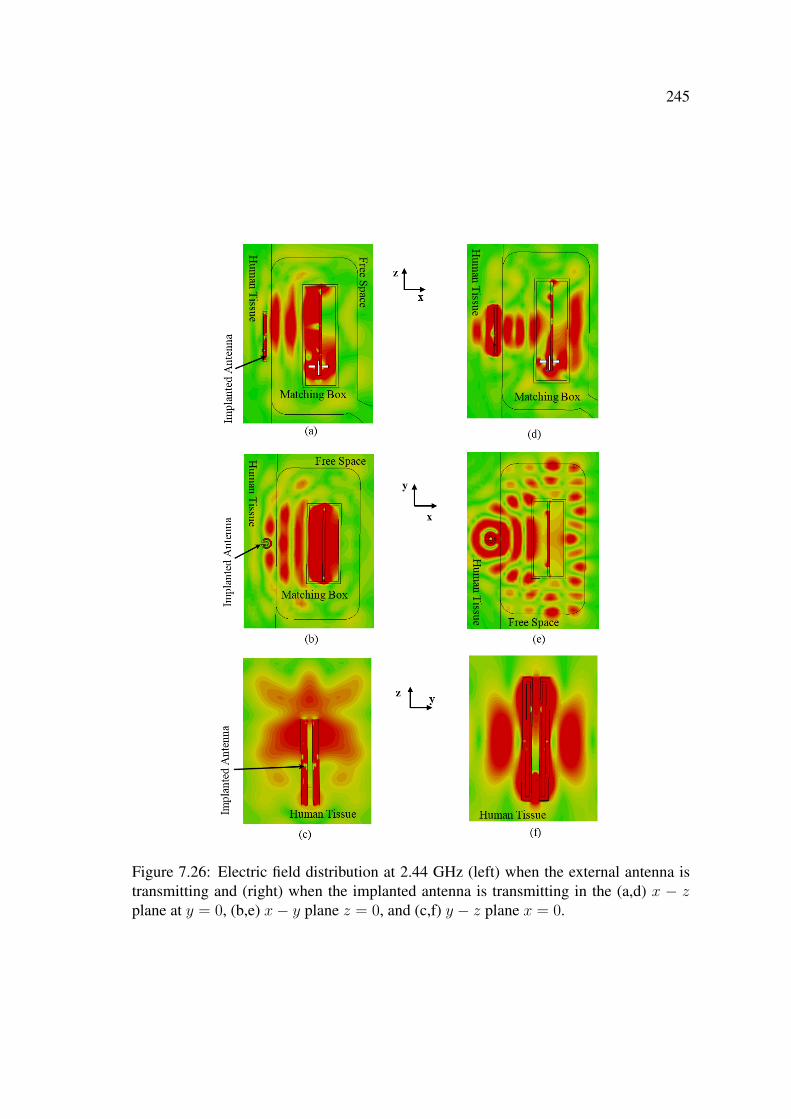
245
Figure 7.26: Electric field distribution at 2.44 GHz (left) when the external antenna istransmitting and (right) when the implanted antenna is transmitting in the (a,d) x − zplane at y = 0, (b,e) x− y plane z = 0, and (c,f) y − z plane x = 0.
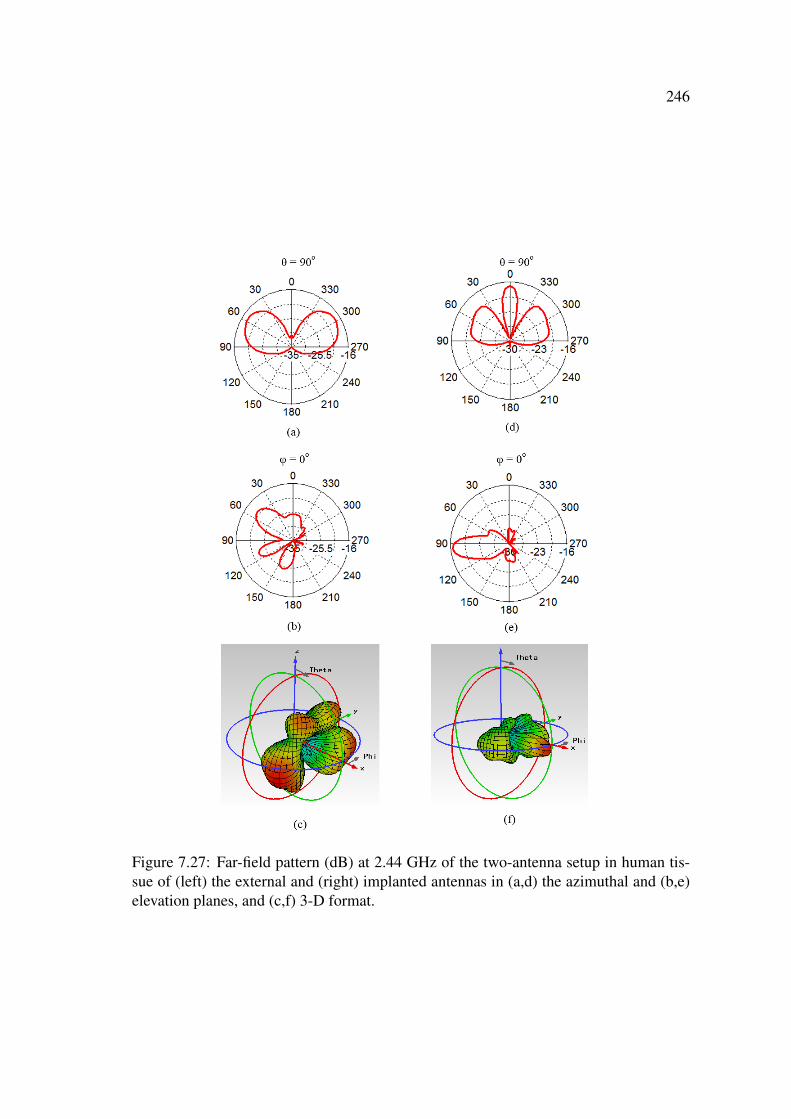
246
Figure 7.27: Far-field pattern (dB) at 2.44 GHz of the two-antenna setup in human tis-sue of (left) the external and (right) implanted antennas in (a,d) the azimuthal and (b,e)elevation planes, and (c,f) 3-D format.

247
through the human tissue and the matching material, and also shows that this radiated
electromagnetic signal is being received by the external patch antenna module. Fur-
thermore, Fig. 7.26(e) shows that there is complex pattern of the electric field in the
matching box which can be attributed to the reflections of the electromagnetic signal at
the boundary of the matching material and free space.
Fig. 7.27 of the far-field pattern at 2.44 GHz shows that the human tissue and the
mutual influence of the antennas have a strong effect on the far-field patterns of both
antennas. The gain of both the implanted open cylindrical antenna and the external
patch antenna module significantly deteriorated to values of -16.36 dB and -18.24 dB,
respectively. Despite the deterioration in the gains of the antennas, the high S21 of -17.80
dB indicates that an efficient microwave wireless power transmission to the implanted
open cylindrical antenna can still be achieved. And has a stronger performance than the
performance of the microwave technique with the miniature microstrip ring disk antenna.
7.5.2 Sensitivity Study: Parametric Variability
In this section a sensitivity study with a parametric variability on the electrical properties
of human tissue and the implantation depth di of the open cylindrical antenna from the
surface of the human tissue is performed.
The sensitivity of the microwave technique to the implantation depth di can be seen
from Fig. 7.28 which shows the effect of di on the magnitude of the transmission coef-
ficient S21. It can be seen from Fig. 7.28 that S21 deteriorates from -17.79 dB to -31.66
dB as di increases from 3 mm to 33 mm. The -17.79 dB S21 at di = 3 mm is similar to
the -17.8 dB S21 obtained in the previous section (c.f. Fig. 7.25) and shows that the CST
model used in this sensitivity study is valid. On the other hand, Fig. 7.28 also shows that
at an implantation depth of 12.5 mm S21 has a value of -22.0 dB which is close to the
-22.70 dB (c.f. Table 6.2) S21 of the microwave technique with the miniature microstrip
ring disk antenna (at a depth of 3 mm). At this S21 (i.e., -22.70 dB) the microwave tech-
nique with the miniature disk antenna was capable of delivering a DC stimulus of up to
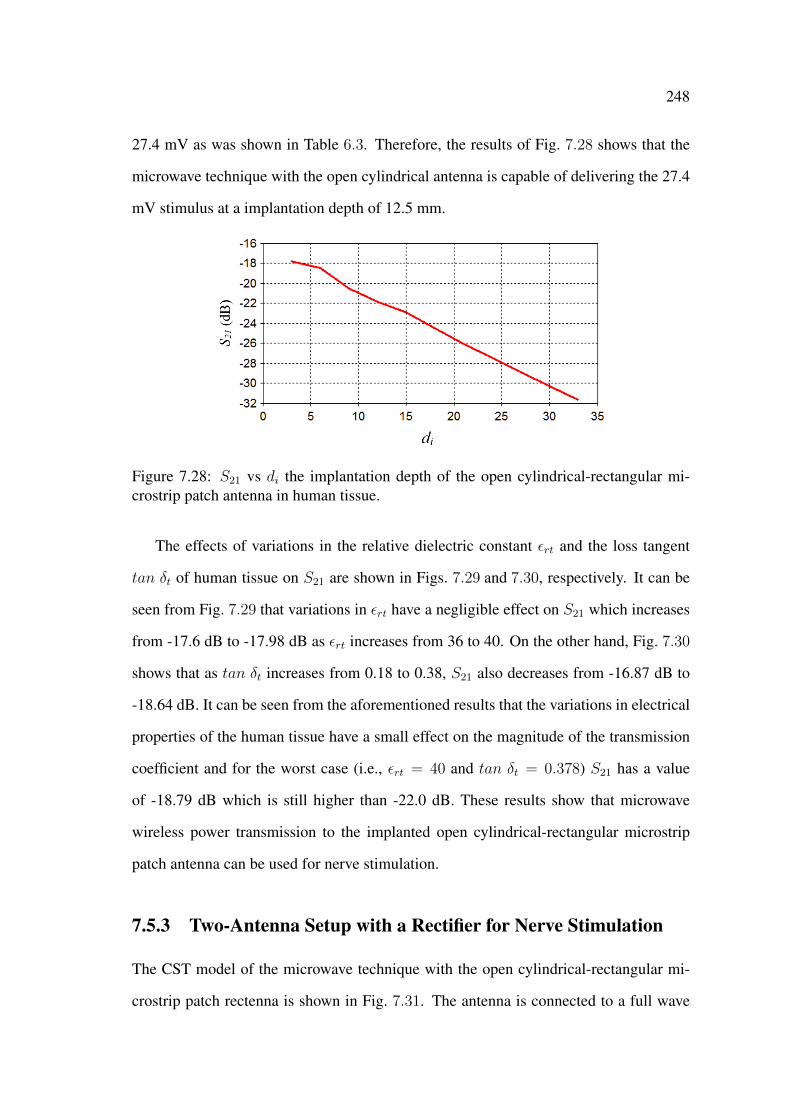
248
27.4 mV as was shown in Table 6.3. Therefore, the results of Fig. 7.28 shows that the
microwave technique with the open cylindrical antenna is capable of delivering the 27.4
mV stimulus at a implantation depth of 12.5 mm.
Figure 7.28: S21 vs di the implantation depth of the open cylindrical-rectangular mi-crostrip patch antenna in human tissue.
The effects of variations in the relative dielectric constant εrt and the loss tangent
tan δt of human tissue on S21 are shown in Figs. 7.29 and 7.30, respectively. It can be
seen from Fig. 7.29 that variations in εrt have a negligible effect on S21 which increases
from -17.6 dB to -17.98 dB as εrt increases from 36 to 40. On the other hand, Fig. 7.30
shows that as tan δt increases from 0.18 to 0.38, S21 also decreases from -16.87 dB to
-18.64 dB. It can be seen from the aforementioned results that the variations in electrical
properties of the human tissue have a small effect on the magnitude of the transmission
coefficient and for the worst case (i.e., εrt = 40 and tan δt = 0.378) S21 has a value
of -18.79 dB which is still higher than -22.0 dB. These results show that microwave
wireless power transmission to the implanted open cylindrical-rectangular microstrip
patch antenna can be used for nerve stimulation.
7.5.3 Two-Antenna Setup with a Rectifier for Nerve Stimulation
The CST model of the microwave technique with the open cylindrical-rectangular mi-
crostrip patch rectenna is shown in Fig. 7.31. The antenna is connected to a full wave
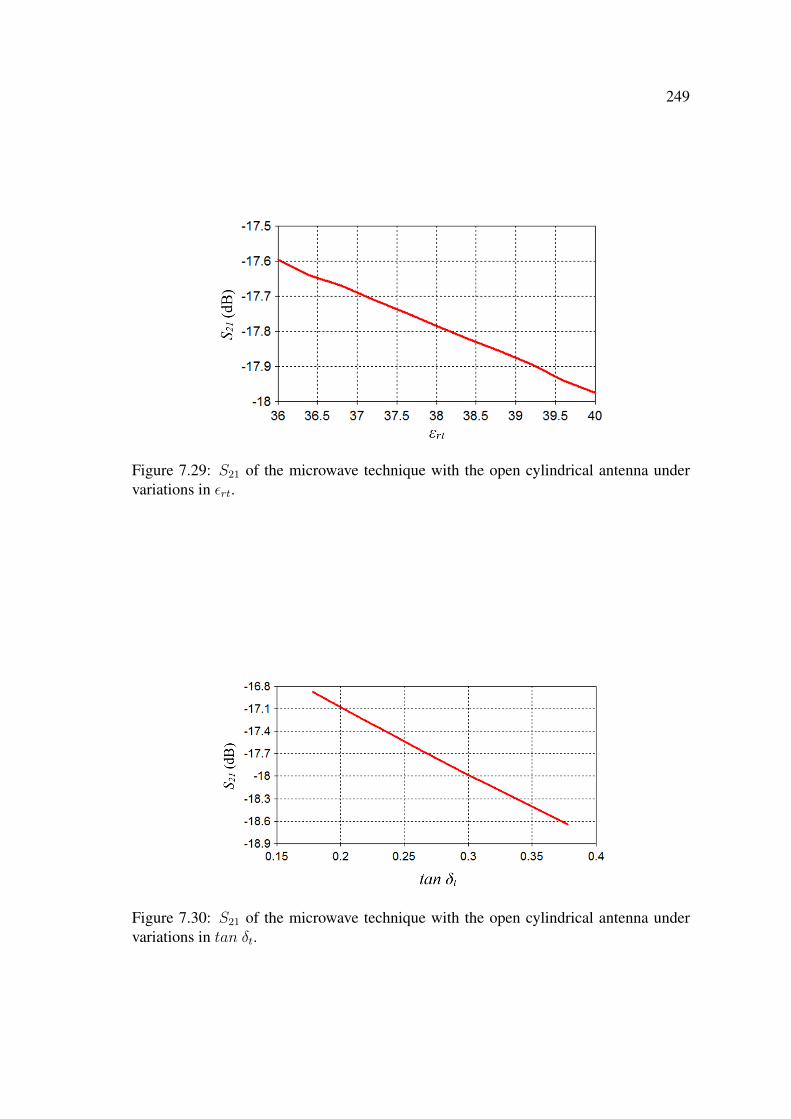
249
Figure 7.29: S21 of the microwave technique with the open cylindrical antenna undervariations in εrt.
Figure 7.30: S21 of the microwave technique with the open cylindrical antenna undervariations in tan δt.

250
rectifying circuit that consists of four Schottky (SBX201C) diodes, a smoothing capaci-
tor and a resistive load. The smoothing capacitor has a value of 12 pF and the output of
the rectenna is terminated with a 1 kΩ load. As mentioned earlier in Secs. 3.4.2 and 6.6.3
the 1 kΩ load is similar to the resistance of soft tissue at DC [40].
Figure 7.31: CST model of the implantable open cylindrical-rectangular microstrip patchrectenna.
A parametric study was performed on the received DC signal, Vdc, at the rectenna’s
output and the specific absorption rate (SAR) in human tissue, when the external antenna
module is excited by a 100 nsec, 2.45 GHz, sine wave at different power levels, Pe. To
reduce the simulation time for this study, a 6 million mesh cells CST model was used.
With 6 million mesh cells the model is still accurate with a minimum of 5 levels of mesh
cells per layer of material.
The recorded Vdc for different power levels Pe is shown in Fig. 7.32. It can be seen
from Fig. 7.32 that Vdc increases from 0.003 V to 1.433 V as Pe increases from 0.1 W to 1
W. It can also be seen from Fig. 7.32 that Vdc has a value of 143 mV and 550 mV for Pe of
0.25 W and 0.5 W, respectively. The 143 mV Vdc at Pe = 0.25 W is significantly higher
than the 27.4 mV DC stimulus (c.f. Fig. 6.38(c)) recorded at the microstrip ring disk
rectenna’s output when the external antenna module was excited by a sine wave of 0.25
W. This increase in Vdc is related to the -17.80 dB S21 of the microwave technique with
the open cylindrical antenna which is higher than the -22.70 dB S21 of the microwave
technique with the miniature disk antenna.

251
Figure 7.32: Recorded Vdc at the output of the implanted open cylindrical rectenna fordifferent power levels Pe.
The SAR in human tissue for different power levels Pe is shown in Fig. 7.33. As
expected, it can be seen from Fig. 7.33 that SAR increases from 0.03 W/kg to 3.04 W/kg
as Pe increases from 0.1 W to 1 W. Fig. 7.33 also shows that at Pe of 0.25 W and 0.5
W the SAR has a value of 0.20 W/kg and 0.76 W/kg, respectively. It is interesting
Figure 7.33: SAR in human tissue when the external antenna module is excited at dif-ferent power levels Pe.
to note that at Pe = 0.25 W the SAR from the microwave with the miniature disk
antenna (c.f. Fig. 6.39) has a value of 1.61 W/kg which is higher than the 0.20 W/kg
shown in Fig. 7.33 for the same Pe. The lower SAR for the case of the open cylindrical
antenna can be related to higher performance (as discussed previously) of the cylindrical
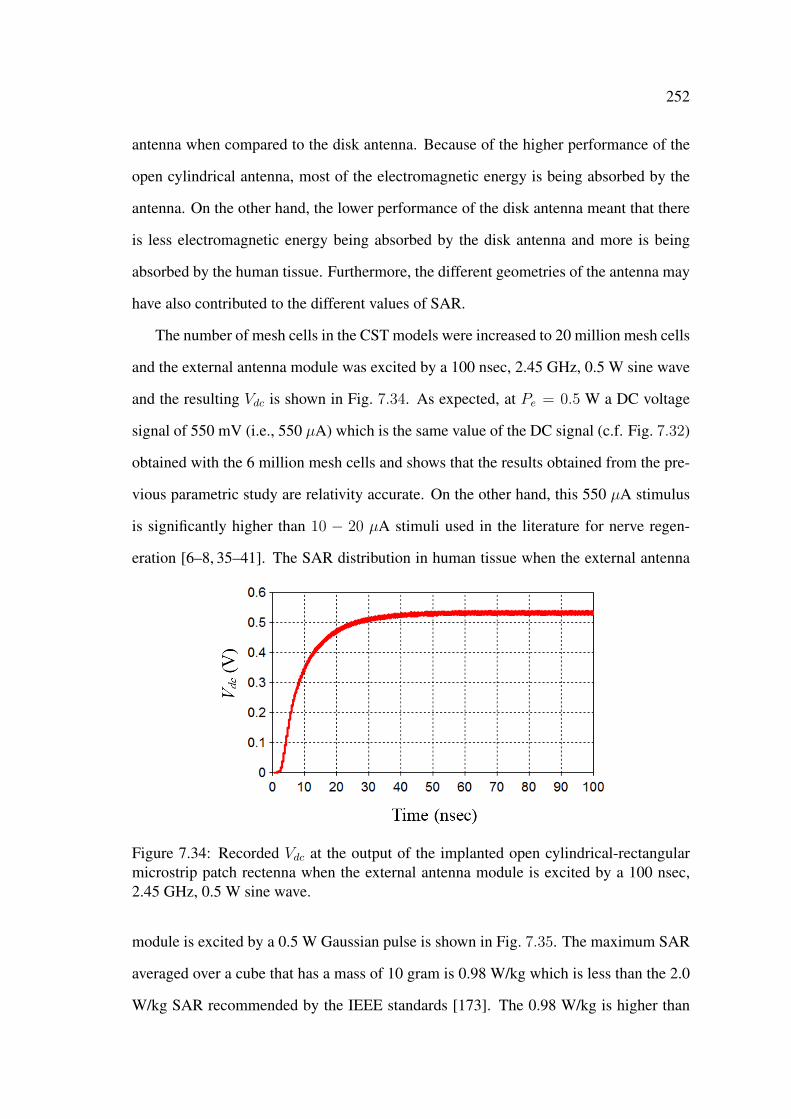
252
antenna when compared to the disk antenna. Because of the higher performance of the
open cylindrical antenna, most of the electromagnetic energy is being absorbed by the
antenna. On the other hand, the lower performance of the disk antenna meant that there
is less electromagnetic energy being absorbed by the disk antenna and more is being
absorbed by the human tissue. Furthermore, the different geometries of the antenna may
have also contributed to the different values of SAR.
The number of mesh cells in the CST models were increased to 20 million mesh cells
and the external antenna module was excited by a 100 nsec, 2.45 GHz, 0.5 W sine wave
and the resulting Vdc is shown in Fig. 7.34. As expected, at Pe = 0.5 W a DC voltage
signal of 550 mV (i.e., 550 µA) which is the same value of the DC signal (c.f. Fig. 7.32)
obtained with the 6 million mesh cells and shows that the results obtained from the pre-
vious parametric study are relativity accurate. On the other hand, this 550 µA stimulus
is significantly higher than 10 − 20 µA stimuli used in the literature for nerve regen-
eration [6–8, 35–41]. The SAR distribution in human tissue when the external antenna
Figure 7.34: Recorded Vdc at the output of the implanted open cylindrical-rectangularmicrostrip patch rectenna when the external antenna module is excited by a 100 nsec,2.45 GHz, 0.5 W sine wave.
module is excited by a 0.5 W Gaussian pulse is shown in Fig. 7.35. The maximum SAR
averaged over a cube that has a mass of 10 gram is 0.98 W/kg which is less than the 2.0
W/kg SAR recommended by the IEEE standards [173]. The 0.98 W/kg is higher than
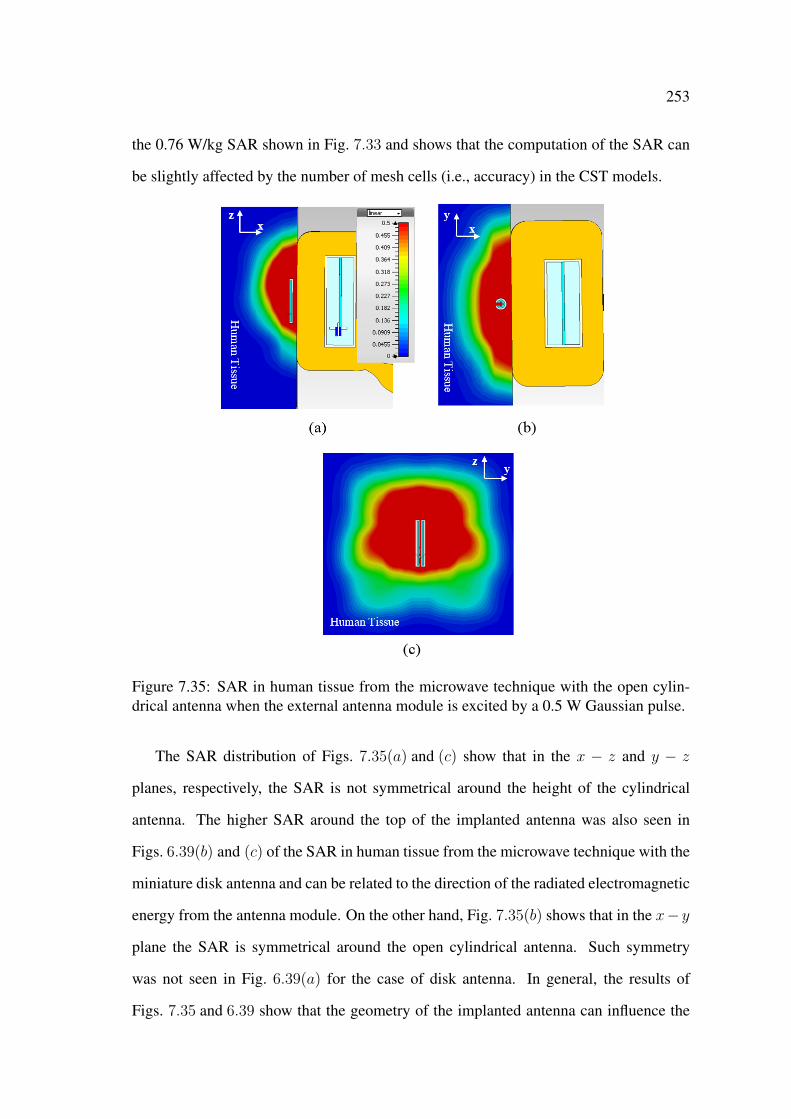
253
the 0.76 W/kg SAR shown in Fig. 7.33 and shows that the computation of the SAR can
be slightly affected by the number of mesh cells (i.e., accuracy) in the CST models.
Figure 7.35: SAR in human tissue from the microwave technique with the open cylin-drical antenna when the external antenna module is excited by a 0.5 W Gaussian pulse.
The SAR distribution of Figs. 7.35(a) and (c) show that in the x − z and y − z
planes, respectively, the SAR is not symmetrical around the height of the cylindrical
antenna. The higher SAR around the top of the implanted antenna was also seen in
Figs. 6.39(b) and (c) of the SAR in human tissue from the microwave technique with the
miniature disk antenna and can be related to the direction of the radiated electromagnetic
energy from the antenna module. On the other hand, Fig. 7.35(b) shows that in the x− y
plane the SAR is symmetrical around the open cylindrical antenna. Such symmetry
was not seen in Fig. 6.39(a) for the case of disk antenna. In general, the results of
Figs. 7.35 and 6.39 show that the geometry of the implanted antenna can influence the
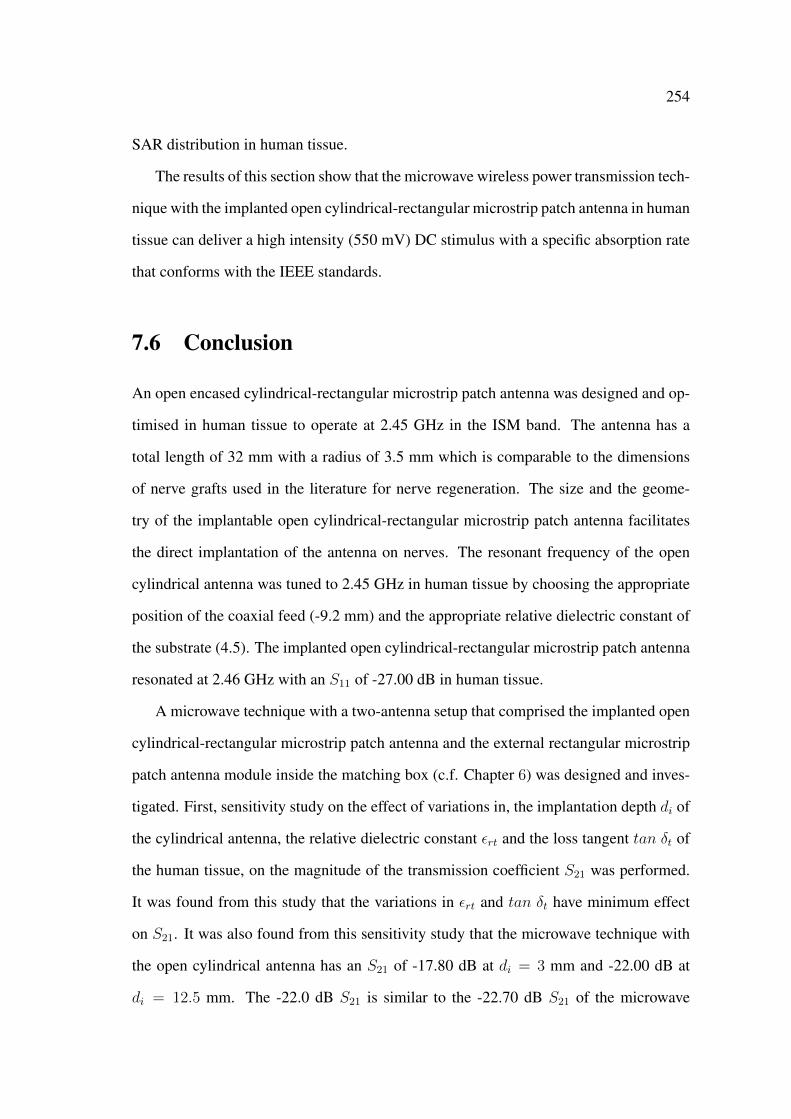
254
SAR distribution in human tissue.
The results of this section show that the microwave wireless power transmission tech-
nique with the implanted open cylindrical-rectangular microstrip patch antenna in human
tissue can deliver a high intensity (550 mV) DC stimulus with a specific absorption rate
that conforms with the IEEE standards.
7.6 Conclusion
An open encased cylindrical-rectangular microstrip patch antenna was designed and op-
timised in human tissue to operate at 2.45 GHz in the ISM band. The antenna has a
total length of 32 mm with a radius of 3.5 mm which is comparable to the dimensions
of nerve grafts used in the literature for nerve regeneration. The size and the geome-
try of the implantable open cylindrical-rectangular microstrip patch antenna facilitates
the direct implantation of the antenna on nerves. The resonant frequency of the open
cylindrical antenna was tuned to 2.45 GHz in human tissue by choosing the appropriate
position of the coaxial feed (-9.2 mm) and the appropriate relative dielectric constant of
the substrate (4.5). The implanted open cylindrical-rectangular microstrip patch antenna
resonated at 2.46 GHz with an S11 of -27.00 dB in human tissue.
A microwave technique with a two-antenna setup that comprised the implanted open
cylindrical-rectangular microstrip patch antenna and the external rectangular microstrip
patch antenna module inside the matching box (c.f. Chapter 6) was designed and inves-
tigated. First, sensitivity study on the effect of variations in, the implantation depth di of
the cylindrical antenna, the relative dielectric constant εrt and the loss tangent tan δt of
the human tissue, on the magnitude of the transmission coefficient S21 was performed.
It was found from this study that the variations in εrt and tan δt have minimum effect
on S21. It was also found from this sensitivity study that the microwave technique with
the open cylindrical antenna has an S21 of -17.80 dB at di = 3 mm and -22.00 dB at
di = 12.5 mm. The -22.0 dB S21 is similar to the -22.70 dB S21 of the microwave
255
technique with the microstrip ring disk antenna (at an implantation depth of 3 mm) and
shows that the open cylindrical antenna has a better performance than the microstrip ring
disk antenna. Second, an implantable rectenna was designed by connecting the open
cylindrical antenna to a rectifying circuit. The received DC signal Vdc at the rectenna’s
output was recorded for different power levels Pe and the SAR in human tissue was also
computed. As expected, it was found that both Vdc and the SAR increased as Pe in-
creased. Finally, it was shown that the microwave technique at 2.45 GHz with the open
cylindrical-rectangular patch rectenna in human tissue can deliver a DC stimulus of 550
µA with a SAR of 0.98 W/kg that conforms with the IEEE standards.
The results obtained in this chapter show that the microwave wireless power trans-
mission technique with the open cylindrical-rectangular microstrip patch antenna con-
tributes towards the further development of active implantable medical devices by elim-
inating the need for the battery and the wired electrodes and facilitating the installation
of such medical devices directly on the stimulation site.
Chapter 8
Summary and Conclusion
8.1 Summary
The performance of microwave wireless power transmission techniques with different
microstrip antennas in human tissue was investigated and optimised. For this purpose,
implantable microstrip antennas which include a microstrip rectangular patch antenna
module, a miniature microstrip ring disk antenna, and an open cylindrical-rectangular
microstrip patch antenna were designed and computationally investigated at 2.45 GHz
using models of human tissue. The computational models were verified experimentally
using other materials including tissue mimicking gel and fresh minced meat. The major
investigations and outcomes can be summarised as follows:
• In Chapter 3, an antenna module was designed by enclosing a microstrip rect-
angular patch antenna inside a protective housing. Parametric studies were per-
formed and showed that by varying the relative dielectric constant of the antenna’s
substrate material and the size of the protective housing the implantable antenna
module can have an acceptable performance in human tissue. The feasibility of
microwave wireless power transmission in human tissue was demonstrated and
the results from a sensitivity study showed that the proposed microwave wireless
power transmission technique can have a reliable performance that corresponds to

257
the design performance.
• A two-antenna setup and a measurement system were used in Chapter 4 to investi-
gate microwave wireless power transmission in tissue mimicking gel and minced
meat. The measured and simulated results were used to determine the electrical
properties of the fabricated tissue mimicking gel and the fresh minced meat. The
good agreement between the measured and simulated results verified the simula-
tion models, and the necessary model settings that are needed to obtain accurate
simulation results were identified and discussed.
• In Chapter 5, an implantable encased miniature microstrip ring disk antenna was
designed and investigated in human tissue. Design parameters such as the length of
the annular ring and the relative dielectric constants of both the encasement and the
antenna’s substrate were modified to optimise the performance of the implanted
miniature disk antenna. The disk antenna had a small size that is suitable for
practical implantable applications.
• A microwave wireless power transmission technique that comprises a two-antenna
setup with implanted microstrip ring disk antenna in human tissue and an exter-
nal antenna module in free space was designed and investigated in Chapter 6.
A computational model of a measurement system to characterise the microwave
technique and evaluate its efficiency was proposed and used. It was found that
the efficiency of the microwave wireless power transmission technique can be sig-
nificantly enhanced by inserting a matching layer between the external antenna
module and human tissue. It was also shown that the microwave wireless power
transmission technique with the miniature disk antenna can be used for nerve stim-
ulation with a specific absorption rate that conforms to the IEEE standards.
• In Chapter 7, a novel implantable open cylindrical-rectangular microstrip patch an-
tenna was proposed and investigated. The geometry and size of the designed open
cylindrical antenna facilitated the installation of the antenna directly on nerves.

258
It was shown that the microwave wireless power transmission technique with the
open cylindrical-rectangular microstrip patch antenna and a rectifier provided an
electrical DC stimulus that can be used for nerve stimulation with a SAR that
conforms to the IEEE standards.
8.2 Conclusion
Three microstrip antennas were designed, investigated and optimised for microwave
wireless power transmission in human tissue at 2.45 GHz. The simulation results with
human tissue and the measurement results with tissue mimicking gel and minced meat
demonstrated the feasibility of microwave wireless power transmission in human tissue.
The strong agreement between the simulation and measurement results showed that the
simulation models are correct and can be used to obtain accurate results for current and
future work.
It was also shown that the performance of microwave wireless power transmission
technique strongly depended on the symmetry in the electromagnetic performance of
both the external and implanted antennas in regards to their resonant frequencies, po-
larisation vector of the radiated electric field, and far-field patterns. It was also shown
that if the symmetry in the electromagnetic performance of both antennas is obtained,
maximum wireless power transmission in human tissue can still be achieved even if the
external and implanted antennas have different geometries and sizes. The performance
of wireless power transmission in human tissue was further optimised by inserting a
matching layer between the external antenna and the human tissue.
A novel implantable open cylindrical-rectangular microstrip patch antenna was pro-
posed, designed, and optimised to operate at 2.45 GHz in human tissue. The implantable
open cylindrical antenna has a geometry and size that enables its direct installation on
nerves and can be used for a number of nerve stimulation applications such as nerve
regeneration. It was shown the microwave wireless power transmission technique with

259
the open cylindrical antenna in human tissue delivered a DC stimulus that can be used
for nerve stimulation while conforming to the SAR recommendations of the IEEE stan-
dards. Active implantable medical devices that utilise microwave techniques with the
open cylindrical antenna eliminate the need for the battery and wired electrodes and can
be installed directly on the stimulation site.
8.3 Future Work
Recommendations for future research on the subject of this thesis are as follows:
• The directivity of both the external and implanted antennas will have a signif-
icant effect on the performance of the microwave wireless power transmission
technique. From a research perspective, an intriguing extension to this work is to
investigate the performance of smart array antennas for wireless power transmis-
sion in human tissue. The narrow beam characteristic of smart antennas can be
used to design wireless power transmission techniques that are capable of deliver-
ing concentrated power to a localised area in the human body. However, the SAR
should be evaluated carefully as such concentrated power may give rise to tissue
temperature.
• An interesting extension to this work is to investigate the performance of mi-
crowave wireless power transmission techniques with implantable conducting poly-
mer antennas. The use of conducting polymers provides extra material properties
such as bio-compatibility and physical deformability to the implantable antenna.
The deformability of conducting polymers can facilitate wireless power transmis-
sion to areas in the human body with complex structure (e.g., the spinal cord) that
imposes strict criteria on the geometry of the implantable antenna. Furthermore,
the polymer can be doped with neurotrophic agents that can be released at the
stimulation site as the implantable antenna is receiving the wireless electromag-
netic power. That is, doped conducting polymer antennas can utilise both electrical

260
stimulation and drug delivery for the treatment of nerves.
• In most of the implantable medical devices that utilise microwave wireless power
transmission the implanted receiving antenna will be connected to an electronic
circuit. In this thesis the implanted microstrip antennas were connected to a simple
full wave rectifying circuit. Although the delivered DC stimulus from the rectify-
ing circuit had an intensity that is comparable to the stimuli used in the literature,
it is clear from the results presented in Chapters 6 and 7 that there are significant
losses between the received AC and the rectified DC signal. These losses are due
to the low coupling between the implanted antenna and the rectifying circuit. A
natural extension to this work is the use of matching circuits to optimise coupling
between the implanted antenna and electronic circuit.

References
[1] B. Holmquist, M. Kanje, J. M. Kerns, and N. Danielsen, “A mathematical modelfor regeneration rate and initial delay following surgical repair of peripheralnerves,” Journal of Neuroscience Methods, vol. 48, no. 1-2, pp. 27–33, 1993.1, 12
[2] M. Kanje, G. Lundborg, and A. Edström, “A new method for studies of the effectsof locally applied drugs on peripheral nerve regeneration in vivo,” Brain Research,vol. 439, no. 1-2, pp. 116–121, 1988. 1, 12
[3] T. M. Brushart, P. N. Hoffman, R. M. Royall, B. B. Murinson, C. Witzel, andT. Gordon, “Electrical stimulation promotes motoneuron regeneration withoutincreasing its speed or conditioning the neuron.” The Journal of Neuroscience,vol. 22, no. 15, pp. 6631–6638, 2002. 1, 12
[4] A. A. Al-Majed, C. M. Neumann, T. M. Brushart, and T. Gordon, “Brief electricalstimulation promotes the speed and accuracy of motor axonal regeneration.” TheJournal of Neuroscience, vol. 20, no. 7, pp. 2602–2608, 2000. 1, 12, 13
[5] M. Vivó, A. Puigdemasa, L. Casals, E. Asensio, E. Udina, and X. Navarro,“Immediate electrical stimulation enhances regeneration and reinnervationand modulates spinal plastic changes after sciatic nerve injury and repair,”Experimental Neurology, vol. 211, no. 1, pp. 180–193, May 2008. [Online].Available: http://www.ncbi.nlm.nih.gov/pubmed/18316076 1, 12
[6] H. Hoffman, “Acceleration and retardation of the process of axon-sprouting inpartially denervated muscles,” Australian Journal in Experimental Biology andMedical Science, no. 30, pp. 541–566, 1952. 1, 12, 13, 209, 252
[7] L. McDevitt, P. Fortner, and B. Pomeranz, “Application of weak electric field tothe hindpaw enhances sciatic motor nerve regeneration in the adult rat,” BrainResearch, vol. 416, no. 2, pp. 308–314, 1987. 1, 12, 13, 209, 252
[8] S. Pockett and R. Gavin, “Acceleration of peripheral nerve regeneration aftercrush injury in rat,” Neuroscience Letters, vol. 59, no. 2, pp. 221–224, Aug. 1985.1, 12, 13, 209, 252
[9] The Therapeutic Goods Administration. (2014, Mar.). [Online]. Available: http://www.tga.gov.au/safety/alerts-device-medtronic-neurostimulation-140317.htm 2,15
262
[10] A. Poon, S. O’Driscoll, and T. Meng, “Optimal frequency for wireless powertransmission into dispersive tissue,” IEEE Transactions Antennas and Propaga-tions, vol. 58, no. 5, pp. 1739–1750, 2010. 3, 4, 16
[11] K. Sanghoek, J. Ho, L. Y. Chen, and A.S.Y.Poon, “Wireless power transfer to acardiac implant,” Applied Physics Letters, vol. 101, no. 7, pp. 073 701–073 701–4,Aug. 2012. 3, 4, 16
[12] A. Lauto, G. Gargiulo, U. Gunawardana, R. Salama, and R. Liyanapathirana,“An apparatus and method for facilitating the treatment of tissue,” Pub. No.:WO/2013/106884, International Application No.: PCT/AU2013/000028, Inerna-tional Filing Date: 18 Jan. 2013. 4
[13] T. Karacolak, A. Hood, and E. Topsakal, “Design of a dual-band implantableantenna and development of skin mimicking gels for continuous glucose moni-toring,” IEEE Transactions Microwave Theory Society, vol. 56, no. 4, pp. 1001–1008, Apr. 2008. 4, 17, 18, 22, 23, 34, 35, 64, 116, 165, 225, 239
[14] E. Chow, M. Morris, and P. Irazoqui, “Implantable RF medical devices: The ben-efits of high-speed communication and much greater communication distances inbiomedical applications,” IEEE Microwave Magazine, vol. 14, no. 4, pp. 64–73,Jun. 2013. 4, 15, 16, 17, 23, 35
[15] X. Gu, F. Ding, Y. Yang, and J. Liu, “Construction of tissue engineered nervegrafts and their application in peripheral nerve regeneration,” Progress in Neuro-biology, vol. 93, no. 2, pp. 204–230, 2011. 12
[16] “Economic impact of SCI,” Topics on Spinal Cord Injury Rehabilitation, vol. 16,no. 4, 2011. 12
[17] P. Hoffman and R. Lasek, “Axonal transport of the cytoskeleton in regeneratingmotor neurons: constancy and change,” Brain Research, vol. 202, no. 2, pp. 317–333, 1980. 12
[18] L. Chen and A. D. Chisholm, “Axon regeneration mechanisms: insights from c.elegans,” Trends Cell Biology, vol. 21, no. 10, pp. 577U–584, Oct. 2011. 12
[19] S. David and A. Aguayo, “Axonal elongation into peripheral nervous system"bridges" after central nervous system injury in adult rats,” Science, vol. 214,pp. 931–933, Nov. 1981. 12
[20] J. Campbell and B. Pomeranz, “A new method to study motoneuron regenera-tion using electromyograms shows that regeneration slows with age in rat sciaticnerve,” Brian Research, vol. 2, no. 603, pp. 264–270, Feb. 1993. 12
[21] J. Pettersson, D. Kalbermatten, A. McGrath, and L. N. Novikova, “Biodegrad-able fibrin conduit promotes long-term regeneration after peripheral nerve injuryin adult rats,” Journal of Plastic, Reconstructive and Aesthetic Surgery, vol. 63,no. 11, pp. 1893–1899, 2010. 12

263
[22] B. Battiston, P. Tos, T. Cushway, and S. Geuna, “Nerve repair by means of veinfilled with muscle grafts I. clinical results,” in Microsurgery, vol. 20, no. 1, 2000,pp. 32–36. 12, 232
[23] S. Hall, “Axonal regeneration through acellular muscle grafts,” Journal Anatomy,vol. 190, pp. 57–71, Jan. 1997. 12
[24] H. Okamoto, K. Hata, H. Kagami, K. Okada, Y. Ito, Y. Narita, H. Hirata, I. Sekiya,T. Otsuka, and M. Ueda, “Recovery process of sciatic nerve defect with novelbioabsorbable collagen tubes packed with collagen filaments in dogs,” JournalBiomedical Material Research Part A, vol. 92, no. 3, pp. 859–868, Mar. 2010. 12
[25] E. G. Fine, R. F. Valentini, , and P. Aebischer, Principles of Tissue Engineering.Academic Press, 2000, ch. 56, pp. 785–798. 12
[26] N. Patel and M. Poo, “Orientation of neurite growth by extracellular electricfields,” J. Neuroscience, vol. 2, no. 4, pp. 483–496, Apr. 1982. 12
[27] A. F. J. Kerns and I. Pavkovic, “A twitch tension method to assess motornerve function in rat,” Journal of Neuroscience Methods, vol. 19, no. 4,pp. 259–266, 1987. [Online]. Available: http://www.sciencedirect.com/science/article/pii/0165027087900690 12
[28] P. Babu, A. Behl, B. Chakravarty, P. Bhandari, T. Bhatti, and S. Maurya, “En-tubulation techniques in peripheral nerve repair,” Indian Journal of Neurotrauma(IJNT), vol. 5, no. 1, pp. 15–20, 2008. 12
[29] O. Silbermann-Hoffman, C. Oberlin, J. Drapé, B. Cadot, J. Alnot, and R. Be-nacerraf, “Median nerve suture in the distal part of the forearm mri evaluation,”Annales de Chirurgie de la Main et du Membre Superieur, vol. 15, no. 4, pp.213–219, 1996. 12
[30] S. Sunderland, “Factors influencing the course of regeneration and thequality of the recovery after nerve suture,” Department of Anatomy andHistology, University of Melbourne, Australia, pp. 19–54. [Online]. Available:http://brain.oxfordjournals.org/ 12
[31] S. K. Lee and S. W. Wolfe, “Peripheral nerve injury and repair,” Journal AmericanAcademy of Orthopaedic Surgeons, vol. 8, no. 4, pp. 243–252, 2000. 12
[32] X.-J. Tong, K.-I. Hirai, H. Shimada, Y. Mizutani, T. Izumi, N. Toda, andP. Yu, “Sciatic nerve regeneration navigated by laminin-fibronectin double coatedbiodegradable collagen grafts in rats,” Brain Research, vol. 663, no. 1, pp. 155–162, 1994. 12
[33] X. Wang, W. Hu, Y. Cao, J. Yao, J. Wu, and X. Gu, “Dog sciatic nerve regen-eration across a 30-mm defect bridged by a chitosan/PGA artificial nerve graft,”Brain, vol. 128, no. 8, pp. 1897–1910, Aug. 2005. 12
264
[34] S. Hansom and M. McGinnis, “Regeneration of rat sciatic nerves in siliconetubes: Characterization of the response to low intensity d.c. stimulation,”Neuroscience, vol. 58, no. 2, pp. 411–421, 1994. [Online]. Available:http://www.sciencedirect.com/science/article/pii/0306452294900477 12, 13
[35] A. A. Al-Majed, “Promoting peripheral nerve regeneration: functional electricalstimulation and pharmacological approaches,” PhD, University of Alberta, De-partment of Pharmacology, Edmonton, Alberta, Fall 2000. 12, 13, 209, 252
[36] E. Asensio-Pinilla, E. Udina, J. Jaramillo, and X. Navarro, “Electrical stimula-tion combined with exercise increase axonal regeneration after peripheral nerveinjury,” Experimental Neurology, vol. 219, no. 1, pp. 258–265, 2009. 12, 13, 14,209, 252
[37] J. Kerns and C. Lucchinetti, “Electrical field effects on crushed nerve regenera-tion,” Experimental Neurology, vol. 117, no. 1, pp. 71–80, Jul. 1992. 12, 13, 14,209, 252
[38] G. C. Román, H. K. Strahlendorf, P. W. Coates, and B. A. Rowley, “Stimulationof sciatic nerve regeneration in the adult rat by low-intensity electric current,”Experimental Neurology, vol. 98, no. 2, pp. 222–232, 1987. 12, 13, 14, 209, 252
[39] J. Kerns, A. Fakhouri, H. Weinrib, and J. Freeman, “Electrical stimulation ofnerve regeneration in the rat: The early effects evaluated by a vibrating probe andelectron microscopy,” Neuroscience, vol. 40, no. 1, pp. 93–107, 1991. 12, 13, 14,209, 252
[40] B. Pomeranz and J. Campbell, “Weak electric current accelerates motoneuronregeneration in the sciatic nerve of ten-month-old rats,” Brain Research, vol. 603,no. 2, pp. 271–278, 1993. 12, 13, 14, 74, 202, 209, 250, 252
[41] T. H. Lee, H. Pan, I. S. Kim, J. K. Kim, T. H. Cho, J. H. Oh, Y. B. Yoon, J. H.Lee, S. J. Hwang, and S. J. Kim, “Functional regeneration of a severed peripheralnerve with a 7-mm gap in rats through the use of an implantable electricalstimulator and a conduit electrode with collagen coating,” Neuromodulation:Technology at the Neural Interface, vol. 13, no. 4, pp. 299–305, 2010. [Online].Available: http://dx.doi.org/10.1111/j.1525-1403.2010.00296.x 12, 13, 14, 209,252
[42] J. Huang, L. Lu, X. Hu, Z. Ye, Y. Peng, X. Yan, D. Geng, and Z. Luo, “Electricalstimulation accelerates motor functional recovery in the rat model of 15-mm sci-atic nerve gap bridged by scaffolds with longitudinally oriented microchannels,”Neurorehabilitation and Neural Repair, vol. 24, no. 8, pp. 736–745, Oct. 2010.12, 13, 14
[43] J. Huang, L. Lu, J. Zhang, X. Hu, Y. Zhang, W. Liang, S. Wu, and Z. Luo, “Electri-cal stimulation to conductive scaffold promotes axonal regeneration and remyeli-nation in a rat model of large nerve defect,” PLoS ONE, vol. 7, no. 6, p. e39526,Jan. 2012. 12, 13

265
[44] J. J. Fitzgerald, P. Lacour, S. B. Mcmahon, and J. W. Fawcett, “Microchannelelectrodes for recording and stimulation: In vitro evaluation,” IEEE TransactionsBiomedical Engineering, vol. 56, no. 5, pp. 1524–1534, 2009. 12, 13
[45] Y.-J. Chang, C.-M. Hsu, C.-H. Lin, M. S.-C. Lu, and L. Chen, “Electrical stim-ulation promotes nerve growth factor induced neurite outgrowth and signaling,”IEEE Transactions Biomedical Engineering, vol. 56, no. 5, pp. 1524–1534, 2009.12, 13
[46] M.-c. Lu, C.-y. Ho, S.-f. Hsu, H.-c. Lee, J.-h. Lin, C.-h. Yao, and Y.-s. Chen,“Effects of electrical stimulation at different frequencies on regeneration of tran-sected peripheral nerve,” Neurorehabilitation Neural Repair, vol. 22, no. 4, pp.367–373, 2008. 12, 13
[47] M. Vivó, A. Puigdemasa, L. Casals, E. Asensio, E. Udina, and X. Navarro,“Immediate electrical stimulation enhances regeneration and reinnervationand modulates spinal plastic changes after sciatic nerve injury and repair,”Experimental Neurology, vol. 211, no. 1, pp. 180 – 193, 2008. [Online]. Available:http://www.sciencedirect.com/science/article/pii/S0014488608000514 12, 13
[48] N. M. Geremia, T. Gordon, T. M. Brushart, A. A. Al-Majed, and V. M. K.Verge, “Electrical stimulation promotes sensory neuron regeneration and growth-associated gene expression,” Experimental Neurology, vol. 205, no. 2, pp.347–359, Jun. 2007. [Online]. Available: http://www.ncbi.nlm.nih.gov/pubmed/17428474 12, 13
[49] H. Zhou, Q. Xu, J. He, H. Ren, H. Zhou, and K. Zheng, “A fullyimplanted programmable stimulator based on wireless communication forepidural spinal cord stimulation in rats.” Journal of Neuroscience Methods,vol. 204, no. 2, pp. 341–348, Mar. 2012. [Online]. Available: http://www.ncbi.nlm.nih.gov/pubmed/22085835 12, 13, 14
[50] P. Ahlborn, M. Schachner, and A. Irintchev, “One hour electrical stimulationaccelerates functional recovery after femoral nerve repair,” ExperimentalNeurology, vol. 208, no. 1, pp. 137–144, Nov. 2007. [Online]. Available:http://www.ncbi.nlm.nih.gov/pubmed/17919580 13
[51] K. H. Polasek, H. A. Hoyen, M. W. Keith, R. F. Kirsch, and D. J. Tyler, “Stim-ulation stability and selectivity of chronically implanted multicontact nerve cuffelectrodes in the human upper extremity,” IEEE Transactions Neural Systems Re-habilitation Engineering, vol. 17, no. 5, pp. 428–437, 2009. 13
[52] T. N. Nielsen, G. A. M. Kurstjens, and J. J. Struijk, “Transverse Versus Longitu-dinal Tripolar Configuration for Selective Stimulation With Multipolar Cuff Elec-trodes,” IEEE Transactions Biomedical Engineering, vol. 58, no. 4, pp. 913–919,2011. 13
266
[53] D. Salter, F. J. R. Richmond, and G. E. Loeb, “Prevention of muscle disuse atro-phy by low-frequency electrical stimulation in rats,” IEEE Transactions On Neu-ral Systems And Rehabilitation Engineering, vol. 11, no. 3, pp. 218–226, 2003.13
[54] Y.-h. Kim, C. Lee, K.-m. Ahn, M. Lee, and Y.-j. Kim, “Robust and real-timemonitoring of nerve regeneration using implantable flexible microelectrode ar-ray,” Biosensors and Bioelectronics, vol. 24, pp. 1883–1887, 2009. 13
[55] C.-P. Young, S.-F. Liang, D.-W. Chang, Y.-C. Liao, F.-Z. Shaw, and C.-H. Hsieh,“A portable wireless online closed-loop seizure controller in freely moving rats,”IEEE Transactions Instrumentation and Measurement, vol. 60, no. 2, pp. 513–521, 2011. 14
[56] Cyberonics, “Vagus Nerve Stimulator.” [Online]. Available: www.cyberonics.com 14
[57] A. Asfour, C. Fiche, and C. Deransart, “Dedicated electronics for electrical stim-ulation and eeg recording using the same electrodes: application to the automaticcontrol of epileptic seizures by neurostimulation,” in IEEE Proceedings Instru-mentation and Measurement Technology Conference (I2MTC), 2007, pp. 1–4. 14
[58] C. Hamani, M. Hodaie, J. Chiang, M. del Campo, D. M. Andrade,D. Sherman, M. Mirski, L. E. Mello, and A. M. Lozano, “Deep brainstimulation of the anterior nucleus of the thalamus: Effects of electricalstimulation on pilocarpine-induced seizures and status epilepticus,” EpilepsyResearch, vol. 78, no. 2-3, pp. 117–123, 2008. [Online]. Available:http://www.sciencedirect.com/science/article/pii/S0920121107002859 14
[59] R. de Haas, R. Struikmans, G. van der Plasse, L. van Kerkhof, J.Brakkee, M. Kas,and H. Westenberg, “Wireless implantable micro-stimulation device for highfrequency bilateral deep brain stimulation in freely moving mice,” Journal ofNeuroscience Methods, vol. 209, no. 1, pp. 113–119, 2012. [Online]. Available:http://www.sciencedirect.com/science/article/pii/S0165027012002051 14
[60] R. Beach, R. Conlan, M. Godwin, and F. Moussy, “Towards a miniature im-plantable in vivo telemetry monitoring system dynamically configurable as a po-tentiostat or galvanostat for two and three-electrode biosensors,” IEEE Transac-tions Instrumentation Measurement, vol. 54, no. 1, pp. 61–72, 2005. 14
[61] R. Beach, F. Kuster, and F. Moussy, “Subminiature implantable potentiostat andmodified commercial telemetry device for remote glucose monitoring,” IEEETransactions Instrumentation Measurement, vol. 48, no. 6, pp. 1239–1245, 1999.14
[62] M. Birkholz, K. Ehwald, T. Basmer, P. Kulse, C. Reich, J. Drews,D. Genschow, U. Haak, S. Marschmeyer, E. Matthus, K. Schulz, D. Wolansky,W. Winkler, T. Guschauski, and R. Ehwald, “Sensing glucose concentrationsat GHz frequencies with a fully embedded biomicro-electromechanical
267
system (BioMEMS),” Journal of Applied Physics, vol. 113, no. 24, 2013.[Online]. Available: http://scitation.aip.org/content/aip/journal/jap/113/24/10.1063/1.4811351 14
[63] S. Lewis, M. Russold, H. Dietl, R. Ruff, T. Dorge, K. Hoffmann, L. Abu-Saleh,D. Schroder, W. Krautschneider, S. Westendorff, A. Gail, T. M. E., and Kaniusas,“Acquisition of muscle activity with a fully implantable multi-channel measure-ment system,” in IEEE International Instrumentation and Measurement Technol-ogy Conference (I2MTC), 2012, pp. 996–999. 14
[64] S. Hao, J. Taylor, A. Miles, and C. Bowen, “An implantable electronic systemfor in-vivo stability evaluation of prosthesis in total hip and knee arthroplasty,” inIEEE Instrumentation and Measurement Technology Conference, I2MTC 2009.,2009, pp. 171–176. 14
[65] C.-C. Huang, J.-S. Liou, Y.-J. Ciou, I.-Y. Huang, C.-P. Li, Y.-C. Lee, and W.-J.Wu, “An implantable long-term bladder urine pressure measurement system witha 1-atm canceling instrumentation amplifier,” in IEEE International SymposiumCircuits and Systems (ISCAS), 2007, pp. 2383–2386. 14
[66] Medtronic, “Spinal cord stimulator (SCS).” [Online]. Available: www.medtronic.com 14, 15
[67] C. O. Oluigbo and A. R. Rezai, “Addressing neurological disorders with neuro-modulation,” IEEE Transactions on Biomedical Engineering, vol. 58, no. 7, pp.1907–1917, 2011. 14
[68] F. C. Flack, E. D. James, and S. D. M., “Mutual inductance of air-cored coils:Effect on design of radio-frequency coupled implants,” Medical Biological Engi-neering, vol. 9, no. 22, pp. 79–85, Mar. 1971. 15, 16
[69] W. H. Ko, S. P. Liang, and C. D. F. Fung, “Design of radio-frequency pow-ered coils for implant instruments,” Medical Biological Engineering Computing,vol. 15, no. 6, pp. 634–640, Nov. 1977. 15, 16
[70] Heetderks and J. William, “Rf powering of millimeter- and submillimeter-sizedneural prosthetic implants,” Biomedical Engineering, IEEE Transactions on,vol. 35, no. 5, pp. 323–327, May 1988. 15, 16
[71] S. Kim, J. Ho, and A. S. Y. Poon, “Wireless power transfer to miniature implantstransmitter optimization,” IEEE Transactions Antennas and Propagation, vol. 60,no. 10, pp. 4838–4845, Oct. 2012. 15, 16
[72] T. Sun, X. Xie, G. Li, Y. Gu, Y. Deng, and Z. Wang, “A two-hop wireless powertransfer system with an efficiency-enhanced power receiver for motion-free cap-sule endoscopy inspection,” IEEE Transactions Biomedical Engineering, vol. 59,no. 11, pp. 3247–3254, Nov 2012. 15, 16
268
[73] E. Y. Chow, A. L. Chlebowski, S. Member, S. Chakraborty, W. J. Chappell, andP. P. Irazoqui, “Fully wireless implantable cardiovascular pressure monitor in-tegrated with a medical stent,” IEEE Transactions on Biomedical Engineering,vol. 57, no. 6, pp. 1487–1496, 2010. 15, 16
[74] E. Y. Chow, B. Beier, Y. Ouyang, W. J. Chappell, and P. P. Irazoqui, “High fre-quency transcutaneous transmission using stents configured as a dipole radiatorfor cardiovascular implantable devices,” in IEEE MTT-S International MicrowaveSymposium Digest, 2009, pp. 1317–1320. 15, 16, 18, 23
[75] R. A. Bercich, D. R. Duffy, and P. P. Irazoqui, “Far-field RF powering of im-plantable devices: safety considerations,” IEEE Transactions Biomedical Engi-neering, vol. 60, no. 8, pp. 2107–2112, 2013. 15, 16, 17, 22, 23
[76] S. Lewis, M. Russold, H. Dietl, R. Ruff, J. Audi, K.-P. Hoffmann, L. Abu-Saleh,D. Schroeder, W. Krautschneider, S. Westendorff, A. Gail, T. Meiners, and E. Ka-niusas, “Fully implantable multi-channel measurement system for acquisition ofmuscle activity,” IEEE Transactions Instrumentation and Measurement, vol. 62,no. 7, pp. 1972–1981, Jul. 2013. 15
[77] S. Seydnejad and M. Samani, “An implantable telemetry system for long-termbio-signal recording,” in IEEE Instrumentation and Measurement TechnologyConference (I2MTC), May 2010, pp. 867–870. 16
[78] W. Lei, T. Drysdale, and D. Cumming, “In situ characterization of two wirelesstransmission schemes for ingestible capsules,” IEEE Transactions Biomedical En-gineering, vol. 54, no. 11, pp. 2020–2027, Nov 2007. 16, 23
[79] J. S. Ho, A. J. Yeh, E. Neofytou, S. Kim, Y. Tanabe, B. Patlolla, R. E. Beygui,and A. S. Y. Poon, “Wireless power transfer to deep-tissue microimplants.”Proceedings of the National Academy of Sciences of the United States ofAmerica, vol. 111, no. 22, pp. 7974–9, Jun. 2014. [Online]. Available:http://www.ncbi.nlm.nih.gov/pubmed/24843161 16
[80] E. Chow, A. Chlebowski, and P.P.Irazoqui, “A miniature-implantable RF-wirelessactive glaucoma intraocular pressure monitor,” IEEE Transactions BiomedicalCircuits and Systems, vol. 4, no. 6, pp. 340–349, Dec 2010. 17
[81] K. F. Lee and L. M. Luk, Microstrip Patch Antennas, T. K. Wei, Ed. ImperialCollege Press, 2011. 17, 27, 30
[82] J. Kim and Y. Rahmat-Samii, “Implanted antennas inside a human body: sim-ulations, designs, and characterizations,” IEEE Transactions Microwave TheoryTechniques, vol. 52, no. 8, pp. 1934–1943, Aug. 2004. 17, 21, 34, 35
[83] W. Huang and A. A. Kishk, “Embedded spiral microstrip implantable antenna,”International Journal Antennas Propagations, vol. 2011, p. 6, 2011. 17, 18, 21
[84] A. Kiourti and K. Nikita, “Miniaturization vs gain and safety considerations ofimplantable antennas for wireless biotelemetry,” in IEEE International Sympo-sium Antennas and Propagations Society (APSURSI), 2012, pp. 1–2. 17, 20, 21
269
[85] T. Houzen, M. Takahashi, and K. Ito, “Implanted antenna for an artificial cardiacpacemaker system,” Progress In Electromagnetics Research Symposium (PIERS)Prague, Czech Republic,, pp. 51–54, Aug. 2007. 17, 18
[86] A. Skriverviky and M. Francesco, “Design and characterization of bio-implantable antennas,” in Proceedings International Conference Applied Elec-tromagnetics and Communications, 2010, pp. 1–5. 17
[87] J. Gemio, J. Parron, and J. Soler, “Human body effects on implantable antennasfor ism bands applications: models comparison and propagation losses study,” inProgress In Electromagnetics Research, vol. 110, 2010, pp. 437–452. 17
[88] F.-J. Huang, C.-M. Lee, C.-L. Chang, L.-K. Chen, T.-C. Yo, and C.-H. Luo,“Rectenna application of miniaturized implantable antenna design for triple-band biotelemetry communication,” IEEE Transactions Antennas Propagations,vol. 59, no. 7, pp. 2646 –2653, Jul. 2011. 17
[89] A. Kiourti and K. Nikita, “A review of implantable patch antennas for biomed-ical telemetry: Challenges and solutions [wireless corner],” IEEE Antennas andPropagations Magazine, vol. 54, no. 3, pp. 210–228, 2012. 17, 35
[90] T. Dissanayake, K. Esselle, and M. Yuce, “Dielectric loaded impedance matchingfor wideband implanted antennas,” IEEE Transactions Microwave Theory Soci-ety, vol. 57, no. 10, pp. 2480 –2487, Oct. 2009. 17
[91] J. Ung and T. Karacolak, “A wideband implantable antenna for continuous healthmonitoring in the MedRadio and ISM bands,” IEEE Antennas Wireless Propaga-tions Letters, vol. 11, pp. 1642–1645, 2012. 17, 21
[92] M. R. K. N. H. Ramli, E. N. Ahyat and N. A. Samsuri, “Design an implantableantenna at 2.45 GHz for wireless implantable body area network (WiBAN) appli-cations,” in IEEE International RF and Microwave Conference (RFM), 2011, pp.329–332. 17
[93] N. Vidal, J. Lopez-Villegas, S. Curto, J. Colomer, S. Ahyoune, A. Garcia,J. Sieiro, and F. Ramos, “Design of an implantable broadband antenna for medicaltelemetry applications,” in 7th European Conference Antennas and Propagation(EuCAP), 2013, pp. 1133–1136. 17
[94] Z. Duan, Y.-X. Guo, R.-F. Xue, M. Je, and D.-L. Kwong, “Differentially feddual-band implantable antenna for biomedical applications,” IEEE TransactionsAntennas and Propagation, vol. 60, no. 12, pp. 5587–5595, 2012. 17
[95] W. jun Lu and H. bo Zhu, “Balanced implantable slot-dipole composite antennafor multiband biomedical applications,” in IEEE International Wireless Sympo-sium (IWS), 2013, pp. 1–5. 17
[96] A. Kiourti and K. Nikita, “Miniature scalp-implantable antennas for telemetry inthe MICS and ISM bands: Design, safety considerations and link budget analy-sis,” IEEE Transactions Antennas and Propagation, vol. 60, no. 8, pp. 3568–3575,2012. 17

270
[97] C.-L. Yang, C.-L. Tsai, K.-T. Cheng, and S.-H. Chen, “Low-invasive implantabledevices of low-power consumption using high-efficiency antennas for cloudhealth care,” IEEE Journal Emerging and Selected Topics in Circuits and Sys-tems, vol. 2, no. 1, pp. 14–23, 2012. 17
[98] S. A. Kumar and T. Shanmuganantham, “Implantable CPW fed dual folded dipoleantenna for biomedical applications,” in Third International Conference Comput-ing Communication Networking Technologies (ICCCNT), 2012, pp. 1–5. 17, 27
[99] M. Hosain, A. Kouzani, and S. Tye, “Multi-layer implantable antenna for closedloop deep brain stimulation system,” in International Symposium Communica-tions and Information Technologies (ISCIT), 2012, pp. 643–648. 17
[100] S. Yanase, M. Takahashi, K. Saito, and K. Ito, “Study of implantable antenna forartificial knee joints,” in International Symposium on Antennas and Propagations(ISAP), 2012, pp. 1244–1247. 17
[101] T.-F. Chien, C.-M. Cheng, H.-C. Yang, J.-W. Jiang, and C.-H. Luo, “Developmentof nonsuperstrate implantable low-profile CPW-Fed ceramic antennas,” IEEE An-tennas and Wireless Propagation Letters, vol. 9, pp. 599–602, 2010. 17
[102] P. Kumar, G. Singh, S. Bhooshan, and T. Chakravarty, “Gap-coupled microstripantennas,” in International Conference Computational Intelligence and Multime-dia Applications, vol. 4, Dec. 2007, pp. 434 –437. 17
[103] R. Porath, “Theory of miniaturized shorting-post microstrip antennas,” IEEETransactions Antennas Propagations, vol. 48, no. 1, pp. 41–47, Jan. 2000. 17
[104] T. Lo, C.-O. Ho, Y. Hwang, E. Lam, and B. Lee, “Miniature aperture-coupledmicrostrip antenna of very high permittivity,” Electronics Letters, vol. 33, no. 1,pp. 9–10, Jan. 1997. 17, 155
[105] Y.-P. Zhang, T.-C. Lo, and Y.-M. Hwang, “A dielectric-loaded miniature antennafor microcellular and personal communications,” in International Symposium An-tennas and Propagations Society, vol. 2, Jun. 1995, pp. 1152 –1155 vol.2. 17,151, 155
[106] Y. Hwang, Y. Zhang, G. Zheng, and T. Lo, “Planar inverted F antenna loaded withhigh permittivity material,” Electronics Letters, vol. 31, no. 20, pp. 1710 –1712,Sep. 1995. 17, 155
[107] R. Waterhouse and S. Targonski, “Performance of microstrip patches incorporat-ing a single shorting post,” in International Symposium Antennas and Propaga-tions Society, vol. 1, Jul. 1996, pp. 29–32. 17, 19
[108] H. Sanad, “Effect of the shorting posts on short circuit microstrip antennas,” inInternational Symposium Antennas and Propagations Society, vol. 2, Jun. 1994,pp. 794–797. 17
271
[109] R. Waterhouse, S. Targonski, and D. Kokotoff, “Design and performance of smallprinted antennas,” IEEE Transactions Antennas Propagations, vol. 46, no. 11, pp.1629 –1633, Nov. 1998. 17
[110] K. Wong, C. Tang, and H. Chen, “A compact meandered circular microstripantenna with a shorting pin,” Microwave and Optical Technology Letters, vol. 15,no. 3, pp. 147–149, 1997. [Online]. Available: http://dx.doi.org/10.1002/(SICI)1098-2760(19970620)15:3<147::AID-MOP8>3.0.CO;2-G 17
[111] I. Park and R. Mittra, “Aperture-coupled small microstrip antenna,” Elec-tronics Letters, vol. 32, no. 19, pp. 1741–1742, Sep. 1996. [On-line]. Available: http://ieeexplore.ieee.org/stamp/stamp.jsp?tp=&arnumber=533464&isnumber=11635 17
[112] R. Waterhouse, “Small microstrip patch antenna,” Electronics Letters, vol. 31,no. 8, pp. 604 –605, Apr. 1995. 17, 19
[113] A. Shackelford, K. Lee, and K. Luk, “Design of small-size wide-bandwidthmicrostrip-patch antennas,” IEEE Antennas and Propagations Magazine, vol. 45,no. 1, pp. 75–83, 2003. 17
[114] M. Scardelletti, G. Ponchak, J. Jordan, N. Jastram, and J. Mahaffey, “Tunablereduced size planar folded slot antenna utilizing varactor diodes,” in IEEE Radioand Wireless Symposium (RWS), 2010, pp. 547–550. 17
[115] T. Tsukiji, Y. Kumon, and M. Yamasaki, “Double-folded monopole antenna us-ing parallel line or coaxial cable,” IEEE Proceedings Microwave, Antennas andPropagations, vol. 149, no. 1, pp. 17–22, 2002. 17
[116] T. Nakao, T. Nguyen, M. Nagatoshi, and H. Morishita, “Fundamental study oncurved folded dipole antenna,” in IEEE International Symposium Antennas andPropagations Society (APSURSI), 2012, pp. 1–2. 17
[117] C. Xiaoyu, S. Jun, K. Jungkwun, K. Cheolbok, D. Senior, and Y. Yong-Kyu, “Acompact self-packaged patch antenna folded in rectangular waveguide shape,” inIEEE International Symposium Antennas and Propagations (APSURSI), 2011,pp. 888–890. 17
[118] A. Ezanuddin, P. Soh, L. Soo, and M. Majmi, “Miniaturization and broadbandingtechniques for folded meander line microstrip antennas,” in IEEE InternationalWorkshop Antenna Technology (iWAT), 2009, pp. 1–4. 17
[119] A. Holub and M. Polivka, “A novel microstrip patch antenna miniaturizationtechnique: A meanderly folded shorted-patch antenna,” in 14th Conference Mi-crowave Society (COMITE), 2008, pp. 1–4. 17
[120] Z. Jiaying and O. Breinbjerg, “Miniaturization of multiple-layer folded patch an-tennas,” in 3rd European Conference Antennas and Propagations (EuCAP), 2009,pp. 3502–3506. 17, 19
272
[121] R. Wan-Lae and W. Jong-Myung, “Miniaturization of microstrip antenna usingfolded structure with attaching plates for satellite communication terminal,” inIEEE International Symposium Antennas and Propagations Society, 2007, pp.4709–4712. 17
[122] A. Bhattacharyya and R. Garg, “Effect of substrate on the efficiency of an arbitrar-ily shaped microstrip patch antenna,” IEEE Transactions Antennas Propagations,vol. 34, no. 10, pp. 1181–1188, Oct 1986. 17
[123] H. Mizuno, R. Ito, M. Takahashi, and K. Saito, “A helical folded dipole antennafor implantable communication devices,” in IEEE International Symposium An-tennas and Propagations Society (APSURSI), Jul. 2010, pp. 1 –4. 17, 20
[124] K. Yazdandoost and R. Kohno, “An antenna for medical implant communicationssystem,” in European Microwave Conference, Oct. 2007, pp. 968 –971. 17, 20,21
[125] M.-R. Tofighi, “Characterization of biomedical antennas for microwave heating,radiometry, and implant communication applications,” in IEEE 12th Annual Wire-less and Microwave Technology Conference (WAMICON), Apr. 2011, pp. 1–6. 17,21
[126] C.-M. Lee, T.-C. Yo, and C.-H. Luo, “Compact broadband stacked implantableantenna for biotelemetry with medical devices,” in IEEE Annual Wireless andMicrowave Technology Conference (WAMICON), 2006, pp. 1–4. 17, 19, 21
[127] F. Merli, L. Bolomey, J. Zurcher, G. Corradini, E. Meurville, and A. Skrivervik,“Design, realization and measurements of a miniature antenna for implantablewireless communication systems,” IEEE Transactions Antennas Propagations,vol. 59, no. 10, pp. 3544–3555, Oct. 2011. 17, 20, 149, 174
[128] S. Islam, K. Esselle, D. Bull, and P. Pilowsky, “Design of an implantable antennato acquire physiological signals in rats,” in IEEE International Symposium Anten-nas and Propagations Society (APSURSI), 2012, pp. 1–2. 17
[129] P. Soontornpipit, C. Furse, and Y. C. Chung, “Design of implantable microstripantenna for communication with medical implants,” IEEE Transactions Mi-crowave Theory Society, vol. 52, no. 8, pp. 1944–1951, Aug. 2004. 17, 18
[130] R. Warty, M.-R. Tofighi, U. Kawoos, and A. Rosen, “Characterization of im-plantable antennas for intracranial pressure monitoring: Reflection by and trans-mission through a scalp phantom,” IEEE Transactions Microwave Theory Society,vol. 56, no. 10, pp. 2366 –2376, Oct. 2008. 17, 18
[131] E. Y. Chow, Y. Ouyang, B. Beier, W. J. Chappell, and P. P. Irazoqui, “Evaluationof cardiovascular stents as antennas for implantable wireless applications,” IEEETransactions on Microwave Theory and Techniques, vol. 57, no. 10, pp. 2523–2532, 2009. 17, 18, 23

273
[132] F. Zengin, E. Akkaya, B. Turetken, and S. San, “Design and realization of ultrawide-band implant antenna for biotelemetry systems,” in General Assembly andScientific Symposium, 2011, pp. 1–4. 17, 18
[133] S. Islam, K. P. Esselle, D. Bull, and P. M. Pilowsky, “Converting a WirelessBiotelemetry System to an Implantable System Through Antenna Redesign,”IEEE Transactions on Microwave Theory and Techniques, vol. 62, no. 9, pp.1890–1897, 2014. 17
[134] “IEEE standard for safety levels with respect to human exposure to radio fre-quency electromagnetic fields, 3 kHz to 300 GHz,” IEEE Std C95.1, 1999 Edition,1999. 21
[135] D. G. J. Swanson and W. J. R. Hoefer, Microwave Circuit Modeling Using Elec-tromagnetic Field Simulation. Norwood, MA: Artech House, 2003. 22, 23
[136] F. uDirkManteuffel and EM, EM Modeling of Antennas and RF Components forWireless Communication Systems. Berlin, Germany: Springer Verlag, 2006. 22,23
[137] T. Weiland, M. Timm, I. Munteanu, and T. Weiland, “A practical guide to 3-dsimulation,” IEEE Microwave Magazine, no. Dec., pp. 62–75, 2008. 22, 23, 24
[138] A. Inc., “Ansys HFSS,” 2014. [Online]. Available: www.ansys.com 23
[139] CST-Computer Simulation Technology, “CST Microwave Studio,” 2012.[Online]. Available: www.cst.com 23, 24, 35, 56, 64, 140, 212
[140] a. Christ, M. Douglas, J. Nadakuduti, and N. Kuster, “Assessing human exposureto electromagnetic fields from wireless power transmission systems,” Proceedingsof the IEEE, vol. 101, no. 6, pp. 1482–1493, Jun. 2013. 23
[141] L. S. Xu, M. Q. Meng, and H. L. Ren, “Electromagnetic radiation from ingestedsources in the human intestine at the frequency of 2.4ghz,” Progress In Electro-magnetics Research Symposium, pp. 893–897, 2008. 23
[142] C. Gabriel, S. Gabriel, and E. Corthout, “The dielectric properties of biologicaltissues: I. literature survey,” Physics in Medicine and Biology, vol. 41, no. 11, p.2231, 1996. [Online]. Available: http://stacks.iop.org/0031-9155/41/i=11/a=00124
[143] S. Gabriel, R. W. Lau, and C. Gabriel, “The dielectric properties of biologicaltissues: II. measurements in the frequency range 10 hz to 20 ghz,” Physicsin Medicine and Biology, vol. 41, no. 11, p. 2251, 1996. [Online]. Available:http://stacks.iop.org/0031-9155/41/i=11/a=002 24, 35, 45, 63, 64, 82, 149
[144] ——, “The dielectric properties of biological tissues: III. parametric models forthe dielectric spectrum of tissues,” Physics in Medicine and Biology, vol. 41,no. 11, pp. 2271–2293, 1996. 24, 35
274
[145] M. Fallah-Rad and L. Shafai, “Gain enhancement in embedded microstripantennas,” Microwave and Optical Technology Letters, vol. 50, no. 2, pp.269–271, 2008. [Online]. Available: http://dx.doi.org/10.1002/mop.23070 27
[146] K. Shams, M. Ali, and A. Miah, “Characteristics of an embedded microstrip patchantenna for wireless infrastructure health monitoring,” in IEEE International Sym-posium Antennas and Propagations Society, 2006, pp. 3643–3646. 27
[147] S. Jiang and S. Georgakopoulos, “Optimum wireless powering of sensors embed-ded in concrete,” IEEE Transactions Antennas Propagations, vol. 60, no. 2, pp.1106–1113, 2012. 27
[148] G. Kumar and K. Ray, Broadband Microstrip Antennas. Artech House, 2003.27, 28, 29, 30
[149] C. A. Balanis, Modern Antenna Handbook. John Wiley and Sons, Inc., 2008,ch. 4, pp. 157–196. 27, 43
[150] ——, Modern Antenna Handbook. John Wiley & Sons, Inc., 2008. 27, 30, 31
[151] R. Harrington, Time-Harmonic Electromagnetic Fields. IEEE, 2001. 27
[152] D. Pozar, Microwave Engineering. Wiley, 2004. [Online]. Available:http://books.google.com.au/books?id=4wzpQwAACAAJ 29, 33
[153] I. J. Bahl and P. Bhartia, Microstrip Antennnas. Artech House, Dedham, MA,1980. 29
[154] C. A. Balanis, Antenna Theory: Analysis Design, 3rd ed. John Wiley & Sons,Inc., 2005. 30, 31, 153
[155] W. Rowe and R. Waterhouse, “Investigation into the performance of proximitycoupled stacked patches,” IEEE Transactions on Antennas and Propagations,vol. 54, no. 6, pp. 1693–1698, Jun. 2006. 30
[156] D. M. Pozar and D. H. Schaubert, Microstrip Antennas, The Analysis and Designof Microstrip Antennas and Arrays. John Wiley & Sons, Inc., Hoboken, NewJersey., 1995. 30, 31
[157] D. M. Pozar, Microwave Engineering, 3rd ed. John Wiley and Sons, Inc., 2005,ch. 3, p. 142. 32
[158] W. H. and J. Hayt, Engineering Electromagnetics, internationl ed. McGraw-Hill,1989. 33
[159] L. Sandrolini, U. Reggiani, and A. Ogunsola, “Modelling the electrical propertiesof concrete for shielding effectiveness prediction,” Journal Physics D: ApplliedPhysics, vol. 40, pp. 5366–5372, 2007. 33
275
[160] M. Scarpello, D. Kurup, H. Rogier, D. Vande Ginste, F. Axisa, J. Vanfleteren,W. Joseph, L. Martens, and G. Vermeeren, “Design of an implantable slot dipoleconformal flexible antenna for biomedical applications,” IEEE Transactions An-tennas Propagations, vol. 59, no. 10, pp. 3556 –3564, Oct. 2011. 34
[161] R. Salama, S. Kharkovsky, R. Liyanapathirana, and U. Gunawardana, “An im-plantable miniature microstrip disk antenna,” in 2012 IEEE International Sympo-sium Antennas Propagations (APSURSI), Jul. 2012, pp. 1–2. 35
[162] TE Connectivity. [Online]. Available: http://www.te.com/catalog/products/en?q=1052324-1 39
[163] C. A. Balanis, Antenna Theory: Analysis Design, 3rd ed. John Wiley & Sons,Inc., 2005, ch. 14, p. 834. 43
[164] RSComponents. [Online]. Available: http://docs-asia.electrocomponents.com/webdocs/1005/0900766b81005f68.pdf 55, 201
[165] A. Sedra S. and K. Smith C., Microelectronic Circuits, 4th ed. Oxford UniversityPress, 1998, ch. 3, p. 190. 55
[166] G. Roqueta, L. Jofre, and M. Feng, “Analysis of the electromagnetic signature ofreinforced concrete structures for nondestructive evaluation of corrosion damage,”IEEE Transactions Instrumentation Measurement, vol. 61, no. 4, pp. 1090–1098,2012. 82
[167] Rogers Corporation, “Ro4000 LoProTM Laminates.” [Online]. Available: http://www.rogerscorp.com/acm/products/53/RO4000-LoPro-Laminates.aspx 99, 187
[168] MathWorks, “MATLAB.” [Online]. Available: http://www.mathworks.com.au/110
[169] RSComponents. [Online]. Available: http://docs-asia.electrocomponents.com/webdocs/11cf/0900766b811cfe0e.pdf 111
[170] ——. [Online]. Available: http://docs-asia.electrocomponents.com/webdocs/0b6d/0900766b80b6d3f1.pdf 113
[171] ——. [Online]. Available: http://docs-asia.electrocomponents.com/webdocs/0b6d/0900766b80b6d3de.pdf 113
[172] X. Yu, G. Li, L. Zhang, and Z. Wang, “Design and test of a miniature 2.45 GHzantenna for implantable medical devices,” in IEEE 14th International Mixed-Signals, Sensors, and Systems Test Workshop (IMS3TW), Jun. 2008, pp. 1–5. 141,142, 145
[173] “IEEE standard for safety levels with respect to human exposure to radio fre-quency electromagnetic fields, 3 kHz to 300 GHz,” IEEE Std C95.1-2005 (Revi-sion of IEEE Std C95.1-1991), pp. 1–238, 2006. 212, 213, 252

276
[174] “IEEE recommended practice for measurements and computations of radio fre-quency electromagnetic fields with respect to human exposure to such fields,100kHz - 300 GHz,” IEEE Std C95.3-2002 (Revision of IEEE Std C95.3-1991), pp.i–126, 2002. 212