5/16/2019
1
Michigan Automotive Industry UpdateKristin Dziczek – Vice President, Industry, Labor, & Economics (ILE) Group
Consensus Revenue Estimating Conference
17 May 2019
2CENTER FOR AUTOMOTIVE RESEARCH
THE CENTER FOR AUTOMOTIVE RESEARCH (CAR)
Automotive industry contract research and service organization (non‐profit ) with more than 30 years experience forecasting industry trends, advising on public
policy, and sponsoring multi‐stakeholder communication forums.
Consortia that bring together industry stakeholders to participate in working groups, networking opportunities, and access to CAR staff.
RESEARCH EVENTS CONNECTIndustry‐driven events and conferences that deliver content, context, and connections.
Independent research and analysis on critical issues facing the industry.

5/16/2019
2
CENTER FOR AUTOMOTIVE RESEARCH 3
• Sales & Production• Employment• Automaker Investments• GM Announcements• Trade Update
AGEN
DA
4
Sales & Production Overview
Areas to Watch
• Michigan’s share of U.S. vehicle production increased to 18.8%
• Michigan’s engine productionwill decrease and transmission production will increase over the next few years
• Electrified vehicle market share increased to 4.4%, the highest level ever recorded
CENTER FOR AUTOMOTIVE RESEARCH

5/16/2019
3
5CENTER FOR AUTOMOTIVE RESEARCH
Positive Factors in the CAR Forecast
Projected moderate U.S. economic output growth in 2019
Historically low U.S. unemployment rates
Relatively low oil prices continue through 2020
Underlying nominal wage growth continues
High levels of consumer confidence were reached in Q4 2018, and
Solid new housing starts and home prices rebounding to pre‐recession levels
6CENTER FOR AUTOMOTIVE RESEARCH
Risks to the Forecast
USMCA Ratification ?
Section 232 Steel & Aluminum Tariffs
Section 232 Auto & Parts Tariffs
U.S.‐China Talks
U.S.‐Japan Talks
U.S.‐EU Talks
U.S.‐U.K. Talks
Section 301 China Tariffs
Recession?
China Auto Sales Slowdown
Japan Economic Slowdown
BREXIT
New• BusinessModels
• Competitors• Technologies
Geopolitical Risks
Consumer Confidence
Interest Rates
UAW Negotiations/Strike

5/16/2019
4
7CENTER FOR AUTOMOTIVE RESEARCH
CAR’s U.S. Light Vehicle Sales Forecast 2019‐2025
17.4 17.517.2 17.2
16.816.5 16.4
16.8
17.317.6 17.7
2015 2016 2017 2018 2019 2020 2021 2022 2023 2024 2025
U.S. LV Sales in
Millions
U.S. Sales
Source: CAR Research, January 2019
8
U.S. Light Vehicle Monthly Sales and SAAR:April 2016 to April 2019
CENTER FOR AUTOMOTIVE RESEARCH
16.43
0
2
4
6
8
10
12
14
16
18
20
0.0
0.2
0.4
0.6
0.8
1.0
1.2
1.4
1.6
1.8
2.0
Apr‐16 Jul‐16 Oct‐16 Jan‐17 Apr‐17 Jul‐17 Oct‐17 Jan‐18 Apr‐18 Jul‐18 Oct‐18 Jan‐19 Apr‐19
Monthly SAAR
Ligh
t Veh
icle Sales (Millions)
Sales SAAR
Source: Wards Auto; CAR Research

5/16/2019
5
9
U.S. Light Vehicle SalesPercent Change (YTD) Through April: 2019 vs. 2018
CENTER FOR AUTOMOTIVE RESEARCH
‐8.5%
0.7%
‐2.2%
‐10% ‐8% ‐6% ‐4% ‐2% 0% 2%
Passenger Cars
Light Trucks
Total
Source: Wards Auto; CAR Research
5,323,276
Total‐122,134
100%
3,719,088
Truck+26,807
69.9%
1,604,188
Cars‐148,941
30.1%
10
Percent Change in Sales of Light Vehicles Per OEM:YTD Through April: 2019 vs. 2018
CENTER FOR AUTOMOTIVE RESEARCH
‐6.7%
‐6.0%
‐4.8%
‐3.9%
‐2.4%
1.5%
3.7%
‐2.2%
‐8% ‐6% ‐4% ‐2% 0% 2% 4% 6%
Nissan/Mitsubishi
GM
Toyota
FCA
Ford
Honda
Hyundai‐ Kia
TOTAL LV Sales
Source: Wards Auto; CAR Research
5,322,611
TOTAL LV Sales‐121,614
100%
396,794
Hyundai‐ Kia14,324
7.5%
495,562
Honda7,370
9.3%
761,134
Ford‐18,820
14.3%
667,198
FCA ‐27,247
12.5%
727,580
Toyota‐36,809
13.7%
896,013
GM‐56,803
16.8%
510,579
Nissan/Mitsubishi‐36,950
9.6%

5/16/2019
6
11
U.S. Market Share: YTD April 2019
CENTER FOR AUTOMOTIVE RESEARCH
Units: 396,794
Units: 495,562
Units: 510,579
Units: 667,198
Units: 727,580
Units: 761,134
Units: 896,013
7.5%
9.3%
9.6%
12.5%
13.7%
14.3%
16.8%
0 100,000 200,000 300,000 400,000 500,000 600,000 700,000 800,000 900,000 1,000,000
Hyundai‐ Kia
Honda
Nissan/Mitsubishi
FCA
Toyota
Ford
GM
Source: Wards Auto; CAR Research
12
U.S. Electrified Light Vehicle Sales by Propulsion Technologies1999 – 2019 YTD Through April
CENTER FOR AUTOMOTIVE RESEARCH
Note: Electrified vehicles consist of BEV, HEV and PHEV
Source: Ward’s Automotive Reports (from 2010 and on), HybridCars.com and CAR Research
2.1% 2.0% 2.0%
0.5% 0.7% 0.5%
0.6%
1.2% 1.7%
0.0%
0.5%
1.0%
1.5%
2.0%
2.5%
3.0%
3.5%
4.0%
4.5%
1999 2000 2001 2002 2003 2004 2005 2006 2007 2008 2009 2010 2011 2012 2013 2014 2015 2016 2017 2018 2019
Hybrid Plug‐In Hybrid Electric

5/16/2019
7
13CENTER FOR AUTOMOTIVE RESEARCH
CAR’s U.S. Light Vehicle Production Forecast 2019‐2025
11.7
12.1
11.2 11.2 11.3
10.910.6
11.1
11.6 11.7 11.7
2015 2016 2017 2018 2019 2020 2021 2022 2023 2024 2025
U.S. V
ehicle Production (millions)
U.S. Production
Source: CAR Research, January 2019
14
2019 Light Vehicle Production:Michigan Ranks 1st in the U.S.; 2nd in NAFTA Region
CENTER FOR AUTOMOTIVE RESEARCH
0
50,000
100,000
150,000
200,000
250,000
300,000
350,000
400,000
MEX MI CAN KY IN OH ALL OTHERS
AL TN MO TX SC IL
Ligh
t Vehicle Production in Units
2018YTD 2019YTD
Source: Ward’s Auto Intelligence

5/16/2019
8
15
Michigan Powertrain Production Forecasts:2019 to 2026
CENTER FOR AUTOMOTIVE RESEARCH
4%
‐13%
1%
‐5%
‐12%
‐2%‐4%
0%
‐20%
‐10%
0%
10%
20%
30%
40%
50%
‐
500,000
1,000,000
1,500,000
2,000,000
2,500,000
2019 2020 2021 2022 2023 2024 2025 2026Units
Output Percent Change
‐9%
‐1%3% 5% 5%
‐1%
9% 11%
‐20%
‐10%
0%
10%
20%
30%
40%
50%
60%
70%
‐
500,000
1,000,000
1,500,000
2,000,000
2,500,000
3,000,000
3,500,000
2019 2020 2021 2022 2023 2024 2025 2026
Units
Output Percent Change
Transmission Production Engine Production
Source: LMC Automotive 1Q 2019
16
Employment Overview Areas to Watch:
• At the end of Q1 2019, Michiganmotor vehicle & parts manufacturing employment increased by 2.2% YOY
• Michigan holds the highest share (21.4%) of U.S. automotive employment, down 0.5percentage point from the fourth quarter last year
CENTER FOR AUTOMOTIVE RESEARCH

5/16/2019
9
17
Michigan Motor Vehicle Production and Motor Vehicle Employment1995 – 2018
0
50,000
100,000
150,000
200,000
250,000
0
500,000
1,000,000
1,500,000
2,000,000
2,500,000
3,000,000
3,500,000
1995 1996 1997 1998 1999 2000 2001 2002 2003 2004 2005 2006 2007 2008 2009 2010 2011 2012 2013 2014 2015 2016 2017 2018
MV Production 3361 Emp 3363 Emp
Source: Current Employment Statistics, Bureau of Labor StatisticsCENTER FOR AUTOMOTIVE RESEARCH
18
Michigan Employment by Automotive‐Related IndustriesProfessionals And Engineering, Vehicles & Parts Dealer Employment Increased March 2019
CENTER FOR AUTOMOTIVE RESEARCH
‐
100
200
300
400
500
600
700
MANUFACTURING (INCL. AUTO) PROFESSIONAL, SCIENTIFIC & TECHNICAL SERVICES VEHICLE & PARTS DEALERS
Employm
ent in Thousands
2009 average March
+74,300
Compare to last quarter:
Compare to 2009:
Compare to last quarter:
+179,400
+13,100
Compare to last quarter:
Source: Current Employment Statistics, Bureau of Labor Statistics; NAICS 3361 & 3363
5/16/2019
10
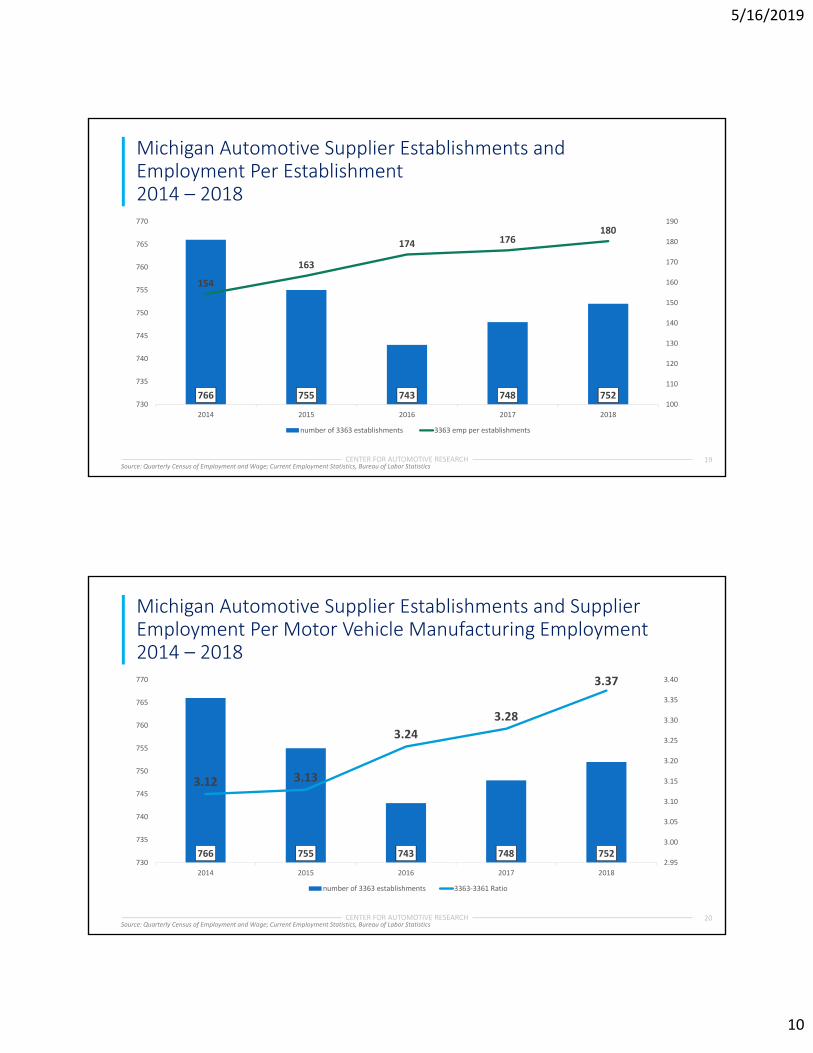
19
Michigan Automotive Supplier Establishments and Employment Per Establishment2014 – 2018
766 755 743 748 752
154
163
174 176180
100
110
120
130
140
150
160
170
180
190
2014 2015 2016 2017 2018
730
735
740
745
750
755
760
765
770
number of 3363 establishments 3363 emp per establishments
Source: Quarterly Census of Employment and Wage; Current Employment Statistics, Bureau of Labor StatisticsCENTER FOR AUTOMOTIVE RESEARCH
20
Michigan Automotive Supplier Establishments and Supplier Employment Per Motor Vehicle Manufacturing Employment2014 – 2018
766 755 743 748 752
3.12 3.13
3.24
3.28
3.37
2.95
3.00
3.05
3.10
3.15
3.20
3.25
3.30
3.35
3.40
2014 2015 2016 2017 2018
730
735
740
745
750
755
760
765
770
number of 3363 establishments 3363‐3361 Ratio
Source: Quarterly Census of Employment and Wage; Current Employment Statistics, Bureau of Labor StatisticsCENTER FOR AUTOMOTIVE RESEARCH

5/16/2019
11
21
Investment Overview Areas to Watch
• Since the recession, automakers have announced roughly $131.2B across North America
• In Q1 2019, Michigan received 55% of U.S. investment
• FCA has announced 2 of Michigan’s largest investments –both at $1.6B each for Mack Engine and Sterling Heights
CENTER FOR AUTOMOTIVE RESEARCH
Note – the following Book of Deals analysis covers publically announced capital investments made by automakers throughout North America.
22
N.A. Announced Automaker Investment by Region2009 to Q1 2019
Region Investment Amount ($USD)
Canada $8.2B
United States $98.2B
U.S. Great Lakes $63.1B
Michigan $32.8B
South $22.3B
Mexico $24.8B
Total $131.2B
Note: U.S. Great Lakes includes: IL, IN, KY, MI, MO, and OH
South includes: AL, FL, GA, MS, SC, TN, and TX
6%
75%
19%
CENTER FOR AUTOMOTIVE RESEARCHSource: CAR Book of Deals, Q1 2019

5/16/2019
12
23
Automaker Announced Investment: MI vs. Other StatesQ1 2019
Michigan55%
Illinois14%
Tennessee12%
Ohio9%
Alabama4%
Kentucky3%
West Virginia2% Maryland
1%
CENTER FOR AUTOMOTIVE RESEARCH
Michigan Announced Investment, 2009 to Q1 2019
3.9
54.6%
0%
10%
20%
30%
40%
50%
60%
70%
0
2
4
6
8
10
12
2009 2010 2011 2012 2013 2014 2015 2016 2017 2018 Q12019
Billions
Investment MI Share of U.S.
Share of U.S. Announced Automaker Investment by State, Q1 2019
Source: CAR Book of Deals, Q1 2019
24
Automaker Investments in MichiganQ1 2019
CENTER FOR AUTOMOTIVE RESEARCH
FCA: $3.5 Billion (6 announcements)Mack Ave Engine: $1.6BJefferson North: $900.0MWarren Truck: $500.0MSterling Heights/Warren (Stamping): $400.0MDundee Engine: $119.0MAuburn Hills (Components Plants): $12.6M
GM: $356.0 Million (4 announcements)Orion Township: $300.0MLansing Delta: $36.0MRomulus Powertrain: $20.0MFlint: Not Disclosed
Source: CAR Book of Deals, Q1 2019
Waymo: $13.6 Million (1 announcement)Detroit (AAM’s Tech Center): $13.6M

5/16/2019
13
25
GM Announcements
CENTER FOR AUTOMOTIVE RESEARCH
Plant Products End of Production
Employment Union Local
Detroit/Hamtramck
LaCrosse, Volt, CT6, Impala
June 1, 2019January 2020
1,542 UAW Local 22
Lordstown Cruze March 1, 2019
1,618 UAW Local 1112
Oshawa Impala, XTS, Silverado,Sierra
Q4 2019 2,900 Unifor Local 222
Warren Trans. 6 Speed Trans August 1, 2019
335 UAW Local 909
Baltimore Ops.
Pickuptransmissions
April 1, 2019 310 UAW Local 239
26CENTER FOR AUTOMOTIVE RESEARCH
YOY Change in U.S. Passenger Car Market Shares2013 – 2018
‐25%
‐20%
‐15%
‐10%
‐5%
0%
2013‐2014 2014‐2015 2015‐2016 2016‐2017 2017‐2018
YOY % Chan
ge
All Automakers All But D3 D3 GM
Source: IHS Markit

5/16/2019
14
27CENTER FOR AUTOMOTIVE RESEARCH
GM Vehicle Production Capacity and Capacity Utilization by Country, 2015‐2018, 2019‐2025(f)
Source: CAR analysis of LMC Automotive data
0
1
2
3
4
5
2016 2017 2018 2019 2020 2021 2022 2023 2024 2025 2026
Millions
Production Capacity
United States Canada Mexico
0%
20%
40%
60%
80%
100%
120%
2016 2017 2018 2019 2020 2021 2022 2023 2024 2025 2026
Capacity Utilization
United States Canada Mexico
28CENTER FOR AUTOMOTIVE RESEARCH
GM Transmission Capacity and Capacity Utilization by Country, 2015‐2018, 2019‐2025(f)
0
1
2
3
4
5
6
2015 2016 2017 2018 2019 2020 2021 2022 2023 2024 2025
Millions
Transmission Capacity
US Canada Mexico
0%
20%
40%
60%
80%
100%
120%
140%
160%
2015 2016 2017 2018 2019 2020 2021 2022 2023 2024 2025
Capacity Utilization
US Canada Mexico
Source: CAR analysis of LMC Automotive data

5/16/2019
15
29CENTER FOR AUTOMOTIVE RESEARCH
30
Export Overview Areas to Watch
• Michigan automotive exports were $26.8 Billion in 2018
• 61% of Michigan vehicles exports go to Canada
• 70% of Michigan auto parts exports to NAFTA region
CENTER FOR AUTOMOTIVE RESEARCH

5/16/2019
16
31
Top Ten U.S. States by Automotive Exports in Dollar Terms:Michigan Motor Vehicle Exports decreased 1.03% in 2018 Total
CENTER FOR AUTOMOTIVE RESEARCH
0
5
10
15
20
25
30
MICHIGAN TEXAS OHIO SOUTH CAROLINA
CALIFORNIA INDIANA ALABAMA ILLINOIS TENNESSEE KENTUCKY
Billions of U.S. D
olla
rs
3361 Motor Vehicles 3362 Vehicle Body and Trailer 3363 Auto Parts
• The major destinations for Michigan exports are Mexico and Canada
Source: International Trade Administration TradeStat Express.
32
The United States cannot currently self‐supply the vehicles American dealers sell to U.S. consumers.
Source: IHS|Markit data
FCA, Ford, & GM Represent 43%of Canada & Mexico Imports
Source: CAR; U.S. International Trade Administration
Sourcing of U.S. Light Vehicle Sales2018
U.S. Production
less U.S. Exports
plus U.S. Imports
U.S. Sales
10.8 million
- 1.8 million
+ 8.2 million
= 17.2 million
U.S. Firms28%
International Firms24%
Mexico15%
Canada10%
Japan10%
South Korea5%
Germany3%
UK1%
Other4%
U.S. Sales of Imported Vehicles
47%
U.S. Sales of U.S. Produced
Vehicles
52%
CENTER FOR AUTOMOTIVE RESEARCH

5/16/2019
17
33
Tariffs are piling up on light vehicles
Steel Tariffs @ 25%
Aluminum Tariffs @ 10%
China Tariffs @ 25%
Potential Parts Tariffs @ 25%
No Tariffs
~60%
Source: Center for Automotive Research CENTER FOR AUTOMOTIVE RESEARCH
34
U.S. Consumer & Economic Impacts of U.S. Automotive Trade Policies
• Assume:• USMCA is ratified,
• Section 232 tariffs on steel & aluminum remain in place on all current countries,
• Section 301 China tariffs remain at current levels, and
• Section 232 auto & parts tariffs are levied at 25% on all trading partners except Canada, Mexico, & South Korea
https://www.cargroup.org/wp‐content/uploads/2019/02/US‐Consumer‐Economic‐Impacts‐of‐US‐Automotive‐Trade‐Policies‐.pdf
CENTER FOR AUTOMOTIVE RESEARCH

5/16/2019
18
35
Impact of USMCA, Section 232 Steel & Aluminum Tariffs, Section 301 China Tariffs &Potential Section 232 Auto & Parts Tariffs
+$2,750 average+$1,900 U.S.‐built+$3,700 imports
‐$30.4B GDP
‐366,900 jobs
‐1.3M fewer U.S. sales‐$43.6B dealership revenue‐77,000 dealership jobs
Source: Center for Automotive Research CENTER FOR AUTOMOTIVE RESEARCH
CENTER FOR AUTOMOTIVE RESEARCH
Steel & Aluminum Tariffs
36By HurwiczRocks ‐ Own work, CC BY‐SA 3.0, https://commons.wikimedia.org/w/index.php?curid=2929407

5/16/2019
19
37
NAFTA Timeline Under Trade Promotion Authority
CENTER FOR AUTOMOTIVE RESEARCH
8/31/2018
11/30/2018
9/30/2018
1/28/2019
3/14/2019
Aiming for 1/1/2020
4/19/2019
38
U.S.‐China Light Vehicle & Parts Trade (USD Billions)2016‐2018
8.3
1.2
2.3
12.9
9.5
1.7
2.7
13.2
6.0
1.5
2.7
15.3
DOMESTIC EXPORTS IMPORTS FOR CONSUMPTION DOMESTIC EXPORTS IMPORTS FOR CONSUMPTION
MOTOR VEHICLES MOTOR VEHICLE PARTS
2016 2017 2018
CENTER FOR AUTOMOTIVE RESEARCH
2017‐2018: ‐36.6% ‐13.1% ‐3.0% +15.5%
Source: U.S. International Trade Commission

5/16/2019
20
39
Trends in Monthly China Motor Vehicle and Parts Domestic Exports and Imports for Consumption2016‐2018
CENTER FOR AUTOMOTIVE RESEARCH
200
400
600
800
1,000
1,200
1,400
1,600
January February March April May June July August September October November December
Millions
Motor Vehicle Exports
50
100
150
200
250
300
January February March April May June July August September October November December
Millions
Motor Vehicle Imports
50
100
150
200
250
300
January February March April May June July August September October November December
Millions
Motor Vehicle Parts Exports
200
400
600
800
1,000
1,200
1,400
1,600
January February March April May June July August September October November December
Millions
Motor Vehicle Parts Imports
Source: U.S. International Trade Commission
40
Brief China Trade Update
U.S. raised tariffs from 10% to 25% – includes all automotive goods
U.S. moves to impose tariffs on nearly all Chinese imports –including consumer goods
China retaliates with tariffs on $60B U.S. imports (rates increase from 5‐10% to 20‐25%)
Average increase in cost due to tariffs/U.S.‐built vehicle = $190
CENTER FOR AUTOMOTIVE RESEARCH

5/16/2019
21
Section 232 on Autos & Parts Presidential Decision due by Saturday, 18 May 2019;
Executive Order Expected TODAY
CENTER FOR AUTOMOTIVE RESEARCH
CENTER FOR AUTOMOTIVE RESEARCH
5/16/2019
22
Thank you