qwertyuiopasdfghjklzxcvbnmqw
ertyuiopasdfghjklzxcvbnmqwert
yuiopasdfghjklzxcvbnmqwertyui
opasdfghjklzxcvbnmqwertyuiopa
sdfghjklzxcvbnmqwertyuiopasdf
ghjklzxcvbnmqwertyuiopasdfghj
klzxcvbnmqwertyuiopasdfghjklz
xcvbnmqwertyuiopasdfghjklzxcv
bnmqwertyuiopasdfghjklzxcvbn
mqwertyuiopasdfghjklzxcvbnmq
wertyuiopasdfghjklzxcvbnmqwe
rtyuiopasdfghjklzxcvbnmqwerty
uiopasdfghjklzxcvbnmqwertyuio
pasdfghjklzxcvbnmqwertyuiopas
dfghjklzxcvbnmqwertyuiopasdfg
hjklzxcvbnmqwertyuiopasdfghjk
Senior Capstone Design Project
Metal Hydride Dual Storage System
5/6/2013
Abstract The Project in hand deals with two types of potential sources of energy, Thermal Energy and
Hydrogen gas. Due to the current limitations in the field of storage for both sources which were
mentioned in previous reports under the title of literature review; in addition to, considering them as
newborns in the world of power production using environmental friendly sources. The problem faced
with using them extensively in the market was the hardship of storing and harnessing each type with the
least cost possible. As a step towards proposing a solution for that, the Hydrogen research facility in
Florida Institute of Technology started approaching a mean of storing both sources in the same tank by
replacing one another depending on the applications required using metal hydrides (Dual Chemical
Storage System). The capstone team approached this dilemma by designing two configurations for two
storage tanks which could be used in a closed system connected to a heater, a compressor and a hydrogen
tank. Furthermore, this project aims to enhance the ability of creating a storage system that will act as a
dual system, where thermal is stored while producing hydrogen gas and vice versa, Hydrogen can be
obtained and stored in this system during the emission of thermal energy. Hence, the tank is now a fuel
cell.
Followed in this report are the details of the final design proposal along with testing procedures
and analysis procedures and the final results of the theoretical calculations, the ANSYS analysis and the
experimental results.
Acknowledgments
This project was designed, built under the supervision and guidance of Dr. Sarada Kuravi, Dr.
Hector Gutierrez and Dr. Riechard, many thanks to them for their time in advising us with the essential
points that made this project possible. Also for supporting the project, I would like to thank Dr. Pei-feng
Hsu and Dr. Mary Helen McCay.
Great Appreciation towards Soumik Biswas, Peijie Lee, Jiapu Liang, and Dhiraj Sardinha who
volunteered their time and effort to deliver this paper.
Authors Omar M. Galil
Youssef Al Khuraim
Table of Contents Abstract ......................................................................................................................................................... 0
1 Design Review ...................................................................................................................................... 4
1.1 Configuration 1 ............................................................................................................................. 4
1.2 Configuration 2 ............................................................................................................................. 4
2 Test and Analysis Procedures ............................................................................................................... 4
2.1 Theoretical Analysis ..................................................................................................................... 4
2.2 ANSYS Analysis .......................................................................................................................... 6
2.3 Experimental Analysis .................................................................................................................. 6
3 Final Results .......................................................................................................................................... 7
3.1 Theoretical Results ........................................................................................................................ 7
3.2 Experimental Results .................................................................................................................... 8
Appendix A Design Configurations .............................................................................................................. 9
A.1 Configuration 1 .................................................................................................................................. 9
A.2 Configuration 2 ................................................................................................................................ 10
Appendix B ANSYS Results ...................................................................................................................... 11
B.1 Configuration 1 ANSYS analysis ..................................................................................................... 11
B.2 Configuration 2 ANSYS analysis ..................................................................................................... 12
Appendix C Experimental Setup................................................................................................................. 13
C.1 Test Setup ......................................................................................................................................... 13
C.2 Hydrogenation Cycle ........................................................................................................................ 14
C.3 De-Hydrogenation Cycle .................................................................................................................. 15
1 Design Review The designs mentioned here are the final designs approved by the project advisor, the safety advisor
and the Machine shop technicians for manufacturability and fabrication. Both designs have shared
characteristics like the presence of a separating plate half way through the storage cylinder to create a
hydrogen chamber for the hydrogen to be collected and a metal hydride chamber where the powder is
going to be stored. The different aspects and key changes are mentioned separately for each
configuration.
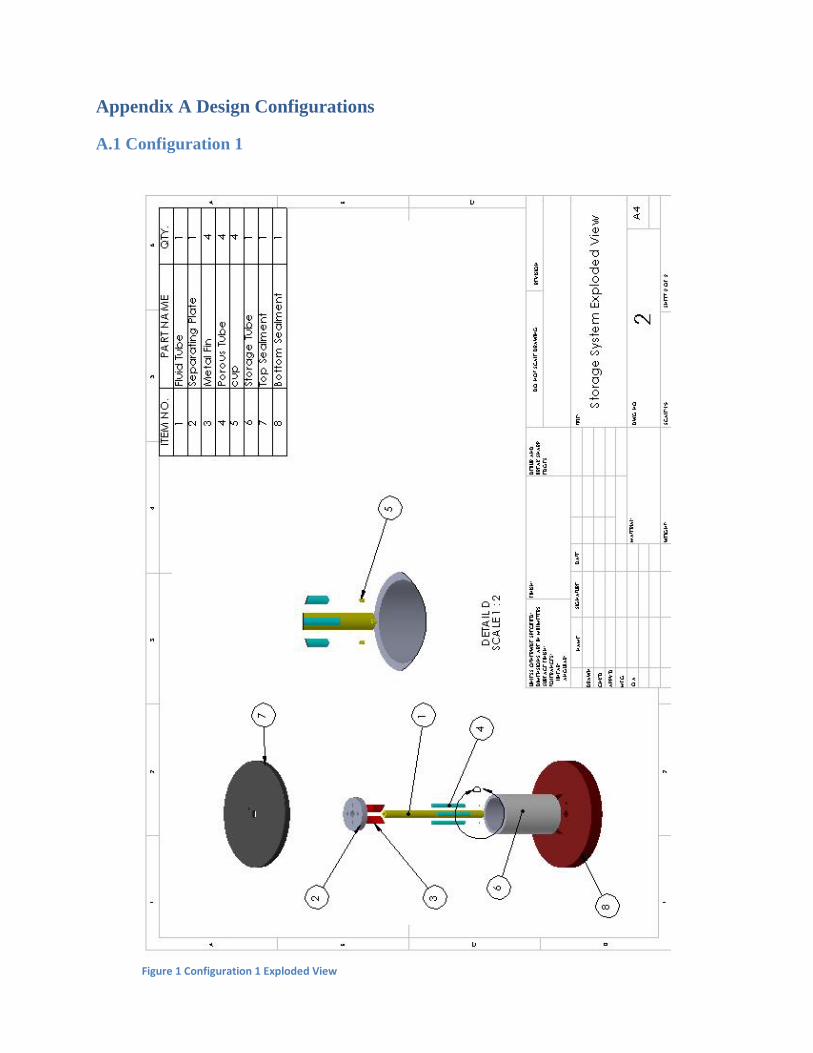
1.1 Configuration 1
The first configuration was designed based on contact area and temperature distribution. Hence, it
includes four metal fins welded at angle from each other to the fluid tube passing in the center of the
top cap, cylinder, and the bottom cap as well. The bottom cap includes three more holes for the
thermocouples to be welded in, the cylinder is 5” high and the separating plate is welded at a depth of
2.5”. On the separating plate are four holes for the porous tubes which act as a portal for the hydrogen to
be absorbed and released by the metal hydride. The metal fins on the other hand that are welded at 1”
below the separating plate are added to enhance the heat transfer between the metal hydride and the air
flowing through the tube.
In appendix A.1, Figure 1 shows an exploded view of the design with a table of materials of each
part numbered in order.
1.2 Configuration 2
In a not too different manner, the second configuration was based upon the idea of direct contact
between the fluid tubes and the metal hydride powder. In turn, the second configuration includes four
fluid tubes having less diameter than the one used for the first configuration, yet when combined the four
tubes make the same area as the tube. This configuration also has four porous tubes connecting to the
lower half of the separating plate serving the same goal of the other ones used in the earlier design.
In Appendix A.2, an exploded view of the system shows where the parts are connected, numbered
and organized on in a table.
2 Test and Analysis Procedures
Since the experimentation will take place at a and under a pressure of 50 bars. The testing
procedure was divided into three phases that are meant to take place after the fabrication and
manufacturing process of both configurations. The actions to be performed are as follows: Glove box
leakage testing, Hydrogenation tests, De-Hydrogenation tests. In the next sections the theoretical analysis
and the ANSYS analysis are explained thoroughly to provide sufficient information on how the data were
obtained.
2.1 Theoretical Analysis
The calculations that took place for this project were aimed to determine three things
1) Internal Stress
2) Safety Factor
3) Heat transfer rate
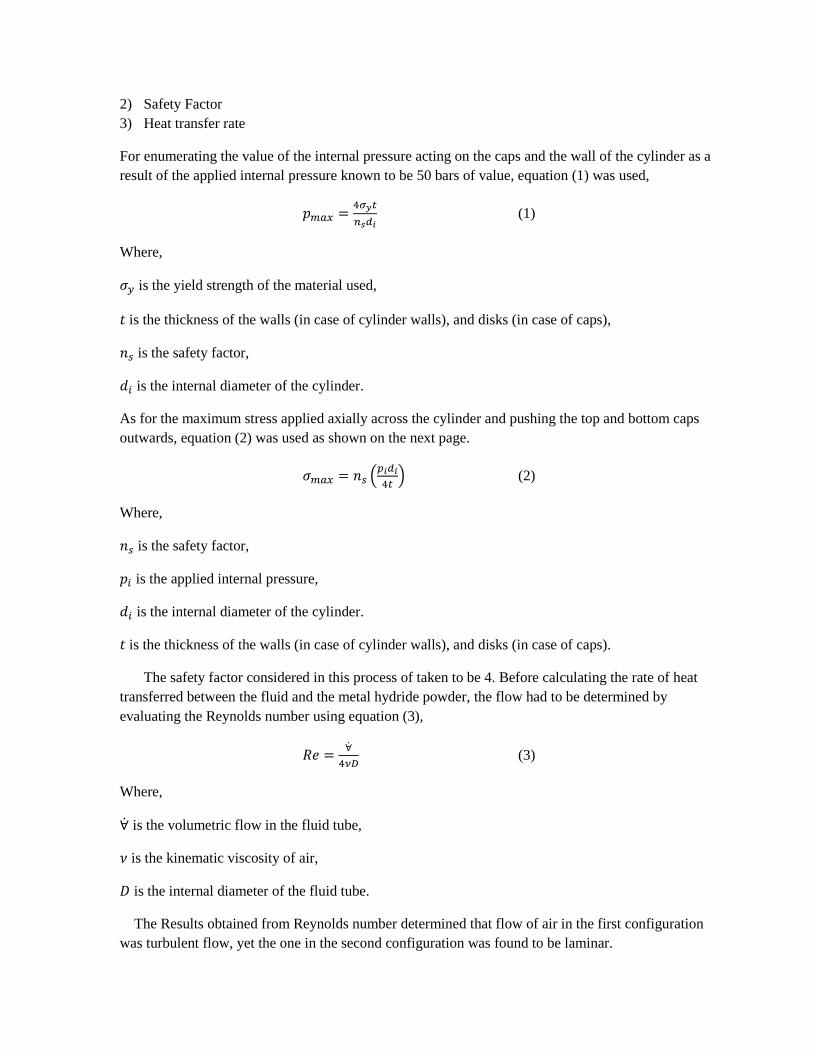
For enumerating the value of the internal pressure acting on the caps and the wall of the cylinder as a
result of the applied internal pressure known to be 50 bars of value, equation (1) was used,
(1)
Where,
is the yield strength of the material used,
is the thickness of the walls (in case of cylinder walls), and disks (in case of caps),
is the safety factor,
is the internal diameter of the cylinder.
As for the maximum stress applied axially across the cylinder and pushing the top and bottom caps
outwards, equation (2) was used as shown on the next page.
(
) (2)
Where,
is the safety factor,
is the applied internal pressure,
is the internal diameter of the cylinder.
is the thickness of the walls (in case of cylinder walls), and disks (in case of caps).
The safety factor considered in this process of taken to be 4. Before calculating the rate of heat
transferred between the fluid and the metal hydride powder, the flow had to be determined by
evaluating the Reynolds number using equation (3),
(3)
Where,
is the volumetric flow in the fluid tube,
is the kinematic viscosity of air,
is the internal diameter of the fluid tube.
The Results obtained from Reynolds number determined that flow of air in the first configuration
was turbulent flow, yet the one in the second configuration was found to be laminar.
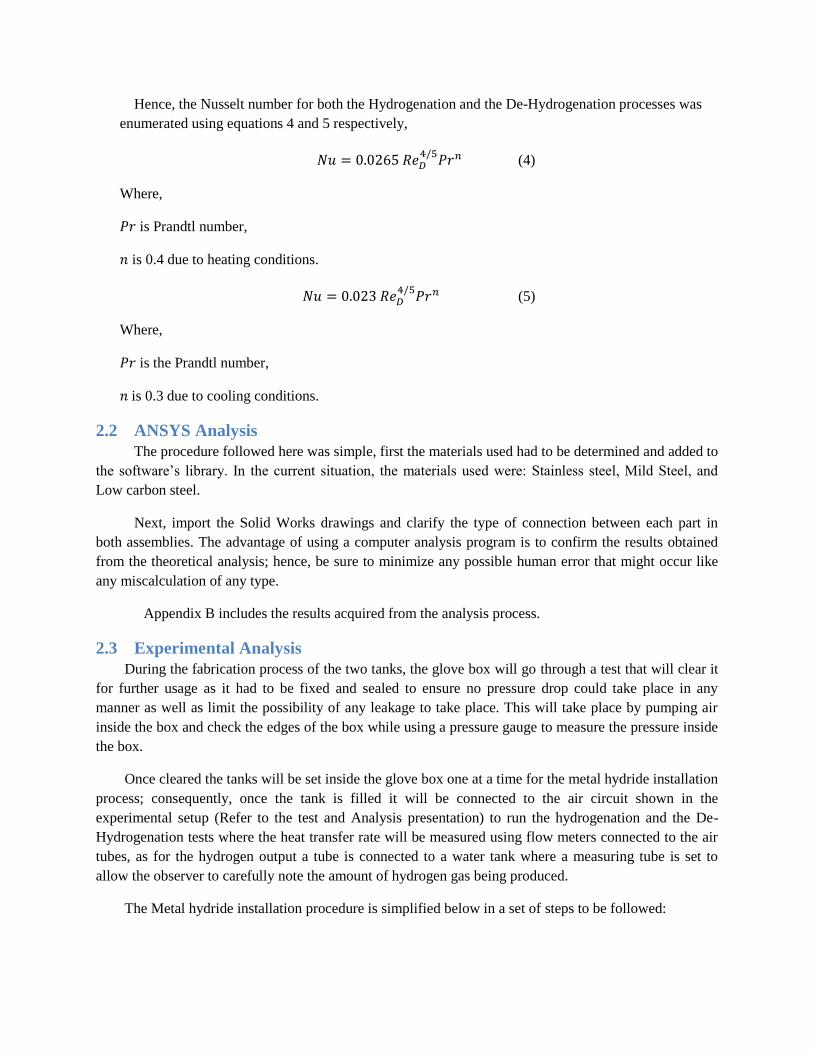
Hence, the Nusselt number for both the Hydrogenation and the De-Hydrogenation processes was
enumerated using equations 4 and 5 respectively,
(4)
Where,
is Prandtl number,
is 0.4 due to heating conditions.
(5)
Where,
is the Prandtl number,
is 0.3 due to cooling conditions.
2.2 ANSYS Analysis
The procedure followed here was simple, first the materials used had to be determined and added to
the software’s library. In the current situation, the materials used were: Stainless steel, Mild Steel, and
Low carbon steel.
Next, import the Solid Works drawings and clarify the type of connection between each part in
both assemblies. The advantage of using a computer analysis program is to confirm the results obtained
from the theoretical analysis; hence, be sure to minimize any possible human error that might occur like
any miscalculation of any type.
Appendix B includes the results acquired from the analysis process.
2.3 Experimental Analysis
During the fabrication process of the two tanks, the glove box will go through a test that will clear it
for further usage as it had to be fixed and sealed to ensure no pressure drop could take place in any
manner as well as limit the possibility of any leakage to take place. This will take place by pumping air
inside the box and check the edges of the box while using a pressure gauge to measure the pressure inside
the box.
Once cleared the tanks will be set inside the glove box one at a time for the metal hydride installation
process; consequently, once the tank is filled it will be connected to the air circuit shown in the
experimental setup (Refer to the test and Analysis presentation) to run the hydrogenation and the De-
Hydrogenation tests where the heat transfer rate will be measured using flow meters connected to the air
tubes, as for the hydrogen output a tube is connected to a water tank where a measuring tube is set to
allow the observer to carefully note the amount of hydrogen gas being produced.
The Metal hydride installation procedure is simplified below in a set of steps to be followed:
1) Metal Canister which is fully welded and fitted with the thermocouple probes is placed inside the
Glove box
2) All the tools necessary e.g. wrenches of correct sizes and a funnel are kept inside the glove box.
3) The metal hydride package received from the manufacturer is placed inside the glove box
4) The glove box is closed and sealed using silicon adhesive. It is left to cure for one day
5) The glove box is filled with argon and using the pressure regulator sufficient amount of positive
pressure is maintained inside the glove box.
6) The glove box operator wears safety goggles and a lab coat while using the glove box.
7) One of the thermocouple probes is removed from the metal canister by loosening the nut around it
using the wrench.
8) The funnel is inserted in place of the thermocouple.
9) The metal hydride package is opened and the hydride material is poured into the canister through
the funnel.
10) The canister is shaken well to distribute the hydride evenly within the canister.
11) The funnel is removed, and the thermocouple is reinserted, and the canister is sealed by
tightening the nut. This concludes the hydride filling process in one canister.
12) The glove box is opened and the canister is taken out.
13) The second canister is placed inside the glove box and steps 1-12 are repeated.
This process will take place under the supervision of Dr. Kuravi for her experience on how to deal
with a glove box. Provided in Appendix C are illustrations and actual photos of the air tube setup; in
addition diagrams showing the hydrogenation and De-Hydrogenation processes.
3 Final Results All the results acquired from the processes performed and explained in the previous chapter are
plotted here. Each section separately includes the appropriate results related to it.
3.1 Theoretical Results
The structure analysis results show that the maximum internal stress applied on the bottom and top caps
is,
And according to the physical properties of the Stainless Steel, the yield strength of the caps is found to
be
This eventually proves the system’s endurance with a safety factor of 4.
As for the heat transfer rate, for the sake of simplification the data have been tabulated in a manner
of comparing the two systems together so the reader could easily determine which one was considered
better in terms of required performance theoretically. The experimental results should either confirm the
same outcome or suggest a different one. Taking into consideration how the pressure drop affects the flow
of air; evidently, the higher the pressure drop the slower the rate of heat transfer while the lower the
pressure drop the higher the transfer rate leading to better results.
Table 1 Heat Transfer Theoretical Data
Parameter Configuration 1 Configuration 2
(Air to Fluid
tube)
2.78 Watts (DH) 3.67 Watts
3.32 Watts (H)
(Fluid tube to
the Metal Hydride) 3.66 Watts 3.8 Watts
3.2 Experimental Results
This section will be updated once results are obtained, as they are currently being carried by team
member: Youssef Al-Khuraim along with Research Assistant: Soumik Biswas. Due to a delay in the
manufacturing process that occurred as a result of an minor problem with the welding procedure that later
was fixed by team member: Omar Galil in aiding Machine shop technician: Bill. The tanks are scheduled
to be welded and assembled by Monday 05/06/2013, and the metal hydride installation will take place on
Tuesday 05/07/2013. Last but not least the testing of each tank will take place in the Applied Research
Lab, located on Hibiscus Road.
Appendix A Design Configurations
A.1 Configuration 1
Figure 1 Configuration 1 Exploded View
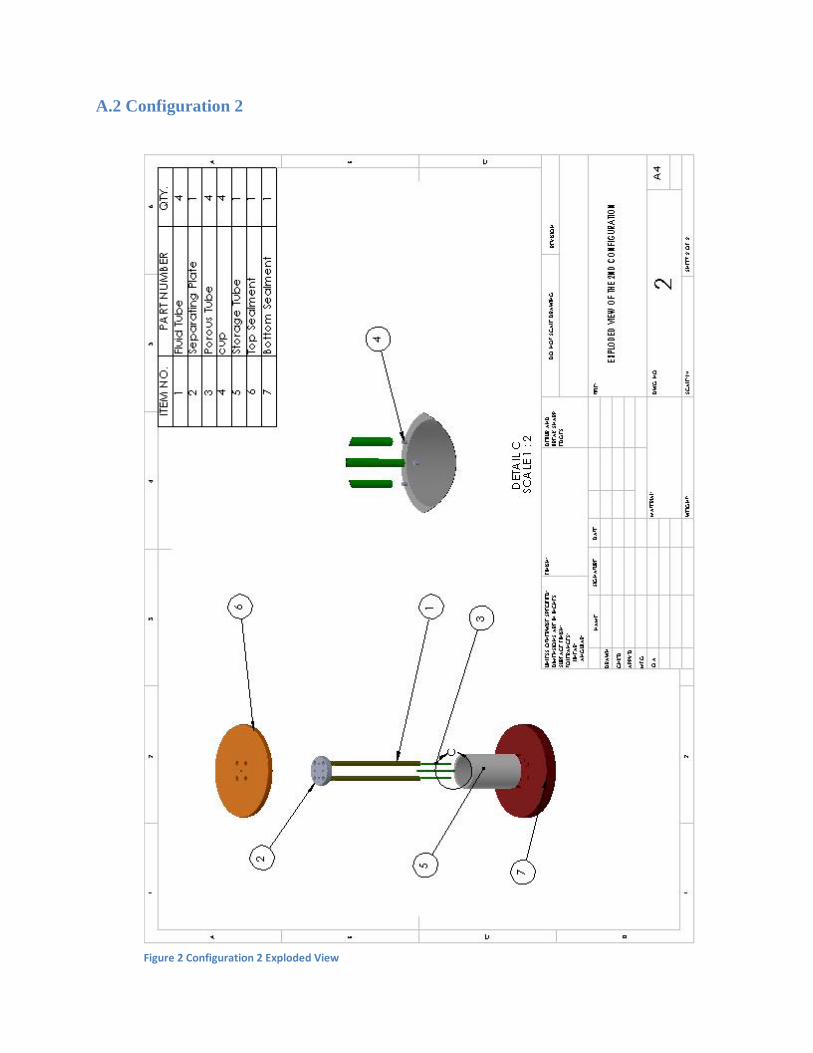
A.2 Configuration 2
Figure 2 Configuration 2 Exploded View
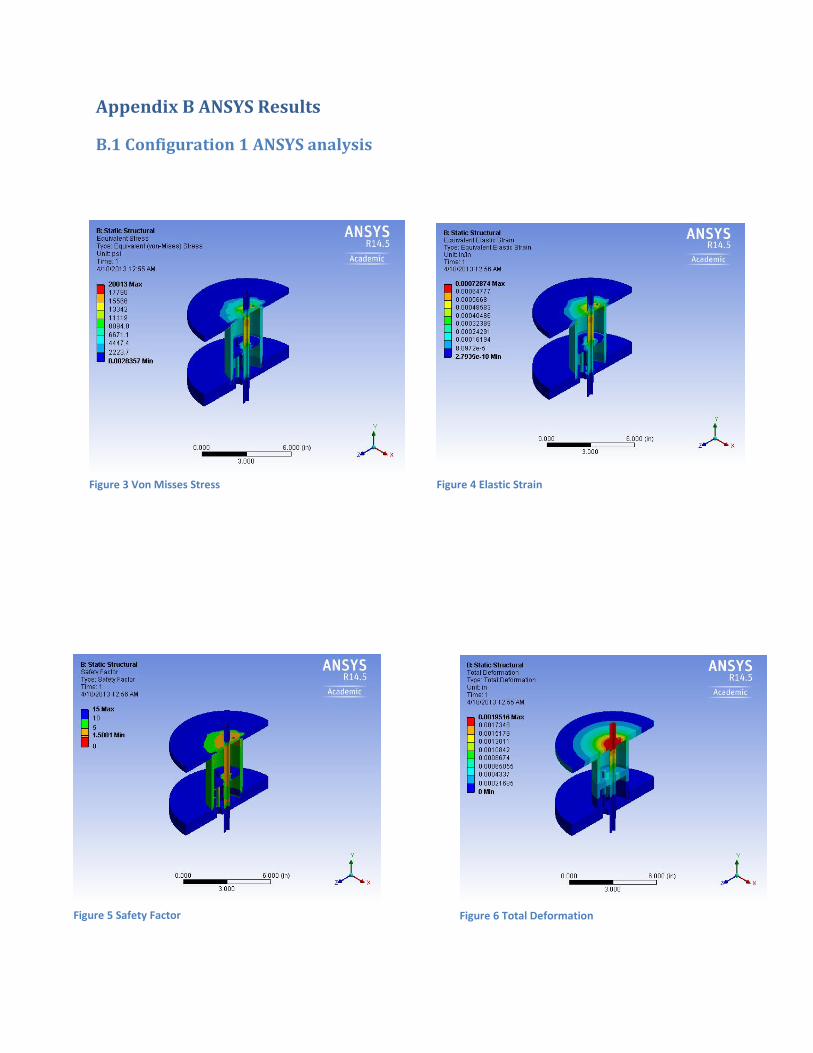
Appendix B ANSYS Results
B.1 Configuration 1 ANSYS analysis
Figure 4 Elastic Strain Figure 3 Von Misses Stress
Figure 6 Total Deformation Figure 5 Safety Factor
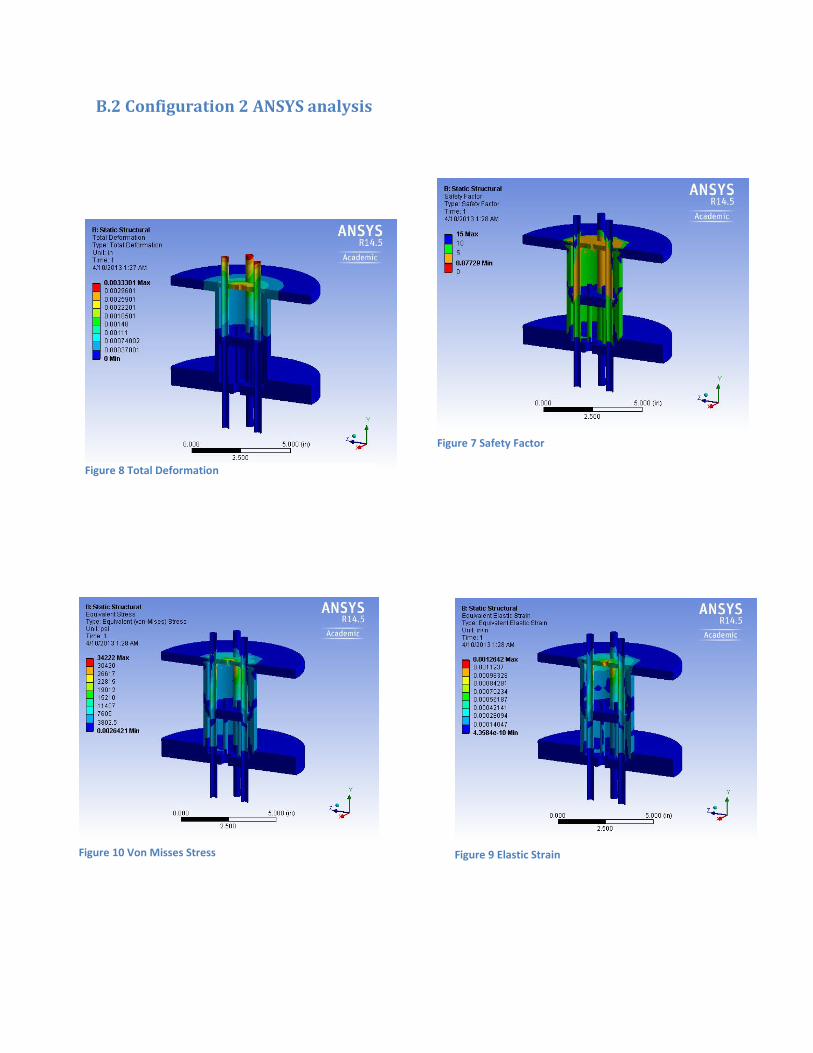
B.2 Configuration 2 ANSYS analysis
Figure 9 Elastic Strain Figure 10 Von Misses Stress
Figure 8 Total Deformation
Figure 7 Safety Factor
Appendix C Experimental Setup
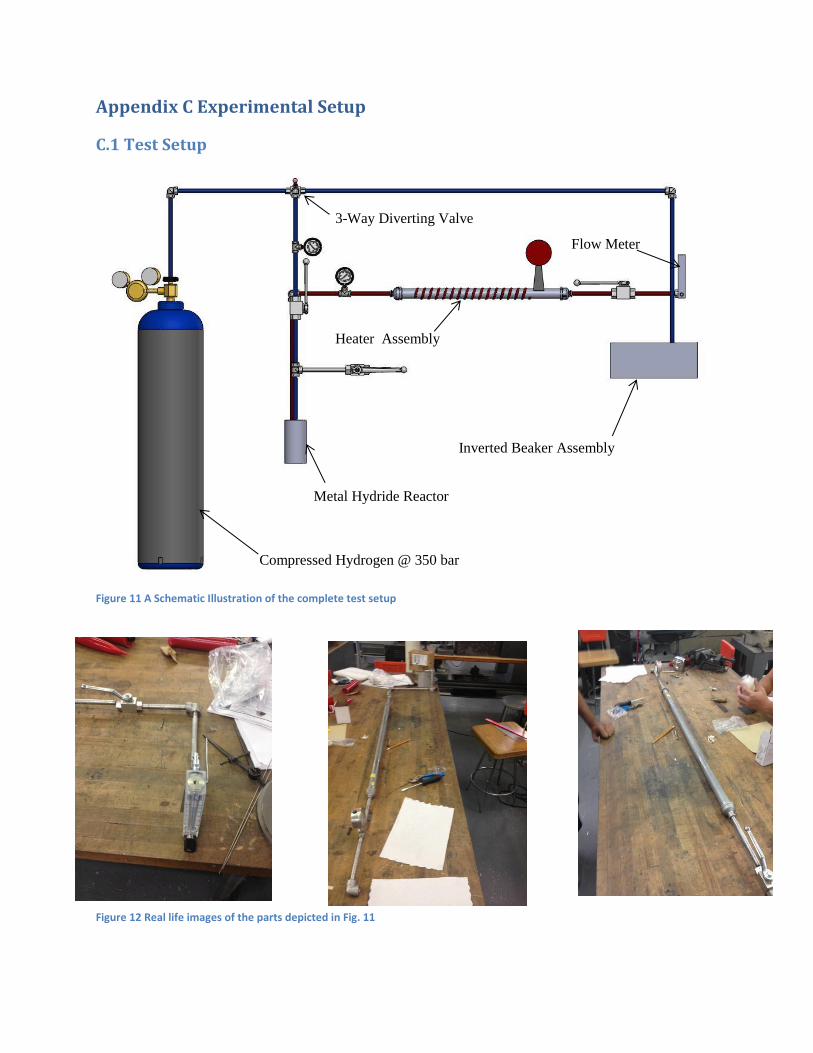
C.1 Test Setup
Figure 11 A Schematic Illustration of the complete test setup
Figure 12 Real life images of the parts depicted in Fig. 11
Compressed Hydrogen @ 350 bar
Metal Hydride Reactor
Flow Meter
3-Way Diverting Valve
Heater Assembly
Inverted Beaker Assembly
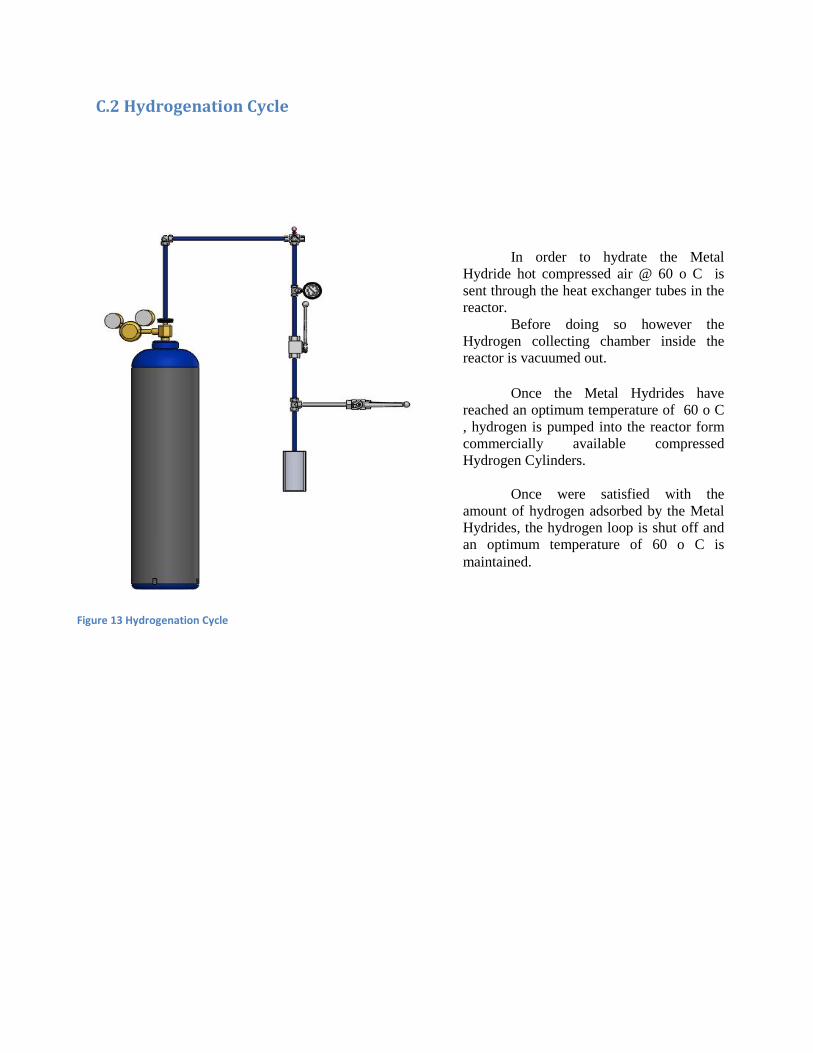
C.2 Hydrogenation Cycle
In order to hydrate the Metal
Hydride hot compressed air @ 60 o C is
sent through the heat exchanger tubes in the
reactor.
Before doing so however the
Hydrogen collecting chamber inside the
reactor is vacuumed out.
Once the Metal Hydrides have
reached an optimum temperature of 60 o C
, hydrogen is pumped into the reactor form
commercially available compressed
Hydrogen Cylinders.
Once were satisfied with the
amount of hydrogen adsorbed by the Metal Hydrides, the hydrogen loop is shut off and
an optimum temperature of 60 o C is
maintained.
Figure 13 Hydrogenation Cycle
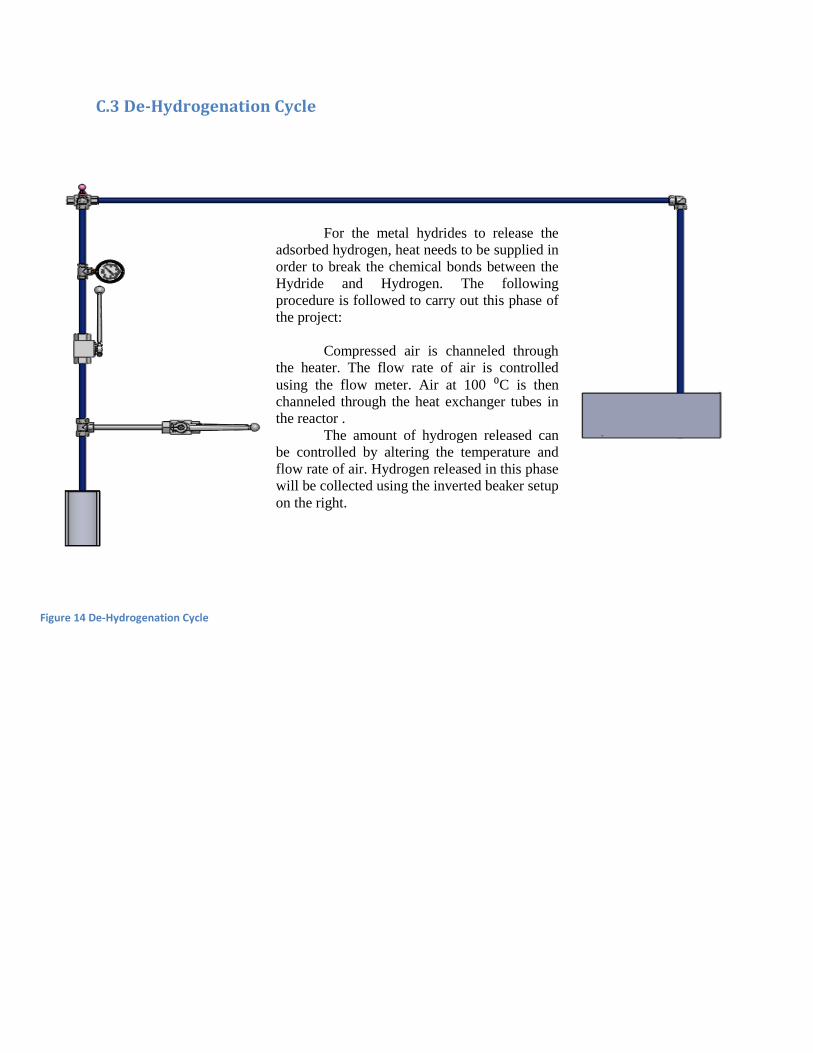
C.3 De-Hydrogenation Cycle
For the metal hydrides to release the
adsorbed hydrogen, heat needs to be supplied in
order to break the chemical bonds between the
Hydride and Hydrogen. The following
procedure is followed to carry out this phase of
the project:
Compressed air is channeled through
the heater. The flow rate of air is controlled
using the flow meter. Air at 100 ⁰C is then
channeled through the heat exchanger tubes in
the reactor .
The amount of hydrogen released can
be controlled by altering the temperature and
flow rate of air. Hydrogen released in this phase
will be collected using the inverted beaker setup
on the right.
Figure 14 De-Hydrogenation Cycle