Mekelle University
Graduate Studies Program
College of Social Sciences and Languages
Department of Geography and Environmental Studies
Spatio – Temporal Assessment of Road Traffic Accident
in Mekelle City
By
Girmay Giday Kindaya
A Thesis Submitted in Partial Fulfillment of the Requirement for the
Masters of Science Degree in Geography and Environmental Studies: Specialization in GIS and Remote Sensing
Advisors
Atkilt Girma (Drs.)
Solomon Hishe (MSc.)
January, 2014
Mekelle

Spatio – Temporal Assessment of Road Traffic Accident
in Mekelle City
A Thesis Submitted in Partial Fulfillment of the Requirement for the Masters of Science Degree in Geography and Environmental Studies:
Specialization in GIS and Remote Sensing
By: Girmay Giday Kindaya
Advisors
Atkilt Girma (Drs.) Solomon Hishe (MSc.)
January, 2014 Mekelle

DECLARATION
This is to certify that this thesis entitled “Spatio-Temporal Assessment of Road Traffic
Accident in Mekelle City” submitted in partial fulfillment of the requirements for the
award of the degree of Master of Science in Geography and Environmental Studies with
Specialization in GIS and Remote Sensing at Mekelle University, department of
Geography and Environmental Studies done by Girmay Giday Kindaya,
CSSL/PS006/03 is an authentic work carried out by him under our guidance. The matter
embodied in this project work has not been submitted earlier for an award of any
degree or diploma to the best of our knowledge and belief.
Name of the Student: Girmay Giday Kindaya
Signature: ______________ Date: _________________
Advisors:
1. Atkilt Girma (Drs.), Mekelle, Ethiopia
Signature: ______________ Date: _________________
2. Solomon Hishe (MSc.), Mekelle, Ethiopia
Signature: ______________ Date: _________________
iii
Table of Contents
Acknowledgements .................................................................................................................. viii
List of Acronyms and Abbreviations ....................................................................................... ix
ABSTRACT .................................................................................................................................. xi
CHAPTER ONE ........................................................................................................................... 1
1. INTRODUCTION .................................................................................................................... 1
1.1 General Introduction.......................................................................................................... 1
1.2 Statement of the Problem .................................................................................................. 2
1.3 Objective of the Study ........................................................................................................ 5
1.3.1 General Objective ......................................................................................................... 5
1.3.2 Specific Objectives ....................................................................................................... 5
1.4 Research Questions ............................................................................................................ 6
1.5 Significance of the Study ................................................................................................... 6
1.6 Scope of the Study .............................................................................................................. 7
1.7 Limitation of the Study ...................................................................................................... 7
1.8 Organization of the Paper ................................................................................................. 8
1.9 Standard Definition of Basic Terms ................................................................................. 8
CHAPTER TWO ........................................................................................................................ 11
2. LITERATURE REVIEW ......................................................................................................... 11
2.1 Introduction ...................................................................................................................... 11
2.1.1 Definition and Concepts ........................................................................................... 11
2.2 Global and Regional Trends of Road Traffic Accidents ............................................. 12
2.3 Causes of Road Traffic Accident .................................................................................... 13
2.3.1 Human Related Causes of Road Traffic Accident ................................................ 13
2.3.2 Road Related Causes of Road Traffic Accident ..................................................... 17
2.3.3 Vehicle Related Causes of Road Traffic Accident ................................................. 19
2.3.4 Environment Related Causes of Road Traffic Accident ....................................... 20
iv
2.4 Impacts of Road Traffic Accident .................................................................................. 20
2.4.1 Economic Impact ....................................................................................................... 20
2.4.2 Social Impact .............................................................................................................. 21
2.5 Black Spots of Road Traffic Accident ............................................................................ 22
2.5.1 Black Spot Definition ................................................................................................. 22
2.5.2 Black Spot Analysis ................................................................................................... 23
2.6 Road Traffic Accident in Ethiopia .................................................................................. 24
2.6.1 Road Traffic Accident Reporting System in Ethiopia .......................................... 25
CHAPTER THREE .................................................................................................................... 28
3. DESCRIPTION OF THE STUDY AREA ............................................................................. 28
3.1 Background of the Study Area ....................................................................................... 28
3.1.1 Location and Administrative Setup ........................................................................ 28
3.1.2 Demographic Characteristics ................................................................................... 29
3.1.3 Topography ................................................................................................................ 30
3.1.4 Climate ........................................................................................................................ 32
3.1.5 Road Network Infrastructure .................................................................................. 33
CHAPTER FOUR ...................................................................................................................... 35
4. MATERIALS AND METHODS ........................................................................................... 35
4.1 Nature and Source of Data .............................................................................................. 35
4.2 Data Collection Methods and Procedure ...................................................................... 36
4.3 Data Preparation ............................................................................................................... 37
4.4 Data Processing, Presentation and Analysis ................................................................ 37
4.5 Road Traffic Accident Black Spot Identification .......................................................... 38
CHAPTER FIVE ........................................................................................................................ 40
5. RESULT AND DISCUSSION ............................................................................................... 40
5. 1 General Characteristics of Road Traffic Accident in Mekelle City .......................... 40
5.1.1 Time and Road Traffic Accidents ............................................................................ 40
5.1.2 Drivers Characteristics and Road Traffic Accidents ............................................. 42
5.1.3 Vehicle Characteristics and Road Traffic Accidents ............................................. 45
5.1.4 Road Characteristics and Road Traffic Accidents ................................................. 48

v
5.1.5 Weather Condition and Road Traffic Accidents ................................................... 50
5.1.6 Types of Road Traffic Accidents.............................................................................. 51
5.2 The Spatio-Temporal Distribution of Road Traffic Accident Spots and Road Traffic Accident Black Spots in Mekelle City ............................................................................ 53
5.2.1 The Spatial Distribution of RTAs and RTA Spots in Mekelle City in 2008 ....... 53
5.2.2 The Spatial Distribution of RTAs and RTA Spots in Mekelle City in 2009 ....... 57
5.2.3 The Spatial Distribution of RTAs and RTA Spots in Mekelle City in 2010 ....... 61
5.2.4 The Spatial Distribution of RTAs and RTA Spots in Mekelle City in 2011 ....... 65
5.2.5 Spatial Distribution of all Spatially Identified RTA Spots of Mekelle City From 2008 to 2011................................................................................................................. 69
5.3 Trend of Road Traffic Accident in Mekelle City .......................................................... 71
5.3.1 Trend in the Occurrence of Road Traffic Accidents ............................................. 71
5.3.2 The Spatio-Temporal Distribution and Trend of RTA Frequency among all Sub-Cities of Mekelle City ........................................................................................ 72
5.3.3 The Spatio-Temporal Distribution and Trend of RTA Frequency in all RTA Black Spots of Mekelle City ...................................................................................... 74
5.3.4 The Spatio-Temporal Distribution and Trend of RTA Frequency in the Top 10 RTA Black Spots of Mekelle City ............................................................................ 77
5.3.5 The Spatio-Temporal Distribution and Trend of RTA Frequency in the Consistent RTA Black Spots of Mekelle City ......................................................... 79
5.4 Causes of Road Traffic Accidents in Mekelle City ...................................................... 81
5.5 Impacts of Road Traffic Accidents in Mekelle City ..................................................... 82
5.5.1 Social Impacts of Road Traffic Accident ................................................................ 82
5.5.2 Economic Impacts of Road Traffic Accident ......................................................... 86
CHAPTER SIX ........................................................................................................................... 88
6. CONCLUSION AND RECOMMENDATIONS ................................................................ 88
6.1 Conclusion ......................................................................................................................... 88
6.2 Recommendations ............................................................................................................ 89
References................................................................................................................................... 91
Appendix 1 ................................................................................................................................. 95
Appendix 2 ............................................................................................................................... 102
Appendix 3 ............................................................................................................................... 104
vi
List of Tables
Table 1: Road Type and length in Mekelle City (2008-2011) ............................................... 34
Table 2: Nature and source of data .......................................................................................... 35
Table 3: Temporal variation of RTAs by hours of a day in Mekelle City (2008-2011) ..... 40
Table 4: Temporal variation of RTAs in a year by month in Mekelle City (2008-2011) ... 41
Table 5: Drivers age and RTA in Mekelle City (2008-2011) ................................................. 42
Table 6: Driving experience and RTA in Mekelle City (2008-2011) .................................... 44
Table 7: Vehicle service age and RTA in Mekelle City (2008-2011) .................................... 46
Table 8: Vehicle Category and RTA in Mekelle City (2008-2011) ....................................... 47
Table 9: Types of RTA in Mekelle City (2008-2011) .............................................................. 51
Table 10: The spatial distribution of RTA occurrences in Mekelle City (2008) ................. 53
Table 11: Mekelle City RTA Black Spot areas (2008) ............................................................ 54
Table 12: The spatial distribution of RTA occurrences in Mekelle City (2009) ................. 57
Table 13: Mekelle City RTA Black Spot areas (2009) ............................................................ 58
Table 14: The spatial distribution of RTA occurrences in Mekelle City (2010) ................. 61
Table 15: Mekelle City RTA Black Spot areas (2010) ............................................................ 62
Table 16: The Spatial distribution of RTA occurrences in Mekelle City (2011) ................ 65
Table 17: Mekelle City RTA Black Spot areas (2011) ............................................................ 66
Table 18: Spatial distribution of total RTA Spots in the Mekelle City (2008 -2011) .......... 69
Table 19: Spatio-temporal variation of RTA Frequency in Mekelle City (2008 – 2011) ... 72
Table 20: All RTA Black Spots and Frequency of RTAs in Mekelle City (2008 – 2011) ... 74
Table 21: Top 10 RTA Black Spots and Frequency of RTAs in Mekelle City
(2008 – 2011) ........................................................................................................... 77
Table 22: Consistent RTA Black Spots and Frequency of RTAs in Mekelle City
(2008 – 2011) ............................................................................................................ 79
Table 23: Causes of RTA in Mekelle City (2008-2011) .......................................................... 81
Table 24: RTA by sex and accident severity class in Mekelle City (2008-2011) ................ 82
Table 25: RTA by accident severity class in Mekelle City (2008-2011) ............................... 84
Table 26: Estimated cost of RTA in Mekelle City (2008-2011) ............................................. 86
vii
List of Figures
Figure 1: Mekelle City (Study Area) ........................................................................................ 28
Figure 2: Mekelle City Population Pyramid (CSA 2007) ...................................................... 29
Figure 3: Slope Map of Mekelle City ....................................................................................... 30
Figure 4: Aspect Map of Mekelle City .................................................................................... 31
Figure 5: Average Monthly Rainfall of Mekelle City (NMA 2009) ..................................... 32
Figure 6: Average Monthly Maximum and Minimum Temperature of Mekelle City
(NMA 2009) ............................................................................................................. 33
Figure 7: Research Design ......................................................................................................... 39
Figure 8: Drivers sex and their contribution to RTA in Mekelle City (2008-2011) ........... 43
Figure 9: Hired Drivers – own drivers vis-à-vis RTA in Mekelle City (2008-2011).......... 45
Figure 10: Road divide and RTA in Mekelle City (2008-2011) ............................................ 48
Figure 11: Road Pavement and RTA in Mekelle City (2008-2011) ...................................... 49
Figure 12: Road moisture condition and RTA in Mekelle City (2008-2011) ...................... 50
Figure 13: Weather condition and RTA in Mekelle City (2008-2011) ................................. 51
Figure 14: Spatial Distribution of RTAs and RTA Spots in Mekelle City (2008) .............. 55
Figure 15: Spatial Distribution of RTA Black Spots in Mekelle City (2008) ...................... 56
Figure 16: Spatial Distribution of RTAs and RTA Spots in Mekelle City (2009) .............. 59
Figure 17: Spatial Distribution of RTA Black Spots in Mekelle City (2009) ...................... 60
Figure 18: Spatial Distribution of RTAs and RTA Spots in Mekelle City (2010) .............. 63
Figure 19: Spatial Distribution of RTA Black Spots in Mekelle City (2010) ...................... 64
Figure 20: Spatial Distribution of RTAs and RTA Spots in Mekelle City (2011) .............. 67
Figure 21: Spatial Distribution of RTA Black Spots in Mekelle City (2011) ...................... 68
Figure 22: Spatial distribution of all spatially identified RTA Spots of Mekelle City from
2008 – 2011 ............................................................................................................... 70
Figure 23: Trend of RTA Occurrences in Mekelle City (2003-2011).................................... 71
Figure 24: The Spatio-temporal Distribution and Trend of RTA frequency among all
sub-cities of Mekelle City (2008 – 2011)............................................................... 73
Figure 25: The Spatio-temporal distribution and Trend of RTA Frequency in all RTA
Black Spots of Mekelle City (2008 – 2011) ........................................................... 76
Figure 26: The Spatio-temporal Distribution and Trend in the occurrence of RTA
Frequency in the Top 10 RTA Black Spots of Mekelle City (2008 – 2011) .... 78
Figure 27: The spatio-temporal Distribution and Trend of RTA Frequency in the
consistent RTA Black Spots of Mekelle City (2008 – 2011).............................. 80
Figure 28: RTA Casualty around Mekelle City Bus Station ................................................. 86
Figure 29: Heavy Truck crashed around Gebriel Church .................................................... 87

viii
Acknowledgements
Let everything that has breath praise the Lord.
Psalms 150:6
It would not have been possible to write this MSc thesis without the help and wherewithal of the kind people around me, to only some of whom it is possible to give partial mention here.
I would like to express my sincere appreciation to my principal advisor Drs. Atkilt
Girma, I am forever grateful for his words of encouragement and inspiration. It is
because of his thoughtful steering, unreserved and unsurpassed knowledge in GIS that
this thesis works is made possible.
The incredible advice, priceless enthusiasm and support of my second advisor, Mr.
Solomon Hishe, has been tremendously instrumental on both academic and personal
level, for which I am extremely grateful.
I have deep gratitude towards my brother Tadesse Tekle for his inimitable terrific patience, kindness, love and respect and for the motive that he showed me the way to walk across the factual fashion since the very start of my career. For this thesis, data were essential. I collected a lot of data from different offices. Many
people helped with this, for which I would like to thank them wholeheartedly. Without
their generosity there would be nothing to work with.
I have been fortunate to come across many hilarious virtuous friends and colleagues in SOS HGS, Mekelle, without whom life would be bleak. I revere you all. I am grateful to my mother Askual Tesfay and my beloved sisters who have given me their unequivocal affection, as always, for which my mere expression of thanks likewise does not suffice. Selina, this is how far your love, prayers and support have brought me. What could I reimburse you Seli? It is enormously auspicious to be with you.
Girmay Giday
Mekelle, January- 2014
ix
List of Acronyms and Abbreviations
AIDS Acquired Immunodeficiency Syndrome
CSA Central Statistics Agency
DALY Disability Adjusted Life Year
ETB Ethiopian Birr
FAO Food and Agriculture Organization
g/dl Gram per Deciliter
GDP Gross Domestic Product
GIS Geographic Information Systems
GNP Gross National Product
GPS Global Positioning System
HIV Human Immunodeficiency Virus
IRTAD International Road Traffic and Accident Database
KDE Kernel Density Estimation
Km/h Kilometer per Hour
MAO Mekelle Administration Office
MZPTO Mekelle Zone Police Traffic Office
NMA National Meteorological Agency
RSDP Road Sector Development Program
RTA Road Traffic Accident
RTAs Road Traffic Accidents
SPSS Statistical Package for the Social Sciences
TRB Transport Research Board
x
TRPC Tigray Region Police Commission
UK United Kingdom
UN United Nations
USD/US$ United States Dollar
WB World Bank
WHO World Health Organization
xi
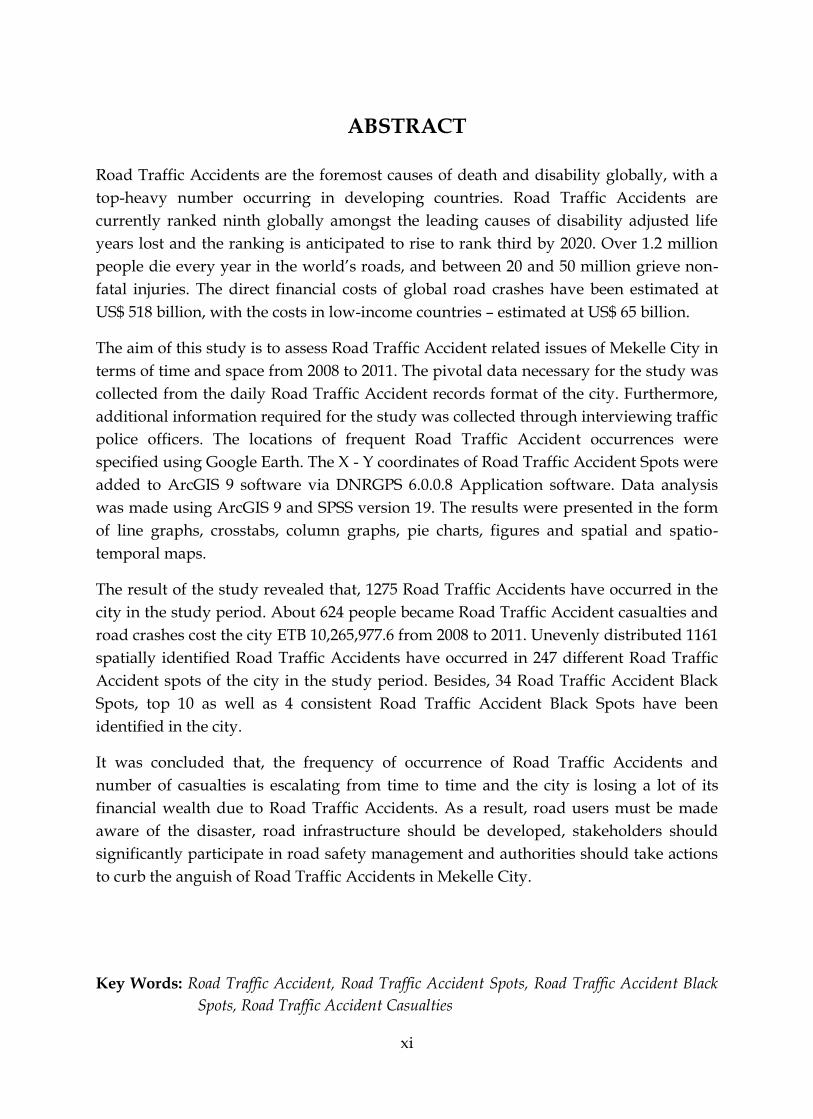
ABSTRACT
Road Traffic Accidents are the foremost causes of death and disability globally, with a
top-heavy number occurring in developing countries. Road Traffic Accidents are
currently ranked ninth globally amongst the leading causes of disability adjusted life
years lost and the ranking is anticipated to rise to rank third by 2020. Over 1.2 million
people die every year in the world’s roads, and between 20 and 50 million grieve non-
fatal injuries. The direct financial costs of global road crashes have been estimated at
US$ 518 billion, with the costs in low-income countries – estimated at US$ 65 billion.
The aim of this study is to assess Road Traffic Accident related issues of Mekelle City in
terms of time and space from 2008 to 2011. The pivotal data necessary for the study was
collected from the daily Road Traffic Accident records format of the city. Furthermore,
additional information required for the study was collected through interviewing traffic
police officers. The locations of frequent Road Traffic Accident occurrences were
specified using Google Earth. The X - Y coordinates of Road Traffic Accident Spots were
added to ArcGIS 9 software via DNRGPS 6.0.0.8 Application software. Data analysis
was made using ArcGIS 9 and SPSS version 19. The results were presented in the form
of line graphs, crosstabs, column graphs, pie charts, figures and spatial and spatio-
temporal maps.
The result of the study revealed that, 1275 Road Traffic Accidents have occurred in the
city in the study period. About 624 people became Road Traffic Accident casualties and
road crashes cost the city ETB 10,265,977.6 from 2008 to 2011. Unevenly distributed 1161
spatially identified Road Traffic Accidents have occurred in 247 different Road Traffic
Accident spots of the city in the study period. Besides, 34 Road Traffic Accident Black
Spots, top 10 as well as 4 consistent Road Traffic Accident Black Spots have been
identified in the city.
It was concluded that, the frequency of occurrence of Road Traffic Accidents and
number of casualties is escalating from time to time and the city is losing a lot of its
financial wealth due to Road Traffic Accidents. As a result, road users must be made
aware of the disaster, road infrastructure should be developed, stakeholders should
significantly participate in road safety management and authorities should take actions
to curb the anguish of Road Traffic Accidents in Mekelle City.
Key Words: Road Traffic Accident, Road Traffic Accident Spots, Road Traffic Accident Black
Spots, Road Traffic Accident Casualties
1
CHAPTER ONE
1. INTRODUCTION
1.1 General Introduction
There is uneven distribution of natural resources on the earth's surface. The
insufficiency of different goods and services exists in different places around the world.
In addition, there is a difference in specialization in the production of varieties of
commodities and services. As a result of these conditions and other related drives
people exchange what they have produced with what they need regardless of the
distance between them and their partners in trade. Consequently, people have to move
from place to place to do so.
Any movement of people for any perseverance using different means is known as
transportation. As indicated in Bamford and Robinson (1978),"Transport by definition
infers a movement, and each individual from an early age owns his own "built-in"
capability to travel, although within a restricted area". Moreover, to express the crucial
part of transport Bamford and Robinson (1978) generalized that it is difficult to conceive
of a situation where transport does not play a major role in the life of an individual.
It is obvious that, among all modes of transportation, road transport is the nearby
means of conveyance. Road Transport’s major advantage compared with others is its
elasticity, which permits it to function from door-to-door over short distances at the
most competitive prices (Bamford and Robinson 1978; Wough 1990). In Africa over 80%
of goods and people are transported by roads while in Ethiopia road transport accounts
for over 90% of all the inter-urban freight and passenger movements in the country
(Kifle 1996).
Transportation is one of the basic necessities for the apposite functioning of societies as
its demand is greatly related to the movement of people from one place to another.
Since every bustle of human being has its own consequences (positive or negative)
transport is not an exception to this circumstance. In connotation to this Rallis (1997)
have stated that the constraints associated with transport include the risk of traffic
mobbing, traffic coincidence, pollution, noise, and the like. Road Traffic Accidents
2
(RTAs) are among the most damaging environmental effects, which have caused from
transportation development. Road safety, therefore, urges serious concern worldwide.
According to Ajit and Ripunjoy (2004) RTAs have turned out to be a huge global public
health and development problem killing almost 1.2 million people a year and
wounding or disabling about 20-50 million people more; the combined population of
five of the world’s large cities. The statistical profile reflects that in 2002, RTAs charged
the global community about US $ 518 billion.
In similar manner WHO (2004) reports that; Road traffic injuries are a major but
neglected global public health disruptive, necessitating concerted sweats for actual and
sustainable prevention. Of all the systems that people have to pact with on a daily basis,
road transport is the most composite and the most dangerous. The catastrophe behind
these figures regularly attracts less media courtesy than other, less recurrent but more
unusual types of tragedy.
Though the above researches focused on the entire nature and disastrous effect of Road
Traffic Accident (RTA) at a global scale, this study will focus on assessing the general
characteristics of RTA, places of frequent road traffic accident occurrences, trend, causes
and impacts of RTAs in Mekelle City.
1.2 Statement of the Problem
The road traffic injury problem has started to occur before the coming of the car.
Nonetheless, it was with the car and afterwards trucks, buses and other vehicles which
the misery intensified swiftly. The first road crash was allegedly writhed by a cyclist on
30 May 1896 in New York city, shadowed few months later by the first fatality, a
pedestrian in London (Gibson 1975; Joseph 1980). Although the meticulous number will
never be known, the frequency of fatalities was conventionally assessed to have reached
an aggregate total of 25 million by 1997 (WHO 2004). It is after those historical events
that the road traffic crashes have sustained to this day to exact their peal.
Despite the extent and severity of the accident is different, it has a global scope in
nature. Road Traffic Accident is the prominent cause of death by injury in the world.
According to UN (2011), above 1.2 million people die in the world’s roads every year.
In addition to this, about 65% of the total deaths in road crashes in the world include
pedestrians, 35% of these are children (UN 2011). In line with this report, WHO (2011)
described that 145 people die at every hour of every day, someone is killed or utterly
hurt in every six seconds of every minute, a million exceeding people lost their lives
3
each year, one in five of whom is a child merely because of RTAs. Likewise, WHO
(2004) described an average of 3,242 persons were vanishing each day around the globe
due to road traffic injuries.
The impact of road transport accident over the socio – economic aspects of Africa is
even much worse. Africa, a continent of people who have long been in a struggle for
poverty reduction and for the security of other basic needs, are nowadays seem to face
another challenge, that is devastating RTA. In another look, UN (2011) shows that RTA
costs Africa $10 billion annually and remains the second leading cause of death for 5 –
44 age - groups around the continent.
Ethiopia contributes much to the misery of RTA in Africa. At least one person is killed
from every five car coincidences occurring in Ethiopia. Eventually the most shocking
and terrible impact of RTA in Ethiopia is also stated in UN (2009), as over half of RTA
deaths in Ethiopia involve pedestrians, of whom 20% are children younger than 18
years old. Similarly, Tesema (2005) have stated that, in Ethiopia, above 1800 people died
while around 7000 were crippled or injured in 2003 due to RTA. Moreover, the death
rate is 136 per 10,000 vehicles in the country. Likewise, according to Odero (2004)
pedestrians account for the highest proportion of road fatalities in nearly all African
countries, ranging between 31% in Zimbabwe and 51% in Ethiopia.
The government of Ethiopia is investing huge budget on road transport construction
and related infrastructures aiming at increasing the quality of roads, making
communication much easier and dissemination of import and export trade better so as
to maintain the current rapidly growing economy of the nation. UN (2010) stated that,
high quality asphalt roads and rural community roads have been constructed all over
the country. In addition to this, UN (2009) proclaimed that: Recognizing the importance
of the road transport, the Government of Ethiopia has launched a Road Sector
Development Program (RSDP) since 1997 which focused on upgrading and
rehabilitating the existing road network, expanding the road network, and providing
regular maintenance. Since then, the condition of roads has improved and the network
which was about 26,550 km at the beginning of RSDP in 1997 has improved to 44,359
km by 2008.
Notwithstanding, the above progressive reports of improvement in the quality and
accessibility of road transportation sector in Ethiopia, RTA remains to be one of the
precarious problems of the road transport in Ethiopia. A study of RTA by UN (2009)
conducted in Ethiopia reveals that, Road traffic accident in Ethiopia is a cause of
significant losses of human and economic resources. In the year 2007/08, police stated
4
15,086 accidents which caused the fatalities of 2,161 lives and over Ethiopian Birr (ETB)
82 million (US$7.3 million).
The report of TRPC (2010) officially reveals that, RTA slurped Tigray region about ETB
15,327,932 in 2010. According to the cost estimate of property damage of RTA as
collected from RTA document of Mekelle City traffic office, the total cost of RTA of the
city was ETB 2,254,981.9 in 2008, 2,196,355.7 in 2009, 1,985,420.0 in 2010 and 3,829,220.0
in 2011. Children under the age of 18 and adults between ages of 18 – 50 are the prior
victims of RTA in Mekelle City. The TRPC (2010), hearsays that, out of 221 death caused
by RTA in 2010 in the region, 51 (23.07%) of the victims were children under the age of
18 and 156 (70.58%) were adults between ages of 18 – 50 years old. In addition to this
above 442 were heavily injured and other 385 have got minor injury in the same year
from all age groups in the region.
Mekelle City, the main focus of this study, contributed 37 out of 221 death cases in
Tigray region by RTA in the year 2010. Not only this but also out of the total occurrence
of RTA in Tigray region by the year 2010, 84 (19%) of the heavy injuries, 79 (20.5%) of
minor injuries and ETB 1,985,420.0 (12.95%) of property damages have been recorded in
Mekelle City. By 2011, 26 out of 303 fatal accidents, 59 out of 415 serious injuries and 24
out of 361 minor injuries in Tigray region have been recorded in Mekelle City. In terms
of financial cost of RTA in 2011, Mekelle City shares ETB 3,829,220.0 (14.45%) of the
total ETB 26,485,650 of Tigray region. This shows that, the city is very much vulnerable
to road transport related accidents than any other zone in Tigray region. Moreover,
Based on MZPTO (2007) the number of vehicles in the city before two decades was
insignificant, but in 2007/08, it has increased to 6989. In addition to this, MZPTO (2007)
report shows that, the RTA occurring in the city with some exceptions are increasing
form time to time. The total RTA occurred in the years 2003, 2004, 2005, 2006 and 2007
was 92, 78, 119, 111 and 116 respectively (MZPTO 2007). However, the number of RTA
occurrences in the city in the years 2008, 2009, 2010 and 2011 has increased in to 288,
342, 322 and 323 respectively.
Some studies, prior to this study, have been conducted focusing on the issue of RTA in
Mekelle City by different dignitaries. However, almost all those studies were not well
organized and failed to plot RTA risk areas in the city, failed to prepare data base of
RTA occurrences and were unable to forward applicable recommendations in relation
to the financial and infrastructural capabilities of Mekelle City. Here we believe that the
RTA issue of Mekelle City did not get enough attention from academicians.
5
While this study is in the same universe with the preceding studies, it will focus mainly
on describing the general characteristics of RTA, mapping RTA risk areas, identifying
main causes, examining spatio – temporal trend of RTA, analyzing impacts of RTA in
the city and forwarding new and applicable recommendations.
So far, we did not find any study that assessed the Spatio – temporal relations of RTA
for Mekelle City. The rationale of this study therefore is to describe the characteristics of
RTA, map places of frequent RTA occurrences, examine the spatio – temporal trend of
RTA, identify major causes and analyze the socio – economic impacts of RTAs and
thereby offer possible suggestions which could help to minimize the disaster in the
study area.
Thus, RTA is problem in Ethiopia and specifically in Mekelle City which is long been
threatening the socio – economic endeavor. With this research we set out to assess the
RTA spatially and temporally considering its relevance to planners, policy makers,
stakeholders and the community at large. This research will thus be the first of its kind
for Mekelle City.
1.3 Objective of the Study
1.3.1 General Objective
The main objective of the research is to study Road Traffic Accident related issues in
Mekelle City in terms of time and space.
1.3.2 Specific Objectives
The specific objective of the study is to:
Describe the general characteristics of RTA in Mekelle City.
Map the spatio-temporal distribution of RTA Spots and RTA Black Spots in
Mekelle City.
Examine the trend of Road Traffic Accident in Mekelle City.
Identify major causes of Road Traffic Accident occurrence in Mekelle City.
Analyze the socio – economic impacts of Road Traffic Accident in Mekelle City.
Propose appropriate interventions which could help to reduce the Road Traffic
Accident occurrences and to minimize RTA socio – economic impacts in Mekelle
City.
6
1.4 Research Questions
This research was conducted to answer the following Basic questions.
1. What characterizes Road Traffic Accidents in Mekelle City?
2. Where do frequent Road Traffic Accidents occur in Mekelle City?
3. What is the trend of Road Traffic Accident occurrence in Mekelle City?
4. What are the major causes and contributory factors for the occurrence of Road
Traffic Accidents in Mekelle City?
5. What social and economic costs have been incurred due to road traffic accidents
in Mekelle City?
6. What possible appropriate interventions can be recommended for Mekelle City
RTA to minimize RTA socio-economic impacts?
1.5 Significance of the Study
This study is mainly concerned with the assessment of RTA in Mekelle City. Emphasis
is given to mapping; examining, identifying and analyzing the RTA risk areas, trend,
cause, and impact of RTA in the city respectively. Therefore, the study is significant for
the following reasons:
Even though the study is limited to a single city in the country, the results to be
obtained from this research could be helpful in launching initiations in studying
the complex problems of urban road transport in general and RTA in particular.
The verdicts attained from the study will be helpful to gain valuable data and
information about the RTA black spots, trend, cause and impact of RTA in the
city, which in turn, could help to develop countermeasures that could reduce the
frequency and severity of road traffic accidents.
The study will have paramount importance to the government, municipal
authorities and the community in the city to determine the need for road
improvements and vehicle inspections.
It can be used as one source of information for those institutions concerned with
road safety management and helps to improve the quality of decision-making in
urban road transport safety planning.
The study will be used as a bench mark information to those scholars who want
to conduct future detailed studies on RTA, road safety and other related issues.
7
1.6 Scope of the Study
This particular research focuses on the issues and implications of RTA in all of the seven
Sub-cities of Mekelle City. The results, findings, discussions and generalizations of the
study will therefore be preliminarily for the study area.
The availability and reliability of the information employed in any study is very
important which will have instrumental impact later on the precision of the results and
conclusions. This study mainly used Mekelle City RTA data and information of 4 years
(2008 - 2011) which is collected from the RTA archives of Mekelle City Traffic Office and
other offices and stake holders concerned with the issues of RTA and road safety.
1.7 Limitation of the Study
This study lucks to obtain fully completed data related to RTA. However, several data
was obtained from Mekelle City Traffic Office, Tigray region police commission,
Mekelle City road transport and construction office and Tigray region bureau of finance
and economic development. Some irregularities exist in the data. Especially the RTA
data of Mekelle City contain a number of missing and incomplete data elements. The
main sources of inconsistence in the RTA data of the city were due to limitations and
erratic reporting made by the traffic polices and RTA investigating officers at the data
gathering and recording level mainly due to lack of knowhow. In addition to this,
before 2008, RTA data of the city were compiled by the sub-cities traffic office
separately. However, after the introduction of the Business Process Reengineering
Program in the whole country; the RTA data of the city was made to be compiled in one
and therefore some RTA data files of the city which contained RTA data of 2008 and
2009 were lost during the transformation process. Consequently, some RTA data of the
city have lost part of their entities and others were totally lost. Furthermore, the data
was available in hard copy and lack Global Positioning System (GPS) coordinate data.
However, the data contained names of approximate location of the RTA. We identified
the location of the RTA sites from Google earth images. Thus, the spatial locations of the
RTA are approximate.
8
1.8 Organization of the Paper
This paper is organized in to six chapters. The first chapter introduces the study with
general introduction, statement of the problem, objective of the study, basic research
questions, significance of the study, scope of the study, limitation of the study and
standard definition of basic terms. The second chapter discussed about the review of
related literatures regarding definition and concepts of RTA, global and regional trend
of RTA, causes of RTA occurrences, economic and social impacts of RTA, RTA black
spot definition and treatment and an overview of RTA in Ethiopia. The third chapter
encompasses description of the study area in terms of location and administrative
setup, demographics characteristics, topography, climate and road network and
infrastructure. The fourth chapter comprises materials used and methods applied in
steering the entire work. The fifth chapter presents detailed results and discussions of
the study while the sixth chapter embraces conclusion and recommendations.
1.9 Standard Definition of Basic Terms
Terms related to RTA can have different definitions in different places. However,
(WHO 2010); Alister and Simon (2011) have quoted the following as standard
definitions of basic terms of RTA.
Accident: Involves personal injury occurring on the public highway (including
footways) involving at least one road vehicle or a vehicle in collision with a pedestrian
and which becomes known to the police within 30 days.
Damage only accident: is the one as a result of which no person is injured only one or
more vehicles involved in the accident are damaged.
Disability Adjusted Life Years: The years lost by an individual because he or she is
disabled as a result of being involved in a Traffic Accident.
Fatal accident: Accident involving at least one fatal casualty.
Fatal injury/ casualty: Injury causes death within 30 days of the accident.
Injury: Physical damage that results when a human body is suddenly or briefly
subjected to intolerable levels of energy. It can be a bodily lesion resulting from acute
exposure to excessive energy or impairment of function resulting from lack of vital
elements.
9
Road motor vehicle: A road vehicle fitted with an engine providing its sole means of
propulsion, which is normally used for carrying persons or goods, or for drawing (on
the road), vehicles used for the carriage of persons or goods.
Road network: All roads in a given area.
Road traffic accident black spots: Places or cites where frequent road traffic accidents
occur.
Road traffic accident spots: Places or cites where even a single RTA has occurred
regardless of its frequency or severity level of its consequence in a given specified
period.
Road traffic crash: A collision or incident involving at least one road vehicle in motion,
on a public road or private road to which the public has right of access. Included are:
collisions between road vehicles; between road vehicles and pedestrians; between road
vehicles and animals or fixed obstacles and with one road vehicle alone. Included are
collisions between road and rail vehicles. Multi-vehicle collisions are counted as only
one crash provided that any successive collisions happen within a very short time
period.
Road traffic injury (or casualty): A person who has sustained physical damage (i.e.
injury) as a result of a road traffic crash.
Road traffic: Any movement of a road vehicle on a given road network.
Road transport: Any movements of goods and/or passengers using a road vehicle on a
given road network.
Road user: a person using any part of the road system as a non-motorized or motorized
transport user.
Road vehicle: A vehicle running or drawn on wheels intended for use on roads.
Road: Line of communication (travelled way) open to public traffic, primarily for the
use of road motor vehicles, using a stabilized base other than rails or air strips. Included
are paved roads and other roads with a stabilized base, e.g. gravel roads. Roads also
cover streets, bridges, tunnels, supporting structures, junctions, crossings and
interchanges.
Serious accident: Accident in which no one is fatally injured, but at least one casualty
received serious injuries.
10
Serious injury/ casualty: Injury does not cause death within 30 days of the accident
and either results in the casualty being detained in hospital as an in-patient, or any of
the following injuries: fractures, concussion, internal injuries, crushing’s, severe cuts
and lacerations, severe general shock requiring treatment, or any injury which causes
death more than 30 days after the accident.
Slight accident: Accident in which at least one casualty receives slight injuries but no
fatal or serious injuries.
Slight injury/ casualty: Injury of a minor character such as a sprain (including
whiplash neck injury), bruise or cut which are not judged to be severe or slight shock
requiring roadside attention. Injuries not requiring medical treatment are included.
In addition to the above terms related to RTA, main economic terms are used in this
study to label countries based on their economic status. The economic terms used in this
study are taken on the basis of their definition given by WB (2012) and are stated as
follows.
High-income countries: Are countries whose Gross National Income Per capita is US$
12,616 or more.
Low-income countries: Are countries whose Gross National Income Per capita is US$
1,035 or less.
Middle-income countries: Are countries whose Gross National Income Per capita is
between US$ 1,036 to 12,615.
Mekelle City: Mekelle City in this research refers to the administrative boundary of
Mekelle zone as per 2011.
11
CHAPTER TWO
2. LITERATURE REVIEW
2.1 Introduction
2.1.1 Definition and Concepts
2.1.1.1 Definition
Road Traffic Accident is any vehicle accident occurring in a public highway. It includes
collision between vehicles and animals, vehicles and pedestrians or vehicles and stuck
obstacles. Single vehicle accidents, that involve a single vehicle, which means without
other road user, are also enclosed (Safecarguide 2004). In a similar manner Ajit and
Ripunjoy (2004), have mentioned that Accident is an occasion, occurring abruptly,
unpredictably and inadvertently under unforeseen circumstances. Seemingly, Segni
(2007) have also outlined that an accident is a rare, random, multi-factor event always
preceded by a situation in which one or more road users have failed to cope with the
road environment. Far from the above arguments, Alister and Simon (2011) stated that
accident Involves personal injury occurring on the public highway (including footways)
involving at least one road vehicle or a vehicle in collision with a pedestrian and which
becomes known to the police within 30 days.
In this regard, RTA can be defined as an accident that occurred on a way or street open
to public traffic; resulted in one or more persons being killed or wounded, and at least
one stirring vehicle was intricate. Therefore, RTA is a smash between vehicles; between
vehicles and pedestrians; between vehicles and animals; or between vehicles and
geographical or architectural obstacles.
2.1.1.2 Concepts
Transport is the movement of people and goods from one place to another (Peters 1982;
Khanna and Justo 1986; Goodall 1987). But according to Belachew (1997), transport also
comprises movement of information. Similarly, Transportation is the conveyance of
people, properties and information from one place to another or it is the repositioning
of people, properties and information over space.
12
The type of transport which exhibits accident that drastically affects the wellbeing of the
people and economy of the nations is the one which involves the movement of people
and or goods from one place to the other. Several RTA incidences occur throughout the
world at every fraction of times in a day. Whatever the reason, where ever the scene
and whoever the victim is, RTAs remain as the headache of everyone.
The manifestations of RTA are sporadic and random in space and time. Nevertheless,
road safety and road incident lessening are related to many other fields of activity such
as education, motorist or driver training, publicity operations, police enforcement, road
traffic policing, the court system, the National Health Service and Vehicle
manufacturing and engineering (Berhanu 2000). The most shocking and emerging
reality of RTA is that, it will continue affecting the survival of several lives across the
planet. Consequently, UN (2009), remains pessimistic in road traffic accident cases
where it projected that, road traffic injuries will be the fifth – leading cause of death
globally by 2030. However, WHO (2004) projected that, RTA crashes which were
ranked at 9th leading cause of burden of disease by 2002 could rank at the 3rd cause of
burden of disease by 2020, if the current trend in motorization continues increasing in
the same or similar manner for the coming decade.
2.2 Global and Regional Trends of Road Traffic Accidents
According to WHO (2004), road traffic deaths have risen from approximately 999, 000 in
1990 to just over 1.1 million in 2002. Low-income and middle-income countries account
for the majority of this increase. Although the number of road traffic injuries has
continued to rise in the world as a whole, time series analysis reveals that road traffic
fatalities and mortality rates show clear differences in the pattern of growth between
high-income countries, on the one hand, and low-income and middle-income countries
on the other. In general, since the 1960s and 1970s, there has been a decrease in the
numbers and rates of fatalities in high-income countries such as Australia, Canada,
Germany, the Netherlands, Sweden, the United Kingdom (UK) and the United States of
America. At the same time, there has been a pronounced rise in numbers and rates in
many low-income and middle-income countries.
The trends are based on a limited number of countries for which data were available
throughout the period and they are therefore influenced by the largest countries in the
regional samples. Such regional trends could mask national trends and the data should
not be extrapolated to the national level. The regional classifications employed are
similar too, but not exactly the same as those defined by The World Health
Organization (WHO). There has been an overall downward trend in road traffic deaths
13
in high-income countries, whereas many of the low-income and middle-income
countries have shown an increase since the late 1980s (WHO 2004). There are, however,
some marked regional differences; Central and Eastern Europe witnessed a rapid
increase in road traffic deaths during the late 1980s, the rate of increase of which has
since declined. The onset of rapid increases in road traffic fatalities occurred later in
Latin America and the Caribbean, from 1992 onwards. In contrast, numbers of road
traffic deaths have risen steadily since the late 1980s in the Middle East and North
Africa and in Asia, particularly in the former (WHO 2004).
The reductions in road traffic fatalities in high-income countries are attributed largely to
the implementation of a wide range of road safety actions, including seat-belt use,
vehicle crash fortification, traffic-calming interventions and traffic law enforcement.
However, the reduction in the reported statistics for road traffic injury does not
necessarily mean an improvement in road safety for everyone. According to the
International Road Traffic and Accident Database (IRTAD), pedestrian and bicyclist
fatalities have decreased more rapidly than have fatalities among vehicle occupants. In
fact, between 1970 and 1999, the proportion of pedestrian and bicyclist fatalities fell
from 37% to 25% of all traffic fatalities, when averaged across 28 countries that report
their data to IRTAD. These reductions could, however, be due, at least in part, to a
decrease in exposure rather than an improvement in safety (WHO 2004).
2.3 Causes of Road Traffic Accident
Road traffic crash results from a combination of factors related to the components of the
system including roads, the setting, vehicles and road users, and the way they interact.
Some factors contribute to the occurrence of a collision and are therefore part of crash
causation. Other factors aggravate the effects of the collision and thus contribute to
trauma severity. Some factors may not appear to be directly related to road traffic
injuries. Some causes are immediate, but they may be underpinned by medium-term
and long-term structural causes. Identifying the risk factors that contribute to road
traffic crashes is important in identifying interventions that can reduce the risks
associated with those factors (Lisa, David et al. 2005).
2.3.1 Human Related Causes of Road Traffic Accident
Human factors are without doubt the most complex and difficult to separate, as they are
virtually all very momentary in nature. What existed at the time of the crash may not
exist some instants later. Consider sensory capabilities, knowledge, decision making,
attitude, attentiveness, fitness, health, driving skill, age, weight, strength and freedom
of movement. Of these, the emotional dynamics are the greatest variable attributes and
14
the most difficult to ascertain. They are also subject to the most adjustment with the
least remaining evidence (Lisa, David et al. 2005). Human factors in vehicle collisions
include all factors related to drivers and other road users that may contribute to a crash.
Examples include driver comportment, visual and auditory acuity, decision-making
ability, and reaction speed. Some of the human related causes of RTA are discussed as
follows.
2.3.1.1 Drink Driving
Drink driving is one of the most contributing factors to RTA occurrences in many
countries of the world. For instance (WHO 2009; WHO 2010) reveals that, drink driving
is responsible for between 10 and 32 % of fatal crashes.
As discussed by WHO (2004) drivers and motorcyclists with any blood alcohol content
greater than zero are at higher risk of a crash than those whose blood alcohol content is
zero. For the overall driving population, as the blood alcohol content escalates from
zero, the risk of being involved in a crash starts to upsurge significantly at a blood
alcohol content of 0.04 g/dl. Inexperienced young adults driving with a blood alcohol
content of 0.05 g/dl have 2.5 times the risk of a crash compared with more experienced
drivers. If a blood alcohol content limit is static at 0.10 g/dl, this will upshot in three
times the risk of a crash than that at 0.05 g/dl, which is the most common perimeter in
high-income countries. If the legal limit stands at 0.08 g/dl, there will still be twice the
risk than at 0.05 g/dl. Alcohol ingestion by drivers puts pedestrians and riders of
motorized two-wheelers at risk.
2.3.1.2 Non-Use of Seat-Belts
A significant number of lives could be saved every year by using seatbelts. Till these
times many drivers are not realizing how much seat belts could save the lives of
themselves and the life of their customers. What makes this fact more complex is that,
although it is the worst in most of the developing countries of the world, it is a usual
phenomenon in some most developed countries to see drivers with no use of seat belts
while driving on public roads. WHO (2010) suggests that; In France, where the wearing
rate is among the highest, it was estimated that, in 2007 if every passenger and driver
had worn a seatbelt, 397 lives could have been saved (around 9% of total fatalities).
Wearing a seat belt reduces the risk of a fatality by 40 – 50%. Another study by Lisa,
David et al. (2005) shows that, not wearing a seatbelt is the most common cause of
fatality which contributes to fatality among 63% of all vehicle occupants. In addition to
this WHO (2004) have stated that Rates of seat-belt use vary greatly among different
countries, depending upon the existence of laws mandating their fitting and use and the
15
degree to which those laws are enforced. In low-income and middle-income countries,
usage rates are generally much lower. Seat-belt usage is substantially lower in fatal
crashes than in normal traffic. Correctly used seat-belts reduce the risk of death in a
crash by approximately 60%. In absolute similarities, supporting the above studies,
WHO (2009) added that if a seatbelt was correctly used, it would reduce the risk of
fatality among front seat passengers by 40-50% and among the rear seat car occupants
by 25-75%.
2.3.1.3 Choice of Less Safe Forms of Travel
By one or another reason, many passengers use less safe forms of travel. It would be
nothing if the passengers could arrive at their destination using any form of
transportation. But several studies in different countries of the world showed that, the
lesser the safety of travel is accompanied with miserable RTA occurrences. It is claimed
by WHO (2004) that “Of the four main modes of travel, road travel scores by far the
highest risk in most countries – using almost any measure of exposure – compared with
rail, air and marine travel.”
2.3.1.4 Speed
The speed of motor vehicles is at the core of the road injury problem. Speed affects to
both crash jeopardy and crash magnitude. In accordance to this, recent studies have
proved that as speeds increase, so do the number and severity of injuries. For instance a
study reported at WHO (2004) shows that the higher the impact speed, the greater the
likelihood of serious and fatal injury. The same report WHO (2004) proved that the
higher the speed of a vehicle, the shorter the time a driver has to stop and escape a
crash. A car moving at 50 km/h will usually require 13 meters in which to stopover,
while a car moving at 40 km/h will stop in less than 8.5 meters. An average increase in
speed of 1 km/h is associated with a 3% higher risk of a crash involving an injury. In
severe crashes, the increased risk is even greater. In such cases, an average increase in
speed of 1 km/h leads to a 5% higher risk of serious or fatal injury, travelling at 5 km/h
above a road speed limit of 65 km/h results in an increase in the relative risk of being
involved in a casualty crash. For car occupants in a crash with an impact speed of 80
km/h, the possibility of death is 20 times what it would have been at an impact speed of
30 km/h. Pedestrians have a 90% chance of surviving car crashes at 30 km/h or below,
but less than a 50% chance of surviving impacts at 45 km/h or beyond. The likelihood
of a pedestrian being killed increases by a factor of 8 as the impact speed of the car
increases from 30 km/h to 50 km/h. To this end WHO (2009) summarized that, a 5%
increase in average speed leads to an approximately 10% increase in crashes that cause
injuries, and a 20% increase in fatal crashes.
16
2.3.1.5 Age of Drivers
The age of drivers affects to the behavior of their driving styles and to the level of
Driver’s attention. In similar sense (WHO 2004); Lisa, David et al. (2005) argued that
Crash rates of male drivers aged 16–20 years were at least three times the estimated
crash rate of male drivers aged 25 years and above. Teenagers are significantly more
likely to be involved in a fatal crash than older drivers. At almost every blood alcohol
level, the risk of crash casualty declines with increasing driver age and experience. In
addition to this a study on drivers killed in road crashes estimated that teenage drivers
had more than five times the risk of a crash compared with drivers aged 30 and beyond,
at all levels.
2.3.1.6 Non-Use of Helmets
The use of helmets has a paramount role in reducing the severity of RTA. However,
several riders in different countries of the world are enjoying their journey without
using helmets until the worst effect of failing to use helmets come in to their lives.
Regarding this WHO (2004); (WHO 2009; WHO 2010) dictates that Non-helmeted users
of motorized two-wheelers are three times more likely to sustain head injuries in a crash
compared to those wearing helmets. Helmet-wearing rates vary from faintly over zero
in some low-income countries to almost 100% in places where laws on helmet use are
efficiently enforced. Though helmets have generally been extensively worn in most
high-income countries, there is a confirmation of a decline in practice in some countries.
More than half of adult riders of motorized two-wheelers in some low-income countries
do not wear their helmets appropriately secured. Child passengers rarely wear helmets,
or wear adult helmets that do not effectively protect them. Helmet use does not have
adverse effects on neck injuries, visibility or the ability to drive safely in traffic. Wearing
a motorcycle helmet correctly can reduce the risk of death by almost 40% and the risk of
severe injury by over 70% (WHO 2010).
2.3.1.7 The Use of Hand-Held Mobile Telephones
The use of mobile telephones while driving could result in unexpected RTA risks. WHO
(2004) suspects that, the use of hand-held mobile telephones can adversely affect driver
behavior – as regards physical as well as perceptual and decision-making tasks. The
process of dialing influences a driver’s ability to keep to the course on the road.
17
2.3.1.8 Lack of Road User Information and Campaign
Road users ought to acquire the knowledge needed to travel safely by means of formal
training and their own experiences. However, inadequate knowledge of traffic
regulations, traffic signs, vehicles and other elements may be some of the factors
contributing to unsafe behavior and road calamities. Road user information and
operations are intended to reduce accidents by promoting safer behavior in traffic, by
giving road users better knowledge and more favorable attitudes towards such
behavior. Another objective is increased understanding of restrictive measures which
are introduced to increase safety, such as speed limits. Elvic, Runee et al. (2005)
evaluated a number of studies on the effects of information campaigns on the number
of accidents. They reviewed that most campaigns targeted at road accidents in general
have not led to statistically significant changes in the number of accidents. On the other
hand, campaigns made to specific target group such as use of seat belt, drink-driving
campaign and the like have led to a decrease in number of accidents in particular types
during the campaign periods.
2.3.2 Road Related Causes of Road Traffic Accident
Since the entire process of road transport is conducted on roads, the quality, size and
engineering characteristics of the roads will have considerable contribution to the
increase or decrease of RTA risks. WHO (2004) supports this idea by saying that, the
road network has an effect on crash risk because it determines how road users perceive
their environment and delivers instructions for road users, through signs and traffic
panels, on what they should be doing. Many traffic management and road safety
engineering measures work through their influence on human behavior. Some variables
regarding the road related causes of RTA are discussed as to below.
2.3.2.1 Road Environment
Road environments have impacts on occurrences of road traffic accidents. In developed
countries, there are continuous efforts to meet the safety standards of roads through
safety audit during the planning, designing, and operation stage. Terje (1998) indicates
that in Africa road network is mounting fast, preservation standards have started
improving lately, and there is potential for improving the safety standards of the roads.
However, Berhanu (2000) reports that in Ethiopia, the police have limited road and
traffic engineering skill in general and thus they underestimate the contribution of
roads and environments to traffic accidents and especially they lack trainings on subject
area.
18
2.3.2.2 Roadway Characteristics
The roadway’s conditions like the quality of pavements, shoulders, traffic control
devices and intersections, can be a factor in a crash. Fewer traffic control devices and
complex intersections with excessive signage lead to confusion. Highways must be
designed for adequate sight distance for designed speed for the drivers to have
sufficient perception –reaction time. The Traffic signs and signals should provide
enough time for decision sight distance when the signal changes from green to red. The
super-elevation on highways and especially ramps should be carefully laid with correct
radius and appropriate transition zones for the vehicle to negotiate curves safely.
Another important factor is the frictional force between the pavement and tires. If the
tires lose contact with the pavement then the vehicle starts fishtailing.
Road factors include, but are not limited to lighting, view obstructions, signals, surface
character, dimension and shielding devices. All factors are subject to adjustments by
outside influences such as road surface that become slippery from rainfall. Modifying
each of the listed road factors are weather, lighting, roadside devices, activities, surface
deposits, damage, deterioration and age (Lisa, David et al. 2005).
2.3.2.3 Narrow Bridges
Bridges are often located on sag vertical curves where approach traffic is on down
grades and a factor responsible for increasing speed which contributes to the losing
control of vehicles. Bridges are also more dangerous when located on bend road
sections. According to Berhanu (2000) bridges are over represented in accidents relative
to the total length of the road system. Traffic accidents are also dangerous at bridges.
Far-reaching review of literature on the safety effects of bridges by Berhanu (2000)
points out features including bridge width, curved bridge, approach roadway
alignment and adverse surface condition as the most prevalent factors of bridge
accidents. Based on the findings of the cited studies, Berhanu (2000) suggests that at
least the bridge shoulder should be 1.8 m wider than the approach traveled way width
on rural two-lane highways (i.e. 0.9m shoulder width on each side should be carried
across the bridge). Besides, frequency and severity of traffic accident at bridges can be
reduced through the provision of adequate visual information to enable the driver
control and navigate safely on bridges. Run-off-the-road crashes and head-on collisions
are frequently associated with narrow bridges. Such crashes are related to lack of
maneuvering room because of narrow lanes, shoulders and roadside hazards or
curbing. Combining these factors with extreme speed might end in deadly results.
19
Crashes involving narrow bridges are habitually fatal. The crash rates may be lowered
by increasing lane and shoulder width or completely replacing bridges.
Other study made by (TRB 1987); Ung (2007) indicates that hazards associated with
bridges can be substantial. Road constriction at narrow bridges diminishes the
opportunity for safe recovery by out-of –control vehicles and can result in end –of –
bridge accidents. Besides, bridge approaches are often on a descending grade, a factor
responsible for intensifications in speed, and, predominantly in the case of older spans,
are often sharp-curved.
2.3.2.4 Road Lights
Road lights are intended to provide enough lighting for drivers to travel with comfort
and safety during night periods or under low visibility conditions. This solution is
commonly applied where there is the possibility of conflicts between vehicles and
pedestrians or cyclists. In rural roads, the implementation of lighting on unlit roads
may lead to a 64 per cent reduction in fatal accidents and 20 to 50 per cent of total
accident reduction. In the other way round the absence of road lights will add up to the
RTA occurrences by 20 to 50% (Sandra 2000).
2.3.3 Vehicle Related Causes of Road Traffic Accident
While vehicle design can have considerable influence on crash injuries, it must be
studied in accordance to its contribution to RTA. Prior studies to this one like WHO
(2004) have proved that vehicle related factors contribution to crashes, through vehicle
defects, is generally around 3% in high-income countries, about 5% in Kenya and 3% in
South Africa. Lisa, David et al. (2005) have argued that a small percentage of crashes are
caused by mechanical failure of a vehicle, such as some form of tire failure, brake
failure, or steering failure. The vehicle and roadway interaction like skid resistance play
a major role in stopping the vehicle from encroaching the off road features like
shoulder, median and other traffic signage. Improvements have been made in the
manufacture of tires and vehicle design however defects can still occur or be the
product of poor vehicle maintenance. Similarly, Ung (2007) stated that Vehicles have
caused road accident because their owners did not properly maintain and regularly
inspect the vehicle during the maneuver. So the road accident happened when brake
failure, tire blowout, power steering failure, headlight failure. In addition to this
defective or under inflated defective brakes, overloaded or poorly loaded vehicle or
trailer, defective lights or indicators, defective steering or suspension and defective or
missing mirrors are the major factors for the frequent occurrence of RTA.
20
2.3.4 Environment Related Causes of Road Traffic Accident
The climatic and environmental conditions can also be a factor in transportation
crashes. Supporting this idea (Lisa, David et al. 2005); Alister and Simon (2011) argued
that, Weather on roads can contribute to crashes: for example wet pavement reduces
friction and flowing or standing water greater than 1/8”deep can cause the vehicle to
hydroplane. Many several crashes have occurred during conditions of smoke or fog,
which can reduce visibility. Vehicles travelling at high rate of speed are unable to see
the slowing and or stopped vehicles in front of them which can lead in to multi –
vehicle pileup. Glare can reduce driver visibility especially on east – west road way
during the hours of sun rise and sun set. During foggy conditions glare off of street
lights and stop lights can also affect visibility. Wind gusts can affect vehicle stability.
Slippery road (due to weather), deposit on road, animal or object in carriageway, poor
or defective road surface, Inadequate or masked signs or road markings are also
responsible for the disaster caused by environmental characteristics to RTA.
2.4 Impacts of Road Traffic Accident
All countries in the world are currently affected by RTA. Although the effects of RTA
vary from one country to the other, from nation to nation, it should be every body’s
concern. Some of the major impacts of RTA discussed by different organizations and
scholars are conversed in the following sub-sections.
2.4.1 Economic Impact
Road traffic accidents are currently deteriorating the financial wealth of many nations.
In this regard, (WHO 2004); Naci, Chislom et al. (2008) urges that, in economic terms,
the cost of road crash injuries is estimated at roughly 1% of Gross National Product
(GNP) in low-income countries, 1.5% in middle-income countries and 2% in high-
income countries. The direct economic costs of global road crashes have been estimated
at US$ 518 billion, with the costs in low-income countries – estimated at US$ 65 billion –
exceeding the total annual amount received in development assistance. In addition to
this, in terms of regional disparities of cost of RTA Naci, Chislom et al. (2008) indicated
that, the economic cost of road crashes have been estimated to be as much as US$ 24.5
Billion in Asia, US$ 19 Billion in Latin America and Caribbean, US$ 9.9 Billion in
Central and East Europe, US$ 7.4 Billion in the Middle East and US$ 3.7 Billion in
Africa. When we come to Ethiopia, RTA’s economic impact is even worse. As far as the
economic impact of RTA in Ethiopia is concerned, Persson (2008) have discussed that,
the economic impact of RTAs is substantial for Ethiopians as the annual cost is
estimated to be around £40 million.
21
2.4.2 Social Impact
The RTA impacts are also shown with their influence on the social aspects of the
livelihood. To this regard, WHO (2004) claims that, over 50% of the global mortality due
to road traffic injury occurs among young adults aged between 15 and 44 years, and the
rates for this age group are higher in low-income and middle-income countries. In 2002,
males accounted for 73% of all road traffic deaths, with an overall rate almost three
times that for females: 27.6 per 100, 000 population and 10.4 per 100, 000 population,
correspondingly. Road traffic mortality rates are higher in men than in women in all
regions regardless of income level, and also across all age groups. On average, males in
the low-income and middle-income countries of the WHO Africa Region and the WHO
Eastern Mediterranean Region have the highest road traffic injury mortality rates
worldwide. The gender difference in mortality rates is probably related to both
exposure and risk-taking behavior. Morbidity rates for males are considerably higher
than those for females. Furthermore, about 60% of the Disability Adjusted Life Year
(DALY) lost globally as a result of road traffic injury occurs among adults aged between
15 and 44 years. Seemingly, WHO (2013) stipulates that, there are large disparities in
road traffic death rates between regions. The risk of dying as a result of a road traffic
injury is highest in the African Region (24.1 per 100, 000 population), and lowest in the
European Region (10.3 per 100, 000). Young adults aged between 15 and 44 years
account for 59% of global road traffic deaths. More than three-quarters (77%) of all road
traffic deaths occur among men. In an absolute similar manner Naci, Chislom et al.
(2008) supports this argument by stating that, Road crashes kill and maim the most
productive segments of the population; globally, in 1998, 51% of fatalities and 59% of
disability-adjusted life years lost as the result of road traffic injuries occurred in the
most productive age groups.
The report of WHO (2004) added that people with road traffic injuries accounted for
13-31% of all injury-related attendees and 48% of bed occupancy in surgical wards and
were the most frequent users of operating theatres and intensive care units. The
increased work load in radiology departments and increased demand for
physiotherapy and rehabilitation services were largely attributed to road traffic injuries.
Regardless of the costs of healthcare and rehabilitation, injured people bear additional
costs. Permanent disability, such as paraplegia, quadriplegia, loss of eye sight or brain
damage, can deprive an individual the ability to achieve even minor goals and can
result in dependence on others for financial support and routine physical care. Less
serious injuries can result in chronic physical pain and limit the injured person’s
physical activity for lengthy periods. Serious burns, contusions or lacerations can lead
to emotional trauma associated with permanent disfigurement.
22
WHO (2009) states that, over 90% of the world’s fatalities on the roads occur in low and
middle income countries, although these countries only have about 48% of the world’s
registered vehicles. The WHO anticipates, unless immediate action is taken, that over
the next 15 years, the number of people dying annually in the road traffic crashes may
rise to 2.4 million. This report also urges that, given these numbers, road traffic injuries
have to be seen in low and middle income countries as one of the most important health
problems along with diseases such diarrhea, malaria, HIV/AIDS and tuberculosis.
2.5 Black Spots of Road Traffic Accident
2.5.1 Black Spot Definition
Black spot areas in RTA are defined in different ways by different scholars. From the
perspective of Rokytova (2000) black spots are defined as locations that are generally
classified after an assessment of the level of risk and the likelihood of a crash occurring
at a location. Black spot safety work can be designated as the task of improving road
safety through variations of the geometrical and environmental characteristics of the
problematic sites in the existing road network. In towns and cities, there is a tendency
for traffic accidents to cluster at specific places, often at intersections. A concentration of
accidents at a specific spot may partly be due to inappropriate road design or
inappropriate traffic control at that place. In such cases, the clustering of accidents can
be avoided or reduced by improving road design or traffic control.
In another words, accident black spot on a National Highway in Norway is defined as
any place with a maximum length of 100 meters, where at least four injury accidents
have been testified to the police in a four year period (Elvic, Runee et al. 2005). Thus, a
black spot in the UK may well have only five injury accidents in three years, whereas a
city in Bangladesh may have black spot defined as having more than 10 injury accidents
in a year (Geurts and Wets 2003). In most developed states, black spots are defined as
the locations where there are 12 accidents in 3 years per 0.3 kilometers (Guo, Gao et al.
2003). In Czech Republic, the black spot criterion is that junctions or 250m long road
sections that are considered as black spots on condition that at least 3 road accidents
with injuries occurred within 1 year or at least 3 road accidents with injuries of the same
type occurred within 3 years or at least 5 road accidents of the same type occurred
within 1 year (Rokytova 2000). Study on single carriage way trunk road Walmsley,
Summersgill et al. (1998) revealed that the criterion used to delineate road sections for
accident analysis are age of opening, carriageway width, curbs, hard strips, and speed
of the road section.
23
Elvic, Runee et al. (2005) points out black spots on national highways in Norway have
heavy traffic but do not have particularly high accident rates when compared with
places which are not classified as accident black spots. Ranking of black-spots were
done with various alternatives. Jonnessen and Sakshaug (2006) show three alternative
methods of ranking black spots. These are number of accident with personal injury or
serious personal injury, accident rates (accident per million vehicle kilometer) and
potential for accident reduction. In addition to this, Lisa, David et al. (2005) stated that
Black spot areas are sites that have had more than one fatal crash, sites with multiple
crashes within a mile from one another.
2.5.2 Black Spot Analysis
Road crash black spot analysis has been widely examined in the academic press, and
various types of methods for identifying unsafe locations have been developed. Simple
methods for identifying unsafe locations, where the number of crashes or the crash rate
per unit exposure exceeds a given threshold, are routine and straightforward (Taylor,
Bonsall et al. 2000). Austroads (1988) describes another method that uses critical crash
rates to determine whether the crash record of each location is significantly greater than
the system wide average. Another statistical models, such as the empirical Bayes
method, include developing a statistical model based on the reference population and
comparing the expected number of crashes with the observed number (Elvic and Runee
2008; Li and Zhang 2008). Not only crash rates, but unsafe locations can be ranked
according to their severity. Geurts, Wets et al. (2004) use the values of 1, 3, and 5 as the
weights for a light, serious, or fatal casualty of a crash. Likewise, ranking methods also
are made of a severity index, which is computed based on weights of 3.0 for fatal
crashes, 1.8 for serious injury, 1.3 for other injury, and 1.0 for property damage only
crashes (RoTA 1994). In addition to these individual ranking methods, other composite
methods that consider more than one factor at a time are also used. For instance,
Vasudevan, Pulugurtha et al. (2007) use the average of the ranks according to
frequency, weighted factor, pedestrian exposure, and traffic volume for ranking
pedestrian hazardous locations. However, these methods, along with other traditional
methods, focus on road segments or specific locations and thus produce results that are
partially dependent on the length of road segment (Thomas 1996) and might not be able
to capture area wide crash hot spots (Anderson 2009).
Various methods for studying spatial patterns of crash data as point events have
recently been developed. One of the most widely used is Kernel Density Estimation
(KDE). Many recent studies use planar KDE for hot spot analysis, such as the study of
high pedestrian crash zones (Vasudevan, Pulugurtha et al. 2007) road crash hot spots
24
(Anderson 2009), and highway crash hot spots (Erdogan 2009). The goal of planar KDE
is to develop a continuous surface of density estimates of discrete events such as road
crashes by summing the number of events within a search bandwidth. However, planar
KDE has been challenged in relation to the fact that road crashes usually happen on the
roads and inside road networks that are portions of two-dimensional space. Road
crashes are, therefore, needed to be considered in a network space, a simplification of
the road network represented by one-dimensional lines. Numerous studies have
extended the KDE to network spaces, which estimates the density over a distance unit
instead of an area unit (Yamada and Thill 2004; Xie and Yan 2008). Neither planar or
network KDE can be tested for statistical significance; this is a major weakness of these
methods (Xie and Yan 2008; Anderson 2009).
2.6 Road Traffic Accident in Ethiopia
Most of the road deaths in developing countries involve vulnerable road users such as
pedestrians and cyclists. In Ethiopia, pedestrian injuries account for 84% of all road
traffic fatalities compared with 32% in Britain and 15% in the United States of America.
In contrary, in the heavily motorized countries, drivers and passengers account for the
majority of road deaths involving children (Bunn, Collier et al. 2003). Similarly,
Mekonnen (2007) quoted that, RTA in Ethiopia is a serious problem. The RTA death
rate is estimated to be 130 per 10,000 vehicles. Of the total victims of RTA who lost their
lives, over half are pedestrians, out of whom 30% are children. In Ethiopia, one among
five people injured dies due to RTA. Based on a five-year average records, of the
personal injury accidents, 81% are caused due to drivers error, 5% due to vehicle defect,
4% due to pedestrian error, 1% due to road defects and 9% due to other problems in
Ethiopia. Studies further shows that the professional drivers are involved in 88% of the
fatal accidents. Special purpose vehicles and motor bicycles cause 8% of such accidents.
On the other hand, automobile drivers have very good safety records with only 4% of
the fatal accidents, which is equivalent to a rate of 12 fatal accidents per 10,000 vehicles.
Conferring the National Road Safety Coordination Office of Ethiopia, the main
underlying reasons for the frequent RTA occurrences and severe impacts of RTA in
Ethiopia are Improper behavior or lower skill of drivers, Poor vehicle technical
conditions, Animals and carts using the highways, Pedestrians not taking proper
precautions, Poor traffic law enforcement, Poor emergency medical services and
Insufficient safety considerations given in road development.
25
In addition to this Segni (2007) added another responsible reasons of RTA occurrences
in Ethiopia like driving without respecting right-hand rule, failure to give way for
vehicles and pedestrians, overtaking in snaky horizontal curves, following too close to
the vehicle in front, improper turning and speeding. These causes contribute to 73% of
the total accident in the year 2004/05 in Ethiopia but the other possible reasons
accounted for less than 27%.
It would be impossible to attach a value to each case of human sacrifice and anguish,
add up the values and result a figure that captures the national social cost of road
crashes and wounds. Conversely, the economic expenses of road traffic accidents are,
obviously, a heavy burden for the national economy. In addition to this UN (2009)
added that the economic costs of road crashes and injuries are estimated to be 1% of
Gross Domestic Product (GDP) in low-income countries such as Ethiopia.
In another stance , Mohammed (2011) Put his findings of the cost of RTA in Ethiopia on
the basis of the Ethiopia’s data and economic figure of 2009/10, as the cost of damage
only, slight, serious and fatal road traffic crashes were 327.12 million, 204.65 million,
619.38 million, and 716.02 million ETB respectively. This represents the total national
economic loss resulting from road accidents to be estimated as ETB 1.867 Billion which
is equivalent to 145.07 million United States Dollar (USD) considering the exchange rate
of the same year, or approximately 0.49% of the GDP of the country in the same year.
Another study conducted by Ethiopian Roads Authority stated that, RTA costs
Ethiopian economy between 350 - 430 million Birr annually, and loses almost 1860 lives
each year with another 8,690 people reported injured (CSA 2007).
2.6.1 Road Traffic Accident Reporting System in Ethiopia
As stated by UN (2009), similar to most countries of the world, police is responsible for
traffic accident investigation and reporting in Ethiopia. According to the Ethiopian
transport regulation (Negarit Gazeta, 1963, which is still in use with amendments), a
driver of a vehicle involved in a road accident shall notify the nearest police station
immediately if the accident involves personal injury and within twenty-four hours if it
involves property damage only. According to the regulation, all accidents are
reportable. In practice, however, the police are notified only when the accident involves
serious injury, agreement cannot be reached between parties involved or if police
accident report is required for insurance. Because of this, the reporting of nonfatal
accidents is uncertain. Thus, the under-reporting of road accidents in Ethiopia is
expected to be quite considerable.
26
Normally, in response to notification of an accident, a traffic police investigator attends
the scene of the accident. Based on the information obtained from observations, the
parties involved in the accident, and other evidences, police prepares a factual report
and makes the sketch of the site on a plain sheet of paper. The police, who are
inadequately equipped and trained, understandably, primarily see their role to take
action if the law has been broken and give much attention to get evidence for
prosecution rather than to investigate the many factors involved in the accident.
On return from the accident site, an account of the accident is recorded in a daily report
book at a local police station or traffic office. The accident recordings in the daily
recording book form the basis of the Ethiopian road accident statistics. Periodic
summaries of aggregate road accident records are made and sent to the immediate
higher police department. They finally reach the Federal Police where the national road
accident statistics are compiled.
The content of the road accident reporting, as it exists now, misses relevant details of an
accident report required for any road safety improvement works. The reporting form, in
the daily report book, is not designed to include details of each vehicle and road user
involved in an accident. The report, further, does not contain details of the road section
and precise location of an accident. The location of an accident is usually reported
broadly by “Kebelle and Wereda” or the name of the surroundings. Besides, because a
plain paper is used on the spot, the investigating policeman is unlikely to remember the
required accident details and as a result the form available at the local traffic police
office is never completely filled.
The information recorded could generally be adequate for the police work, but it is of
limited use to other bodies requiring information for identifying the causes and
appropriate remedial measures. It is primarily inadequate in determining the location
of accidents and the factors involved. Moreover, accident reporting lacks a significant
level of consistency. Terminology of accident details does not have a uniform definition
even among the staff members at a police station. There also exists a significant
variation in accident reporting in different regional states.
In addition to the indicated limitations of accident reporting, there is no established
system of computerized accident data bank to store detailed information on individual
road traffic accidents occurring in the country. This is another handicap for the efficient
management of the reported traffic accident data. Moreover, there is no system of
periodic road traffic accident analysis and dissemination system to give information on
road traffic accident trends, specific accident problems so that stakeholders are aware
and aim to improve the situation.

27
The accident statistics, although not complete and with all sorts of limitations, can,
however, be used by interested stakeholders to make a broad accident analysis for
various purposes. Moreover, the existing data can be used to create awareness and
define policy and mobilize human and financial resources towards alleviating the
problem.
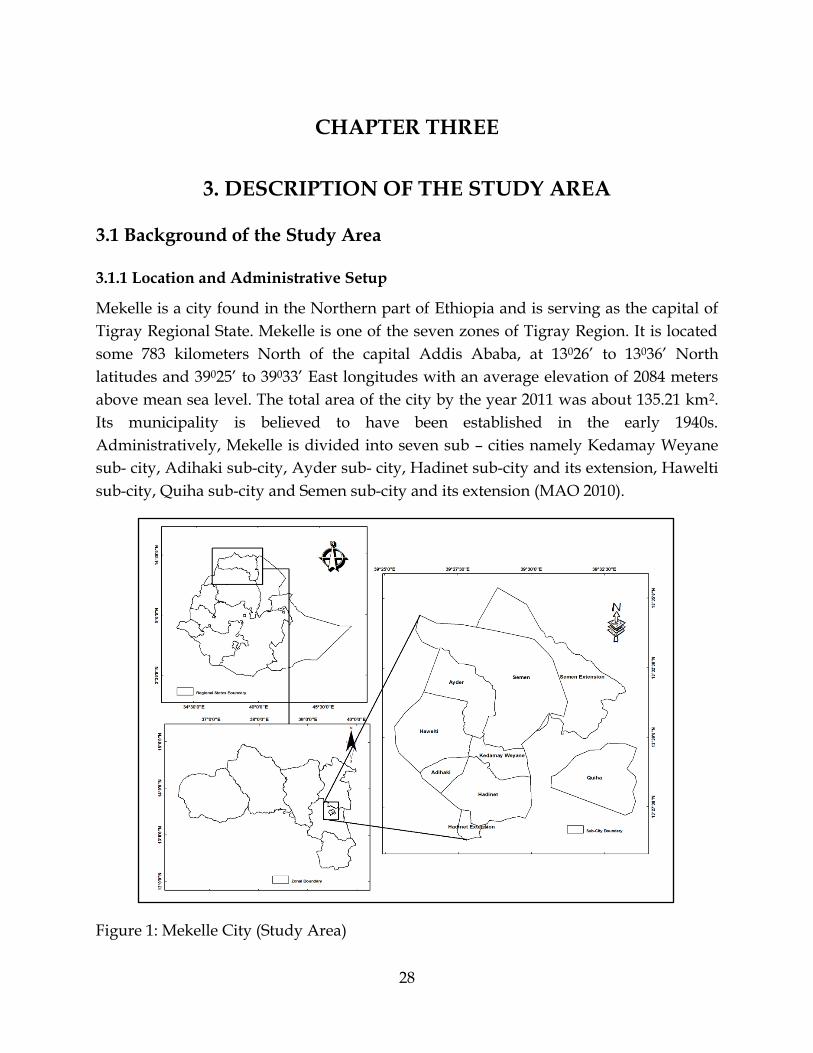
28
CHAPTER THREE
3. DESCRIPTION OF THE STUDY AREA
3.1 Background of the Study Area
3.1.1 Location and Administrative Setup
Mekelle is a city found in the Northern part of Ethiopia and is serving as the capital of
Tigray Regional State. Mekelle is one of the seven zones of Tigray Region. It is located
some 783 kilometers North of the capital Addis Ababa, at 13026’ to 13036’ North
latitudes and 39025’ to 39033’ East longitudes with an average elevation of 2084 meters
above mean sea level. The total area of the city by the year 2011 was about 135.21 km2.
Its municipality is believed to have been established in the early 1940s.
Administratively, Mekelle is divided into seven sub – cities namely Kedamay Weyane
sub- city, Adihaki sub-city, Ayder sub- city, Hadinet sub-city and its extension, Hawelti
sub-city, Quiha sub-city and Semen sub-city and its extension (MAO 2010).
Figure 1: Mekelle City (Study Area)
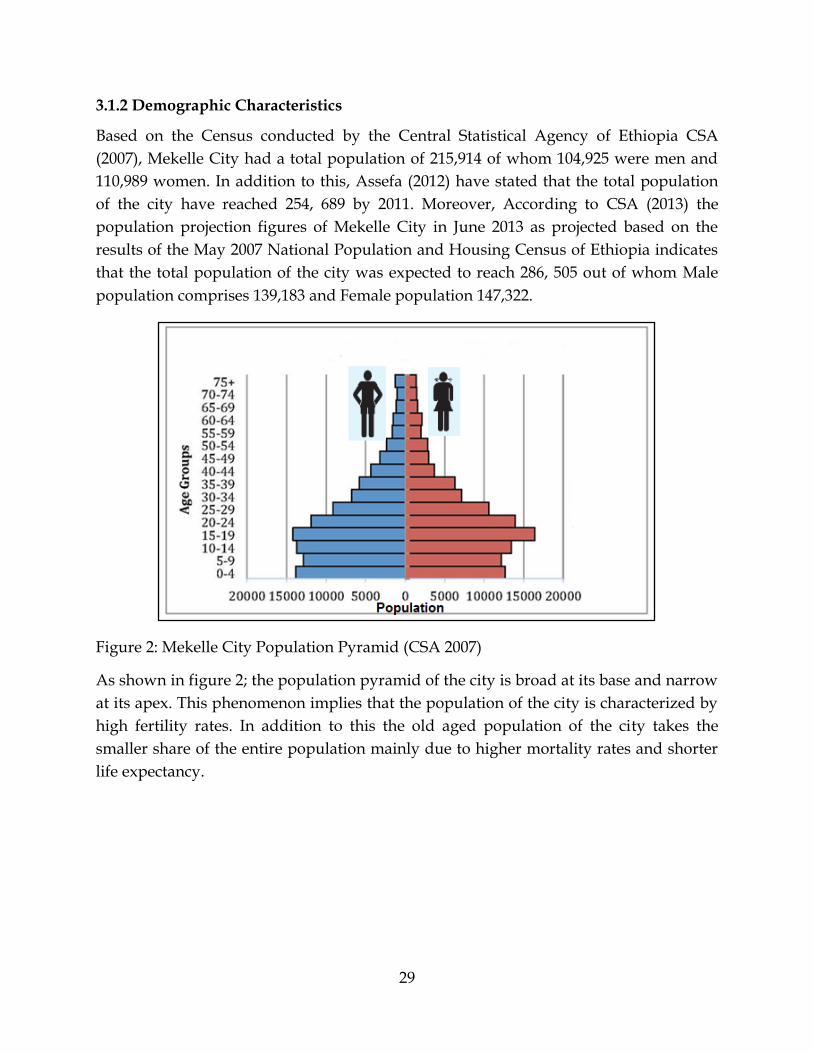
29
3.1.2 Demographic Characteristics
Based on the Census conducted by the Central Statistical Agency of Ethiopia CSA
(2007), Mekelle City had a total population of 215,914 of whom 104,925 were men and
110,989 women. In addition to this, Assefa (2012) have stated that the total population
of the city have reached 254, 689 by 2011. Moreover, According to CSA (2013) the
population projection figures of Mekelle City in June 2013 as projected based on the
results of the May 2007 National Population and Housing Census of Ethiopia indicates
that the total population of the city was expected to reach 286, 505 out of whom Male
population comprises 139,183 and Female population 147,322.
Figure 2: Mekelle City Population Pyramid (CSA 2007)
As shown in figure 2; the population pyramid of the city is broad at its base and narrow
at its apex. This phenomenon implies that the population of the city is characterized by
high fertility rates. In addition to this the old aged population of the city takes the
smaller share of the entire population mainly due to higher mortality rates and shorter
life expectancy.
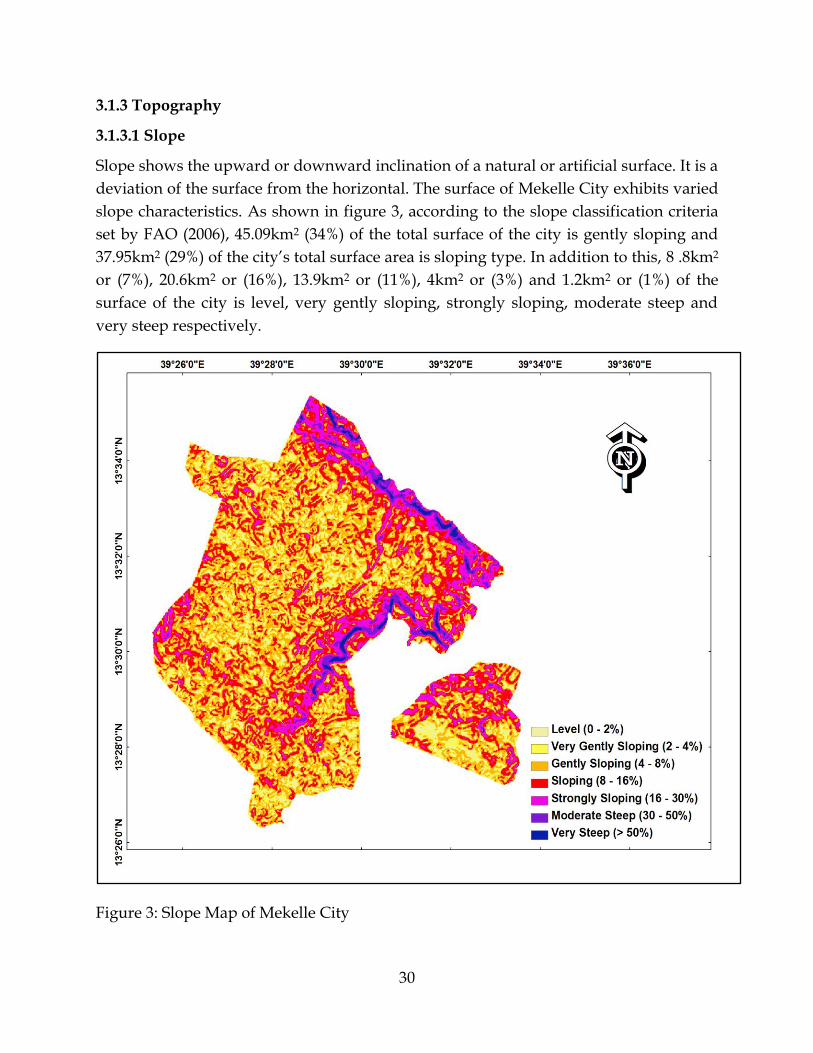
30
3.1.3 Topography
3.1.3.1 Slope
Slope shows the upward or downward inclination of a natural or artificial surface. It is a
deviation of the surface from the horizontal. The surface of Mekelle City exhibits varied
slope characteristics. As shown in figure 3, according to the slope classification criteria
set by FAO (2006), 45.09km2 (34%) of the total surface of the city is gently sloping and
37.95km2 (29%) of the city’s total surface area is sloping type. In addition to this, 8 .8km2
or (7%), 20.6km2 or (16%), 13.9km2 or (11%), 4km2 or (3%) and 1.2km2 or (1%) of the
surface of the city is level, very gently sloping, strongly sloping, moderate steep and
very steep respectively.
Figure 3: Slope Map of Mekelle City
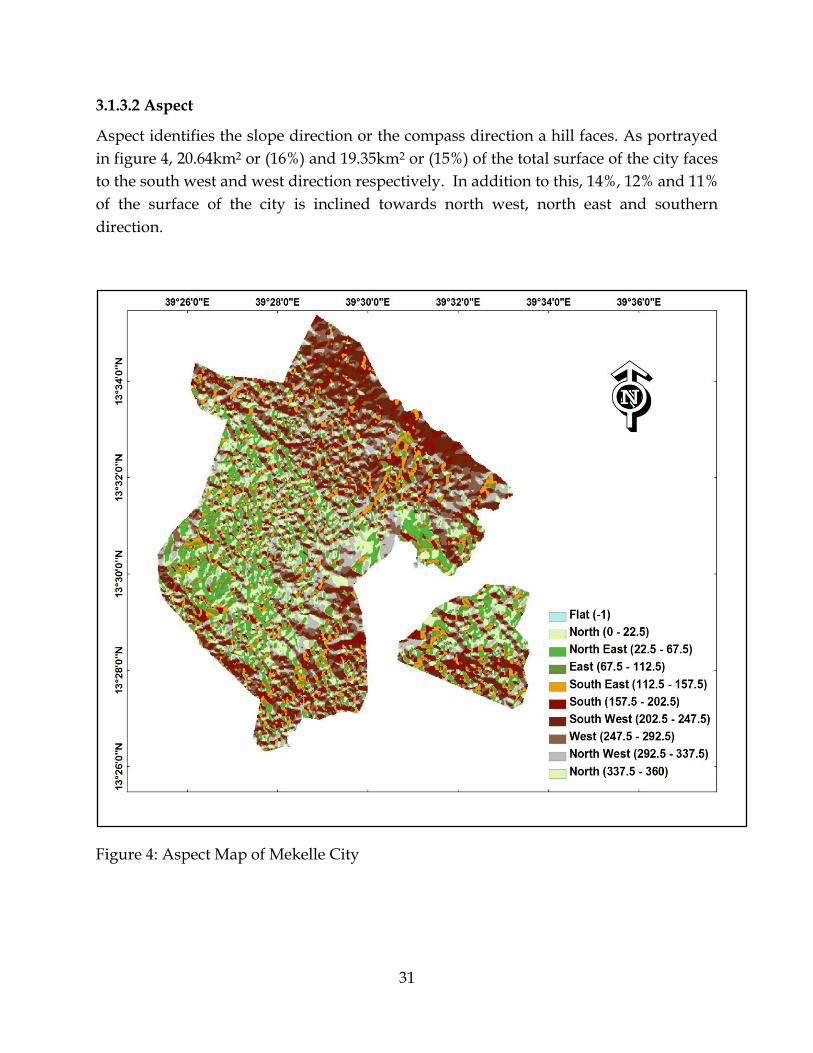
31
3.1.3.2 Aspect
Aspect identifies the slope direction or the compass direction a hill faces. As portrayed
in figure 4, 20.64km2 or (16%) and 19.35km2 or (15%) of the total surface of the city faces
to the south west and west direction respectively. In addition to this, 14%, 12% and 11%
of the surface of the city is inclined towards north west, north east and southern
direction.
Figure 4: Aspect Map of Mekelle City
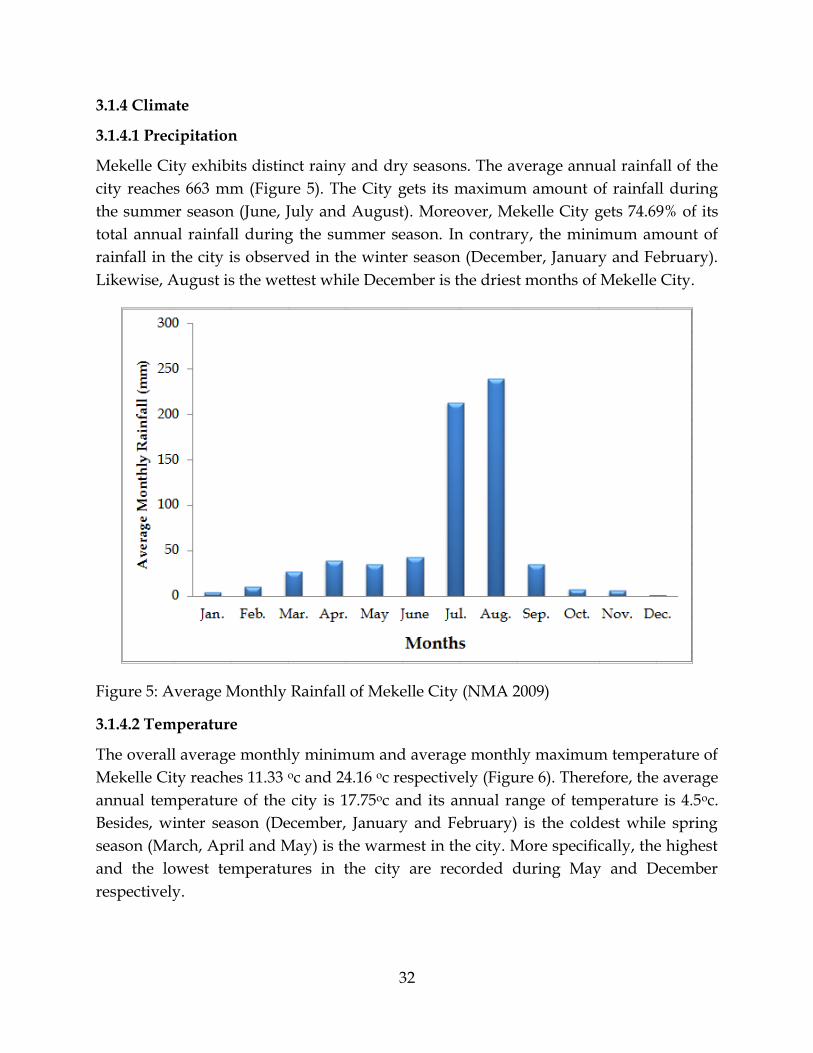
32
3.1.4 Climate
3.1.4.1 Precipitation
Mekelle City exhibits distinct rainy and dry seasons. The average annual rainfall of the
city reaches 663 mm (Figure 5). The City gets its maximum amount of rainfall during
the summer season (June, July and August). Moreover, Mekelle City gets 74.69% of its
total annual rainfall during the summer season. In contrary, the minimum amount of
rainfall in the city is observed in the winter season (December, January and February).
Likewise, August is the wettest while December is the driest months of Mekelle City.
Figure 5: Average Monthly Rainfall of Mekelle City (NMA 2009)
3.1.4.2 Temperature
The overall average monthly minimum and average monthly maximum temperature of
Mekelle City reaches 11.33 oc and 24.16 oc respectively (Figure 6). Therefore, the average
annual temperature of the city is 17.75oc and its annual range of temperature is 4.5oc.
Besides, winter season (December, January and February) is the coldest while spring
season (March, April and May) is the warmest in the city. More specifically, the highest
and the lowest temperatures in the city are recorded during May and December
respectively.
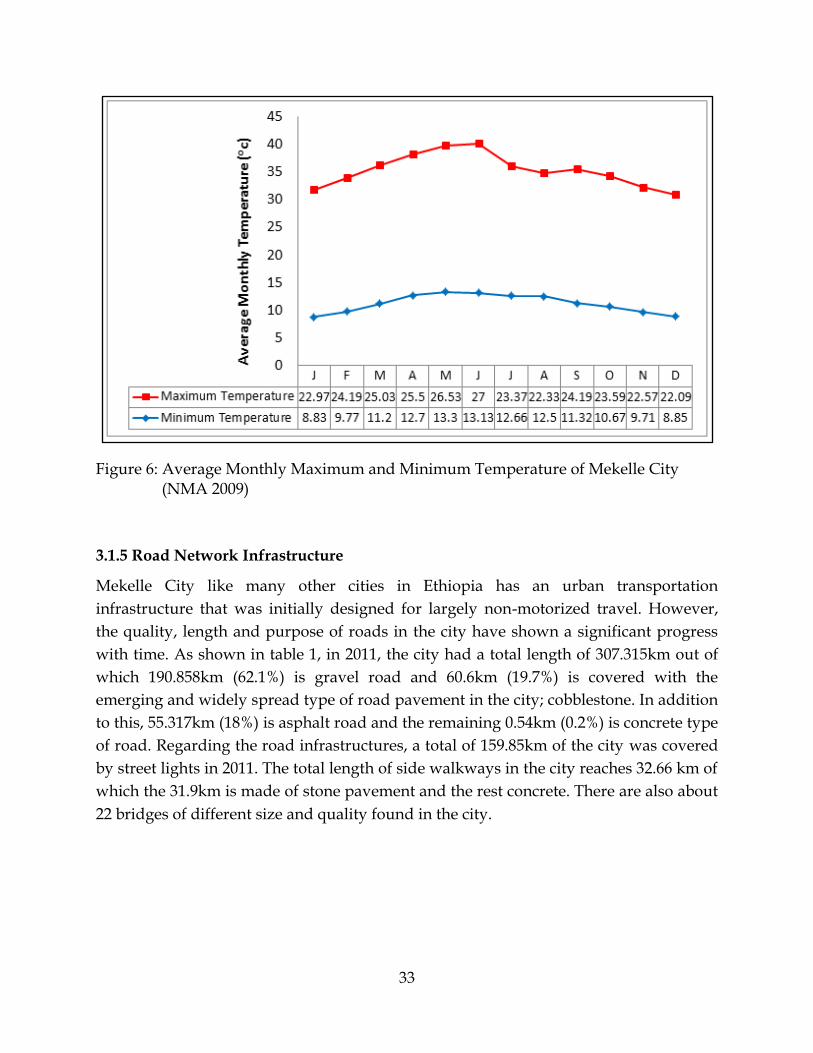
33
Figure 6: Average Monthly Maximum and Minimum Temperature of Mekelle City (NMA 2009)
3.1.5 Road Network Infrastructure
Mekelle City like many other cities in Ethiopia has an urban transportation
infrastructure that was initially designed for largely non-motorized travel. However,
the quality, length and purpose of roads in the city have shown a significant progress
with time. As shown in table 1, in 2011, the city had a total length of 307.315km out of
which 190.858km (62.1%) is gravel road and 60.6km (19.7%) is covered with the
emerging and widely spread type of road pavement in the city; cobblestone. In addition
to this, 55.317km (18%) is asphalt road and the remaining 0.54km (0.2%) is concrete type
of road. Regarding the road infrastructures, a total of 159.85km of the city was covered
by street lights in 2011. The total length of side walkways in the city reaches 32.66 km of
which the 31.9km is made of stone pavement and the rest concrete. There are also about
22 bridges of different size and quality found in the city.
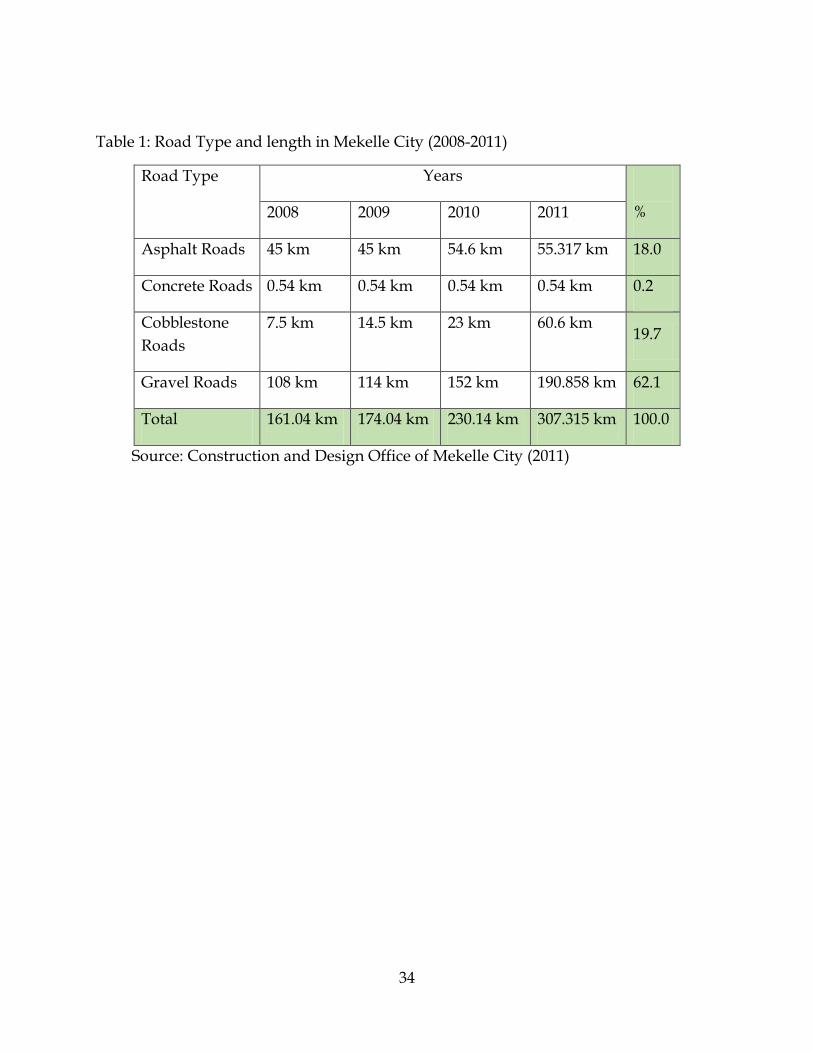
34
Table 1: Road Type and length in Mekelle City (2008-2011)
Road Type
Years
% 2008 2009 2010 2011
Asphalt Roads 45 km 45 km 54.6 km 55.317 km 18.0
Concrete Roads 0.54 km 0.54 km 0.54 km 0.54 km 0.2
Cobblestone
Roads
7.5 km 14.5 km 23 km 60.6 km 19.7
Gravel Roads 108 km 114 km 152 km 190.858 km 62.1
Total 161.04 km 174.04 km 230.14 km 307.315 km 100.0
Source: Construction and Design Office of Mekelle City (2011)
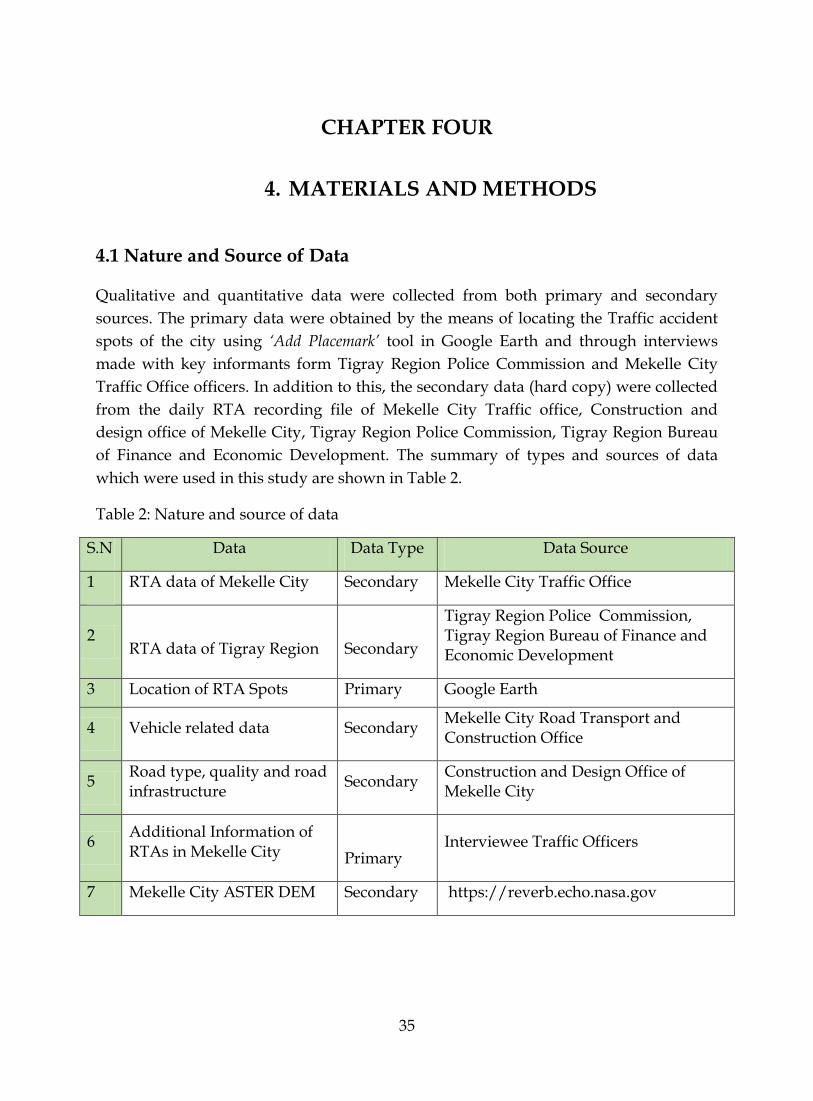
35
CHAPTER FOUR
4. MATERIALS AND METHODS
4.1 Nature and Source of Data
Qualitative and quantitative data were collected from both primary and secondary
sources. The primary data were obtained by the means of locating the Traffic accident
spots of the city using ‘Add Placemark’ tool in Google Earth and through interviews
made with key informants form Tigray Region Police Commission and Mekelle City
Traffic Office officers. In addition to this, the secondary data (hard copy) were collected
from the daily RTA recording file of Mekelle City Traffic office, Construction and
design office of Mekelle City, Tigray Region Police Commission, Tigray Region Bureau
of Finance and Economic Development. The summary of types and sources of data
which were used in this study are shown in Table 2.
Table 2: Nature and source of data
S.N Data Data Type Data Source
1 RTA data of Mekelle City Secondary Mekelle City Traffic Office
2
RTA data of Tigray Region
Secondary
Tigray Region Police Commission, Tigray Region Bureau of Finance and Economic Development
3 Location of RTA Spots Primary Google Earth
4 Vehicle related data Secondary Mekelle City Road Transport and Construction Office
5 Road type, quality and road infrastructure
Secondary Construction and Design Office of Mekelle City
6 Additional Information of RTAs in Mekelle City
Primary Interviewee Traffic Officers
7 Mekelle City ASTER DEM Secondary https://reverb.echo.nasa.gov
36
4.2 Data Collection Methods and Procedure
The RTA data of Mekelle City from 2008 to 2011 were collected from the daily RTA
records file of Mekelle City Traffic Office. Data collection format was prepared in excel
document format which enables us to collect, filter and edit the required variables for
the study. The main RTA input data sets collected from the daily RTA records file of
Mekelle City Traffic Office includes the following variables.
Accident date
Accident month
Accident place or accident location
Accident reason
Accident time in military time format
Accident type
Accident year
Driver – vehicle relation
Driver’s age in years
Driver’s driving experience in years
Driver’s sex
Estimated accident cost in ETB
Road divide type
Road pavement
Road moisture in the time of accident
Vehicle service age in years
Vehicle type
Weather condition in the time of accident
The service year of vehicles is determined using vehicles model and using the time the
vehicles registered in the road transport office. The price of property damages is
estimated by technical professionals and insurance companies in reference to the price
of damaged properties in the time of the accident.
In order to ease the analysis of the data and to locate the RTA Spots in Google Earth, all
RTA Spots of the city were assigned with a special code. Following the data filter,
editing and data coding procedures, four years RTA database of the city was made in
an Excel format. The data base consists of the RTA records of 1275 RTA incidences of
Mekelle City from 2008 to 2011. The locations of known RTA Spots of the city in the last
four years were collected from the Google Earth through ‘Add Placemark’ tool using the
special code given to the RTA spots.
37
4.3 Data Preparation
After adding the location of RTA places in Google Earth as point data, it was converted
in to shape file using ArcGIS 9 software by uploading via DNRGPS 6.0.0.8 Application
software. The four years RTA data which was arranged in Excel format was again
filtered and rearranged using Pivot table for further application and was saved as CSV
(comma delimited) (*.csv) format. After this procedure, the total RTA data was linked to
the aforementioned shape file in to the ArcMap using the ‘Joins and relates’ function. The
‘clip’ function from the ‘Analysis tools’ was manipulated to pin sub-cities from Mekelle
City administration map shape file so as to know the number of RTA Spots included in
each sub-city in each year. Using input data like RTA Spot special codes, RTA Spot code
count, RTA Spot name, RTA year and Mekelle sub-city boundary shape file; spatial
RTA point maps of RTA Spots and RTA Black spots of each year and spatio-temporal
RTA Black Spot maps were prepared for analysis.
4.4 Data Processing, Presentation and Analysis
The RTA Data collected from Mekelle City Traffic Office were processed using
descriptive statistics like crosstabs, frequencies, averages, totals and percentages in the
Statistical Package for the Social Sciences (SPSS) version 19 software. Accordingly, the
data was organized and presented in the form of tables, pie charts, column bar charts
and line graphs. The difference and trend in the frequency of RTAs was presented on
maps using graduated symbols and bar charts.
Analysis of the data was basically made in five sections. The first part tried to analyze
the general characteristics of RTAs in Mekelle City using the collected 1275 RTA
incidences of the city in the last four years. The second part conversed about the spatio-
temporal variation and distribution of RTAs across the city in general and amongst the
sub-cities in particular. Spatio-temporal maps of RTA Spots and RTA Black Spots of
Mekelle City were generated using the spatially referenced 1161 known places for RTA
incidences out of the total 1275. This is because the name of the places of the remaining
114 RTA incidences of the city of the last four years was not specified in the daily RTA
records of Mekelle City Traffic Office. The third part discussed about the trend of
occurrence of RTAs in the whole city in general and in the RTA Black Spots in
particular. The fourth part specified the major causes and the last about socio-economic
impacts of RTA in Mekelle City. The RTA data of Mekelle City from 2003 to 2007 was
also used so as to analyze the frequency, trend and socio-economic impact of road
crashes comparing to the RTA occurrences in the city between 2008 and 2011. The
information gathered from the key informants was analyzed in line with each
associated characteristics of RTA of the city.
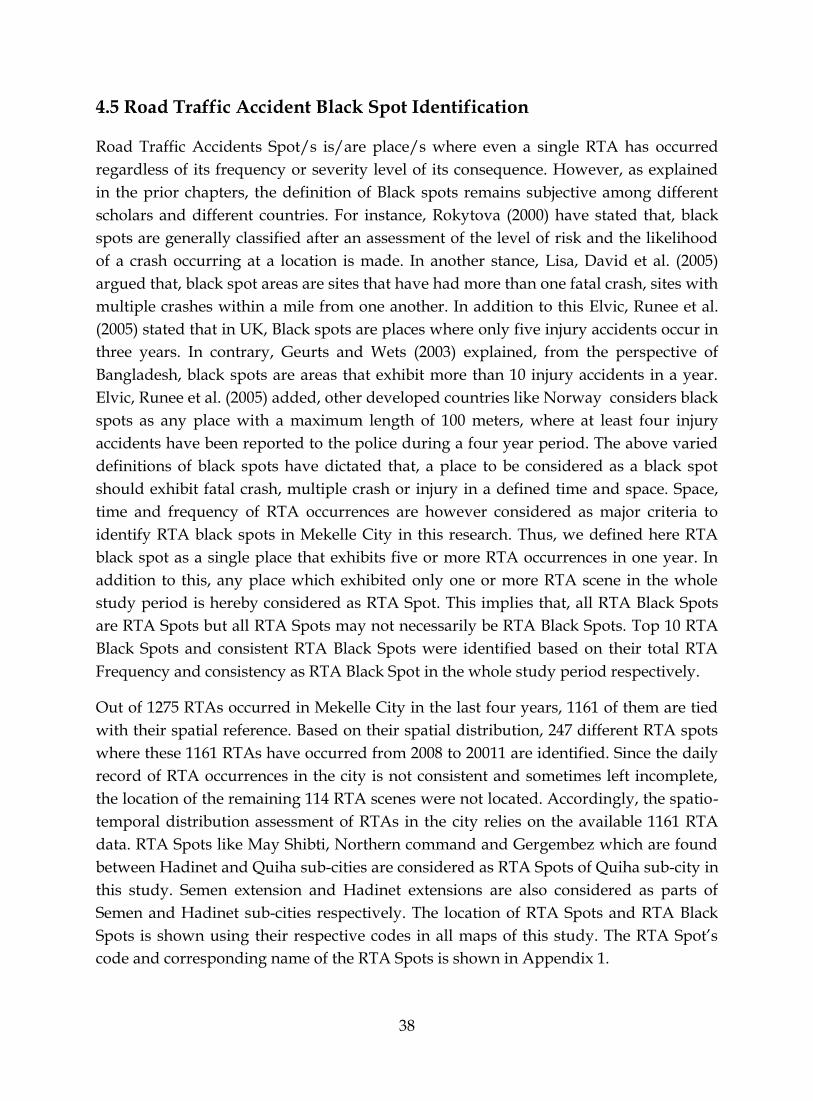
38
4.5 Road Traffic Accident Black Spot Identification
Road Traffic Accidents Spot/s is/are place/s where even a single RTA has occurred
regardless of its frequency or severity level of its consequence. However, as explained
in the prior chapters, the definition of Black spots remains subjective among different
scholars and different countries. For instance, Rokytova (2000) have stated that, black
spots are generally classified after an assessment of the level of risk and the likelihood
of a crash occurring at a location is made. In another stance, Lisa, David et al. (2005)
argued that, black spot areas are sites that have had more than one fatal crash, sites with
multiple crashes within a mile from one another. In addition to this Elvic, Runee et al.
(2005) stated that in UK, Black spots are places where only five injury accidents occur in
three years. In contrary, Geurts and Wets (2003) explained, from the perspective of
Bangladesh, black spots are areas that exhibit more than 10 injury accidents in a year.
Elvic, Runee et al. (2005) added, other developed countries like Norway considers black
spots as any place with a maximum length of 100 meters, where at least four injury
accidents have been reported to the police during a four year period. The above varied
definitions of black spots have dictated that, a place to be considered as a black spot
should exhibit fatal crash, multiple crash or injury in a defined time and space. Space,
time and frequency of RTA occurrences are however considered as major criteria to
identify RTA black spots in Mekelle City in this research. Thus, we defined here RTA
black spot as a single place that exhibits five or more RTA occurrences in one year. In
addition to this, any place which exhibited only one or more RTA scene in the whole
study period is hereby considered as RTA Spot. This implies that, all RTA Black Spots
are RTA Spots but all RTA Spots may not necessarily be RTA Black Spots. Top 10 RTA
Black Spots and consistent RTA Black Spots were identified based on their total RTA
Frequency and consistency as RTA Black Spot in the whole study period respectively.
Out of 1275 RTAs occurred in Mekelle City in the last four years, 1161 of them are tied
with their spatial reference. Based on their spatial distribution, 247 different RTA spots
where these 1161 RTAs have occurred from 2008 to 20011 are identified. Since the daily
record of RTA occurrences in the city is not consistent and sometimes left incomplete,
the location of the remaining 114 RTA scenes were not located. Accordingly, the spatio-
temporal distribution assessment of RTAs in the city relies on the available 1161 RTA
data. RTA Spots like May Shibti, Northern command and Gergembez which are found
between Hadinet and Quiha sub-cities are considered as RTA Spots of Quiha sub-city in
this study. Semen extension and Hadinet extensions are also considered as parts of
Semen and Hadinet sub-cities respectively. The location of RTA Spots and RTA Black
Spots is shown using their respective codes in all maps of this study. The RTA Spot’s
code and corresponding name of the RTA Spots is shown in Appendix 1.
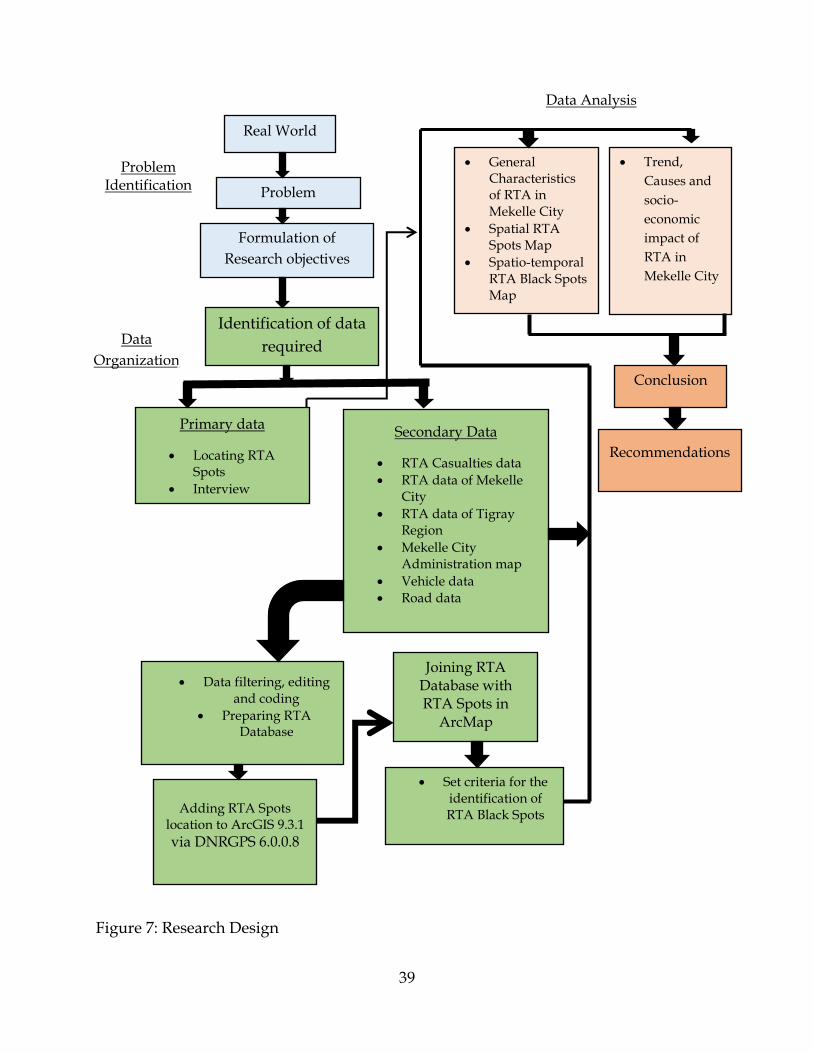
39
Figure 7: Research Design
Data Analysis
Data
Organization
Real World
Formulation of
Research objectives
Identification of data
required
Problem
Definition
Joining RTA Database with RTA Spots in
ArcMap
Data filtering, editing and coding
Preparing RTA Database
Secondary Data
RTA Casualties data
RTA data of Mekelle City
RTA data of Tigray Region
Mekelle City Administration map
Vehicle data
Road data
Primary data
Locating RTA Spots
Interview
Adding RTA Spots location to ArcGIS 9.3.1
via DNRGPS 6.0.0.8
Set criteria for the identification of RTA Black Spots
General Characteristics of RTA in Mekelle City
Spatial RTA Spots Map
Spatio-temporal RTA Black Spots Map
Trend,
Causes and
socio-
economic
impact of
RTA in
Mekelle City
Conclusion
Recommendations
Problem Identification
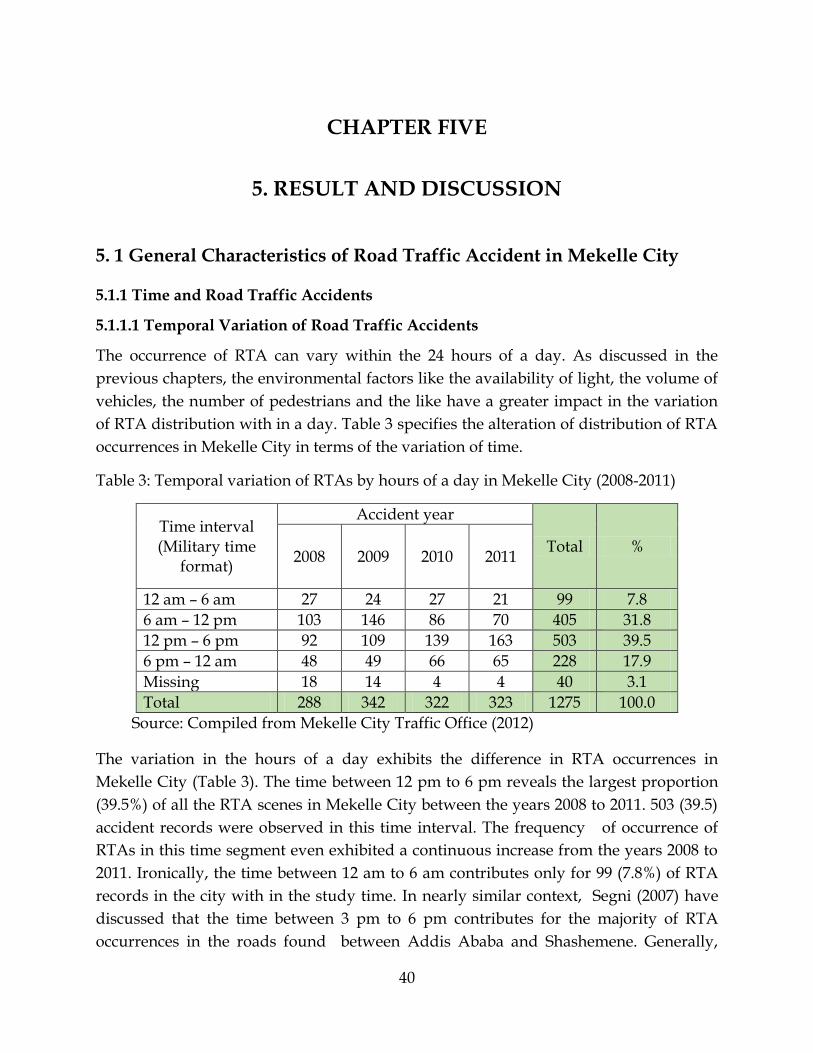
40
CHAPTER FIVE
5. RESULT AND DISCUSSION
5. 1 General Characteristics of Road Traffic Accident in Mekelle City
5.1.1 Time and Road Traffic Accidents
5.1.1.1 Temporal Variation of Road Traffic Accidents
The occurrence of RTA can vary within the 24 hours of a day. As discussed in the
previous chapters, the environmental factors like the availability of light, the volume of
vehicles, the number of pedestrians and the like have a greater impact in the variation
of RTA distribution with in a day. Table 3 specifies the alteration of distribution of RTA
occurrences in Mekelle City in terms of the variation of time.
Table 3: Temporal variation of RTAs by hours of a day in Mekelle City (2008-2011)
Time interval (Military time
format)
Accident year
Total % 2008 2009 2010 2011
12 am – 6 am 27 24 27 21 99 7.8
6 am – 12 pm 103 146 86 70 405 31.8
12 pm – 6 pm 92 109 139 163 503 39.5
6 pm – 12 am 48 49 66 65 228 17.9
Missing 18 14 4 4 40 3.1
Total 288 342 322 323 1275 100.0
Source: Compiled from Mekelle City Traffic Office (2012)
The variation in the hours of a day exhibits the difference in RTA occurrences in
Mekelle City (Table 3). The time between 12 pm to 6 pm reveals the largest proportion
(39.5%) of all the RTA scenes in Mekelle City between the years 2008 to 2011. 503 (39.5)
accident records were observed in this time interval. The frequency of occurrence of
RTAs in this time segment even exhibited a continuous increase from the years 2008 to
2011. Ironically, the time between 12 am to 6 am contributes only for 99 (7.8%) of RTA
records in the city with in the study time. In nearly similar context, Segni (2007) have
discussed that the time between 3 pm to 6 pm contributes for the majority of RTA
occurrences in the roads found between Addis Ababa and Shashemene. Generally,
41
RTAs in Mekelle City are frequently observed in the day time than in the night time
between 6 am to 6 pm. About 908 (71.21%) of all the accidents recorded in the study
period have been observed in the day time. The rest 327 (25.64%) RTA incidences have
been recorded in the night time between 6 pm to 6 am. This means, driving or travelling
on the roads of Mekelle City between 12 pm to 6 pm is five times more precarious for
being engaged in RTAs than driving or travelling between 12 am to 6 am. This
phenomenon is evident mainly due to the fact that the movement and volume of
vehicles and pedestrians is more in the day time than in the night time. This result is
different from Bahir Dar City. Addis (2003) stated that about 51% RTAs in Bahir Dar
City are commonly exhibit during the day time as opposed to 49% in the night time.
The difference in the temporal occurrence of RTAs between day and night times in
Mekelle City also disproves the idea stated by Hoobs (1979) that, night time accident
rates are about 50% greater than daytime accidents.
5.1.1.2 Monthly Temporal Variation of Road Traffic Accidents
Like the variation in the distribution of RTAs within the 24 hours of a day, there is
disparity of RTA frequencies between the different months of a year.
Table 4: Temporal variation of RTAs in a year by month in Mekelle City (2008-2011)
Months Accident Year
Total % 2008 2009 2010 2011
January 24 14 21 27 86 6.7
February 15 37 29 21 102 8.0
March 29 30 33 18 110 8.6
April 31 31 25 15 102 8.0
May 23 32 20 25 100 7.8
June 18 39 22 35 114 8.9
July 25 41 22 36 124 9.7
August 20 48 23 38 129 10.1
September 25 15 32 27 99 7.8
October 27 19 33 28 107 8.4
November 32 22 37 33 124 9.7
December 15 12 24 20 71 5.6
Missing 4 2 1 0 7 0.5
Total 288 342 322 323 1275 100.0
Source: Compiled from Mekelle City Traffic Office (2012)
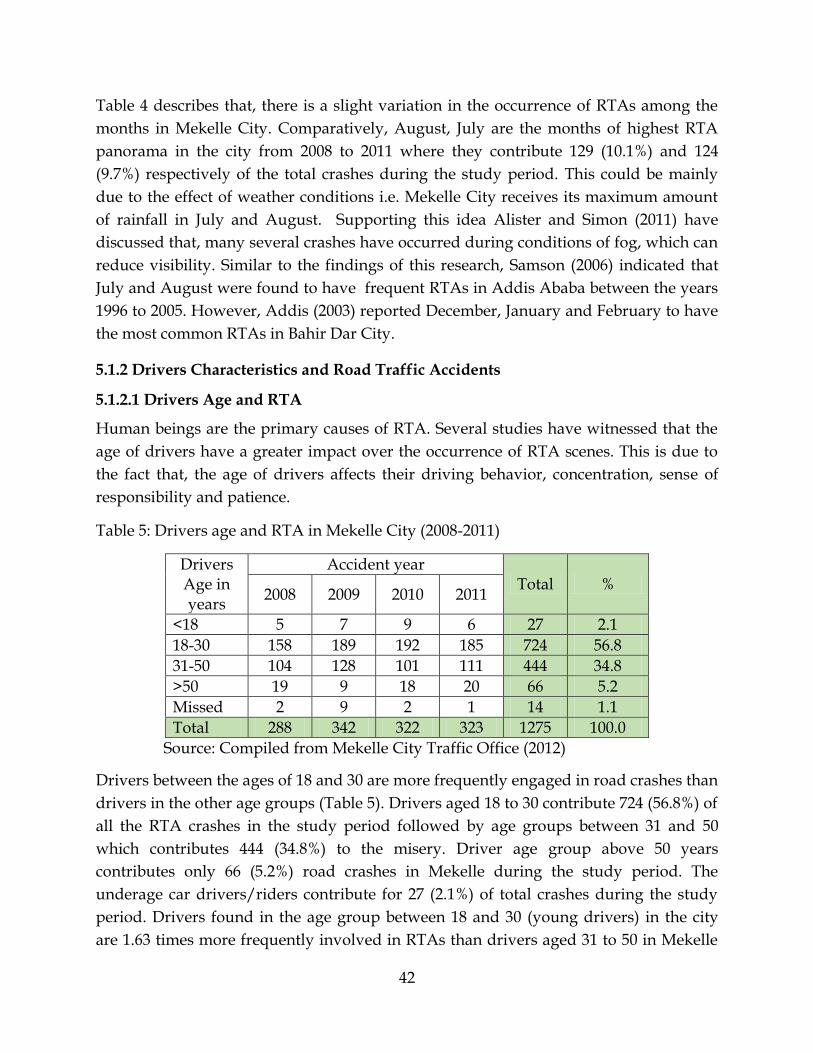
42
Table 4 describes that, there is a slight variation in the occurrence of RTAs among the
months in Mekelle City. Comparatively, August, July are the months of highest RTA
panorama in the city from 2008 to 2011 where they contribute 129 (10.1%) and 124
(9.7%) respectively of the total crashes during the study period. This could be mainly
due to the effect of weather conditions i.e. Mekelle City receives its maximum amount
of rainfall in July and August. Supporting this idea Alister and Simon (2011) have
discussed that, many several crashes have occurred during conditions of fog, which can
reduce visibility. Similar to the findings of this research, Samson (2006) indicated that
July and August were found to have frequent RTAs in Addis Ababa between the years
1996 to 2005. However, Addis (2003) reported December, January and February to have
the most common RTAs in Bahir Dar City.
5.1.2 Drivers Characteristics and Road Traffic Accidents
5.1.2.1 Drivers Age and RTA
Human beings are the primary causes of RTA. Several studies have witnessed that the
age of drivers have a greater impact over the occurrence of RTA scenes. This is due to
the fact that, the age of drivers affects their driving behavior, concentration, sense of
responsibility and patience.
Table 5: Drivers age and RTA in Mekelle City (2008-2011)
Drivers Age in years
Accident year Total %
2008 2009 2010 2011
<18 5 7 9 6 27 2.1
18-30 158 189 192 185 724 56.8
31-50 104 128 101 111 444 34.8
>50 19 9 18 20 66 5.2
Missed 2 9 2 1 14 1.1
Total 288 342 322 323 1275 100.0
Source: Compiled from Mekelle City Traffic Office (2012)
Drivers between the ages of 18 and 30 are more frequently engaged in road crashes than
drivers in the other age groups (Table 5). Drivers aged 18 to 30 contribute 724 (56.8%) of
all the RTA crashes in the study period followed by age groups between 31 and 50
which contributes 444 (34.8%) to the misery. Driver age group above 50 years
contributes only 66 (5.2%) road crashes in Mekelle during the study period. The
underage car drivers/riders contribute for 27 (2.1%) of total crashes during the study
period. Drivers found in the age group between 18 and 30 (young drivers) in the city
are 1.63 times more frequently involved in RTAs than drivers aged 31 to 50 in Mekelle
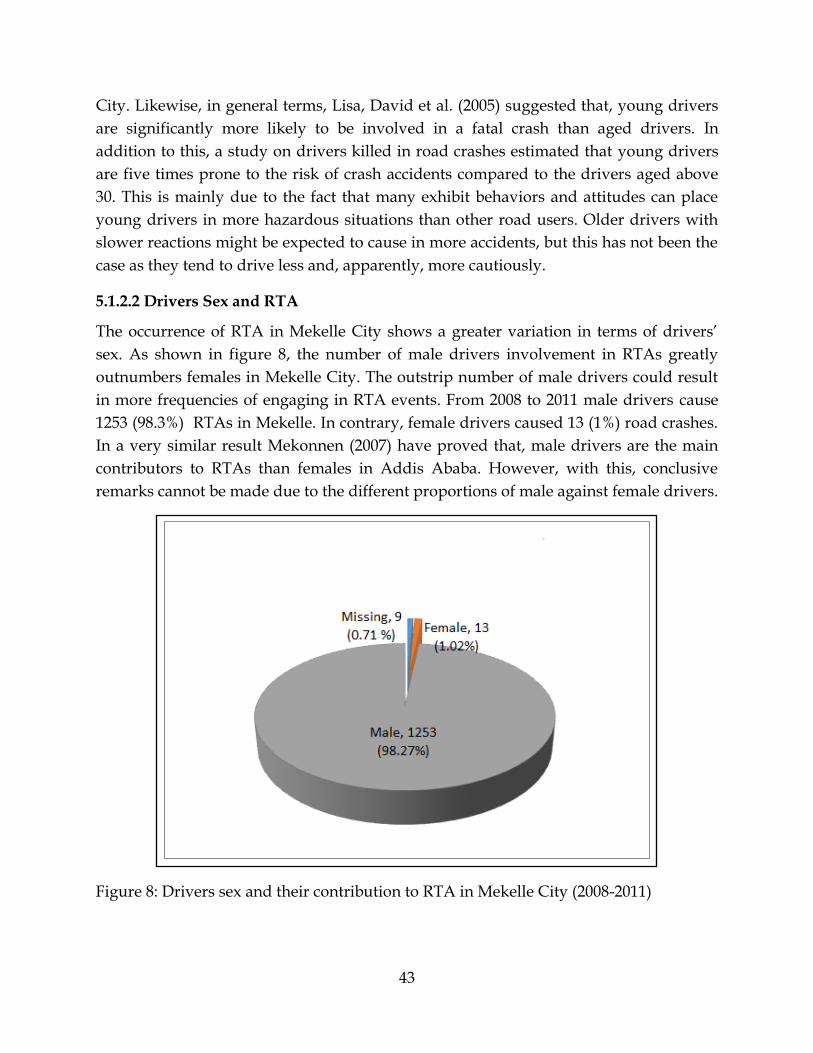
43
City. Likewise, in general terms, Lisa, David et al. (2005) suggested that, young drivers
are significantly more likely to be involved in a fatal crash than aged drivers. In
addition to this, a study on drivers killed in road crashes estimated that young drivers
are five times prone to the risk of crash accidents compared to the drivers aged above
30. This is mainly due to the fact that many exhibit behaviors and attitudes can place
young drivers in more hazardous situations than other road users. Older drivers with
slower reactions might be expected to cause in more accidents, but this has not been the
case as they tend to drive less and, apparently, more cautiously.
5.1.2.2 Drivers Sex and RTA
The occurrence of RTA in Mekelle City shows a greater variation in terms of drivers’
sex. As shown in figure 8, the number of male drivers involvement in RTAs greatly
outnumbers females in Mekelle City. The outstrip number of male drivers could result
in more frequencies of engaging in RTA events. From 2008 to 2011 male drivers cause
1253 (98.3%) RTAs in Mekelle. In contrary, female drivers caused 13 (1%) road crashes.
In a very similar result Mekonnen (2007) have proved that, male drivers are the main
contributors to RTAs than females in Addis Ababa. However, with this, conclusive
remarks cannot be made due to the different proportions of male against female drivers.
Figure 8: Drivers sex and their contribution to RTA in Mekelle City (2008-2011)
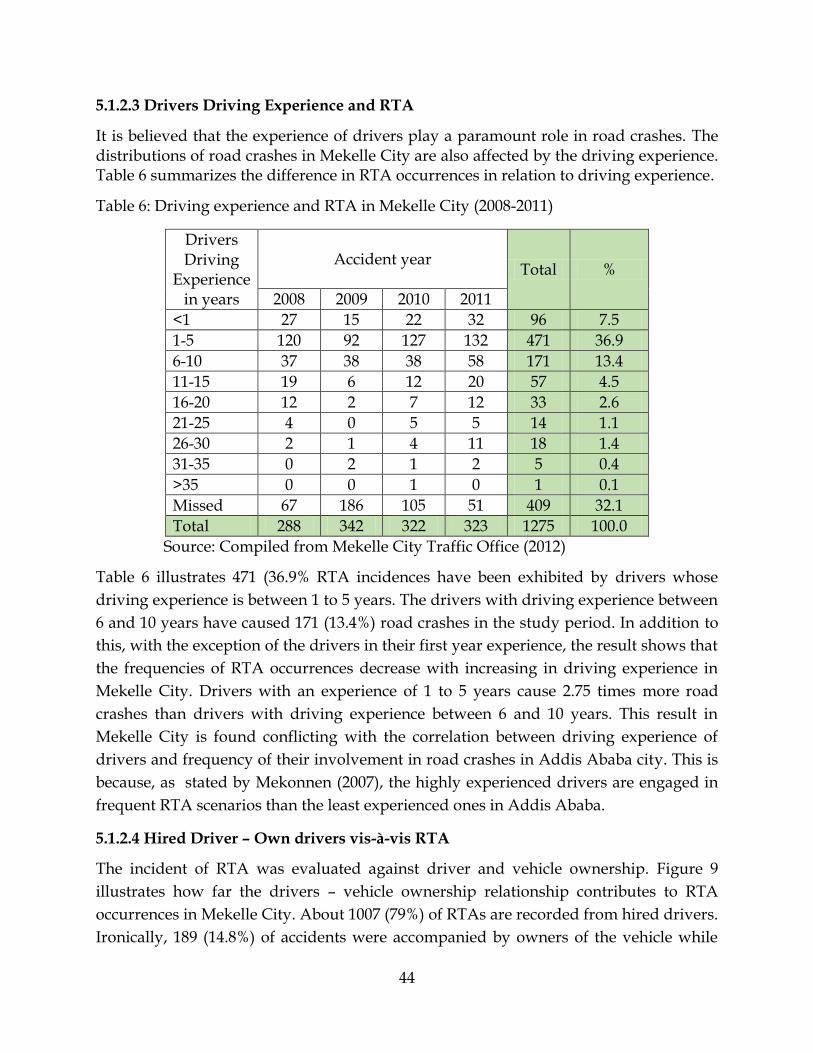
44
5.1.2.3 Drivers Driving Experience and RTA
It is believed that the experience of drivers play a paramount role in road crashes. The distributions of road crashes in Mekelle City are also affected by the driving experience. Table 6 summarizes the difference in RTA occurrences in relation to driving experience.
Table 6: Driving experience and RTA in Mekelle City (2008-2011)
Drivers Driving
Experience in years
Accident year Total %
2008 2009 2010 2011
<1 27 15 22 32 96 7.5
1-5 120 92 127 132 471 36.9
6-10 37 38 38 58 171 13.4
11-15 19 6 12 20 57 4.5
16-20 12 2 7 12 33 2.6
21-25 4 0 5 5 14 1.1
26-30 2 1 4 11 18 1.4
31-35 0 2 1 2 5 0.4
>35 0 0 1 0 1 0.1
Missed 67 186 105 51 409 32.1
Total 288 342 322 323 1275 100.0
Source: Compiled from Mekelle City Traffic Office (2012)
Table 6 illustrates 471 (36.9% RTA incidences have been exhibited by drivers whose
driving experience is between 1 to 5 years. The drivers with driving experience between
6 and 10 years have caused 171 (13.4%) road crashes in the study period. In addition to
this, with the exception of the drivers in their first year experience, the result shows that
the frequencies of RTA occurrences decrease with increasing in driving experience in
Mekelle City. Drivers with an experience of 1 to 5 years cause 2.75 times more road
crashes than drivers with driving experience between 6 and 10 years. This result in
Mekelle City is found conflicting with the correlation between driving experience of
drivers and frequency of their involvement in road crashes in Addis Ababa city. This is
because, as stated by Mekonnen (2007), the highly experienced drivers are engaged in
frequent RTA scenarios than the least experienced ones in Addis Ababa.
5.1.2.4 Hired Driver – Own drivers vis-à-vis RTA
The incident of RTA was evaluated against driver and vehicle ownership. Figure 9
illustrates how far the drivers – vehicle ownership relationship contributes to RTA
occurrences in Mekelle City. About 1007 (79%) of RTAs are recorded from hired drivers.
Ironically, 189 (14.8%) of accidents were accompanied by owners of the vehicle while
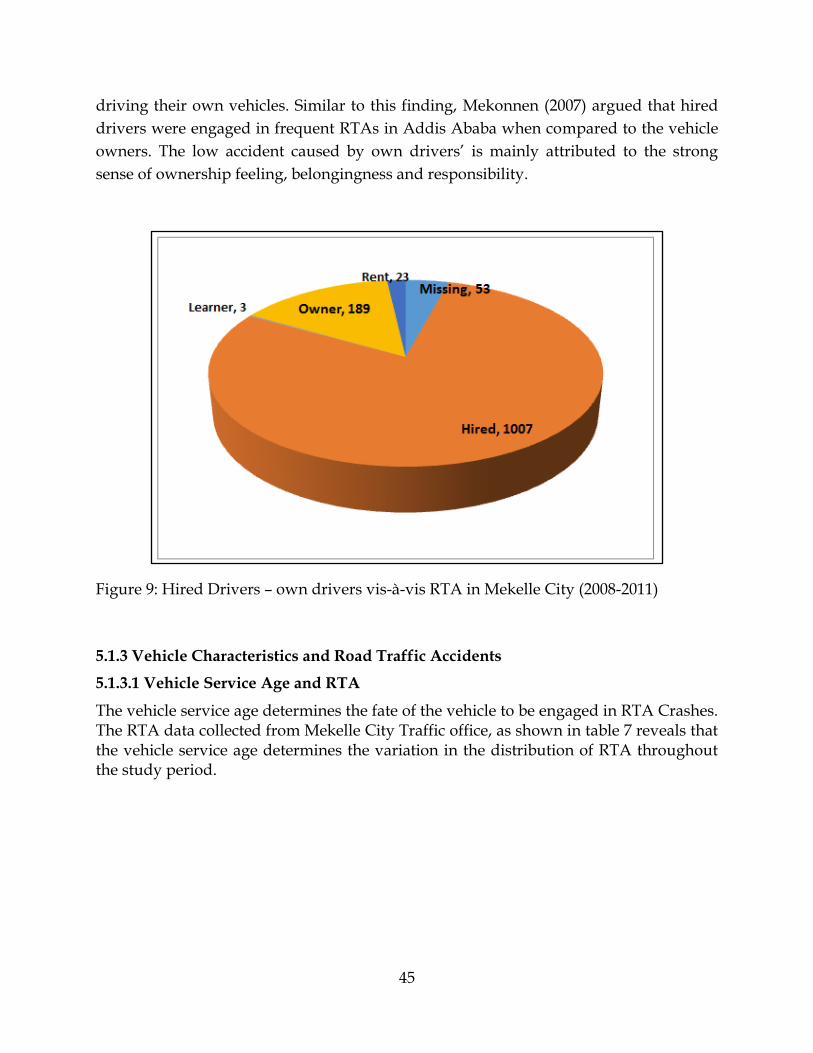
45
driving their own vehicles. Similar to this finding, Mekonnen (2007) argued that hired
drivers were engaged in frequent RTAs in Addis Ababa when compared to the vehicle
owners. The low accident caused by own drivers’ is mainly attributed to the strong
sense of ownership feeling, belongingness and responsibility.
Figure 9: Hired Drivers – own drivers vis-à-vis RTA in Mekelle City (2008-2011)
5.1.3 Vehicle Characteristics and Road Traffic Accidents
5.1.3.1 Vehicle Service Age and RTA
The vehicle service age determines the fate of the vehicle to be engaged in RTA Crashes. The RTA data collected from Mekelle City Traffic office, as shown in table 7 reveals that the vehicle service age determines the variation in the distribution of RTA throughout the study period.
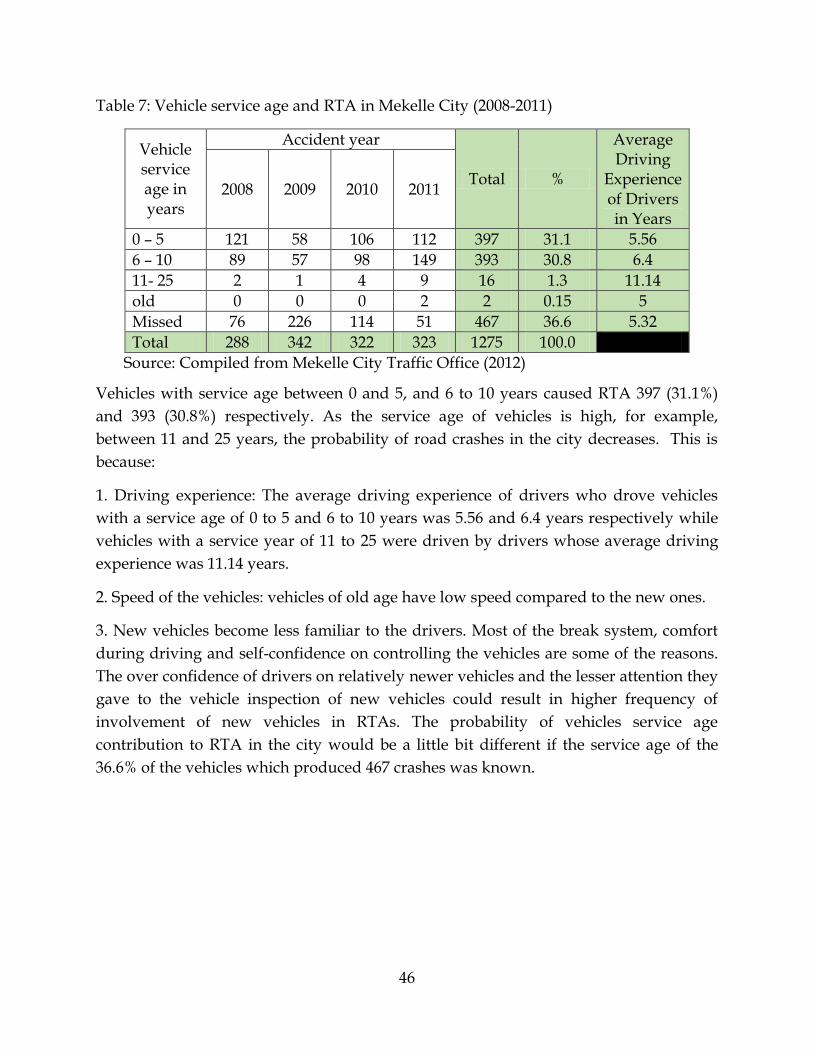
46
Table 7: Vehicle service age and RTA in Mekelle City (2008-2011)
Vehicle service age in years
Accident year
Total %
Average Driving
Experience of Drivers in Years
2008 2009 2010 2011
0 – 5 121 58 106 112 397 31.1 5.56
6 – 10 89 57 98 149 393 30.8 6.4
11- 25 2 1 4 9 16 1.3 11.14
old 0 0 0 2 2 0.15 5
Missed 76 226 114 51 467 36.6 5.32
Total 288 342 322 323 1275 100.0
Source: Compiled from Mekelle City Traffic Office (2012)
Vehicles with service age between 0 and 5, and 6 to 10 years caused RTA 397 (31.1%)
and 393 (30.8%) respectively. As the service age of vehicles is high, for example,
between 11 and 25 years, the probability of road crashes in the city decreases. This is
because:
1. Driving experience: The average driving experience of drivers who drove vehicles
with a service age of 0 to 5 and 6 to 10 years was 5.56 and 6.4 years respectively while
vehicles with a service year of 11 to 25 were driven by drivers whose average driving
experience was 11.14 years.
2. Speed of the vehicles: vehicles of old age have low speed compared to the new ones.
3. New vehicles become less familiar to the drivers. Most of the break system, comfort
during driving and self-confidence on controlling the vehicles are some of the reasons.
The over confidence of drivers on relatively newer vehicles and the lesser attention they
gave to the vehicle inspection of new vehicles could result in higher frequency of
involvement of new vehicles in RTAs. The probability of vehicles service age
contribution to RTA in the city would be a little bit different if the service age of the
36.6% of the vehicles which produced 467 crashes was known.
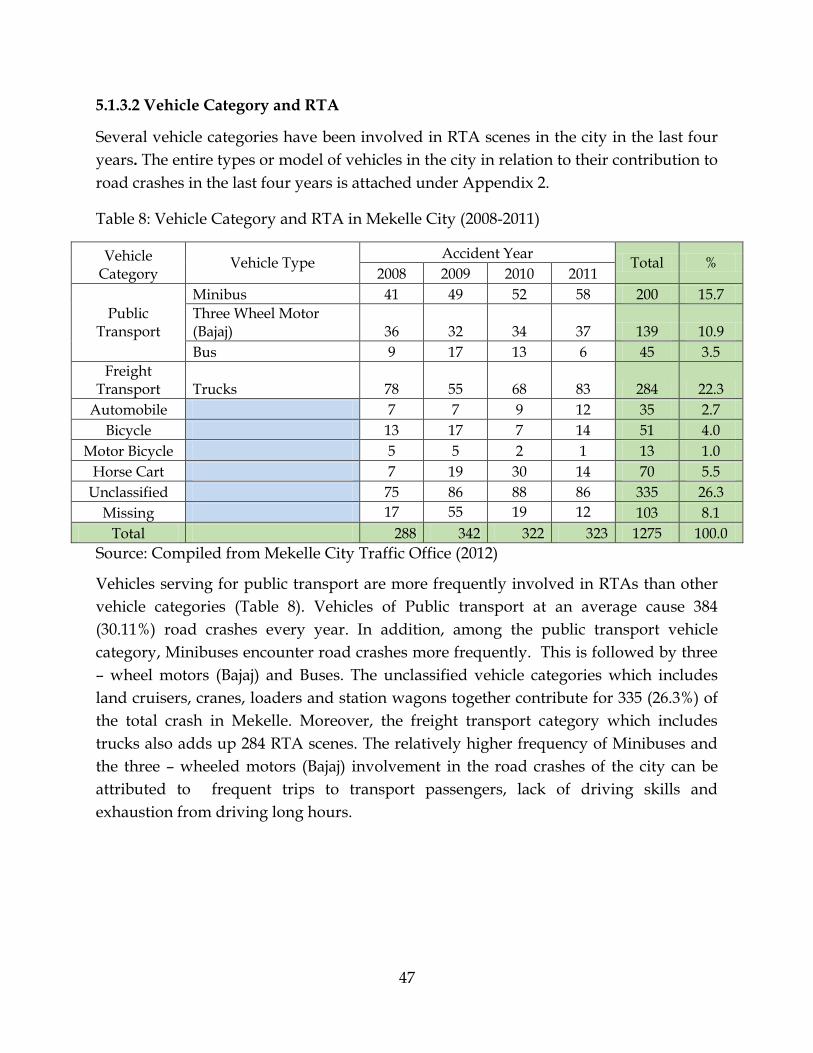
47
5.1.3.2 Vehicle Category and RTA
Several vehicle categories have been involved in RTA scenes in the city in the last four
years. The entire types or model of vehicles in the city in relation to their contribution to
road crashes in the last four years is attached under Appendix 2.
Table 8: Vehicle Category and RTA in Mekelle City (2008-2011)
Vehicle Category
Vehicle Type Accident Year
Total % 2008 2009 2010 2011
Public Transport
Minibus 41 49 52 58 200 15.7
Three Wheel Motor (Bajaj) 36 32 34 37 139 10.9
Bus 9 17 13 6 45 3.5
Freight Transport Trucks 78 55 68 83 284 22.3
Automobile 7 7 9 12 35 2.7
Bicycle 13 17 7 14 51 4.0
Motor Bicycle 5 5 2 1 13 1.0
Horse Cart 7 19 30 14 70 5.5
Unclassified 75 86 88 86 335 26.3
Missing 17 55 19 12 103 8.1
Total 288 342 322 323 1275 100.0
Source: Compiled from Mekelle City Traffic Office (2012)
Vehicles serving for public transport are more frequently involved in RTAs than other
vehicle categories (Table 8). Vehicles of Public transport at an average cause 384
(30.11%) road crashes every year. In addition, among the public transport vehicle
category, Minibuses encounter road crashes more frequently. This is followed by three
– wheel motors (Bajaj) and Buses. The unclassified vehicle categories which includes
land cruisers, cranes, loaders and station wagons together contribute for 335 (26.3%) of
the total crash in Mekelle. Moreover, the freight transport category which includes
trucks also adds up 284 RTA scenes. The relatively higher frequency of Minibuses and
the three – wheeled motors (Bajaj) involvement in the road crashes of the city can be
attributed to frequent trips to transport passengers, lack of driving skills and
exhaustion from driving long hours.
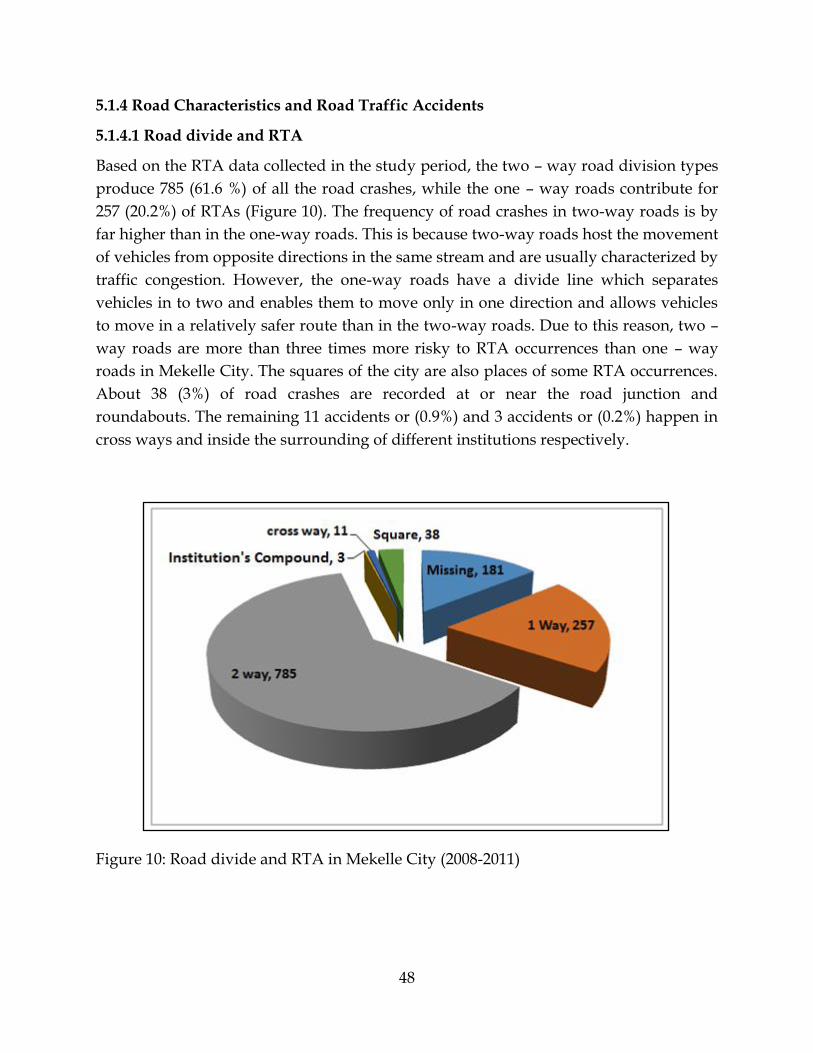
48
5.1.4 Road Characteristics and Road Traffic Accidents
5.1.4.1 Road divide and RTA
Based on the RTA data collected in the study period, the two – way road division types
produce 785 (61.6 %) of all the road crashes, while the one – way roads contribute for
257 (20.2%) of RTAs (Figure 10). The frequency of road crashes in two-way roads is by
far higher than in the one-way roads. This is because two-way roads host the movement
of vehicles from opposite directions in the same stream and are usually characterized by
traffic congestion. However, the one-way roads have a divide line which separates
vehicles in to two and enables them to move only in one direction and allows vehicles
to move in a relatively safer route than in the two-way roads. Due to this reason, two –
way roads are more than three times more risky to RTA occurrences than one – way
roads in Mekelle City. The squares of the city are also places of some RTA occurrences.
About 38 (3%) of road crashes are recorded at or near the road junction and
roundabouts. The remaining 11 accidents or (0.9%) and 3 accidents or (0.2%) happen in
cross ways and inside the surrounding of different institutions respectively.
Figure 10: Road divide and RTA in Mekelle City (2008-2011)
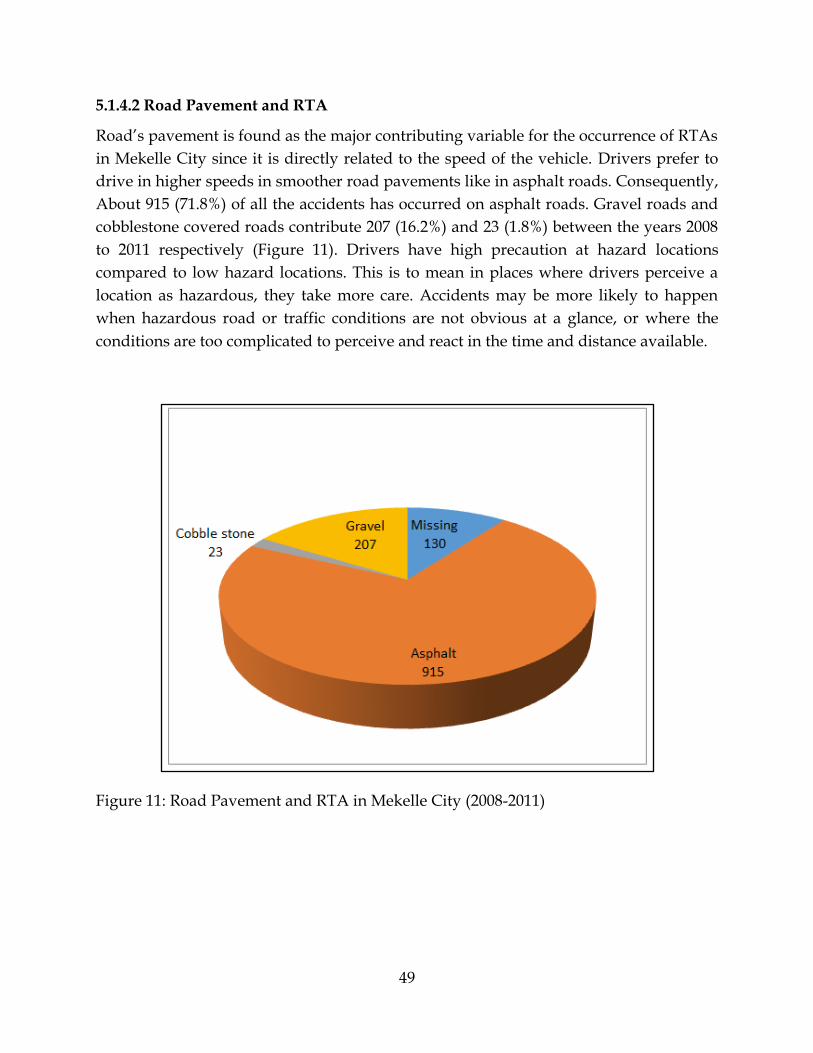
49
5.1.4.2 Road Pavement and RTA
Road’s pavement is found as the major contributing variable for the occurrence of RTAs
in Mekelle City since it is directly related to the speed of the vehicle. Drivers prefer to
drive in higher speeds in smoother road pavements like in asphalt roads. Consequently,
About 915 (71.8%) of all the accidents has occurred on asphalt roads. Gravel roads and
cobblestone covered roads contribute 207 (16.2%) and 23 (1.8%) between the years 2008
to 2011 respectively (Figure 11). Drivers have high precaution at hazard locations
compared to low hazard locations. This is to mean in places where drivers perceive a
location as hazardous, they take more care. Accidents may be more likely to happen
when hazardous road or traffic conditions are not obvious at a glance, or where the
conditions are too complicated to perceive and react in the time and distance available.
Figure 11: Road Pavement and RTA in Mekelle City (2008-2011)
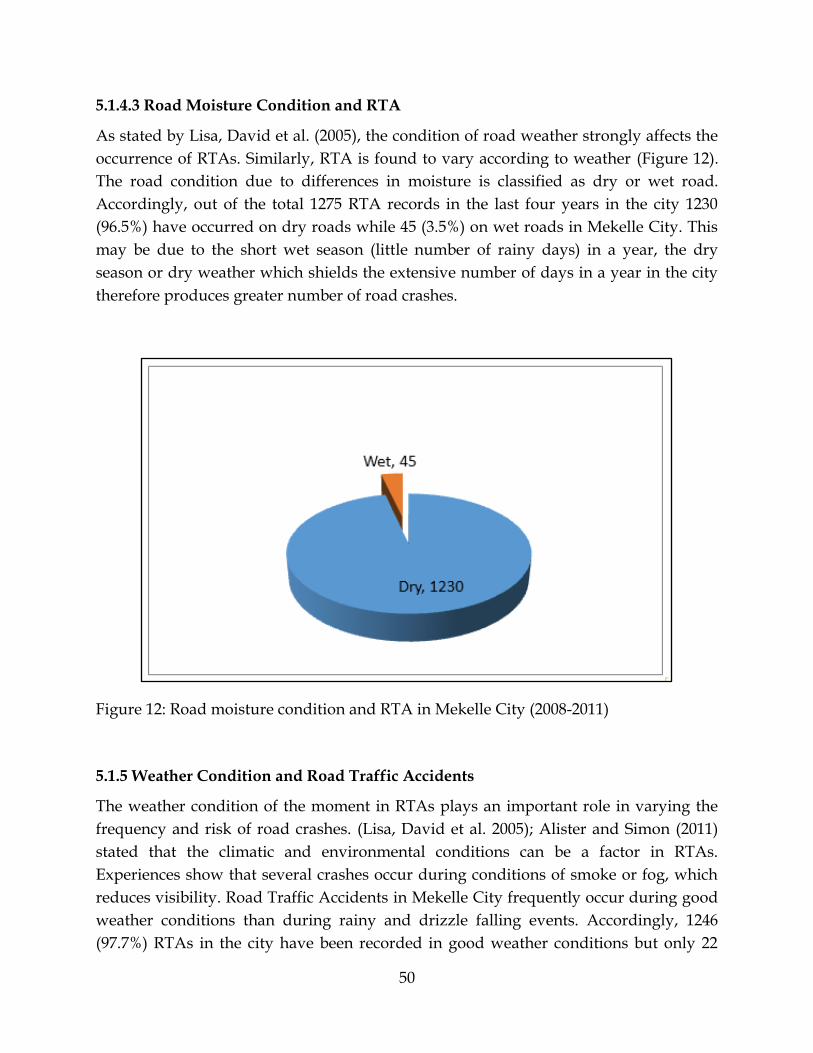
50
5.1.4.3 Road Moisture Condition and RTA
As stated by Lisa, David et al. (2005), the condition of road weather strongly affects the
occurrence of RTAs. Similarly, RTA is found to vary according to weather (Figure 12).
The road condition due to differences in moisture is classified as dry or wet road.
Accordingly, out of the total 1275 RTA records in the last four years in the city 1230
(96.5%) have occurred on dry roads while 45 (3.5%) on wet roads in Mekelle City. This
may be due to the short wet season (little number of rainy days) in a year, the dry
season or dry weather which shields the extensive number of days in a year in the city
therefore produces greater number of road crashes.
Figure 12: Road moisture condition and RTA in Mekelle City (2008-2011)
5.1.5 Weather Condition and Road Traffic Accidents
The weather condition of the moment in RTAs plays an important role in varying the
frequency and risk of road crashes. (Lisa, David et al. 2005); Alister and Simon (2011)
stated that the climatic and environmental conditions can be a factor in RTAs.
Experiences show that several crashes occur during conditions of smoke or fog, which
reduces visibility. Road Traffic Accidents in Mekelle City frequently occur during good
weather conditions than during rainy and drizzle falling events. Accordingly, 1246
(97.7%) RTAs in the city have been recorded in good weather conditions but only 22
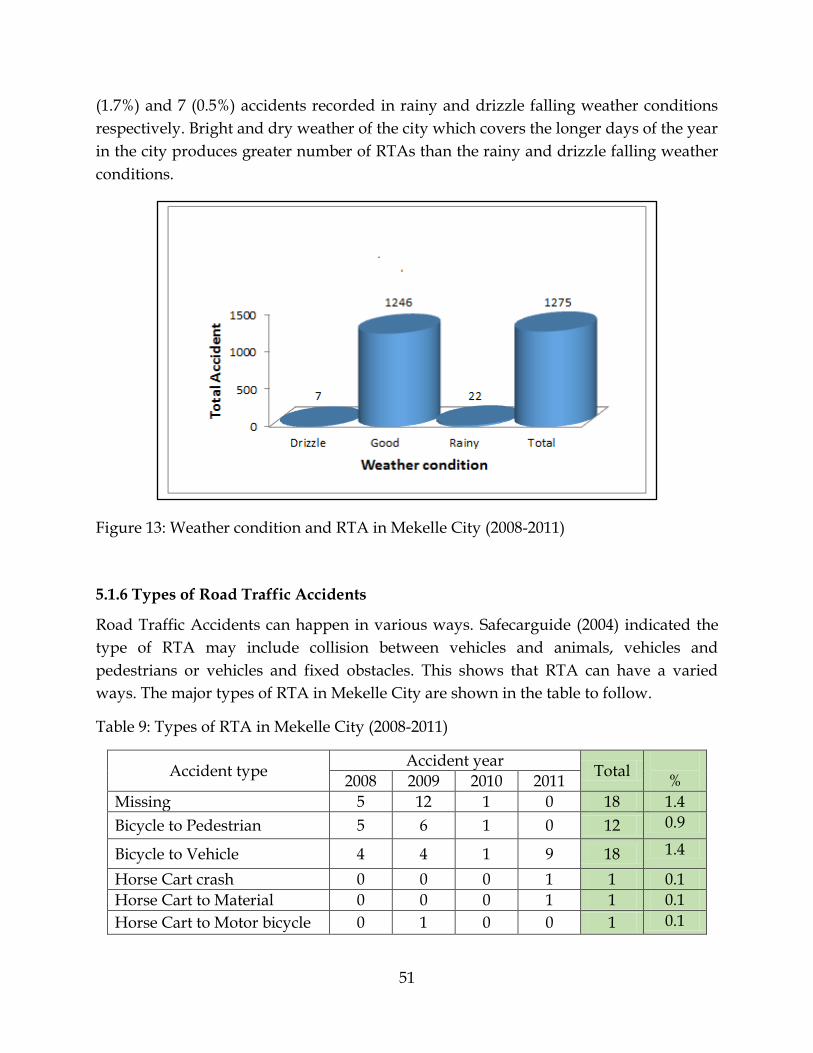
51
(1.7%) and 7 (0.5%) accidents recorded in rainy and drizzle falling weather conditions
respectively. Bright and dry weather of the city which covers the longer days of the year
in the city produces greater number of RTAs than the rainy and drizzle falling weather
conditions.
Figure 13: Weather condition and RTA in Mekelle City (2008-2011)
5.1.6 Types of Road Traffic Accidents
Road Traffic Accidents can happen in various ways. Safecarguide (2004) indicated the
type of RTA may include collision between vehicles and animals, vehicles and
pedestrians or vehicles and fixed obstacles. This shows that RTA can have a varied
ways. The major types of RTA in Mekelle City are shown in the table to follow.
Table 9: Types of RTA in Mekelle City (2008-2011)
Accident type Accident year
Total
% 2008 2009 2010 2011
Missing 5 12 1 0 18 1.4
Bicycle to Pedestrian 5 6 1 0 12 0.9
Bicycle to Vehicle 4 4 1 9 18 1.4
Horse Cart crash 0 0 0 1 1 0.1
Horse Cart to Material 0 0 0 1 1 0.1
Horse Cart to Motor bicycle 0 1 0 0 1 0.1
52
Accident type Accident year
Total
% 2008 2009 2010 2011
Horse Cart to Pedestrian 0 7 2 2 11 0.9
Horse Cart to Vehicle 5 7 20 7 39 3.1
Motor bicycle crash 1 0 0 0 1 0.1
Motor bicycle to Vehicle 0 1 0 0 1 0.1
Vehicle crash 25 38 27 21 111 8.7
Vehicle to Animal 8 14 7 5 34 2.7
Vehicle to Bicycle 0 3 2 4 9 0.7
Vehicle to Horse cart 0 7 6 2 15 1.2
Vehicle to Material 21 22 39 30 112 8.8
Vehicle to Motor bicycle 0 0 1 0 1 0.1
Vehicle to Pedestrian 69 72 54 78 273 21.4
Vehicle to Vehicle 145 148 161 163 617 48.4
Total 288 342 322 323 1275 100
Source: Compiled from Mekelle City Traffic Office (2012)
The RTA occurred in the city between the study periods are of varied types and their
contribution to the road crashes also vary considerably. The vehicle to vehicle crash gets
the biggest proportion i.e. 617 (48.4%) of RTA crashes of all types of RTAs in the city
followed by vehicle to pedestrian crashes which covers 273 RTA scenes and 21.4% share
of the RTA occurrences from 2008 to 2011 in Mekelle City (Table 9). In the remaining
cases, with the exception of Vehicle to material and vehicle crush types which covers
8.8% and 8.7% of the road crashes respectively, the rest have relatively insignificant
contribution to road crashes in Mekelle City. Pedestrians have been engaged in 296 RTA
cases i.e. 273 with vehicles, 12 with bicycle and 11 with horse cart. In addition to this,
vehicles, Horse cart and bicycles are engaged in 1212, 68 and 39 RTA occurrences in the
study period.
53
5.2 The Spatio-Temporal Distribution of Road Traffic Accident Spots and Road Traffic Accident Black Spots in Mekelle City
5.2.1 The Spatial Distribution of RTAs and RTA Spots in Mekelle City in 2008
In 2008, Mekelle City exhibits the occurrence of 272 spatially identified RTAs. The RTAs
were unevenly distributed throughout the Sub-cities of Mekelle City administration in
this year.
Table 10: The spatial distribution of RTA occurrences in Mekelle City (2008)
Year Sub-city No. of RTA
Spots
No. of RTAs
occurred
% of RTA Spots
% of RTAs
occurred
2008
Semen and its extension 38 109 38 40.1
Quiha 14 35 14 12.9
Hawelti 13 40 13 14.7
Hadinet and its extension 11 36 11 13.2
Ayder 2 5 2 1.8
Kedamay Weyane 18 42 18 15.4
Adihaki 4 5 4 1.8
Total 100 272 100 100.0
Source: Compiled from Mekelle City Traffic Office (2012)
The above table 10 stipulates that, 272 RTAs were recorded form 100 RTA spots in the
city in 2008. This indicates that an average of 2.72 RTAs have occurred at every RTA
spots in the city in 2008. The highest numbers of RTA spots as well as the largest
frequency of RTA incidents were recorded from Semen sub-city and its extension.
Semen sub-city and its extension exhibits 109 (40.1%) of RTAs and 38 (38%) of RTA
spots in the city by 2008. Kedamay Weyane sub-city produced 42 (15.4%) of RTAs
unveiled in 18 (18%) RTA spots followed by Hawelti sub-city which shares 40 (14.7%)
RTAs happened in 13 (13%) RTA spots. The RTAs have been fairly distributed amongst
Hadinet sub-city and its extension and Quiha sub-city since 36 (13.2%) and 35 (12.9%)
RTAs occurred in the sub-cities respectively. Ayder sub-city and Adihaki sub-city
showed 5 (1.8%) RTAs each in 2 (2%) and 4 (4%) RTA spots respectively. The spatial
distribution of RTA spots in Mekelle City by the year 2008 is shown in figure 14.

54
5.2.1.1 Spatial Distribution of RTA Black Spots of Mekelle City in 2008
According to the criteria set, all places that exhibit five or more than five RTAs were
defined as RTA Black spots. Accordingly, as shown in table 11 and figure 15; 14 places
were identified as RTA Black spots in Mekelle City in the year 2008.
Table 11: Mekelle City RTA Black Spot areas (2008)
Year RTA Black Spot area Black Spot code
No. of RTAs occurred in the Black spot
2008
Messebo Mountain 163 6
Lachi 137 10
Trans Ethiopia 238 16
Donbosco 65 10
Mesfin Industrial Engineering 165 5
Mobil 172 11
Dedebit Micro Finance 61 15
Health Station 108 5
Kebelle 18 129 5
Adihawsi 12 5
Mekelle University, Arid campus 158 11
May Shibti 151 6
Air force 19 8
Yetebaberut, Endasilassie 245 11
Total 14
124
Source: Compiled from Mekelle City Traffic Office (2012)
According to table 11, a total of 124 RTAs have been recorded from only 14 RTA black
spots in the city in the year 2008. This implies that, an average of 8.85 RTA incidences
have occurred at every single RTA Black spot in the city in the year 2008. The highest
frequency of RTAs i.e. 16 happened around Trans Ethiopia area in 2008. In addition to
this, 6 out of the 14 RTA black spots of the city in this year have occurred in the Semen
sub-city and its extension. Hadinet and its extension and Quiha sub-cities shared 3 and
2 RTA Black Spots respectively. Ironically, Adihaki, Kedamay weyane and Hawelti sub-
cities exhibited only 1 RTA black spot area each in the year while Ayder sub-city had
nil.
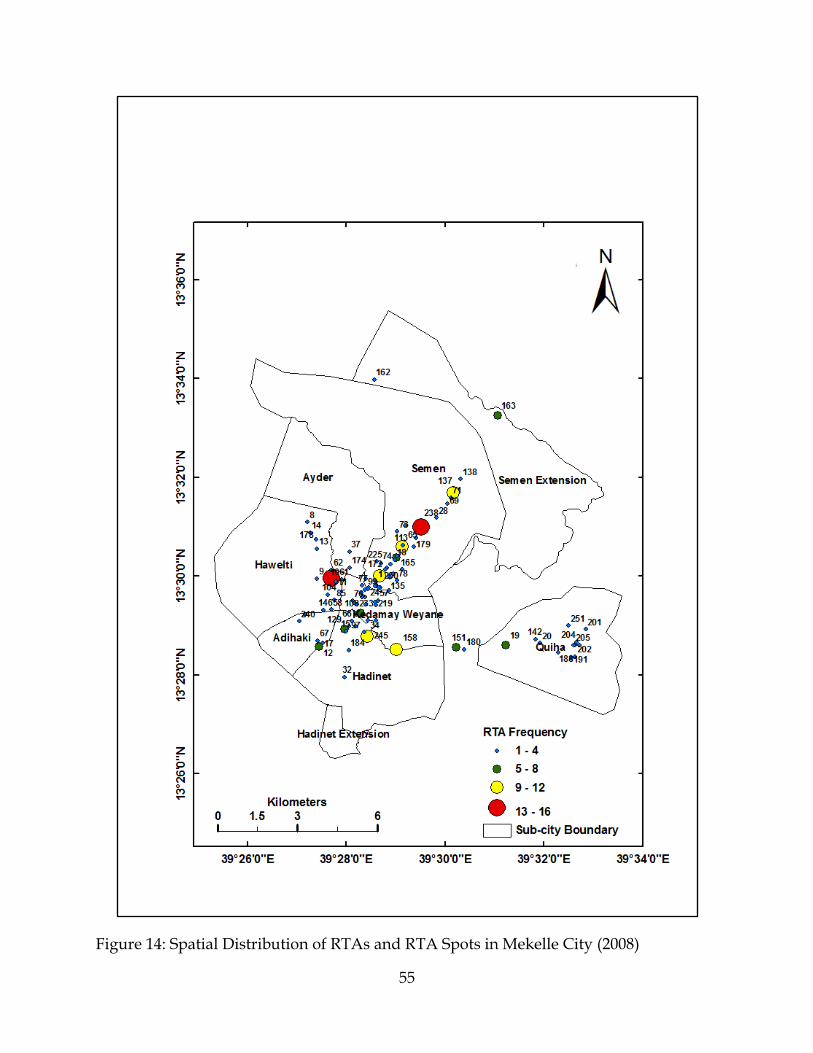
55
Figure 14: Spatial Distribution of RTAs and RTA Spots in Mekelle City (2008)
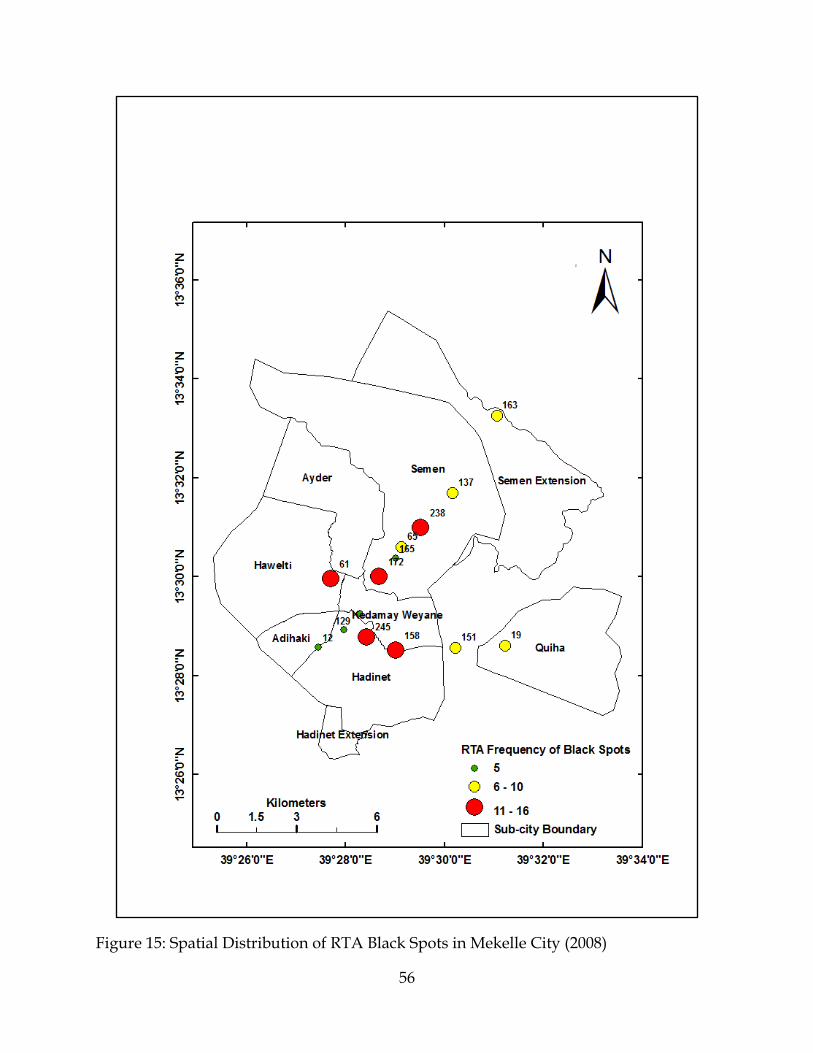
56
Figure 15: Spatial Distribution of RTA Black Spots in Mekelle City (2008)
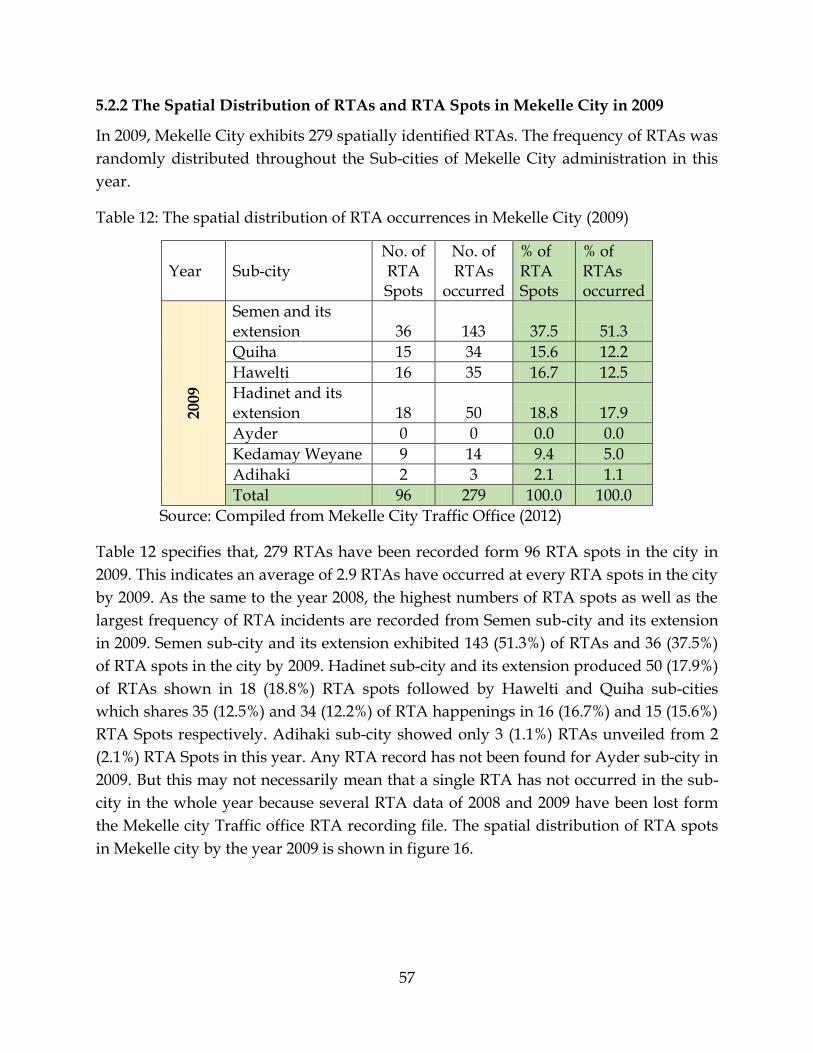
57
5.2.2 The Spatial Distribution of RTAs and RTA Spots in Mekelle City in 2009
In 2009, Mekelle City exhibits 279 spatially identified RTAs. The frequency of RTAs was
randomly distributed throughout the Sub-cities of Mekelle City administration in this
year.
Table 12: The spatial distribution of RTA occurrences in Mekelle City (2009)
Year Sub-city No. of RTA Spots
No. of RTAs
occurred
% of RTA Spots
% of RTAs occurred
2009
Semen and its extension 36 143 37.5 51.3
Quiha 15 34 15.6 12.2
Hawelti 16 35 16.7 12.5
Hadinet and its extension 18 50 18.8 17.9
Ayder 0 0 0.0 0.0
Kedamay Weyane 9 14 9.4 5.0
Adihaki 2 3 2.1 1.1
Total 96 279 100.0 100.0
Source: Compiled from Mekelle City Traffic Office (2012)
Table 12 specifies that, 279 RTAs have been recorded form 96 RTA spots in the city in
2009. This indicates an average of 2.9 RTAs have occurred at every RTA spots in the city
by 2009. As the same to the year 2008, the highest numbers of RTA spots as well as the
largest frequency of RTA incidents are recorded from Semen sub-city and its extension
in 2009. Semen sub-city and its extension exhibited 143 (51.3%) of RTAs and 36 (37.5%)
of RTA spots in the city by 2009. Hadinet sub-city and its extension produced 50 (17.9%)
of RTAs shown in 18 (18.8%) RTA spots followed by Hawelti and Quiha sub-cities
which shares 35 (12.5%) and 34 (12.2%) of RTA happenings in 16 (16.7%) and 15 (15.6%)
RTA Spots respectively. Adihaki sub-city showed only 3 (1.1%) RTAs unveiled from 2
(2.1%) RTA Spots in this year. Any RTA record has not been found for Ayder sub-city in
2009. But this may not necessarily mean that a single RTA has not occurred in the sub-
city in the whole year because several RTA data of 2008 and 2009 have been lost form
the Mekelle city Traffic office RTA recording file. The spatial distribution of RTA spots
in Mekelle city by the year 2009 is shown in figure 16.
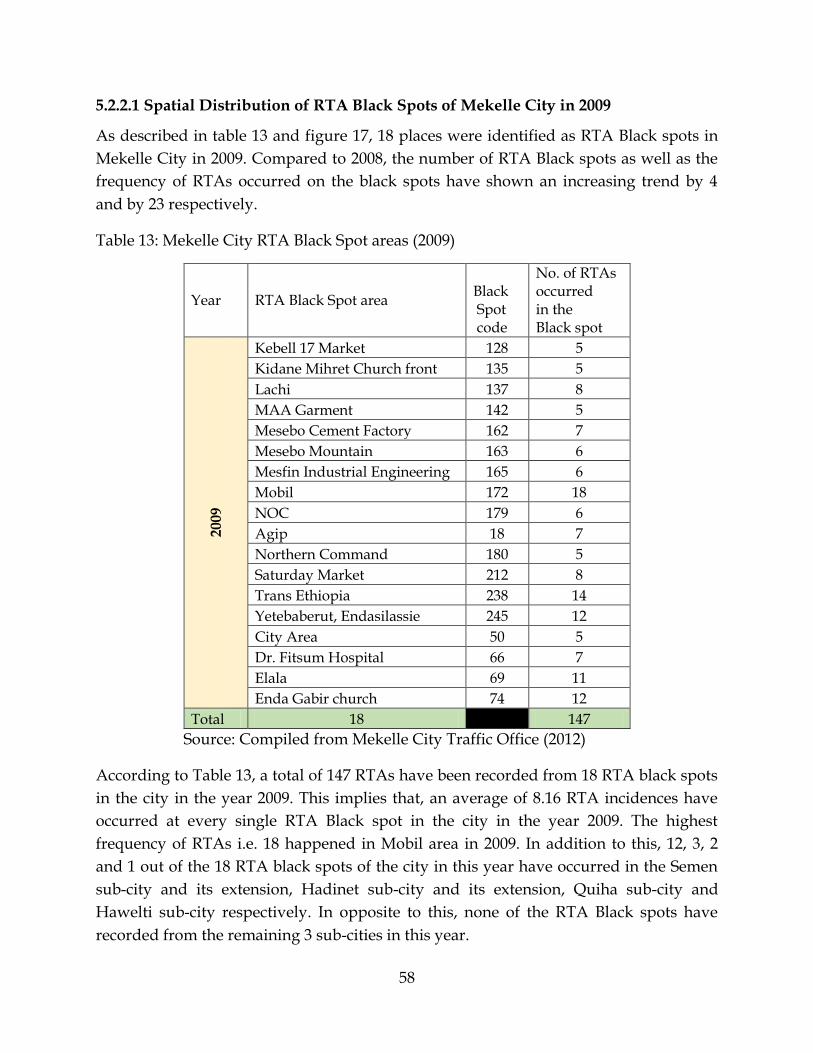
58
5.2.2.1 Spatial Distribution of RTA Black Spots of Mekelle City in 2009
As described in table 13 and figure 17, 18 places were identified as RTA Black spots in
Mekelle City in 2009. Compared to 2008, the number of RTA Black spots as well as the
frequency of RTAs occurred on the black spots have shown an increasing trend by 4
and by 23 respectively.
Table 13: Mekelle City RTA Black Spot areas (2009)
Year RTA Black Spot area Black Spot code
No. of RTAs occurred in the Black spot
2009
Kebell 17 Market 128 5
Kidane Mihret Church front 135 5
Lachi 137 8
MAA Garment 142 5
Mesebo Cement Factory 162 7
Mesebo Mountain 163 6
Mesfin Industrial Engineering 165 6
Mobil 172 18
NOC 179 6
Agip 18 7
Northern Command 180 5
Saturday Market 212 8
Trans Ethiopia 238 14
Yetebaberut, Endasilassie 245 12
City Area 50 5
Dr. Fitsum Hospital 66 7
Elala 69 11
Enda Gabir church 74 12
Total 18
147
Source: Compiled from Mekelle City Traffic Office (2012)
According to Table 13, a total of 147 RTAs have been recorded from 18 RTA black spots
in the city in the year 2009. This implies that, an average of 8.16 RTA incidences have
occurred at every single RTA Black spot in the city in the year 2009. The highest
frequency of RTAs i.e. 18 happened in Mobil area in 2009. In addition to this, 12, 3, 2
and 1 out of the 18 RTA black spots of the city in this year have occurred in the Semen
sub-city and its extension, Hadinet sub-city and its extension, Quiha sub-city and
Hawelti sub-city respectively. In opposite to this, none of the RTA Black spots have
recorded from the remaining 3 sub-cities in this year.
59
Figure 16: Spatial Distribution of RTAs and RTA Spots in Mekelle City (2009)
60
Figure 17: Spatial Distribution of RTA Black Spots in Mekelle City (2009)
61
5.2.3 The Spatial Distribution of RTAs and RTA Spots in Mekelle City in 2010
In 2010, Mekelle City exhibits the occurrence of 295 spatially identified RTAs. The
frequency of RTAs is irregularly distributed throughout the Sub-cities in 2010.
Table 14: The spatial distribution of RTA occurrences in Mekelle City (2010)
Year Sub-city No. of RTA Spots
No. of RTAs occurred
% of RTA Spots
% of RTAs occurred
2010
Semen and its extension 37 101 28.0 34.2
Quiha 11 17 8.3 5.8
Hawelti 15 49 11.4 16.6
Hadinet and its extension 19 49 14.4 16.6
Ayder 3 7 2.3 2.4
Kedamay Weyane 44 62 33.3 21.0
Adihaki 3 10 2.3 3.4
Total 132 295 100.0 100.0
Source: Compiled from Mekelle City Traffic Office (2012)
Table 14 postulates that, 295 RTAs have been recorded form 132 RTA spots in the city in
2010. This indicates an average of 2.23 RTAs have occurred at every RTA spots in the
city by 2010. Like in the preceding years, the highest numbers of RTA spots are
recorded from Semen sub-city and its extension by 2010. However, the highest number
of RTA Spots shifted from Semen sub-city and its extension to Kedamay weyane sub-
city in this year. The opening of Kedamay Weyane shopping mall and other related
businesses results in increasing the traffic volume in Kedamay Weyane sub-city. Semen
sub-city and its extension exhibited 101 (34.2%) of RTAs and 37 (28%) of RTA spots in
the city by 2010. Kedamay Weyane sub-city takes the share of 62 (21%) RTAs and 62
(33.3%) of the RTA Spots in the year. Hadinet sub-city and its extension and Hawelti
sub-cities produced 49 (16.6%) of RTAs each shown in 19 (14.14%) and 15 (11.4%) RTA
spots respectively. Ayder sub-city which produced the least RTAs and RTA Spots in the
previous years contributed for 7 (2.4%) RTA incidents from 3 (2.3%) RTA Spots in 2010.
The spatial distribution of RTA spots in Mekelle City by the year 2010 is shown in
figure 18.
62
5.2.3.1 Spatial Distribution of RTA Black Spots of Mekelle City in 2010
As described in table 15 and figure 19, 13 places are identified as RTA Black spots in
Mekelle City in 2010. Comparing to 2009, the number of RTA Black spots as well as the
frequency of RTAs occurred in the black spots have shown a decreasing trend by 5 and
by 54 respectively.
Table 15: Mekelle City RTA Black Spot areas (2010)
Year RTA Black Spot area Black Spot code
No. of RTAs occurred in the Black spot
2010
Adi Haqi Market 11 5
Lachi 137 9
Martyrs Monument 146 5
Mekelle university, Arid Campus 158 5
Mesebo Mountain 163 8
Mesfin Industrial Engineering 165 5
Settlement Area 220 6
Total 237 5
Trans Ethiopia 138 10
Yetebaberut, Endasilassie 245 13
Ayder Referral Hospital 37 5
Dedebit Micro Finance 61 11
Donbosco 65 6
Total 13
93
Source: Compiled from Mekelle City Traffic Office (2012)
According to table 15, a total of 93 RTAs have been recorded from 13 RTA black spots in
the city in the year 2010. This implies that, an average of 7.15 RTA incidences have
occurred at every single RTA Black spot in the city in the year 2010. The highest
frequency of RTAs i.e. 13 happened in Yetebaberut, Endasilassie area in 2010. In
addition to this, 6 out of the 13 RTA black spots of the city in this year have occurred in
the Semen sub-city and its extension. Hawelti and Hadinet and its extension sub-cities
shared 3 and 2 RTA Black Spots respectively while Ayder and Adihaki sub-cities
comprise 1 RTA Black Spot each in the year. Atypically, none of the RTA Black spots
have recorded from Quiha and Kedamay Weyane sub-cities.
63
Figure 18: Spatial Distribution of RTAs and RTA Spots in Mekelle City (2010)

64
Figure 19: Spatial Distribution of RTA Black Spots in Mekelle City (2010)
65
5.2.4 The Spatial Distribution of RTAs and RTA Spots in Mekelle City in 2011
In 2011, Mekelle City exhibits the occurrence of 315 spatially identified RTAs. The
frequency of RTAs is randomly distributed throughout the Sub-cities of Mekelle City
administration in this year.
Table 16: The Spatial distribution of RTA occurrences in Mekelle City (2011)
Year Sub-city No. of RTA Spots
No. of RTAs occurred
% of RTA Spots
% of RTAs occurred
2011
Semen and its extension 49 119 33.1 37.8
Quiha 10 21 6.8 6.7
Hawelti 16 38 10.8 12.1
Hadinet and its extension 15 42 10.1 13.3
Ayder 6 9 4.1 2.9
Kedamay Weyane 47 77 31.8 24.4
Adihaki 5 9 3.4 2.9
Total 148 315 100.0 100.0
Source: Compiled from Mekelle City Traffic Office (2012)
The above table 16 shows that, 315 RTAs have been recorded form 148 RTA spots in the
city in 2011. This indicates that, an average of 2.12 RTAs has occurred at every RTA
spots in the city by 2011. Like in 2008 and 2009, the highest numbers of RTA spots as
well as the largest frequency of RTA incidents are recorded from Semen sub-city and its
extension. Semen sub-city and its extension exhibited 119 (37.8%) of RTAs and 49
(33.1%) of RTA spots in the city by 2011. Kedamay Weyane sub-city hosted 77 (24.4%) of
RTAs occurred in 47 (31.8%) RTA spots followed by Hadinet sub-city and its extension
which shares 42 (13.3%) RTAs occurances in 15 (10.1%) RTA spots. The RTAs have been
fairly distributed amongst Ayder sub-city and Quiha sub-city since 9 (2.9%) RTAs have
recorded from each respectively. The spatial distribution of RTA spots in Mekelle City
by the year 2011 is shown in figure 20.
66
5.2.4.1 Spatial Distribution of RTA Black Spots of Mekelle City in 2011
As described in table 17 and figure 21, 14 places are identified as RTA Black spots in
Mekelle City in the year 2011. Comparing to 2010, the number of RTA Black spots have
increased by one but the frequency of RTAs occurred in the black spots remain the same
as 93.
Table 17: Mekelle City RTA Black Spot areas (2011)
Year RTA Black Spot area Black Spot code
No. of RTAs occurred in the Black spot
2011
Adihawsi 12 9
Air Force 19 5
Elala 69 6
Enda Gabir church 74 5
Enda Raisi Park 78 5
Lachi 137 8
May Degene 147 6
Mekelle Bus Station 155 6
Mekelle University, Arid campus 158 5
Mercy School 161 6
Mesebo Cement Factory 162 7
Mesebo Mountain 163 8
Trans Ethiopia 238 7
Yetebaberut, Endasilassie 245 10
Total 14
93
Source: Compiled from Mekelle City Traffic Office (2012)
According to table 17, a total of 93 RTAs have been recorded from 14 RTA black spots in
the city in the year 2011. This infers that, an average of 6.64 RTA occurrences has
befallen at every single RTA Black spot in the city in the year 2011. Like in 2010, the
highest frequency of RTAs i.e. 10 RTAs occurred in Yetebaberut, Endasilassie area in
2011. In addition to this, half of the RTA Black spots of the city in this year have
occurred in the Semen sub-city and its extension. As Kedamay weyane and Hadinet
and its extension shared 2 RTA Black Spots each in 2010, Quiha, Adihaki and Hawelti
sub-cities compile 1 RTA Black Spot each in the year. Ironically, none of the RTA Black
spots have recorded from Ayder sub-city in 2011.
67
Figure 20: Spatial Distribution of RTAs and RTA Spots in Mekelle City (2011)
68
Figure 21: Spatial Distribution of RTA Black Spots in Mekelle City (2011)
69
5.2.5 Spatial Distribution of all Spatially Identified RTA Spots of Mekelle City From
2008 to 2011
In the last sections prior to this one, it has been discussed that 1161 RTAs have occurred
in the city which exhibited in 247 different RTA Spots from 2008 to 2011. The following
table 18 recapitulates the total number of RTA Spots and their spatial distribution via all
sub-cities.
Table 18: Spatial distribution of total RTA Spots in the Mekelle City (2008 -2011)
Sub-city Number of RTA
Spots Total RTAs
occurred
Semen and its extension 74 472
Kedamay Weyane 73 195
Quiha 29 107
Hadinet and its extension 28 177
Hawelti 27 162
Ayder 9 21
Adihaqi 7 27
Total 247 1161
Source: Compiled from Mekelle City Traffic Office (2012)
Conferring to table 18, Semen and its extension and Kedamay Weyane sub-cities shared
the largest number of RTA Spots of the city in the last four years. Semen sub-city and its
extension engulfed 74 RTA Spots while Kedamay weyane sub-city constitutes 73 in the
study period. This implies that, 147 (59.51%) of the total RTA Spots in Mekelle City are
found in Semen and its extension and Kedamay weyane sub-cities. The higher density
of roads, larger volume of vehicle and population movements and extensive business
activities makes these two sub-cities to take the lion share of the spatial distribution of
RTA Spots of the city from 2008 to 2011. The RTA Spots are fairly distributed among
Quiha, Hadinet and its extension and Hawelti sub-cities. However, Ayder and Adihaki
sub-cities contribute only for 9 and 7 total RTA Spots in the city in the whole study
period. Although the number of RTA Spots seems to be similar in Semen and its
extension and Kedamay Weyane sub-cities, the resulting RTA occurrences in Semen
and its extension is by 2.43 times much higher than in Kedamay Weyane. The spatial
distribution of all the 247 RTA Spots and their frequency of RTAs in the last four years
are shown in figure 22.
70
Figure 22: Spatial distribution of all spatially identified RTA Spots of Mekelle City from 2008 – 2011
71
5.3 Trend of Road Traffic Accident in Mekelle City
5.3.1 Trend in the Occurrence of Road Traffic Accidents
The occurrence of RTAs vary with time as attributed by the variation in the number and
quality of vehicles, quality of roads, physical characteristics of roads, weather condition,
population size, level of awareness of road users. The frequencies of occurrence of RTAs
in Mekelle City also exhibit such fluctuations in this decade due to either of these
reasons. As shown in figure 23, more than 1791 RTA occurrences have been recorded
on the roads of Mekelle City from 2003 to 2011. According to MZPTO (2007), the first
five years from 2003 to 2007 show only 516 road crashes in the city. However, according
to our findings, the years from 2008 to 2011 revealed the incidence of 1275 road crashes.
This means the occurrence of RTAs in Mekelle City in the last four years from 2008 to
2011 is 2.47 times much higher than the RTAs occurred in the first five years from 2003
to 2007. The RTA incidences of the city have shown an increasing trend in the last
decade except in 2004, 2006 and 2010. At an average, about 103.2 RTAs have occurred
every year in the city between 2003 and 2007 but the occurrence of RTAs have increased
to an average of 318.75 incidences per year from 2008 to 2011. The gradual growth in
vehicle and human population in the city contributed much to the increasing trend of
RTA frequency in Mekelle City especially from the year 2008 to 2011.
Figure 23: Trend of RTA Occurrences in Mekelle City (2003-2011)
Source: MZPTO (2007) and Mekelle City Traffic Office (2012)
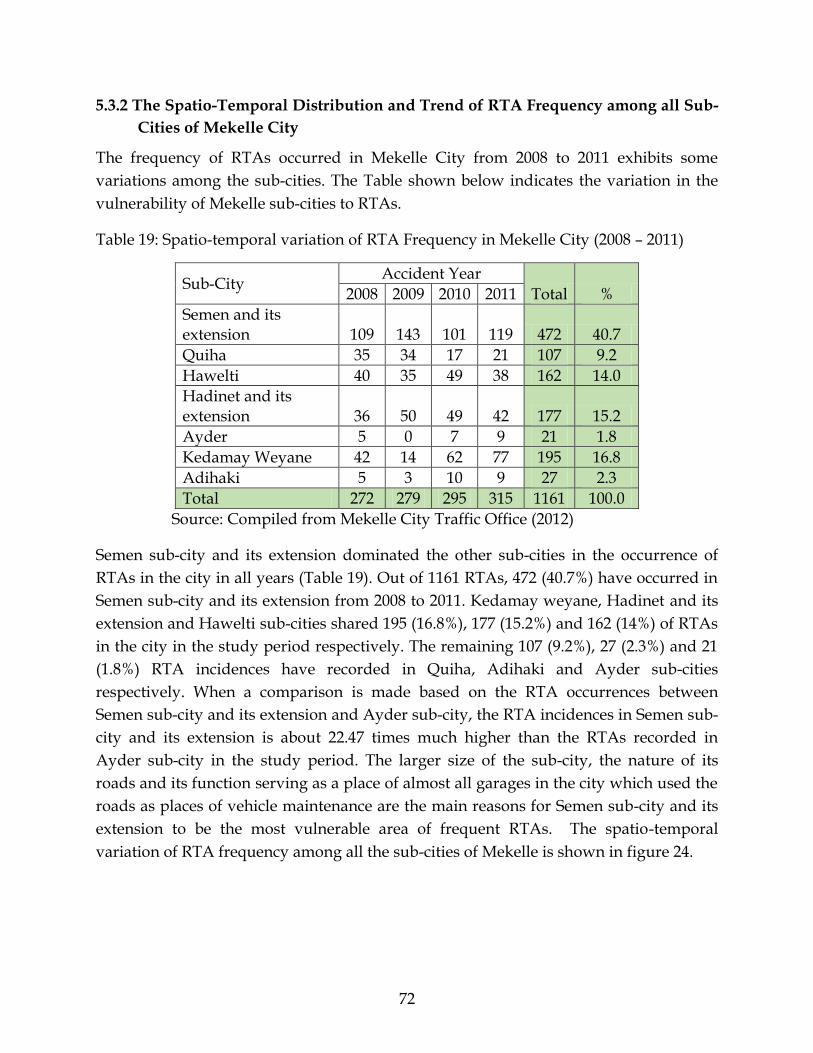
72
5.3.2 The Spatio-Temporal Distribution and Trend of RTA Frequency among all Sub-
Cities of Mekelle City
The frequency of RTAs occurred in Mekelle City from 2008 to 2011 exhibits some
variations among the sub-cities. The Table shown below indicates the variation in the
vulnerability of Mekelle sub-cities to RTAs.
Table 19: Spatio-temporal variation of RTA Frequency in Mekelle City (2008 – 2011)
Sub-City Accident Year
Total % 2008 2009 2010 2011
Semen and its extension 109 143 101 119 472 40.7
Quiha 35 34 17 21 107 9.2
Hawelti 40 35 49 38 162 14.0
Hadinet and its extension 36 50 49 42 177 15.2
Ayder 5 0 7 9 21 1.8
Kedamay Weyane 42 14 62 77 195 16.8
Adihaki 5 3 10 9 27 2.3
Total 272 279 295 315 1161 100.0
Source: Compiled from Mekelle City Traffic Office (2012)
Semen sub-city and its extension dominated the other sub-cities in the occurrence of
RTAs in the city in all years (Table 19). Out of 1161 RTAs, 472 (40.7%) have occurred in
Semen sub-city and its extension from 2008 to 2011. Kedamay weyane, Hadinet and its
extension and Hawelti sub-cities shared 195 (16.8%), 177 (15.2%) and 162 (14%) of RTAs
in the city in the study period respectively. The remaining 107 (9.2%), 27 (2.3%) and 21
(1.8%) RTA incidences have recorded in Quiha, Adihaki and Ayder sub-cities
respectively. When a comparison is made based on the RTA occurrences between
Semen sub-city and its extension and Ayder sub-city, the RTA incidences in Semen sub-
city and its extension is about 22.47 times much higher than the RTAs recorded in
Ayder sub-city in the study period. The larger size of the sub-city, the nature of its
roads and its function serving as a place of almost all garages in the city which used the
roads as places of vehicle maintenance are the main reasons for Semen sub-city and its
extension to be the most vulnerable area of frequent RTAs. The spatio-temporal
variation of RTA frequency among all the sub-cities of Mekelle is shown in figure 24.
73
Figure 24: The Spatio-temporal Distribution and Trend of RTA frequency among all sub-cities of Mekelle City (2008 – 2011)
74
5.3.3 The Spatio-Temporal Distribution and Trend of RTA Frequency in all RTA
Black Spots of Mekelle City
The distribution as well as the frequency of RTAs occurred in the RTA Black Spots of
Mekelle City exhibits both spatial and temporal variation. As shown in table 20 and
figure 25, from the total 247 RTA Spots, 34 different RTA Black Spots have been
identified in the city from 2008 to 2011. In addition to this 600 (51.6%) out of 1161 total
RTA incidences have occurred in these 34 Black Spots. This implies that an average of
17.64 RTAs have been recorded from each RTA Black Spots in the study period. The
frequency of RTA incidences varies from 47 in Trans Ethiopia area to 5 in some city
areas. Semen sub-city and its extension constitute 14 different RTA Black Spots followed
by Hawelti and Hadinet and its extension sub-cities which constitute 5 RTA Black spots
each from 2008 to 2011. In addition to this, Quiha, Kedamay weyane and Adihaki sub-
cities constitute 4, 3 and 2 different RTA Black spots in the study period.
Table 20: All RTA Black Spots and Frequency of RTAs in Mekelle City (2008 – 2011)
RTA Black Spot Code
RTA Black Spot Accident Year Total
RTAs
% 2008 2009 2010 2011
238 Trans Ethiopia 16 14 10 7 47 7.8
245 Yetebaberut, Endasilassie 11 12 13 10 46 7.7
137 Lachi 10 8 9 8 35 5.8
172 Mobil 11 18 2 3 34 5.7
61 Dedebit Micro Finance 15 4 11 3 33 5.5
163 Mesebo Mountain 6 6 8 8 28 4.7
158 Mekelle University, Arid Campus 11 4 5 5 25 4.2
69 Elala 3 11 1 6 21 3.5
74 Enda Gabir Church 2 12 1 5 20 3.3
165 Mesfin Industrial Engineering 5 6 5 4 20 3.3
12 Adi Hawsi 5 3 2 9 19 3.2
65 Donbosco 10 2 6 1 19 3.2
66 Dr. Fitsum Hospital 4 7 3 4 18 3.0
162 Mesebo Cement Factory 1 7 3 7 18 3.0
19 Air Force 8 2 1 5 16 2.7
179 Noc 3 6 4 3 16 2.7
212 Saturday Market 1 8 4 2 15 2.5
11 Adi Haqi Market 2 3 5 3 13 2.2
146 Martyrs Monument 2 4 5 2 13 2.2
151 May Shibti 6 1 4 2 13 2.2
75
RTA Black Spot Code
RTA Black Spot Accident Year Total
RTAs
% 2008 2009 2010 2011
37 Ayder Referral Hospital 4 0 5 3 12 2.0
180 Northern Command 3 5 2 2 12 2.0
18 Agip 1 7 1 2 11 1.8
161 Mercy School 0 2 3 6 11 1.8
237 Total 4 1 5 1 11 1.8
129 Kebelle 18 5 0 4 1 10 1.7
135 Kidane Mihret Church Front 2 5 2 1 10 1.7
142 Maa Garment 2 5 1 2 10 1.7
220 Settlement Area 0 1 6 3 10 1.7
147 May Degene 1 0 1 6 8 1.3
155 Mekelle Bus Station 0 0 2 6 8 1.3
108 Health Station 5 0 0 2 7 1.2
127 Kebelle 17 1 1 1 3 6 1.0
50 City Area 0 5 0 0 5 0.8
Total 34 160 170 135 135 600 100.0
Source: Compiled from Mekelle City Traffic Office (2012)
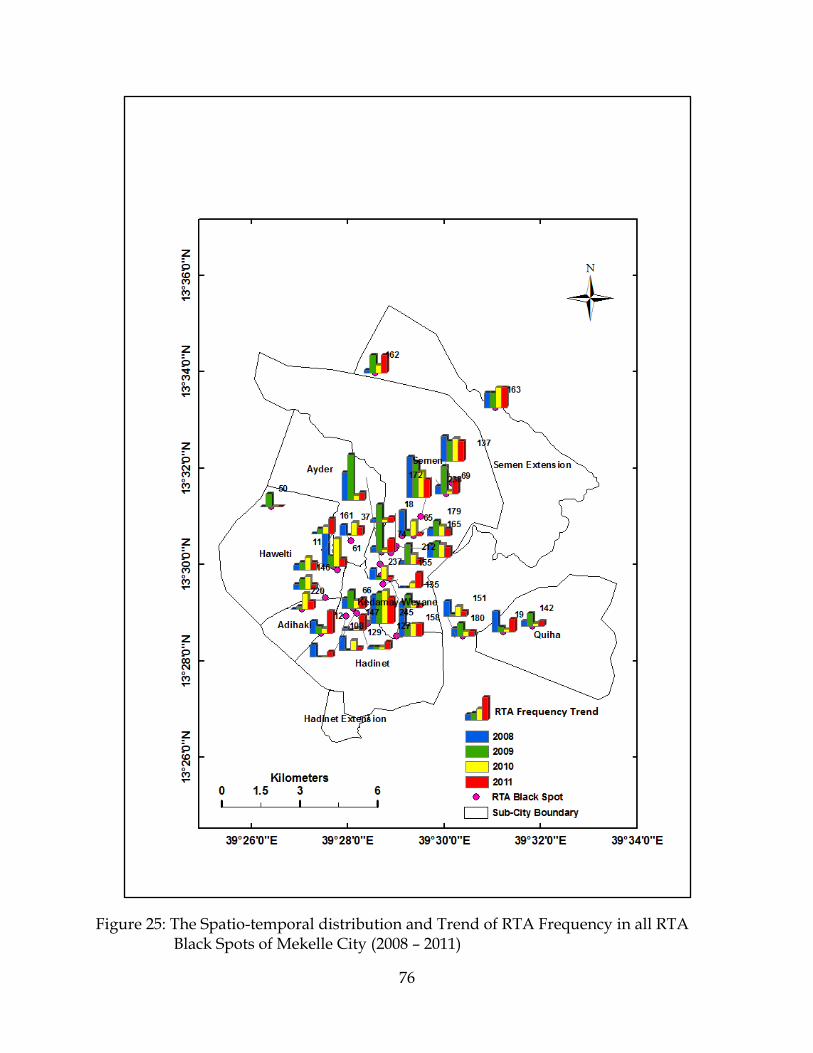
76
Figure 25: The Spatio-temporal distribution and Trend of RTA Frequency in all RTA Black Spots of Mekelle City (2008 – 2011)

77
5.3.4 The Spatio-Temporal Distribution and Trend of RTA Frequency in the Top 10
RTA Black Spots of Mekelle City
It is discussed in the previous part that, about 34 RTA Black Spots have been identified
in the city from 2008 to 2011. This part however focused only on the Top 10 most severe
RTA Black Spots identified in the city in the whole study period from 2008 to 2011. Out
of 600 RTAs recorded from all 34 RTA Black Spots of Mekelle City in the study period,
309 (51.5%) have occurred in the Top 10 RTA Black Spots (Table 21, Figure 26). In
addition to this, 7 out of the top 10 RTA Black Spots are found in the Semen Sub-city
and its extension. The remaining 2 are found in Hadinet sub-city and 1 in Hawelti sub-
city. The remaining Sub-cities do not have RTA Black Spots which could be included in
the top 10 RTA Black Spot level.
Table 21: Top 10 RTA Black Spots and Frequency of RTAs in Mekelle City (2008 – 2011)
RTA Black Spot Code
RTA Black Spot Accident Year
Total RTAs
%
2008 2009 2010 2011
238 Trans Ethiopia 16 14 10 7 47 15.2
245 Yetebaberut, Endasilassie 11 12 13 10 46 14.9
137 Lachi 10 8 9 8 35 11.3
172 Mobil 11 18 2 3 34 11.0
61 Dedebit Micro Finance 15 4 11 3 33 10.7
163 Mesebo Mountain 6 6 8 8 28 9.1
158 Mekelle University, Arid Campus 11 4 5 5 25 8.1
69 Elala 3 11 1 6 21 6.8
74 Enda Gabir Church 2 12 1 5 20 6.5
165 Mesfin Industrial Engineering 5 6 5 4 20 6.5
Total 10 90 95 65 59 309 100.0
Source: Compiled from Mekelle City Traffic Office (2012)
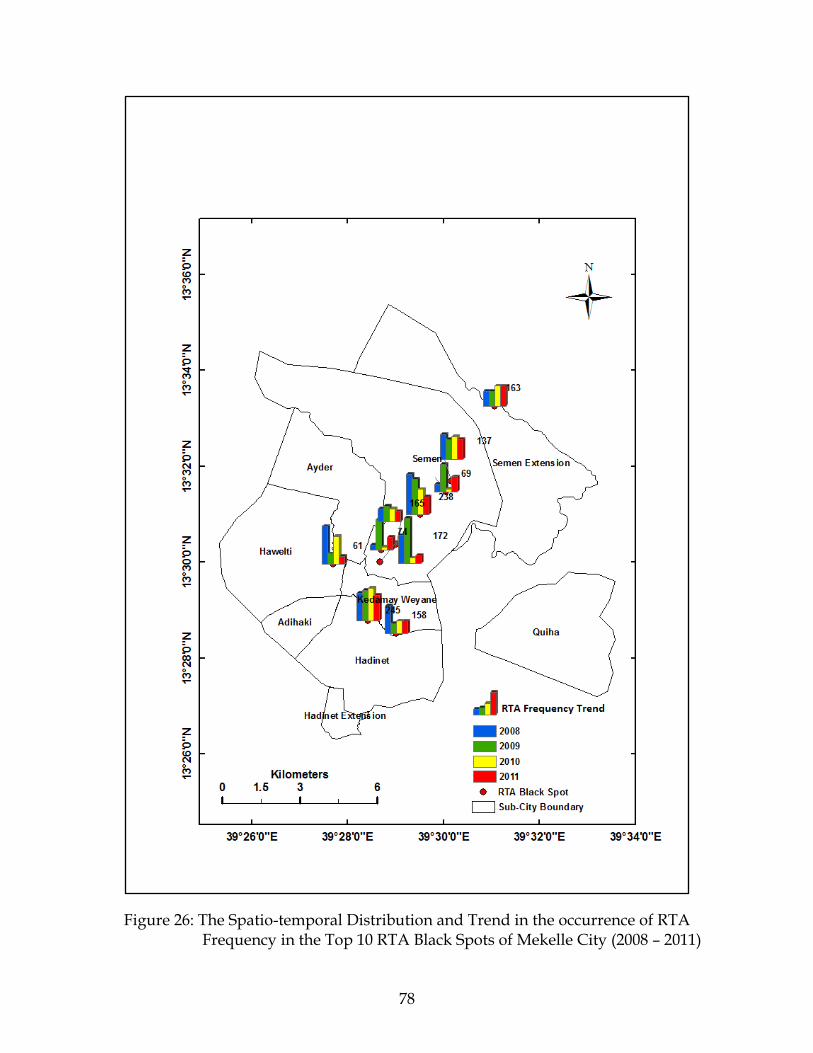
78
Figure 26: The Spatio-temporal Distribution and Trend in the occurrence of RTA Frequency in the Top 10 RTA Black Spots of Mekelle City (2008 – 2011)
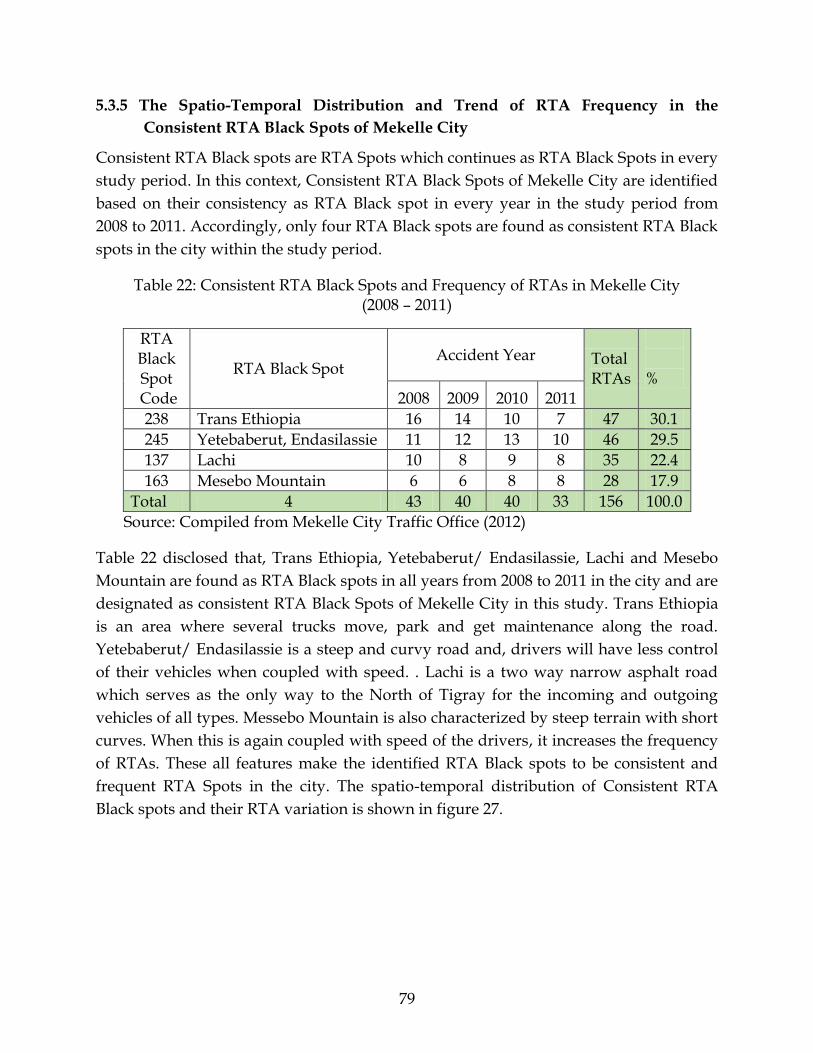
79
5.3.5 The Spatio-Temporal Distribution and Trend of RTA Frequency in the
Consistent RTA Black Spots of Mekelle City
Consistent RTA Black spots are RTA Spots which continues as RTA Black Spots in every
study period. In this context, Consistent RTA Black Spots of Mekelle City are identified
based on their consistency as RTA Black spot in every year in the study period from
2008 to 2011. Accordingly, only four RTA Black spots are found as consistent RTA Black
spots in the city within the study period.
Table 22: Consistent RTA Black Spots and Frequency of RTAs in Mekelle City (2008 – 2011)
RTA Black Spot
Code
RTA Black Spot Accident Year Total
RTAs
%
2008 2009 2010 2011
238 Trans Ethiopia 16 14 10 7 47 30.1
245 Yetebaberut, Endasilassie 11 12 13 10 46 29.5
137 Lachi 10 8 9 8 35 22.4
163 Mesebo Mountain 6 6 8 8 28 17.9
Total 4 43 40 40 33 156 100.0
Source: Compiled from Mekelle City Traffic Office (2012)
Table 22 disclosed that, Trans Ethiopia, Yetebaberut/ Endasilassie, Lachi and Mesebo
Mountain are found as RTA Black spots in all years from 2008 to 2011 in the city and are
designated as consistent RTA Black Spots of Mekelle City in this study. Trans Ethiopia
is an area where several trucks move, park and get maintenance along the road.
Yetebaberut/ Endasilassie is a steep and curvy road and, drivers will have less control
of their vehicles when coupled with speed. . Lachi is a two way narrow asphalt road
which serves as the only way to the North of Tigray for the incoming and outgoing
vehicles of all types. Messebo Mountain is also characterized by steep terrain with short
curves. When this is again coupled with speed of the drivers, it increases the frequency
of RTAs. These all features make the identified RTA Black spots to be consistent and
frequent RTA Spots in the city. The spatio-temporal distribution of Consistent RTA
Black spots and their RTA variation is shown in figure 27.
80
Figure 27: The spatio-temporal Distribution and Trend of RTA Frequency in the consistent RTA Black Spots of Mekelle City (2008 – 2011)
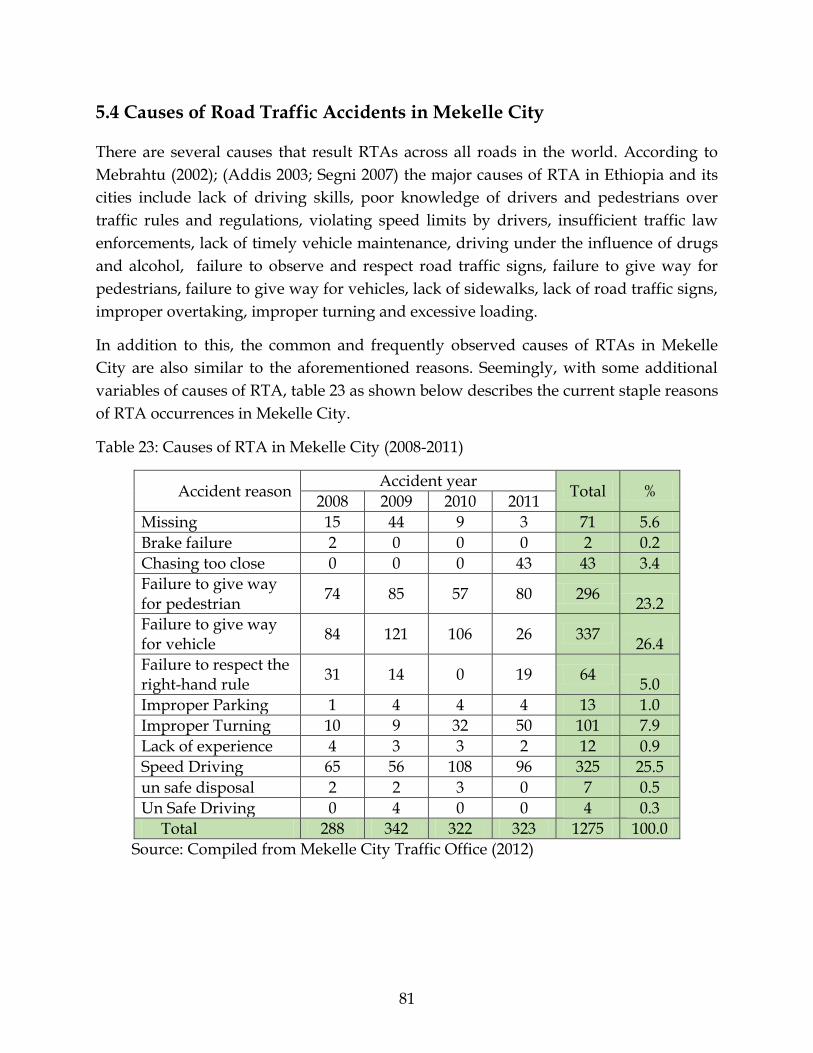
81
5.4 Causes of Road Traffic Accidents in Mekelle City
There are several causes that result RTAs across all roads in the world. According to
Mebrahtu (2002); (Addis 2003; Segni 2007) the major causes of RTA in Ethiopia and its
cities include lack of driving skills, poor knowledge of drivers and pedestrians over
traffic rules and regulations, violating speed limits by drivers, insufficient traffic law
enforcements, lack of timely vehicle maintenance, driving under the influence of drugs
and alcohol, failure to observe and respect road traffic signs, failure to give way for
pedestrians, failure to give way for vehicles, lack of sidewalks, lack of road traffic signs,
improper overtaking, improper turning and excessive loading.
In addition to this, the common and frequently observed causes of RTAs in Mekelle
City are also similar to the aforementioned reasons. Seemingly, with some additional
variables of causes of RTA, table 23 as shown below describes the current staple reasons
of RTA occurrences in Mekelle City.
Table 23: Causes of RTA in Mekelle City (2008-2011)
Accident reason Accident year
Total % 2008 2009 2010 2011
Missing 15 44 9 3 71 5.6
Brake failure 2 0 0 0 2 0.2
Chasing too close 0 0 0 43 43 3.4
Failure to give way for pedestrian
74 85 57 80 296 23.2
Failure to give way for vehicle
84 121 106 26 337 26.4
Failure to respect the right-hand rule
31 14 0 19 64 5.0
Improper Parking 1 4 4 4 13 1.0
Improper Turning 10 9 32 50 101 7.9
Lack of experience 4 3 3 2 12 0.9
Speed Driving 65 56 108 96 325 25.5
un safe disposal 2 2 3 0 7 0.5
Un Safe Driving 0 4 0 0 4 0.3
Total 288 342 322 323 1275 100.0
Source: Compiled from Mekelle City Traffic Office (2012)
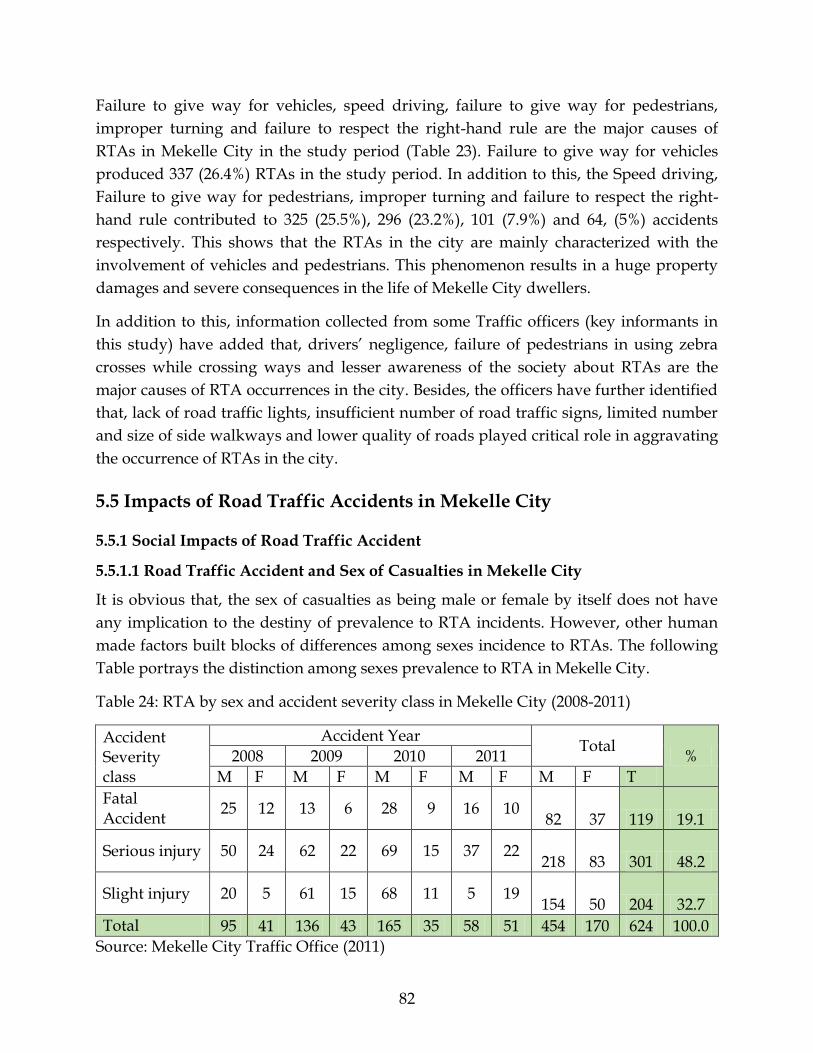
82
Failure to give way for vehicles, speed driving, failure to give way for pedestrians,
improper turning and failure to respect the right-hand rule are the major causes of
RTAs in Mekelle City in the study period (Table 23). Failure to give way for vehicles
produced 337 (26.4%) RTAs in the study period. In addition to this, the Speed driving,
Failure to give way for pedestrians, improper turning and failure to respect the right-
hand rule contributed to 325 (25.5%), 296 (23.2%), 101 (7.9%) and 64, (5%) accidents
respectively. This shows that the RTAs in the city are mainly characterized with the
involvement of vehicles and pedestrians. This phenomenon results in a huge property
damages and severe consequences in the life of Mekelle City dwellers.
In addition to this, information collected from some Traffic officers (key informants in
this study) have added that, drivers’ negligence, failure of pedestrians in using zebra
crosses while crossing ways and lesser awareness of the society about RTAs are the
major causes of RTA occurrences in the city. Besides, the officers have further identified
that, lack of road traffic lights, insufficient number of road traffic signs, limited number
and size of side walkways and lower quality of roads played critical role in aggravating
the occurrence of RTAs in the city.
5.5 Impacts of Road Traffic Accidents in Mekelle City
5.5.1 Social Impacts of Road Traffic Accident
5.5.1.1 Road Traffic Accident and Sex of Casualties in Mekelle City
It is obvious that, the sex of casualties as being male or female by itself does not have
any implication to the destiny of prevalence to RTA incidents. However, other human
made factors built blocks of differences among sexes incidence to RTAs. The following
Table portrays the distinction among sexes prevalence to RTA in Mekelle City.
Table 24: RTA by sex and accident severity class in Mekelle City (2008-2011)
Accident Severity class
Accident Year Total
% 2008 2009 2010 2011
M F M F M F M F M F T
Fatal Accident
25 12 13 6 28 9 16 10 82 37 119 19.1
Serious injury 50 24 62 22 69 15 37 22 218 83 301 48.2
Slight injury 20 5 61 15 68 11 5 19 154 50 204 32.7
Total 95 41 136 43 165 35 58 51 454 170 624 100.0
Source: Mekelle City Traffic Office (2011)
83
The number of persons who lost their lives, lost either of parts of their body and visits a
hospital due to RTAs were 119, 301 and 204 respectively (Table 24). The data in the table
also proves that, males are more frequently vulnerable to road crashes than females in
the city. According to the data, 454 (72.75%) males and 170 (27.24%) females were
victims of RTAs in the city from 2008 to 2011. This indicates that, males are 2.67 times
more prevalent to RTAs than females in Mekelle City. More specifically, males are 2.21
times, 2.62 times and 3.08 times much vulnerable than females to fatal accidents, serious
injury and slight injury in Mekelle City respectively. In addition to this, males are more
victims of RTAs than females in all accident severity classes and in all years from 2008
to 2011. Such amount of difference among sexes in their prevalence to RTA in Mekelle
City is a manifestation of various factors. Since majority of the drivers are males and are
the main sources of economies, they are found to be the most victims of RTAs. This
gender based difference in RTAs of Mekelle City is similar to the findings of (WHO
2004). A study by WHO (2004) conducted across WHO member countries specified that
in 2002, males accounted for 73% of all road traffic deaths, with an overall rate almost
three times that for females: 27.6 per 100, 000 for male population and 10.4 per 100, 000
for female population, respectively. Road traffic mortality rates are higher in men than
in women in all regions regardless of income level, and also across all age groups. At an
average, males in the low-income and middle-income countries of the WHO Africa
Region and the WHO Eastern Mediterranean Region have the highest road traffic injury
mortality rates worldwide. The gender difference in mortality rates is probably related
to both exposure and risk-taking behavior (WHO 2004). In addition to this Addis (2003)
have stated that the risk of males to be involved in RTAs is three to four times higher
than females in Bahir Dar City.
5.5.1.2 Road Traffic Accident by Accident Severity Classes and by age of casualties in
Mekelle City
All age segments may not be equally exposed to RTAs. The economic role and
responsibility of the age groups in the community could contribute to the fatality of age
groups in road crashes. Table 25, shows RTA by accident severity classes in Mekelle
City between the years 2008 to 2011.
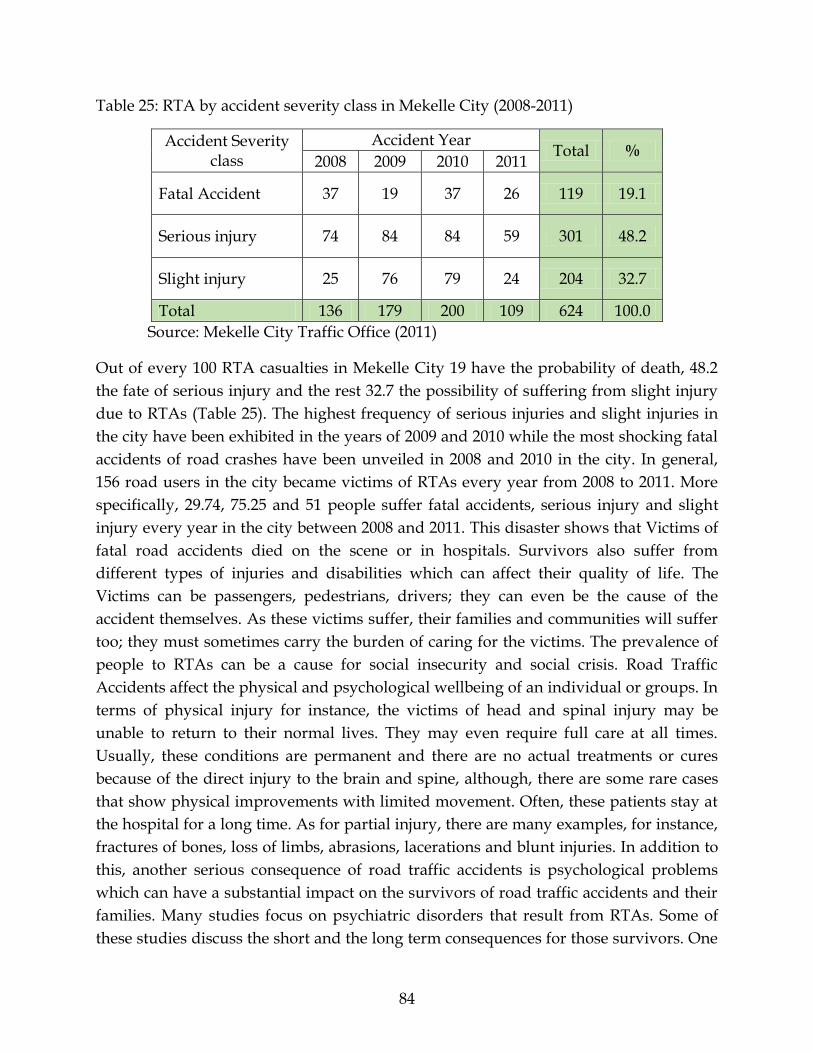
84
Table 25: RTA by accident severity class in Mekelle City (2008-2011)
Accident Severity class
Accident Year Total %
2008 2009 2010 2011
Fatal Accident 37 19 37 26 119 19.1
Serious injury 74 84 84 59 301 48.2
Slight injury 25 76 79 24 204 32.7
Total 136 179 200 109 624 100.0
Source: Mekelle City Traffic Office (2011)
Out of every 100 RTA casualties in Mekelle City 19 have the probability of death, 48.2
the fate of serious injury and the rest 32.7 the possibility of suffering from slight injury
due to RTAs (Table 25). The highest frequency of serious injuries and slight injuries in
the city have been exhibited in the years of 2009 and 2010 while the most shocking fatal
accidents of road crashes have been unveiled in 2008 and 2010 in the city. In general,
156 road users in the city became victims of RTAs every year from 2008 to 2011. More
specifically, 29.74, 75.25 and 51 people suffer fatal accidents, serious injury and slight
injury every year in the city between 2008 and 2011. This disaster shows that Victims of
fatal road accidents died on the scene or in hospitals. Survivors also suffer from
different types of injuries and disabilities which can affect their quality of life. The
Victims can be passengers, pedestrians, drivers; they can even be the cause of the
accident themselves. As these victims suffer, their families and communities will suffer
too; they must sometimes carry the burden of caring for the victims. The prevalence of
people to RTAs can be a cause for social insecurity and social crisis. Road Traffic
Accidents affect the physical and psychological wellbeing of an individual or groups. In
terms of physical injury for instance, the victims of head and spinal injury may be
unable to return to their normal lives. They may even require full care at all times.
Usually, these conditions are permanent and there are no actual treatments or cures
because of the direct injury to the brain and spine, although, there are some rare cases
that show physical improvements with limited movement. Often, these patients stay at
the hospital for a long time. As for partial injury, there are many examples, for instance,
fractures of bones, loss of limbs, abrasions, lacerations and blunt injuries. In addition to
this, another serious consequence of road traffic accidents is psychological problems
which can have a substantial impact on the survivors of road traffic accidents and their
families. Many studies focus on psychiatric disorders that result from RTAs. Some of
these studies discuss the short and the long term consequences for those survivors. One

85
study by Blanchard and Veazey (2001) shows that one-third of young survivors
experience a psychological disorder in the early stages and about 25% manifest
symptoms for up to 1 year later. Families also suffer from their children’s involvement
in RTAs. They are considered another hidden victim of RTAs, and need care and
support just like other RTA victims or survivors. Families can be affected
psychologically and socially. High levels of anxiety, depression, irritability and mood
disturbances are the most common psychological symptoms among victims’ relatives
(Livingston and Brooks 1988).
The distributions of RTAs among different age groups have a serious social impact. All
age groups are not equally vulnerable to road crashes in Mekelle City. The data which
shows the prevalence of different age categories via accident severity class is only
available for the years 2010 and 2011 in the Mekelle City Traffic Office. The analysis is
therefore made based on the existing data.
Adults found between the ages of 18 to 30 and 31 to 50 are the most susceptible age
groups to RTA in Mekelle City. Adults between 18 to 30 years of age contribute for 168,
(54.4%) of road crashes occurred in the city between 2010 and 2011. The severity rate of
RTA in all severity classes is much higher in the age groups of 18 to 30 than the others
in the last two years. In addition to this, 82 (26.5%) adults aged 31 to 50 years had RTAs
in the city during the two years period. Children whose age is below 18 years are also
the victims of road crashes in the city. The numbers of children who become victims of
RTAs in the city in the last two years are 34 (11%). In addition to this, 25 (8.1%) people
whose age is more than 50 also suffered from road crashes in Mekelle City. This
panorama which results in the sufferings of children under the age of 18 and productive
population between the ages of 18 to 50 drastically affects the wellbeing of the society in
the city. This is because, the RTA is obscuring the future of children and complicating
the life of the adult in the city. The situation of children and adults as being the frequent
victims of RTA in Mekelle City is found to be similar with the case studied by WHO
across the globe. WHO (2004) stated that, over 50% of the global mortality due to road
traffic injury occurs among young adults aged between 15 and 44 years, and the rates
for this age group are higher in low-income and middle-income countries.
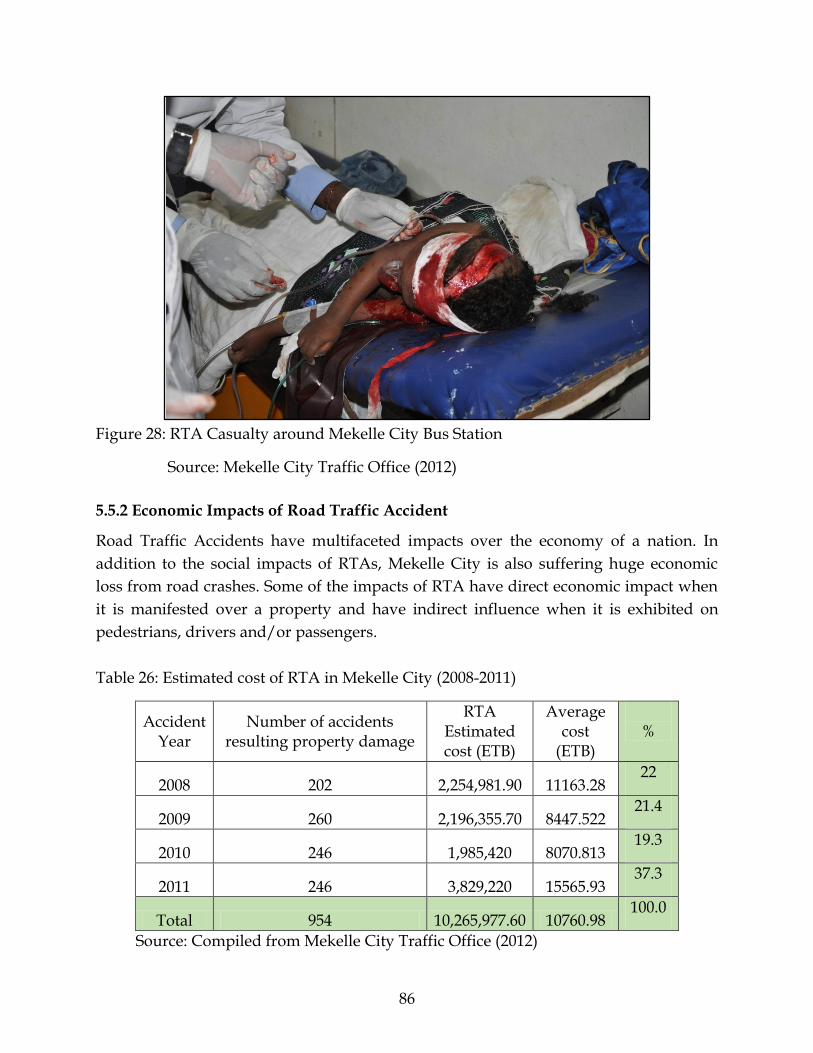
86
Figure 28: RTA Casualty around Mekelle City Bus Station
Source: Mekelle City Traffic Office (2012)
5.5.2 Economic Impacts of Road Traffic Accident
Road Traffic Accidents have multifaceted impacts over the economy of a nation. In
addition to the social impacts of RTAs, Mekelle City is also suffering huge economic
loss from road crashes. Some of the impacts of RTA have direct economic impact when
it is manifested over a property and have indirect influence when it is exhibited on
pedestrians, drivers and/or passengers.
Table 26: Estimated cost of RTA in Mekelle City (2008-2011)
Accident Year
Number of accidents resulting property damage
RTA Estimated cost (ETB)
Average cost
(ETB)
%
2008 202 2,254,981.90 11163.28 22
2009 260 2,196,355.70 8447.522 21.4
2010 246 1,985,420 8070.813 19.3
2011 246 3,829,220 15565.93 37.3
Total 954 10,265,977.60 10760.98 100.0
Source: Compiled from Mekelle City Traffic Office (2012)
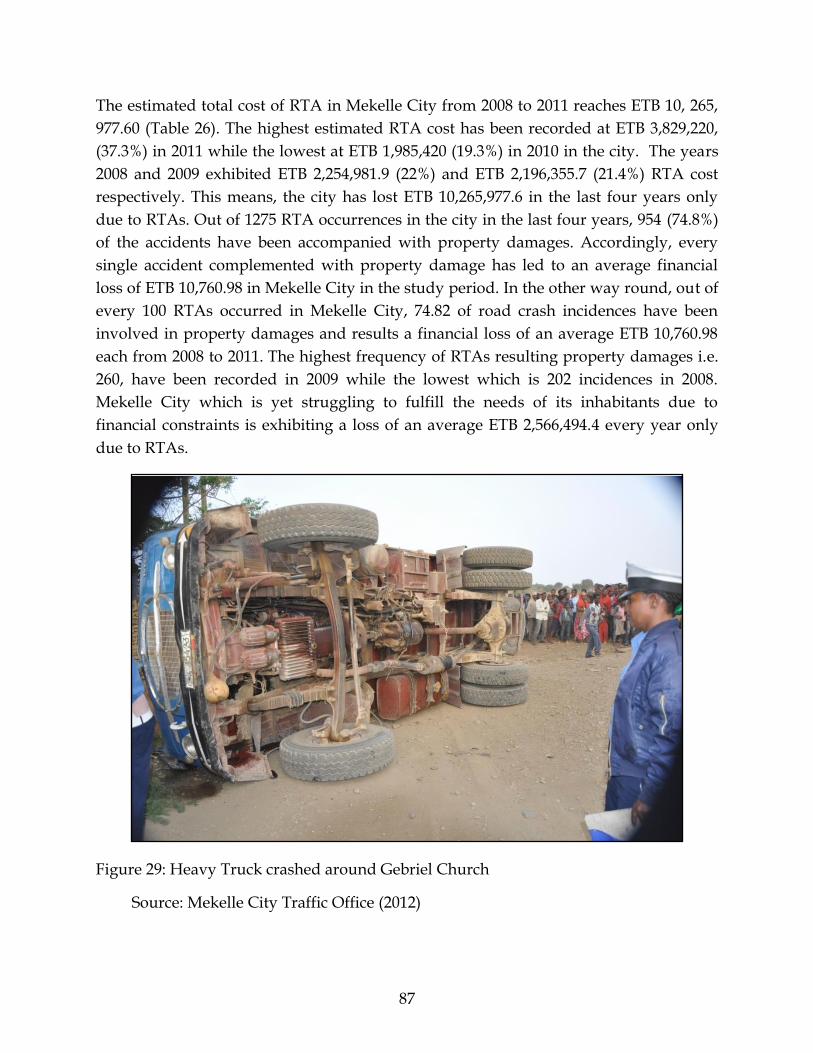
87
The estimated total cost of RTA in Mekelle City from 2008 to 2011 reaches ETB 10, 265,
977.60 (Table 26). The highest estimated RTA cost has been recorded at ETB 3,829,220,
(37.3%) in 2011 while the lowest at ETB 1,985,420 (19.3%) in 2010 in the city. The years
2008 and 2009 exhibited ETB 2,254,981.9 (22%) and ETB 2,196,355.7 (21.4%) RTA cost
respectively. This means, the city has lost ETB 10,265,977.6 in the last four years only
due to RTAs. Out of 1275 RTA occurrences in the city in the last four years, 954 (74.8%)
of the accidents have been accompanied with property damages. Accordingly, every
single accident complemented with property damage has led to an average financial
loss of ETB 10,760.98 in Mekelle City in the study period. In the other way round, out of
every 100 RTAs occurred in Mekelle City, 74.82 of road crash incidences have been
involved in property damages and results a financial loss of an average ETB 10,760.98
each from 2008 to 2011. The highest frequency of RTAs resulting property damages i.e.
260, have been recorded in 2009 while the lowest which is 202 incidences in 2008.
Mekelle City which is yet struggling to fulfill the needs of its inhabitants due to
financial constraints is exhibiting a loss of an average ETB 2,566,494.4 every year only
due to RTAs.
Figure 29: Heavy Truck crashed around Gebriel Church
Source: Mekelle City Traffic Office (2012)
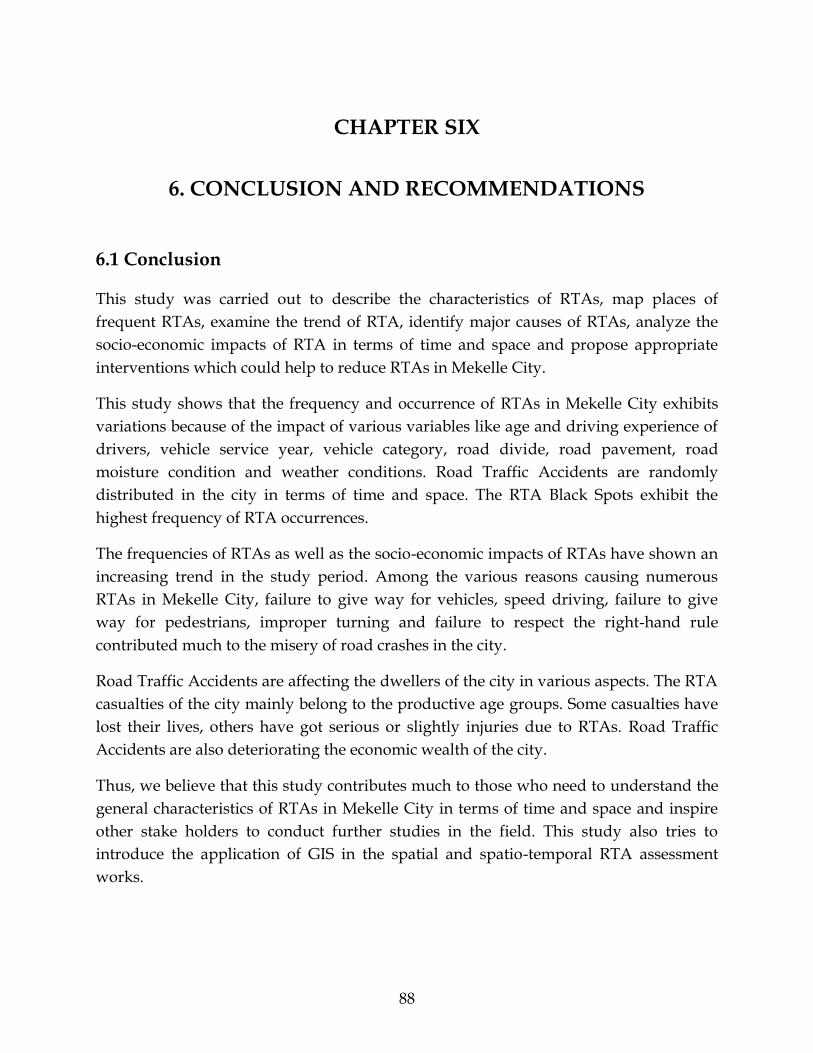
88
CHAPTER SIX
6. CONCLUSION AND RECOMMENDATIONS
6.1 Conclusion
This study was carried out to describe the characteristics of RTAs, map places of
frequent RTAs, examine the trend of RTA, identify major causes of RTAs, analyze the
socio-economic impacts of RTA in terms of time and space and propose appropriate
interventions which could help to reduce RTAs in Mekelle City.
This study shows that the frequency and occurrence of RTAs in Mekelle City exhibits
variations because of the impact of various variables like age and driving experience of
drivers, vehicle service year, vehicle category, road divide, road pavement, road
moisture condition and weather conditions. Road Traffic Accidents are randomly
distributed in the city in terms of time and space. The RTA Black Spots exhibit the
highest frequency of RTA occurrences.
The frequencies of RTAs as well as the socio-economic impacts of RTAs have shown an
increasing trend in the study period. Among the various reasons causing numerous
RTAs in Mekelle City, failure to give way for vehicles, speed driving, failure to give
way for pedestrians, improper turning and failure to respect the right-hand rule
contributed much to the misery of road crashes in the city.
Road Traffic Accidents are affecting the dwellers of the city in various aspects. The RTA
casualties of the city mainly belong to the productive age groups. Some casualties have
lost their lives, others have got serious or slightly injuries due to RTAs. Road Traffic
Accidents are also deteriorating the economic wealth of the city.
Thus, we believe that this study contributes much to those who need to understand the
general characteristics of RTAs in Mekelle City in terms of time and space and inspire
other stake holders to conduct further studies in the field. This study also tries to
introduce the application of GIS in the spatial and spatio-temporal RTA assessment
works.
89
6.2 Recommendations
Based on the core findings of this study, the following are recommended.
Majority of the RTAs in Mekelle City are occurring in the day time especially
between 12 pm to 6 pm. Hence, Traffic polices should be assigned in the major
roads and RTA Black Spots of the city to ease the volume of vehicles and
pedestrians. Vehicle parking across main roads of the city at this specific time
which results in traffic congestion needs attention.
Drivers aged 18 to 30 are more frequently involved in RTAs than the other. The
Mekelle City Road Transport and Construction Office which gives the driving
license should seriously assess the capability of drivers and monitor the training
given to learners by private agencies. Special awareness creation programs
should be organized especially for the drivers of this age group so that they
could develop the sense of responsibility and ownership.
Minibuses and three wheeled motors (Bajaj) which are used to convey majority
of the city dwellers are found more likely to be involved in frequent RTAs than
other vehicle types. Therefore, it is recommended that the implementation of
continuous, sudden and special technical investigation as well as training is
required on these vehicle types.
Since two-way roads are more than three times perilous than one-way roads in
Mekelle City, the city administration should focus on widening the existing two-
way roads and the newly constructed roads should preferably be one-way types.
In addition, short junctions and curves were found to be contributing to RTA
hence special attention to new road designs is required.
Speed limits must be placed in shorter distances across asphalt roads since about
71.8% of all the RTAs in the city are exhibited in asphalt pavements and, special
follow-up and fine mechanisms should be put in place.
The vehicle to pedestrian crash is the second most common type of RTA
incidences in Mekelle City next to vehicle to vehicle crash. Hence, continuous
and participatory public campaigns concerning the use of roads should be given
to pedestrians. In line with this, additional pedestrian side walkways must be
constructed in the side of roads of the city.
In order to enable traffic polices control the traffic flow efficiently; road traffic
lights should be placed in the major road junctions so that traffic polices could
control traffic flow of other roads other than mere in the junctions and, special
attention should be given to the RTA black spots already identified.
90
Vehicle maintenance service across and at the side of major roads of the city must
be banned.
The prevalence of road casualties is increasing in terms of number and severity
form time to time in the city. The time which takes to transport casualties from
the place of accident to hospitals or clinics determines the consequence.
Therefore, it is recommended that hospitals be more equipped with an
emergency vehicle /Ambulances/ to safeguard the destiny of survival of RTA
casualties.
The specific locations of many RTA incidences have not been described in the
daily RTA recording format of Mekelle City traffic office. It is therefore
suggested that trainings should be provided to traffic officers on how to use GPS
to specify where the accident has occurred and the data can easily be used to
map and take countermeasures in the RTA risk areas. For this fact, the daily RTA
recording format should be redesigned in a way that the Eastings, Northings and
elevation of the accident spot can be recorded.
Since it is vital for RTA analysis, every RTA incidents must be recorded in the
daily RTA recording format of the city.
An effort has to be made to compile and organize RTA data of the city in
database software or at least in application software programs like Microsoft
office Access or Microsoft office Excel for data retrieval and analysis.
As it can be clearly seen in this research, under-reporting has been challenging
the reliability of the study. Traffic polices should therefore record the accident
data and information on the daily RTA recording format consistently to make the
RTA data complete, meaningful and rational so that proper safety/protection
measures will be put in place.
Efforts should be made by other researchers to curb the multifaceted impacts of
RTA of the city through studying the engineering characteristics of roads and
settlements, drivers driving behavior, law enforcements, pedestrians road using
behaviors, methods of vehicle inspections, role of private driver learning
agencies and the like in Mekelle City.
91
References
Addis, Y. (2003). The Extent, Variation and Causes of Road Traffic Accidents in Bahir Dar. MA in Geography, Addis Ababa University.
Ajit, G. and S. Ripunjoy (2004). A Statistical Analysis of Road Traffic Accidents in Dibrugarh city, Assam, INDIA.
Alister, C., OBE and B. Simon (2011). Licensed to Skill. England and Wales, Institute of Advanced Motorists Limited.
Anderson, T. K. (2009). Kernel density estimation ond K-means to profile road accident hot spots.
Assefa, D. (2012). The impact of urbanization on housing problem: The case of Mekelle City. MSc, Mekelle University.
Austroads (1988). Guide to Traffic Engineering Practice. Sydney.
Bamford, G. and H. Robinson (1978). Geography of Transport. England, London, East over: Macdonald and Evans Ltd. London.
Belachew, M. (1997). "Some Thoughts on Intra-Urban Transport Problems in Ethiopia, The Case of the Anbessa City Bus Transport." Journal of Development Research 19(1).
Berhanu, G. (2000). Effects of Road and Traffic Factors on Road Safety in Ethiopia. Trodhium, Norway.
Blanchard, E. B. and C. H. Veazey (2001). Mental Disorders resulting from road traffic accidents.
Bunn, F., T. Collier, et al. (2003). Traffic calming for the prevention of road traffic injuries: Systematic review and meta-analysis.
CSA (2007). Population and Housing census of Ethiopia.
CSA (2007). Population Size of Towns by Sex, Region, Zone and Wereda.
CSA (2013). Ethiopian Population Projection Figures. Population Projection.
Elvic and Runee (2008). A Survey of Operational definitions of hazardous road locations in some European countries. Accident Analysis and Prevention.
Elvic, Runee, et al. (2005). The Handbook of Road Safety Measures. London, Elsevier Ltd.
Erdogan, S. (2009). Explorative spatial analysis of traffic accident statistics and road mortality among the province of Turkey.
92
FAO (2006). Guidelines for Soil Description. Viale delle Terme di Caracalla, 00100 Rome, Italy, Food and Agriculture Organization of the United Nations.
Geurts, K. and G. Wets (2003). Black Spot Analysis Methods: Literature Review. Belgium, Onderzoekslijn Kennis Verkeersonveiligheid.
Geurts, K., G. Wets, et al. (2004). Identification and ranking of black spots: Sensitivity analysis.
Gibson, D. (1975). "How to win the war against the Motorway." Evening Times.
Goodall, B. (1987). The Penguin Dictionary of Human Geography. England, Penguin Books,England.
Guo, Z., J. Gao, et al. (2003). The Road Safety Situation Investigation and Characteristics Analysis of Black Spots of Arterials Highways. Shanghai, China, Key Laboratory of Road and Traffic Engineering of the Ministry of Education, Tongji University, Shanghai 200092.
Hoobs, F. D. (1979). Traffic Planning and Engineering. New York, Pergamon Press.
Jonnessen, S. and K. Sakshaug (2006). Lecture Note in Traffic Safety and Environmental Engineering. Addis Ababa, Ethiopia, Addis Ababa University.
Joseph, A., Shyngle (1980). A Study of Road Traffic Accidents in Lagos. Degree of Doctor of Medicine, Lagos University Teaching Hospital.
Khanna, S. K. and C. E. G. Justo (1986). Highway Engineering, Nem Chand and BROS. Roorkee.
Kifle, A. (1996). Road Safety Management Crisis in Ethiopia. Unpublished.
Li, L. and Y. Zhang (2008). Bayesian approach based on geographic informatin systems to identify hazardous roadway segments for traffic crashes.
Lisa, K. S., B. David, et al. (2005). Evaluation of Traffic Crash Fatality Causes and Effect. Florida State, Florida A and M University, Florida State University.
Livingston, M. G. and D. N. Brooks (1988). "The burden on families of the brain injured:a review." Head Trauma Rehabil Journal.
MAO (2010). The Northern Star. Mekelle City Bulletin. Mekelle, Mekelle Administration Office, Rehoboth Ethiopia.
Mebrahtu, B. (2002). Taxi Traffic Accidents In Addis Ababa:Causes, Temporal And Spatial Variations And Consequences. MA, Addis Ababa University.
Mekonnen, T. (2007). Emprical Analysis on Traffic Accidents involving human injuries:The case of Addis Ababa. MSc, Addis Ababa University.

93
Mohammed, M. (2011). Costing Road Traffic Accidents in Ethiopia. MSc, Addis Ababa University.
MZPTO (2007). Mekelle Zone Road Traffic Accident Report , 2003-2007.
Naci, H., D. Chislom, et al. (2008). Distribution of Road Traffic Deaths by Road user group: A global comparison.
NMA (2009). Climate Data Of Mekelle City, National Meteorological Agency of Ethiopia.
Odero, W. (2004). Africa's Epidemic of Road Traffic Injuries: Trends, Risk factors and Strategies for Improvement.
Persson, A. (2008). "Advances in Transportation Studies " An International Journal XV(Section A 15).
Peters, J. H. (1982). Transportation and Society. Washington D.C, World Bank.
Rallis, T. (1997). Intercity Transport Engineering and Planning, Mac Milan Press Ltd.
Rokytova, J. (2000). Black Spots Treatment on Routes in Rural Areas. Transport Research Center, Czech Republic.
RoTA (1994). Road Traffic Accidents in NSW-1993. , Sydney: Roads and Traffic Authority of NSW.
Safecarguide. (2004). Retrieved April 25, 2013, from http//www.safecarguide.com/exp/intro/idx.htm.
Samson, F. (2006). Analysis of Traffic Accident in Addis Ababa: Traffic Simulation. MSc in Addis Ababa University.
Sandra, V., Gomes (2000). Low-cost engineering measures for casualty reduction.
Segni, G. (2007). Causes of Road Traffic Accidents and Possible Counter Measures on Addis Ababa-Shashemene Roads. MSc, Addis Ababa University.
Taylor, M. A. P., P.W., Bonsall, et al. (2000). Understanding Traffic Systems: Data, Analysis and Presentation, Aldershot: Ashgate.
Terje, A. (1998). Road Safety in Africa Appraisal Of Road Safety.
Tesema (2005). "Rule Mining And Classification Of Road Traffic Accidents Using Adaptive Regression Trees." International Journal of Simulation Systems 6(Science & Technology Special Issue on Soft Computing for Modeling and Simulation.).
Thomas, I. (1996). Spatial Data Aggregation: Exploratory analysis of road accidents.
94
TRB (1987). Designing Safer Roads. T. R. Board. Washington, D.C, National Research Council.
TRPC (2010). Tigray Region Road Traffic Accident Report, Unbublished report.
UN (2009). United Nations Economic Commission for Africa. Road Safety in Ethiopia.
UN (2010). The Ethiopia's MDGs progressreport.
UN (2011). The Africa Report.
UN (2011). The Global Road Safety Facility.
Ung, C. H., H.E (2007). Road Safety in Cambodia. H. E. U. C. Hour. Phnom Penh, Ministry of public works and transport.
Vasudevan, V., S. Pulugurtha, et al. (2007). Methods to prioritize pedestrain high-crash locations and statistical analysis of their relationships.
Walmsley, D., Summersgill, et al. (1998). Accidents on Modern Rural Single-carriage Way Trunk Roads. TRL 336, England. 31.
WB. (2012). "World Bank’s classification of countries by income group ", from http://www.gfmag.com/tools/global-database/economic-data/12066-countries-by-income-group.html#ixzz2XyCdW98s
WHO (2004). World Report on Road Traffic Injury Prevention. Margie Peden, Richard Scurfield, David Sleetet al. Geneva, World Health Organization.
WHO (2009). Global Status Report On Road Safety. Time For Action. Switzerland, WHO.
WHO (2010). The Road Safety Annual Report.
WHO (2010). A road safety manual for decision-makers and practitioners. France, WHO.
WHO (2011). Decade of Action for Road Safety 2011-2020. Global launch. Switzerland
WHO (2013). Global Status Report On Road Safety. Geneva 27, Switzerland.
Wough, D. (1990). Geography, An integral approach. Hong Kong, Thomas Nelson Ltd.
Xie, Z. and J. Yan (2008). Kernel Density Estimation of Traffic Accidents in a network space.
Yamada, I. and J. C. Thill (2004). "Comparison of planar and network K-Functions in Traffic Accident analysis." Journal of Transport Geography 12(2): 149-158.
95
Appendix 1 Road Traffic Accident Location (RTA Spot) names and Road Traffic Accident
Location (RTA Spot) codes
RTA Location Name (RTA Spot Name) RTA Location
Code (RTA Spot Code)
3rd Police Station 1
Aba Gebremichael School 2
Abebe Garage 3
Abreha Castle 4
Abyssinia Bank 5
Abyssinia Butchery 6
Abyssinia Language Center 7
Adi Ha 8
Adi Haqi 9
Adi Haqi Bridge 10
Adi Haqi Market 11
Adi Hawsi 12
Adi Shim Dihun 13
Adi Shim Dihun Market 14
Adventist School 15
Agazi Hotel, Adi Haqi 17
Agip 18
Air Force 19
Airport Square 20
Alula Avenue 21
Amanuel Clinic 22
Ambassador Hotel 23
Anbessa Bank 24
Araya Degol 25
Aregawi Haile Building 26
Artaele Garage 28
Ashago 29
Ashegoda 30
Aster Kitfo 31
Awash Camp 32
Awash Restaurant 33
Axum Hotel 34
96
RTA Location Name (RTA Spot Name) RTA Location
Code (RTA Spot Code)
Ayder 35
Ayder Bus Stop 36
Ayder Referral Hospital 37
Baloni 38
Biruh Tesfa Car Wash 40
Bridge 41
Bureau Of Agriculture, Kebelle 05 42
Bureau Of Education 43
Bus Stop 44
Café Area 45
Catholic Church 46
Cement Market 47
Cherkos Church 48
China Camp 49
City Area 50
Commercial Area 51
Commercial Bank Of Ethiopia 52
Crs 53
Customs Office 54
Daero Academy 55
Dagim Amsal School 56
Dalas Hotel 57
Debre Damo Hotel 58
Debregenet Condominium 59
Debri Steep Area 60
Dedebit Micro Finance 61
Dejen Bureau 62
Desta Alcohol Factory 63
Desta Printing Press 64
Donbosco 65
Dr. Fitsum Hospital 66
Dr.Solomon Enquay House 67
Effort 68
Elala 69
Elala Bridge 70
Elala Total 71
Enkodo Traffic Light 72
Enda Denagil 73

97
RTA Location Name (RTA Spot Name) RTA Location
Code (RTA Spot Code)
Enda Gabir Church 74
Enda Maryam Gugsa 75
Enda Michael Church 76
Enda Milaw Mill, Kebelle 12 77
Enda Raisi Park 78
Enda Rufael Church 79
Enkodo Romanat Bank 80
Enkodo School 81
Factory 82
Fasika Hotel 83
Former Business College 84
Fre Abyot School 85
Garad Building 86
Gebriel Church, Hawelti 87
Gebriel Church, Kebelle 17 88
Gelila Engineering 89
Gereb Bubu 90
Gergembez 91
Geza Gerlase 92
Gofla Restaurant 93
Gomista 94
Gotera Gibrina 95
Hadnet Photo Yemane 96
Hadnet Sub-City Administration 97
Hadnet Sub-City Trade And Industry Office 98
Hakfen 99
Hamiday 100
Harmaz Construction Materials Shop 101
Hashenge College 102
Hatse Yohannes Hotel 103
Hawelti 104
Hawelti Administration 105
Hawelti Hotel 106
Hawzen Square 107
Health Station 108
Hen's Market 109
Hibret Bank 110
Hidmo Restaurant 111

98
RTA Location Name (RTA Spot Name) RTA Location
Code (RTA Spot Code)
Hill Top 112
Industry 113
Jibruk 114
Justice Office Front 115
Kalamino Campus 116
Kaleb School 117
Health Station, Kebelle 03 118
Kebede Garage, Mesfin 119
Kebelle 03 120
Kebelle 05 121
Kebelle 06 122
Kebelle 07 123
Kebelle 11 124
Kebelle 14 125
Kebelle 16 126
Kebelle 17 127
Kebelle 17 Market 128
Kebelle 18 129
Kebelle 18 Bus Stop 130
Kebelle 19 131
Qedamay Weyane Administration Office 132
Kenema Pharmacy 133
Ketema Limat 134
Kidane Mihret Church Front 135
Kisanet School 136
Lachi 137
Lachi, Sur Construction 138
Lili Beauty Salon 139
Lucy Hotel (Around Romanat Traffic Light Area) 140
Lucy Park 141
Maa Garment 142
Maekel Tigray Hotel 143
Market Area 144
Mars Engineering College 145
Martyrs Monument 146
May Degene 147
May Duba 148
May Gebel 149
99
RTA Location Name (RTA Spot Name) RTA Location
Code (RTA Spot Code)
May Liham School 150
May Shibti 151
May Siye Snack 152
May Weyni School 153
Medhin Insurance Company 154
Mekelle Bus Station 155
Mekelle Hospital 156
Mekelle Hotel 157
Mekelle University, Arid Campus 158
Mekelle University, Business Campus 159
Menen Hotel 160
Mercy School 161
Mesebo Cement Factory 162
Mesebo Mountain 163
Meserete School 164
Mesfin Industrial Engineering 165
Meskerem Hospital 166
Messebo Abattoir 167
Mihret Bakery 168
Milano Hotel 169
Milkana Café 170
Mizer Avenue 171
Mobil 172
Moloti 173
Muslim Cemetery 174
Mussie Avenue 175
National Hotel 176
Nigiste Saba Hotel 177
Nigiste Saba Kindergarten 178
Noc 179
Northern Command 180
Offices Area 181
Old Municipality 182
Old Semien Wereda Administration 183
Oxen Market 184
Photo Fitsum 185
Qedamay Weyane Market Center 186
Quiha Bus Stop 187
100
RTA Location Name (RTA Spot Name) RTA Location
Code (RTA Spot Code)
Quiha Donbosco 188
Quiha Hospital 189
Quiha Inda Milaw Mill 190
Quiha Kebelle 01 191
Quiha Maryam 192
Quiha Mill 193
Quiha Police Training Center 194
Quiha Square 195
Quiha Street 196
Quiha, Andnet Park 197
Quiha, Awash Camp 198
Quiha, Genet Hotel 199
Quiha, Hospital(Hewo) 200
Quiha, May Bandera 201
Quiha, Memorial Hotel 202
Quiha, Momona School 203
Quiha, Old Market 204
Quiha, Sunrise Café 205
Quiha, Zemenawi Butchery 206
Red Cross 207
Rest 208
Romanat Square 209
Sabi Hotel 210
Samre Hotel 211
Saturday Market 212
Segenet Hotel 213
Semien Police Office 214
Semien Sub-City Administration Office 215
Senay Zeben Mill 216
Seti Hotel 217
Setoch 218
Setoch Restaurant 219
Settlement Area 220
Sewhi Nigus 221
Sheba Academy 222
Sheba Leather Factory 223
Sheba University College 224
Sheria Court 225
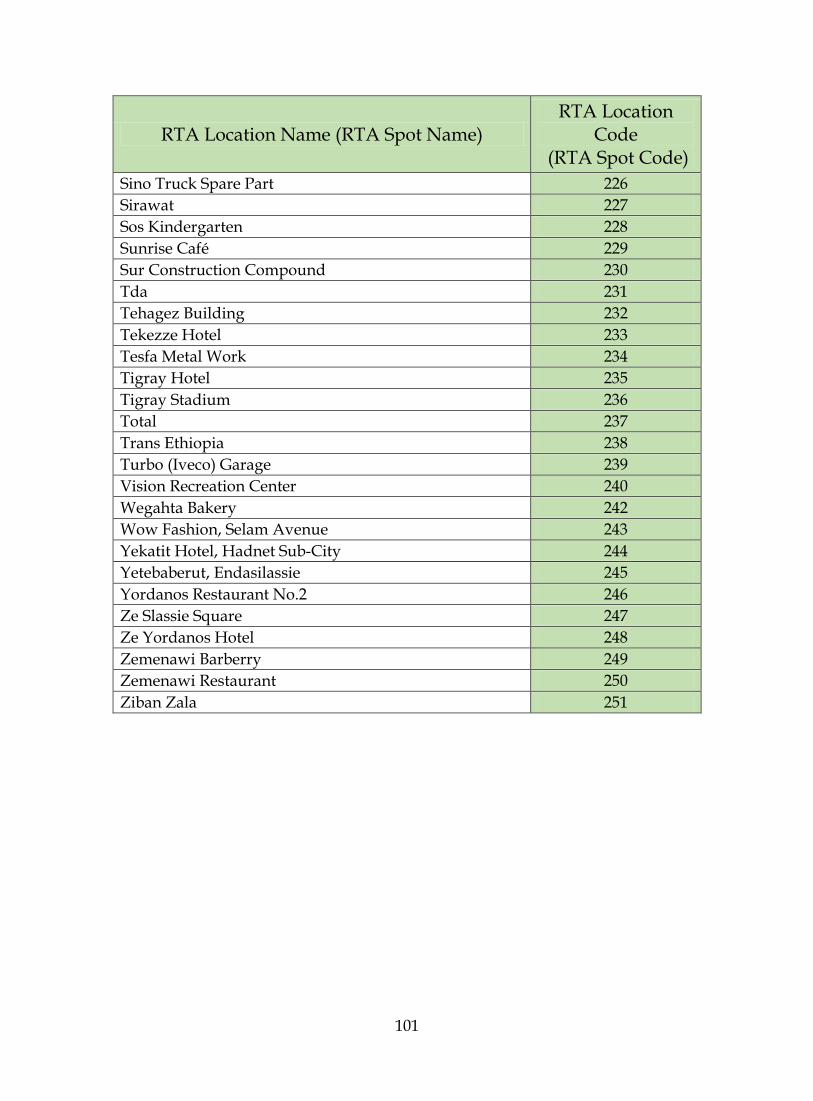
101
RTA Location Name (RTA Spot Name) RTA Location
Code (RTA Spot Code)
Sino Truck Spare Part 226
Sirawat 227
Sos Kindergarten 228
Sunrise Café 229
Sur Construction Compound 230
Tda 231
Tehagez Building 232
Tekezze Hotel 233
Tesfa Metal Work 234
Tigray Hotel 235
Tigray Stadium 236
Total 237
Trans Ethiopia 238
Turbo (Iveco) Garage 239
Vision Recreation Center 240
Wegahta Bakery 242
Wow Fashion, Selam Avenue 243
Yekatit Hotel, Hadnet Sub-City 244
Yetebaberut, Endasilassie 245
Yordanos Restaurant No.2 246
Ze Slassie Square 247
Ze Yordanos Hotel 248
Zemenawi Barberry 249
Zemenawi Restaurant 250
Ziban Zala 251
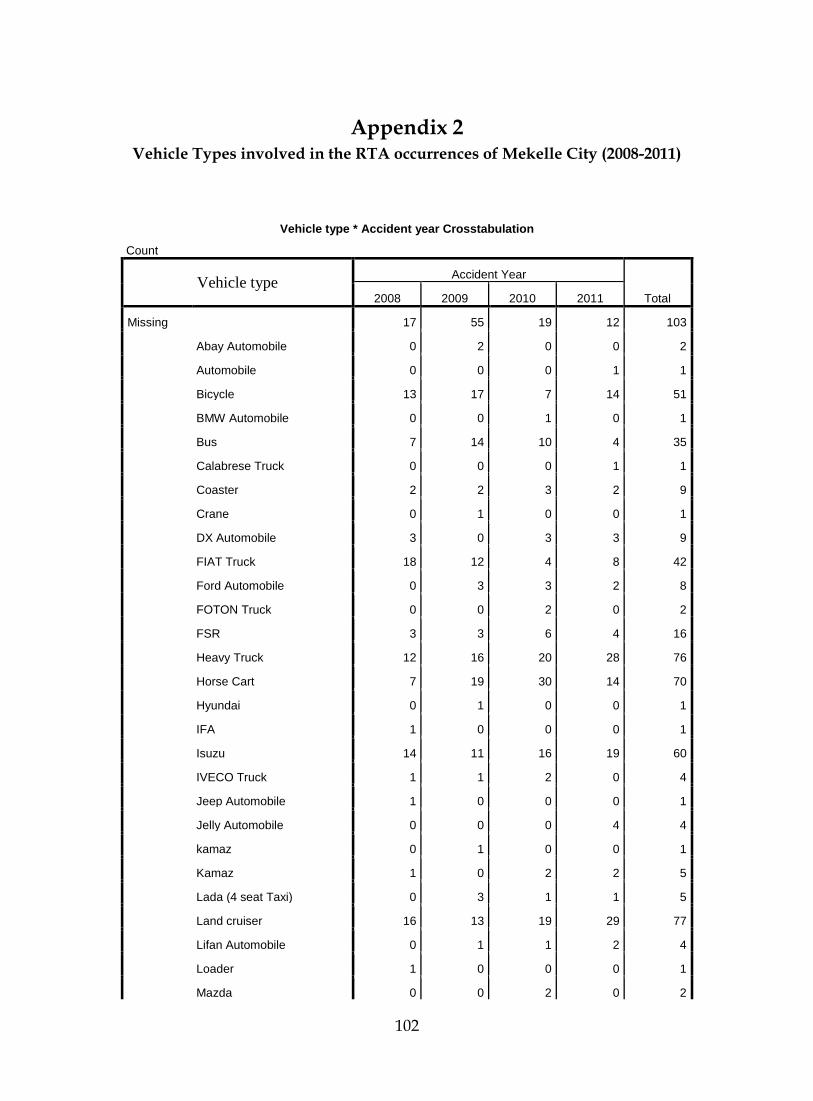
102
Appendix 2 Vehicle Types involved in the RTA occurrences of Mekelle City (2008-2011)
Vehicle type * Accident year Crosstabulation
Count
Vehicle type Accident Year
Total 2008 2009 2010 2011
Missing 17 55 19 12 103
Abay Automobile 0 2 0 0 2
Automobile 0 0 0 1 1
Bicycle 13 17 7 14 51
BMW Automobile 0 0 1 0 1
Bus 7 14 10 4 35
Calabrese Truck 0 0 0 1 1
Coaster 2 2 3 2 9
Crane 0 1 0 0 1
DX Automobile 3 0 3 3 9
FIAT Truck 18 12 4 8 42
Ford Automobile 0 3 3 2 8
FOTON Truck 0 0 2 0 2
FSR 3 3 6 4 16
Heavy Truck 12 16 20 28 76
Horse Cart 7 19 30 14 70
Hyundai 0 1 0 0 1
IFA 1 0 0 0 1
Isuzu 14 11 16 19 60
IVECO Truck 1 1 2 0 4
Jeep Automobile 1 0 0 0 1
Jelly Automobile 0 0 0 4 4
kamaz 0 1 0 0 1
Kamaz 1 0 2 2 5
Lada (4 seat Taxi) 0 3 1 1 5
Land cruiser 16 13 19 29 77
Lifan Automobile 0 1 1 2 4
Loader 1 0 0 0 1
Mazda 0 0 2 0 2
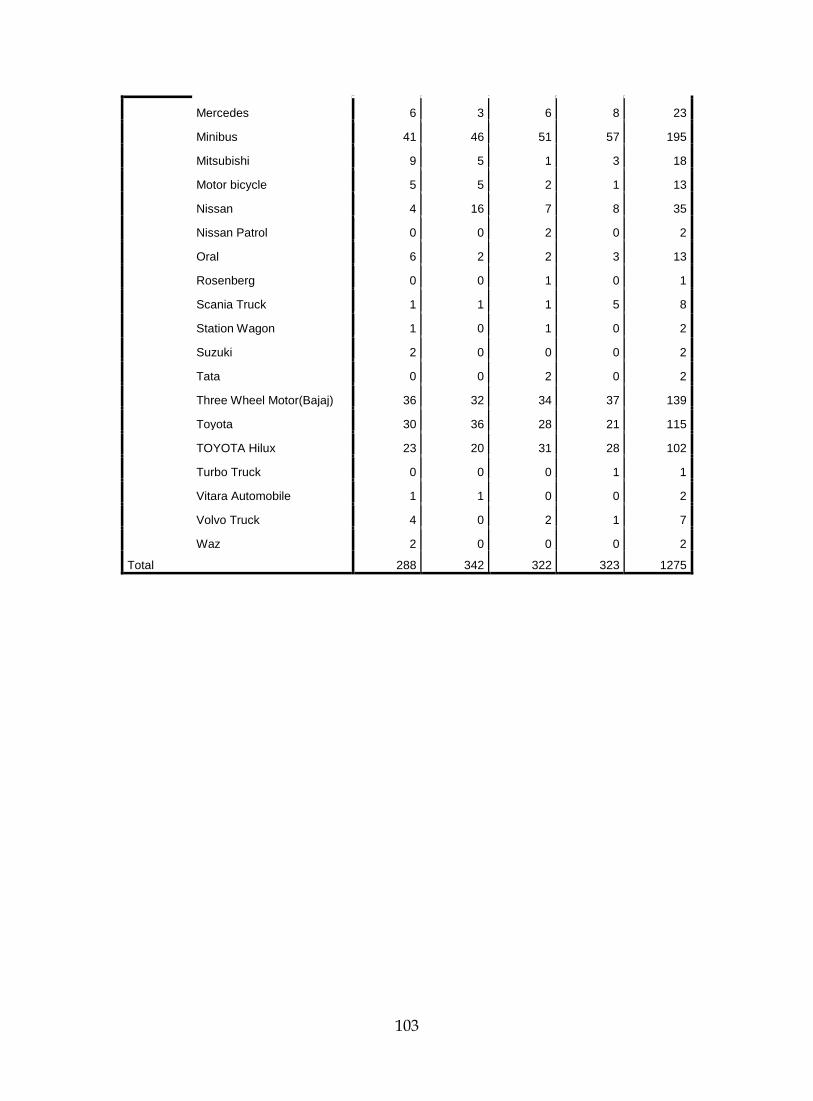
103
Mercedes 6 3 6 8 23
Minibus 41 46 51 57 195
Mitsubishi 9 5 1 3 18
Motor bicycle 5 5 2 1 13
Nissan 4 16 7 8 35
Nissan Patrol 0 0 2 0 2
Oral 6 2 2 3 13
Rosenberg 0 0 1 0 1
Scania Truck 1 1 1 5 8
Station Wagon 1 0 1 0 2
Suzuki 2 0 0 0 2
Tata 0 0 2 0 2
Three Wheel Motor(Bajaj) 36 32 34 37 139
Toyota 30 36 28 21 115
TOYOTA Hilux 23 20 31 28 102
Turbo Truck 0 0 0 1 1
Vitara Automobile 1 1 0 0 2
Volvo Truck 4 0 2 1 7
Waz 2 0 0 0 2
Total 288 342 322 323 1275
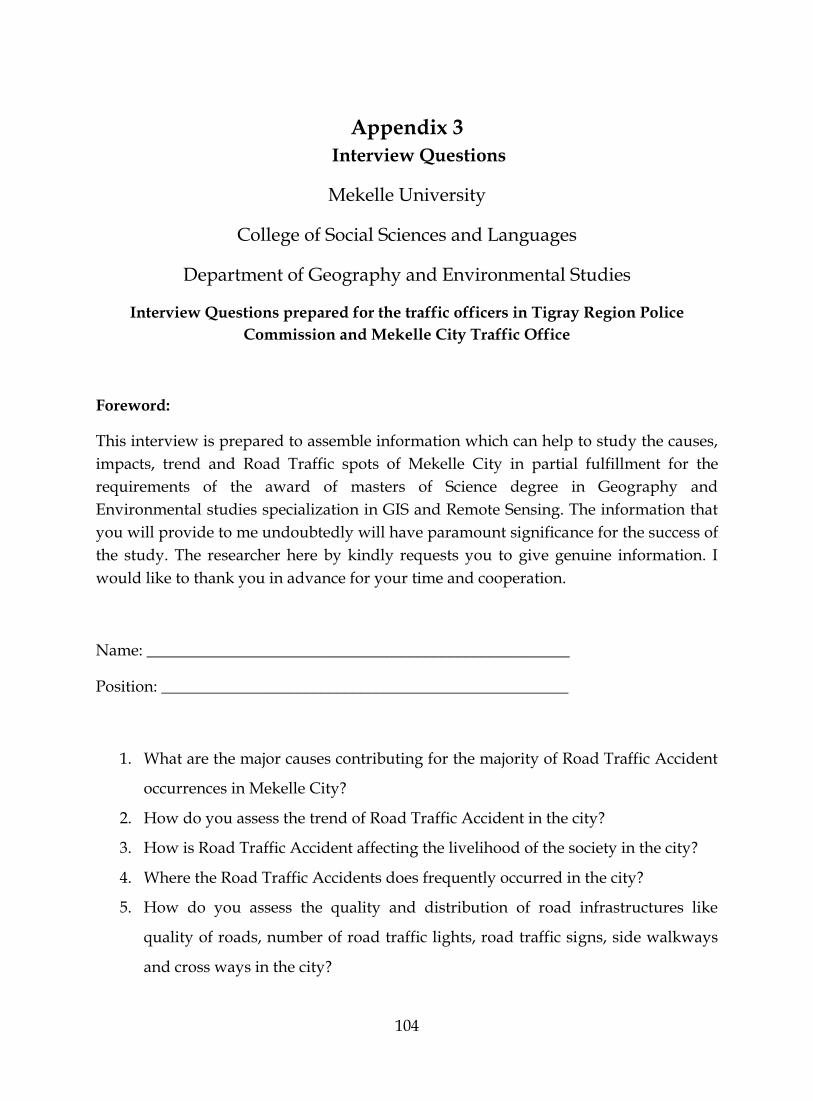
104
Appendix 3
Interview Questions
Mekelle University
College of Social Sciences and Languages
Department of Geography and Environmental Studies
Interview Questions prepared for the traffic officers in Tigray Region Police
Commission and Mekelle City Traffic Office
Foreword:
This interview is prepared to assemble information which can help to study the causes,
impacts, trend and Road Traffic spots of Mekelle City in partial fulfillment for the
requirements of the award of masters of Science degree in Geography and
Environmental studies specialization in GIS and Remote Sensing. The information that
you will provide to me undoubtedly will have paramount significance for the success of
the study. The researcher here by kindly requests you to give genuine information. I
would like to thank you in advance for your time and cooperation.
Name: _____________________________________________________
Position: ___________________________________________________
1. What are the major causes contributing for the majority of Road Traffic Accident
occurrences in Mekelle City?
2. How do you assess the trend of Road Traffic Accident in the city?
3. How is Road Traffic Accident affecting the livelihood of the society in the city?
4. Where the Road Traffic Accidents does frequently occurred in the city?
5. How do you assess the quality and distribution of road infrastructures like
quality of roads, number of road traffic lights, road traffic signs, side walkways
and cross ways in the city?
105
6. How is the service year of vehicles engaged in Road Traffic Accidents assessed?
7. How is the technical condition of vehicles in the time of accident inspected?
8. What methods are applied to assess the slope of roads where Road Traffic
Accidents occur?
9. How is the price of property damages caused by Road Traffic Accidents
estimated?
10. How is the Road Traffic Accident Data recorded?
11. What is done so far to minimize the frequency of occurrence of Road Traffic
Accidents and their consequences?
I Thank You!
Girmay Giday