Measuring attendance: issues and implications for estimating the impact of free-to-view sports events
DAVIES, L. <http://orcid.org/0000-0003-0591-7507>, RAMCHANDANI, G. <http://orcid.org/0000-0001-8650-9382> and COLEMAN, R. <http://orcid.org/0000-0002-2582-7499>
Available from Sheffield Hallam University Research Archive (SHURA) at:
http://shura.shu.ac.uk/2851/
This document is the author deposited version. You are advised to consult the publisher's version if you wish to cite from it.
Published version
DAVIES, L., RAMCHANDANI, G. and COLEMAN, R. (2010). Measuring attendance: issues and implications for estimating the impact of free-to-view sports events. International Journal of Sports Marketing and Sponsorship, 12 (1), 11-23.
Copyright and re-use policy
See http://shura.shu.ac.uk/information.html
Sheffield Hallam University Research Archivehttp://shura.shu.ac.uk
1
Measuring attendance: Issues and implications for estimating the
impact of free-to-view sports events
Dr. Larissa Davies*, Girish Ramchandani, and Richard Coleman
*Corresponding author: Dr. Larissa Davies.
Sport Industry Research Centre
Sheffield Hallam University
Howard Street
Sheffield
S1 1WB
Email: [email protected]
2
Measuring attendance: Issues and implications for estimating the
impact of free-to-view sports events
Abstract
A feature of many non-elite sports events, especially those conducted in public
places is that they are free-to-view. The article focuses on the methodological issue
of estimating spectator attendance at free-to-view events and the consequences of
this for impact evaluation. Using empirical data from three case studies, the article
outlines various approaches to measuring attendance and discusses the key issues
and implications for evaluating free-to-view sports events in the future.
Executive Summary
Since the mid-1990s, literature on major sports events has grown considerably. This
has enhanced knowledge and understanding of how events are organised and
managed, marketed and ultimately measured in terms of their contribution to societal
outcomes. However, previous research focuses on pay-to-view events, with free-to-
view events receiving considerably less attention. The article focuses on estimating
spectator attendance at free-to-view events, and the implications of this for
evaluating impact. It is a methodological issue particularly relevant to non-elite
events, as many are conducted in public places such as roads, parks, beaches and
open waters and are consequently free-to-view. Measuring attendance accurately is
significant for a number of reasons. It indicates the popularity of an event, which is
of interest to organisers, funders and potential sponsors, but it is also considered a
valuable performance indicator for some events. Moreover, it is an important factor
in measuring economic, environmental and social impacts of events.
The article uses empirical data from a marathon event, a cycle road race and a
motorsport event, to examine various approaches to measuring spectator attendance
at free-to view events. For each event, a spectator survey was undertaken to
establish patterns of spectator behaviour, and the article gives details on how this
3
was carried out and used together with other sources of information, to derive
aggregate estimates of attendance.
The article suggests there are a number of considerations that researchers, event
organisers and event funders need to take into account when measuring spectator
attendance at free-to-view events. These include the sampling techniques used for
the spectator surveys, which will be determined by factors such as the spatial layout
and length of the course, access to spectator areas and existing local intelligence;
repeat viewing within a single event, either at multiple locations or on multiple days,
which is often a source of error within estimates of spectator attendance, and
incidental or casual attendance, which can serve to inflate attendance figures. It also
suggests that a major challenge in estimating spectator attendance can be
reconciling the expectations of event organisers and balancing this with rigorous and
robust measurement of spectator attendance, which can often produce estimates
lower than anticipated.
The article concludes that despite the challenges outlined, robust measurement of
attendance is fundamental to ensuring the reliability of event monitoring and
evaluation. It argues that there is a need to move towards a more rigorous,
empirically-based framework for measuring spectator attendance at free-to-view
events, to provide organisers with a more reputable method for evaluating events,
and to provide more credible information for use in marketing and for potential
sponsors of free-to-view events in the future.
4
1 Introduction
Since the mid-1990s there has been a proliferation in major sports event evaluation.
This evaluation has led to a greater understanding of the way that events are
organised and managed, marketed and ultimately measured in terms of their
contribution to economic, social and environmental outcomes. Furthermore, it has
generated an evidence base increasingly used to rationalise and justify the bidding
for and hosting of sports events. However, much of the growth in literature has
focused on events that spectators pay-to-view (e.g. Collins, Jones and Munday,
2009; Gibson, Qi and Zhang, 2008; Jinxia and Mangan, 2008; Johnsen, Biegert,
Muler and Elsasser, 2004; Lakshman, 2008; Porter and Fletcher, 2008; Rathke and
Ulrich, 2008; Soderman, 2008; Solberg and Preuss, 2007; Sterken, 2006), with free-
to-view events receiving considerably less attention.
The article focuses on the issue of measuring spectator numbers and attendance at
free-to-view events and the implications of this for evaluating impact. It is a
methodological issue that has received limited consideration in academic literature.
Previous studies on the topic of attendance at sports events have focused on a
range of issues, including factors affecting attendance (Funk, Filo, Beaton and
Pritchard, 2009; Lambrecht, Kaefer and Ramenofsky 2009); spectator motives for
attending (Sack, Singh and DiPaolo, 2009); attendance profiling (Graham, 1992);
perceptions of event attendees (Dale, van Iwaarden, van der Wiele and Williams,
2005) predicting audience numbers (Chen, Stotlar and Lin, 2009) and evaluation of
impacts associated with attendance (Wood, 2005). However, there appears to be a
genuine gap in knowledge about the processes involved in estimating attendance
figures at free-to-view sports events. It is a particularly significant issue for non-elite
events, given they are often conducted in public spaces such as roads, parks,
beaches and open waters and are consequently free-to-view.
Accurate measurement of attendance is significant for several reasons. It is often
used as an indicator to assess the popularity or reach of an event for the purposes of
public relations, sponsorship, financial monitoring or service level agreement
5
monitoring. Furthermore, some events use it as a pre-determined performance
indicator, for example, certain events may have equity targets set for them such as
the percentage of local people attending, or the level of engagement by other
targeted groups such as children and young people. Fundamentally though,
spectator attendance is a precursor to other measures linked to economic,
environmental or social impacts of events, therefore evaluation of these impacts is
ultimately dependent upon reliable and accurate measurement of the number of
people attending.
Arguably, attendance measurement at ticketed or pay-to-view events is a relatively
simple exercise, especially those that take place within the confines of a fixed venue
such as a stadium, where there is a record of how many people can be
accommodated. However, this is not always the case and measurement of
spectators at pay-to-view events can also be problematic. For example, estimates of
attendances at football matches are frequently based on the number of tickets sold
(including season tickets), rather than reflecting how many people actually viewed
the event:
Coca-Cola Championship club Charlton have admitted that they calculate match day attendances to include the number of season tickets sold - regardless of whether the holders actually turned up or not... (Daily Mail, 2008)
This is not an uncommon practice for estimating attendance and there are
numerous other examples of football clubs calculating attendance on the number
of tickets sold rather than those passing through the turnstiles. Moreover, there
are examples of other pay-to-view events at which spectator attendance has also
been somewhat exaggerated, including Formula 1 Grand Prix events and county
cricket matches in England:
The official attendance for the Turkish Grand Prix a fortnight ago was said to be 20,000, which in itself is dismal. But it is now believed that figure has been exaggerated and that the true number of tickets sold was closer to 7,000 (Smith, 2009)
6
In January 2009, the England and Wales Cricket Board trumpeted the fact that over 550,000 had been to County Championship matches last summer. Wisden reveals the absurdity of that claim, which is built on erroneous figures – epitomised by a healthy crowd of almost 12,000 supposedly attending the Glamorgan v Worcestershire game in September. In reality the match saw not a single ball bowled. The true figure for Championship attendance would, in all probability, have been under half a million. At best, this was incompetence; at worst dishonest and deliberately misleading... (Wisden, 2009)
Given the errors associated with measuring attendances at ticketed events, the
complexity of estimating credible crowd sizes at open access, free-to-view events
where there are no ticket sales to draw upon, becomes even more apparent.
Using empirical data from a marathon event, a cycle road race and a motorsport
event, the article examines a range of approaches used to measure attendance
at free-to-view events. Drawing upon evidence from the three case studies
presented, it discusses the methodological issues arising and the key
considerations for estimating spectator attendance. It argues that robust
measurement of attendance is fundamental to ensuring the reliability of event
monitoring and evaluation. The article concludes by suggesting that despite the
challenges highlighted, there is a need to move towards a more rigorous,
empirically-based framework for measuring spectator attendance at free-to-view
events, to provide managers, researchers, event organisers and policy makers
with a more reputable method for evaluating events in the future.
2 Case studies and research
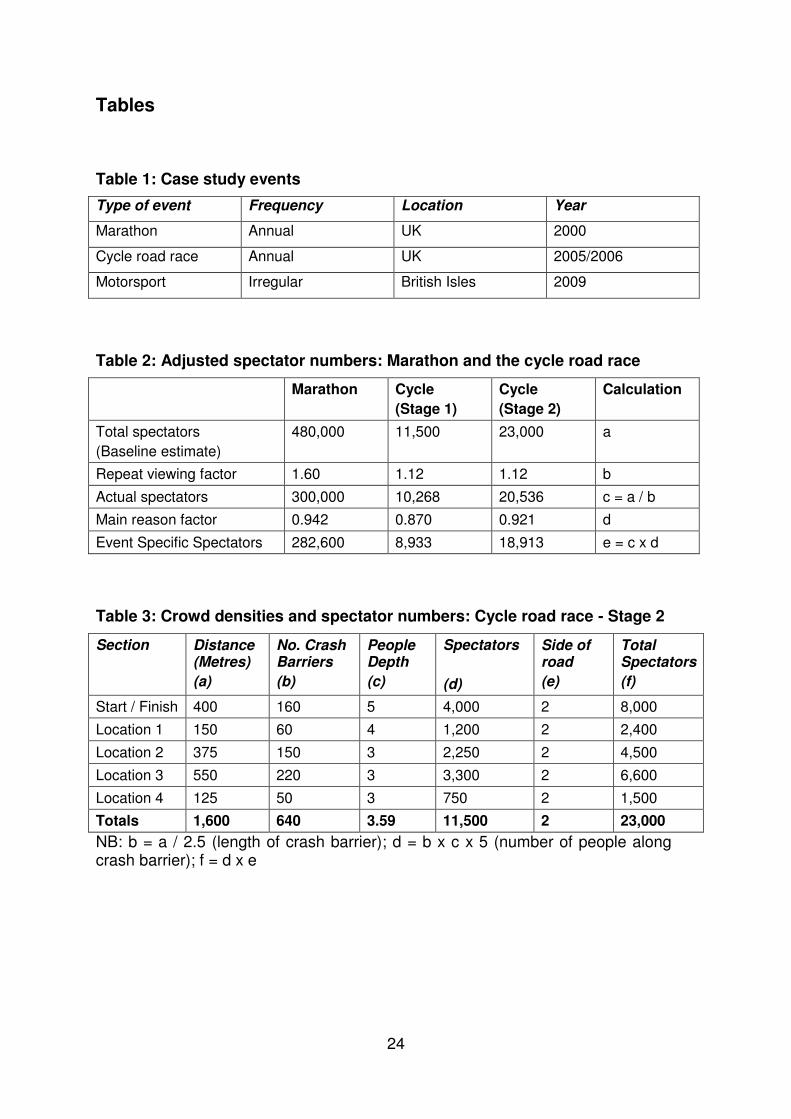
This section presents empirical data from the three case studies listed in Table 1.
The events were selected for the article because they are free-to-view, occurred in
public places and covered large distances, all of which are factors that make the
measurement of spectator attendance challenging. The events were also selected
7
because of their varied spatial layout and scale, which necessitates different
approaches to attendance measurement. The data presented was collected and
analysed by independent research consultants on behalf of event organisers or
sponsors and in each case was gathered as part of an economic impact evaluation.
For this reason, in order to maintain client confidentiality and given that much of the
data presented is not available in the public domain, two of the events have been
anonymised.
Insert Table 1
For each event, a spectator survey was undertaken to establish patterns of spectator
behaviour, including repeat or multiple viewing across the event, and to establish
levels of viewing by ‘casuals’ within the overall attendance figures. Consideration of
repeat viewing is particularly important at free-to-view events that take place in public
places, because people can often watch the event from more than one vantage point.
Therefore, by applying a repeat viewing factor to account for the movement of people
from one location to another, it becomes possible to calculate the actual number of
different people in attendance. Failure to do so can result in double counting of
individuals. Another relevant consideration for estimating attendance at free-to-view
events is to differentiate between ‘event-specific’ attendance and ‘casual’ attendance.
This is because when an event is held outside the confines of a traditional venue (e.g.
a stadium or arena) it is quite possible that people passing through the event location
(e.g. town centre) are included in the attendance estimate. Discounting ‘casual’
attendance is also commonly recommended for the purpose of event economic
impact evaluation to avoid double counting (see for example, Crompton 2001, 1995)
and was considered a relevant issue for estimating spectator attendance.
The following case studies will detail the sampling techniques used for the spectator
surveys and illustrate how this data was used together with other sources of
information, to establish overall viewing figures.
8
2.1 The London Marathon
The London marathon involves both elite and non-elite participants, but is largely a
mass participation, free-to-view running event. It is included as a case study within
the article because it exemplifies the challenges faced by researchers and event
organisers in trying to estimate crowd attendance at a very large participant and
spectator event. The data presented was gathered as part of an economic impact
evaluation in 2000 (Coleman, 2003), which is in the process of being repeated in
2010. While the data is taken from the event several years ago, the methodological
challenges of trying to estimate spectator attendance, as demonstrated from this
case study, remain relevant to the focus of this article and are complementary to the
other two event examples included.
Estimating spectator attendance at the London Marathon is especially challenging
due to the large numbers and disparate nature of spectators along the 26 mile route.
Media reports suggested that there were up to one million people in London
watching the event in 2000. However, for this to be the case there would have been
crowds of six deep on either side of the route for the entire 26 miles, which was
clearly not so, based on scrutiny of BBC television coverage and the primary
research undertaken on the race day. Spectator attendance was derived using a
combination of methods, including a spectator survey with 1005 spectators on race
day; observations of crowd densities from the research team and detailed analyses
of television footage including aerial footage and still photography.
A baseline estimate was initially derived by estimating crowd densities along the
route, using the assumption that five spectators could stand side by side along a
standard 2.5m crash barrier. Hence if the crowd was five deep on both sides of the
road at a given point, this represents 50 spectators (i.e. 5 x 5 x 2). There were
occasions along the route when densities achieved such levels, for example in
‘honey spot’ locations, which reflected historically popular landmarks and vantage
points (e.g. Birdcage Walk, St James's Park, Tower Bridge, Cutty Sark and Canary
Wharf). The analysis of the television coverage, still photography and
9
measurements of the crowd densities at given points along the route (recorded by
researchers) resulted in an estimated baseline attendance figure of 480,000.
The 480,000 baseline estimate was adjusted using information derived from the
spectator survey. Eight hundred and fifty five spectator surveys were administered
at a series of ‘honey spot' locations along the route. A smaller sample of 150
surveys was also conducted in the less popular areas along the route. Twenty
researchers administered the surveys using random sampling techniques. The
selection method used when interviewing a group of people was to ask the person
with the next birthday to complete the questionnaire, as recommended in Sport
England’s ‘Model Survey Package’ (Sports Council, 1995). The data revealed that
5.8% of people were out in London but not specifically to attend the marathon
(casuals) and the remainder watched the event from an average of 1.6 different
locations along the route (the repeat viewing factor). The adjustments were applied
on the basis that spectators may have just chanced upon the marathon and
consequently their attendance was not a function of their intention to watch the race.
Moreover, spectators were free to move around London and watch from more than
one vantage point, which without the adjustment would overinflate the total number
of different spectators and hence expenditure.
As demonstrated in Table 2, the application of these two adjustments resulted in
282,600 different people in London specifically to watch the race. This figure was
presented to the police and they confirmed that it was in the right 'ballpark'.
Insert Table 2
The London Marathon clearly illustrates the difficulty in accurately estimating
spectator numbers at a very large open access event. While the attendance figure
was derived using a range of methods, including primary research, 282,600 still
represents a rudimentary, albeit informed, estimate of the total number of different
spectators attending the event. However, it provides a baseline from which to work
in the two examples of free-to-view events that now follow.
10
2.2 Cycle road race
The second case study was a non-elite cycling event held in the UK as part of the
annual sporting calendar. Data was collected in 2005 and 2006 from two
separate stages, both of which were one-day affairs. The first stage was a
192km linear route and the second was a 1.6km criterium (circular) stage located
within a city. Each of these posed different methodological challenges in terms of
estimating spectator attendance. For both stages, a spectator survey was
undertaken, again to establish the proportion of spectators watching the event by
chance and the amount of repeat viewing across the length of the course. The
spectator survey was then used together with other sources of information to
estimate total spectator attendance.
2.2.1 Stage 1
For Stage 1, the linear route, one of the key methodological challenges was the
large distance covered by the event (192km). Spectator attendance was derived
by identifying a series of honey spot locations around the course. Honey spots
comprised the key areas of the race where it would be reasonable to expect large
numbers of people to congregate, including the start, finish, sprints and climbs.
These locations were identified as being the ‘most exciting stages of the event’ in
the official event programme. In total, eight sites were identified covering
approximately 7.5km of the course. The total number of people in each location
was derived by a combination of methods such as hand held counters, analysis
of television footage, police and marshals' estimates. The baseline attendance
figure for spectators in the honey spots was estimated to be approximately
11,500.
In each of the honey spot locations, 423 spectator surveys were administered to
derive information on spectator behaviour. Again, a challenge with this event
was the course set up, which was designed specifically to allow spectators to
watch the event from more than one location. The spectator surveys revealed
that the average number of locations attended by each spectator was 1.12
11
(repeat viewing factor). The survey also found that 13% of spectators were in the
honey spot locations by coincidence (casuals), which is not surprising since
many of the honey spots were in the vicinity of ordinarily busy locations.
Accordingly, as shown in Table 2, for Stage 1 the actual number of event specific
spectators was adjusted to 8,933.
Whilst the honey spots were identified as the key viewing locations, these sites
only accounted for 7.5km of a 192km route, therefore there was potential for
people to watch the event along the other 184.5km of the route. Event
organisers claimed that, in addition to the spectators in the honey spots, there
was an additional 46,000 people who watched some part of the race along the
route. This figure equates to an average of 250 people per km over 184km.
However, without any credible evidence to support it, this estimate was
considered overly ambitious and was refuted by the research team on the basis
of their observations at the event and from analysis of the television coverage of
areas other than the honey spots, which revealed very few spectators. The
research team argued that since it was the honey spots that were designed to be
the spectator vantage points, it would be unreasonable to expect the claimed
audience turnout elsewhere. Furthermore, it was argued that since the race
passed through the streets of busy towns and cities along the route there would
inevitably be people going about their daily lives and that it would be
inappropriate to consider these people as event-specific spectators. Thus, the
research team concluded that the most justifiable number of different event
specific spectators at Stage 1 of the cycle event was 8,933, which is the figure
derived for the honey spot locations only. It was this figure that was
subsequently used for estimating the economic impact attributable to the event,
to avoid exaggerating the estimated impact.
2.2.2 Stage 2
Stage 2 of the cycle event took place in a tightly defined area of 1.6km circular
circuit. In essence the whole of the circuit was considered to be a honey spot.
The approach employed to estimate spectator numbers, as with the London
12
Marathon, was to use crash barriers along the circuit as a reference point. For
the duration of Stage 2, researchers were at the event site taking measurements
of crowd densities at various points around the circuit. The derivation of
spectator numbers was underpinned by the following assumptions:
Barriers were on both sides of the road for the entire 1.6km loop giving a total
of 3.2km of barriers.
Each barrier measured 2.5 metres and accommodates 5 people (side by side).
1.6km of roads require 640 barriers (1,600m / 2.5m) per side.
As shown in Table 3, the crowd densities varied by section of the loop. Using the
assumptions stated and the observations of crowd densities around the route, the
baseline estimate for the spectators along the circuit was 23,000. This is equivalent
to a spectator depth of 3.59 people all the way round a 1.6km course on both sides
of the road. In addition, television coverage of the race was used to verify crowd
densities along the length of the circuit. The crowd measurements taken by the
research team at the event site were found to be broadly consistent with the
observations from television monitoring.
Insert Table 3
A spectator survey of 595 people was carried out at various sections of the circuit.
The survey found that the average number of locations attended by each spectator
(repeat viewing factor) was 1.12. Furthermore, the survey revealed that for 8% of
spectators the event was not their main reason for being in the area. Therefore, as
shown in Table 2, the number of event specific spectators was estimated to be
18,913.
As with Stage 1, organisers claimed that Stage 2 also had additional spectators over
and above the number estimated by the research team. This was supposedly based
on police estimates, according to which the total crowds passing through the area
13
surrounding the event location was 60,000. The organisers did not acknowledge
that the location of the event in the city centre would have had a considerable impact
on this estimate and given the event took place at the weekend; it was highly likely
that there were casual spectators. Consequently, the stance of the research team
was to base their attendance figure and economic impact calculation on the
defendable and more credible figure of 18,913 event specific spectators.
2.3 Motorsport event
The third and final case study was an international elite motor sport event held in the
British Isles in 2009. A significant investment was made by public sector agencies to
secure the event for the host area. Research was commissioned by the event
sponsors to provide an indication of the return on their investment in economic
impact terms on the host area. This involved undertaking interviews with the key
groups attending the event, predominantly amongst spectators, in order to
understand their attendance patterns and spending behaviour
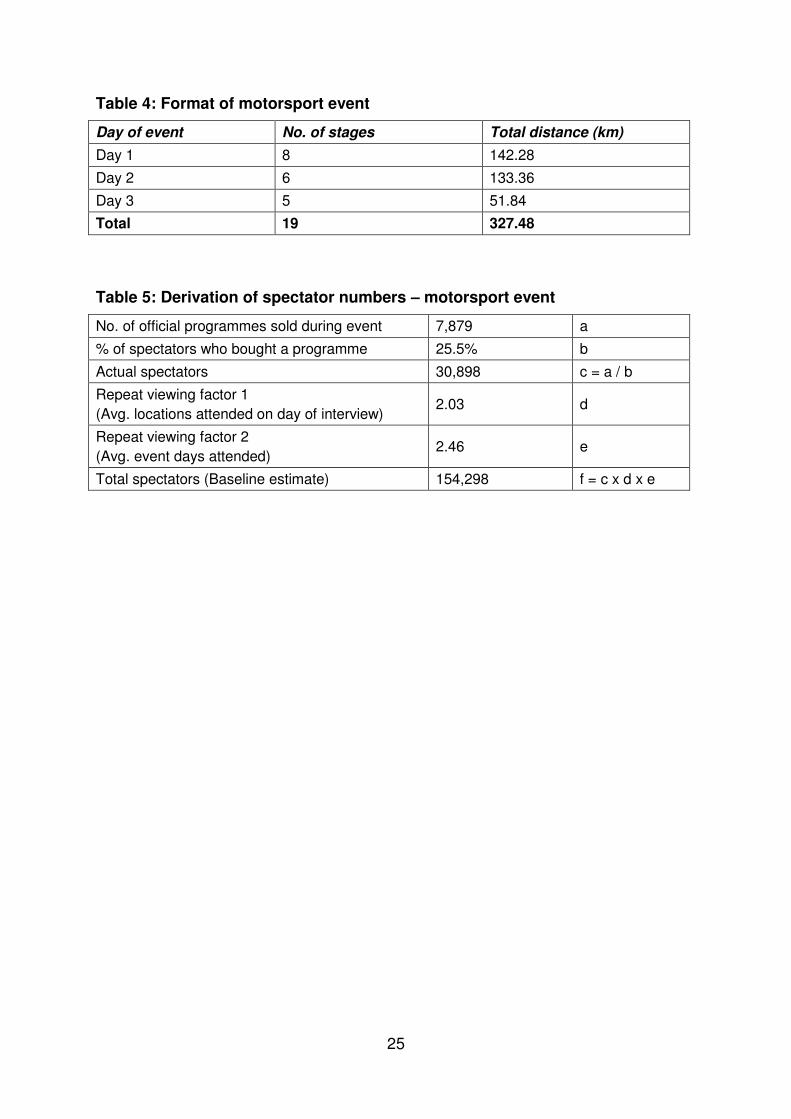
Unlike the previous examples, the motorsport event took place over three days and
was therefore conducive to repeat viewing over multiple days. Moreover, as shown
in Table 4, each day of the event was split into several stages that spread across
several kilometres. Each stage had a number of designated spectator viewing areas,
so it was possible for spectators to view the event on more than one day as well as
from more than one location or stage on the same day.
Insert Table 4
Rather than adopting the top-down approach used in the marathon and the road
cycle race, of deriving spectator attendance by establishing a crude baseline
attendance figure and adjusting this for factors such as repeat viewing and casual
attendance, spectator attendance for the motorsport event was estimated using a
bottom-up approach. This was partly due to the difficultly in estimating overall
14
viewing figures resulting from a paucity of local information and absence of
alternative credible evidence. Estimates of spectator attendance were primarily
generated using the spectator survey.
Again, a methodological challenge for this event were the large distances covered by
the various stages, and subsequently choosing appropriate spectator locations to
collect survey information. Organisers were asked to advise on the potential
locations where large crowds were expected, but ultimately the survey locations
chosen were those that complied with health and safety regulations, given the
unpredictable nature of motorsport events and the potential for injury to competitors
and spectators alike.
The spectator survey was used to derive a bottom-up estimate of spectator
attendance. Based on 1,303 responses to the survey across 31 different spectator
viewing areas, it was estimated that around one in four spectators had access to an
official event programme (25.5%). According to official sources, there were 7,879
programme sales made during the event, consequently as shown in Table 5, it was
estimated that 30,898 different spectators actually attended the event. Allowing for
multiple days viewing (on average 2.46 days per person) and attendance at more
than one location on the day of interview (on average 2.03 different locations per
person), an aggregate baseline attendance figure of approximately 154,298
spectators was derived. This figure was triangulated with estimates of spectator
attendance at the survey locations, which were derived based on observations from
the research team and a sample of crowd size estimates provided by event marshals
for their respective jurisdictions.
Insert Table 5
A major challenge with estimating attendance at the motorsport event was trying to
reconcile the estimates produced by the research team with those produced by the
event organisers. Immediately following the event, organisers suggested that
15
spectator attendance for the event was approximately 270,000. This was higher than
the corresponding figure released for the previous edition of the event (257,000).
The official attendance figures were thought to be overstated for a number of
reasons.
The methodology adopted by event organisers to estimate attendance in the main
spectator locations was considered (by both the research team and event funders) to
be highly unorthodox. In short, this was based on 'an assessment of the amount of
damage to the grassed areas of fields from which people viewed the event and then
applying an average of two people per square metre to derive an aggregate figure
for each location'. However, such an approach is prone to error, as it assumes that
the fields were packed to capacity (which they were not) and does not allow for the
movement of people from one point to another in a given location.
The assumptions used by event organisers to derive spectator numbers away from
the main viewing areas also seemed overly ambitious. For example, organisers
estimated an additional 40% of spectators at other locations along the route on Day
1 and 50% on Day 2 and Day 3. Furthermore, their estimate for the final stage of the
event made an allowance of 25% more spectators in "buildings etc.", which again
serves to inflate crowd sizes. Evidence from monitoring of television coverage of the
event revealed sporadic pockets of spectators at stage sections that were not
promoted to be safe or viewer-friendly.
The weather conditions were significantly worse than at the previous edition of the
event, which had a claimed attendance of 257,000. This was certainly the case on
Day 1, so much so that two stages were subsequently cancelled. Furthermore, post-
event consultations with more than 100 accommodation providers in the host area,
by and large suggested that the event did not generate the anticipated effect on their
business relative to the previous edition. Anecdotal evidence from marshals
revealed that they too watched sections of the event days when they were not
working. The treatment of marshals as spectators can lead to double counting of
people attending the event.
16
Due to the reasons cited above, the research team had reason to believe that the
official attendance figures were not credible and that using them would only
artificially inflate the economic impact attributable to the motorsport event.
Eventually, the research team and event sponsors (who were interested in finding
out the real value of the event) made a collective decision to use the survey as the
primary tool for estimating the audience figures and subsequent economic impact.
3 Methodological issues and key considerations for estimating
spectator attendance
The case studies presented have highlighted various approaches used to
estimate spectator attendance at free-to-view events. The following discussion
will now draw together the methodological issues raised and key points that need
to be considered when measuring spectator attendance.
A key consideration for measuring spectator attendance is the methods used to
derive estimates and the sources of information available. It was evident from
the case studies presented that official estimates, whether they are from police
sources, the media or event organisers are often inaccurate. For free-to-view
events that take place within a venue or restricted area, the dimensions of
spectator access should be used as an initial guide to spectator attendance.
However, many free-to-view events such as those discussed, take place in public
areas and therefore capacity constraints are generally not a limiting factor in
terms of attendance. In such cases, other measures of reasonableness should
be used as an initial guide for spectator numbers, for example, as for the
marathon and the cycle road race, using variables such as crash barriers, depth
of crowd and length of course as a reference point. Other methods, such as
(aerial) photographic evidence and television footage also provide useful tools for
estimating crowd densities, especially for those events that are remote or have

17
difficult to access areas, such as the motorsport event. Fundamentally though,
the spectator survey was very important for estimating event specific attendance
in each case study. Careful consideration therefore needs to be given to the
sampling techniques used to collect survey data, which will be affected by factors
such as the spatial layout of the event and length of the course, together with
access to spectator areas and local intelligence.
A further methodological consideration is the issue of repeat viewing within a
single event, either across a course or over multiple days. This is often a source
of error within estimations of spectator attendance and was a key consideration
for the three events discussed. Crowds at open access, free-to-view events are
fluid. For events that take place over an extended distance, such as running,
cycle and triathlon events, it is common practice for people to move around the
course. Indeed many courses are designed to maximise viewing in this way.
Consequently the significance attached to the repeat viewing cannot be
emphasised enough, not least because without its consideration, double counting
of spectator numbers and in turn, exaggerated benefits of other measures linked
to attendance are inevitable. For example, at the London Marathon, without the
application of the repeat viewing factor the expenditure attributable to spectators
would have been exaggerated by c. £9.2m (Coleman, 2003). Repeat viewing
across multiple days, if an event takes place on more than one day, is a further
important factor to consider. It can be a significant source of error if not identified
and can lead to discrepancies between official and other reported attendance
figures, such as in the case of the motorsport event.
An additional methodological consideration for estimating spectator attendance at
free-to-view events which take place in public places is estimating the proportion of
casual spectators watching the event because they just happened to be in the area.
This was an issue in the three case studies presented. There should be a clear
differentiation made between the actual spectator attendance and the event specific
attendance. Whereas this may not be relevant for some indicators, such as the
popularity of the event, it is particularly pertinent for some types of event monitoring

18
and evaluation such as economic impact, where it is imperative to distinguish
between people attending specifically for an event and 'casual' spectators to avoid
exaggerating figures.
Finally, in the case of commissioned research, there is the methodological challenge
of meeting client expectations and balancing this with the appropriate rigour in
measurement. Once more this was an issue in all the case studies presented and
remains a significant challenge to researchers undertaking evaluation studies that
are linked with attendance measurement. Often event organisers overstate
spectator attendance, as in the case of the cycle road race and the motorsport event,
and a key challenge facing researchers is how to reconcile the differences between
official figures and those derived as part of an impact evaluation study. It is
important that estimates of spectator attendance are therefore supported by a
transparent audit trail of how such figures are derived to ensure that they are able to
stand up to scrutiny.
4 Conclusions: Implications for future free-to-view event impact
evaluation
Measuring attendance at free-to-view sports events is not a straightforward process.
While event organisers tend to have accurate records of accredited personnel, such
as the number of participants and officials, it is frequently not the case for spectators,
and attendance figures often represent little more than educated guess work, derived
with limited academic rigour. This article presented empirical data from three case
studies to examine various approaches to spectator measurement at free-to-view
events, and suggested several methodological considerations for estimating
spectator attendance in the future. While the issues raised within the article are
relevant to free-to-view events in general, they are particularly pertinent to non-elite
events, given they are commonly held in public places, with greater levels of casual
viewing.
19
Despite the lack of attention afforded to attendance measurement within the
academic literature, it is an important methodological consideration in its own right.
Although exaggerating crowd sizes may be beneficial for public relations, marketing
and the perceived success of an event to a host community, region or country, it
compromises the reliability of any monitoring and evaluation that is based on
estimates of attendance. For example, common forms of economic impact
evaluation involve surveying a sample of event attendees, then aggregating the
findings upwards to derive estimates for the population in attendance. Assuming
that the sampling has been conducted in a robust manner, the greatest source of
error is likely to be the figure used to multiply the findings from the sample upwards
to the population as a whole. Research commissioned by UK Sport (2004, 2006)
has shown that, for the most part, the key determinant of total economic impact is
the number of spectators attending an event. There is a very high correlation (r =
0.90) between the number of spectator admissions at an event and the economic
impact attributable to that event (UK Sport, 2004). In this regard, a reliable estimate
of the spectator attendance is critical to the accuracy of economic impact figures.
While exaggerating crowd sizes has the effect of overstating positives (e.g.
economic impact), at the same time it can result in overstating the negatives (e.g.
environmental impact) attributable to an event. Furthermore, other measures that
are based on findings from a survey, such as the percentage of disadvantaged
people attending the event, will be overstated if used subsequently to compute the
absolute number of people from a particular group who attended an event. Thus,
regardless of the rigour with which monitoring and evaluation data is collected, its
true value is unreliable if attendance levels are inaccurate. The significance of
accurate crowd estimates to meaningful evaluation cannot be overstated, especially
at free-to-view, open access events. It has significant implications for measuring
economic and environmental indicators and it is therefore vital that event organisers
recognise the implications of misrepresenting the popularity of an event in terms of
spectator numbers.

20
Accurate measurement of attendance is not only important for the monitoring and
evaluation of various types of impact, but it is of great consequence to the
marketing and sponsorship of free-to-view events. In marketing terms, reliable
information on spectator attendance is important for targeting promotional
materials. Furthermore, potential sponsors of free-to-view events are interested
in both participant and spectator attendance, to evaluate the potential exposure
and benefits that supporting an event might bring. Inaccurate information may
impact on the ability of an event to sustain or secure funding in the future.
Conversely, armed with accurate knowledge and information, appropriate
strategies can be devised to grow an event and ensure sponsorship to help fund
such events in the future is forthcoming.
This article was essentially written to stimulate thinking amongst academics and
practitioners about measuring attendance at free-to-view sports events. While it
illustrates various approaches used to estimate spectator numbers, it does not
offer a single concrete solution for attendance measurement. Rather, it puts
forward a series of methodological issues to be considered in order to move
towards a more systematic approach to attendance measurement. Undoubtedly
each and every event is unique, in terms of its spatial layout and spectator
access points; however broad similarities can be drawn between certain types of
events. Hopefully the suggestions put forward in this article will be of benefit to
researchers and organisers of free-to-view events and contribute to the
development of a more robust framework for measuring spectator attendance in
the future.

21
References
Chen, C., Stotlar, D. K. and Lin, Y. (2009) 'Prediction of ticket purchase in
professional sport using data mining', International Journal of Sport
Management and Marketing, Vol. 6, No. 1, pp. 68-86.
Coleman, R. (2003) 'Flora London Marathon 2000 – The economic legacy', Journal
of Hospitality and Tourism Management, 10 (Supplement) Event Management,
pp. 51-73.
Collins, A., Jones, C. and Munday, M. (2009) 'Assessing the environmental impacts
of mega sporting events: Two options?', Tourism Management, Vol. 30, pp.
828-837.
Crompton, J. L. (1995) 'Economic impact analysis of sports facilities and events:
Eleven sources of misapplication', Journal of Sport Management, Vol. 9, pp.
14-35.
Crompton, J. L. (2001) 'A guide for undertaking economic impact studies: The
Springfest example', Journal of Travel Research, Vol. 40, pp. 79-87.
Daily Mail (2008) 'The truth behind modern day attendances. How clubs count on
missing fans', http://www.dailymail.co.uk/sport/football/article-1083630/The-
truth-modern-day-attendances-How-clubs-count-missing-fans.html (accessed
15 January 2009).
Dale, B., van Iwaarden, J., van der Wiele, T. And Williams, R. (2005) Service
improvement in a sports environment: a study of spectator attendance,
Managing Service Quality, Vol. 15, No. 5, pp. 470-484.
Funk, D. C., Filo, K., Beaton, A. A. and Pritchard, M. (2009) 'Measuring the motives
of sport event attendance: Bridging the academic-practitioner divide to
understanding behaviour', Sport Marketing Quarterly, Vol. 18, No. 3, pp. 126-
138.

22
Gibson, H. J., Qi, C. X and Zhang, J. J. (2008) 'Destination image and intent to visit
China and the 2008 Beijing Olympic Games', Journal of Sport Management,
Vol. 22, No. 4, pp. 427-450.
Graham, P. J. (1992) 'A Study of the demographic and economic characteristics of
spectators attending the U.S. men's clay court championships', Sport
Marketing Quarterly, Vol. 1, No. 1, pp. 25-30.
Gratton, C. and Taylor, P. (2000) Economics of Sport and Recreation, London: E &
FN Spon.
Jinxia, D. and Mangan, J. A. (2008) 'Beijing Olympics Legacies: Certain intentions
and certain and uncertain outcomes, International Journal of the History of
Sport, Vol. 25, No. 14, pp. 2019-2040.
Johnsen, J., Biegert, T. Muller, H. and Elsasser, H. (2004) 'Sustainability of mega
events: Challenges, requirements and results. The case-study of the World
Ski Championship St. Moritz 2003, Tourism Review, Vol. 59, No. 4, pp. 27-36.
Lakshman, C. (2008) 'Conditions for hosting mega-sporting events in Asia:
Comparing Japan and India', Asian Business and Management, Vol. 7, No. 2,
pp. 181-200.
Lambrecht, K. W., Kaefer, F. and Ramenofsky, S. D. (2009) 'Sportscape factors
Influencing spectator attendance and satisfaction at a Professional Golf
Association tournament', Sport Marketing Quarterly, Vol. 18, No.3, pp. 165-
172.
Porter, P. K. and Fletcher, D. (2008) 'The economic impact of the Olympic Games:
Ex ante predictions and ex poste reality', Journal of Sport Management, Vol.
22, No. 4, pp. 470-486.
Rathke, A. and Ulrich, W. (2008) 'Economics and the summer Olympics: An
efficiency analysis, Journal of Sports Economics, Vol. 9, No. 5, pp. 520-537.
Sack, A. L., Singh, P. and DiPaolo, T. (2009) 'Spectator motives for attending
professional women's tennis events: Linking marketing and Maslow's
hierarchy of needs theory', International Journal of Sport Management and
Marketing, Vol. 6, No. 1, pp. 1-16.
23
Smith, D. (2009) 'F1 rebels ready to oust Max Mosley in power struggle',
http://www.thisislondon.co.uk/standard-sport/article-23709605-f1-rebels-
ready-to-oust-max-mosley-in-power-struggle.do (accessed 15 January 2009).
Soderman, S. (2008) 'Mega-sporting events in Asia - Impacts on society, business
and management: An introduction', Asian Business and Management, Vol. 7,
No. 2, pp. 147-162.
Solberg, H. A. and Preuss, H. (2007) 'Major sport events and long-term tourism
impacts', Journal of Sport Management, Vol. 21, pp. 213-234.
Sports Council (1995) Measuring Sports Participation: Model Survey Packages.
Centre for Leisure Research, London: Sports Council.
Sterken, E. (2006) 'Growth impact of major sporting events', European Sport
Management Quarterly, Vol. 6, No. 4, pp. 375-389.
UK Sport. (2004) 'Measuring Success 2: The Economic Impact of Major Sports
Events',http://www.uksport.gov.uk/pages/economic_impact_of_major_sports_
events/ (accessed 15 January 2009).
UK Sport (2006) 'Measuring Success 3: The Economic Impact of Six Major Sports
Events Supported by the World Class Events Programme',
http://www.uksport.gov.uk/assets/File/Measuring%20Success%203%20-
%20Overview%20of%20Findings.pdf (accessed 15 January 2009).
Wisden, (2009) 'Lies, damned lies and attendance figures'
http://www.wisden.com/default.aspx?id=27 (accessed 15 January 2009).
Wood, E. H. (2005) 'Measuring the economic and social impacts of local authority
events', International Journal of Public Sector Management, Vol. 18, No. 1,
pp. 37-53.
24
Tables
Table 1: Case study events
Type of event Frequency Location Year
Marathon Annual UK 2000
Cycle road race Annual UK 2005/2006
Motorsport Irregular British Isles 2009
Table 2: Adjusted spectator numbers: Marathon and the cycle road race
Marathon Cycle
(Stage 1)
Cycle
(Stage 2)
Calculation
Total spectators
(Baseline estimate)
480,000 11,500 23,000 a
Repeat viewing factor 1.60 1.12 1.12 b
Actual spectators 300,000 10,268 20,536 c = a / b
Main reason factor 0.942 0.870 0.921 d
Event Specific Spectators 282,600 8,933 18,913 e = c x d
Table 3: Crowd densities and spectator numbers: Cycle road race - Stage 2
Section Distance (Metres)
(a)
No. Crash Barriers
(b)
People Depth
(c)
Spectators
(d)
Side of road
(e)
Total Spectators
(f)
Start / Finish 400 160 5 4,000 2 8,000
Location 1 150 60 4 1,200 2 2,400
Location 2 375 150 3 2,250 2 4,500
Location 3 550 220 3 3,300 2 6,600
Location 4 125 50 3 750 2 1,500
Totals 1,600 640 3.59 11,500 2 23,000
NB: b = a / 2.5 (length of crash barrier); d = b x c x 5 (number of people along crash barrier); f = d x e
25
Table 4: Format of motorsport event
Day of event No. of stages Total distance (km)
Day 1 8 142.28
Day 2 6 133.36
Day 3 5 51.84
Total 19 327.48
Table 5: Derivation of spectator numbers – motorsport event
No. of official programmes sold during event 7,879 a
% of spectators who bought a programme 25.5% b
Actual spectators 30,898 c = a / b
Repeat viewing factor 1
(Avg. locations attended on day of interview) 2.03 d
Repeat viewing factor 2
(Avg. event days attended) 2.46 e
Total spectators (Baseline estimate) 154,298 f = c x d x e