Master of Science in Viticulture & Enology
Joint diploma “EuroMaster Vinifera” awarded by:
INSTITUT NATIONAL D'ETUDES SUPERIEURES AGRONOMIQUES DE MONTPELLIER
AND
INSTITUTO SUPERIOR DE AGRONOMIA DA UNIVERSIDADE DE LISBOA
Master thesis
Unveiling the Role of Technological Processes on the Strontium Isotopic Ratio,
Fingerprint of Wines’ Geographical Origin
Ayse Deniz KAYA
2015-2016
supervisor: Sofia CATARINO, Instituto Superior de Agronomia (ISA), University of Lisbon
supervisor: Alain RAZUNGLES, Montpellier SupAgro
Lisbon, 2016

1
Acknowledgment:
This study has been a great experience for my academic career. Above all, I would like to
take this opportunity to thank my supervisor Sofia Catarino for her time and her support. I am
grateful with her attentive supervision and about sharing her knowledge generously. Besides,
my sincere thanks to Otília Cerveira from INIAV Dois Portos for her big help with analytical
procedure of this work. I also highly appreciate the assistance and aid of Daniel Duarte and
Diana Faria from Laboratory of Enology in ISA on my analyses.
Last but not least, I would like to thank my parents who gave all their trust and support to me
during this master.

2
Abstract
Based on the close relationship of strontium isotopic ratio 87Sr/86Sr between soil and plants,
this isotopic ratio has been reported as fingerprint tool to verify wine geographical origin and
its authenticity In the last decade, some studies suggested that winemaking applications do
not alter the 87Sr/86Sr isotopic ratios from vineyard to the wine despite the variations of
mineral concentration. However, information about wood impact on 87Sr/86Sr is lacking in the
literature. In this study, we investigated the wood ageing effect on 87Sr/86Sr, and also on the
multi-elemental compositon of wine, which to our best knowledge are novelties, thus
representing important advances to this field of knowledge.
A red wine from Castelão grape variety was aged in stainless steel vats (34,000 L) with oak
wood staves, in triplicate. The wines were sampled after 30, 60 and 90 days of ageing and
evaluated in terms of: 87Sr/86Sr, by Q-ICP-MS after Sr and Rb separation by ion exchange
chromatography; multi-elemental analysis (Be, Mg, Al, Sc, Ti, V, Mn, Co, Ni, Cu, Zn, Ga, Ge,
As, Rb, Sr, Y, Zr, Mo, Sb, Cs, Ba, Pr, Nd, Sm, Eu, Dy, Ho, Er, Yb, Lu, Tl, Pb) by Q-ICP-MS;
Na, K, Ca, Fe by FAAS. Wood ageingWood ageing effect on total polysaccharides
concentration , chromatic characteristics and phenolic composition was also evaluated.
Statistical analysis showed that there was no significant difference of the 87Sr/86Sr between
the control wine and wine aged with wood. The results show that strontium isotopic ratio of
wines was not altered even after ageing with wood (0.710 at initial time and 0.709 after 90
days) despite having a significant increase in Sr concentration by wood stage. This suggests
that 87Sr/86Sr might be used as a reliable geographical indicator. Time had significant impact
on Al, V, Zn, Ni, Cs, Pb and also on Na, K, Ca and Fe while wood stage only altered
concentrations of Mg, V, Co, Ni and Sr. Our study suggests that wood ageing does not
impact the 87Sr/86Sr, accordingly it will shed some light for further studies.
Key words: wine, authenticity, wood stage, strontium isotopic ratio 87Sr/86Sr, elemental composition

3
Resumo
A razão isotópica de estrôncio 87Sr/86Sr tem sido apontada como impressão digital do vinho
para verificação da origem geográfica e autenticidade. Alguns estudos, realizados na última
década, sugerem que a razão 87Sr/86Sr não é significativamente alterada pelas práticas
enológicas, não obstante as alterações na composição mineral. Contudo, falta informação
na literatura sobre o impacto do estágio em madeira na 87Sr/86Sr do vinho. No presente
estudo, foi investigado o efeito do envelhecimento em contacto com aduelas de madeira de
carvalho na razão isotópica do estrôncio do vinho. Complementarmente foi avaliado o efeito
deste tratamento na composição multi-elementar do vinho, o que representa igualmente um
importante avanço nesta área de conhecimento. Para tal, um vinho tinto foi estagiado, à
escala industrial, em depósitos de aço inoxidável com aduelas de madeira de carvalho, em
triplicado. Foram colhidas amostras ao fim de 30, 60 e 90 dias de estágio e avaliados os
seguintes parâmetros: 87Sr/86Sr, por Q-ICP-MS após separação do Sr e Rb por
cromatografia de troca iónica; composição multi-elementar (Li, Be, Mg, Al, Sc, Ti, V, Mn, Co,
Ni, Cu, Zn, Ga, Ge, As, Rb, Sr, Y, Zr, Mo, Sb, Cs, Ba, Pr, Nd, Sm, Eu, Dy, Ho, Er, Yb, Lu, Tl,
Pb) por Q-ICP-MS; elementos Na, K, Ca, Fe por FAAS. Foi ainda a avaliado o efeito do
estágio com madeira na nas características cromáticas, composição fenólica e
polissacáridos totais. Nas condições experimentais descritas não foi observado efeito
significativo do estágio com madeira na razão isotópica 87Sr/86Sr do vinho, não obstante o
aumento significativo da concentração de Sr do vinho decorrente do contacto com a
madeira. O valor de 87Sr/86Sr no início (0.710) e no final do estágio (0.709) não variou
significativamente, indicando a robustez desta razão isotópica como marcador de origem
geográfica. O estágio com madeira afectou significativamente as concentrações de Mg, V,
Co, Ni e Sr. Ao longo do tempo de estágio verificaram-se alterações significativas nas
concentrações dos metais Al, V, Zn, Ni, Cs e Pb.
Palavras-chave: vinho, autenticidade, estágio em madeira, razão isotópica de estrôncio 87Sr / 86Sr, composição multi-elementar

4
Resumo Alargado
As Denominações de Origem e Indicações Geográficas, assim como o desenvolvimento de
ferramentas que permitam verificar a autenticidade dos produtos vitivinícolas no que respeita
à sua origem geográfica, são aspectos importantes para os intervenientes do sector
vitivinícola e consumidores de vinho.
A avaliação da composição multi-elementar de alimentos, relacionando-a com o solo de
origem, tem sido relatada frequentemente na literatura como uma ferramenta útil para
avaliação da proveniência geográfica. As razões isotópicas 2H/1H, 13C/12C, 18O/16O
apresentam utilidade na avaliação da autenticidade do vinho principalmente no que respeita
à origem botânica e detecção de práticas fraudulentas clássicas, tais como adição de água,
ou etanol com outra origem que não no açúcar da uva.
Mais recentemente, a razão de isótopos 87Sr/86Sr de estrôncio, cuja composição isotópica
natural varia com a idade geológica e consequentemente com a região geográfica, entrou
neste campo de aplicação. A aplicabilidade da razão 87Sr/86Sr para rastreabilidade de
Denominações de Origem Portuguesas foi recentemente demonstrada. De facto, a
proporção do isótopo radiogénico 87Sr, enriquecido ao longo do tempo por decaimento
radioativo do 87Rb, relativamente ao 86Sr, varia de acordo com a composição e idade
geológica. A razão 87Sr/86Sr do vinho reflete a razão 87Sr/86Sr da formação geológica/solo,
uma vez que a videira não promove o fracionamento isotópico do Sr pela e a influência de
aditivos enológicos é negligenciável.
Alguns estudos indicam que esta razão isotópica não sofre alteração significativa durante o
processo de vinificação, apesar das variações da concentração mineral do vinho. Contudo, a
literatura carece de informação sobre o impacto do envelhecimento em/com madeira na
razão isotópica 87Sr/86Sr do vinho. Assim, o objectivo principal deste estudo consistiu na
avaliação do impacto do estágio do vinho com madeira de carvalho nesta razão isotópica e
na evolução da composição multi-elementar do vinho ao longo do envelhecimento.
A utilização de barricas de madeira de carvalho no envelhecimento do vinho é um processo
tradicional na produção de vinho. Durante o período de envelhecimento, ocorrem várias
reações, como interações entre compostos no vinho e na madeira. Actualmente, como
alternativa às barricas de carvalho, devido ao seu elevado preço e espaço necessário, é
autorizada a utilização de fragmentos de madeira de carvalho e de castanho.
No presente estudo, foi investigado o efeito do envelhecimento em contacto com aduelas de
madeira de carvalho na razão isotópica do estrôncio do vinho. Complementarmente foi
avaliado o efeito deste tratamento na composição multi-elementar do vinho, o que
representa igualmente um importante avanço nesta área de conhecimento. Para tal, um

5
vinho tinto foi estagiado, à escala industrial, em depósitos de inox com aduelas de madeira
de carvalho, em triplicado. Foram colhidas amostras ao fim de 30, 60 e 90 dias de estágio e
avaliados os seguintes parâmetros: 87Sr/86Sr, por Q-ICP-MS após separação do Sr e Rb por
cromatografia de troca iónica; composição multi-elementar (Li, Be, Mg, Al, Sc, Ti, V, Mn, Co,
Ni, Cu, Zn, Ga, Ge, As, Rb, Sr, Y, Zr, Mo, Sb, Cs, Ba, Pr, Nd, Sm, Eu, Dy, Ho, Er, Yb, Lu, Tl,
Pb) por Q-ICP-MS; elementos Na, K, Ca, Fe por FAAS. Foi ainda avaliado o efeito do
estágio com madeira nas características cromáticas, composição fenólica e polissacáridos
totais. Nas condições experimentais descritas não foi observado efeito significativo do
estágio com madeira na razão isotópica 87Sr/86Sr do vinho, não obstante o aumento
significativo da concentração de Sr do vinho decorrente do contacto com a madeira. O valor
de 87Sr/86Sr no início (0.710) e no final do estágio (0.709) não variou significativamente,
indicando a robustez desta razão isotópica como marcador de origem geográfica. O estágio
com madeira afectou significativamente as concentrações de Mg, V, Co, Ni and Sr. Ao longo
do tempo de estágio verificaram-se alterações significativas nas concentrações dos metais
Al, V, Zn, Ni, Cs e Pb.
6
Table of Contents Acknowledgment: ................................................................................................................................... 1
Abstract ................................................................................................................................................... 2
Resumo .................................................................................................................................................... 3
Resumo Alargado .................................................................................................................................... 4
1. General Introduction ....................................................................................................................... 9
2. Objective of the Thesis .................................................................................................................. 12
3. State of Art .................................................................................................................................... 12
3.1. Multi-elemental Markers ...................................................................................................... 16
3.2. Strontium Isotopic Ratio as Provenance Indicator ................................................................ 20
3.3. Wood Ageing and Oak Wood Alternatives in Enology .......................................................... 25
3.3.1. Chemical Composition of Oak Wood ............................................................................ 27
3.3.2. Wood Ageing Impact on Wine Characteristics .............................................................. 28
4. References ..................................................................................................................................... 30
5. Effect of Wood Ageing on Wine Mineral Composition and 87
Sr/86
Sr Isotopic Ratio* ................... 40
5.1. Abstract ................................................................................................................................. 40
5.2. Introduction ........................................................................................................................... 41
5.3. Materials and Methods ......................................................................................................... 44
5.3.1. Wines and Wood Material ............................................................................................ 44
5.3.2. Experimental Conditions / Experimental Design ........................................................... 44
5.4. Statistical Analysis ................................................................................................................. 49
5.5. Results and Discussion .......................................................................................................... 49
5.5.1. General Physical and Chemical Analysis .............................................................................. 49
5.5.2. Total Polysaccharides .................................................................................................... 51
5.5.3. Phenolic Composition and Chromatic Characteristics ...................................................... 51
5.5.3.1. Total Phenolics Index (TPI) ........................................................................................ 51
5.5.3.2. Total Anthocyanins .................................................................................................... 52
Color Intensity ............................................................................................................................... 54
Tonality .......................................................................................................................................... 55
5.5.4. Mineral Composition ......................................................................................................... 56
5.5.4.1. Major and Micro Elements ........................................................................................ 56
5.5.4.2. Multi-elements .......................................................................................................... 59
5.5.5. Strontium Isotopic Ratios .................................................................................................. 62
5.6. Final Considerations and Conclusion ......................................................................................... 65

7
6. References ..................................................................................................................................... 66
Scientific Disclosure ........................................................................................................................... 70
ANNEX ................................................................................................................................................... 71
Index of Tables
Table 1. Wood chemical compositions from different species (% of dry weight) (Canas and Caldeira,
2015) ...................................................................................................................................................... 27
Table 2. Effect of wood stage and time on the physical chemical characteristics of wine. .................. 50
Table 3. Effect of wood stage and time on Total polysaccharides concentrations of wine (mg/L) ...... 51
Table 4. Effect of wood stage and time on the -Total Phenolic Index (TPI) .......................................... 52
Table 5. Effect of wood stage and time on Total anthocyanins concentrations (mg/L) of wines ......... 53
Table 6. Effect of wood stage and time on color intensity of wine ....................................................... 54
Table 7. Effect of wood ageing and time on tonality ............................................................................ 55
Table 8. Effect of wood stage and time on macro elements composition (mg/L) ................................ 57
Table 9. Effect of wood stage and time on multi-elemental composition ............................................ 60
Table 10. Effect of wood stage and time on strontium isotopic ratio .................................................. 64
Table 11. Total polysaccharides concentrations values (mg/L) ............................................................ 71
Table 12. Mean values of chromatic characteristics ............................................................................. 71
Table 13. Sr and Rb concentrations (ng/L) and effectiveness of chromatic separation values. ........... 72
Table 14. Physical – chemical characteristics of wines ......................................................................... 73
Table 15. Major and micro elements compositions of wines .............................................................. 74
Table 16. Multi-elemental compositions of wines ................................................................................ 75

8
Index of Figures
Figure 1. Metal sources in wine - endogenous (solid line) and exogenous (dotted line) (Pohl, 2007) . 16
Figure 2. Analytical procedure of strontium isotopic ratio determination (Moreira et al., 2016)........ 48
Figure 3. Evolution of total anthocyanins concentration during wood ageing ..................................... 53
Figure 4. Evolution of Na (mg/L) in wines over time ............................................................................. 58
Figure 5. Evolution of K (mg/L) in wines over time ............................................................................... 58
Figure 6. Evolution of Ca (mg/L) in wines over time ............................................................................. 58
Figure 7. Evolution of Fe (mg/L) in wines over time ............................................................................. 58
Figure 8. Evolution of Al (mg/L) in Control and Wood over time .......................................................... 61
Figure 9. Evolution of V (ng/L) in Control and Wood over time ............................................................ 61
Figure 10. Evolution of Zn (ng/L) in Control and Wood over time ........................................................ 61
Figure 11. Evolution of Ni (ng/L) in Control and Wood over time ........................................................ 61
Figure 12. Evolution of Cs (ng/L) in Control and Wood over time ........................................................ 61
Figure 13. Evolution of Pb (ng/L) in Control and Wood over time ........................................................ 61
Figure 14. Evolution of Sr (µg/L) in Control and Wood over time ......................................................... 62
Figure 15. Evolution of Mg (µg/L) in Control and Wood over time....................................................... 62
Figure 16. 87
Sr/86
Sr Isotopic Ratios in wines over time.......................................................................... 64

9
1. General Introduction
Wine is one of the oldest fermented drinks in the world and consumed by number of people
with a growing interest day by day. 274, 4 millions of hectoliters of wine are produced in the
world with Europe’s half share of the global production (OIV - International Vine and Wine
Organization, 2015). These numbers provide a clear insight how the wine sector is important
for consumers, producers and all the actors in this sector. As commonly known common
attributes like aroma, color, mouth feeling, are the main quality indicators of wine. As a result
of containing many organic and inorganic substances, it is a complex beverage. Therefore, it
has several quality criteria besides its physical and chemical composition, such as grape
variety, origin, soil and climate, winemaking practices, traditional applications and terroir.
Terroir is a concept that is attributed to build a holistic approach regarding interactions
between physical, chemical, biological environment and applied viticultural practices that
represent the characteristics of products from a particular territory. The term includes specific
soil, topography, climate, landscape and biodiversity and grape variety. The biggest
contribution factor to classify the wines is terroir (OIV, 2010).
With regards to especially terroir aspect, the determination of wines’ authenticity has been an
important issue for wine producers and consumers for decades. As a consequence of being
one of the most consumed alcoholic drinks, and having easily adulteration potential, it is
subjected to some falsification applications in the industry, hence posing risks for producers
and actors as well as for consumers. While some of these falsifications are of quality risks
and result in financial losses due to reputation damage such as incorrect grape variety,
addition of water, sugar or alcohol, while some can lead to serious health risks due to high
heavy metal concentration if they are superior to safe limits. One research study that was
done with wide variety of wines from different countries showed that most of the samples
exhibited high level risks regarding target hazard quotients (THQ) (Naughton and Petróczi,
2008). Therefore, this situation makes researchers develop reliable methods to reveal the
illegal applications and adulterations. Due to certain protected and certificated wine regions,
classification of wines are strictly regulated in EU by label regulations which producers need
to declare the qualities of the wine and to give certain and correct information to the
consumers. In Europe, label legislation is maintained for protecting the designation of the
region and encourages traditional and good practices under the name of protected
geographical indication (PGI) that wine’s characteristics are related exclusively to the
geographic origin, including natural and human factors and also protected designation of
origin (PDO) and traditional specialities guaranteed (TSG). PDO covers agricultural products
and foodstuffs which are produced, processed and prepared in a given geographical area

10
using recognized traditional practices while PGI covers agricultural products and foodstuffs
closely linked to the geographical area. At least one of the stages of production, processing
or preparation takes place in the area. TSG highlights traditional character, either in the
composition or means of production (OIV, 2015).
From the consumer’s perspective, it is difficult to rely on every bottle in the market as some
may not have fair declarations. Fraudulent practices in the industry are not only on premium
wines but also on fine/medium quality wines. There are several types that producers may
apply at different stages of the chain. Easily applied adulterations, that eventually provide
high profit margins, pose challenging risk for counterfeiting. Sweetening (chaptalization),
substitutions by cheaper products which can be addition of different source of sugars,
coloring agents, water, preservatives, flavor note and CO2 and acidity regulators are
commonly known fraud uses. Traceability of the whole chain by the authorities is not always
easy and requires specific tools and methods for authentication purposes. In Europe, the
quality of wine is controlled by taking several criteria into account about the sensory
characteristics, label declarations such as alcohol content, vintage, blending, geographical
origin and also chemical adulterations as mentioned above. The objective of these detection
tools is to verify the accuracy of the information that is declared on the labels and uncover
the counterfeiting applications so that buyers and consumers are protected and not misled.
In addition to revealing the falsifications, authenticity of wine’s origin on the labels provides
dignity to the product in the eyes of customers. Moreover, designated origins, that are also
called appellation of origin, add high values to the wines. As there are several regions
(terroir) in the world that are known by their fine quality wines, people are willing to pay more
for the wines from these regions as long as they are reliably identified.
In the literature, recently, one of the most commonly used analytical techniques for
fingerprinting is the multi-element composition of the product. However, it is still in research
that there is no officially established method by OIV for authentication purpose by using
multi-elemental analyses. Multi-elemental analysis is applied to determine the mineral pattern
and concentration of wine. Statistical techniques make it possible the discrimination of wines
according to the products’ geographical area where they are grown. However, mineral
composition of wine (macro and micro elements) changes with different agricultural
applications, such as fungicide, pesticide and fertilization applications, winemaking practices
and environmental conditions (Kment et al., 2005; Pohl, 2007; Catarino et al., 2008a,
Catarino et al., 2008b). Therefore, it makes it difficult to depend on only multivariate methods
as a provenance tool due to uncertainties and insufficiencies. It is necessary to find new
alternatives with more precise and accurate results related to the geographical origin. Thus,

11
analytical methods are developed by using trace elements whose concentrations are lower in
the nature than other elements that had slight but significant changes according to the
geological regions that seem to give more trustworthy results.
With provenance verification purpose, isotope abundance ratios have been used for several
decades for determination of archeological sources and also in geo-sciences. Growing
interest in food provenance enabled new applications and methods also in agriculture. As an
alternative to the above mentioned methods regarding authenticity and wine fingerprinting,
Horn et al. (1993) published a study by using isotopic ratio of strontium for wine traceability
with promising results. The study emphasizes that different geological bedrocks have
different mineral composition in the earth stratum. The mineral composition of rocks and soils
differs from one region to another by representing different strontium isotopic ratios. Even
though, the ratios vary slightly from one area to another, they might be significantly different
from each other. Strontium isotopic ratios (Sr IR) can lead to recognition of adulterations or
frauds as soils from different wine regions carry different 87Sr/86Sr values (Horn et al., 1993).
Hence, strontium isotopic ratio can be used as a provenance assignment tool in regard to its
close relation between 87Sr/86Sr of soil origin and the plant. The study by Horn’s team
encouraged researchers to focus on strontium element for traceability purpose in order to
prevent false declarations of wines with denominations of origins. In the last two decades,
there have been many studies proving the reliability on 87Sr/86Sr for wine fingerprinting.
Nevertheless, there are also number of studies reporting the analytical uncertainties and
discrepancies of Sr isotopes analyses in wines and difficulties to match them with their
substrata data (Martins et al., 2014; Durante et al., 2015; Marchionni et al., 2016).
One study that analyzed the soil composition and grape juices, seeds, skins, and wine
samples in each step of the vinification process, suggests that strontium isotopic ratio may
be carried inalterably by the different stages of wine making processes (Almeida and
Vasconcelos, 2004). Even though, several vinification steps do not seem to alter the
strontium ratio of soil that is transferred to the vines, according to the recent studies in the
literature, to our knowledge, there is no study that reveals the oak ageing impacts on the
strontium isotopic ratio. The evolution of wine’s mineral composition with ageing is also
lacking in the literature as some of these elements are with special interest such as heavy
metals due to their food safety issues in addition to the evolution of physical – chemical
characteristics of wine. Hence, it is important to unveil their development by wood contact for
future studies.

12
2. Objective of the Thesis
Our objective in this study was to observe the evolution of 87Sr/86Sr in wine by oak ageing
and to reveal if there is any significant change in strontium isotopic ratio over time as well as
evaluating the alterations in physical, chemical and chromatic characteristics of wine during
ageing. The results will contribute to the state of art if strontium isotopic ratio can be a
reliable tool for justifying wine provenance, moreover, whether they can be used even for
aged wines. Also, the developments of the mineral composition, during ageing, were studied,
which to the best of our knowledge is a novelty.
3. State of Art It is stated that authenticity and origin of wines might be identified relying on the specific
mineral and trace element patterns by means of chemometric methods (Baxter et al., 1997;
Thiel et al., 2004).
With the increasing awareness of consumers about the origin of the food, authorities
intensely focused on discovering new practices for food fingerprinting. Recently reliable
analytical methods are being emerged. The use of stable isotopes of water and alcohol of
wine has been a reliable tool for authentication as they vary depending on the climatic
factors. Analyses recognized by OIV for authenticity purpose are shortly presented
hereinafter for detecting the frauds and tracing the authentication in wines concerning the
falsification and authenticity issues.
In terms of authenticity in wine, stable isotopic ratio analyses of 13C/12C, 2H/1H and 18O/16O
were the first methods that were recognized by OIV for detecting the sugar origin in wine.
Nevertheless, these tools still stay to be limited in terms of interpreting the data and relating
them to the wines’ provenance. The most commonly used frauds are shortly explained as
follows:
Chaptalization is identified by ethanol analysis in order to identify the sugar source in wine.
Because sugar cane and maze are from C4 group plants while grapes are of C3 plants.
Grapes showing lower isotopic ratio of 13C/12C in ethanol than other sugar sources makes
easy to detect the foreign sugar addition into the wine (OIV-MA-AS312-06 Type II method;
OIV, 2015). Another method based on the distribution of the deuterium (heavy H) in the
grape must reveals the addition of exogenous sugar while also giving the climatology of the
production area (Commission Regulation No 2348/91). This technique is also known as Site-
specific Isotope Fractionation measured by Nuclear Magnetic Resonance (SNIF NMR™).
13
Water addition is identified by isotopic ratio of 18O/16O water in musts and wines by means
of stable isotopes ratio mass spectrometry method (IRMS). The ratio of 18O/16O reflects the
geographic origins and the climatic conditions of the products (Commission Regulation No
1932/97).
Carbon dioxide in wine must come from the botanic origin of Vitis Vinifera. In order to justify
its origin exogenous CO2 can be detected by the isotopic ratio of 13C/12C by IRMS method
especially for sparkling wines (OIV Method OIV-MA-AS314 Type method: II; OIV, 2015).
Glycerol; The determination of 13C/12C in wines by Gas Chromatography Combustion or
High performance Liquid Chromatography coupled to Isotopic Ratio Mass Spectrometry (GC-
C-IRMS or HPLC-IRMS, respectively) enables the detection glycerol addition (OIV Method
OIVMA-AS312-07 - Type method: II).
In the international methods of analysis by OIV, wine authenticity for fingerprinting is
assessed by analyses with targeted compounds that are, as some are already indicated
above, nuclear magnetic resonance techniques (NMR), stable isotopes ratio mass
spectrometry (IRMS), high performance liquid chromatography (HPLC) and gas
chromatography for determination of light isotopes (Roullier-Gall et al., 2015).
In the case that the results are inconsistent, additional information to the isotope analysis of 18O/16O of wine water can be used. For instance, in a study, the minerals in wine (Mg and
Rb) in addition to 18O/16O isotopic information made it possible to classify the different
regions in Brazil by means of discrimination statistical analysis (Dutra et al., 2011).
A very interesting study was done in 1999 in Bordeaux, with combination of methods of
isotope ratios (C, H and O) and trace elements. The production year and different
denominations were efficiently differentiated by IRMS and SNIF-NMR (Martin et al., 1999).
Very similar study by using multivariate analysis, this time with combination of IRMS and H-
NMR made it possible to discriminate three different regions in Spain by their 2H and 13C
content variation of fermentative ethanol based on environmental and eco-physiological
factors within three years (Giménez-Miralles et al., 1999).
Furthermore, frauds are not only about exogenous addition of sugars or waters but also on
the labels that can be related to the vintage year, ageing time and grape variety. There are
several studies that established methods to reveal these characteristics’ of wine. One
research team published a study with different wine samples from three different vintage
years (1996, 1997 and 1998) with the aim of provenance tool and they were successfully
separated according to their geographical origin that compares the coastal region and
continental regions with combination of site-specific natural isotopic fractionation nuclear

14
magnetic resonance (SNIF-NMR) method and IRMS method that used ∂13C. However,
separation of two continental regions was only possible when 18O/16O was included in the
statistical evaluations (Ogrinc et al., 2001). It promotes to note again that the integration of
different methods and tools are essential for additional information in the scope of
authenticity.
It is difficult to determine the vintage years of wines. Analytical measurements are
established by the determination of 14C content with successful findings. However, 14C
content of a wine can differ from one year to another due to nuclear testing that was done in
1950s and 1960s. Isotopic ratio 2H/1H ethanol is also correlated with the environmental
conditions of the vintage year. Yet again, any supportive environmental data to the 2H/1H or
to any fingerprinting method about soils are necessary for authentic results (Arvanitoyannis
et al., 1999). Alternatively, DNA-based detection systems are alternative methods for wine
varietal identification as long as they are not modified through the chain (Fernandes et al.,
2015). DNA based techniques (PCR, capillary electrophoresis, capillary gel electrophoresis
with laser-induced fluorescence) by extracting DNA fragments from must or wine for
authenticity purpose are also used when the spectrometric techniques need additional
information (Pereira et al., 2016). Baleiras-Couto and Eiras-Dias (2006) reported that
molecular methods on the basis of residual DNA successfully detected the grape cultivar
DNA fragments in the wine. However, a contradictory study stated that, since the DNA can
be degraded during winemaking processes and can be found in low concentration after
fermentation, molecular markers based on DNA analysis cannot be a reliable tool for
commercial wines (García-Beneytez et al., 2002).
In addition to analytical tools, sensory analyses are carried out by experts who are able to
distinguish which geographical origin the wine is made in (Elortondo et al., 2007). However
as Palade and Popa (2014) stated this method might be significantly uncertain which makes
it controversial despite having well-trained panelists who are thoroughly qualified to perform
the sensory evaluation. Because, determination of wines’ origins depends on the qualification
of the panel which means it is difficult to have reliable results. Uncertainness of this method
may cause insufficient results and requires combination of additional techniques such as
analysis of volatile compounds, amino acidic profile, phenolic composition, mineral profile
and stable isotope ratios as the principal methods (Danezis et al., 2016).
In order to assess the must varietal origin, molecular markers can also be used.
Microsatellite-based system (microsatellite SSR) is found to have a strong correlation with
leaf and must samples. The method is based on DNA extraction. In spite of the fact that DNA

15
extraction from vine and wine is relatively more difficult due to reasons such as maceration
process, use of microorganisms during the process, nevertheless, for grape vine variety
characterization, it is considered to be a very efficient method once they are independent of
environmental factors (Pereira et al., 2012).
Composition of wine phenolic compounds varies according to the grape variety and is
affected by maceration, fermentation and ageing conditions that consequently determine the
wine color and mouth feel due to especially anthocyanin compounds (Mazza, 1995; Gao et
al., 1997; Vázquez et al., 2010). Anthocyanins form polymeric compounds that create more
stable wines by the time (Ribéreau-Gayon et al., 2006). They have been also found as the
most indicative phenolic profile of geological origin and phenolic compounds are the biggest
contributors for organoleptic characteristics of wine. The determination is carried out by high
performance liquid chromatography (HPLC). Several studies showed the use of anthocyanin
profiles for distinguishing wines with the ratio of acetylated and coumaroylated anthocyanins
(Rac/coum) (Von Baer et al., 2008). In the course of maturation of wines in barrels or tanks, due
to the presence of oxygen, red color gets degraded and yellow/brown color increases. This
phenomenon is because of the shift reactions of anthocyanins by polymeric pigments and it
highly contributes to the taste and flavor qualities of wine. The formation of the polymeric
pigments is caused by acetaldehyde condensation and co-pigmentation as the stability of the
compounds in wine are dependent upon several aspects, such as oxygen, temperature
(storage conditions), pH, the density of molecules, SO2, and acetaldehyde (Mazza, 1995).
The effect of different regions on phenolic characteristics of specific botanical origins can be
also representative tool of classification of wines. In a research study, it is reported that
environmental conditions from different vineyards exhibit significantly different anthocyanin
profile that can be a useful tool for young red wines’ authenticity (González et al., 2004).
Another study with the scope of categorization of wines based on the grapes variety and
origin by using their phenol content emphasizes that the polyphenolic profile of a particular
variety considerably reflects its genetic character. Therefore, study reports that many wine
samples from several regions were differentiated by eliminating the oak ageing and
technology impact on phenol content (Makris et al., 2006). One case study on vinification
impact, investigated six different winemaking variables and techniques, revealed that
phenolic concentration increased by vinification processes such as thermo-vinification,
pectolytic enzyme treatment and extended maceration. Moreover, yeast selection, carbonic
maceration, skin and juice mixing practices caused inconstant results depending on the
grape varieties (Sacchi et al., 2005).
It is also important to highlight the impacts of vinification processes and ageing on Castelão
wines as it is our case study’s variety. The study by Spranger et al. (2004) made it possible

16
to differentiate wines from the same cultivar on the basis of the winemaking technologies.
The carbonic maceration wine had less color intensity than skin fermented wines, lower
concentrations of phenolic compounds and increasing maceration time decreased both total
and some individual anthocyanins. The volatile composition was not significantly affected by
the presence of stems. It is once again confirmed that phenolic and volatile composition
seemed to be a potent tool to classify the wines.
On the other hand, one opponent study about using the phenolic composition for
geographical indication purpose was published. The study on Italian red wines showed that it
was not possible to differentiate the wines by their phenolic composition (Gambelli and
Santaroni, 2004).
3.1. Multi-elemental Markers
As illustrated on figure 1, the metal content of the wines can be influenced by factors such as
the levels of these elements in soil, fertilizing practices and processing conditions (Álvarez et
al., 2007; Pohl, 2007). Effect of winemaking techniques on the mineral composition of wines
was investigated by ICP-MS if the mineral content changes by the addition of yeast, fining
products, etc. from must to wine. The study was in micro-vinification scale. Only few
elements (Li, B, Mg, Ca, Rb, Cs and Pb) out of 63 were found to stay in constant
concentration during the winemaking processes while the rest of the elements’
concentrations varied due to fermentation and winemaking processes (Castiñeira-Gomez et
al., 2004).
Figure 1. Metal sources in wine - endogenous (solid line) and exogenous (dotted line) (Pohl, 2007)

17
In another study, the effects of different winemaking techniques (addition of pectolytic
enzymes, Ganimede autowinemaker, prefermentative maceration, addition of oak chips,
delestage, and conventional procedure) on the metal content (Ca, Cu, Fe, Mn, Mg, K, and
Zn) and phenolic composition of red wines were investigated. Fe, Mn, Ca were selected as
descriptor elements that discriminated different winemaking practices. Other descriptor
elements were also found significantly correlated with the phenolic composition and
anthocyanin compounds (Soto Vázquez et al., 2013). The team also highlighted that,
depending on the winemaking process, metal concentration can be influenced due to metal-
tannins combinations if there is addition of tannins to the wine. Additionally, the effect of vine
variety on the metal absorption from soil was reported by another study with the purpose of
assessing the origin of wines by their mineral composition. Some elements (Mg, Mn, Ca, Na,
K) out of 11 elements were found to have almost identical concentration in the soil, juice, and
wine. In the study Mg is suggested to be used as a marker for wine provenance (Fabani et
al., 2009).
According to another study by Marengo and Aceto (2003), a successful classification by
using 56 metal elements in wine made it possible to identify the wines related to their
geographical origin. The study suggests that elemental composition of wines could be a good
tool to characterize and identify wine samples (Marengo and Aceto, 2003).
Despite the fact that above methods seem to give us information about the wine’s origin,
variety and authenticity, they are not strongly reliable and appropriate methods particularly
for wine fingerprinting. In order to establish a reliable tool for geographical origin
determination, the selected abundance ratio of the element must not be altered by the
agricultural and winemaking practices through the chain and the wines must reflect the same
ratios as in the soil and the rocks where the vines grow (Almeida and Vasconcelos, 2004).
As is known, the elements naturally occur in Nature as heavy and light elements with number
of their isotopes. The types of mass fractionations of light elements’ isotopic ratios represent
information about only their history. Besides that, elements with atomic weights greater than
50, heavy elements, have large relative mass differences, have very small ∂m/m ratio.
Accordingly, mass fractionation and technical processes do not alter the abundance ratios.
Therefore, heavy elements isotopic ratios can give information about the plant’s origin. (Horn
et al., 1993) Heavy isotopes group, most commonly used ratio in food authentication in the
literature are 87Sr/86Sr and more rarely 206Pb/204Pb, 207Pb/204Pb, 208Pb/204Pb, 143Nd/144Nd
(Danezis et al., 2016).

18
Mineral composition of wines is the most valuable tool for identifying the wine provenance.
While some mineral elements’ content change during winemaking process, some elements
so-called trace elements (Co, Cr, Li, etc.) undergo a change in small amount. Although they
are found in very small quantities, these slightly changed elements are considered to be
good tools for tracing the wines’ origin and could give statistically significant results (Palade
and Popa, 2014). Marengo and Aceto (2003) state in their study that Al, B, Ba, Li, Mn, Mo,
Rb, Si, Sr and Ti are elements not expected to be influenced by the production process.
However, they may be altered by the winemaking processes (Marengo and Aceto, 2003).
The effect of vinification process on composition of Cr, Cd and Pb was studied by Kristl et al.
(2002) on the grapes, pressed pomace, deposit of must, lees deposit, must and wine which
were sampled from three different wineries. Cr, Cd and Pb were maintained in higher
amounts in wine than in the must. This confirms the metal contamination from the equipment.
This result also shows that these elements cannot be used as origin tracers as they may
undergo a change during winemaking and change the concentration of elements in the
course of contact with equipment. For instance, a study was performed in order to reveal the
evolution of lead isotopic ratio, which is a trace element, along the several vintages whose
grapes were harvested from the same vineyard. The concentration has been measured with
high accuracy by isotope dilution mass spectrometry. Over the years, lead concentration was
found to be significantly lower than it was in the past (Rosman et al., 1998).
Multi-element composition of heavy and light elements is used for fingerprinting of wine.
Inductively Coupled Plasma - Mass Spectrometry (ICP-MS) and Thermal Ionization Mass
Spectrometry (TIMS) methods can quantify heavy isotopes by spectroscopic methods. A
large number of studies have been published with especially ICP-MS technique for
characterizing the mineral composition of wines and correlating them with their geographical
origin with the close soil – vine relation (Jakubowski et al., 1999; Barbaste et al., 2002;
Almeida and Vasconcelos, 2003; Fortunato et al., 2004; Kment et al., 2005; Mihaljevič et al.,
2006; Di Paola-Naranjo et al., 2011; Martin et al., 2012; Zou et al., 2012; Martins et al., 2014;
Catarino et al., 2014).
Thiel et al. (2004) analyzed the multi-elemental composition of several wine samples and 32
elements were insignificantly influenced by climate and winemaking technology. Several
methods have been developed in the wine and food sector for tracing the agricultural chain.
An early study by Baxter et al. (1997) used multi-elemental analysis for discrimination of 112
wines by using ICP-MS method. It is stated that 48 trace elements helped successfully
discriminate of English and Spanish wines by their geographical origin. ICP-MS is known to
be one of the best techniques for multi-element determinations (Baxter et al., 1997).

19
Recently, spectroscopic methods are very commonly used to identify the wine to find out
adulterations of targeted and non-targeted ingredients. Methods with targeted approach are
applied by specified compounds of interest. These techniques give results of different
parameters in very short time by characterizing the wine in terms of quantification. On the
other hand, non-targeted approach, that can be also called as food fingerprinting, permits
having information about authenticity parameters such as vintage, grape variety, provenance
and help determine the falsifications. However, this method requires a thorough statistical
analysis such as, principal component analysis (PCA), linear discriminant analysis (LDA),
and a large database with the aim of classifying the wines according to the place of origin.
Being a spectroscopic method, ICP-MS by liquid/gas chromatographic identify minimal
analytical differences between compounds by means of analytical methods and again,
statistical evaluation. One challenge about using non-targeted path is that the regulations are
not strictly established by the authorities yet; therefore the data may differ from one end to
another because of specific applications of each laboratory. To give an example study, 6
different Slovakian wines were analyzed with Atomic Absorption Spectrometry (AAS) and the
data were evaluated by the statistical method Principal Component Factoring (PCF) and
PCA. B, Ba, Ca, Co, Cr, Li, Mg Rb, Sr, Sn and V elements out of 36 different elements in
Slovakia soils were discriminated as markers. PCF method was found to be more effective in
this study than PCA for differentiation of Slovakian wines from Portuguese, Spanish, French
and Italian wines (Koreňovská and Suhaj, 2005). It was even possible to discriminate red and
white wines successfully from 23 different wineries in a relatively small region (1000 km2) by
using multi-elemental analysis under favor of statistical methods (Coetzee et al., 2014).
The statistical approach on multi-elemental analysis was assessed in terms of its power to
differentiate the wines according to their relation with the soil in some other study. The data
comprised of 23 elements in 103 wines. ANOVA and PCA were used to choose the most
indicative elements. The study confirmed the reliability of the multi-elemental method as wine
classification tool even with a large number of data emphasizing that the selection of the
elements is essential and the use of lower measured concentrations of elements will give
more reliable results (Serapinas et al., 2008).
In two different Canadian regions (Okanagan Valley and Niagara Peninsula), multivariate
analyses were carried out in order to identify the regions by their mineral compositions with
large number of wine samples confirming the ICP-MS as a useful tool with good precision
(Taylor et al., 2003). Another similar study found 4 discriminant elements (Rb, Na, Mn and
Sr) of wines from three denomination regions of Canary Islands (Frıas et al., 2003).

20
The metal content of sparkling wines also discriminated cava and champagne wines by
means of multi-elemental analysis (by ICP-MS) and discriminant analysis (Jos et al., 2004).
In the literature, large number of case studies, using the multivariate analysis allied to the
statistical data analysis, confirms the method as a useful discrimination method of wines from
different denomination of regions. To give examples, one case study with multivariate
statistical analysis in Southern Italian regions (Basilicata, Calabria and Campania) enabled to
discriminate 120 wines according to their provenance that were produced in two different
vintages. Results showed that elemental composition was independent from the production
year (Galgano et al., 2008). Fino wines from two Andalusian Denominations of Origin (DO)
were perfectly separated as well (Álvarez et al., 2007). Same success was achieved in
Valencian wines from three protected designation of origins. Discrimination was done by 38
elements including Sr as our element of interest (Gonzálvez et al., 2009). Similar study by
ICP-MS methodology was validated for correct determination the concentration of 17
elements (Al, As, B, Ba, Ca, Co, Cu, Fe, K, Mg, Mn, Na, Ni, P, Pb, Sr, Zn) in Portuguese
wines from regions of Alentejo, Bairrada, Dão and Vinho Verde (Rodrigues et al., 2011).
Catarino et al. (2011) analyzed the composition of fourteen rare earth elements multi-
elemental characteristics of soils, grape musts and wines in three different regions (Dão,
Óbidos and Palmela) of Portugal. Discriminant analysis made it possible to relate the wines
to their vineyard origin by means of Li, Mn, Sr and RE elements (Catarino et al., 2011).
3.2. Strontium Isotopic Ratio as Provenance Indicator
As given in IUPAC technical report, strontium element has four naturally occurring isotopes.
Three of them are stable (84Sr, 86Sr and 88Sr) with constant values which means they are
non-radiogenic while 87Sr is derived from radioactive β-decay of 87Rb (half-life of 48.8 billion
years). Oldest 87Sr/86Sr isotope abundance ratios (0.699) come from meteorites and mass
fractionation is minute. Hence, 87Sr/86Sr ratio of a rock depends on its age and content of Rb.
Absolute amounts of the stable 86Sr remains constant. Basaltic rocks (young rocks) have the
lowest IR (0.702–0.706), granites (silicate rocks) show the highest abundance ratios (0.710–
0.750). Lime stones contain high Sr content with a medium level of IR values (0.706–0.709)
(Garcia et al., 2007; Horn, 1993).
The 87Sr/86Sr isotope abundance variations given by IUPAC fall in a range of 82.29–82.75 %
for 88Sr, 6.94–7.14 % for 87Sr, 9.75–9.99 % for 86Sr and 0.55–0.58 % for 84Sr, respectively
(Rosman and Taylor, 1998; Fortunato et al., 2004).
21
Observed range in the nature for 87Sr is 0.0694–0.0714 mole fractions while 86Sr is 0.0975–
0.0999 which gives the ratio range from 0.695 to 0.732 as also indicated in IUPAC technical
report (Berglund and Wieser, 2011).
Geological age of a rock determines how many nuclides are formed. Nevertheless, despite
having constant decay rates of radiogenic elements, overlapping of 87Sr/86Sr in different
regions is possible due to human factors such as fertilizer use. In this case, in spite of being
a reliable fingerprint of abundance ratios of heavy and light elements, taking another
element’s isotope ratio into consideration would give more efficiency for provenance tracing
purpose, such as use of 144Nd/143Nd (Horn et al., 1998).
Bearing in mind the above qualities of naturally occurring isotopes of elements, such as
strontium (Sr), are considered to be good tools for characterizing soil-vegetation relationship.
Multiple-collector inductively coupled plasma mass spectrometry (MC-ICP-MS) has been
used for the precise determination of variations in the isotopic composition of Sr (Capo et al.,
1998; Fortunato et al., 2004).
Considering that the wines contain several minerals, only a few of them are affected by the
soil structure and composition that allow soil - vine close relation to be used as geographical
indicator (Thiel et al., 2004). In the literature, most recently, trace elements and stable
isotopes are used to classify wines to the geographical origins. The trace elements in grape
juice are up taken by the plant from the soil. Lately, strontium is one of the most focused
elements as wine fingerprinting tool. Sr element is absorbed by the roots of the plant.
Strontium isotopic ratio is independent of the vine species that, reflects the value of the
geological parent rock (Horn et al., 1993; Gosz and Moore, 1998; Tescione et al., 2015).
Therefore, it is important to choose specific elements that are particularly carried from rock to
the soil and pass from soil to the grape in the same isotopic ratios as in the soil (García-Ruiz
et al., 2007).
Recently, there have been a number of studies revealing the relation between the soil and
food products representing their traceability of each terroir with analytical parameters
Almeida and Vasconcelos (2003) urged the close relationship between soil and the wines by
using multi-elemental composition of soils, grape juices, and wine samples. The method
used was ICP-MS. In the study, it is indicated that vinification processes altered the
elemental composition of wine because of precipitation and co-precipitation phenomenon. In
addition, during the maturation of wine, there was Cd, Cr and Pb contamination from the
equipment. Despite this contamination fact, strong correlations were still found in terms of
their strontium isotopic ratio between wine and respective grape juices. Hence, using an

22
element’s isotopic ratio would be more efficient for fingerprinting particularly on fine wines
produced by specific grape varieties as the contamination sources might be better controlled
(Almeida and Vasconcelos, 2003). It is also important to take into consideration
anthropogenic human factors such as irrigation water, pollution and fertilizers that can
contribute as mineral sources (Rosman et al., 1998; Avram et al., 2014; Petrini et al., 2015).
To give an example, a study focusing on atmospheric inputs of forested ecosystems in New
Mexico reported that 87Sr/86Sr isotope ratio varied from 0.7090 to 0.7131 significantly
between years due to the precipitation (Gosz and Moore, 1998). What is to point out here is
that the use of mineral composition is only reliable for determining the wine’s origin as long
as they are not altered during production processes (Almeida and Vasconcelos, 2003; Suhaj
and Korenovska, 2005). Winemaking involves several practices that can modify the element
content significantly. Therefore, elements to classify with high discrimination power must be
carefully selected (Thiel et al., 2004).
Strontium isotope ratios for provenance tracing have also been used on different food and
agricultural products in several studies, such as wheat, butter, cheese and ginseng, mineral
water, beer and olive oil (Branch et al., 2003; Rossmann et al., 2003; Fortunato et al., 2004;
Montgomery et al., 2006; Rosner, 2010; Medini et al., 2015; Bong et al., 2016). Another
study compared the changes in 87Sr/86Sr ratio in different levels of a forest ecosystem by
analyzing the soil, caterpillars, leaves, snails and eggshells. The team affirmed that strontium
isotopic ratio was not modified within the food chain (Blum et al., 2000).
As specified earlier, it is always necessary to have complementary information for
authentication of wine by means of relation between its chemical compositions and the
territory where the grapes grow (Thiel et al., 2004).
In a study with cider, 87Sr/86Sr isotopic ratio with together with Na, Mg, Al, K, Ca, Ti, V, Mn,
Zn, As, Rb, Sr, Mo, Ba elements allowed distinguishing wines from different countries
bylinear discriminant analysis (García-Ruiz et al., 2007).
For example, according to a research, 87Sr/86Sr values along with Mg concentrations were
best discriminator minerals of wine origin. Additionally, inserting phenolic characteristics of
wine provided even a more efficient discrimination between the varieties from the same
region (Di Paola-Naranjo et al., 2011).
Such studies about isotopic ratios of radiogenic elements of geological region interest have
drawn attention for wine traceability (Horn et al., 1993; Almeida and Vasconcelos, 2004).
Once again, 87Sr/86Sr can be used as a fingerprint of wine origin, if a considerable correlation
between the value of this parameter in the soil and in a wine is observed and if significantly

23
different values are observed in wines from different geological bedrocks (Almeida and
Vasconcelos, 2004).
Horn’s team published a study two decades ago, stating that soils of respective vineyards
regions have different 87Sr/86Sr ratios. The elements, which are absorbed by the plants,
maintain the same isotopic ratios as in the soil and rocks. The team used thermal ionisation
mass spectrometry (TIMS) method for Sr isotopic ratio measurement. This technique gives
both accurate and precise results (Horn et al., 1993). However, being an inconvenient
method with long sample preparation and an expensive method, this technique is less
favored and unfeasible. Thanks to its fast and simpler sample preparation, low sample
analysis cost, ICP-MS method has recently been used in isotope ratio determination. It has
0.01 % relative standard deviation (RSD) that is considered to be not enough for accurate
results while TIMS have 0.002 % RSD. 0.01 % is the minimum precision that is needed.
However, Barbaste et al. (2002) achieved a ratio between 0.002 – 0.003 % with ICP- sector
field multi collector MS that is based on relative differences on the precision which was better
than the R.S.D of 0.3 % achieved by Almeida and Vasconcelos (2001). The technique can
play an important role due to its fast sample throughput, low sample analysis cost, instrument
robustness and simplified sample preparation comparing to TIMS (Barbaste et al., 2002;
Marguí et al., 2006). The lower precision obtained by ICP-MS compared to TIMS can be
explained considering that the isotopes are usually measured sequentially by using strontium
isotopic ratio as tracer element which relates the grapes with the substratum (García-Ruiz et
al., 2007). However, it is necessary to highlight that, in our work, precision of the results is
more fundamental than the accuracy.
Another publication achieved correct classification of soils by means of multi elemental data.
Also 100 % of the wines analyzed from the three regions in Argentina using seven elements
(K, Fe, Ca, Cr, Mg, Zn and Mn) were successfully distinguished, 85 % of correlation
variability was observed between the wines and respective soils in which the vines were
grown (Fabani et al., 2010).
Almeida and Vasconcelos (2004) state that although winemaking processes, and chemical
applications in the vineyard change the element composition of must and wine, a strong
correlation in terms of Sr isotopic ratio between wine and grape juice is still found. A similar
study also reports that the analytical results of red and white wines did not show significant
differences between oenological food chains. Sr isotopic values of red and white wines were
not affected by addition of fining agents (yeast and bentonite) during winemaking process
proving the close relation with the vineyard (Tescione et al., 2015). One recent study by
Durante et al. (2016) shed light on the use of 87Sr/86Sr isotope ratio as geographical tracer,
24
investigated the cellar practices that used different additives, such as clarification or
deacidification agents as well as concentrated musts. The hypothesis was that strontium
concentration could be modified; hence the 87Sr/86Sr ratio of wine may be affected by these
practices. Considering constancy of Sr IR from the soil to the plant and eventually into the
wine, samples from grape juice, intermediate products and wine were taken at each step.
Once again, the 87Sr/86Sr ratio was found to be a powerful tool discriminate the wines based
on their region (Durante et al., 2016).
In another study targeting the IR measurements for B and Sr element by ICP-MS, in four
different South African regions, achieved the precision value of 0.1 RSD. While significant
results to differentiate the wine regions were obtained with 11B/10B, it is reported that 87Sr/86Sr
values did not give a useful correlation between the wines’ respective origins that might be
explained due to isobaric overlapping of 87Rb with 87Sr (Vorster et al., 2015).
A Romanian team has investigated the mineral content and isotopic ratios of 206Pb/207Pb, 207Pb/208Pb and 87Sr/86Sr of 27 white wines from four regions from three vintages. ICP-MS
method was used. Some agricultural practices such as fertilization and pesticide uses can
make difficult the tracing of wine origin. They quantified the concentration of three mineral
groups: macro-elements (superior to 10 mg/L), micro-elements (between 0.1 – 10 mg/L) and
trace elements, such as Pb, Cd, Cs, Sr, whose concentrations are below 0.1 mg/L. The
results show that using winemaking and agricultural practices cause adulterations on the
concentration of micro and macro elements while trace elements are quite stable from year
to year (Avram et al., 2014). As long as anthropogenic contamination does not arise during
winemaking, strontium isotopic ratio (Sr IR) stays constant. Yet, in order to justify this, Sr IR
of the vineyard soil must be determined (Almeida and Vasconcelos, 2004).
Mercurio and his team studied on volcanic vineyards to find a correlation between rare earth
elements, micro-nutrients and Sr isotopic ratio for a reliable fingerprinting method. However,
no element was found to be traced as an indicator of the wine provenance except for 87Sr/86Sr isotopic composition (Mercurio et al., 2014).
A correlative study by Martins et al. investigated the soil strontium isotopic ratio values from
Portuguese appellation regions of Dão, Óbidos and Palmela. It was reported that the regions
were successfully discriminated by their geographical indications with the precision ratio
between 0.04 and 0.23 (Martins et al., 2014).
Furthermore, 87Sr/86Sr isotopic ratios of 45 bottles of wine from four different regions of Italy
were analyzed by TIMS which is a reliable method with high precision and accuracy. It is
demonstrated that Sr isotopic ratios in wines were in the same range as the vineyards soil.
Large range variations were observed between different geographical areas even from
25
different vintage years, which make Sr IR a reliable mechanism for traceability (Marchionni et
al., 2013).
Very recent study on Cesanese wines from different vintage years focused on the only
strontium composition change during winemaking process. It was found that 87Sr/86Sr isotopic
ratios that were determined in soil, grape juice and in wines have been found statistically
identical. It confirms that Sr isotopic ratio in substrata of the vineyards are highly correlated
with the wine Sr IR of the Cesanese region and are independent from winemaking process
and vintage year unless contamination occurs (Marchionni et al., 2016).
Two recent studies from Vinciguerra et al. (2016) and Geană et al. (2016) announced very
promising results by attributing a strong relationship between 87Sr/86Sr on grape and wine
and soils from different vineyards in Quebec and in Romania, respectively.
Being a reliable tool of Sr IR as a geographical indicator, study reports that musts from the
different vineyards are also characterized by variable 87Sr/86Sr ratio, which remains
reproducible in three different harvests. However, the variation of the 87Sr/86Sr in must, seeds
and stem overlaps is explained by experimental uncertainties (Petrini et al., 2015).
3.3. Wood Ageing and Oak Wood Alternatives in Enology
Traditional winemaking involves ageing in oak barrels for maturation of the wine in order to
obtain favorable aroma and flavors by means of extraction of volatile compounds (and
phenolic compounds, namely hydrolyzable tannins) from the wood and also for the wine’s
color improvement. Oak ageing has a big influence on wine’s chemical and organoleptic
characteristics. Oak wood composition depends on its geographical origin, oak species and
the cooperage processes. Oak comes from Quercus genus. The species that are used for
ageing of alcoholic beverages are Q. alba L.(American oak), Q. sessiliflora
Salisb and Quercus robur (French oaks) and Quercus pyrenaica willd. The first two species
are mainly used for the ageing of wine while Q. robur is used for the ageing of Cognac wine-
brandy (Garde-Cerdán and Ancín-Azpilicueta, 2006).
The most important quality of oak barrels for wine ageing is being porous to let the oxygen
contact with wine and develop the wine’s aroma and taste and color, affect the phenolic
content and improve its stability (Mazza, 1995; Rubio-Bretón et al., 2012). Porous
characteristics lead to aeration that increases the color intensity of wines (Ribéreau‐Gayon et
al., 1983).
26
Physical and chemical changes that occur during oak ageing can be described as
degradation of anthocyanins, tannins polymerizations, copolymerization of tannins and
anthocyanins, formation of new pigments, extraction of pigments from the oak (Rubio-Bretón
et al., 2012). The anthocyanin composition changes during wood ageing by means of
formation of pyranoanthocyanins and anthocyanin derived pigments. Although grapes do not
contain pyranoanthocyanins, during ageing they are produced with a reaction of
anthocyanins and several compounds (hydroxycinnamic acids, pyruvic acid, and the
corresponding vinylphenols). That is why it is important to take into consideration of the
formation of pyranoanthocyanins while determining the anthocyanins in wine (Von Baer et al.,
2008).
During the ageing in oak barrels, wine composition changes also due to the extracted
compounds, such as lignins, tannins, gallic acid, ellagic acid, aldehydes, aromatic carboxylic
acids (Chira and Teissedre, 2013). However, ellagic tannins and volatile substances
decrease by the time as barrels are continuously used.
The wine’s development depends on various parameters during ageing such as oxygen,
SO2, temperature, time, its phenolic composition, total polysaccharides concentration and
interactions between tannins and anthocyanins (Ribéreau-Gayon et al., 2006).
The oak barrels are subjected to heating with different temperatures. The components
(tannins, lignin derivatives, volatile compounds) that are transferred into the wine with
thermal degradation alter wines’ organoleptic characteristics. Maturation of the oak depends
on the species, geographical origin, forest origin, stave variation, barrel’s age and volume
(Koussissi, 2009). In addition to these factors, toasting process, (toasting time and
temperature) contact period play important roles on the wine’s final composition. Lignins
exhibit a large amount of aromatic compounds in the course of toasting treatment.
Frequency of using the barrels also influences the oak wood composition (Garde-Cerdán and
Ancín-Azpilicueta, 2006). Old barrels have less contribution to the wines organoleptic
development than the new barrels since they release fewer compounds. Toasting is
considered to be the process that has the greatest impact on chemical and polyphenolic
composition of the oaks (De Simon et al., 2010). Medium level of toasting is known to give
the optimal combination of several compounds due to the newly formed polymers or
polymers degradation(Chatonnet et al., 1989).
However, being space occupant, costly, a long-lasting practice of production of oak barrels
and also having the risk of microbial growth of undesired organisms (Brettanomyces) of
reused barrels, cost-effective alternatives to oak-ageing are developed in the industry, such
as, using pieces of woods so-called oak chips and oak staves (larger fragments of oak chips)
that provide the desired quality in a shorter time (Campbell et al., 2006). It has been found

27
that use of chips in wine provides better extracted wood aromas than oak barrels in shorter
time (Gutiérrez Afonso, 2002). The use of oak chips and staves are regulated by
International Oenological Codex (OIV, 2015)
Dimensions of oak staves play an important role on the wine flavor. For example, guaiacol
was extracted in higher amounts when larger sized chips were used (Arapitsas et al., 2004)
A study that was carried out to see the impacts of use of oak chips, oak staves and oak
barrels on wine’s composition reported that vanillin was extracted in greater quantity by oak
chips than oak staves and oak barrels while barrels and staves provided similar extracted
amounts in wine (Del Alamo Sanza et al., 2004). Another study by De Simón et al. (2010)
stated that although different type of oak species exhibit specific extraction behavior, still, the
size of wood pieces has a greater impact on the volatile composition of the wines than the
oak species.
Nevertheless, it is important to state that these alternative accelerated uses of oak woods
may not provide the same results as oak barrels (Rubio-Bretón et al., 2012). In addition,
micro-oxygenation in stainless steel vats is used in order to mimic the oxidation that occurs in
oak barrels.
3.3.1. Chemical Composition of Oak Wood
Chemical composition of oak can be categorized in two groups: extractable compounds and
macromolecules. 90% of the dry oak wood consists of macromolecules which are polymers
of cellulose, hemicelluloses and lignin (Rubio-Bretón et al., 2012). Oak wood lignins have
significant effect on barrel characteristics, regarding their contribution to the hydrophobicity
and impermeability (Le Floch et al., 2015). Wood composition with percentages is in table 1.
In the table, cells with more than one value represents values from different references in the
literature.
Table 1. Wood chemical compositions from different species (% of dry weight) (Canas and Caldeira, 2015)
Species Cellulose Hemicellulose Lignin Extractables
Castenea sativa 47.3 - 31.8; 45 14; 16.1; 18.4
Quercus robur 38.1; 41.1 26.6; 52; 29.6 12.6; 14.5
Quercus alba 50; 49-52 32; 31-33 6; 13.3
Alnus glutinosa 43,4 23,9 3,8
Fagus selvatica 49,1 22 23,8 0,8
Robinia pseudoacacia 50,1 20,6 3 - 4
Fraxinus excelsior 37,9 25,6
28
Cis-oak lactone and trans-oak lactone are the main compounds of oak wood. Guaiacol and
4-methylguaiacol are the compounds that form by the degradation of lignins while furfuryl
compounds (furfural and 5- methylfurfural) also form from hemicellulose with toasting the
oak. The quantity of guaiacol and 4-methylguaiacol are in very small quantities when the
toasting temperature is under 230°C (Bautista‐Ortín et al., 2008). These compounds are
transferred to the wine in the course of ageing. Oak lactones in untreated oaks are in small
amounts while vanillin, smoky aromas come from coopered barrels. There are several
studies confirming that American white oak species release higher quantity of cis-oak
lactones to the wine than European oak species (Gómez‐Plaza et al., 2004). Cooperage by
heat treatment with the aim of likening the original flavors can also be applied to oak pieces
as well as to the barrels. Toasting that is also called heat treatment can be light, medium and
heavy (Chatonnet et al., 1989). It significantly alters the volatile concentration that
consequently influences the wine flavor and its balance. Hence, it is an important decision to
make to what extent the barrels, or the staves or chips must be heated. Chemical and
sensory analyses assist in this respect (Campbell et al., 2006). Another factor that affects the
volatile extraction from the oak is the alcohol content of the wine. Higher amounts of volatile
compounds are extracted in higher alcohol content (Rubio-Bretón et al., 2012).
Chip size is also an important factor regarding their impact on extraction of volatiles from the
wood. A study with comparison of two different sized oak chips, as 15 x 15 x 5 mm and 10 x
2 x 2 mm states that larger amounts of cis-oak lactones were extracted from finer chips than
smaller chips during 30 days (Campbell et al., 2006). Another study indicates that heating
larger staves at 235°C releases two to four times greater quantity of guaiacol and 4-
methylguaiacol than smaller staves for French and American oak. However, it is stated that
oak chips that are significantly small in diameter (0. 1 – 0. 5 mm) lose their volatility.
3.3.2. Wood Ageing Impact on Wine Characteristics
Ageing in wood highly contributes to improve the sensory characteristics of wine by means of
extracted compounds from the oak into the wine as mentioned earlier. These extracted
compounds are dependent upon wine composition, oak wood composition and the time that
wine is in contact with wood (Garde-Cerdán and Ancín-Azpilicueta, 2006).
Oxidation, copigmentation, polymerization and condensation phenomena occur during wine
and oak contact time that ensure the stability and improve the wine’s taste by reducing its
astringency (Boulton, 2001).

29
Another study investigated the micro oxygenation and maturing with oak impacts on the
chromatic characteristics of wine. The micro-oxygenated and the oak matured wines showed
higher color intensity than control wine. Nevertheless, after six months in bottle, the oak
matured wines showed a more stable color than micro-oxygenated wines that can be
because of extracted compounds from wood (e.g. ellagitannins or wood aldehydes) (Cano-
López et al., 2010).
Using new or old barrels is also an important factor in wine’s characteristics. A case study,
which compares the contact time, size of chips and impact of new and old barrels on aroma
compounds states that the highest concentration of furfural was found by the end of 3
months ageing in the wines that are aged in new barrels and those in used barrels with oak
cubes (Bautista‐Ortín et al., 2008).
It is emphasized by many authors that the technological processes and contact of wine with
vineyard equipment increase metal concentrations during maturation and ageing (Hernández
et al., 1996; Al Nasir et al., 2001; Sauvage et al., 2002; Galani-Nikolakaki et al., 2002; Pohl,
2007; Catarino et al., 2008a). In spite of several studies indicating that 87Sr/86Sr isotopic ratio
remains stable after winemaking processes, the literature lacks the information on the wood
ageing influence on 87Sr/86Sr isotopic ratio. The aim of this study is to uncover the impact of
wood aging by oak staves on strontium composition whether they change the Sr composition
or 87Sr/86Sr isotopic ratio during ageing in red wines and shed some light to the metal
extraction from wood to wine and suggest that 87Sr/86Sr isotopic ratio could be a good
fingerprinting method for wines’ authenticity.
30
4. References
1. Al Nasir, F. M., Jiries, A. G., Batarseh, M. I., & Beese, F. (2001). Pesticides and trace
metals residue in grape and homemade wine in Jordan. Environmental Monitoring and
Assessment, 66 (3), 253-263.
2. Almeida, C. M., & Vasconcelos, M. T. S. (2001). ICP-MS determination of strontium
isotope ratio in wine in order to be used as a fingerprint of its regional origin. Journal of
Analytical Atomic Spectrometry, 16 (6), 607-611.
3. Almeida, C. M. R., & Vasconcelos, M. T. S. (2003). Multielement composition of wines
and their precursors including provenance soil and their potentialities as fingerprints of
wine origin. Journal of Agricultural and Food Chemistry, 51 (16), 4788-4798.
4. Almeida, C. M. R., & Vasconcelos, M. T. S. (2004). Does the winemaking process
influence the wine 87Sr/86Sr? A case study. Food Chemistry, 85 (1), 7-12.
5. Álvarez, M., Moreno, I. M., Jos, Á., Cameán, A. M., & González, A. G. (2007).
Differentiation of ‘two Andalusian DO ‘fino’wines according to their metal content from
ICP-OES by using supervised pattern recognition methods. Microchemical Journal, 87
(1), 72-76.
6. Arapitsas, P., Antonopoulos, A., Stefanou, E., & Dourtoglou, V. G. (2004). Artificial aging
of wines using oak chips. Food Chemistry, 86(4), 563-570.
7. Arvanitoyannis, I. S., Katsota, M. N., Psarra, E. P., Soufleros, E. H., & Kallithraka, S.
(1999). Application of quality control methods for assessing wine authenticity: Use of
multivariate analysis (chemometrics). Trends in Food Science & Technology, 10 (10),
321-336.
8. Avram, V., Voica, C., Hosu, A., Cimpoiu, C., & Măruţoiu, C. (2014). ICP-MS
characterization of some roumanian white wines by their mineral content. Revue
roumaine de chimie, 59(11-12), 1009-1019.
9. Baleiras-Couto, M. M., & Eiras-Dias, J. E. (2006). Detection and identification of grape
varieties in must and wine using nuclear and chloroplast microsatellite markers. Analytica
Chimica Acta, 563 (1), 283-291.
10. Barbaste, M., Robinson, K., Guilfoyle, S., Medina, B., & Lobinski, R. (2002). Precise
determination of the strontium isotope ratios in wine by inductively coupled plasma sector
field multicollector mass spectrometry (ICP-SF-MC-MS). Journal of Analytical Atomic
Spectrometry, 17 (2), 135-137.
11. Bautista‐Ortín, A. B., Lencina, A. G., Cano‐López, M., pardo‐mínguez, F., López‐Roca, J.
M., & Gómez‐Plaza, E. (2008). The use of oak chips during the ageing of a red wine in
stainless steel tanks or used barrels: effect of the contact time and size of the oak chips
on aroma compounds. Australian Journal of Grape and Wine Research, 14 (2), 63-70.

31
12. Baxter, M. J., Crews, H. M., Dennis, M. J., Goodall, I., & Anderson, D. (1997). The
determination of the authenticity of wine from its trace element composition. Food
Chemistry, 60 (3), 443-450.
13. Berglund, M., & Wieser, M. E. (2011). Isotopic compositions of the elements 2009
(IUPAC Technical Report). Pure and Applied Chemistry, 83(2), 397-410.
14. Blum, J. D., Taliaferro, E. H., Weisse, M. T., & Holmes, R. T. (2000). Changes in Sr/Ca,
Ba/Ca and 87Sr/86Sr ratios between trophic levels in two forest ecosystems in the
northeastern USA. Biogeochemistry, 49 (1), 87-101.
15. Bong, Y. S., Ryu, J. S., Choi, S. H., La, M. R., & Lee, K. S. (2016). Investigation of the
geographical provenance of the beer available in South Korea using multielements and
isotopes. Food Control, 60, 378-381.
16. Boulton, R. (2001). The copigmentation of anthocyanins and its role in the color of red
wine: a critical review. American Journal of Enology and Viticulture,52(2), 67-87.
17. Branch, S., Burke, S., Evans, P., Fairman, B., & Briche, C. S. W. (2003). A preliminary
study in determining the geographical origin of wheat using isotope ratio inductively
coupled plasma mass spectrometry with 13C, 15N mass spectrometry. Journal of
Analytical Atomic Spectrometry, 18(1), 17-22.
18. Campbell, J. I., Pollnitz, A. P., Sefton, M. A., Herderich, M. J., & Pretorius, I. S. (2006).
Factors affecting the influence of oak chips on wine flavour. Australian and New Zealand
Wine Industry Journal, 21 (4), 38-42.
19. Canas S., Caldeira I., 2015. Utilização de madeiras em Enologia. In Química enológica –
métodos analíticos. Avanços recentes no controlo da qualidade de vinhos e de outros
produtos vitivinícolas, Curvelo-Garcia A.S. & Barros P. (Eds). Publindústria – Edições
Técnicas, Porto.
20. Cano-López, M., López-Roca, J. M., Pardo-Minguez, F., & Plaza, E. G. (2010). Oak
barrel maturation vs. micro-oxygenation: Effect on the formation of anthocyanin-derived
pigments and wine colour. Food Chemistry, 119 (1), 191-195.
21. Capo, R. C., Stewart, B. W., & Chadwick, O. A. (1998). Strontium isotopes as tracers of
ecosystem processes: theory and methods. Geoderma, 82 (1), 197-225.
22. Castiñeira, M. D. M., Brandt, R., Jakubowski, N., & Andersson, J. T. (2004). Changes of
the metal composition in German white wines through the winemaking process. A study
of 63 elements by inductively coupled plasma-mass spectrometry. Journal of Agricultural
and Food Chemistry, 52 (10), 2953-2961.
23. Catarino S., Madeira M., Monteiro M., Caldeira I., Rosa T., Martins P., Bruno de Sousa R.,
Curvelo-Garcia A.S., 2014. Multi-elemental analysis throughout soil-wine system as a
generator of information on geographic origin. In Proceedings of 37th World Congress of
Vine and Wine (USB Pen, ISBN 979-10-91799-33-1), Mendoza, Argentina.

32
24. Catarino, S., Trancoso, I. M., Madeira, M., Monteiro, F., de Sousa, R. B., & Curvelo-
Garcia, A. S. (2011). Rare earths data for geographical origin assignment of wine: a
Portuguese case study.Le Bulletin l’OIV, 84, 333-346.
25. Catarino S., Curvelo-Garcia A.S., Bruno de Sousa R., 2008a. Revisão: Elementos
contaminantes nos vinhos. Ciência e Técnica Vitivinícola, 23 (1), 3-19.
26. Catarino S., Madeira M., Monteiro F., Rocha F., Curvelo-Garcia A.S., Bruno de Sousa R.,
2008b. Effect of bentonite characteristics on the elemental composition of wine. Journal
of Agricultural and Food Chemistry, 56, 158-165.
27. Chatonnet, P., Boidron, J. N., & Pons, M. (1989). Effect on heat on oak wood and its
chemical composition. Part 2. Variations of certain compounds in relation to toasting
intensity. Connaissance de la Vigne et du Vin, 23 (4), 223-250.
28. Chira, K., & Teissedre, P. L. (2013). Extraction of oak volatiles and ellagitannins
compounds and sensory profile of wine aged with French wine woods subjected to
different toasting methods: Behavior during storage. Food Chemistry, 140(1), 168-177.
29. Coetzee, P. P., Van Jaarsveld, F. P., & Vanhaecke, F. (2014). Intraregional classification
of wine via ICP-MS elemental fingerprinting. Food Chemistry, 164, 485-492.
30. Commission Regulation (EC) No 1932/97 (1997). Amending Regulation (EEC) No
2348/91 establishing a databank for the results of analyses of wine products by nuclear
magnetic resonance of deuterium. Official Journal, L 272, 0010-001.
31. Commission Regulation (EEC) No 2348/91 (1991). Establishing a databank for the
results of analyses of wine products by nuclear magnetic resonance of deuterium. Official
Journal L 214, 0039–0043.
32. Danezis, G. P., Tsagkaris, A. S., Camin, F., Brusic, V., & Georgiou, C. A. (2016). Food
authentication: techniques, trends & emerging approaches. Trends in Analytical
Chemistry (2016), doi: 10.1016/j.trac.2016.02.026
33. De Simón, B. F., Cadahía, E., Muiño, I., Del Álamo, M., & Nevares, I. (2010). Volatile
composition of toasted oak chips and staves and of red wine aged with them. American
Journal of Enology and Viticulture, 61(2), 157-165.
34. Del Alamo Sanza, M., Domınguez, I. N., Cárcel, L. C., & Gracia, L. N. (2004). Analysis for
low molecular weight phenolic compounds in a red wine aged in oak chips. Analytica
Chimica Acta, 513 (1), 229-237.
35. Di Paola-Naranjo, R. D., Baroni, M. V., Podio, N. S., Rubinstein, H. R., Fabani, M. P.,
Badini, R. G., Badini, R. G., Inga, M., Ostera, H., Cagnoni, M., Gallegos, E., Gautier, E.,
Peral-García, P., Hoogewerff, J., and Wunderlin, D.A. (2011). Fingerprints for main
varieties of Argentinean wines: terroir differentiation by inorganic, organic, and stable
isotopic analyses coupled to chemometrics. Journal of Agricultural and Food
Chemistry, 59 (14), 7854-7865.
33
36. Durante, C., Baschieri, C., Bertacchini, L., Bertelli, D., Cocchi, M., Marchetti, A., Manzini,
D., Papotti, G.,Sighinolfi, S. (2015). An analytical approach to Sr isotope ratio
determination in Lambrusco wines for geographical traceability purposes. Food
Chemistry, 173, 557-563.
37. Durante, C., Bertacchini, L., Bontempo, L., Camin, F., Manzini, D., Lambertini,
P.,Marchetti, A., Paolini, M. (2016). From soil to grape and wine: Variation of light and
heavy elements isotope ratios. Food Chemistry, 210, 648-659.
38. Dutra, S. V., Adami, L., Marcon, A. R., Carnieli, G. J., Roani, C. A., Spinelli, F. R.,
Leonardelli, S., Ducatti, C., Moreira, M.Z.,Vanderlinde, R. (2011). Determination of the
geographical origin of Brazilian wines by isotope and mineral analysis. Analytical and
Bioanalytical Chemistry, 401 (5), 1571-1576.
39. Elortondo, F. P., Ojeda, M., Albisu, M., Salmerón, J., Etayo, I., & Molina, M. (2007). Food
quality certification: An approach for the development of accredited sensory evaluation
methods. Food Quality and Preference, 18(2), 425-439.
40. Fabani, M. P., Toro, M. E., Vázquez, F., Daz, M. P., & Wunderlin, D. A. (2009).
Differential absorption of metals from soil to diverse vine varieties from the valley of tulum
(Argentina): consequences to evaluate wine provenance.Journal of agricultural and food
chemistry, 57(16), 7409-7416.
41. Fabani, M. P., Arrúa, R. C., Vázquez, F., Diaz, M. P., Baroni, M. V., & Wunderlin, D. A.
(2010). Evaluation of elemental profile coupled to chemometrics to assess the
geographical origin of Argentinean wines. Food Chemistry, 119 (1), 372-379.
42. Fernandes, J. R., Pereira, L., Jorge, P., Moreira, L., Gonçalves, H., Coelho, L.,
Alexandre, D.,Eiras-Dias, J., Brazão, J., Clímaco, P., Baleiras-Couto, M., Catarino, S.,
Graça, A.,Martins-Lopes, P.(2015). Wine fingerprinting using a bio-geochemical
approach. In BIO Web of Conferences (Vol. 5, p. 02021). EDP Sciences.
43. Final Scientific Report (2013) of the R&D project PTDC/AGR-ALI-64655/2006, INIAV, 68
p., Dois Portos.
44. Fortunato, G., Mumic, K., Wunderli, S., Pillonel, L., Bosset, J. O., & Gremaud, G. (2004).
Application of strontium isotope abundance ratios measured by MC-ICP-MS for food
authentication. Journal of Analytical Atomic Spectrometry, 19 (2), 227-234.
45. Frıas, S., Conde, J. E., Rodrıguez-Bencomo, J. J., Garcıa-Montelongo, F., & Pérez-
Trujillo, J. P. (2003). Classification of commercial wines from the Canary Islands (Spain)
by chemometric techniques using metallic contents. Talanta, 59 (2), 335-344.
46. Galani-Nikolakaki, S., Kallithrakas-Kontos, N., & Katsanos, A. A. (2002). Trace element
analysis of Cretan wines and wine products. Science of the Total Environment, 285 (1),
155-163.

34
47. Galgano, F., Favati, F., Caruso, M., Scarpa, T., & Palma, A. (2008). Analysis of trace
elements in southern Italian wines and their classification according to provenance. LWT-
Food Science and Technology, 41 (10), 1808-1815.
48. Gambelli, L., & Santaroni, G. P. (2004). Polyphenols content in some Italian red wines of
different geographical origins. Journal of Food Composition and Analysis, 17(5), 613-618.
49. Garde-Cerdán, T., & Ancín-Azpilicueta, C. (2006). Review of quality factors on wine
ageing in oak barrels. Trends in Food Science & Technology, 17 (8), 438-447.
50. Gao, L., Girard, B., Mazza, G., & Reynolds, A. G. (1997). Changes in anthocyanins and
color characteristics of Pinot Noir wines during different vinification processes. Journal of
Agricultural and Food Chemistry, 45 (6), 2003-2008.
51. García-Beneytez, E., Moreno-Arribas, M. V., Borrego, J., Polo, M. C., & Ibáñez, J. (2002).
Application of a DNA analysis method for the cultivar identification of grape musts and
experimental and commercial wines of Vitis vinifera L. using microsatellite
markers. Journal of Agricultural and Food Chemistry, 50 (21), 6090-6096.
52. García-Ruiz, S., Moldovan, M., Fortunato, G., Wunderli, S., & Alonso, J. I. G. (2007).
Evaluation of strontium isotope abundance ratios in combination with multi-elemental
analysis as a possible tool to study the geographical origin of ciders. Analytica Chimica
Acta, 590 (1), 55-66.
53. Geană, E. I., Sandru, C., Stanciu, V., & Ionete, R. E. (2016). Elemental Profile and 87Sr/86Sr Isotope Ratio as Fingerprints for Geographical Traceability of Wines: an
Approach on Romanian Wines. Food Analytical Methods, 1-11.
54. Giménez-Miralles, J. E., Salazar, D. M., & Solana, I. (1999). Regional origin assignment
of red wines from Valencia (Spain) by 2H NMR and 13C IRMS stable isotope analysis of
fermentative ethanol. Journal of Agricultural and Food Chemistry, 47 (7), 2645-2652.
55. Gómez‐Plaza, E., Pérez‐Prieto, L. J., Fernández‐Fernández, J. I., & López‐Roca, J. M.
(2004). The effect of successive uses of oak barrels on the extraction of oak‐related
volatile compounds from wine. International Journal of Food Science & Technology, 39
(10), 1069-1078.
56. González-Neves, G., Barreiro, L., Gil, G., Franco, J., Ferrer, M., Moutounet, M., &
Carbonneau, A. (2004). Anthocyanic composition of Tannat grapes from the south region
of Uruguay. Analytica Chimica Acta, 513 (1), 197-202.
57. Gonzálvez, A., Llorens, A., Cervera, M. L., Armenta, S., & De la Guardia, M. (2009).
Elemental fingerprint of wines from the protected designation of origin Valencia. Food
Chemistry, 112 (1), 26-34.
58. Gosz, J. R., & Moore, D. I. (1989). Strontium isotope studies of atmospheric inputs to
forested watersheds in New Mexico. Biogeochemistry, 8 (2), 115-134.
35
59. Gutiérrez Afonso, V. L. (2002). Sensory descriptive analysis between white wines
fermented with oak chips and in barrels. Journal of Food Science, 67 (6), 2415-2419.
60. Hernández, G. G., de La Torre, A. H., & Leon, J. A. (1996). Quantity of K, Ca, Na, Mg,
Fe, Cu, Pb, Zn and ashes in DOC Tacoronte-Acentejo (Canary Islands, Spain) musts and
wines. Zeitschrift für Lebensmittel-Untersuchung und Forschung, 203 (6), 517-521.
61. Horn, P., Schaaf, P., Holbach, B., Hölzl, S., & Eschnauer, H. (1993). 87Sr/86Sr from rock
and soil into vine and wine. Zeitschrift für Lebensmittel-Untersuchung und
Forschung, 196 (5), 407-409.
62. Horn, P., Hölzl, S., Todt, W., & Matthies, D. (1998). Isotope abundance ratios of Sr in
wine provenance determinations, in a tree-root activity study, and of Pb in a pollution
study on tree-rings. Isotopes in Environmental and Health Studies, 34 (1-2), 31-42.
63. Jakubowski, N., Brandt, R., Stuewer, D., Eschnauer, H. R., & Görtges, S. (1999).
Analysis of wines by ICP-MS: Is the pattern of the rare earth elements a reliable
fingerprint for the provenance?. Fresenius' Journal of Analytical Chemistry, 364 (5), 424-
428.
64. Jos, A., Moreno, I., González, A. G., Repetto, G., & Cameán, A. M. (2004). Differentiation
of sparkling wines (cava and champagne) according to their mineral content. Talanta, 63
(2), 377-382.
65. Kment, P., Mihaljevič, M., Ettler, V., Šebek, O., Strnad, L., & Rohlová, L. (2005).
Differentiation of Czech wines using multielement composition–A comparison with
vineyard soil. Food Chemistry, 91 (1), 157-165.
66. Koreňovská, M., & Suhaj, M. (2005). Identification of some Slovakian and European
wines origin by the use of factor analysis of elemental data. European Food Research
and Technology, 221 (3-4), 550-558.
67. Koussissi, E., Dourtoglou, V. G., Ageloussis, G., Paraskevopoulos, Y., Dourtoglou, T.,
Paterson, A., & Chatzilazarou, A. (2009). Influence of toasting of oak chips on red wine
maturation from sensory and gas chromatographic headspace analysis. Food
Chemistry, 114 (4), 1503-1509.
68. Le Floch, A., Jourdes, M., & Teissedre, P. L. (2015). Polysaccharides and lignin from oak
wood used in cooperage: Composition, interest, assays: A review. Carbohydrate
research, 417, 94-102.
69. Marengo, E., & Aceto, M. (2003). Statistical investigation of the differences in the
distribution of metals in Nebbiolo-based wines. Food Chemistry, 81(4), 621-630.
70. Makris, D. P., Kallithraka, S., & Mamalos, A. (2006). Differentiation of young red wines
based on cultivar and geographical origin with application of chemometrics of principal
polyphenolic constituents. Talanta, 70 (5), 1143-1152.

36
71. Marchionni, S., Braschi, E., Tommasini, S., Bollati, A., Cifelli, F., Mulinacci, N., ... &
Conticelli, S. (2013). High-precision 87Sr/86Sr analyses in wines and their use as a
geological fingerprint for tracing geographic provenance. Journal of Agricultural and Food
Chemistry, 61 (28), 6822-6831.
72. Marchionni, S., Buccianti, A., Bollati, A., Braschi, E., Cifelli, F., Molin, P., ... & Conticelli,
S. (2016). Conservation of 87Sr/86 Sr isotopic ratios during the winemaking processes of
‘Red’wines to validate their use as geographic tracer. Food Chemistry, 190, 777-785.
73. Marguí, E., Iglesias, M, Queralt, I, & Hidalgo, M. (2006). Lead isotope ratio
measurements by ICP-QMS to identify metal accumulation in vegetation specimens
growing in mining environments. Science of the Total Environment, 367 (2), 988–998.
74. Martin, A. E., Watling, R. J., & Lee, G. S. (2012). The multi-element determination and
regional discrimination of Australian wines. Food Chemistry, 133 (3), 1081-1089.
75. Martin, G. J., Mazure, M., Jouitteau, C., Martin, Y. L., Aguile, L., & Allain, P. (1999).
Characterization of the geographic origin of Bordeaux wines by a combined use of
isotopic and trace element measurements. American Journal of Enology and
Viticulture, 50 (4), 409-417.
76. Martins, P., Madeira, M., Monteiro, F., De Sousa, R. B., Curvelo-García, A. S., &
Catarino, S. (2014). 87Sr/86Sr ratio in vineyard soils from Portuguese denominations of
origin and its potential for origin authentication. Journal International des Sciences de la
Vigne et du Vin, 48 (1), 21-29.
77. Mazza, G., & Francis, F. J. (1995). Anthocyanins in grapes and grape products. Critical
Reviews in Food Science & Nutrition, 35(4), 341-371.
78. Medini, S., Janin, M., Verdoux, P., & Techer, I. (2015). Methodological development for 87
Sr/86 Sr measurement in olive oil and preliminary discussion of its use for geographical
traceability of PDO Nîmes (France). Food Chemistry, 171, 78-83.
79. Mercurio, M., Grilli, E., Odierna, P., Morra, V., Prohaska, T., Coppola, E., ... & Langella,
A. (2014). A ‘Geo-Pedo-Fingerprint’(GPF) as a tracer to detect univocal parent material-
to-wine production chain in high quality vineyard districts, Campi Flegrei (Southern
Italy). Geoderma, 230, 64-78.
80. Mihaljevič, M., Ettler, V., Šebek, O., Strnad, L., & Chrastný, V. (2006). Lead isotopic
signatures of wine and vineyard soils—tracers of lead origin. Journal of Geochemical
Exploration, 88 (1), 130-133.
81. Montgomery, J., Evans, J. A., & Wildman, G. (2006). 87 Sr/86 Sr isotope composition of
bottled British mineral waters for environmental and forensic purposes. Applied
Geochemistry, 21 (10), 1626-1634.
82. Naughton, D. P., & Petróczi, A. (2008). Heavy metal ions in wines: meta-analysis of
target hazard quotients reveal health risks. Chemistry Central Journal, 2(1), 1.
37
83. Ogrinc, N., Košir, I. J., Kocjancic, M., & Kidric, J. (2001). Determination of authenticy,
regional origin, and vintage of Slovenian wines using a combination of IRMS and SNIF-
NMR analyses. Journal of Agricultural and Food Chemistry, 49(3), 1432-1440.
84. Palade, M., & Mona-Elena, Popa. (2014). Wine traceability and authenticity– A literature
review. Scientific Bulletin. Series F. Biotechnologies, 18, 226-233.
85. Pereira, L., Gomes, S., & Martins-Lopes, P. (2016). Nucleic Acid Sample Preparation for
Food Traceability. Sample Preparation Techniques for Soil, Plant, and Animal Samples,
195-216.
86. Pereira, L., Martins-Lopes, P., Batista, C., Zanol, G. C., Clímaco, P., Brazão, J., ... &
Guedes-Pinto, H. (2012). Molecular markers for assessing must varietal origin. Food
Analytical Methods, 5 (6), 1252-1259.
87. Petrini, R., Sansone, L., Slejko, F. F., Buccianti, A., Marcuzzo, P., & Tomasi, D. (2015).
The 87Sr/86Sr strontium isotopic systematics applied to Glera vineyards: A tracer for the
geographical origin of the Prosecco. Food Chemistry, 170, 138-144.
88. Pohl, P. (2007). What do metals tell us about wine?. TrAC Trends in Analytical
Chemistry, 26 (9), 941-949.
89. Ribéreau‐Gayon, P., Pontallier, P., & Glories, Y. (1983). Some interpretations of colour
changes in young red wines during their conservation. Journal of the Science of Food
and Agriculture, 34(5), 505-516.
90. Ribéreau-Gayon, P., Dubourdieu, D., Donèche, B., & Lonvaud, A. (Eds.). (2006).
Handbook of enology, the microbiology of wine and vinifications (Vol. 1). John Wiley &
Sons.
91. Rodrigues, S. M., Otero, M., Alves, A. A., Coimbra, J., Coimbra, M. A., Pereira, E., &
Duarte, A. C. (2011). Elemental analysis for categorization of wines and authentication of
their certified brand of origin. Journal of Food Composition and Analysis, 24 (4), 548-562.
92. Rosman, K. J. R., & Taylor, P. D. P. (1998). Isotopic compositions of the elements 1997
(Technical Report). Pure and Applied Chemistry, 70 (1), 217-235.
93. Rosman, K. J., Chisholm, W., Jimi, S., Candelone, J. P., Boutron, C. F., Teissedre, P. L.,
& Adams, F. C. (1998). Lead concentrations and isotopic signatures in vintages of French
wine between 1950 and 1991. Environmental Research, 78 (2), 161-167.
94. Rossmann, A., Haberhauer, G., Hölzl, S., Horn, P., Pichlmayer, F., & Voerkelius, S.
(2000). The potential of multielement stable isotope analysis for regional origin
assignment of butter. European Food Research and Technology, 211 (1), 32-40.
95. Rosner, M. (2010). Geochemical and instrumental fundamentals for accurate and precise
strontium isotope data of food samples: Comment on “Determination of the strontium
isotope ratio by ICP-MS ginseng as a tracer of regional origin”(). Food Chemistry, 121
(3), 918-921.

38
96. Rubio-Bretón, P., Lorenzo, C., Salinas, M. R., Martínez, J., & Garde-Cerdán, T. (2012).
Influence of oak barrel aging on the quality of red wines. Oak: Ecology, types and
management, 59-86.
97. Roullier-Gall, C., Witting, M., Tziotis, D., Ruf, A., Lucio, M., Schmitt-Kopplin, P., &
Gougeon, R. D. (2015). Advances in Wine Research. S. E. Ebeler, G. Sacks, S. Vidal, &
P. Winterhalter (Eds.). American Chemical Society: 85-108
98. Sacchi, K. L., Bisson, L. F., & Adams, D. O. (2005). A review of the effect of winemaking
techniques on phenolic extraction in red wines. American Journal of Enology and
Viticulture, 56 (3), 197-206.
99. Sauvage, L., Frank, D., Stearne, J., & Millikan, M. B. (2002). Trace metal studies of
selected white wines: an alternative approach. Analytica Chimica Acta, 458 (1), 223-230.
100. Segarra, I., Lao, C., López-Tamames, E., & De La Torre-Boronat, M. C. (1995).
Spectrophotometric methods for the analysis of polysaccharide levels in winemaking
products. American Journal of Enology and Viticulture, 46(4), 564-570.
101. Serapinas, P., Venskutonis, P. R., Aninkevičius, V., Ežerinskis, Ž., Galdikas, A., &
Juzikienė, V. (2008). Step by step approach to multi-element data analysis in testing the
provenance of wines. Food Chemistry, 107 (4), 1652-1660.
102. Soto Vázquez, E., Rio Segade, S., & Fernández Gomez, E. (2013). Incidence of the
winemaking technique on metal content and phenolic composition of red wines.
International Journal of Food Properties, 16 (3), 622-633.
103. Spranger, M. I., Clımaco, M. C., Sun, B., Eiriz, N., Fortunato, C., Nunes, A., Leandro
M.C., Avelar, M.L., Belchior, A. P. (2004). Differentiation of red winemaking technologies
by phenolic and volatile composition. Analytica Chimica Acta, 513 (1), 151-161.
104. Suhaj, M., & Korenovska, M. (2005). Application of elemental analysis for
identification of wine origin: a review. Acta Alimentaria, 34 (4), 393-401.
105. Taylor, V. F., Longerich, H. P., & Greenough, J. D. (2003). Multielement analysis of
Canadian wines by inductively coupled plasma mass spectrometry (ICP-MS) and
multivariate statistics. Journal of Agricultural and Food Chemistry, 51 (4), 856-860.
106. Tescione, I., Marchionni, S., Mattei, M., Tassi, F., Romano, C., & Conticelli, S. (2015).
A Comparative 87 Sr/86 Sr Study in Red and White Wines to Validate its Use as
Geochemical Tracer for the Geographical Origin of Wine. Procedia Earth and Planetary
Science, 13, 169-172.
107. Thiel, G., Geisler, G., Blechschmidt, I., & Danzer, K. (2004). Determination of trace
elements in wines and classification according to their provenance. Analytical and
Bioanalytical Chemistry, 378 (6), 1630-1636.
108.

39
109. Vázquez, E. S., Segade, S. R., & Fernández, I. O. (2010). Effect of the winemaking
technique on phenolic composition and chromatic characteristics in young red
wines. European Food Research and Technology, 231 (5), 789-802.
110. Victor, V., Ross, S., Karine, P., André, P., Jean-François, H., & David, W. (2015).
Strontium Isotope Characterization of Wines from the Quebec (Canada) Terroir. Procedia
Earth and Planetary Science, 13, 252-255.
111. Vinciguerra, V., Stevenson, R., Pedneault, K., Poirier, A., Hélie, J. F., & Widory, D.
(2016). Strontium isotope characterization of wines from Quebec, Canada. Food
Chemistry, 210, 121-128.
112. Von Baer, D., Rentzsch, M., Hitschfeld, M. A., Mardones, C., Vergara, C., &
Winterhalter, P. (2008). Relevance of chromatographic efficiency in varietal authenticity
verification of red wines based on their anthocyanin profiles: Interference of
pyranoanthocyanins formed during wine ageing. Analytica Chimica Acta, 621 (1), 52-56.
113. Vorster, C., Greeff, L., & Coetzee, P. P. (2015). The determination of 11 B/10 B and 87
Sr/86 Sr isotope ratios by quadrupole-based ICP-MS for the fingerprinting of South African
wine. South African Journal of Chemistry, 63, 207-214.Zou, J. F., Peng, Z. X., Du, H. J.,
Duan, C. Q., Reeves, M. J., & Pan, Q. H. (2012). Elemental patterns of wine, grape, and
vineyard soil from Chinese wine-producing regions and their association. American
Journal of Enology and Viticulture, ajev-2012. 11087

40
5. Effect of Wood Ageing on Wine Mineral Composition and 87Sr/86Sr
Isotopic Ratio*
5.1. Abstract
Recently, the close relationship of strontium isotopic ratios between soil and plants has been
reported to be used as fingerprinting tool in wine. Researchers are focused on the impacts of
anthropogenic factors and technological processes of isotopic ratios of authenticity indicator
elements. In the last decade, some studies suggested that winemaking technologies do not
alter the 87Sr/86Sr isotopic ratios from vineyard to the wine. In this study, we investigated the
evolution of strontium isotopic ratio (Sr IR) during wood ageing. The experiment was carried
out with French oak staves (Quercus sessiliflora Salisb.) in stainless steel tanks with three
industrial scale replicates. The wines samples were obtained in Palmela DO. The variance
analysis was applied to samples at time-zero and to ones at the end of ageing (90 days).
Multi-elemental composition of wines was also analyzed by quadrupole inductively coupled
plasma mass spectrometry Q-ICP-MS and macro elements (Na, K, Ca and Fe) by flame
atomic absorption spectrometry (AAS). In the end of ageing period, wines exhibited
statistically identical Sr isotopic ratios compared to control wine.To our knowledge, effect of
wood stage on multi-elemental composition is also a novelty. Following elements were
analyzed: Li, Be, Mg, Al, Sc, Ti, V, Mn, Co, Ni, Cu, Zn, Ga, Ge, As, Rb, Sr, Y, Zr, Mo, Sb, Cs,
Ba, Pr, Nd, Sm, Eu, Dy, Ho, Er, Yb, Lu, Tl, Pb by using Q-ICP-MS and Na, K, Ca, Fe
concentrations were determined by flame AAS technique.
Our study suggests that wood ageing does not impact the 87Sr/86Sr, accordingly it will shed
some light for further studies.
Key words: wine, authenticity, woodstage, strontium isotopic ratio 87Sr/86Sr, elemental composition
* Article in preparation for submission to Journal of Agricultural and Food Chemistry
41
5.2. Introduction
Determination of wines’ authenticity has been an important issue for wine producers and
consumers for decades. Due to certain protected and certificated wine regions,
classifications of wines are strictly regulated in EU by label regulations which producers need
to declare the qualities of the wine and to give certain and correct information to the
consumers. Provenance declaration also provides added value to the products as well as
verifying the products’ origins. Widely accepted tool for authentication determination has
been the use of stable isotope ratios of C, H, N, O (Rossmann et al., 2000). Besides, heavy
elements such as lead and strontium gained a critical importance recently (Almeida and
Vasconcelos, 2001; Mihaljevič et al., 2006; Martins et al., 2014).
Large number of studies indicates that mineral composition and concentration of wine can
give information about their geological origin and multi-elemental analyses can determine the
wine fingerprint (Taylor et al., 2003). Furthermore, by means of statistical techniques, the
discrimination of elements according to the products’ geographical area where they are
grown is obtained. However, mineral composition of wine changes with different agricultural
applications, such as fungicide, pesticide and fertilization applications, winemaking practices
and environmental conditions (Kment et al., 2005; Pohl, 2007; Catarino et al., 2008a;
Catarino et al., 2008b).
Therefore, in order to establish a reliable tool for geographical origin determination of wines,
the selected abundance ratio of the element must not be altered by the agricultural and
winemaking practices through the chain from vineyard to bottle, in other words the wines
must reflect the same ratios as in the soil or in the rocks where the vines are grown (Almeida
and Vasconcelos, 2003). It is also important to take into consideration anthropogenic human
factors such as irrigation water, pollution and fertilizers that can contribute as mineral
sources to the plants (Rosman et al., 1998).
Horn et al. (1993) brought to our attention that different geological bedrocks have different
mineral composition in the earth stratum. The mineral composition of rocks and soils differs
from one region to another by representing different strontium isotopic ratios. Even though,
the ratios vary slightly from one area to another, they might be significantly different from
each other to be used as a discriminant factor. To achieve that, elements with high
discrimination power must be selected (Barbaste et al., 2002; Thiel et al., 2004). Multi-
element composition of heavy and light elements is used for wine fingerprint. Techniques of
ICP-MS and Thermal Ionization Mass Spectrometry (TIMS) can quantify heavy isotopes by
spectroscopic methods. Recently, a large number of studies has been published with
especially ICP-MS technique for characterizing the mineral composition of wines and
correlating them with their geographical origin (Jakubowski et al., 1999; Barbaste et al.,

42
2002; Almeida and Vasconcelos, 2003; Kment et al., 2005; Mihaljevič et al., 2006; Di Paola-
Naranjo et al., 2011; Zou et al., 2012; Catarino et al., 2014; Martins et al., 2014). There is
several authenticity methods published, such as analysis of volatile compounds, amino acidic
profile, phenolic composition, mineral profile and stable isotope ratios as principal methods.
Among all, the most commonly used tool is multi-elemental analysis (rare earth and trace
elements) for geographic origin authentication while most commonly used heavy isotopes in
food authentication is 87Sr/86Sr and more rarely 206Pb/204Pb, 207Pb/204Pb, 208Pb/204Pb, 143Nd/144Nd (Danezis et al., 2016).
Being of our element of interest, strontium occurs in the Nature as four isotopes. Three of
them are stable (84Sr, 86Sr and 88Sr) with constant values which means they are non-
radiogenic while 87Sr is radiogenic and is derived from radioactive β-decay of 87Rb and
absolute amounts of the stable 86Sr remains constant (Horn et al., 1993). Hence, Sr IR of a
rock, depending on its age and content of Rb gives particular data on different geological
regions. Horn’s team stated that soils of respective vineyards regions have different 87Sr/86Sr
ratios. The elements, which are absorbed by the plants, maintain the same isotopic ratios as
in the soil and rocks. The team used thermal ionisation mass spectrometry (TIMS) method
for Sr isotopic ratio measurement. This technique gives both accurate and precise results
(Horn et al., 1993). However, being an inconvenient method with long sample preparation
and expensive, the technique is less favored and unfeasible. Thanks to its fast and simpler
sample preparation, low sample analysis cost, ICP-MS method has recently been used in
isotope ratio determination.
Lately, there is number of researches who focus on the wine authenticity tools, especially on 87Sr/86Sr ratios, associating the wines with their vineyards. Many studies suggest Sr IR as
one of the most reliable fingerprint tools when it comes to relating the plants to the soil
(Almeida and Vasconcelos, 2004; Mercurio et al., 2014; Martins et al., 2014; Tescione et al.,
2015; Vorster et al., 2015; Durante et al., 2016; Geană et al., 2016; Marchionni et al., 2016;
Vinciguerra et al., 2016).
Almeida and Vasconcelos (2004) state that although winemaking processes, chemical
applications in the vineyard change the elemental composition of must and wine, a strong
correlation in terms of Sr isotopic ratio between wine and grape juice is still found. A similar
study also reports that the analytical results of red and white wines did not show significant
differences between oenological food chains(Tescione et al., 2015). Sr isotopic values of red
and white wines were not affected by addition of fining agents (yeast and bentonite) during
winemaking process proving the close relation with the vineyard. One recent study by
Durante et al. (2016) shed light on the use of 87Sr/86Sr isotope ratio as geographical tracer,
investigated the cellar practices that used different additives, such as clarification or

43
deacidification agents as well as concentrated musts. The hypothesis was that strontium
concentration could be modified; hence, the objective in the study was to see whether the 87Sr/86Sr ratio of wine is affected by these practices. Considering constancy of Sr IR from the
soil to the plant and eventually into the wine, samples from grape juice, intermediate
products and wine were taken at each step. Once again, the 87Sr/86Sr ratio was not altered
and found to be a powerful tool to discriminate the wines based on their region (Durante et
al., 2016).
A very recent study from Moreira et al. (2016) studied also the effect of nanofiltration (NF) on
the isotopic ratio 87Sr/86Sr and it was confirmed that there is no significance on 87Sr/86Sr of
wines.
In addition to Sr IR data, it is always necessary to have complementary information for
authentication of wine by means of relation between its chemical compositions and the
territory where the grapes grow (Thiel et al., 2004). For instance, according to a research, 87Sr/86Sr values along with Mg concentrations were best discriminator minerals of wine origin.
Additionally, another study even suggests that inserting phenolic characteristics of wine
provided a more efficient discrimination between the varieties from the same region (Di
Paola-Naranjo et al., 2011).
A study in Australia also justifies the robustness of the strontium isotopic ratio method in
order to differentiate between Australian wines’ and Non-Australian wines. Nevertheless,
overlap of strontium isotopic ratio from different countries was observed. This suggests that
the use of only one fingerprinting method may not be sufficient (Wilkes et al., 2016).
As commonly known in the literature, ageing in wood highly contributes to improve the
sensory characteristics of wine by means of extracted compounds from the oak into the wine
as mentioned earlier. These extracted compounds are dependent upon wine composition,
oak wood composition and the time that wine is in contact with wood (Garde-Cerdán and
Ancín-Azpilicueta, 2006). Oxidation, copigmentation, polymerization and condensation
phenomena occur during wine and oak contact time that ensure the stability and improve the
wine’s taste by reducing its astringency (Boulton, 2001).
It is emphasized by many authors that the technological processes and contact of wine with
vineyard equipment increase metal concentrations during maturation and ageing (Hernández
et al., 1996; Al Nasir et al., 1999; Sauvage et al., 2002; Galani-Nikolakaki et al., 2002; Pohl,
2007; Catarino et al., 2008). In spite of several studies indicating that 87Sr/86Sr isotopic ratio

44
remains stable after winemaking processes, the literature lacks the information on the wood
ageing influence on 87Sr/86Sr isotopic ratio. The aim of this study is to uncover the impact of
wood aging by oak staves on strontium composition whether they change the Sr composition
or 87Sr/86Sr isotopic ratio during ageing of red wines and shed some light to the metal
extraction from wood to wine.
5.3. Materials and Methods
5.3.1. Wines and Wood Material
A red wine of Castelão grape variety from 2014 vintage from a winery in Península de
Setúbal region of Palmela DO was aged with French oak (Quercus sessiliflora Salisb.)
staves in steel vats with the volume of 34.000 L during 90 days. The experiment was carried
out in industrial scale in the cellars of the winery. The wines did not suffer any stabilization
treatment before ageing in wood.
The physical-chemical characteristics of wine before starting ageing were: alcoholic strength
13.6 %vol.; total acidity 5.40 g/L (expressed in tartaric acid); volatile acidity 0.7 g/L
(expressed in acetic acid); pH 3.62; free sulphur dioxide 14 mg/L; total sulphur dioxide 45
mg/L with completed malolactic fermentation.
5.3.2. Experimental Conditions / Experimental Design
Three stainless steel vats have been added medium plus toasted (< 200 °C) oak staves in
dimensions of 91 cm x 6.4 cm x 0.95 cm made from French oak (Quercus sessiliflora Salisb.)
in February, 2016. Typical drying time of oak woods was 18-24 months. One oak piece was
added per 40 L of wine with the surface to volume ratio of 33.75 cm2/L. Micro-oxygenation
was applied with the amount of 3 mg/L per month. Storing temperature of tanks was close to
18°C. Sampling of the wines was performed each month. It is worth to note that stave
dimensions and micro-oxygenation amount were decided by the winery according to their
experiences. The experiment was carried out as one control vat without oak staves which is
designated as Control and three identical vats (triplicates) with oak staves that are
designated as Wood.

45
5.3.2.1. General Physical/Chemical Analysis
Physical and chemical analysis and determinations are carried out by using OIV analytical
methods (OIV, 2015). Alcoholic strength by distillation and determination by hydrometry, free
and total SO2 by titration, volatile acidity by distillation followed by acid-base titrimetry, density
by aerometry, total dry extract by calculation, pH value by potenciometry, total acidity by
acid-base titrimetry, malolactic fermentation verification by paper ascending chromatography,
reducing substances, chromatic characteristics; total anthocyanins and total phenolics index
by spectrophotometry and ash determination. Total polysaccharides content in wine is
determined by an adopted method which was established by Segarra et al. (1995). In this
method, settling the wine samples that are diluted with ethanol (96% vol.) about 12 - 14
hours in order to eliminate the phenolic and other compounds, and then washing the
precipitation were important steps for the determination. All the analyses except for total
polysaccharides are followed in duplicates. As the total polysaccharide determination
protocol is relatively low precise and robust, it is performed in triplicate.
5.3.2.2. Phenolic Composition and Chromatic Characteristics
The chromatic characteristics of wines (tonality and color intensity) and total phenolic index
were measured in the framework of OIV standards (OIV, 2015). Total anthocyanins
concentrations were analyzed by the method that was established by Somers and Evans
(1977), based on their responses to pH change and to sulphur dioxide addition. The
determination of color intensity, tonality and total phenolic index is carried out by measuring
absorbances in different wavelengths with spectrophotometer as follows.
Color intensity = A420 + A520 + A620
Tonality = A420 / A520
Total Phenolic Index (TPI) = A280 x 100

46
5.3.2.3. Mineral Composition
Major mineral elements
The wine samples were analyzed in terms of their Na, K, Ca and Fe content by flame atomic
absorption spectrophotometry methods described by OIV (OIV, 2015). The equipment Perkin
Elmer, Analyst 100, equipped with an air-acetylene burner and appropriate hollow cathode
lamps, was used.
Multi-elemental Analysis
Multi-elemental analysis by ICP-MS, the following elements were determined by quadrupole
inductively coupled plasma mass spectrometry (Q-ICP-MS) semi-quantitative methodology
that was described in the study of Catarino et al. (2006) : Li, Be, Mg, Al, Sc, Ti, V, Mn, Co,
Ni, Cu, Zn, Ga, As, Rb, Sr, Y, Sb, Cs, Ba, Pr, Nd, Eu, Dy, Ho, Er, Yb, Lu, Tl, Pb as given in
table 9. Some trace elements are neglected due to high relative standard deviation values.
Perkin-Elmer SCIEX Elan 9000 utilized with Gilson pump and a Scott-type spray chamber, a
crossflow nebulizer and nickel cones.
In order to optimize operational conditions, monoelement standard solutions of Be, Co and in
1000 mg/L (Merck) and a multi-element solution with Mg, Cu, Rh, Cd, In, Ba, Ce, Pb and U
10 μg/L (Perkin-Elmer) were used. Wash, blank and standard solutions were prepared with
ultrapure concentrated HNO3 Ultrex II 70% (v/v) (J.T. Baker). Analytical calibration was
established with a standard solution with 30 elements, 10 mg/L (Perkin-Elmer). Standard
solutions of Rh and Re 1000 mg/L (Merck) were used for internal standardization (Catarino
et al., 2006).
5.3.2.4. Strontium Isotopic Ratio Analysis
Sample Preparation
Prior to 87Sr/86Sr determination by Q-ICP-MS, following three main analytical steps in
sequence are performed as described by Martins et al. (2014): Sample digestion by High
Pressure Microwave Digestion (HPMW) (1), chromatographic separation of 87Sr and 87Rb (2)
and determination of Sr and Rb content by Q-ICP-MS (3).
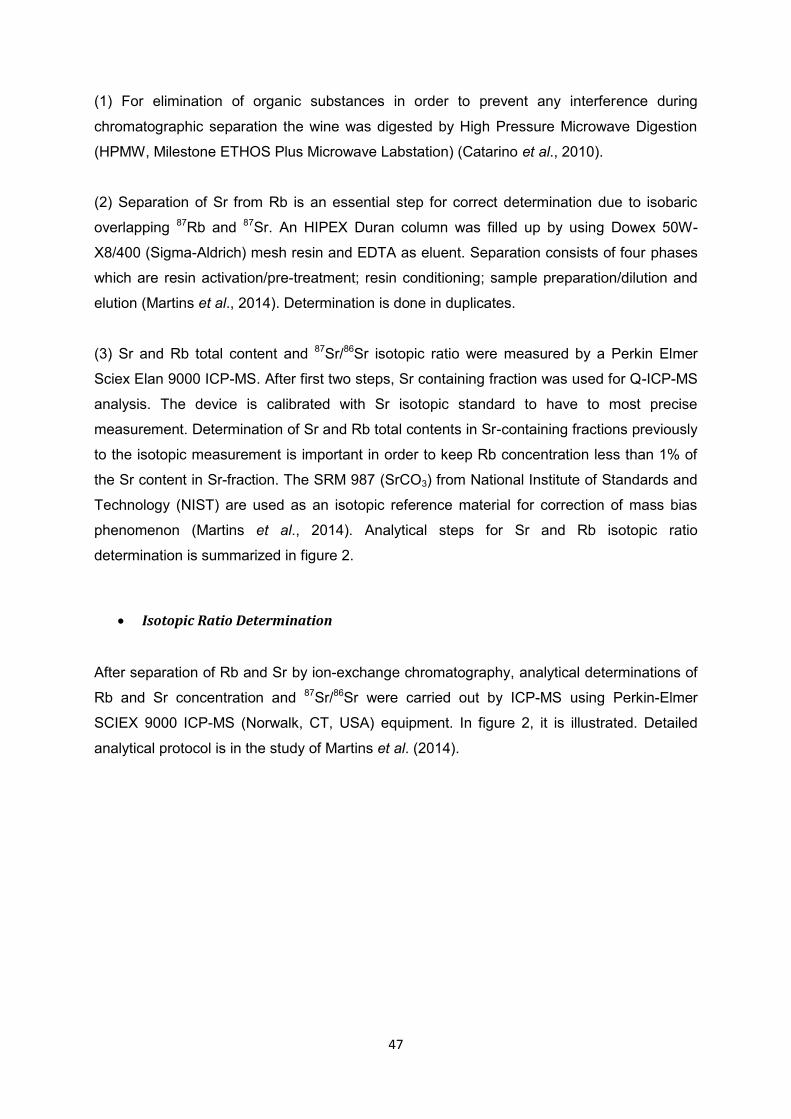
47
(1) For elimination of organic substances in order to prevent any interference during
chromatographic separation the wine was digested by High Pressure Microwave Digestion
(HPMW, Milestone ETHOS Plus Microwave Labstation) (Catarino et al., 2010).
(2) Separation of Sr from Rb is an essential step for correct determination due to isobaric
overlapping 87Rb and 87Sr. An HIPEX Duran column was filled up by using Dowex 50W-
X8/400 (Sigma-Aldrich) mesh resin and EDTA as eluent. Separation consists of four phases
which are resin activation/pre-treatment; resin conditioning; sample preparation/dilution and
elution (Martins et al., 2014). Determination is done in duplicates.
(3) Sr and Rb total content and 87Sr/86Sr isotopic ratio were measured by a Perkin Elmer
Sciex Elan 9000 ICP-MS. After first two steps, Sr containing fraction was used for Q-ICP-MS
analysis. The device is calibrated with Sr isotopic standard to have to most precise
measurement. Determination of Sr and Rb total contents in Sr-containing fractions previously
to the isotopic measurement is important in order to keep Rb concentration less than 1% of
the Sr content in Sr-fraction. The SRM 987 (SrCO3) from National Institute of Standards and
Technology (NIST) are used as an isotopic reference material for correction of mass bias
phenomenon (Martins et al., 2014). Analytical steps for Sr and Rb isotopic ratio
determination is summarized in figure 2.
Isotopic Ratio Determination
After separation of Rb and Sr by ion-exchange chromatography, analytical determinations of
Rb and Sr concentration and 87Sr/86Sr were carried out by ICP-MS using Perkin-Elmer
SCIEX 9000 ICP-MS (Norwalk, CT, USA) equipment. In figure 2, it is illustrated. Detailed
analytical protocol is in the study of Martins et al. (2014).
48
Figure 2. Analytical procedure of strontium isotopic ratio determination (Moreira et al., 2016)
Samples digestion by HPMW
Resin washing and pre-treatment (H
2O
de-ionized; HCl 2 N)
Resin activation (30 mL de NH
3 10% (v/v))
Resin washing (excess NH3 removal)
(20 mL de H2O
de-ionized)
Resin conditioning (20 mL de 0.02 M EDTA pH 5.5)
Diluted sample elution (25-35 mL de 0.1 M EDTA pH 5.0)
Ca elution (40 mL de 0.02 M EDTA pH 5.5)
Sr elution (50 mL de 0.05 M EDTA pH 7.0)
Resin washing (excess EDTA removal) (40 mL H
2O
de-ionized)
Rb elution (40 mL de HNO
3 3 M)
Resin washing (neutralization for later use) (40 mL H
2O
de-ionized)
Filtration with syringe filter
PVDF 0.45 μm, d=2.5 cm
Sr and Rb determination by Q-ICP-MS
87
Sr/86
Sr isotopic ratio determination
by Q-ICP-MS

49
5.4. Statistical Analysis
The two-way analysis of variance (ANOVA) was performed to evaluate the effects of wood
ageing and ageing time on the studied wines. Significant differences are compared with
posthoc LSD (Tukey’s test) by using Statistica 7 software (StatSoft, Inc. 2004). p- values that
are lower than 0.05 were considered to be significant (p<0.05).
5.5. Results and Discussion
5.5.1. General Physical and Chemical Analysis
Results of the physical-chemical analyses of the wines are listed in table 2. Control value is a
mean based on analytical duplicates while Wood represents three experimental replicates
and respective analytical duplicates. The values from each month sampling are presented
and they are in the range of usual range of variation for each parameter. Castelão wines
exhibit the following physical and chemical characteristics of the wine at time –zero: 13.6 %
vol. of alcoholic strength, 0.9921 g/mL of density, 3.62 of pH, 3.2 g/L of ash, 45 mg/L SO2, 14
mg/L of free SO2, 0.7 g/L volatile acidity, 5.4 g/L total acidity, 30 g/L of total dry matter and
2.4 g/L of reducing substances. Results are expressed as average values. As seen in table
2, there is no significant effect of ageing with wood and time on major part of parameters.
Exceptionally, total SO2 and free SO2 concentrations have significantly changed that might
be explained by SO2 corrections. Statistical significance was found also on reducing
substances. However, it is considered to be a slight increase in terms of wine parameters.

50
Table 2. Effect of wood stage and time on the physical chemical characteristics of wine.
Wood Stage Time
Time*Wood
Interaction
Wood
Effect Control Wood Time Effect T-0 T-90
Density (20°C) (g/mL) n.s. 0.9919 (0.0002) 0.9918 (0.0001) n.s. 0.9919 (0.0002) 0.9919 (0.0002) n.s.
Alcohol (% vol.) n.s. 13.5 (0.1) 13.5 (0.1) n.s. 13.5 (0.1) 13.5 (0.0) n.s.
pH n.s. 3.61 (0.01) 3.61 (0.01) n.s. 3.62 (0.00) 3.60 (0.01) n.s.
Ash (g/L) n.s. 3.24 (0.01) 3.11 (0.25) n.s. 3.31 (0.13) 2.98 (0.16) n.s.
Total SO2 (mg/L) n.s. 55.8 (12.5) 56 (7) *** 48 (5) a 63 (3) b *
Free SO2 (mg/L) n.s. 17 (3) 17 (2) *** 15 (2) a 18 (2) b n.s.
Volatile Acidity (g/L) n.s. 0.7 (0.0) 0.7 (0.0) n.s. 0.7 (0.0) 0.7 (0.0) n.s.
Total Acidity (g/L) n.s. 5.1 (0.2) 5.3 (0.2) n.s. 5.3 (0.2) 5.1 (0.2) n.s.
Total Dry Matter (g/L) n.s. 28.6 (0.2) 28.8 (0.6) n.s. 29.1 (0.6) 28.4 (0.0) n.s.
Reducing Substances (g/L) n.s. 2.6 (0.3) 2.6 (0.3) * 2.3 (0.0) 2.9 (0.1) n.s.
Control: Wine without wood staves; Wood: Wine with wood staves; T-0: Time-zero, T-90: 90 days.
Regarding the wood effect, Control and Wood results correspond to mean values of the corresponding levels of time (T-0 and T-90).
Concerning time effect, for each level (T-0 and T-90), the results are based on average values of Control and Wood.
Relative standard deviations are presented in parenthesis. Mean values followed by the same letter are not significantly different at 0.05* or 0.001*** level of significance;
n.s. without significant difference

51
5.5.2. Total Polysaccharides
Total polysaccharides concentrations at the initial state and after 90 days are given in table
3. Wood ageing did not have a significant impact on total polysaccharides. The wood is
known to have high amount of cellulose, hemicellulose. Hence, it might be possible to have
an increase due to polysaccharides release from the wood. However, as seen in table 3,
wood does not play a significant impact. It is also important to note that the method that was
applied for total polysaccharides determination is relatively low precise and robust.
On the other hand, there is a significant increase of total polysaccharides over the time. This
increase might be also due to the addition of any enological product that has polysaccharides
content even though to our knowledge there was no addition of any additive. Evolution of
total polysaccharides during ageing is given in table 11 in annex.
Table 3. Effect of wood stage and time on Total polysaccharides concentrations of wine (mg/L)
Wood Stage Time
Time*Wood
Interaction Wood Effect Control Wood
Time
Effect T-0 T-90
Total
polysaccharides n.s. 437 (83) 416 (77) *** 350 (26) a 493 (28) b n.s.
Control: Wine without wood staves; Wood: Wine with wood staves; T-0: Time-zero, T-90: 90 days.
Regarding the wood effect, Control and Wood results correspond to mean values of the corresponding levels of
time (T-0 and T-90).
Concerning time effect, for each level (T-0 and T-90), the results are based on average values of Control and
Wood.
Relative standard deviations are presented in parenthesis. Mean values followed by the same letter are not
significantly different at 0.05* or 0.001*** level of significance; n.s. without significant difference
5.5.3. Phenolic Composition and Chromatic Characteristics
5.5.3.1. Total Phenolics Index (TPI)
In terms of total phenolics index, the wines show relatively higher values (54.3 at initial time,
table 12, annex) than the wines studied by Jordão et al. (2015) from same region Palmela on
Castelão wines (TPI of 19). On the other hand Spranger et al. (2004) reported a study about
the effect of with four different winemaking techniques on the same grape variety. TPI values
of the samples of our experiment are in accordance with study of Spranger et al. (2004). Yet,
the slight difference is probably due to different vintage year and winemaking

52
techniques.They still fall within the medium range as usual TPI values for red wines
(Ribéreau-Gayon, 2006). As it is seen in table 4, there is a significant increase by the wood
effect, from 52.9 to 54.9. This might be most probably explained by the phenolic compounds
that are released from wood to wine that are ellagic tannins as the major phenolic
compounds in oak. Our results also justify the findings of Cruz et al. (2012) as they had
found out that total phenolic index significantly increased after wood ageing of wine brandies.
The evolution that occurred during three months can be seen in table 12 in annex.
Table 4. Effect of wood stage and time on the -Total Phenolic Index (TPI)
Control: Wine without wood staves; Wood: Wine with wood staves; T-0: Time-zero, T-90: 90 days.
Regarding the wood effect, Control and Wood results correspond to mean values of the corresponding levels of
time (T-0 and T-90).
Concerning time effect, for each level (T-0 and T-90), the results are based on average values of Control and
Wood.
Relative standard deviations are presented in parenthesis. Mean values followed by the same letter are not
significantly different at 0.05* or 0.001*** level of significance; n.s. without significant difference
5.5.3.2. Total Anthocyanins
The average anthocyanins concentration values are given in table 5. The values are similar
to those observed by Spranger et al. (2004) in wines from the same grape variety. When
compared to other grape varieties, according to the literature, Castelão wines seem to have
relatively lower anthocyanin levels as they can go from 200 to 2000 mg/L. As it is seen,
there is a significant increase on the concentrations in the end of three months. However,
use of wood did not have a significant impact on anthocyanin levels.
Wood Stage Time
Time*Wood
Interaction Wood Effect Control Wood
Time
Effect T-0 T-90
TPI * 52.9 (2.0) a 54.9 (1.9) b n.s. 53.7 (1.4) 55.1 (2.4) ***

53
Table 5. Effect of wood stage and time on Total anthocyanins concentrations (mg/L) of wines
Wood ageing Time
Time*Wood
Interaction
Wood
Effect Control Wood
Time
Effect T-0 T-90
Total
Anthocyanins n.s. 320 (32) 303 (36) *** 278 (23) a 337 (12) b n.s.
Control: Wine without wood staves; Wood: Wine with wood staves; T-0: Time-zero, T-90: 90 days.
Regarding the wood effect, Control and Wood results correspond to mean values of the corresponding levels of
time (T-0 and T-90).
Concerning time effect, for each level (T-0 and T-90), the results are based on average values of Control and
Wood.
Relative standard deviations are presented in parenthesis. Mean values followed by the same letter are not
significantly different at 0.05* or 0.001*** level of significance; n.s. without significant difference
Generally, total anthocyanins concentration is expected to decrease by ageing due to
degradation reactions. However, in our study total anthocyanins seem to increase in
concentration from 278 to 337 mg/L in the wine without oak staves after three months. There
is a slight decrease in the end of 30 days and then they reach to a higher concentration after
two months as seen in table 12 in annex. In our study total anthocyanin concentrations
exhibit an increasing trend as in the study of Tavares (2015) that was carried out with acacia
and cherry wood chips. This might be due to the complex composition of wine and some
reactions occurred by precursors even without wood contact. Figure 3 shows the evolution of
our wine during 90 days in terms of anthocyanins content.
Figure 3. Evolution of total anthocyanins concentration during wood ageing

54
Jarauta et al. (2005) stated that there are several phenomena regarding the concentration of
compounds changes in during wine ageing. For example compounds such as aliphatic
lactones are wood-extractable lactones that are released into the wine and also compounds
highly extracted from wood surface (such as fatty acids) in the end of three month ageing. In
our study, most probably, we have extracted the compounds only from the wood surface
considering short ageing time. Yet, keeping in mind the extraction process with oak staves is
faster than oak barrels will help to interpretate these results. Nevertheless, another study
where six different winemaking techniques were evaluated, including wood chips, revealed
that antocyanins concentration was not significantly altered with wood contact (Vázquez et
al., 2010).
Color Intensity
Mean values of color intensity with corresponding standard deviation values are given in table 6.
Table 6. Effect of wood stage and time on color intensity of wine
Control: Wine without wood staves; Wood: Wine with wood staves; T-0: Time-zero, T-90: 90 days.
Regarding the wood effect, Control and Wood results correspond to mean values of the corresponding levels of
time (T-0 and T-90).
Concerning time effect, for each level (T-0 and T-90), the results are based on average values of Control and
Wood.
Relative standard deviations are presented in parenthesis. Mean values followed by the same letter are not
significantly different at 0.05* or 0.001*** level of significance; n.s. without significant difference
It is known that phenolic content has the highest contribution to color intensity. Interactions
that occur during wine ageing such as condensation and polymerization of tannins, promoted
by aeration play an important role on the color. In the course of wood ageing, despite the
decrease in total anthocyanins concentration, due to breakdown phenomena and
precipitation of free anthocyanins, polymeric pigments are formed resulting in the increase in
color intensity and stabilizing it. Thanks to presence of oxygen, oxidation of ethanol forms
Wood Stage Time Time*Wood
Interaction Wood Effect Control Wood Time Effect T-0 T-90
CoIor
Intensity n.s. 10.5 (0.6) 10.7 (0.5) *** 11.1 (0.1) b 10.2 (0.3) a n.s.

55
traces of ethanal during ageing and stimulates an increase in color (Ribéreau-Gayon et al.,
2006)
In our experiment, there is a significant decrease in color intensity. This might be due to
precipitation of colloidal colorant matter.Therefore, loss of those molecules leads to decrease
in color intensity. Also, it might be due to short ageing time that was not sufficient to create
condensation reactions with tannins that eventually induce an increase of color intensity. The
statistical data show that oak staves addition did not affect the color. It is important to
remember that condensation reactions are slow and the experiment ended after 90 days. It is
possible that also anthocyanins breakdown reactions occurred and led to color loss.
Another reason could be because of insufficient micro-oxygenation that was not enough for
condensation formation as copolymerization of anthocyanins and tannins occur in the
presence of ethanol and oxygen (Ribéreau‐Gayon et al., 1983).
Color intensity values of Castelão variety in Évora region from another study by Cabrita et al.
(2003) present relatively lower values than ours in the years of 1997, 1998, 1999 that are
5.54, 5.01, and 6.05, respectively. This difference might be due to terroir and vintage year
difference and also different winemaking practices.
Tonality
The absorbencies at different wavelengths represent different colors. Absorbance at 520 nm
represents the red color that mainly represents free anthocyanins while 420 nm is
responsible for yellow.
Table 7. Effect of wood ageing and time on tonality
Wood Stage Time
Time*Wood
Interaction
Wood
Effect Control Wood
Time
Effect T-0 T-90
Tonality n.s. 0.771 (0.012) 0.779 (0.022) *** 0.760 (0.002) a 0.795 (0.013) b *
Control: Wine without wood staves; Wood: Wine with wood staves; T-0: Time-zero, T-90: 90 days.
Regarding the wood effect, Control and Wood results correspond to mean values of the corresponding levels of
time (T-0 and T-90). Concerning time effect, for each level (T-0 and T-90), the results are based on average
values of Control and Wood.
Relative standard deviations are presented in parenthesis. Mean values followed by the same letter are not
significantly different at 0.05* or 0.001*** level of significance; n.s. without significant difference

56
As seen in table 7, time had significant impact on tonality causing a little bit degradation in
red color as expected. This increase in tonality might be due to the anthocyanin and tannin
breakdown reactions and wine’s tendency to yellowish color. For a desired color in wine, the
molar ratio between tannins and anthocyanins (T/A) is crucial and necessary to be superior
to 2. Therefore, as the wine may be considered not very rich in tannins and also relatively
low anthocyanins (varying from 273 to 347 mg/L), the red color did not improve as desired.
These reactions depend on the phenolic content and structure, tannin origin.
5.5.4. Mineral Composition
Mineral composition of wines is of great interest due to its potential effect on physical
chemical stability, sensory characterstics, wine food safety and legal limits as well as help
discriminating the wines as their composition change from rock to soil to the vines. There are
several factors that can alter the multi-elemental composition of grapes and wines such as
winemaking practices, agricultural practices and climatic conditions (Catarino et al., 2008a).
The concentrations with two-way ANOVA results are given below in table 8 and 9.
5.5.4.1. Major and Micro Elements
Concentrations of Na, K, Ca and Fe were measured by flame atomic absorption
spectrometry. As the concentrations of these elements are relatively higher in wine, the
measurement is easily carried out by atomic absorption. The results can be seen in table 8 in
mg/L. Control values (designated as control) represent the mean values of duplicates of
analysis. Wines of analysis with wood staves (designated as wood) represent three
experimental replicates and two analysis replicates. As seen in table 8, Na, K, Ca, Fe
showed a significant decrease in concentration by the time. Having 56 mg/L of Ca in our
control wine (table 15, annex), which is under the empiric limit of 80 mg/L regarding the
susceptibility to calcium tartrate precipitation. However, significant decrease effect by wood
ageing in Na, K, Ca and Fe might be explained by precipitation of these metal ions. Although
the study is carried out with red wine, Fe concentration is important for the stability of the
wines. Especially during wine ageing, it plays role in oxidative reactions. Iron forms soluble
compounds with organic acids in wine. However, excessive amounts of iron can cause
turbidity that is called ferric casse. Concentration above 5 - 10 mg/L can cause undesired
sensory characteristics in wine (Ribéreau-Gayon, 2006). However, our wine is under this
limit, by having 2.42 mg/L (table 15 in annex) in control wine after three months that has

57
decreased 16 %, has no risk of iron casse or toxic effect, as at usual concentrations there is
no toxic risk in wines.
Moreover, another enological interest of major elements in wine is content of K and Ca as
they form tartaric salts and lead to precipitation. It is seen in table 8 that K concentration has
slightly but statistically decreased in the end of ageing period. Nevertheless, wood stage did
not play a significant role even though it shows a slight increase. Values can be found in
annex from each sampling month in table 15 in annex. It is known that potassium mainly
comes from soils, fertilizers and anthropogenic resources. And K2S2O5 (potassium
metabisulphite) can be also used to inhibit bacterial growth and for its antioxidant
characteristic (Avram et al., 2014).
Table 8. Effect of wood stage and time on macro elements composition (mg/L)
Control: Wine without wood staves; Wood: Wine with wood staves; T-0: Time-zero, T-90: 90 days.
Regarding the wood effect, Control and Wood results correspond to mean values of the corresponding levels of
time (T-0 and T-90). Concerning time effect, for each level (T-0 and T-90), the results are based on average
values of Control and Wood.
Relative standard deviations are presented in parenthesis. Mean values followed by the same letter are not
significantly different at 0.05* or 0.001*** level of significance; n.s. without significant difference
Figures 4, 5, 6 and 7 are given below concerning the evolution through the time of Na, K, Ca
and Fe elements, respectively.
Wood ageing Time Time*Wood
Interaction
Wood Effect Control Wood Time Effect T-0 T-90
Na n.s. 29.5 (1) 30.4 (0.2) *** 30.4 (0.3) b 29.9 (1) a ***
K n.s. 1064 (97) 1102 (37) *** 1135 (11) b 1050 (50) a *
Ca n.s. 56 (1) 54 (1) *** 56 (2) b 53 (1) a n.s.
Fe n.s. 2.7 (0.4) 2.9 (0.3) *** 3.1 (0.1) b 2.6 (0.2) a n.s.

58
Figure 4. Evolution of Na (mg/L) in wines over time
Control: Wine without wood staves; Wood: Wine with
wood staves; T-0: Time-zero, T-30: 30 days, T-60: 60
days, T-90: 90 days. Results are expressed in mg/L.
Regarding Control wines, results correspond to mean
values of the corresponding analytical duplicates
(n=2); Concerning Wood wines results mean values (and
corresponding standard deviation) of three experimental
replicates and corresponding analytical duplicates (n=6).
Figure 5. Evolution of K (mg/L) in wines over time
Control: Wine without wood staves; Wood: Wine with
wood staves; T-0: Time-zero, T-30: 30 days, T-60: 60
days, T-90: 90 days. Results are expressed in mg/L.
Regarding Control wines, results correspond to mean
values of the corresponding analytical duplicates
(n=2); Concerning Wood wines results mean values (and
corresponding standard deviation) of three experimental
replicates and corresponding analytical duplicates (n=6).
Figure 6. Evolution of Ca (mg/L) in wines over time
Control: Wine without wood staves; Wood: Wine with
wood staves; T-0: Time-zero, T-30: 30 days, T-60: 60
days, T-90: 90 days. Results are expressed in mg/L.
Regarding Control wines, results correspond to mean
values of the corresponding analytical duplicates
(n=2); Concerning Wood wines results mean values (and
corresponding standard deviation) of three experimental
replicates and corresponding analytical duplicates (n=6).
Figure 7. Evolution of Fe (mg/L) in wines over time
Control: Wine without wood staves; Wood: Wine with
wood staves; T-0: Time-zero, T-30: 30 days, T-60: 60
days, T-90: 90 days. Results are expressed in mg/L.
Regarding Control wines, results correspond to mean
values of the corresponding analytical duplicates
(n=2); Concerning Wood wines results mean values (and
corresponding standard deviation in parenthesis) of
three experimental replicates and corresponding
analytical duplicates (n=6).
59
5.5.4.2. Multi-elements
As can be seen in table 9, studied wines did not show significant differences for the following
elements after wood ageing period for neither time nor wood factor: Li, Be, Sc, Ti, Mn, Cu,
Ga, As, Rb, Y, Sb, Ba, Pr, Nd, Eu, Dy, Ho, Er, Yb, Lu and Tl. Time had a significant impact
on the concentrations of Al, V, Co, Ni, Zn, Cs and Pb, also can be seen in figure 8, 9, 10, 11,
12, 13. All the elements that time has significant impact show a decrease in their content
except for Zn. This incidence is accordance with precipitation phenomena of metals over the
time. Regarding ageing impact on the mineral content, we can see from table 9 that Mg, V,
Co, Ni and Sr are the only elements that wood ageing significantly affected and suffered an
increase. Sr concentration is altered by wood from 249 to 258 µg/L. As Sr is an important
element regarding wine fingerprinting concerning its 87Sr/86Sr isotopic ratio, increase in its
concentrations might cause also a change in this ratio. It is substantial to observe if
alterations on the concentration cause changes in Sr abundance ratios in order to contribute
to authenticity verification applications.

60
Table 9. Effect of wood stage and time on multi-elemental composition
Wood Ageing Time
Time*Wood
Interaction
Wood
Effect Control Wood Time Effect T-0 T-90
Li n.s. 11300 (162) 11756 (640) n.s. 11451 (318) 11790 (720) n.s.
Be n.s. 102 (47) 110 (36) n.s. 91 (26) 126 (39) n.s.
Mg * 55943 (1432) a 58186 (2339) b n.s. 56448 (1151) 58810 (2664) n.s.
Al n.s. 180 (12) 184 (7) *** 188 (4) b 178 (8) a n.s.
Sc n.s. 671 (169) 915 (121) n.s. 858 (212) 860 (53) n.s.
Ti n.s. 1253 (84) 1346 (104) n.s. 1313 (122) 1333 (93) n.s.
V *** 672 (277) a 961 (56) b *** 938 (90) b 839 (245) a ***
Mn n.s. 770 (22) 806 (47) n.s. 777 (24) 812 (52) n.s.
Co *** 2392 (534) a 2833 (110) b *** 2866 (92) b 2580 (412) a ***
Ni *** 33691 (24380) a 53440 (2440) b *** 55094 (708) b 41911 (18205) a ***
Cu n.s. 21673 (639) 24365 (6241) n.s. 22018 (7083) 25367 (2814) n.s.
Zn n.s. 323 (37) 330 (21) *** 344 (20) b 313 (19) a n.s.
Ga n.s. 2770 (171) 2865 (137) n.s. 2903 (88) 2779 (172) n.s.
As n.s. 976 (98) 1058 (71) n.s. 1060 (48) 1016 (107) n.s.
Rb n.s. 1174 (41) 1220 (47) n.s. 1187 (32) 1231 (54) n.s.
Sr * 240 (7) a 258 (12) b n.s. 249 (6) 258 (17) n.s.
Y n.s. 401 (48) 418 (41) n.s. 406 (33) 423 (51) n.s.
Sb n.s. 76 (7) 67 (6) n.s. 67 (9) 72 (13) n.s.
Cs n.s. 4941 (443) 5202 (208) *** 5338 (117) b 4935 (273) a *
Ba n.s. 976 (98) 1058 (71) n.s. 1060 (48) 1016 (107) n.s.
Pr n.s. 50 (12) 45 (8) n.s. 43 (11) 49 (6) n.s.
Nd n.s. 123 (11) 181 (78) n.s. 189 (89) 135 (18) n.s.
Eu n.s. 109 (20) 111 (18) n.s. 106 (19) 115 (16) n.s.
Dy n.s. 32 (17) 43 (8) n.s. 36 (11) 47 (9) n.s.
Ho n.s. 13 (5) 13 (3) n.s. 15 (3) 11 (4) n.s.
Er n.s. 30 (13) 44 (10) n.s. 42 (6) 38 (16) n.s.
Yb n.s. 37 (13) 44 (12) n.s. 47 (12) 38 (12) n.s.
Lu n.s. 15 (5) 13 (3) n.s. 13 (3) 13 (3) n.s.
Tl n.s. 310 (21) 324 (15) n.s. 322 (13) 320 (21) n.s.
Pb n.s. 4912 (1292) 6567 (2678) *** 7956 (2353) b 4351 (449) a n.s.
Results are expressed in µg/L for Mg, Al, Mn, Zn, Rb, Sr, and Ba. The rest of the elements are in ng/L.
Control: Wine without wood staves; Wood: Wine with wood staves; T-0: Time-zero, T-90: 90 days.
Regarding the wood effect, Control and Wood results correspond to mean values of the corresponding levels of
time (T-0 and T-90).
Concerning time effect, for each level (T-0 and T-90), the results are based on average values of Control and
Wood.
Relative standard deviations are presented in parenthesis. Mean values followed by the same letter are not
significantly different at 0.05* or 0.001*** level of significance; n.s. without significant difference
Mean values followed by the same letter are not significantly different at 0.05* or 0.001*** level of
significance; n.s. without significant difference
Two-way ANOVA is applied only to T-0 and T-90 values.

61
Figure 8. Evolution of Al (mg/L) in Control and Wood
over time
Figure 9. Evolution of V (ng/L) in Control and Wood
over time
Figure 10. Evolution of Zn (ng/L) in Control and Wood
over time
Figure 11. Evolution of Ni (ng/L) in Control and Wood
over time
Figure 12. Evolution of Cs (ng/L) in Control and Wood
over time
Figure 13. Evolution of Pb (ng/L) in Control and Wood
over time
Control: Wine without wood staves; Wood: Wine with wood staves; T-0: Time-zero, T-30: 30 days, T-60: 60 days, T-90: 90
days. Results are expressed in mg/L. Regarding Control wines, results correspond to mean values of the corresponding
analytical duplicates (n=2); Concerning Wood wines results mean values (and corresponding standard deviation) of three
experimental replicates and corresponding analytical duplicates (n=6).

62
Figure 14. Evolution of Sr (µg/L) in Control and Wood
over time
Figure 15. Evolution of Mg (µg/L) in Control and Wood
over time
Control: Wine without wood staves; Wood: Wine with wood staves; T-0: Time-zero, T-30: 30 days, T-60: 60 days, T-90: 90
days. Results are expressed in mg/L. Regarding Control wines, results correspond to mean values of the corresponding
analytical duplicates (n=2); Concerning Wood wines results mean values (and corresponding standard deviation) of three
experimental replicates and corresponding analytical duplicates (n=6).
Maximum acceptable limits by OIV of critical elements are defined as 1, 5, 0.2 and 0.15
mg/L, for Cu, Zn, As, Pb respectively (OIV, 2015). Our wines show low amount of these
elements which are 0.02, 0.0004, 0.001, 0.01 mg/L, respectively.
Cu and Fe play role in the oxidation of ellagic tannins (Vivas and Glories, 1996) that makes
them important for ageing phenomena. However, there was no impact of wood ageing on Cu
and Fe while time significantly caused a decrease in Fe concentration.
Wines are in the range of 60 – 150 mg/L in terms of Mg content (Ribéreau-Gayon et al.,
2006). Wine samples have medium concentration with average of 58 mg/L. As it can be seen
in figure 15, Mg concentration has increased after wood ageing. One of magnesium’s
important roles in wine is to have ion exchange character. Mg resins can be used to inhibit
tartrate precipitation by elimination K and Ca cations (Ribéreau- Gayon et al., 2006). They
also contribute to the buffer capacity and metallic structure of wine.
5.5.5. Strontium Isotopic Ratios
Separation of rubidium and strontium
As previously stated, the separation of Sr and Rb is a mandatory step before isotopic
analysis by ICP-MS. In this study, successful separation of Rb and Sr was achieved. The
concentration ratios of Rb/Sr after ion-exchange chromatography are given in table 13 in
annex. It can be confidently said that in the samples that Sr isotopic ratios were measured

63
were not interfered by 87Rb isotope, because in all the chromatographic fractions containing
Sr, the ratio Rb/Sr was always lower than 0.93%. Relative standard deviation was obtained
as optimal as possible for ICP-MS method.
87Sr/86Sr Isotopic Ratios
87Sr/86Sr isotope abundance ratio values determined are given in table 10. In total, 32 wine
samples were analyzed from initial time until the end of 90 days. Yet, as previously indicated,
it is important to consider anthropogenic sources of strontium while using it as geographical
indicator.
Strontium isotopic ratio that is taken by the roots of the vines shows identical values as in the
soil as well as in the wine after wood ageing. As previously stated, regarding Sr
concentration, the wine samples in the end of three months exhibit significantly higher
concentration values. However, as it is illustrated on figure 16, strontium isotopic ratios were
not modified after wood ageing and they are significantly identical before and after which are
independent from the Sr concentrations even though, as given in table 9, the concentration
has slightly increased by wood ageing factor. These results justify our hypothesis about
using Sr isotopic ratio as wine provenance tool. Our findings are also in accordance with the
results from Martins et al. (2014). The team analyzed isotopic ratio of the soil from Palmela
region that was 0.711±0.0003. In this study the ratios vary from 0.709 to 0.710. This
suggests strong relationship of 87Sr/86Sr between soil and wines.
Nevertheless more studies are necessary for the reliability of this method and the database
must have enough sources of data to be used as a reliable method.

64
Figure 16. 87
Sr/86
Sr Isotopic Ratios in wines over time
Control: Wine without wood staves; Wood: Wine with wood staves; T-0: Time-zero, T-30: 30 days, T-60: 60
days, T-90: 90 days. Regarding Control wine results correspond to mean values of the corresponding analytical
duplicates (n=2); Wood wines results correspond to mean values (and corresponding standard deviation with
error bars) of three experimental replicates and corresponding analytical duplicates (n=6).
Table 10. Effect of wood stage and time on strontium isotopic ratio
Mean
(S.D.) Time
Wood
Effect
Time
Effect Time* Wood Interaction
Control 0.710 (0.001) T-0 n.s. n.s. n.s.
Wood 0.710 (0.001) T-0 n.s. n.s. n.s.
Control 0.710 (0.001) T-30 n.s. n.s. n.s.
Wood 0.709 (0.001) T-30 n.s. n.s. n.s.
Control 0.709 (0.001) T-60 n.s. n.s. n.s.
Wood 0.709 (0.001) T-60 n.s. n.s. n.s.
Control 0.710 (0.001) T-90 n.s. n.s. n.s.
Wood 0.709 (0.001) T-90 n.s. n.s. n.s.
Control: Wine without wood staves; Wood: Wine with wood staves; T-0: Time-zero, T-30: 30 days, T-60: 60
days, T-90: 90 days.
Regarding Control wine results correspond to mean values of the corresponding analytical duplicates
(n=2); Concerning Wood wines results mean values (and corresponding standard deviation in parenthesis) of
three experimental replicates and corresponding analytical duplicates (n=6). Mean values followed by the same
letter are not significantly different at 0.05* or 0.001*** level of significance; n.s. without significant difference
65
5.6. Final Considerations and Conclusion
After three months of ageing time with oak staves in stainless steel tanks with three
experimental replicates, it is found that wood ageing and time did not alter 87Sr/86Sr ratios.
However, some significant changes on elements’ compositions occurred that might be
explained by oenological treatments, precipitations and interactions between several
compounds in wine such as anthocyanins, proteins and tannins. Effect of wood ageing on
the chromatic characteristics and total polysacchardies content of wine was also studied.
This study allowed us to reveal the impacts of wood ageing on wines mineral composition
and on strontium isotopic ratio as a novelty to the best of our knowledge. Findings of this
work can shed some light on the authenticity methods and contribute to future similar studies
and can be developed in different regions, especially the ones that have appellations, by
analyzing the soil and the wines. In this way establishing a database will help new studies
that can relate soils’ Sr isotopic ratios with the wines. It is also worth to mention that in order
to add value to the high quality fine wines, and prevent false declarations; this method can be
very useful.
Considering that this study was carried out with one type of wine treating with oak staves
from a single wood species, it can be developed by assaying ageing wines with different oak
species, oaks with different cooperage processes, with oak barrels and diverse winemaking
techniques in order to reveal impacts of such practices and alterations on the strontium
isotopic ratios of wine. Different grape varieties from different regions would also contribute
to a better understanding of the reliability of the method. After several supportive studies,
studied method can be recognized by OIV for fingerprinting of wines.
ACKNOWLEDGEMENTS
The authors acknowledge José Maria da Fonseca Vinhos S.A. for providing its facilities
regarding the study development; the staff of Enology Laboratory (Instituto Superior de
Agronomia) and Mineral Analysis Laboratory, namely Otília Cerveira (INIAV, Dois Portos) for
technical support.
This work was supported by the Portuguese National Funding Agency for Science and
Technology through the research centres LEAF (UID/AGR/04129/2013).

66
6. References
1. Almeida, C. M., & Vasconcelos, M. T. S. (2001). ICP-MS determination of strontium
isotope ratio in wine in order to be used as a fingerprint of its regional origin. Journal of
Analytical Atomic Spectrometry, 16(6), 607-611.
2. Almeida, C. M. R., & Vasconcelos, M. T. S. (2003). Multielement composition of wines
and their precursors including provenance soil and their potentialities as fingerprints of
wine origin. Journal of Agricultural and Food Chemistry,51(16), 4788-4798.
3. Almeida, C. M. R., & Vasconcelos, M. T. S. (2004). Does the winemaking process
influence the wine 87 Sr/86 Sr? A case study. Food chemistry, 85(1), 7-12.
4. Arvanitoyannis, I. S., Katsota, M. N., Psarra, E. P., Soufleros, E. H., & Kallithraka, S.
(1999). Application of quality control methods for assessing wine authenticity: Use of
multivariate analysis (chemometrics). Trends in Food Science & Technology, 10(10), 321-
336.
5. Avram, V., Voica, C., Hosu, A., Cimpoiu, C., & Măruţoiu, C. (2014). ICP-MS
characterization of some roumanian white wines by their mineral content. Revue roumaine
de chimie, 59(11-12), 1009-1019.
6. Cabrita, M. J., Ricardo-da-Silva, J., & Laureano, O. (2003). Os compostos polifenólicos
das uvas e dos vinhos. I SEMINÁRIO INTERNACIONAL DE VITIVINICULTURA.
Anais... Ensenada, México.
7. Catarino, S., Curvelo-Garcia, A. S., & de Sousa, R. B. (2006). Measurements of
contaminant elements of wines by inductively coupled plasma-mass spectrometry: A
comparison of two calibration approaches. Talanta, 70(5), 1073-1080.
8. Catarino S., Curvelo-Garcia A.S., Bruno de Sousa R., 2008a. Revisão: Elementos
contaminantes nos vinhos. Ciência e Técnica Vitivinícola, 23 (1), 3-19.
9. Catarino S., Madeira M., Monteiro F., Rocha F., Curvelo-Garcia A.S., Bruno de Sousa R.,
2008b. Effect of bentonite characteristics on the elemental composition of wine. Journal
of Agricultural and Food Chemistry, 56, 158-165.
10. Catarino, S., Trancoso, I. M., Sousa, R. B. D., & Curvelo-Garcia, A. S. (2010). Grape
must mineralization by high pressure microwave digestion for trace element analysis:
development of a procedure. Ciência e Técnica Vitivinícola, 87-93.
11. Chris Somers, T., & Evans, M. E. (1977). Spectral evaluation of young red wines:
anthocyanin equilibria, total phenolics, free and molecular SO2,“chemical age”. Journal
of the Science of Food and Agriculture, 28(3), 279-287.

67
12. Cruz, S., Canas, S., & Belchior, A. P. (2012). Effect of ageing system and time on the
quality of wine brandy aged at industrial-scale. Ciência e Técnica Vitivinícola, 27(2), 83-
93.
13. Danezis, G. P., Tsagkaris, A. S., Camin, F., Brusic, V., & Georgiou, C. A. (2016). Food
authentication: techniques, trends & emerging approaches. TrAC Trends in Analytical
Chemistry.
14. Di Paola-Naranjo, R. D., Baroni, M. V., Podio, N. S., Rubinstein, H. R., Fabani, M. P.,
Badini, R. G., ... & Gautier, E. (2011). Fingerprints for main varieties of Argentinean
wines: terroir differentiation by inorganic, organic, and stable isotopic analyses coupled to
chemometrics. Journal of agricultural and food chemistry, 59(14), 7854-7865.
15. Durante, C., Bertacchini, L., Bontempo, L., Camin, F., Manzini, D., Lambertini, P., ... &
Paolini, M. (2016). From soil to grape and wine: Variation of light and heavy elements
isotope ratios. Food chemistry, 210, 648-659.
16. Geană, E. I., Sandru, C., Stanciu, V., & Ionete, R. E. (2016). Elemental Profile and
87Sr/
86Sr Isotope Ratio as Fingerprints for Geographical Traceability of Wines: an
Approach on Romanian Wines. Food Analytical Methods, 1-11.
17. Horn, P., Schaaf, P., Holbach, B., Hölzl, S., & Eschnauer, H. (1993). 87Sr/86Sr from rock
and soil into vine and wine. Zeitschrift für Lebensmittel-Untersuchung und
Forschung, 196(5), 407-409.
18. Horn, P., Hölzl, S., Todt, W., & Matthies, D. (1998). Isotope abundance ratios of Sr in
wine provenance determinations, in a tree-root activity study, and of Pb in a pollution
study on tree-rings. Isotopes in environmental and health studies, 34(1-2), 31-42.
19. Jakubowski, N., Brandt, R., Stuewer, D., Eschnauer, H. R., & Görtges, S. (1999).
Analysis of wines by ICP-MS: Is the pattern of the rare earth elements a reliable
fingerprint for the provenance? Fresenius' journal of analytical chemistry, 364(5), 424-
428.
20. Jarauta, I., Cacho, J., & Ferreira, V. (2005). Concurrent phenomena contributing to the
formation of the aroma of wine during aging in oak wood: An analytical study. Journal of
agricultural and food chemistry, 53(10), 4166-4177.
21. Jordão, A. M., Ricardo-da-Silva, J. M., & Laureano, O. (2015). Evolution of
proanthocyanidins in bunch stems during berry development (Vitis vinifera L.). VITIS-
Journal of Grapevine Research, 40(1), 17.

68
22. Kment, P., Mihaljevič, M., Ettler, V., Šebek, O., Strnad, L., & Rohlová, L. (2005).
Differentiation of Czech wines using multielement composition–A comparison with
vineyard soil. Food Chemistry, 91(1), 157-165.
23. Marchionni, S., Buccianti, A., Bollati, A., Braschi, E., Cifelli, F., Molin, P., ... &
Conticelli, S. (2016). Conservation of 87
Sr/86
Sr isotopic ratios during the winemaking
processes of ‘Red’wines to validate their use as geographic tracer.Food chemistry, 190,
777-785.
24. Martins, P., Madeira, M., Monteiro, F., De Sousa, R. B., Curvelo-García, A. S., &
Catarino, S. (2014). 87
Sr/86
Sr ratio in vineyard soils from Portuguese denominations of
origin and its potential for origin authentication. J. Int. Sci. Vigne Vin, 48(1), 21-29.
25. Mercurio, M., Grilli, E., Odierna, P., Morra, V., Prohaska, T., Coppola, E., ... & Langella,
A. (2014). A ‘Geo-Pedo-Fingerprint’(GPF) as a tracer to detect univocal parent material-
to-wine production chain in high quality vineyard districts, Campi Flegrei (Southern
Italy). Geoderma, 230, 64-78.
26. Moreira C., de Pinho M., Curvelo-Garcia A.S., Bruno de Sousa R., Ricardo-da-Silva J.M.,
CATARINO S.. Evaluationg nanofiltration effect on wine 87
Sr/86
Sr isotopic ratio and the
robustness of this geographical fingerprint, 2016. South African Journal of Enology and
Viticulture (accepted for publication).
27. Pohl, P. (2007). What do metals tell us about wine?. TrAC Trends in Analytical
Chemistry, 26(9), 941-949.
28. Ribéreau‐Gayon, P., Pontallier, P., & Glories, Y. (1983). Some interpretations of colour
changes in young red wines during their conservation. Journal of the Science of Food and
Agriculture, 34(5), 505-516.
29. Ribéreau-Gayon, P., Dubourdieu, D., Donèche, B., & Lonvaud, A. (Eds.).
(2006). Handbook of enology, the microbiology of wine and vinifications (Vol. 1). John
Wiley & Sons.
30. Rosman, K. J., Chisholm, W., Jimi, S., Candelone, J. P., Boutron, C. F., Teissedre, P. L.,
& Adams, F. C. (1998). Lead concentrations and isotopic signatures in vintages of French
wine between 1950 and 1991. Environmental research, 78(2), 161-167.
31. Rossmann, A., Haberhauer, G., Hölzl, S., Horn, P., Pichlmayer, F., & Voerkelius, S.
(2000). The potential of multielement stable isotope analysis for regional origin
assignment of butter. European Food Research and Technology,211(1), 32-40.

69
32. Segarra, I., et al. "Spectrophotometric methods for the analysis of polysaccharide levels in
winemaking products." American Journal of Enology and Viticulture 46.4 (1995): 564-
570.
33. Spranger, M. I., Clımaco, M. C., Sun, B., Eiriz, N., Fortunato, C., Nunes, A., ... &
Belchior, A. P. (2004). Differentiation of red winemaking technologies by phenolic and
volatile composition. Analytica Chimica Acta, 513 (1), 151-161.
34. StatSoft, Inc. (2004). STATISTICA (data analysis software system), version 7.
www.statsoft.com.
35. Taylor, V. F., Longerich, H. P., & Greenough, J. D. (2003). Multielement analysis of
Canadian wines by inductively coupled plasma mass spectrometry (ICP-MS) and
multivariate statistics. Journal of Agricultural and Food Chemistry, 51(4), 856-860.
36. Tavares, Mariana Ferreira Filipe (2005). Impact of utilization of alternative wood
products of less conventional species (cherry and acacia), on the phenolic composition and
sensory profile evolution of a red wine. Master thesis, University of Lisbon.
37. Thiel, G., Geisler, G., Blechschmidt, I., & Danzer, K. (2004). Determination of trace
elements in wines and classification according to their provenance. Analytical and
bioanalytical chemistry, 378(6), 1630-1636.
38. Vivas, N., & Glories, Y. (1996). Role of oak wood ellagitannins in the oxidation process
of red wines during aging. American journal of enology and viticulture, 47(1), 103-107.
39. Vázquez, E. S., Segade, S. R., & Fernández, I. O. (2010). Effect of the winemaking
technique on phenolic composition and chromatic characteristics in young red
wines. European Food Research and Technology, 231 (5), 789-802.
40. Vinciguerra, V., Stevenson, R., Pedneault, K., Poirier, A., Hélie, J. F., & Widory, D.
(2016). Strontium isotope characterization of wines from Quebec, Canada. Food
Chemistry, 210, 121-128.
41. Vorster, C., Greeff, L., & Coetzee, P. P. (2015). The determination of 11
B/10
B and 87
Sr/86
Sr isotope ratios by quadrupole-based ICP-MS for the fingerprinting of South African
wine. South African Journal of Chemistry, 63, 207-214.
42. Wilkes, E., Day, M., Herderich, M., & Johnson, D. (2016). AWRI reports: In vino veritas-
investigating technologies to fight wine fraud. Wine & Viticulture Journal,31(2), 36.
43. Zou, J. F., Peng, Z. X., Du, H. J., Duan, C. Q., Reeves, M. J., & Pan, Q. H. (2012).
Elemental patterns of wine, grape, and vineyard soil from Chinese wine-producing
regions and their association. American Journal of Enology and Viticulture, ajev-2012.
11087

70
Scientific Disclosure
Part of the results of this work has been included in the communication “Effect of new and
conventional technological processes on the terroir marker 87Sr/86Sr” and was presented
orally in OIV Congress which has taken place in October, 2016 in Bento Gonçalves, Brazil.
The corresponding proceeding is published at Bio Web of Conferences: CATARINO S.,
Moreira C., Bruno de Sousa R., Curvelo-Garcia A.S., de Pinho M., Ricardo-da-Silva J.M.,
2016. Effect of new and conventional technological processes on
the terroir marker 87Sr/86Sr. Bio Web of Conferences, 7, 02003. 39th World Congress of Vine
and Wine, Bento Gonçalves, Brasil. (DOI: 10.1051/bioconf/20160702003)

71
ANNEX
Table 11. Total polysaccharides concentrations values (mg/L)
Mean (S.D.) (mg/L) Time
Control 362 (13) T-0
Wood 346 (27) T-0
Control 321 (33) T-30
Wood 391 (50) T-30
Control 306 (65) T-60
Wood 313 (36) T-60
Control 512 (12) T-90
Wood 486 (28) T-90
Wood: Mean values with standard deviation values (in parenthesis) of wines with wood staves; averages
present 6 replicates, which three replicates are in industrial scale and two in analytical scale (n=9); Control:
Mean values of analytical duplicates of control wines. (n=3) T-0: Time-zero, T-30: After 30 days, T-60: After 60
days, T-90: After 90 days.
Table 12. Mean values of chromatic characteristics
Color Intensity (a.u) Tonality
Total Phenolic
Index Total Anthocyanins Time
Mean (S.D.) Mean (S.D.) Mean (S.D.) Mean (S.D.) (mg/L)
Control 11.0 (0.0) 0.761 (0.000) 54.3 (1.9) 292 (1) T-0
Wood 11.1 (0.1) 0.762 (0.001) 53.5 (0.5) 273 (25) T-0
Control 10.3 (0.1) 0.783 (0.005) 55.2 (0.6) 276 (7) T-30
Wood 10.4 (0.4) 0.780 (0.000) 55.3 (0.6) 282 (3) T-30
Control 10.0 (0.2) 0.833 (0.040) 56.6 (0.3) 343 (7) T-60
Wood 9.8 (0.1) 0.773 (0.007) 56.4 (0.3) 357 (2) T-60
Control 10.0 (0.0) 0.781 (0.002) 51.5 (0.2) 334 (11) T-90
Wood 10.3 (0.3) 0.798 (0.005) 56.4 (0.8) 326 (5) T-90
Wood: Mean values with standard deviation values (in parenthesis) of wines with wood staves; averages
present 6 replicates, which three replicates are in industrial scale and two in analytical scale (n=6); Control:
Mean values of analytical duplicates of control wines. (n=2) T-0: Time-zero, T-30: After 30 days, T-60: After 60
days, T-90: After 90 days.

72
Table 13. Sr and Rb concentrations (ng/L) and effectiveness of chromatic separation values.
Sample [ Sr ] [ Rb ] Rb/Sr (%)
Time
Control 476.374,81 186,556 0,04 T-0
Control 403.257,88 261,732 0,06 T-0
Wood 390.171,28 309,037 0,08 T-0
Wood 462.771,22 1.212,22 0,26 T-0
Wood 396.319,58 99,308 0,03 T-0
Wood 374.400,32 215,502 0,06 T-0
Wood 386.536,90 131,51 0,03 T-0
Wood 431.072,10 2.276,19 0,53 T-0
Control 369.026,16 143,239 0,04 T-30
Control 397.660,52 138,274 0,03 T-30
Wood 413.214,57 129,178 0,03 T-30
Wood 450.056,92 128,156 0,03 T-30
Wood 489.660,08 73,92 0,02 T-30
Wood 488.694,54 137,926 0,03 T-30
Wood 347.574,32 114,198 0,03 T-30
Wood 443.194,73 235,825 0,05 T-30
Control 434.147,23 159,085 0,04 T-60
Control 366.838,91 145,876 0,04 T-60
Wood 257.964,94 241,658 0,09 T-60
Wood 449.726,50 153,345 0,03 T-60
Wood 371.054,54 275,886 0,07 T-60
Wood 296.450,04 224,284 0,08 T-60
Wood 348.958,12 116,651 0,03 T-60
Wood 369.569,72 284,345 0,08 T-60
Control 340.269,04 178,737 0,05 T-90
Control 344.313,93 128,707 0,04 T-90
Wood 452.184,52 4.220,29 0,93 T-90
Wood 488.444,01 302,552 0,06 T-90
Wood 122.849,63 253,738 0,21 T-90
Wood 117.479,24 218,478 0,19 T-90
Wood 395.178,72 115,722 0,03 T-90
Wood 342.629,93 133,283 0,04 T-90
Wood: Wines with wood staves which three replicates are in industrial scale and two in analytical scale (n=6);
Control: analytical duplicates of control wines (n=2). T-0: Time-zero, T-30: After 30 days, T-60: After 60 days, T-
90: After 90 days.
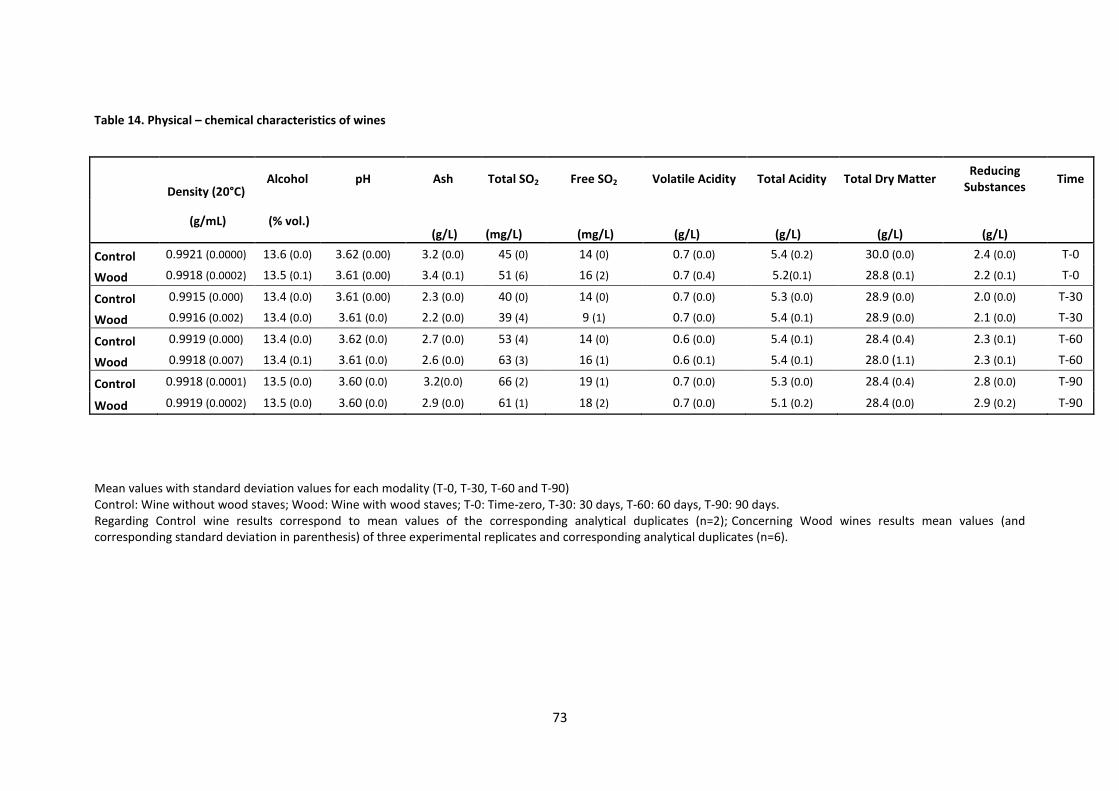
73
Table 14. Physical – chemical characteristics of wines
Mean values with standard deviation values for each modality (T-0, T-30, T-60 and T-90)
Control: Wine without wood staves; Wood: Wine with wood staves; T-0: Time-zero, T-30: 30 days, T-60: 60 days, T-90: 90 days.
Regarding Control wine results correspond to mean values of the corresponding analytical duplicates (n=2); Concerning Wood wines results mean values (and
corresponding standard deviation in parenthesis) of three experimental replicates and corresponding analytical duplicates (n=6).
Density (20°C) Alcohol pH Ash Total SO2 Free SO2 Volatile Acidity Total Acidity Total Dry Matter
Reducing
Substances Time
(g/mL) (% vol.)
(g/L) (mg/L) (mg/L) (g/L) (g/L) (g/L) (g/L)
Control 0.9921 (0.0000) 13.6 (0.0) 3.62 (0.00) 3.2 (0.0) 45 (0) 14 (0) 0.7 (0.0) 5.4 (0.2) 30.0 (0.0) 2.4 (0.0) T-0
Wood 0.9918 (0.0002) 13.5 (0.1) 3.61 (0.00) 3.4 (0.1) 51 (6) 16 (2) 0.7 (0.4) 5.2(0.1) 28.8 (0.1) 2.2 (0.1) T-0
Control 0.9915 (0.000) 13.4 (0.0) 3.61 (0.00) 2.3 (0.0) 40 (0) 14 (0) 0.7 (0.0) 5.3 (0.0) 28.9 (0.0) 2.0 (0.0) T-30
Wood 0.9916 (0.002) 13.4 (0.0) 3.61 (0.0) 2.2 (0.0) 39 (4) 9 (1) 0.7 (0.0) 5.4 (0.1) 28.9 (0.0) 2.1 (0.0) T-30
Control 0.9919 (0.000) 13.4 (0.0) 3.62 (0.0) 2.7 (0.0) 53 (4) 14 (0) 0.6 (0.0) 5.4 (0.1) 28.4 (0.4) 2.3 (0.1) T-60
Wood 0.9918 (0.007) 13.4 (0.1) 3.61 (0.0) 2.6 (0.0) 63 (3) 16 (1) 0.6 (0.1) 5.4 (0.1) 28.0 (1.1) 2.3 (0.1) T-60
Control 0.9918 (0.0001) 13.5 (0.0) 3.60 (0.0) 3.2(0.0) 66 (2) 19 (1) 0.7 (0.0) 5.3 (0.0) 28.4 (0.4) 2.8 (0.0) T-90
Wood 0.9919 (0.0002) 13.5 (0.0) 3.60 (0.0) 2.9 (0.0) 61 (1) 18 (2) 0.7 (0.0) 5.1 (0.2) 28.4 (0.0) 2.9 (0.2) T-90

74
Table 15. Major and micro elements compositions of wines
Mean values with standard deviation values for each modality (T-0, T-30, T-60 and T-90)
Control: Wine without wood staves; Wood: Wine with wood staves; T-0: Time-zero, T-30: 30 days, T-60: 60 days, T-90: 90 days.
Regarding Control wine results correspond to mean values of the corresponding analytical duplicates (n=2); Concerning Wood wines results mean values (and
corresponding standard deviation in parenthesis) of three experimental replicates and corresponding analytical duplicates (n=6).
T-0 T-30 T-60 T-90
Control Wood Control Wood Control Wood Control Wood
Na 30.6 (0.3) 30.4 (0.2) 30.2 (0.2) 30.2 (0.3) 30.6 (0.0) 30.7 (0.1) 28.4 (0.0) 30.4 (0.1)
K 1134.6 (1.4) 1135.1 (3.1) 1148.2 (24.0) 1155.7 (17.0) 1081.2 (20.4) 1067.9 (8.3) 992.6 (90.8) 1068.7 (3.6)
Ca 56.64 (1.02) 56.06 (2.20) 55.15 (0.75) 54.18 (0.15) 46.18 (0.74) 53.38 (3.29) 54.84 (1.22) 52.80 (0.58)
Fe 3.05 (0.08) 3.11 (0.14) 3.32 (0.04) 2.92 (0.15) 3.30 (0.08) 2.94 (0.22) 2.42 (0.03) 2.70 (0.15)

75
Table 16. Multi-elemental compositions of wines
T-0 T-30 T-60 T-90
Control Wood Control Wood Control Wood Control Wood
Li 11277 (128) 11459 (101) 11621 (483) 10507 (717) 12308 (334) 10566 (1474) 11307 (268) 12058 (400)
Be 75 (2) 94 (15) 104 (21) 79 (11) 81 (13) 79 (89) 156 (0)# 142 (21)
Mg 56020 (1012) 56581 (1106) 57842 (986) 55651 (3432) 59113 (533) 52717 (5541) 55867 (2259) 59792 (643)
Al 190 (5) 188 (3) 198 (5) 177 (6) 187 (3) 162 (15) 171 (7) 180 (1)
Sc 575 (42) 952 (70) 615 (144) 752 (183) 413 (78) 523 (194) 863 (0) # 844 (53)
Ti 1201 (8) 1350 (122) 1554 (66) 1362 (56) 1355 (32) 1228 (22) 1305 (102) 1342 (59)
V 897 (162) 952 (71) 877 (23) 751 (20) 1139 (30) 926 (93) 446 (20) 970 (4)
Mn 759 (32) 784 (18) 793 (8) 777 (46) 794 (3) 736 (76) 755 (37) 833 (37)
Co 2850 (127) 2871 (91) 2932 (27) 2808 (146) 2818 (102) 2530 (216) 1934 (12) 2795 (37)
Ni 54804 (265) 55191 (542) 55380 (1409) 52451 (3913) 52097 (1042) 48596 (2240) 12578 (470) 51869 (1858)
Cu 21409 (146) 22221 (9353) 17517 (331) 13477 (778) 17331 (719) 20497 (4245) 21936 (962) 26510 (2236)
Zn 353 (23) 340 (15) 326 (3) 320 (11) 311 (8) 283 (30) 294 (14) 319 (11)
Ga 2893 (1) 2906 (84) 2867 (149) 2702 (150) 3026 (92) 2378 (378) 2648 (165) 2824 (69)
As 1022 (80) 1073 (14) 1015 (33) 968 (79) 1058 (7) 892 (143) 931 (118) 1044 (47)
Rb 1173 (38) 1191 (33) 1219 (1) 1184 (38) 1241 (33) 1117 (117) 1175 (59) 1249 (21)
Sr 244 (4) 250 (6) 257 (0) 248 (12) 257 (6) 235 (24) 237 (9) 265 (9)
Y 441 (20) 394 (13) 385 (56) 388 (16) 419 (50) 377 (61) 361 (4) 443 (18)
Sb 77 (9) 63 (3) 94 (2) 80 (8) 123 (24) 59 (7) 73 (0) # 72 (2)
Cs 5315 (76) 5346 (116) 5403 (83) 5218 (266) 5086 (63) 4524 (460) 4567 (153) 5057 (129)
Ba 214 (1) 221 (6) 219 (1) 215 (12) 205 (2) 192 (19) 198 (7) 214 (10)
Pr 53 (16) 40 (3) 34 (4) 34 (2) 40 (0) # 38 (4) 40 (0) # 50 (2)
Nd 120 (0) # 201 (34) 273 (0) 235 (19) 180 (0) 189 (10) 125 (19) 141 (18)
Eu 111 (34) 105 (7) 111 (8) 88 (8) 93 (9) 91 (10) 107 (5) 118 (15)
Dy 22 (2) 41 (7) 37 (5) 35 (7) 51 (0) # 43 (12) 41 (15) 50 (10)
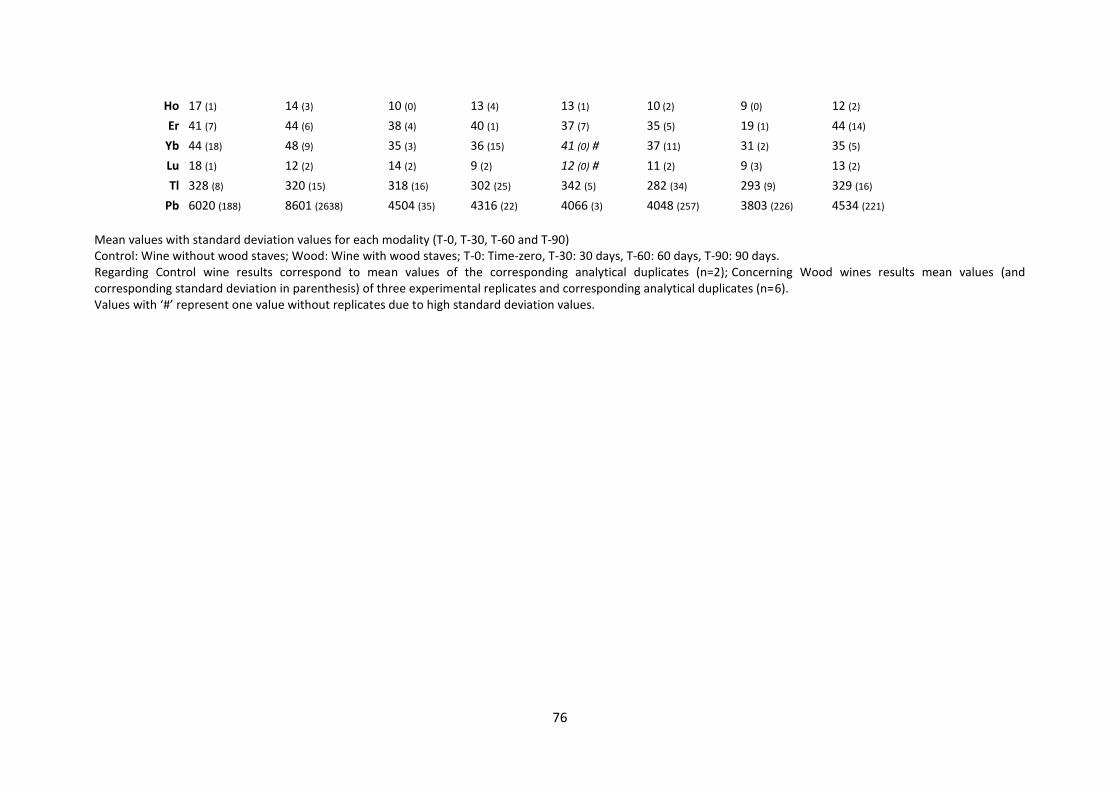
76
Ho 17 (1) 14 (3) 10 (0) 13 (4) 13 (1) 10 (2) 9 (0) 12 (2)
Er 41 (7) 44 (6) 38 (4) 40 (1) 37 (7) 35 (5) 19 (1) 44 (14)
Yb 44 (18) 48 (9) 35 (3) 36 (15) 41 (0) # 37 (11) 31 (2) 35 (5)
Lu 18 (1) 12 (2) 14 (2) 9 (2) 12 (0) # 11 (2) 9 (3) 13 (2)
Tl 328 (8) 320 (15) 318 (16) 302 (25) 342 (5) 282 (34) 293 (9) 329 (16)
Pb 6020 (188) 8601 (2638) 4504 (35) 4316 (22) 4066 (3) 4048 (257) 3803 (226) 4534 (221)
Mean values with standard deviation values for each modality (T-0, T-30, T-60 and T-90)
Control: Wine without wood staves; Wood: Wine with wood staves; T-0: Time-zero, T-30: 30 days, T-60: 60 days, T-90: 90 days.
Regarding Control wine results correspond to mean values of the corresponding analytical duplicates (n=2); Concerning Wood wines results mean values (and
corresponding standard deviation in parenthesis) of three experimental replicates and corresponding analytical duplicates (n=6).
Values ith # represent one alue ithout replicates due to high standard de iation alues.

BIO Web of Conferences 7, 02003 (2016) DOI: 10.1051/bioconf/20160702003
39th World Congress of Vine and Wine
Effect of new and conventional technological processes on theterroir marker 87Sr/86Sr
Sofia Catarino1,2,3,a, Cıntia Moreira3, Ayse Kaya1, Raul Bruno de Sousa1, Antonio Curvelo-Garcia2, Maria de Pinho3,and Jorge Ricardo-da-Silva1
1 LEAF, Instituto Superior de Agronomia, Universidade de Lisboa, Tapada da Ajuda, 1349-017 Lisboa, Portugal2 Instituto Nacional de Investigacao Agraria e Veterinaria, 2565-191 Dois Portos, Portugal3 CEFEMA, Instituto Superior Tecnico, Universidade de Lisboa, Av. Rovisco Pais, 1, 1049-001 Lisboa, Portugal
Abstract. Aiming to use the strontium isotopic ratio 87Sr/86Sr for traceability and authentication of wine, itis crucial to understand the impacts of anthropogenic factor and technological processes on this parameter.In this study the effect of two technologies: nanofiltration (NF), applied for wine dealcoholisation (1), andageing with oak wood staves (2), on 87Sr/86Sr ratio of wines from Portuguese Designations of Origin (DO),was assessed. Control wines, NF processed wines and wooden aged wines were evaluated for chemicalcomposition, multi-elemental composition and 87Sr/86Sr ratio by Q-ICP-MS. Regarding NF experiments, highrejections to mineral elements, including heavy metals, were observed. Bearing in mind the several rolesplayed by these elements in wine, this knowledge is of strategic importance in order to guarantee that NFprocess does not adversely affect product quality. Concerning wood ageing experiment, results indicate theinfluence of this technological process on metal physical-chemical stability. In the experimental conditions ofthis study, no significant effect of NF process and wood ageing on 87Sr/86Sr ratio was observed, suggestingthat the application of these technologies in wine production is not a limitative factor for the use of 87Sr/86Srratio as a geographical origin marker.
1. Introduction
Closely related to the idea that terroir determines thequality and character of wines, many efforts have beenmade to identify potential markers and develop reliableanalytical methods to determine the wine’s geographicalorigin.
The isotopic ratio 87Sr/86Sr is a well-established toolfor dating and tracing the origin of rocks and minerals [1]with special interest for wine traceability. Several studieson its use for wine geographical origin assessment canbe found in literature [2–8]. Recently, within a researchprogram regarding strategies for wine fingerprinting, theauthors confirmed 87Sr/86Sr as a viable tool for traceabilityof Portuguese DO, where soils were developed on differentgeological formations [9,10].
The use of this parameter as a marker of winegeographical origin is based on the assumption that arelation between soil, plants and wine exists. Therefore,87Sr/86Sr ratio should not be significantly modified duringwine processing. Aiming to use 87Sr/86Sr for traceabilityand authentication of wine, it is mandatory to clarifythe impacts of anthropogenic factors and technologicalprocesses on this isotopic ratio. This is a current subjectof major importance addressed in this study.
NF is a versatile membrane process, with severalapplications in wine production where its use is increasing,e.g. for ethanol content modulation but also for reductionof the sugar content in musts, volatile acidity correction
a Corresponding author: [email protected]
and to remove excess of ethyl-phenols [11]. NF effects onwine composition have been assessed, namely on alcoholicstrength, total acidity and phenolic composition [12,13].Nevertheless, to the best of our knowledge, its influenceon mineral composition and wine 87Sr/86Sr is not known.
Wood aging is a traditional practice widely usedin wine production. Currently, as alternative to woodbarrels, in order to improve the traditional process inconditions that sustain the economic viability of thispractice, the use of wood pieces in stainless-steel tanksis widespread. In spite of substantial understanding of theorganic extractable compounds, little has been publishedon metal extraction from wood to wine, and no data aboutits influence on 87Sr/86Sr.
In spite of a few studies suggesting that 87Sr/86Srisotopic ratio remains stable after enological processes[3,5,14,15], the literature lacks the information on the NFprocess and wood ageing influence on 87Sr/86Sr isotopicratio. The main aim of this study was to uncover theeffect of NF and wood ageing by oak staves on strontium87Sr/86Sr isotopic ratio. Furthermore, information on theeffect of these technologies on mineral composition ofwines was obtained.
2. Materials and methods2.1. Nanofiltration experiments
For NF experiments, three white wines (WW) and threered wines (RW) from the Portuguese DO Dao, Obidosand Palmela were used. White wines, from 2014 vintage,
c© The Authors, published by EDP Sciences. This is an Open Access article distributed under the terms of the Creative Commons Attribution License 4.0(http://creativecommons.org/licenses/by/4.0/).

BIO Web of Conferences 7, 02003 (2016) DOI: 10.1051/bioconf/20160702003
39th World Congress of Vine and Wine
Figure 1. Set up of the nanofiltration unit.
were produced using the following grape varieties (Vitisvinifera L.): Fernao Pires (Obidos); Verdelho and Viosinho(Palmela); Verdelho (Dao). Red wines, from 2013 vintage,resulted from the following grape varieties (Vitis viniferaL.): Calladoc, Syrah and Alicante Bouchet (Obidos);Castelao (Palmela); Touriga Nacional (Dao).
NF experiments were carried out at laboratory scale inthe unit Celfa P-28 for dealcoholisation of white and redwines (Fig. 1).
Regarding the NF membrane used, a celluloseacetate membrane was laboratory made and characterized,presenting hydraulic permeability of 0.313 kg/(h.m2.bar)and rejection coefficients of 90.3% to NaCl, 95.3%to Na2SO4, 92.8% to CaSO4 and 90.3% to glucose.Rejection coefficients (f) to solutes were determined usingequation 1, where C f and Cp are the concentrations in feedand permeate, respectively:
f = (Cf − Cp)/Cf (1)
NF experiments were carried out at a transmembranepressure of 17 bar and a feed recirculation flow rate of2.1 L/min. Each NF fraction (initial feed, final feed andpermeate) was evaluated through summary analysis andtotal polysaccharides, total anthocyanins, total phenolicindex, multi-elemental composition and 87Sr/86Sr isotopicratio.
2.2. Ageing experiments
A red wine from Castelao grape variety (Palmela DO),2014 vintage, was aged in stainless steel vats (34,000L) with wood staves, in triplicate. French oak (Quercussessiliflora Salisb.) staves, with medium plus toastinglevel (<200 ◦C), in dimensions of 91 cm (length) × 6.4 cm(width) × 0.95 cm (thickness) were used, one oak staveper 40 L of wine. Micro-oxygenation was applied with theamount of 3 mg/L per month. Storing temperature of thetanks was 18 ◦C. The experiment was carried out with onecontrol vat without oak staves.
The wines were sampled after 30, 60 and 90 days ofageing (a total of 16 samples) and evaluated in terms ofgeneral analysis, total polysaccharides, total anthocyanins,total phenols index, multi-elemental composition and87Sr/86Sr isotopic ratio.
2.3. Analytical determinations
2.3.1. Physical-chemical characterization
Alcoholic strength, total acidity, volatile acidity, tartaricacid, malic acid, lactic acid, total dry matter, ash, density,pH, total sulphur dioxide, reducing substances, colourintensity and tonality, were determined according toOIV analysis methods [16], in the samples from ageingexperiments.
Due to the low sample volume available for analysis,wine NF streams (initial feed, final feed and permeate)were analysed for the before referred analytical parametersby Fourier Transform Infrared (FTIR) technique using aFoss WineScan FT 120 equipment.
Total polysaccharides were assessed through phenol-sulfuric method (colorimetric method), after the separationof polysaccharides by ethanol. Total anthocyanins and totalphenols index determinations were carried out as describedby Somers and Evans [17].
2.3.2. Multi-elemental analysis
Thirty-six minor and trace elements were measured byquadrupole inductively coupled plasma mass spectrometry(Q-ICP-MS) semi-quantitative methodology according tothe protocol described by Catarino et al. [18].
A Perkin-Elmer SCIEX Elan 9000 Q-ICP-MS appara-tus, equipped with a peristaltic sample delivery pump withfour channels model Gilson, a Scott-type spray chambermade of Ryton, a crossflow nebulizer, nickel cones andan autosampler Perkin-Elmer AS-93 Plus, protected by alaminar-flow-chamber clean room class 100 was used. Thesystem was controlled by software Elan – 6100WindowsNT (Version 2.4).
Major mineral elements (Na, K, Ca, Fe) weredetermined in wines from ageing experiments by FlameAtomic Absorption Spectrophotometry (FAAS) accordingto the methods described by OIV [16].
2.3.3. 87Sr/86 Sr isotopic ratio determination
Due to isobaric overlap of 87Rb and 87Sr, an effectiveRb and Sr separation is required before ICP-MS analysis,in order to accurate determination of 87Sr/86Sr isotopicratios. Wine samples treatment is composed by threesteps: digestion by High Pressure Microwave (HPMW),chromatographic separation of Sr and Rb and filtration ofSr chromatographic fraction.
87Sr/86Sr isotopic ratio determination by Q-ICP-MSwas carried out according to protocol described by theauthors [9], using the Q-ICP-MS equipment previouslydescribed. Analytical calibration and stability control in87Sr/86Sr isotopic ratio analysis were made with SrCO3(50 µg/L), prepared from certified reference material NISTSRM 987 (SrCO3).
2.4. Statistical analysis
Analysis of variance (ANOVA) was carried out to assessthe effect of nanofiltration and wooden ageing on the87Sr/86Sr isotopic ratio of wines. Fisher’s least significantdifference (LSD, significance level of 0.05) test wasapplied to compare the different averages. All calculationswere carried out using Statistica version 7 (StatSoft Inc.,Tulsa, USA).
2
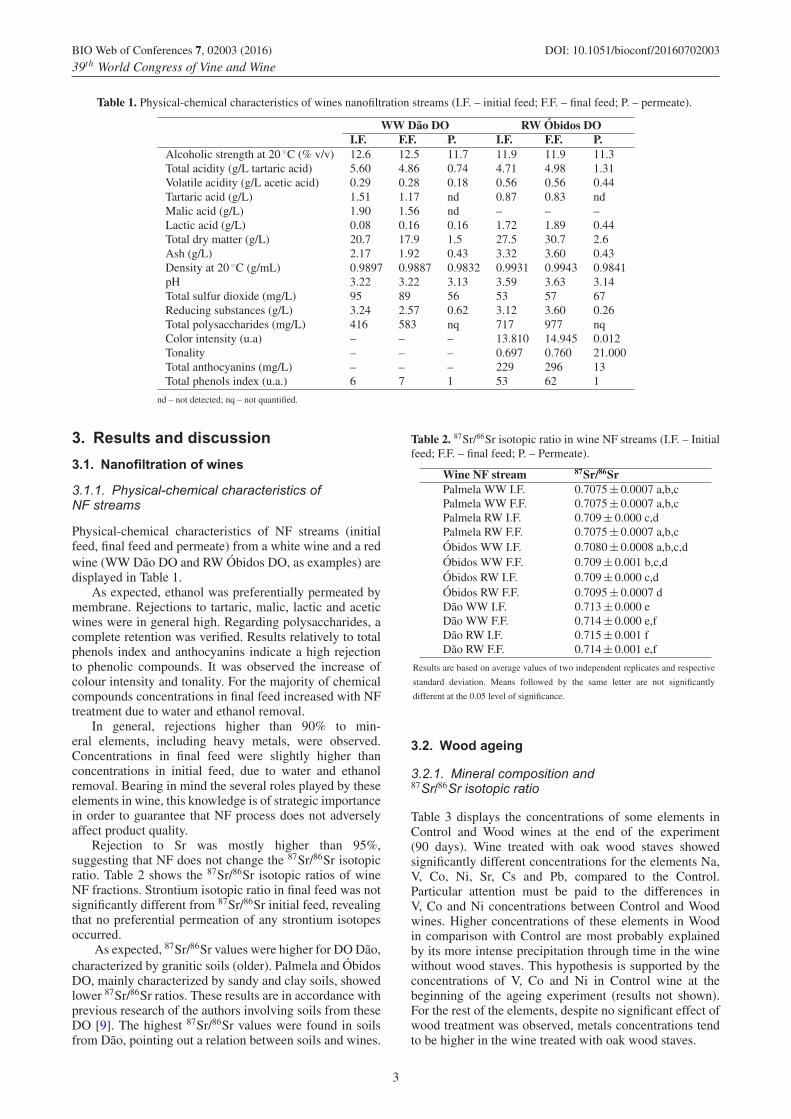
BIO Web of Conferences 7, 02003 (2016) DOI: 10.1051/bioconf/20160702003
39th World Congress of Vine and Wine
Table 1. Physical-chemical characteristics of wines nanofiltration streams (I.F. – initial feed; F.F. – final feed; P. – permeate).
WW Dao DO RW Obidos DOI.F. F.F. P. I.F. F.F. P.
Alcoholic strength at 20 ◦C (% v/v) 12.6 12.5 11.7 11.9 11.9 11.3Total acidity (g/L tartaric acid) 5.60 4.86 0.74 4.71 4.98 1.31Volatile acidity (g/L acetic acid) 0.29 0.28 0.18 0.56 0.56 0.44Tartaric acid (g/L) 1.51 1.17 nd 0.87 0.83 ndMalic acid (g/L) 1.90 1.56 nd – – –Lactic acid (g/L) 0.08 0.16 0.16 1.72 1.89 0.44Total dry matter (g/L) 20.7 17.9 1.5 27.5 30.7 2.6Ash (g/L) 2.17 1.92 0.43 3.32 3.60 0.43Density at 20 ◦C (g/mL) 0.9897 0.9887 0.9832 0.9931 0.9943 0.9841pH 3.22 3.22 3.13 3.59 3.63 3.14Total sulfur dioxide (mg/L) 95 89 56 53 57 67Reducing substances (g/L) 3.24 2.57 0.62 3.12 3.60 0.26Total polysaccharides (mg/L) 416 583 nq 717 977 nqColor intensity (u.a) – – – 13.810 14.945 0.012Tonality – – – 0.697 0.760 21.000Total anthocyanins (mg/L) – – – 229 296 13Total phenols index (u.a.) 6 7 1 53 62 1
nd – not detected; nq – not quantified.
3. Results and discussion
3.1. Nanofiltration of wines
3.1.1. Physical-chemical characteristics ofNF streams
Physical-chemical characteristics of NF streams (initialfeed, final feed and permeate) from a white wine and a redwine (WW Dao DO and RW Obidos DO, as examples) aredisplayed in Table 1.
As expected, ethanol was preferentially permeated bymembrane. Rejections to tartaric, malic, lactic and aceticwines were in general high. Regarding polysaccharides, acomplete retention was verified. Results relatively to totalphenols index and anthocyanins indicate a high rejectionto phenolic compounds. It was observed the increase ofcolour intensity and tonality. For the majority of chemicalcompounds concentrations in final feed increased with NFtreatment due to water and ethanol removal.
In general, rejections higher than 90% to min-eral elements, including heavy metals, were observed.Concentrations in final feed were slightly higher thanconcentrations in initial feed, due to water and ethanolremoval. Bearing in mind the several roles played by theseelements in wine, this knowledge is of strategic importancein order to guarantee that NF process does not adverselyaffect product quality.
Rejection to Sr was mostly higher than 95%,suggesting that NF does not change the 87Sr/86Sr isotopicratio. Table 2 shows the 87Sr/86Sr isotopic ratios of wineNF fractions. Strontium isotopic ratio in final feed was notsignificantly different from 87Sr/86Sr initial feed, revealingthat no preferential permeation of any strontium isotopesoccurred.
As expected, 87Sr/86Sr values were higher for DO Dao,characterized by granitic soils (older). Palmela and ObidosDO, mainly characterized by sandy and clay soils, showedlower 87Sr/86Sr ratios. These results are in accordance withprevious research of the authors involving soils from theseDO [9]. The highest 87Sr/86Sr values were found in soilsfrom Dao, pointing out a relation between soils and wines.
Table 2. 87Sr/86Sr isotopic ratio in wine NF streams (I.F. – Initialfeed; F.F. – final feed; P. – Permeate).
Wine NF stream 87Sr/86SrPalmela WW I.F. 0.7075 ± 0.0007 a,b,cPalmela WW F.F. 0.7075 ± 0.0007 a,b,cPalmela RW I.F. 0.709 ± 0.000 c,dPalmela RW F.F. 0.7075 ± 0.0007 a,b,cObidos WW I.F. 0.7080 ± 0.0008 a,b,c,dObidos WW F.F. 0.709 ± 0.001 b,c,dObidos RW I.F. 0.709 ± 0.000 c,dObidos RW F.F. 0.7095 ± 0.0007 dDao WW I.F. 0.713 ± 0.000 eDao WW F.F. 0.714 ± 0.000 e,fDao RW I.F. 0.715 ± 0.001 fDao RW F.F. 0.714 ± 0.001 e,f
Results are based on average values of two independent replicates and respective
standard deviation. Means followed by the same letter are not significantly
different at the 0.05 level of significance.
3.2. Wood ageing
3.2.1. Mineral composition and87Sr/86Sr isotopic ratio
Table 3 displays the concentrations of some elements inControl and Wood wines at the end of the experiment(90 days). Wine treated with oak wood staves showedsignificantly different concentrations for the elements Na,V, Co, Ni, Sr, Cs and Pb, compared to the Control.Particular attention must be paid to the differences inV, Co and Ni concentrations between Control and Woodwines. Higher concentrations of these elements in Woodin comparison with Control are most probably explainedby its more intense precipitation through time in the winewithout wood staves. This hypothesis is supported by theconcentrations of V, Co and Ni in Control wine at thebeginning of the ageing experiment (results not shown).For the rest of the elements, despite no significant effect ofwood treatment was observed, metals concentrations tendto be higher in the wine treated with oak wood staves.
3

BIO Web of Conferences 7, 02003 (2016) DOI: 10.1051/bioconf/20160702003
39th World Congress of Vine and Wine
Table 3. Mineral composition of the wine treated with oak woodstaves and of the control wine at the end of the experiment,90 days (Results are given in µg/L, except for Na, Mg, Al, K,Ca, Mn, Fe and Zn, which are expressed as mg/L)a.
Treatment effectb Control WoodLi n.s. 11.3 ± 0.3 12.2 ± 0.2Na *** 28.38 ± 0.03 a 30.37 ± 0.04 bMg n.s. 56 ± 2 59.7 ± 0.5Al n.s. 171 ± 7 180.3 ± 0.5K n.s. 993 ± 91 1069 ± 3Ca n.s. 55 ± 1 53.3 ± 0.6V *** 0.45 ± 0.02 a 0.970 ± 0.004 bMn n.s 0.76 ± 0.04 0.83 ± 0.03Fe n.s. 2.42 ± 0.03 2.7 ± 0.1Co *** 1.9 ± 0.1 a 2.80 ± 0.03 bNi *** 12.6 ± 0.5 a 52 ± 2 bCu n.s. 21.9 ± 0.9 26 ± 2Zn n.s. 0.3 ± 0.1 0.319 ± 0.009Ga n.s. 2.6 ± 0.2 2.8 ± 0.6As n.s. 0.9 ± 0.1 1.04 ± 0.04Rb n.s. 1175 ± 59 1249 ± 17Sr * 237 ± 9 a 265 ± 7 bCs * 4.6 ± 0.2 a 5.1 ± 0.1 bTl n.s. 0.293 ± 0.009 0.33 ± 0.01Pb * 3.8 ± 0.2 a 4.5 ± 0.2 b
a Control: the results are based on average values of analysis duplicates.
Wood: the results are based on average values of experimental triplicates and
analyses duplicates. b Means followed by the same letter in a line are not
significantly different at the 0.05* or 0.001*** level of significance; n.s. =
without significant difference. b Control: the results are based on average values of
analysis duplicates. Wood: the results are based on average values of experimental
triplicates and analyses duplicates.
Concerning 87Sr/86Sr isotopic ratio, the values wereof 0.710 ± 0.001 and 0.709 ± 0.001 in Control and Wood,respectively. Under these experimental conditions, the87Sr/86Sr isotopic ratio of wine was not significantlyaffected by the wood treatment suggesting that woodageing does not preclude the use of this parameter as amarker of geographical origin.
Additional results and comprehensive discussion con-cerning this research are being prepared for publication.
The authors acknowledge the Companhia Agrıcola do Sanguin-hal Lda, Jose Maria da Fonseca Vinhos S.A. and Sogrape VinhosS.A. for providing their facilities regarding the study develop-ment; the staff of Membranes Laboratory (Instituto SuperiorTecnico), Enology Laboratory (Instituto Superior de Agronomia)and Mineral Analysis Laboratory, namely Otılia Cerveira (INIAV,Dois Portos) for technical support. This work was supportedby the Portuguese National Funding Agency for Science andTechnology through the grant SFRH/BPD/93535/2013 andthrough the research centres LEAF (UID/AGR/04129/2013)and CEFEMA (UID/CTM/04540/2013).
References
[1] R.C. Capo, B.W. Stewart, O.A. Chadwick, Geoderma82, 197–225 (1998)
[2] P. Horn, P. Schaaf, B. Holbach, S. Holzl, H.Eschnauer, Z. Lebensm. Unters. Forsch. 196,407–409 (1993)
[3] P. Horn, S. Holzl, W. Todt, D. Matthies, Isot. Environ.Healt. Stud. 33 (1–2), 31–42 (1997)
[4] C.M. Almeida, M.T.S.D. Vasconcelos, J. Anal. At.Spectrom. 16, 607–611 (2001)
[5] C.M.R. Almeida, M.T.S.D. Vasconcelos, FoodChem. 85, 7–12 (2004)
[6] S. Marchionni, E. Braschi, S. Tommasini, A. Bollati,F. Cifelli, N. Mulinacci, M. Mattei, S. Conticelli. S.,J. Agric. Food Chem. 61 (28), 6822–6831 (2013)
[7] M. Mercurio, E. Grilli, P. Odierna, V. Morra, T.Prohaska, E. Coppola, C. Grifa, A. Buondonno, ALangella, Geoderma 230–231, 64–78 (2014)
[8] C. Durante, C. Baschieri, L. Bertacchini, D. Bertelli,M. Cocchi, A. Marchetti, D. Manzini, G. Papotti, S.Sighinolfi, Food Chem. 173, 557–563 (2015)
[9] P. Martins, M. Madeira, F. Monteiro, R. Bruno deSousa, A.S. Curvelo-Garcia, S. Catarino, J. Int. Sci.Vigne Vin, 48 (1), 21–29 (2014)
[10] S. Catarino, R. Bruno de Sousa, A.S. Curvelo-Garcia,Origem geografica. In: A.S. Curvelo Garcia A.S.& P. Barros (eds). Quımica enologica – metodosanalıticos. Avancos recentes no controlo da qualidadede vinhos e de outros produtos vitivinıcolas,513–538. Publindustria, Porto (2015)
[11] OIV. International Code of Oenological Practices.Organisation Internationale de la Vigne et du Vin,Paris (2015)
[12] M. Catarino, A. Mendes, Innov. Food Sci. Emerg. 12(3), 330–337 (2011)
[13] F. Goncalves, R. Ribeiro, L. Neves, T. Lemperle,M. Lanca, J. Ricardo da Silva, O. Laureano.In: P.-L. Teissedre (coord.). Proc. 1st InternationalSymposium of Oenoviti International Network,64–67. Bordeaux (2013)
[14] V. Victor, S. Ross, P. Karine, P. Andre, H. Jean-Francois, W. David, Procedia Earth and PlanetaryScience 13, 252-255 (2015)
[15] S. Marchionni, A. Buccianti, A. Bollati, E. Braschi,F. Cifelli, P. Molin, M. Parotto, M. Mattei, S.Tommasini, S. Conticelli, Food Chem. 190, 777–785(2016)
[16] OIV. Compendium of International Methods of Wineand Must Analysis I/II, Organisation Internationalede la Vigne et du Vin: Paris, France (2014)
[17] T.C. Somers, M.E. Evans, J. Sci. Food Agr., 28,279–287 (1977)
[18] S. Catarino, A.S. Curvelo-Garcia, R. Bruno de Sousa,Talanta, 70, 1073–1080 (2006)
4