Makingpredictions

Sofar...Build,check&selectmodelsfordetectability
Build,check&selectmodelsforabundance
Makesomeecologicalinferenceaboutsmooths
Whataboutpredictions?

Let'stalkaboutmaps

Whatdoesamapmean?Grids!
Cellsareabundanceestimate
“snapshot”
Sumcellstogetabundance
Sumasubset?

Goingbacktotheformula(Count)Model:
Predictions(index ):
Needto“fill-in”valuesfor , and .
= exp[ + s( ) + s( )] +nj Aj p̂j β0 yj Depthj ϵj
r
= exp[ + s( ) + s( )]nr Ar β0 yr Depthr
Ar yr Depthr

PredictingWiththesevaluescanusepredictinRpredict(model, newdata=data)

Predictiondata x y Depth SST NPP DistToCAS EKE off.set126 547984.6 788254 153.5983 8.8812 1462.521 11788.974 0.0074 1e+08127 557984.6 788254 552.3107 9.2078 1465.410 5697.248 0.0144 1e+08258 527984.6 778254 96.8199 9.6341 1429.432 13722.626 0.0024 1e+08259 537984.6 778254 138.2376 9.6650 1424.862 9720.671 0.0027 1e+08260 547984.6 778254 505.1439 9.7905 1379.351 8018.690 0.0101 1e+08261 557984.6 778254 1317.5952 9.9523 1348.544 3775.462 0.0193 1e+08 LinkID Nhat_tw126 1 0.01417657127 2 0.05123483258 3 0.01118858259 4 0.01277096260 5 0.04180434261 6 0.45935801

AquickwordaboutrastersWehavetalkedaboutrastersabit
InR,thedata.frameiskingFortunatelyas.data.frameexistsMakeour“stack”andthenconverttodata.frame

Predictors

MakingapredictionAddanothercolumntothepredictiondata
Plottingtheneasier(inR)
predgrid$Nhat_tw <- predict(dsm_all_tw_rm, predgrid)

Mapsofpredictionsp <- ggplot(predgrid) + geom_tile(aes(x=x, y=y, fill=Nhat_tw)) + scale_fill_viridis() + coord_equal()print(p)

TotalabundanceEachcellhasanabundance,sumtogettotal
sum(predict(dsm_all_tw_rm, predgrid))
[1] 2491.864

SubsettingRsubsettingletsyoucalculate“interesting”estimates:
# how many sperm whales at depths less than 2500m?sum(predgrid$Nhat_tw[predgrid$Depth < 2500])
[1] 1006.272
# how many sperm whales North of 0?sum(predgrid$Nhat_tw[predgrid$x>0])
[1] 1383.742
Extrapolation

Whatdowemeanbyextrapolation?Predictingatvaluesoutsidethoseobserved
Whatdoes“outside”mean?
betweentransects?
outside“surveyarea”?

TemporalextrapolationModelsaretemporallyimplicit(mostly)
Dynamicvariableschangeseasonally
Migrationcanbeanissue
Needtounderstandwhatthepredictionsare

ExtrapolationExtrapolationisfraughtwithissues
Wanttobepredicting“insidetherug”
Ingeneral,trynottodoit!
(Thinkaboutvariancetoo!)

RecapUsingpredictGetting“overall”abundance
Subsetting
PlottinginR
Extrapolation(anditsdangers)
Estimatingvariance

NowwecanmakepredictionsNowwearedangerous.

Predictionsareuselesswithoutuncertainty

Wheredoesuncertaintycomefrom?

SourcesofuncertaintyDetectionfunction
GAMparameters

Let'sthinkaboutsmoothsfirst

UncertaintyinsmoothsDashedlinesare+/-2standarderrors
Howdowetranslateto ?N̂

BacktobasesBeforeweexpressedsmoothsas:
Theorytellsusthat:
where isabitcomplicated
(derivedfromthesmoothermatrix)
s(x) = (x)∑Kk=1 βkbk
β ∼ N( , )β̂ Vβ
Vβ

Predictionstopredictionvariance(roughly)
“map”dataontofittedvalues
“map”predictionmatrixtopredictions
Here needtotakesmoothsintoaccount
pre-/post-multiplyby to“transformvariance”
linkscale,needtodoanothertransformforresponse
Xβ
βXp
Xp
Xp
⇒ XTp VβXp
Addingindetectionfunctions
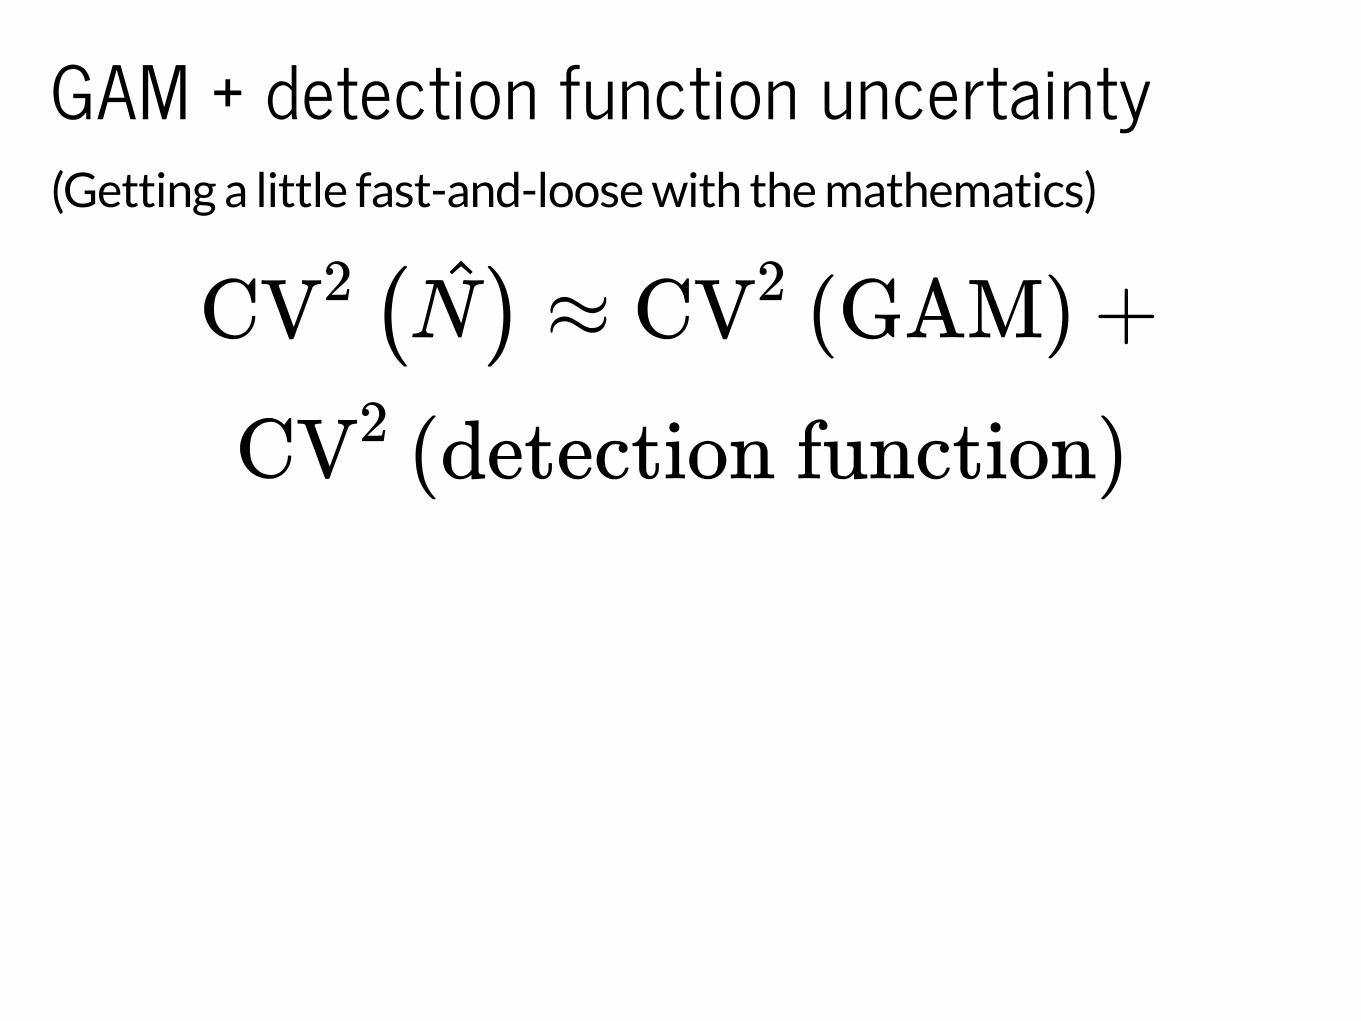
GAM+detectionfunctionuncertainty(Gettingalittlefast-and-loosewiththemathematics)
( ) ≈ (GAM) +CV2 N̂ CV2
(detectionfunction)CV2

Notthatsimple...AssumesdetectionfunctionandGAMareindependent
Maybethisisokay?
(Probablynottrue?)

VariancepropagationIncludethedetectabilityasterminGAM
Randomeffect,meanzero,varianceofdetectionfunction
Uncertainty“propagated”throughthemodel
Detailsinbibliography(toomuchtodetailhere)
Underdevelopment
(Cancoverinspecialtopic)
Thatseemedcomplicated...

Rtotherescue
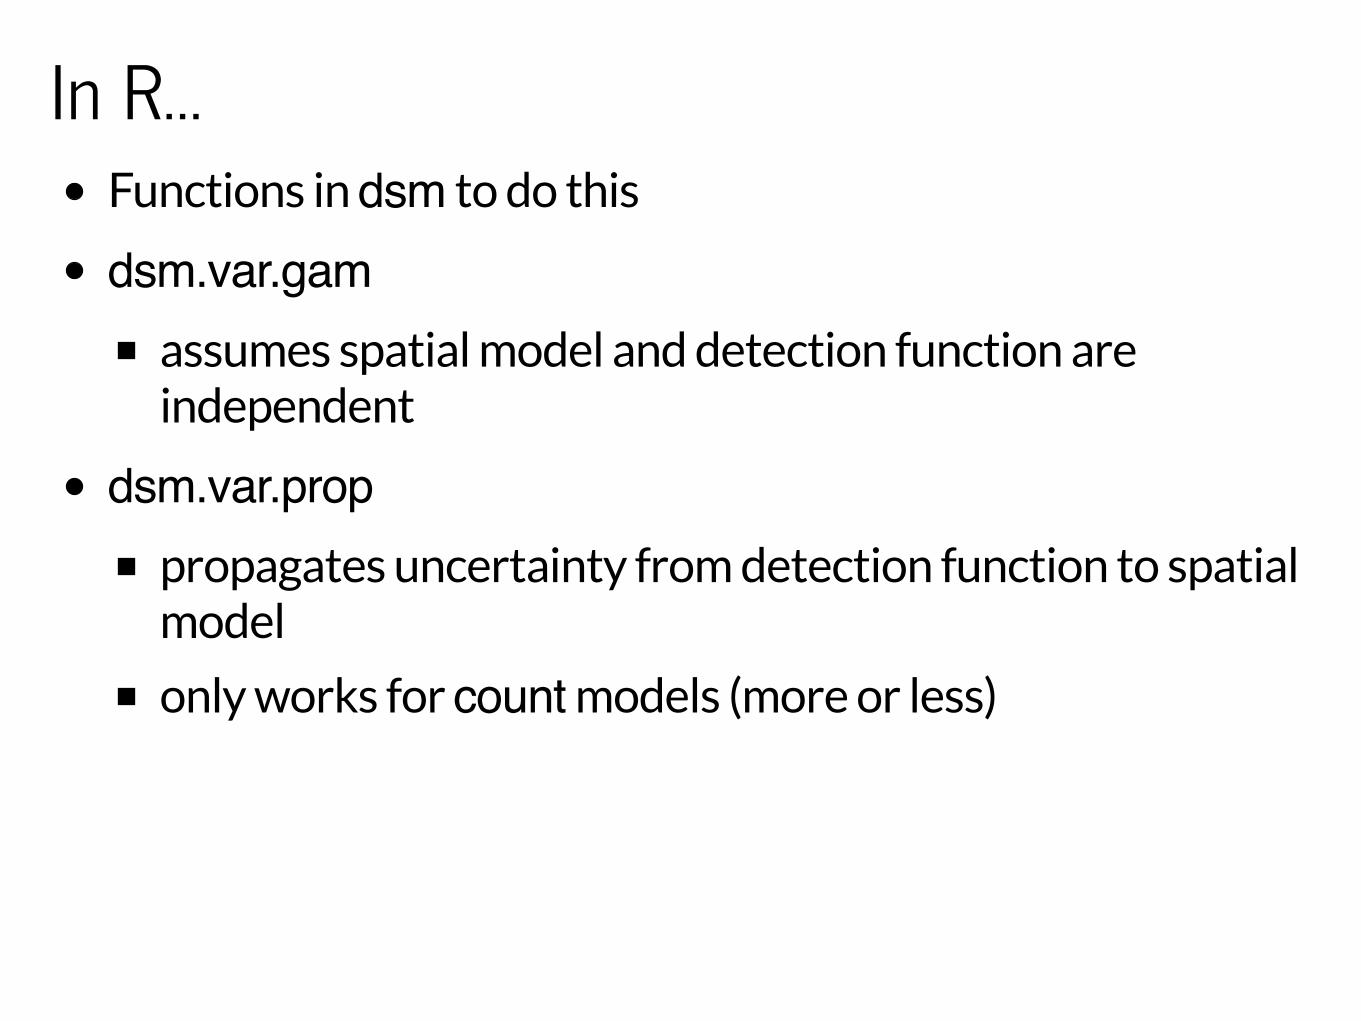
InR...Functionsindsmtodothis
dsm.var.gamassumesspatialmodelanddetectionfunctionareindependent
dsm.var.proppropagatesuncertaintyfromdetectionfunctiontospatialmodel
onlyworksforcountmodels(moreorless)

VarianceofabundanceUsingdsm.var.gam
dsm_tw_var_ind <- dsm.var.gam(dsm_all_tw_rm, predgrid, off.set=predgrid$off.set)summary(dsm_tw_var_ind)
Summary of uncertainty in a density surface model calculated analytically for GAM, with delta method
Approximate asymptotic confidence interval: 2.5% Mean 97.5% 1539.018 2491.864 4034.643 (Using log-Normal approximation)
Point estimate : 2491.864 CV of detection function : 0.2113123 CV from GAM : 0.1329 Total standard error : 622.0389 Total coefficient of variation : 0.2496

VarianceofabundanceUsingdsm.var.prop
dsm_tw_var <- dsm.var.prop(dsm_all_tw_rm, predgrid, off.set=predgrid$off.set)summary(dsm_tw_var)
Summary of uncertainty in a density surface model calculated by variance propagation.
Probability of detection in fitted model and variance model Fitted.model Fitted.model.se Refitted.model1 0.3624567 0.07659373 0.3624567
Approximate asymptotic confidence interval: 2.5% Mean 97.5% 1556.898 2458.634 3882.646 (Using log-Normal approximation)
Point estimate : 2458.634 Standard error : 581.0379 Coefficient of variation : 0.2363

Plotting-dataprocessingCalculateuncertaintyper-cell
dsm.var.*thinkspredgridisone“region”Needtosplitdataintocells(usingsplit())(Couldbearbitrarysetsofcells,seeexercises)
Needwidthandheightofcellsforplotting

Plotting(code)predgrid$width <- predgrid$height <- 10*1000predgrid_split <- split(predgrid, 1:nrow(predgrid))head(predgrid_split,3)
$`1` x y Depth SST NPP DistToCAS EKE off.set126 547984.6 788254 153.5983 8.8812 1462.521 11788.97 0.0074 1e+08 LinkID Nhat_tw height width126 1 0.01417657 10000 10000
$`2` x y Depth SST NPP DistToCAS EKE off.set127 557984.6 788254 552.3107 9.2078 1465.41 5697.248 0.0144 1e+08 LinkID Nhat_tw height width127 2 0.05123483 10000 10000
$`3` x y Depth SST NPP DistToCAS EKE off.set258 527984.6 778254 96.8199 9.6341 1429.432 13722.63 0.0024 1e+08 LinkID Nhat_tw height width258 3 0.01118858 10000 10000
dsm_tw_var_map <- dsm.var.prop(dsm_all_tw_rm, predgrid_split, off.set=predgrid$off.set)
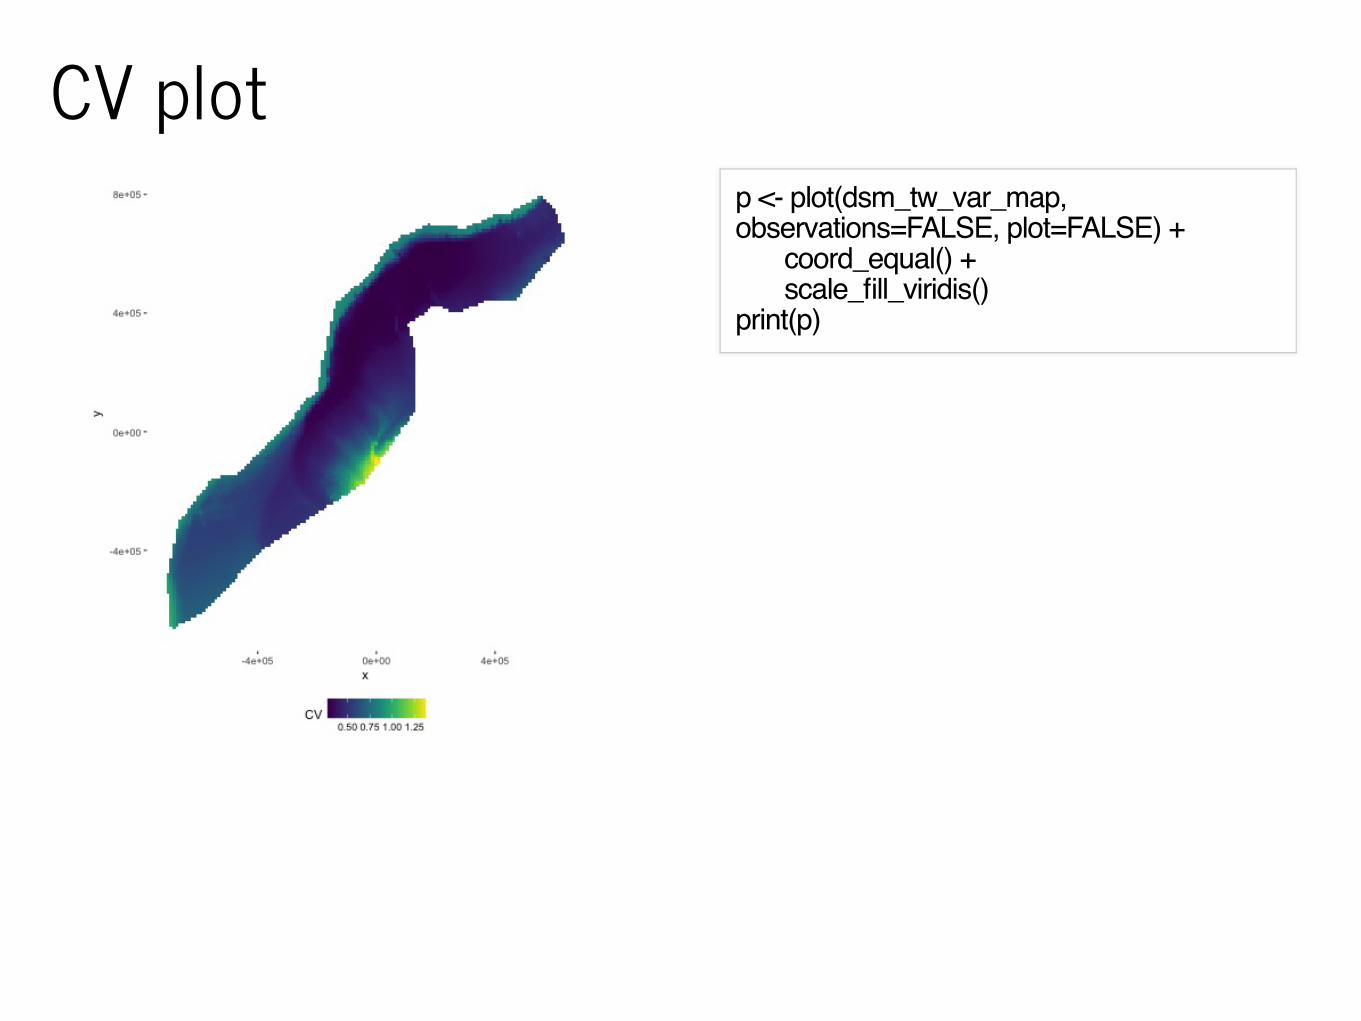
CVplotp <- plot(dsm_tw_var_map, observations=FALSE, plot=FALSE) + coord_equal() + scale_fill_viridis()print(p)

InterpretingCVplotsPlottingcoefficientofvariation
Standardisestandarddeviationbymean
(percell)
Canbeusefultooverplotsurveyeffort
CV = se( )/N̂ N̂
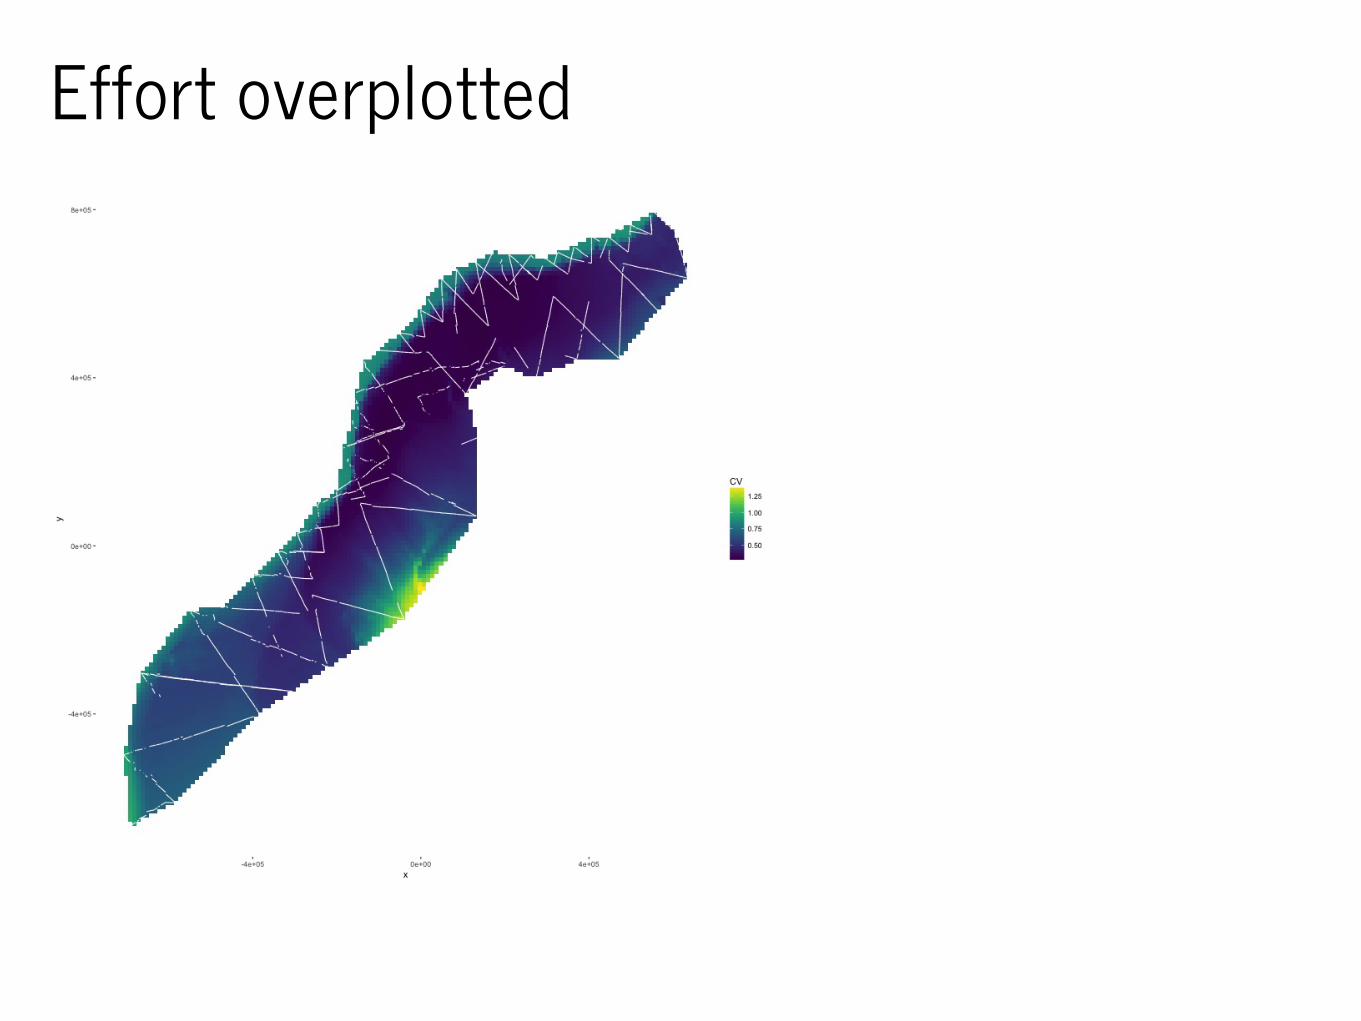
Effortoverplotted

BigCVsHereCVsare“wellbehaved”
Notalwaysthecase(hugeCVspossible)
Thesecanbeapaintoplot
Usecut()inRtomakecategoricalvariable
e.g.c(seq(0,1, len=100), 2:4, Inf)orsomesuch

RecapHowdoesuncertaintyariseinaDSM?
Estimatevarianceofabundanceestimate
Mapcoefficientofvariation

Let'strythat!