prediction results supplied by prediction results supplied by the IERS Sub-bureau for Rapid the IERS Sub-bureau for Rapid Service and Predictions and Service and Predictions and results of other prediction results of other prediction methods methods W. Kosek 1 , D.D. McCarthy 2 , T.J. Johnson 2 , M. Kalarus 1 1 Space Research Centre, PAS, Warsaw, Poland 2 U.S. Naval Observatory, Washington D.C., USA Journees 2003 “Systemes de Reference Spatio-Temporels”, 22-25 September 2003, St. Petersburg, Russia.

Comparison of polar motion prediction results supplied by the IERS Sub-bureau for Rapid Service and Predictions and results of other prediction methods.
Dec 18, 2015
Welcome message from author
This document is posted to help you gain knowledge. Please leave a comment to let me know what you think about it! Share it to your friends and learn new things together.
Transcript

Comparison of polar motion prediction Comparison of polar motion prediction results supplied by the IERS Sub-bureau results supplied by the IERS Sub-bureau
for Rapid Service and Predictions and for Rapid Service and Predictions and results of other prediction methodsresults of other prediction methods
W. Kosek1, D.D. McCarthy2, T.J. Johnson2, M. Kalarus1 1Space Research Centre, PAS, Warsaw, Poland 2U.S. Naval Observatory, Washington D.C., USA
Journees 2003 “Systemes de Reference Spatio-Temporels”, 22-25 September 2003, St. Petersburg, Russia.

Data EOPC01 (1846.0 - 2000.0), Δt =0.05 years http://hpiers.obspm.fr/eop-pc/ EOPC04 (1962.0 - 2003.5), Δt = 1 day http://hpiers.obspm.fr/eop-pc/ USNO (1976.0 - 2003.5), Δt = 1 day (finals.all )
http://maia.usno.navy.mil/bulletin-a.html
1890 1900 1910 1920 1930 1940 1950 1960 1970 1980 1990 2000-0.50-0.40-0.30-0.20-0.100.000.100.200.300.400.50
x
arcsec
1890 1900 1910 1920 1930 1940 1950 1960 1970 1980 1990 2000-0.40-0.30-0.20-0.100.000.100.200.300.400.500.60
y
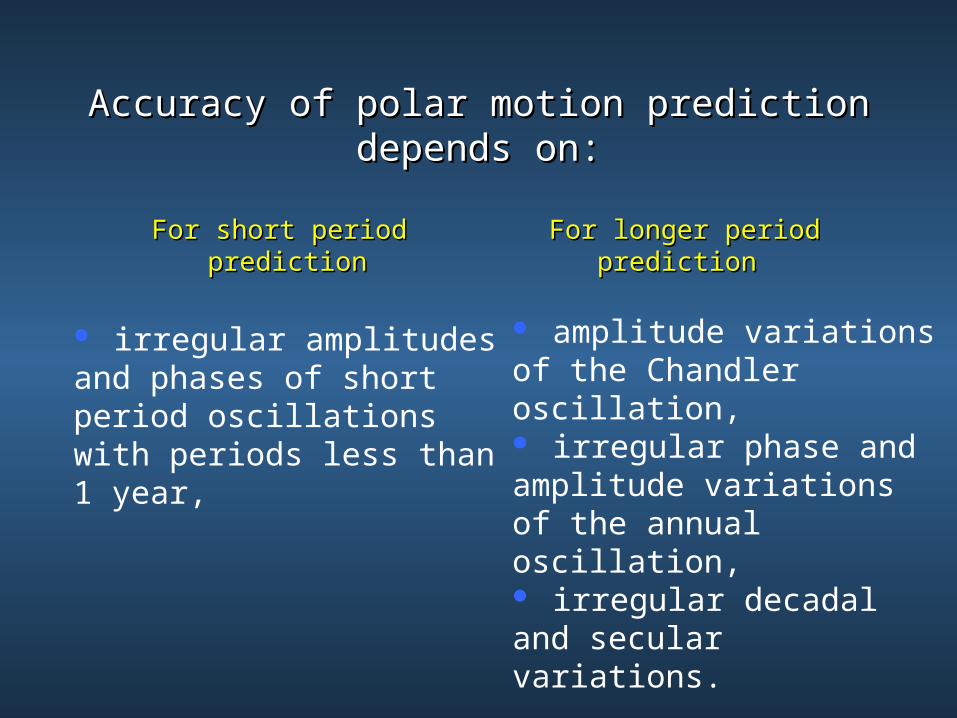
Accuracy of polar motion prediction depends on:Accuracy of polar motion prediction depends on:
irregular amplitudes and phases of short period oscillations with periods less than 1 year,
amplitude variations of the Chandler oscillation, irregular phase and amplitude variations of the annual oscillation, irregular decadal and secular variations.
For short period For short period predictionprediction
For longer period For longer period predictionprediction

The Chandler and annual oscillations filtered by the FTBPF The Chandler and annual oscillations filtered by the FTBPF from pole coordinates datafrom pole coordinates data
1890 1900 1910 1920 1930 1940 1950 1960 1970 1980 1990 2000-0.30-0.20-0.100.000.100.200.30
Ch x
arcsec
1890 1900 1910 1920 1930 1940 1950 1960 1970 1980 1990 2000-0.30-0.20-0.100.000.100.200.30
Ch y
1890 1900 1910 1920 1930 1940 1950 1960 1970 1980 1990 2000-0.20-0.100.000.100.20
An x
1890 1900 1910 1920 1930 1940 1950 1960 1970 1980 1990 2000-0.20-0.100.000.100.20
An y
Chandler
Annual

Time-frequency FTBPF amplitude spectra (prograde part) with different Time-frequency FTBPF amplitude spectra (prograde part) with different frequency bandwidths of complex-valued USNO pole coordinate datafrequency bandwidths of complex-valued USNO pole coordinate data
1975 1978 1981 1984 1987 1990 1993 1996 1999 2002
10
40
70
100
130
0.5
1.0
1.5
2.0
1975 1978 1981 1984 1987 1990 1993 1996 1999 2002years
10
40
70
100
130
p
erio
d (d
ays)
0.5
1.0
1.5
2.0
2.5
3.0
3.5
4.0
0.0004
0.0014
x - iy (HPF 160 days) m as
18.04.23 6
The current polar motion prediction computed by theThe current polar motion prediction computed by the IERS IERS Sub-Bureau for Rapid Service and Prediction Sub-Bureau for Rapid Service and Prediction is the LS is the LS
extrapolation of the circular Chandler and elliptic annual and extrapolation of the circular Chandler and elliptic annual and semiannual oscillations. The LS extrapolation model is fit to semiannual oscillations. The LS extrapolation model is fit to the last year of the pole coordinates data and predicted for the last year of the pole coordinates data and predicted for
one year in the future. one year in the future.
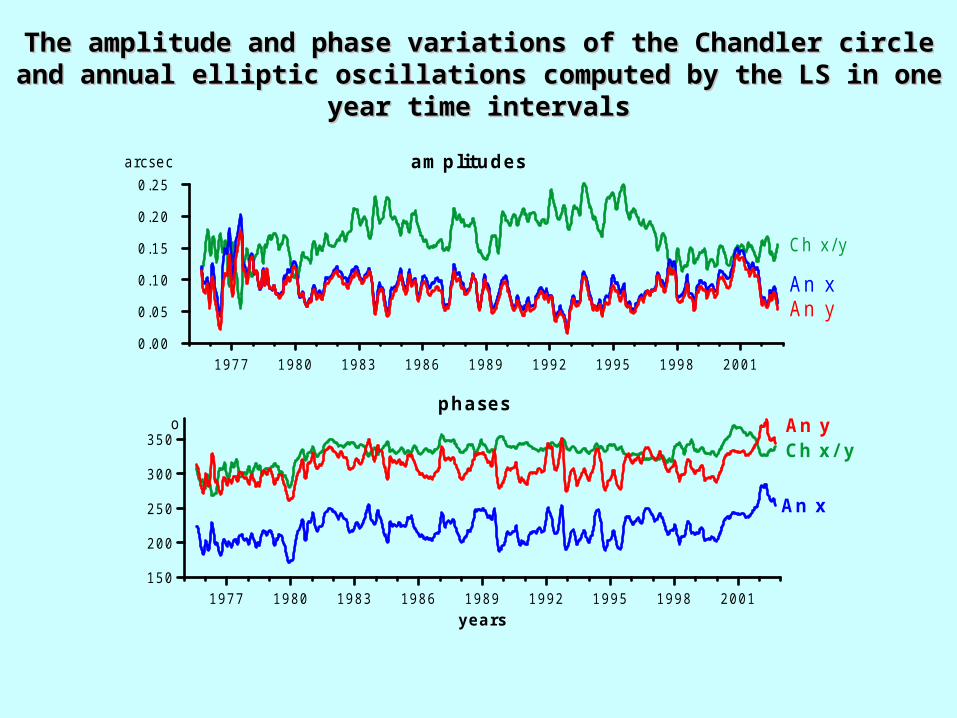
The amplitude and phase variations of the Chandler circle and annual elliptic The amplitude and phase variations of the Chandler circle and annual elliptic oscillations computed by the LS in one year time intervalsoscillations computed by the LS in one year time intervals
1977 1980 1983 1986 1989 1992 1995 1998 20010.00
0.05
0.10
0.15
0.20
0.25arcsec am plitudes
Ch x/ y
An xAn y
1977 1980 1983 1986 1989 1992 1995 1998 2001years
150
200
250
300
350o
phases
Ch x/ yAn y
An x

Two ways of polar motion Two ways of polar motion predictionprediction
A prediction method is applied directly to x, y pole coordinates data. Before the prediction is applied the linear trend is removed and the trend extrapolation model is added to the computed forecast.
A prediction method is applied in polar coordinate system to the polar motion radius and angular velocity and then their forecasts are transformed to the pole coordinate prediction using linear intersection. The radius and its prediction must be referred to the mean pole and its prediction.

The following prediction methods using two ways of prediction were applied:
1) Least-squares (LS) extrapolation (1 and 2 dimensions)2) Autocovariance (2 dimensions) (Kosek 1997)3) Autoregressive (AR) (2 dimensions) (Brzeziński 1995)4) Neural networks (NN) (1 dimension)
Different combinations of the two prediction methods that compute the forecast as the sum of the LS extrapolation and the autocovariance, autoregressive and neural networks prediction of the LS extrapolation residuals were also tested.
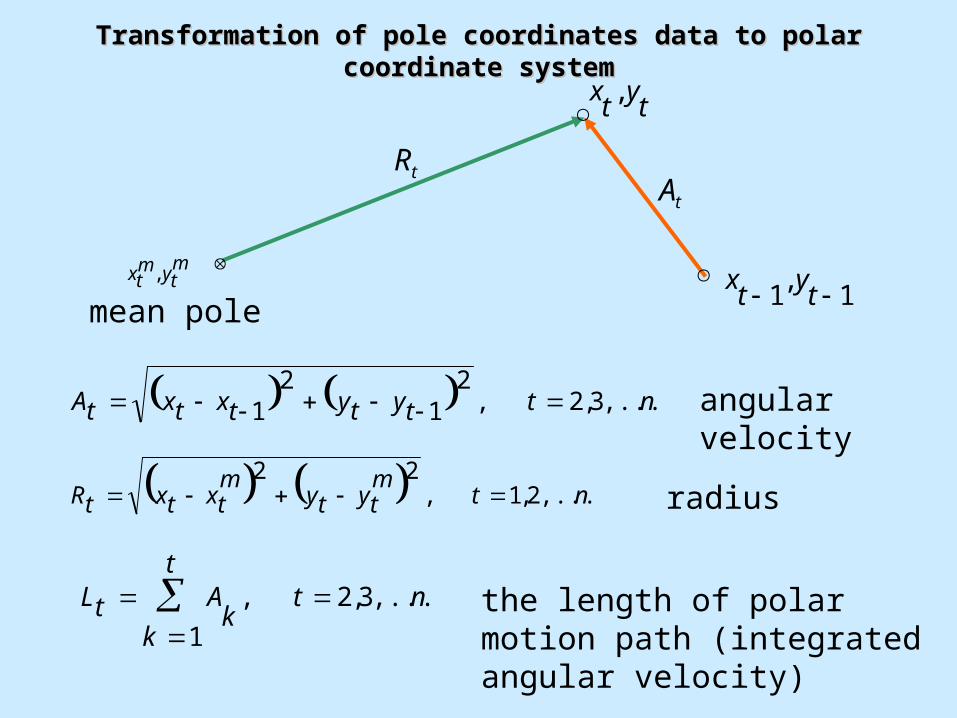
Transformation of pole coordinates data to polar coordinate systemTransformation of pole coordinates data to polar coordinate system
ntt
kkAtL ,...,3,2,
1
ty
tx ,
tR
ntmtyty
mtxtxtR ,...,2,1,
22
nttytytxtxtA ,...,3,2,2
12
1
radius
angular velocity
the length of polar motion path (integrated angular velocity)
mty
mtx ,
tA
1,
1 ty
tx
mean pole

Transformation of the prediction of radius and Transformation of the prediction of radius and angular velocityangular velocity from from the polar to the Cartesian pole coordinate systemthe polar to the Cartesian pole coordinate system
mnym
nx ,
ny
nx ,
1,
1 ny
nx
,4cot,4cot 21
221
21
221 PRRAPARR nnnnnn
cotcot
cotcot
1
1
mn
mn
mn
mn
n
n
n
n
n
n x
y
y
x
x
y
y
x
y
x
2
, 1111
nnn
nnn
ARRpApRpRppP
Linear intersection formula:
1nR1nA
mean pole prediction
nR

The mean pole using Ormsby LPF
LnLtkct
tkck
ktyktx
mty
mtx L
Lk
,...,2,2))((2
)2cos()2cos(
L n- filter length, - number of data,
cc Tt / - cutoff frequency, - cutoff period, yrTc 180415.3 Etc - cutoff frequency – roll off termination frequency.
tt yx , - pole coordinates data,
-0.10.00.10.20.30.4-0.1
0.0
0.1x
yarcsec
arcsec2003
1849

1900 1910 1920 1930 1940 1950 1960 1970 1980 1990 20000.0
0.1
0.2
0.3
0.4Radiusarcsec
1900 1910 1920 1930 1940 1950 1960 1970 1980 1990 20000.000
0.002
0.004
0.006
0.008Angular velocityarcsec/day
Corr. Coeff.1900-2003
0.8641950-2003
0.899

The FTBPF time-frequency amplitude spectra of polar motion radius and angular velocity
1920 1930 1940 1950 1960 1970 1980years
500
1500
2500
3500
per
iod
(day
s)
0.2
0.4
0.6
0.8
1.0
1 9 20 19 3 0 1 9 4 0 1 95 0 1 9 6 0 1 9 70 1 9 8 0
500
1500
2500
3500
1 02 03 04 05 06 0
3
6
9
yr m asrad ius
angular ve locity m as/day
3
6
9
0.0001

The FTBPF amplitude spectra of polar motion radius and angular velocityThe FTBPF amplitude spectra of polar motion radius and angular velocity
0 100 200 300 400 500 600period (days)
0
1
2
3
4
5mas radius
0 100 200 300 400 500 600period (days)
0.000.020.040.060.080.100.12
mas/ day angular velocity
b )

Time-frequency FTBPF amplitude spectra of polar motion radius, Time-frequency FTBPF amplitude spectra of polar motion radius, angular velocity and integrated angular velocityangular velocity and integrated angular velocity
0.0005
m as/day
m as
0.5
1.0
1.5
0.5
1.0
1.5
yrrad ius
angular ve loc ity1979 1981 1983 1985 1987 1989 1991 1993 1995 1997 1999 2001
100
300
500
2
4
6
8
1979 1981 1983 1985 1987 1989 1991 1993 1995 1997 1999 2001
100
300
500
perio
d (d
ays)
0.020.040.060.080.100.12
1979 1981 1983 1985 1987 1989 1991 1993 1995 1997 1999 2001years
100
300
500
2
4
6
8
length o f po lar m otion pa th
1.5
1.0
m as
0.5

Autocovariance prediction
,0)(
1
1
n
n
z
zR
)0(ˆ
)(ˆ
)(1
1)(
1 nzz
kn
kkn
nzz
n c
zkcz
1,...,1,0,1
)(ˆ1
)(
nkforzz
nkc
kn
tktt
nzz
nkforzzn
kckn
tktt
nzz ,...,1,0,
1
1)(ˆ
1
)1(
min,)(ˆ)(ˆ)(1
2)1()(1
kn
k
nzz
nzzn kckczR
?1 nz
Let be stationary complex-valued time seriesnttz ,...,2,1,
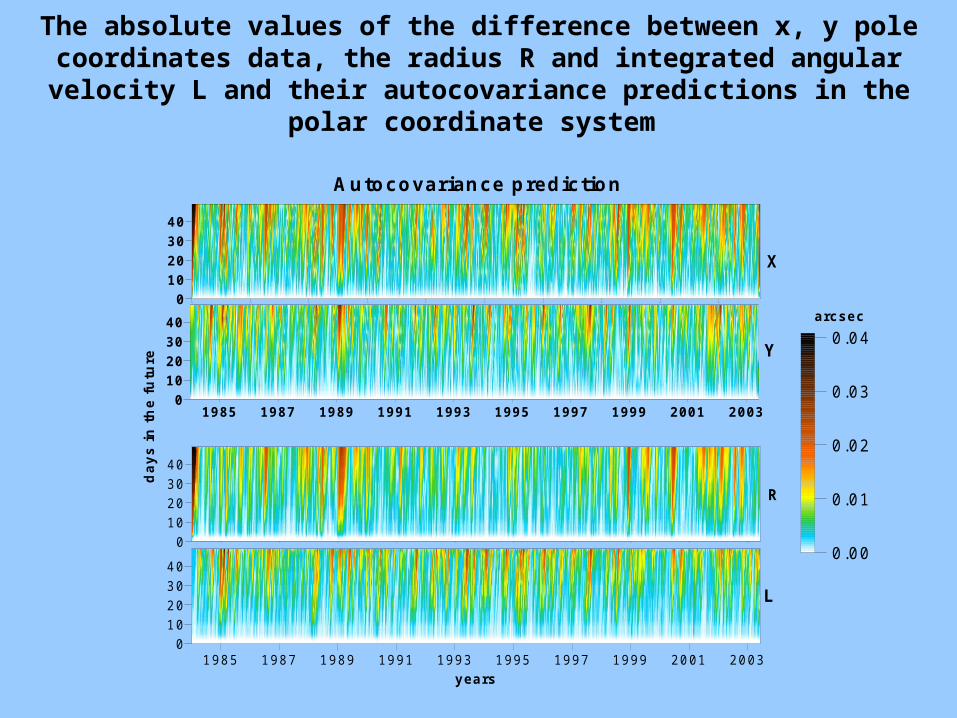
The absolute values of the difference between x, y pole coordinates data, the radius R and integrated angular velocity L and their autocovariance predictions
in the polar coordinate system
1985 1987 1989 1991 1993 1995 1997 1999 2001 20030
10203040
1 98 4 1 986 19 88 1 99 0 1 992 1 99 4 1 996 19 98 2 00 0 2 002010203040
Autocovariance prediction
X
Y
1 98 5 1 987 1 98 9 1 991 19 93 1 99 5 1 997 1 99 9 2 001 20 03010203040
d
ays
in t
he
futu
re
0.00
0.01
0.02
0.03
0.04
1985 1987 1989 1991 1993 1995 1997 1999 2001 2003years
010203040
R
L
arcsec

The absolute value of the difference between x, y pole coordinates data and their IERS and autocovariance predictions computed in the polar coordinate system
1 9 8 5 1 9 8 7 1 9 8 9 1 9 9 1 1 9 9 3 1 9 9 5 1 9 9 7 1 9 9 9 2 0 0 1 2 0 0 3
010203040
0.01
0.02
0.03
0.04
1985 1987 1989 1991 1993 1995 1997 1999 2001 20030
10203040
X
Y
1985 1987 1989 1991 1993 1995 1997 1999 2001 2003years
010203040
1 9 8 4 1 9 86 19 8 8 1 9 9 0 1 99 2 1 9 9 4 1 9 96 19 9 8 2 0 0 0 2 00 2010203040
d
ays
in t
he
futu
re
LS prediction - IERS SubBureau for Rapid Service and Prediction
Autocovariance prediction
X
Y
arcsec

The mean prediction error of x, y pole coordinates data, the radius R, angular velocity A and integrated angular velocity L in 1984.0-2003.5
computed from the autocovariance predictions in the polar coordinate system
0 50 100 150 200 250 300 350days in the future
0.000.010.020.030.040.050.060.070.080.090.100.110.120.130.14
A
R
xy
Larcsec

The mean prediction error of x, y pole coordinates data in 1984.0-2003.5 computed from the autocovariance predictions in the polar coordinate system and by the IERS Sub-bureau for Rapid Service and Predictions
0 50 100 150 200 250 300 350days in the future
0.00
0.01
0.02
0.03
0.04
0.05
0.06
x
y
arcsec
USNO
autocovarianceprediction
xy

Prediction by combination of the LS and a stochastic methodPrediction by combination of the LS and a stochastic methodin the Cartesian pole coordinate systemin the Cartesian pole coordinate system
x, y LS extrapolation
residuals
Prediction ofx, y
LS extrapolation residuals
LS extrapolation of x, y
Prediction of x, y
AUTOCOVARIANCEARNN
x, y pole coordinates
data
x, y LS model

Prediction of x, y pole coordinates data by combination of the LS and a Prediction of x, y pole coordinates data by combination of the LS and a stochastic methodstochastic method in the polar coordinate systemin the polar coordinate system
x, y pole coordinates data
R, A LS model
R, A LS extrapolation
residuals
Prediction of R, A
LS extrapolation residuals
R, ALS extrapolation
Prediction of R, A
AUTOCOVARIANCEAR
R – radius A – angular velocity
Prediction of x, y
mean pole + its LS prediction
Prediction of R, A
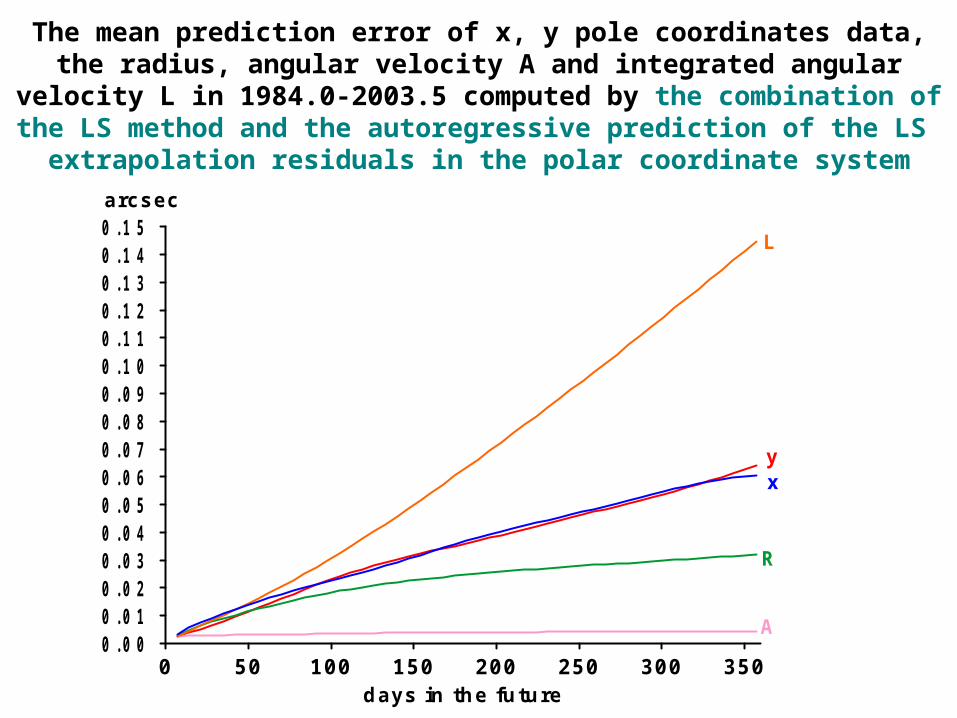
The mean prediction error of x, y pole coordinates data, the radius, angular velocity A and integrated angular velocity L in 1984.0-2003.5
computed by the combination of the LS method and the autoregressive prediction of the LS extrapolation residuals in the polar coordinate
system
0 50 100 150 200 250 300 350days in the future
0.000.010.020.030.040.050.060.070.080.090.100.110.120.130.140.15
A
R
xy
L
arcsec

The mean prediction error in 1984.0-2003.5 of x, y pole coordinates data computed from the LS predictions of the IERS Sub-Bureau for Rapid Service
and Predictions (x - blue and y - red) and from the combination of the LS extrapolation of complex-valued pole coordinate data and the AR prediction of
the complex-valued LS extrapolation residuals (x - green, y - yellow)
0 50 100 150 200 250 300 350days in the future
0.00
0.01
0.02
0.03
arcsec
xy
xy
USNO
LS + AR

The absolute value of the difference between x, y pole coordinates data and their IERS and LS+AR predictions
1 985 1987 198 9 1991 1993 19 95 1997 1999 2 001 2003
010203040
0.01
0.02
0.03
0.04
1985 1987 1989 1991 1993 1995 1997 1999 2001 20030
10203040
day
s in
th
e fu
ture
x
y
arcsecIERS Sub-bureau for Rapid Service and Predictions
1985 1 987 19 89 1991 1993 1995 1 997 19 99 2001 2003
010203040
0.00
0.01
0.02
0.03
0.04LS prediction + AR prediction of LS extrapolation residuals
1985 1987 1989 1991 1993 1995 1997 1999 2001 20030
10203040
d
ays
in t
he
futu
re x
y

The mean prediction error in 1984.0-2003.5 of x, y pole coordinates data computed from the LS predictions of the IERS Sub-Bureau for Rapid Service
and Predictions (x - blue and y - red) and from the combination of the LS extrapolation of complex-valued pole coordinate data and the NN prediction of
the real-valued LS extrapolation residuals (x - green, y - yellow)
USNO
LS + NN
0 50 100 150 200 250 300 350days in the future
0.00
0.01
0.02
0.03
arcsec
xy
xy

The absolute value of the difference between x, y pole coordinates data and their IERS and LS+NN predictions
1 985 1987 198 9 1991 1993 19 95 1997 1999 2 001 2003
010203040
0.01
0.02
0.03
0.04
1985 1987 1989 1991 1993 1995 1997 1999 2001 20030
10203040
d
ays
in t
he
futu
re x
y
arcsec
I ER S Sub-bureau for R apid Service and Predictions
19 85 198 7 198 9 199 1 19 93 19 95 19 97 19 99 200 1 200 3
010203040
1985 1987 1989 1991 1993 1995 1997 1999 2001 2003years
010203040
d
ays
in t
he
futu
re
LS + NN
x
y

ConclusionsConclusions The mean prediction errors of x, y pole coordinates data
for prediction length less than 50 days in the future of the IERS prediction and the autocovariance prediction in polar coordinate system are of the same order.
The problem of any prediction method of pole coordinates data in the polar coordinate system is a significant error in the prediction of the integrated angular velocity.
The accuracy of prediction of x, y pole coordinates data by combination of the LS extrapolation and the AR or NN predictions of the LS extrapolation residuals is better than the accuracy of prediction carried out by the IERS Sub-Bureau for Rapid Service and Prediction.
Related Documents