This is a repository copy of Land rents drive oil palm expansion dynamics in Indonesia.
White Rose Research Online URL for this paper:http://eprints.whiterose.ac.uk/148218/
Version: Published Version
Article:
Lim, F.K.S., Carrasco, R., McHardy, J. orcid.org/0000-0003-2441-7110 et al. (1 more author) (2019) Land rents drive oil palm expansion dynamics in Indonesia. Environmental Research Letters. ISSN 1748-9326
https://doi.org/10.1088/1748-9326/ab2bda
[email protected]://eprints.whiterose.ac.uk/
Reuse
This article is distributed under the terms of the Creative Commons Attribution (CC BY) licence. This licence allows you to distribute, remix, tweak, and build upon the work, even commercially, as long as you credit the authors for the original work. More information and the full terms of the licence here: https://creativecommons.org/licenses/
Takedown
If you consider content in White Rose Research Online to be in breach of UK law, please notify us by emailing [email protected] including the URL of the record and the reason for the withdrawal request.

Environmental Research Letters
ACCEPTED MANUSCRIPT • OPEN ACCESS
Land rents drive oil palm expansion dynamics in IndonesiaTo cite this article before publication: Felix K.S. Lim et al 2019 Environ. Res. Lett. in press https://doi.org/10.1088/1748-9326/ab2bda
Manuscript version: Accepted Manuscript
Accepted Manuscript is “the version of the article accepted for publication including all changes made as a result of the peer review process,and which may also include the addition to the article by IOP Publishing of a header, an article ID, a cover sheet and/or an ‘AcceptedManuscript’ watermark, but excluding any other editing, typesetting or other changes made by IOP Publishing and/or its licensors”
This Accepted Manuscript is © 2019 The Author(s). Published by IOP Publishing Ltd .
As the Version of Record of this article is going to be / has been published on a gold open access basis under a CC BY 3.0 licence, this AcceptedManuscript is available for reuse under a CC BY 3.0 licence immediately.
Everyone is permitted to use all or part of the original content in this article, provided that they adhere to all the terms of the licencehttps://creativecommons.org/licences/by/3.0
Although reasonable endeavours have been taken to obtain all necessary permissions from third parties to include their copyrighted contentwithin this article, their full citation and copyright line may not be present in this Accepted Manuscript version. Before using any content from thisarticle, please refer to the Version of Record on IOPscience once published for full citation and copyright details, as permissions may be required.All third party content is fully copyright protected and is not published on a gold open access basis under a CC BY licence, unless that isspecifically stated in the figure caption in the Version of Record.
View the article online for updates and enhancements.
This content was downloaded from IP address 143.167.29.34 on 09/07/2019 at 14:58

Land rents drive oil palm expansion dynamics in Indonesia1
Felix K.S. Lim1,2, L. Roman Carrasco3, Jolian McHardy4, David P. Edwards12
June 10, 20193
1School of Animal and Plant Sciences, University of Sheffield, United Kingdom;4
2Grantham Centre for Sustainable Futures, University of Sheffield, United Kingdom;5
3Department of Biological Sciences, National University of Singapore, Singapore;6
4Department of Economics, University of Sheffield, United Kingdom7
Corresponding author: [email protected]
Number of words: 41379
Number of words in Abstract: 19910
Running Title: Modelling Indonesian oil palm expansion11
Number of figures: 212
Number of references: 4113
1
Page 1 of 18 AUTHOR SUBMITTED MANUSCRIPT - ERL-107020.R1
1
2
3
4
5
6
7
8
9
10
11
12
13
14
15
16
17
18
19
20
21
22
23
24
25
26
27
28
29
30
31
32
33
34
35
36
37
38
39
40
41
42
43
44
45
46
47
48
49
50
51
52
53
54
55
56
57
58
59
60
Acc
epte
d M
anus
crip
t
Abstract14
Increasing global demand for oil palm drives its expansion across the tropics, at the expense of forests15
and biodiversity. Little is known of the dynamics that shape the spread of oil palm, limiting our potential to16
predict areas vulnerable to future crop expansion and its resulting biodiversity impacts. Critically, studies17
have not related oil palm expansion to the role of agricultural rent and profitability in explaining how and18
where oil palm is expected to expand. Using a novel land-rent modelling framework parameterised to19
oil palm expansion across Indonesia between 2000 to 2015, we identify drivers of crop expansion and20
evaluate whether Indonesia’s Forest Moratorium might reduce the rate of future oil palm expansion. With21
an overall accuracy of 85.84%, the model shows oil palm expansion is driven by price changes, spatial22
distribution of production costs, and a spatial contagion effect. Projecting beyond 2015, we show that areas23
under high risk of oil palm expansion are mostly not protected by the current Forest Moratorium. Our study24
emphasises the importance of economic forces and infrastructure on oil palm expansion. These results25
could be used for more effective conservation decisions to manage one of the biggest drivers of tropical26
biodiversity loss.27
Keywords28
Agricultural rent, conservation planning, cropland expansion, deforestation, Elaeis guineensis, Forest29
Moratorium30
2
Page 2 of 18AUTHOR SUBMITTED MANUSCRIPT - ERL-107020.R1
1
2
3
4
5
6
7
8
9
10
11
12
13
14
15
16
17
18
19
20
21
22
23
24
25
26
27
28
29
30
31
32
33
34
35
36
37
38
39
40
41
42
43
44
45
46
47
48
49
50
51
52
53
54
55
56
57
58
59
60
Acc
epte
d M
anus
crip
t

Introduction31
As the most widely traded vegetable oil and biofuel, oil palm (Elaeis guineensis Jacq.) is an important32
driver of land-use change across the tropics [1]. Globally, there has been a rapid increase in extent of33
oil palm plantations from 10.9 Mha in 2000 to 20.2 Mha in 2015 [2], with expansion linked to extensive34
deforestation, biodiversity loss, and environmental degradation, especially in Southeast Asia [3]–[5]. As35
global palm oil demand grows [6], we can expect greater pressure on remaining tropical forests and36
biodiversity. A crucial question, however, is which areas are most likely to be the focus of further oil37
palm expansion, and at what costs to the environment and biodiversity. To answer this, it is essential that38
we first understand the drivers that explain oil palm expansion across time and space.39
Our understanding of oil palm expansion has largely been based on environmental crop suitability and40
accessibility [7]–[10]. We also have an extensive understanding of spatial variation in oil palm suitability41
[1], [11], [12], and potential palm oil yields pan-tropically [13]. Studies examining oil palm expansion42
within the Neotropics also account for the influence of socio-economic factors or trade impacts on oil palm43
expansion across time and space [14], [15], relating expansion to market incentives and profits. A key44
research unknown is the role of agricultural rent — the potential economic returns from converting land45
to agriculture [16] — in explaining and predicting oil palm expansion. Land-use change for expansion46
of commercial crops is fundamentally economic [17] and driven by profitability, and it is thus important47
we have a better understanding of this relationship across both space and time. Knowing which areas48
are susceptible to land-use change and crop expansion could also inform conservation policies. Efforts49
managing oil palm expansion typically involve protecting vulnerable areas with high conservation value,50
via state intervention (e.g., establishing protected areas), or corporate action under certification schemes51
(e.g., the Roundtable on Sustainable Palm Oil).52
Here, we focus on Indonesia as the world’s largest producer and exporter of palm oil. The extent of oil palm53
plantations increased from 2 Mha in 2000 to 8.6 Mha in 2015 [2], and concurrently, Indonesia experienced54
6 Mha loss of primary intact and degraded lowland dipterocarp forests and peatland forests during this55
period, with annual deforestation steadily rising [18]. In 2010, Indonesia passed legislation protecting over56
69 Mha of primary forest and deep peatlands from land-use change under a Forest Moratorium, while57
allowing oil palm expansion across primary forests already licensed and forests degraded by logging [19],58
[20]. Incorporating an agricultural land rent approach, in relation to commodity prices, establishment costs59
3
Page 3 of 18 AUTHOR SUBMITTED MANUSCRIPT - ERL-107020.R1
1
2
3
4
5
6
7
8
9
10
11
12
13
14
15
16
17
18
19
20
21
22
23
24
25
26
27
28
29
30
31
32
33
34
35
36
37
38
39
40
41
42
43
44
45
46
47
48
49
50
51
52
53
54
55
56
57
58
59
60
Acc
epte
d M
anus
crip
t

and profitability into models of oil palm expansion, allows us to uniquely: (i) explain the factors driving the60
recent spread and current distribution of oil palm plantations across Indonesia; (ii) predict future oil palm61
expansion and any associated forest loss; and (iii) evaluate how effective Indonesia’s Forest Moratorium62
is at restricting future oil palm expansion into dryland and peat swamp forests.63
Methods64
Overview65
Using distribution maps of oil palm plantations across Indonesia for different time points spanning 2000 to66
2015, and spatial variation in potential oil palm yields, we built a model explaining oil palm expansion using67
an agricultural land rent approach. This model allows us to examine the spread of oil palm plantations68
both spatially — from variations in crop yields and market accessibility — and temporally — according69
to changes in palm oil prices and production costs. We then projected the extent of further oil palm70
expansion beyond 2015 based on hypothetical projections of future prices, and from which we predict the71
effectiveness of Indonesia’s Forest Moratorium.72
Data collection73
We obtained spatially explicit distributions of oil palm plantations, other land-use types and vegetation74
classes across Indonesia in 2000, 2010 and 2015 [21], [22]. These were mapped as grid cells, each75
representing an area of 250 m by 250 m. For each cell, we obtained information of potential palm oil76
yield across space [13] (Table S1). We also obtained information on the areas across Indonesia set aside77
for conservation from Indonesia’s Forest Moratorium [23], legally protected areas [24] and locations of oil78
palm concessions [25]. We restricted our analyses to cells with positive potential palm oil yields, and cells79
available for conversion to oil palm plantation from 2000, i.e., existing oil palm plantations, concessions80
and all vegetation types across lowlands [22]. Our model therefore did not permit oil palm expansion into81
cells within protected areas and other plantations. Because the spatial distribution of oil palm plantations82
was not distinguished from other plantations in the map for the year 2000, we determined the distribution of83
4
Page 4 of 18AUTHOR SUBMITTED MANUSCRIPT - ERL-107020.R1
1
2
3
4
5
6
7
8
9
10
11
12
13
14
15
16
17
18
19
20
21
22
23
24
25
26
27
28
29
30
31
32
33
34
35
36
37
38
39
40
41
42
43
44
45
46
47
48
49
50
51
52
53
54
55
56
57
58
59
60
Acc
epte
d M
anus
crip
t

oil palm plantations in 2000 as cells that were classified as plantations in 2000 and as oil palm plantations84
in 2010.85
We based yearly production costs attributed to labour on annual reports of mean monthly national86
minimum wages [26]. We also obtained yearly national prices of fuel [27], fertilisers, oil palm fresh fruit87
bunches and timber [2]. Prices were deflated to USD 2015 values, and yearly prices were used where88
available: when prices were not available, we assumed constant prices from the previous year (Table S1).89
Explaining the spread and current distribution of oil palm plantations90
We based our crop expansion model on variation in agricultural rent across space and time [16]. Here, the91
decision to convert a cell for palm oil production is based on whether the amount earned from agricultural92
and timber harvests outweighs the costs involved to convert and manage a plantation, and, exceeds93
a minimum threshold. This threshold represents the opportunity costs of other land uses, including94
conversion to other crops: rent exceeding this threshold indicates a cell is more likely to be converted95
into oil palm plantation over other land uses. Rent for a cell i in a single year is calculated as96
Renti = (yip+ w)− (f + l +yi
cvdi) (1)
where yi is the potential yield per hectare in cell i, p is the price of oil palm fruit bunches, and w represents97
revenue from sale of timber from first clearing the land, given a set timber harvest of 23.1 m3 per hectare98
[28]. f and l represent capital costs attributed to fertiliser and labour per hectare respectively, with labour99
requirement set constant at 43.6 man days per hectare [29]. yi
cvdi represents the cost (per hectare) of100
transporting fresh fruits, which we calculated from the number of trips needed given the yield yi and the101
maximum capacity of oil palm fruit bunches a truck can carry (c, assumed as 18 m3), fuel cost per driving102
hour v, and the travel time di to the nearest large city (with at least a population of 50,000), therefore a103
measure of accessibility (S1).104
For every cell i, we evaluated the rent net present value (NPV), i.e., the discounted sum of yearly105
agricultural rents across the lifespan of an oil palm plantation. The rent calculation from (1) is embedded106
within the formula for NPV given in equation (2), where t is a time index t ∈ [0, T ], with t = 0 as the base107
5
Page 5 of 18 AUTHOR SUBMITTED MANUSCRIPT - ERL-107020.R1
1
2
3
4
5
6
7
8
9
10
11
12
13
14
15
16
17
18
19
20
21
22
23
24
25
26
27
28
29
30
31
32
33
34
35
36
37
38
39
40
41
42
43
44
45
46
47
48
49
50
51
52
53
54
55
56
57
58
59
60
Acc
epte
d M
anus
crip
t

year for the plantation and T the final year in a crop cycle, and r is the discount rate.108
NPVi =T∑
0
Renti,t
(1 + r)t(2)
NPV was calculated based on a typical 25-year life cycle (T = 25) of an oil palm plantation, accounting for109
time taken for crops to mature: oil palm crops typically start producing fruits after the third year, therefore110
we only considered returns from the harvest of fruits (yip) from the fourth to twenty-fifth years. Because111
our analyses relied on spatial variation of potential yields, we were limited to assuming constant yearly112
agricultural output upon maturity to maintain average values, instead of varying with age. Timber sales113
(w) were recorded as a one-off gain in the first year (t = 0).114
Rent for each year t was discounted annually by a discount rate r, set at 10% following [30], [31], and115
NPV was derived from the summed discounted rents across all 25 years (2). We calculated the equivalent116
annual costs (EAC) of each cell i, i.e., the equivalent constant annual revenue that leads to a similar117
NPV value. Having calculated NPV and EAC for each cell in a given year, we then adjusted the EAC118
(EACadj), based on additional factors that could potentially influence the distribution and spread of oil119
palm plantations across time and space.120
EACadji = EACi − Pi − S ×Ai,t−1 −K (3)
K represents the minimum threshold rent needed to establish plantations, set constant across space and121
time. This includes the opportunity cost of capital, recognising the capital could have been invested122
elsewhere achieving some baseline profit. Pi adjusts EACi based on soil type, allowing for additional123
costs incurred from draining peat swamps prior to conversion. Finally, S accounts for adjustments in rent124
associated with the location of the cell in relation to existing oil palm plantations. This parameter captures125
the impact of local resources, labour skills and transport systems which result from having existing126
plantations in the area and which result in lower costs on the basis that the necessary infrastructure127
already established from neighbouring plantations would reduce costs of further expansion [8], [9], [32].128
S therefore relates to the proportion of cells devoted to oil palm surrounding each cell. Ai,t−1 refers to129
the percentage of plantation area within a buffer (set at 0.1 degrees) for cell i in period t − 1 to capture130
this potential accelerating factor in crop expansion, where higher percentages of existing plantations131
surrounding a cell relate to reduced establishment costs for that cell.132
6
Page 6 of 18AUTHOR SUBMITTED MANUSCRIPT - ERL-107020.R1
1
2
3
4
5
6
7
8
9
10
11
12
13
14
15
16
17
18
19
20
21
22
23
24
25
26
27
28
29
30
31
32
33
34
35
36
37
38
39
40
41
42
43
44
45
46
47
48
49
50
51
52
53
54
55
56
57
58
59
60
Acc
epte
d M
anus
crip
t
We fitted our model to land-use maps in 2000 and 2015, simulating spatial predictions of Indonesian oil133
palm expansion every year from 2001 to 2015 based on yearly changes in agricultural rent across space134
from 2001 to 2014. We assumed a one-year time lag between changes in prices and establishing a135
plantation. Although we incorporated yearly changes in prices, we assumed that investment decisions136
were based on expectations of future prices, allowing current prices to represent future expectations in137
real terms. Starting from 2001, we calculated EACadj for cells not classified as oil palm plantations,138
based on deflated prices of oil palm fruits, labour, fertiliser and fuel in that year. Cells whose agricultural139
rent exceeded the minimum threshold K (i.e., EACadji > 0) were considered economically viable for oil140
palm agriculture, and we simulated conversion to plantation. We then updated prices and distribution of141
existing plantations to re-evaluate agricultural rent across the remaining unconverted cells the following142
year (2002). We repeated this process every year until 2015 (S1).143
We determined parameter values that returned an outcome of oil palm expansion by 2015 with closest144
resemblance to the known distribution of oil palm plantations via an optimisation approach (S1), and across145
multiple iterations we selected as our fitted model the combination of parameter values that returned the146
highest recall, i.e., the highest average proportion of cells correctly predicted across both classes of oil147
palm plantations and non-plantations. This selects the model that produced the highest average proportion148
of both correctly predicted converted and unconverted cells. To determine magnitudes of the parameters149
and relationship of the spatial contagion effect, we repeated the optimisation process across different sets150
of models (i.e., ways of evaluating EACadj) and selected the model with the highest average recall as the151
final, best performing model (S1). We also compared our analyses with oil palm expansion models that152
only account for suitability and yield (S1).153
Due to computational limitations, models were fitted on a subset of cells stratified-randomly sampled154
across the total dataset (∼24,000 of 25,111,235 cells), ensuring the same proportion of cells across all155
provinces. Given the limitations of this single-crop expansion model, we did not model displacement156
of other crops by oil palm and, therefore, cells classified as other plantations were excluded from this157
analysis except where oil palm concessions had been awarded. Additionally, we did not account for oil158
palm abandonment due to the lack of spatial information of area and extent of abandoned fields. We159
validated our final model against a larger subset of the overall data (10%, ∼2,400,000 cells), and model160
performance was similarly evaluated by comparing the predicted with the observed distribution of oil palm.161
7
Page 7 of 18 AUTHOR SUBMITTED MANUSCRIPT - ERL-107020.R1
1
2
3
4
5
6
7
8
9
10
11
12
13
14
15
16
17
18
19
20
21
22
23
24
25
26
27
28
29
30
31
32
33
34
35
36
37
38
39
40
41
42
43
44
45
46
47
48
49
50
51
52
53
54
55
56
57
58
59
60
Acc
epte
d M
anus
crip
t

Projected future oil palm expansion and effectiveness of Indonesia’s Forest162
Moratorium163
Using projected palm oil prices from 2016 to 2025 [2], [33], while keeping all other costs at 2015 values,164
we ran our model forwards to determine areas susceptible to future expansion as palm oil prices vary and165
identified areas that become economically viable for oil palm expansion each subsequent year. In keeping166
other prices constant in real terms, our projections show the direct impact of oil palm prices on future oil167
palm expansion. Given our model only focuses on the spread of oil palm plantations, we do not examine168
future displacement of other crops by oil palm, and excluded other plantations from projections of oil palm169
expansion beyond 2015. From these projections, we identified the proportion of areas vulnerable to crop170
expansion that fall under protection by Indonesia’s 2011 Forest Moratorium.171
Results172
Explaining the spread and current distribution of oil palm plantations173
A land rent framework was more effective in explaining Indonesia’s oil palm expansion than just relying on174
suitability (S2). Of the models run, Model 4 performed best (average recall = 75.8%; S2) and was used for175
validation and projection. This model included a minimum threshold K of USD10,053 per hectare before176
a new plantation is established, adopting a discount rate of 10%. We also captured a spatial contagion177
effect in relation to agricultural rent: lower costs are incurred (S = USD987 per hectare) as the percentage178
of existing surrounding plantations increases, following a square-root relationship. We excluded additional179
costs of establishing plantations on peat soils in this model (i.e., P = USD0 per hectare). Considering180
an overall relationship across fifteen years, our model showed gradual increase in the area cleared for181
oil palm each year. As prices of oil palm fruits (relative to other costs) increased from 2000 to 2010, so182
did the extent of oil palm expansion into forests and peatlands. Additionally, with the spatial contagion183
process, even with the slight drop in fruit prices beyond 2011, the extent of oil palm plantations continued184
increasing.185
Against our validation data-points (10% of the total area), our model showed an overall accuracy of186
8
Page 8 of 18AUTHOR SUBMITTED MANUSCRIPT - ERL-107020.R1
1
2
3
4
5
6
7
8
9
10
11
12
13
14
15
16
17
18
19
20
21
22
23
24
25
26
27
28
29
30
31
32
33
34
35
36
37
38
39
40
41
42
43
44
45
46
47
48
49
50
51
52
53
54
55
56
57
58
59
60
Acc
epte
d M
anus
crip
t
85.84%. We correctly identified 70.07% of cells converted to plantations in 2015 (58,483 out of 83,460187
cells). Our model performed particularly well in Kalimantan, Jambi, Riau, North and West Sumatra (Figure188
1). The model also correctly identified 79.23% of peat swamps converted into oil palm plantations by 2015,189
particularly in Riau, North and West Sumatra (S4). The model could not identify 29.93% of the converted190
cells (24,977 out of 83,460 cells) as having agricultural rents high enough to establish plantations. Of191
these cells, 17,286 (69.2%) had been classified as other plantations in 2000 but converted to oil palm by192
2015, thus had not been detected by our model. Other cells were located within areas and provinces (e.g.,193
West Papua, East Kalimantan) with no detected oil palm plantations in 2000 (Figure 1).194
Our model also had a false positive rate of 13.53%, i.e., cells predicted to be economically profitable195
for conversion into plantations but were not classified as oil palm plantations in 2015 (Figure 1). These196
cells were mainly located within proximity to existing plantations, especially across provinces in Sumatra197
and Kalimantan. Of these cells, 50.49% were classified as plantations: while the returns from oil palm198
expansion was high, these areas had been converted to other crops instead (Figure S1). Provinces such199
as West Papua, Bengkulu, Jambi, and Southeast Sulawesi, for instance, showed high false positive rates200
(>65%, S4).201
Projected future oil palm expansion and effectiveness of Indonesia’s Forest202
Moratorium203
Keeping other costs constant at 2015 values and assuming no other land-use changes, the extent of oil204
palm plantations based on projected annual prices of oil palm fruits could grow by as much as 4.5 times205
by 2020 (Figure 2), and six times by 2025 (S5). Areas economically viable for further crop expansion206
were mainly located near existing oil palm plantations. Projected oil palm expansion was therefore207
highest across Sumatra and Kalimantan. Only 9.79% of the areas susceptible to oil palm expansion by208
2020 (10.27% by 2025) fall within Indonesia’s Forest Moratorium. 80.67% of natural areas (i.e., forests,209
peatlands and mangroves) vulnerable to oil palm expansion by 2020 (83.9% by 2025) were not protected210
by the Forest Moratorium (Table S5). Provinces like Riau, Papua and West Papua were better protected211
against oil palm expansion, with a higher proportion of areas with high agricultural rents by 2025 falling212
within the Forest Moratorium areas (0.22–0.27, Table S6). Conversely, within Kalimantan, large213
proportions of natural areas susceptible to expansion by 2025 were not protected by the Forest214
9
Page 9 of 18 AUTHOR SUBMITTED MANUSCRIPT - ERL-107020.R1
1
2
3
4
5
6
7
8
9
10
11
12
13
14
15
16
17
18
19
20
21
22
23
24
25
26
27
28
29
30
31
32
33
34
35
36
37
38
39
40
41
42
43
44
45
46
47
48
49
50
51
52
53
54
55
56
57
58
59
60
Acc
epte
d M
anus
crip
t
Moratorium (≥0.89, Table S6).215
Discussion216
Understanding oil palm expansion is key for improving environmental management via spatial planning.217
Studies have focused on oil palm suitability in explaining oil palm distribution and expansion, e.g., [10],218
[12], or incorporated the influence of socio-economic factors [15] and trade [14]. Expansion is, however,219
fundamentally economic [17], and we uniquely show how variations in agricultural rent — the costs and220
benefit from converting forestland as a factor of crop expansion — and a spatial contagion effect influence221
Indonesian oil palm expansion. Our approach accounts for both costs of plantation establishment and222
economic returns from agricultural harvests [16] through incorporating spatial variation in potential oil223
palm yield [13] and temporal variability in commodity prices. This provides a means of explaining oil palm224
expansion, i.e., companies (and smallholders) respond to changes in agricultural rent and profitability of225
conversion [16], [34]. Our findings emphasise the importance of economic forces and infrastructure on oil226
palm expansion, and provide a method for spatial zoning to manage oil palm expansion.227
Building on the land-rent framework [16], we found a high overall minimum threshold (K) needed to228
establish plantations, accounting for initial set-up costs and opportunity costs of other land uses. The rate229
and extent of oil palm expansion could, therefore, be influenced by the ability to withstand the initial230
losses incurred before plantations reach maturity. While we have kept the threshold (K) constant, we231
acknowledge that it could vary spatially and across years, as well as between companies and232
smallholders — some might be able to withstand initial losses more easily than others. We also identified233
an economic-driven spatial contagion process of oil palm expansion in proximity to existing plantations234
across Indonesia since 2000, supporting patterns of spatial dependence and clustering observed from235
remotely sensed data [22]. Other studies also emphasised the strong influence of proximity to existing236
plantations, typically including distance to the nearest existing plantation as a predictor for crop expansion237
[8], [9]. The spatial contagion effect builds on the von Thunen land rent approach [16], capturing238
fine-scale changes in agricultural rent associated with the presence of existing plantations, such as239
established infrastructure and an existing labour force. Spatial clustering of agricultural expansion is240
characteristic of agricultural expansion, via a positive feedback between prices, access to resources and241
10
Page 10 of 18AUTHOR SUBMITTED MANUSCRIPT - ERL-107020.R1
1
2
3
4
5
6
7
8
9
10
11
12
13
14
15
16
17
18
19
20
21
22
23
24
25
26
27
28
29
30
31
32
33
34
35
36
37
38
39
40
41
42
43
44
45
46
47
48
49
50
51
52
53
54
55
56
57
58
59
60
Acc
epte
d M
anus
crip
t

possibly land-use rules, increasing agricultural rent and likelihood of conversion at the local scale [32].242
While we have kept this effect constant, it could vary across provinces and across companies.243
Despite additional costs incurred from draining waterlogged peat swamps and other establishment costs244
[35], [36], there was little evidence of a large effect on overall costs incurred to convert peat swamp forests245
into plantations. Land concessions on peat soils are awarded to large-scale oil palm estates [18], [35], and246
therefore, the additional establishment costs associated with peat soils might incur less of a cost barrier247
than expected. Clearing and draining peatlands for agriculture is associated with higher carbon emissions248
[3], [10] and increased risk of fire. As Indonesia launches its new initiative to restore degraded peatlands,249
it is therefore important we also consider which peatlands are at greater risk of conversion and require250
increased protection.251
Against our model projections, only a small proportion of forests vulnerable to future expansion due to252
high land rents would be protected under Indonesia’s Forest Moratorium. These results confirm Sloan,253
Edwards, and Laurance [37] who identified low additionality of dryland (dipterocarp dry) forest254
conservation from the Forest Moratorium due to low association with areas of heavy land use, and255
Sumarga and Hein [8] that noted minimal contribution from the Forest Moratorium to reduce oil palm256
expansion and loss of ecosystem services within Kalimantan. The Forest Moratorium was established as257
a means of reducing land-use change in the immediate future, but with little overlap with areas258
susceptible to oil palm expansion, it fails to protect remaining forests and peat swamps against immediate259
crop expansion, suggesting its additionality is questionable.260
Our oil palm expansion model has three core limitations. First, our model is dependent on spatial and261
temporal accuracies of past and present oil palm distribution, potential yield, yearly national data of prices262
and costs. Inaccuracies in the data could manifest in erroneous predictions of expansion. For instance,263
while we have used the most accurate land-use maps of Southeast Asia to date [21], [22] and reliable264
predictions of potential palm yield [13], we are unable to distinguish between industrial plantations and265
smallholders.266
Second, the model excludes factors related to land tenure (including property rights), subsidies, land267
management, spatial variations in governance, aspects of the political economy, and company-level capital268
assets [5], [38]. Crop expansion attributed to regional-level effects, e.g., government decisions, were269
not considered in this study [39]. We also did not consider infrastructure of palm oil mills, road-building270
11
Page 11 of 18 AUTHOR SUBMITTED MANUSCRIPT - ERL-107020.R1
1
2
3
4
5
6
7
8
9
10
11
12
13
14
15
16
17
18
19
20
21
22
23
24
25
26
27
28
29
30
31
32
33
34
35
36
37
38
39
40
41
42
43
44
45
46
47
48
49
50
51
52
53
54
55
56
57
58
59
60
Acc
epte
d M
anus
crip
t
decisions and government policies of investment in new areas (e.g. Papua). This likely explains why our271
model could not identify oil palm expansion in regions without prior plantations in 2000, and the increased272
probability of forest conversion across Papua. Institutional decisions to begin establishing plantations273
within a region are difficult to predict and not determined by land rent or spatial contagion effect. Similarly,274
due to data paucity, we could not account for fine-scale responses to local policies, tax and tenure regimes,275
local-scale management, and company-level capital assets that determine the extent to which a company276
can afford to pursue longer-term goals and tolerate short-term losses across space and time. This suggest277
we might underestimate the capacity of actors with high capital assets to invest and expand in remote278
areas where rents would be initially low.279
Third, we only modelled expansion of a single crop without considering competing land-uses. Our280
projections of future expansion only considers a single land use, keeping all other costs constant.281
Accounting for displacement and leakage of other crops would help us to better understand the overall282
extent of land-use change and environmental impacts. Quantifying and modelling displacement, however,283
is challenging, and requires establishing firm causal links between substitution of one crop in one place284
and its expansion in another [34]. Nevertheless, despite its simplicity, our model captures the salient285
dynamics of oil palm expansion in Indonesia.286
As global demands for palm oil continue to rise with population and affluence, the probability of further287
oil palm expansion and forest loss is imminent. With oil palm estates expanding across Africa [40] and288
the Neotropics [11], [14], [15], our work offers a stepping stone for future studies to understand oil palm289
expansion in other regions and at a global scale. Given the role of commodity prices in explaining crop290
expansion, it is important that future studies also consider price feedbacks to changes in palm oil supply291
[41].292
Conclusion293
Using knowledge of the spatial distribution of oil palm plantations and temporal changes in costs and294
revenues, we show a land rent approach explains Indonesia’s oil palm spread over a fifteen-year period.295
We also identified a spatial contagion effect: areas with greater extent of existing plantations might296
experience greater crop expansion. Considering the simplicity of our model, we were able to correctly297
12
Page 12 of 18AUTHOR SUBMITTED MANUSCRIPT - ERL-107020.R1
1
2
3
4
5
6
7
8
9
10
11
12
13
14
15
16
17
18
19
20
21
22
23
24
25
26
27
28
29
30
31
32
33
34
35
36
37
38
39
40
41
42
43
44
45
46
47
48
49
50
51
52
53
54
55
56
57
58
59
60
Acc
epte
d M
anus
crip
t

predict 79% of past oil palm expansion. As global palm oil demands continue to rise, our model allows us298
to make spatially explicit projections of future crop expansion, highlighting provinces of immediate concern299
to forest loss. Importantly, we found little contribution from Indonesia’s Forest Moratorium to protect forests300
from immediate oil palm expansion, exacerbating the global carbon and biodiversity crises. Understanding301
the economic forces driving this expansion, we can prioritise conservation interventions and reduce the302
impacts of crop expansion on carbon emissions and biodiversity loss.303
Acknowledgements304
F.K.S.L. acknowledges a PhD scholarship and support from the Grantham Centre for Sustainable Futures.305
The authors would also like to thank the two Reviewers and Manoela M. Mollinari for their feedback which306
greatly improved its clarity and presentation of this article.307
Figure Captions308
Figure 1. Performance of oil palm expansion model across Indonesia between 2000 and 2015, validated309
against a stratified random sample (10%) of cells (250 by 250 m) spanning all provinces (n= 2,242,417).310
Across known oil palm plantations, the model was 70.07% successful in identifying cells as economically311
viable/profitable to convert into plantation (yellow), while 29.93% of the oil palm plantations (red) were not312
identified as having rents high enough to be converted. Of the cells not classified as oil palm plantations313
in 2015, the model predicted 13.53% were profitable for oil palm expansion during that time (blue): these314
cells were either converted to other plantations (S1) or remained as forests and peatlands. The remaining315
cells (grey) were correctly identified as not having rents high enough to establish plantations.316
Figure 2. 2020 Model projections of areas susceptible to further oil palm expansion (shown in brown) as317
prices of oil palm fruits increase, based on agricultural rents and spatial distribution of oil palm plantations318
in 2015 (blue). Projections were conducted on a sample (10%) of cells deemed suitable for crop expansion,319
including existing plantations, natural areas and other plantations. Agricultural rents were evaluated from320
projected prices of palm oil from 2016 to 2020, while keeping other costs constant at 2015 values.321
13
Page 13 of 18 AUTHOR SUBMITTED MANUSCRIPT - ERL-107020.R1
1
2
3
4
5
6
7
8
9
10
11
12
13
14
15
16
17
18
19
20
21
22
23
24
25
26
27
28
29
30
31
32
33
34
35
36
37
38
39
40
41
42
43
44
45
46
47
48
49
50
51
52
53
54
55
56
57
58
59
60
Acc
epte
d M
anus
crip
t

Figure 1: Performance of oil palm expansion model across Indonesia between 2000 and 2015, validated against a stratified random sample (10%)
of cells (250 by 250 m) spanning all provinces (n= 2,242,417). Across known oil palm plantations, the model was 70.07% successful in identifying
cells as economically viable/profitable to convert into plantation (yellow), while 29.93% of the oil palm plantations (red) were not identified as having
rents high enough to be converted. Of the cells not classified as oil palm plantations in 2015, the model predicted 13.53% were profitable for oil palm
expansion during that time (blue): these cells were either converted to other plantations (S1) or remained as forests and peatlands. The remaining
cells (grey) were correctly identified as not having rents high enough to establish plantations.
14
Pa
ge
14
of 1
8A
UT
HO
R S
UB
MIT
TE
D M
AN
US
CR
IPT
- ER
L-1
07
02
0.R
1
12345678910
11
12
13
14
15
16
17
18
19
20
21
22
23
24
25
26
27
28
29
30
31
32
33
34
35
36
37
38
39
40
41
42
43
44
45
46
47
48
49
50
51
52
53
54
55
56
57
58
59
60
Accepted Manuscript
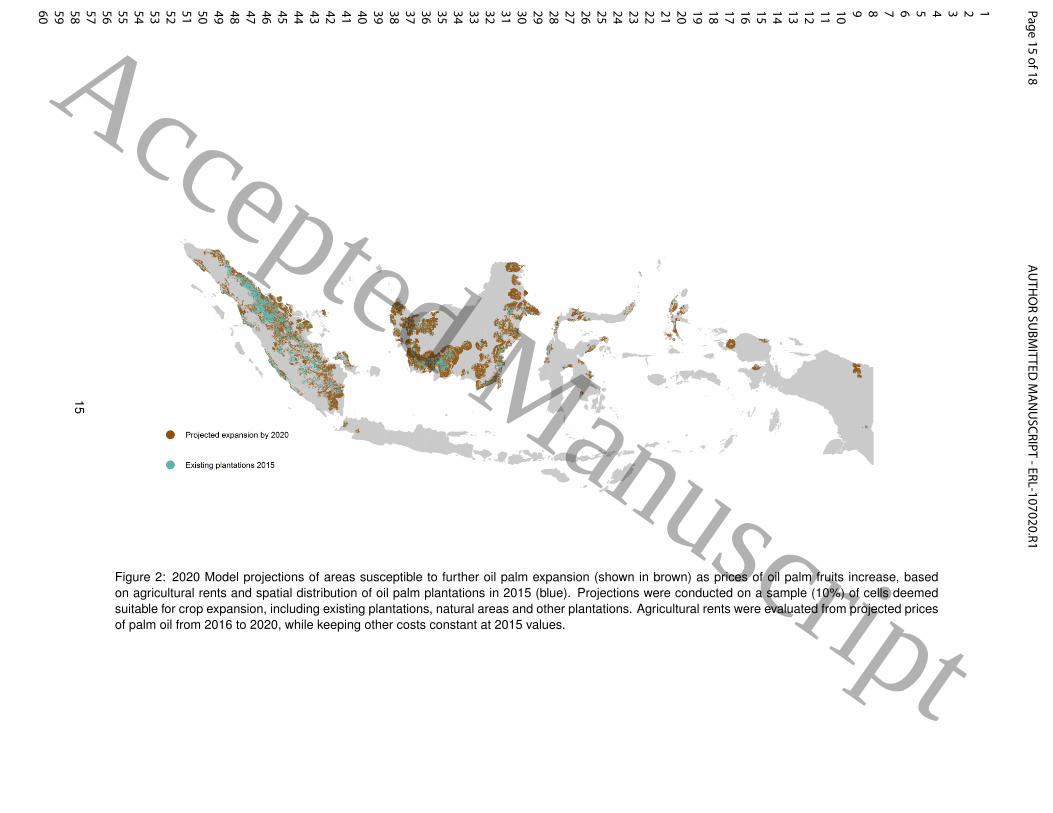
Figure 2: 2020 Model projections of areas susceptible to further oil palm expansion (shown in brown) as prices of oil palm fruits increase, based
on agricultural rents and spatial distribution of oil palm plantations in 2015 (blue). Projections were conducted on a sample (10%) of cells deemed
suitable for crop expansion, including existing plantations, natural areas and other plantations. Agricultural rents were evaluated from projected prices
of palm oil from 2016 to 2020, while keeping other costs constant at 2015 values.
15
Pa
ge
15
of 1
8A
UT
HO
R S
UB
MIT
TE
D M
AN
US
CR
IPT
- ER
L-1
07
02
0.R
1
12345678910
11
12
13
14
15
16
17
18
19
20
21
22
23
24
25
26
27
28
29
30
31
32
33
34
35
36
37
38
39
40
41
42
43
44
45
46
47
48
49
50
51
52
53
54
55
56
57
58
59
60
Accepted Manuscript
References322
[1] E. Meijaard, J. Garcia-Ulloa, D. Sheil, S. Wich, K. Carlson, D. Juffe-Bignoli, and T. Brooks, “Oil palm323
and biodiversity: a situation analysis by the IUCN Oil Palm Task Force,” Tech. Rep., Jun. 2018.324
[2] FAO, Food and Agriculture Organization of the United Nations Statistics Division, 2019.325
[3] C. Dislich, A. C. Keyel, J. Salecker, Y. Kisel, K. M. Meyer, M. Auliya, A. D. Barnes, M. D. Corre,326
K. Darras, H. Faust, B. Hess, S. Klasen, A. Knohl, H. Kreft, A. Meijide, F. Nurdiansyah, F. Otten,327
G. Pe’er, S. Steinebach, S. Tarigan, M. H. Tolle, T. Tscharntke, and K. Wiegand, “A review of328
the ecosystem functions in oil palm plantations, using forests as a reference system,” Biological329
Reviews, vol. 92, no. 3, pp. 1539–1569, Aug. 2017, ISSN: 1469185X.330
[4] D. S. Wilcove, X. Giam, D. P. Edwards, B. Fisher, and L. P. Koh, “Navjot’s nightmare revisited:331
logging, agriculture, and biodiversity in Southeast Asia.,” Trends in ecology & evolution, vol. 28,332
no. 9, pp. 531–40, Sep. 2013, ISSN: 1872-8383.333
[5] E. B. Fitzherbert, M. J. Struebig, A. Morel, F. Danielsen, C. A. Bruhl, P. F. Donald, and B. Phalan,334
“How will oil palm expansion affect biodiversity?” Trends in ecology & evolution, vol. 23, no. 10,335
pp. 538–45, Oct. 2008, ISSN: 0169-5347.336
[6] R. Corley, “How much palm oil do we need?” Environmental Science & Policy, vol. 12, no. 2,337
pp. 134–139, Apr. 2009, ISSN: 14629011.338
[7] K. G. Austin, A. Mosnier, J. Pirker, I. McCallum, S. Fritz, and P. S. Kasibhatla, “Shifting patterns of oil339
palm driven deforestation in Indonesia and implications for zero-deforestation commitments,” Land340
Use Policy, vol. 69, pp. 41–48, Dec. 2017.341
[8] E. Sumarga and L. Hein, “Benefits and costs of oil palm expansion in Central Kalimantan, Indonesia,342
under different policy scenarios,” Regional Environmental Change, vol. 16, no. 4, pp. 1011–1021,343
Apr. 2016, ISSN: 1436378X.344
[9] K. G. Austin, P. S. Kasibhatla, D. L. Urban, F. Stolle, and J. Vincent, “Reconciling oil palm expansion345
and climate change mitigation in Kalimantan, Indonesia,” PLoS ONE, vol. 10, no. 5, B. Poulter, Ed.,346
e0127963, May 2015, ISSN: 19326203.347
[10] K. M. Carlson, L. M. Curran, D. Ratnasari, A. M. Pittman, B. S. Soares-Filho, G. P. Asner, S. N. Trigg,348
D. A. Gaveau, D. Lawrence, and H. O. Rodrigues, “Committed carbon emissions, deforestation, and349
community land conversion from oil palm plantation expansion in West Kalimantan, Indonesia.,”350
Proceedings of the National Academy of Sciences of the United States of America, vol. 109, no. 19,351
pp. 7559–64, May 2012, ISSN: 1091-6490.352
[11] V. Vijay, S. L. Pimm, C. N. Jenkins, and S. J. Smith, “The Impacts of oil palm on recent deforestation353
and biodiversity loss,” PLoS ONE, vol. 11, no. 7, M. Anand, Ed., pp. 1–19, Jul. 2016, ISSN: 1932-354
6203.355
[12] P. Gunarso, M. E. Hartoyo, F. Agus, and T. J. Killeen, “Oil Palm and Land Usge Change in Indonesia,356
Malaysia and Papua New Guinea. Reports from the Technical Panels of the 2nd Greenhouse357
Gas Working Group of the Roundtable on Sustainable Palm Oil (RSPO),” pp. 29–64, 2013, ISSN:358
20476302.359
[13] J. Pirker, A. Mosnier, F. Kraxner, P. Havlık, and M. Obersteiner, “What are the limits to oil palm360
expansion?” Global Environmental Change, vol. 40, pp. 73–81, 2016, ISSN: 09593780.361
[14] P. R. Furumo and T. M. Aide, “Characterizing commercial oil palm expansion in Latin America: Land362
use change and trade,” Environmental Research Letters, vol. 12, no. 2, p. 024 008, Feb. 2017, ISSN:363
17489326.364
[15] C. Castiblanco, A. Etter, and T. M. Aide, “Oil palm plantations in Colombia: a model of future365
expansion,” Environmental Science & Policy, vol. 27, pp. 172–183, Mar. 2013, ISSN: 14629011.366
16
Page 16 of 18AUTHOR SUBMITTED MANUSCRIPT - ERL-107020.R1
1
2
3
4
5
6
7
8
9
10
11
12
13
14
15
16
17
18
19
20
21
22
23
24
25
26
27
28
29
30
31
32
33
34
35
36
37
38
39
40
41
42
43
44
45
46
47
48
49
50
51
52
53
54
55
56
57
58
59
60
Acc
epte
d M
anus
crip
t
[16] A. Angelsen, “Policies for reduced deforestation and their impact on agricultural production.,”367
Proceedings of the National Academy of Sciences of the United States of America, vol. 107,368
no. 46, pp. 19 639–44, Nov. 2010, ISSN: 1091-6490.369
[17] P. R. Armsworth, G. C. Daily, P. Kareiva, and J. N. Sanchirico, “Land market feedbacks can370
undermine biodiversity conservation.,” Proceedings of the National Academy of Sciences of the371
United States of America, vol. 103, no. 14, pp. 5403–8, 2006, ISSN: 0027-8424.372
[18] B. A. Margono, P. V. Potapov, S. Turubanova, F. Stolle, and M. C. Hansen, “Primary forest cover loss373
in indonesia over 2000-2012,” Nature Climate Change, vol. 4, no. 8, pp. 730–735, Jun. 2014, ISSN:374
17586798.375
[19] J. Busch, K. Ferretti-Gallon, J. Engelmann, M. Wright, K. G. Austin, F. Stolle, S. Turubanova, P. V.376
Potapov, B. Margono, M. C. Hansen, and A. Baccini, “Reductions in emissions from deforestation377
from Indonesia’s moratorium on new oil palm, timber, and logging concessions,” Proceedings of the378
National Academy of Sciences, vol. 112, no. 5, pp. 1328–1333, Feb. 2015, ISSN: 0027-8424.379
[20] S. Sloan, “Indonesia’s moratorium on new forest licenses: An update,” Land Use Policy, vol. 38,380
pp. 37–40, May 2014, ISSN: 02648377.381
[21] J. Miettinen, C. Shi, W. J. Tan, and S. C. Liew, “2010 land cover map of insular Southeast Asia382
in 250-m spatial resolution,” Remote Sensing Letters, vol. 3, no. 1, pp. 11–20, Jan. 2012, ISSN:383
2150704X.384
[22] J. Miettinen, C. Shi, and S. C. Liew, “2015 Land cover map of Southeast Asia at 250 m spatial385
resolution,” Remote Sensing Letters, vol. 7, no. 7, pp. 701–710, Jul. 2016, ISSN: 21507058.386
[23] WRI, Indonesia forest moratorium, 2017.387
[24] Ministry of Forestry, Indonesia legal classifications, 2010.388
[25] WRI, Indonesia oil palm concessions, 2012.389
[26] ILO, International Labour Organisation Statistics Division, 2017.390
[27] GIZ, International fuel prices, 2014.391
[28] FAO, “Asia-Pacific forestry sector outlook study II: Indonesia forestry outlook study,” 2009.392
[29] R. Corley and P. Tinker, The Oil Palm. Chichester, UK: John Wiley & Sons, Ltd, Nov. 2015, ISBN:393
9781118953297.394
[30] E. Sumarga, L. Hein, B. Edens, and A. Suwarno, “Mapping monetary values of ecosystem services395
in support of developing ecosystem accounts,” Ecosystem Services, vol. 12, pp. 71–83, Apr. 2015,396
ISSN: 22120416.397
[31] S. Irawan, L. Tacconi, and I. Ring, “Stakeholders’ incentives for land-use change and REDD+: The398
case of Indonesia,” Ecological Economics, vol. 87, pp. 75–83, Mar. 2013, ISSN: 09218009.399
[32] R. D. Garrett, E. F. Lambin, and R. L. Naylor, “The new economic geography of land use change:400
Supply chain configurations and land use in the Brazilian Amazon,” Land Use Policy, vol. 34,401
pp. 265–275, Sep. 2013, ISSN: 02648377.402
[33] OECD/FAO, OECD - FAO agricultural outlook 2018-2027. Paris: OECD Publishing, 2018, ISBN:403
9788578110796. arXiv: arXiv:1011.1669v3.404
[34] P. Meyfroidt, K. M. Carlson, M. E. Fagan, V. H. Gutierrez-Velez, M. N. Macedo, L. M. Curran, R. S.405
DeFries, G. A. Dyer, H. K. Gibbs, E. F. Lambin, D. C. Morton, and V. Robiglio, “Multiple pathways406
of commodity crop expansion in tropical forest landscapes,” Environmental Research Letters, vol. 9,407
no. 7, p. 074 012, Jul. 2014, ISSN: 1748-9326.408
[35] J. S. H. Lee, S. Abood, J. Ghazoul, B. Barus, K. Obidzinski, and L. P. Koh, “Environmental impacts409
of large-scale oil palm enterprises exceed that of smallholdings in Indonesia,” Conservation Letters,410
vol. 7, no. 1, pp. 25–33, Jan. 2014, ISSN: 1755263X.411
17
Page 17 of 18 AUTHOR SUBMITTED MANUSCRIPT - ERL-107020.R1
1
2
3
4
5
6
7
8
9
10
11
12
13
14
15
16
17
18
19
20
21
22
23
24
25
26
27
28
29
30
31
32
33
34
35
36
37
38
39
40
41
42
43
44
45
46
47
48
49
50
51
52
53
54
55
56
57
58
59
60
Acc
epte
d M
anus
crip
t

[36] S. Budidarsono, A. Rahmanulloh, and M. Sofiyuddin, Economics assessment of palm oil production,412
2012.413
[37] S. Sloan, D. P. Edwards, and W. F. Laurance, “Does Indonesia’s REDD+ moratorium on new414
concessions spare imminently threatened forests?” Conservation Letters, vol. 5, no. 3,415
pp. 222–231, Jun. 2012, ISSN: 1755263X.416
[38] J. F. McCarthy and R. A. Cramb, “Policy narratives, landholder engagement, and oil palm expansion417
on the Malaysian and Indonesian frontiers,” Geographical Journal, vol. 175, no. 2, pp. 112–123, Jun.418
2009, ISSN: 00167398.419
[39] M. Euler, M. P. Hoffmann, Z. Fathoni, and S. Schwarze, “Exploring yield gaps in smallholder oil palm420
production systems in eastern Sumatra, Indonesia,” Agricultural Systems, vol. 146, pp. 111–119,421
Jul. 2016, ISSN: 0308521X.422
[40] G. Strona, S. D. Stringer, G. Vieilledent, Z. Szantoi, J. Garcia-Ulloa, and S. A. Wich, “Small room423
for compromise between oil palm cultivation and primate conservation in Africa,” Proceedings of the424
National Academy of Sciences, vol. 115, no. 35, p. 201 804 775, Aug. 2018, ISSN: 0027-8424.425
[41] F. K. Lim, L. R. Carrasco, J. McHardy, and D. P. Edwards, Perverse Market Outcomes from426
Biodiversity Conservation Interventions, Jan. 2017.427
18
Page 18 of 18AUTHOR SUBMITTED MANUSCRIPT - ERL-107020.R1
1
2
3
4
5
6
7
8
9
10
11
12
13
14
15
16
17
18
19
20
21
22
23
24
25
26
27
28
29
30
31
32
33
34
35
36
37
38
39
40
41
42
43
44
45
46
47
48
49
50
51
52
53
54
55
56
57
58
59
60
Acc
epte
d M
anus
crip
t