L AD-R148 564 NO-SLUMP ROLLER-COMPACTED CONCRETE (RCC) FOR USE IN i/IMASS CONCRETE CONSTRUCTION(U) ARMY ENGINEER MATERWAYSEXPERIMENT STATION VICKSBURG MS STRUC.. K L SRUCIER
UNCLASSIFIED OCT 84 WES/TR/SL-84-17 F/G 11/2 NLEm--Em.-.
IEM
.1.
-, Igo
liii 1.1 E4O 1.8
111125 11ii. 61 .
MICROCOPY RESOLUTION TEST CHART
NATIONAL BUREAU O. STANOARDOS -93 -A
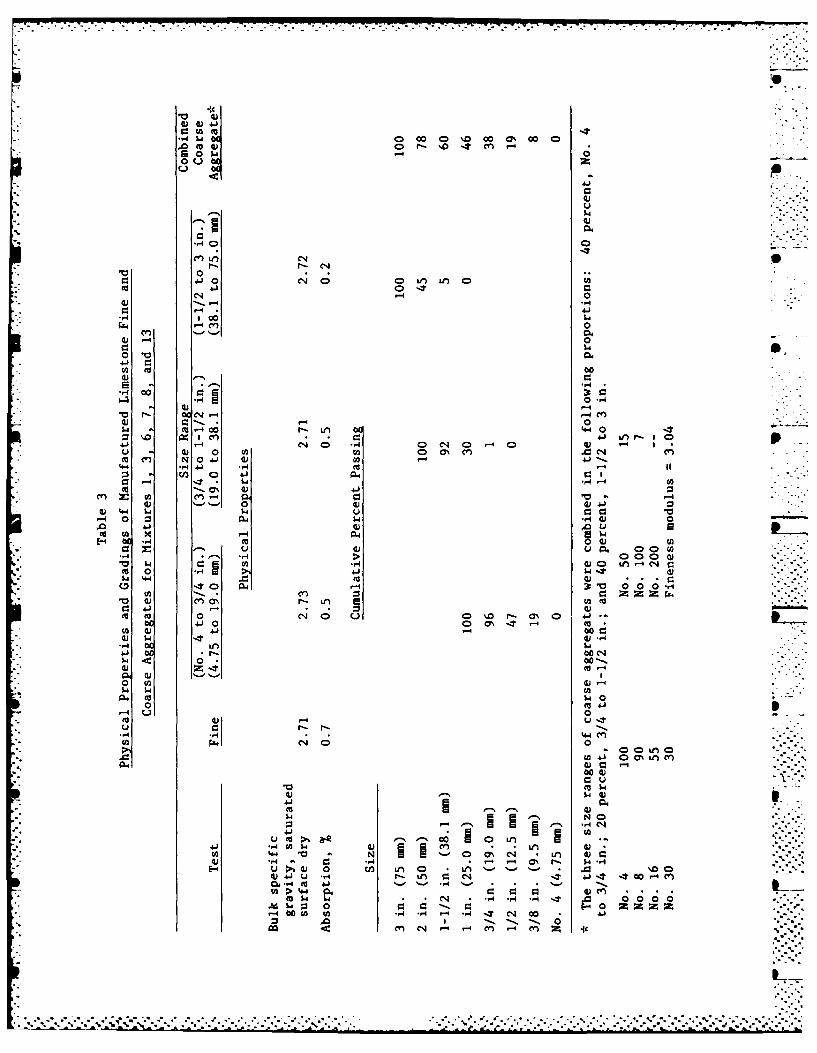
-1°
. . . . . . . . . . . . . . . . . . . . . . . . . . .. . _ .~ _ . - . .
• " , - i - . - . - ~ -o
. • . . - . ' . -.-... . ... . .."" " - * ". ° - ° ".* "\"' ". .. ' .* " .' -.. . " - . " " - , . ' . % - ° o % ." °. "
. . . .."" ." " * " • ° - . ° -
lug. I TECHNICAL REPORT SL-84-17 ~ .S -- NO-SLUMP ROLLER-COMPACTED
CONCRETE (RCC) FOR USE INMASS CONCRETE CONSTRUCTION
by
Kenneth L. Saucier
Structures Laboratory
(0 DEPARTMENT OF THE ARMYIt) Waterways Experiment Station, Corps of Engineers
P0 Box 631Vicksburg, Mississippi 39180-0631
DTIIOctober 1984
B%Prepared for DEPARTMENT OF THE ARMY9
US Army Corps of Engineers61 MIWashington, DC 20314-1000LAUORTORYunder CWR Work Unit 31240
84 1.2 05 028~
Unclassified
SCURITY CLASSIFICATtON OF THtS PAGEW bh DMa Zutoerd)
20. ABSTRACT (Continued). I
.11(c) determine methods of improving hardened lifts joints, (d) determine therelative frost resistance of RCC, (e) evaluate the erosion susceptibility,
.- "J and (f) discover economical methods of obtaining void-free vertical surfaces.
Indications are that: (a) the curb concrete is a viable method of form-ing and containing RCC; (b) the degree of compaction achieved is dependent onthe stiffness and the paste content of the mixture, the lift thickness, and
the individual roller; (c) the tensile strength of the untreated joints in-creased with paste content and quality from approximately 25 percent for rela-tively lean RCC to approximately 50 percent for richer RCC; (d) erosion resis-tance at 35-ft/sec fluid velocity of RCC is good; (e) resistance to freezingand thawing of the RCC is poor, apparently due to a poor air void system; and(f) surface treatment with a mortar gun (shotcrete) appears to be a practicalmethod to achieve smooth vertical surfaces.,,,
'.4
'. 4"
UnclassifiedSECURITY CLASSIFICATION OF T14IS PAGE(When Oh,. EnIer*d)
-' .** ,**...*.." ,.. -. **.*"

PREFACE
The investigation reported herein was authorized by a letter dated
* 24 April 1975 from the Office, Chief of Engineers, U. S. Army, in response to
* a US Army Engineer Waterways Experiment Station (WES) letter dated 19 March
1975, subject: Project Plan for Investigation of No-Slump Roller-Compacted
Concrete (CWR Work Unit 31240). The Technical Monitor for this investigation
was Mr. Fred Anderson, DAEN-ECE-DC.
The investigation was conducted during the period 1975 to 1981 at the
* Structures Laboratory (SL), WES, under the supervision of Messrs. Bryant
Mather, Chief, SL, and John M. Scanlon, Chief, Concrete Technology Division.
* Mr. Kenneth L. Saucier was the project leader and prepared this report.
Commanders and Directors of WES during this investigation and the prep-
aration of this report were COL John L. Cannon, CE, COL Nelson P. Conover, CE,
* and COL Tilford C. Creel, CE. Technical Director was Mr. F. R. Brown.
Accession For
NTSGRANIDT1C' TRn F
J"..
Dist
C - .. .4
-i
C~* C.*.C. .." .'...'..

CONTENTS
Page
PREFACE .. ..................................
*CONVERSION FACTORS, NON-SI TO SI (METRIC) UNITS OF MEASUREMENT . . . . 3
*PART I: INTRODUCTION .. .......................... 4
Background . ....... ...................... 4Purpose .. .............................. 5Scope .. ....... ........................ 5
PART II: MATERIALS, EQUIPMENT, AND TESTS. ............ ..... 6
Materials .. ............................. 6Equipment .. ............................. 6Tests .. ............................... 8
PART III: RESULTS. ............................ 13
Mixture Proportioning .. ....................... 13Tests of Fresh Joints .. ....................... 19Tests of Cold Joints. ........................ 19Moisture-Density Relationships. ................... 20Erosion Tests. .......... ................. 21Surface Treatment. ......... ................ 21Freezing and Thawing Resistance .. .................. 21
PART IV: CONCLUSIONS. ......... ................. 25
REFERENCES ........ ........................ 26
TABLES 1-12
2

CONVERSION FACTORS, NON-SI TO SI (METRIC)UNITS OF MEASUREMENT
Non-SI units of measurement used in this report can be converted to SI
(metric) units as follows:
Multiply By To Obtain - ".*
cubic feet 0.02831685 cubic metres S
degrees 0.01745329 radians
feet 0.3048 metres
feet per second 0.3048 metres per second
horsepower (550 ft-lbf/sec) 745.6999 watts
*inches 25.4 millimetres
pounds (force) 4.447 newtons
pounds (mass) 0.4535924 kilograms
pounds (mass) per cubic foot 16.01846 kilograms per cubic metre .
pounds (mass) per cubic yard 0.5932764 kilograms per cubic metre
pounds (force) per square inch 6.894757 kilopascals
square feet 0.09290304 square metres
tons (2000 lb) 907.1847 kilograms
3 .-. *
S * -o-. s .
NO-SLUMP ROLLER-COMPACTED CONCRETE (RCC) FOR
USE IN MASS CONCRETE CONSTRUCTION
PART I: INTRODUCTION
Background
1. The cost of concrete construction is continually rising. Recent
proposals indicate that if the present conventional methods of placing mass
concrete were changed, considerable savings in construction costs could be re-
alized. The use of no-slump concrete and embankment techniques (i.e., a bull-
dozer to level the concrete and a vibratory roller to externally consolidate
the concrete) would permit a significant cost reduction (Camellerie 1974).
2. No-slump concrete is concrete having no slump but containing the
minimum amount of water necessary to achieve consolidation with a vibrating
roller. It is anticipated that such a concrete mixed and placed in large vol-
umes would result in moderate savings in cement cost and significant savings
in labor cost required for consolidation of conventional mass concrete. Most
promising applications appear to be for use in construction of mass sections
or as a foundation or pavement slab.
3. Results of a previous investigation using earth compaction methods
(15-ton* vibratory roller) have been reported by the Tennessee Valley Author-
ity (Cannon 1972). Tests at the U. S. Army Engineer Waterways Experiment Sta-
tion (WES) demonstrated the feasibility of mixing, hauling, spreading, level-
ing, and compacting no-slump concrete for a massive section (Tynes 1973).
Additional studies indicated that the RCC technique could be adapted to cer-
tain types of paving construction (Burns 1976). Results of tests on drilled
core specimens indicated that the unit weight and strength properties of the
concrete were the equal of conventionally placed concrete.
4. Studies by Hall and Houghton (1974) at the Lost Creek Dam site
proved the practicality of application of RCC to a mass concrete project. The
first full-scale use of RCC in mass concrete construction in the United States
*A table of factors for converting non-SI units of measurement to SI(metric) units is presented on page 3.
4
occurred with the completion of Willow Creek Dam in Oregon in 1982 (U. S. Army . ...... .--
Engineer District, Walla Walla, 1983).
Purpose
5. The objective of the investigation reported herein was to study the
problems associated with the use of no-slump RCC for mass concrete construc-
tion and investigate possible solutions for problems encountered. 0
Scope
6. Tests were conducted to: (a) optimize mixtures for application of
no-slump techniques, (b) develop a consistency and quality control technique,
(c) determine methods of improving hardened lift joints, (d) determine the
relative frost resistance of RCC, (e) evaluate the erosion susceptibility,
and (f) discover economical methods of obtaining void-free vertical surfaces.
5
.... ...~. . . . . . . . . . . . . . . . . . . . . . .. . ..
. . . . . . . . . . . . . . . . . . . . . . . . ...- ,..,,..b
PART II: MATERIALS, EQUIPMENT, AND TESTS
Materials
Portland cement
7. A Type II portland cement (RC-705) from Alabama was used in all mix-
tures; the chemical and physical properties of the cement are presented in
Table 1.
Fly ash
8. A fly ash meeting the requirements of CRD-C 255 (ASTM C 618) (U. S.
Army Engineer Waterways Experiment Station 1949) for Class F was used in sev-
eral mixtures. The chemical and physical properties of fly ash are given in
Table 2.
Aggregates
9. The limestone fine (CRD MS-27) and coarse (CL-2 G-1) aggregates were
obtained from Alabama. The natural fine and coarse aggregates were obtained
locally. The physical properties and gradings of the aggregates used for spe-
cific mixtures are given in Tables 3-6.
Equipment
Vibratory roller
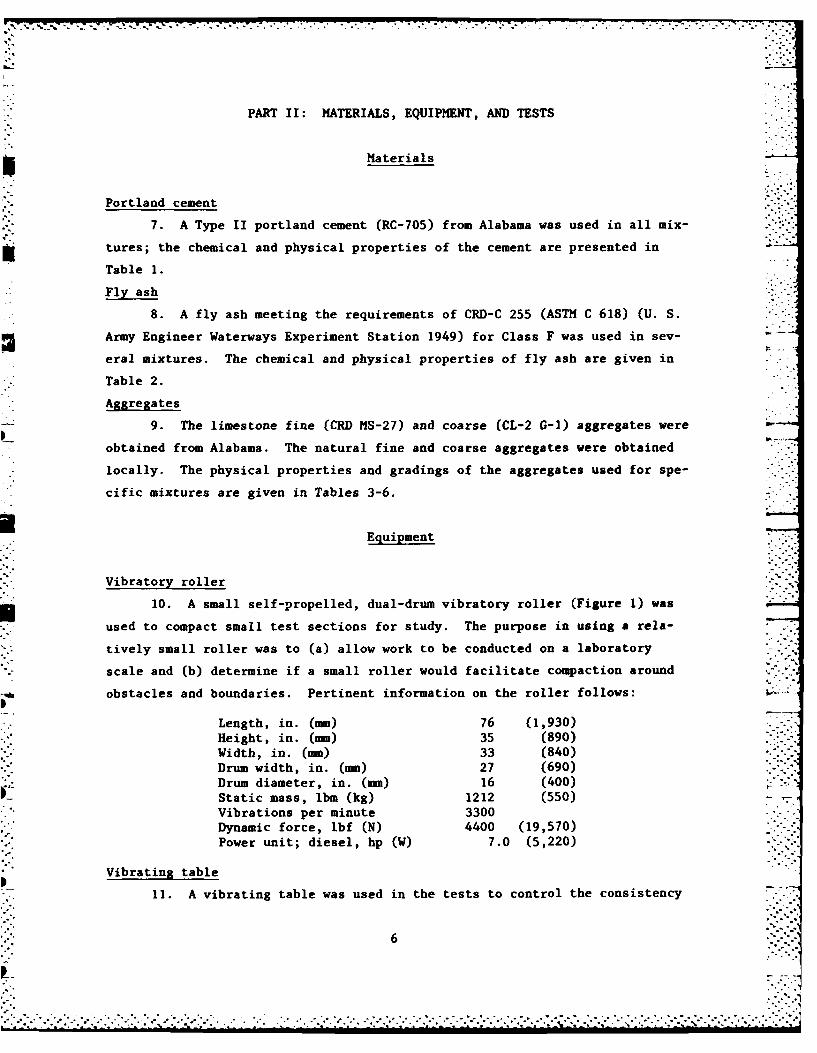
10. A small self-propelled, dual-drum vibratory roller (Figure 1) was
used to compact small test sections for study. The purpose in using a rela-
tively small roller was to (a) allow work to be conducted on a laboratory
scale and (b) determine if a small roller would facilitate compaction around
obstacles and boundaries. Pertinent information on the roller follows:
Length, in. (mm) 76 (1,930)Height, in. (m) 35 (890)Width, in. (m) 33 (840)Drum width, in. (m) 27 (690)Drum diameter, in. (nm) 16 (400)Static mass, lbm (kg) 1212 (550)Vibrations per minute 3300Dynamic force, lbf (N) 4400 (19,570)Power unit; diesel, hp (W) 7.0 (5,220)
Vibrating table
11. A vibrating table was used in the tests to control the consistency
6
. ... ... J

-. . . , - -- -7 7 7 7 7-
0
Figure 1. Vibratory roller usedfor compacting RCC
of the RCC. The table had a frequency of 3600 Hz and was operated at an am-
plitude of 0.015 in. (0.38 mm) during this study.
Erosion apparatus
12. An apparatus was constructed for this investigation to determine
the amount of erosion of RCC due to the impingement of high velocity water.
The apparatus was designed so that a jet of water (approximately I by 8 in.)
having a velocity of 40 ft/sec would impinge on the specimen surface at an
angle of 5 deg from the horizontal. The center of the specimen was placed
12 in. from the source of the water jet. The specimen was examined at in--.
tervals to note any deterioration of the surface. The intervals were every
1/2-hr up to 1-hr testing, every 1-hr up to a total of 4-hr testing, and,
finally, every 4 hr up to termination of the test. The test specimens were
12 by 12 by 1 in. thick. A specimen under test is shown in Figure 2. ,
7
-. • .sAA°o & --

:0
0
Figure 2. Erosion test apparatus
Mortar gun
13. A small mortar gun which pneumatically applies a shotcrete mixture
to a rigid surface was used as a surface treatment technique for the rough
edges of RCC. The gun, developed at the Missouri River Division Laboratory,
is shown in Figure 3 (Coy 1974).
Mechanical compactor
14. A large mechanical compactor normally used to define moisture-
density curves for gravel-sand mixtures was used to study the compaction char- •
acteristics of two RCC mixtures (Donaghe and Townsend 1975). For these tests
a 10-lb hammer compacted the material in a 6-in.-diam mold.
Tests ,'-"
Mixtures
15. Work by Leflaire and Morel (1975) indicated that RCC mixtures must
be optimized for the particular roller to be used. Mixtures were therefore
proportioned to accommodate the smaller roller and to determine if more fluid
or smaller-nominal-maximum-size-aggregate mixtures could be consolidated near
rigid boundaries. Information on the individual mixtures is given in Table 7.
= o .- -- o- ° • . ° -° o . .. . . . °° . . °. . .. . . . . .. , . ..
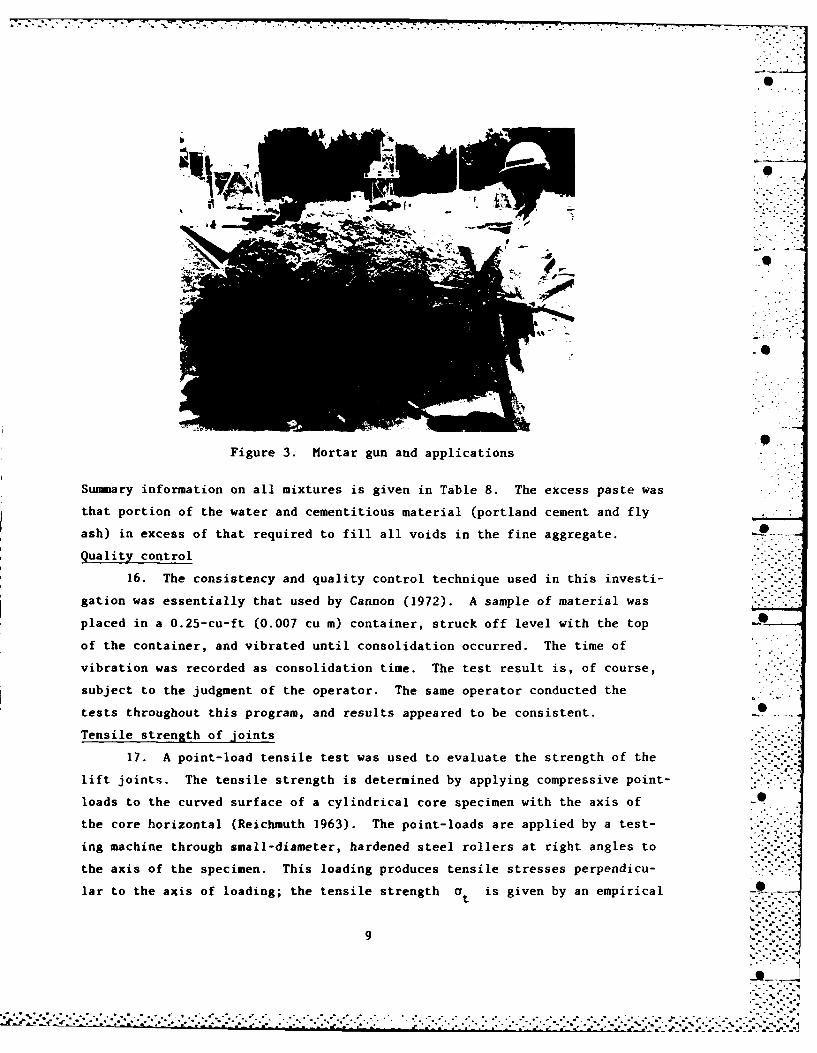
Figure 3. Mortar gun and applications
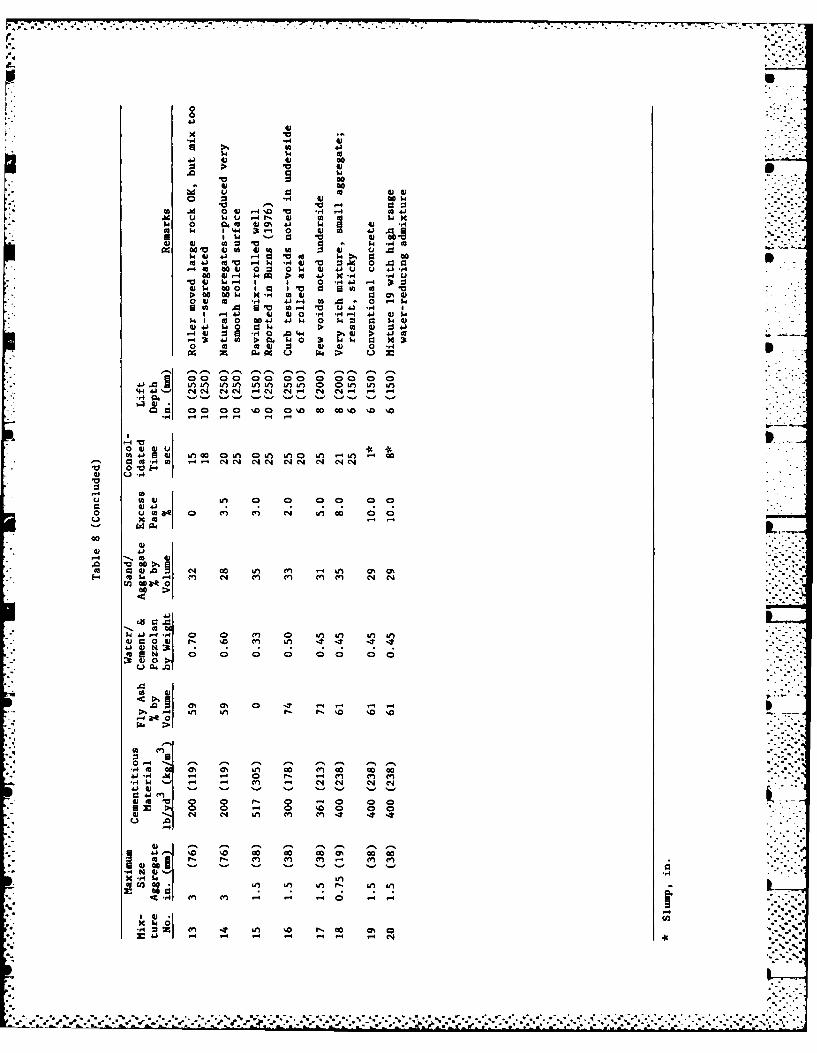
Summary information on all mixtures is given in Table 8. The excess paste was
that portion of the water and cementitious material (portland cement and fly
ash) in excess of that required to fill all voids in the fine aggregate.
Quality control
16. The consistency and quality control technique used in this investi-
gation was essentially that used by Cannon (1972). A sample of material was
placed in a 0.25-cu-ft (0.007 cu m) container, struck off level with the top
of the container, and vibrated until consolidation occurred. The time of
vibration was recorded as consolidation time. The test result is, of course,
subject to the judgment of the operator. The same operator conducted the
tests throughout this program, and results appeared to be consistent. . .
Tensile strength of joints
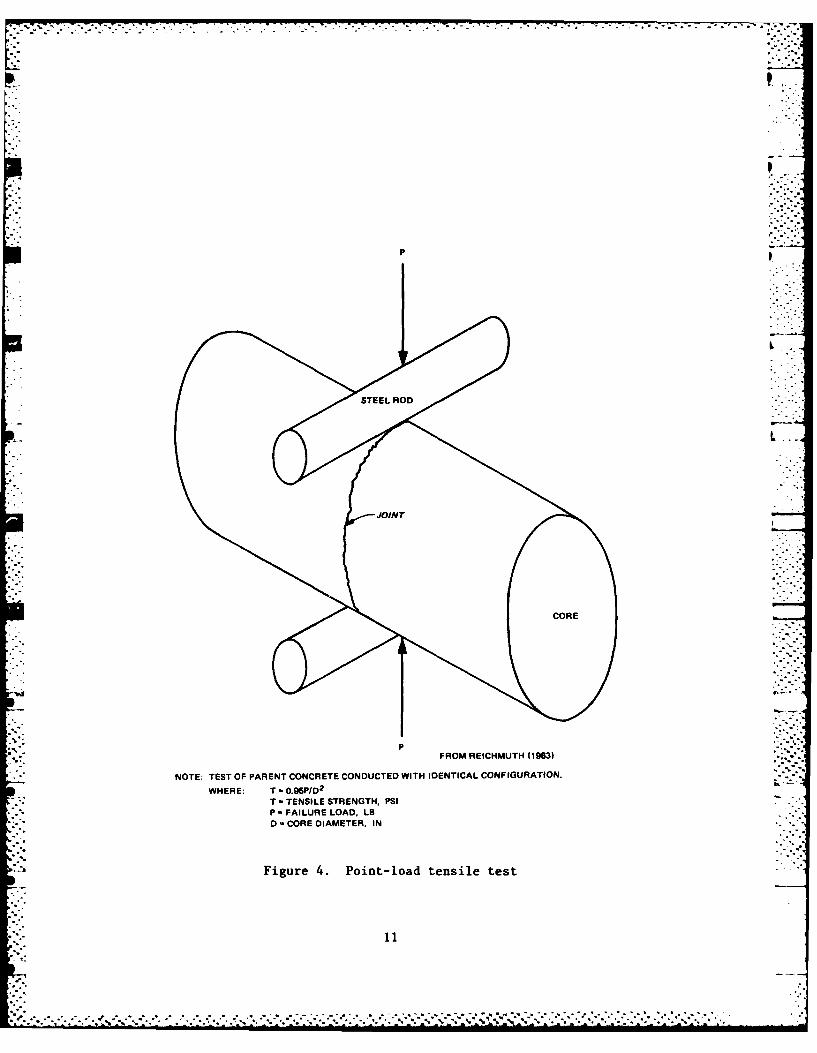
17. A point-load tensile test was used to evaluate the strength of the ..-
lift joints. The tensile strength is determined by applying compressive point-
loads to the curved surface of a cylindrical core specimen with the axis of -
the core horizontal (Reichmuth 1963). The point-loads are applied by a test-
ing machine through small-diameter, hardened steel rollers at right angles to -
the axis of the specimen. This loading produces tensile stresses perpendicu-
lar to the axis of loading; the tensile strength 0t is given by an empirical
9
-%%..-...
= -% o,,... o. .. % ... .- , .,% % -. .- -. - -.- °.o - - • .. .-.. .. , ... .... . . . .-. .-.--.- - % -- - -- -' -'.''. . . . . . ... . . . . . . . .•., , . , . _ _., , , , , , , . _' =_" =
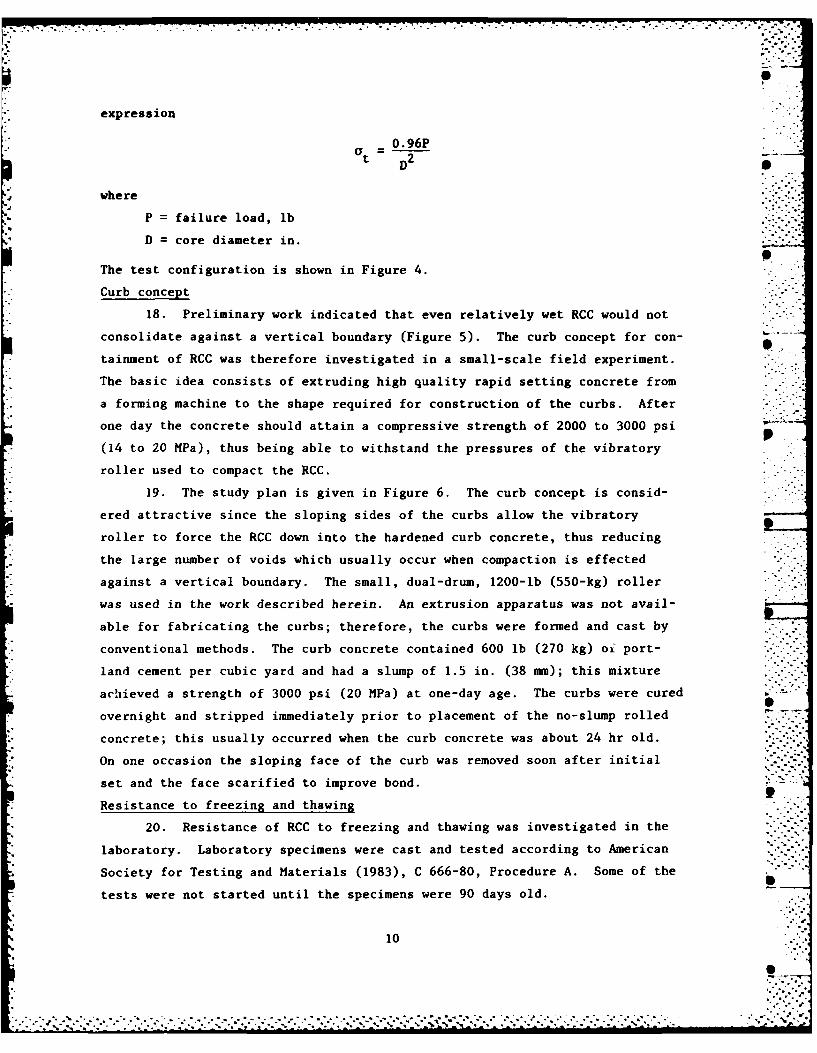
expression
0.96Pat 2 - -
D
where
P = failure load, lb
D = core diameter in.
The test configuration is shown in Figure 4.
Curb concept
18. Preliminary work indicated that even relatively wet RCC would not
consolidate against a vertical boundary (Figure 5). The curb concept for con-
tainment of RCC was therefore investigated in a small-scale field experiment.
The basic idea consists of extruding high quality rapid setting concrete from
a forming machine to the shape required for construction of the curbs. After
one day the concrete should attain a compressive strength of 2000 to 3000 psi
(14 to 20 MPa), thus being able to withstand the pressures of the vibratory
roller used to compact the RCC.
19. The study plan is given in Figure 6. The curb concept is consid-
ered attractive since the sloping sides of the curbs allow the vibratory
roller to force the RCC down into the hardened curb concrete, thus reducing
the large number of voids which usually occur when compaction is effected
against a vertical boundary. The small, dual-drum, 1200-lb (550-kg) roller
was used in the work described herein. An extrusion apparatus was not avail-
able for fabricating the curbs; therefore, the curbs were formed and cast by
conventional methods. The curb concrete contained 600 lb (270 kg) oi port-
land cement per cubic yard and had a slump of 1.5 in. (38 mm); this mixture
achieved a strength of 3000 psi (20 MPa) at one-day age. The curbs were cured
overnight and stripped immediately prior to placement of the no-slump rolled ___
concrete; this usually occurred when the curb concrete was about 24 hr old.
On one occasion the sloping face of the curb was removed soon after initial
set and the face scarified to improve bond.
Resistance to freezing and thawing
20. Resistance of RCC to freezing and thawing was investigated in the
laboratory. Laboratory specimens were cast and tested according to American
Society for Testing and Materials (1983), C 666-80, Procedure A. Some of the
tests were not started until the specimens were 90 days old.
10
o'S e'*l
".'..'.-:-...'....'.-".-'...................-..........-..."-..,"...."..-".."-...........'.'.....'-"...-.-...'.................._'
. .- .7-
pp
JOINT
CORE
pFROM REICHMUTH (1963)
NOTE: TEST OF PARENT CONCRETE CONDUCTED WITH IDENTICAL CONFIGURATION.
WHERE: T -O.96p/0 2
T - TENSILE STRENGTH, PSIP -FAILURE LOAD. LBD0- CORE DIAMETER, IN
Figure 4. Point-load tensile test
- .% N~.. *..., . .- . - . . .. '...... ..... * * '*.'.. *.''.

rp
Figure 5. RCC compacted against a verticalsurface (three lifts)
1070 mm
NOTE: ~ ~ ~ ~ ,,7-TE1-E NUBR NCICE NICT LCMETDTS
TUESDAYMITUR TH1DA6.~.GFE -CUTIDAY
MIXTURE 1Fiur 6.TRCurbDstudy
I1------------
MI Tu~g 1
.............................................................................
* J - 5 5 . .' S L ..-- .....--
PART III: RESULTS
Mixture Proportioning
21. Due to its successful application in the work reported by Tynes
(1973), mixture 1 was used as a starting point. It was discovered that the
relatively dry (consolidation time of 90 sec), large aggregate (3 in., 75-mm)*
mixture could not be effectively consolidated by the small roller. Since a
lift thickness of 10 in. (250 mm) was needed due to the rock size, the water .i
content of the concrete was increased (mixture 6). A consolidation time of
20 sec produced concrete that was a little wet; a consolidation time of 30 to -.
40 sec appeared to produce a concrete of the consistency required in order to
achieve good consolidation under the roller. Consolidation times of less than
20 sec (mixture 13) resulted in segregation problems. Mixtures 7 and 8 were
made to investigate changes in aggregate fractions which might improve consol-
idation of 3-in. material. Ten percent smaller rocks (mixture 8) proved bene-
ficial. Use of natural coarse aggregates (mixture 14) resulted in an excep-
tionally smooth rolled surface not observed with crushed aggregates. However,
it was concluded that the small roller would not prove feasible for extended 4rolling of 3-in. (75-mm) nominal maximum size aggregate concrete. Also, in ac- Utual practice smaller aggregate concrete would normally be used near obstacles
and boundaries. Consequently, most of the remainder of the test program was
devoted to the techniques of working with nominal 1.5-in. (37.5-mm) or smaller
maximum size aggregate concrete.
22. The work with mixture 2 indicated that the roller would consolidate
relatively dry small aggregate concrete but only in lifts of approximately
4 in. (100 mm). Since 4-in. lifts would not likely prove practical, it was
decided to try incremental lift depths up to 10 in. The 10-in, lifts at a
consolidation time of 60 sec were not satisfactory (mixture 4), but were sat-
isfactory at a consolidation time of 45 sec when placed over relatively fresh
concrete. A consolidation time of 25 to 35 sec proved to be the optimum (mix-
tures 9 and 11) for concrete placed on rigid, hardened surfaces. Mixture 12A
was a modification of a conventional RCC mixture to achieve 7 percent total
air. The rolling of mixture 12A was satisfactory, but there was no practical
way to determine how much of the total air was entrained air. Mixture 15 was
proportioned to represent a paving mixture reported by Burns (1976), and the
13
z?7
. "."............."...............".-_.'" ..- " ". -. • ." "*.."-...".".. . . . .-.-.-. .. '.. ......... . . .-.. . . -.-. .' .

- -.
rolling and consolidating of this mixture were satisfactory.
23. The tests with mixtures 16 and 17 proved to be very significant.
During the curb tests a board was wedged between the curbs to provide a con- •
tinuous curb section. Immediately after the lifts were rolled, the board was
removed to observe the effect of consolidation in the underside of the com- -
pacted concrete. Figure 7 shows the undersides of mixtures 16 and 17. Note
the improved degree of consolidation with mixture 17, which had 5 percent ex-
cess paste compared with only 2 percent for mixture 16. It was concluded that
the excess paste was the significant factor in the compaction process. How-
ever, when the paste content became relatively large (8 percent in mixture 18), -
the mixture became sticky. Mixture 10 with natural aggregates had a springy Al
a.~~~ Mitr 16 b. Mitr 17
Fdi
140
a. Mixture 16b• Mixture 1
Figure 7. Underside of compacted mixtures 16 and 17--\ =
.............. *.. .•
.. .. ".., . __._____"""-_'___""_"'_"..._'
.. . ... ..... •
effect and yielded a very smooth surface similar to mixture 14 under the roll-
ing action.
24. All three RCC mixtures used in the curb trials were proportioned to 0
have a consolidation test time of 20 to 25 sec. Thus, all were relatively wet
by no-slump concrete standards. Three double passes were used in compacting
all lifts. Mixture 16, the basic mixture, was used for the first three lifts.
Mixtures 17 (lift 4) and 18 (portion of lift 5) were proportioned to have in- a
creased paste contents. Observations indicated that (a) all mixtures rolled
satisfactorily and (b) the curb concept appeared to be a viable method of
forming and containing RCC (Figures 8-11).
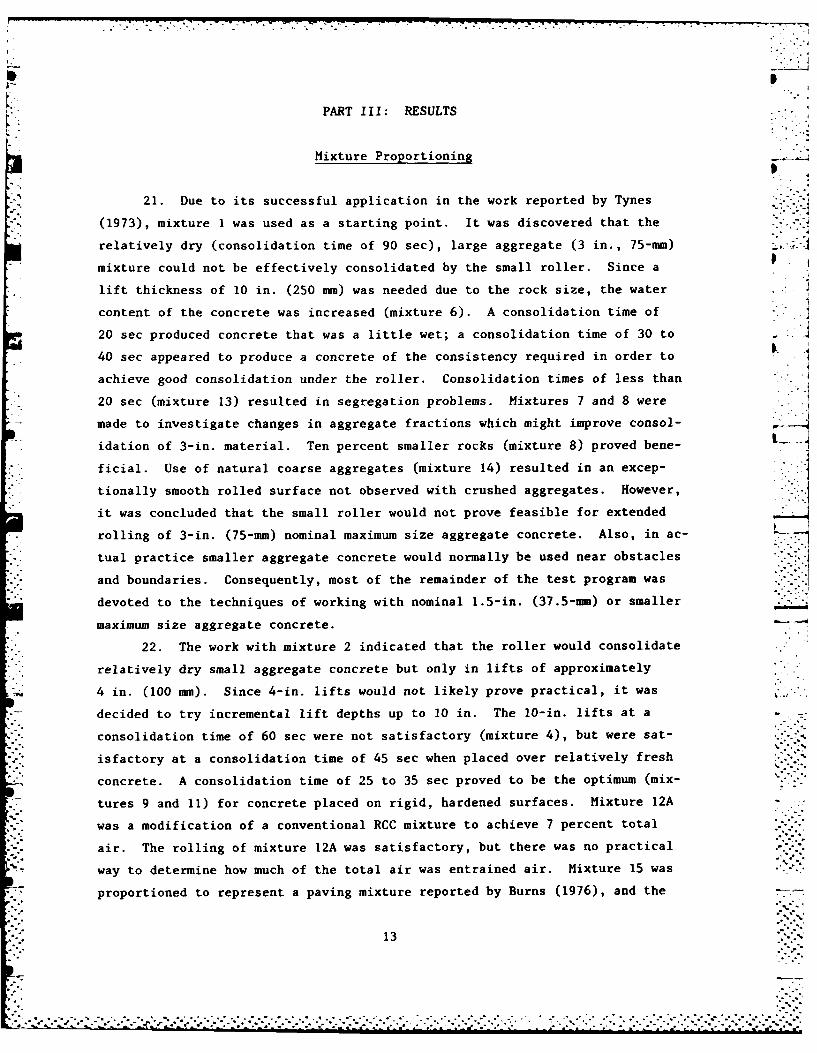
25. The concrete curbs were cast in two sections (Figure 12). The re-
sulting space between the adjacent curb sections was closed prior to RCC place-
ment by wedging a board in line with the sloping curb surfaces. The board was
removed after compaction and the degree of consolidation was observed. Al-
though the mixtures appeared to be fully consolidated, the underside of the
compacted concrete revealed differences in the mixtures. Some minor alignment
problems developed with the formed curbs; however, a properly operated extru-
sion machine designed especially for the curb section should rectify these
problems.
Figure 8. One 16-cu-ft batch of mixture I
"
15-°

Figure 9. Complete lift of mixture I
040
Figure 10. Compacted top surface of mixture 2
16

Figure 11. Completed curb trial section
Figure 12. Forming and casting of curbs
17
. ..
26. The test section was cored when the concrete reached 90 days age.
Twelve 6-in. (152-rm) cores were taken as follows: (a) four vertical cores
full depth through the RCC, (b) four vertical cores at the interface of the
RCC and the curbs, and (c) four horizontal cores at the RCC joints. Intact
joints were present only on the untreated joint and the retarded-then washed
joint of mixture 17 of the RCC. Good mechanical interlock was evident at all
other RCC joint surfaces; however, the core separated at the joints when re-
moved from the hole. It was expected that good bond would develop at the
top lift under mixtures 17 and 18, but such did not happen. The four cores
drilled horizontally through the joints verified the findings of the vertical
cores, namely that the joints were intact in two cores drilled at the inter-
face of mixture 17 (placement day 7), but only mechanical interlock on the
other joints was observed.
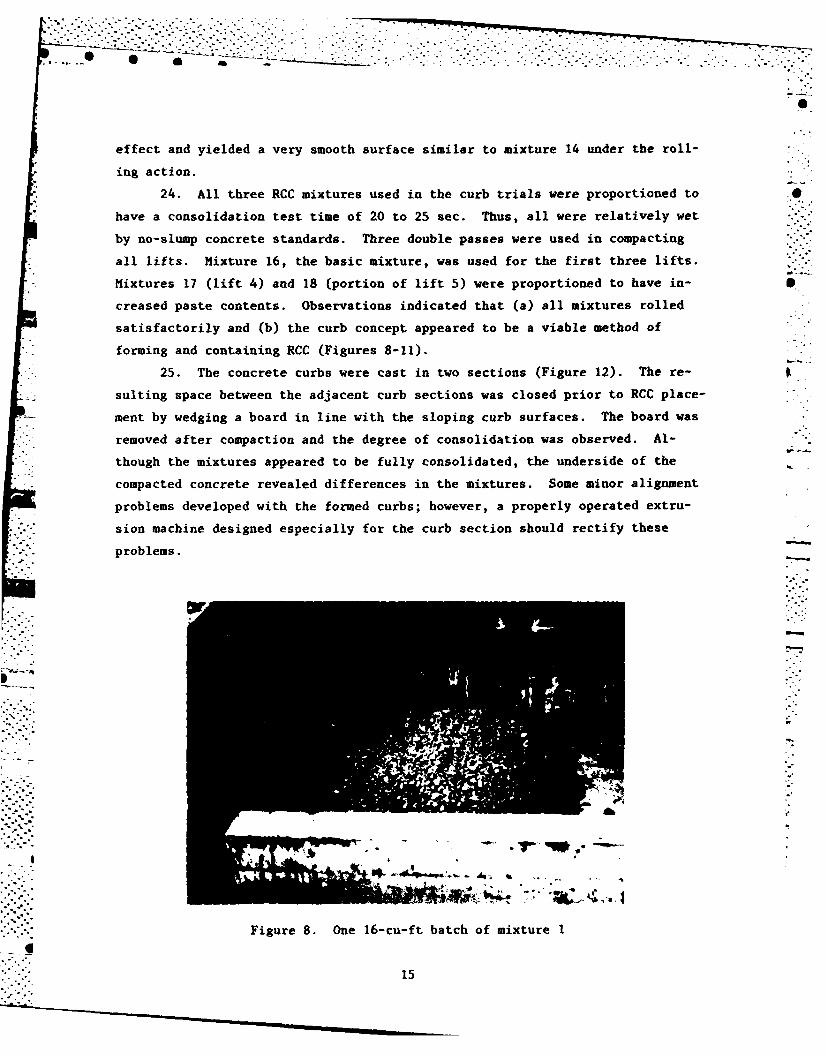
27. The four vertical cores drilled at the interface of the RCC and the
curbs revealed (a) excellent adhesion between the curbs and (b) relatively
good bond of the RCC to the curbs. The 6-in.- (152-rn-) diam cores included
only feather edges of the RCC; thus many of the edges broke during removalfrom the core hole. Good bond was evident in many cases, where the RCC ex-
ceeded the 2-in. (50-rm) depth, and especially on the scarified cub (Fig-
ure 13).
.*
'"'
Figure 13. Scarified face on one curb section
18
S* .*. '. %*.*..% . *.*-".*.*....
. . . . . . . . . .. . . . . . . . . . . . . . . . . . . . . . . . .
-- - - - - -b .S -U°-."
Tests of Fresh Joints
28. Examination of specimens taken from concrete produced during the
mixture proportioning studies revealed that very poor bond developed between
lifts of mixtures which were very dry or contained relatively low amounts of
cementitious material. In order to investigate the bonding characteristics of
RCC, three 6-in. (150-mm) lifts of mixture 9 were rolled and cores were taken
and tested for tensile strength at 90 days age by the point-load test proposed
by Reichmuth (1963) (Figure 4). Results are given in Table 9. The fresh
joint (1-hr age) strength is almost the equal of the parent concrete. How-
ever, the cold joint developed a strength of only about half that of the base
material. Apparently if the concrete is consolidated before time of initial
setting, the material acts almost as a uniform mass; however, after time of
final setting is reached in the lower lift, complete bond between lifts will
not be achieved.• -.. .
Tests of Cold Joints
29. In order to determine if the intact joints achieved with mixture 17
were due to the increased paste content or the reduced lift height, a supple-
mental test section was rolled (Figure 14). A 3-in. (75-rm) lift of mix-
ture 16 provided the base for placement of three 6-in. (150-r) lifts, one
each of mixtures 16 and 18, and half sections of mixtures 19 and 20. Mix-
ture 19 with a slump of 1 in. (25 mm) and mixture 20 with a slump of 8 in.
(200 mm) were used to provide a basis for evaluating the bond of the RCC con-
crete. Mixture 19 was vibrated; mixture 20 was essentially flowing concrete.
All joints were untreated except for wetting prior to concrete placement.
Twelve vertical concrete cores were drilled through the section for testing.
30. The tensile strengths of the cold joints and the parent concrete
were determined at 90 days age. Results of the tensile tests are given in
Table 10. Mixture 19, the control mixture, developed 305-psi (2100-kPa) ten-
sile strength in the concrete and 223 psi (1550 kPa) or 74 percent in the
joints. Mixture 16 developed 225 psi (1550 kPa) in the concrete and only
60 psi (410 kPa) or 27 percent in the joint. Significantly, only 7 of the
12 joint cores were recovered from mixture 16. Mixture 18 had cement content
and water-cement ratio identical with those of mixture 19 and developed almost .
19 4
-.- ...-. .-
• ,. , -.,. -., .-.... , .. ,..- . ..', *.. .. .. .... *.,, . .,...- .,,..: - . " -..- ........ ... ,-. ,.......,

LEGENDSCORE HOLE
I b
MIXTURE 20O
MIXTURE 16 6.""
8''MIXTURE 16
24m ".
Figure 14. Supplemental study
as much strength in the matrix. Thus, it appeared that good consolidation was
achieved with the roller on mixture 18. An average joint strength of 44 per-
cent of the concrete strength was obtained on 11 out of 12 possible core tests.
This compares with 50 percent joint strength achieved previously on mixture 9.
Mixture 20, the high-range water-reducing admixture, developed less strength
than mixture 19, although mixture proportions were identical. Significant
segregation which was obtained when using mixture 20 may have caused the
lower strengths.
Moisture-Density Relationships
31. In order to gain some measure of the relative amount of water being
used in the RCC mixtures in relation to the compaction curves developed for
conventional earth compaction procedures, moisture-density relationships were
20
. . ..

7S
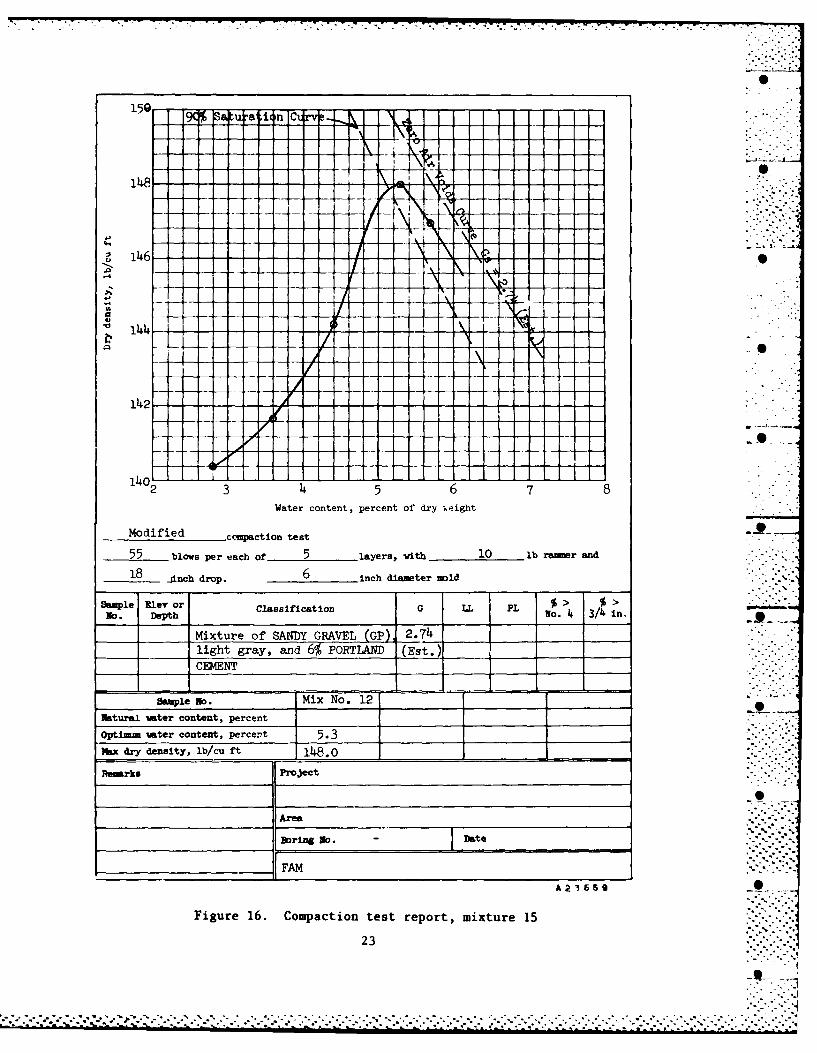
determined for two mixtures, 12 and 15. The results, given in Figures 15 and
16, indicate that the optimum water content (to secure maximum density) is ap-
proximately 5 percent for these mixtures. By comparison, the water contents
used for these mixtures, as determined from Table 8, to secure compaction with
the vibratory roller were 3.7 percent and 4.1 percent, respectively. There-
fore, indications are that the vibratory roller must operate on RCC mixtures
which have approximately 1 percent less moisture than optimum to prevent sink- •S
ing of the roller into the mass.
Erosion Tests
32. Tests of erosion resistance of RCC were conducted on two specimens
received from the U. S. Army Engineer Division Laboratory, North Pacific, and
two specimens fabricated at WES from mixture 6. The specimens were examined
at intervals to note any deterioration of the surface. The impinging jet is
shown in Figure 2. The velocity achieved during these tests fluctuated be-
tween 30 and 35 ft/sec. Results are given in Table 11. Very little erosion
was indicated on any of the four test specimens after 14 hr of flow. An ad-
ditional 6 hr of testing on specimen 2 produced no further loss of material.
Observation indicated that material lost during erosion consisted of small
amounts of weak mortar adjacent to the voids in the test specimens.
Surface Treatment
33. One of the problems associated with RCC for use in mass construc-
tion is the rough edges left if forming is not used. A small mortar gun was
used to determine if a properly applied shotcrete would provide an acceptable
alternative to a formed surface. The mixture used was a wet process mixture
in which the ratio of sand to cement was varied between 2:1 and 4:1. Only
enough water was used to provide the proper gunning consistency in accordance
with instructions (Coy 1974). Figure 3 shows the result of gunning several
areas with different mixture proportions. Apparently, a gunned mortar would
provide an acceptable surface treatment to the rough RCC either as a natural
gunned finish or as a troweled or floated finish.
Freezing and Thawing Resistance
* 34. Results of freezing and thawing tests are shown in Table 12. Spec-imens from mixture 12A, which contained 5 to 6 percent total air as a result
21
I.%.

3 7[... . . .
151-a ;i nO 4 .
94 I. A C i I I
F- I --
147------------------------...
,1.---- K -- ~- 177 1i 1 AJ - -i 1 -- "
- -1---
145.
P, 2 3 5 6 7 8
Water content, percent of dry -,.ight
Modified t, ccaetion test
55 blows per each of 5 layers, with 10 lb ramr and
18O _inch drop. 6 inch din ter mold
Sample vEle or Classification G LL PL % 350. Depth No. 3/4 in.
Mixture of SANDY GRAVEL(GP), 2.76 ! _ _ _.
light gray, and 12% PORTLAND (Est.) __ I-_
Semple no. Mix 15- 12 Cement
Natural water content, percent
Optima meter content, percent 5.1Max dry density, ib/cu ft 150.4
Remrks Project
Area
Boring No. - Date ;ii
Figure 15. Compaction test report, mixture 12
22
.- p.. . . . .- . .-
* ,.... .. ...']
-- 7 7
148-I
2 3 5 6 7Water content, percent of~ dry -..ght
Modified camaction test
55 blows per each of 5 -layers, vith 10 lb rmmr and
18 Anch drop. 6 -inch diameter mold
No.pl DlepthCas~iato LL~ PL % > %>N. Deph or C c. 4 3/4 in."
____ ____Mixture of' SANDY GRAVEL (GP), 2.74_____________ ____light gray, and 6% PORTLAND (Est.)______
Sampleo. No. Mi°o.1
Naua vae cotet perc..e-nt-" .Opt vae content,.percent'5""
Remrks Project
Area
"<,I ",....-i
Boring No. Date
Figure 16. Compaction test report, mixture 15
23
XI
-71. "7
of the addition of an air-entraining admixture (AEA), were tested at two ages.
At the specified test age (14 days), the relative modulus of elasticity E
dropped to less than 20 percent at 11 cycles. At a test age of 90 days the
test ran to 34 cycles before termination, indicating some slight improvement
in resistance to freezing and thawing. Apparently the air void system ob-
tained with the AEA was not satisfactory. Specimens from mixture 15, which
contained no entrained air, sustained 69 cycles before the modulus decreasedp
to 50 percent.
L-
24
*. . . . . . . . . . .. . .. " S. . . . .

PART IV: CONCLUSIONS
35. Based on the results of this study, the following conclusions ap-
pear warranted:
a. The curb concept is a viable method of forming and containingRCC.
b. The degree of compaction achieved is dependent on the stiffnessand the paste content of the mixture, the lift thickness, and 0the individual roller. An excess paste content of 5 percentappears to be needed to secure satisfactory compaction.
c. The tensile strength of the untreated joints compared with theparent concrete increased with paste content and quality froma value of approximately 25 percent for relatively lean RCC toapproximately 50 percent for richer RCC to 75 percent for con-ventional concrete.
d. Erosiou resistance of RCC at 35-ft/sec fluid velocity for20 hrs of test is indicated to be very good.
e. The moisture content which is best for rolling is approximatelyI percent less than optimum as determined by soil compactiontechniques.
f. Surface treatment by use of a mortar gun appears to be a prac-tical method to secure smooth edges on RCC.
g. Resistance of RCC to freezing and thawing containing up to 5 to6 percent total air is poor, apparently due to an unsatisfac-tory air void system.
pp
25
• , 9 "-
REFERENCES
American Society for Testing and Materials. 1983. "Resistance of Concrete toRapid Freezing and Thawing," Vol 04.02, Philadelphia, Pa.
Burns, Cecil D. 1976 (Aug). "Compaction Study of Zero-Slump Concrete," Mis-cellaneous Paper S-76-16, U. S. Army Engineer Waterways Experiment Station,CE, Vicksburg, Miss. -.
Camellerie, J. F. 1974. "Cost and Feasibility Study; Alternate Designs to
Permit Use of Slip Form and Other Techniques to Maximize Economies, TrumbullLake Dam, Pequonnock River Basin, Connecticut," Miscellaneous Paper C-74-15,U. S. Army Engineer Waterways Experiment Station, CE, Vicksburg, Miss.
Cannon, R. W. 1972 (May). "Concrete Dam Construction Using Earth CompactionMethods," Proceedings, Engineering Foundation Conference, 14-18 May 1972,American Society of Civil Engineers, New York, N. Y., pp 143-152. 9Coy, William R. 1974 (Apr). "Development of Equipment and Techniques for .Pneumatic Application of Portland Cement Mortar in Shallow Patches," Technical
Report MRDL 2-74- ? , U. S. Army Missouri River Division, CE, St. Louis, Mo.
Donaghe, R. T., and Townsend, F. C. 1975 (Aug). "Compaction Characteristicsof Earth-Rock Mixtures," Miscellaneous Paper S-73-25, Report 2, U. S. ArmyEngineer Waterways Experiment Station, CE, Vicksburg, Miss.
Hall, D. J., and Houghton, D. L. 1974 (June). "Roller Compacted ConcreteStudies at Lost Creek Dam," U. S. Army Engineer District, Portland, Oreg.
Leflaire, D., and Morel, G. 1975 (Feb). "LeCompactage: OrientationActveles" ("Compaction, Present Trends"), Translation No. 76-1 (CTIAC ReportNo. 18), translated by J. C. Van Tienhoven, U. S. Army Engineer Waterways Ex-periment Station, CE, Vicksburg, Miss.; Translated from Annales des InstituteTechnique du Batiment et des Travaus Publics, No. 325, pp 46-64.
Reichmuth, D. R. 1963. "Correlations of Force-Displacement Data with Phys-ical Properties of Rock for Percussive Drilling Systems," Proc Symp. RockMechanics, 5th, MacMillan, New York, N. Y., p 33.
Tynes, W. 0. 1973 (Oct). "Feasibility Study of No-Slump Concrete for MassConcrete Construction," MP C-73-10, U. S. Army Engineer Waterways ExperimentStation, CE, Vicksburg, Miss.
U. S. Army Engineer Waterways Experiment Station, CE. 1949. "Handbook forConcrete and Cement" (with quarterly supplements), Vicksburg, Miss.
U. S. Army Engineer District, Walla Walla. 1983 (July). "Concrete Report,Willow Creek Dam," Walla Walla, Wash.
26
......... ... , . G ..... , ....-....-....-..... .. ....-.-................-...... ,-*.-.........,- .........- .
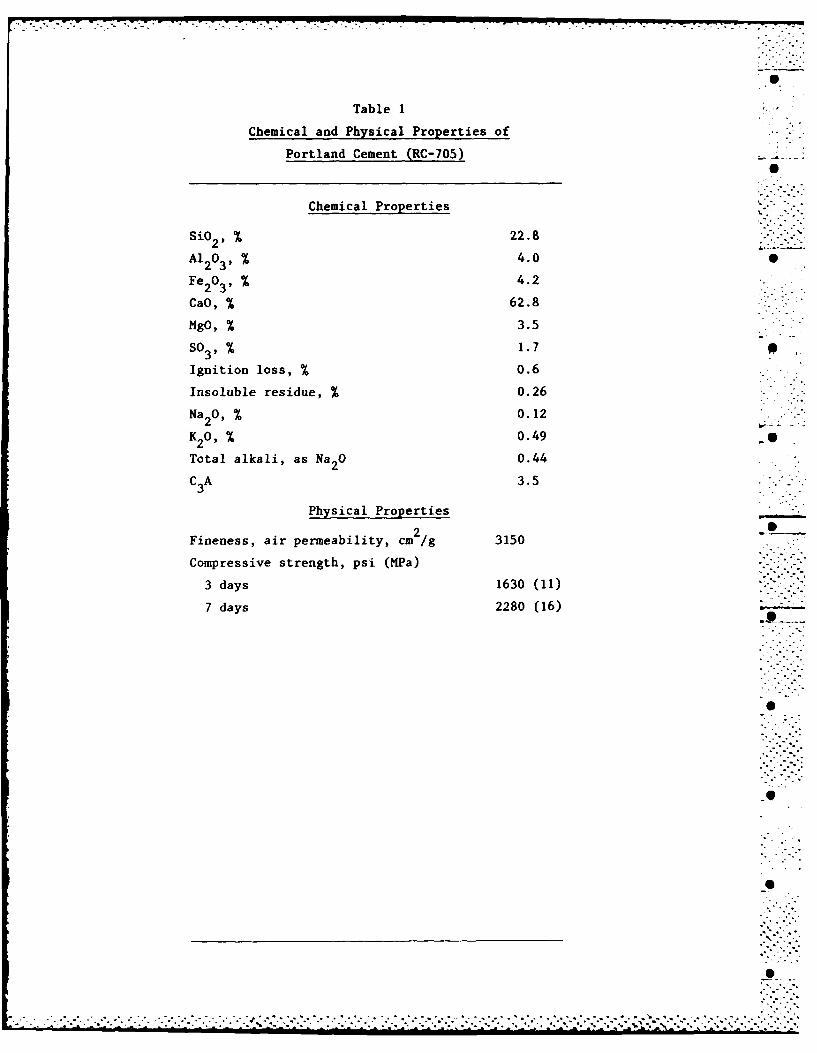
Table I
Chemical and Physical Properties of
Portland Cement (RC-705)
Chemical Properties
SiO 2, % 22.8
Al 20 3, % 4.0
Fe 203, %. 4.2
CaO, %. 62.8
ilgO, %. 3.5
so 3, % 1.7
Ignition loss, %. 0.6
Insoluble residue, %. 0.26
Na 0, %. 0.12
K 20, %. 0.49
Total alkali, as Na 20 0.44
C A 3.53
Physical Properties
2Fineness, air permeability, cm /g 3150
Compressive strength, psi (MPa)
3 days 1630 (11)
7 days 2280 (16)-
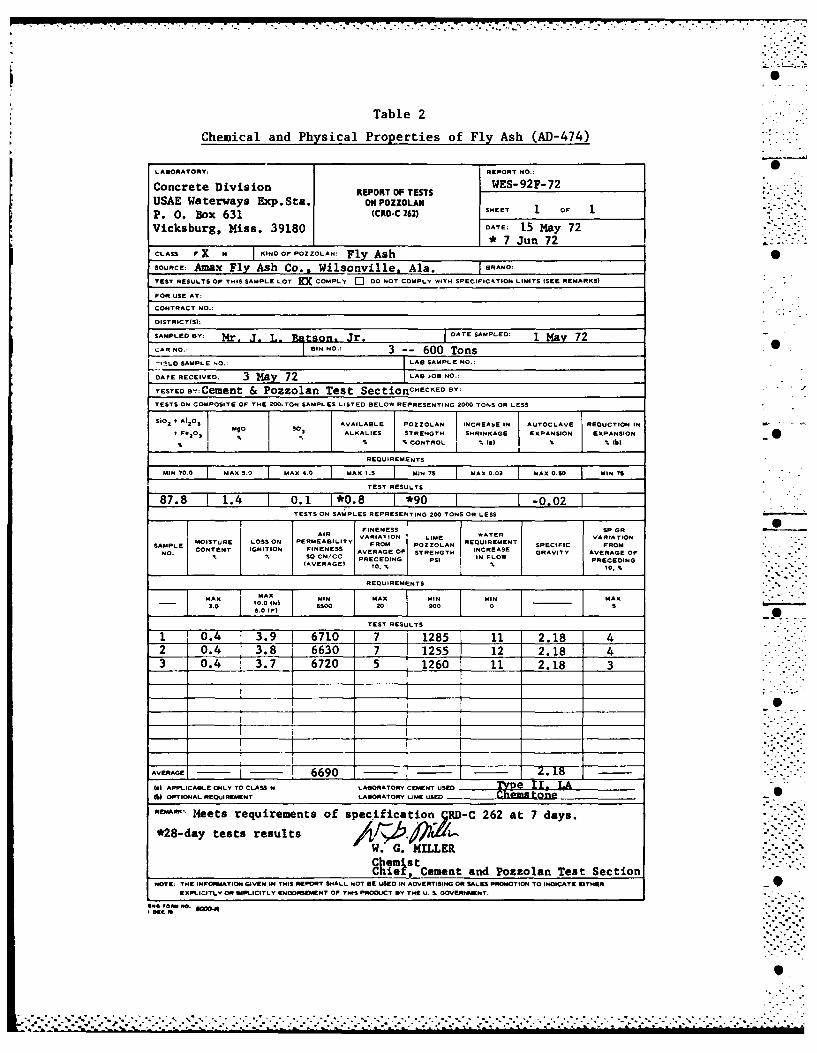
Table 2
Chemical and Physical Properties of Fly Ash (AD-474)
LABORATORY: REPORT NO.:
Concrete Division WES-92F-72REPORT OF TESTS
USAE Waterways Exp. Sta. ON POZZOLANP. 0. Box 631 (CRO*C 262) SET 1 O
Vicksburg, Miss. 39180 DATE: 15 May 72
TEST RESULTS OF THIS SAMPLE LOT K( COMPLY Q DO NOT COMPLY WITH SPECIFICATION LIMITS ISEE REMARS)I
FOR USE AT:
CONTRACT NO.
DISTRICTISh
SAMPLED BY: Mr. 7 -Br n Jr. DATE SAMPLED: 1 May 72CAR NO.: BIN No.: 3 -- 600 Tons-I.LO SAMPLE NO, ILAS SAMPLE N.
DATE RECEIVED: 3 Ma 72 1LAS JOB NO.:
TESTED s" Cexuent & Pozzolan Test Sec tionHECXED BY:
TESTS ON COMPOSITE OF THE 200-TON SAMPLES LISTED BELOW REPRESENTING 2000 TONS OR LESS
sio2 . Al 12 0 g Sl AVAILABLE POZZOLAN INCREASE IN AUTOCLAVE REDUCTION IN
,e' %ALKALIES STRENGTH SHRINKAGE EXPANSION EXPANSION% %CONTROL % (a) % % IbI
REQUIREMENTS
MIN 70.0 MAX 5.0 MAX 4.0 M-AX 1.0 MIN 75 MAX 0.03 MAX 0.50 MIN 75
TEST RESULTS
87.8 1.4 0.1 *0.8 *90 -0.02TESTS ON SAMPLES REPRESENTING 200 TONS OR LESS-
FINENESS OP ORAIR VARIA' ION LM WATER VARIATIO
SML MOSUE LOSS ON PERMEBILITY FROM POZOAN RQIENT SPECIFIC FRO
NO. CONTENT IGIION FINENESS AV ERAGE OF STRENGTH INCREASE GRAVITY AVERAGE OF% so OCM/CC P RECEDING I psi IN FLOW PRECEDING
AVERAGE) t. t0.%
R EDQUIREMENT S
MAX MAX MN 1 MAX MIN MIIA10.0 IN) 2o go MN
- j 20 [ 4.0 IF) ~~TEST RESULTS 90[_____[ MX-
1 _0.4_ 3.9 6710 7 1285 11 2.18 42 0. 3. 6720 7___ 1255 12 2.18 43__ 0.4 37 672 5 1260 11 2.18 3
AVERAGE ___ ____ 66901 ___ JeAPPLICABLE ONLY TO CLASS N LABORATORY CEMENT USED TvDe 11. LAI)OPTIONAL REQUIREMENT LABORATORY LIME USED ChStn
Meets requirements of specification 5DC 262 at 7 days.
*28-day tests results/iv .9 (LW. G. MILLER
Chem tCiet, Cement and Pozzolan Test Section
ROTE: THE INFORAT.OM GIVEN IN THIS REPORT SHALL NOT .E .SE IN ADVERTISING OR SALES PRNTION TO INDICATE EITERnEXP'LICITLY OR IPLICITLY EHDORSEMENT OF THIS PRODUCT BY THE U. S. GOVERNMIENT.
i..S M0 R .o-". SEC IS
iToV~ 4)
) 0 4 1
01 0o 000 (700% 00 0
0 $
0 u be
CV)
0 -- T00
-4
LfV N 0
00
0 "0) 0mt
0)0
(U -4 0o0 '0 ) c4 0 -
I cn- C:A0LCOO 00C4 0 , 0 0a4) 0)0 u 7 n=C
m N.4 00'.r44- H4) M-c
*C r4 ca N -cca 4-* 41 0Li =.0 r- CV) a4C.0 -4
w '-.0 0 4) 4) z .- aJ r4) t4 -4 $O v. 0: V 04
*.4 001-rCi0 0j 4)04
0 w . .4 * L -4 U4
E-4 '-- 0r o 4)Mdi u)- C) Li to 0
'0 $4 0 -A '.) 0 ncc 0) .,4
0 0 0
00 '.4 4.) r- i-W.cC: 41i .04 0 0m m -0 04 .-4 u' CD0or- a%0 j
oe 41' 0 ~ 0 ONI 4 c
0 4 -T( 4)
* ,4 ir0 Li)4.) 00. - 00 C1
*0 CO a)-
m 04 0 00 m041
-4 C. 00 ~~ a) .4 U '
'.41 41
u 00 uLn-W 4)M to$44)
0 4 VN I I ;0 'diE0U> ) 0 W4n )L
4. 21)4 , T .040 j 0'- 6.' 0 a)
r-4~~5 2 CO(A 0 H r40
co 4- 04 01 - 0 M -4 ") *
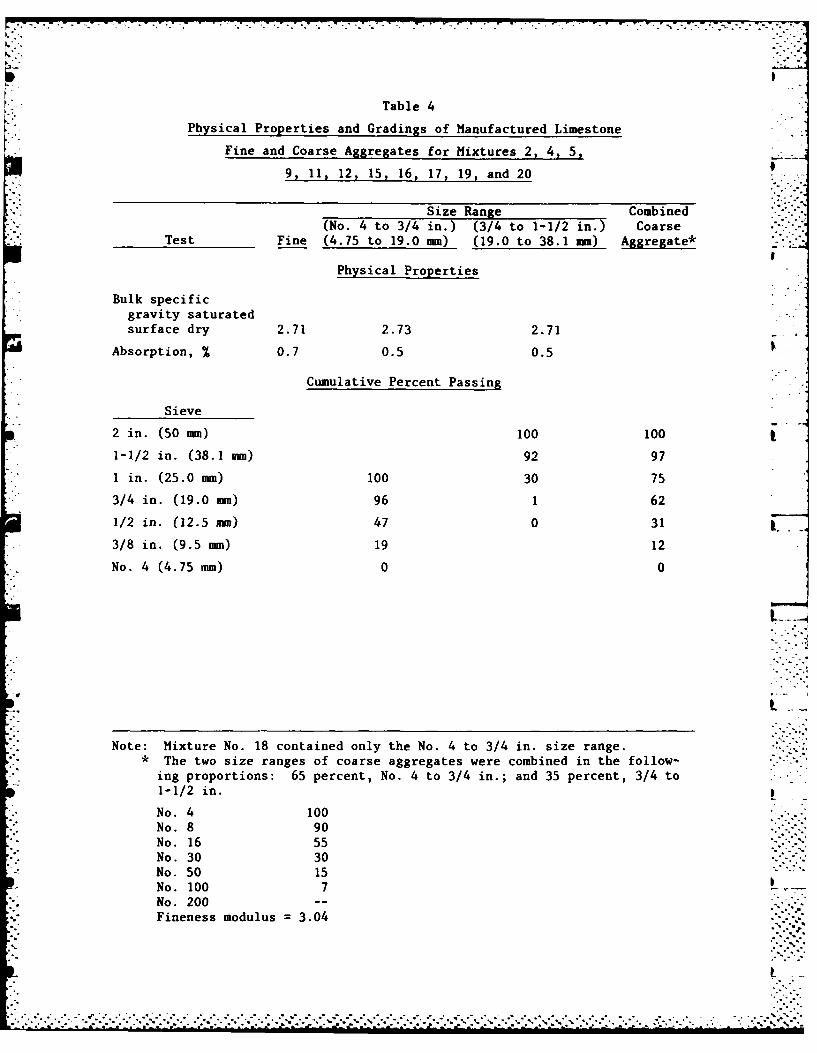
Table 4
Physical Properties and Gradings of Manufactured Limestone
Fine and Coarse Aggregates for Mixtures 2, 4, 5,
9, 11, 12, 15, 16, 17, 19, and 20
Size Range Combined(No. 4 to 3/4 in.) (3/4 to 1-1/2 in.) Coarse
-. Test Fine (4.75 to 19.0 m-) (19.0 to 38.1 mmn) Aggregate*
Physical Properties
Bulk specificgravity saturatedsurface dry 2.71 2.73 2.71
Absorption, % 0.7 0.5 0.5
Cumulative Percent Passing
Sieve
2 in. (50 mm) 100 100
*1-1/2 in. (38.1 nmn) 92 97
I in. (25.0 am) 100 30 75
*3/4 in. (19.0 mm) 96 1 62
1/2 in. (12.5 mm) 47 0 31
3/8 in. (9.5 mm) 19 12
No. 4 (4.75 mm) 0 0
Note: Mixture No. 18 contained only the No. 4 to 3/4 in. size range.*The two size ranges of coarse aggregates were combined in the follow-ing proportions: 65 percent, No. 4 to 3/4 in.; and 35 percent, 3/4 to1-1/2 in.
No. 4 100No. 8 90No. 16 55No. 30 30No. 50 15No. 100 7No. 200 -
Fineness modulus =3.04

Table S
Physical Properties and Gradings of Natural Fine
and Coarse Aggregate for Mlixture 10
Size Range
(No. 4 to 3/4 in.)Test Fine (4.75 to 38.1 mm)
Physical Properties
Bulk specific
gravity, saturated
surface dry 2.64 2.56
Absorption, % 0.2 1.9
Cumulative Percent Passing
Size
1 in. (25 mm) 100
3/4 in. (19 m-) 100
1/2 in. (12.5 mm) 63
3/8 in. (9.5 mm) 35
No. 4 (4.75 mm) 3
lp
No. 4 98
No. 8 89
No. 16 76
No. 30 51
No. 50 15
No. 100 2
No. 200 --
Fineness modulus 2 2.79
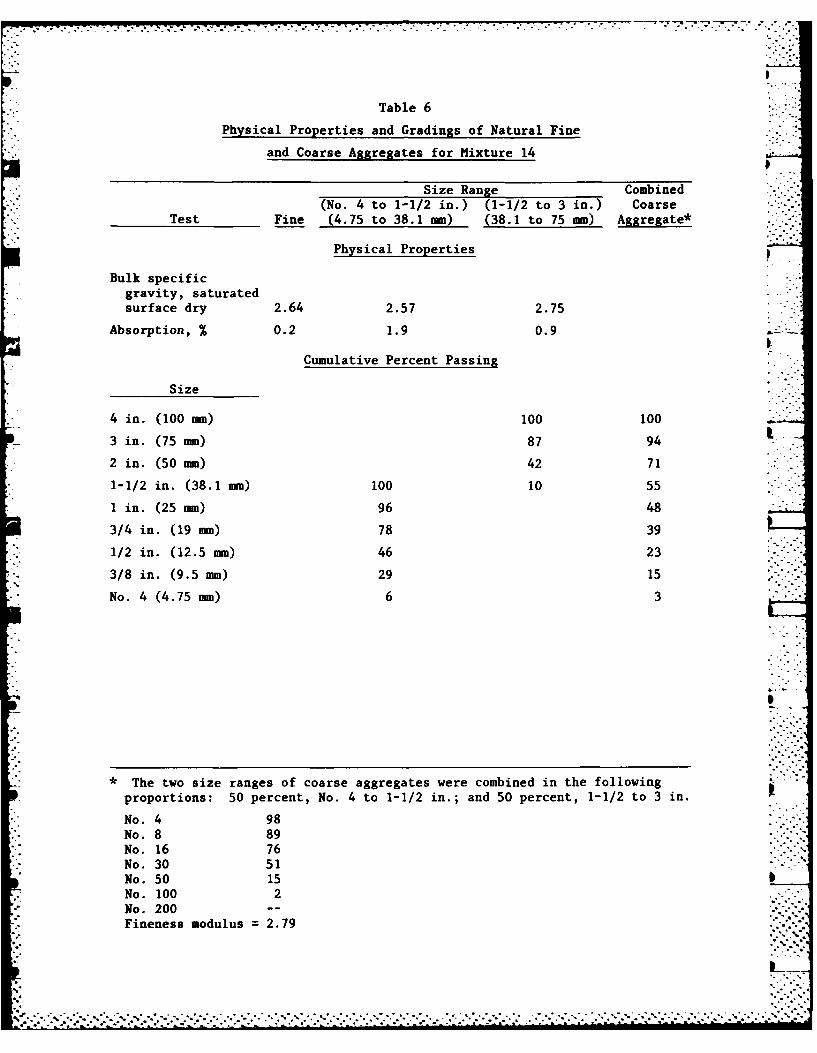
Table 6
Physical Properties and Gradings of Natural Fine
and Coarse Aggregates for Mixture 14
Size Range Combined(No. 4 to 1-1/2 in.) (1-1/2 to 3 in.) Coarse -
Test Fine (4.75 to 38.1 mm) (38.1 to 75 mm) Aggregate*
Physical Properties
Bulk specificgravity, saturatedsurface dry 2.64 2.57 2.75
Absorption, % 0.2 1.9 0.9p
Cumulative Percent Passing
Size
4 in. (100 mm) 100 100
3 in. (75 mm) 87 94
2 in. (50 mm) 42 71
1-1/2 in. (38.1 mm) 100 10 55
in. (25 mm) 96 48
3/4 in. (19 mm) 78 39
1/2 in. (12.5-m) 46 23
3/8 in. (9.5 mm) 29 15
No. 4 (4.75 m) 6 3
" The two size ranges of coarse aggregates were combined in the followingproportions: 50 percent, No. 4 to 1-1/2 in.; and 50 percent, 1-1/2 to 3 in.
No. 4 98No. 8 89No. 16 76No. 30 51No. 50 15 SNo. 100 2No. 200 --
Fineness modulus = 2.79
,.............. .-... "....................-...... ........ ... .~......-'-.-

0
Table 7
Individual Maximum Mixture Proportions
Weight, Saturated ,Solid Volume Surface Dry
Materials ft3 ( 3) lb/yd3 (kg/m ) 3
Limestone 3/4 in.
Mixture 1 '0
Portland cement 1.196 0.034 235.0 139.4Fine aggregate 6.810 0.193 1151.4 683.1Coarse aggregate 16.670 0.472 2831.5 1679.9Water 2.324 0.066 145.0 86.0
Total 27.000 0.765 4362.9 2588.4
Mixture 3
Portland cement 0.598 0.017 117.5 69.7Fly ash 0.598 0.017 81.3 48.2Fine aggregate 7.385 0.209 1248.8 740.9Coarse aggregate 15.695 0.445 2665.5 1581.4Water 2.324 0.066 145.0 86.0Air 0.400 0.011 ... -
Total 27.000 0.765 4258.1 2526.2
Mixture 6
Portland cement 0.689 0.020 135.0 80.1Fly ash 0.689 0.020 93.7 55.6Fine aggregate 7.250 0.205 1226.0 727.4Coarse aggregate 15.406 0.436 2616.8 1552.4Water 2.566 0.073 160.1 95.0Air 0.400 0.011 -- --
Total 27.000 0.765 4231.6 2510.5
Limestone 1-1/2 in.
Mixture 2
Portland cement 1.196 0.034 235.0 139.4Fly ash 0.722 0.022 105.0 62.3Fine aggregate 7.808 0.221 1320.3 783.3Coarse aggregate 14.500 0.411 2463.7 1461.7Water 2.324 0.066 145.0 86.0Air 0.400 0.011 -- --
Total 27.000 0.765 4269.0 2532.7
A(Continued)
(Sheet 1 of 5)

. . . .o_ .. o .. . . . . . . . . . . . . . . . . . .
-- 4 -
Table 7 (Continued)
Weight, SaturatedSolid Volume Surface Dry t 0 ,t
Materials ft3 (M3) lb/yd3 (kg/m 3 )
Limestone 1-1/2 in. (Continued)
Mixture 4
Portland cement 0.984 0.028 193.4 114.7Fly ash 0.984 0.028 133.9 79.4Fine aggregate 8.463 0.240 1431.1 849.0Coarse aggregate 13.808 0.391 2346.2 1392.0Water 2.361 0.067 147.3 87.4Air 0.400 0.011 -- ---. 0
Total 27.000 0.765 4251.9 2522.5
Mixture 5
Portland cement 1.196 0.034 235.0 139.4Fly ash 0.722 0.022 105.0 62.3 .6Fine aggregate 7.724 0.219 1306.1 744.9Coarse aggregate 14.344 0.406 2437.2 1445.9Water 2.564 0.073 160.0 94.9Air 0.400 0.011 -- --
Total 27.000 0.765 4243.3 2487.4 0
Limestone 3 in.
Mixture 7
Portland cement 0.689 0.020 135.0 80.1 9..Fly ash 0.689 0.020 93.7 55.6,-, . _
Fine aggregate 7.250 0.205 1226.0 727.4Coarse aggregate 15.406 0.436 2616.8 1552.4 -°* "
Water 2.566 0.073 160.1 95.0Air 0.400 0.011 ....
Total 27.000 0.765 4231.6 2510.5
Mixture 8 .'.
Portland cement 0.689 0.020 135.0 80.1Fly ash 0.689 0.020 93.7 55.6Fine aggregate 7.250 0.205 1226.0 727.4Coarse aggregate 15.406 0.436 2616.8 1552.4Water 2.566 0.073 160.1 95.0Air 0.400 0.011 -- --
Total 27.000 0.765 4231.6 2510.5
(Continued)
(Sheet 2 of 5)
.....................-.- •-.,
- . .% .. . • . . . . • . . -..... . . ... . ..

Table 7 (Continued)
Weight, SaturatedSolid Volume Surface Dry _
Materials ft3 _____ 3 __
Limestone 3 in. (Continued)
Mixture 13
Portland cement 0.509 0.014 100.0 59.3Fly ash 0.735 0.021 100.0 59.3Fine aggregate 7.092 0.201 1199.3 711.5Coarse aggregate 15.070 0.427 2559.6 1518.6Water 2.244 0.064 140.0 83.1Air 1.350 0.038 -- ---
Total 27.000 0.765 4098.9 2431.8
Natural 3/4 in.
Mixture 10
Portland cement 1.196 0.034 235.0 139.4Fly ash 0.772 0.022 105.0 62.3Fine aggregate 8.981 0.254 1479.5 877.8Coarse aggregate 13.472 0.382 2168.9 1286.7Water 2.179 0.062 136.0 80.7Air 0.400 0.011 -- -- 5
Total 27.000 0.765 4124.4 2446.9
Natural 3 in.
Mixture 14
Portland cement 0.509 0.014 100.0 59.3Fly ash 0.735 0.021 100.0 59.3Fine aggregate 6.295 0.179 1037.0 615.2Coarse aggregate 16. 188 0.458 2686.9 1594.1Water 1.923 0.055 120.0 71.2Air 1.350 0.038 -- --
Total 27.000 0.765 4043.9 2399.1
S.000
(Continued)
(Sheet 3 of 5)

..-- -.:
7
Table 7 (Continued)
Weight, SaturatedSolid Volume Surface Dry "
333 3Materials ft3 (*3) lb/yd (kg/m3)
Limestone 1-1/2 in.
Mixture 15
Portland cement 2.630 0.074 517.0 306.7Fine aggregate 7.433 0.211 1256.9 745.7Coarse aggregate 13.803 0.392 2345.3 1391.4Water 2.734 0.077 170.6 101.2Air 0.400 0.011 --
Total 27.000 0.765 4289.8 2545.0
Mixture 16
Portland cement 0.509 0.014 100.0 59.0Fly ash 1.470 0.042 200.0 119.0Fine aggregate 7.277 0.206 1226.0 727.0Coarse aggregate 14.778 0.419 2505.0 1486.0Water 2.404 0.068 150.0 89.0Air 0.562 0.016 .. '.
Total 27.000 0.765 4181.0 2480.0
Mixture 17
Portland cement 0.677 0.019 133.0 79.0Fly ash 1.676 0.048 228.0 135.0Fine aggregate 6.695 0.190 1128.0 669.0Coarse aggregate 14.780 0.418 2505.0 1486.0Water 2.596 0.074 162.0 96.0Air 0.576 0.016 -- --
Total 27.000 0.765 4156.0 2465.0
Mixture 18
Portland cement 0.763 0.022 150.0 89.0Fly ash 1.838 0.052 250.0 148.0Fine aggregate 7.328 0.208 1235.0 733.0 .'.
Coarse aggregate 13.610 0.385 2310.0 1370.0Water 2.885 0.082 180.0 107.0Air 0.576 0.016 .. ..
Total 27.000 0.765 4125.0 2447.0
(Continued)
(Sheet 4 of 5)
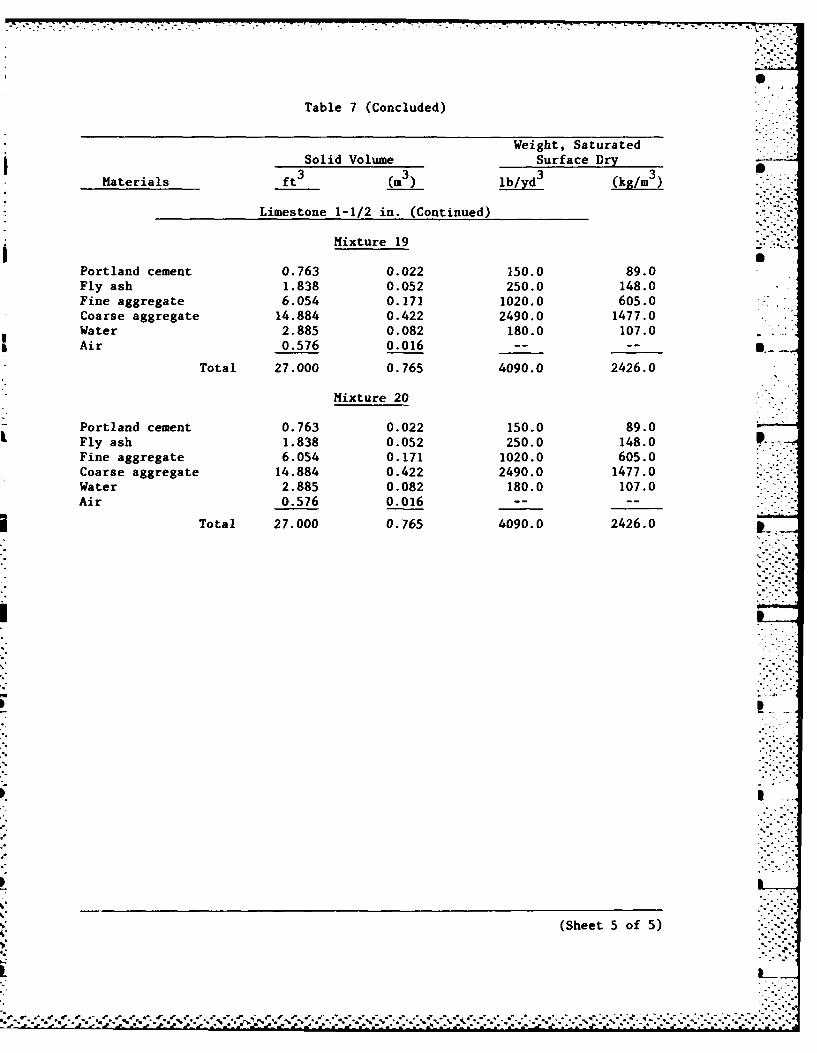
Table 7 (Concluded)
Weight, SaturatedSolid Volume Surface Dry
Materials ft3 (m3 lb/yd3 (kg/m 3
Limestone 1-1/2 in. (Continued)
Mixture 19
Portland cement 0.763 0.022 150.0 89.0Fly ash 1.838 0.052 250.0 148.0Fine aggregate 6.054 0.171 1020.0 605.0Coarse aggregate 14.884 0.422 2490.0 1477.0Water 2.885 0.082 180.0 107.0Air 0.576 0.016 -- --
Total 27.000 0.765 4090.0 2426.0
Mixture 20
Portland cement 0.763 0.022 150.0 89.0Fly ash 1.838 0.052 250.0 148.0
Fine aggregate 6.054 0.171 1020.0 605.0Coarse aggregate 14.884 0.422 2490.0 1477.0Water 2.885 0.082 180.0 107.0Air 0.576 0.016 -- --
Total 27.000 0.765 4090.0 2426.0
(Sheet 5 of 5)

:~~~~ F7-.777
$4 0
1.4 -4 4.)0 -4 41. .30 4.) m43
'4 -j '4 V(AO .W I o -4 4-
0 1M 41) 4.) - 4 -4 .I-04w3u 4.4 4.) 0 4) -4'- V
-. 4 40 .,4 V 0 4) 3) V -4 3 : ->0 4)' to w VD
4) OV 0 30 V$4 -P4 4) to V.H V) 4.V 0
0.4c 3 r 041 4) -4 41)w -4 V '4 V -4 4.)0 w. 0 4.) 4)-4 *j0 m a 4 IV-4 0 4to c ,-H 4 -4 4 )V 4 0 .4 r- -4 -4 0
CO 0~ >~ -,4 00 *4-. A '4 0 0-4 -4 .,4 -4 -4 w$4 '0 VV 4) 4 C3W 4 -40 I 0 w -I diJ 0 V "a4 44 U W 34 0 0 0 0M I 4) (U 3Cr-4 4 '4 3; V0 0 V Q Q , '4 . CW .13 W0 C3 I -- 3 V 00 V
v 54 AJ0 4 4J 4 -4 -,4 A4.)VV W -*.0 0 o ( V4.. V0 Q -4 to-H4 c0 00O M e ( 4 1 '-f4)4J -) - CJU0, 0 AJ4)V4J -4 ' -4 ) -1 ,-4(A 4.)
4.)'W-4 V > 0 0 0 W WVV -q to V4) - 4 -4 4) CO 4J-4 -,4 r.-Ix0 m 1" 0 '4 I 0'4 w V '4 10 w 0u-4 0 0m0 0 w 0
4) 0 4-w 40 0 u30 w 0 aJ 0 w-4 A 00' ' 40 M 0*. 4 0 0 '4w= '4 C3 0.4.) ~0 0 04. Vi4)
04 Uw w" 0 0 1 u000 PC 0 '4 00v1 .. 4 '-4'4 .. 4to 4.) 0 4 4444 (1 U0 V1 2 0 0 u I V 3 00 4) 0 .- -4
V 0 0 0-) 41 41- 4.) a .01 0 00 4 0 - 4 -0 4 a000 .0 .0 00' 0 w ' 400 ( 0 in C 04- 0 V) 0
-4 0 "a 0 'A 0 43 10 t. 4-4 C w0 00, m 00 a- 3 3-4 V .44. 41 '4 ' 4 '1 1 -. 44 w 0 w w44 '43 - 00 1-4 0 0 -4 CC M0 44N.- - -4 G4U N T 44 'a 4 0. CO W " * V Va
0 '4'4'4 0.04 Vc '4'4 .4)4. 40.)Q.~ u V " r 0 0 VVV 4) 4.) V) V--I0q)w 0 x 4.).0 0 43 -4 -
0 .,4 00 000939 > 0Io 0 .'-4 0 0 0 0 0
* 000 0000 000 00 00 0 041~ a OLA V V)4 Ln OLe)LM 0 4(30 Ln i Ln Ln Ln U)
cI -J14 - N C-4 N'i- NN C14 N 1
0. 0 4 -- - -
z I
0 .-4-4 04c404.) L 4J aV 0 010oq 0 n 0 n OLLm o)~ 0n a 004c(o L Ln Ln 0 OLn 0 0'4 a m- q to O 0% ON0 0% '0 T4 T4-.? NC) M '104 10 NC'N C)NC') C Ln NN C J C')00 VE-.
0
0 V
OX 0
44 "1 i 4)0 "a00 ,U
0V.0 . 9 O LM N~ 00 LA N1 N1 N LA 0 r- 0000om '4 14 N1 M' M' c') C') M' CM M' en) CI') en C)
00
*- 0 %0 ' 0 10 1'4'4-4 N C') C'V I- 0 0 0 0 0 0
0 0 00 0 00 0 N 0 I0 00 c
.4
0 V
%~ 0
.. 4 -4 - -1 4C1
4) - 0% r 0 C') m' C') 0 0 - 4 4
(n0N4 N1 NN 41 42 0 00004) N en- C4 c n04 N N e e n N e
%D ) %0 '000 %0 '0.%0 00 0% 00 000r- m' fl, ') r- r.- r- M' - en) (n) M
-4N V)N -.4 '4 LR C 00- LA LM LA LA r-- LA LM LA
fn - C) LA %Q r- 00 m% 0 - N N
"% -
A -,
V ca06
'3 Q4o3
V3 - 0 14C3
u 54 u4 434 OO1.i o 40.c 4 % 41 4
0 5 1 043-4 '. 31 0 .0 -(A4IM w. 04,I- V3 03 (4 1
1.4 40. : %'3 $.l 4 ,4 C$414 w 4 ""- 9 0 $3 t3 '3
43 41 t 0 4 W. -r .' 3.4 a-4 43 '3 -4 (1, 0 00 0 54 j j-
Do' 4 1 -4 1-dn > g .. 4 1 x .1 .44 004 0 ~ 01A V3'13 U ',
>0A 0 4 X 1.4q ca4 '3 X- *4)04 0) ~ to r4 0j -' W- $
in1 00 8a r a ta (4 -0 U4J -w I 0 DO 4J J4 03 W 0 C3 4 443 (4 0 .8 H0 4 t3. 0 t 41 t
*43 .4'3 > $430 3t 5.4 '3 4304 (40 cc. 31 . 0 w 4 0 -H4Ix' 1.4 04 m 03 P4 >'
444 C43N C C4, .40 N ~ -Cq 43 C4 N
4. aw 4na '03L ~0 1.4in0 LM 14. in -0 (4 (43E4 4 .
Z M.C 14.>n
9:4i 4()( 4(J1 41( 0 0( ( (0 443 NN FA .4N N N C1 -
4)3
0E43. mK (n-Kj n 4 0
M 43 84,. 0
00
(.3 034 M1 0 0 00 1 U03) 0N' ' N 4 0 0
00
P4
'00>4 (4 043. 0,N 00 m 0 U 0 0
.,(44 w en N ( ' V C~1 N Nq
00114.4 n
41 4 %0 10 co) 0 4(1 M( 001 4(4 0431 r- '0 cn en~ e4 (n4
4J43N4 w . .(U 0 0 i 0 i 0 ? 00 00
z % 0% (ni 0 -4 Go .-
% 4J( 04

Table 9
Tests of Joints (Mixture 9)
Point LoadTensile Strength
Specimen No. psi (kpa)
Cold joint (24 hr)1 175 (1210)2 115 (790)3 175 (1210)4 175 (1210)5 185 (1280)6 165 (1140)
Avg 165 (1140)
Fresh joint (1 hr)1 230 (1590)2 275 (1900)3 350 (2410)4 260 (1790) -
5 255 (1760)6 255 (1760)
Avg 270 (1860)
Parent concrete1 340 (2340)-2 295 (2030)3 320 (2210)4 325 (2240)5 285 (1970)6 295 (2030)
Avg 310 (2140)
-. 7

c 0 Ln L0 0 0 0000000.,4 0 LM C*4%a4O 0 (n % 1r- 0 %0 r
-9 In ~ 0 a0%-4r 0 in
a4 413 413. -
14 I.3
00 00. Q
0 nI n0041 0 00 0 00 40 0
M U 0 N 04 M N N r.4 ON Go0% r0asr- 0% 'A.*i aas-4 N -
U w.@
C2.1 '0t L L0.. 0 ~ /u0~ 0' # 0000 0 #n(4r c o1
.,4~--ccca 04 M4 4NClr 4MTi M
a a: 4) @393 4> 4) .a, 93 @34
o 0 Uu
0 C ' 040 ON41 43 4
4) @3 $314 (ncn N eJ~00% 0 a . Coo1 -n0 .14*4.1 w.4 u MCn (n 04 N Cl3 0 C04NO M O0'- 0 @
4) @3 C N C-4 ~ N 04~ 4N* 14 410 a cc
*a -k@3o
0 06 0>
0 to03 0 41
(a -4-aA
A 0.
41 00O cf-- 4 ifLnr -4 0\ -4O N T a, ft- N\0r- o -r.4- I. It 14P
1.. A 41 43 .14
In ".4 w. 1.4 'aU U 41 a0) . @
* ".4 0N CaN 43
* a 4) - 43 - 41 44@3 @3Q3 a a o
$-4. 4u 3 Mi '0 0 0'rLn 0 f "4 00 0 00 0 0 0n .40 4 O i0\ 1.\.% G%% 'o'oOco -0 0% co nF n %r %m cn m .- P 0 w4&3 U N C-4NC -4CN
4N N ClNN NI -1 0 -o0-f r- 0 0c O o4 40 M 2 1- a
Ma4 -N NN ' -N N-0 00
43
P43
1.3 QS S
%1 -O 4 4 9 t-C4 N 0 3
0 anL n0i n00i L 3 0 0 0 0 0 0 : 4u hC -& 1 n0N4 C m4 )- n - -43 -C\ L v4 @
1. 1.4 1- o~C Ub U

Table 11
Erosion Tests
Specimen Hours of Test Erosion/lb* 0No. Surface Individual Cumulative Individual Cumulative
1 Cast 7 7 0.05 0.057 14 0.01 0.06
2 Cast 7 7 0.10 0.107 14 0.05 0.15 ,6 20 0.00 0.15
3 Rolled 5 5 0.00 0.00(smooth) 3 8 0.00 0.00
6 14 0.00 0.00
4 Rolled 3 3 0.04 0.04(rough) 3 6 0.01 0.05
4 10 0.00 0.054 14 0.00 0.05
On a 1-sq-ft surface.
Table 12
Results of Freezing and Thawing Tests
Relative Modulus ofMixture Test Age Specimen Elasticity E at Cycles ShownNo. days No. 0 11 23 34 69 o
12A 14 1 100 72 173 204 195 13 S6 18
12A 90 7 -- 30 118 -- 3:139 -- 31 1210 -- 27 811 -- 31 12
12 -- 27 9
15 14 13 91 -- 76 5014 89 -- 78 4815 91 -- 75 4416 91 -- 79 5017 91 -- 76 4618 86 -- 60 32
,3::.,.
* .... ....
FILMED _7
1-85
DTIC


![l]MC FILE COPY - DTIC](https://static.cupdf.com/doc/110x72/61885438e860b91cee1aab70/lmc-file-copy-dtic.jpg)