8/10/2019 JKH-1HFY15 Earnings Note - SELL - 07Nov2014.pdf
http://slidepdf.com/reader/full/jkh-1hfy15-earnings-note-sell-07nov2014pdf 1/6
1
John Keells Holdings [JKH.N0000]1HFY15 Earnings Note - Trading at a 30%+ premium to FV - SELL
YEAR END MARCH (LKR mn) 1HFY14 FY14 1HFY15 FY15ECurrent Price (LKR)
Revenue 40,900 89,300 43,400 95,100255
EBIT 3,300 16,600 3,900 18,100Fair Value (LKR)
Profit to Equity Holders 3,600 11,700 4,800 12,800192
Recurring Profit¹ 3,500 9,400 3,700 10,400Recommendation
Reported EPS (LKR) 4.17 12.6 4.84 13.1SELL
EPS Growth (%) (12.7) (8.7) 16.1 4.1Date
Reported PER (x) 20.3 19.5 7-November-14
Recurring EPS (LKR)¹ 4.11 11.9 3.77 10.7
Recurring PER (x) 21.4 25.0
JKH’s 1HFY15 EPS of LKR 4.84 is a c .+16% YoY. Reported EPS
benefited from c .LKR 670mn in interest income generated on funds
raised by the rights issue and c .LKR 395mn in sales of equity
investments. CAL estimates 1HFY15 recurrent EPS at LKR 3.77 (c .-9.6%
YoY) and anticipates flat EPS in FY16E as funds from the rights issue
are utilized. Revenue from the Property arm is in-line with CAL’sestimates of LKR 4.7bn for FY15E, as recognition of sales of 7
th Sense
continues. The Transport segment is unlikely to see an improvement in
the near-term, and we anticipate a c .4% YoY fall in FY15E revenue.
CAL’s DCF-based SOTP value for JKH is LKR 152 and we attribute a
LKR 40* for JKH’s IR project (total LKR 192). SELL
LKR 670mn in interest income from rights funds supports profit – CAL expects
LKR 15-20bn in funds to be utilized for the IR project during FY15E, which may
result in finance income from rights funds of c.LKR 1.6bn for the year. Our
FY15E recurrent EPS of LKR 10.7 (c .-10% YoY) excludes interest income from
the rights funds and capital gains from the sale of shares.
FY15E Property revenue to reach LKR 4.7bn (20% YoY) – Revenue from
recognition of sales from 7th Sense continues as expected. CAL expects sales
from c.30 apartments to be recognized in FY15E.
FY15E CF&R revenue to reach c.LKR 29bn (12% YoY) – The growth in revenue
is likely to be fueled by increased consumption. An average household is likely to
save c.LKR 2k/month due to the reduction in various energy prices, while the
increase in gov’t wages of c.LKR 15k/month is likely to further contribute to the
increase in discretionary spending. CAL expects CF&R EBIT margins to improve
to c.7% from 5.8% in FY14.
JKH trades at a c.33% premium to CAL’s SOTP – CAL is confident that the IR
project will roll out as planned. However, at current price levels, all futureopportunities are fully priced in. Our DCF-based SOTP is LKR 192. We
recommend long-term investors to buy closer to LKR 210 to factor price volatility.
SELL
Refer p.6 for Impo rtant Disclaimer
CAL Research
Level 5, “Millennium House”,
No.46/58, Nawam Mawatha,
Colombo 2
Tel: +94 11 231 7786
Email: [email protected]
Purasisi Jinadasa
Market Capitalization (USD): 1.9bn
1-year avg. Daily T/O (USD): 2.2mn
1-year H/L (LKR): 263/206
Free Float: 98%
¹ Does not include interest earned
on funds from rights issue and
capital gains from share sales
* Refer “A closer look at the
integrated resort project” 4 July
2014
8/10/2019 JKH-1HFY15 Earnings Note - SELL - 07Nov2014.pdf
http://slidepdf.com/reader/full/jkh-1hfy15-earnings-note-sell-07nov2014pdf 2/6
2
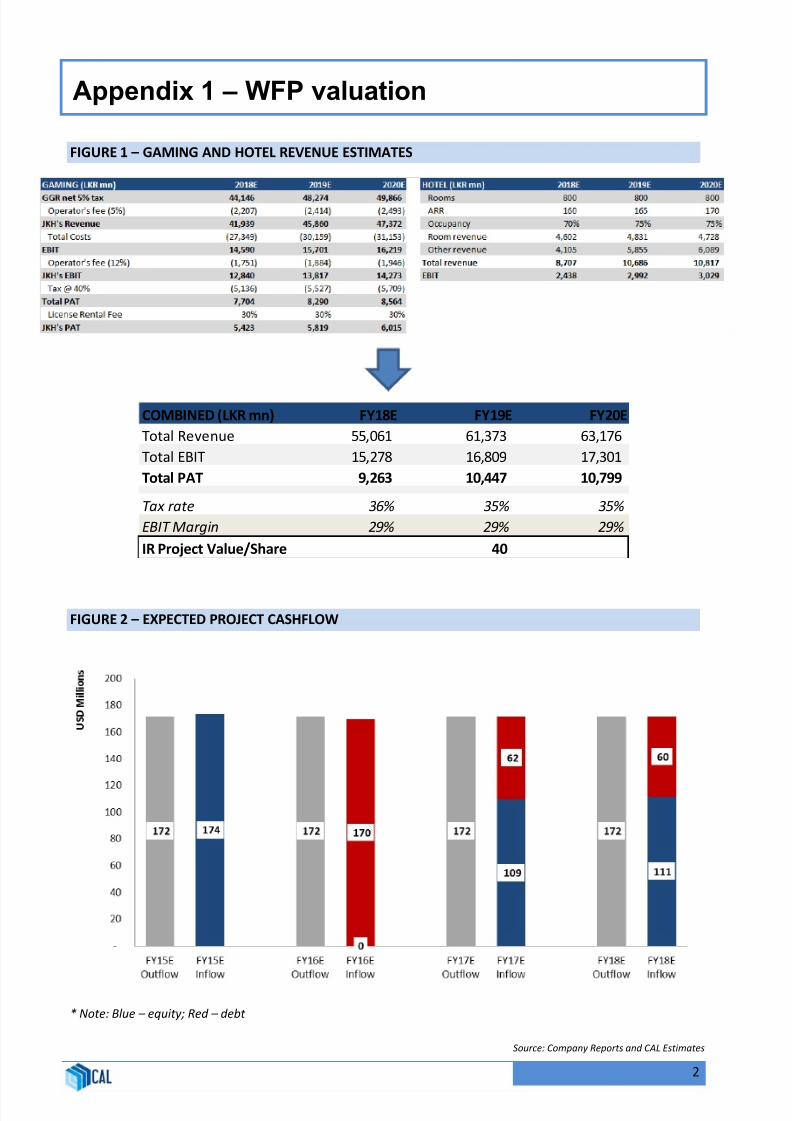
FIGURE 1 – GAMING AND HOTEL REVENUE ESTIMATES
FIGURE 2 – EXPECTED PROJECT CASHFLOW
* Note: Blue – equity; Red – debt
COMBINED (LKR mn) FY18E FY19E FY20E
Total Revenue 55,061 61,373 63,176
Total EBIT 15,278 16,809 17,301
Total PAT 9,263 10,447 10,799
Tax rate 36% 35% 35%
EBIT Margin 29% 29% 29%
IR Project Value/Share 40
Appendix 1 – WFP valuation
Source: Company Reports and CAL Estimates
8/10/2019 JKH-1HFY15 Earnings Note - SELL - 07Nov2014.pdf
http://slidepdf.com/reader/full/jkh-1hfy15-earnings-note-sell-07nov2014pdf 3/6
3
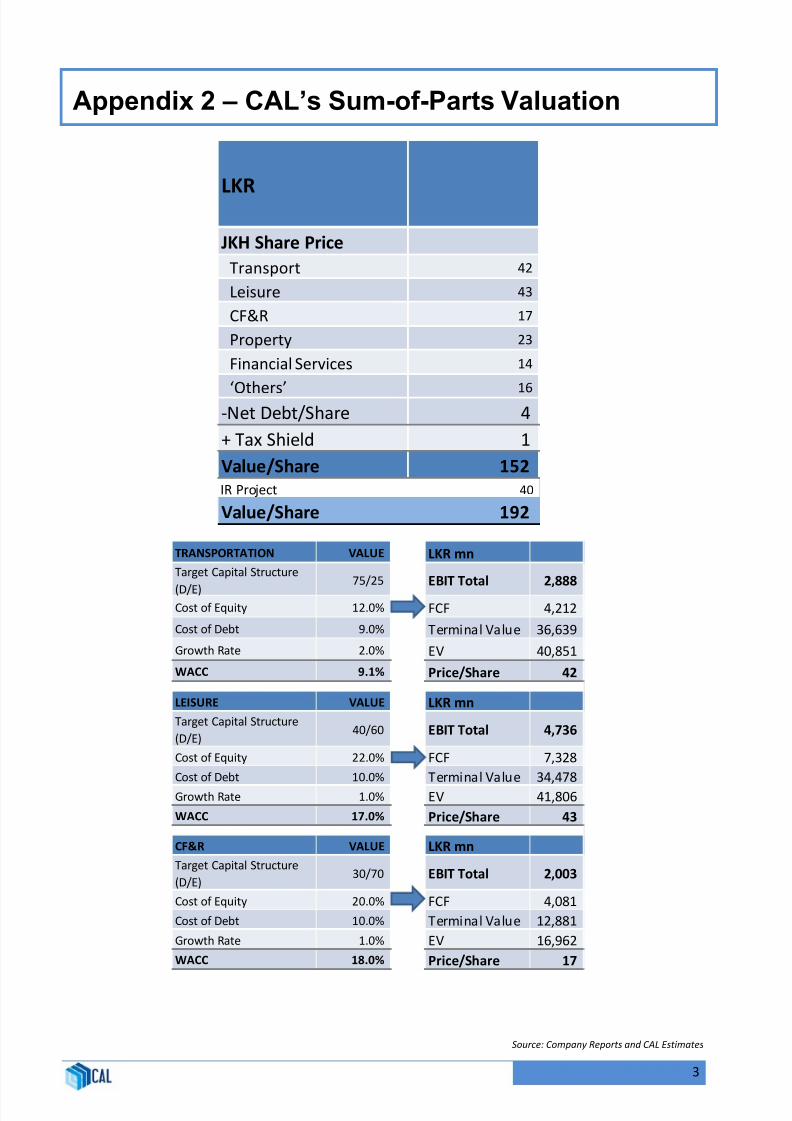
LKR
JKH Share Price
Transport 42
Leisure 43
CF&R 17
Property 23
Financial Services 14
‘Others’ 16 -Net Debt/Share 4
+ Tax Shield 1
Value/Share 152
IR Project 40
Value/Share 192
TRANSPORTATION VALUE LKR mn
Target Capital Structure
(D/E)75/25 EBIT Total 2,888
Cost of Equity 12.0% FCF 4,212
Cost of Debt 9.0% Terminal Value 36,639
Growth Rate 2.0% EV 40,851
WACC 9.1% Price/Share 42
LEISURE VALUE LKR mn
Target Capital Structure
(D/E)40/60 EBIT Total 4,736
Cost of Equity 22.0% FCF 7,328
Cost of Debt 10.0% Terminal Value 34,478
Growth Rate 1.0% EV 41,806
WACC 17.0% Price/Share 43
CF&R VALUE LKR mn
Target Capital Structure
(D/E)30/70 EBIT Total 2,003
Cost of Equity 20.0% FCF 4,081
Cost of Debt 10.0% Terminal Value 12,881
Growth Rate 1.0% EV 16,962
WACC 18.0% Price/Share 17
Appendix 2 – CAL’s Sum-of-Parts Valuation
Source: Company Reports and CAL Estimates
8/10/2019 JKH-1HFY15 Earnings Note - SELL - 07Nov2014.pdf
http://slidepdf.com/reader/full/jkh-1hfy15-earnings-note-sell-07nov2014pdf 4/6
4
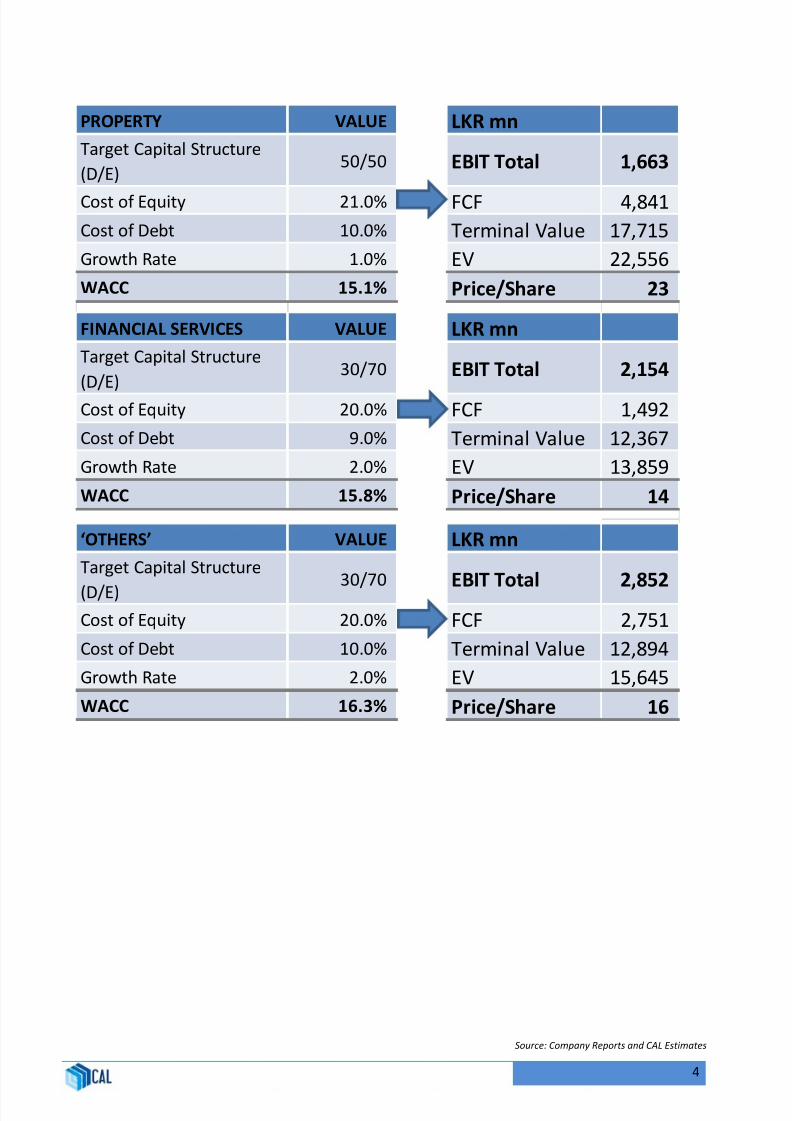
PROPERTY VALUE LKR mn
Target Capital Structure
(D/E)50/50 EBIT Total 1,663
Cost of Equity 21.0% FCF 4,841
Cost of Debt 10.0% Terminal Value 17,715
Growth Rate 1.0% EV 22,556
WACC 15.1% Price/Share 23
FINANCIAL SERVICES VALUE LKR mn
Target Capital Structure
(D/E)30/70 EBIT Total 2,154
Cost of Equity 20.0% FCF 1,492
Cost of Debt 9.0% Terminal Value 12,367
Growth Rate 2.0% EV 13,859
WACC 15.8% Price/Share 14
‘OTHERS’ VALUE LKR mn
Target Capital Structure
(D/E)30/70
EBIT Total 2,852Cost of Equity 20.0% FCF 2,751
Cost of Debt 10.0% Terminal Value 12,894
Growth Rate 2.0% EV 15,645
WACC 16.3% Price/Share 16
Source: Company Reports and CAL Estimates
8/10/2019 JKH-1HFY15 Earnings Note - SELL - 07Nov2014.pdf
http://slidepdf.com/reader/full/jkh-1hfy15-earnings-note-sell-07nov2014pdf 5/6
5
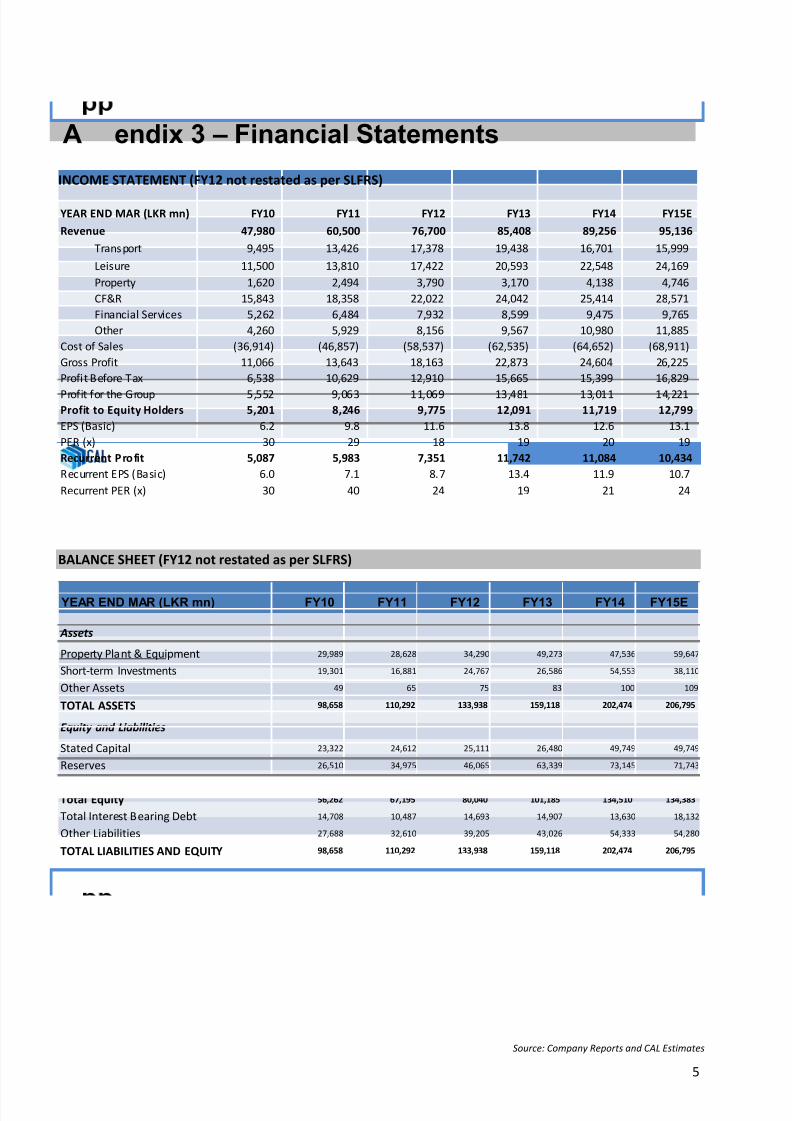
INCOME STATEMENT (FY12 not restated as per SLFRS)
BALANCE SHEET (FY12 not restated as per SLFRS)
YEAR END MAR (LKR mn) FY10 FY11 FY12 FY13 FY14 FY15E
Revenue 47,980 60,500 76,700 85,408 89,256 95,136
Transport 9,495 13,426 17,378 19,438 16,701 15,999
Leisure 11,500 13,810 17,422 20,593 22,548 24,169
Property 1,620 2,494 3,790 3,170 4,138 4,746
CF&R 15,843 18,358 22,022 24,042 25,414 28,571
Financial Services 5,262 6,484 7,932 8,599 9,475 9,765
Other 4,260 5,929 8,156 9,567 10,980 11,885
Cost of Sales (36,914) (46,857) (58,537) (62,535) (64,652) (68,911)
Gross Profit 11,066 13,643 18,163 22,873 24,604 26,225
Profit Before Tax 6,538 10,629 12,910 15,665 15,399 16,829
Profit for the Group 5,552 9,063 11,069 13,481 13,011 14,221Profit to Equity Holders 5,201 8,246 9,775 12,091 11,719 12,799
EPS (Basic) 6.2 9.8 11.6 13.8 12.6 13.1
PER (x) 30 29 18 19 20 19
Recurrent Profit 5,087 5,983 7,351 11,742 11,084 10,434
Recurrent EPS (Basic) 6.0 7.1 8.7 13.4 11.9 10.7
Recurrent PER (x) 30 40 24 19 21 24
YEAR END MAR (LKR mn) FY10 FY11 FY12 FY13 FY14 FY15E
Assets
Property Plant & Equipment 29,989 28,628 34,290 49,273 47,536 59,647
Short-term Investments 19,301 16,881 24,767 26,586 54,553 38,110
Other Assets 49 65 75 83 100 109
TOTAL ASSETS 98,658 110,292 133,938 159,118 202,474 206,795
Equity and Liabilities
Stated Capital 23,322 24,612 25,111 26,480 49,749 49,749
Reserves 26,510 34,975 46,065 63,339 73,145 71,743
Minority Interest 6,430 7,608 8,865 11,366 11,616 12,891
Total Equity 56,262 67,195 80,040 101,185 134,510 134,383
Total Interest Bearing Debt 14,708 10,487 14,693 14,907 13,630 18,132
Other Liabilities 27,688 32,610 39,205 43,026 54,333 54,280
TOTAL LIABILITIES AND EQUITY 98,658 110,292 133,938 159,118 202,474 206,795
A endix 3 – Financial Statements
Source: Company Reports and CAL Estimates

8/10/2019 JKH-1HFY15 Earnings Note - SELL - 07Nov2014.pdf
http://slidepdf.com/reader/full/jkh-1hfy15-earnings-note-sell-07nov2014pdf 6/6
6
Research TeamTel No: +94 11 231 7777 (General)
E-mail: [email protected]
Head of ResearchPurasisi Jinadasa Udeeshan JonasTel No: +94 11 231 7786 Tel No: +94 11 231 7746E-mail: [email protected] E-mail: [email protected]
Thushani de Silva Christeen SilvaTel No: +94 11 231 7777 (Ext: 7815) E-mail: [email protected]: [email protected]
Teresh AmaratungaE-mail: [email protected]
This document has been prepared and issued on the basis of publicly available information, internallydeveloped data and other sources, believed to be reliable. Capital Alliance Securities (Private) Limitedhowever does not warrant its completeness or accuracy. Opinions and estimates given constitute a judgment as of the date of the material and are subject to change without notice. This report is not intendedas an offer or solicitation for the purchase or sale of any financial instrument. The recipient of this reportmust make their own independent decision regarding any securities, investments or financial instrumentsmentioned herein. Securities or financial instruments mentioned may not be suitable to all investors. Capital Alliance Securities (Private) Limited it’s directors, officers, consultants, employees, outsourced research providers associates or business partner, will not be responsible, for any claims damages, compensation,
suits, damages, loss, costs, charges, expenses, outgoing or payments including attorney’s fees whichrecipients of the reports suffers or incurs directly or indirectly arising out actions taken as a result of thisreport. This report is for the use of the intended recipient only. Access, disclosure, copying, distribution orreliance on any of it by anyone else is prohibited and may be a criminal offence.
Definition of rating distribution for long-term investment opportunities
CAL Research uses the following rating system:
STRONG BUY Strong upside. Total return (incl. dividends) is expected to be above 20%within the next 12 months.
BUY Good upside. Total return (incl. dividends) is expected to be between 15% to
20% within the next 12 months.
HOLD For existing shareholders. Total return (incl. dividends) is expected to bebetween 5% to 15% within the next 12 months.
SELL Strong downside. Total return (incl. dividends) is expected to be below 5%within the next 12 months.
Disclaimer
Contacts

![BUKU JKH [E] 2011-JKR](https://static.cupdf.com/doc/110x72/577cd5bd1a28ab9e789b8113/buku-jkh-e-2011-jkr.jpg)
![=floa[cdmf kh]jkh]clan]f - DHS: Startseite · =pi_`nq`m]\i_ `)Q) #](https://static.cupdf.com/doc/110x72/5b9f25b509d3f2d0208cb4d5/floacdmf-khjkhclanf-dhs-pinqmi-q-.jpg)