Smart City and environmental challenges Professor Isam ShahrourIsam.Shahrour@univ-‐lille1.fr
Shandong agricultural University, China, December 23, 2015

Contact-‐Follow
Isam.shahrour@univ-‐lille1.frwww.isamshahrour.comhttps://www.linkedin.com/in/ishahrourhttp://fr.slideshare.net/ishahrour

Q1: Environmental challenges?
Q2: How the Smart City concept will help to face these challenges ?
Q3: How to implement the Smart City concept?
3 questions

Q1: Environmental challenges?
Q2: How the Smart City concept will help to face these challenges ?
Q3: How to implement this concept? (Case study : SunRise project)
3 questions

Environmental challenges World Summits (From Kyoto 2005 to Paris 2015)

Changement climatique

Water stress evolution
Source: Le Monde diplomatique
(% Water withdrawal of the total available water)

The City:• 70% of the total energy consumption• 80% of the greenhouse emission
Greenhouse emission is due mainly to energy consumption
Why ?

Urban Developing countries
Urban –Developed countries
RuralDeveloping countries
Concentration of the population in cities

Concentration in large cities

The City has similarities with biological systemUrban network act as cardiovascular and nervous systems

Generally, cities operate with undersized networksAs an adult with a cardio-‐vascular system of a child.

The city suffers from traffic Congestion

From high air pollutionWHO : 7 million deaths/year

From lack of basic urban services:• 1 billon do not have access to drinking water.• 2.5 billons do not have access to sewage service.

Investment need : 1.8 to 2.3 trillions /year
Transport
Electricity
Water
Telecom
Developing countries has huge needs in Infrastructures

United States (ASCE, 2013 report):Infrastructures GPA = D+
Developed countries: aging Infrastructures challenges

80% (France)
Buildings in France : high investment needs for building renovation

The situation of the city is criticalIn the coming years, it is expected to become more critical, because of the explosion of the urban population
Developed Developed
Less developed

Energy consumption will continue to increase
OECD : Organization for Economic Co-‐operation and Development

Infrastructures
Buildings
Urbanization
Management
City:
Eco-‐ friendly
Socio –friendly
Huge financial crisis
We have to transform the city to meet the environmental challenges

In a period of tough crisis, we have to be innovative
Digital technology (Smart City) ?

Q1: Environmental challenges?
Q2: How the Smart City concept will help to face the environmental challenges ?
Q3: How to implement this concept? (Case study : SunRise project)
3 questions

Digital technology
Internet
Social Network

Each object :-‐ Identified-‐ Geo-‐localized-‐ Communicate-‐ Store data-‐ Analyze data


SeeAnalyzeUnderstandImprove
Real time
Digital technology in the City

Thanks to this technology,
buried infrastructures become visible When we see things, we make progress.

Health, EducationArt, Culture
More data
BIG DATAdigital, images, movies, audios

Smart city technology allows:
• Real-‐time monitoring
• Rapid action in the case of an abnormal event (security, leakage, contamination,....)• Optimal management
• Stakeholders implication• New services

Smart Energy : optimal management
Production
Storage Smart Grid
Energy Consumption

Q1: Environmental challenges?
Q2: How the Smart City concept will help to face these challenges ?
Q3: How to implement this concept?
3 questions

SunRise – Smart City:Large Scale demonstrator of the Smart City

Innovation operators • Pole Ubiquitaire• CITC –EURARFID• PRN
Local government• AMGVF (Large
Cities association)• Lille Metropolis• Region• ArtoisComm
International:• W-‐Smart (Int. Ass. for
water Security)• US• Netherland, UK, Spain• Lebanon, Morocco
Water/Energy/Buildings operators• Dalkia• Eaux du Nord (Suez)• Eau de Paris• ERDF • Lille Métropole Habitat
Research Laboratories:• Engineering• Information technology • Social Science
Education :• Master programs• PhD programs
Starts-‐ups : Stereograph, Noolittic,Inodesign, Calmwater, Planete oui, Ixsane, Projex,
SunRise : Large public-‐private partnership

Smart Cityimplementation ?
Large Experimentation (Demonstrator)

Scientific CampusSmart City Demonstrator
Small town:• 25 000 users• 140 Buildings

C1 – Chimie (1966) Polytech’Lille (2000)IUT (2006)
Learning Center (2016)Bâtiment D
(Rénovation /Extension, 2019)

100 km of urban networks
• Drinking Water• Sewage• District Heating• Gas • Electrical ( HV, LV)• Public light• Roads

SunRise Community :PhD, Master Degree Students, engineers,

SunRise PlatformInformation Sytem
Asset Data (GIS)
Analytics
Web server communication
• Users• Management staff• Technical staff• Academic Staff
Communication : • Réseaux filaires • Réseaux sans fils
Monitoring • Buildings• Water Network• Energy network• Others
Sensors data
Users -‐ Alert -‐ Information
Users data
Open data • Weather• Traffic • Emergency
Open data

Drinking water

Concerns: • Leakage• Real-‐time contamination detection• Users awareness
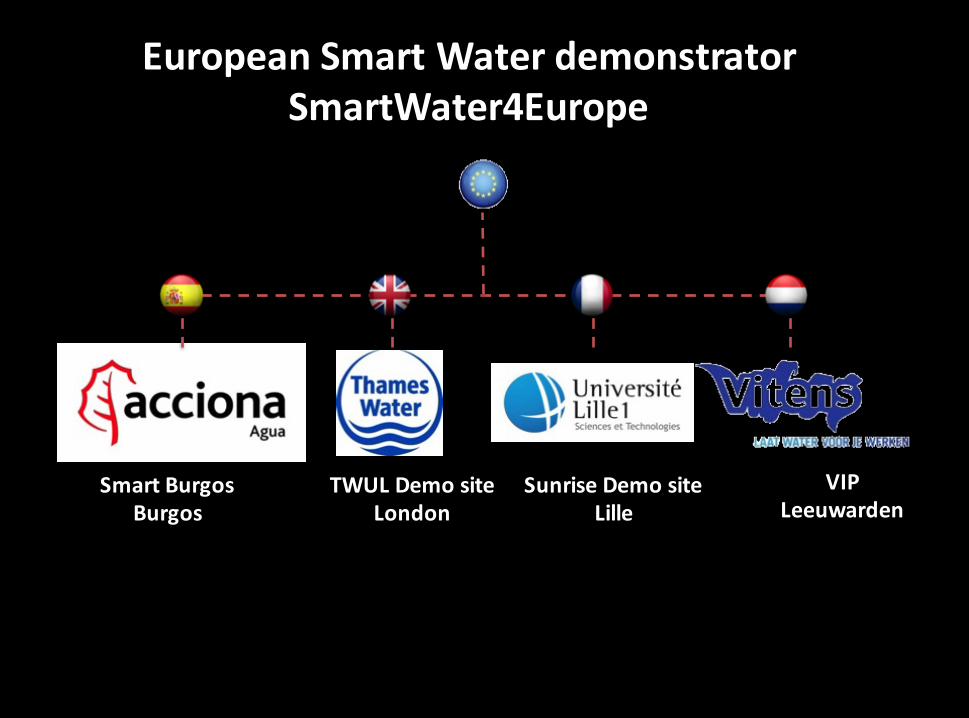
TWUL Demo siteLondon
Smart BurgosBurgos
VIPLeeuwarden
Sunrise Demo siteLille
European Smart Water demonstrator SmartWater4Europe

15 km of pipes

100 electronic Counters
reading 1h step

Pressure cell Datalogger
Electronic pressure cells


Real-‐time water quality control
Accidental contamination ?

49
Intellisonde S::can EventLab
Innovative devices for water quality control

50
Emplacement des capteurs qualité
Plan of implementation

Before the field implementation, we conducted analysis of the sensors performances for the detection of chemical and biological contaminations.

Injection
Point de mesure
52
Lab-‐Station for the analysis of the sensors performances for the detection of chemical and biological contaminations.

53
-‐0,5
0
0,5
1
1,5
2
0 20 40 60 80 100 120 140 160
Chan
gemen
t de ph
ase
Temps (minutes)
40 mg/L 30 mg/L
20 mg/L
10mg/L
5mg/L
Phase change – chemical contamination
EventLab –Optiqua

541,5
1,7
1,9
2,1
2,3
2,5
2,7
2,9
0 20 40 60 80 100 120 140 160 180 200
Turb ISO -‐[FTU
]
Temps (minutes)
S::CAN
Turbidity
Absorbency
E. Coli injection
105 UFC/mL
105 UFC/mL
108 UFC/mL
107 UFC/mL

District heating

Concerns: • Data-‐based Diagnostic • Reduction of energy looses (network, buildings)• Demand-‐ based energy production • Users awareness

SunRiseSite pilote de la ville intelligente et durable
Réseau d'eau
District heating system
Heating Center

Heating Sub-‐Station
• Temperature• Flow• Pressure• Consumption
Regulation System(Valve Controllers)

Data : Building « M1 »
Heat Consumption External Temperature

Large economy with smart control
Smart Regulation?
Real Consumption

High potential of energy savings
University strategy : Large investment for the-‐ Transformation of the district heating into a smart one-‐ Construction of co-‐generation station
Funded by :• Energy savings• Public – private partnership

Under Progress:• Public lighting• Sewage • Cyber security
• SunRise social network

Contact-‐Follow
Isam.shahrour@univ-‐lille1.frwww.isamshahrour.comhttps://www.linkedin.com/in/ishahrourhttp://fr.slideshare.net/ishahrour