Humanising Financial Services
Disclaimer: The contents of this document/information remain the intellectual property of Maybank and no part of thisis to be reproduced or transmitted in any form or by any means, including electronically, photocopying, recording or in
any information storage and retrieval system without the permission in writing from Maybank. The contents of this
document/information are confidential and its circulation and use are restricted.
Financial ResultsFourth Quarter and Full Year FY2021 ended 31 December 202124 February 2022
Investor Presentation
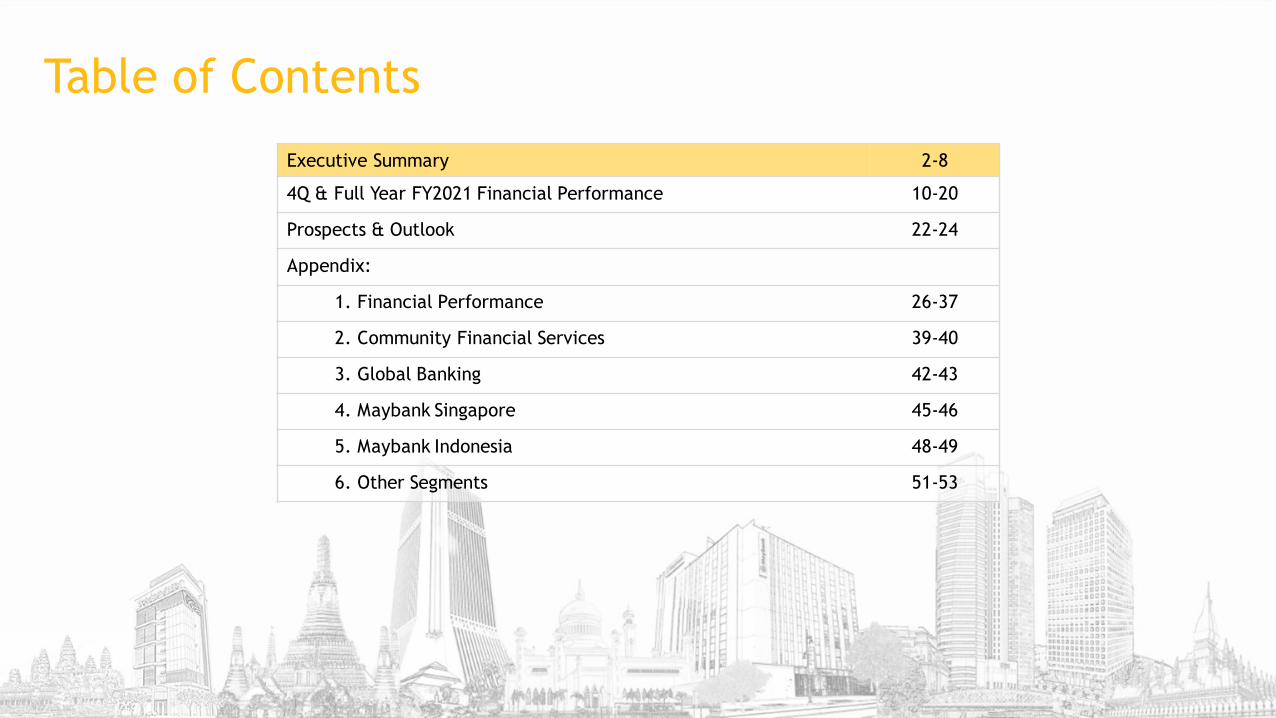
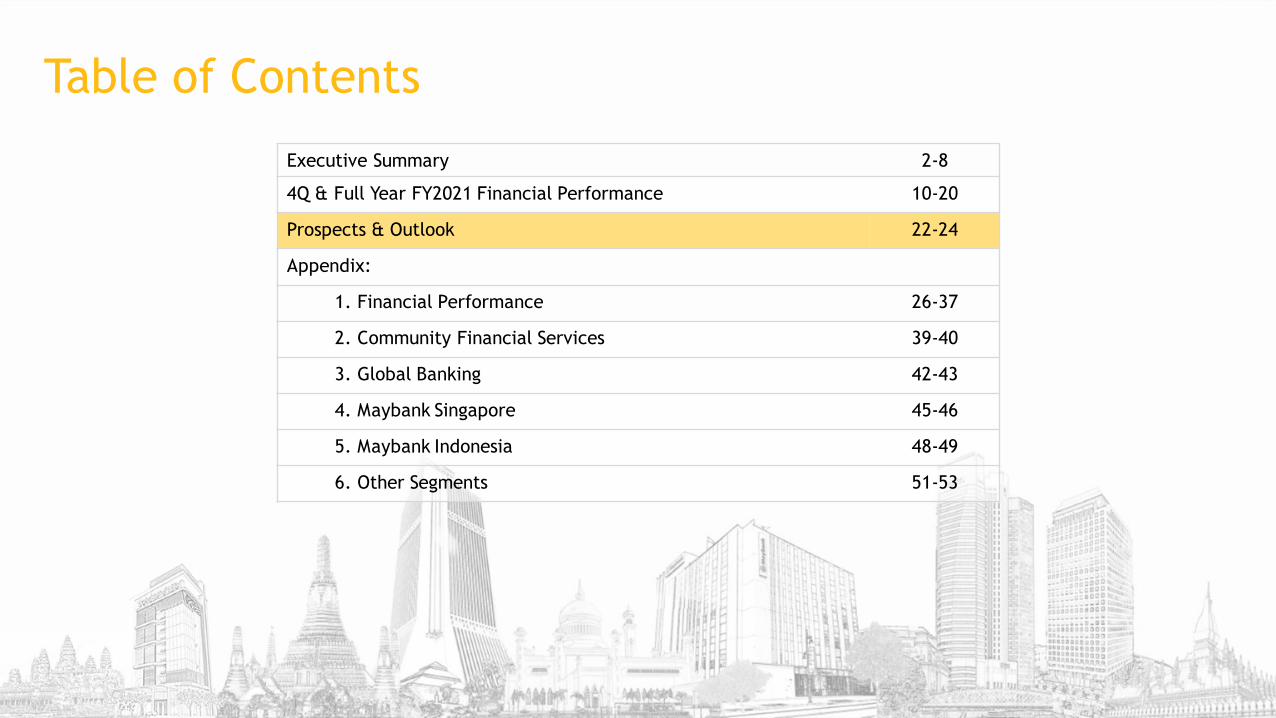
Executive Summary 2-8
4Q & Full Year FY2021 Financial Performance 10-20
Prospects & Outlook 22-24
Appendix:
1. Financial Performance 26-37
2. Community Financial Services 39-40
3. Global Banking 42-43
4. Maybank Singapore 45-46
5. Maybank Indonesia 48-49
6. Other Segments 51-53
Table of Contents
2
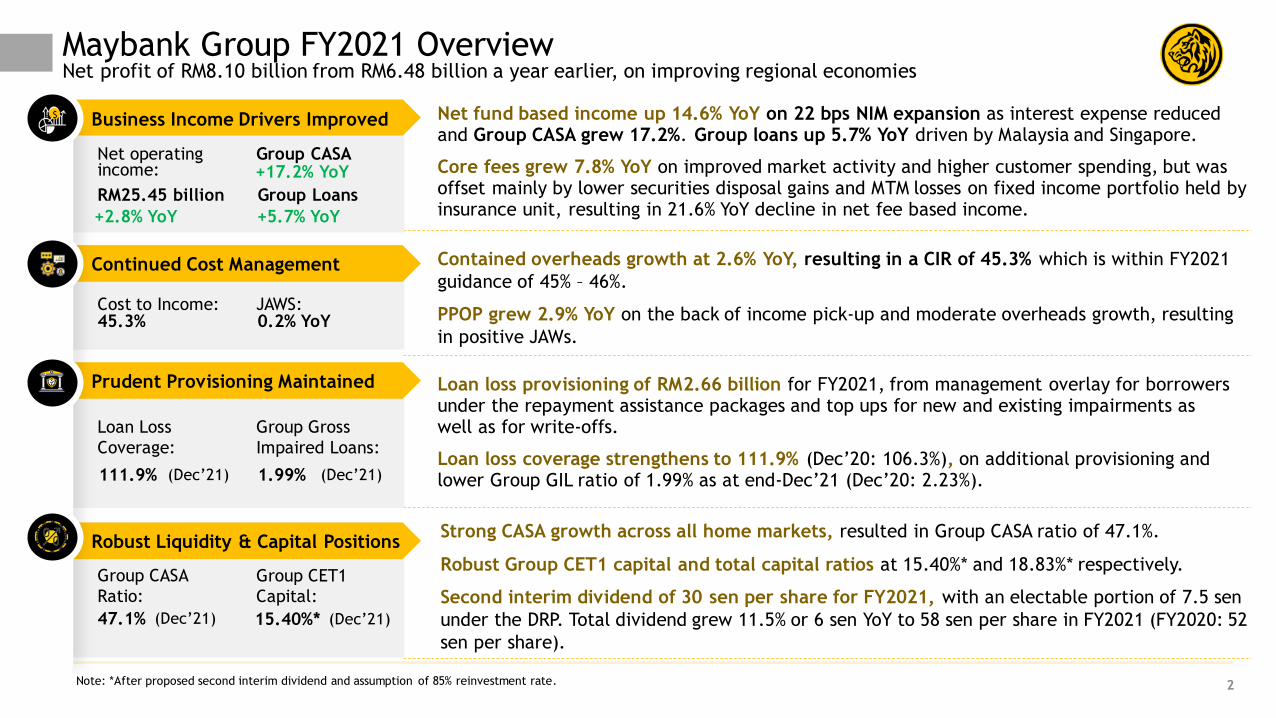
Net operating income:
RM25.45 billion
+2.8% YoY
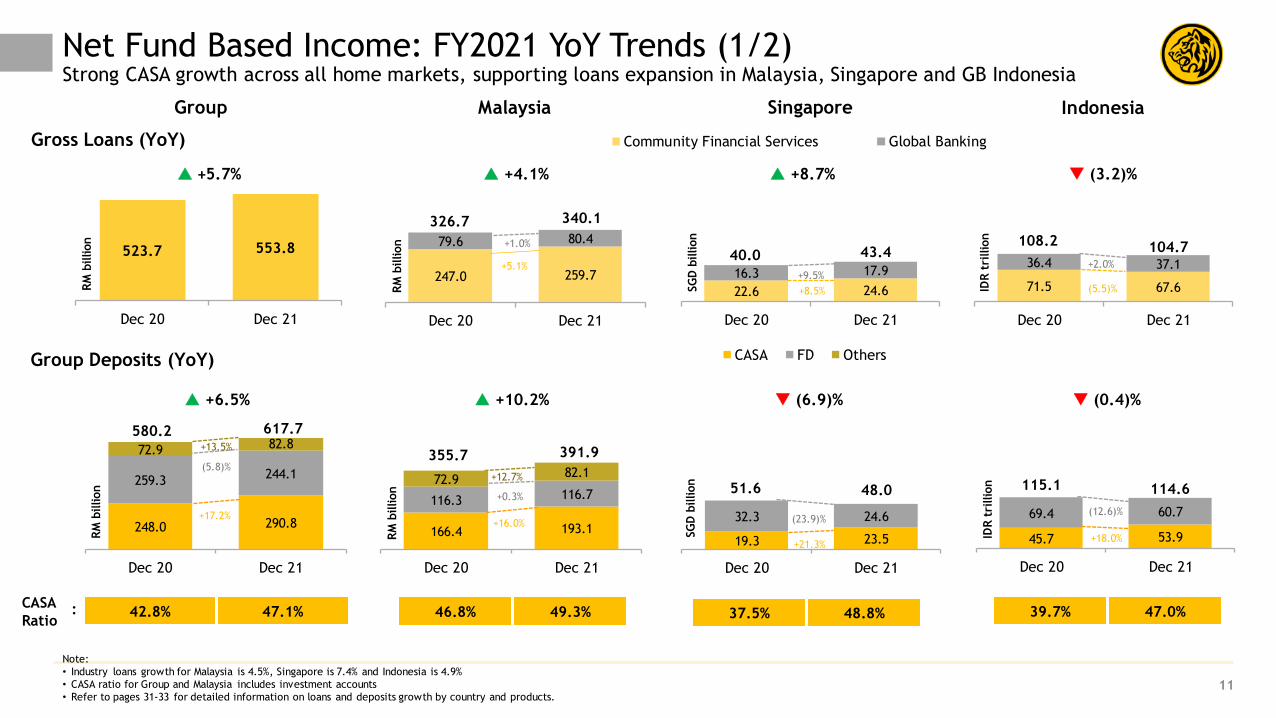
Net fund based income up 14.6% YoY on 22 bps NIM expansion as interest expense reduced and Group CASA grew 17.2%. Group loans up 5.7% YoY driven by Malaysia and Singapore.
Core fees grew 7.8% YoY on improved market activity and higher customer spending, but was offset mainly by lower securities disposal gains and MTM losses on fixed income portfolio held by insurance unit, resulting in 21.6% YoY decline in net fee based income.
Contained overheads growth at 2.6% YoY, resulting in a CIR of 45.3% which is within FY2021
guidance of 45% – 46%.
PPOP grew 2.9% YoY on the back of income pick-up and moderate overheads growth, resulting
in positive JAWs.
Cost to Income: JAWS: 45.3% 0.2% YoY
111.9%
Loan Loss
Coverage:
Group Gross
Impaired Loans:
1.99% (Dec’21)
Loan loss provisioning of RM2.66 billion for FY2021, from management overlay for borrowers under the repayment assistance packages and top ups for new and existing impairments as well as for write-offs.
Loan loss coverage strengthens to 111.9% (Dec’20: 106.3%), on additional provisioning and lower Group GIL ratio of 1.99% as at end-Dec’21 (Dec’20: 2.23%).
Strong CASA growth across all home markets, resulted in Group CASA ratio of 47.1%.
Robust Group CET1 capital and total capital ratios at 15.40%* and 18.83%* respectively.
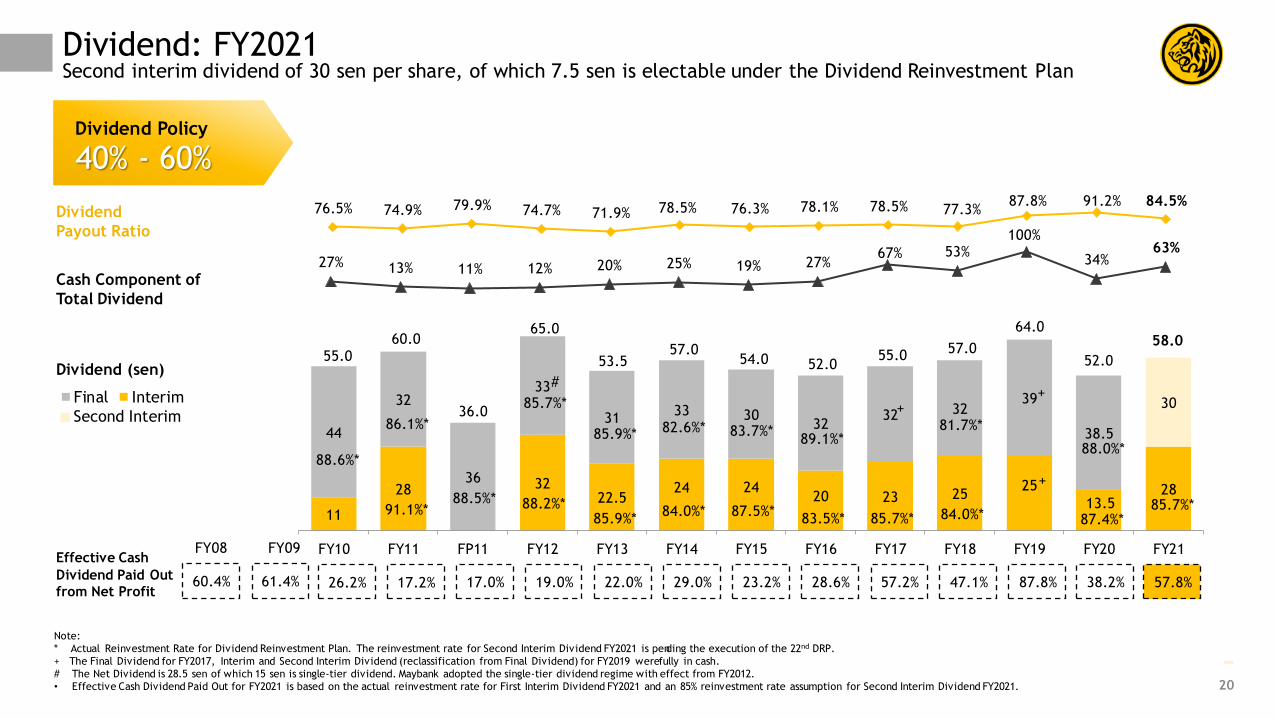
Second interim dividend of 30 sen per share for FY2021, with an electable portion of 7.5 sen
under the DRP. Total dividend grew 11.5% or 6 sen YoY to 58 sen per share in FY2021 (FY2020: 52
sen per share).
Group CASA
Ratio:
47.1%
Group CET1
Capital:
15.40%*
Note: *After proposed second interim dividend and assumption of 85% reinvestment rate.
(Dec’21)
Group CASA
Group Loans
+5.7% YoY
(Dec’21)
$ Business Income Drivers Improved
Continued Cost Management
Prudent Provisioning Maintained
Robust Liquidity & Capital Positions
(Dec’21)
Maybank Group FY2021 OverviewNet profit of RM8.10 billion from RM6.48 billion a year earlier, on improving regional economies
+17.2% YoY
3
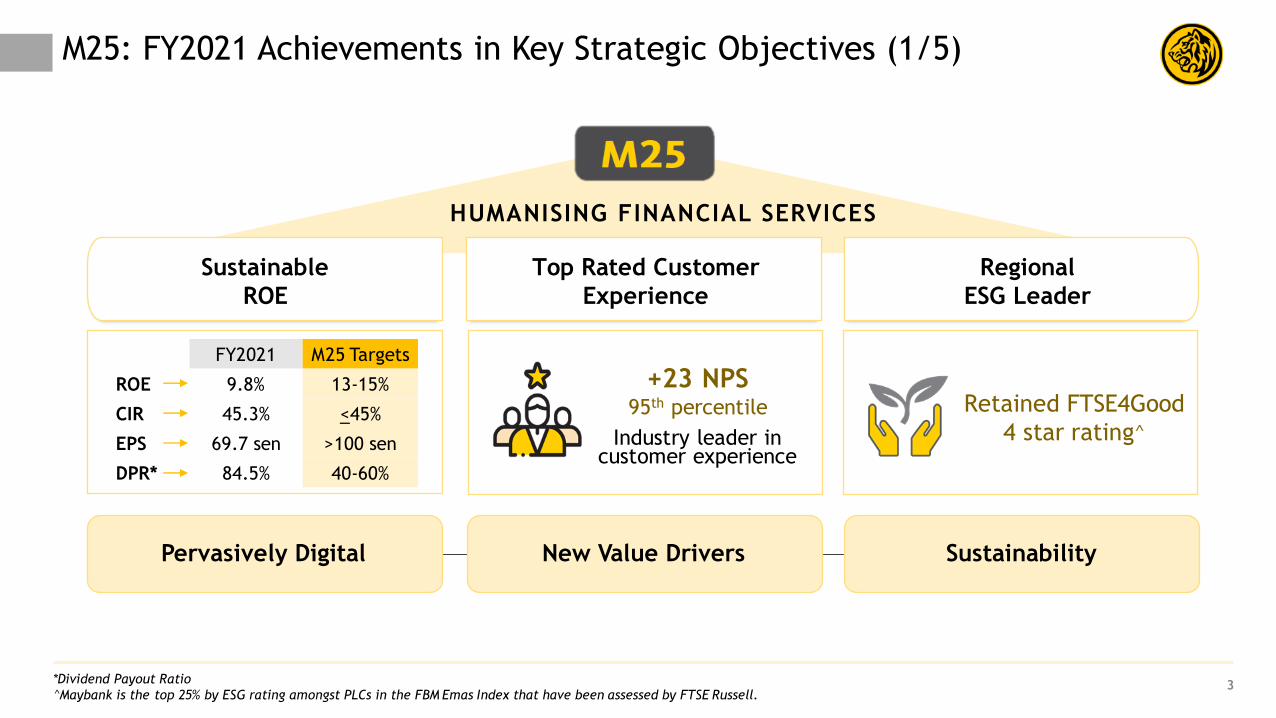
M25: FY2021 Achievements in Key Strategic Objectives (1/5)
FY2021 M25 Targets
ROE 9.8% 13-15%
CIR 45.3% <45%
EPS 69.7 sen >100 sen
DPR* 84.5% 40-60%
Retained
MSCI ESG AA rating
Pervasively Digital
HUMANISING FINANCIAL SERVICES
+23 NPS
Industry leader in customer experience
95th percentile
Sustainable
ROE
Top Rated Customer
Experience
Regional
ESG Leader
Retained FTSE4Good
4 star rating^
New Value Drivers Sustainability
*Dividend Payout Ratio
^Maybank is the top 25% by ESG rating amongst PLCs in the FBM Emas Index that have been assessed by FTSE Russell.
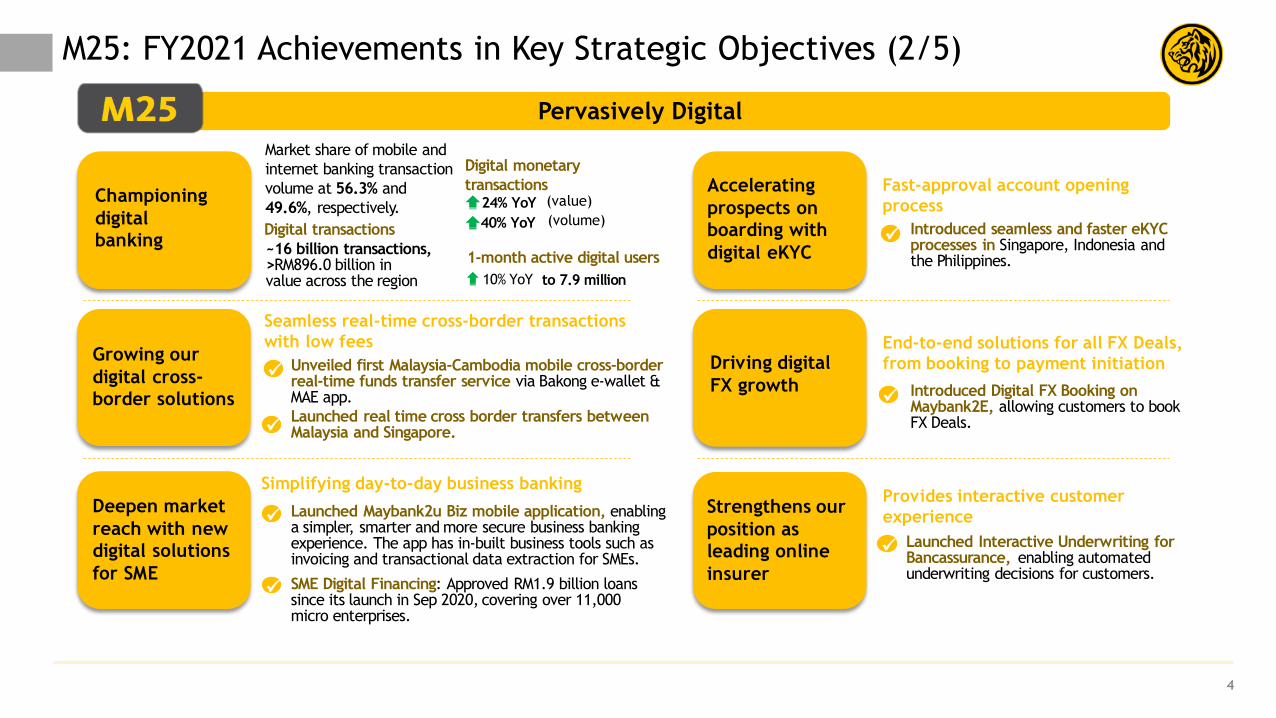
Pervasively Digital
4
Unveiled first Malaysia-Cambodia mobile cross-border real-time funds transfer service via Bakong e-wallet & MAE app.
Growing our
digital cross-
border solutionsLaunched real time cross border transfers between Malaysia and Singapore.
Championing
digital
banking
Market share of mobile and
internet banking transaction
volume at 56.3% and
49.6%, respectively.
~16 billion transactions, >RM896.0 billion in value across the region
Digital monetary
transactions24% YoY
40% YoY
(value)
(volume)Digital transactions
1-month active digital users
to 7.9 million10% YoY
Deepen market
reach with new
digital solutions
for SME
Launched Maybank2u Biz mobile application, enabling a simpler, smarter and more secure business banking experience. The app has in-built business tools such as invoicing and transactional data extraction for SMEs.
Accelerating
prospects on
boarding with
digital eKYC
Launched Interactive Underwriting for Bancassurance, enabling automated underwriting decisions for customers.
Introduced seamless and faster eKYCprocesses in Singapore, Indonesia and the Philippines.
Driving digital
FX growth Introduced Digital FX Booking on Maybank2E, allowing customers to book FX Deals.
Strengthens our
position as
leading online
insurer
M25: FY2021 Achievements in Key Strategic Objectives (2/5)
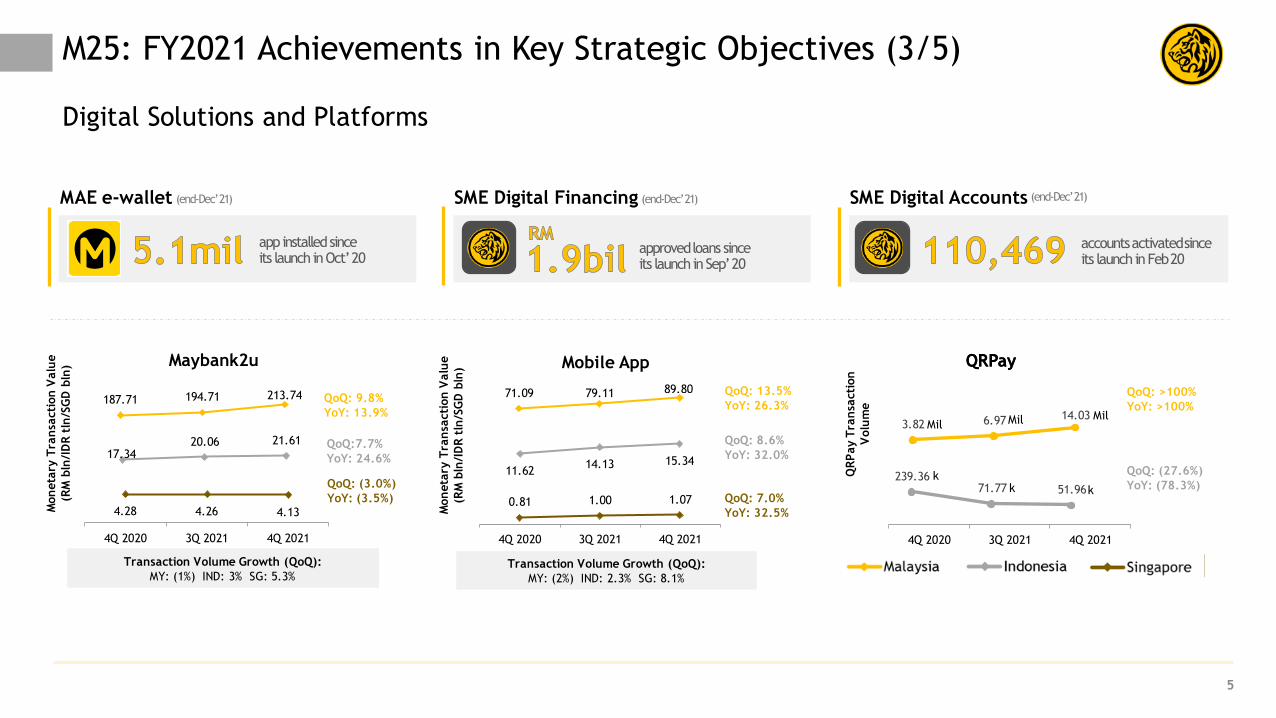
SME Digital Financing: Approved RM1.9 billion loans since its launch in Sep 2020, covering over 11,000 micro enterprises.
Seamless real-time cross-border transactions
with low fees
Simplifying day-to-day business banking
Fast-approval account opening
process
End-to-end solutions for all FX Deals,
from booking to payment initiation
Provides interactive customer
experience
5
(end-Dec’ 21)
app installed since its launch in Oct’ 20
MAE e-wallet SME Digital Financing
approved loans since its launch in Sep’ 20
SME Digital Accounts
accounts activated since its launch in Feb 20
(end-Dec’ 21) (end-Dec’ 21)
Digital Solutions and Platforms
4Q 2020 3Q 2021 4Q 2021
3.82 6.97 14.03
239.3671.77 51.96
QRPay
QR
Pay T
ran
sacti
on
Volu
me
QRPay
QoQ: >100%
YoY: >100%
QoQ: (27.6%)
YoY: (78.3%)
Mil Mil Mil
kk k
4.28 4.26 4.13
4Q 2020 3Q 2021 4Q 2021
Maybank2u
Mon
eta
ry T
ran
sacti
on
Valu
e
(RM
bln
/ID
R t
ln/S
GD
bln
)
187.71 194.71 213.74
17.3420.06 21.61
QoQ: 9.8%
YoY: 13.9%
QoQ:7.7%
YoY: 24.6%
QoQ: (3.0%)
YoY: (3.5%)
Transaction Volume Growth (QoQ):
MY: (1%) IND: 3% SG: 5.3%
71.09 79.11 89.80
0.81 1.00 1.07
4Q 2020 3Q 2021 4Q 2021
Mobile App
QoQ: 13.5%
YoY: 26.3%
QoQ: 8.6%
YoY: 32.0%
Transaction Volume Growth (QoQ):
MY: (2%) IND: 2.3% SG: 8.1%
Mon
eta
ry T
ran
sacti
on
Valu
e
(RM
bln
/ID
R t
ln/S
GD
bln
)11.62
14.13 15.34
QoQ: 7.0%
YoY: 32.5%
M25: FY2021 Achievements in Key Strategic Objectives (3/5)
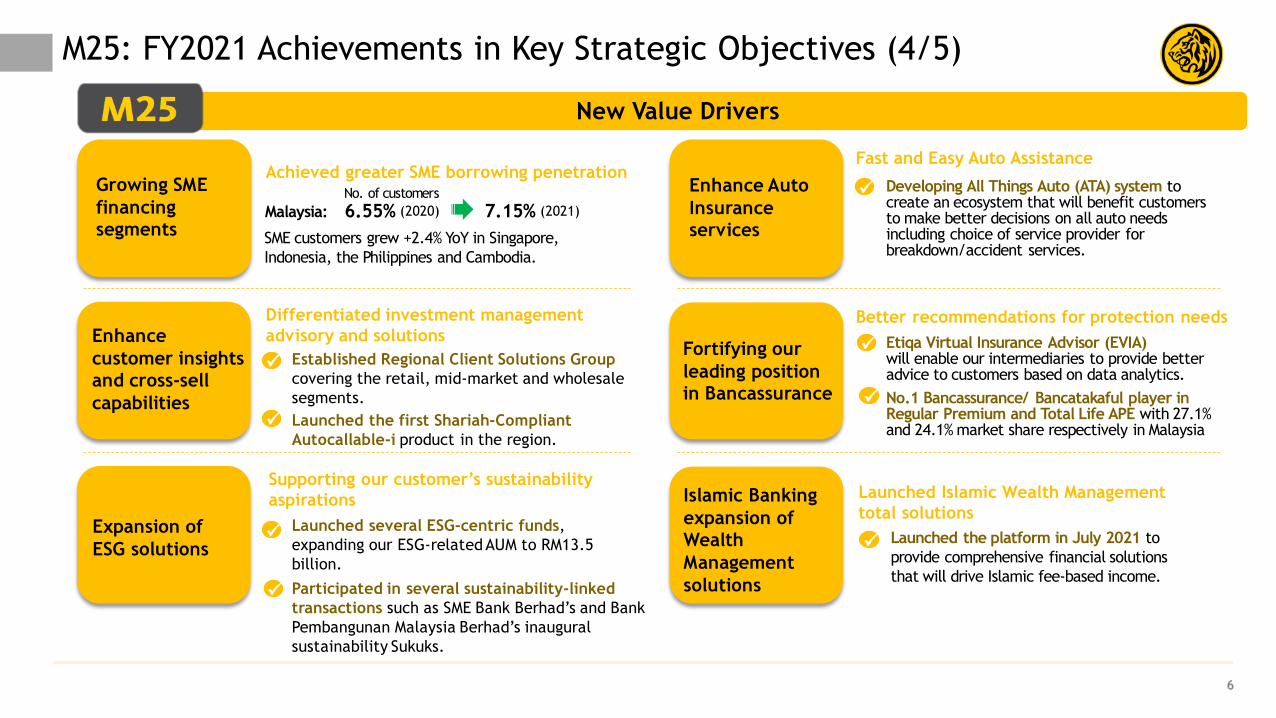
New Value Drivers
6
Enhance
customer insights
and cross-sell
capabilities
Growing SME
financing
segments
Expansion of
ESG solutions
Enhance Auto
Insurance
services
Fortifying our
leading position
in Bancassurance
Islamic Banking
expansion of
Wealth
Management
solutions
M25: FY2021 Achievements in Key Strategic Objectives (4/5)
Launched the platform in July 2021 to
provide comprehensive financial solutions
that will drive Islamic fee-based income.
Launched several ESG-centric funds,
expanding our ESG-related AUM to RM13.5
billion.
Established Regional Client Solutions Group
covering the retail, mid-market and wholesale
segments. No.1 Bancassurance/ Bancatakaful player in Regular Premium and Total Life APE with 27.1% and 24.1% market share respectively in Malaysia
Achieved greater SME borrowing penetration
SME customers grew +2.4% YoY in Singapore,
Indonesia, the Philippines and Cambodia.
7.15% (2021)6.55% (2020)Malaysia:
Launched the first Shariah-Compliant
Autocallable-i product in the region.
Participated in several sustainability-linked
transactions such as SME Bank Berhad’s and Bank
Pembangunan Malaysia Berhad’s inaugural
sustainability Sukuks.
Developing All Things Auto (ATA) system to create an ecosystem that will benefit customers to make better decisions on all auto needs including choice of service provider for breakdown/accident services.
Etiqa Virtual Insurance Advisor (EVIA) will enable our intermediaries to provide better advice to customers based on data analytics.
Differentiated investment management
advisory and solutions
Supporting our customer’s sustainability
aspirations
Fast and Easy Auto Assistance
Better recommendations for protection needs
Launched Islamic Wealth Management
total solutions
No. of customers
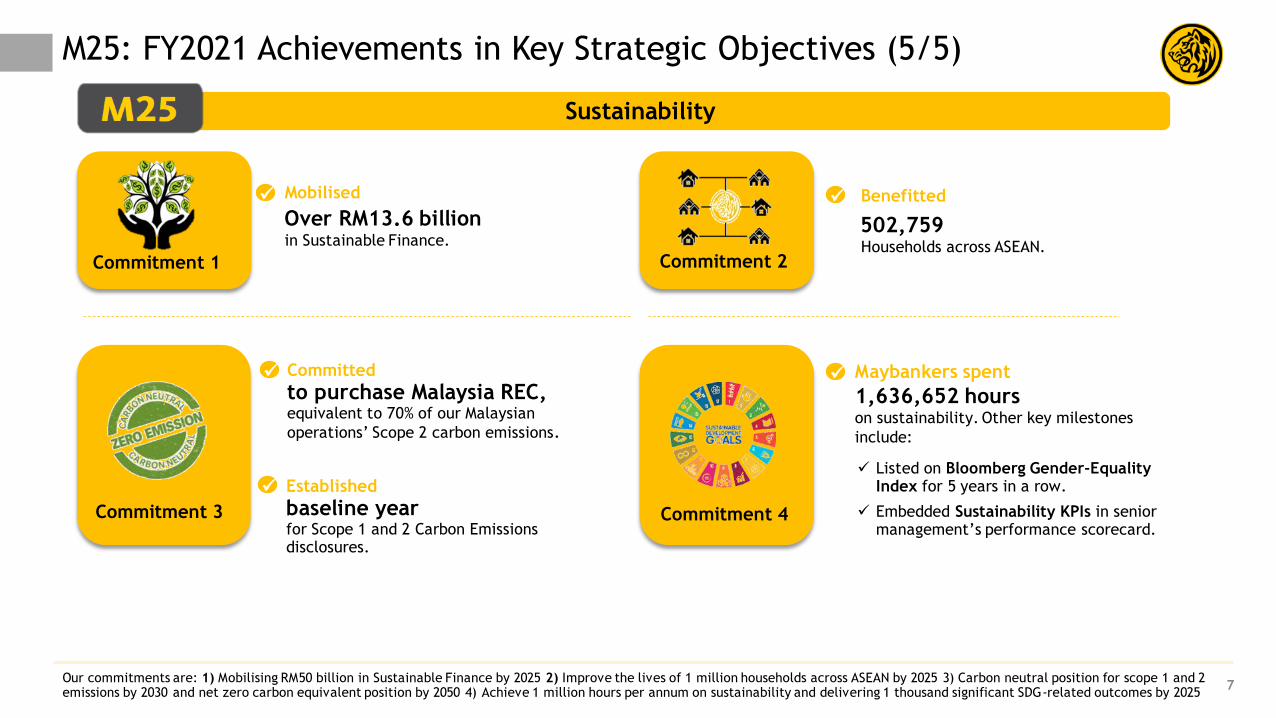
Sustainability
7Our commitments are: 1) Mobilising RM50 billion in Sustainable Finance by 2025 2) Improve the lives of 1 million households across ASEAN by 2025 3) Carbon neutral position for scope 1 and 2 emissions by 2030 and net zero carbon equivalent position by 2050 4) Achieve 1 million hours per annum on sustainability and delivering 1 thousand significant SDG-related outcomes by 2025
Commitment 3
Commitment 1 Commitment 2
Commitment 4
M25: FY2021 Achievements in Key Strategic Objectives (5/5)
Over RM13.6 billionin Sustainable Finance. Households across ASEAN.
502,759
Committed
to purchase Malaysia REC, equivalent to 70% of our Malaysian
operations’ Scope 2 carbon emissions.
Established
baseline year for Scope 1 and 2 Carbon Emissions disclosures.
Mobilised Benefitted
Listed on Bloomberg Gender-Equality Index for 5 years in a row.
Embedded Sustainability KPIs in senior management’s performance scorecard.
Maybankers spent
1,636,652 hours on sustainability. Other key milestones
include:
16.9%
27.1%30.6%
20.6%
6.7% 6.1% 3.9% 3.4%
13.4%15.3% 15.2%
12.4%
May'21 Aug'21 Nov'21 Feb'22
Malaysia
Singapore
Indonesia
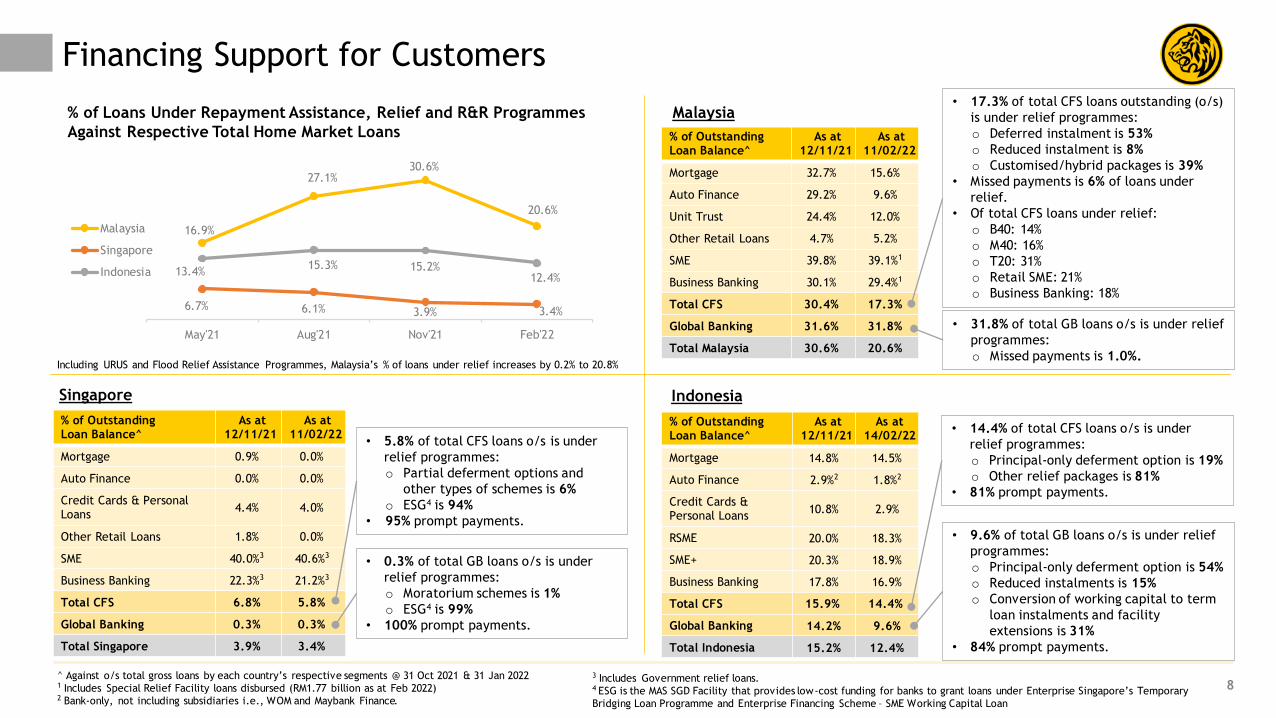
Financing Support for Customers
% of OutstandingLoan Balance^
As at 12/11/21
As at 11/02/22
Mortgage 32.7% 15.6%
Auto Finance 29.2% 9.6%
Unit Trust 24.4% 12.0%
Other Retail Loans 4.7% 5.2%
SME 39.8% 39.1%1
Business Banking 30.1% 29.4%1
Total CFS 30.4% 17.3%
Global Banking 31.6% 31.8%
Total Malaysia 30.6% 20.6%
% of Loans Under Repayment Assistance, Relief and R&R Programmes
Against Respective Total Home Market Loans
^ Against o/s total gross loans by each country’s respective segments @ 31 Oct 2021 & 31 Jan 20221 Includes Special Relief Facility loans disbursed (RM1.77 billion as at Feb 2022)2 Bank-only, not including subsidiaries i.e., WOM and Maybank Finance.
3 Includes Government relief loans. 4 ESG is the MAS SGD Facility that provides low-cost funding for banks to grant loans under Enterprise Singapore’s Temporary
Bridging Loan Programme and Enterprise Financing Scheme – SME Working Capital Loan
% of OutstandingLoan Balance^
As at 12/11/21
As at 11/02/22
Mortgage 0.9% 0.0%
Auto Finance 0.0% 0.0%
Credit Cards & Personal Loans
4.4% 4.0%
Other Retail Loans 1.8% 0.0%
SME 40.0%3 40.6%3
Business Banking 22.3%3 21.2%3
Total CFS 6.8% 5.8%
Global Banking 0.3% 0.3%
Total Singapore 3.9% 3.4%
% of OutstandingLoan Balance^
As at 12/11/21
As at 14/02/22
Mortgage 14.8% 14.5%
Auto Finance 2.9%2 1.8%2
Credit Cards & Personal Loans
10.8% 2.9%
RSME 20.0% 18.3%
SME+ 20.3% 18.9%
Business Banking 17.8% 16.9%
Total CFS 15.9% 14.4%
Global Banking 14.2% 9.6%
Total Indonesia 15.2% 12.4%
• 17.3% of total CFS loans outstanding (o/s)
is under relief programmes:
o Deferred instalment is 53%
o Reduced instalment is 8%
o Customised/hybrid packages is 39%
• Missed payments is 6% of loans under
relief.
• Of total CFS loans under relief:
o B40: 14%
o M40: 16%
o T20: 31%
o Retail SME: 21%
o Business Banking: 18%
Malaysia
• 31.8% of total GB loans o/s is under relief
programmes:
o Missed payments is 1.0%.
Indonesia
• 14.4% of total CFS loans o/s is under
relief programmes:
o Principal-only deferment option is 19%
o Other relief packages is 81%
• 81% prompt payments.
• 9.6% of total GB loans o/s is under relief
programmes:
o Principal-only deferment option is 54%
o Reduced instalments is 15%
o Conversion of working capital to term
loan instalments and facility
extensions is 31%
• 84% prompt payments.
Singapore
• 5.8% of total CFS loans o/s is under
relief programmes:
o Partial deferment options and
other types of schemes is 6%
o ESG4 is 94%
• 95% prompt payments.
• 0.3% of total GB loans o/s is under
relief programmes:
o Moratorium schemes is 1%
o ESG4 is 99%
• 100% prompt payments.
8
Including URUS and Flood Relief Assistance Programmes, Malaysia’s % of loans under relief increases by 0.2% to 20.8%
Executive Summary 2-8
4Q & Full Year FY2021 Financial Performance 10-20
Prospects & Outlook 22-24
Appendix:
1. Financial Performance 26-37
2. Community Financial Services 39-40
3. Global Banking 42-43
4. Maybank Singapore 45-46
5. Maybank Indonesia 48-49
6. Other Segments 51-53
Table of Contents
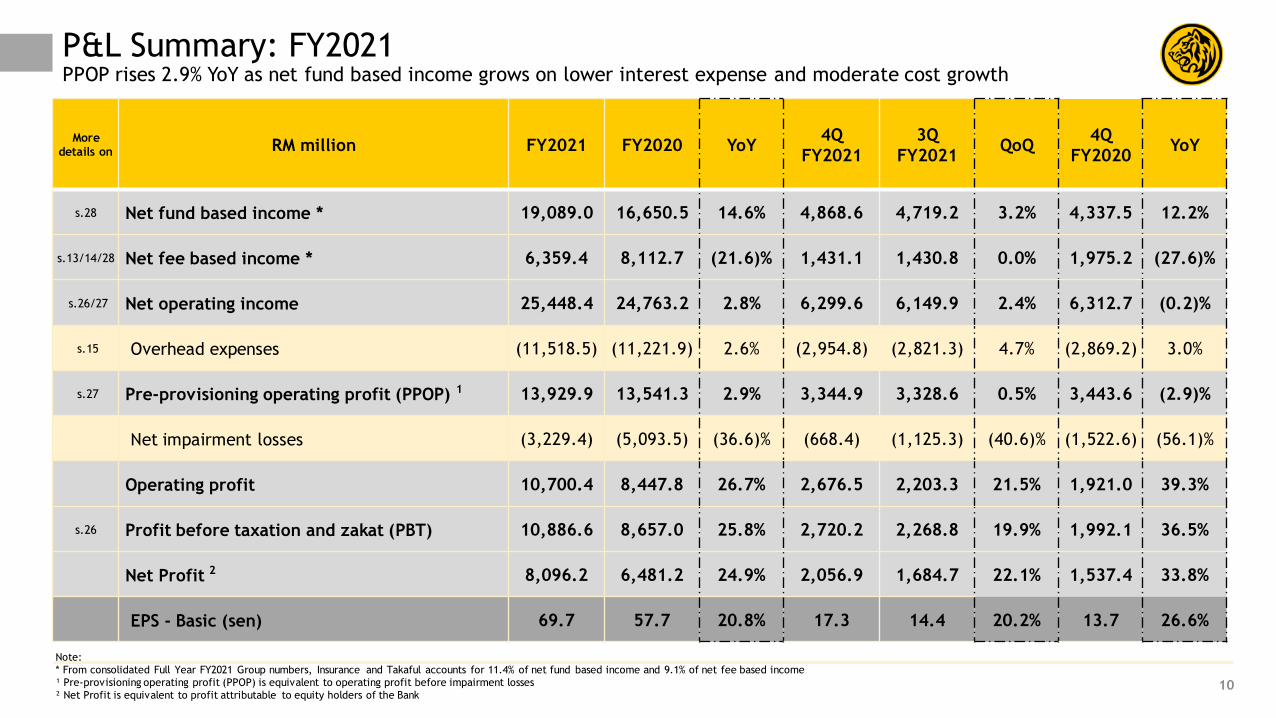
P&L Summary: FY2021PPOP rises 2.9% YoY as net fund based income grows on lower interest expense and moderate cost growth
10
Note:
* From consolidated Full Year FY2021 Group numbers, Insurance and Takaful accounts for 11.4% of net fund based income and 9.1% of net fee based income
¹ Pre-provisioning operating profit (PPOP) is equivalent to operating profit before impairment losses
² Net Profit is equivalent to profit attributable to equity holders of the Bank
More details on RM million FY2021 FY2020 YoY
4Q
FY2021
3Q
FY2021QoQ
4Q
FY2020YoY
s.28 Net fund based income * 19,089.0 16,650.5 14.6% 4,868.6 4,719.2 3.2% 4,337.5 12.2%
s.13/14/28 Net fee based income * 6,359.4 8,112.7 (21.6)% 1,431.1 1,430.8 0.0% 1,975.2 (27.6)%
s.26/27 Net operating income 25,448.4 24,763.2 2.8% 6,299.6 6,149.9 2.4% 6,312.7 (0.2)%
s.15 Overhead expenses (11,518.5) (11,221.9) 2.6% (2,954.8) (2,821.3) 4.7% (2,869.2) 3.0%
s.27 Pre-provisioning operating profit (PPOP) 1 13,929.9 13,541.3 2.9% 3,344.9 3,328.6 0.5% 3,443.6 (2.9)%
Net impairment losses (3,229.4) (5,093.5) (36.6)% (668.4) (1,125.3) (40.6)% (1,522.6) (56.1)%
Operating profit 10,700.4 8,447.8 26.7% 2,676.5 2,203.3 21.5% 1,921.0 39.3%
s.26 Profit before taxation and zakat (PBT) 10,886.6 8,657.0 25.8% 2,720.2 2,268.8 19.9% 1,992.1 36.5%
Net Profit 2 8,096.2 6,481.2 24.9% 2,056.9 1,684.7 22.1% 1,537.4 33.8%
EPS - Basic (sen) 69.7 57.7 20.8% 17.3 14.4 20.2% 13.7 26.6%
19.3 23.5
32.3 24.6
Dec 20 Dec 21
CASA FD Others
248.0 290.8
259.3244.1
72.9 82.8
Dec 20 Dec 21
22.6 24.6
16.3 17.9
Dec 20 Dec 21
Community Financial Services Global Banking
71.5 67.6
36.4 37.1
Dec 20 Dec 21
IDR
tri
llio
n
+2.0%+9.5%
166.4 193.1
116.3 116.772.9
82.1
Dec 20 Dec 21
+12.7%
+13.5%
+8.5%
45.7 53.9
69.4 60.7
Dec 20 Dec 21
(12.6)%+17.2%
247.0 259.7
79.6 80.4
Dec 20 Dec 21
Net Fund Based Income: FY2021 YoY Trends (1/2)Strong CASA growth across all home markets, supporting loans expansion in Malaysia, Singapore and GB Indonesia
11
(5.5)%
+5.1%
391.9(5.8)%
104.7523.7 553.8
Dec 20 Dec 21
326.7
43.4108.2
RM
billion
SG
D b
illion
Gross Loans (YoY)
+4.1% (3.2)% +5.7%
40.0
340.1
RM
billion
RM
billion
SG
D b
illion
IDR
tri
llio
n
Group Deposits (YoY)
37.5% 48.8%46.8% 49.3%42.8% 47.1% 39.7% 47.0%CASA
Ratio:
+0.3%
(23.9)%
580.2 617.7
355.7
51.6 48.0 115.1 114.6
+10.2% (6.9)% (0.4)% +6.5%
+18.0%
RM
billion +1.0%
Note:
• Industry loans growth for Malaysia is 4.5%, Singapore is 7.4% and Indonesia is 4.9%
• CASA ratio for Group and Malaysia includes investment accounts
• Refer to pages 31-33 for detailed information on loans and deposits growth by country and products.
+16.0%
+21.3%
Group Malaysia Singapore Indonesia
+8.7%
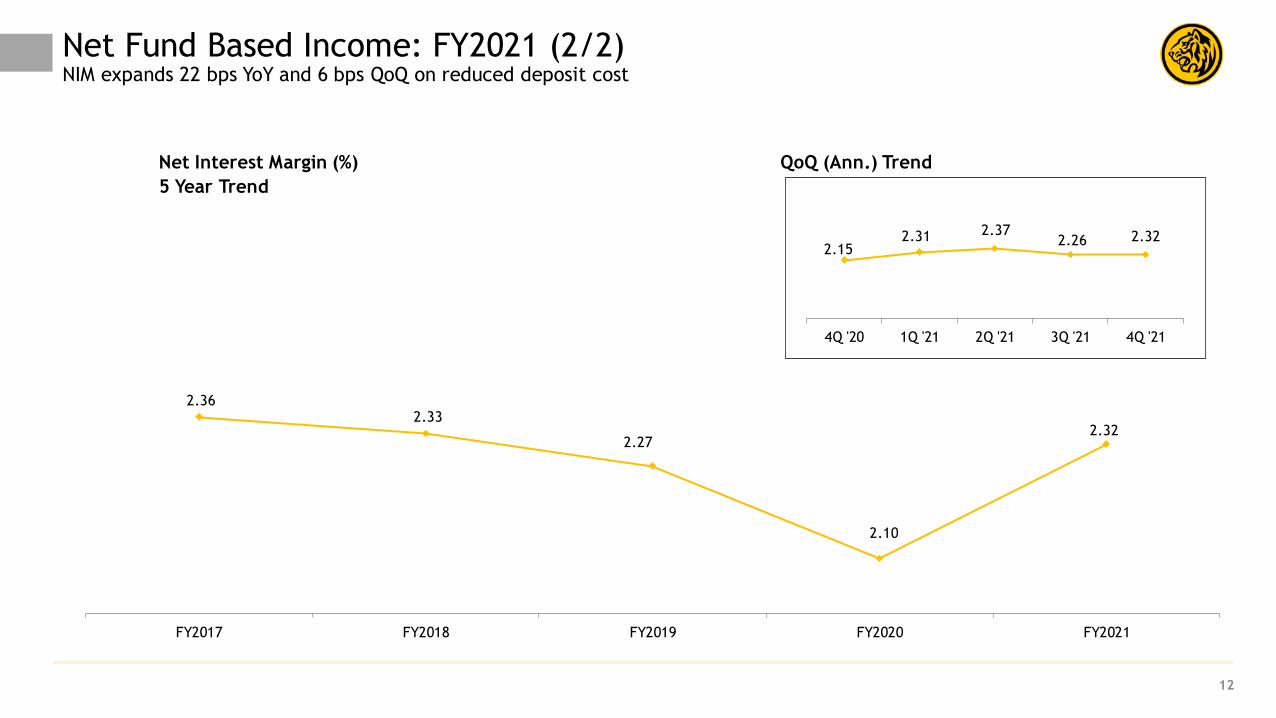
2.36 2.33
2.27
2.10
2.32
FY2017 FY2018 FY2019 FY2020 FY2021
12
Net Fund Based Income: FY2021 (2/2)NIM expands 22 bps YoY and 6 bps QoQ on reduced deposit cost
5 Year Trend
Net Interest Margin (%) QoQ (Ann.) Trend
2.15 2.31 2.37
2.26 2.32
4Q '20 1Q '21 2Q '21 3Q '21 4Q '21
8,113
6,479
575 1,059
6,359
5,033
518 809
Total Other Operating Income fromBanking Operations
Fee Income fromIslamic Operations
Net Fee Incomefrom Insurance
FY2020
FY2021
(23.6)% YoY
13
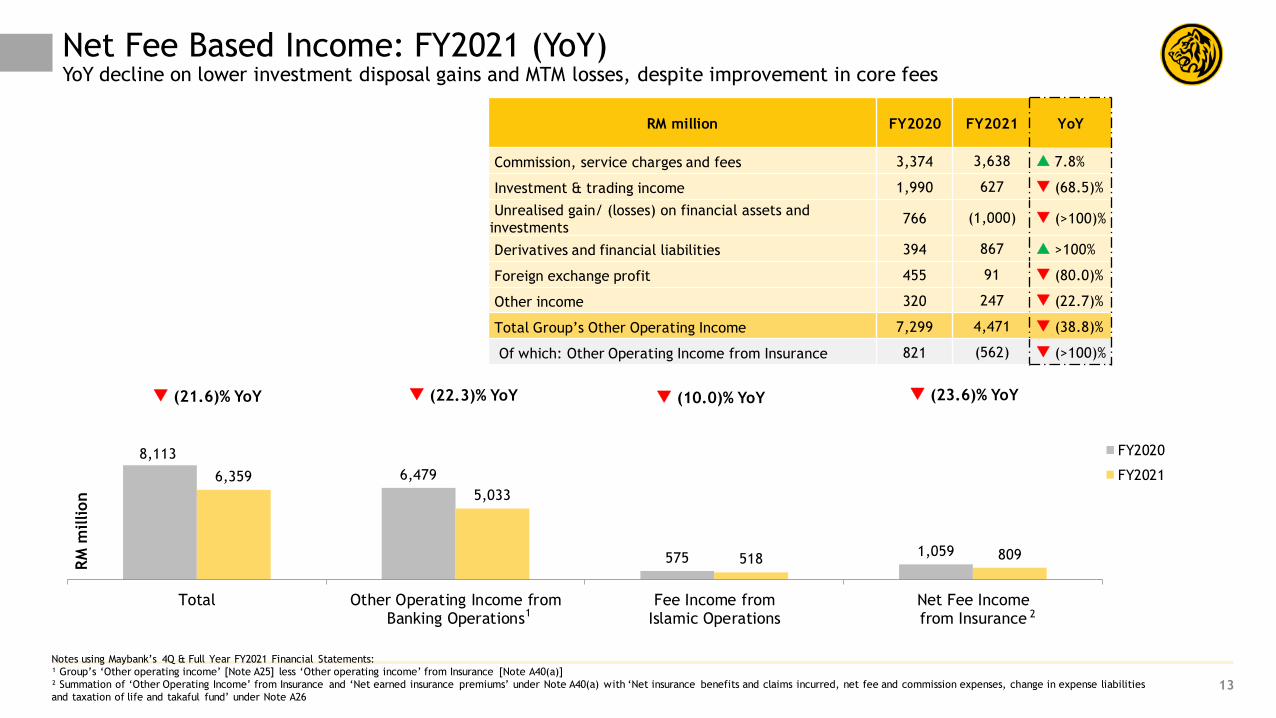
Net Fee Based Income: FY2021 (YoY)YoY decline on lower investment disposal gains and MTM losses, despite improvement in core fees
RM million FY2020 FY2021 YoY
Commission, service charges and fees 3,374 3,638 7.8%
Investment & trading income 1,990 627 (68.5)%
Unrealised gain/ (losses) on financial assets and
investments766 (1,000) (>100)%
Derivatives and financial liabilities 394 867 >100%
Foreign exchange profit 455 91 (80.0)%
Other income 320 247 (22.7)%
Total Group’s Other Operating Income 7,299 4,471 (38.8)%
Of which: Other Operating Income from Insurance 821 (562) (>100)%
RM
million
1 2
Notes using Maybank’s 4Q & Full Year FY2021 Financial Statements:
¹ Group’s ‘Other operating income’ [Note A25] less ‘Other operating income’ from Insurance [Note A40(a)]
² Summation of ‘Other Operating Income’ from Insurance and ‘Net earned insurance premiums’ under Note A40(a) with ‘Net insurance benefits and claims incurred, net fee and commission expenses, change in expense liabilities
and taxation of life and takaful fund’ under Note A26
(10.0)% YoY (22.3)% YoY (21.6)% YoY
14
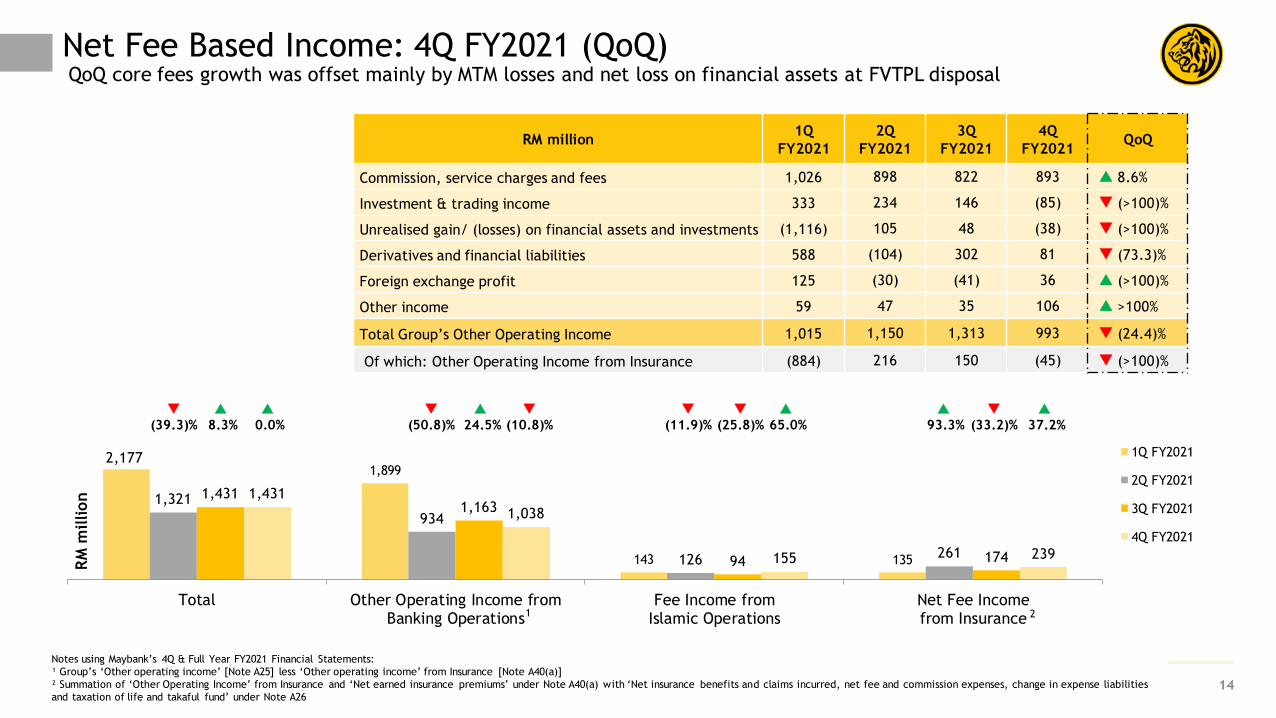
Net Fee Based Income: 4Q FY2021 (QoQ)QoQ core fees growth was offset mainly by MTM losses and net loss on financial assets at FVTPL disposal
2,177 1,899
143 135
1,321
934
126 261
1,431 1,163
94 174
1,431
1,038
155 239
Total Other Operating Income fromBanking Operations
Fee Income fromIslamic Operations
Net Fee Incomefrom Insurance
1Q FY2021
2Q FY2021
3Q FY2021
4Q FY2021
RM million1Q
FY2021
2Q
FY2021
3Q
FY2021
4Q
FY2021QoQ
Commission, service charges and fees 1,026 898 822 893 8.6%
Investment & trading income 333 234 146 (85) (>100)%
Unrealised gain/ (losses) on financial assets and investments (1,116) 105 48 (38) (>100)%
Derivatives and financial liabilities 588 (104) 302 81 (73.3)%
Foreign exchange profit 125 (30) (41) 36 (>100)%
Other income 59 47 35 106 >100%
Total Group’s Other Operating Income 1,015 1,150 1,313 993 (24.4)%
Of which: Other Operating Income from Insurance (884) 216 150 (45) (>100)%
65.0%
(25.8)%
(11.9)%
(50.8)%
24.5%
(10.8)%
(33.2)%
37.2%
93.3%
0.0%
8.3%
(39.3)%
RM
million
1 2
Notes using Maybank’s 4Q & Full Year FY2021 Financial Statements:
¹ Group’s ‘Other operating income’ [Note A25] less ‘Other operating income’ from Insurance [Note A40(a)]
² Summation of ‘Other Operating Income’ from Insurance and ‘Net earned insurance premiums’ under Note A40(a) with ‘Net insurance benefits and claims incurred, net fee and commission expenses, change in expense liabilities
and taxation of life and takaful fund’ under Note A26
15
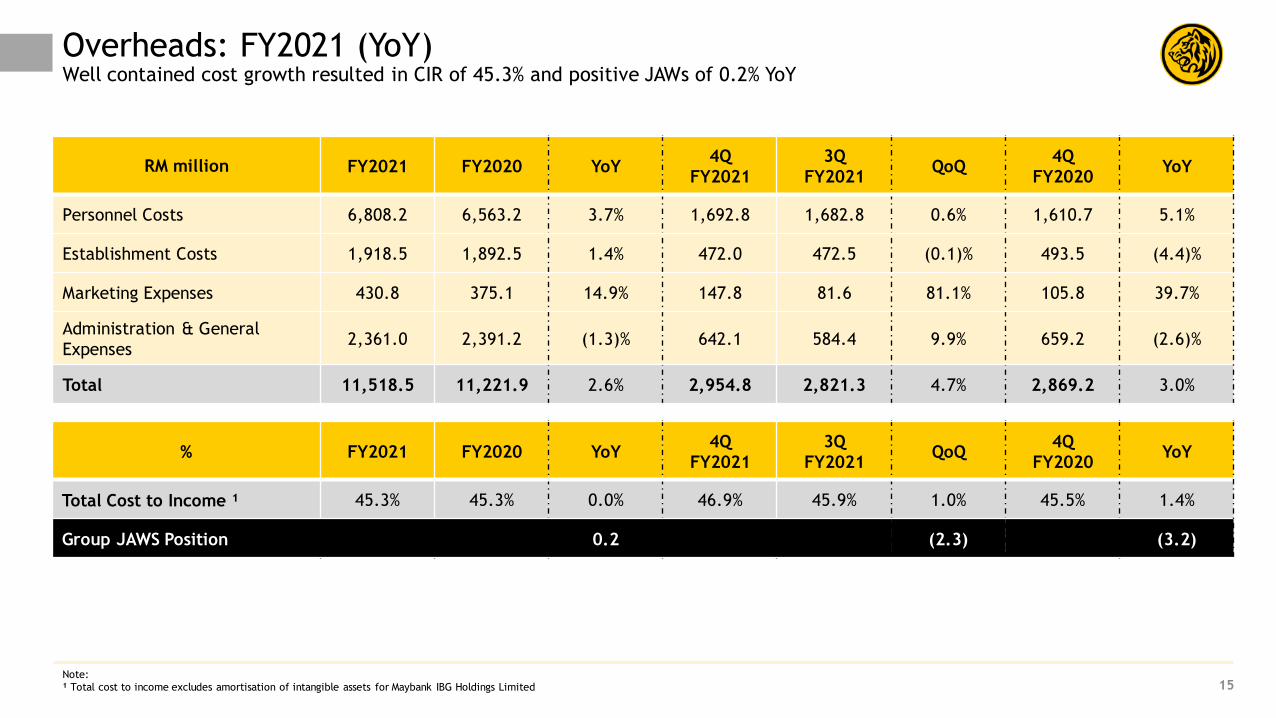
Overheads: FY2021 (YoY)Well contained cost growth resulted in CIR of 45.3% and positive JAWs of 0.2% YoY
Note:
¹ Total cost to income excludes amortisation of intangible assets for Maybank IBG Holdings Limited
RM million FY2021 FY2020 YoY4Q
FY2021
3Q
FY2021QoQ
4Q
FY2020YoY
Personnel Costs 6,808.2 6,563.2 3.7% 1,692.8 1,682.8 0.6% 1,610.7 5.1%
Establishment Costs 1,918.5 1,892.5 1.4% 472.0 472.5 (0.1)% 493.5 (4.4)%
Marketing Expenses 430.8 375.1 14.9% 147.8 81.6 81.1% 105.8 39.7%
Administration & General
Expenses 2,361.0 2,391.2 (1.3)% 642.1 584.4 9.9% 659.2 (2.6)%
Total 11,518.5 11,221.9 2.6% 2,954.8 2,821.3 4.7% 2,869.2 3.0%
% FY2021 FY2020 YoY4Q
FY2021
3Q
FY2021QoQ
4Q
FY2020YoY
Total Cost to Income ¹ 45.3% 45.3% 0.0% 46.9% 45.9% 1.0% 45.5% 1.4%
Group JAWS Position 0.2 (2.3) (3.2)
16
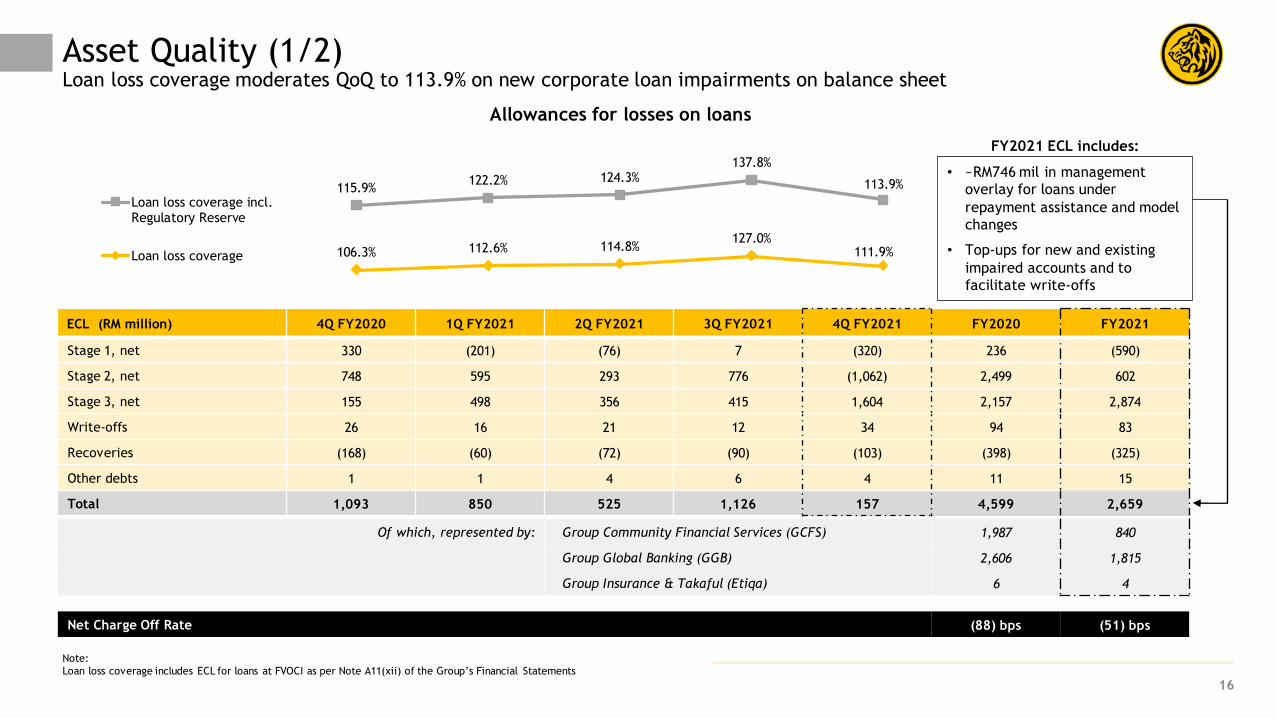
Asset Quality (1/2)Loan loss coverage moderates QoQ to 113.9% on new corporate loan impairments on balance sheet
Allowances for losses on loans
Note:
Loan loss coverage includes ECL for loans at FVOCI as per Note A11(xii) of the Group’s Financial Statements
FY2021 ECL includes:
• ~RM746 mil in management
overlay for loans under
repayment assistance and model
changes
• Top-ups for new and existing
impaired accounts and to
facilitate write-offs
ECL (RM million) 4Q FY2020 1Q FY2021 2Q FY2021 3Q FY2021 4Q FY2021 FY2020 FY2021
Stage 1, net 330 (201) (76) 7 (320) 236 (590)
Stage 2, net 748 595 293 776 (1,062) 2,499 602
Stage 3, net 155 498 356 415 1,604 2,157 2,874
Write-offs 26 16 21 12 34 94 83
Recoveries (168) (60) (72) (90) (103) (398) (325)
Other debts 1 1 4 6 4 11 15
Total 1,093 850 525 1,126 157 4,599 2,659
Of which, represented by: Group Community Financial Services (GCFS) 1,987 840
Group Global Banking (GGB) 2,606 1,815
Group Insurance & Takaful (Etiqa) 6 4
Net Charge Off Rate (88) bps (51) bps
106.3% 112.6% 114.8%127.0%
111.9%
115.9%122.2% 124.3%
137.8%
113.9%
Loan loss coverage incl.Regulatory Reserve
Loan loss coverage
17
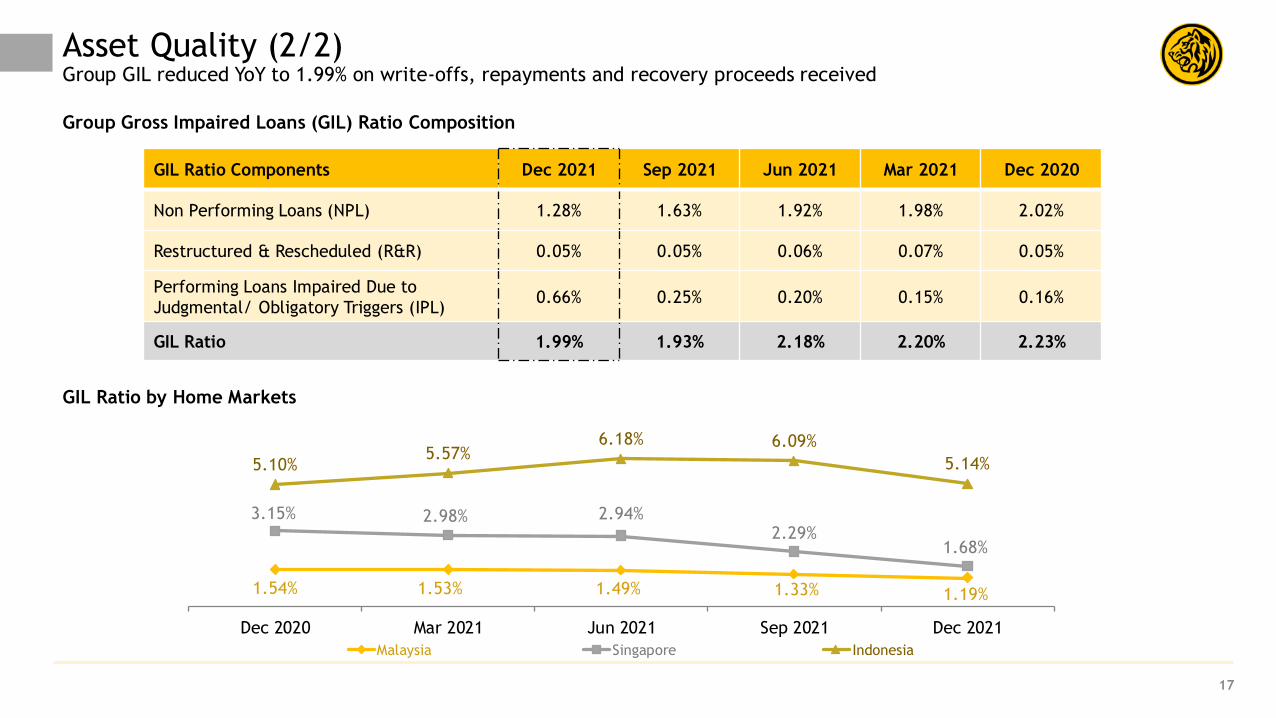
Asset Quality (2/2)Group GIL reduced YoY to 1.99% on write-offs, repayments and recovery proceeds received
1.54% 1.53% 1.49% 1.33% 1.19%
3.15% 2.98% 2.94%2.29%
1.68%
5.10%5.57%
6.18% 6.09%
5.14%
Dec 2020 Mar 2021 Jun 2021 Sep 2021 Dec 2021
Malaysia Singapore Indonesia
GIL Ratio Components Dec 2021 Sep 2021 Jun 2021 Mar 2021 Dec 2020
Non Performing Loans (NPL) 1.28% 1.63% 1.92% 1.98% 2.02%
Restructured & Rescheduled (R&R) 0.05% 0.05% 0.06% 0.07% 0.05%
Performing Loans Impaired Due to
Judgmental/ Obligatory Triggers (IPL)0.66% 0.25% 0.20% 0.15% 0.16%
GIL Ratio 1.99% 1.93% 2.18% 2.20% 2.23%
Group Gross Impaired Loans (GIL) Ratio Composition
GIL Ratio by Home Markets
18
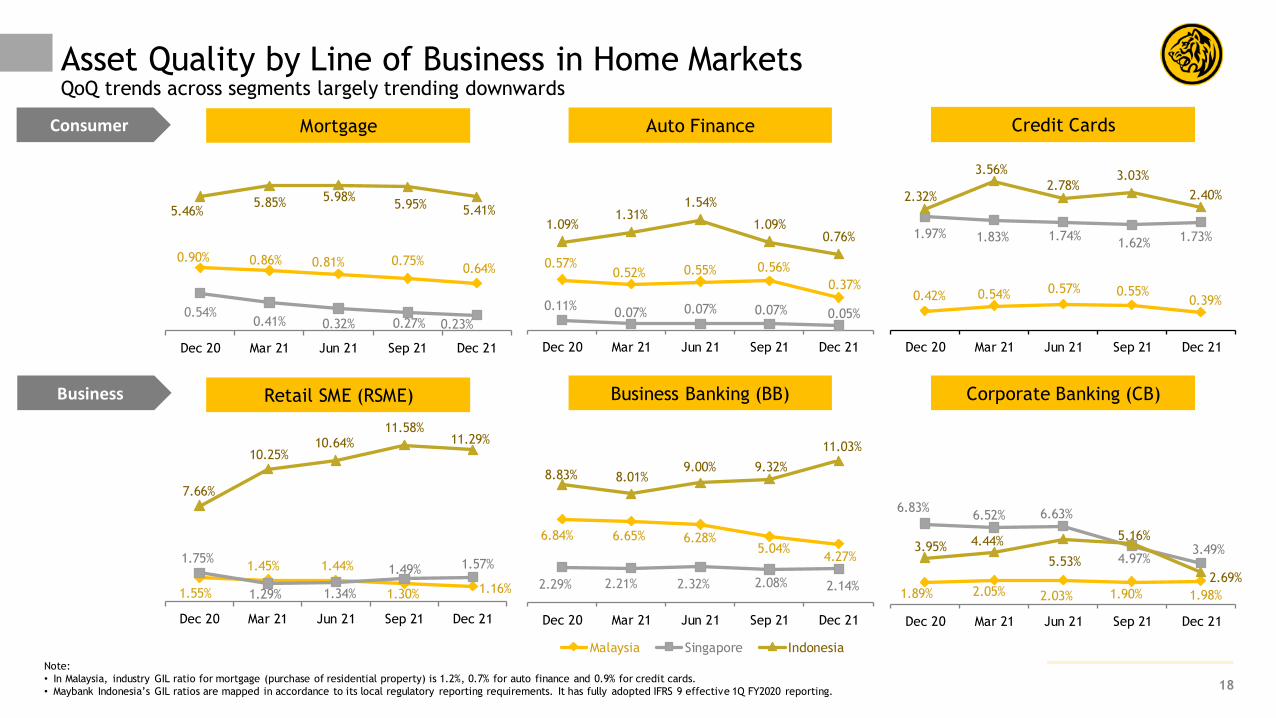
Asset Quality by Line of Business in Home MarketsQoQ trends across segments largely trending downwards
Note:
• In Malaysia, industry GIL ratio for mortgage (purchase of residential property) is 1.2%, 0.7% for auto finance and 0.9% for credit cards.
• Maybank Indonesia’s GIL ratios are mapped in accordance to its local regulatory reporting requirements. It has fully adopted IFRS 9 effective 1Q FY2020 reporting.
0.42% 0.54% 0.57% 0.55%0.39%
1.97% 1.83% 1.74%1.62%
1.73%
2.32%
3.56%
2.78%3.03%
2.40%
Dec 20 Mar 21 Jun 21 Sep 21 Dec 21
6.84% 6.65% 6.28%5.04%
4.27%
2.29% 2.21% 2.32% 2.08% 2.14%
8.83% 8.01%9.00% 9.32%
11.03%
Dec 20 Mar 21 Jun 21 Sep 21 Dec 21
Malaysia Singapore Indonesia
Mortgage Auto Finance Credit Cards
Retail SME (RSME) Business Banking (BB) Corporate Banking (CB)
Consumer
Business
0.90% 0.86% 0.81% 0.75%0.64%
0.54%0.41% 0.32% 0.27% 0.23%
5.46%5.85% 5.98%
5.95% 5.41%
Dec 20 Mar 21 Jun 21 Sep 21 Dec 21
0.57%0.52% 0.55% 0.56%
0.37%
0.11%0.07% 0.07% 0.07% 0.05%
1.09%1.31%
1.54%
1.09%0.76%
Dec 20 Mar 21 Jun 21 Sep 21 Dec 21
1.89% 2.05% 2.03% 1.90% 1.98%
6.83%6.52% 6.63%
4.97%3.49%3.95% 4.44%
5.53%
5.16%
2.69%
Dec 20 Mar 21 Jun 21 Sep 21 Dec 21
1.55%
1.45% 1.44%
1.30% 1.16%
1.75%
1.29% 1.34%
1.49% 1.57%
7.66%
10.25%10.64%
11.58%11.29%
Dec 20 Mar 21 Jun 21 Sep 21 Dec 21
90.1%89.0% 89.3% 88.9% 89.5%
83.3% 82.4% 83.0% 82.2%83.3%
73.2% 72.7% 73.2% 72.7% 73.5%
Dec 20 Mar 21 Jun 21 Sep 21 Dec 21
LDR LTF LTFE
142.0% 138.5% 137.2% 138.1% 136.4%
LCR
15.58% 15.46% 14.28%
16.34% 16.22% 15.04%
18.64% 18.79%17.60%
Dec 20 Dec 21 Dec 21
15.31% 16.09% 15.40%
16.03% 16.81% 16.12%
18.68% 19.52% 18.83%
Dec 20 Dec 21 Dec 21
Total Capital Ratio Tier 1 Capital Ratio CET 1 Capital Ratio
After proposed dividend,
assuming 85%
reinvestment rate
Before proposed dividendLiquidity Risk Indicators
19
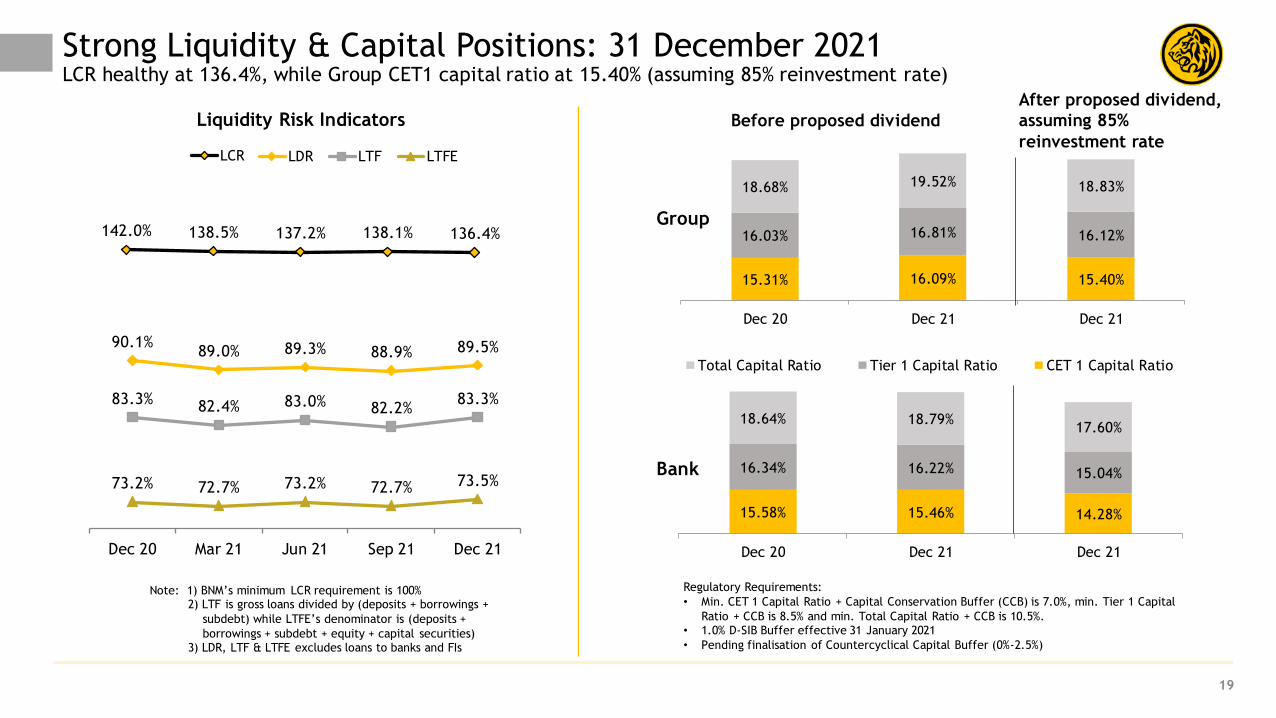
Strong Liquidity & Capital Positions: 31 December 2021LCR healthy at 136.4%, while Group CET1 capital ratio at 15.40% (assuming 85% reinvestment rate)
Regulatory Requirements:
• Min. CET 1 Capital Ratio + Capital Conservation Buffer (CCB) is 7.0%, min. Tier 1 Capital
Ratio + CCB is 8.5% and min. Total Capital Ratio + CCB is 10.5%.• 1.0% D-SIB Buffer effective 31 January 2021
• Pending finalisation of Countercyclical Capital Buffer (0%-2.5%)
Note: 1) BNM’s minimum LCR requirement is 100%2) LTF is gross loans divided by (deposits + borrowings +
subdebt) while LTFE’s denominator is (deposits +
borrowings + subdebt + equity + capital securities)3) LDR, LTF & LTFE excludes loans to banks and FIs
Group
Bank
40% - 60%Dividend Policy
11
28 3222.5
24 2420 23 25
25
13.528
44
32
36
33
3133 30
3232 32
39
38.5
30
FY10 FY11 FP11 FY12 FY13 FY14 FY15 FY16 FY17 FY18 FY19 FY20 FY21
Final Interim
76.5% 74.9% 79.9% 74.7% 71.9% 78.5% 76.3% 78.1% 78.5% 77.3%87.8% 91.2% 84.5%
Dividend
Payout Ratio
Cash Component of
Total Dividend
Effective Cash
Dividend Paid Out
from Net Profit
27% 13% 11% 12% 20% 25% 19% 27%67% 53%
100%
34%63%
26.2% 17.2% 17.0% 19.0% 22.0% 29.0% 23.2% 28.6% 57.2% 47.1% 87.8% 38.2% 57.8%
65.0 64.0
85.9%*
85.7%*
88.2%*85.9%*
88.5%*91.1%*
86.1%*
88.6%*
82.6%*
84.0%*
83.7%*
87.5%*
89.1%*
83.5%* 85.7%* 84.0%*
+81.7%*
+
+
#
55.060.0
36.0
53.557.0
54.0 52.055.0 57.0
88.0%*
52.0
58.0
FY08 FY09
60.4% 61.4%
Dividend (sen)
Note:
* Actual Reinvestment Rate for Dividend Reinvestment Plan. The reinvestment rate for Second Interim Dividend FY2021 is pending the execution of the 22nd DRP.
+ The Final Dividend for FY2017, Interim and Second Interim Dividend (reclassification from Final Dividend) for FY2019 werefully in cash.
# The Net Dividend is 28.5 sen of which 15 sen is single-tier dividend. Maybank adopted the single-tier dividend regime with effect from FY2012.
• Effective Cash Dividend Paid Out for FY2021 is based on the actual reinvestment rate for First Interim Dividend FY2021 and an 85% reinvestment rate assumption for Second Interim Dividend FY2021. 20
Dividend: FY2021Second interim dividend of 30 sen per share, of which 7.5 sen is electable under the Dividend Reinvestment Plan
Second Interim
85.7%*87.4%*
Executive Summary 2-8
4Q & Full Year FY2021 Financial Performance 10-20
Prospects & Outlook 22-24
Appendix:
1. Financial Performance 26-37
2. Community Financial Services 39-40
3. Global Banking 42-43
4. Maybank Singapore 45-46
5. Maybank Indonesia 48-49
6. Other Segments 51-53
Table of Contents
>>>>>
>>>>>
2022 (f) 2021
GDP 3.8% 7.6%
System loan 7.5% - 9.0% 7.4%
3M SIBOR 0.98% 0.44%
USD/SGD 1.30 1.35
Inflation average 3.6% 2.3%
22
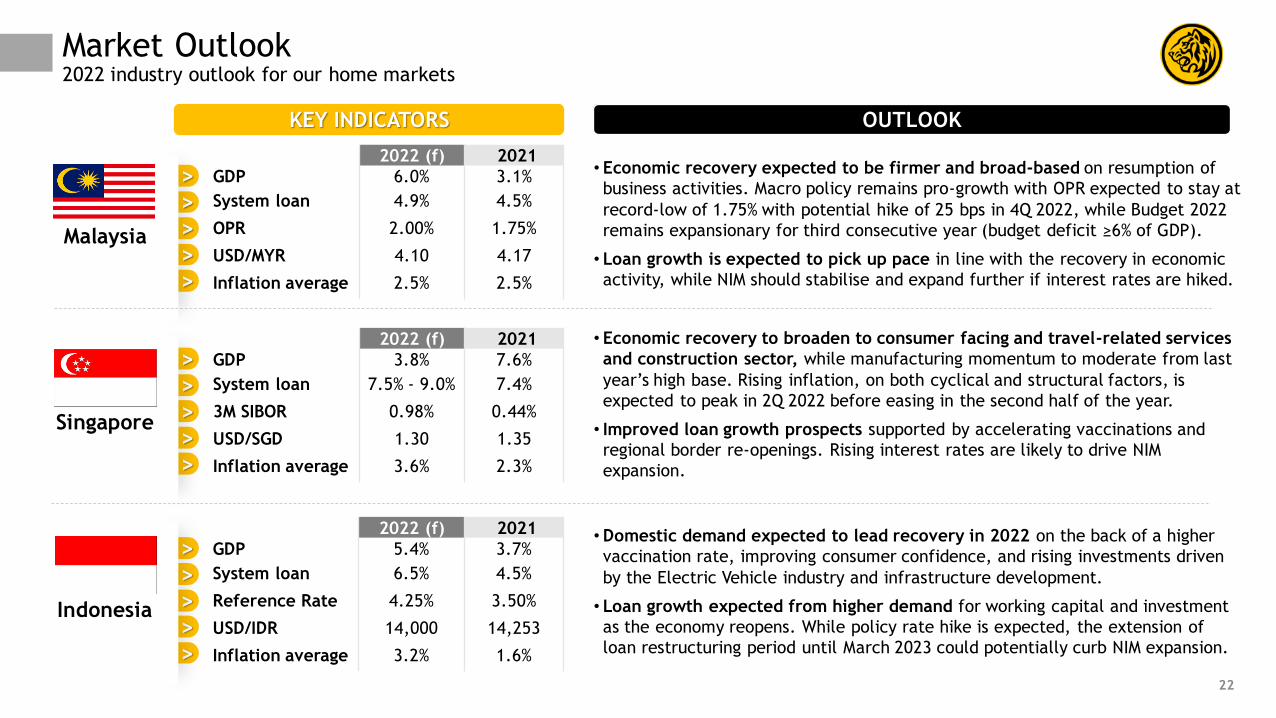
Market Outlook2022 industry outlook for our home markets
>>>>>
Malaysia
Indonesia
Singapore
KEY INDICATORS OUTLOOK
• Economic recovery expected to be firmer and broad-based on resumption of
business activities. Macro policy remains pro-growth with OPR expected to stay at
record-low of 1.75% with potential hike of 25 bps in 4Q 2022, while Budget 2022
remains expansionary for third consecutive year (budget deficit ≥6% of GDP).
• Loan growth is expected to pick up pace in line with the recovery in economic
activity, while NIM should stabilise and expand further if interest rates are hiked.
• Economic recovery to broaden to consumer facing and travel-related services
and construction sector, while manufacturing momentum to moderate from last
year’s high base. Rising inflation, on both cyclical and structural factors, is
expected to peak in 2Q 2022 before easing in the second half of the year.
• Improved loan growth prospects supported by accelerating vaccinations and
regional border re-openings. Rising interest rates are likely to drive NIM
expansion.
•Domestic demand expected to lead recovery in 2022 on the back of a higher
vaccination rate, improving consumer confidence, and rising investments driven
by the Electric Vehicle industry and infrastructure development.
• Loan growth expected from higher demand for working capital and investment
as the economy reopens. While policy rate hike is expected, the extension of
loan restructuring period until March 2023 could potentially curb NIM expansion.
2022 (f) 2021
GDP 6.0% 3.1%
System loan 4.9% 4.5%
OPR 2.00% 1.75%
USD/MYR 4.10 4.17
Inflation average 2.5% 2.5%
2022 (f) 2021
GDP 5.4% 3.7%
System loan 6.5% 4.5%
Reference Rate 4.25% 3.50%
USD/IDR 14,000 14,253
Inflation average 3.2% 1.6%
23
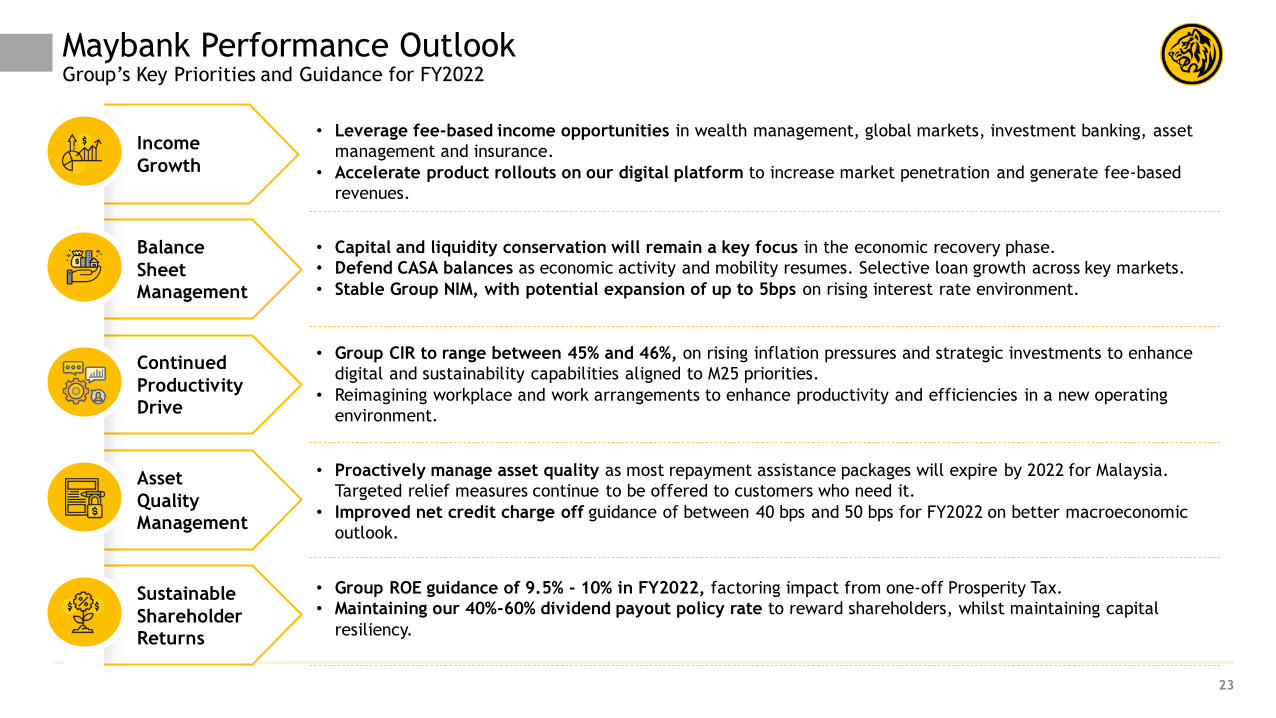
Income
Growth
• Leverage fee-based income opportunities in wealth management, global markets, investment banking, asset
management and insurance.
• Accelerate product rollouts on our digital platform to increase market penetration and generate fee-based
revenues.
Maybank Performance OutlookGroup’s Key Priorities and Guidance for FY2022
Balance
Sheet
Management
Continued
Productivity
Drive
Asset
Quality
Management
Sustainable
Shareholder
Returns
• Capital and liquidity conservation will remain a key focus in the economic recovery phase.
• Defend CASA balances as economic activity and mobility resumes. Selective loan growth across key markets.
• Stable Group NIM, with potential expansion of up to 5bps on rising interest rate environment.
• Group CIR to range between 45% and 46%, on rising inflation pressures and strategic investments to enhance
digital and sustainability capabilities aligned to M25 priorities.
• Reimagining workplace and work arrangements to enhance productivity and efficiencies in a new operating
environment.
• Proactively manage asset quality as most repayment assistance packages will expire by 2022 for Malaysia.
Targeted relief measures continue to be offered to customers who need it.
• Improved net credit charge off guidance of between 40 bps and 50 bps for FY2022 on better macroeconomic
outlook.
• Group ROE guidance of 9.5% - 10% in FY2022, factoring impact from one-off Prosperity Tax.
• Maintaining our 40%-60% dividend payout policy rate to reward shareholders, whilst maintaining capital
resiliency.
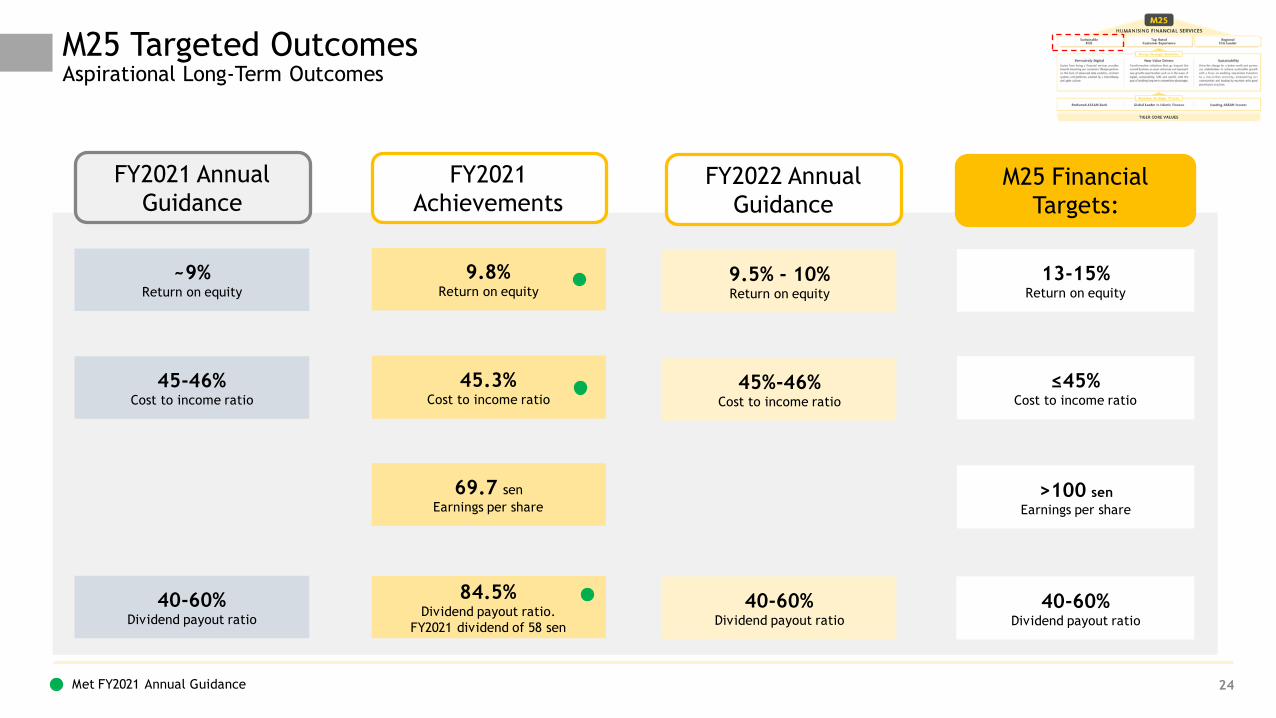
M25 Targeted OutcomesAspirational Long-Term Outcomes
24
M25 Financial
Targets:
13-15% Return on equity
≤45%Cost to income ratio
>100 sen
Earnings per share
40-60%Dividend payout ratio
FY2021 Annual
Guidance
FY2021
Achievements
~9% Return on equity
45-46% Cost to income ratio
40-60%Dividend payout ratio
9.8% Return on equity
45.3% Cost to income ratio
69.7 sen
Earnings per share
84.5%Dividend payout ratio.
FY2021 dividend of 58 sen
Met FY2021 Annual Guidance
FY2022 Annual
Guidance
9.5% - 10% Return on equity
45%-46% Cost to income ratio
40-60%Dividend payout ratio
Executive Summary 2-8
4Q & Full Year FY2021 Financial Performance 10-20
Prospects & Outlook 22-24
Appendix:
1. Financial Performance 26-37
2. Community Financial Services 39-40
3. Global Banking 42-43
4. Maybank Singapore 45-46
5. Maybank Indonesia 48-49
6. Other Segments 51-53
Table of Contents
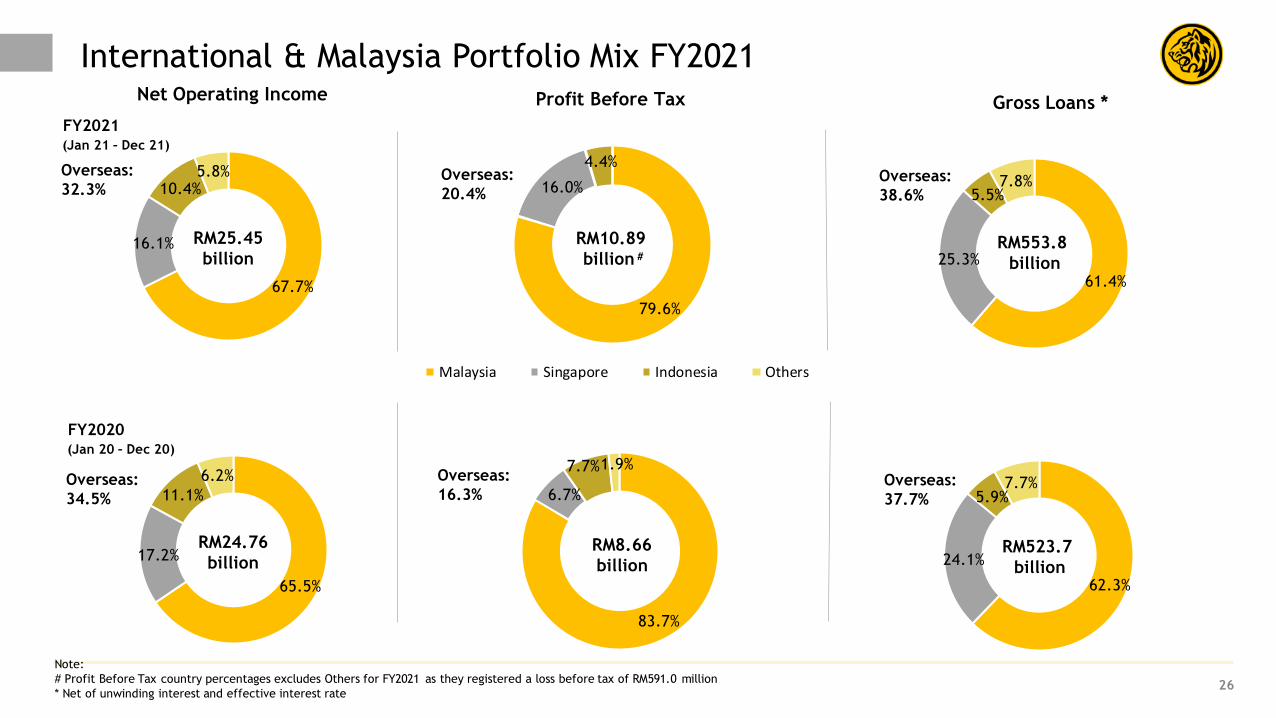
83.7%
6.7%
7.7%1.9%
79.6%
16.0%
4.4%
Malaysia Singapore Indonesia Others
Overseas:
20.4%
Overseas:
16.3%
61.4%
25.3%
5.5%7.8%
International & Malaysia Portfolio Mix FY2021
26
Overseas:
38.6%
67.7%
16.1%
10.4%5.8%
Net Operating Income Profit Before Tax
FY2021
Gross Loans *
Overseas:
32.3%
(Jan 21 – Dec 21)
RM10.89
billion #RM553.8
billion
RM25.45
billion
62.3%
24.1%
5.9%7.7%Overseas:
37.7%
65.5%
17.2%
11.1%
6.2%
FY2020
Overseas:
34.5%
(Jan 20 – Dec 20)
RM8.66
billionRM523.7
billion
RM24.76
billion
Note:
# Profit Before Tax country percentages excludes Others for FY2021 as they registered a loss before tax of RM591.0 million
* Net of unwinding interest and effective interest rate
Segmental Performance of Businesses: FY2021 (1/2)
27
13,541
5,654 6,847
521 34 1,037
13,930
6,592 6,258
566 (26)
901
Total Group CommunityFinancial Services
Group Corporate Banking& Global Markets
Group Investment Banking Group Asset Management Group Insurance& Takaful
FY2020 FY2021
24,763
12,914
8,747
1,528 144
1,982
25,448
14,053
8,173
1,555 120
1,908
Total Group CommunityFinancial Services
Group Corporate Banking& Global Markets
Group Investment Banking Group Asset Management Group Insurance& Takaful
FY2020 FY2021
Net Operating Income
+2.8%
RM
million
PPOP
+8.8% (6.6)%
Group Global Banking (8.2)%
Group Global Banking (5.5)%
FY2020: 10,419 FY2021: 9,848
FY2020: 7,402 FY2021: 6,798
RM
million
(8.6)% +16.6%
+1.8% (16.7)% (3.7)%
+2.9%
+8.7% (>100)% (13.1)%
Note:
Net income & PPOP for Group includes “Head Office & Others” expenditure of RM551.5 million for FY2020 and RM360.4 million for FY2021.
16,651
9,900
5,409
243 2 1,260
19,089
10,866
5,703
306 2 1,376
Total Group CommunityFinancial Services
Group Corporate Banking & Global Markets
Group Investment Banking Group Asset Management Group Insurance& Takaful
FY2020 FY2021
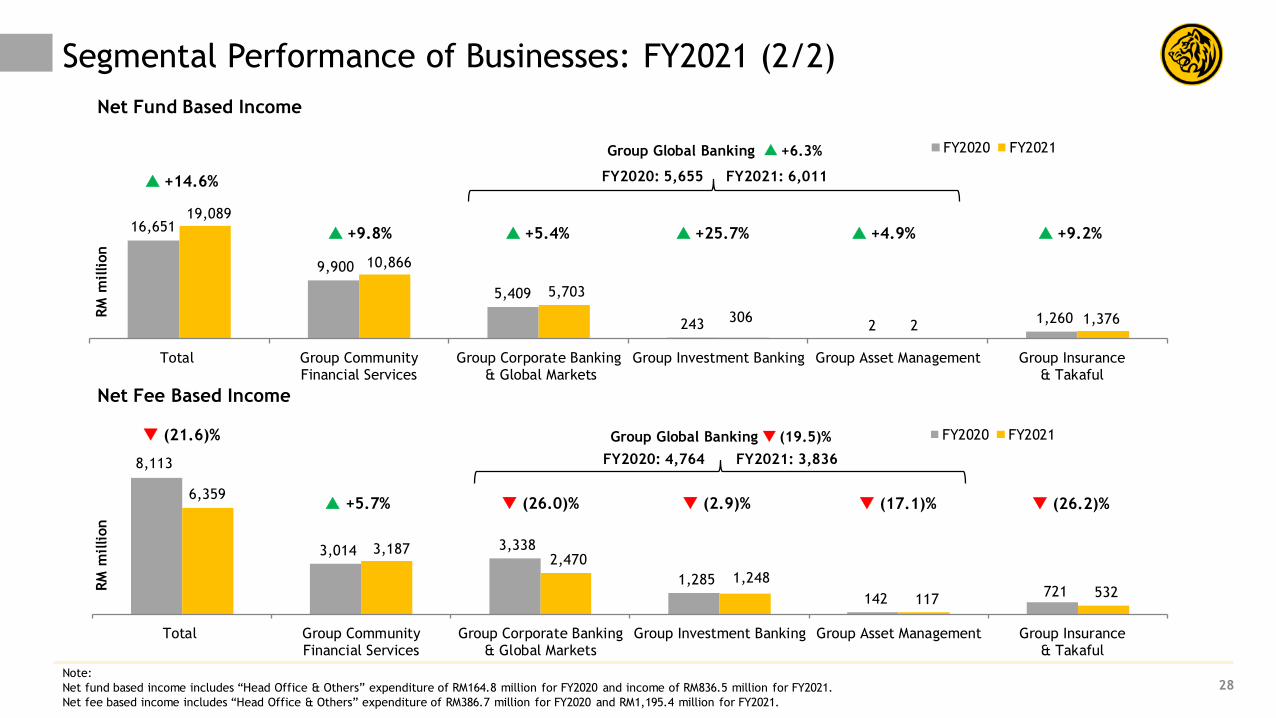
Segmental Performance of Businesses: FY2021 (2/2)
28
8,113
3,014 3,338
1,285
142 721
6,359
3,187 2,470
1,248
117 532
Total Group CommunityFinancial Services
Group Corporate Banking& Global Markets
Group Investment Banking Group Asset Management Group Insurance& Takaful
FY2020 FY2021
Net Fund Based Income
Group Global Banking +6.3%
Net Fee Based Income
+25.7% +4.9% +9.8% +5.4% +9.2%
FY2020: 5,655 FY2021: 6,011
Group Global Banking (19.5)%
FY2020: 4,764 FY2021: 3,836
(26.0)% +5.7%
(21.6)%
+14.6%
(2.9)% (17.1)% (26.2)%
Note:
Net fund based income includes “Head Office & Others” expenditure of RM164.8 million for FY2020 and income of RM836.5 million for FY2021.
Net fee based income includes “Head Office & Others” expenditure of RM386.7 million for FY2020 and RM1,195.4 million for FY2021.
RM
million
RM
million
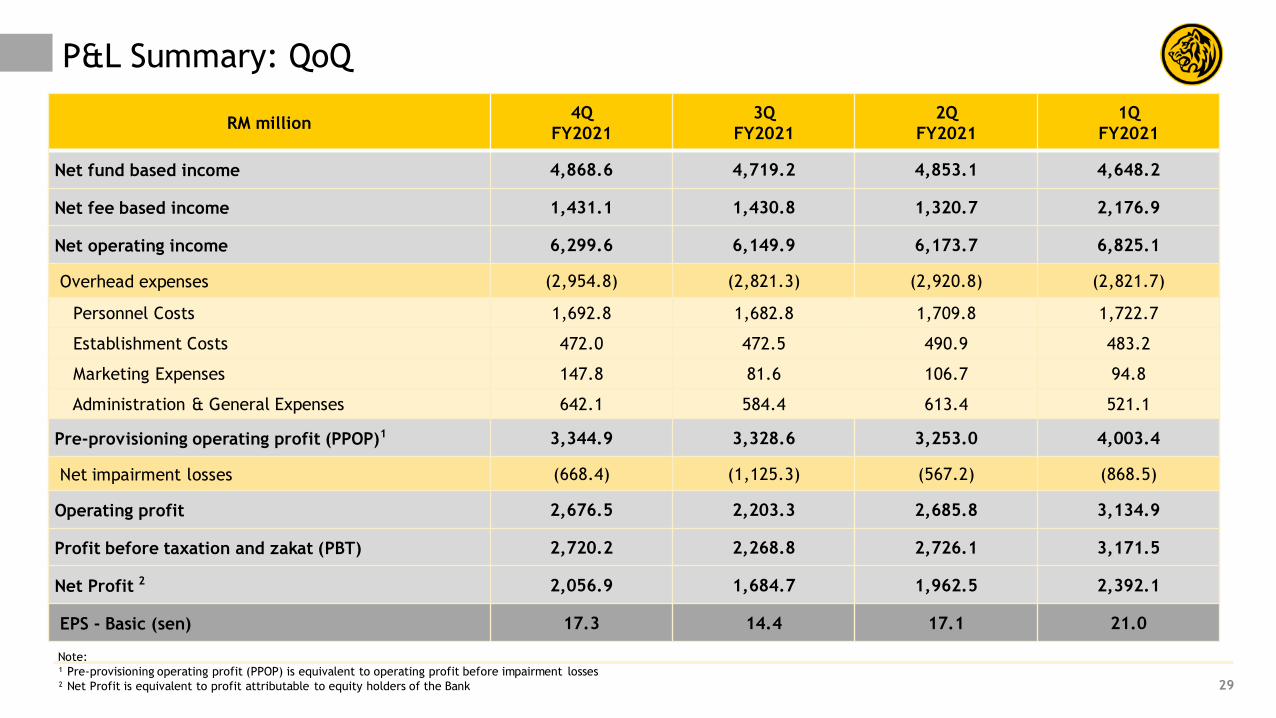
P&L Summary: QoQ
29
RM million4Q
FY2021
3Q
FY2021
2Q
FY2021
1Q
FY2021
Net fund based income 4,868.6 4,719.2 4,853.1 4,648.2
Net fee based income 1,431.1 1,430.8 1,320.7 2,176.9
Net operating income 6,299.6 6,149.9 6,173.7 6,825.1
Overhead expenses (2,954.8) (2,821.3) (2,920.8) (2,821.7)
Personnel Costs 1,692.8 1,682.8 1,709.8 1,722.7
Establishment Costs 472.0 472.5 490.9 483.2
Marketing Expenses 147.8 81.6 106.7 94.8
Administration & General Expenses 642.1 584.4 613.4 521.1
Pre-provisioning operating profit (PPOP)1 3,344.9 3,328.6 3,253.0 4,003.4
Net impairment losses (668.4) (1,125.3) (567.2) (868.5)
Operating profit 2,676.5 2,203.3 2,685.8 3,134.9
Profit before taxation and zakat (PBT) 2,720.2 2,268.8 2,726.1 3,171.5
Net Profit 2 2,056.9 1,684.7 1,962.5 2,392.1
EPS - Basic (sen) 17.3 14.4 17.1 21.0
Note:
¹ Pre-provisioning operating profit (PPOP) is equivalent to operating profit before impairment losses
² Net Profit is equivalent to profit attributable to equity holders of the Bank
Income Statement for Insurance and Takaful Business
30
RM million FY2021 FY2020 YoY 4Q FY2021 3Q FY2021 2Q FY2021 1Q FY2021 QoQ
Net interest income 1,375.9 1,260.4 9.2% 362.8 357.5 337.7 318.0 1.5%
Net earned premiums 8,846.8 9,458.9 (6.5)% 2,167.6 1,983.4 2,166.5 2,529.2 9.3%
Other operating income (562.4) 820.6 (>100)% (45.0) 149.9 216.3 (883.6) (>100)%
Total operating income 9,660.4 11,539.8 (16.3)% 2,485.3 2,490.8 2,720.6 1,963.6 (0.2)%
Net insurance benefits & claims incurred, net fee &
commission expenses, change in expense liabilities and
life & takaful fund tax
(7,752.2) (9,559.6) (18.9)% (1,960.3) (2,026.9) (2,187.0) (1,578.0) (3.3)%
Net operating income 1,908.2 1,980.2 (3.6)% 525.0 463.9 533.7 385.6 13.2%
Overhead expenses (999.1) (950.4) 5.1% (257.7) (241.2) (244.9) (255.3) 6.9%
PPOP 909.0 1,029.8 (11.7)% 267.3 222.7 288.7 130.3 20.0%
Net impairment losses 30.9 (41.2) (>100)% 3.1 4.5 (0.3) 23.6 (30.1)%
Operating profit 939.9 988.6 (4.9)% 270.4 227.2 288.4 153.9 19.0%
RM million FY2021 FY2020 YoY 4Q FY2021 3Q FY2021 2Q FY2021 1Q FY2021 QoQ
Net insurance benefits & claims incurred, net fee &
commission expenses, change in expense liabilities and
life & takaful fund tax
(7,752.2) (9,559.6) (18.9)% (1,960.3) (2,026.9) (2,187.0) (1,578.0) (3.3)%
Less: intercompany elimination 276.5 338.8 (18.4)% 76.6 67.7 64.8 67.3 13.1%
Total net insurance benefits & claims incurred, net fee
& commission expenses, change in expense liabilities
and life & takaful fund tax
(7,475.7) (9,220.8) (18.9)% (1,883.7) (1,959.2) (2,122.1) (1,510.7) (3.9)%
Reconciliation of net insurance benefits & claims incurred, net fee & commission expenses, change in expense liabilities and life & takaful
fund tax
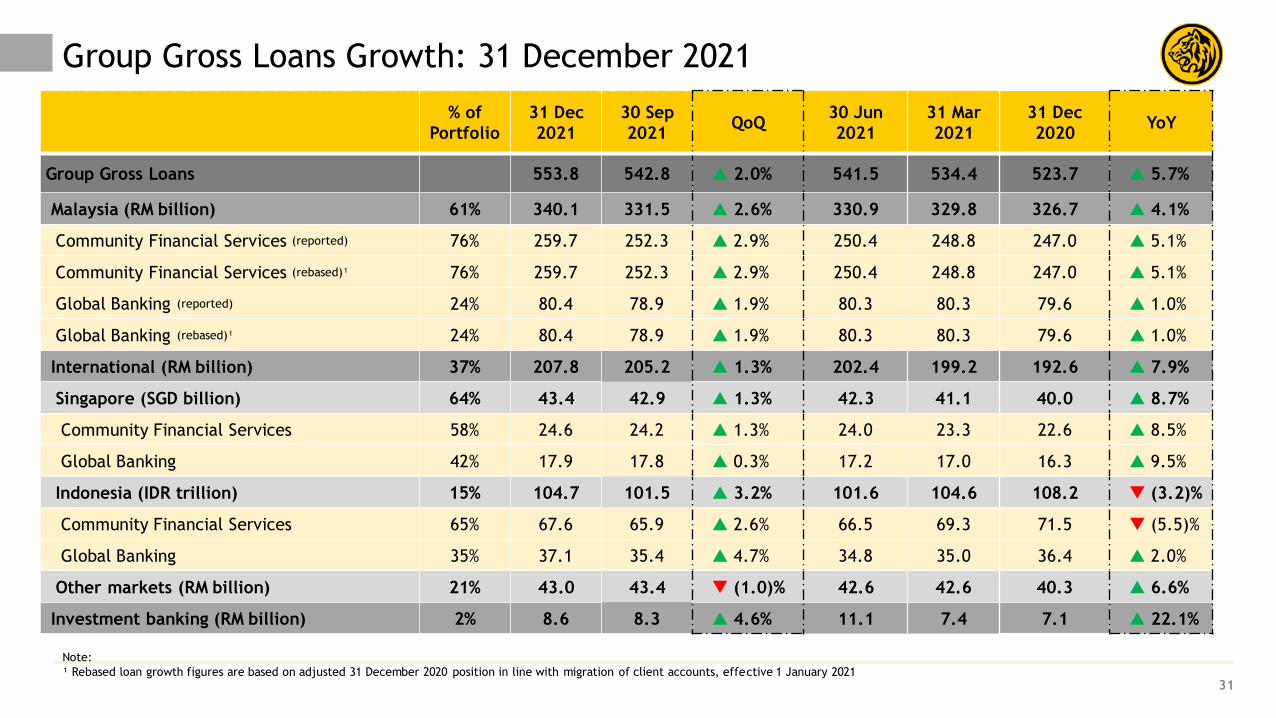
Group Gross Loans Growth: 31 December 2021
31
% of
Portfolio
31 Dec
2021
30 Sep
2021QoQ
30 Jun
2021
31 Mar
2021
31 Dec
2020YoY
Group Gross Loans 553.8 542.8 2.0% 541.5 534.4 523.7 5.7%
Malaysia (RM billion) 61% 340.1 331.5 2.6% 330.9 329.8 326.7 4.1%
Community Financial Services (reported) 76% 259.7 252.3 2.9% 250.4 248.8 247.0 5.1%
Community Financial Services (rebased)¹ 76% 259.7 252.3 2.9% 250.4 248.8 247.0 5.1%
Global Banking (reported) 24% 80.4 78.9 1.9% 80.3 80.3 79.6 1.0%
Global Banking (rebased)¹ 24% 80.4 78.9 1.9% 80.3 80.3 79.6 1.0%
International (RM billion) 37% 207.8 205.2 1.3% 202.4 199.2 192.6 7.9%
Singapore (SGD billion) 64% 43.4 42.9 1.3% 42.3 41.1 40.0 8.7%
Community Financial Services 58% 24.6 24.2 1.3% 24.0 23.3 22.6 8.5%
Global Banking 42% 17.9 17.8 0.3% 17.2 17.0 16.3 9.5%
Indonesia (IDR trillion) 15% 104.7 101.5 3.2% 101.6 104.6 108.2 (3.2)%
Community Financial Services 65% 67.6 65.9 2.6% 66.5 69.3 71.5 (5.5)%
Global Banking 35% 37.1 35.4 4.7% 34.8 35.0 36.4 2.0%
Other markets (RM billion) 21% 43.0 43.4 (1.0)% 42.6 42.6 40.3 6.6%
Investment banking (RM billion) 2% 8.6 8.3 4.6% 11.1 7.4 7.1 22.1%
Note:
¹ Rebased loan growth figures are based on adjusted 31 December 2020 position in line with migration of client accounts, effective 1 January 2021
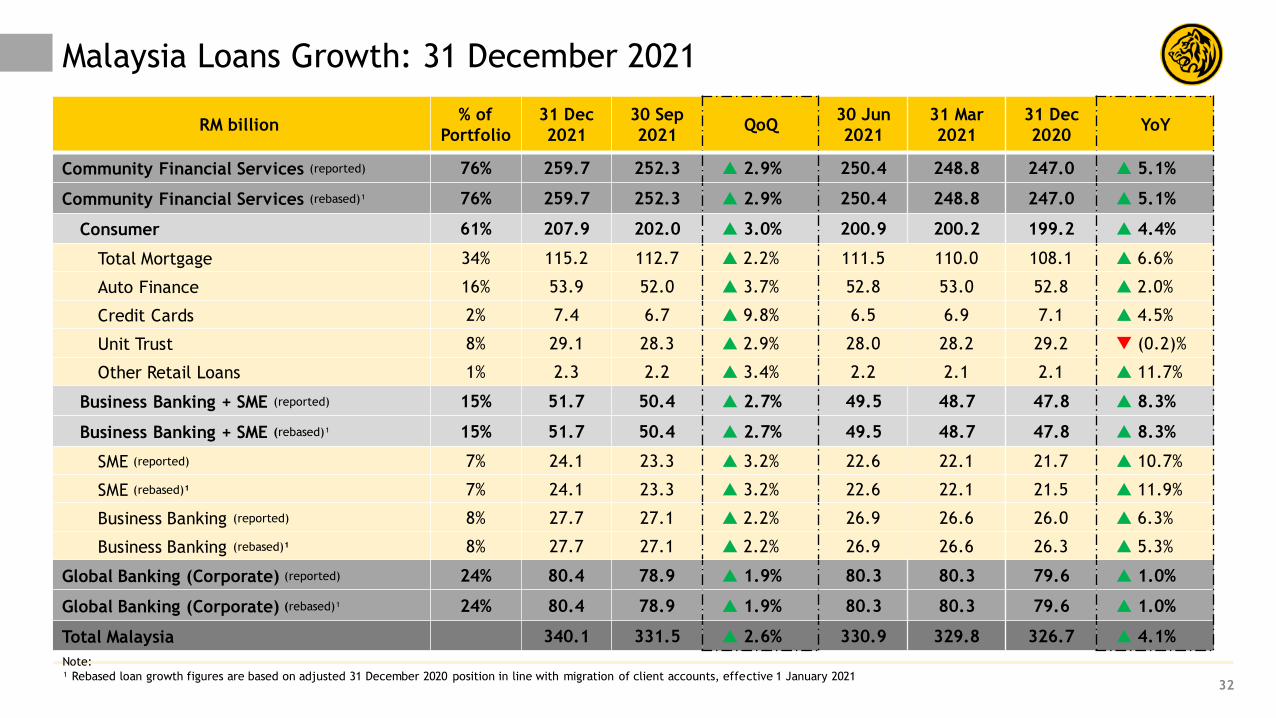
Malaysia Loans Growth: 31 December 2021
32
RM billion% of
Portfolio
31 Dec
2021
30 Sep
2021QoQ
30 Jun
2021
31 Mar
2021
31 Dec
2020YoY
Community Financial Services (reported) 76% 259.7 252.3 2.9% 250.4 248.8 247.0 5.1%
Community Financial Services (rebased)¹ 76% 259.7 252.3 2.9% 250.4 248.8 247.0 5.1%
Consumer 61% 207.9 202.0 3.0% 200.9 200.2 199.2 4.4%
Total Mortgage 34% 115.2 112.7 2.2% 111.5 110.0 108.1 6.6%
Auto Finance 16% 53.9 52.0 3.7% 52.8 53.0 52.8 2.0%
Credit Cards 2% 7.4 6.7 9.8% 6.5 6.9 7.1 4.5%
Unit Trust 8% 29.1 28.3 2.9% 28.0 28.2 29.2 (0.2)%
Other Retail Loans 1% 2.3 2.2 3.4% 2.2 2.1 2.1 11.7%
Business Banking + SME (reported) 15% 51.7 50.4 2.7% 49.5 48.7 47.8 8.3%
Business Banking + SME (rebased)¹ 15% 51.7 50.4 2.7% 49.5 48.7 47.8 8.3%
SME (reported) 7% 24.1 23.3 3.2% 22.6 22.1 21.7 10.7%
SME (rebased)¹ 7% 24.1 23.3 3.2% 22.6 22.1 21.5 11.9%
Business Banking (reported) 8% 27.7 27.1 2.2% 26.9 26.6 26.0 6.3%
Business Banking (rebased)¹ 8% 27.7 27.1 2.2% 26.9 26.6 26.3 5.3%
Global Banking (Corporate) (reported) 24% 80.4 78.9 1.9% 80.3 80.3 79.6 1.0%
Global Banking (Corporate) (rebased)¹ 24% 80.4 78.9 1.9% 80.3 80.3 79.6 1.0%
Total Malaysia 340.1 331.5 2.6% 330.9 329.8 326.7 4.1%
Note:
¹ Rebased loan growth figures are based on adjusted 31 December 2020 position in line with migration of client accounts, effective 1 January 2021
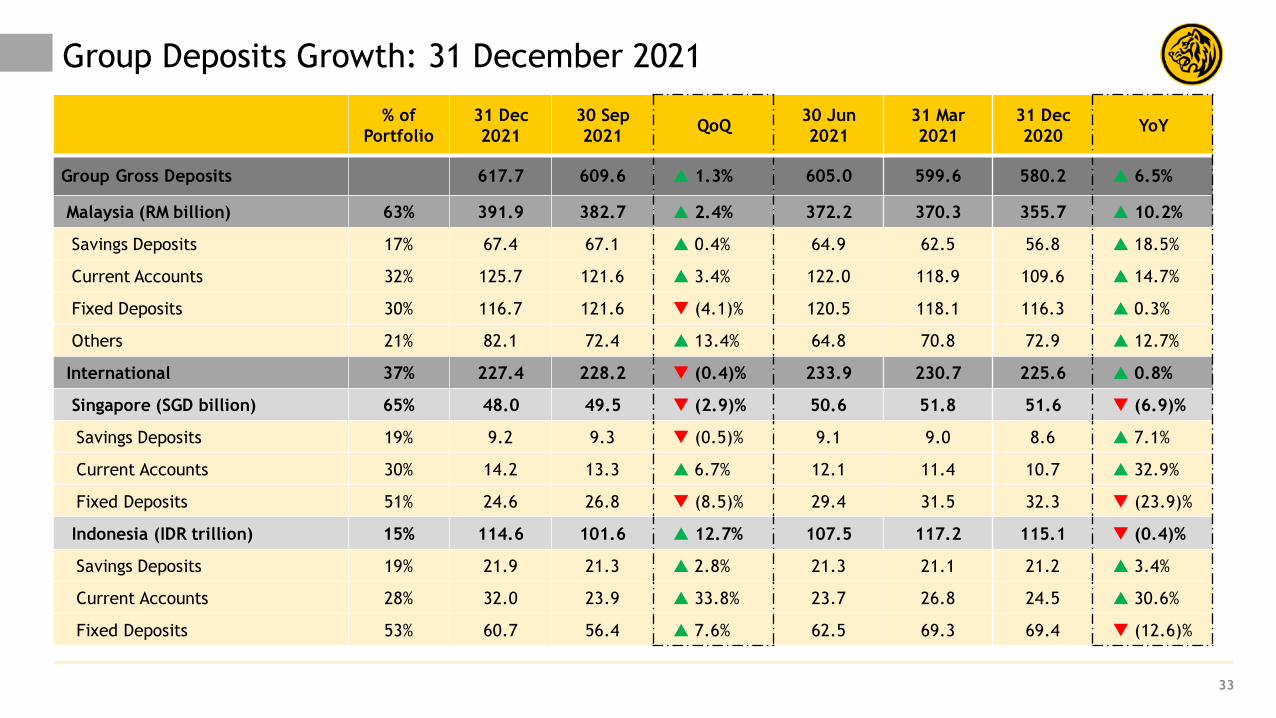
Group Deposits Growth: 31 December 2021
33
% of
Portfolio
31 Dec
2021
30 Sep
2021QoQ
30 Jun
2021
31 Mar
2021
31 Dec
2020YoY
Group Gross Deposits 617.7 609.6 1.3% 605.0 599.6 580.2 6.5%
Malaysia (RM billion) 63% 391.9 382.7 2.4% 372.2 370.3 355.7 10.2%
Savings Deposits 17% 67.4 67.1 0.4% 64.9 62.5 56.8 18.5%
Current Accounts 32% 125.7 121.6 3.4% 122.0 118.9 109.6 14.7%
Fixed Deposits 30% 116.7 121.6 (4.1)% 120.5 118.1 116.3 0.3%
Others 21% 82.1 72.4 13.4% 64.8 70.8 72.9 12.7%
International 37% 227.4 228.2 (0.4)% 233.9 230.7 225.6 0.8%
Singapore (SGD billion) 65% 48.0 49.5 (2.9)% 50.6 51.8 51.6 (6.9)%
Savings Deposits 19% 9.2 9.3 (0.5)% 9.1 9.0 8.6 7.1%
Current Accounts 30% 14.2 13.3 6.7% 12.1 11.4 10.7 32.9%
Fixed Deposits 51% 24.6 26.8 (8.5)% 29.4 31.5 32.3 (23.9)%
Indonesia (IDR trillion) 15% 114.6 101.6 12.7% 107.5 117.2 115.1 (0.4)%
Savings Deposits 19% 21.9 21.3 2.8% 21.3 21.1 21.2 3.4%
Current Accounts 28% 32.0 23.9 33.8% 23.7 26.8 24.5 30.6%
Fixed Deposits 53% 60.7 56.4 7.6% 62.5 69.3 69.4 (12.6)%
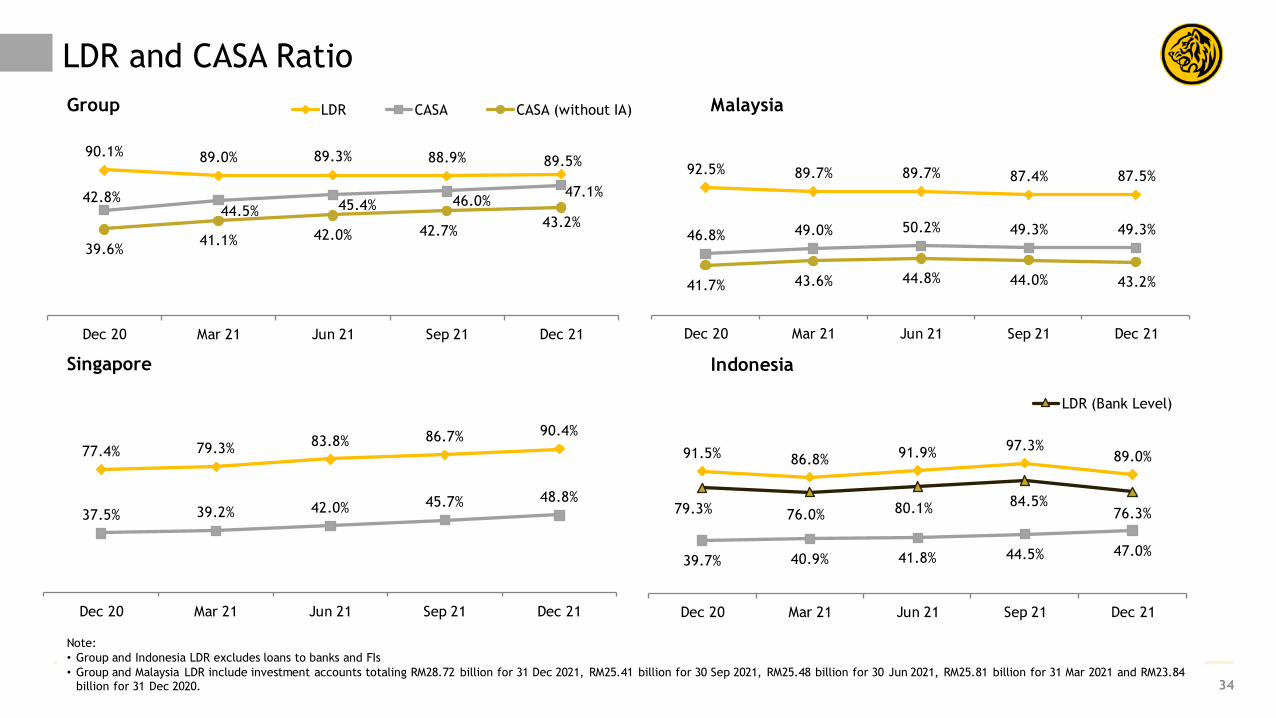
90.1% 89.0% 89.3% 88.9% 89.5%
42.8%44.5% 45.4% 46.0%
47.1%
39.6%41.1% 42.0% 42.7%
43.2%
Dec 20 Mar 21 Jun 21 Sep 21 Dec 21
LDR CASA CASA (without IA)
77.4% 79.3%83.8% 86.7% 90.4%
37.5% 39.2% 42.0% 45.7% 48.8%
Dec 20 Mar 21 Jun 21 Sep 21 Dec 21
LDR and CASA Ratio
34
Indonesia
Malaysia
92.5% 89.7% 89.7% 87.4% 87.5%
46.8% 49.0% 50.2% 49.3% 49.3%
41.7% 43.6% 44.8% 44.0% 43.2%
Dec 20 Mar 21 Jun 21 Sep 21 Dec 21
Singapore
Group
91.5% 86.8% 91.9%97.3%
89.0%
39.7% 40.9% 41.8% 44.5% 47.0%
79.3% 76.0% 80.1%84.5%
76.3%
Dec 20 Mar 21 Jun 21 Sep 21 Dec 21
LDR (Bank Level)
Note:
• Group and Indonesia LDR excludes loans to banks and FIs
• Group and Malaysia LDR include investment accounts totaling RM28.72 billion for 31 Dec 2021, RM25.41 billion for 30 Sep 2021, RM25.48 billion for 30 Jun 2021, RM25.81 billion for 31 Mar 2021 and RM23.84 billion for 31 Dec 2020.
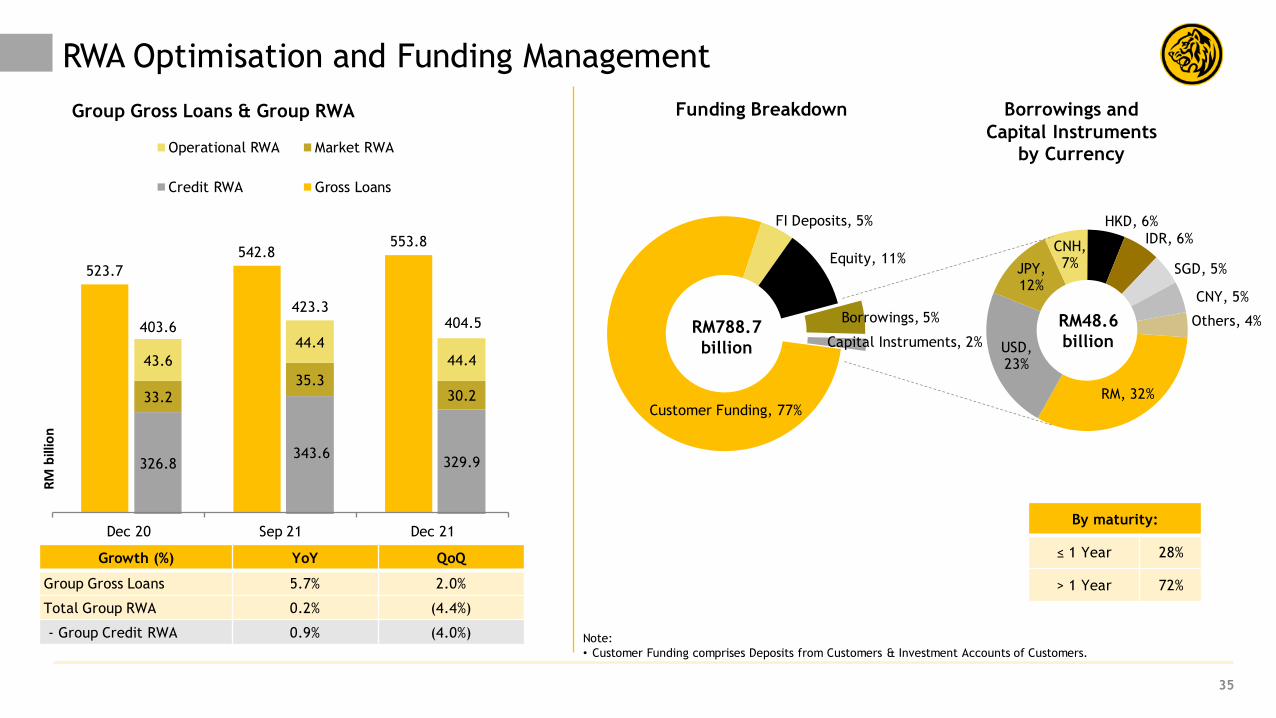
326.8343.6
329.9
33.235.3
30.2
43.6
44.4
44.4
Operational RWA Market RWA
Credit RWA Gross Loans
523.7
542.8553.8
Dec 20 Sep 21 Dec 21
404.5 Borrowings, 5%
Capital Instruments, 2%
Customer Funding, 77%
FI Deposits, 5%
Equity, 11%
RWA Optimisation and Funding Management
35
RM, 32%
USD, 23%
JPY, 12%
CNH, 7%
HKD, 6%
IDR, 6%
SGD, 5%
CNY, 5%
Others, 4%
Funding Breakdown
Note:
• Customer Funding comprises Deposits from Customers & Investment Accounts of Customers.
By maturity:
≤ 1 Year 28%
> 1 Year 72%
Borrowings and
Capital Instruments
by Currency
Group Gross Loans & Group RWA
RM
bill
ion
Growth (%) YoY QoQ
Group Gross Loans 5.7% 2.0%
Total Group RWA 0.2% (4.4%)
- Group Credit RWA 0.9% (4.0%)
403.6
423.3
RM788.7
billion
RM48.6
billion
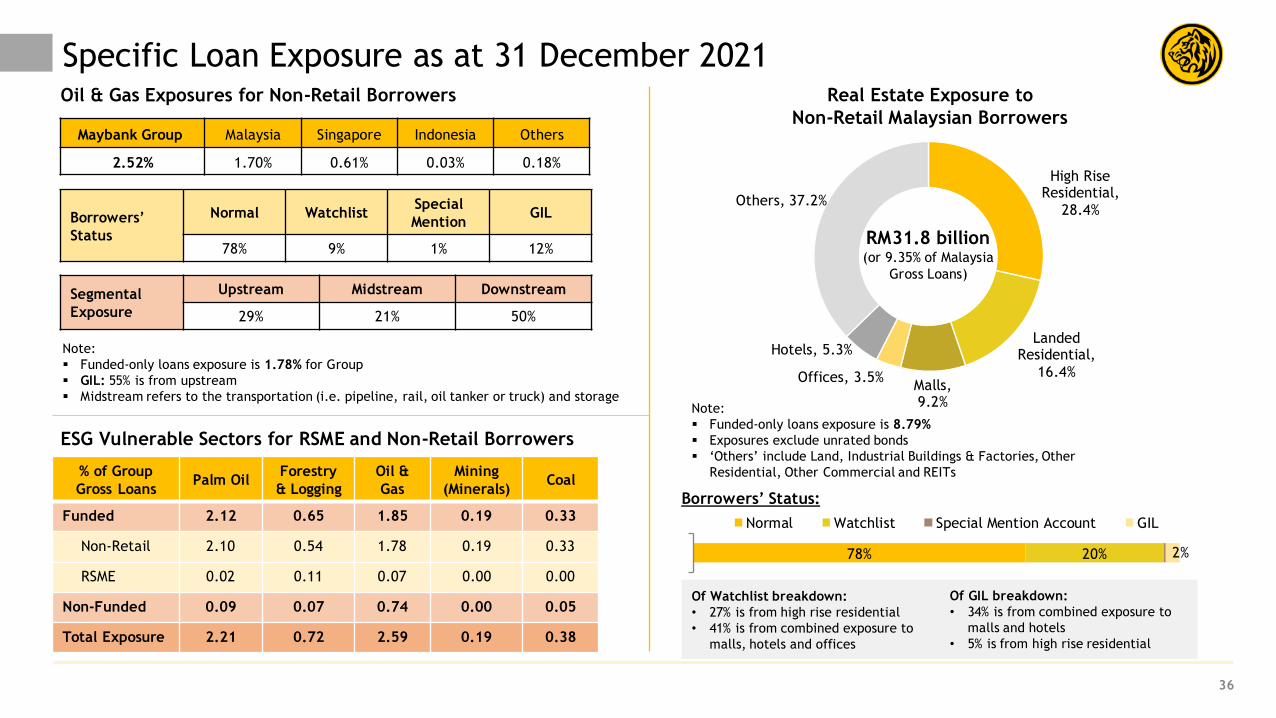
Specific Loan Exposure as at 31 December 2021
36
% of Group
Gross LoansPalm Oil
Forestry
& Logging
Oil &
Gas
Mining
(Minerals)Coal
Funded 2.12 0.65 1.85 0.19 0.33
Non-Retail 2.10 0.54 1.78 0.19 0.33
RSME 0.02 0.11 0.07 0.00 0.00
Non-Funded 0.09 0.07 0.74 0.00 0.05
Total Exposure 2.21 0.72 2.59 0.19 0.38
Maybank Group Malaysia Singapore Indonesia Others
2.52% 1.70% 0.61% 0.03% 0.18%
Note:
Funded-only loans exposure is 1.78% for Group
GIL: 55% is from upstream
Midstream refers to the transportation (i.e. pipeline, rail, oil tanker or truck) and storage
Borrowers’
Status
Normal WatchlistSpecial
MentionGIL
78% 9% 1% 12%
Segmental
Exposure
Upstream Midstream Downstream
29% 21% 50%
Real Estate Exposure to
Non-Retail Malaysian Borrowers
Note:
Funded-only loans exposure is 8.79%
Exposures exclude unrated bonds
‘Others’ include Land, Industrial Buildings & Factories, Other
Residential, Other Commercial and REITs
78% 20% 2%
Normal Watchlist Special Mention Account GIL
Borrowers’ Status:
Of GIL breakdown:
• 34% is from combined exposure to
malls and hotels
• 5% is from high rise residential
Of Watchlist breakdown:
• 27% is from high rise residential
• 41% is from combined exposure to
malls, hotels and offices
High Rise Residential,
28.4%
Landed Residential,
16.4%Malls, 9.2%
Offices, 3.5%
Hotels, 5.3%
Others, 37.2%
Oil & Gas Exposures for Non-Retail Borrowers
ESG Vulnerable Sectors for RSME and Non-Retail Borrowers
RM31.8 billion(or 9.35% of Malaysia
Gross Loans)
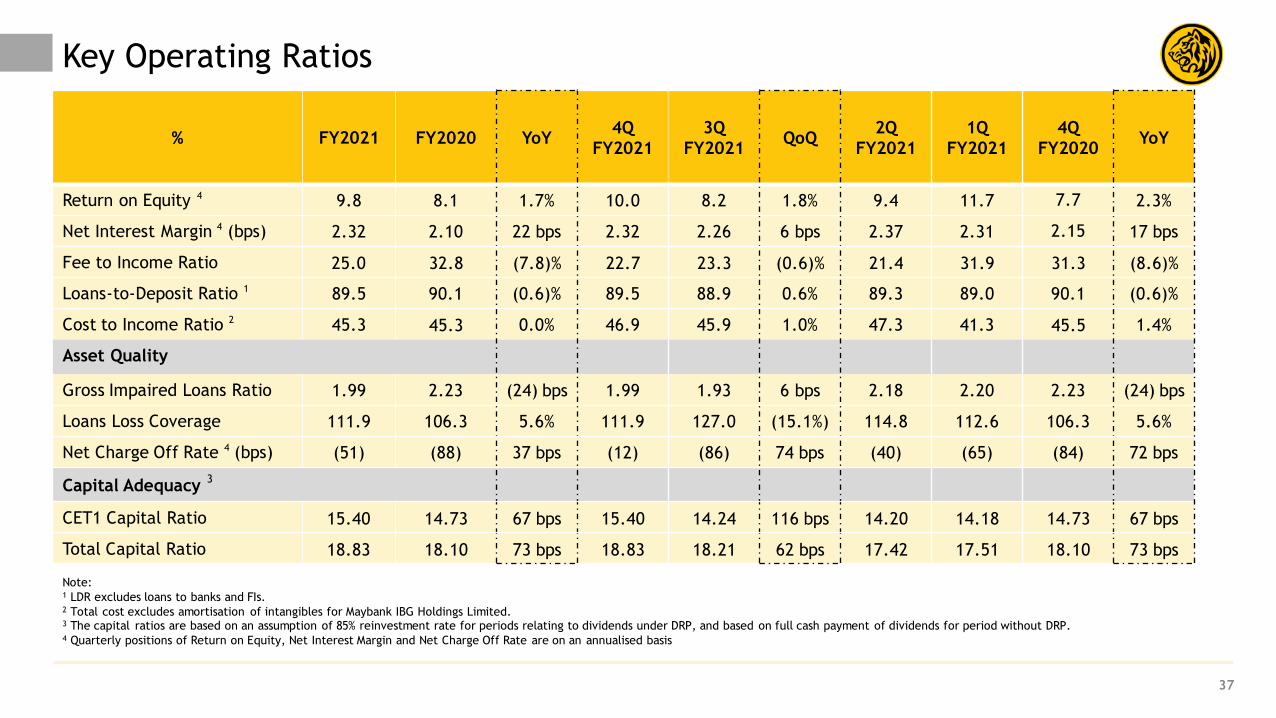
Key Operating Ratios
37
% FY2021 FY2020 YoY4Q
FY2021
3Q
FY2021QoQ
2Q
FY2021
1Q
FY2021
4Q
FY2020YoY
Return on Equity 4 9.8 8.1 1.7% 10.0 8.2 1.8% 9.4 11.7 7.7 2.3%
Net Interest Margin 4 (bps) 2.32 2.10 22 bps 2.32 2.26 6 bps 2.37 2.31 2.15 17 bps
Fee to Income Ratio 25.0 32.8 (7.8)% 22.7 23.3 (0.6)% 21.4 31.9 31.3 (8.6)%
Loans-to-Deposit Ratio 1 89.5 90.1 (0.6)% 89.5 88.9 0.6% 89.3 89.0 90.1 (0.6)%
Cost to Income Ratio 2 45.3 45.3 0.0% 46.9 45.9 1.0% 47.3 41.3 45.5 1.4%
Asset Quality
Gross Impaired Loans Ratio 1.99 2.23 (24) bps 1.99 1.93 6 bps 2.18 2.20 2.23 (24) bps
Loans Loss Coverage 111.9 106.3 5.6% 111.9 127.0 (15.1%) 114.8 112.6 106.3 5.6%
Net Charge Off Rate 4 (bps) (51) (88) 37 bps (12) (86) 74 bps (40) (65) (84) 72 bps
Capital Adequacy 3
CET1 Capital Ratio 15.40 14.73 67 bps 15.40 14.24 116 bps 14.20 14.18 14.73 67 bps
Total Capital Ratio 18.83 18.10 73 bps 18.83 18.21 62 bps 17.42 17.51 18.10 73 bps
Note:1 LDR excludes loans to banks and FIs.2 Total cost excludes amortisation of intangibles for Maybank IBG Holdings Limited.3 The capital ratios are based on an assumption of 85% reinvestment rate for periods relating to dividends under DRP, and based on full cash payment of dividends for period without DRP.4 Quarterly positions of Return on Equity, Net Interest Margin and Net Charge Off Rate are on an annualised basis
Executive Summary 2-8
4Q & Full Year FY2021 Financial Performance 10-20
Prospects & Outlook 22-24
Appendix:
1. Financial Performance 26-37
2. Community Financial Services 39-40
3. Global Banking 42-43
4. Maybank Singapore 45-46
5. Maybank Indonesia 48-49
6. Other Segments 51-53
Table of Contents
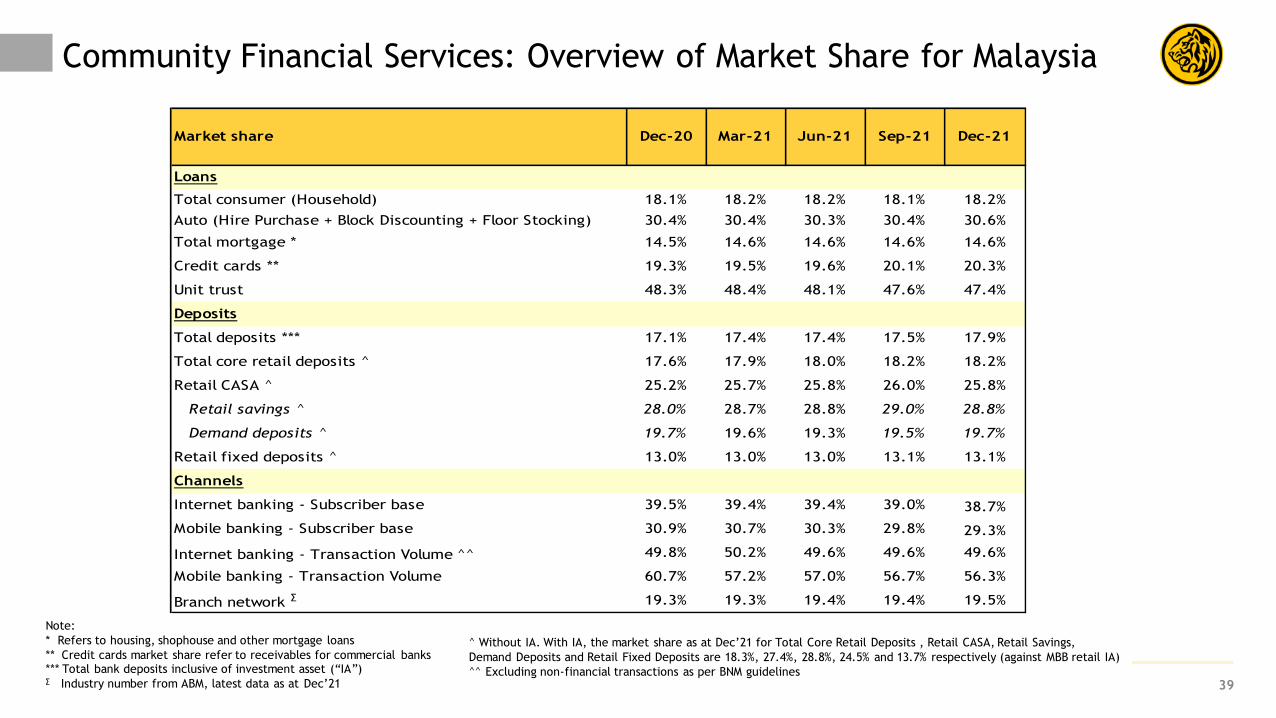
39
Community Financial Services: Overview of Market Share for Malaysia
Note:
* Refers to housing, shophouse and other mortgage loans
** Credit cards market share refer to receivables for commercial banks*** Total bank deposits inclusive of investment asset (“IA”)∑ Industry number from ABM, latest data as at Dec’21
Loans
Total consumer (Household) 18.1% 18.2% 18.2% 18.1% 18.2%
Auto (Hire Purchase + Block Discounting + Floor Stocking) 30.4% 30.4% 30.3% 30.4% 30.6%
Total mortgage * 14.5% 14.6% 14.6% 14.6% 14.6%
Credit cards ** 19.3% 19.5% 19.6% 20.1% 20.3%
Unit trust 48.3% 48.4% 48.1% 47.6% 47.4%
Deposits
Total deposits *** 17.1% 17.4% 17.4% 17.5% 17.9%
Total core retail deposits ^ 17.6% 17.9% 18.0% 18.2% 18.2%
Retail CASA ^ 25.2% 25.7% 25.8% 26.0% 25.8%
Retail savings ^ 28.0% 28.7% 28.8% 29.0% 28.8%
Demand deposits ^ 19.7% 19.6% 19.3% 19.5% 19.7%
Retail fixed deposits ^ 13.0% 13.0% 13.0% 13.1% 13.1%
Channels
Internet banking - Subscriber base 39.5% 39.4% 39.4% 39.0% 38.7%
Mobile banking - Subscriber base 30.9% 30.7% 30.3% 29.8% 29.3%
Internet banking - Transaction Volume ^^ 49.8% 50.2% 49.6% 49.6% 49.6%
Mobile banking - Transaction Volume 60.7% 57.2% 57.0% 56.7% 56.3%
Branch network ∑ 19.3% 19.3% 19.4% 19.4% 19.5%
Dec-20Market share Dec-21Sep-21Jun-21Mar-21
^ Without IA. With IA, the market share as at Dec’21 for Total Core Retail Deposits , Retail CASA, Retail Savings,
Demand Deposits and Retail Fixed Deposits are 18.3%, 27.4%, 28.8%, 24.5% and 13.7% respectively (against MBB retail IA)
^^ Excluding non-financial transactions as per BNM guidelines
3.10 3.55
1.101.26
FY2020 FY2021
Fund Fee
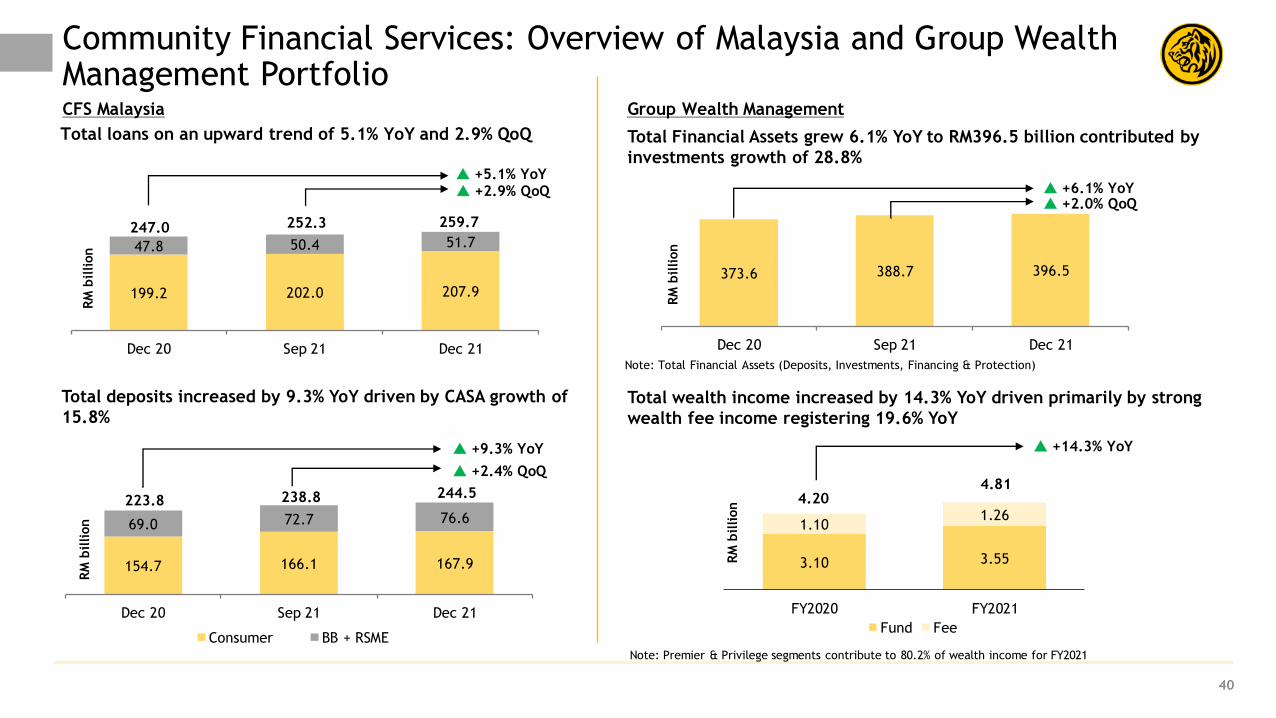
Community Financial Services: Overview of Malaysia and Group Wealth Management Portfolio
40
154.7 166.1 167.9
69.0 72.7 76.6
Dec 20 Sep 21 Dec 21
Consumer BB + RSME
223.8 238.8
Total loans on an upward trend of 5.1% YoY and 2.9% QoQ
+2.4% QoQ
Total deposits increased by 9.3% YoY driven by CASA growth of
15.8%
+9.3% YoY
199.2 202.0 207.9
47.8 50.4 51.7
Dec 20 Sep 21 Dec 21
259.7
+2.9% QoQ +5.1% YoY
247.0 252.3
244.5
RM
billion
RM
billion
Total Financial Assets grew 6.1% YoY to RM396.5 billion contributed by
investments growth of 28.8%
CFS Malaysia Group Wealth Management
Total wealth income increased by 14.3% YoY driven primarily by strong
wealth fee income registering 19.6% YoY
+14.3% YoY
RM
billion
4.204.81
Note: Premier & Privilege segments contribute to 80.2% of wealth income for FY2021
Note: Total Financial Assets (Deposits, Investments, Financing & Protection)
373.6 388.7 396.5
Dec 20 Sep 21 Dec 21
+6.1% YoY
RM
billion
+2.0% QoQ
Table of Contents
Executive Summary 2-8
4Q & Full Year FY2021 Financial Performance 10-20
Prospects & Outlook 22-24
Appendix:
1. Financial Performance 26-37
2. Community Financial Services 39-40
3. Global Banking 42-43
4. Maybank Singapore 45-46
5. Maybank Indonesia 48-49
6. Other Segments 51-53
9.9
21.2
48.4
11.2
19.5
48.2
11.6
20.4
48.3
Dec 21 Sep 21 Dec 20
65.2 60.7 60.1 65.7 65.8
54.0 62.1 53.659.2 58.8
60.6 60.161.3
63.8 65.6
28.0 26.625.2
23.6 24.07.4 8.0
8.89.7 9.7
Dec 20 Mar 21 Jun 21 Sep 21 Dec 21
Govt. Securities - Domestic
Govt. Securities - Foreign
PDS/Corp Bonds - Domestic
PDS/Corp Bonds - Foreign
Others
222.0
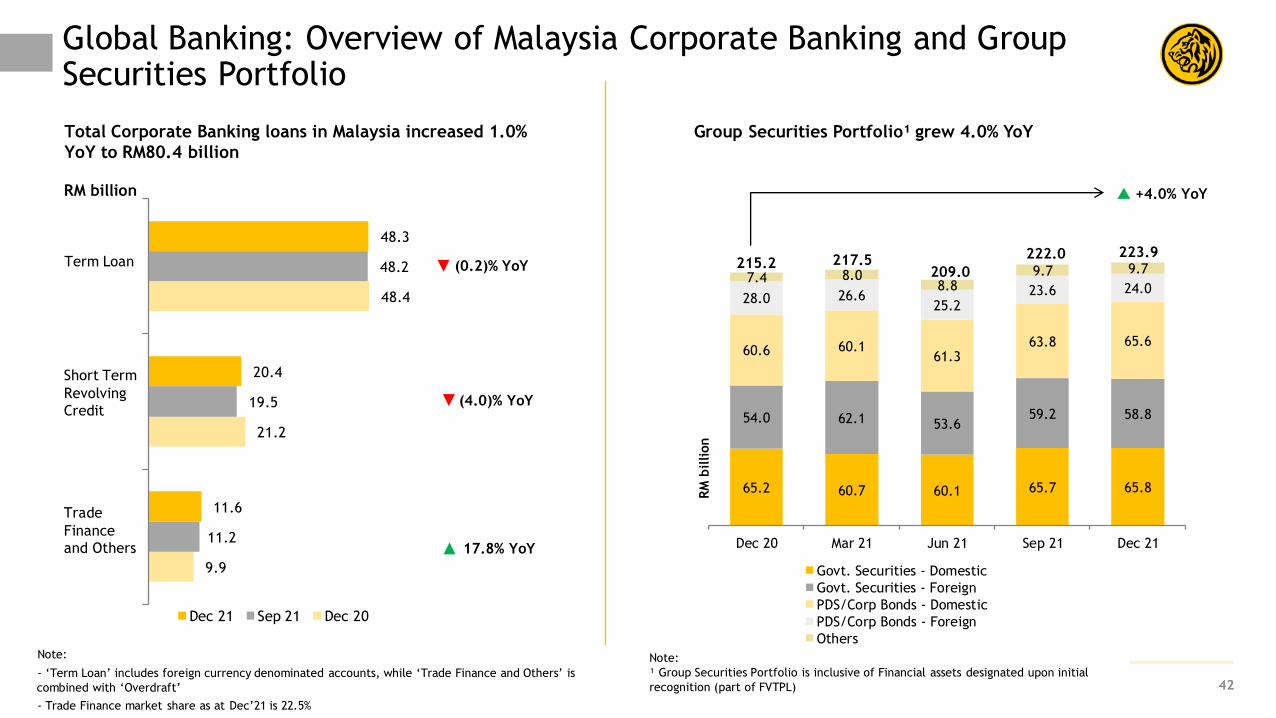
Global Banking: Overview of Malaysia Corporate Banking and Group Securities Portfolio
42
Note:
- ‘Term Loan’ includes foreign currency denominated accounts, while ‘Trade Finance and Others’ is
combined with ‘Overdraft’
- Trade Finance market share as at Dec’21 is 22.5%
Total Corporate Banking loans in Malaysia increased 1.0%
YoY to RM80.4 billion
RM billion
Term Loan
Short Term
Revolving
Credit
Trade
Finance
and Others 17.8% YoY
Group Securities Portfolio¹ grew 4.0% YoY
Note:
¹ Group Securities Portfolio is inclusive of Financial assets designated upon initial
recognition (part of FVTPL)
+4.0% YoY
215.2 217.5209.0
RM
billion
(4.0)% YoY
(0.2)% YoY223.9
Global Banking: Overview of Group Investment Banking Portfolio
43
FY2021 Fee-based Income for MalaysiaFY2021 Total Income Breakdown by Country
Note:
¹ Maybank Investment Banking Group (MIBG) represents the combined business of Maybank IB and business segments under MIBG Holdings.
Country Rank Market ShareTrading Value
(USD billion)
Malaysia 5 7.9% 34.0
Singapore 13 3.7% 17.9
Thailand 6 5.2% 64.1
Indonesia 7 3.7% 17.2
Philippines 14 3.1% 2.7
Hong Kong Tier C 0.0% 8.9
Vietnam >10 1.1% 6.2
FY2021 Brokerage Market Share by Country
Arrangers' Fees15%
Brokerage Fees55%
Other Fee Income
11%
Agency/ Guarantee Fees
4%
Advisory Fees7%
Underwriting &Placement Fees
8%
Malaysia40%
Singapore27%
Thailand18%
Indonesia4%
Phillipines1%
Hong Kong4%
Others6%
RM 1,555 mil
Table of Contents
Executive Summary 2-8
4Q & Full Year FY2021 Financial Performance 10-20
Prospects & Outlook 22-24
Appendix:
1. Financial Performance 26-37
2. Community Financial Services 39-40
3. Global Banking 42-43
4. Maybank Singapore 45-46
5. Maybank Indonesia 48-49
6. Other Segments 51-53
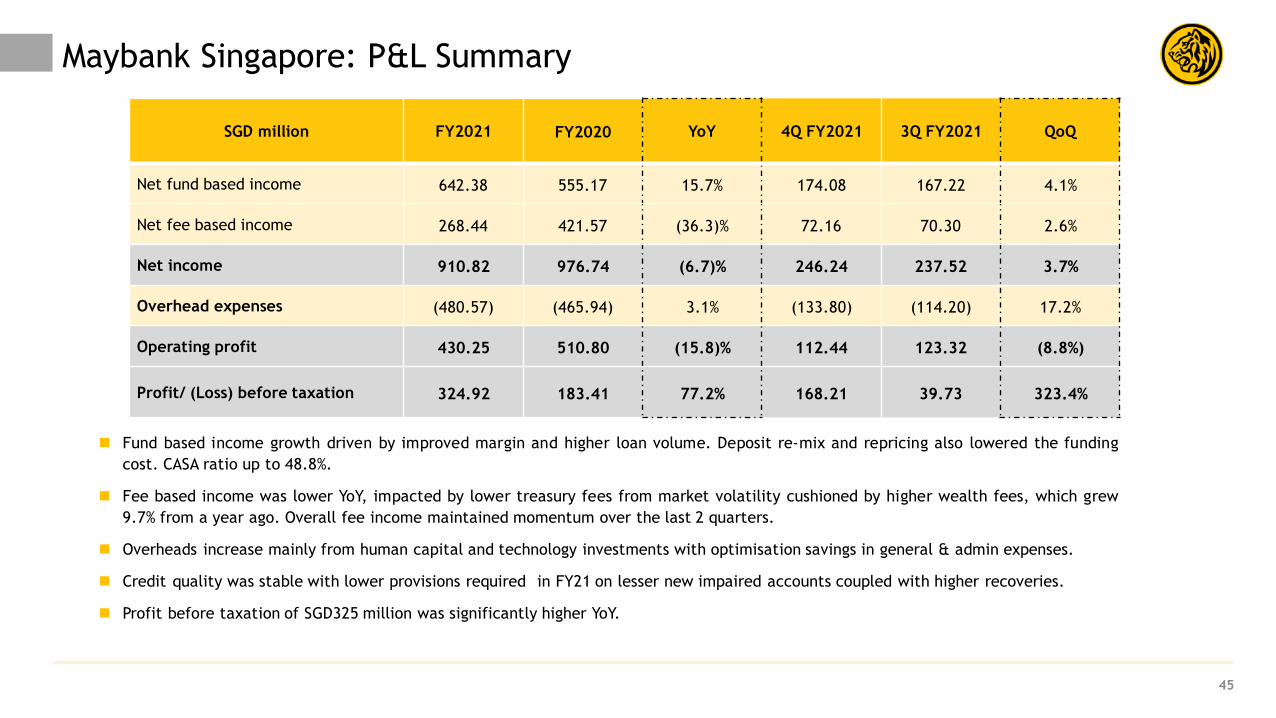
Maybank Singapore: P&L Summary
Fund based income growth driven by improved margin and higher loan volume. Deposit re-mix and repricing also lowered the funding
cost. CASA ratio up to 48.8%.
Fee based income was lower YoY, impacted by lower treasury fees from market volatility cushioned by higher wealth fees, which grew
9.7% from a year ago. Overall fee income maintained momentum over the last 2 quarters.
Overheads increase mainly from human capital and technology investments with optimisation savings in general & admin expenses.
Credit quality was stable with lower provisions required in FY21 on lesser new impaired accounts coupled with higher recoveries.
Profit before taxation of SGD325 million was significantly higher YoY.
SGD million FY2021 FY2020 YoY 4Q FY2021 3Q FY2021 QoQ
Net fund based income 642.38 555.17 15.7% 174.08 167.22 4.1%
Net fee based income 268.44 421.57 (36.3)% 72.16 70.30 2.6%
Net income 910.82 976.74 (6.7)% 246.24 237.52 3.7%
Overhead expenses (480.57) (465.94) 3.1% (133.80) (114.20) 17.2%
Operating profit 430.25 510.80 (15.8)% 112.44 123.32 (8.8%)
Profit/ (Loss) before taxation 324.92 183.41 77.2% 168.21 39.73 323.4%
45
8.6 9.3 9.2
10.713.3 14.2
32.3 26.8 24.6
Dec 20 Sep 21 Dec 21
Time Deposits
Demand Deposits
Savings
37.5%45.7%
46
Maybank Singapore: Overview of Loans and Deposits Portfolio
9.1 11.4 12.4
16.3 14.4 12.7
10.2 11.2 11.1
16.0 12.5 11.8
Dec 20 Sep 21 Dec 21
Consumer - TimeDeposits
Consumer CASA
Business TimeDeposits
Business CASA
48.049.5
Diversified Loan Portfolio
Consumer
47.7%
Corporate
52.3%
Business deposits remained core contributor at 52.3% of total deposits
CASA Ratio:
48.8%
SG
D b
illion
CASA ratio higher at 48.8% on expanded demand deposits, whilst
time deposits reduced
Fixed deposits were SGD 7.9 billion lower YoY. At SGD 24.5 billion, fixed deposits
constituted 51% of total deposits.
CASA deposits were SGD 4.2 billion higher YoY at SGD 23.5 billion.
51.6
(6.9)% YoY
SG
D b
illion
SGD Billion% of
Portfolio
31-Dec 30-SepQoQ
31-DecYoY
2021 2021 2020
CFS 58% 24.6 24.2 1.3% 22.6 8.5%
Consumer 42% 18.2 17.8 2.3% 16.4 11.3%
Housing Loan 29% 12.7 12.3 3.2% 11.0 15.7%
Auto Loan 5% 2.3 2.3 (1.0)% 2.3 0.8%
Cards 1% 0.3 0.3 1.8% 0.3 (4.9)%
Others 7% 2.9 2.9 1.0% 2.8 4.4%
Non-Individuals 15% 6.3 6.4 (1.6)% 6.2 1.1%
RSME 4% 1.8 1.8 (0.1)% 1.7 2.1%
Business Banking 8% 3.2 3.4 (3.3)% 3.2 0.3%
Others 3% 1.3 1.3 0.9% 1.3 1.5%
Corporate Banking
42%
17.9 17.8 0.3% 16.3 9.5%
Loans to Related
Corporations0.9 0.7 27.6% 0.9 1.0%
Total 100% 43.4 42.9 1.3% 40.0 8.7%
Table of Contents
Executive Summary 2-8
4Q & Full Year FY2021 Financial Performance 10-20
Prospects & Outlook 22-24
Appendix:
1. Financial Performance 26-37
2. Community Financial Services 39-40
3. Global Banking 42-43
4. Maybank Singapore 45-46
5. Maybank Indonesia 48-49
6. Other Segments 51-53
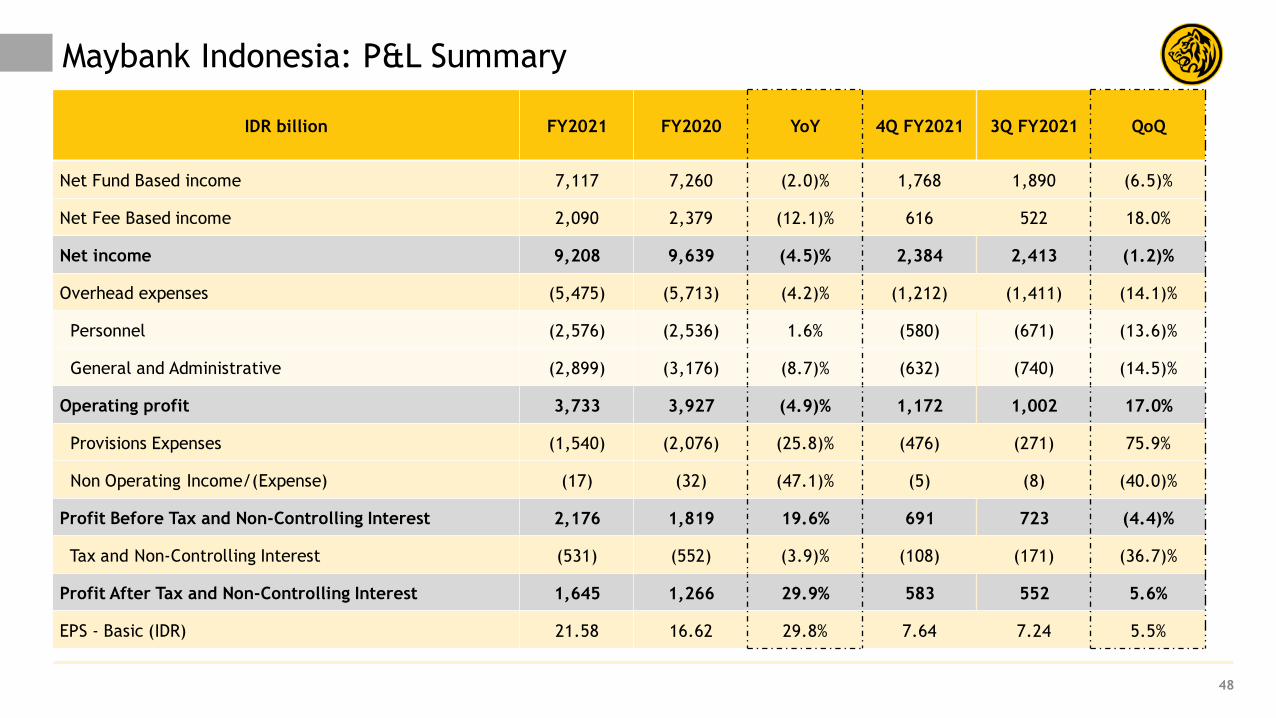
Maybank Indonesia: P&L Summary
48
IDR billion FY2021 FY2020 YoY 4Q FY2021 3Q FY2021 QoQ
Net Fund Based income 7,117 7,260 (2.0)% 1,768 1,890 (6.5)%
Net Fee Based income 2,090 2,379 (12.1)% 616 522 18.0%
Net income 9,208 9,639 (4.5)% 2,384 2,413 (1.2)%
Overhead expenses (5,475) (5,713) (4.2)% (1,212) (1,411) (14.1)%
Personnel (2,576) (2,536) 1.6% (580) (671) (13.6)%
General and Administrative (2,899) (3,176) (8.7)% (632) (740) (14.5)%
Operating profit 3,733 3,927 (4.9)% 1,172 1,002 17.0%
Provisions Expenses (1,540) (2,076) (25.8)% (476) (271) 75.9%
Non Operating Income/(Expense) (17) (32) (47.1)% (5) (8) (40.0)%
Profit Before Tax and Non-Controlling Interest 2,176 1,819 19.6% 691 723 (4.4)%
Tax and Non-Controlling Interest (531) (552) (3.9)% (108) (171) (36.7)%
Profit After Tax and Non-Controlling Interest 1,645 1,266 29.9% 583 552 5.6%
EPS - Basic (IDR) 21.58 16.62 29.8% 7.64 7.24 5.5%
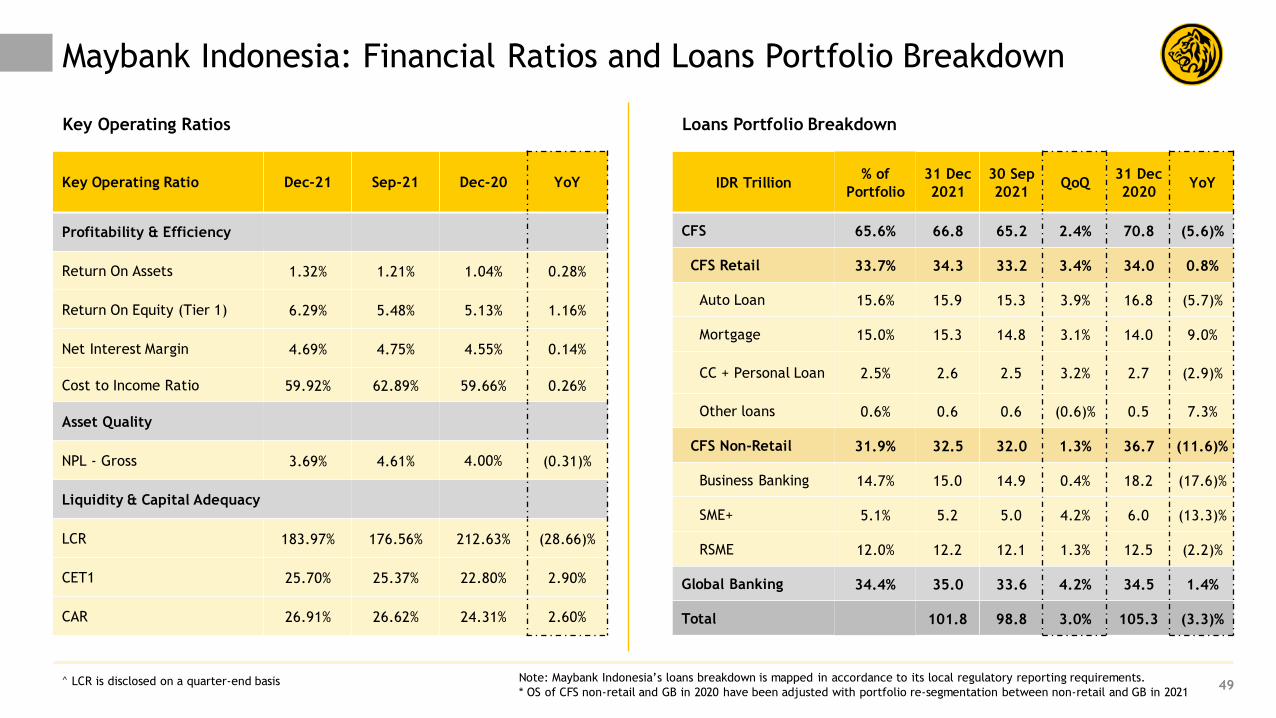
Maybank Indonesia: Financial Ratios and Loans Portfolio Breakdown
49
Key Operating Ratios Loans Portfolio Breakdown
Key Operating Ratio Dec-21 Sep-21 Dec-20 YoY
Profitability & Efficiency
Return On Assets 1.32% 1.21% 1.04% 0.28%
Return On Equity (Tier 1) 6.29% 5.48% 5.13% 1.16%
Net Interest Margin 4.69% 4.75% 4.55% 0.14%
Cost to Income Ratio 59.92% 62.89% 59.66% 0.26%
Asset Quality
NPL - Gross 3.69% 4.61% 4.00% (0.31)%
Liquidity & Capital Adequacy
LCR 183.97% 176.56% 212.63% (28.66)%
CET1 25.70% 25.37% 22.80% 2.90%
CAR 26.91% 26.62% 24.31% 2.60%
IDR Trillion% of
Portfolio
31 Dec
2021
30 Sep
2021QoQ
31 Dec
2020YoY
CFS 65.6% 66.8 65.2 2.4% 70.8 (5.6)%
CFS Retail 33.7% 34.3 33.2 3.4% 34.0 0.8%
Auto Loan 15.6% 15.9 15.3 3.9% 16.8 (5.7)%
Mortgage 15.0% 15.3 14.8 3.1% 14.0 9.0%
CC + Personal Loan 2.5% 2.6 2.5 3.2% 2.7 (2.9)%
Other loans 0.6% 0.6 0.6 (0.6)% 0.5 7.3%
CFS Non-Retail 31.9% 32.5 32.0 1.3% 36.7 (11.6)%
Business Banking 14.7% 15.0 14.9 0.4% 18.2 (17.6)%
SME+ 5.1% 5.2 5.0 4.2% 6.0 (13.3)%
RSME 12.0% 12.2 12.1 1.3% 12.5 (2.2)%
Global Banking 34.4% 35.0 33.6 4.2% 34.5 1.4%
Total 101.8 98.8 3.0% 105.3 (3.3)%
Note: Maybank Indonesia’s loans breakdown is mapped in accordance to its local regulatory reporting requirements.
* OS of CFS non-retail and GB in 2020 have been adjusted with portfolio re-segmentation between non-retail and GB in 2021^ LCR is disclosed on a quarter-end basis
Table of Contents
Executive Summary 2-8
4Q & Full Year FY2021 Financial Performance 10-20
Prospects & Outlook 22-24
Appendix:
1. Financial Performance 26-37
2. Community Financial Services 39-40
3. Global Banking 42-43
4. Maybank Singapore 45-46
5. Maybank Indonesia 48-49
6. Other Segments 51-53
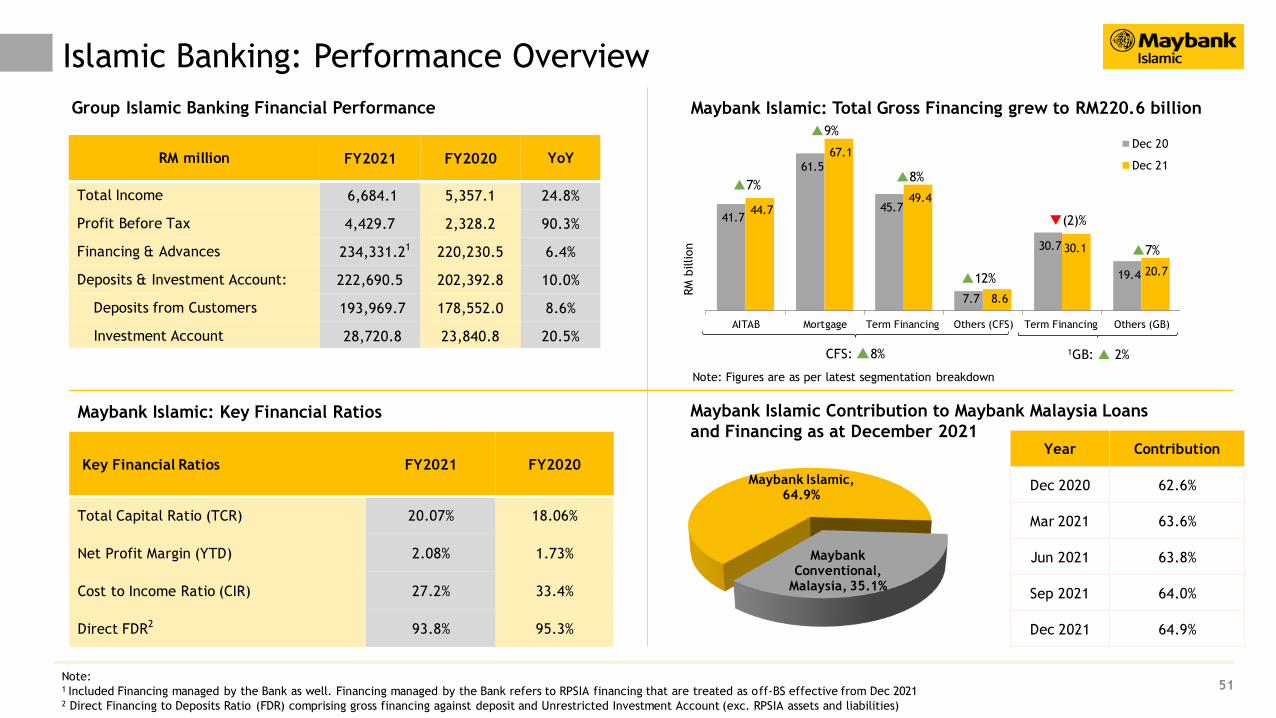
Maybank Islamic, 64.9%
Maybank Conventional,
Malaysia, 35.1%
RM million FY2021 FY2020 YoY
Total Income 6,684.1 5,357.1 24.8%
Profit Before Tax 4,429.7 2,328.2 90.3%
Financing & Advances 234,331.21 220,230.5 6.4%
Deposits & Investment Account: 222,690.5 202,392.8 10.0%
Deposits from Customers 193,969.7 178,552.0 8.6%
Investment Account 28,720.8 23,840.8 20.5%
Islamic Banking: Performance Overview
51
Group Islamic Banking Financial Performance
Maybank Islamic: Key Financial Ratios
Key Financial Ratios FY2021 FY2020
Total Capital Ratio (TCR) 20.07% 18.06%
Net Profit Margin (YTD) 2.08% 1.73%
Cost to Income Ratio (CIR) 27.2% 33.4%
Direct FDR2 93.8% 95.3%
Note:1 Included Financing managed by the Bank as well. Financing managed by the Bank refers to RPSIA financing that are treated as off-BS effective from Dec 20212 Direct Financing to Deposits Ratio (FDR) comprising gross financing against deposit and Unrestricted Investment Account (exc. RPSIA assets and liabilities)
Maybank Islamic: Total Gross Financing grew to RM220.6 billion
Note: Figures are as per latest segmentation breakdown
Year Contribution
Dec 2020 62.6%
Mar 2021 63.6%
Jun 2021 63.8%
Sep 2021 64.0%
Dec 2021 64.9%
Maybank Islamic Contribution to Maybank Malaysia Loans
and Financing as at December 2021
41.7
61.5
45.7
7.7
30.7
19.4
44.7
67.1
49.4
8.6
30.1
20.7
AITAB Mortgage Term Financing Others (CFS) Term Financing Others (GB)
Dec 20
Dec 218%
7%
RM
billion
(2)%
CFS: 8% 1GB: 2%
12%
9%
7%
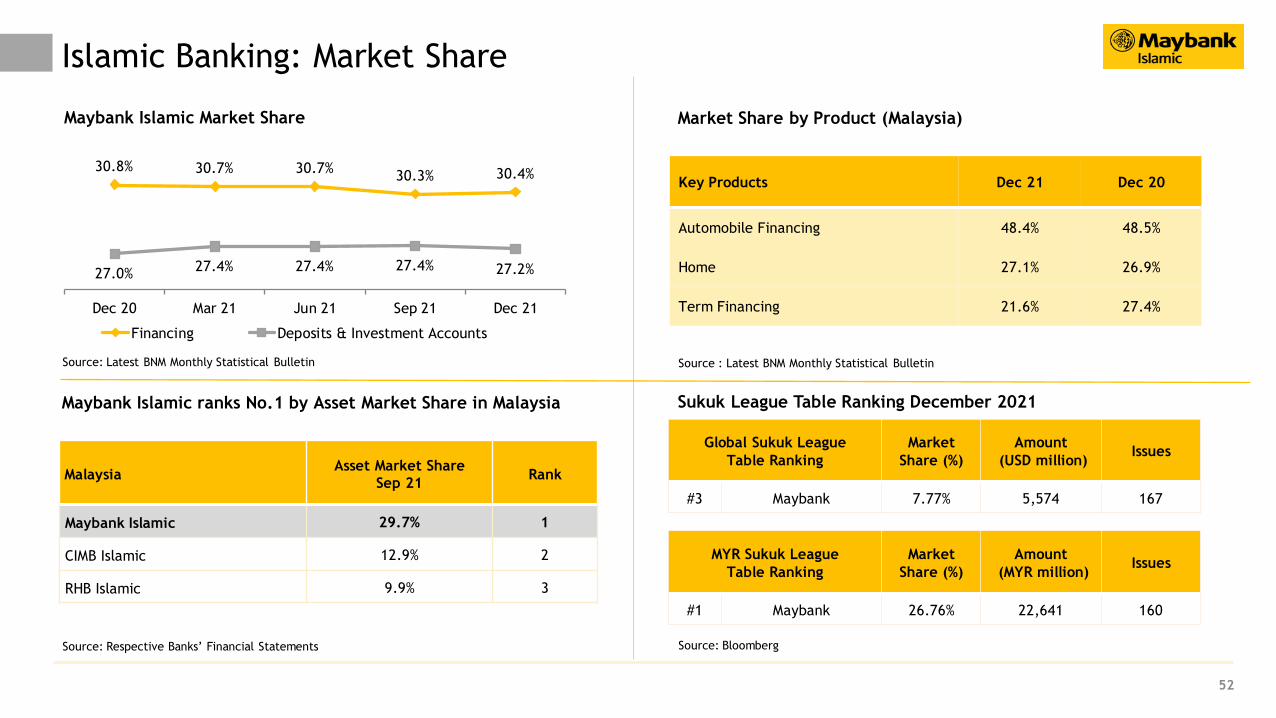
Islamic Banking: Market Share
52
Key Products Dec 21 Dec 20
Automobile Financing 48.4% 48.5%
Home 27.1% 26.9%
Term Financing 21.6% 27.4%
Maybank Islamic ranks No.1 by Asset Market Share in Malaysia
Market Share by Product (Malaysia) Maybank Islamic Market Share
30.8% 30.7% 30.7%30.3% 30.4%
27.0%27.4% 27.4% 27.4% 27.2%
Dec 20 Mar 21 Jun 21 Sep 21 Dec 21
Financing Deposits & Investment Accounts
MalaysiaAsset Market Share
Sep 21Rank
Maybank Islamic 29.7% 1
CIMB Islamic 12.9% 2
RHB Islamic 9.9% 3
Source: Latest BNM Monthly Statistical Bulletin
Sukuk League Table Ranking December 2021
Source : Latest BNM Monthly Statistical Bulletin
Source: BloombergSource: Respective Banks’ Financial Statements
Global Sukuk League
Table Ranking
Market
Share (%)
Amount
(USD million)Issues
#3 Maybank 7.77% 5,574 167
MYR Sukuk League
Table Ranking
Market
Share (%)
Amount
(MYR million)Issues
#1 Maybank 26.76% 22,641 160
Profit Before Tax
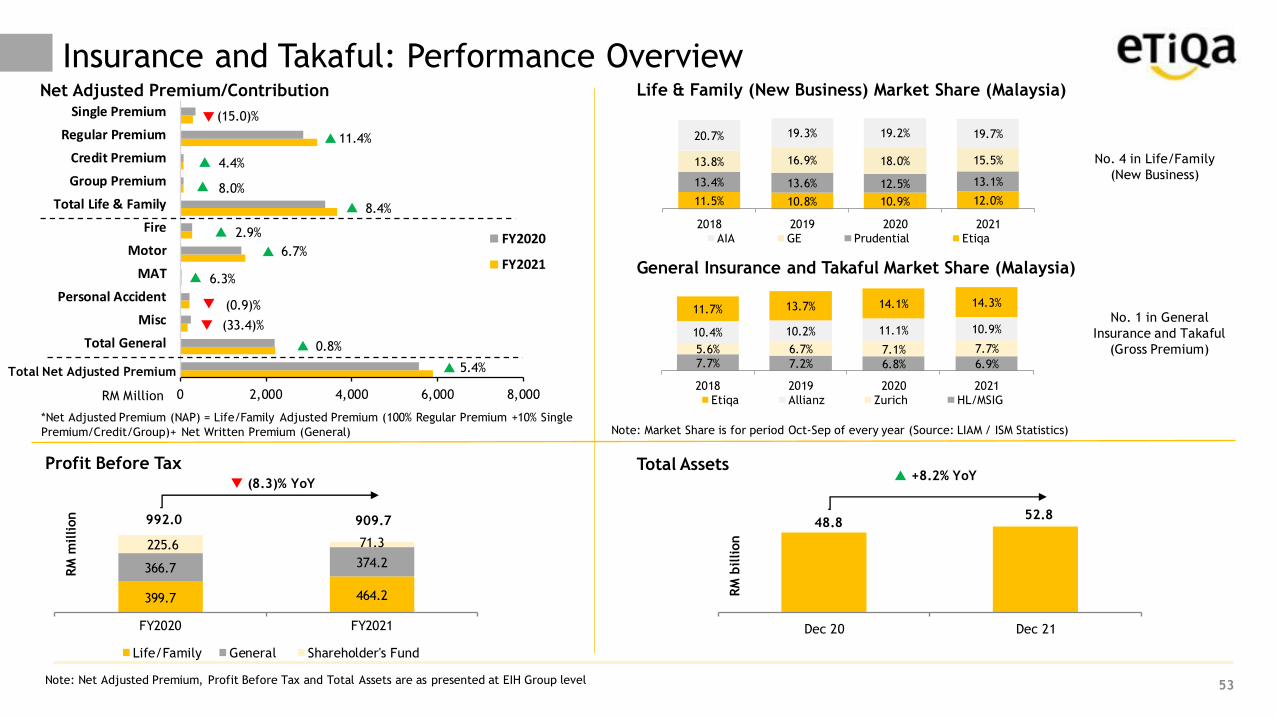
Insurance and Takaful: Performance Overview
53
Total Assets
Net Adjusted Premium/Contribution Life & Family (New Business) Market Share (Malaysia)
No. 1 in General
Insurance and Takaful
(Gross Premium)
General Insurance and Takaful Market Share (Malaysia)
Note: Market Share is for period Oct-Sep of every year (Source: LIAM / ISM Statistics)
No. 4 in Life/Family
(New Business)
*Net Adjusted Premium (NAP) = Life/Family Adjusted Premium (100% Regular Premium +10% Single
Premium/Credit/Group)+ Net Written Premium (General)
Note: Net Adjusted Premium, Profit Before Tax and Total Assets are as presented at EIH Group level
399.7 464.2
366.7 374.2
225.6 71.3
FY2020 FY2021
Life/Family General Shareholder's Fund
(8.3)% YoY
992.0 909.7
RM
million
48.8 52.8
Dec 20 Dec 21
+8.2% YoY
RM
billion
0 2,000 4,000 6,000 8,000
Total General
Misc
Personal Accident
MAT
Motor
Fire
Total Life & Family
Group Premium
Credit Premium
Regular Premium
Single Premium
RM Million
FY2020
FY2021
(15.0)%
11.4%
4.4%
8.0%
8.4%
2.9%
6.7%
(0.9)%
6.3%
(33.4)%
0.8%
5.4%
Total Net Adjusted Premium7.7% 7.2% 6.8% 6.9%
5.6% 6.7% 7.1% 7.7%
10.4% 10.2% 11.1% 10.9%
11.7% 13.7% 14.1% 14.3%
2018 2019 2020 2021
Etiqa Allianz Zurich HL/MSIG
11.5% 10.8% 10.9% 12.0%
13.4% 13.6% 12.5% 13.1%
13.8% 16.9% 18.0% 15.5%
20.7% 19.3% 19.2% 19.7%
2018 2019 2020 2021
AIA GE Prudential Etiqa

Humanising Financial Services
MALAYAN BANKING BERHAD14th Floor, Menara Maybank100, Jalan Tun Perak50050 Kuala Lumpur, MalaysiaTel : (6)03-2070 8833
www.maybank.com
Disclaimer. This presentation has been prepared by Malayan Banking Berhad (the “Company”) for information purposes only and does not purport to contain all the information that
may be required to evaluate the Company or its financial position. No representation or warranty, express or implied, is given by or on behalf of the Company as to the accuracy or
completeness of the information or opinions contained in this presentation.
The presentation does not constitute or form part of an offer, solicitation or invitation of any offer, to buy or subscribe for any securities, nor should it or any part of it form the basis
of, or be relied in any connection with, any contract, investment decision or commitment whatsoever.
The Company does not accept any liability whatsoever for any loss howsoever arising from any use of this presentation or their contents or otherwise arising in connection therewith.