i
INVESTIGATION OF THE EFFECTS OF
POLYCHLORINATED BIPHENYL (PCB)
DECHLORINATION ON THE NATURAL INHIBITORS AND
OXIDATION STABILITY OF UNINHIBITED NAPHTHENIC
BASED MINERAL OILS
Sumaya Nassiep
Submitted in partial fulfilment of the requirements for the degree
Master of Science in Engineering (Power and Energy Systems), Faculty of Engineering,
University of KwaZulu-Natal
January 2010
Supervisor: Prof Dave Arnold

ii
I Sumaya Nassiep, student number 205526658 declare that
i. The research reported in this dissertation, except where otherwise indicated, is my original
work.
ii. This dissertation has not been submitted for any degree or examination at any other
University.
iii. This dissertation does not contain other persons’ data, pictures, graphs or other information,
unless specifically acknowledged as being sourced from other persons.
iv. This dissertation does not contain other persons’ writing, unless specifically acknowledged as
being sourced from other researchers. Where other written sources have been quoted, then:
a) their words have been re-written but the general information attributed to them has been
referenced;
b) where their words have been used, their writing has been placed inside quotation
marks, and referenced.
v. Where I have reproduced a publication of which I am an author, co-author or editor, I have
indicated in detail which part of the publication was actually written by myself alone and
have fully referenced such publications.
vi. This dissertation does not contain text, graphics or tables copied and pasted from the Internet,
unless specifically acknowledged, and the source being detailed in the dissertation and the
references sections.
_________________
Sumaya Nassiep
Disclaimer
The contents of this research report are the views and opinions of the author and not necessarily that
of Eskom.

iii
ACKNOWLEDGEMENTS
The author would like to acknowledge and thank the following persons:
My supervisor, Prof Dave Arnold, for guidance and support without which this research
would not have been possible.
My Husband, Kadri Nassiep, for his inspiration, encouragement and unwavering support.
My three children for their support and understanding.
Dr Christos Eleftheriades and Mr Norman Wellen for their support as industry partners.
My parents for their faith and support over the years.
Ms Catherine Jacobs and Mr Mohammad Essop for their assistance.

iv
ABSTRACT
PCBs are persistent organic pollutants that have intentionally and unintentionally (through
contamination) been added to mineral insulating oil to improve its insulating and cooling
properties within electrical equipment. The Stockholm Convention on Persistent Organic
Pollutants (2001) orders the eradication of PCBs from use by 2025.
Sodium based dechlorination is a PCB destruction process that is non-thermal, relatively cost
effective and allows for the recovery of a reusable end product. A comparative benefits
study, contained in chapter 2 of this dissertation, describes the increased financial and
environmental impact associated with incinerating large volumes of PCB contaminated
mineral oil. The results of the comparative analysis indicate a cost ratio of 1: 2.5, in favour of
sodium dechlorination.
In addition to the financial benefit, the sodium based PCB dechlorination process is versatile
and can be either batched or skid mounted and is typically combined with an oil regeneration
step, allowing for transformers to be treated onsite and whilst energised. Eskom is currently
considering obtaining the mobile dechlorination unit for the purpose of conducting
dechlorination and regeneration on its PCB contaminated transformers while energised.
Mineral insulating oil is considered a strategic asset within most industries. Eskom uses
mainly uninhibited mineral oil in its older transformers and the effects of PCB dechlorination
on the natural inhibitor content of the oil is uncertain.
The objective of this study was to investigate the effects of sodium dechlorination on the
oxidation stability and thereby indirectly the natural inhibitor content of uninhibited
naphthenic based mineral oil. The study involved the dechlorination, regeneration and
subsequent chemical analyses of PCB contaminated oils in the PCB ranges <50ppm, 50 to
500 ppm and >500 ppm as stipulated by the Stockholm Convention on Persistent Organic
Pollutants (2001).
The study confirmed the reduction in oxidation stability and thereby the natural inhibitor
content of the mineral oil after sodium dechlorination. Based on the results obtain a

v
preliminary algorithm was established to predict the reduction in oxidation stability after
sodium dechlorination, as a function of the PCB concentration prior to dechlorination. This
will provide an indirect indication of the rate of natural inhibitor depletion of the oil, based on
its exposure to the sodium dechlorination reagents and process conditions.

vi
TABLE OF CONTENTS
CHAPTER ONE: INTRODUCTION…………………………………………...……..…….....1
1.1 Background………………………………………………………………...............................1
1.2 The PCB situation in Eskom……………………………..………………………….………2
1.3 Potential alternative uses for dechlorinated oils………..………………...….......................3
1.4 Expected benefits………………………………………………………………………….….3
1.5 Hypothesis……………………………………………………………..…..………….............4
1.6 Research design…………… ……………………………………………………..….............4
1.7 Research methodology………………………………………………..…………...................5
1.8 Outline of dissertation chapters…………………………………………………..................6
CHAPTER TWO: LITERATURE REVIEW………………………………………..............7
2.1 Introduction to literature review………………………………………...….........................7
2.2 Mineral insulating oils……………………………………………………….........................7
2.3 Role of mineral insulating oil in transformers…...……………………...….......................10
2.4 The effects of oxidation on mineral oil characteristics……………….……………….......12
2.5 Characteristics of PCBs…………………………………………………….........................16
2.6 The history of PCBs……………. …………………………………………….....................18
2.7 Health & environmental impacts of PCB…………………………………….....................19
2.8 PCB regulation in South Africa.…………………………………………….......................20
2.9 Base catalysed dechlorination for PCB destruction………………………………………24
2.10 Other PCB destruction technologies………………………………………….....................30
2.11 Insulating oil regeneration…………………...……………………...…...............................35
2.12 Artificial neural networks…………………...……………………...…................................37
2.13 Summary of literature reviewed…………………...……………………...….....................40
2.14 Comparative analysis of the benefits of dechlorination versus local PCB licensed
disposal options..……………………………………………………………………………43
CHAPTER THREE: EXPERIMENTAL ……………………………..…………........... ………49
3.1 Introduction to the experimental investigation……..…………….…………....................49
3.2 Experimental methodology…………………………………………………………………49

vii
3.3 Description of process & equipment used in experimental work……………………......50
3.4 Chemical analyses of uninhibited dechlorinated mineral oil…………………………….55
CHAPTER FOUR: EVALUATION & INTERPRETATION OF RESULTS……………….58
4.1 Introduction to evaluation & interpretation of results………………………...................58
4.2 Results obtained………….……………………………………………………………….....58
4.3 Evaluation & interpretation of results used…………….……............................................64
4.4 Trend evaluation of results across the PCB test range………………………….…….….70
CHAPTER FIVE: ALGORITHM APPLICATION………………………………………….74
5.1 Introduction to algorithm application and the application of neural networks to
this study….…………………………………………………………………………………74
5.2 The results obtained from the established algorithm ……………………………………76
CHAPTER SIX: CONCLUSIONS & RECOMMENDATIONS ……………………….........78
REFERENCES …………………………………………………………………………… ………80
APPENDICES.…………………………………………………………………………….……....85
Appendix 1: Materials safety data sheet for PCBs in oil…………………………………...….86
Appendix 2: Stockholm Convention on persistent organic pollutants – Annex A, part II..….89
Appendix 3: The actual execution of the Matlab / Netlab code used for the development
of the neural network……………………………………………………………...92
Appendix 4: Result of the Matlab / Netlab code execution from Appendix 3…………………99

viii
LIST OF FIGURES
NUMBER PAGE
Figure 2-1: Basic hydrocarbon structures in mineral insulating oil ....................................................... 8
Figure 2-2: Acidity of the oil samples from 43 power transformers of various ages........................... 13
Figure 2-3: Arrhenius plot of accelerated aging of an oil sample at different temperatures................ 14
Figure 2-4: Transformer indicating the position of the paper insulation around the transformer
windings………………………………………………………………………………….15
Figure 2-5: Generic molecular structure of PCB ................................................................................. 16
Figure 2-6: Visuals of PCB-sodium dispersion single particle reaction .......................................... . 26
Figure 2-7: Simulated sodium-PCB reaction model ............................................................................ 26
Figure 2-8: Model regressed by Huang et al. (2007) to the reaction rate, based on 10%wt PCB
at 160OC............................................................................................................................. 28
Figure 2-9: Sodium dispersion particle size vs. reaction time……………………………………….. 29
Figure 2-10: Schematic of the Fuller’s earth oil regeneration process oil regeneration process…...36
Figure 2-11: System configuration for developing (training) and testing a neural network……… .... 37
Figure 2-12: A two layer perceptron neural network with two neutrons in the hidden layer and two
neurons in the output layer……………………………………………………………. .38
Figure 2-13: Log-Sigmoid, linear an hyperbolic tangent activation functions….…………………….39
Figure 3-1: Sodium dechlorination process flow ................................................................................. 53
Figure 3-2: Mobile sodium dechlorination plant.................................................................................. 54
Figure 3-3: Reagent / injector dosing................................................................................................... 54
Figure 3-4: Centrifuge – separation ..................................................................................................... 54
Figure 3-5: Sample collection .............................................................................................................. 54
Figure 4-1: Oxidation stability as percentage sludge formation (<50 ppm) ........................................ 65
Figure 4-2: Oxidation stability as ppm of acidity formation (<50 ppm).............................................. 65
Figure 4-3: Oxidation stability as percentage sludge formation (50 - 500 ppm) ................................. 67
Figure 4-4: Oxidation stability as ppm of acidity formation (50 -500 ppm)........................................ 68
Figure 4-5: Oxidation stability as percentage sludge formation (>500ppm) ....................................... 69
Figure 4-6: Oxidation Stability as ppm of acidity formation (>500ppm) ............................................ 69
Figure 4-7: Regression plot of acidity as percentage sludge formation prior to dechlorination…… .. 71

ix
Figure 4-8: Regressions plot of acidity as percentage sludge formation after dechlorination…....71
Figure 4-9: Percentage variation in acidity as percentage sludge formation..................................72
Figure 4-10: Regression plot of acidity and percentage sludge formation after regeneration……72
Figure 5-1: Dechlorination and 164 hr oxidation test..…………………………………………...74
Figure 5-2: System configuration………………………………………………………………...75
Figure 5-3: Neural network……………………………………………………………………….76

x
LIST OF TABLES
NUMBER PAGE Table 2-1: Sulphur types and reactivity within mineral oil………………………………………….9
Table 2-2: Recommended limits for oil properties of uninhibited regenerated oil ………………...11
Table 2-3: List of PCB derivatives and their number of isomers………………….…….……...….17
Table 2-4: Characteristics of commercial Aroclors …..…………….…………………....………...17
Table 2-5: List of PCB trade names. ……………………………………………………….............18
Table 2-6: SANS documentation relating to the transportation of PCBs…………………………..24
Table 2-7: Conditions and constants for the simulated reaction……………………….....………...28
Table 2-8: Selected resource input required & CO2 emitted to produce 5.75 GWh……………......45
Table 2-9: Selected resource input required & CO2 emitted to produce 0.58 GWh...……………...47
Table 3-1: Ranges of PCB contaminated oil for processing………………………………………..50
Table 4-1: PCB concentration results of test samples …..................................................................59
Table 4-2: Oxidation Stability results as percentage sludge formation for sample in PCB test
range………………………………………………………………………….……….....60
Table 4-3: Oxidation Stability results as acidity content for samples in the PCB test
range……....………………………………………………………………………….....60
Table 4-4: Results for polyaromatic hydrocarbon analysis for samples in the PCB test range….....61
Table 4-5: Results of the total sulphur content analysis for samples in the PCB test range……......62
Table 4-6: Results of the moisture analysis for samples in the PCB test range……….……………63
Table 4-7: Dielectric strength results for samples in the PCB test range……………………..…….63
Table 4-8: Results of neutralisation value analysis for the samples in the PCB test range....…........64
Table 5-1: Sample of percentage sludge formation input and output data….. …...…………….. …75
Table 5-2: Sample of acidity concentration input and output data….. ………...……….…………..75
Table 5-3: Model 1 - Oxidation stability as percentage sludge formation ………....…..……….….77
Table 5-4: Model 2 - Oxidation stability as percentage acidity content........……………………….77
xi
DEFINITIONS
Abnormal Operating Conditions Transformer operations where the mineral insulating oils is exposed to high temperatures and excess moisture and oxygen
Age assessment tests Age assessment tests are done to determine the ageing characteristics of electrical equipment by means of chemical analysis of the insulating oil.
Antioxidant additive A synthetic organic compound added to retard the oxidation process in insulating oil.
Arrhenius law A mathematical empiric law relating to the influence of temperature on the velocity of chemical reactions.
Askarel and Aroclor Refers to well defined commercial PCB mixtures.
Backpropagation A supervised learning process for training feed forward neural networks to learn from test samples
Concentration: Refers to the concentration of PCBs in the dilutent in mg/L or parts per million.
Congeners Group of chemicals which have the same basic structure.
Corrosive sulphur: Oil containing reactive sulphur that can cause corrosion problems in power equipment.
Dechlorinated oil PCB contaminated oil which has passed through a chlorine stripping chemical process and has been treated in such a manner so as to render it safe and no longer a safety, health and environmental hazard.
Duty of Care (National Environmental Management Act)
An ethical and legal concept relating to the responsibility of each and every individual to take all reasonable and practical measures in undertaking their activities to prevent harm to another person or property of another
Dielectric strength Ability of oil to withstand electrical stress, and is influenced by the presence of moisture and particulate material in the oil
Electrical equipment: Transformer, capacitor, voltage regulator, re-closer, switchgear or cable that contains dielectric fluid

xii
Gigawatt hour 1000 x MWh
Inhibited Insulating oil that has a synthetic antioxidant additive added to prevent oxidation. Typical values are between a minimum of 0.08% to a maximum of 0.4% anti oxidant.
Insulating (mineral) oil Mineral oil used in transformers and other electrical equipment for insulation and cooling.
Kilowatt hour The unit of energy equivalent to one kilowatt (1 kW) of power expended for one hour (1 h) of time
Megaflex Time of use electricity tariff for urban customers who are able to shift load and with an NMD (notified maximum demand) greater than 1MVA
Megawatt hour 1000 x kWh
Moisture content Moisture dissolved in oil and measured in parts per million or milligrams per kilogram. Moisture decreases the insulating potential of oil and can originate from sources both internal and external to electrical equipment.
Miniflex Time of use electricity tariff for urban customers with an NMD from 25kVA up to 5MVA (font)
Naphthenic, paraffinic or aromatic insulating oil
Classification of oil dependent on the relative proportions of the three molecular types, each of which conveys its own properties of the finished product.
Neutralization value, acidity, total acid number
Indication or measure of the acidic constituents or contaminants in the oil. The presence of acids is normally an indication of oxidation of oil.
New /Virgin oil Oil that has never been used in electrical equipment and that complies in all respects with new oil specifications laid down in this document.
Non-PCB Oil, including oil in electrical equipment and in any item of equipment, that has a measurable PCB concentration of less than <50 ppm as per SANS 0290
Oxidation Process of oil degradation induced by the presence of moisture, oxygen and high temperatures.
Polychlorinated Biphenyl Any one of a number of 209 congeners containing one to ten chlorine atoms attached to a biphenyl group.
xiii
PCBs are synthetic products not known to occur naturally. New oil produced from crude oil does not contain PCB.
PCB contaminated item Equipment or container (e.g. package, can, bottle, bag, barrel, drum, tank) or any other device that contains PCB or the surfaces of which have been in contact with PCB (the PCB being at a concentration of between 51 ppm and 500 ppm), or any article (e.g. container, oil, water, soil, personal protective equipment) that has been in contact with PCB or PCB contaminated equipment
PCB free PCB level is below the detection limits and ideally will be zero
Regeneration process A clay reclamation process whereby the chemical and physical properties of used oil is restored to SANS 10555 standards
Regenerated oil Reclaimed used oil that has undergone an oil regeneration process.
Single layer perceptron A simple net that can decide if an input belongs to one of two possible classes.
Transformer A static electrical device that transfers electricity from one electrical circuit to another by magnetic coupling. It is often used to convert between high and low voltages and accordingly between low and high currents.
Uninhibited Insulating oil that has no antioxidant additive present and therefore depends on its natural antioxidants to combat oxidation.

xiv
ABBREVIATIONS
COP Conference of parties
DBDS Dibenzyl disulphide
DEA Department of environmental affairs (South Africa)
DGA Dissolved gas analysis
GWh Giga Watt hour
H:H Landfill site licensed to dispose of highly hazardous materials
HPLC High performance liquid chromatography
kWh Kilowatt hour
MWh Mega Watt hour
mg KOH/g Amount of potassium hydroxide, measured in milligrams, needed to
neutralize the amount of acid in a weighed amount of oil.
PAH Polyaromatic hydrocarbon(s)
PCB Polychlorinated biphenyl
POP Persistent organic pollutant
ppm Parts per million
SANS South African national standards
TNP Test not performed
UNEP United nations environmental programme

1
Chapter One
INTRODUCTION
1.1 BACKGROUND
Polychlorinated Biphenyl (PCB) is the generic term given to a broad class of fire-resistant
synthetically produced substances. PCBs were designed to have very high physical and
chemical stability which created ideal heat transfer and electrical insulating media for a host of
industrial and commercial applications, the most common being its use in electrical equipment
such as transformers and capacitors.
Sanders et al. (1992) cited that the first commercial production of PCBs dated back to the late
1920’s, which sparked its global demand and production under various trade names during the
five decades that followed. The most common PCB trade name encountered in South Africa is
Askarel, which consists of a combination of commercial PCB mixtures. Globally, PCB
production ceased in the late 1970’s after it was confirmed that the very characteristics that
made them ideal for industrial use also rendered them problematic to human health and the
environment (US EPA, n.d).
PCBs have been earmarked under the Stockholm Convention on Persistent Organic Pollutants
for eradication from the environment by 2025. The convention was ratified by the South
African government on the 4th of September 2002, as stated by the United Nations
Environmental Programme (UNEP) in its Status of ratification of the Stockholm Convention
report (UNEP, 2006). South Africa is a party to the convention and has consented to be bound
by the regulations and terms of the convention. All industries within South Africa are legally
required to conform to the conditions, restrictions and limitations as set out in the convention.
The South African DEA, in collaboration with the Stockholm Convention’s implementing
body, UNEP, has initiated a PCB inventory collection campaign. The immediate objective of
the campaign is to establish registers of PCB stockpiles from major industries and to create
awareness within industry. The long term objective of the inventory collection campaign is to
regulate and monitor the management and safe disposal of PCBs within the timeframe
2
stipulated by the Stockholm Convention. This is done in accordance with the terms as set in
Article 6 of the convention (Stockholm Convention, 2001).
Several PCB disposal processes based on thermal, chemical and microbial destruction
techniques are in commercial use worldwide. Only two disposal options are currently legally
available within South Africa namely, land filling at a licensed H:H landfill site and thermal
treatment at a licensed hazardous disposal plant in Gauteng. Section 20 of the Environment
Conservation Act (1989) of South Africa declares that waste can only be disposed of at
facilities that are licensed by the Minister of the then Water Affairs and Forestry Department.
Fulfillment of the requirements for the licensing of a hazardous waste treatment facility are,
understandably, exponentially more stringent, extensive and therefore costly when compared to
that of a general waste processing facility or site. This is a major contributing factor to the
limited number of licensed PCB disposal options available within South Africa.
1.2 THE PCB SITUATION IN ESKOM
Eskom purchased several thousand PCB capacitors and very few PCB containing transformers,
mainly excitation type, during the 1900’s. The power utility’s access to the widespread
acquisition of PCB containing equipment was relatively limited as a result of sanctions imposed
upon South Africa during the Apartheid years. Eskom has taken a proactive approach to the
identification, management and environmentally sound disposal of its PCB stockpiles over the
past two decades. This is evident in its 1993 establishment of a PCB test laboratory, its 1995
hosting of an International Conference on PCBs, the development of in-house PCB expertise
and the implementation of several PCB directives, policies, specifications and standards within
the utility. Despite these efforts, Eskom still has in excess of 1000 tons of PCB containing
equipment and a few thousand tons of PCB contaminated oil requiring phase-out. The utility’s
phase-out plans have been hampered by a number of factors. These include;
• The limited number of licensed PCB disposal facilities available locally. Disposal options
are currently restricted to land filling or thermal treatment.
• No availability of a government licensed PCB dechlorination facility. Dechlorination
would allow for the recovery and reuse of the dechlorinated oil, be it for reuse internally
and/or externally to the Eskom network.

3
• The high costs associated with currently available disposal options. The licensed PCB
disposal facilities currently have a monopoly within their respective markets.
• Eskom’s current financial and electricity supply constraints, warranting the prioritisation of
critical areas to ensure business sustainability viz. capital expansion planning, new build,
and optimisation of operations and maintenance regimes.
1.3. POTENTIAL ALTERNATIVE USES OF DECHLORINATED OILS
As a result of the uncertainty regarding the reuse of uninhibited dechlorinated mineral oil
within the Eskom transformer fleet, establishing potential alternative uses for such oils is of
importance to Eskom. The author consulted with in-house specialists on the Eskom Insulating
Oil Steering Committee to establish possible alternative uses, i.e. other than its use in
transformers. The option of adding an artificial inhibitor after dechlorination and then its reuse
in transformers was considered. Eskom uses predominantly laboratory analyses for condition
monitoring of its transformers. Artificially inhibiting the oil may affect its in-service
behaviour, which in turn will have an effect on transformer trending patterns.
Potential alternative uses for dechlorinated oils include:
• Blending as a co-fuel in other processes such as cement kilns, dual fuel boilers (depending
on oil characteristics), etc.
• As top-up oil for transformers containing uninhibited oils and provided it conforms to the
SANS 555 standard (SABS, 2007).
• Use in lubricating oils
• Use in smaller non-critical electrical equipment such as pole mounted transformers
• In the production of petroleum based products.
In light of the recent global crude oil crisis and shortage, the reuse of the recovered oils will
offer some financial relief to industry.
1.4. EXPECTED BENEFITS
The expected benefits of this study to Eskom and Industry are summarised as follows:
• The study provides the scientific basis to confirm the research hypothesis and therefore to
discourage the use, and or reuse, of sodium based dechlorinated uninhibited naphthenic

4
mineral oils in critical electrical equipment such as transformers. Doing so may result in
accelerated ageing through increased rates of oil and cellulose oxidation and ultimately
reduce the operational life expectancy of the transformers.
• Improved economic benefit through promotion of the reuse of dechlorinated oil in other
areas internal or external to the business and in so doing offset the cost of PCB
dechlorination.
• Positive environmental impact as the dechlorination process is a non-thermal PCB
destruction method and the oil will be recovered for reuse.
• Will support Eskom’s and government’s objectives of PCB phase-out in terms of its 2025
Stockholm Convention commitment.
1.5. HYPOTHESIS
Dechlorination of PCB contaminated oils will deplete the uninhibited mineral oils of their
natural inhibitors, thereby resulting in reduced oxidation stability and ultimately reduced life
expectancies of transformers in which such oils are used and or reused.
1.6. RESEARCH DESIGN
In order to achieve the objective of the study, the author undertook a quantitative research
approach. The study used data obtained from various analytical procedures as a basis for
verification of the study hypothesis.
The study involves the use of used uninhibited naphthenic based mineral insulating oils as this
is typically the type of oil within the Eskom network that would require dechlorination. The
characteristics of the oils have been assessed before and after dechlorination through various
chemical analyses. The samples stipulated in the study proposal have been subjected to a range
of laboratory analytical methods to assess the effects of the sodium based dechlorination on the
chemical properties of uninhibited naphthenic based mineral oil. The test results were used to
derive a preliminary algorithm to predict the reduction in oxidation stability, after sodium
dechlorination, as a function of PCB concentration prior to dechlorination. This will provide an
indirect indication of rate of natural inhibitor depletion of the oil based on its exposure to the
sodium dechlorination reagents and process conditions.
5
1.7. RESEARCH METHODOLOGY
The following activities were undertaken by the author during execution of this study:
• Identified a research topic based on current unknowns within the transformer operations
and maintenance area of the Eskom business.
• Undertook preliminary investigation into the study topic and produced a full proposal for
the study which was reviewed and accepted by the Higher Degree’s Committee of the
University of Kwa-Zulu Natal.
• Gathered and reviewed literature on uninhibited mineral insulating oil, oxidation stability,
polychlorinated biphenyls and Polychlorinated Biphenyl dechlorination processes.
• Identified industry partners, both locally and abroad, with dechlorination technologies to
assist in the experimental test trials of this study.
• Collected and prepared sufficient volumes PCB contaminated oils in the relevant PCB
concentration levels for use during PCB dechlorination.
• Processed the samples on the sodium dechlorination and collected representative samples
for analytical testing of selected oil parameters to assess the oxidation stability of the oil.
Samples were taken before and after dechlorination and after oil regeneration.
• The samples were submitted to accredited analytical laboratories, within and external to
Eskom, for the following analyses.
o PCB Analysis
o Oxidation Stability
o PAH Analysis
o Percentage Total Sulphur
o Karl-Fischer Moisture Content
o Acidity Content
o Dielectric Strength

6
• Evaluation and interpretation of the test results and the derivation of a preliminary
algorithm to predict the reduction in oxidation stability after sodium dechlorination, as a
function of PCB concentration prior to dechlorination. This will provide an indirect
indication of natural inhibitor depletion of the oil based on its exposure to the sodium
dechlorination process conditions.
• Conclusions and recommendations based on the findings of the study.
1.8. OUTLINE OF DISSERTATION CHAPTERS
The purpose of this dissertation is to:
• Provide a scientific basis, through literature and experimental studies, to support or reject
the study hypothesis that sodium based dechlorination removes the natural inhibitor
contained in uninhibited naphthenic based mineral oils.
• To establish a preliminary set of algorithms to provide an indirect measure of the natural
inhibitor content of uninhibited naphthenic based mineral oil after PCB dechlorination.
Chapter 1: Provides an introduction by means of a study background, an overview of the PCB
situation within Eskom and a comparative cost analysis of licensed PCB processes within South
Africa.
Chapter 2: Provides a review of literature relevant to the research topic.
Chapter 3: Describes the experimental methodology employed, provides details on the
technical operation of the sodium dechlorination plant and describes the analytical methods
used for analyses of PCB dechlorinated oils.
Chapter 4: Presents the experimental results obtained and the evaluation and interpretation
thereof.
Chapter 5: Describes the preliminary set of algorithms to predict the natural inhibitor content
or the oil after dechlorination.
Chapter 6: Concludes this research relating to the topic.
REFERENCES
APPENDICES

7
Chapter Two
LITERATURE REVIEW
2.1. INTRODUCTION TO THE LITERATURE REVIEW
Mineral oil serves both a cooling and insulating purpose within transformers. It is for this
reason that maintaining the quality of this strategic asset is vitally important to the smooth
operation of Eskom’s transformers and ultimately its continuity of supply.
PCBs are persistent organic pollutants that have entered the Eskom oil pool primarily through
cross contamination arising from oil rehabilitation processes such as filtration and regeneration.
Eskom has an estimated 2 million litres of PCB oil that requires phase-out by 2025. PCB oil
dechlorination is a more economical and environmentally sound manner of destroying PCBs
while allowing for the recovery of reusable dechlorinated oil. The impact of the process on the
natural inhibitors of uninhibited naphthenic based mineral oil was not well publicised. This
chapter will review literature relevant to the research topic and will include literature on
mineral insulating oils, oxidation of mineral oils, PCBs, Base Catalysed Dechlorination and
alternative destruction methods for PCBs in mineral oil.
2.2. MINERAL INSULATING OILS
2.2.1 BASIC CHEMICAL STRUCTURES OF MINERAL INSULATING OIL
Mineral oils are produced from natural crude oil distillates and have complex compositions
comprising more than 3000 different hydrocarbons structures as cited by Lobeiras et al. (2001).
These hydrocarbon structures can be classified under three main hydrocarbon groups namely,
straight chains (paraffin’s), rings without double bonds (naphthenes) and/or rings with double
bonds (aromatics).

8
Nynas (2001) describes how the three basic hydrocarbon groups are further divided into
straight-chain and branched (iso) paraffin’s, mono and condensed naphthenes and mono, linear
and angular condensed aromatics. Condensed compounds comprise two or more ring structures
in which adjacent rings share two or more carbon atoms. The condensed compounds are
important because those which are unsaturated (containing double bonds) are, in general more
reactive and therefore affect the physical properties of the oil.
Figure 2-1: Basic hydrocarbon structures in mineral insulating oil (Nynas, 2001)
A mineral oil can be classified as paraffinic, naphthenic or aromatic depending on the relative
proportions of the molecular types present in the oil. Each molecular type contributes its own
properties to the finished product.
2.2.2 OXIDATION INHIBITORS IN MINERAL OIL
Lewand (2002) explained that mineral insulating oil has molecules that contain atoms other
than carbon and hydrogen. These include atoms of sulphur, nitrogen and oxygen which are
referred to as heteroatoms. Molecules that have heteroatoms attached to several aromatic rings
are known to be highly reactive, oxidise fast and increase the rate of oxidation of other
substances. These types of molecules are considered the natural inhibitors within the oil.
Inhibitors, whether natural or synthetic, are substances that retard or render the process of
oxidation inactive.
PARAFFINS ISOPARAFFINS
NAPHTHENES
AROMATICS POLYAROMATICS
9
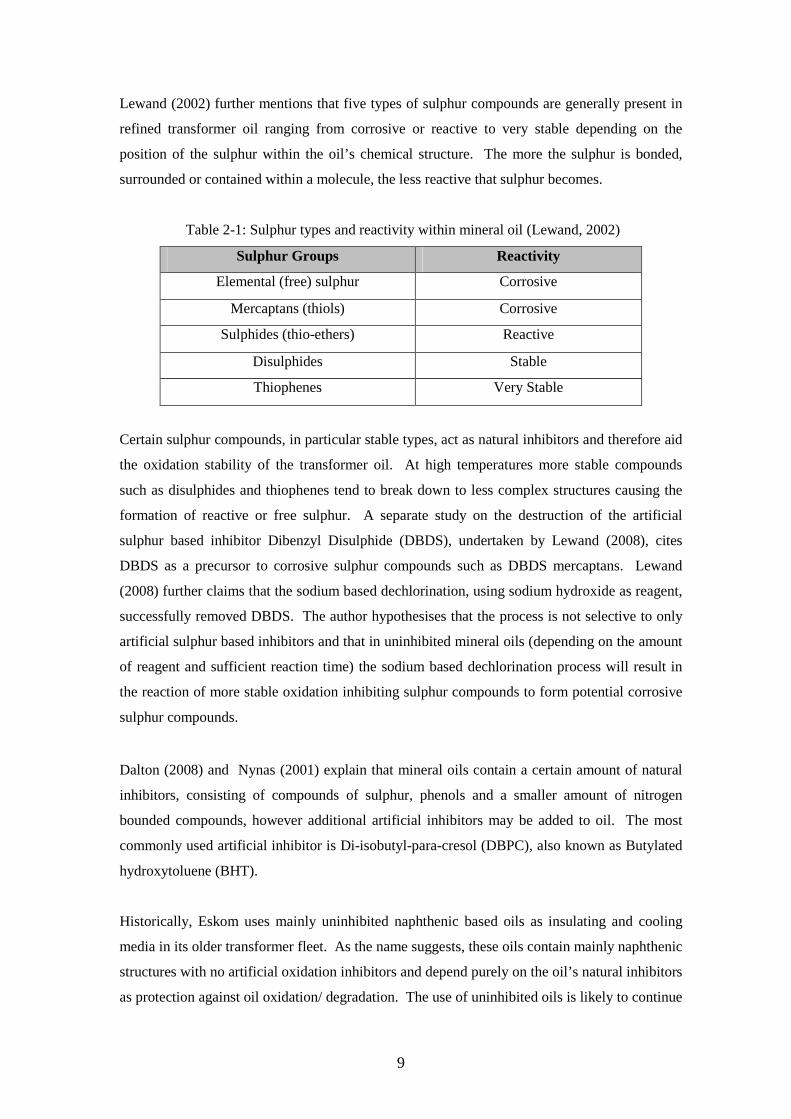
Lewand (2002) further mentions that five types of sulphur compounds are generally present in
refined transformer oil ranging from corrosive or reactive to very stable depending on the
position of the sulphur within the oil’s chemical structure. The more the sulphur is bonded,
surrounded or contained within a molecule, the less reactive that sulphur becomes.
Table 2-1: Sulphur types and reactivity within mineral oil (Lewand, 2002)
Sulphur Groups Reactivity
Elemental (free) sulphur Corrosive
Mercaptans (thiols) Corrosive
Sulphides (thio-ethers) Reactive
Disulphides Stable
Thiophenes Very Stable
Certain sulphur compounds, in particular stable types, act as natural inhibitors and therefore aid
the oxidation stability of the transformer oil. At high temperatures more stable compounds
such as disulphides and thiophenes tend to break down to less complex structures causing the
formation of reactive or free sulphur. A separate study on the destruction of the artificial
sulphur based inhibitor Dibenzyl Disulphide (DBDS), undertaken by Lewand (2008), cites
DBDS as a precursor to corrosive sulphur compounds such as DBDS mercaptans. Lewand
(2008) further claims that the sodium based dechlorination, using sodium hydroxide as reagent,
successfully removed DBDS. The author hypothesises that the process is not selective to only
artificial sulphur based inhibitors and that in uninhibited mineral oils (depending on the amount
of reagent and sufficient reaction time) the sodium based dechlorination process will result in
the reaction of more stable oxidation inhibiting sulphur compounds to form potential corrosive
sulphur compounds.
Dalton (2008) and Nynas (2001) explain that mineral oils contain a certain amount of natural
inhibitors, consisting of compounds of sulphur, phenols and a smaller amount of nitrogen
bounded compounds, however additional artificial inhibitors may be added to oil. The most
commonly used artificial inhibitor is Di-isobutyl-para-cresol (DBPC), also known as Butylated
hydroxytoluene (BHT).
Historically, Eskom uses mainly uninhibited naphthenic based oils as insulating and cooling
media in its older transformer fleet. As the name suggests, these oils contain mainly naphthenic
structures with no artificial oxidation inhibitors and depend purely on the oil’s natural inhibitors
as protection against oil oxidation/ degradation. The use of uninhibited oils is likely to continue

10
in future as Eskom transformers are subjected to periodic oil analyses as a means of condition
based monitoring. The data from the oil analyses is used to trend transformer ageing and fault
detection. The use of inhibited transformer oils will render the years of laboratory data null and
void as inhibited oils age differently to uninhibited oils. Eskom has however purchased
inhibited oils for its new fleet of transformers.
2.3. THE ROLE OF MINERAL OIL IN TRANSFORMERS
Mineral oil has two main functions within transformers namely, cooling and insulating.
Cooling typically occurs through heat dissipation resulting from power losses and localised
hotspots within the transformer, while insulating electrically, as it is a liquid dielectric and fully
saturates the solid insulation of the transformer as explained by Meshkatoddini (2008).
The analogy drawn by experts in this field is that mineral oil in a transformer is much like the
blood in a human body, where specific characteristics and changes within the oil can be linked
to specific developing and existing faults within the transformer. It is for this reason that
transformer oil sampling and analyses forms a critical part of any transformer maintenance
regime. This allows transformer engineers and operators to trend transformer ageing and
allows for the early identification of incipient faults. Furthermore, it also allows for the
trending of transformer oil quality and specific analyses are used as indicators for transformer
oil changes or regeneration as failure to maintain oil quality can lead to transformer failure
(Dalton 2008: Nynas 2001).
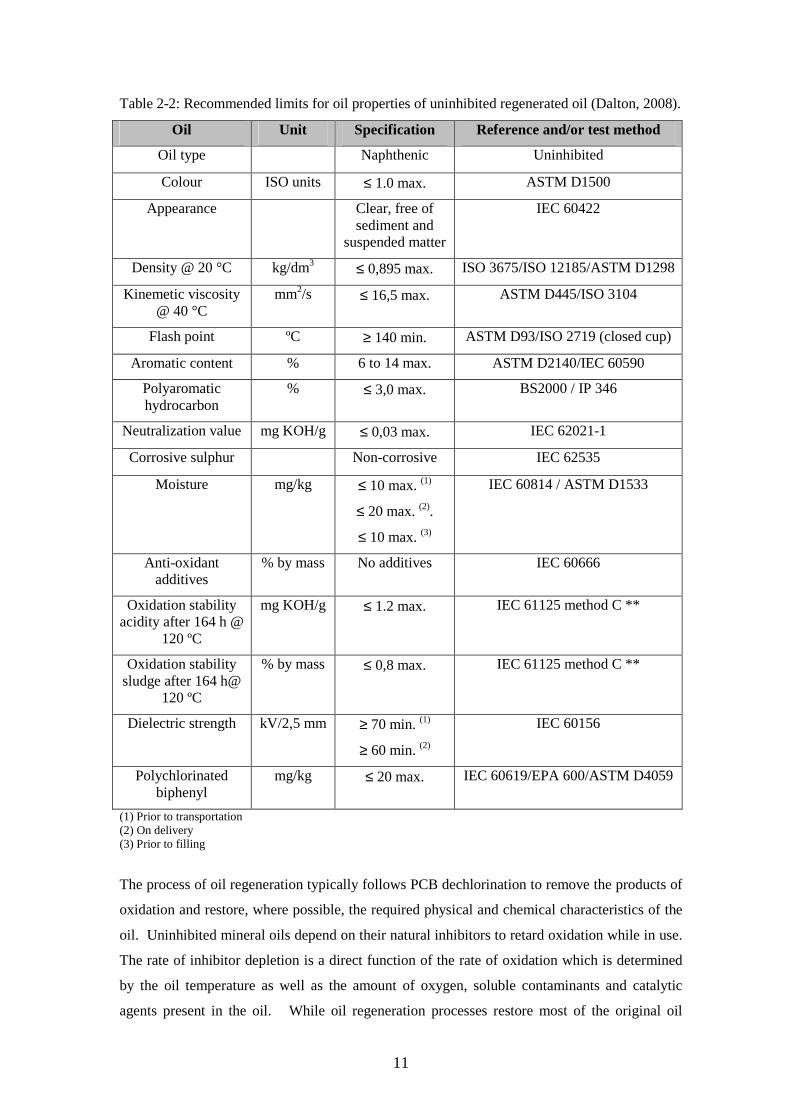
In order to achieve optimal performance, the uninhibited mineral oil is required to conform to a
specific set of characteristics. Table 2-2 lists the typical chemical analyses performed on
regenerated uninhibited mineral oil, the corresponding oil characteristic it measures and the
limit for each of the characteristics measured (Dalton 2008: Nynas 2001). The limits for new
uninhibited mineral oils are similar to those for regenerated uninhibited oils with the exception
that the PCB concentration for new oils should be zero.
11
Table 2-2: Recommended limits for oil properties of uninhibited regenerated oil (Dalton, 2008).
Oil Unit Specification Reference and/or test method
Oil type Naphthenic Uninhibited
Colour ISO units ≤ 1.0 max. ASTM D1500
Appearance Clear, free of sediment and
suspended matter
IEC 60422
Density @ 20 °C kg/dm3 ≤ 0,895 max. ISO 3675/ISO 12185/ASTM D1298
Kinemetic viscosity @ 40 °C
mm2/s ≤ 16,5 max. ASTM D445/ISO 3104
Flash point ºC ≥ 140 min. ASTM D93/ISO 2719 (closed cup)
Aromatic content % 6 to 14 max. ASTM D2140/IEC 60590
Polyaromatic hydrocarbon
% ≤ 3,0 max. BS2000 / IP 346
Neutralization value mg KOH/g ≤ 0,03 max. IEC 62021-1
Corrosive sulphur Non-corrosive IEC 62535
Moisture mg/kg ≤ 10 max. (1)
≤ 20 max. (2).
≤ 10 max. (3)
IEC 60814 / ASTM D1533
Anti-oxidant additives
% by mass No additives IEC 60666
Oxidation stability acidity after 164 h @
120 ºC
mg KOH/g ≤ 1.2 max. IEC 61125 method C **
Oxidation stability sludge after 164 h@
120 ºC
% by mass ≤ 0,8 max. IEC 61125 method C **
Dielectric strength kV/2,5 mm ≥ 70 min. (1)
≥ 60 min. (2)
IEC 60156
Polychlorinated biphenyl
mg/kg ≤ 20 max. IEC 60619/EPA 600/ASTM D4059
(1) Prior to transportation (2) On delivery (3) Prior to filling
The process of oil regeneration typically follows PCB dechlorination to remove the products of
oxidation and restore, where possible, the required physical and chemical characteristics of the
oil. Uninhibited mineral oils depend on their natural inhibitors to retard oxidation while in use.
The rate of inhibitor depletion is a direct function of the rate of oxidation which is determined
by the oil temperature as well as the amount of oxygen, soluble contaminants and catalytic
agents present in the oil. While oil regeneration processes restore most of the original oil

12
characteristics and allows for reuse thereof, the natural inhibitor content cannot be replenished.
In order for PCB dechlorinated oils to be reused in transformers their characteristics would
need to conform to the limits set in Table 2-2.
2.4. THE EFFECTS OF OXIDATION ON MINERAL OIL
CHARACTERISTICS
Mineral oil will undergo oxidation during operation. As mentioned in preceding subsections,
the rate at which oxidation occurs is a direct function of the transformer operating temperature
and the amounts of moisture (contained in the oil and solid paper insulation) and oxygen
present within the transformer, which is intensified with the presence of electrical, mechanical
and thermal stresses experienced during transformer operation as cited by Meshkatoddini
(2008). During the oxidation process, chemically unstable intermediate compounds, namely
free radicals, are produced resulting in the formation of organic acids and sludge (Dalton 2008).
Webber (2006) cited that the purpose of the inhibitor, be it natural or artificial, is to scavenge
these reactive free radicals and in so doing itself become a less reactive radical, thereby
retarding the rate of oxidation. It is an accepted industry norm that the life expectancy of the
mineral insulating oil is halved for every 10°C increase in mineral oil operating temperature.
This norm is based on the understanding that the oxidation reaction rate is doubled for every
10°C increase in temperature. As shown by the oxidation mechanisms below, certain oxidation
reactions can be initiated by the presence of high temperature only to produce a free radical that
readily react with oxygen and moisture to continue the oxidation process (Nynas, 2001).
Oxidation mechanisms [14]:
1. Creation of a free radical (by heat, UV light or mechanical shear)
R-H ----> R* + H*
2. Creation of peroxides by the reaction of the free radical with oxygen. R* + O2 ----> ROO*
3. The peroxide may react and produce a new radical, alcohols, ketones, aldehydes and acids.
ROO* + R-H ----> ROOH + R* ROOH ----> RO* + HO*
Where:
R-H = Hydrocarbon structure in present in the mineral oil
13
ROOH = Organic Acid
R*, H*, RO2 *, RO*, HO* = Free radicals
At sufficiently high concentrations, the combined effects of oxidation products such as acid and
sludge will have a damaging impact on a transformer in service (Meshkatoddini 2008). The
acid present in the oil will initiate a chemical degradation reaction of the entire insulation
systems (paper, pressboard & oil). Sludge accumulation on and between the windings and
cooling surfaces of the transformer will in turn hamper its efficient cooling, causing further
oxidation and resulting in the formation of more acid and sludge (Dalton 2008).
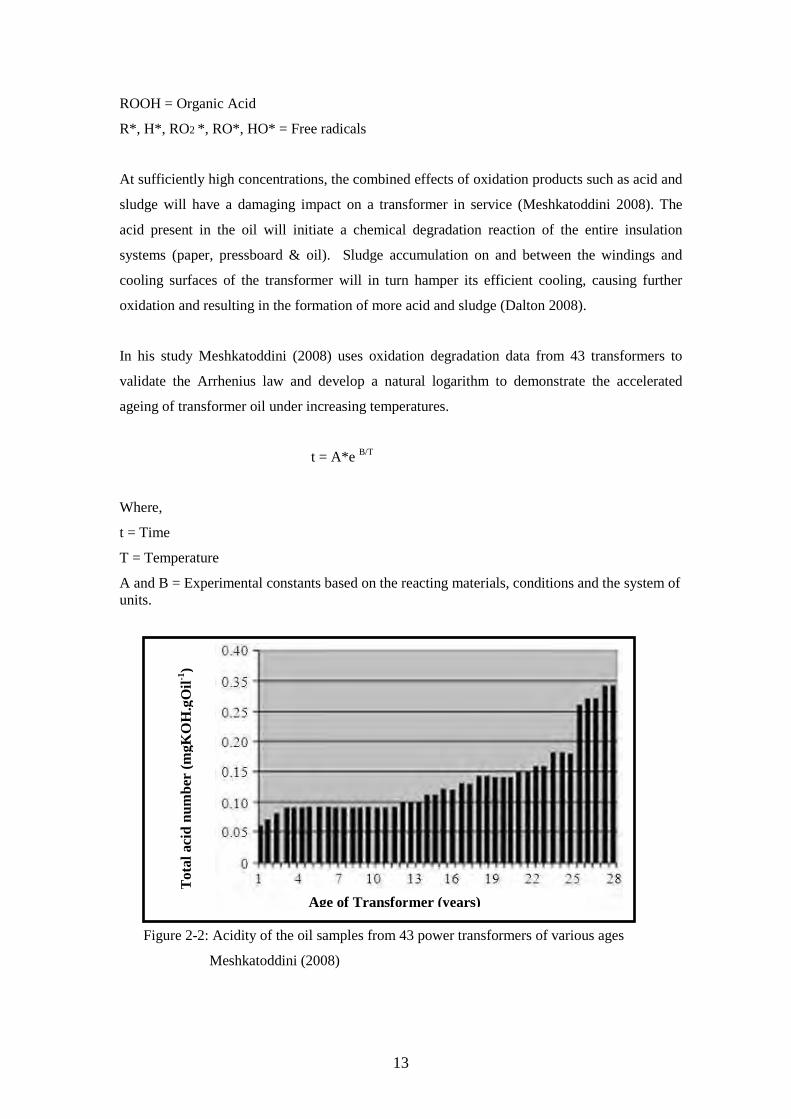
In his study Meshkatoddini (2008) uses oxidation degradation data from 43 transformers to
validate the Arrhenius law and develop a natural logarithm to demonstrate the accelerated
ageing of transformer oil under increasing temperatures.
t = A*e B/T
Where,
t = Time
T = Temperature
A and B = Experimental constants based on the reacting materials, conditions and the system of units.
Figure 2-2: Acidity of the oil samples from 43 power transformers of various ages
Meshkatoddini (2008)
Tot
al a
cid
num
ber
(mgK
OH
.gO
il-1)
Age of Transformer (years)

14
Figure 2-3: Arrhenius plot showing accelerated aging of an oil sample at different
temperatures (Meshkatoddini, 2008).
From Figures 2-2 and 2-3 the increasing rate of mineral oil oxidation with increasing
transformer operating temperatures can be inferred, which will be further expedited by the
lowering of natural inhibitor of uninhibited mineral insulating.
2.4.1 OXIDATION EFFECTS ON DIELECTRIC STRENGTH
The oxidation process results in the formation of sludge, which as a suspended impurity and
semi-conductive sediment, decreases the breakdown voltage of the mineral oil similar to that in
the case of particles, and thereby decreasing the oil’s ability to withstand electrical stresses
(Dalton 2008: Nynas 2001).
2.4.2 OXIDATION EFFECTS ON NEUTRALISATION NUMBER
Acid is a by-product of oxidation and therefore, resulting in a directly proportional relationship
between oil oxidation and the oil’s neutralisation number is. The higher the rate of oxidation
the higher the neutralisation number of the oil. (Dalton 2008: Nynas 2001).
2.4.3 OXIDATION EFFECTS ON MOISTURE CONTENT
Chemical degradation of the cellulose (paper & pressboard) results in the reduction of the
cellulose chains also referred to as the degree of polymerisation, thereby reducing the insulating
properties of the solid insulation. A by-product of the cellulose insulation degradation is the

15
formation of moisture. Moisture in turn induces oxidation and will therefore partake in the
further oxidation reactions and ultimately the production of more acid.
Figure 2-4: Transformer indicating the position of the paper insulation around the transformer windings
2.4.4 OXIDATION EFFECTS ON OXIDATION STABILITY
Oxidation stability is one of the most vital characteristics of insulating oil and provides an
indication of the oil’s resilience to oxidation processes. The oxidation stability of the oil is
directly related to the inhibitor content of the oil and has an inversely proportional relationship
with the rate of oxidation. If the oil has adequate inhibitor to retard the oxidation process then
the oil will have good oxidation stability and vice versa (Dalton 2008: Nynas 2001)
2.4.5 OXIDATION EFFECTS ON PAH CONTENT
Lombard (1996) mentions the presence of two groups of polyaromatic hydrocarbons (PAHs)
which are formed during the oil refining process of the mineral insulating oil. Lombard refers
to the groups as “good PAHs” and “bad PAHs”. The “good” PAHs add oxidation inhibiting
characteristics to the oil through the production of phenols which are gas absorbing and acts as
a free radical inhibitor. The “bad” PAHs have an oxidising effect on the mineral oil and a
negative effect on the impulse breakdown of the oil. It is also stated in the literature that the
“good gas absorbing PAHs” outweigh the amount of “bad oxidising PAHs” present in the oil
(Lombard, 1996). It is not clear whether this is always the case. The overall effect of oxidation
on the PAH content could thus be positive or negative depending on which of the PAH groups
are dominant. The European Union and British Standards Institute have set the limit for total
PAH concentration in mineral oil at 3%, for human health and environmental reasons.
Transformer tank containing insulating oil for cooling and insulating purposes
Cellulose insulation covering copper windings

16
2.4.6 OXIDATION EFFECTS ON TOTAL SULPHUR PERCENTAGE
The total percentage sulphur in mineral oil can be used to identify the oil type. Literature cited
in this study indicates the presence of five types of sulphur present in mineral insulating oils,
ranging from corrosive to very stable. Oxidation of the oil through degradation under optimal
and stressed transformer operation results in the formation of acid. The test is performed via X-
ray method, ISO14596, to measure total sulphur content.
2.5. CHARACTERISTICS OF PCBS
Polychlorinated Biphenyls are a group of synthetically produced non-polar compounds, each
consisting of a biphenyl ring to which a maximum of ten chlorine atoms may be attached. This
results in 209 possible PCB structures, commonly known as PCB congeners, having the generic
chemical structure C12H10-xClx, where x = 1-10, as described in the Encyclopedia of
Environmental Sciences (Alexander et al.,1999).
Figure 2-5: Generic molecular structure of PCB (UNEP Chemicals, 1999)
Sittig (1981), describes PCBs as non-volatile, chemically inert substances that only undergo
reduction, oxidation, addition, elimination reactions under extreme conditions. While Erickson
(1997) explains that individual PCB congeners are usually colourless and odourless crystals
with specific properties depending on their chemical structures.

17
Table 2-3: List of PCB derivatives and their number of isomers (Erickson, 1997)
PCB Derivative Number of Chlorine Atoms Number of Congeners
Monochlorophenyl 1 3
Dichlorophenyl 2 12
Trichlorophenyl 3 24
Tetrachlorophenyl 4 42
Pentachlorophenyl 5 46
Hexachlorophenyl 6 42
Heptachlorophenyl 7 24
Octochlorophenyl 8 12
Nonachlorophenyl 9 3
Decachlorophenyl 10 1
Total Number of Congeners 209
A number of PCB congeners are combined with volumes of organic solvents (e.g.
Trichlorobenzene) to produce complex commercial mixtures which are commonly referred to
as Aroclors. Around ten different Aroclor mixtures, as listed in Table 2-4, were commercially
produced under a range of trade names as contained in Table 2-5.
Table 2-4: Characteristics of Commercial Aroclors (Erickson, 1997)
Aroclor Density @
20oC
Viscosity
at 98.9 oC
Flash Point
(oC)
Distillation
Range (oC )
Solubility in water
at 25 oC
(µg/L)
1221 1.18 30-31 141-150 275-320 15000*
1232 1.26 31-32 152-154 270-325 1450*
1016 1.37 nv 170 323-356 420
1242 1.38 34-35 176-180 325-366 240
1248 1.44 36 193-196 340-375 52
1254 1.54 44-58 ntb 365-390 12
1260 1.62 72-78 ntb 385-420 3
1262 1.64 86-100 ntb 390-425 nv
1268 1.81 nv ntb 435-450 nv
1270 1.95 nv ntb 450-460 nv
ntb = None to boiling, nv = No value, * = Estimated
18
These Aroclors are identified in the environment by the number accompanying the term
Aroclor i.e. Aroclor 1260, 1254, 1248, etc. Where “12 “represents the numbers of chlorine
atoms within the biphenyl structure followed by the number representing the percentage
Aroclor chlorination by weight (Erickson, 1997). The higher the percentage chlorination, the
less volatile, more stable and therefore, the more bioaccumulative the Aroclor would be and
vice versa. Appendix 1 of this dissertation contains the material safety data sheet (MSDS) for a
broad range of Aroclors in oil.
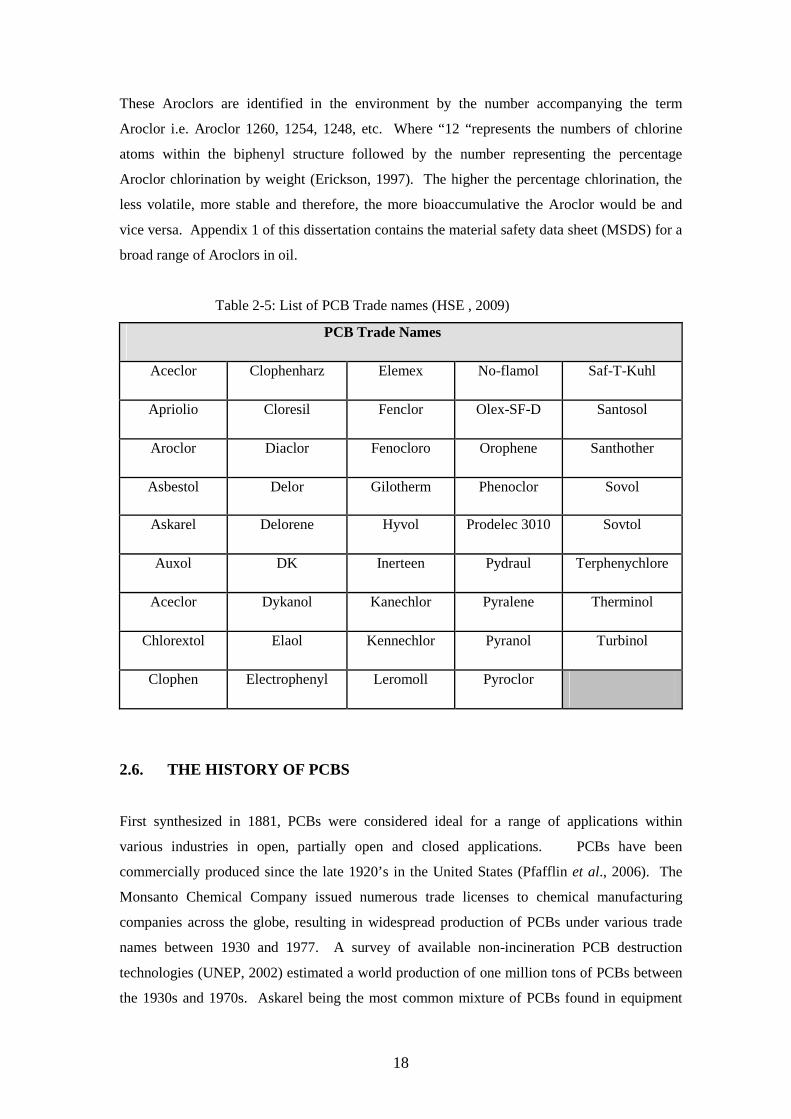
Table 2-5: List of PCB Trade names (HSE , 2009)
PCB Trade Names
Aceclor Clophenharz Elemex No-flamol Saf-T-Kuhl
Apriolio Cloresil Fenclor Olex-SF-D Santosol
Aroclor Diaclor Fenocloro Orophene Santhother
Asbestol Delor Gilotherm Phenoclor Sovol
Askarel Delorene Hyvol Prodelec 3010 Sovtol
Auxol DK Inerteen Pydraul Terphenychlore
Aceclor Dykanol Kanechlor Pyralene Therminol
Chlorextol Elaol Kennechlor Pyranol Turbinol
Clophen Electrophenyl Leromoll Pyroclor
2.6. THE HISTORY OF PCBS
First synthesized in 1881, PCBs were considered ideal for a range of applications within
various industries in open, partially open and closed applications. PCBs have been
commercially produced since the late 1920’s in the United States (Pfafflin et al., 2006). The
Monsanto Chemical Company issued numerous trade licenses to chemical manufacturing
companies across the globe, resulting in widespread production of PCBs under various trade
names between 1930 and 1977. A survey of available non-incineration PCB destruction
technologies (UNEP, 2002) estimated a world production of one million tons of PCBs between
the 1930s and 1970s. Askarel being the most common mixture of PCBs found in equipment
19
within Eskom. Until the 1960’s knowledge relating to the toxicity of PCBs was limited within
industry and not publicized. However, by 1972, sufficient scientific evidence existed to suggest
that the toxic, persistent, and bio-accumulative properties of PCBs represented a serious hazard
to human health and the environment, further discussed in section 2.7. In 1973, the
Organization for Economic Co- operation and Development (OECD) instructed member
countries to restrict PCBs to limited uses, as stated by Obaid et al (2003). PCB production
ceased in the late 1970’s after its toxic and bio-accumulative properties became known.
2.7. HEALTH & ENVIRONMENTAL IMPACTS OF PCB
Until the 1960’s knowledge relating to the toxicity of PCBs was limited within industry and not
publicized. However, by 1972, sufficient scientific evidence existed to suggest that the toxic,
persistent, and bio-accumulative properties of PCBs represented a serious hazard to human
health and the environment. In 1973, the Organization for Economic Co- operation and
Development (OECD) instructed member countries to restrict PCBs to limited uses (Obaid et
al., 2003). A collaborative study by the UNEP and the World Health Organization (1995)
established the health impacts of PCBs described in the subsections below.
2.7.1 BIO-ACCUMULATION OF PCBS IN ORGANISMS
• PCBs are easily absorbed through the skin and through inhalation by both humans and
animals and remain in the fatty tissue, where they tend to accumulate.
• More than 90% of ingested PCBs cross the intestinal walls and are retained in the
organisms. The organ favoured by PCBs is the liver, which stores PCBs.
2.7.2 ACTUAL TOXICITY OF PCBS - POISONING OF HUMANS
Studies of cases of poisoning caused by accidental absorption of doses measuring 800 to 1000
mg/kg of PCB indicate that the first areas to show symptoms are the skin manifesting in itself in
a condition called chloracne and in the eyes (oedema of the eyelids, watering of the eyes).
More general symptoms include liver disorders, bronchitis, certain peripheral neuropathies
(tumours) and endocrine disruptions. These symptoms recede after approximately 1 year of
continuous high level exposure. Abnormalities were observed in behavioural tests of children
born to women who during pregnancy consumed PCB contaminated oil (Agency for Toxic

20
Substance and Disease Registry, 2001). These anomalies are primarily found on the skin,
mucous membrane and the epidermis.
2.7.3 CARCINOGENICITY OF PCBS
Epidemiological studies have shown no significant increase in the incidence of cancer among
individuals exposed to PCBs. Skin cancer, liver tumours and leukaemia have been attested,
however scientific analyses have failed to establish a link between increased skin and
pancreatic cancer rates and occupational exposure of the victims to PCBs.
The International Agency for Research on Cancer (IARC), which is part of the World Health
Organisation (WHO), measures the carcinogenic risk of various chemicals and classifies them
in two groups:
• Those which are “carcinogenic to humans” – group 1;
• Those which are “potentially carcinogenic to humans” – group 2.
Group 2 is further subdivided into groups A and B:
• For group 2A, evidence of carcinogenicity is “fairly well established”;
• For group 2B, evidence is “less well established”.
PCBs are classified as group 2B, i.e. potential human carcinogen.
2.8. PCB REGULATION IN SOUTH AFRICA
South Africa is a party to international agreements that impact on gradual phase-out and
disposal of PCBs, namely the Stockholm Convention on Persistent Organic Pollutants
(Stockholm Convention, 2001) and the Basel Convention on Transboundary Movement of
Hazardous Waste and Their Disposal (1989).
2.8.1. STOCKHOLM CONVENTION
The Stockholm Convention is a global treaty aimed at eliminating specific Persistent Organic
Pollutants (POPs) from use by specified dates as agreed to by the “Conference of Parties”
(COP) on the convention. The convention was adopted on the 22nd of May 2001 in Stockholm,

21
Sweden and was entered into force on the 17th of May 2004. South Africa ratified the
agreement on the 4th of September 2004, as previously cited in chapter 1.
The Stockholm Convention outlines specific requirements with respect to the management of
PCBs and its phase-out by 2025 and states that each party shall (Stockholm Convention 2001);
• “Make determined efforts to identify, label and remove from use equipment containing
greater than 0.05 per cent polychlorinated biphenyls and volumes greater than 5 litres”;
• “Endeavour to identify and remove from use equipment containing greater than 0.005
percent polychlorinated biphenyls and volumes greater than 0.05 litres.” In accordance
with subparagraph (e) of Annex A, Part II removal and elimination should be done by no
later than 2028.
Appendix 2 of this dissertation contains a copy of Annex A, Part II of the Stockholm
Convention relating specifically to the elimination of PCBs.
South Africa adopted the UNEP recommended PCB classification, which is based on
classifications enforced within the United States and most European countries and inferred
from the terms set under the Stockholm Convention. These classifications are as follows;
• PCB concentrations above 500 ppm are classified as pure PCB.
• PCB concentrations between 50 and 499 ppm are classified as PCB contaminated.
• PCB concentrations below 50 ppm are classified as PCB-free.
2.8.2 BASEL CONVENTION
The Basel Convention is a global treaty aimed at controlling the trans-boundary movement of
hazardous waste and their disposal between countries. The need for this convention was
identified in the late 1980’s when industrialised countries enforced stricter environmental
regulations with costly penalties for transgressors, resulting in unscrupulous entities shipping
their hazardous waste to developing countries.
The Basel Convention entered into force on the 5th of May 1992 with ratification by the South
African Government on the 5th of May 1994. Parties to the convention are bound by a number
of general obligations as listed in Article 4 of the agreement, with the main objective of
22
protecting human health and the environmentally against the movement and disposal of
hazardous materials (Basel Convention, 1992).
The convention accepts 50 ppm as the level above which PCBs are considered hazardous and
recommends that all thermal processes that destroy PCBs have a DRE of 99.9999% and reduce
PCB concentrations to below a scientifically-based minimum detection criterion as described in
the PCB, PCT and PBB technical guidelines issued by the Basel Convention, (2003).
2.8.3 SOUTH AFRICAN LEGISLATION AND STANDARDS
The South African Department of Water Affairs classifies PCBs as hazardous in the national
specification entitled “Minimum Requirements for the Handling, Classification and Disposal of
Hazardous Waste” (1998). Based on this classification all national laws pertaining to the
handling and disposal of hazardous waste are relevant in the management and disposal of
PCBs. The relevant laws / acts are briefly described in subsection 2.8.3.1.
2.8.3.1 NATIONAL LEGISLATION RELATING TO THE MANAGEMENT PCBS
• South African Constitution (1996)
All persons have the right to an environment that is not harmful to their health and wellbeing
and to an environment that is protected for current and future generations.
• Environmental Conservation Act (1989)
All waste disposal sites require the approval of the Minister of Water Affairs, including thermal
and chemical treatment facilities.
• National Environmental Management Act (1998)
Owners of hazardous waste cannot transfer the liability to disposal contractors and shall remain
liable for the safe management and disposal thereof inline with the “cradle to grave”
philosophy. It is the responsibility of all individuals to ensure all reasonable and practical
measures are taken when undertaking their activities to prevent harm to another person, their
environment and/or property (Duty of Care).

23
• Hazardous Substances Act (1973)
The Act provides the regulations to manage and control the use of hazardous substances, and
the disposal of hazardous waste within the country jurisdiction.
• National Environmental Management: Air Quality Act (2004)
Emissions generated by hazardous waste disposal processes must be in accordance with the
national limits for stack emissions. PCBs shall not be disposed of in a manner that it causes air
emissions in excess of the limits prescribed by the Act.
• Occupational Health and Safety Act (1993)
It is the duty of employers to inform, protect and train employees about the dangers of working
with hazardous materials. It is the employee’s responsibility to use all measures provided by
the employer to protect himself/herself against any physical, mental or any other health impact
that may arise from exposure to such hazardous material, such as PCBs, in the work
environment.
• National Water Act (1998)
The Act makes provision for situations where pollution of water source may occur. No person
shall intentionally pollute water sources, be it natural or unnatural, surface or ground water.
Land owners and or persons occupying land shall take all reasonable measures to prevent the
occurrence, continuation and recurrence of the pollution of water sources on or nearby the
occupied land. PCBs shall therefore not be disposed of in a manner that it poses the risk of
polluting water sources.
• National Road Traffic Act (1996)
The Act governs all vehicles, motorist, pedestrians, road planning, road quality, etc. The road
transportation of hazardous substances such as PCBs require conformity with applicable road
ordinances which is detailed in the SANS standards on transportation listed in Table 2-6.
• National Policy “Minimum Requirement for the Handling, Classification and Disposal of
Hazardous Waste” (1998)
The policy provides a classification mechanism for both general and hazardous waste according
to their inherent toxicological properties. Hazardous waste is given a rating based on the health

24
and environmental risk they pose during disposal. PCBs are classified as a class 9
(Miscellaneous hazardous material).
2.8.3.2 National Standards
A list of national standards relating to the safe management, transportation and disposal of
PCBs, thereby ensuring adherence to the national laws listed under subsection 2.7.3.2 are
contained in table 2-6.
Table 2-6: SANS Documentation relating to the transportation of PCBs
Document Identification Number Title of Document
SANS 290 Mineral Insulating Oils – Management and handling
of Polychlorinated Biphenyls
SANS 555 National Standard for unused and reclaimed mineral
insulating oils for transformers and switchgear
SANS 10228 The identification and classification of dangerous
goods for transport
SANS 10229 Transport of dangerous goods - Purchasing and large
packaging for road and rail transport
SANS 10231 Transport of dangerous goods - Operational
requirements for road vehicles
SANS 10232 Transport of dangerous goods - Emergency
information systems Part 1: Emergency information
system for road transport
2.9. BASE CATALYSED DECHLORINATION FOR PCB DESTRUCTION
PCB base catalysed dechlorination processes are commercially available with some countries
opting to reuse the dechlorinated oil as insulating and cooling media in their electrical
equipment. The process is acknowledged and accepted by UNEP (Inventory of World-wide
PCB Destruction Capacity, 1998) as an alternative non-thermal PCB destruction technology.
The UNEP (1998) recommends utilisation of dechlorinated oils for functions, other than as
insulating and cooling media in electrical equipment, such as in the production of lubricating
oils, etc. The UNEP literature cited in section 2.9 of this dissertation does not clearly indicate
whether the reuse of dechlorinated oils in electrical equipment is supported but it does warn of
potential effects on artificial inhibitors contained in inhibited mineral oil as a result of the
25
dechlorination process. The decision to use dechlorinated oils as insulating and cooling media
in electrical equipment, such as transformers, therefore reside with the utility and should be
based on sound strategic, environmental and economic considerations.
A range of processes are commercially available for dechlorination of PCB contaminated oils.
The operating principles for most of the commercially available dechlorinators are similar but
they utilise different proprietary reagents to achieve dechlorination. A market evaluation
undertaken by Nassiep (2005) describes the technical, economic and safety considerations for a
number of commercially available PCB dechlorination technologies. Variations of the
technology utilise sodium, potassium or glycol mixtures combined with proprietary reagents to
effect dechlorination of PCBs in mineral oil.
2.9.1 PRINCIPLE OF OPERATION
Dechlorination processes involve the addition of an alkali or alkaline earth metal carbonate,
hydroxide or bicarbonate to the contaminated medium, thereby replacing the chlorine atoms on
the PCB molecules with hydrogen.
Parker et al.(1981) describes the typical processes incorporating an alkali metal, such as the
process used in the experimental part of this study uses a alkali metal dispersion (sodium) to
which an aromatic radical anion substrate (naphthalide) is added in the presence of an ether-
type solvent (tetrahydrofuran) to produce an alkali metal aromatic radical anion reagent
(sodium naphthalenide). The reagent is added to the PCB contaminated oil to bring about a
reaction with the chlorine atoms attached to the PCB. The chlorine content is converted to
inorganic salts and the chlorine-free polymeric structures (or biphenyls) fraction is removed by
organic fraction filtration or centrifugation. Reactions take place under inert atmosphere, so as
to avoid the risk of an explosion or fire, and in the absence of water as wastes are pre-dried by
heating. The plant can be either fixed or mobile, and used on PCB within an operating
transformer with the process taking up to a week.
2.9.2 REACTION KINETICS OF SODIUM DISPERSION DECHLORINATION
Huang et al. (2007) conducted laboratory scale experiments using a laboratory scale reactor to
determine the reaction kinetics of the sodium dispersion dechlorination process by means of
single particle evaluation. The sodium metal dispersion was allowed to react with a mixture of
PCBs and mineral insulating oil under varying experimental conditions, so as to simulate a full
scale process.
26
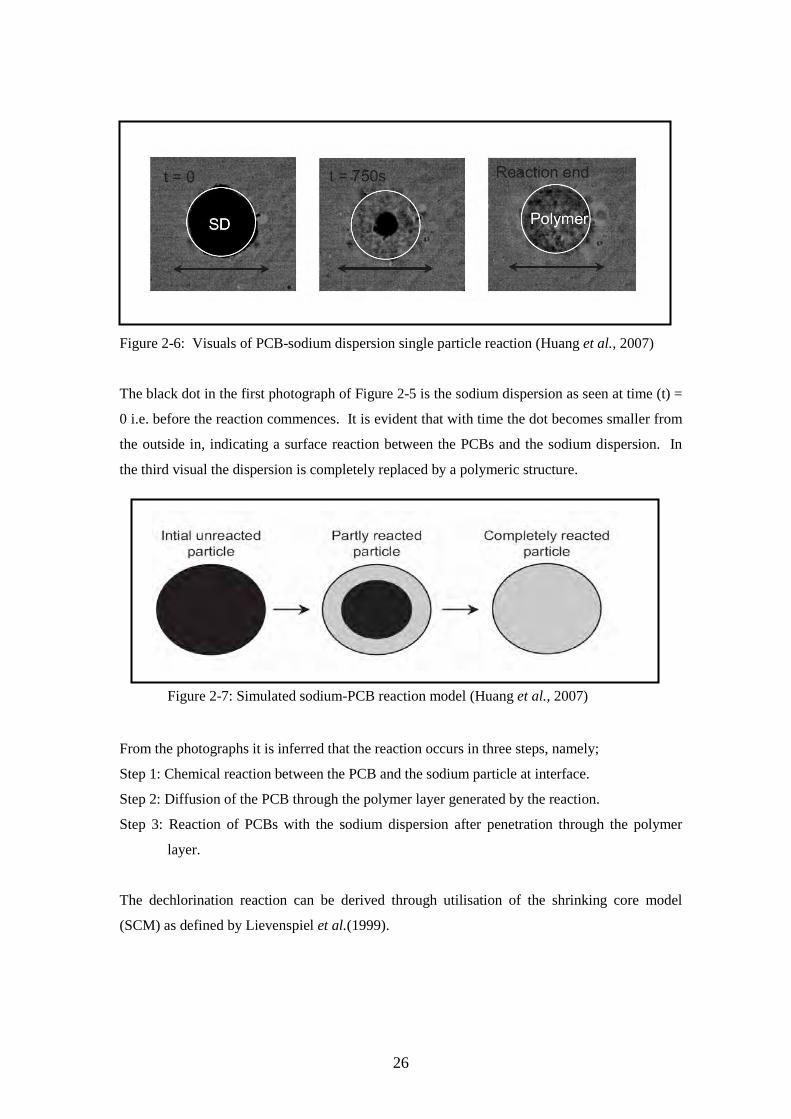
Figure 2-6: Visuals of PCB-sodium dispersion single particle reaction (Huang et al., 2007)
The black dot in the first photograph of Figure 2-5 is the sodium dispersion as seen at time (t) =
0 i.e. before the reaction commences. It is evident that with time the dot becomes smaller from
the outside in, indicating a surface reaction between the PCBs and the sodium dispersion. In
the third visual the dispersion is completely replaced by a polymeric structure.
Figure 2-7: Simulated sodium-PCB reaction model (Huang et al., 2007)
From the photographs it is inferred that the reaction occurs in three steps, namely;
Step 1: Chemical reaction between the PCB and the sodium particle at interface.
Step 2: Diffusion of the PCB through the polymer layer generated by the reaction.
Step 3: Reaction of PCBs with the sodium dispersion after penetration through the polymer
layer.
The dechlorination reaction can be derived through utilisation of the shrinking core model
(SCM) as defined by Lievenspiel et al.(1999).

27
Where: XB = Fractional conversion of SD particles (dimensionless) Csod = Sodium concentration (mol.m−3) R = Initial radius of SD particle (m) r = Radius of SD particles (m)
The reaction rate for the sodium dispersion – PCB reaction was derived using the SCM with
data incorporated from the laboratory sodium dispersion and PCB experiment. The reaction
rate was then expressed as follow:
(Huang et al., 2007)
Where:
XB = Fractional conversion of SD particles (dimensionless)
CPCB = PCB concentration (mol.m−3)
Csod = Sodium concentration (mol.m−3)
R = Initial radius of SD particle (m)
DeA = Effective diffusion coefficient (m2.s−1)
kc = Rate constant (ms−1)
Rg = Gas constant (8.314 J.mol−1K−1)
T = Reaction temperature (K)
γ = General reaction rate (mol.s−1)
τ = Reaction time (s)
(Huang et al., 2007).
28
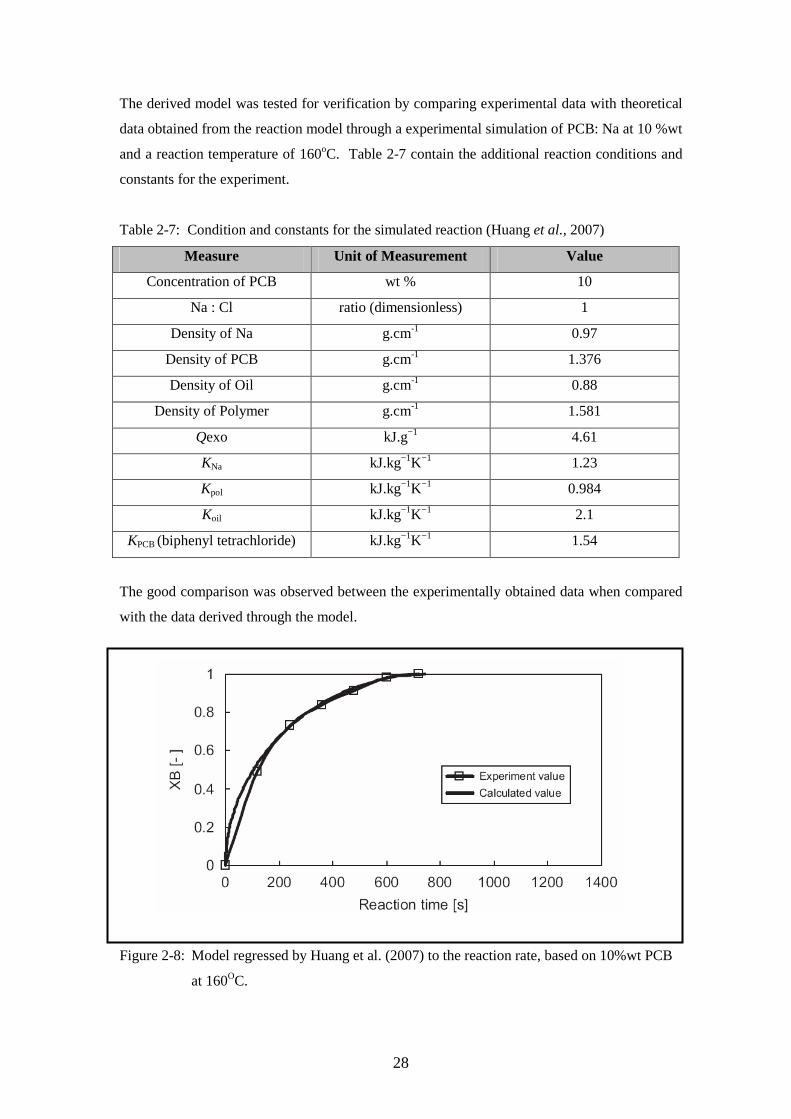
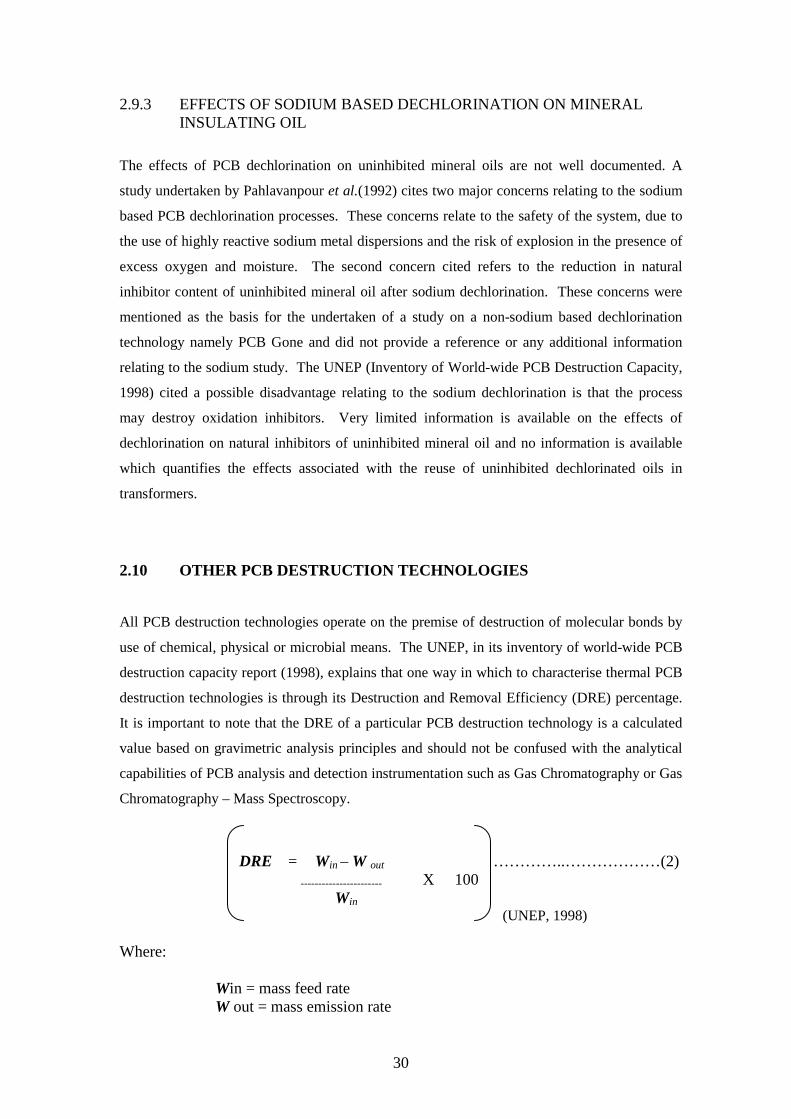
The derived model was tested for verification by comparing experimental data with theoretical
data obtained from the reaction model through a experimental simulation of PCB: Na at 10 %wt
and a reaction temperature of 160oC. Table 2-7 contain the additional reaction conditions and
constants for the experiment.
Table 2-7: Condition and constants for the simulated reaction (Huang et al., 2007)
Measure Unit of Measurement Value
Concentration of PCB wt % 10
Na : Cl ratio (dimensionless) 1
Density of Na g.cm-1 0.97
Density of PCB g.cm-1 1.376
Density of Oil g.cm-1 0.88
Density of Polymer g.cm-1 1.581
Qexo kJ.g−1 4.61
KNa kJ.kg−1K−1 1.23
Kpol kJ.kg−1K−1 0.984
Koil kJ.kg−1K−1 2.1
KPCB (biphenyl tetrachloride) kJ.kg−1K−1 1.54
The good comparison was observed between the experimentally obtained data when compared
with the data derived through the model.
Figure 2-8: Model regressed by Huang et al. (2007) to the reaction rate, based on 10%wt PCB
at 160OC.
29
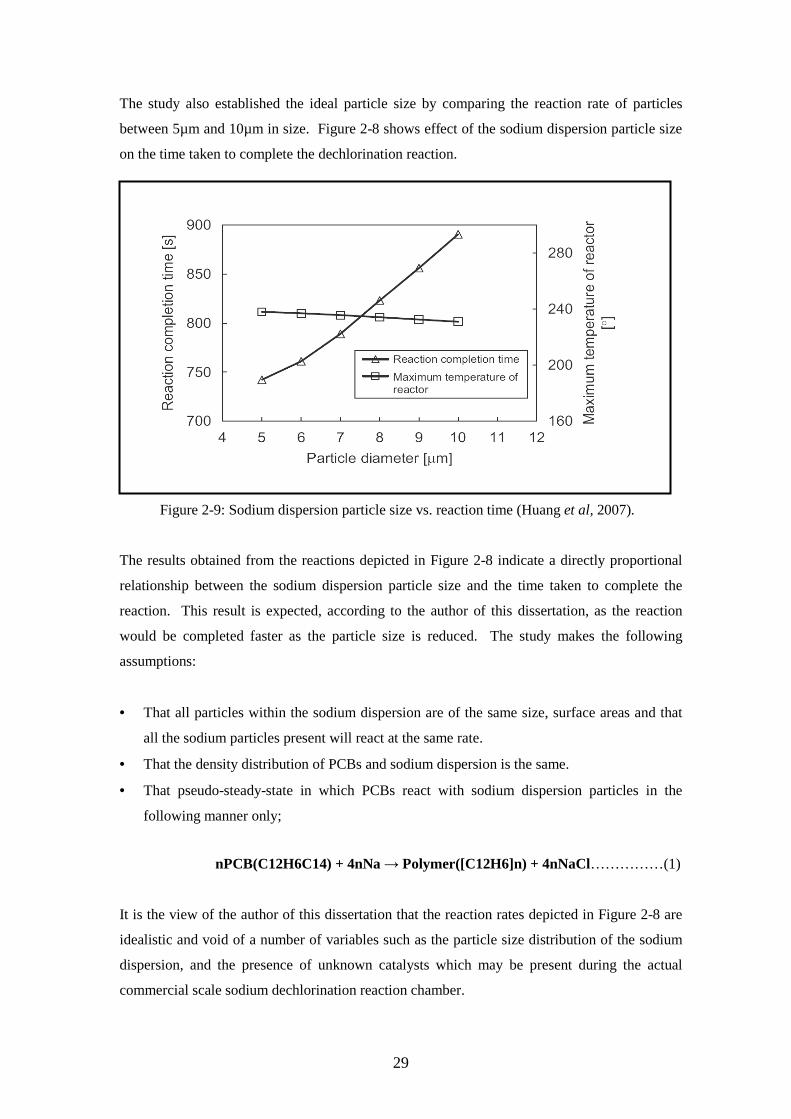
The study also established the ideal particle size by comparing the reaction rate of particles
between 5µm and 10µm in size. Figure 2-8 shows effect of the sodium dispersion particle size
on the time taken to complete the dechlorination reaction.
Figure 2-9: Sodium dispersion particle size vs. reaction time (Huang et al, 2007).
The results obtained from the reactions depicted in Figure 2-8 indicate a directly proportional
relationship between the sodium dispersion particle size and the time taken to complete the
reaction. This result is expected, according to the author of this dissertation, as the reaction
would be completed faster as the particle size is reduced. The study makes the following
assumptions:
• That all particles within the sodium dispersion are of the same size, surface areas and that
all the sodium particles present will react at the same rate.
• That the density distribution of PCBs and sodium dispersion is the same.
• That pseudo-steady-state in which PCBs react with sodium dispersion particles in the
following manner only;
nPCB(C12H6C14) + 4nNa → Polymer([C12H6]n) + 4nNaCl……………(1)
It is the view of the author of this dissertation that the reaction rates depicted in Figure 2-8 are
idealistic and void of a number of variables such as the particle size distribution of the sodium
dispersion, and the presence of unknown catalysts which may be present during the actual
commercial scale sodium dechlorination reaction chamber.
30
2.9.3 EFFECTS OF SODIUM BASED DECHLORINATION ON MINERAL INSULATING OIL
The effects of PCB dechlorination on uninhibited mineral oils are not well documented. A
study undertaken by Pahlavanpour et al.(1992) cites two major concerns relating to the sodium
based PCB dechlorination processes. These concerns relate to the safety of the system, due to
the use of highly reactive sodium metal dispersions and the risk of explosion in the presence of
excess oxygen and moisture. The second concern cited refers to the reduction in natural
inhibitor content of uninhibited mineral oil after sodium dechlorination. These concerns were
mentioned as the basis for the undertaken of a study on a non-sodium based dechlorination
technology namely PCB Gone and did not provide a reference or any additional information
relating to the sodium study. The UNEP (Inventory of World-wide PCB Destruction Capacity,
1998) cited a possible disadvantage relating to the sodium dechlorination is that the process
may destroy oxidation inhibitors. Very limited information is available on the effects of
dechlorination on natural inhibitors of uninhibited mineral oil and no information is available
which quantifies the effects associated with the reuse of uninhibited dechlorinated oils in
transformers.
2.10 OTHER PCB DESTRUCTION TECHNOLOGIES
All PCB destruction technologies operate on the premise of destruction of molecular bonds by
use of chemical, physical or microbial means. The UNEP, in its inventory of world-wide PCB
destruction capacity report (1998), explains that one way in which to characterise thermal PCB
destruction technologies is through its Destruction and Removal Efficiency (DRE) percentage.
It is important to note that the DRE of a particular PCB destruction technology is a calculated
value based on gravimetric analysis principles and should not be confused with the analytical
capabilities of PCB analysis and detection instrumentation such as Gas Chromatography or Gas
Chromatography – Mass Spectroscopy.
DRE = Win – W out …………..………………(2) ----------------------- X 100
Win
(UNEP, 1998) Where:
Win = mass feed rate W out = mass emission rate

31
The DRE rating of a thermal destruction technology is a calculated percentage that represents
the number of molecules of a compound removed or destroyed by a thermal destruction
technology relative to the number of molecules entering the system. The DRE calculation
measures only the mass of the compound in the emissions whereas the destruction efficiency
(DE) of a technology measures the mass of the compound in gaseous emission aqeous and solid
residues relative to the mass (number of moles) entering the system. (UNEP, 1998)
Nassiep (2001) cited the following available PCB destruction technologies during an
investigation of commercially available and emerging thermal and non-thermal processes for
PCB destruction:
• High temperature incineration
• Encapsulation & landfilling (non-destruction – long term storage)
• Plasma treatment
• Ozonation
• Ball milling
• Cement kilns (for incineration)
• Eco Logic
• Supercritical water oxidation
• Solvated electron technology
• Molten salt
• Thermal desorption & oxidation
2.10.1 HIGH TEMPERATURE INCINERATION
PCBs have been disposed of primarily through high temperature oxidation, i.e. incineration.
The PCB compound is converted to amongst other hydrochloric acid and water at temperatures
above 1350oC. However, a risk exists of formation of by-products produced at temperature
below 1350oC, which are of major health and environmental concern. These by-products such
gaseous dioxins and furans are referred to as “Products of Incomplete Combustion” (PICs).
Hazardous waste incinerators have varied designed and typically comprise rotary kilns,
combustion chambers and adequate afterburners and scrubber (filtration) systems to minimise
the risk of dioxin and furans being released to atmosphere (Rahuman et al., 2000).

32
The technology, if properly operated, is highly effective in the destruction of PCBs with
reported DREs of 99,9999%. Environmental concerns relating to the inherent threat of toxic
emissions renders this method of destruction less environmentally sound. This could however
be overcome by the dilution of the PCB oil to non-PCB contaminated heavy furnace fuel
(HFO) or non-PCB contaminated waste oil prior to incineration to assist in the reduction of
toxic emissions such as dioxins and furans.
2.10.2 ENCAPSULATION & LANDFILLING
Encapsulation and landfilling of hazardous waste is a disposal method in which materials are
buried between multiple layers of low and high permeability soil and low permeability geo-
synthetic substances to prevent contact with the environment and ground water systems. PCB
contaminated oil are placed in metal containers and then buried to ensure effective containment.
The process does not involve destruction of the compounds per se but, rather long term storage.
The landfill sites needs to be continuously maintained and monitored to ensure containment of
the hazardous material so as to prevent potential damage, due to leakages into the environment.
A major setback to this disposal option is that waste owners remain liable for any
environmental damage that may occur as a result of landfill leakages (National Environmental
Management Act, 1998).
2.10.3 PLASMA TREATMENT
The process involves the direct injection of a liquid or gaseous hazardous waste stream with
inert argon gas into a plasma arc which provides plasma temperatures in excess of 3000OC
resulting in pyrolysis of the hazardous waste. This means that the organic materials contained
in the waste dissociates into elemental ions and atoms in the absence of oxygen. The elemental
ions and atoms recombine in the cooler area of the equipment’s reaction chamber prior to a
rapid alkaline quenching step to form simple non-hazardous molecules. The end products of
the process are argon gas, carbon dioxide, water vapour and an aqueous solution of inorganic
salts. The destruction and removal efficiency (DRE) of organic compounds is greater than
99.99% (CMPS&F, 1997).
Plasma treatment has also been applied to solid hazardous waste streams through the Plasma
Arc Centrifugal Treatment (PACT) process. The plasma torch heat is used to melt and vitrify
solid waste feed material resulting in vaporisation, decomposition and ionization by the air used
as plasma gas. This is followed by an off-gas treatment system. Solid are vitrified into a
monolithic non-leachable mass. PACT has a DRE of 99.996% (CMPS&F, 1997).

33
2.10.5 OZONATION
Ozone is generally used for odour removal and disinfection of various water streams. The
process has been successfully applied to PCBs contained in oil and soil to form carbon dioxide,
water and hydrochloric acid via the formation of free radicals that degrade ozone in different
media. The DE for ozonation is 93% (Nassiep, 2001).
2.10.6 BALL MILLING
Ball Milling is a mechano-chemical process that uses the energy produced and released form
collision between balls in a ball mill. The energy is used to activate a reaction between the lime
and hazardous waste resulting in the degradation of organo-chlorine waste compounds. The
process has been successfully used to decontaminate solid PCB waste streams. The process
forms low toxicity products, amongst which are graphite, calcium chloride and calcium
hydroxide. No gaseous emissions are produced by the process (CMPS&F, 1997)..
2.10.7 CEMENT KILNS
The use of cement kilns for PCB disposal has been widely used in Europe. The cement
manufacturing process requires the use of large quantities of raw materials and the kilns require
operating temperatures inline with those required for the destruction of PCB. PCB
contaminated waste can be fed directly into the middle of the kiln via a hopper or the waste can
be pre-treated through a thermal desorption (volatilisation and extraction) of PCB from the
solid media prior to treatment / use as feed in the kiln (Rahuman et al., 2000). Temperatures in
>2000OC and long retention times for both gases and raw materials make this method of
destruction effective for the destruction of PCBs (CMPS&F, 1997). The process would
however require stricter emissions monitoring to ensure dioxins and furan levels are within
South African stack emission limits (Nassiep, 2001). Dioxin and furan monitoring and analysis
are currently extremely costly, which may be a deterrent in the local application of this disposal
option.
2.10.8 ECO LOGIC
This patented process relies on the gas phase thermo-chemical reaction of hydrogen with
organic compounds, i.e. thermal hydrogenation. At temperatures above 850OC hydrogen
combines with organic compounds in a reduction reaction forming shorter chained
hydrocarbons (primarily methane) and hydrogen chloride. The reaction is enhanced by the
presence of water, which acts as a reducing agent and hydrogen source. The average DRE of

34
the Eco Logic process during independent evaluations undertaken between 1995 and 1996 was
99.999995% (CMPS&F, 1997).
2.10.9 SUPERCRITICAL WATER OXIDATION (SCWO)
SCWO is a high temperature and pressure technology that incorporates the properties of
supercritical water in the destruction of organic compounds and toxic waste.
The process decomposes PCB by using an oxidising agent (typically oxygen or hydrogen
peroxide) and the solubility properties of supercritical water having a temperature of ≥374OC.
The reaction occurs in a homogenous phase where carbon is converted to carbon dioxide,
hydrogen to water and chlorine (derived from organo-chlorine compounds) to chloride ions.
The reactions are exothermic and the process is self sustaining at appropriate concentrations of
organic waste. The process produces disposable ash, salt solutions and non-toxic gases.
SCWO has a DRE of >99.99994% for dioxins (Rahuman et al., 2000: Nassiep, 2001:
CMPS&F, 1997).
2.10.10 SOLVATED ELECTRON TECHNOLOGY
The process uses a proprietary reagent namely Agent 313 for the treatment of PCB
contaminated waste streams. Solvated electrons are extremely powerful reducing agents
(Nassiep, 2001).
An alkali metal (sodium, calcium or lithium) is dissolved into anhydrous ammonia turning the
solution bright blue as electrons are freed. Free radical electrons are strongly attracted by
halogenated compounds and when mixed with the solvated solution become instantaneously
neutralized. During the treatment of PCBs, chlorine combines with the ions of sodium to form
sodium chloride, biphenyls and an uncontaminated media (oil, soil, etc.) as described by
Rahuman et al. (2000).
2.10.11 MOLTEN SALT
The process involves the use of a molten alkaline salt bed, typically sodium carbonate, which
oxidises organic materials at temperatures between 900OC to 1000 OC. The chlorine contained
in the organic feed is retained in the molten salt bed. The process achieved DREs of
99.9999970% (900OC) and 99.9999932% (1000 OC) for trichlorobenzene and >99.9999988%
during treatment of chlordane.

35
2.10.12 THERMAL DESORPTION AND OXIDATION
The process comprises a combination of a pre-treatment technology known as thermal
desorption followed by thermal oxidation and final volatile organic compounds (VOC)
destruction.
Thermal desorption is a physical separation process which is not necessarily designed to
destroy organics. Contaminated waste is heated to volatilise water and organic contaminants
and due to the high temperatures organic compounds become decomposed. The volatilised
material is vacuum drawn and destroyed in an after-burner. The use of the thermal desorption
step allows for only the volatiles to be destroyed in the afterburner and not the entire mass of
material, as in the case of conventional PCB incineration.
In the case of PCB oils, the materials are heated in a horizontal rotary kiln, which consists of an
inclined rotating tube so that the waste moves horizontally as well as radially through the kiln.
In the case of capacitors, these are first stripped and drained under vacuum prior to treatment.
Depending on the percentage chlorination, PCBs are fed into the kiln at a rate of around 200
kg/hour. The kiln is operated at temperatures above 600oC allowing for the flashing off of the
hydrocarbons. The gases released are then exposed to an oxidative atmosphere at temperatures
above 1350OC for a period of >2 seconds in the presence of a proprietary reagent. The after-
burner converts volatile organic compounds (VOCs) and other gaseous hydrocarbon pollutants
to carbon dioxide, water and inorganic salts. The afterburner is followed by a rapid gas-
quenching step minimising the potential for dioxin formation. A gas clean-up plant consisting
of a scrubber and a packed column (dry gas collection filter unit) follows the quenching step.
The gas clean-up plant neutralises acid gas and reduces particulates, halides, heavy metal and
other unwanted pollutants to the required emission levels. The plant has online gas and pH
monitors. Solid residues are tested for the presence of PCBs and PAHs prior to disposal in a
general waste landfill site.
2.11 INSULATING OIL REGENERATION
Insulating oil regeneration, also referred to as insulating oil reclamation, can be defined as a
process whereby contaminants such as acids, water, impurities and suspended solids of used oil
is removed by chemical or adsorbent means so as to restore the oil characteristics similar to
those of new insulating oil. Commercially available regeneration plants use Alumina or Fuller’s
earth (Pahlavanpour et al., 1994) for the removal of oil oxidation products.

36
The process involves the purification and subsequent percolation of the oil through a set of
columns containing the Fuller’s earth adsorptive medium. Figure 2-9 provide an overview of
the typical oil regeneration plant.
The oxidised oil enters the system and is heated and kept at a temperature between 65 -70°C, by
a set of electric heaters. The oil then passes through a set of coarse filters to remove suspended
solids and excess moisture. This is followed by forced percolation of the oil through the
adsorptive clay bed consisting of a range of columns containing Fuller’s earth clay, at a
temperature of 65°C. The oil leaving the columns is pumped through a fine filter (typically 0.5
micron rated filter) before being degassed in the vacuum chamber. The process removes acids,
sludge, polar compounds and suspended impurities and regenerates the insulating properties of
the mineral oil to allow for its reuse in electrical equipment. The study undertaken by
Phalavanpour et al (1994) established that the regeneration process did not remove the natural
inhibitor from the oil.
Figure 2-10: Schematic of the Fuller’s earth oil regeneration process (Pahlavanpour et al.1994).

37
2.12 ARTIFICIAL NEURAL NETWORKS
Artificial neural networks, commonly known as neural networks are cited by Hagan et al.
(1999) as computationally intelligent models that have the ability to learn and are considered to
be the computational equivalent of the human brain. They were first introduced in the 1940’s
and have been used in applications such as self driven cars, pattern recognition, stock market
prediction, AIDS modelling to mention a few. The neural networks subject is broad and makes
use of optimisation techniques, statistical methods, numerical methods etc., most of which are
beyond the scope of this study.
This section provides an overview of neural networks, their application to model the process of
dechlorination and the 164 hour oxidation test used during this study. The multilayer
perceptron neural network is introduced together with its application in process modelling.
Also presented is the backpropagation algorithm, one of the most efficient procedures to train
multilayer perceptron neural networks.
2.12.1 NEURAL NETWORK FUNDAMENTALS
As seen in Figure 2-11, there is some actual physical process to be modelled. The objective is
to adjust the parameters of the neural network so that it will produce the same output as the
actual process. The input x to the actual process, whatever it may be, is applied to the process.
The resulting output is the actual or target output t, which is produced by the process. When x
is applied to the neural network, the network output y must be approximately equal to the target
output t. If they are not equal, then the difference (y-t) is computed as seen by the summation
symbol. This difference is fed back into the network so as to alter the parameters such as
weights and biases so that the network output y equals the target output t. This is known as
training the neural network to model some process.
Figure 2-11: System configuration for developing (training) and testing a neural network

38
2.12.2 MULTILAYER PERCEPTRON NEURAL NETWORK
An example of a multilayer perceptron neural network is seen in Figure 2-12. This is a two
layer network.
Figure 2-12: A two layer perceptron neural network with two neurons in the hidden layer and
2 neurons in the output layer (Hagan, 1999)
Each layer has its own weight matrix w, its own bias vector b and a net input vector n (Hagan
et al.,1999). In the first layer the single input x is multiplied by the weight matrix w to form
wx which is sent to the summer. The other input, 1, is multiplied by b and is also sent to the
summer. The output of the summer n is called the net input. This is sent to the activation
function (hyperbolic tangent in the hidden layer and linear in the output layer) to produce the
outputs a in the first layer and y in the second. w and b are parameters which are adjusted by a
learning rule until the neural network models the specified process (Hagan et al.,1999). The
activation function is chosen according to the application or the process being modelled. Each
activation function pair is called a neuron.
Two layer neural networks with a Log-Sigmoid activation function in the first layer and a linear
activation function in the second are known as universal approximators. These universal
approximators are able to model almost any process or system given the right circumstances.
Using a hyperbolic tangent function in the first layer also makes for a good approximator. The
equations that govern the neural network in Figure 2-12 are below.
11n = 1
1,1w x1 + 11b and 1
2n = 11,2w x1 + 1
2b …………………………………………………….(3)
11a = tanh( 1
1n ) = tanh( 11,1w x1 + 1
1b ) and 12a = tanh( 1
2n ) = tanh( 11,2w x1 + 1
2b )………………(4)

39
21n = 1
1a 21,1w + 1
2a 22,1w + 2
1b = tanh( 11,1w x1 + 1
1b ) 21,1w + tanh( 1
1,2w x1 + 12b ) 2
2,1w + 21b …....(5)
y1 = lin( 21n ) = lin(tanh( 1
1,1w x1 + 11b ) 2
1,1w + tanh( 11,2w x1 + 1
2b ) 22,1w + 2
1b )……………….(6)
22n = 1
1a 22,1w + 1
2a 21,2w + 2
2b = tanh( 11,1w x1 + 1
1b ) 22,1w + tanh( 1
1,2w x1 + 12b ) 2
1,2w + 22b ……(7)
y2 = lin( 22n ) = lin(tanh( 1
1,1w x1 + 11b ) 2
2,1w + tanh( 11,2w x1 + 1
2b ) 21,2w + 2
2b )………………..(8)
The graphs of the various activation functions discussed are seen in Figure 2-11.
a = logsig(n) a = lin(n) a = tanh(n)
Figure 2-13: Log-sigmoid, linear and hyperbolic tangent activation functions
2.12.3 TRAINING THE NEURAL NETWORK
In this section the method of determining the neural network parameters, weights and biases, or
training the neural network is presented. A common and effective training method based on a
quasi-Newton optimization algorithm known as backpropagation is used. The method is termed
backpropagation because derivatives are processed from the first layer of the network to the
last. A comprehensive reference for alternative algorithms to quasi-Newton optimization is
discussed by Hagan et al. (1999). The following equations are used to determine the weights
and biases. The derivations of the above equations are beyond the scope of this research and
can be found in (Hagan et al.,1999).
[ ] [ ]
∂∂−≈+
nnn W
EWW α1 and
[ ] [ ]
∂∂−≈+
nnn b
Ebb α1 ………………………………………………………………………(9)
α is known as the learning rate. The E in the partial derivatives seen above represents the
mean square error performance index, which is found as follows.

40
)()( 2
1
2
1∑∑∑ +−≈
≈≈
WtyEN
i
M
j
α ………………………………………………………….(10)
Where y = f(W, x), M is the number of training samples, N is the number of outputs and f
represents the activation function of a layer in the neural network. The second term in (10)
above makes sure that the orders of magnitudes of all weights are the same.
The first step in training the neural network is to initialize the weights and biases with random
values. The input x is then applied to the neural network and is processed through equations (3)
to (8) to produce the network output y. The difference between network output y and the target
output t (i.e. the output from the actual process) or the error is found using equation (10). This
error is used to find the next set of values of the weights and biases from equation (9). This is
called a training cycle. The next training cycle then begins whereby once again the input x is
applied to the neural network which now has new values for the weights and biases found
during the first training cycle. After the second training cycle the error from equation (10)
would have decreased. In this manner the neural network goes through many training cycles
until the error is sufficiently small.
One method to determine the number of neuron as well as the number of training cycles is
called Early Stopping, of which a detailed explanation is given by Hagan et al. (1999). The
number of layers is determined depending on the complexity of the process being modelled
however 2 layers suffice for most applications.
2.13 SUMMARY OF LITERATURE REVIEWED
The key findings of the literature reviewed in this chapter are summarised as follows:
• Uninhibited naphthenic based mineral oil contains natural inhibitors such as certain of the
sulphur, aromatic and nitrogen based compounds present in the oil.
• Mineral oil serves two main functions in transformers namely, cooling and insulating. The
ability of the oil to successfully provide these functions is greatly dependent on the physical
and chemical integrity of the mineral oil which needs to confirm to specific criteria for it to
be used effectively within transformers.
• Mineral oil will always undergo oxidation when circulating as a cooling and insulating
media in electrical equipment. It is only the degree of oxidation that can and should be
41
reduced where possible. The rate of oxidation is determined by the oil temperature and the
concentrations of oxygen and moisture present in both the oil and the equipment.
• The natural inhibitors contained in uninhibited mineral oil are continuously being depleted
as they limit the rate at which oxidation occurs while the oil is in-service. Unlike
artificially inhibited mineral oils, the natural inhibitors cannot be replenished as the
addition of artificial inhibitor would affect the ageing patterns of the oil and ultimately
affect the condition monitoring trending patterns for such equipment.
• The process of oxidation produces by-products which in themselves promote further
oxidation and ultimately a chain reaction. Oxidation negatively affects many of the oil
properties such as oxidation stability, dielectric strength, acidity, moisture content, etc.
• PCBs are synthetic substances with high thermal and chemical stability which made them
ideal for use as insulating and cooling media in electrical equipment. It is unfortunately
these same characteristics which render PCBs persistent organic pollutants.
• PCBs were first produced in the United States in the late 1920’s. PCBs were produced
under a various trade names across the globe. Production was ceased in the late 1970’s
after their toxic and bio-accumulative properties became widely known.
• PCBs settle in the fatty tissue and liver of the human body. The World Health Organisation
has rated PCBs as potential carcinogens.
• South Africa is a party to the Stockholm Convention on Persistent Organic Pollutants. The
Convention has earmarked the eradication of PCBs from use by 2025 and for lower
concentration, no later than 2028.
• Owners of PCB materials have to comply with several national laws and standards which
govern and impact the manner in which PCBs are managed and disposed of within South
Africa.
• As a hazardous material, PCBs require specialized methods of destruction and disposal.
Disposal of PCBs can only be undertaken at facilities licensed by the South African
Minister of Water Affairs.

42
• PCB (in oil) concentrations less than 50ppm are classified as PCB-free under the
Stockholm convention. However, as part of good corporate governance and risk
mitigation, Eskom and other international electricity utilities are working towards total
eradication of PCBs from its insulating oil and equipment. PCB contaminated oil at
concentrations just below 50ppm may still result in significant PCB soil contamination
should a spill occur. This is due to the fact that the SANS 290 limits for PCBs in soil are
significantly more stringent and range from 0.5 ppm for agricultural land to 10ppm for
commercial or industrial land.
• The process of PCB dechlorination is well established and several variations of the
technology used for PCB dechlorination are commercially available throughout the world.
The process effectively destroys PCB molecules through the addition of an alkali or
alkaline earth metal carbonate, hydroxide or bicarbonate to the contaminated medium
thereby replacing the chlorine atoms on the PCB molecules with hydrogen. The process
allows for the recovery of dechlorinated oil for reuse.
• Sodium based dechlorination methods typically use a sodium metal dispersion added to an
aromatic radical anion substrate (naphthalide) in the presence of an ether-type solvent
(tetrahydrofuran) to produce an alkali metal aromatic radical anion reagent (sodium
naphthalenide). The reagent is added to the PCB contaminated oil to bring about a reaction
with the chlorine atoms on the PCB molecules. The chlorine atoms are converted to an
inorganic salts and the chlorine-free polymeric structures (or biphenyls) fraction is removed
by organic fraction filtration or centrifugation.
• The effect of sodium dechlorination on the natural inhibitors of uninhibited mineral oil is
not well documented. Two sources of literature reviewed briefly mention the reduction of
natural inhibitor content after sodium dechlorination, however these statements are not
referenced the literature.
• A study evaluating the reaction kinetics of PCB in an oil substrate with sodium metal
dispersion particles established that the dechlorination reaction occurs in three steps;
Step 1: Chemical reaction between the PCB and the sodium particle at interface.
Step 2: Diffusion of the PCB through the polymer layer generated by the reaction.
Step 3: Reaction of PCBs with the sodium dispersion after penetration through the
polymer layer.
43
• The efficiency of the sodium dechlorination process can be improved by the use of smaller
sodium metal particles within the dispersion.
• Several established and emerging processes are available for the thermal and non-thermal
destruction of PCBs. Proven processes involve incineration and land filling of different
streams of PCB waste. These are currently the only two process licensed for use within
South Africa. Two local companies are currently in the process of obtaining licenses for
PCB dechlorination technologies.
• PCB destruction technologies are characterized internationally by its percentage
Destruction Efficiency (for non-thermal processes) and the percentage Destruction and
Removal Efficiency for thermal processes.
• A common problem with neural networks is that if the network receives an input which is
outside the range of the training data, the network response might be far from accurate
depending on the complexity of the process that was modelled. This is the problem of
extrapolation. Neural networks do not extrapolate well i.e. they can only really predict
accurately or interpolate within the range of the training data.
2.14 COMPARATIVE ANALYSIS OF THE BENEFITS OF
DECHLORINATION VERSUS LOCAL PCB LICENSED DISPOSAL
OPTIONS
Although disposing of Eskom’s PCB contaminated oil at the licensed thermal facility is legal,
several factors currently render this option economically and environmentally less viable. This
section examines and quantifies, where possible, the financial implications of dechlorination
relative to the two PCB disposal options currently licensed within South Africa. It also
discusses certain environmental impacts associated with each disposal option. Calculations are
based on disposal of 1000 tons of PCB contaminated oil.

44
2.14.1 ENCAPSULATION & LANDFILLING
In previous years Eskom encapsulated and landfilled its PCB materials. Eskom has
subsequently refrained from encapsulating and landfilling of PCB contaminated oil and
equipment and currently only landfills PCB contaminated soil. The decision to stop
encapsulating PCB oil and equipment was based on the fact that landfilling did not offer
complete destruction of the PCB material. Landfilling is for this reason considered more for
long term storage without the option of retrieval for reuse.
In accordance with the National Environmental Management Act (1998), Eskom remains liable
for any future environmental damages, such as leaching and subsequent ground water
contamination, that may occur as a result of an inadequately maintained landfill site. The
author did therefore not quantify any financial benefit for this disposal option.
2.14.2 THERMAL TREATMENT
The licensed thermal treatment facility in Gauteng is based on the process of thermal desorption
via refractory bricks followed by thermal oxidation. The process, described in subsection
2.10.12, is fully electrically driven and runs 24 hours a day, requiring an average 0.1150 MW of
electricity per hour, at 96 % load capacity, and has a PCB feed rate of between 200 kg and 2000
kg of PCB contaminated oil per hour as described in the scoping report for the thermal
treatment plant undertaken by Hindoc MSA (2001). The scoping report was produced as part
of the environmental impact assessment in fulfilment of the requirements for obtaining a trial
license for the operation of a thermal hazardous waste treatment plant during demonstration
phase. The feed rate varies depending on the concentration of PCB present in the oil. An
average feed rate of 1000 kg per hour of PCB contaminated oil will be used in the calculations
pertaining to this technology. Table 1-1 provides information on the amount of coal and water
required as well as the amount of carbon dioxide gas produced during generation of 1 kWh of
electricity.
The direct estimated cost of thermal disposal of 1000 tons of PCB contaminated oil as charged
by the disposal facility is calculated as:
Tonnage X Cost per ton = Cost for disposal
1000 X R 16 000.00 = R 16 000 000.00……………………(11)
The estimated amount of electricity required for thermal disposal of 1000 tons of PCB
contaminated oil, based on an average feed rate of 200 kg per hour, is calculated as:

45
Tonnage = Total hours Feed rate / hour
1000 tons = 5000 hours…………………………………………………………….…(12) 0.2 tons/hour
Total hours X Power Requirement of Plant = Total kWh required
5000 hours x 1150 kW (plant) = 5.75 x 10⁶ kWh or 5.75 GWh……………………………..(13)
Table 2-8: Selected resource input required and CO2 emitted to produce 5.75 GWh of
electricity*
Measure Unit of
Measurement
Amount/
KWh *
Total needed for Production
of 5.75 GWh
Coal Usage kg/kWh 0.5 2875 tons
Water Usage L/kWh 1.35 7762.5 kilo litres
Carbon Dioxide Production kg/kWh 0.9 5175 tons
*(Eskom Annual Report, 2009: Department of Environmental Affairs- State of the Environment, n.d)
The thermal disposal facility obtains its electricity supply directly from Eskom on the Megaflex
rate at a current revenue tariff of 22,5c/kWh. The average production cost per tariff of the
Megaflex option is 20,6c/kWh as published in the 2009 Eskom Annual Report (2009).
The production cost of 5.75 GWh at the current rate is calculated as:
20,6c/kWh X 5.75 x10⁶ kWh = R 1 184 500.00…………...……...(14)
Revenue recovered from the sale of 5.75 GWh at the current Megaflex tariff rate
22,5c/kWh X 5.75 x10⁶ kWh = R 1 293 750.00.…………...……..(15)
Profit derived from sale of electricity = (13) – (12) = R 109 250.00 or 9.2 %.........................(16)
Newcomer (2008) cited an environmental emissions tax cost of USD 35 per metric ton of CO2
produced. An exchange rate of R7.6 per $1, as per economic indicators as at 6th of November
2009 is used.
The carbon dioxide emissions tax associated with the production of 5175 tons of CO2 for the
thermal treatment of PCB oil is calculated as:

46
Tonnage of carbon dioxide X Cost per metric ton = Carbon emissions tax associated with
thermal destruction
5175 tons X R 266.00 = R 1 376 550.00……………………….....(17)
The actual cost incurred by Eskom for thermal destruction of 1000 tons of PCB contaminated
oil, excluding costs associated with environmental impacts listed in table 1-1 above, is
calculated as:
Actual cost of thermal destruction to Eskom:
Actual cost = (11) + (17) – (16) = R 17 267 300.00……………………………...…………(18)
2.12.4. SODIUM BASED CATALYZED DECHLORINATION
Base catalysed dechlorination processes operate on the principles of chemical reaction of the
PCB molecule with an alkali metal or alkali metal oxide or hydroxide. The process is by default
considered more environmentally sound as it does not involve combustion and therefore does
not have the risk of the production and release of harmful emissions into the atmosphere. Other
benefits include that the process allows for the recovery of reusable oil, that the process is
mobile and dechlorination can either be undertaken by bulk or continuous processing. The
process is also significantly less energy intensive, with the average electricity requirement 150
kWh and a feed rate of up to 3800 litres per hour. The locally available (unlicensed)
dechlorination plants are batch type and can treat batch volumes of between 500 to 3800 litres
at a time, depending on PCB oil contamination level. It is important to note that the higher the
PCB concentration of the contaminated oil, the more reagent and longer reaction time is
required to achieve the desired PCB concentration level of below 2ppm. The average time taken
for reaction and regeneration of the PCB contaminated oils in the range of 12 to 144 ppm, is 3
hours. Longer reaction times are observed for the PCB concentration above 500 ppm. For this
study, processing of the 1730 ppm PCB oil took as long as 8 hours to reduce PCB
concentrations of less than 2 ppm, with a total time of 12 hours including oil regeneration after
dechlorination.
For simplicity, the author shall assume a conservative dechlorination rate of 287 litres per hour
(average batch volume size divided by the average dechlorination and regeneration time). The
cost of dechlorination is directly proportional to the PCB concentration of the oil and typically
ranges between R8.00 to R 12.00 per litre. The density of used mineral insulating oil is around

47
0.895 kg/L (Dalton 2008: Nynas 2001). A thousand tons of PCB contaminated oil would be
equivalent to 11171 kilo litres (kL) of used mineral oil.
The cost of dechlorinating 1000 tons of PCB contaminated mineral oil, assuming an average
dechlorination cost of R10 per litre, is calculated as follows:
Volume X Cost per Litre = Cost of Dechlorination
1117 x 103 L X R 10.00/L = R 11,170,000.00…………….(19)
The dechlorination cost in calculation (19) will be offset by the cost of the value of the
recovered dechlorinated oil, which can either be retained within Eskom or be sold into the used
oil market at an estimated average cost of R4.50 per litre. Assuming volume losses of 10%
after processing, the value of the recovered commodity is calculated as follows:
Regenerated Oil (l ) X Potential Revenue (per litre) = Estimated Potential Revenue
1005.3 x 103 L X R 4.50/L = R 4,523,850.00…………………………...(20)
The estimated amount of electricity required for dechlorination of 1117 kL of PCB
contaminated oil (equivalent to 1000 tons), based on an average feed rate of 287 litres per hour,
is calculated as:
Volume = Total hours X Power Requirement of Plant = Total kWh required Feed rate / hour
1117 = 3892 hours X 150 kW (plant) = 583800 kWh or 583.8 MWh or 0.58 GWh...........(21) 0.287
Table 2-9: Selected resource input required and CO2 emitted to produce 0.58 GWh of electricity
Measure Unit of
Measurement
Amount/
kWh
Total needed for Production
of 0.58 GWh
Coal Usage kg/kWh 0.5 291.9 tons
Water Usage L/kWh 1.35 788.1 kL
Carbon Dioxide Production kg/kWh 0.9 525.4 tons
The carbon dioxide emissions tax associated with the production of 525.4 tons of CO2 for the
dechlorination of 1000 tons of PCB oil is calculated as:
1 The volume of used mineral oil that is equivalent to 1000 tons of mineral oil, without compensating for the density of PCBs contained in the oil which, depending on PCB concentration, is negligible.

48
Tonnage of carbon dioxide X Cost per metric ton = Carbon emissions tax associated with
dechlorination
525.4 tons X R 266.00 per ton = R 139 756.40 .............................(22)
As the dechlorination facilities are smaller and do not operate on a 24 hour basis, the author
presumes an electricity revenue tariff in line with the Eskom Miniflex tariff option.
The cost associated with generating 0.58 GWh at the current Miniflex rate is calculated as:
24,4c/kWh X 0.58 x10⁶ kWh = R 141 520.00……… ……………….……(23)
Revenue recovered from the sale of 0.58 GWh at the current Megaflex tariff rate
26,3c/kWh X 0.58 x10⁶ kWh = R 152 540.00…...……………......(24)
Profit derived from sale of electricity (24) – (23) = R 11 020.00 or 7.8%...............................(25)
The actual cost incurred by Eskom for dechlorination of 1000 tons of PCB contaminated oil,
excluding the costs associated with the environmental impacts listed in Table 2-9 above, is
calculated as:
Actual cost of dechlorination = [(19) + (22)] – [(20) + (25)] = R 6 774 886.40.…………….(26)
The relative cost benefit associated with the destruction of 1000 tons of PCB oil is calculated
as:
(Actual cost of thermal destruction) - (Actual cost of dechlorination) = Disposal cost saving
R 17 267 300.00 - R 6 774 886.40 = R 10 492 413.60, a cost saving of 61%......................(27)
The cost benefit associated with sodium dechlorination is apparent from calculation (27). The
sodium dechlorination method has further significant merit as the use of natural resources is
significantly reduced when using this process for PCB destruction.

49
Chapter Three
EXPERIMENTAL
3.1 INTRODUCTION TO THE EXPERIMENTAL INVESTIGATION
This chapter discusses the experimental methodology employed and the technical operation of
the sodium based dechlorination technology. It gives a brief summary of the analytical test
methods used to evaluate the selective parameters, relating to oil oxidation stability, of the nine
test batches processed during the study.
3.2. EXPERIMENTAL METHODOLOGY
The author collected suitable sample volumes of PCB contaminated oils in the concentrations
levels as stipulated by the Stockholm Convention on Persistent Organic Pollutants i.e. below 50
ppm, between 50 and 500 ppm and above 500 ppm. This allowed for the collection of 3 main
batches of uninhibited napthenic mineral oil of the Nynas 10GBN type, although it cannot be
confirmed if the oil had been mixed or topped up with other uninhibited oil from a different
supplier. Volumes of the batches were mixed with each other and similar oils containing lower
PCB concentrations in order to obtain a spread of concentrations within each of the three PCB
ranges stipulated by the Stockholm Convention. Samples were taken as follows for of the
ranges processed:
o Prior to energizing i.e. control sample for baseline data
o After PCB dechlorination, to assess the effects of sodium dechlorination on the oil.
o After oil regeneration, to assess the oil’s suitability for reuse in transformers.
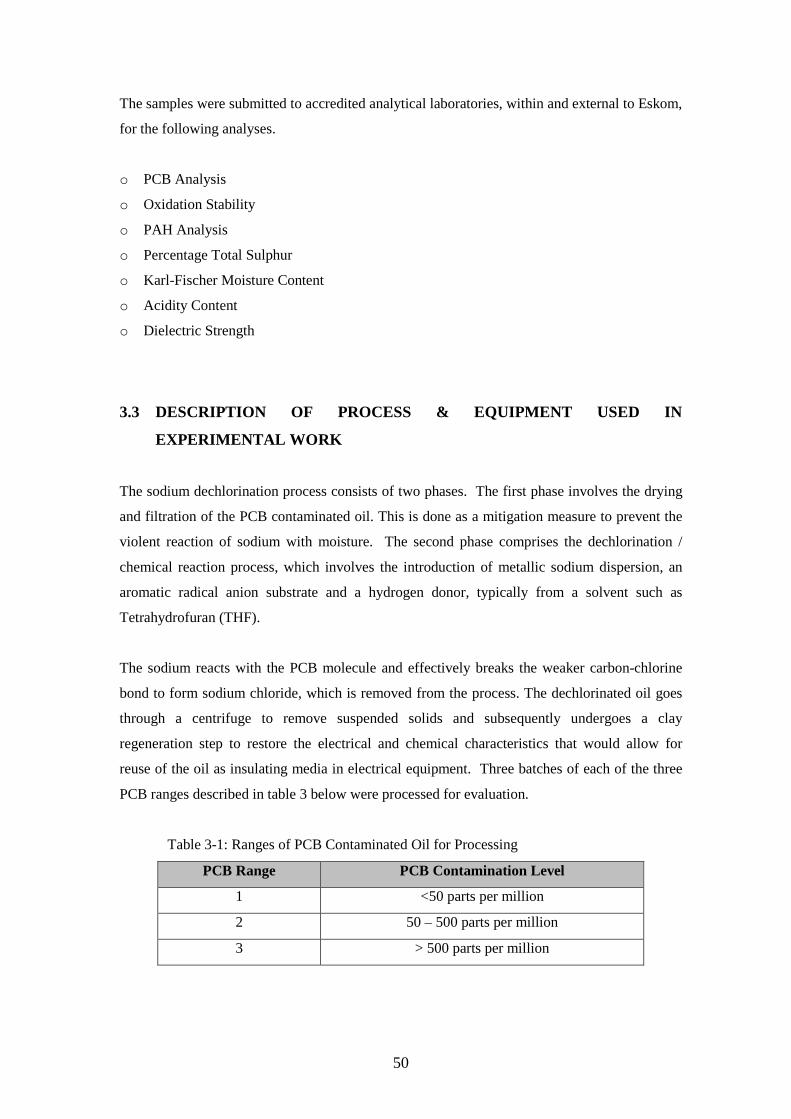
50
The samples were submitted to accredited analytical laboratories, within and external to Eskom,
for the following analyses.
o PCB Analysis
o Oxidation Stability
o PAH Analysis
o Percentage Total Sulphur
o Karl-Fischer Moisture Content
o Acidity Content
o Dielectric Strength
3.3 DESCRIPTION OF PROCESS & EQUIPMENT USED IN
EXPERIMENTAL WORK
The sodium dechlorination process consists of two phases. The first phase involves the drying
and filtration of the PCB contaminated oil. This is done as a mitigation measure to prevent the
violent reaction of sodium with moisture. The second phase comprises the dechlorination /
chemical reaction process, which involves the introduction of metallic sodium dispersion, an
aromatic radical anion substrate and a hydrogen donor, typically from a solvent such as
Tetrahydrofuran (THF).
The sodium reacts with the PCB molecule and effectively breaks the weaker carbon-chlorine
bond to form sodium chloride, which is removed from the process. The dechlorinated oil goes
through a centrifuge to remove suspended solids and subsequently undergoes a clay
regeneration step to restore the electrical and chemical characteristics that would allow for
reuse of the oil as insulating media in electrical equipment. Three batches of each of the three
PCB ranges described in table 3 below were processed for evaluation.
Table 3-1: Ranges of PCB Contaminated Oil for Processing
PCB Range PCB Contamination Level
1 <50 parts per million
2 50 – 500 parts per million
3 > 500 parts per million

51
3.3.1 STEP-BY-STEP SODIUM DECHLORINATION PROCESS
To fully understand the operation of the sodium dechlorination process employed in Chapter 3
of this study, the step-by-step process explained in this subsection must be read in conjunction
with the flow diagram contained in Figure 3-1.
• Step 1: PCB contaminated oil enters the dechlorinator at the system INLET and passes
through HEAT EXCHANGER (1) where it is heated to between 65 and 70oC to remove
excess moisture. The heating time is dependant on the moisture concentration of the PCB
contaminated oil entering the system. For safety reasons the moisture concentration of the
heated oil existing (1) does not exceed 30 ppm, as sodium metal dispersion is used in the
dechlorination process.
• Step 2: The heated oil then passes through PUMP (1) into the HEATER where the
temperature is raised to between 120OC to 130OC. The pipes following the heater are
insulated to ensure the oil temperature is maintained.
• Step 3: The heated oil is then pumped into the MIXING CHAMBER where it will
encounter a predetermined volume of the sodium reagent either only sodium metal
dispersion or a mixture of sodium metal dispersion, naphthalene and tetrahydrofuran, which
has been pumped into the mixing chamber via the INJECTOR. The heated PCB
contaminated oil and sodium reagent are thoroughly mixed.
• Step 4: The mixture flows in to the REACTION ZONE where the dechlorination reaction is
completed and the sodium is reacted with the chlorine atoms on the PCB molecules
contained in the mineral oil. The dechlorination reaction of the PCB molecule is limited to
the amount of active sodium present, resulting in the formation of sodium chloride. The
reaction path is as follows:
XCl + NaR NaCl + Xo………………(28)
Where:
XCl is a PCB molecule (1 to 10 chlorine atoms)
NaR is a reactive sodium atom
Xo is a biphenyl molecule (chlorine free)

52
• Step 5: It is possible to neutralise and remove the un-reacted reagent and catalyst through
the addition of water and carbon dioxide. The resulting hydrogen gas developed in the
vessel is vented to atmosphere. A screw pump continuously drains the vessel and feeds the
PCB free oil/water mixture into a centrifuge for removal of salts and particles
• Step 6: The temperature of the decontaminated oil is reduced to the below the melting
point of the sodium to allow the molten sodium to solidify and separate out of the oil.
• Step 7: To achieve the drop in temperature the decontaminated oil leaves the reaction zone
and flows through HEAT EXCHANGER 2, where it releases heat and flows into HEAT
EXCHANGER 1 where further heat release occurs. This heat is subsequently used to heat
the PCB contaminated oil entering the system.
• Step 8: The cooled dechlorinated oil leaves HEAT EXCHANGER 1 (at below 80OC) and
passes into the SEPARATOR (centrifuge) where the solidified sodium is removed from the
system. Lowering the oil temperature to below 80OC also allows for the separation of the
polymer by-product from the oil through filtration or centrifugation.
• Step 9: The dechlorinated oil leaves the SEPARATOR and is pumped back through both
HEAT EXCHANGERS to raise the temperature. This is done as higher oil temperatures
aid in oil degassing.
• Step 10: The decontaminated oil is degassed in the degasser and sent to the holding tank or
straight into the regeneration plant.
3.2.2 DECHLORINATED OIL REGENERATION
The dechlorinated oil is fed through a Fullers Earth Clay regeneration process to purify and
restore specific chemical and electrical characteristics of the oil as discussed in section 2.11 so
as to conform to the requirement regenerated oil as specified in the SANS 555 standard and
contained in Table 2-2 (Dalton, 2008).

53
Figure 3-1: Sodium Dechlorination Process Flow (Jordan, 1982)

54
Figure 3-2: Mobile sodium dechlorination plant
Figure 3-3: Reagent / injector dosing
Figure 3-4: Centrifuge – separation
Figure 3-5: Sample collection
55
3.4. CHEMICAL ANALYSES OF UNIHBITED DECHLORINATED
MINERAL OIL
The oil in a transformer acts as both a cooling and insulating media. One can therefore draw
the analogy that the oil in a transformer is much like the blood in the human body in that it
contains information on the health of the transformer. Analysis of a transformer oil sample
contains a wealth of information that may assist an operator in making crucial decisions on
whether or not to remove the transformer from service in order to prevent a potential
catastrophe and unplanned outage.
A number of chemical analyses techniques have been developed and proven over the years,
and are currently being used as reliable pro-active and preventative monitoring tools within
power utilities across the globe. The chemical analyses relevant to this study are briefly
explained below.
3.4.1 POLYCHLORINATED BIPHENYL ANALYSIS
As described in section 2.5, 209 variations (congeners) exist. New oil produced from crude
oil does not contain PCBs. The congeners most commonly used as insulating and cooling
media in electrical equipment are Askarels with unique identifiers namely; 1260, 1254, 1248
and 1242. The “12” contained in the unique identifier indicates the number of carbon atoms
in the biphenyl ring whereas the “60”, “54”, “48” and “42” indicate the percentage
chlorination around the biphenyl molecule. This analysis was performed using the IEC 61619
test method for the determination of PCBs using a high resolution capillary column and an
electron capture detector.
3.4.2 MOISTURE CONTENT
Moisture, even in minute quantities, is harmful in power transformers and power equipment
as moisture has a tendency to migrate towards areas where the most significant electrical
stress exist and where it has the greatest detrimental effect. Moisture accelerates the
deterioration of both the uninhibited mineral oil and the insulating materials used inside the
transformer. Once deterioration has been initiated, more moisture is produced. This is a self-
supporting cycle and once the paper has been degraded, it can never be returned to its original
condition. Moisture, either on its own, or in conjunction with cellulose particles also has a
detrimental effect on the dielectric properties of oil. Where moisture concentrations and
cellulose deterioration rates are sufficiently high, free water may be formed as a by-product in

56
the transformer, which can lead to electrical breakdown. Moisture can be readily removed
from the oil however, most of the moisture in a transformer is located in the solid insulation
of the transformer (i.e. cellulose insulation paper around copper windings and insulation
pressboard) the removal of moisture is not effective without first removing the moisture in the
solid insulation. Therefore, there is no “quick fix” solution in the case of a transformer with
high levels of moisture. Oil can be damaged during this process and it is best to test the oil
after regeneration to ensure compliance with the relevant standards. Moisture analysis for
this study was performed using accredited test method IEC 60814.
3.4.3 ACIDITY OR NEUTRALISATION VALUE
The neutralization value of the oil is a measure of the presence of acidic compounds in the oil.
An increase in the neutralization number typically indicates oxidation of the oil. The
concentration of acids is negligible in new or virgin oil, but increases as a result of oxidative
ageing. Acidity is normally used as a measure to decide when oil should be replaced or
regenerated. Failure to proceed with these actions will cause the oil to become corrosive,
produce dissolved sludge and finally sludge deposits. These deposits can result in overheating
and the acid will further weaken the solid insulation material, resulting in eventual failure of
the transformer. The acids will also increase the solubility of moisture in the oil and paper,
due to the polar nature of these compounds. The acidity analysis for this study was performed
using accredited test method IEC 62021-1. This analysis was undertaken by the author..
3.4.4 DIELECTRIC STRENGTH
In transformers, oil is used in conjunction with oil-impregnated paper to provide insulation.
However, oil is not as good as insulator as the oil-impregnated paper. The dielectric constant
of oil is less than that of paper so that the oil tends to be more stressed than the paper. As a
result of this, it may be stated that oil is the weak link in the transformer and that the
condition of the oil is of great importance. The maintenance of the oil is paramount to
maintain the dielectric strength properties of the oil. Dielectric strength is therefore the
insulation property that the oil inherently displays. The dielectric strength analysis for this
study was performed using accredited test method IEC 60156 and is described in further
detail in chapter 4.

57
3.4.5 OXIDATION STABILITY
Mineral insulating oil is expected to effectively cool and insulate transformers under stressful
operating conditions. Oxidation stability is a crucial characteristic of insulating oil as it
measures the ability of the oil to withstand degradation by oxidation. During the oxidation,
acids and sludge are formed in the oil, which attack materials within the transformer causing
the materials to eventually fail. The function of the oxidation stability test is to determine
how long the process would take before unacceptable levels of acids and sludge are reached.
The longer the oil can withstand the oxidation process the better it will be for the sensitive
materials such as the cellulose insulating paper and metal components contained in the
transformer. The oxidation stability analysis for this study was performed in accordance with
accredited test methods ASTM D2440/IEC61125 Method C, where oil will be exposed to
oxygen in the presence of a copper catalyst for a period 164 hours. The percentage sludge
formation and neutralisation number was measured to establish the oxidation stability of the
uninhibited mineral oil. This analysis was undertaken by the author with the assistance of the
laboratory technician.
3.4.5 POLYAROMATIC HYDROCABONS (PAHs)
PAHs relate to the percentage of hydrocarbon cyclic compounds present in the oil. An
aromatic hydrocarbon typically has a benzene structure which is fused to other benzene
related hydrocarbons. The dechlorination process typically strips the chlorine off the PCB
molecule and replaces it with either an H or an OH depending on the reagent being used in
the dechlorination process. PAHs are usually kept as low as possible due to the carcinogenic
related tendencies and a maximum of 3% is allowed in mineral insulating oils as cited in the
Eskom research report on PAHs in transformer oils (Lombard 2000). The PAH analysis for
this study was performed using High Performance Liquid Chromatography (HPLC) test
method BS 2000 par 346. The author is not proficient in HPLC instrumentation operation
and analysis was therefore undertaken by the laboratory chemist responsible for this area.
3.4.6 TOTAL SULPHUR CONTENT (%)
The test measures the total sulphur content of the oil. The test is performed via X-ray
method, ISO14596, to measure total sulphur content. The student is not proficient in the
operation of X-ray Diffraction instrumentation and analysis was therefore undertaken
by the laboratory chemist responsible for this area.

58
Chapter Four
EVALUATION & INTERPRETATION OF RESULTS
4.1 INTRODUCTION TO EVALUATION & INTERPRETATION OF
RESULTS
A total of nine batches of PCB contaminated mineral oil were processed using the sodium
dechlorination technology described in chapter 3. The samples were submitted for chemical
analyses, the results, of which are interpreted in this chapter.
4.2. RESULTS OBTAINED
Three samples of each of the nine test batches were taken at specific positions during the
experimental part of this study. The first sample was taken prior to PCB dechlorination to
establish a baseline. The second sample was taken after dechlorination and a third sample
was taken after oil regeneration. The second and third samples were taken to establish the
effects of each of the processes (i.e. dechlorination and regeneration) on the specific
characteristic/parameter within the oil.
PCB analysis was performed on each of the nine test batches. The test method, IEC 61619,
was employed for analysis of the samples taken during the experimental part in this study.
This test method involves a solvent extraction step where the 0.2g sample oil is added to a 10
mL volumetric flask together with 1 mL sulphuric acid and 1 mL of 1 ppm
decachlorobiphenyl as an internal standard. The contents of the volumetric flask are made up
to the mark with hexane, shaken and left to stand until it produces a clear solution. A gas-
tight glass syringe is used to draw a 1 µL sample from the volumetric flask. This is
introduced into a gas chromatograph (GC) with a high resolution capillary separation column

59
an electron capture detector to allow for qualitative analytical analysis. Specific PCB
congeners are represented by peaks on a chromatogram which elute from the GC separation
column at specified times. The peak size and areas are indicative of the concentration of the
specific PCB congener. Table 4-1 contains the results of each of the nine batches analysed
using test method IEC 61619.
Table 4-1: Results of PCB analysis for all samples across the PCB range
PCB
Range
Batch
No.
Pre-
dechlorination
Post-
dechlorination
After
regeneration
No. of
Dechlorination
cycles
1 12 ppm <2 ppm <2 ppm 1
2 28 ppm <2 ppm <2 ppm 1
Range 1
(<50 ppm)
3 41 ppm <2 ppm <2 ppm 1
4 58 ppm <2 ppm <2 ppm 1
5 133 ppm <2 ppm <2 ppm 2
Range 2
(50–500
ppm) 6 144 ppm <2 ppm <2 ppm 2
7 631 ppm <2 ppm <2 ppm 3
8 837 ppm <2 ppm <2 ppm 3
Range 3
(>500 ppm)
9 1730 ppm <2 ppm <2 ppm 4
The oxidation stability test was undertaken by the author with the assistance of the laboratory
technician. The test involves the exposure of 25grams of sample oil to a continuous flow of
oxygen, at a flow rate of 1L/hour and in the presence of a copper catalyst, for a period of 164
hours and at a constant temperature of 100oC. The copper catalyst is added at a ratio of 0.39
sq.cm/g Oil. At the end of the 164 hour test the sample is analysed to establish its acidity and
sludge contents. Tables 4-2 and 4-3 below contain the results of the sludge analysis and
titrametric acidity analysis respectively.

60
Table 4-2: Oxidation stability results as % sludge formation for samples in PCB test range
Pre-dechlorination
Post-dechlorination
After regeneration
PCB Range
Batch No.
PCB concentration
prior to dechlorination Sludge after
164h @ 120ºC (% by mass)
Sludge after 164h @ 120ºC (% by mass)
Sludge after 164h @ 120ºC (% by mass)
1 12 ppm 0.68 0.42 0.54
2 28 ppm 0.55 0.71 0.68
Range 1
(<50 ppm)
3 41 ppm TNP* 0.99 0.36
4 58 ppm 0.47 1.37 0.26
5 133 ppm 0.46 1.65 0.78
Range 2
(50–500 ppm)
6 144 ppm 0.61 1.87 0.63
7 631 ppm 0.38 0.92 0.50
8 837 ppm 0.67 2.06 1.06
Range 3
(>500 ppm)
9 1730 ppm 0.74 2.30 1.40
Table 4-3: Oxidation stability results as acidity content for samples in the PCB test range
Pre-dechlorination
Post-dechlorination
After regeneration
PCB Range
Batch No.
PCB concentration
prior to dechlorination Acidity after
164h @ 120ºC (mgKOH/g)
Acidity after 164h @ 120 ºC
(mgKOH/g)
Acidity after 164h @ 120ºC
(mgKOH/g) 1 12 ppm 1.18 1.14 0.72
2 28 ppm 1.28 1.23 0.65
Range 1
(<50 ppm)
3 41 ppm TNP* 1.50 0.31
4 58 ppm 1.02 1.19 0.74
5 133 ppm 0.95 1.46 1.58
Range 2
(50–500 ppm)
6 144 ppm 1.12 1.77 1.25
7 631 ppm 1.05 1.56 0.88
8 837 ppm 0.85 2.50 1.13
Range 3
(>500 ppm)
9 1730 ppm 1.12 3.02 1.62
The PAH analysis was undertaken by test method BS 2000 par 346 using High Performance
Liquid Chromatography. The procedure is designed to determine the presence and quantities
of polycyclic aromatics in unused lubricating base oils and asphaltene free petroleum
* Test not performed as sample was accidentally discarded by laboratory staff prior to analysis

61
fractions using the dimethyl sulphoxide extraction refractive index method. Table 4-4
contains the PAH results of the samples analysed. Due to the cost associated with this test
only six of the nine samples were submitted for PAH analysis. The author did not undertake
the PAH analysis.
Table 4-4: Results of polyaromatic hydrocarbon analysis for samples in the PCB test range.
Certain sulphur compounds contained in mineral insulating oil act as natural antioxidants.
The ISO 14596 test method was specifically designed to measure the percentage of sulphur in
petroleum based products with typical total sulphur contents in the range of 0.001 to 2.5%.
The test method makes use of wavelength-dispersive X-ray fluorescence (XRF) spectrometry
for quantitative determination. The author did not undertake the analysis.
Pre-dechlorination
Post-dechlorination
After regeneration
PCB Range
Batch No.
PCB concentration
prior to dechlorination
PAH (%)
PAH (%)
PAH (%)
1 12 ppm 1.37 1.34 1.21
2 28 ppm 0.27 0.28 0.24
Range 1
(<50 ppm)
3 41 ppm - - -
4 58 ppm 0.22 0.22 0.20
5 133 ppm - - -
Range 2
(50–500 ppm)
6 144 ppm 0.35 0.31 0.32
7 631 ppm 0.55 0.57 0.78
8 837 ppm - - -
Range 3
(>500 ppm)
9 1730 ppm 0.49 0.56 0.55
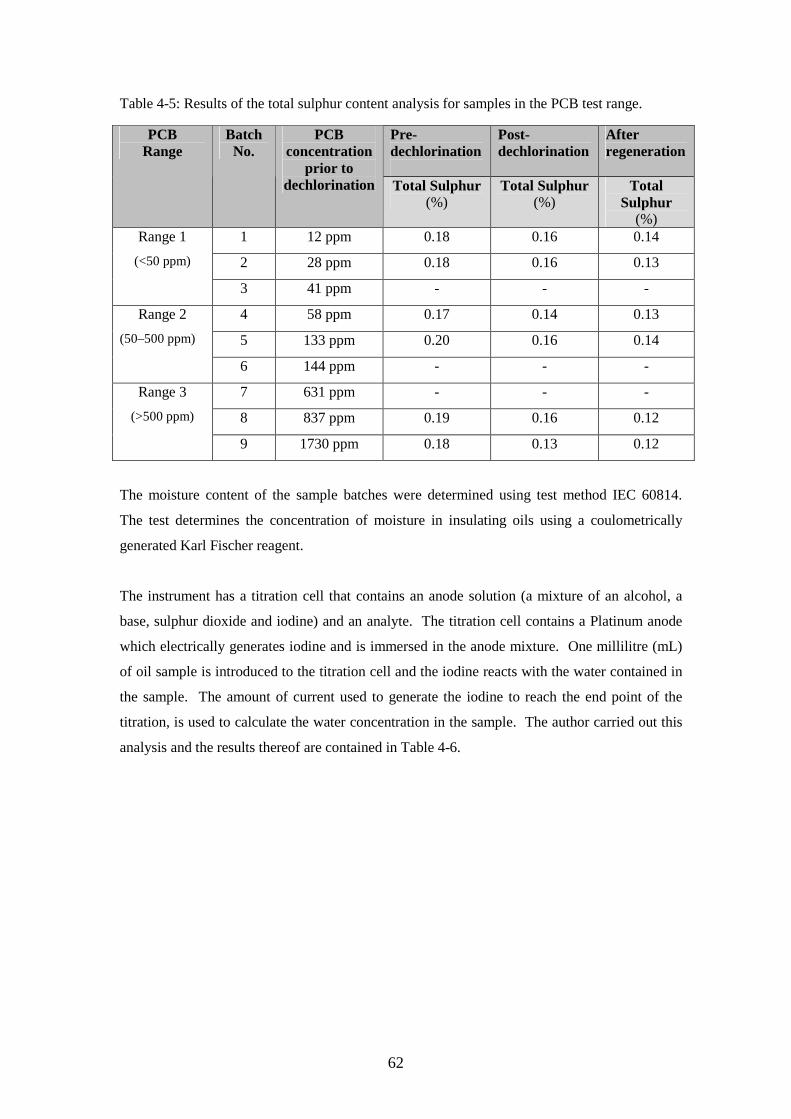
62
Table 4-5: Results of the total sulphur content analysis for samples in the PCB test range.
The moisture content of the sample batches were determined using test method IEC 60814.
The test determines the concentration of moisture in insulating oils using a coulometrically
generated Karl Fischer reagent.
The instrument has a titration cell that contains an anode solution (a mixture of an alcohol, a
base, sulphur dioxide and iodine) and an analyte. The titration cell contains a Platinum anode
which electrically generates iodine and is immersed in the anode mixture. One millilitre (mL)
of oil sample is introduced to the titration cell and the iodine reacts with the water contained in
the sample. The amount of current used to generate the iodine to reach the end point of the
titration, is used to calculate the water concentration in the sample. The author carried out this
analysis and the results thereof are contained in Table 4-6.
Pre-dechlorination
Post-dechlorination
After regeneration
PCB Range
Batch No.
PCB concentration
prior to dechlorination Total Sulphur
(%) Total Sulphur
(%) Total
Sulphur (%)
1 12 ppm 0.18 0.16 0.14
2 28 ppm 0.18 0.16 0.13
Range 1
(<50 ppm)
3 41 ppm - - -
4 58 ppm 0.17 0.14 0.13
5 133 ppm 0.20 0.16 0.14
Range 2
(50–500 ppm)
6 144 ppm - - -
7 631 ppm - - -
8 837 ppm 0.19 0.16 0.12
Range 3
(>500 ppm)
9 1730 ppm 0.18 0.13 0.12
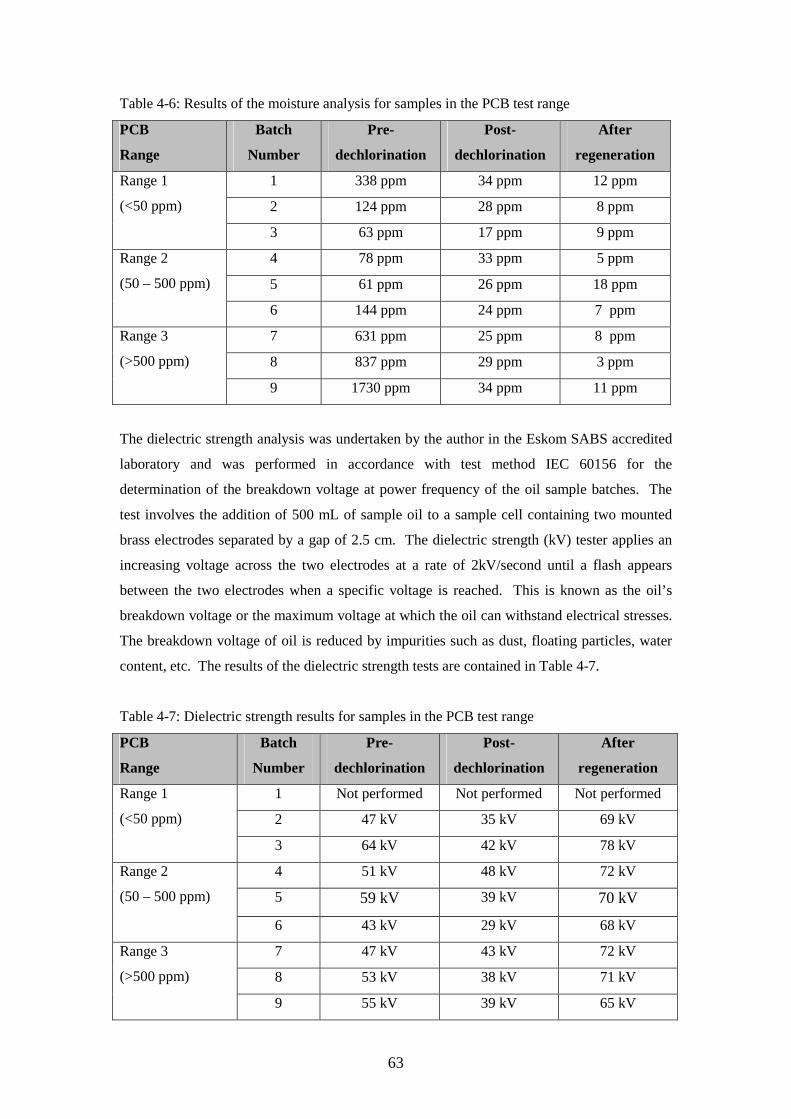
63
Table 4-6: Results of the moisture analysis for samples in the PCB test range
PCB
Range
Batch
Number
Pre-
dechlorination
Post-
dechlorination
After
regeneration
1 338 ppm 34 ppm 12 ppm
2 124 ppm 28 ppm 8 ppm
Range 1
(<50 ppm)
3 63 ppm 17 ppm 9 ppm
4 78 ppm 33 ppm 5 ppm
5 61 ppm 26 ppm 18 ppm
Range 2
(50 – 500 ppm)
6 144 ppm 24 ppm 7 ppm
7 631 ppm 25 ppm 8 ppm
8 837 ppm 29 ppm 3 ppm
Range 3
(>500 ppm)
9 1730 ppm 34 ppm 11 ppm
The dielectric strength analysis was undertaken by the author in the Eskom SABS accredited
laboratory and was performed in accordance with test method IEC 60156 for the
determination of the breakdown voltage at power frequency of the oil sample batches. The
test involves the addition of 500 mL of sample oil to a sample cell containing two mounted
brass electrodes separated by a gap of 2.5 cm. The dielectric strength (kV) tester applies an
increasing voltage across the two electrodes at a rate of 2kV/second until a flash appears
between the two electrodes when a specific voltage is reached. This is known as the oil’s
breakdown voltage or the maximum voltage at which the oil can withstand electrical stresses.
The breakdown voltage of oil is reduced by impurities such as dust, floating particles, water
content, etc. The results of the dielectric strength tests are contained in Table 4-7.
Table 4-7: Dielectric strength results for samples in the PCB test range
PCB
Range
Batch
Number
Pre-
dechlorination
Post-
dechlorination
After
regeneration
1 Not performed Not performed Not performed
2 47 kV 35 kV 69 kV
Range 1
(<50 ppm)
3 64 kV 42 kV 78 kV
4 51 kV 48 kV 72 kV
5 59 kV 39 kV 70 kV
Range 2
(50 – 500 ppm)
6 43 kV 29 kV 68 kV
7 47 kV 43 kV 72 kV
8 53 kV 38 kV 71 kV
Range 3
(>500 ppm)
9 55 kV 39 kV 65 kV

64
The acidity content or neutralisation value of mineral insulating oil measures the degree to
which the oil has oxidized and formed constituents that have acidic characteristics. These
constituents include organic acids, phenols, organometallic salts, etc. The test consists of a
neutralisation titration where the acid contained in the oil is titrated against a potassium
hydroxide base using and a colour indicator to determine the titration end point. This analysis
was undertaken by the author in the Eskom SANS accredited laboratory. The results of the
neutralisation value test undertaken are contained in Table 4-8.
Table 4-8: Results of neutralisation value analysis for samples in the PCB test range
PCB
Range
Batch
Number
Pre-
dechlorination
Post-
dechlorination
After
regeneration
1 0.01 mg KOH/g 0.02 mg KOH/g 0.01 mg KOH/g
2 0.01 mg KOH/g 0.03 mg KOH/g 0.01 mg KOH/g
Range 1
(<50 ppm)
3 0.01 mg KOH/g 0.05 mg KOH/g 0.02 mg KOH/g
4 0.05 mg KOH/g 0.06 mg KOH/g 0.02 mg KOH/g
5 0.03 mg KOH/g 0.01 mg KOH/g 0.03 mg KOH/g
Range 2
(50 – 500 ppm)
6 0.03 mg KOH/g 0.04 mg KOH/g 0.01 mg KOH/g
7 0.03 mg KOH/g 0.03 mg KOH/g 0.01 mg KOH/g
8 0.03 mg KOH/g 0.04 mg KOH/g 0.03 mg KOH/g
Range 3
(>500 ppm)
9 0.06 mg KOH/g 0.05 mg KOH/g 0.03 mg KOH/g
4.3. EVALUATION & INTERPRETATION OF RESULTS
The PCB results contained in Table 4-1 indicate the efficacy of the sodium dechlorination
technology in successfully dechlorinating the PCB content of the contaminated oils. The
batches in the <50ppm PCB range required only one cycle of processing to effectively reduce
the PCB concentration of the input oil to below 2 ppm PCB. The number of cycles required
to achieve the target concentration of <2ppm PCB increases with an increase in PCB input
concentration.
Of particular interest are the oxidation stability results and how it relates to the natural
inhibitor content of the oil during each phase of the experimental process i.e. pre-
dechlorination, post-dechlorination and post-regeneration. Tables 4-4 to 4-8 will be discussed
relative to the oxidation stability results contained in Tables 4-2 and 4-3 for each of the three
PCB concentration ranges.

65
4.3.1 EVALUATION AND INTERPRETATION OF SAMPLE RESULTS FOR PCB RANGE <50 PPM
The oxidation stability results obtained in tables 4-2 and 4-3 have been plotted for
interpretation purposes.
Oxidation Stability as % Sludge Formation (Range <50 ppm)
0
0.2
0.4
0.6
0.8
1
1.2
12 28 41
PCB Concentration (ppm)
% S
ludge
Form
atio
n (%
by
mas
s)
Pre-dechlorination
Post-dechlorination
Post Regeneration
[----Batch 1---------]
[----Batch 2---------]
[----Batch 3---------]
No test done
Figure 4-1: Oxidation stability as percentage sludge formation (<50 ppm)
Oxidation Stability as Acidity Content (Range <50 ppm)
0
0.2
0.4
0.6
0.8
1
1.2
1.4
1.6
1.8
12 28 41
PCB Concentration (ppm)
Aci
dit
y (m
g K
OH
/g)
Pre-dechlorination
Post-dechlorination
Post Regeneration
[----Trial 1---------]
[----Trial 2---------]
[----Trial 3---------]
No test done
Figure 4-2: Oxidation stability as ppm acidity formation (<50 ppm)

66
Batch 1 of range <50 ppm indicate lower acid and sludge formation after sodium
dechlorination, which indicates an increase oxidation stability after the dechlorination and
regeneration process and an overall increase in oxidation stability in the post-regeneration
sample. The oxidation stability result ito % sludge formation after regeneration does not appear
to conform to the natural behaviour of oil after dechlorination and prior to regeneration as it
would be expected that the % sludge formation would be less after oil regeneration. This
phenomenon could either be assigned to the influence of external factors such as human error
(sample contamination or incorrect measurement). Alternatively it could be due to an
inadequate regeneration step due to spent clay thereby not sufficiently removing oxidation
enhancing impurities. If so, these impurities may have lead to an accelerated transition of acid
to sludge in the post-regeneration sample relative to this transition in the pre-dechlorination
sample. Phalavanpour et al.(1994) cited that the mechanics of sludge formation in mineral
insulating oil occurs in two steps namely:
1. The formation of soluble oxidation products, this process commences as soon as
the transformer is energized and the mineral oils starts circulating.
2. The transition of soluble oxidation products such as acids to insoluble tarry like
compounds that settle out.
When comparing the post-dechlorination and post-regeneration oxidation stability results it is
observed that the acid concentration of the former is higher than that of the later and the %
sludge formation of the former is lower than that of the later. This may be due to a faster
transition of acid to sludge in the later, if the regeneration process did not adequately remove
the oxidation enhancing compounds from the oil.
Batch 2 in the PCB concentration range <50 ppm indicates a distinct increase in percentage
sludge formation in the post-dechlorination sample and a decrease in acidity formation. As
acid is a precursor for the formation of sludge, it may be inferred that the reaction of acid to
sludge occurred more rapidly in batch 2. This could be due to the oil’s solubility of acid being
reduced during the dechlorination and regeneration process, however this is not the trend a
common trend observed across the ranges and can therefore not be claimed with a large degree
of certainty.
It is anticipated that the percentage sludge formation of the pre-dechlorination sample of Batch
3 would have been lower than the post-dechlorination sample although this cannot be
confirmed beyond any reasonable doubt as no point of reference i.e. pre-dechlorination sample
results, are available to allow for interpretation of the results.
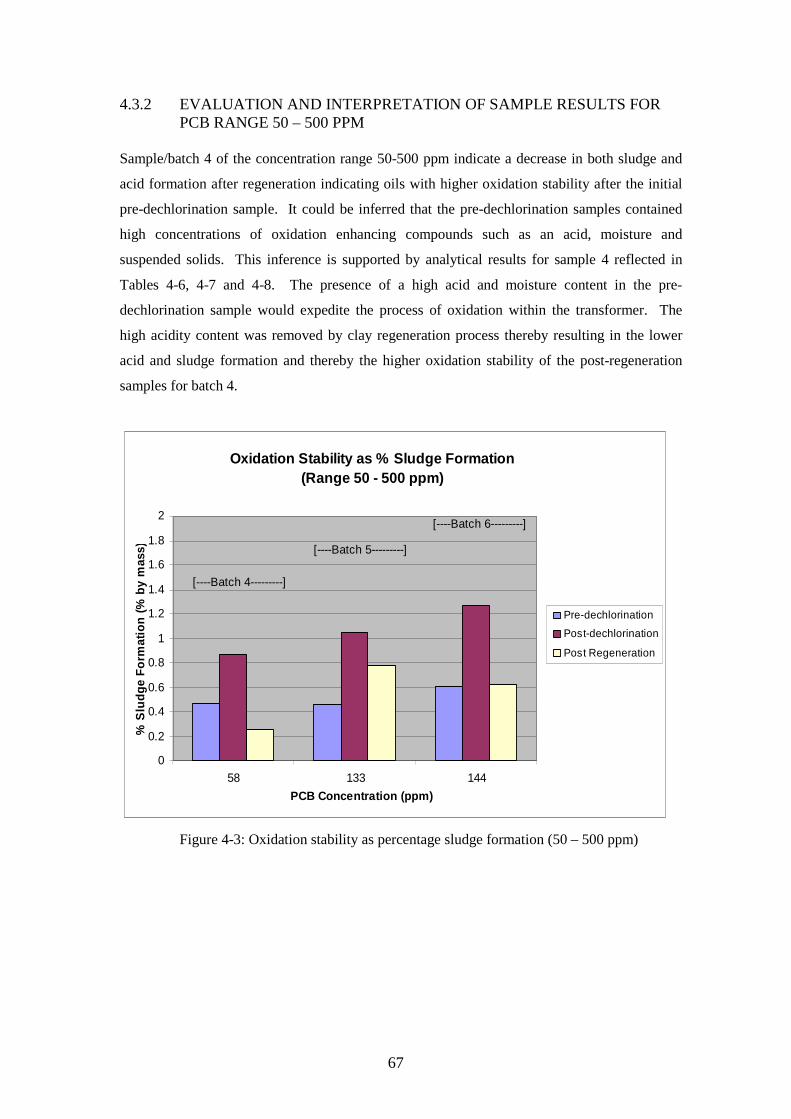
67
4.3.2 EVALUATION AND INTERPRETATION OF SAMPLE RESULTS FOR PCB RANGE 50 – 500 PPM
Sample/batch 4 of the concentration range 50-500 ppm indicate a decrease in both sludge and
acid formation after regeneration indicating oils with higher oxidation stability after the initial
pre-dechlorination sample. It could be inferred that the pre-dechlorination samples contained
high concentrations of oxidation enhancing compounds such as an acid, moisture and
suspended solids. This inference is supported by analytical results for sample 4 reflected in
Tables 4-6, 4-7 and 4-8. The presence of a high acid and moisture content in the pre-
dechlorination sample would expedite the process of oxidation within the transformer. The
high acidity content was removed by clay regeneration process thereby resulting in the lower
acid and sludge formation and thereby the higher oxidation stability of the post-regeneration
samples for batch 4.
Oxidation Stability as % Sludge Formation (Range 50 - 500 ppm)
0
0.2
0.4
0.6
0.8
1
1.2
1.4
1.6
1.8
2
58 133 144
PCB Concentration (ppm)
% S
lud
ge
Fo
rmat
ion
(%
by
mas
s)
Pre-dechlorination
Post-dechlorination
Post Regeneration
[----Batch 4---------]
[----Batch 5---------]
[----Batch 6---------]
Figure 4-3: Oxidation stability as percentage sludge formation (50 – 500 ppm)

68
Oxidation Stability as Acidity Content (Range 50 - 500 ppm)
0
0.2
0.4
0.6
0.8
1
1.2
1.4
1.6
1.8
2
58 133 144
PCB Concentration (ppm)
Aci
dity
(mg K
OH
/g)
Pre-dechlorination
Post-dechlorination
Post Regeneration
[----Batch 4--------]
[----Batch 5--------]
[----Batch 6-------]
Figure 4-4: Oxidation stability as ppm acidity formation (50 – 500 ppm)
Samples / batch 5 and 6 of PCB concentration range 50 – 500 ppm indicate an increase in both
the sludge and acidity of the post-dechlorination and post-regeneration samples relative to the
pre-dechlorination sample. Thereby indicating a lower oxidation stability and thereby a
lowered natural inhibitor content of the oil after dechlorination and regeneration relative to pre-
dechlorination. This could be assigned to the fact that both samples 5 & 6 underwent two
dechlorination cycles, resulting in addition of extra dechlorination reagent and longer reaction
or contact time and heat exposure. It is hypothesized that the additional dechlorination cycle
would have an increased negative impact on the natural inhibitor content of the oil. The results
of samples 5 & 6 therefore support the study hypothesis.
4.3.3 EVALUATION AND INTERPRETATION OF SAMPLE RESULTS FOR PCB RANGE >500 PPM
Batches 8 & 9 in the PCB range above 500 ppm indicate an increase in the post-dechlorination
and post-regeneration sludge and acidity content. The acidity content of batch 7 increases after
dechlorination and decreases to below the pre-dechlorination result obtained for the batch. This
could be an error in end-point determination as the acidity analysis is based on a neutralization
titration with visual end-point detection. Rendering this test method subjective, to a degree.
From the majority of the results obtained in the PCB range >500 ppm it can be inferred that the
natural inhibitor content of the oil is reduced through dechlorination. The regeneration process

69
generally removes the by-products of oxidation, from previous in-service oil ageing processes,
to restore most of the oil’s chemical and physical properties.
Oxidation Stability as % Sludge Formation (Range >500 ppm)
0
0.4
0.8
1.2
1.6
2
2.4
2.8
3.2
Post Regeneration
PCB Concentration (ppm)
% S
lud
ge
Fo
rmat
ion
(%
by
mas
s)
pre-dechlorination
post-dechlorination
post-regeneration
[----Batch 7---------]
[----Batch 8---------]
[----Batch 9---------]
Figure 4-5: Oxidation stability as percentage sludge formation (>500 ppm)
Oxidation Stability as Acidity Content (Range >500 ppm)
-0.2
0.2
0.6
1
1.4
1.8
2.2
2.6
3
3.4
631 837 1730
PCB Concentration (ppm)
Aci
dit
y (m
g K
OH
/g)
Pre-dechlorination
Post-dechlorination
Post Regeneration
[----Batch 7---------]
[----Batch 8--------]
[----Batch 9--------]
Figure 4-6: Oxidation stability as ppm of acidity formation (>500ppm)

70
4.3.4 PAH AND TOTAL SULPHUR PERCENTAGE RESULTS
The percentage total sulphur results in table 4-5 indicate a general reduction in sulphur content
after dechlorination and regeneration processes. The dechlorination process was found to
remove corrosive sulphur from the oil (Lewand, 2008). However, stable sulphur as those found
in sulphur based natural inhibitors can become reactive and ultimately corrosive with time and
through exposure to high temperatures (Lewand, 2002). Therefore it can be inferred that the
older more oxidized an oil is the more likely it is that its stable sulphur (natural inhibitor) will
become unstable and corrosive. This process would be further compounded if such oils
undergo dechlorination, if the study hypothesis is to be confirmed. The total sulphur content of
all the samples analysed indicate reductions after the dechlorination and regeneration processes.
However, Phalavanpour et al (1994) established that the Fullers’ earth regeneration process
does not remove the natural inhibitor in the oil. The further reduction in percentage total
sulphur after regeneration does therefore not correlate with the findings cited by Phalavanpour
et al. (1994). The results of the six samples analysed indicate an average further reduction of
13.8% in total sulphur content after regeneration, which is beyond the 10% deviation or
measurement tolerance. The author recommends that this be investigated in further detail
outside this study.
The PAH analyses were undertaken to establish whether an increase of this oil parameter would
be observed after dechlorination. Although very slight increases in PAH concentration were
observed in some cases, not much can be inferred from the results as these increases could be a
result of analytical instrument sensitivity. All the samples within the sample range conformed
to the SANS 555 specification of less than 3% PAH content.
4.4. TREND EVALUATION OF RESULTS ACROSS THE PCB TEST RANGE The variations in the effects discussed in subsections 4.3.1, 4.3.2 and 4.3.3 are partly due to
natural variability. Figure 4-7 indicates no significant variations in the initial acidity and sludge
formation of the pre-dechlorination samples.
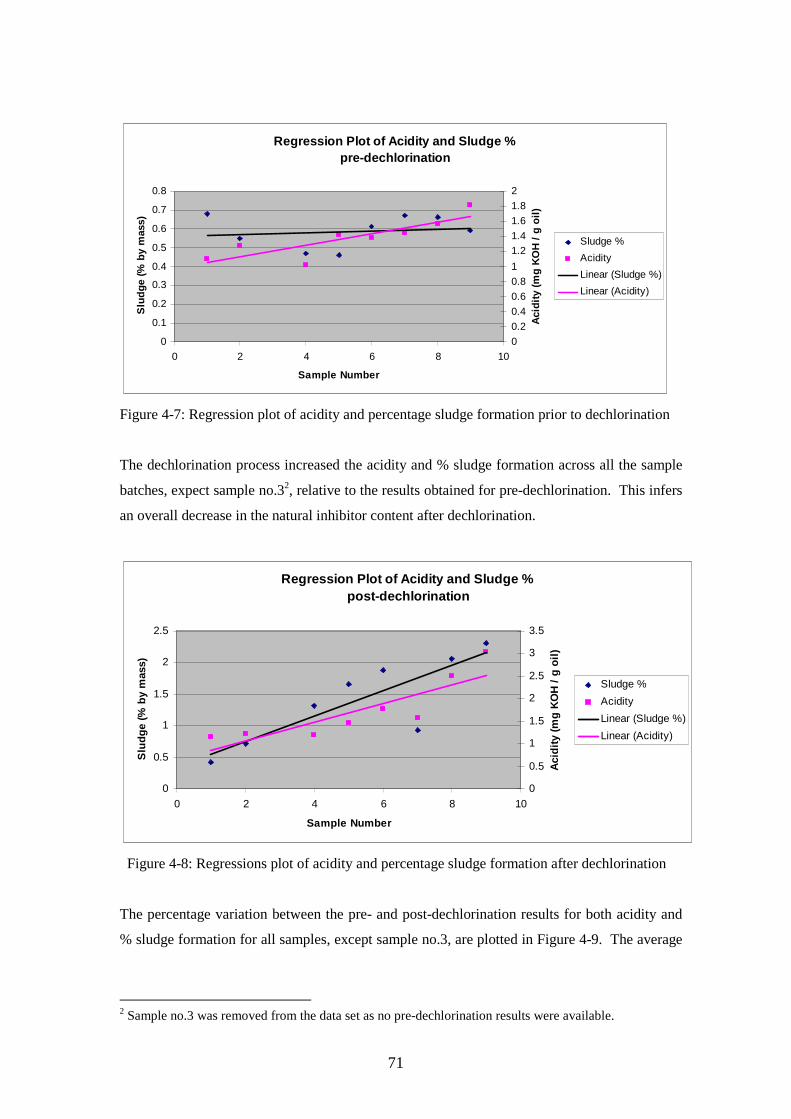
71
Regression Plot of Acidity and Sludge %pre-dechlorination
0
0.1
0.2
0.3
0.4
0.5
0.6
0.7
0.8
0 2 4 6 8 10
Sample Number
Slu
dg
e (%
by
mas
s)
0
0.2
0.4
0.6
0.8
1
1.2
1.4
1.6
1.8
2
Aci
dit
y (m
g K
OH
/ g
oil
)
Sludge %
Acidity
Linear (Sludge %)
Linear (Acidity)
Figure 4-7: Regression plot of acidity and percentage sludge formation prior to dechlorination
The dechlorination process increased the acidity and % sludge formation across all the sample
batches, expect sample no.32, relative to the results obtained for pre-dechlorination. This infers
an overall decrease in the natural inhibitor content after dechlorination.
Regression Plot of Acidity and Sludge %post-dechlorination
0
0.5
1
1.5
2
2.5
0 2 4 6 8 10
Sample Number
Slu
dg
e (%
by
mas
s)
0
0.5
1
1.5
2
2.5
3
3.5
Aci
dit
y (m
g K
OH
/ g
oil
)
Sludge %
Acidity
Linear (Sludge %)
Linear (Acidity)
Figure 4-8: Regressions plot of acidity and percentage sludge formation after dechlorination
The percentage variation between the pre- and post-dechlorination results for both acidity and
% sludge formation for all samples, except sample no.3, are plotted in Figure 4-9. The average
2 Sample no.3 was removed from the data set as no pre-dechlorination results were available.
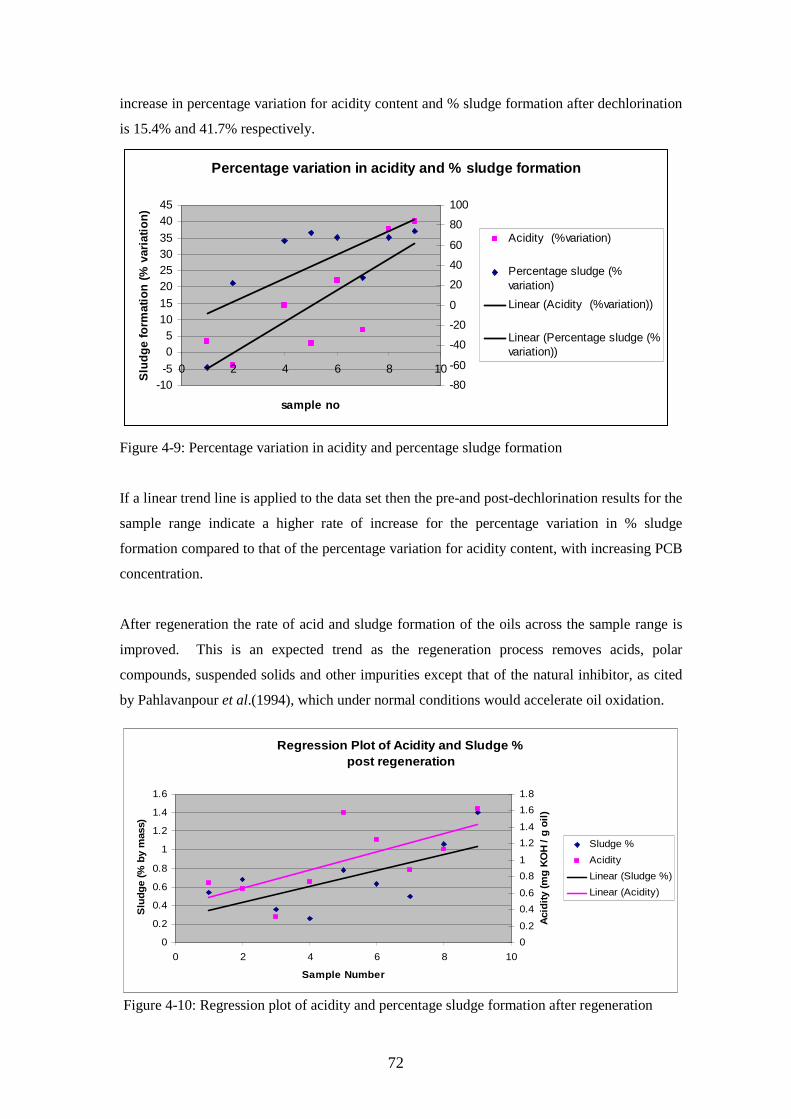
72
increase in percentage variation for acidity content and % sludge formation after dechlorination
is 15.4% and 41.7% respectively.
Percentage variation in acidity and % sludge formation
-10-5
05
1015
20253035
4045
0 2 4 6 8 10
sample no
Slu
dg
e fo
rmat
ion
(%
var
iati
on
)
-80
-60
-40
-20
0
20
40
60
80
100
Acidity (%variation)
Percentage sludge (%variation)
Linear (Acidity (%variation))
Linear (Percentage sludge (%variation))
Figure 4-9: Percentage variation in acidity and percentage sludge formation
If a linear trend line is applied to the data set then the pre-and post-dechlorination results for the
sample range indicate a higher rate of increase for the percentage variation in % sludge
formation compared to that of the percentage variation for acidity content, with increasing PCB
concentration.
After regeneration the rate of acid and sludge formation of the oils across the sample range is
improved. This is an expected trend as the regeneration process removes acids, polar
compounds, suspended solids and other impurities except that of the natural inhibitor, as cited
by Pahlavanpour et al.(1994), which under normal conditions would accelerate oil oxidation.
Regression Plot of Acidity and Sludge %post regeneration
0
0.2
0.4
0.6
0.8
1
1.2
1.4
1.6
0 2 4 6 8 10
Sample Number
Slu
dg
e (%
by
mas
s)
0
0.2
0.4
0.6
0.8
1
1.2
1.4
1.6
1.8
Aci
dit
y (m
g K
OH
/ g
oil
)
Sludge %
Acidity
Linear (Sludge %)
Linear (Acidity)
Figure 4-10: Regression plot of acidity and percentage sludge formation after regeneration

73
A review of the post-regeneration results of the various chemical analyses across the nine
sample ranges indicate that most of the samples conform to the specifications as listed in Table
2-2, allowing for re-use of the regenerated oil in electrical equipment provided all other
parameters in Table 2-2 are within the specified limits.
Samples 5, 6, 8 and 9 do not conform to the specification for oxidation stability, where samples
8 and 9 are in excess of the limit set for % sludge formation and samples 5, 6 and 9 are in
excess of the limit set for acidity content. The percentage PAH concentration of sample 9 is in
excess of the 3% limit and is therefore unsuitable for reuse in electrical equipment as cited in
the Eskom research report (Lombard, 1996).

74
Chapter Five
ALGORITHM APPLICATION
5.1 INTRODUCTION TO ALOGRITHM APPLICATION AND THE
APPLICATION OF NEURAL NETWORKS TO THIS STUDY
The actual / physical process of sodium based dechlorination, described in chapter 3, and the
164 hour oxidation test, as per American Standards Test Method (ASTM) D 21440, is
modelled in this chapter. In simpler terms, oil with known PCB concentrations were process
through a sodium dechlorinator. The recovered dechlorinated oil was then exposed to the
oxidation stability test which involved continuous exposure of the oil to oxygen and copper
for a period of 164 hrs at 120C0 as seen in Figure 5-1. This resulted in actual input/output
data that could be used in the modelling.
Input Process Outputs PCB Oil Sludge after Dechlorination
Sludge after Regeneration
Acidity after Dechlorination
Acidity after Regeneration
Figure 5-1: Dechlorination and 164 hr Oxidation Test
A sample of the data obtained during the experimental study was used as input and output to
establish the algorithm.
Dechlorination
164 hr Oxidation Test

75
The preliminary model established could be utilised as a means of establishing / predicting
the effect of the sodium dechlorination process on the oxidation stability (as percentage
sludge and ppm acid formation) of the oil without physically having to process the oil through
the sodium dechlorinator and subsequently undertaking the 164 hour oxidation stability test.
The training data is seen in Tables 5-1 and 5-2.
Table 5-1: Sample of percentage sludge formation Input and output data (Training Data)
Input Outputs
PCB-Concentration Prior to
Dechlorination (ppm)
Post-Dechlorination
Sludge (% by mass)
After Regeneration
Sludge (% by mass)
12 0.42 0.54
28 0.71 0.68
58 1.31 0.26
133 1.65 0.78
144 1.87 0.63
631 0.92 0.5
837 2.06 1.06
1730 2.3 1.4
Table 5-2: Sample of acidity concentration input and output data (Training Data)
Input Outputs
PCB Concentration Prior to
Dechlorination (ppm)
Post-Dechlorination
Acidity (mg KOH/g)
After Regeneration
Acidity (mg KOH/g)
12 1.14 0.72
28 1.23 0.65
58 1.19 0.74
133 1.46 1.58
144 1.77 1.25
631 1.56 0.88
837 2.5 1.13
1730 3.02 1.62
A single neural network was developed using the training data in Tables 5-1 and 5-2. It was
developed using a software application called Matrix Laboratory (Matlab) together with an
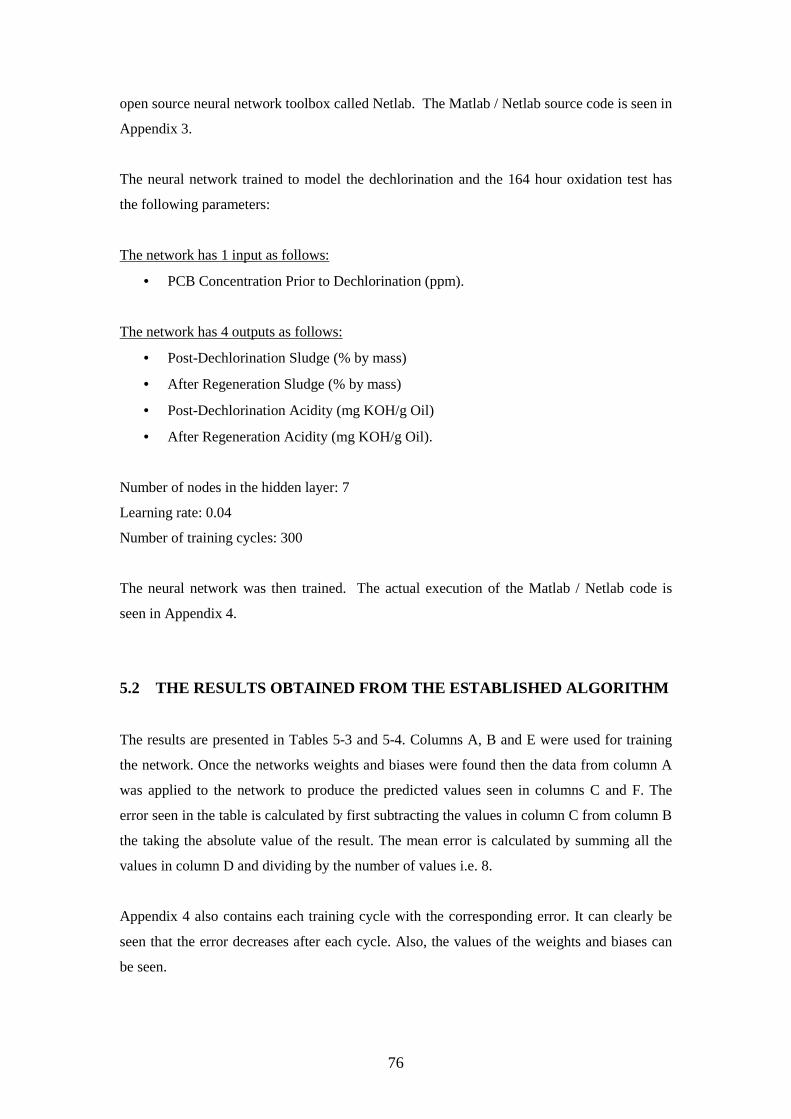
76
open source neural network toolbox called Netlab. The Matlab / Netlab source code is seen in
Appendix 3.
The neural network trained to model the dechlorination and the 164 hour oxidation test has
the following parameters:
The network has 1 input as follows:
• PCB Concentration Prior to Dechlorination (ppm).
The network has 4 outputs as follows:
• Post-Dechlorination Sludge (% by mass)
• After Regeneration Sludge (% by mass)
• Post-Dechlorination Acidity (mg KOH/g Oil)
• After Regeneration Acidity (mg KOH/g Oil).
Number of nodes in the hidden layer: 7
Learning rate: 0.04
Number of training cycles: 300
The neural network was then trained. The actual execution of the Matlab / Netlab code is
seen in Appendix 4.
5.2 THE RESULTS OBTAINED FROM THE ESTABLISHED ALGORITHM
The results are presented in Tables 5-3 and 5-4. Columns A, B and E were used for training
the network. Once the networks weights and biases were found then the data from column A
was applied to the network to produce the predicted values seen in columns C and F. The
error seen in the table is calculated by first subtracting the values in column C from column B
the taking the absolute value of the result. The mean error is calculated by summing all the
values in column D and dividing by the number of values i.e. 8.
Appendix 4 also contains each training cycle with the corresponding error. It can clearly be
seen that the error decreases after each cycle. Also, the values of the weights and biases can
be seen.

77
Table 5-3: Model 1 - Oxidation Stability as percentage Sludge Formation A B C D E F G
PCB Conc Prior to Dechlorination (ppm)
Post-Dechlorination Sludge (% by mass)
Model Prediction
Sludge (% by mass)
Error = abs(B-C)
After Regeneration Sludge (% by mass)
Model Prediction
Sludge (% by mass)
Error = abs(E-F)
12 0.42 0.409474356 0.010525644 0.54 0.553977245 0.013977245 28 0.71 0.726894987 0.016894987 0.68 0.640781689 0.039218311 58 1.31 1.301561125 0.008438875 0.26 0.308562488 0.048562488 133 1.65 1.75639938 0.10639938 0.78 0.679951946 0.100048054 144 1.87 1.750825551 0.119174449 0.63 0.700828931 0.070828931 631 0.92 0.999237454 0.079237454 0.5 0.508388882 0.008388882 837 2.06 1.925200556 0.134799444 1.06 1.090342655 0.030342655 1730 2.3 2.365877746 0.065877746 1.4 1.365723209 0.034276791
Mean Error = ΣD ÷ 8 = 0.067668498 Mean Error 0.043205419
Table 5-4: Model 2 - Oxidation Stability as Percentage Acidity Content
PCB Conc Prior to Dechlorination (ppm)
Post-Dechlorination Acidity (mgKOH/g)
Model Prediction Acidity
Error = abs(B-C)
After Regeneration Acidity
(mgKOH/g)
Model Prediction Acidity
Error = abs(E-F)
12 1.14 1.149813928 0.009813928 0.72 0.656110793 0.063889207 28 1.23 1.17099305 0.05900695 0.65 0.680084724 0.030084724 58 1.19 1.242088617 0.052088617 0.74 0.802027558 0.062027558 133 1.46 1.601969252 0.141969252 1.58 1.38803475 0.19196525 144 1.77 1.609728511 0.160271489 1.25 1.408202822 0.158202822 631 1.56 1.648541959 0.088541959 0.88 0.852796589 0.027203411 837 2.5 2.3842175 0.1157825 1.13 1.216687915 0.086687915 1730 3.02 3.058326559 0.038326559 1.62 1.563173961 0.056826039
Mean Error = ΣD ÷ 8 = 0.083225157 Mean Error 0.084610866
78
Chapter Six
CONCLUSIONS & RECOMMENDATIONS
Nine batches of PCB contaminated mineral oil; three within each of the ranges identified in
Table 3-1 were processed using a sodium dechlorination technology. Each batch consisted of 3
samples representing a prior to dechlorination sample, after dechlorination sample and an after
regeneration sample.
Based on the results obtained from the experimental tests performed during this study, it can be
concluded that the sodium dechlorination process negatively affects the natural inhibitor
content of the uninhibited naphthenic based mineral oil.
The degree of reduction in natural inhibitor content appears to be negligible at PCB
concentrations below 200 ppm. Post-regeneration samples 5 and 6 did not meet the
requirements for oxidation stability test ito acidity content. Post-regeneration samples 1,2,3,4
and 7 conformed to the SANS 555 specification for the parameters measured, allowing for
reuse of this oil within transformers3. The study did not included samples with PCB
concentrations between 200 – 600 ppm, however the establish algorithm can be used to predict
the effect of dechlorination on PCB concentrations falling within this region.
The natural inhibitor was greatly reduced in the PCB concentration range >500ppm. This could
be assigned to the fact that the contaminated oil in this range endured 3 to 4 cycles of
dechlorination prior to reaching the desired PCB concentration of below 2 ppm. Samples from
batches 8 & 9 did not conform to the SANS 555 specification for after dechlorination and
subsequent regeneration.
3 Provided the oils conform to the specifications for all the other parameters set out in SANS555 but not measured during this study.
79
Most of the Eskom uninhibited PCB contaminated mineral oils currently contained in
equipment have been in use for a number of year and their natural inhibitors will have already
been reduced. Based on the findings of this study it can be concluded, that for uninhibited PCB
contaminated oil above 100 ppm, the natural inhibitor of the oil may not be at a level that would
allow for its reuse in transformers. The degree of uncertainty of this conclusion is significantly
decreased for uninhibited PCB contaminated oil in the >500 ppm range.
The results obtained from the oxidation stability analyses confirms the author’s hypothesis that
the dechlorination process removes natural inhibitors such as stable and very stable sulphur
(thiophenes) from the oil thus the reduction in oxidation stability observed in the after
dechlorination samples of across most of the batches. Possible explanations for this occurrence
could be the molecular changes brought about by the introduction of an alkali or alkali earth
metal to replace the chlorine atom on the PCB molecule. This causes breaking of the stronger
carbon-chlorine bond and at the constant high temperature and pressure at which the
dechlorination unit operates, it is hypothesized that some carbon-sulphur bonds may also be
compromised during the process, thereby exposing what used to be very stable sulphur and
either removing them or rendering them reactive or corrosive.
In order for the neural network to more accurately model the specified process, it is
recommended that more training data be used. Again this is data from the actual process.
Commercial off the shelf neural software will also provide better results than the open source
Netlab that was used. Also, the data that was used to train the neural network was also used to
test it. Using another data set to test the network will provide insight into the true capabilities of
the network. The author therefore recommends that the preliminary algorithm established
during this study be optimised through additional experimental studies, prior to implementation
thereof within Eskom.

80
REFERENCES
Agency for Toxic Substance and Disease Registry (ATSDR). 2001. Polychlorinated
Biphenyls. [Online]. Available. http://www.atsdr.cdc.gov/tfacts17.pdf [3 December 2009].
Alexander, D.E & Fairbridge, R.W. (eds). 1999. Polychlorinated Biphenyls (PCBs).
Encyclopaedia of Environmental Sciences, 1: p 490 – 491.
Basel Convention. 1998. Basel Convention on the Transboundary Movement of Hazardous
Waste and Their Disposal. [Online]. Available. http://www.basel.int/text/documents.html
19 February 2011].
Basel Convention. 2003. PCB, PCT and PBB technical guidelines. 4th draft. Environment
Canada Toxics Pollution Prevention Directorate.
CMPS&F – Environmental Australia. 1997. Appropriate Technologies for the Treatment of
Scheduled Wastes, Review Report Number 4. [Online]. Available.
http://www.environment.gov.au/settlements/publications/chemicals/scheduled-
waste/swtt/technologies.html [9 January 2009].
Dalton, T.H. 2008. Mineral insulating oils (uninhibited and inhibited) Part 1: Purchase,
Management, Maintenance and Testing. Eskom Specification 32-406.
Erickson, M.D. 1997. Analytical Chemistry of PCBs. 2nd Edition, Lewis Publishers. Florida.
Eskom Holdings Limited. 2009. Annual Report 2009. [Online]. Available. at
http://www.eskom.co.za/annreport09/ar_2009/info_sheets/pricing_03.htm [03 December 2009].
Eskom Technology Group. 1996. Poly Aromatic Hydrocarbon Content in Transformer
Oil. TRR/S96/212. Lombard, A.E
Eskom Research, Development & Demonstration Department. 2000., Polynuclear Aromatic
Hydrocarbons in Transformer Oil. RES/FR/.00/11595. Lombard, A.E.
Eskom Research, Development & Demonstration. 2001. Polychlorinated Biphenyl
Decontamination Processes. RES/SC/01/14834. Nassiep, S.
81
Eskom Research, Development & Demonstration. 2005. Polychlorinated Biphenyl
Dechlorination Technologies – Market Survey., RES/RR/05/27309. Nassiep, S.
Hagan, M.T. & Demuth, H.B. 1999. Neural Networks for Control. Sch. of Electr. & Comput.
Eng., Oklahoma State University. [Online]. Available.
http://hagan.okstate.edu/hagandemuthacc99.pdf [26 January 2010].
Hagan, M.T., Demuth, H.B & Meale, M. 1996. Neural Network Design. PWS Publishing
Company. Boston.
Health and Safety Executive (HSE) Publications. 2009. Do you know how to work safely with
PCBs?. PCBs and You. [Online]. Available. http://www.hse.gov.uk/pubns/msa19.htm. [19
February 2011].
Hindoc MSA. 2001. Scoping Report for the Thermal Treatment of Hazardous Waste. Prepared
for Thermopower Process Technologies (Pty) Ltd. p. 13-15.
Huang, H., Kobayashi, N., Hasatani, M., Matsuyama, K. & Sasaki, T. 2007. Reaction kinetics
analysis of the dechlorination process of PCBs by sodium dispersion process. Chemical
Engineering Science, 62: p 5144 – 5149.
Jordan, O.D.1982. System and apparatus for the continuous destruction and removal of
Polychlorinated Biphneyls from fluids. Patent number 4340471. [Online]. Available.
http://www.freepatentsonline.com/4340471.html [17 September 2008].
Levenspiel, O. 1999. Chemical Reaction Engineering. 3rd Edition. Wiley Publishers. New
York, p 566–586.
Lewand, L.R. 2002. The Role of Corrosive Sulfur in Transformers and Transformer Oil.
Proceedings of the 69thAnnual International Conference of Doble Clients, Boston, MA.
Lewand, L.R. 2008. Destruction of Dibenzyl Disulfide in Transformer Oil. Proceedings of the
75th Annual Conference of Doble Clients, Boston, MA.
Lobeiras, A. Sabau, J. 2001. Counting and Particles in Insulating Mineral Oils. 6th World
Congress of Chemical Engineering, Melbourne, 23 -27 September 2001.
Meshkatoddini, M.R.2008. Aging Study and Lifetime Estimation of Transformer Mineral Oil,

82
American Journal of Engineering and Applied Sciences, 1(4): p 384-388.
NYNAS.2001. Base oil handbook. Nynäs Naphthenics AB. p.13-39.
Newcomer, A., Blumsack, S,A., Apt, J., Lave, L.B. & Morgan, M.G. 2008. Short Run Effects
of a Price on Carbon Dioxide Emissions from U.S. Electric Generators. Journal of
Environment, Science & Technology, 42 (9). p 3139–3144.
Obaid, M.F., Samuel K., Smith-Simon C., & De Rosa C.T. 2003. Polychlorinated Biphenyls:
human health aspects. World Health Organization.
Pahlavanpour, B., Myers, D., & McManamon, K. 1992. Evaluation of oil quality after
chemical destruction of PCB's in transformers. Proceedings of 6th International Conference
on Dielectric Materials, Measurements and Application, Manchester, 7 – 10 September
2002.,p 264-266.
Pahlavanpour, B. & Lindell, M. 1994. Transformer life extension by in-situ oil reclamation.
Proceedings of the 4th International Conference on Properties and Applications of Dielectric
Materials. Brisbane. 3-8 July. p 841 – 845.
Parker, D.K. & Steichen,R.J. Process for the removal of low level (ppm) halogenated
contaminants. Patent number 4284516. [Online]. Available.
http://www.freepatentsonline.com/4284516.html [17 September 2008].
Pfafflin, J.R. & Ziegler, E.N. (eds.). 2006. PCBs and Associated Aromatics. Encyclopedia of
Environmental Science and Engineering, Fifth Edition, 1 & 2: p 845 – 955.
Rahuman, M.S.M., Pistone, L., Trifirò, F. & Miertus, S. 2000. Destruction Technologies for
Polychlorinated Biphenyls (PCBs). Proceedings of Expert Group Meetings on POPs and
Pesticides Contamination, United Nations Industrial Development Organization (ICS-
UNIDO).
Sanders, G., Jones, K.C., Hamilton-Taylor. & Doerr, H. 1992. Historical inputs of
polychlorinated biphenyls and other Organochlorines to a dated Lacustrine sediment core in
rural England. Journal of Environmental Science & Technology, 26 (9): p 1815–1821.
Sittig, M. 1981. Handbook of Toxic and Hazardous Chemicals. Noyes Publications. New

83
Jersey.
SOUTH AFRICA. Department of Environmental Affairs. 2010. Air quality and health: areas of
most impact - State of the Environment. [Online]. Available
http://soer.deat.gov.za/themes.aspx?m=385 [16 January 2010].
SOUTH AFRICA. 1996. Constitution of the Republic of South Africa Act. No 108 of 1996.
Pretoria. Government Gazette. [Laws.]
SOUTH AFRICA. 1989. Environmental Conservation Act, No 73 of 1989. Pretoria.
Government Gazette. [Laws.].
SOUTH AFRICA. 1973. Hazardous Substances Act. No 15 of 1973. Pretoria. Government
Gazette. [Laws.]
SOUTH AFRICA. 1998. National Environmental Management Act, No 107 of 1998. Pretoria.
Government Gazette. [Laws.].
SOUTH AFRICA. 2004. National Environmental Management Act: Air Quality Act, No 39 of
2004. Pretoria. Government Gazette. [Laws.]
SOUTH AFRICA. 1996. National Road Traffic Act. No 93 of 1996. Pretoria. Government
Gazette. [Laws.]
SOUTH AFRICA. 1998. National Water Act, No 36 of 1998. Pretoria. Government Gazette.
[Laws.]
SOUTH AFRICA. Department of Water Affairs and Forestry. 1998. Minimum Requirements
for the Handling, Classification and Disposal of Hazardous Waste. [Online]. Available.
www.dwaf.gov.za/Dir_WQM/docs/Pol_Hazardous.pdf [24/07/2009].
SOUTH AFRICA. 1993. Occupational Health & Safety Act, No 85 of 1993. Pretoria.
Government Gazette. [Laws.]
South African Bureau of Standards. 2007. National Standard for unused and reclaimed mineral
insulating oils for transformers and switchgear. SANS 555. Revision 5. [Online].

84
Available. https://www.sabs.co.za/index.php?page=standards [20 August 2009].
Stockholm Convention. 2001. Stockholm Convention on Persistent Organic Pollutants,
[Online]. Available. http://chm.pops.int/Convention/tabid/54/Language/en-
US/Default.aspx#convtext. [16 April 2008]
United Nations Environment Programme. 1999. Guideline for the Identification of PCBs and
Materials Containing PCBs. [Online]. Available.
http://www.chem.unep.ch/pops/pdf/PCBident/pcbid1.pdf. [25 March 2009]
United States Environmental Protection Agency (EPA). . Polychlorinated Biphenyls (PCBs)
Basic Information. [Online]. Available.
http://www.epa.gov/waste/hazard/tsd/pcbs/pubs/about.htm [10 April 2008].
United Nations Environmental Programme – Chemicals. 2002. Survey of Currently Available
Non-Incineration PCB Destruction Technologies. Inter-Organization Programme for the Sound
Management of Chemicals (IOMC). August 2002.
United Nations Environment Programme. 2006. Status of ratification of the Stockholm
Convention. [Online]. Available.
http://www.pops.int/documents/meetings/cop_2/meetingdocs/270406/K0651271%20COP2-
INF14.pdf . [16 January 2010].
United Nations Environmental Programme. 1998. Inventory of World-wide PCB Destruction
Capacity. First Issue. The Inter-Organization Programme for the Sound Management of
Chemicals, First Issue, p10-14.
Webber,I. 2006.PCBs and Associated Aromatics. Encyclopedia of Environmental Science and
Engineering, 5 (2): p 845-955.
World Health Organization. 2003. Polychlorinated Biphenyls: Human Health Aspects.
[Online]. Available http://www.who.int/ipcs/publications/cicad/en/cicad55.pdf [3 December
2009].

85
APPENDICES

86
APPENDIX 1
MATERIALS SAFETY DATA SHEET FOR PCBS IN OIL
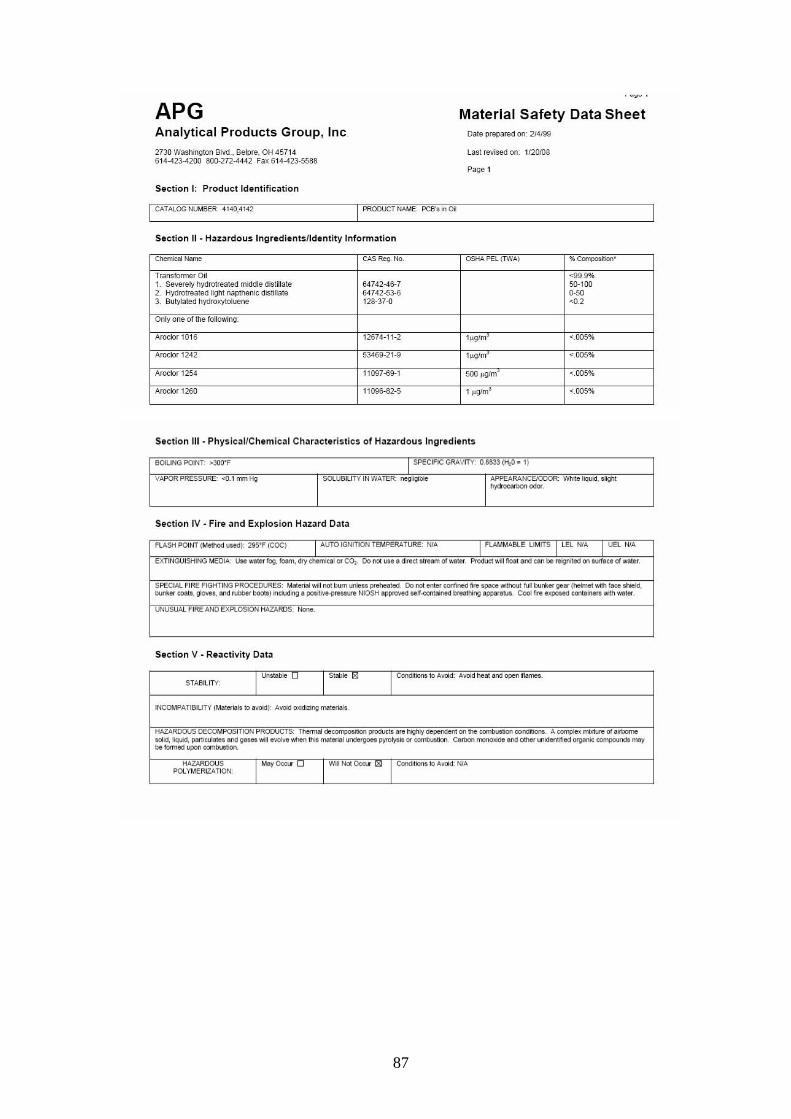
87
APG Material Safety Data Sheet Analyti ca l Products Group, Inc
2130 Washingtoo BMI .. Belpre. OH 45114 614-423-4200 800-212-4442 Fax 614-423-5588
Section I: Product Ident ilic~t ion
I PRDOUCT NAME PCB~ in Oil
Section II - H3ZOlrdous Ingredientslldentily InformOllion
ChemaliHame CAS Reg. No
T",,,,,1omIer rn , Severe", h)'<lrotmated m~e dis:il late 64142-46-1 2. Hydrolreated light napt""";c d;s~l!ate 64142-53-6 3. BYt)l1'l1ed hydroxylolueoe 128-37-0
0r0IV 0'"' of !!Ie followio!l
" rodor 1016 12674 -11 -2
Arodor 1242 53469-21-9
Arodor 12S4 1109H9--1
" rodor 1260 11096-a2-5
Oale prep,,,e d on : 214199
Las! ",,/Ose<! on 1120108
OSHA. PEL (TWA)
1"OJ/m
lltOJ/m
5OO"OJ/m
l"lOIm
Stellan III • Physlc3I1Ch.m lc:.1 Ch:lr3ct.rlst les 01 Hazardous Ingr.dl.nls
6OII.ING pomT .300'f
V"-POR PREsstJR!;: 41.1 Im'I Hg I SOlUBILrfYlNWAffR
I~oc~ ---
Section IV - Fire ;lnd Explos ion HOlzOlrd DOlt"
%~.
<99.9% 50-100
" ~ <0.2
<.005%
<.005%
<.005%
<.005%
flASH POINT I"""""' ....... ~ 29S'f (COC) j ~UTOlGNll1ONTEMPEftt,T\.IftE: NI~ j f1.AMM,O,f!lE LIMITS j lEl NI~ j iJEl NI~
EXTlf.lGUlSliING MEOlA. lIM _10<0, --., <tycl"oem<tllo<co,. Dono(",. dore<Ionomol_ Pro<lI<IIOiI _ .... .,.. be ~ "" ...... "". 01_
SPECIAl. FIRE FIGHTIf.IG PROCfOURES; Mo(orioIwiI no( bum..-......... ted Dono(_~," OC>II<O ~ lUI ""'or9N'V,,",,",wilhl __ • II<ri.et <>*&. gICPvea. oncI ..-_I 0>cIucWI; • ~e NIOSH ~ oel!_ blOIl!\In; __ CoQj"," .>tpOOO<I_ wtIII_
UNUSUAl FIRf 4NO EXPlOSlON~; _
Section V - Re3C!i vi!y D3!3
STA61l1TY I ~ U 1'- " I CondItiono Io~I'Oid : ~l'Oidhe"oncIopon ~ames
I NCOMI'~TIeIUTV IM>_. Io....,;d~ Avoidoxi<liUog~
H./IZAROOVS OCCOMPOSITION PROOI)CTS: 'IhornIW ~ pro<kJc!s .... "'ItY ~ on !he <mb.nIion ~ ... """l'I"" mi-. '" oirt>orno ooIicI, IiQuocI,~oncI_IOiI _""""tI1it __ oIlM'1<1e1gon~0<~1ion , C"""'lI'lCIf'IO>IGeonclotllel~iedorvnc~1IWY be_upon","""""",
~ I "'~· U I W~ ~ 0tQlI' ~ I ContIolionI Io Avoid: HI. POl YMERIZAnott
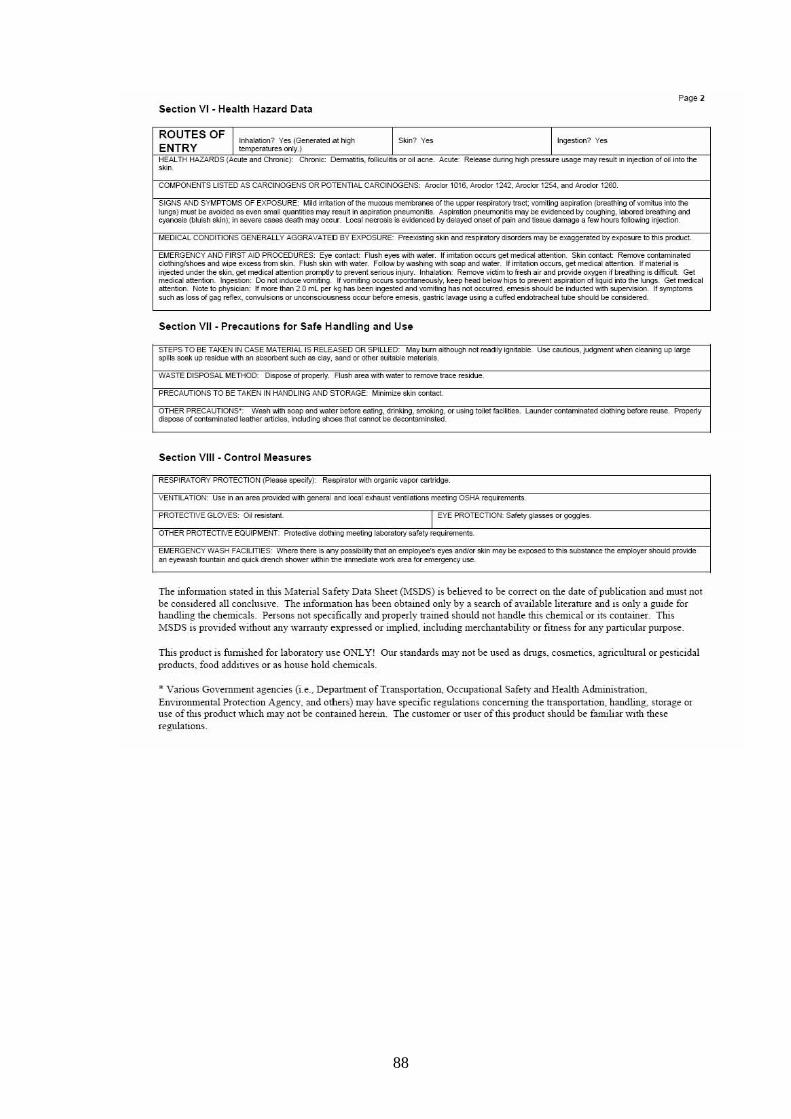
88
Section VI - Heal!h HOlzOlrd O;l!Ol
ROUTES OF 1_' Yes(Geoora\e<l" hi>:lh
ENTRY _"'on/v.) 1-' '" I ....... stioo' Y ..
HEAlTH HAZARDS (ACUIe and Olrono:) CI"roni<: o.rn-, 1oI 'cu' .... '" oj ""'" AruIe: ReIeaoe ~ hi>:lh ~ ""'II" mil)' resoI! n irfe<Iioo of oj no ".,. -CCf.!I'Ot>ENTSUSTED ASCARC lr.IOGENS OR POTENTIAl CARClfIOGENS: hod", 1016. Aroclor 12.2, Al<><1or 12501, _ _ 1260
SIGNS AND SYMPTOMS OF EXPOSURE : ""'" nu"" of Ihe """"",......u.n.. of Ihe o.we< reopntoty 1nICI; VOO'I!irog _ (br~ of I<>mtus _Ihe hng» ....... be . _ as.,.,..., omoI ~ may leoti! in ~ ~ .... Aspimioo pneumooiIis may be evidM<ed by C<JU,lhing, _ tn.".,.,. and eyan<>o4 (l>IuioI1 Wo); in ..,.,...., ones de"'" mil)' DeCU. Local ne<rosis is _ by de'.oyed oooe1 of pM> and Ii>we <Iomoge • row oo.n !oiIowW>:l ir;edioo.
MErnCAJ. COtlDmOtlS GEtiERAlL Y AGGRAVATeD BY EXPOSURE: ~ """' _ ~-... Ihorders mil)' be ~ by e,.,.,....., to !his prOOJcl
EMERGEOCY AND FIRST /liD PROC EDURES: E.,., oon\ad Fk>sII.,.,.,. _ wa'" ~ ir<it:>tion ocan ~ me<IicaI _ . SUI COOIact ~-<~andwi;>e",<=s!romWo. flush"'"'w.", ..... "'. Followby-......_soop _ _ . NmtoIiooocun, 'l'OImedicai anetttioo. K ma'<fi8 io
irjected under ".,. ","" 'l'OI medicai .."..-, prOll"¢y to _ setious ...-v -.roo: Re<roYe l"i<!imto ~"" _and proWIe o",,",",, ~bre~ is dtrocu1l ~
medicai ""_. IngesIion Do "'" inWco VOO'I!irog. ~ VOO'I!irog ocan~, i.ee!> _ beiow hipo to pr""",,, _ of liquid into "'" UVo. Go< medicai ""_. ~tol*lY>i<"'>: Worore ...... 2.0mL po< 1<\1_ '-'~ _-minIl ...... ""'oc<....-ed. erneoio _ be indu<t<Od_~. N.)'IIVtomI ""'" as _ of gag ref.e.<, ~ Of ~ oceur before erneoio. \jOSIJi.< 1al'O<}O usng. cu!ed 0fld0<nteheaI b.t>e _ be cono4de<ed
Section VII - Prec;lu! ions fo r SOlfe HOlndling Ol nd Use
STEPS TO BE TAAEN IN CASE 1M TeRlAl tS RELEASED OR SP1 LLED: May bum a:~ noI feO<t.'y ~. ......,..-....~I<hn~up~ ",:isoool; up _>OiItI..,_oucI1 .. day, ....-.d", __ moteooI.
WASTE DISPOSAl METHOO: I>ioposoe of propeIIv flush...-eo __ to """"'" nee """""'.
PRECAlITlONS TO BE TAKEN IN HAIlDlJfIG AND STORA.GE: Minimize"'in <OO!ad.
OTH ER PRECAl1TlOtlS': WosI1 """ ooop _ .... '" beI<Jre e ...... , _inII. otr<>I<ing. Of ........... _ Ie> laundef ~ cIo<tlir>:l before reuse -diopooe of «>nIOminoled -... _ . nclu<lio-g.roe. """ carnJt be~.
Section VIII - Conn o l MeOlsures
RESf'IR>.TORY PROTECn ON (Please opeciI';): R~_ Ofgoni<:vapor~
VH ITILATION: ......, in an ..... pro-OOed ___ _ local e-... vemlOliooo ~inII OSHA requir<metlts
PROTeCTIVE GLOVES: OiI.--....o. EYE PROTECTION: Sarely g'.asoes '" 1P"oI9leo.
OTHER PROTECTIVE EOUIPII.ENT: ~ ckMh'fl\l ~inII Iabomory"'elyrequir<metlts
EMERGENCY WASH FACtLITI ES: Whole ~ is ""'I ~ _ ... ~' • .,.,.,. aOO'Of """' may be expose<! to thio ~ Ihe ~ _ proWIe ... .,.,.,...ash _ _ qui<~ __ withinlhe __ ,. _""'. ror""""l/OflCY .......
Th~ mfonnation ".t~d in this Matenal Saf.l)-· Data Sh •• t (MSDS)" bdi."r-d to ~ correct onth. date o f publication and mus t not be con,idrrr-d all conelu",', . Th~ information has bern obtain.d only by a ",arch of anibbl. lit. um" and i, only a guide for handling th. chrnticals. Puson, not ,~cific ally and properly trained should not handl. !his chemical or '" cOnlati .. " Thi, MSDS i, pro\·,d.d without any warranty ~xpr~,,~d or implir-d. ineluding merchantabihl)-' or fim .. , for any parllcular pmpo"'.
This producT" fumi,h~d for labontof)' u.~ ONLY' Our "andard, may not be u,~d as drugs. cosm.tics. agricultural or pesticidal producTS, food add"i" ... or as hous~ hold eh.nunk
• Variou, Go,'rrrunenl .genci~, (i.~ . , D. p.rrm.ut of Tr.nspon.tlon. Occupation.1 Saf. l)-· and Health AdlllullSlration. Ennronm~nlal Protection Ag~1lCy. and oTh.",) may Iia," specific regulation> concerning th. tr. nspon. tlon. h. udling, Morag~ or use of lhi, prodUCT which lIlay not ~ cOnlain~d h~rrm Th~ customer or us~r of thi, prodUCT should be falluliar with th.", r~gulations.
89
APPENDIX 2
STOCKHOLM CONVENTION ON PERSISTENT ORANGIC
POLLUTANTS – ANNEX A, PART II
90
Part11
Polychlorinated Biphenyls Each party shall: (a) With regard to the elimination of the use of polychlorinated biphenyls in equipment
(e.g. transformers, capacitors or other receptacles containing liquid stocks) by 2025, subject to review by the Conference of the Parties, take action in accordance with the following priorities:
(1) Make determined efforts to identify, label and remove from use equipment
containing greater than 10 per cent polychlorinated biphenyls and volumes greater than 5 litres;
(2) Make determined efforts to identify, label and remove from use equipment
containing greater than 0.05 per cent polychlorinated biphenyls and greater volumes than 5 litres;
(3) Endeavour to identify and remove use equipment containing greater than
0.005 percent polychlorinated biphenyls and volume greater than 0.05 litres;
(b) Consistent with the priorities in subparagraph (a), promote the following measures
to reduce exposures and risks to control the use of polychlorinated biphenyls: (1) Use only in intact and non-leaking equipment and only in areas where the risk from environmental release can be minimised and quickly remedied;
(2) Not use in equipment in areas associated with the production or processing of food or feed;
(3) When used in populated areas, including schools and hospitals, all
reasonable measures to protect from electrical failure which could result in a fire, and regular inspection of equipment for leaks;
(c)Notwithstanding paragraph 2 of Article 3, ensure that equipment containing
polychlorinated biphenyls, as described in subparagraph (a), shall not be exported or imported except for the purpose of environmentally sound waste management;
(d) Except for maintenance and servicing operations, not allow recovery for the
purpose of reuse in other equipment of liquids with polychlorinated biphenyls content above 0.005 per cent;

91
(e) Make determined efforts designed to lead to environmentally sound waste management of liquids containing polychlorinated biphenyls and equipment contaminated with polychlorinated biphenyls having polychlorinated biphenyls content above 0.005 per cent, in accordance with paragraph 1 of Article 6, as soon as possible, but no later than 2028, subject to review by the Conference of Parties;
(f) In lieu of note (ii) in Part 1 of this Annex, endeavour to identify other articles
containing more than 0.005 per cent polychlorinated biphenyls (e.g. cable-sheaths, cured caulk and painted objects) and manage them in accordance with paragraph 1 of Article 6;
(g) Provide a report every five years on progress in eliminating polychlorinated
biphenyls and submit it to the Conference of the Parties pursuant to Article 15;
(h) The reports described in subparagraph (g) shall, as appropriate, be considered by the Conference of the Parties in its reviews to Polychlorinated biphenyls. The Conference of the Parties shall review progress towards elimination of Polychlorinated biphenyls at five year intervals or other period, as appropriate, taking into account such reports.

92
APPENDIX 3
THE ACTUAL EXECUTION OF THE MATLAB / NETLAB CODE
USED FOR THE DEVELOPMENT OF THE NEURAL NETWORK

93
MATLAB/NETLAB SOURCE CODE FOR TRAINING AND TESTING THE
NEURAL NETWORK MODELS OF THE PROCESS OF DECHLORINATION
AND THE 164 HOUR OXIDATION TEST
A.3.1 MAIN PROGRAM FOR TRAINING AND TESTING THE NEURAL NETWORK
Below is the source code for training and testing the neural network. However this code uses
various other script type functions seen in subsequent sections of this appendix.
% Training and Testing a multilayer perceptron neura l network % that models a process of Dechlorination followed b y a 164 % hour oxidation test % % Description % The problem consists of building a neural network with 1 input % x (PCB Conc Prior to Dechlorination (ppm)) and 4 o utputs t % (Post-Dechlorination Sludge (% by mass)) % (After Regeneration Sludge (% by mass)) % (Post-Dechlorination Acidity (mgKOH/g)) % (After Regeneration Acidity (mgKOH/g)) % See also MLP, NETOPT, MLPFWD % % Copyright (c) (2010) %________________________Initialise Program_________ _____________% clear % Clear memory c lc % Clear the Matlab command window f ormat long % Increase the number of decimal positions % for more precision %_____Load Data from the actual physical process int o Matlab_____% Data = xlsread( 'Book1.xls' ); Data = Data(randperm(8),:); x(:,1) = Data(:,1); % Input t (:,1) = Data(:,3); % Ouputs t (:,2) = Data(:,4); t(:,3) = Data(:,6); t(:,4) = Data(:,7); %_____________Setup the neural network parameters___ _____________% nin = 1; % Number of inputs. nhidden = 7; % Number of hidden units. nout = 4; % Number of outputs. alpha = 0.01; % Coefficient of weight-decay prior %_________Create and initialize network weight vecto r____________% net = mlp(nin, nhidden, nout, 'linear' , alpha); options = zeros(1,18); % Set up vector of options for the optimiser. options(1) = 1; % This provides display of error values. options(14) = 300; % Number of training cycles.
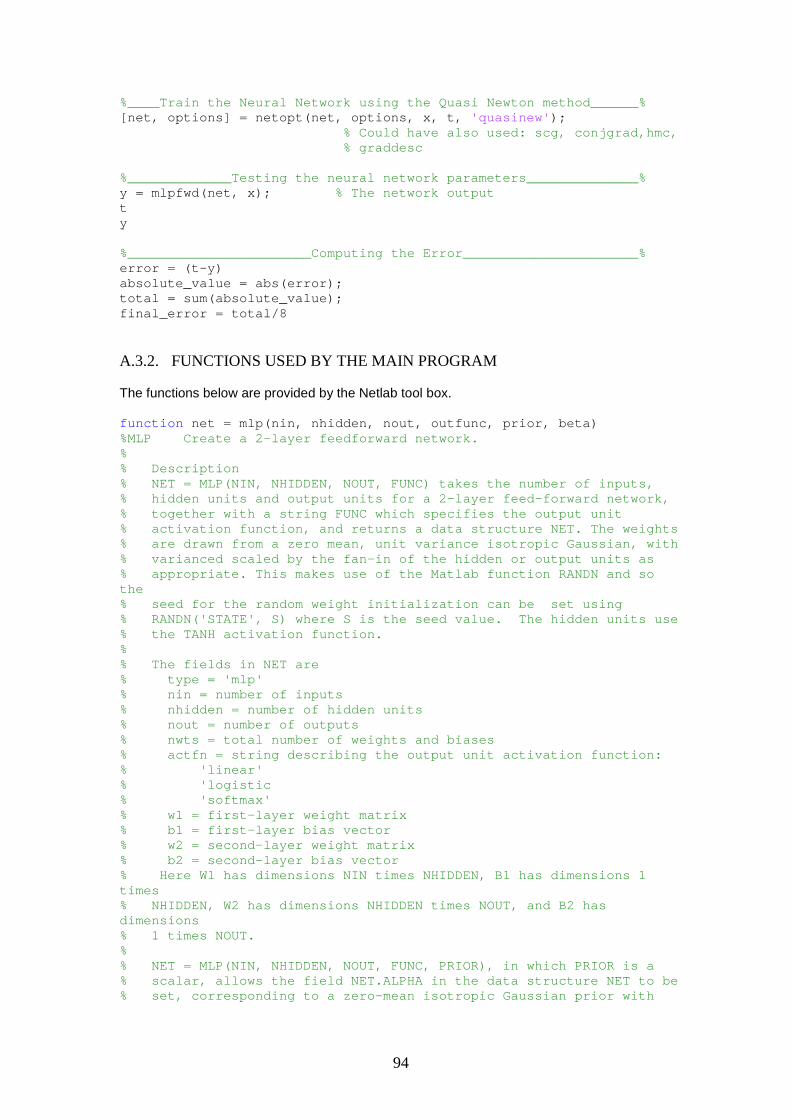
94
%____Train the Neural Network using the Quasi Newton method______% [ net, options] = netopt(net, options, x, t, 'quasinew' ); % Could have also used: scg, conjgrad,hmc, % graddesc %_____________Testing the neural network p arameters______________% y = mlpfwd(net, x); % The network output t y %_______________________Computing the Error_________ _____________% error = (t-y) absolute_value = abs(error); total = sum(absolute_value); final_error = total/8 A.3.2. FUNCTIONS USED BY THE MAIN PROGRAM The functions below are provided by the Netlab tool box. function net = mlp(nin, nhidden, nout, outfunc, prior, beta) %MLP Create a 2-layer feedforward network. % % Description % NET = MLP(NIN, NHIDDEN, NOUT, FUNC) takes the number of inputs, % hidden units and output units for a 2-layer feed-forward network, % together with a string FUNC which specifies the output unit % activation function, and returns a data structure NET. The weights % are drawn from a zero mean, unit variance isotropic Gaussian, with % varianced scaled by the fan-in of the hidden or output units as % appropriate. This makes use of the Matlab function RANDN and so the % seed for the random weight initialization can be set using % RANDN('STATE', S) where S is the seed value. The hidden units use % the TANH activation function. % % The fields in NET are % type = 'mlp' % nin = number of inputs % nhidden = number of hidden units % nout = number of outputs % nwts = total number of weights and biases % actfn = string describing the output unit activation function: % 'linear' % 'logistic % 'softmax' % w1 = first-layer weight matrix % b1 = first-layer bias vector % w2 = second-layer weight matrix % b2 = second-layer bias vector % Here W1 has dimensions NIN times NHIDDEN, B1 has dimensions 1 times % NHIDDEN, W2 has dimensions NHIDDEN times NOUT, and B2 has dimensions % 1 times NOUT. % % NET = MLP(NIN, NHIDDEN, NOUT, FUNC, PRIOR), in which PRIOR is a % scalar, allows the field NET.ALPHA in the data structure NET to be % set, corresponding to a zero-mean isotropic Gaussian prior with

95
% inverse variance with value PRIOR. Alternatively, PRIOR can consist % of a data structure with fields ALPHA and INDEX, allowing individual % Gaussian priors to be set over groups of weights in the network. Here % ALPHA is a column vector in which each element corresponds to a % separate group of weights, which need not be mutually exclusive. The % membership of the groups is defined by the matrix INDX in which the % columns correspond to the elements of ALPHA. Each column has one % element for each weight in the matrix, in the order defined by the % function MLPPAK, and each element is 1 or 0 according to whether the % weight is a member of the corresponding group or not. A utility % function MLPPRIOR is provided to help in setting up the PRIOR data % structure. % % NET = MLP(NIN, NHIDDEN, NOUT, FUNC, PRIOR, BETA) also sets the % additional field NET.BETA in the data structure NET, where beta % corresponds to the inverse noise variance. % % See also % MLPPRIOR, MLPPAK, MLPUNPAK, MLPFWD, MLPERR, MLPBKP, MLPGRAD % % Copyright (c) Ian T Nabney (1996-2001) net.type = 'mlp' ; net.nin = nin; net.nhidden = nhidden; net.nout = nout; net.nwts = (nin + 1)*nhidden + (nhidden + 1)*nout; outfns = { 'linear' , 'logistic' , 'softmax' }; if sum(strcmp(outfunc, outfns)) == 0 error( 'Undefined output function. Exiting.' ); else net.outfn = outfunc; end if nargin > 4 if isstruct(prior) net.alpha = prior.alpha; net.index = prior.index; elseif size(prior) == [1 1] net.alpha = prior; else error( 'prior must be a scalar or a structure' ); end end net.w1 = randn(nin, nhidden)/sqrt(nin + 1); net.b1 = randn(1, nhidden)/sqrt(nin + 1); net.w2 = randn(nhidden, nout)/sqrt(nhidden + 1); net.b2 = randn(1, nout)/sqrt(nhidden + 1); if nargin == 6

96
net.beta = beta; end The source code below is provided by the Netlab neural network tool box.
function [net, options, varargout] = netopt(net, options, x, t, alg); %NETOPT Optimize the weights in a network model. % % Description % % NETOPT is a helper function which facilitates the training of % networks using the general purpose optimizers as well as sampling % from the posterior distribution of parameters using general purpose % Markov chain Monte Carlo sampling algorithms. It can be used with any % function that searches in parameter space using error and gradient % functions. % % [NET, OPTIONS] = NETOPT(NET, OPTIONS, X, T, ALG) takes a network % data structure NET, together with a vector OPTIONS of parameters % governing the behaviour of the optimization algorithm, a matrix X of % input vectors and a matrix T of target vectors, and returns the % trained network as well as an updated OPTIONS vector. The string ALG % determines which optimization algorithm (CONJGRAD, QUASINEW, SCG, % etc.) or Monte Carlo algorithm (such as HMC) will be used. % % [NET, OPTIONS, VARARGOUT] = NETOPT(NET, OPTIONS, X, T, ALG) also % returns any additional return values from the optimisation algorithm. % % See also % NETGRAD, BFGS, CONJGRAD, GRADDESC, HMC, SCG % % Copyright (c) Ian T Nabney (1996-2001) optstring = [alg, '(''neterr'', w, options, ''netgrad'', net, x, t)' ]; % Extract weights from network as single vector w = netpak(net); % Carry out optimisation [s{1:nargout}] = eval(optstring); w = s{1}; if nargout > 1 options = s{2}; % If there are additional arguments, extract them nextra = nargout - 2; if nextra > 0 for i = 1:nextra varargout{i} = s{i+2}; end end
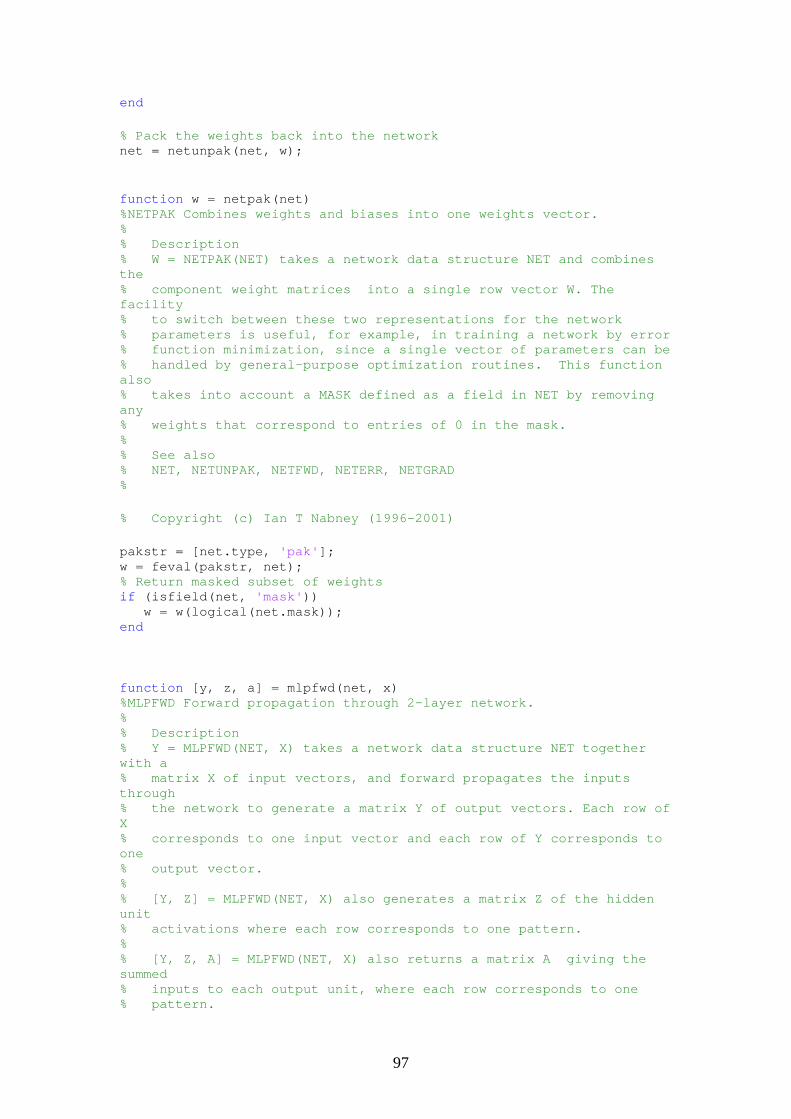
97
end % Pack the weights back into the network net = netunpak(net, w); function w = netpak(net) %NETPAK Combines weights and biases into one weights vector. % % Description % W = NETPAK(NET) takes a network data structure NET and combines the % component weight matrices into a single row vector W. The facility % to switch between these two representations for the network % parameters is useful, for example, in training a network by error % function minimization, since a single vector of parameters can be % handled by general-purpose optimization routines. This function also % takes into account a MASK defined as a field in NET by removing any % weights that correspond to entries of 0 in the mask. % % See also % NET, NETUNPAK, NETFWD, NETERR, NETGRAD % % Copyright (c) Ian T Nabney (1996-2001) pakstr = [net.type, 'pak' ]; w = feval(pakstr, net); % Return masked subset of weights if (isfield(net, 'mask' )) w = w(logical(net.mask)); end
function [y, z, a] = mlpfwd(net, x) %MLPFWD Forward propagation through 2-layer network. % % Description % Y = MLPFWD(NET, X) takes a network data structure NET together with a % matrix X of input vectors, and forward propagates the inputs through % the network to generate a matrix Y of output vectors. Each row of X % corresponds to one input vector and each row of Y corresponds to one % output vector. % % [Y, Z] = MLPFWD(NET, X) also generates a matrix Z of the hidden unit % activations where each row corresponds to one pattern. % % [Y, Z, A] = MLPFWD(NET, X) also returns a matrix A giving the summed % inputs to each output unit, where each row corresponds to one % pattern.
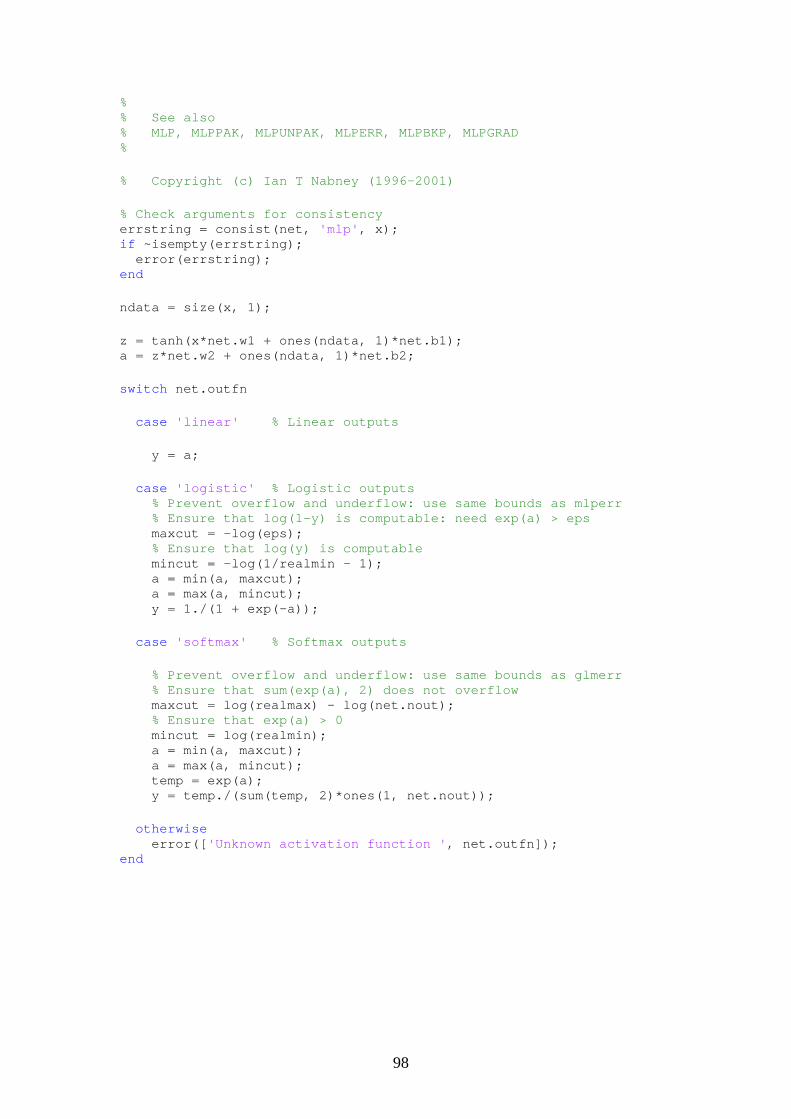
98
% % See also % MLP, MLPPAK, MLPUNPAK, MLPERR, MLPBKP, MLPGRAD % % Copyright (c) Ian T Nabney (1996-2001) % Check arguments for consistency errstring = consist(net, 'mlp' , x); if ~isempty(errstring); error(errstring); end ndata = size(x, 1); z = tanh(x*net.w1 + ones(ndata, 1)*net.b1); a = z*net.w2 + ones(ndata, 1)*net.b2; switch net.outfn case 'linear' % Linear outputs y = a; case 'logistic' % Logistic outputs % Prevent overflow and underflow: use same bounds as mlperr % Ensure that log(1-y) is computable: need exp(a) > eps maxcut = -log(eps); % Ensure that log(y) is computable mincut = -log(1/realmin - 1); a = min(a, maxcut); a = max(a, mincut); y = 1./(1 + exp(-a)); case 'softmax' % Softmax outputs % Prevent overflow and underflow: use same bounds as glmerr % Ensure that sum(exp(a), 2) does not overflow maxcut = log(realmax) - log(net.nout); % Ensure that exp(a) > 0 mincut = log(realmin); a = min(a, maxcut); a = max(a, mincut); temp = exp(a); y = temp./(sum(temp, 2)*ones(1, net.nout)); otherwise error([ 'Unknown activation function ' , net.outfn]); end

99
APPENDIX 4
RESULTS OF THE MATLAB / NETLABCODE EXECUTION
FROM APPENDIX 3
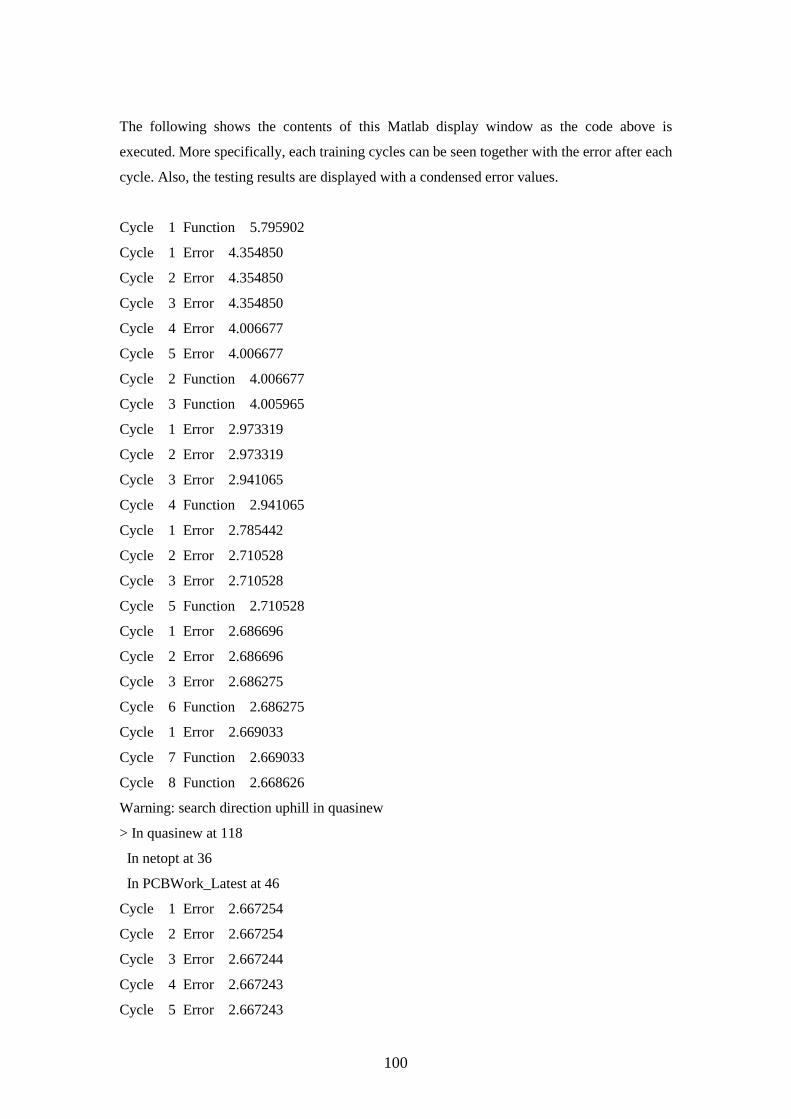
100
The following shows the contents of this Matlab display window as the code above is
executed. More specifically, each training cycles can be seen together with the error after each
cycle. Also, the testing results are displayed with a condensed error values.
Cycle 1 Function 5.795902
Cycle 1 Error 4.354850
Cycle 2 Error 4.354850
Cycle 3 Error 4.354850
Cycle 4 Error 4.006677
Cycle 5 Error 4.006677
Cycle 2 Function 4.006677
Cycle 3 Function 4.005965
Cycle 1 Error 2.973319
Cycle 2 Error 2.973319
Cycle 3 Error 2.941065
Cycle 4 Function 2.941065
Cycle 1 Error 2.785442
Cycle 2 Error 2.710528
Cycle 3 Error 2.710528
Cycle 5 Function 2.710528
Cycle 1 Error 2.686696
Cycle 2 Error 2.686696
Cycle 3 Error 2.686275
Cycle 6 Function 2.686275
Cycle 1 Error 2.669033
Cycle 7 Function 2.669033
Cycle 8 Function 2.668626
Warning: search direction uphill in quasinew
> In quasinew at 118
In netopt at 36
In PCBWork_Latest at 46
Cycle 1 Error 2.667254
Cycle 2 Error 2.667254
Cycle 3 Error 2.667244
Cycle 4 Error 2.667243
Cycle 5 Error 2.667243
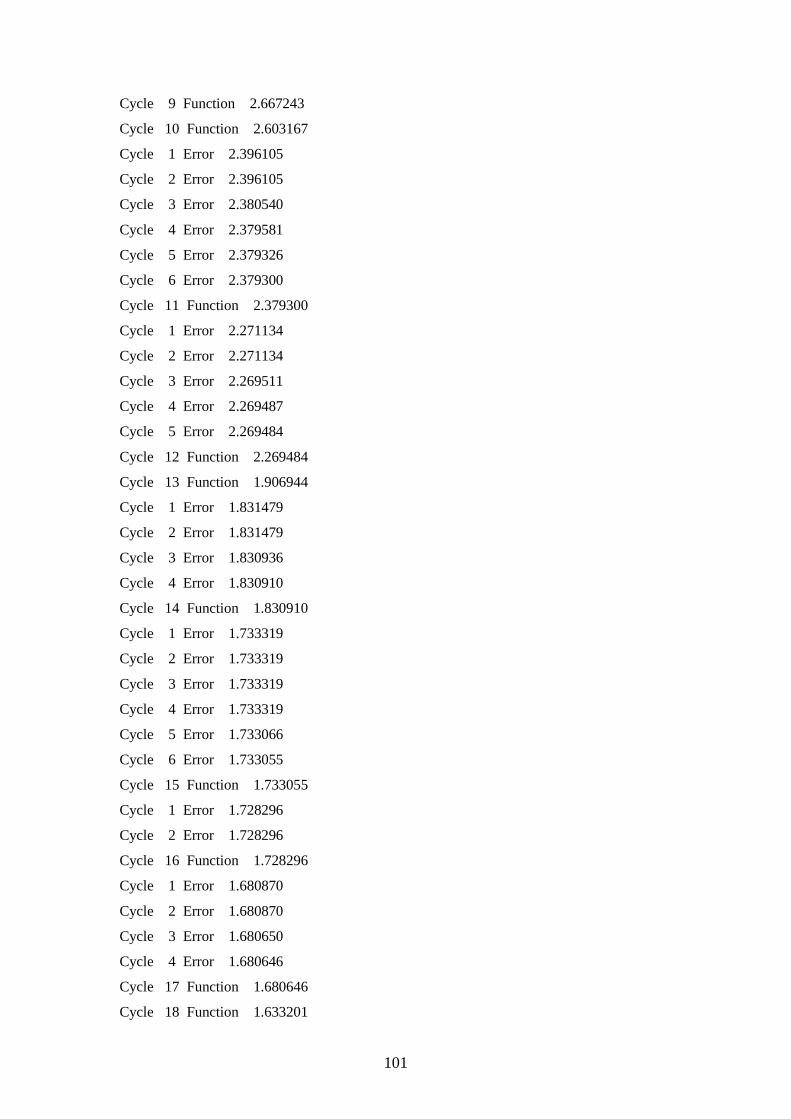
101
Cycle 9 Function 2.667243
Cycle 10 Function 2.603167
Cycle 1 Error 2.396105
Cycle 2 Error 2.396105
Cycle 3 Error 2.380540
Cycle 4 Error 2.379581
Cycle 5 Error 2.379326
Cycle 6 Error 2.379300
Cycle 11 Function 2.379300
Cycle 1 Error 2.271134
Cycle 2 Error 2.271134
Cycle 3 Error 2.269511
Cycle 4 Error 2.269487
Cycle 5 Error 2.269484
Cycle 12 Function 2.269484
Cycle 13 Function 1.906944
Cycle 1 Error 1.831479
Cycle 2 Error 1.831479
Cycle 3 Error 1.830936
Cycle 4 Error 1.830910
Cycle 14 Function 1.830910
Cycle 1 Error 1.733319
Cycle 2 Error 1.733319
Cycle 3 Error 1.733319
Cycle 4 Error 1.733319
Cycle 5 Error 1.733066
Cycle 6 Error 1.733055
Cycle 15 Function 1.733055
Cycle 1 Error 1.728296
Cycle 2 Error 1.728296
Cycle 16 Function 1.728296
Cycle 1 Error 1.680870
Cycle 2 Error 1.680870
Cycle 3 Error 1.680650
Cycle 4 Error 1.680646
Cycle 17 Function 1.680646
Cycle 18 Function 1.633201
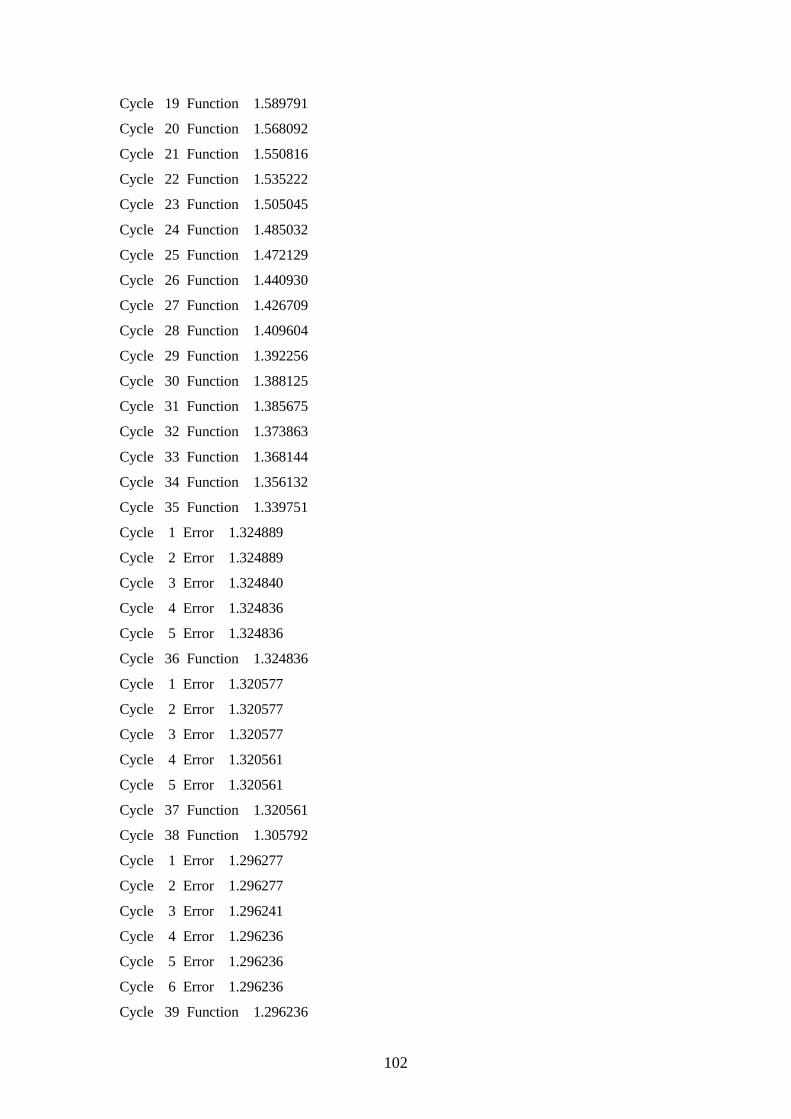
102
Cycle 19 Function 1.589791
Cycle 20 Function 1.568092
Cycle 21 Function 1.550816
Cycle 22 Function 1.535222
Cycle 23 Function 1.505045
Cycle 24 Function 1.485032
Cycle 25 Function 1.472129
Cycle 26 Function 1.440930
Cycle 27 Function 1.426709
Cycle 28 Function 1.409604
Cycle 29 Function 1.392256
Cycle 30 Function 1.388125
Cycle 31 Function 1.385675
Cycle 32 Function 1.373863
Cycle 33 Function 1.368144
Cycle 34 Function 1.356132
Cycle 35 Function 1.339751
Cycle 1 Error 1.324889
Cycle 2 Error 1.324889
Cycle 3 Error 1.324840
Cycle 4 Error 1.324836
Cycle 5 Error 1.324836
Cycle 36 Function 1.324836
Cycle 1 Error 1.320577
Cycle 2 Error 1.320577
Cycle 3 Error 1.320577
Cycle 4 Error 1.320561
Cycle 5 Error 1.320561
Cycle 37 Function 1.320561
Cycle 38 Function 1.305792
Cycle 1 Error 1.296277
Cycle 2 Error 1.296277
Cycle 3 Error 1.296241
Cycle 4 Error 1.296236
Cycle 5 Error 1.296236
Cycle 6 Error 1.296236
Cycle 39 Function 1.296236
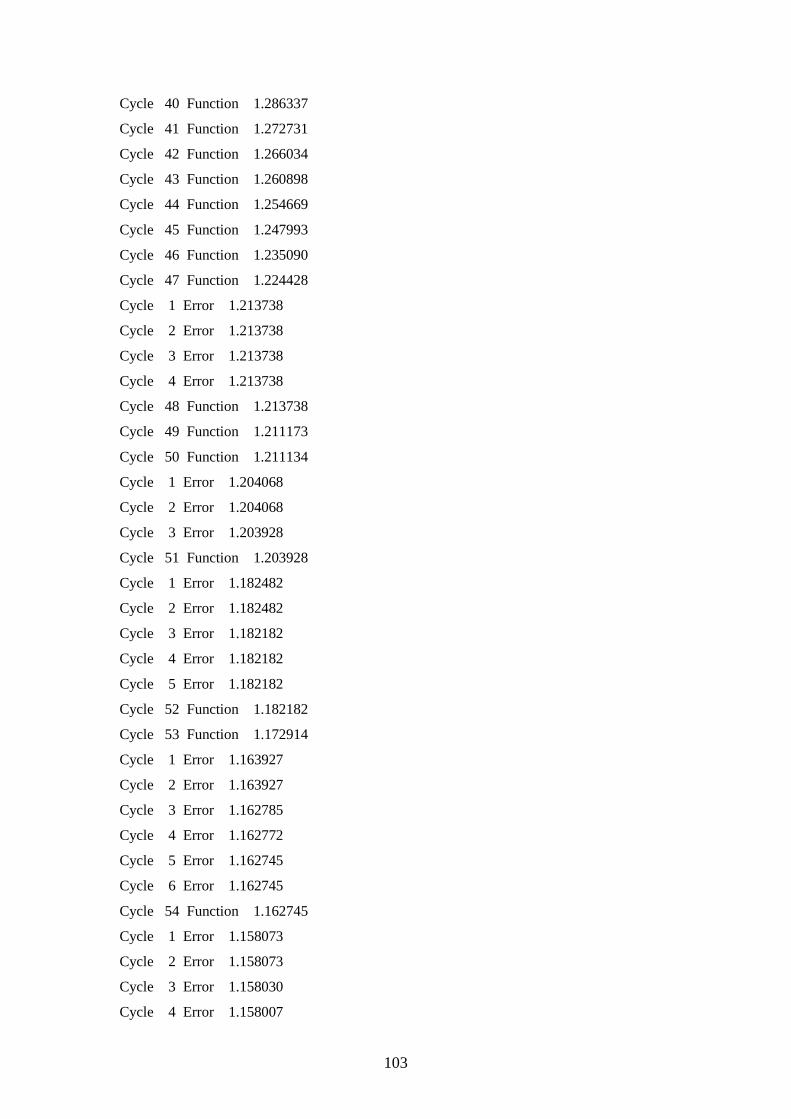
103
Cycle 40 Function 1.286337
Cycle 41 Function 1.272731
Cycle 42 Function 1.266034
Cycle 43 Function 1.260898
Cycle 44 Function 1.254669
Cycle 45 Function 1.247993
Cycle 46 Function 1.235090
Cycle 47 Function 1.224428
Cycle 1 Error 1.213738
Cycle 2 Error 1.213738
Cycle 3 Error 1.213738
Cycle 4 Error 1.213738
Cycle 48 Function 1.213738
Cycle 49 Function 1.211173
Cycle 50 Function 1.211134
Cycle 1 Error 1.204068
Cycle 2 Error 1.204068
Cycle 3 Error 1.203928
Cycle 51 Function 1.203928
Cycle 1 Error 1.182482
Cycle 2 Error 1.182482
Cycle 3 Error 1.182182
Cycle 4 Error 1.182182
Cycle 5 Error 1.182182
Cycle 52 Function 1.182182
Cycle 53 Function 1.172914
Cycle 1 Error 1.163927
Cycle 2 Error 1.163927
Cycle 3 Error 1.162785
Cycle 4 Error 1.162772
Cycle 5 Error 1.162745
Cycle 6 Error 1.162745
Cycle 54 Function 1.162745
Cycle 1 Error 1.158073
Cycle 2 Error 1.158073
Cycle 3 Error 1.158030
Cycle 4 Error 1.158007

104
Cycle 5 Error 1.158007
Cycle 6 Error 1.158003
Cycle 55 Function 1.158003
Cycle 1 Error 1.153601
Cycle 2 Error 1.153601
Cycle 3 Error 1.153364
Cycle 56 Function 1.153364
Cycle 57 Function 1.142339
Cycle 58 Function 1.130855
Cycle 1 Error 1.122687
Cycle 2 Error 1.122687
Cycle 3 Error 1.122305
Cycle 4 Error 1.122305
Cycle 5 Error 1.122305
Cycle 6 Error 1.122305
Cycle 7 Error 1.122305
Cycle 59 Function 1.122305
Cycle 60 Function 1.108962
Cycle 61 Function 1.095124
Cycle 62 Function 1.088689
Cycle 1 Error 1.072751
Cycle 2 Error 1.072751
Cycle 3 Error 1.072659
Cycle 4 Error 1.072658
Cycle 5 Error 1.072657
Cycle 63 Function 1.072657
Cycle 1 Error 1.063453
Cycle 2 Error 1.063453
Cycle 3 Error 1.062927
Cycle 4 Error 1.062927
Cycle 5 Error 1.062927
Cycle 6 Error 1.062927
Cycle 7 Error 1.062927
Cycle 8 Error 1.062927
Cycle 64 Function 1.062927
Cycle 65 Function 1.060623
Cycle 66 Function 1.042949

105
Cycle 1 Error 1.038309
Cycle 2 Error 1.038309
Cycle 3 Error 1.038274
Cycle 4 Error 1.038273
Cycle 5 Error 1.038273
Cycle 6 Error 1.038273
Cycle 7 Error 1.038273
Cycle 67 Function 1.038273
Cycle 68 Function 1.031595
Cycle 1 Error 1.023674
Cycle 2 Error 1.023674
Cycle 3 Error 1.023663
Cycle 4 Error 1.023662
Cycle 69 Function 1.023662
Cycle 1 Error 1.013945
Cycle 2 Error 1.013945
Cycle 3 Error 1.013945
Cycle 4 Error 1.013945
Cycle 5 Error 1.013945
Cycle 6 Error 1.013945
Cycle 70 Function 1.013945
Cycle 1 Error 1.006358
Cycle 2 Error 1.006358
Cycle 3 Error 1.005898
Cycle 4 Error 1.005898
Cycle 5 Error 1.005898
Cycle 6 Error 1.005898
Cycle 7 Error 1.005898
Cycle 71 Function 1.005898
Cycle 1 Error 1.004095
Cycle 2 Error 1.004095
Cycle 3 Error 1.004018
Cycle 4 Error 1.004018
Cycle 5 Error 1.004018
Cycle 6 Error 1.004018
Cycle 72 Function 1.004018
Cycle 73 Function 1.000503

106
Cycle 74 Function 0.991846
Cycle 1 Error 0.981656
Cycle 2 Error 0.981656
Cycle 3 Error 0.981400
Cycle 4 Error 0.981398
Cycle 5 Error 0.981397
Cycle 6 Error 0.981397
Cycle 7 Error 0.981397
Cycle 75 Function 0.981397
Cycle 76 Function 0.968075
Cycle 1 Error 0.961565
Cycle 2 Error 0.961565
Cycle 3 Error 0.961484
Cycle 4 Error 0.961483
Cycle 5 Error 0.961483
Cycle 77 Function 0.961483
Cycle 78 Function 0.952922
Cycle 79 Function 0.917504
Cycle 1 Error 0.897789
Cycle 2 Error 0.897789
Cycle 3 Error 0.897205
Cycle 4 Error 0.897196
Cycle 80 Function 0.897196
Cycle 1 Error 0.868723
Cycle 2 Error 0.868723
Cycle 3 Error 0.868584
Cycle 4 Error 0.868558
Cycle 81 Function 0.868558
Cycle 1 Error 0.833054
Cycle 2 Error 0.833054
Cycle 3 Error 0.832297
Cycle 4 Error 0.832252
Cycle 5 Error 0.832239
Cycle 82 Function 0.832239
Cycle 83 Function 0.774417
Cycle 84 Function 0.734052
Cycle 1 Error 0.708009

107
Cycle 2 Error 0.708009
Cycle 3 Error 0.707973
Cycle 4 Error 0.707972
Cycle 5 Error 0.707972
Cycle 85 Function 0.707972
Cycle 1 Error 0.694137
Cycle 2 Error 0.694137
Cycle 3 Error 0.693959
Cycle 4 Error 0.693959
Cycle 5 Error 0.693959
Cycle 6 Error 0.693959
Cycle 7 Error 0.693959
Cycle 86 Function 0.693959
Cycle 1 Error 0.681622
Cycle 2 Error 0.681622
Cycle 3 Error 0.681477
Cycle 4 Error 0.681476
Cycle 5 Error 0.681476
Cycle 87 Function 0.681476
Cycle 88 Function 0.656776
Cycle 89 Function 0.626597
Cycle 90 Function 0.606745
Cycle 91 Function 0.593834
Cycle 92 Function 0.583349
Cycle 1 Error 0.573892
Cycle 2 Error 0.573892
Cycle 3 Error 0.573420
Cycle 4 Error 0.573420
Cycle 5 Error 0.573420
Cycle 6 Error 0.573420
Cycle 7 Error 0.573420
Cycle 8 Error 0.573420
Cycle 93 Function 0.573420
Cycle 94 Function 0.566499
Cycle 95 Function 0.561232
Cycle 96 Function 0.553769
Cycle 97 Function 0.545610

108
Cycle 98 Function 0.537055
Cycle 1 Error 0.532451
Cycle 2 Error 0.532451
Cycle 3 Error 0.532191
Cycle 4 Error 0.532191
Cycle 5 Error 0.532191
Cycle 6 Error 0.532191
Cycle 99 Function 0.532191
Cycle 100 Function 0.525425
Cycle 101 Function 0.519376
Cycle 102 Function 0.512658
Cycle 103 Function 0.511511
Cycle 104 Function 0.500185
Cycle 105 Function 0.494010
Cycle 106 Function 0.484444
Cycle 107 Function 0.472564
Cycle 108 Function 0.460538
Cycle 1 Error 0.455512
Cycle 2 Error 0.455512
Cycle 3 Error 0.455399
Cycle 4 Error 0.455390
Cycle 5 Error 0.455389
Cycle 6 Error 0.455389
Cycle 7 Error 0.455389
Cycle 109 Function 0.455389
Cycle 110 Function 0.453227
Cycle 1 Error 0.438967
Cycle 2 Error 0.438967
Cycle 3 Error 0.438279
Cycle 4 Error 0.438274
Cycle 5 Error 0.438273
Cycle 6 Error 0.438273
Cycle 111 Function 0.438273
Cycle 1 Error 0.430780
Cycle 2 Error 0.430312
Cycle 3 Error 0.430093
Cycle 4 Error 0.430093

109
Cycle 5 Error 0.430093
Cycle 112 Function 0.430093
Cycle 113 Function 0.429941
Cycle 114 Function 0.421453
Cycle 115 Function 0.419470
Cycle 116 Function 0.416670
Cycle 117 Function 0.410070
Cycle 118 Function 0.405908
Cycle 119 Function 0.398531
Cycle 120 Function 0.394424
Cycle 121 Function 0.387521
Cycle 122 Function 0.378089
Cycle 123 Function 0.374901
Cycle 1 Error 0.370546
Cycle 2 Error 0.370349
Cycle 3 Error 0.370189
Cycle 4 Error 0.370189
Cycle 5 Error 0.370189
Cycle 124 Function 0.370189
Cycle 125 Function 0.363733
Cycle 126 Function 0.359775
Cycle 127 Function 0.351851
Cycle 128 Function 0.343722
Cycle 129 Function 0.335297
Cycle 1 Error 0.332313
Cycle 2 Error 0.332313
Cycle 3 Error 0.332275
Cycle 4 Error 0.332273
Cycle 5 Error 0.332273
Cycle 6 Error 0.332273
Cycle 7 Error 0.332273
Cycle 130 Function 0.332273
Cycle 131 Function 0.326297
Cycle 132 Function 0.320018
Cycle 133 Function 0.314744
Cycle 134 Function 0.311542
Cycle 135 Function 0.307697
110
Cycle 136 Function 0.303136
Cycle 137 Function 0.301165
Cycle 138 Function 0.297393
Cycle 139 Function 0.293944
Cycle 140 Function 0.289907
Cycle 141 Function 0.284394
Cycle 142 Function 0.280722
Cycle 143 Function 0.277346
Cycle 144 Function 0.276157
Cycle 145 Function 0.274130
Cycle 146 Function 0.271778
Cycle 147 Function 0.270624
Cycle 148 Function 0.270120
Cycle 149 Function 0.268842
Cycle 150 Function 0.266792
Cycle 151 Function 0.264418
Cycle 152 Function 0.262596
Cycle 153 Function 0.262221
Cycle 154 Function 0.260775
Cycle 155 Function 0.260477
Cycle 156 Function 0.260042
Cycle 157 Function 0.259320
Cycle 158 Function 0.259131
Cycle 159 Function 0.258795
Cycle 160 Function 0.258545
Cycle 161 Function 0.258276
Cycle 162 Function 0.258078
Cycle 163 Function 0.257924
Cycle 164 Function 0.257750
Cycle 165 Function 0.257578
Cycle 166 Function 0.257458
Cycle 167 Function 0.257365
Cycle 168 Function 0.257250
Cycle 169 Function 0.257076
Cycle 170 Function 0.256912
Cycle 171 Function 0.256797
Cycle 172 Function 0.256694
111
Cycle 173 Function 0.256569
Cycle 174 Function 0.256378
Cycle 175 Function 0.256182
Cycle 176 Function 0.256015
Cycle 177 Function 0.255840
Cycle 178 Function 0.255544
Cycle 179 Function 0.255096
Cycle 180 Function 0.254605
Cycle 181 Function 0.254268
Cycle 182 Function 0.254102
Cycle 183 Function 0.253797
Cycle 184 Function 0.253314
Cycle 185 Function 0.252724
Cycle 186 Function 0.251494
Cycle 187 Function 0.250657
Cycle 188 Function 0.250283
Cycle 189 Function 0.249606
Cycle 190 Function 0.249256
Cycle 191 Function 0.248575
Cycle 192 Function 0.248317
Cycle 193 Function 0.247878
Cycle 194 Function 0.247433
Cycle 195 Function 0.246933
Cycle 196 Function 0.246402
Cycle 197 Function 0.245843
Cycle 198 Function 0.245550
Cycle 199 Function 0.245112
Cycle 200 Function 0.244811
Cycle 201 Function 0.244623
Cycle 202 Function 0.244481
Cycle 203 Function 0.244389
Cycle 204 Function 0.244244
Cycle 205 Function 0.244104
Cycle 206 Function 0.243800
Cycle 207 Function 0.243460
Cycle 208 Function 0.243194
Cycle 209 Function 0.243043

112
Cycle 210 Function 0.242921
Cycle 211 Function 0.242781
Cycle 212 Function 0.242619
Cycle 213 Function 0.242489
Cycle 214 Function 0.242407
Cycle 215 Function 0.242357
Cycle 216 Function 0.242310
Cycle 217 Function 0.242262
Cycle 218 Function 0.242221
Cycle 219 Function 0.242181
Cycle 220 Function 0.242154
Cycle 221 Function 0.242128
Cycle 222 Function 0.242095
Cycle 223 Function 0.242051
Cycle 224 Function 0.242016
Cycle 225 Function 0.242001
Cycle 226 Function 0.241994
Cycle 227 Function 0.241987
Cycle 228 Function 0.241970
Cycle 229 Function 0.241941
Cycle 230 Function 0.241903
Cycle 231 Function 0.241878
Cycle 232 Function 0.241867
Cycle 233 Function 0.241863
Cycle 234 Function 0.241858
Cycle 235 Function 0.241846
Cycle 236 Function 0.241826
Cycle 237 Function 0.241793
Cycle 238 Function 0.241761
Cycle 239 Function 0.241743
Cycle 240 Function 0.241737
Cycle 241 Function 0.241734
Cycle 242 Function 0.241729
Cycle 243 Function 0.241718
Cycle 244 Function 0.241704
Cycle 245 Function 0.241692
Cycle 246 Function 0.241682
113
Cycle 247 Function 0.241674
Cycle 248 Function 0.241660
Cycle 249 Function 0.241635
Cycle 250 Function 0.241599
Cycle 251 Function 0.241562
Cycle 252 Function 0.241544
Cycle 253 Function 0.241536
Cycle 254 Function 0.241528
Cycle 255 Function 0.241517
Cycle 256 Function 0.241494
Cycle 257 Function 0.241448
Cycle 258 Function 0.241363
Cycle 259 Function 0.241218
Cycle 260 Function 0.241026
Cycle 261 Function 0.240755
Cycle 262 Function 0.240412
Cycle 1 Error 0.240300
Cycle 2 Error 0.240300
Cycle 3 Error 0.240296
Cycle 4 Error 0.240296
Cycle 5 Error 0.240296
Cycle 6 Error 0.240296
Cycle 7 Error 0.240296
Cycle 263 Function 0.240296
Cycle 264 Function 0.240250
Cycle 265 Function 0.240224
Cycle 266 Function 0.240213
Cycle 267 Function 0.240194
Cycle 268 Function 0.240168
Cycle 269 Function 0.240111
Cycle 270 Function 0.240060
Cycle 271 Function 0.240028
Cycle 272 Function 0.240013
Cycle 273 Function 0.239991
Cycle 274 Function 0.239975
Cycle 275 Function 0.239963
Cycle 276 Function 0.239957

114
Cycle 277 Function 0.239955
Cycle 278 Function 0.239952
Cycle 279 Function 0.239947
Cycle 280 Function 0.239939
Cycle 281 Function 0.239930
Cycle 282 Function 0.239925
Cycle 283 Function 0.239924
Cycle 284 Function 0.239924
Cycle 285 Function 0.239924
Cycle 286 Function 0.239924
Cycle 287 Function 0.239924
Cycle 288 Function 0.239924
Cycle 289 Function 0.239924
Cycle 290 Function 0.239923
Cycle 291 Function 0.239923
Cycle 292 Function 0.239923
Cycle 293 Function 0.239923
Cycle 294 Function 0.239923
Cycle 295 Function 0.239923
Cycle 296 Function 0.239923
Cycle 297 Function 0.239923
Cycle 298 Function 0.239923
Cycle 299 Function 0.239923
Cycle 300 Function 0.239923
Maximum number of iterations has been exceeded
t =
1.650000000000000 0.780000000000000 1.460000000000000 1.580000000000000
1.870000000000000 0.630000000000000 1.770000000000000 1.250000000000000
2.300000000000000 1.400000000000000 3.020000000000000 1.620000000000000
0.920000000000000 0.500000000000000 1.560000000000000 0.880000000000000
1.310000000000000 0.260000000000000 1.190000000000000 0.740000000000000
2.060000000000000 1.060000000000000 2.500000000000000 1.130000000000000
0.420000000000000 0.540000000000000 1.140000000000000 0.720000000000000
0.710000000000000 0.680000000000000 1.230000000000000 0.650000000000000

115
y =
1.759094808230166 0.686398005836463 1.605821131584036 1.394713359902200
1.752212109430362 0.702355898933282 1.616141601401630 1.413695601223982
2.392791423509879 1.386705807227279 3.007962545612929 1.522217673208337
1.011053216787444 0.510037735056904 1.586914556357650 0.838683644624587
1.299495289439456 0.299751111700375 1.194129418333201 0.763025740520823
1.884872594982724 1.065925328287480 2.490023320887617 1.269296279218797
0.411277229138223 0.554678126984988 1.135269752523392 0.710715166298223
0.724854816074746 0.642511093148704 1.227490667186088 0.653635579373963
error =
-0.109094808230166 0.093601994163537 -0.145821131584036 0.185286640097800
0.117787890569638 -0.072355898933282 0.153858398598370 -0.163695601223982
-0.092791423509879 0.013294192772721 0.012037454387071 0.097782326791663
-0.091053216787443 -0.010037735056904 -0.026914556357650 0.041316355375413
0.010504710560544 -0.039751111700375 -0.004129418333201 -0.023025740520823
0.175127405017276 -0.005925328287480 0.009976679112383 -0.139296279218797
0.008722770861777 -0.014678126984988 0.004730247476608 0.009284833701777
-0.014854816074746 0.037488906851296 0.002509332813912 -0.003635579373963
final_error =
0.077492130201434 0.035891661843823 0.044997152332904 0.082915419538027
>> net
net =
type: 'mlp'
nin: 1
nhidden: 7
nout: 4

116
nwts: 46
outfn: 'linear'
alpha: 0.010000000000000
w1: [1x7 double]
b1: [1x7 double]
w2: [7x4 double]
b2: [0.435227020959160 0.163629790983202 0.623837556387389
0.400759176289016]