1 Invesco Markets III plc
Invesco Markets III plc (an umbrella investment company with variable capital and segregated
liability between
its funds incorporated with limited liability in Ireland under registration
number 352941)
Condensed Semi-Annual Report and
Unaudited Financial Statements
For the six months ended 31 March 2022
Condensed Semi-Annual
Report & Unaudited
Financial Statements
2 Invesco Markets III plc
Table of Contents
Pages
General Information 4-5
Investment Policy and Description of the Funds 6-7
Investment Manager’s Report 8-10
Schedule of Investments 11-87
Statement of Financial Position as at 31 March 2022 88-90
Statement of Financial Position as at 30 September 2021 91-93
Statement of Comprehensive Income for financial period ended 31 March 2022 94-96
Statement of Comprehensive Income for financial period ended 31 March 2021 97-99
Statement of Changes in Net Assets Attributable to Holders of Redeemable
Participating Shares for financial period ended 31 March 2022 100-102
Statement of Changes in Net Assets Attributable to Holders of Redeemable
Participating Shares for financial period ended 31 March 2021 103-105
Notes to the Financial Statements 106-119
US Equity ETFs
Invesco EQQQ NASDAQ-100 UCITS ETF
Schedule of Investments 11 Statement of Changes in Composition of the Portfolio 120
Invesco FTSE RAFI US 1000 UCITS ETF
Schedule of Investments 14 Statement of Changes in Composition of the Portfolio 121
Invesco S&P 500 High Dividend Low Volatility
UCITS ETF
Schedule of Investments F
30 Statement of Changes in Composition of the Portfolio 122
Invesco S&P 500 QVM UCITS ETF
Schedule of Investments 32 Statement of Changes in Composition of the Portfolio 123
Intelligent Access ETFs
Invesco Global Buyback Achievers UCITS ETF
Schedule of Investments 35 Statement of Changes in Composition of the Portfolio 124
Global ETFs
Invesco FTSE RAFI All-World 3000 UCITS
ETF
Schedule of Investments 39 Statement of Changes in Composition of the Portfolio 125
Invesco FTSE RAFI Emerging Markets UCITS
ETF
Schedule of Investments 58 Statement of Changes in Composition of the Portfolio 126
Invesco FTSE RAFI Europe UCITS ETF
Schedule of Investments 65 Statement of Changes in Composition of the Portfolio 127
Invesco EURO STOXX High Dividend Low
Volatility UCITS ETF
Schedule of Investments 74 Statement of Changes in Composition of the Portfolio 128
Invesco FTSE Emerging Markets High Dividend
Low Volatility UCITS ETF
Schedule of Investments 76 Statement of Changes in Composition of the Portfolio 129
3 Invesco Markets III plc
Table of Contents (continued)
Country Specified ETFs
Invesco FTSE RAFI UK 100 UCITS ETF
Schedule of Investments 79 Statement of Changes in Composition of the Portfolio 130
Fixed Income ETFs
Invesco Euro Cash 3 Months UCITS ETF
(formerly Invesco EuroMTS Cash 3 Months
UCITS ETF)*
Schedule of Investments 82 Statement of Changes in Composition of the Portfolio 131
Invesco US High Yield Fallen Angels UCITS ETF
Schedule of Investments 84 Statement of Changes in Composition of the Portfolio 132
Additional Information
Securities Financing Transactions Regulation 133
UK Reporting 140
4 Invesco Markets III plc
General Information
Invesco Markets III plc (the “Company”) was incorporated on 5 February 2002 and is established as an open-ended investment company with variable capital
(“OEIC”) under the laws of Ireland as a public limited company pursuant to the Companies Act 2014, registration number 352941, the European Communities
(Undertakings for Collective Investment in Transferable Securities) Regulations, 2011 (as amended) and the Central Bank (Supervision and Enforcement) Act
2013 (Section 48(1)) (Undertakings for Collective Investment in Transferable Securities) (Amendment) Regulations 2019 (the "Central Bank UCITS
Regulations"). As at 31 March 2022, thirteen active funds of the Company had been established (each a “Fund” and together the “Funds”).
US Equity ETFs Invesco EQQQ NASDAQ-100 UCITS ETF
Invesco FTSE RAFI US 1000 UCITS ETF
Invesco S&P 500 High Dividend Low Volatility UCITS ETF
Invesco S&P 500 QVM UCITS ETF
Intelligent Access ETFs Invesco Global Buyback Achievers UCITS ETF
Global ETFs Invesco FTSE RAFI All-World 3000 UCITS ETF
Invesco FTSE RAFI Emerging Markets UCITS ETF
Invesco FTSE RAFI Europe UCITS ETF
Invesco EURO STOXX High Dividend Low Volatility UCITS ETF
Invesco FTSE Emerging Markets High Dividend Low Volatility UCITS ETF
Country Specified ETFs Invesco FTSE RAFI UK 100 UCITS ETF
Fixed Income ETFs Invesco Euro Cash 3 Months UCITS ETF (formerly Invesco EuroMTS Cash 3 Months UCITS ETF)
Invesco US High Yield Fallen Angels UCITS ETF
5 Invesco Markets III plc
General Information (continued)
Board of Directors: Registered Office:
Feargal Dempsey (Irish)(Chairman) * Ground Floor ***
Gary Buxton (British/Irish) ** 2 Cumberland Place
Barry McGrath (Irish) * Fenian Street
Katy Walton Jones (British) ** Dublin 2
* Independent non-executive director D02 H0V5
** Non-executive director Ireland
Investment Manager: Manager:
Invesco Capital Management LLC Invesco Investment Management Limited***
3500 Lacey Road Ground Floor
Suite 700 Downers Grove 2 Cumberland Place
Illinois 60515 Fenian Street
United States Dublin 2
D02 H0V5
Ireland
Auditors and Reporting Accountant: Administrator, Registrar and Transfer Agent:
PricewaterhouseCoopers BNY Mellon Fund Services (Ireland) Designated Activity Company
Chartered Accountants and Statutory Auditors One Dockland Central
One Spencer Dock Guild Street
North Wall Quay International Financial Services Centre
Dublin 1 Dublin 1
Ireland D01 E4XO
Ireland
Secretary:
MFD Secretaries Limited Depositary:
32 Molesworth Street The Bank of New York Mellon SA/NV, Dublin Branch
Dublin 2 Riverside Two
D02 Y512 Sir John Rogerson’s Quay
Ireland Grand Canal Dock
Dublin 2
D02 KV60
Legal Advisers to the Company: Ireland
Arthur Cox LLP
Ten Earlsfort Terrace Sub - Custodian:
Dublin 2 The Bank of New York Mellon
D02 T380 240 Greenwich Street
Ireland New York, NY 10286
United States
Paying Agent:
The Bank of New York Mellon, London Branch
One Canada Square Swiss Paying Agent:
Canary Wharf BNP Paribas Securities Services Paris
London E14 5AL Succursale de Zurich,
United Kingdom Selnaustrasse
16, 8002
Zurich
*** Effective 6 December 2021, the registered office and the Manager changed their address from Central Quay, Riverside IV, Sir John Rogerson’s Quay,
Dublin 2, D02 RR77, Ireland to Ground Floor, 2 Cumberland Place, Fenian Street, Dublin 2, D02 H0V5, Ireland.
6 Invesco Markets III plc
Investment Policy and Description of the Funds
Investment Strategy for the Financial Period
Invesco EQQQ NASDAQ-100 UCITS ETF The investment objective of the Fund is to provide investors with investment results which, before expenses, generally correspond to the price and yield
performance of the NASDAQ-100 Notional Index (Net Total Return) (the “Index”) in US Dollar terms. The Investment Manager uses the full physical
replication method of the ‘index tracking’ strategy whereby the Fund will so far as possible and practicable hold all of the components of the Index in their
respective weightings subject to the investment restrictions as disclosed in the Fund’s Prospectus.
Invesco FTSE RAFI US 1000 UCITS ETF The investment objective of the Fund is to provide investors with investment results which, before expenses, correspond to the price and yield performance of
the FTSE RAFI US 1000 Index (Net Total Return) (the “Index”) in US Dollar terms. The Investment Manager uses the full physical replication method of the
‘index-tracking’ strategy whereby the Fund will so far as possible and practicable hold all of the components of the Index in their respective weightings subject
to the investment restrictions as disclosed in the Fund’s Prospectus.
Invesco S&P 500 High Dividend Low Volatility UCITS ETF The investment objective of the Fund is to generate income, together with capital growth which, before expenses, would correspond to, or track, the return on
the S&P 500 Low Volatility High Dividend Index (Net Total Return) (the “Index”) in US Dollar terms. The Investment Manager uses a full physical
replication method of the ‘index-tracking’ strategy whereby the Fund will, so far as possible and practicable hold all the components of the Index in their
respective weightings subject to the investment restrictions as disclosed in the Fund’s Prospectus.
Invesco S&P 500 QVM UCITS ETF
The investment objective of the Fund is to provide investors with investment results which, before expenses, correspond to the price and yield performance of
the S&P 500 Quality, Value and Momentum Multi-Factor Index (Net Total Return) (the “Index”) in US Dollar terms. The Investment Manager uses a full
physical replication method of the ‘index-tracking’ strategy whereby the Fund would, so far as possible and practicable hold all the components of the Index in
their respective weightings subject to the investment restrictions as disclosed in the Fund’s Prospectus.
Invesco Global Buyback Achievers UCITS ETF The investment objective of the Fund is to provide investors with investment results which, before expenses, correspond to the price and yield performance of
the NASDAQ Global Buyback Achievers Index (Net Total Return) (the “Index”) in US Dollar terms. The Investment Manager uses the full physical
replication method of the ‘index-tracking’ strategy whereby the Fund will so far as possible and practicable hold all of the components of the Index in their
respective weightings subject to the investment restrictions as disclosed in the Fund’s Prospectus.
Invesco FTSE RAFI All-World 3000 UCITS ETF The investment objective of the Fund is to provide investors with investment results which, before expenses, correspond to the price and yield performance of
the FTSE RAFI All-World 3000 Index (Net Total Return) (the “Index”) in US Dollar terms. The Investment Manager uses an optimal sampling method of the
‘index-tracking’ strategy whereby the Fund will so far as possible and practicable hold a sample of the components of the Index subject to the investment
restrictions as disclosed in the Fund’s Prospectus.
Invesco FTSE RAFI Emerging Markets UCITS ETF The investment objective of the Fund is to provide investors with investment results which, before expenses, correspond to the price and yield performance of
the FTSE RAFI Emerging Markets Index (Net Total Return) (the “Index”) in US Dollar terms. The Investment Manager uses the full physical replication
method of the ‘index-tracking’ strategy whereby the Fund will so far as possible and practicable, hold all of the components in the Index in their respective
weightings, subject to the investment restrictions as disclosed in the Fund’s Prospectus.
Invesco FTSE RAFI Europe UCITS ETF The investment objective of the Fund is to provide investment results which, before expenses, correspond to the price and yield performance of the FTSE
RAFI Europe Index (Net Total Return) (the “Index”) in Euro terms. The Investment Manager uses the full physical replication method of the 'index-tracking'
strategy whereby the Fund will, so far as possible and practicable, hold all of the components of the Index in their respective weightings subject to the
investment restrictions as disclosed in the Fund’s Prospectus.
Invesco EURO STOXX High Dividend Low Volatility UCITS ETF The investment objective of the Fund is to generate income, together with capital growth which, before expenses, correspond to, or track the return on the
EURO iSTOXX High Dividend Low Volatility 50 Index (Net Total Return) (the “Index”) in Euro terms. The Investment Manager uses full physical
replication method of the ‘index-tracking’ strategy whereby the Fund will so far as possible and practicable, hold all of the components in the Index in their
respective weightings, subject to the investment restrictions as disclosed in the Fund’s Prospectus.
Invesco FTSE Emerging Markets High Dividend Low Volatility UCITS ETF The investment objective of the Fund is to generate income, together with capital growth which, before expenses, would correspond to, or track, the return on
the FTSE Emerging High Dividend Low Volatility Index (Net Total Return) (the “Index”) in US Dollar terms. The Investment Manager uses a full physical
replication method of the ‘index-tracking’ strategy whereby the Fund will so far as possible and practicable hold all the components of the Index in their
respective weightings, subject to the investment restrictions as disclosed in the Fund’s Prospectus.
Invesco FTSE RAFI UK 100 UCITS ETF The investment objective of the Fund is to provide investors with investment results which, before expenses, correspond to the price and yield performance of
the FTSE RAFI UK 100 Index (Net Total Return) (the “Index”) in Sterling terms. The Investment Manager uses the full physical replication method of the
‘index-tracking’ strategy whereby the Fund will so far as possible and practicable hold all of the components of the Index in their respective weightings,
subject to the investment restrictions as disclosed in the Fund’s Prospectus.
Invesco Euro Cash 3 Months UCITS ETF (formerly Invesco EuroMTS Cash 3 Months UCITS ETF)* The investment objective of the Fund is to provide investors with investment results which, before expenses, correspond to the price and yield performance of
the FTSE Eurozone Government Bill 0-6 Month Capped Index* (the “Index”) in Euro terms. The Investment Manager uses an optimal sampling method of the
'index tracking' strategy whereby the Fund will so far as possible and practicable hold a sample of the components of the Index.
7 Invesco Markets III plc
Investment Policy and Description of the Funds (continued)
Investment Strategy for the Financial Period (continued)
Invesco US High Yield Fallen Angels UCITS ETF The investment objective of the Fund is to provide investors with investment results which, before expenses, correspond to the price and yield performance of
the FTSE Time-Weighted US Fallen Angel Bond Select Index (the “Index”) in US Dollar terms. The Investment Manager uses an optimal sampling method of
the ‘index-tracking’ strategy whereby the Fund will so far as possible and practicable hold a sample of the components of the Index.
8 Invesco Markets III plc
Investment Manager’s Report
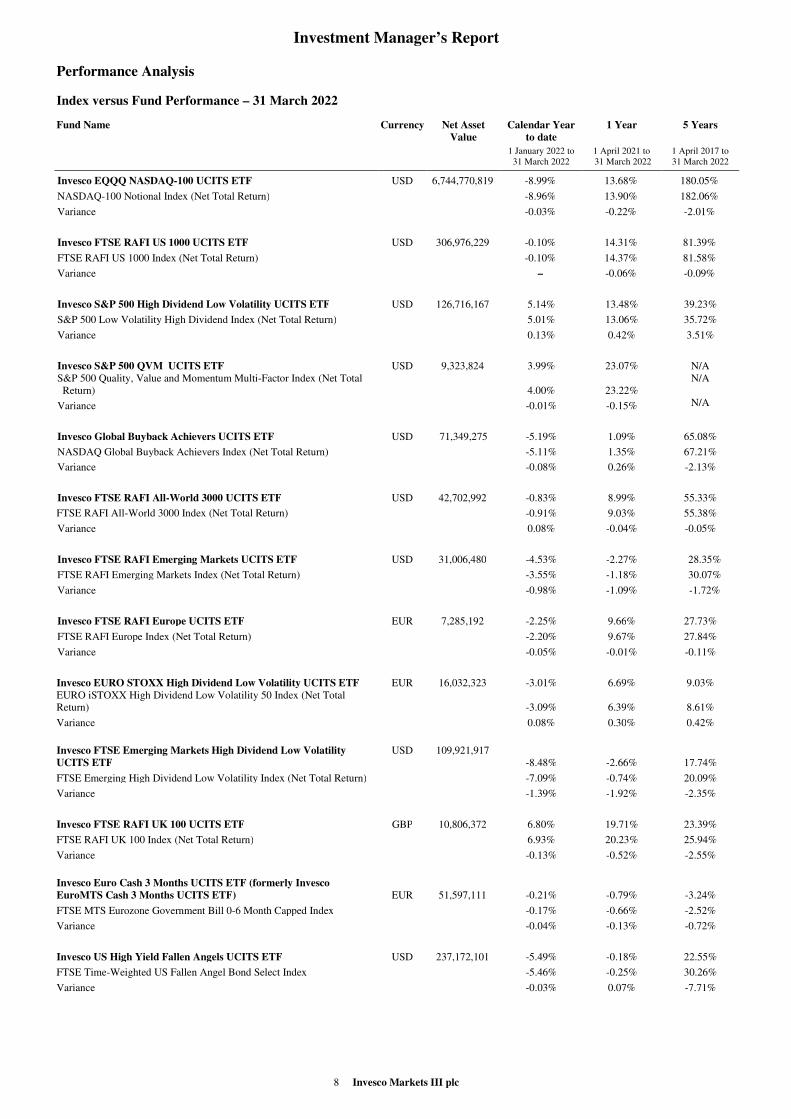
Performance Analysis
Index versus Fund Performance – 31 March 2022
Fund Name Currency Net Asset
Value
Calendar Year
to date
1 Year 5 Years
1 January 2022 to
31 March 2022
1 April 2021 to
31 March 2022
1 April 2017 to
31 March 2022
Invesco EQQQ NASDAQ-100 UCITS ETF USD 6,744,770,819 -8.99% 13.68% 180.05%
NASDAQ-100 Notional Index (Net Total Return) -8.96% 13.90% 182.06%
Variance -0.03% -0.22% -2.01%
Invesco FTSE RAFI US 1000 UCITS ETF USD 306,976,229 -0.10% 14.31% 81.39%
FTSE RAFI US 1000 Index (Net Total Return) -0.10% 14.37% 81.58%
Variance – -0.06% -0.09%
Invesco S&P 500 High Dividend Low Volatility UCITS ETF USD 126,716,167 5.14% 13.48% 39.23% S&P 500 Low Volatility High Dividend Index (Net Total Return) 5.01% 13.06% 35.72% Variance 0.13% 0.42% 3.51%
Invesco S&P 500 QVM UCITS ETF USD 9,323,824 3.99% 23.07% N/A
S&P 500 Quality, Value and Momentum Multi-Factor Index (Net Total
Return) 4.00% 23.22% N/A
Variance -0.01% -0.15% N/A
Invesco Global Buyback Achievers UCITS ETF USD 71,349,275 -5.19% 1.09% 65.08%
NASDAQ Global Buyback Achievers Index (Net Total Return) -5.11% 1.35% 67.21%
Variance -0.08% 0.26% -2.13%
Invesco FTSE RAFI All-World 3000 UCITS ETF USD 42,702,992 -0.83% 8.99% 55.33%
FTSE RAFI All-World 3000 Index (Net Total Return) -0.91% 9.03% 55.38%
Variance 0.08% -0.04% -0.05%
Invesco FTSE RAFI Emerging Markets UCITS ETF USD 31,006,480 -4.53% -2.27% 28.35%
FTSE RAFI Emerging Markets Index (Net Total Return) -3.55% -1.18% 30.07%
Variance -0.98% -1.09% -1.72%
Invesco FTSE RAFI Europe UCITS ETF EUR 7,285,192 -2.25% 9.66% 27.73% FTSE RAFI Europe Index (Net Total Return) -2.20% 9.67% 27.84% Variance -0.05% -0.01% -0.11%
Invesco EURO STOXX High Dividend Low Volatility UCITS ETF EUR 16,032,323 -3.01% 6.69% 9.03% EURO iSTOXX High Dividend Low Volatility 50 Index (Net Total
Return) -3.09% 6.39% 8.61% Variance 0.08% 0.30% 0.42%
Invesco FTSE Emerging Markets High Dividend Low Volatility
UCITS ETF
USD 109,921,917
-8.48% -2.66% 17.74% FTSE Emerging High Dividend Low Volatility Index (Net Total Return) -7.09% -0.74% 20.09% Variance -1.39% -1.92% -2.35%
Invesco FTSE RAFI UK 100 UCITS ETF GBP 10,806,372 6.80% 19.71% 23.39% FTSE RAFI UK 100 Index (Net Total Return) 6.93% 20.23% 25.94% Variance -0.13% -0.52% -2.55%
Invesco Euro Cash 3 Months UCITS ETF (formerly Invesco
EuroMTS Cash 3 Months UCITS ETF) EUR 51,597,111 -0.21% -0.79% -3.24%
FTSE MTS Eurozone Government Bill 0-6 Month Capped Index -0.17% -0.66% -2.52%
Variance -0.04% -0.13% -0.72%
Invesco US High Yield Fallen Angels UCITS ETF USD 237,172,101 -5.49% -0.18% 22.55%
FTSE Time-Weighted US Fallen Angel Bond Select Index -5.46% -0.25% 30.26%
Variance -0.03% 0.07% -7.71%
9 Invesco Markets III plc
Investment Manager’s Report (continued)
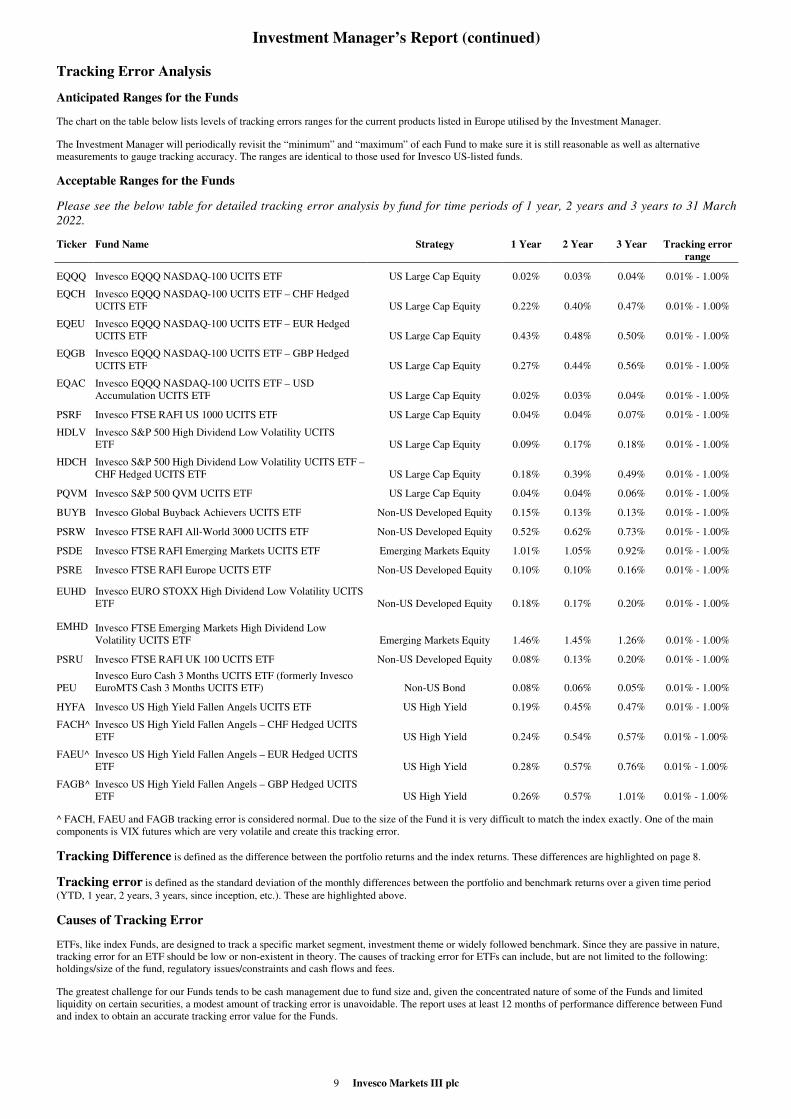
Tracking Error Analysis
Anticipated Ranges for the Funds
The chart on the table below lists levels of tracking errors ranges for the current products listed in Europe utilised by the Investment Manager.
The Investment Manager will periodically revisit the “minimum” and “maximum” of each Fund to make sure it is still reasonable as well as alternative
measurements to gauge tracking accuracy. The ranges are identical to those used for Invesco US-listed funds.
Acceptable Ranges for the Funds
Please see the below table for detailed tracking error analysis by fund for time periods of 1 year, 2 years and 3 years to 31 March
2022.
Ticker Fund Name Strategy 1 Year 2 Year 3 Year Tracking error
range
EQQQ Invesco EQQQ NASDAQ-100 UCITS ETF US Large Cap Equity 0.02% 0.03% 0.04% 0.01% - 1.00%
EQCH Invesco EQQQ NASDAQ-100 UCITS ETF – CHF Hedged
UCITS ETF US Large Cap Equity 0.22% 0.40% 0.47% 0.01% - 1.00%
EQEU Invesco EQQQ NASDAQ-100 UCITS ETF – EUR Hedged
UCITS ETF US Large Cap Equity 0.43% 0.48% 0.50% 0.01% - 1.00%
EQGB Invesco EQQQ NASDAQ-100 UCITS ETF – GBP Hedged
UCITS ETF US Large Cap Equity 0.27% 0.44% 0.56% 0.01% - 1.00%
EQAC Invesco EQQQ NASDAQ-100 UCITS ETF – USD
Accumulation UCITS ETF US Large Cap Equity 0.02% 0.03% 0.04% 0.01% - 1.00%
PSRF Invesco FTSE RAFI US 1000 UCITS ETF US Large Cap Equity 0.04% 0.04% 0.07% 0.01% - 1.00%
HDLV Invesco S&P 500 High Dividend Low Volatility UCITS
ETF US Large Cap Equity 0.09% 0.17% 0.18% 0.01% - 1.00%
HDCH Invesco S&P 500 High Dividend Low Volatility UCITS ETF –
CHF Hedged UCITS ETF US Large Cap Equity 0.18% 0.39% 0.49% 0.01% - 1.00%
PQVM Invesco S&P 500 QVM UCITS ETF US Large Cap Equity 0.04% 0.04% 0.06% 0.01% - 1.00%
BUYB Invesco Global Buyback Achievers UCITS ETF Non-US Developed Equity 0.15% 0.13% 0.13% 0.01% - 1.00%
PSRW Invesco FTSE RAFI All-World 3000 UCITS ETF Non-US Developed Equity 0.52% 0.62% 0.73% 0.01% - 1.00%
PSDE Invesco FTSE RAFI Emerging Markets UCITS ETF Emerging Markets Equity 1.01% 1.05% 0.92% 0.01% - 1.00%
PSRE Invesco FTSE RAFI Europe UCITS ETF Non-US Developed Equity 0.10% 0.10% 0.16% 0.01% - 1.00%
EUHD Invesco EURO STOXX High Dividend Low Volatility UCITS
ETF Non-US Developed Equity 0.18% 0.17% 0.20% 0.01% - 1.00%
EMHD Invesco FTSE Emerging Markets High Dividend Low
Volatility UCITS ETF
Emerging Markets Equity 1.46% 1.45% 1.26% 0.01% - 1.00%
PSRU Invesco FTSE RAFI UK 100 UCITS ETF Non-US Developed Equity 0.08% 0.13% 0.20% 0.01% - 1.00%
PEU
Invesco Euro Cash 3 Months UCITS ETF (formerly Invesco
EuroMTS Cash 3 Months UCITS ETF) Non-US Bond 0.08% 0.06% 0.05% 0.01% - 1.00%
HYFA Invesco US High Yield Fallen Angels UCITS ETF US High Yield 0.19% 0.45% 0.47% 0.01% - 1.00%
FACH^ Invesco US High Yield Fallen Angels – CHF Hedged UCITS
ETF US High Yield 0.24% 0.54% 0.57% 0.01% - 1.00%
FAEU^ Invesco US High Yield Fallen Angels – EUR Hedged UCITS
ETF US High Yield 0.28% 0.57% 0.76% 0.01% - 1.00%
FAGB^ Invesco US High Yield Fallen Angels – GBP Hedged UCITS
ETF US High Yield 0.26% 0.57% 1.01% 0.01% - 1.00%
^ FACH, FAEU and FAGB tracking error is considered normal. Due to the size of the Fund it is very difficult to match the index exactly. One of the main
components is VIX futures which are very volatile and create this tracking error.
Tracking Difference is defined as the difference between the portfolio returns and the index returns. These differences are highlighted on page 8.
Tracking error is defined as the standard deviation of the monthly differences between the portfolio and benchmark returns over a given time period
(YTD, 1 year, 2 years, 3 years, since inception, etc.). These are highlighted above.
Causes of Tracking Error
ETFs, like index Funds, are designed to track a specific market segment, investment theme or widely followed benchmark. Since they are passive in nature,
tracking error for an ETF should be low or non-existent in theory. The causes of tracking error for ETFs can include, but are not limited to the following:
holdings/size of the fund, regulatory issues/constraints and cash flows and fees.
The greatest challenge for our Funds tends to be cash management due to fund size and, given the concentrated nature of some of the Funds and limited
liquidity on certain securities, a modest amount of tracking error is unavoidable. The report uses at least 12 months of performance difference between Fund
and index to obtain an accurate tracking error value for the Funds.
10 Invesco Markets III plc
Investment Manager’s Report (continued)
Tracking Error Analysis (continued)
Tracking Error Exception
At the direction of the Board of the Company, we have been providing a quarterly tracking error analysis using the tracking error ranges noted as a reference
point. The Investment Manager will periodically revisit the “minimum” and “maximum” of each Fund to make sure it is still appropriate as well as alternative
measurements to gauge tracking accuracy.
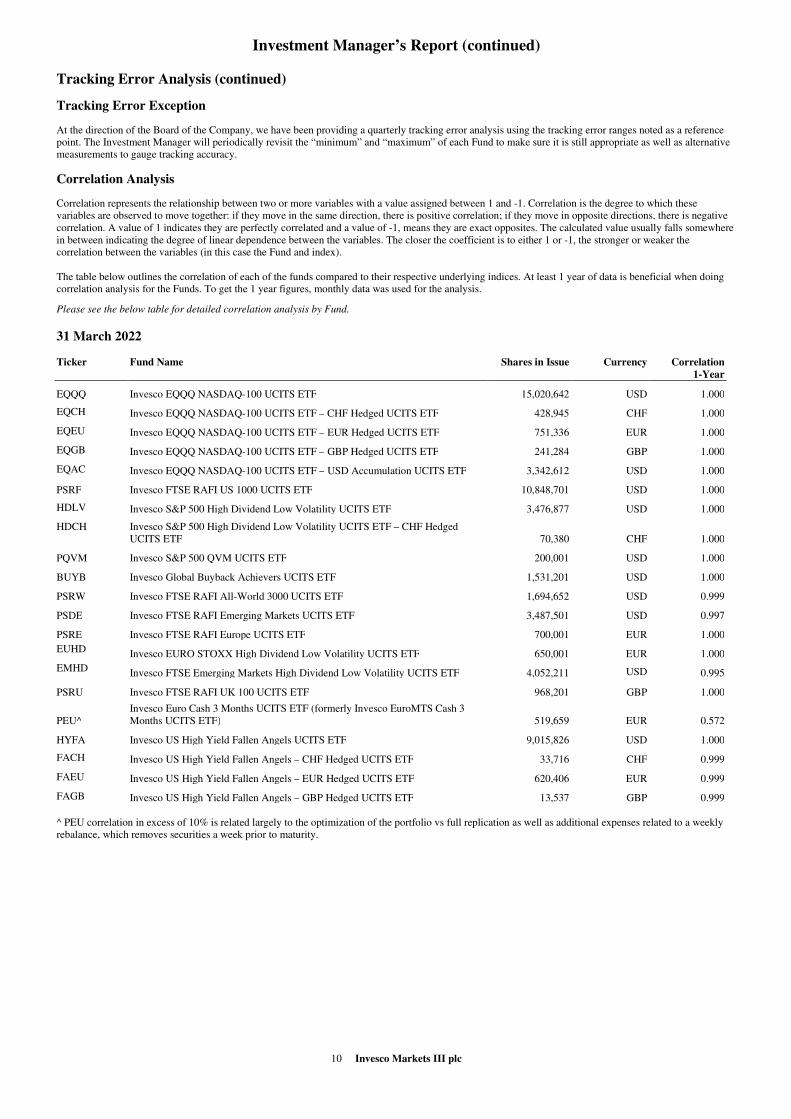
Correlation Analysis
Correlation represents the relationship between two or more variables with a value assigned between 1 and -1. Correlation is the degree to which these
variables are observed to move together: if they move in the same direction, there is positive correlation; if they move in opposite directions, there is negative
correlation. A value of 1 indicates they are perfectly correlated and a value of -1, means they are exact opposites. The calculated value usually falls somewhere
in between indicating the degree of linear dependence between the variables. The closer the coefficient is to either 1 or -1, the stronger or weaker the
correlation between the variables (in this case the Fund and index).
The table below outlines the correlation of each of the funds compared to their respective underlying indices. At least 1 year of data is beneficial when doing
correlation analysis for the Funds. To get the 1 year figures, monthly data was used for the analysis.
Please see the below table for detailed correlation analysis by Fund.
31 March 2022
Ticker
Fund Name
Shares in Issue
Currency
Correlation
1-Year
EQQQ Invesco EQQQ NASDAQ-100 UCITS ETF 15,020,642 USD 1.000
EQCH Invesco EQQQ NASDAQ-100 UCITS ETF – CHF Hedged UCITS ETF 428,945 CHF 1.000
EQEU Invesco EQQQ NASDAQ-100 UCITS ETF – EUR Hedged UCITS ETF 751,336 EUR 1.000
EQGB Invesco EQQQ NASDAQ-100 UCITS ETF – GBP Hedged UCITS ETF 241,284 GBP 1.000
EQAC Invesco EQQQ NASDAQ-100 UCITS ETF – USD Accumulation UCITS ETF 3,342,612 USD 1.000
PSRF Invesco FTSE RAFI US 1000 UCITS ETF 10,848,701 USD 1.000
HDLV Invesco S&P 500 High Dividend Low Volatility UCITS ETF 3,476,877 USD 1.000
HDCH Invesco S&P 500 High Dividend Low Volatility UCITS ETF – CHF Hedged
UCITS ETF 70,380 CHF 1.000
PQVM Invesco S&P 500 QVM UCITS ETF 200,001 USD 1.000
BUYB Invesco Global Buyback Achievers UCITS ETF 1,531,201 USD 1.000
PSRW Invesco FTSE RAFI All-World 3000 UCITS ETF 1,694,652 USD 0.999
PSDE Invesco FTSE RAFI Emerging Markets UCITS ETF 3,487,501 USD 0.997
PSRE Invesco FTSE RAFI Europe UCITS ETF 700,001 EUR 1.000
EUHD Invesco EURO STOXX High Dividend Low Volatility UCITS ETF 650,001 EUR 1.000
EMHD Invesco FTSE Emerging Markets High Dividend Low Volatility UCITS ETF 4,052,211 USD 0.995
PSRU Invesco FTSE RAFI UK 100 UCITS ETF 968,201 GBP 1.000
PEU^
Invesco Euro Cash 3 Months UCITS ETF (formerly Invesco EuroMTS Cash 3
Months UCITS ETF) 519,659 EUR 0.572
HYFA Invesco US High Yield Fallen Angels UCITS ETF 9,015,826 USD 1.000
FACH Invesco US High Yield Fallen Angels – CHF Hedged UCITS ETF 33,716 CHF 0.999
FAEU Invesco US High Yield Fallen Angels – EUR Hedged UCITS ETF 620,406 EUR 0.999
FAGB Invesco US High Yield Fallen Angels – GBP Hedged UCITS ETF 13,537 GBP 0.999
^ PEU correlation in excess of 10% is related largely to the optimization of the portfolio vs full replication as well as additional expenses related to a weekly
rebalance, which removes securities a week prior to maturity.
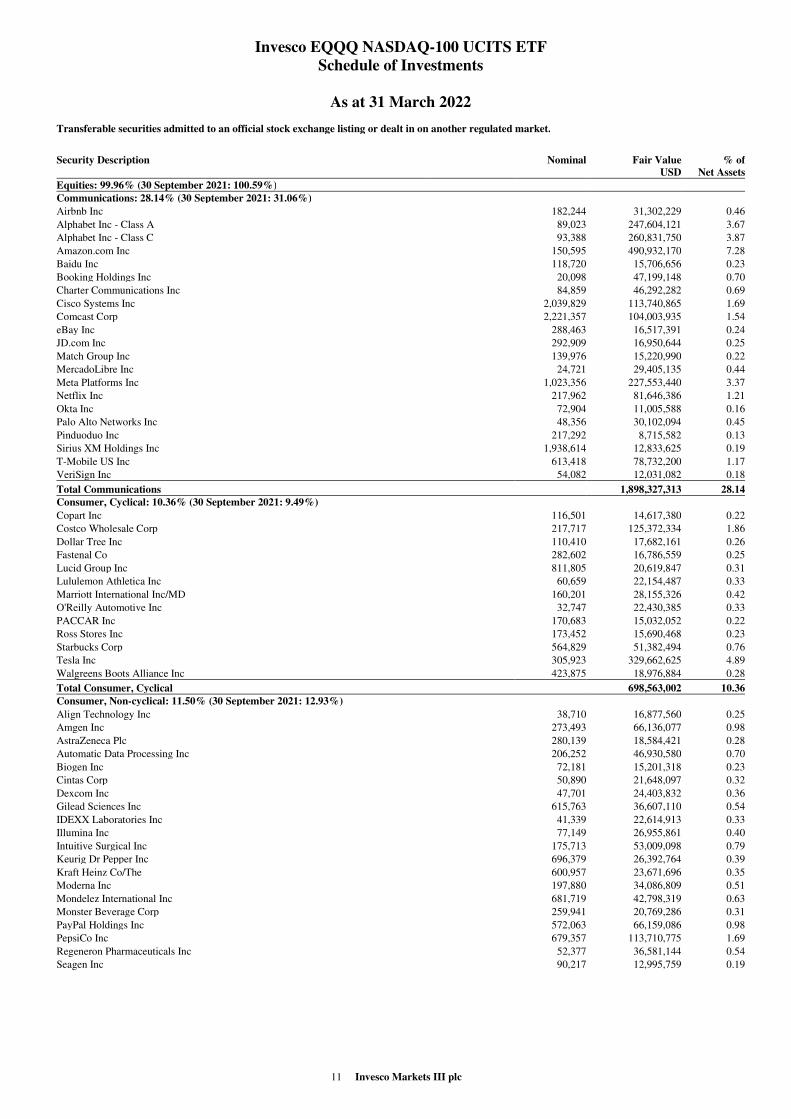
11 Invesco Markets III plc
Invesco EQQQ NASDAQ-100 UCITS ETF
Schedule of Investments
As at 31 March 2022
Transferable securities admitted to an official stock exchange listing or dealt in on another regulated market.
Security Description
Nominal Fair Value
USD
% of
Net Assets
Equities: 99.96% (30 September 2021: 100.59%)
Communications: 28.14% (30 September 2021: 31.06%)
Airbnb Inc 182,244 31,302,229 0.46
Alphabet Inc - Class A 89,023 247,604,121 3.67
Alphabet Inc - Class C 93,388 260,831,750 3.87
Amazon.com Inc 150,595 490,932,170 7.28
Baidu Inc 118,720 15,706,656 0.23
Booking Holdings Inc 20,098 47,199,148 0.70
Charter Communications Inc 84,859 46,292,282 0.69
Cisco Systems Inc 2,039,829 113,740,865 1.69
Comcast Corp 2,221,357 104,003,935 1.54
eBay Inc 288,463 16,517,391 0.24
JD.com Inc 292,909 16,950,644 0.25
Match Group Inc 139,976 15,220,990 0.22
MercadoLibre Inc 24,721 29,405,135 0.44
Meta Platforms Inc 1,023,356 227,553,440 3.37
Netflix Inc 217,962 81,646,386 1.21
Okta Inc 72,904 11,005,588 0.16
Palo Alto Networks Inc 48,356 30,102,094 0.45
Pinduoduo Inc 217,292 8,715,582 0.13
Sirius XM Holdings Inc 1,938,614 12,833,625 0.19
T-Mobile US Inc 613,418 78,732,200 1.17
VeriSign Inc 54,082 12,031,082 0.18
Total Communications 1,898,327,313 28.14
Consumer, Cyclical: 10.36% (30 September 2021: 9.49%)
Copart Inc 116,501 14,617,380 0.22
Costco Wholesale Corp 217,717 125,372,334 1.86
Dollar Tree Inc 110,410 17,682,161 0.26
Fastenal Co 282,602 16,786,559 0.25
Lucid Group Inc 811,805 20,619,847 0.31
Lululemon Athletica Inc 60,659 22,154,487 0.33
Marriott International Inc/MD 160,201 28,155,326 0.42
O'Reilly Automotive Inc 32,747 22,430,385 0.33
PACCAR Inc 170,683 15,032,052 0.22
Ross Stores Inc 173,452 15,690,468 0.23
Starbucks Corp 564,829 51,382,494 0.76
Tesla Inc 305,923 329,662,625 4.89
Walgreens Boots Alliance Inc 423,875 18,976,884 0.28
Total Consumer, Cyclical 698,563,002 10.36
Consumer, Non-cyclical: 11.50% (30 September 2021: 12.93%)
Align Technology Inc 38,710 16,877,560 0.25
Amgen Inc 273,493 66,136,077 0.98
AstraZeneca Plc 280,139 18,584,421 0.28
Automatic Data Processing Inc 206,252 46,930,580 0.70
Biogen Inc 72,181 15,201,318 0.23
Cintas Corp 50,890 21,648,097 0.32
Dexcom Inc 47,701 24,403,832 0.36
Gilead Sciences Inc 615,763 36,607,110 0.54
IDEXX Laboratories Inc 41,339 22,614,913 0.33
Illumina Inc 77,149 26,955,861 0.40
Intuitive Surgical Inc 175,713 53,009,098 0.79
Keurig Dr Pepper Inc 696,379 26,392,764 0.39
Kraft Heinz Co/The 600,957 23,671,696 0.35
Moderna Inc 197,880 34,086,809 0.51
Mondelez International Inc 681,719 42,798,319 0.63
Monster Beverage Corp 259,941 20,769,286 0.31
PayPal Holdings Inc 572,063 66,159,086 0.98
PepsiCo Inc 679,357 113,710,775 1.69
Regeneron Pharmaceuticals Inc 52,377 36,581,144 0.54
Seagen Inc 90,217 12,995,759 0.19

12 Invesco Markets III plc
Invesco EQQQ NASDAQ-100 UCITS ETF
Schedule of Investments
As at 31 March 2022 (continued)
Security Description
Nominal Fair Value
USD
% of
Net Assets
Equities: 99.96% (30 September 2021: 100.59%) (continued)
Consumer, Non-cyclical: 11.50% (30 September 2021: 12.93%) (continued)
Verisk Analytics Inc 79,236 17,006,423 0.25
Vertex Pharmaceuticals Inc 124,973 32,614,204 0.48
Total Consumer, Non-cyclical 775,755,132 11.50
Industrial: 1.82% (30 September 2021: 1.54%)
CSX Corp 1,077,053 40,335,635 0.60
Honeywell International Inc 336,729 65,520,729 0.97
Old Dominion Freight Line Inc 56,362 16,834,202 0.25
Total Industrial 122,690,566 1.82
Technology: 47.01% (30 September 2021: 44.69%)
Activision Blizzard Inc 382,634 30,652,810 0.46
Adobe Inc 231,955 105,683,337 1.57
Advanced Micro Devices Inc 799,073 87,370,642 1.30
Analog Devices Inc 256,929 42,439,532 0.63
ANSYS Inc 42,827 13,603,997 0.20
Apple Inc 4,830,152 843,392,841 12.51
Applied Materials Inc 433,832 57,179,058 0.85
ASML Holding NV 40,724 27,200,781 0.40
Atlassian Corp Plc 69,278 20,355,955 0.30
Autodesk Inc 107,998 23,149,371 0.34
Broadcom Inc 201,104 126,631,167 1.88
Cadence Design Systems Inc 136,146 22,390,571 0.33
Cognizant Technology Solutions Corp 257,602 23,099,171 0.34
Crowdstrike Holdings Inc 102,233 23,215,070 0.34
Datadog Inc 129,790 19,659,291 0.29
DocuSign Inc 97,130 10,404,566 0.16
Electronic Arts Inc 138,052 17,464,958 0.26
Fiserv Inc 320,208 32,469,091 0.48
Fortinet Inc 79,020 27,004,295 0.40
Intel Corp 1,999,562 99,098,293 1.47
Intuit Inc 139,062 66,866,572 0.99
KLA Corp 74,023 27,096,859 0.40
Lam Research Corp 68,512 36,832,736 0.55
Marvell Technology Inc 414,329 29,711,533 0.44
Microchip Technology Inc 273,014 20,514,272 0.30
Micron Technology Inc 549,850 42,827,816 0.64
Microsoft Corp 2,218,904 684,110,292 10.14
NetEase Inc 102,820 9,221,926 0.14
NVIDIA Corp 1,041,361 284,145,762 4.21
NXP Semiconductors NV 128,872 23,851,630 0.35
Paychex Inc 177,105 24,169,519 0.36
QUALCOMM Inc 553,406 84,571,505 1.25
Skyworks Solutions Inc 80,494 10,728,240 0.16
Splunk Inc 77,973 11,587,568 0.17
Synopsys Inc 75,125 25,036,909 0.37
Texas Instruments Inc 453,479 83,204,327 1.23
Workday Inc 96,265 23,051,617 0.34
Zoom Video Communications Inc 118,944 13,943,805 0.21
Zscaler Inc 68,781 16,595,480 0.25
Total Technology 3,170,533,165 47.01
Utilities: 1.13% (30 September 2021: 0.88%)
American Electric Power Co Inc 247,555 24,698,562 0.37
Constellation Energy Corp 160,263 9,014,794 0.13
Exelon Corp 481,271 22,922,938 0.34
Xcel Energy Inc 267,244 19,286,999 0.29
Total Utilities 75,923,293 1.13
Total Equities 6,741,792,471 99.96
Total Value of Investments 6,741,792,471 99.96
13 Invesco Markets III plc
Invesco EQQQ NASDAQ-100 UCITS ETF
Schedule of Investments
As at 31 March 2022 (continued)
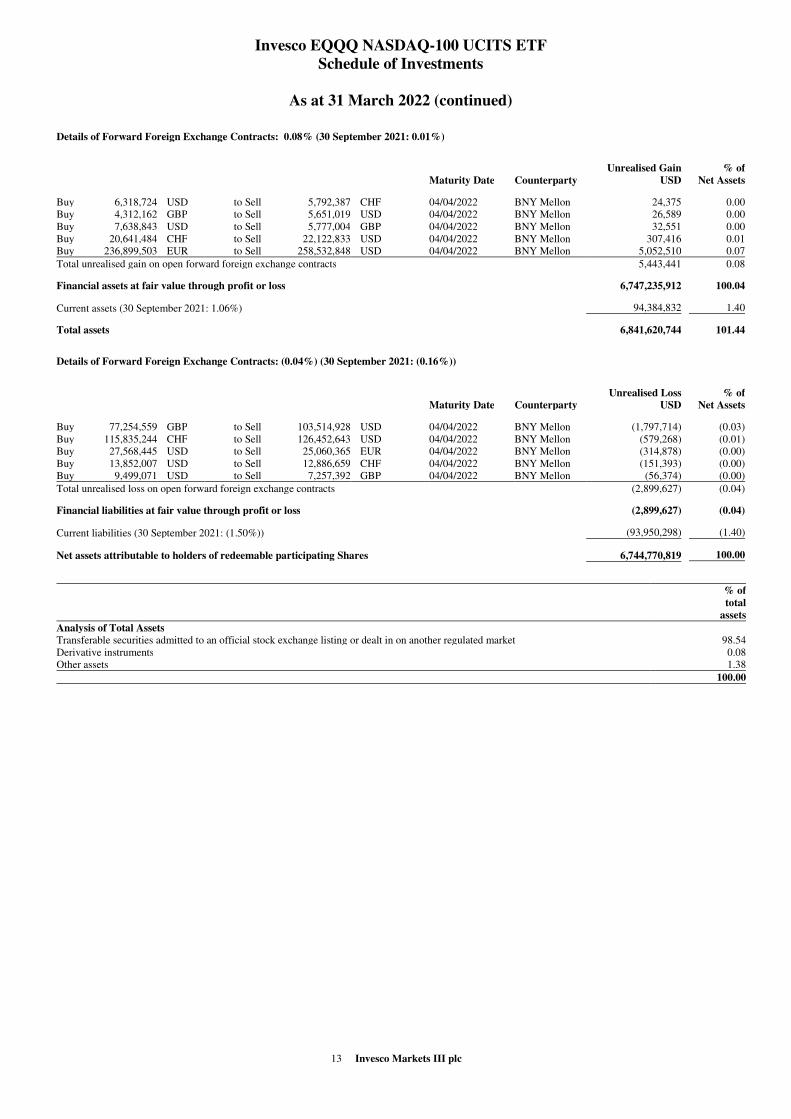
Details of Forward Foreign Exchange Contracts: 0.08% (30 September 2021: 0.01%)
Maturity Date Counterparty
Unrealised Gain
USD
% of
Net Assets
Buy 6,318,724 USD to Sell 5,792,387 CHF 04/04/2022 BNY Mellon 24,375 0.00
Buy 4,312,162 GBP to Sell 5,651,019 USD 04/04/2022 BNY Mellon 26,589 0.00
Buy 7,638,843 USD to Sell 5,777,004 GBP 04/04/2022 BNY Mellon 32,551 0.00
Buy 20,641,484 CHF to Sell 22,122,833 USD 04/04/2022 BNY Mellon 307,416 0.01
Buy 236,899,503 EUR to Sell 258,532,848 USD 04/04/2022 BNY Mellon 5,052,510 0.07
Total unrealised gain on open forward foreign exchange contracts 5,443,441 0.08
Financial assets at fair value through profit or loss 6,747,235,912 100.04
Current assets (30 September 2021: 1.06%) 94,384,832 1.40
Total assets 6,841,620,744 101.44
Details of Forward Foreign Exchange Contracts: (0.04%) (30 September 2021: (0.16%))
Maturity Date Counterparty
Unrealised Loss
USD
% of
Net Assets
Buy 77,254,559 GBP to Sell 103,514,928 USD 04/04/2022 BNY Mellon (1,797,714) (0.03)
Buy 115,835,244 CHF to Sell 126,452,643 USD 04/04/2022 BNY Mellon (579,268) (0.01)
Buy 27,568,445 USD to Sell 25,060,365 EUR 04/04/2022 BNY Mellon (314,878) (0.00)
Buy 13,852,007 USD to Sell 12,886,659 CHF 04/04/2022 BNY Mellon (151,393) (0.00)
Buy 9,499,071 USD to Sell 7,257,392 GBP 04/04/2022 BNY Mellon (56,374) (0.00)
Total unrealised loss on open forward foreign exchange contracts (2,899,627) (0.04)
Financial liabilities at fair value through profit or loss (2,899,627) (0.04)
Current liabilities (30 September 2021: (1.50%)) (93,950,298) (1.40)
Net assets attributable to holders of redeemable participating Shares 6,744,770,819 100.00
% of
total
assets
Analysis of Total Assets
Transferable securities admitted to an official stock exchange listing or dealt in on another regulated market 98.54
Derivative instruments 0.08
Other assets 1.38
100.00
14 Invesco Markets III plc
Invesco FTSE RAFI US 1000 UCITS ETF
Schedule of Investments
As at 31 March 2022
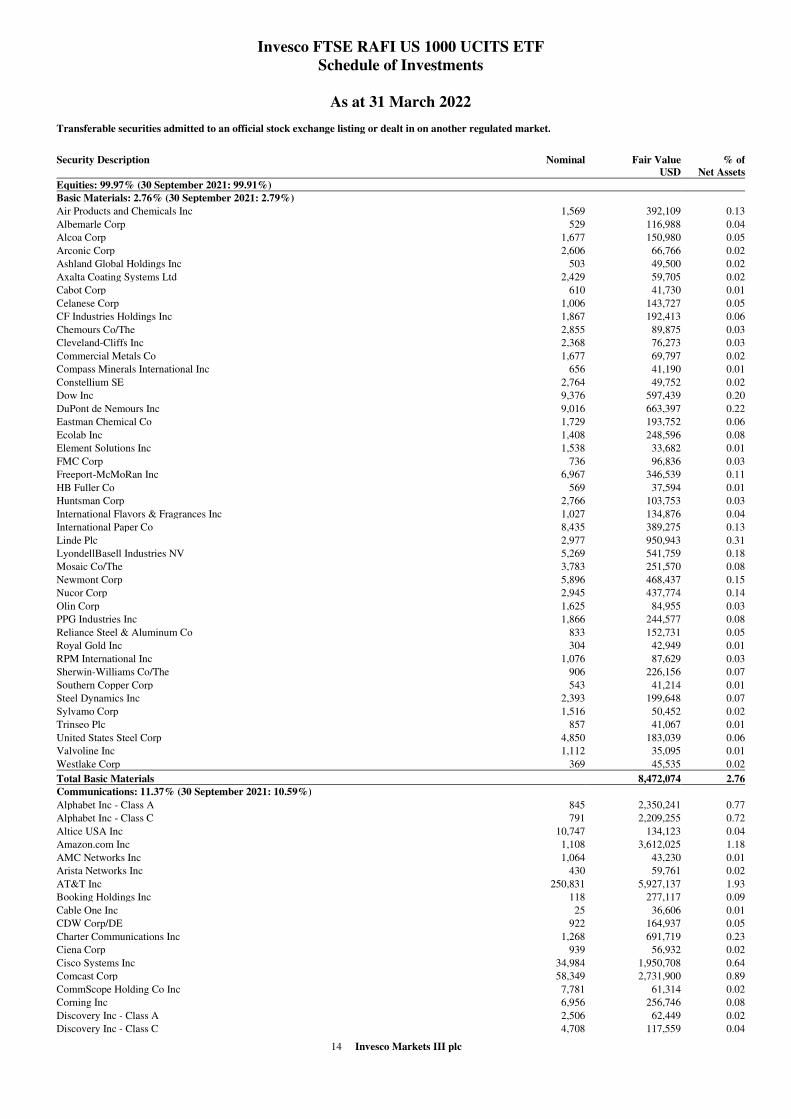
Transferable securities admitted to an official stock exchange listing or dealt in on another regulated market.
Security Description
Nominal Fair Value
USD
% of
Net Assets
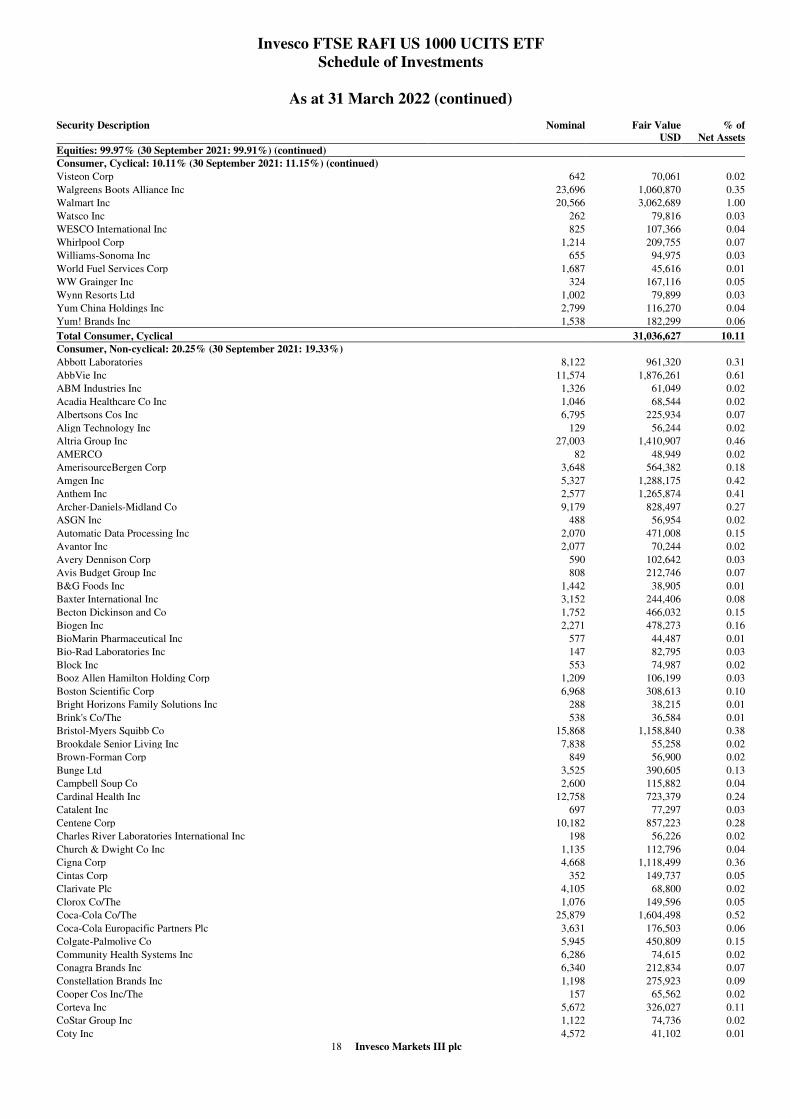
Equities: 99.97% (30 September 2021: 99.91%)
Basic Materials: 2.76% (30 September 2021: 2.79%)
Air Products and Chemicals Inc 1,569 392,109 0.13
Albemarle Corp 529 116,988 0.04
Alcoa Corp 1,677 150,980 0.05
Arconic Corp 2,606 66,766 0.02
Ashland Global Holdings Inc 503 49,500 0.02
Axalta Coating Systems Ltd 2,429 59,705 0.02
Cabot Corp 610 41,730 0.01
Celanese Corp 1,006 143,727 0.05
CF Industries Holdings Inc 1,867 192,413 0.06
Chemours Co/The 2,855 89,875 0.03
Cleveland-Cliffs Inc 2,368 76,273 0.03
Commercial Metals Co 1,677 69,797 0.02
Compass Minerals International Inc 656 41,190 0.01
Constellium SE 2,764 49,752 0.02
Dow Inc 9,376 597,439 0.20
DuPont de Nemours Inc 9,016 663,397 0.22
Eastman Chemical Co 1,729 193,752 0.06
Ecolab Inc 1,408 248,596 0.08
Element Solutions Inc 1,538 33,682 0.01
FMC Corp 736 96,836 0.03
Freeport-McMoRan Inc 6,967 346,539 0.11
HB Fuller Co 569 37,594 0.01
Huntsman Corp 2,766 103,753 0.03
International Flavors & Fragrances Inc 1,027 134,876 0.04
International Paper Co 8,435 389,275 0.13
Linde Plc 2,977 950,943 0.31
LyondellBasell Industries NV 5,269 541,759 0.18
Mosaic Co/The 3,783 251,570 0.08
Newmont Corp 5,896 468,437 0.15
Nucor Corp 2,945 437,774 0.14
Olin Corp 1,625 84,955 0.03
PPG Industries Inc 1,866 244,577 0.08
Reliance Steel & Aluminum Co 833 152,731 0.05
Royal Gold Inc 304 42,949 0.01
RPM International Inc 1,076 87,629 0.03
Sherwin-Williams Co/The 906 226,156 0.07
Southern Copper Corp 543 41,214 0.01
Steel Dynamics Inc 2,393 199,648 0.07
Sylvamo Corp 1,516 50,452 0.02
Trinseo Plc 857 41,067 0.01
United States Steel Corp 4,850 183,039 0.06
Valvoline Inc 1,112 35,095 0.01
Westlake Corp 369 45,535 0.02
Total Basic Materials 8,472,074 2.76
Communications: 11.37% (30 September 2021: 10.59%)
Alphabet Inc - Class A 845 2,350,241 0.77
Alphabet Inc - Class C 791 2,209,255 0.72
Altice USA Inc 10,747 134,123 0.04
Amazon.com Inc 1,108 3,612,025 1.18
AMC Networks Inc 1,064 43,230 0.01
Arista Networks Inc 430 59,761 0.02
AT&T Inc 250,831 5,927,137 1.93
Booking Holdings Inc 118 277,117 0.09
Cable One Inc 25 36,606 0.01
CDW Corp/DE 922 164,937 0.05
Charter Communications Inc 1,268 691,719 0.23
Ciena Corp 939 56,932 0.02
Cisco Systems Inc 34,984 1,950,708 0.64
Comcast Corp 58,349 2,731,900 0.89
CommScope Holding Co Inc 7,781 61,314 0.02
Corning Inc 6,956 256,746 0.08
Discovery Inc - Class A 2,506 62,449 0.02
Discovery Inc - Class C 4,708 117,559 0.04
15 Invesco Markets III plc
Invesco FTSE RAFI US 1000 UCITS ETF
Schedule of Investments
As at 31 March 2022 (continued)
Security Description
Nominal Fair Value
USD
% of
Net Assets
Equities: 99.97% (30 September 2021: 99.91%) (continued)
Communications: 11.37% (30 September 2021: 10.59%) (continued)
DISH Network Corp 5,869 185,754 0.06
eBay Inc 3,776 216,214 0.07
Expedia Group Inc 593 116,032 0.04
F5 Inc 313 65,401 0.02
FactSet Research Systems Inc 110 47,756 0.02
Fox Corp - Class A 3,807 150,186 0.05
Fox Corp - Class B 1,805 65,485 0.02
Frontier Communications Parent Inc 1,525 42,197 0.01
Gray Television Inc 2,173 47,958 0.02
IAC/InterActiveCorp 414 41,516 0.01
iHeartMedia Inc 2,993 56,657 0.02
Interpublic Group of Cos Inc/The 4,510 159,879 0.05
Juniper Networks Inc 3,618 134,445 0.04
Liberty Broadband Corp - Class A 114 14,941 0.01
Liberty Broadband Corp - Class C 684 92,559 0.03
Liberty Global Plc - Class A 5,244 133,774 0.04
Liberty Global Plc - Class C 10,221 264,826 0.09
Liberty Latin America Ltd - Class A 779 7,556 0.00
Liberty Latin America Ltd - Class C 3,000 28,770 0.01
Liberty Media Corp-Liberty Formula One - Class A 141 8,901 0.00
Liberty Media Corp-Liberty Formula One - Class C 1,178 82,272 0.03
Liberty Media Corp-Liberty SiriusXM - Class A 1,152 52,658 0.02
Liberty Media Corp-Liberty SiriusXM - Class C 1,993 91,140 0.03
Lumen Technologies Inc 56,773 639,832 0.21
Match Group Inc 381 41,430 0.01
Meta Platforms Inc 11,665 2,593,829 0.85
Motorola Solutions Inc 694 168,087 0.05
Netflix Inc 790 295,926 0.10
News Corp - Class A 3,871 85,743 0.03
News Corp - Class B 1,191 26,821 0.01
Nexstar Media Group Inc 426 80,292 0.03
NortonLifeLock Inc 6,119 162,276 0.05
Omnicom Group Inc 3,195 271,192 0.09
Paramount Global 13,794 521,551 0.17
Spotify Technology SA 365 55,122 0.02
TEGNA Inc 2,972 66,573 0.02
Telephone and Data Systems Inc 3,661 69,120 0.02
T-Mobile US Inc 5,896 756,752 0.25
Twitter Inc 3,429 132,668 0.04
Uber Technologies Inc 4,370 155,922 0.05
Verizon Communications Inc 80,789 4,115,392 1.34
Viasat Inc 1,080 52,704 0.02
Walt Disney Co/The 12,119 1,662,242 0.54
Wayfair Inc 322 35,671 0.01
Yandex NV 760 – –
Zillow Group Inc - Class A 226 10,900 0.00
Zillow Group Inc - Class C 651 32,088 0.01
Total Communications 34,882,769 11.37
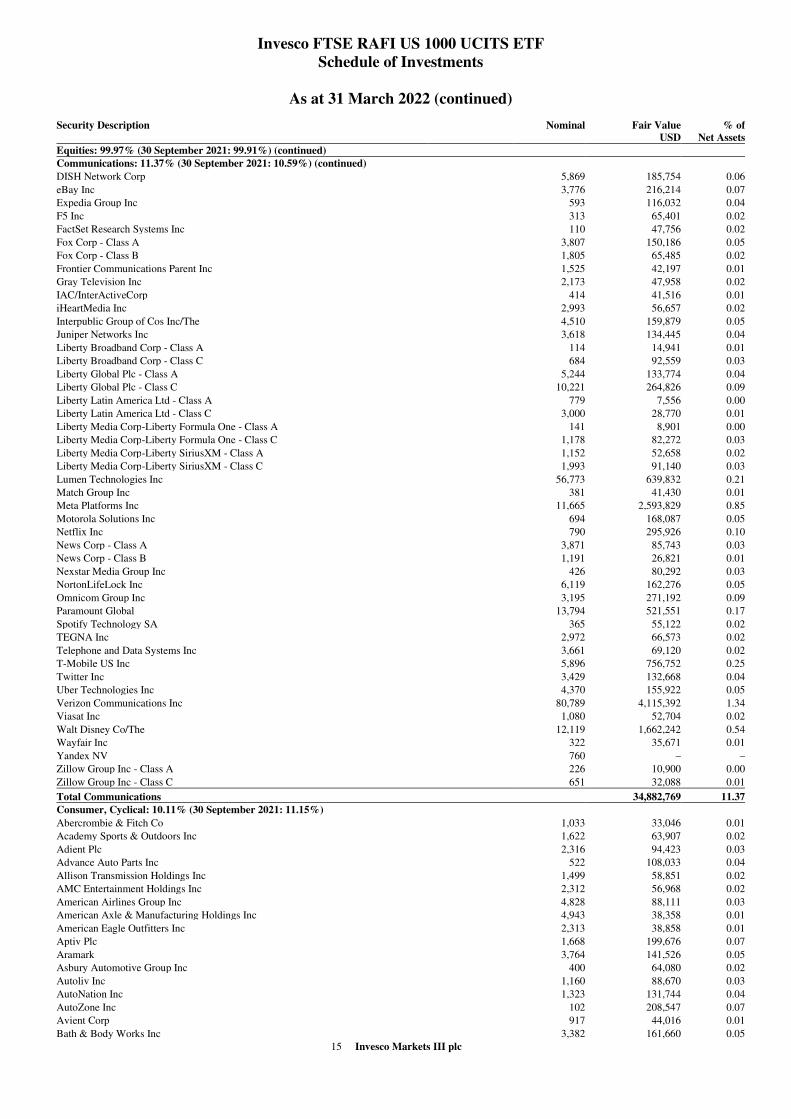
Consumer, Cyclical: 10.11% (30 September 2021: 11.15%)
Abercrombie & Fitch Co 1,033 33,046 0.01
Academy Sports & Outdoors Inc 1,622 63,907 0.02
Adient Plc 2,316 94,423 0.03
Advance Auto Parts Inc 522 108,033 0.04
Allison Transmission Holdings Inc 1,499 58,851 0.02
AMC Entertainment Holdings Inc 2,312 56,968 0.02
American Airlines Group Inc 4,828 88,111 0.03
American Axle & Manufacturing Holdings Inc 4,943 38,358 0.01
American Eagle Outfitters Inc 2,313 38,858 0.01
Aptiv Plc 1,668 199,676 0.07
Aramark 3,764 141,526 0.05
Asbury Automotive Group Inc 400 64,080 0.02
Autoliv Inc 1,160 88,670 0.03
AutoNation Inc 1,323 131,744 0.04
AutoZone Inc 102 208,547 0.07
Avient Corp 917 44,016 0.01
Bath & Body Works Inc 3,382 161,660 0.05

16 Invesco Markets III plc
Invesco FTSE RAFI US 1000 UCITS ETF
Schedule of Investments
As at 31 March 2022 (continued)
Security Description
Nominal Fair Value
USD
% of
Net Assets
Equities: 99.97% (30 September 2021: 99.91%) (continued)
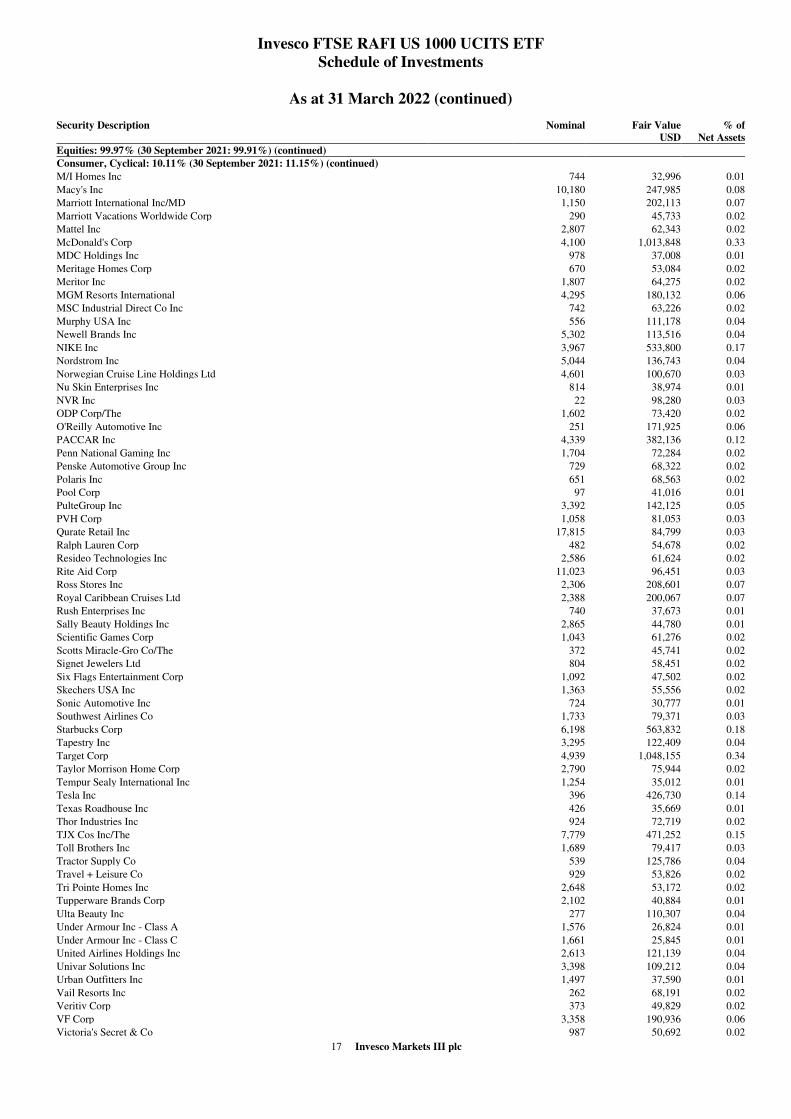
Consumer, Cyclical: 10.11% (30 September 2021: 11.15%) (continued)
Beacon Roofing Supply Inc 1,050 62,244 0.02
Bed Bath & Beyond Inc 6,625 149,261 0.05
Best Buy Co Inc 4,585 416,776 0.14
Big Lots Inc 1,719 59,477 0.02
BJ's Wholesale Club Holdings Inc 1,884 127,377 0.04
Bloomin' Brands Inc 1,497 32,844 0.01
BorgWarner Inc 3,947 153,538 0.05
Brinker International Inc 939 35,832 0.01
Brunswick Corp/DE 676 54,682 0.02
Burlington Stores Inc 342 62,302 0.02
Caesars Entertainment Inc 918 71,016 0.02
Cannae Holdings Inc 1,491 35,665 0.01
Capri Holdings Ltd 1,206 61,976 0.02
CarMax Inc 2,218 213,993 0.07
Carnival Corp 17,393 351,686 0.11
Carter's Inc 569 52,342 0.02
Casey's General Stores Inc 478 94,725 0.03
Chipotle Mexican Grill Inc 50 79,102 0.03
Cinemark Holdings Inc 3,004 51,909 0.02
Copart Inc 479 60,100 0.02
Costco Wholesale Corp 2,693 1,550,764 0.51
Cracker Barrel Old Country Store Inc 454 53,903 0.02
Cummins Inc 1,819 373,095 0.12
Dana Inc 3,716 65,290 0.02
Darden Restaurants Inc 1,022 135,875 0.04
Deckers Outdoor Corp 145 39,697 0.01
Delta Air Lines Inc 2,897 114,634 0.04
Dick's Sporting Goods Inc 730 73,015 0.02
Dollar General Corp 1,717 382,256 0.12
Dollar Tree Inc 2,217 355,053 0.12
Domino's Pizza Inc 128 52,097 0.02
DR Horton Inc 3,017 224,797 0.07
Fastenal Co 3,247 192,872 0.06
Foot Locker Inc 2,343 69,493 0.02
Ford Motor Co 99,616 1,684,507 0.55
GameStop Corp 425 70,796 0.02
Gap Inc/The 7,444 104,812 0.03
General Motors Co 40,181 1,757,517 0.57
Gentex Corp 2,018 58,865 0.02
Genuine Parts Co 1,716 216,250 0.07
G-III Apparel Group Ltd 1,310 35,436 0.01
GMS Inc 731 36,382 0.01
Goodyear Tire & Rubber Co/The 10,862 155,218 0.05
Group 1 Automotive Inc 483 81,062 0.03
Hanesbrands Inc 6,755 100,582 0.03
Harley-Davidson Inc 2,586 101,888 0.03
Hasbro Inc 1,218 99,779 0.03
Hilton Worldwide Holdings Inc 703 106,673 0.03
Home Depot Inc/The 5,950 1,781,013 0.58
International Game Technology Plc 1,439 35,515 0.01
KAR Auction Services Inc 3,217 58,067 0.02
KB Home 1,317 42,644 0.01
Kohl's Corp 4,512 272,796 0.09
Las Vegas Sands Corp 4,916 191,085 0.06
LCI Industries 294 30,520 0.01
Lear Corp 1,270 181,089 0.06
Leggett & Platt Inc 2,280 79,344 0.03
Lennar Corp 3,039 246,676 0.08
Lennar Corp - Class B 175 11,961 0.00
Lions Gate Entertainment Corp - Class A 1,047 17,014 0.01
Lions Gate Entertainment Corp - Class B 2,121 31,879 0.01
Lithia Motors Inc 314 94,238 0.03
Live Nation Entertainment Inc 389 45,762 0.02
LKQ Corp 3,468 157,482 0.05
Lowe's Cos Inc 4,218 852,837 0.28
Lululemon Athletica Inc 248 90,577 0.03
17 Invesco Markets III plc
Invesco FTSE RAFI US 1000 UCITS ETF
Schedule of Investments
As at 31 March 2022 (continued)
Security Description
Nominal Fair Value
USD
% of
Net Assets
Equities: 99.97% (30 September 2021: 99.91%) (continued)
Consumer, Cyclical: 10.11% (30 September 2021: 11.15%) (continued)
M/I Homes Inc 744 32,996 0.01
Macy's Inc 10,180 247,985 0.08
Marriott International Inc/MD 1,150 202,113 0.07
Marriott Vacations Worldwide Corp 290 45,733 0.02
Mattel Inc 2,807 62,343 0.02
McDonald's Corp 4,100 1,013,848 0.33
MDC Holdings Inc 978 37,008 0.01
Meritage Homes Corp 670 53,084 0.02
Meritor Inc 1,807 64,275 0.02
MGM Resorts International 4,295 180,132 0.06
MSC Industrial Direct Co Inc 742 63,226 0.02
Murphy USA Inc 556 111,178 0.04
Newell Brands Inc 5,302 113,516 0.04
NIKE Inc 3,967 533,800 0.17
Nordstrom Inc 5,044 136,743 0.04
Norwegian Cruise Line Holdings Ltd 4,601 100,670 0.03
Nu Skin Enterprises Inc 814 38,974 0.01
NVR Inc 22 98,280 0.03
ODP Corp/The 1,602 73,420 0.02
O'Reilly Automotive Inc 251 171,925 0.06
PACCAR Inc 4,339 382,136 0.12
Penn National Gaming Inc 1,704 72,284 0.02
Penske Automotive Group Inc 729 68,322 0.02
Polaris Inc 651 68,563 0.02
Pool Corp 97 41,016 0.01
PulteGroup Inc 3,392 142,125 0.05
PVH Corp 1,058 81,053 0.03
Qurate Retail Inc 17,815 84,799 0.03
Ralph Lauren Corp 482 54,678 0.02
Resideo Technologies Inc 2,586 61,624 0.02
Rite Aid Corp 11,023 96,451 0.03
Ross Stores Inc 2,306 208,601 0.07
Royal Caribbean Cruises Ltd 2,388 200,067 0.07
Rush Enterprises Inc 740 37,673 0.01
Sally Beauty Holdings Inc 2,865 44,780 0.01
Scientific Games Corp 1,043 61,276 0.02
Scotts Miracle-Gro Co/The 372 45,741 0.02
Signet Jewelers Ltd 804 58,451 0.02
Six Flags Entertainment Corp 1,092 47,502 0.02
Skechers USA Inc 1,363 55,556 0.02
Sonic Automotive Inc 724 30,777 0.01
Southwest Airlines Co 1,733 79,371 0.03
Starbucks Corp 6,198 563,832 0.18
Tapestry Inc 3,295 122,409 0.04
Target Corp 4,939 1,048,155 0.34
Taylor Morrison Home Corp 2,790 75,944 0.02
Tempur Sealy International Inc 1,254 35,012 0.01
Tesla Inc 396 426,730 0.14
Texas Roadhouse Inc 426 35,669 0.01
Thor Industries Inc 924 72,719 0.02
TJX Cos Inc/The 7,779 471,252 0.15
Toll Brothers Inc 1,689 79,417 0.03
Tractor Supply Co 539 125,786 0.04
Travel + Leisure Co 929 53,826 0.02
Tri Pointe Homes Inc 2,648 53,172 0.02
Tupperware Brands Corp 2,102 40,884 0.01
Ulta Beauty Inc 277 110,307 0.04
Under Armour Inc - Class A 1,576 26,824 0.01
Under Armour Inc - Class C 1,661 25,845 0.01
United Airlines Holdings Inc 2,613 121,139 0.04
Univar Solutions Inc 3,398 109,212 0.04
Urban Outfitters Inc 1,497 37,590 0.01
Vail Resorts Inc 262 68,191 0.02
Veritiv Corp 373 49,829 0.02
VF Corp 3,358 190,936 0.06
Victoria's Secret & Co 987 50,692 0.02
18 Invesco Markets III plc
Invesco FTSE RAFI US 1000 UCITS ETF
Schedule of Investments
As at 31 March 2022 (continued)
Security Description
Nominal Fair Value
USD
% of
Net Assets
Equities: 99.97% (30 September 2021: 99.91%) (continued)
Consumer, Cyclical: 10.11% (30 September 2021: 11.15%) (continued)
Visteon Corp 642 70,061 0.02
Walgreens Boots Alliance Inc 23,696 1,060,870 0.35
Walmart Inc 20,566 3,062,689 1.00
Watsco Inc 262 79,816 0.03
WESCO International Inc 825 107,366 0.04
Whirlpool Corp 1,214 209,755 0.07
Williams-Sonoma Inc 655 94,975 0.03
World Fuel Services Corp 1,687 45,616 0.01
WW Grainger Inc 324 167,116 0.05
Wynn Resorts Ltd 1,002 79,899 0.03
Yum China Holdings Inc 2,799 116,270 0.04
Yum! Brands Inc 1,538 182,299 0.06
Total Consumer, Cyclical 31,036,627 10.11
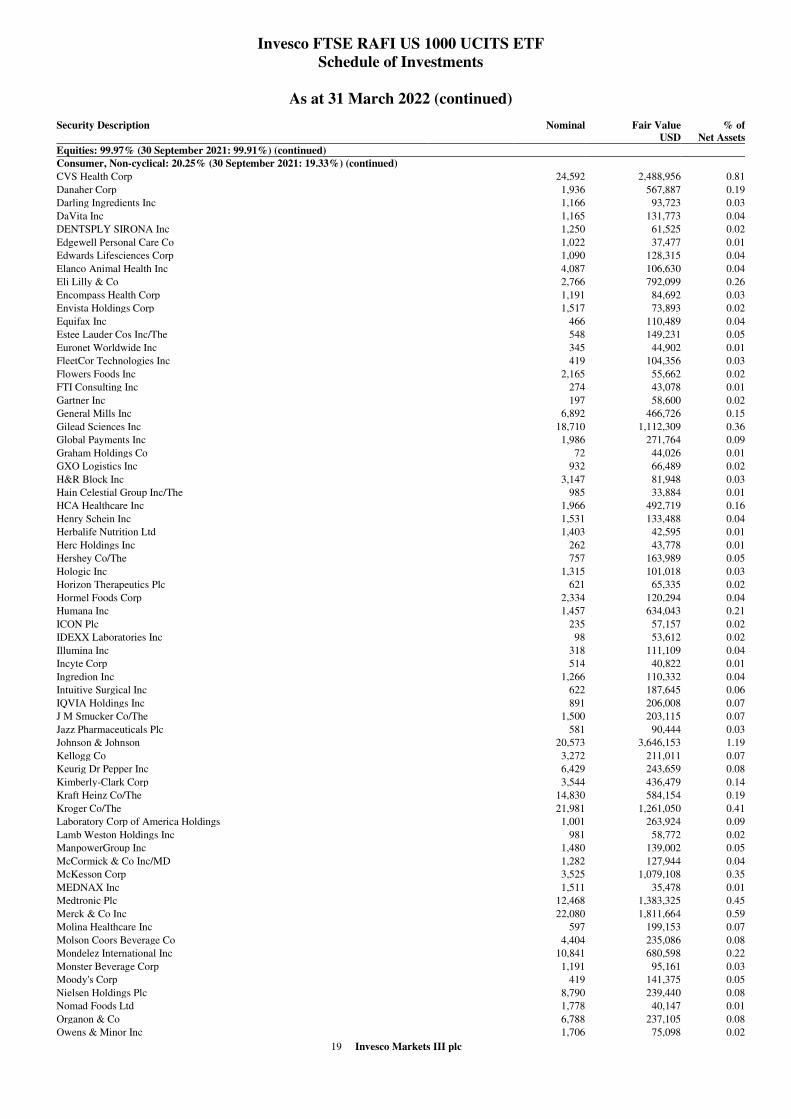
Consumer, Non-cyclical: 20.25% (30 September 2021: 19.33%)
Abbott Laboratories 8,122 961,320 0.31
AbbVie Inc 11,574 1,876,261 0.61
ABM Industries Inc 1,326 61,049 0.02
Acadia Healthcare Co Inc 1,046 68,544 0.02
Albertsons Cos Inc 6,795 225,934 0.07
Align Technology Inc 129 56,244 0.02
Altria Group Inc 27,003 1,410,907 0.46
AMERCO 82 48,949 0.02
AmerisourceBergen Corp 3,648 564,382 0.18
Amgen Inc 5,327 1,288,175 0.42
Anthem Inc 2,577 1,265,874 0.41
Archer-Daniels-Midland Co 9,179 828,497 0.27
ASGN Inc 488 56,954 0.02
Automatic Data Processing Inc 2,070 471,008 0.15
Avantor Inc 2,077 70,244 0.02
Avery Dennison Corp 590 102,642 0.03
Avis Budget Group Inc 808 212,746 0.07
B&G Foods Inc 1,442 38,905 0.01
Baxter International Inc 3,152 244,406 0.08
Becton Dickinson and Co 1,752 466,032 0.15
Biogen Inc 2,271 478,273 0.16
BioMarin Pharmaceutical Inc 577 44,487 0.01
Bio-Rad Laboratories Inc 147 82,795 0.03
Block Inc 553 74,987 0.02
Booz Allen Hamilton Holding Corp 1,209 106,199 0.03
Boston Scientific Corp 6,968 308,613 0.10
Bright Horizons Family Solutions Inc 288 38,215 0.01
Brink's Co/The 538 36,584 0.01
Bristol-Myers Squibb Co 15,868 1,158,840 0.38
Brookdale Senior Living Inc 7,838 55,258 0.02
Brown-Forman Corp 849 56,900 0.02
Bunge Ltd 3,525 390,605 0.13
Campbell Soup Co 2,600 115,882 0.04
Cardinal Health Inc 12,758 723,379 0.24
Catalent Inc 697 77,297 0.03
Centene Corp 10,182 857,223 0.28
Charles River Laboratories International Inc 198 56,226 0.02
Church & Dwight Co Inc 1,135 112,796 0.04
Cigna Corp 4,668 1,118,499 0.36
Cintas Corp 352 149,737 0.05
Clarivate Plc 4,105 68,800 0.02
Clorox Co/The 1,076 149,596 0.05
Coca-Cola Co/The 25,879 1,604,498 0.52
Coca-Cola Europacific Partners Plc 3,631 176,503 0.06
Colgate-Palmolive Co 5,945 450,809 0.15
Community Health Systems Inc 6,286 74,615 0.02
Conagra Brands Inc 6,340 212,834 0.07
Constellation Brands Inc 1,198 275,923 0.09
Cooper Cos Inc/The 157 65,562 0.02
Corteva Inc 5,672 326,027 0.11
CoStar Group Inc 1,122 74,736 0.02
Coty Inc 4,572 41,102 0.01
19 Invesco Markets III plc
Invesco FTSE RAFI US 1000 UCITS ETF
Schedule of Investments
As at 31 March 2022 (continued)
Security Description
Nominal Fair Value
USD
% of
Net Assets
Equities: 99.97% (30 September 2021: 99.91%) (continued)
Consumer, Non-cyclical: 20.25% (30 September 2021: 19.33%) (continued)
CVS Health Corp 24,592 2,488,956 0.81
Danaher Corp 1,936 567,887 0.19
Darling Ingredients Inc 1,166 93,723 0.03
DaVita Inc 1,165 131,773 0.04
DENTSPLY SIRONA Inc 1,250 61,525 0.02
Edgewell Personal Care Co 1,022 37,477 0.01
Edwards Lifesciences Corp 1,090 128,315 0.04
Elanco Animal Health Inc 4,087 106,630 0.04
Eli Lilly & Co 2,766 792,099 0.26
Encompass Health Corp 1,191 84,692 0.03
Envista Holdings Corp 1,517 73,893 0.02
Equifax Inc 466 110,489 0.04
Estee Lauder Cos Inc/The 548 149,231 0.05
Euronet Worldwide Inc 345 44,902 0.01
FleetCor Technologies Inc 419 104,356 0.03
Flowers Foods Inc 2,165 55,662 0.02
FTI Consulting Inc 274 43,078 0.01
Gartner Inc 197 58,600 0.02
General Mills Inc 6,892 466,726 0.15
Gilead Sciences Inc 18,710 1,112,309 0.36
Global Payments Inc 1,986 271,764 0.09
Graham Holdings Co 72 44,026 0.01
GXO Logistics Inc 932 66,489 0.02
H&R Block Inc 3,147 81,948 0.03
Hain Celestial Group Inc/The 985 33,884 0.01
HCA Healthcare Inc 1,966 492,719 0.16
Henry Schein Inc 1,531 133,488 0.04
Herbalife Nutrition Ltd 1,403 42,595 0.01
Herc Holdings Inc 262 43,778 0.01
Hershey Co/The 757 163,989 0.05
Hologic Inc 1,315 101,018 0.03
Horizon Therapeutics Plc 621 65,335 0.02
Hormel Foods Corp 2,334 120,294 0.04
Humana Inc 1,457 634,043 0.21
ICON Plc 235 57,157 0.02
IDEXX Laboratories Inc 98 53,612 0.02
Illumina Inc 318 111,109 0.04
Incyte Corp 514 40,822 0.01
Ingredion Inc 1,266 110,332 0.04
Intuitive Surgical Inc 622 187,645 0.06
IQVIA Holdings Inc 891 206,008 0.07
J M Smucker Co/The 1,500 203,115 0.07
Jazz Pharmaceuticals Plc 581 90,444 0.03
Johnson & Johnson 20,573 3,646,153 1.19
Kellogg Co 3,272 211,011 0.07
Keurig Dr Pepper Inc 6,429 243,659 0.08
Kimberly-Clark Corp 3,544 436,479 0.14
Kraft Heinz Co/The 14,830 584,154 0.19
Kroger Co/The 21,981 1,261,050 0.41
Laboratory Corp of America Holdings 1,001 263,924 0.09
Lamb Weston Holdings Inc 981 58,772 0.02
ManpowerGroup Inc 1,480 139,002 0.05
McCormick & Co Inc/MD 1,282 127,944 0.04
McKesson Corp 3,525 1,079,108 0.35
MEDNAX Inc 1,511 35,478 0.01
Medtronic Plc 12,468 1,383,325 0.45
Merck & Co Inc 22,080 1,811,664 0.59
Molina Healthcare Inc 597 199,153 0.07
Molson Coors Beverage Co 4,404 235,086 0.08
Mondelez International Inc 10,841 680,598 0.22
Monster Beverage Corp 1,191 95,161 0.03
Moody's Corp 419 141,375 0.05
Nielsen Holdings Plc 8,790 239,440 0.08
Nomad Foods Ltd 1,778 40,147 0.01
Organon & Co 6,788 237,105 0.08
Owens & Minor Inc 1,706 75,098 0.02
20 Invesco Markets III plc
Invesco FTSE RAFI US 1000 UCITS ETF
Schedule of Investments
As at 31 March 2022 (continued)
Security Description
Nominal Fair Value
USD
% of
Net Assets
Equities: 99.97% (30 September 2021: 99.91%) (continued)
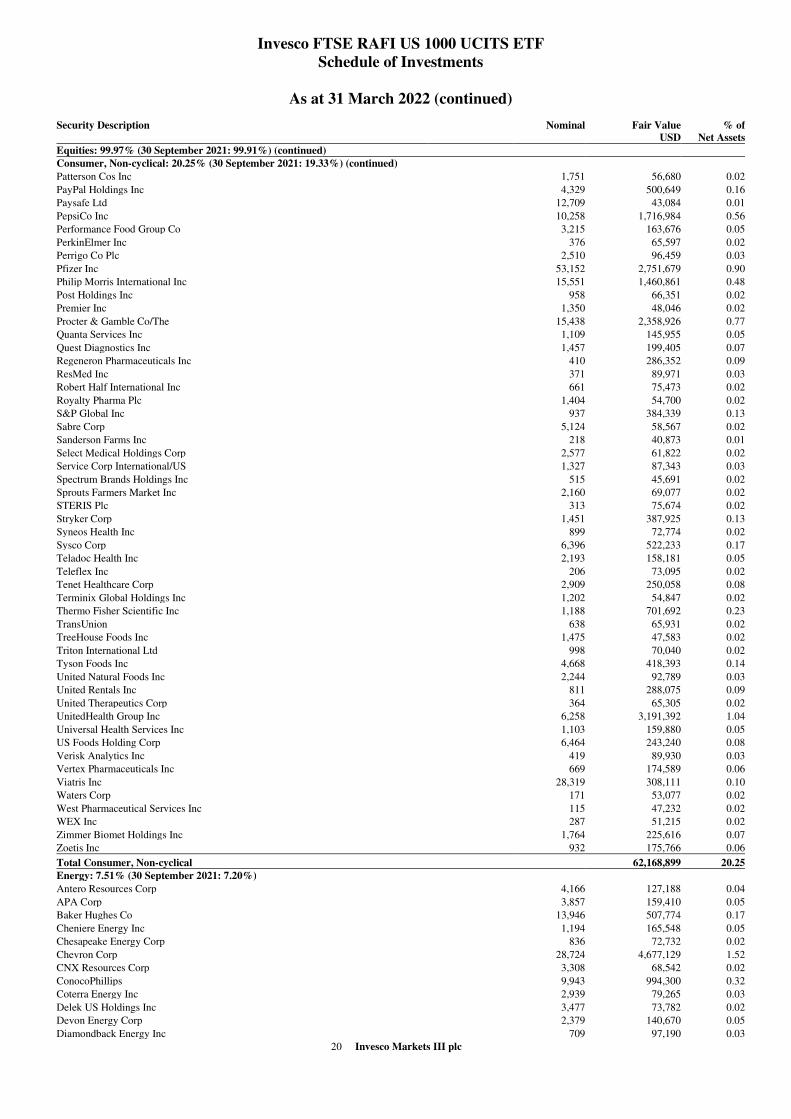
Consumer, Non-cyclical: 20.25% (30 September 2021: 19.33%) (continued)
Patterson Cos Inc 1,751 56,680 0.02
PayPal Holdings Inc 4,329 500,649 0.16
Paysafe Ltd 12,709 43,084 0.01
PepsiCo Inc 10,258 1,716,984 0.56
Performance Food Group Co 3,215 163,676 0.05
PerkinElmer Inc 376 65,597 0.02
Perrigo Co Plc 2,510 96,459 0.03
Pfizer Inc 53,152 2,751,679 0.90
Philip Morris International Inc 15,551 1,460,861 0.48
Post Holdings Inc 958 66,351 0.02
Premier Inc 1,350 48,046 0.02
Procter & Gamble Co/The 15,438 2,358,926 0.77
Quanta Services Inc 1,109 145,955 0.05
Quest Diagnostics Inc 1,457 199,405 0.07
Regeneron Pharmaceuticals Inc 410 286,352 0.09
ResMed Inc 371 89,971 0.03
Robert Half International Inc 661 75,473 0.02
Royalty Pharma Plc 1,404 54,700 0.02
S&P Global Inc 937 384,339 0.13
Sabre Corp 5,124 58,567 0.02
Sanderson Farms Inc 218 40,873 0.01
Select Medical Holdings Corp 2,577 61,822 0.02
Service Corp International/US 1,327 87,343 0.03
Spectrum Brands Holdings Inc 515 45,691 0.02
Sprouts Farmers Market Inc 2,160 69,077 0.02
STERIS Plc 313 75,674 0.02
Stryker Corp 1,451 387,925 0.13
Syneos Health Inc 899 72,774 0.02
Sysco Corp 6,396 522,233 0.17
Teladoc Health Inc 2,193 158,181 0.05
Teleflex Inc 206 73,095 0.02
Tenet Healthcare Corp 2,909 250,058 0.08
Terminix Global Holdings Inc 1,202 54,847 0.02
Thermo Fisher Scientific Inc 1,188 701,692 0.23
TransUnion 638 65,931 0.02
TreeHouse Foods Inc 1,475 47,583 0.02
Triton International Ltd 998 70,040 0.02
Tyson Foods Inc 4,668 418,393 0.14
United Natural Foods Inc 2,244 92,789 0.03
United Rentals Inc 811 288,075 0.09
United Therapeutics Corp 364 65,305 0.02
UnitedHealth Group Inc 6,258 3,191,392 1.04
Universal Health Services Inc 1,103 159,880 0.05
US Foods Holding Corp 6,464 243,240 0.08
Verisk Analytics Inc 419 89,930 0.03
Vertex Pharmaceuticals Inc 669 174,589 0.06
Viatris Inc 28,319 308,111 0.10
Waters Corp 171 53,077 0.02
West Pharmaceutical Services Inc 115 47,232 0.02
WEX Inc 287 51,215 0.02
Zimmer Biomet Holdings Inc 1,764 225,616 0.07
Zoetis Inc 932 175,766 0.06
Total Consumer, Non-cyclical 62,168,899 20.25
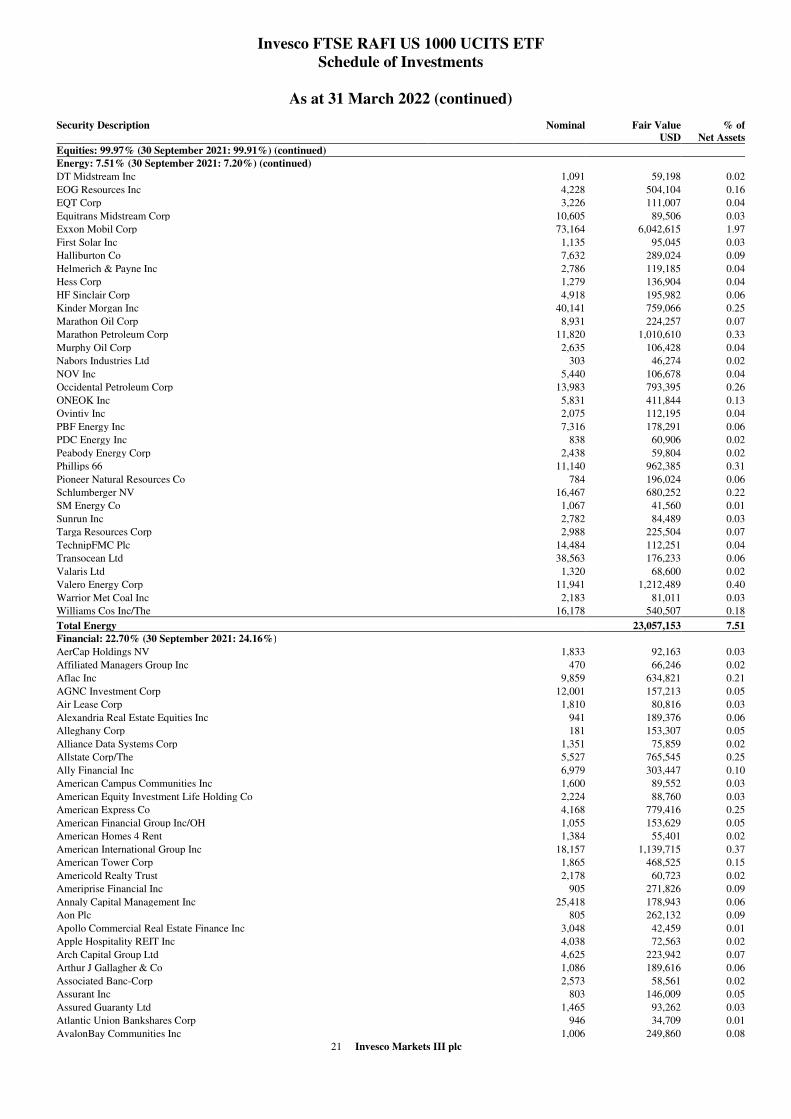
Energy: 7.51% (30 September 2021: 7.20%)
Antero Resources Corp 4,166 127,188 0.04
APA Corp 3,857 159,410 0.05
Baker Hughes Co 13,946 507,774 0.17
Cheniere Energy Inc 1,194 165,548 0.05
Chesapeake Energy Corp 836 72,732 0.02
Chevron Corp 28,724 4,677,129 1.52
CNX Resources Corp 3,308 68,542 0.02
ConocoPhillips 9,943 994,300 0.32
Coterra Energy Inc 2,939 79,265 0.03
Delek US Holdings Inc 3,477 73,782 0.02
Devon Energy Corp 2,379 140,670 0.05
Diamondback Energy Inc 709 97,190 0.03
21 Invesco Markets III plc
Invesco FTSE RAFI US 1000 UCITS ETF
Schedule of Investments
As at 31 March 2022 (continued)
Security Description
Nominal Fair Value
USD
% of
Net Assets
Equities: 99.97% (30 September 2021: 99.91%) (continued)
Energy: 7.51% (30 September 2021: 7.20%) (continued)
DT Midstream Inc 1,091 59,198 0.02
EOG Resources Inc 4,228 504,104 0.16
EQT Corp 3,226 111,007 0.04
Equitrans Midstream Corp 10,605 89,506 0.03
Exxon Mobil Corp 73,164 6,042,615 1.97
First Solar Inc 1,135 95,045 0.03
Halliburton Co 7,632 289,024 0.09
Helmerich & Payne Inc 2,786 119,185 0.04
Hess Corp 1,279 136,904 0.04
HF Sinclair Corp 4,918 195,982 0.06
Kinder Morgan Inc 40,141 759,066 0.25
Marathon Oil Corp 8,931 224,257 0.07
Marathon Petroleum Corp 11,820 1,010,610 0.33
Murphy Oil Corp 2,635 106,428 0.04
Nabors Industries Ltd 303 46,274 0.02
NOV Inc 5,440 106,678 0.04
Occidental Petroleum Corp 13,983 793,395 0.26
ONEOK Inc 5,831 411,844 0.13
Ovintiv Inc 2,075 112,195 0.04
PBF Energy Inc 7,316 178,291 0.06
PDC Energy Inc 838 60,906 0.02
Peabody Energy Corp 2,438 59,804 0.02
Phillips 66 11,140 962,385 0.31
Pioneer Natural Resources Co 784 196,024 0.06
Schlumberger NV 16,467 680,252 0.22
SM Energy Co 1,067 41,560 0.01
Sunrun Inc 2,782 84,489 0.03
Targa Resources Corp 2,988 225,504 0.07
TechnipFMC Plc 14,484 112,251 0.04
Transocean Ltd 38,563 176,233 0.06
Valaris Ltd 1,320 68,600 0.02
Valero Energy Corp 11,941 1,212,489 0.40
Warrior Met Coal Inc 2,183 81,011 0.03
Williams Cos Inc/The 16,178 540,507 0.18
Total Energy 23,057,153 7.51
Financial: 22.70% (30 September 2021: 24.16%)
AerCap Holdings NV 1,833 92,163 0.03
Affiliated Managers Group Inc 470 66,246 0.02
Aflac Inc 9,859 634,821 0.21
AGNC Investment Corp 12,001 157,213 0.05
Air Lease Corp 1,810 80,816 0.03
Alexandria Real Estate Equities Inc 941 189,376 0.06
Alleghany Corp 181 153,307 0.05
Alliance Data Systems Corp 1,351 75,859 0.02
Allstate Corp/The 5,527 765,545 0.25
Ally Financial Inc 6,979 303,447 0.10
American Campus Communities Inc 1,600 89,552 0.03
American Equity Investment Life Holding Co 2,224 88,760 0.03
American Express Co 4,168 779,416 0.25
American Financial Group Inc/OH 1,055 153,629 0.05
American Homes 4 Rent 1,384 55,401 0.02
American International Group Inc 18,157 1,139,715 0.37
American Tower Corp 1,865 468,525 0.15
Americold Realty Trust 2,178 60,723 0.02
Ameriprise Financial Inc 905 271,826 0.09
Annaly Capital Management Inc 25,418 178,943 0.06
Aon Plc 805 262,132 0.09
Apollo Commercial Real Estate Finance Inc 3,048 42,459 0.01
Apple Hospitality REIT Inc 4,038 72,563 0.02
Arch Capital Group Ltd 4,625 223,942 0.07
Arthur J Gallagher & Co 1,086 189,616 0.06
Associated Banc-Corp 2,573 58,561 0.02
Assurant Inc 803 146,009 0.05
Assured Guaranty Ltd 1,465 93,262 0.03
Atlantic Union Bankshares Corp 946 34,709 0.01
AvalonBay Communities Inc 1,006 249,860 0.08
22 Invesco Markets III plc
Invesco FTSE RAFI US 1000 UCITS ETF
Schedule of Investments
As at 31 March 2022 (continued)
Security Description
Nominal Fair Value
USD
% of
Net Assets
Equities: 99.97% (30 September 2021: 99.91%) (continued)
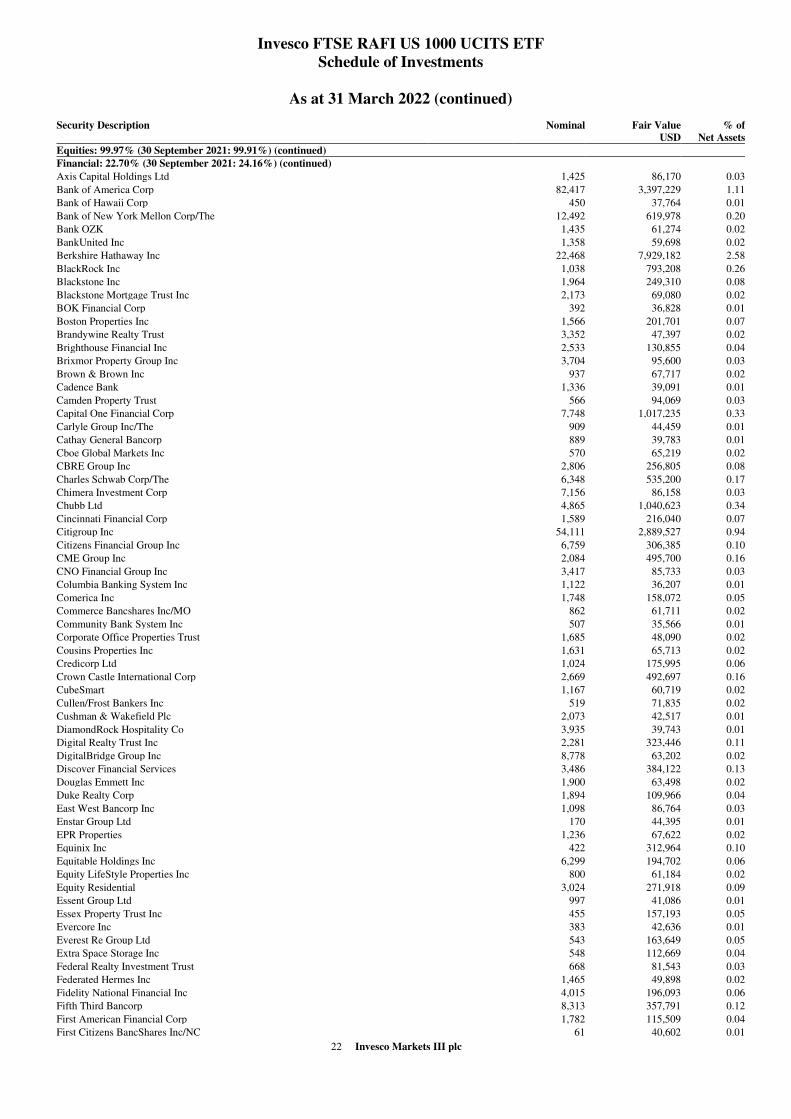
Financial: 22.70% (30 September 2021: 24.16%) (continued)
Axis Capital Holdings Ltd 1,425 86,170 0.03
Bank of America Corp 82,417 3,397,229 1.11
Bank of Hawaii Corp 450 37,764 0.01
Bank of New York Mellon Corp/The 12,492 619,978 0.20
Bank OZK 1,435 61,274 0.02
BankUnited Inc 1,358 59,698 0.02
Berkshire Hathaway Inc 22,468 7,929,182 2.58
BlackRock Inc 1,038 793,208 0.26
Blackstone Inc 1,964 249,310 0.08
Blackstone Mortgage Trust Inc 2,173 69,080 0.02
BOK Financial Corp 392 36,828 0.01
Boston Properties Inc 1,566 201,701 0.07
Brandywine Realty Trust 3,352 47,397 0.02
Brighthouse Financial Inc 2,533 130,855 0.04
Brixmor Property Group Inc 3,704 95,600 0.03
Brown & Brown Inc 937 67,717 0.02
Cadence Bank 1,336 39,091 0.01
Camden Property Trust 566 94,069 0.03
Capital One Financial Corp 7,748 1,017,235 0.33
Carlyle Group Inc/The 909 44,459 0.01
Cathay General Bancorp 889 39,783 0.01
Cboe Global Markets Inc 570 65,219 0.02
CBRE Group Inc 2,806 256,805 0.08
Charles Schwab Corp/The 6,348 535,200 0.17
Chimera Investment Corp 7,156 86,158 0.03
Chubb Ltd 4,865 1,040,623 0.34
Cincinnati Financial Corp 1,589 216,040 0.07
Citigroup Inc 54,111 2,889,527 0.94
Citizens Financial Group Inc 6,759 306,385 0.10
CME Group Inc 2,084 495,700 0.16
CNO Financial Group Inc 3,417 85,733 0.03
Columbia Banking System Inc 1,122 36,207 0.01
Comerica Inc 1,748 158,072 0.05
Commerce Bancshares Inc/MO 862 61,711 0.02
Community Bank System Inc 507 35,566 0.01
Corporate Office Properties Trust 1,685 48,090 0.02
Cousins Properties Inc 1,631 65,713 0.02
Credicorp Ltd 1,024 175,995 0.06
Crown Castle International Corp 2,669 492,697 0.16
CubeSmart 1,167 60,719 0.02
Cullen/Frost Bankers Inc 519 71,835 0.02
Cushman & Wakefield Plc 2,073 42,517 0.01
DiamondRock Hospitality Co 3,935 39,743 0.01
Digital Realty Trust Inc 2,281 323,446 0.11
DigitalBridge Group Inc 8,778 63,202 0.02
Discover Financial Services 3,486 384,122 0.13
Douglas Emmett Inc 1,900 63,498 0.02
Duke Realty Corp 1,894 109,966 0.04
East West Bancorp Inc 1,098 86,764 0.03
Enstar Group Ltd 170 44,395 0.01
EPR Properties 1,236 67,622 0.02
Equinix Inc 422 312,964 0.10
Equitable Holdings Inc 6,299 194,702 0.06
Equity LifeStyle Properties Inc 800 61,184 0.02
Equity Residential 3,024 271,918 0.09
Essent Group Ltd 997 41,086 0.01
Essex Property Trust Inc 455 157,193 0.05
Evercore Inc 383 42,636 0.01
Everest Re Group Ltd 543 163,649 0.05
Extra Space Storage Inc 548 112,669 0.04
Federal Realty Investment Trust 668 81,543 0.03
Federated Hermes Inc 1,465 49,898 0.02
Fidelity National Financial Inc 4,015 196,093 0.06
Fifth Third Bancorp 8,313 357,791 0.12
First American Financial Corp 1,782 115,509 0.04
First Citizens BancShares Inc/NC 61 40,602 0.01

23 Invesco Markets III plc
Invesco FTSE RAFI US 1000 UCITS ETF
Schedule of Investments
As at 31 March 2022 (continued)
Security Description
Nominal Fair Value
USD
% of
Net Assets
Equities: 99.97% (30 September 2021: 99.91%) (continued)
Financial: 22.70% (30 September 2021: 24.16%) (continued)
First Hawaiian Inc 1,975 55,083 0.02
First Horizon Corp 6,285 147,635 0.05
First Industrial Realty Trust Inc 706 43,708 0.01
First Republic Bank/CA 896 145,242 0.05
Flagstar Bancorp Inc 805 34,132 0.01
FNB Corp/PA 5,835 72,646 0.02
Franklin Resources Inc 5,824 162,606 0.05
Fulton Financial Corp 2,453 40,769 0.01
Gaming and Leisure Properties Inc 1,999 93,813 0.03
Genworth Financial Inc 11,485 43,413 0.01
GEO Group Inc/The 8,516 56,291 0.02
Glacier Bancorp Inc 845 42,487 0.01
Globe Life Inc 1,371 137,923 0.05
Goldman Sachs Group Inc/The 4,368 1,441,877 0.47
Hancock Whitney Corp 1,096 57,156 0.02
Hanover Insurance Group Inc/The 542 81,040 0.03
Hartford Financial Services Group Inc/The 6,018 432,153 0.14
Healthcare Realty Trust Inc 1,496 41,110 0.01
Healthcare Trust of America Inc 2,253 70,609 0.02
Healthpeak Properties Inc 5,191 178,207 0.06
Highwoods Properties Inc 1,516 69,342 0.02
Home BancShares Inc/AR 1,803 40,748 0.01
Hope Bancorp Inc 2,067 33,237 0.01
Host Hotels & Resorts Inc 10,237 198,905 0.07
Howard Hughes Corp/The 418 43,309 0.01
Hudson Pacific Properties Inc 2,305 63,964 0.02
Huntington Bancshares Inc/OH 16,001 233,935 0.08
Intercontinental Exchange Inc 2,744 362,537 0.12
Invesco Ltd 8,128 187,432 0.06
Investors Bancorp Inc 2,895 43,222 0.01
Invitation Homes Inc 3,367 135,286 0.04
Iron Mountain Inc 4,220 233,830 0.08
Jackson Financial Inc 2,342 103,587 0.03
Janus Henderson Group Plc 2,883 100,963 0.03
JBG SMITH Properties 1,710 49,966 0.02
Jefferies Financial Group Inc 3,783 124,272 0.04
Jones Lang LaSalle Inc 614 147,028 0.05
JPMorgan Chase & Co 37,629 5,129,585 1.67
Kemper Corp 1,509 85,319 0.03
KeyCorp 12,626 282,570 0.09
Kilroy Realty Corp 1,172 89,564 0.03
Kimco Realty Corp 4,756 117,473 0.04
KKR & Co Inc 3,074 179,737 0.06
Lamar Advertising Co 726 84,347 0.03
Lazard Ltd 2,325 80,212 0.03
Life Storage Inc 442 62,070 0.02
Lincoln National Corp 4,862 317,780 0.10
Loews Corp 2,727 176,764 0.06
LPL Financial Holdings Inc 427 78,004 0.03
LXP Industrial Trust 2,613 41,024 0.01
M&T Bank Corp 1,723 292,048 0.10
Macerich Co/The 5,369 83,971 0.03
Markel Corp 173 255,216 0.08
Marsh & McLennan Cos Inc 2,588 441,047 0.14
Mastercard Inc 1,337 477,817 0.16
Medical Properties Trust Inc 5,380 113,733 0.04
MetLife Inc 16,602 1,166,789 0.38
MFA Financial Inc 11,213 45,188 0.01
MGIC Investment Corp 3,892 52,737 0.02
Mid-America Apartment Communities Inc 687 143,892 0.05
Morgan Stanley 13,138 1,148,261 0.37
Nasdaq Inc 589 104,960 0.03
National Retail Properties Inc 1,673 75,185 0.02
Navient Corp 5,761 98,167 0.03
New Residential Investment Corp 13,316 146,210 0.05
New York Community Bancorp Inc 11,039 118,338 0.04
24 Invesco Markets III plc
Invesco FTSE RAFI US 1000 UCITS ETF
Schedule of Investments
As at 31 March 2022 (continued)
Security Description
Nominal Fair Value
USD
% of
Net Assets
Equities: 99.97% (30 September 2021: 99.91%) (continued)
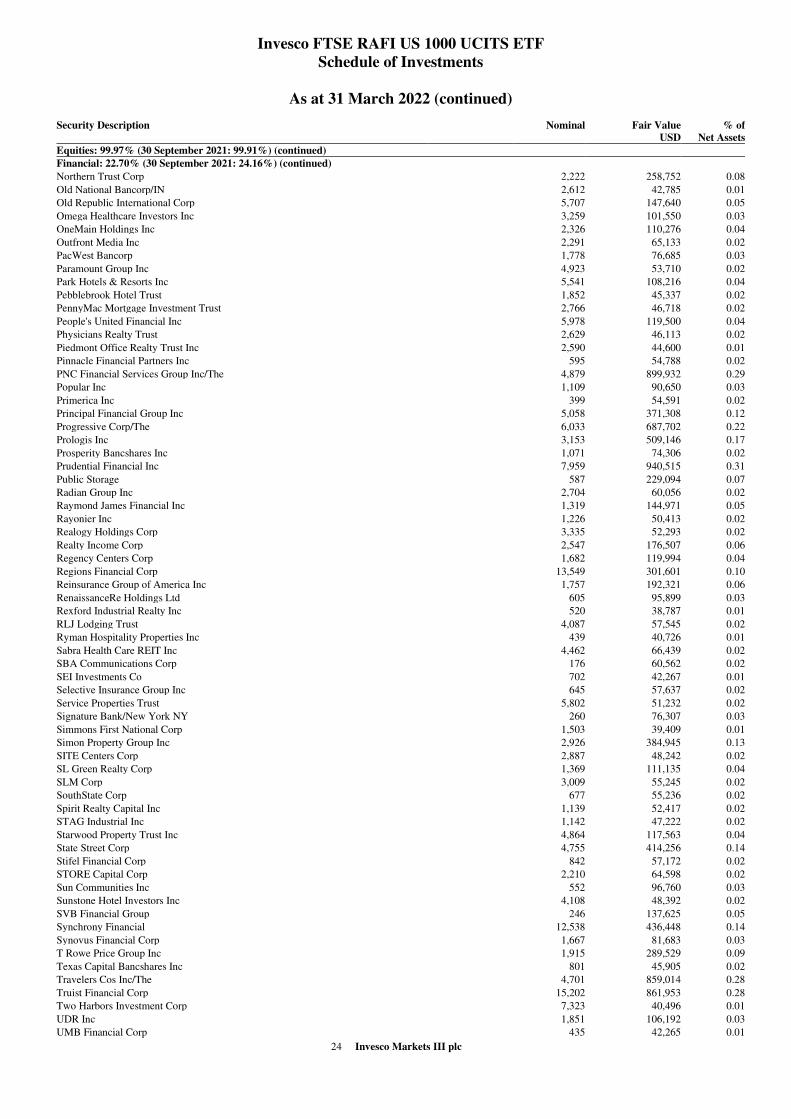
Financial: 22.70% (30 September 2021: 24.16%) (continued)
Northern Trust Corp 2,222 258,752 0.08
Old National Bancorp/IN 2,612 42,785 0.01
Old Republic International Corp 5,707 147,640 0.05
Omega Healthcare Investors Inc 3,259 101,550 0.03
OneMain Holdings Inc 2,326 110,276 0.04
Outfront Media Inc 2,291 65,133 0.02
PacWest Bancorp 1,778 76,685 0.03
Paramount Group Inc 4,923 53,710 0.02
Park Hotels & Resorts Inc 5,541 108,216 0.04
Pebblebrook Hotel Trust 1,852 45,337 0.02
PennyMac Mortgage Investment Trust 2,766 46,718 0.02
People's United Financial Inc 5,978 119,500 0.04
Physicians Realty Trust 2,629 46,113 0.02
Piedmont Office Realty Trust Inc 2,590 44,600 0.01
Pinnacle Financial Partners Inc 595 54,788 0.02
PNC Financial Services Group Inc/The 4,879 899,932 0.29
Popular Inc 1,109 90,650 0.03
Primerica Inc 399 54,591 0.02
Principal Financial Group Inc 5,058 371,308 0.12
Progressive Corp/The 6,033 687,702 0.22
Prologis Inc 3,153 509,146 0.17
Prosperity Bancshares Inc 1,071 74,306 0.02
Prudential Financial Inc 7,959 940,515 0.31
Public Storage 587 229,094 0.07
Radian Group Inc 2,704 60,056 0.02
Raymond James Financial Inc 1,319 144,971 0.05
Rayonier Inc 1,226 50,413 0.02
Realogy Holdings Corp 3,335 52,293 0.02
Realty Income Corp 2,547 176,507 0.06
Regency Centers Corp 1,682 119,994 0.04
Regions Financial Corp 13,549 301,601 0.10
Reinsurance Group of America Inc 1,757 192,321 0.06
RenaissanceRe Holdings Ltd 605 95,899 0.03
Rexford Industrial Realty Inc 520 38,787 0.01
RLJ Lodging Trust 4,087 57,545 0.02
Ryman Hospitality Properties Inc 439 40,726 0.01
Sabra Health Care REIT Inc 4,462 66,439 0.02
SBA Communications Corp 176 60,562 0.02
SEI Investments Co 702 42,267 0.01
Selective Insurance Group Inc 645 57,637 0.02
Service Properties Trust 5,802 51,232 0.02
Signature Bank/New York NY 260 76,307 0.03
Simmons First National Corp 1,503 39,409 0.01
Simon Property Group Inc 2,926 384,945 0.13
SITE Centers Corp 2,887 48,242 0.02
SL Green Realty Corp 1,369 111,135 0.04
SLM Corp 3,009 55,245 0.02
SouthState Corp 677 55,236 0.02
Spirit Realty Capital Inc 1,139 52,417 0.02
STAG Industrial Inc 1,142 47,222 0.02
Starwood Property Trust Inc 4,864 117,563 0.04
State Street Corp 4,755 414,256 0.14
Stifel Financial Corp 842 57,172 0.02
STORE Capital Corp 2,210 64,598 0.02
Sun Communities Inc 552 96,760 0.03
Sunstone Hotel Investors Inc 4,108 48,392 0.02
SVB Financial Group 246 137,625 0.05
Synchrony Financial 12,538 436,448 0.14
Synovus Financial Corp 1,667 81,683 0.03
T Rowe Price Group Inc 1,915 289,529 0.09
Texas Capital Bancshares Inc 801 45,905 0.02
Travelers Cos Inc/The 4,701 859,014 0.28
Truist Financial Corp 15,202 861,953 0.28
Two Harbors Investment Corp 7,323 40,496 0.01
UDR Inc 1,851 106,192 0.03
UMB Financial Corp 435 42,265 0.01
25 Invesco Markets III plc
Invesco FTSE RAFI US 1000 UCITS ETF
Schedule of Investments
As at 31 March 2022 (continued)
Security Description
Nominal Fair Value
USD
% of
Net Assets
Equities: 99.97% (30 September 2021: 99.91%) (continued)
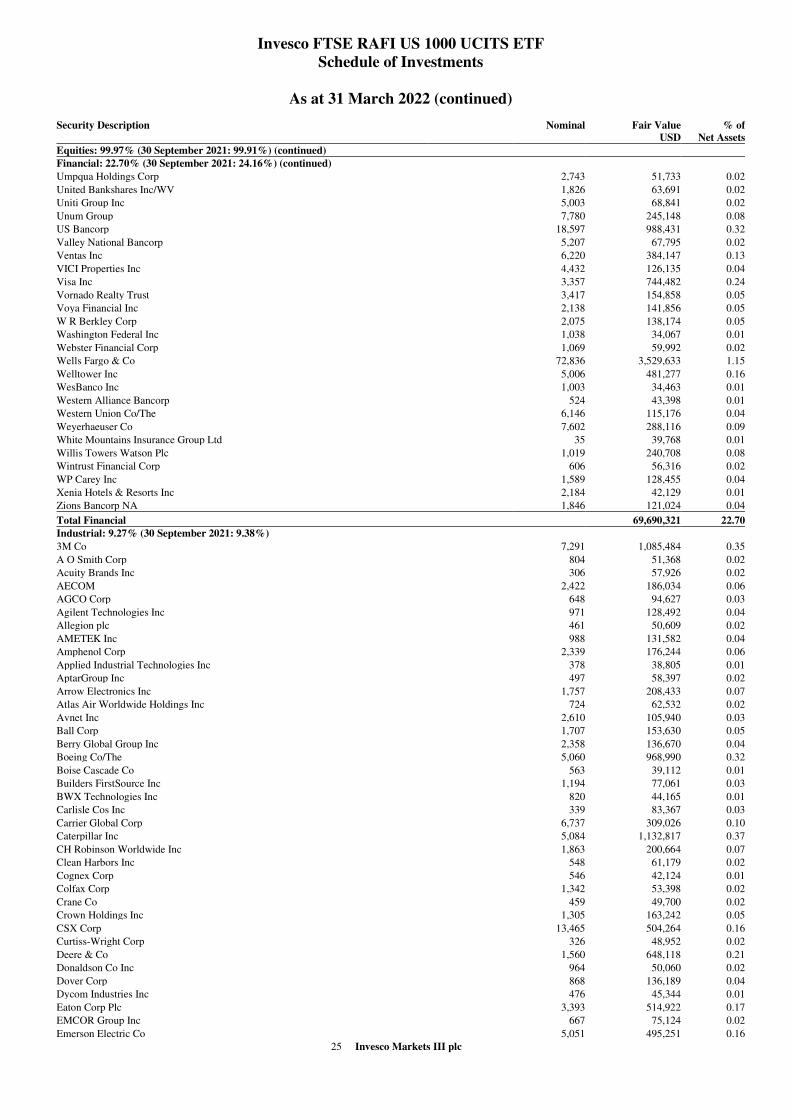
Financial: 22.70% (30 September 2021: 24.16%) (continued)
Umpqua Holdings Corp 2,743 51,733 0.02
United Bankshares Inc/WV 1,826 63,691 0.02
Uniti Group Inc 5,003 68,841 0.02
Unum Group 7,780 245,148 0.08
US Bancorp 18,597 988,431 0.32
Valley National Bancorp 5,207 67,795 0.02
Ventas Inc 6,220 384,147 0.13
VICI Properties Inc 4,432 126,135 0.04
Visa Inc 3,357 744,482 0.24
Vornado Realty Trust 3,417 154,858 0.05
Voya Financial Inc 2,138 141,856 0.05
W R Berkley Corp 2,075 138,174 0.05
Washington Federal Inc 1,038 34,067 0.01
Webster Financial Corp 1,069 59,992 0.02
Wells Fargo & Co 72,836 3,529,633 1.15
Welltower Inc 5,006 481,277 0.16
WesBanco Inc 1,003 34,463 0.01
Western Alliance Bancorp 524 43,398 0.01
Western Union Co/The 6,146 115,176 0.04
Weyerhaeuser Co 7,602 288,116 0.09
White Mountains Insurance Group Ltd 35 39,768 0.01
Willis Towers Watson Plc 1,019 240,708 0.08
Wintrust Financial Corp 606 56,316 0.02
WP Carey Inc 1,589 128,455 0.04
Xenia Hotels & Resorts Inc 2,184 42,129 0.01
Zions Bancorp NA 1,846 121,024 0.04
Total Financial 69,690,321 22.70
Industrial: 9.27% (30 September 2021: 9.38%)
3M Co 7,291 1,085,484 0.35
A O Smith Corp 804 51,368 0.02
Acuity Brands Inc 306 57,926 0.02
AECOM 2,422 186,034 0.06
AGCO Corp 648 94,627 0.03
Agilent Technologies Inc 971 128,492 0.04
Allegion plc 461 50,609 0.02
AMETEK Inc 988 131,582 0.04
Amphenol Corp 2,339 176,244 0.06
Applied Industrial Technologies Inc 378 38,805 0.01
AptarGroup Inc 497 58,397 0.02
Arrow Electronics Inc 1,757 208,433 0.07
Atlas Air Worldwide Holdings Inc 724 62,532 0.02
Avnet Inc 2,610 105,940 0.03
Ball Corp 1,707 153,630 0.05
Berry Global Group Inc 2,358 136,670 0.04
Boeing Co/The 5,060 968,990 0.32
Boise Cascade Co 563 39,112 0.01
Builders FirstSource Inc 1,194 77,061 0.03
BWX Technologies Inc 820 44,165 0.01
Carlisle Cos Inc 339 83,367 0.03
Carrier Global Corp 6,737 309,026 0.10
Caterpillar Inc 5,084 1,132,817 0.37
CH Robinson Worldwide Inc 1,863 200,664 0.07
Clean Harbors Inc 548 61,179 0.02
Cognex Corp 546 42,124 0.01
Colfax Corp 1,342 53,398 0.02
Crane Co 459 49,700 0.02
Crown Holdings Inc 1,305 163,242 0.05
CSX Corp 13,465 504,264 0.16
Curtiss-Wright Corp 326 48,952 0.02
Deere & Co 1,560 648,118 0.21
Donaldson Co Inc 964 50,060 0.02
Dover Corp 868 136,189 0.04
Dycom Industries Inc 476 45,344 0.01
Eaton Corp Plc 3,393 514,922 0.17
EMCOR Group Inc 667 75,124 0.02
Emerson Electric Co 5,051 495,251 0.16
26 Invesco Markets III plc
Invesco FTSE RAFI US 1000 UCITS ETF
Schedule of Investments
As at 31 March 2022 (continued)
Security Description
Nominal Fair Value
USD
% of
Net Assets
Equities: 99.97% (30 September 2021: 99.91%) (continued)
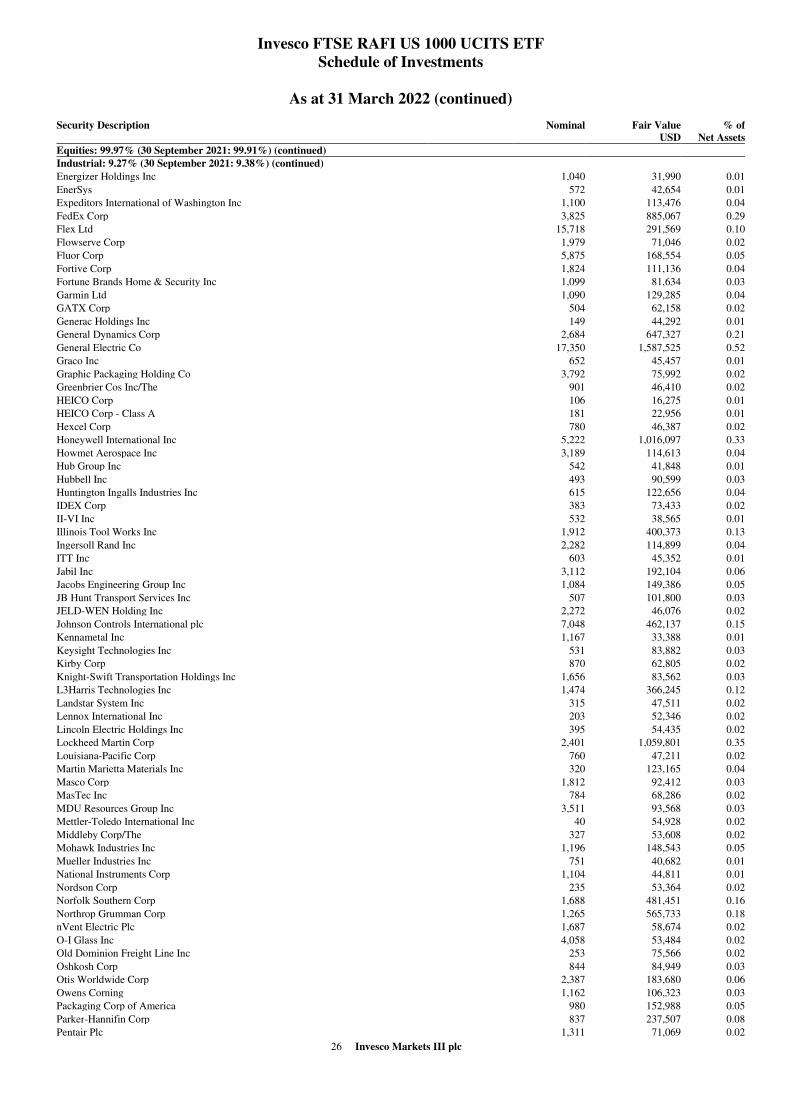
Industrial: 9.27% (30 September 2021: 9.38%) (continued)
Energizer Holdings Inc 1,040 31,990 0.01
EnerSys 572 42,654 0.01
Expeditors International of Washington Inc 1,100 113,476 0.04
FedEx Corp 3,825 885,067 0.29
Flex Ltd 15,718 291,569 0.10
Flowserve Corp 1,979 71,046 0.02
Fluor Corp 5,875 168,554 0.05
Fortive Corp 1,824 111,136 0.04
Fortune Brands Home & Security Inc 1,099 81,634 0.03
Garmin Ltd 1,090 129,285 0.04
GATX Corp 504 62,158 0.02
Generac Holdings Inc 149 44,292 0.01
General Dynamics Corp 2,684 647,327 0.21
General Electric Co 17,350 1,587,525 0.52
Graco Inc 652 45,457 0.01
Graphic Packaging Holding Co 3,792 75,992 0.02
Greenbrier Cos Inc/The 901 46,410 0.02
HEICO Corp 106 16,275 0.01
HEICO Corp - Class A 181 22,956 0.01
Hexcel Corp 780 46,387 0.02
Honeywell International Inc 5,222 1,016,097 0.33
Howmet Aerospace Inc 3,189 114,613 0.04
Hub Group Inc 542 41,848 0.01
Hubbell Inc 493 90,599 0.03
Huntington Ingalls Industries Inc 615 122,656 0.04
IDEX Corp 383 73,433 0.02
II-VI Inc 532 38,565 0.01
Illinois Tool Works Inc 1,912 400,373 0.13
Ingersoll Rand Inc 2,282 114,899 0.04
ITT Inc 603 45,352 0.01
Jabil Inc 3,112 192,104 0.06
Jacobs Engineering Group Inc 1,084 149,386 0.05
JB Hunt Transport Services Inc 507 101,800 0.03
JELD-WEN Holding Inc 2,272 46,076 0.02
Johnson Controls International plc 7,048 462,137 0.15
Kennametal Inc 1,167 33,388 0.01
Keysight Technologies Inc 531 83,882 0.03
Kirby Corp 870 62,805 0.02
Knight-Swift Transportation Holdings Inc 1,656 83,562 0.03
L3Harris Technologies Inc 1,474 366,245 0.12
Landstar System Inc 315 47,511 0.02
Lennox International Inc 203 52,346 0.02
Lincoln Electric Holdings Inc 395 54,435 0.02
Lockheed Martin Corp 2,401 1,059,801 0.35
Louisiana-Pacific Corp 760 47,211 0.02
Martin Marietta Materials Inc 320 123,165 0.04
Masco Corp 1,812 92,412 0.03
MasTec Inc 784 68,286 0.02
MDU Resources Group Inc 3,511 93,568 0.03
Mettler-Toledo International Inc 40 54,928 0.02
Middleby Corp/The 327 53,608 0.02
Mohawk Industries Inc 1,196 148,543 0.05
Mueller Industries Inc 751 40,682 0.01
National Instruments Corp 1,104 44,811 0.01
Nordson Corp 235 53,364 0.02
Norfolk Southern Corp 1,688 481,451 0.16
Northrop Grumman Corp 1,265 565,733 0.18
nVent Electric Plc 1,687 58,674 0.02
O-I Glass Inc 4,058 53,484 0.02
Old Dominion Freight Line Inc 253 75,566 0.02
Oshkosh Corp 844 84,949 0.03
Otis Worldwide Corp 2,387 183,680 0.06
Owens Corning 1,162 106,323 0.03
Packaging Corp of America 980 152,988 0.05
Parker-Hannifin Corp 837 237,507 0.08
Pentair Plc 1,311 71,069 0.02

27 Invesco Markets III plc
Invesco FTSE RAFI US 1000 UCITS ETF
Schedule of Investments
As at 31 March 2022 (continued)
Security Description
Nominal Fair Value
USD
% of
Net Assets
Equities: 99.97% (30 September 2021: 99.91%) (continued)
Industrial: 9.27% (30 September 2021: 9.38%) (continued)
Raytheon Technologies Corp 12,455 1,233,917 0.40
Regal Rexnord Corp 379 56,388 0.02
Republic Services Inc 1,616 214,120 0.07
Rockwell Automation Inc 605 169,418 0.06
Ryder System Inc 1,785 141,604 0.05
Sanmina Corp 1,644 66,450 0.02
Sealed Air Corp 1,045 69,973 0.02
Sensata Technologies Holding Plc 1,470 74,749 0.02
Silgan Holdings Inc 1,070 49,466 0.02
Snap-on Inc 526 108,082 0.04
Sonoco Products Co 1,543 96,530 0.03
Spirit AeroSystems Holdings Inc 1,345 65,757 0.02
Stanley Black & Decker Inc 1,676 234,288 0.08
Stericycle Inc 1,017 59,922 0.02
Summit Materials Inc 1,347 41,838 0.01
TD SYNNEX Corp 368 37,981 0.01
TE Connectivity Ltd 2,172 284,489 0.09
Teledyne Technologies Inc 171 80,820 0.03
Terex Corp 987 35,196 0.01
Textron Inc 2,411 179,330 0.06
Timken Co/The 810 49,167 0.02
TopBuild Corp 182 33,013 0.01
Toro Co/The 536 45,823 0.02
Trane Technologies Plc 1,478 225,691 0.07
TransDigm Group Inc 422 274,950 0.09
Trimble Inc 1,131 81,590 0.03
Trinity Industries Inc 1,405 48,276 0.02
TTM Technologies Inc 3,743 55,471 0.02
UFP Industries Inc 538 41,512 0.01
Union Pacific Corp 3,837 1,048,307 0.34
United Parcel Service Inc 4,990 1,070,155 0.35
Valmont Industries Inc 181 43,187 0.01
Vishay Intertechnology Inc 2,223 43,571 0.01
Vontier Corp 1,986 50,424 0.02
Vulcan Materials Co 688 126,386 0.04
Waste Management Inc 2,868 454,578 0.15
Werner Enterprises Inc 1,012 41,492 0.01
Westinghouse Air Brake Technologies Corp 1,352 130,022 0.04
Westrock Co 6,403 301,133 0.10
Woodward Inc 342 42,719 0.01
XPO Logistics Inc 1,395 101,556 0.03
Xylem Inc/NY 1,063 90,631 0.03
Total Industrial 28,436,919 9.27
Technology: 10.99% (30 September 2021: 10.93%)
Accenture Plc 2,651 893,997 0.29
Activision Blizzard Inc 3,421 274,056 0.09
Adobe Inc 767 349,461 0.11
Advanced Micro Devices Inc 1,145 125,194 0.04
Akamai Technologies Inc 974 116,286 0.04
Amdocs Ltd 1,178 96,843 0.03
Amkor Technology Inc 1,647 35,773 0.01
Analog Devices Inc 1,870 308,887 0.10
ANSYS Inc 237 75,283 0.02
Apple Inc 37,148 6,486,412 2.11
Applied Materials Inc 2,987 393,687 0.13
Black Knight Inc 949 55,032 0.02
Broadcom Inc 1,711 1,077,382 0.35
Broadridge Financial Solutions Inc 631 98,253 0.03
CACI International Inc 304 91,583 0.03
Cadence Design Systems Inc 467 76,803 0.03
CDK Global Inc 1,001 48,729 0.02
Cerner Corp 1,374 128,551 0.04
Change Healthcare Inc 3,418 74,512 0.02
Check Point Software Technologies Ltd 518 71,619 0.02
Cirrus Logic Inc 419 35,527 0.01
Citrix Systems Inc 546 55,091 0.02
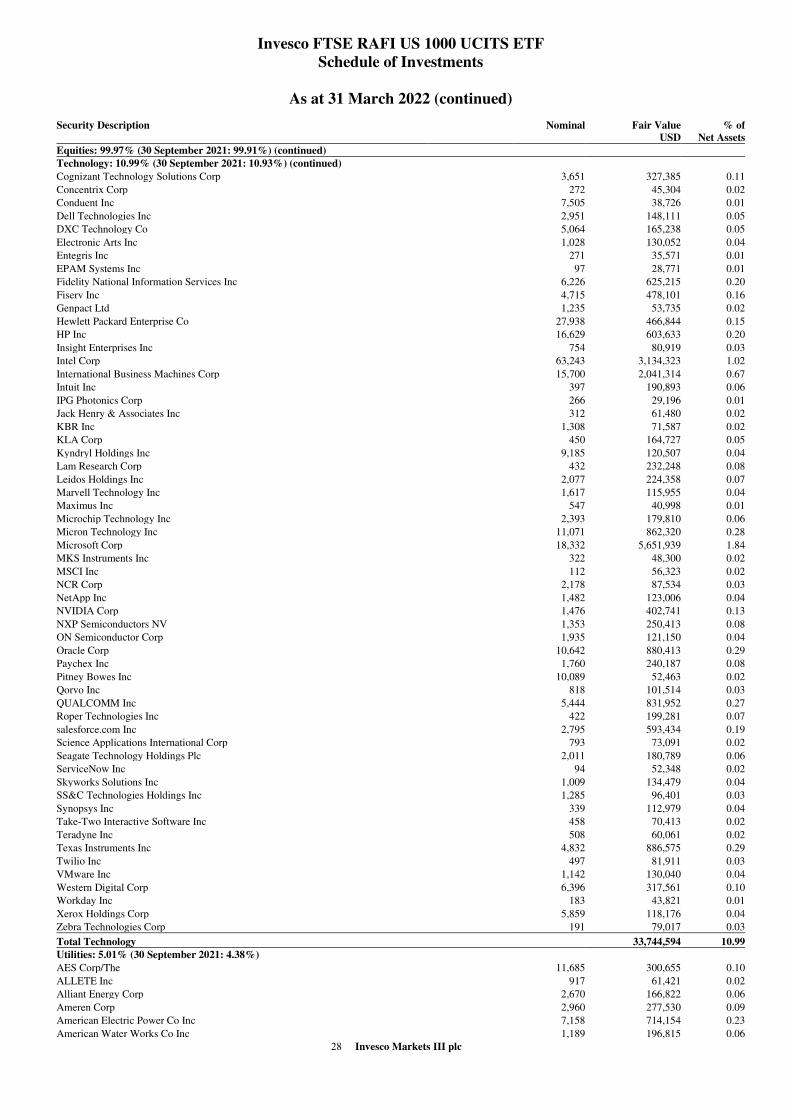
28 Invesco Markets III plc
Invesco FTSE RAFI US 1000 UCITS ETF
Schedule of Investments
As at 31 March 2022 (continued)
Security Description
Nominal Fair Value
USD
% of
Net Assets
Equities: 99.97% (30 September 2021: 99.91%) (continued)
Technology: 10.99% (30 September 2021: 10.93%) (continued)
Cognizant Technology Solutions Corp 3,651 327,385 0.11
Concentrix Corp 272 45,304 0.02
Conduent Inc 7,505 38,726 0.01
Dell Technologies Inc 2,951 148,111 0.05
DXC Technology Co 5,064 165,238 0.05
Electronic Arts Inc 1,028 130,052 0.04
Entegris Inc 271 35,571 0.01
EPAM Systems Inc 97 28,771 0.01
Fidelity National Information Services Inc 6,226 625,215 0.20
Fiserv Inc 4,715 478,101 0.16
Genpact Ltd 1,235 53,735 0.02
Hewlett Packard Enterprise Co 27,938 466,844 0.15
HP Inc 16,629 603,633 0.20
Insight Enterprises Inc 754 80,919 0.03
Intel Corp 63,243 3,134,323 1.02
International Business Machines Corp 15,700 2,041,314 0.67
Intuit Inc 397 190,893 0.06
IPG Photonics Corp 266 29,196 0.01
Jack Henry & Associates Inc 312 61,480 0.02
KBR Inc 1,308 71,587 0.02
KLA Corp 450 164,727 0.05
Kyndryl Holdings Inc 9,185 120,507 0.04
Lam Research Corp 432 232,248 0.08
Leidos Holdings Inc 2,077 224,358 0.07
Marvell Technology Inc 1,617 115,955 0.04
Maximus Inc 547 40,998 0.01
Microchip Technology Inc 2,393 179,810 0.06
Micron Technology Inc 11,071 862,320 0.28
Microsoft Corp 18,332 5,651,939 1.84
MKS Instruments Inc 322 48,300 0.02
MSCI Inc 112 56,323 0.02
NCR Corp 2,178 87,534 0.03
NetApp Inc 1,482 123,006 0.04
NVIDIA Corp 1,476 402,741 0.13
NXP Semiconductors NV 1,353 250,413 0.08
ON Semiconductor Corp 1,935 121,150 0.04
Oracle Corp 10,642 880,413 0.29
Paychex Inc 1,760 240,187 0.08
Pitney Bowes Inc 10,089 52,463 0.02
Qorvo Inc 818 101,514 0.03
QUALCOMM Inc 5,444 831,952 0.27
Roper Technologies Inc 422 199,281 0.07
salesforce.com Inc 2,795 593,434 0.19
Science Applications International Corp 793 73,091 0.02
Seagate Technology Holdings Plc 2,011 180,789 0.06
ServiceNow Inc 94 52,348 0.02
Skyworks Solutions Inc 1,009 134,479 0.04
SS&C Technologies Holdings Inc 1,285 96,401 0.03
Synopsys Inc 339 112,979 0.04
Take-Two Interactive Software Inc 458 70,413 0.02
Teradyne Inc 508 60,061 0.02
Texas Instruments Inc 4,832 886,575 0.29
Twilio Inc 497 81,911 0.03
VMware Inc 1,142 130,040 0.04
Western Digital Corp 6,396 317,561 0.10
Workday Inc 183 43,821 0.01
Xerox Holdings Corp 5,859 118,176 0.04
Zebra Technologies Corp 191 79,017 0.03
Total Technology 33,744,594 10.99
Utilities: 5.01% (30 September 2021: 4.38%)
AES Corp/The 11,685 300,655 0.10
ALLETE Inc 917 61,421 0.02
Alliant Energy Corp 2,670 166,822 0.06
Ameren Corp 2,960 277,530 0.09
American Electric Power Co Inc 7,158 714,154 0.23
American Water Works Co Inc 1,189 196,815 0.06

29 Invesco Markets III plc
Invesco FTSE RAFI US 1000 UCITS ETF
Schedule of Investments
As at 31 March 2022 (continued)
Security Description
Nominal Fair Value
USD
% of
Net Assets
Equities: 99.97% (30 September 2021: 99.91%) (continued)
Utilities: 5.01% (30 September 2021: 4.38%) (continued)
Atmos Energy Corp 1,279 152,828 0.05
Avangrid Inc 983 45,945 0.02
Avista Corp 1,245 56,212 0.02
Black Hills Corp 949 73,092 0.02
CenterPoint Energy Inc 8,541 261,696 0.09
CMS Energy Corp 3,480 243,391 0.08
Consolidated Edison Inc 5,856 554,446 0.18
Dominion Energy Inc 10,194 866,184 0.28
DTE Energy Co 2,589 342,292 0.11
Duke Energy Corp 12,194 1,361,582 0.44
Edison International 6,708 470,231 0.15
Entergy Corp 3,325 388,194 0.13
Essential Utilities Inc 1,666 85,183 0.03
Evergy Inc 3,679 251,423 0.08
Eversource Energy 4,196 370,045 0.12
Exelon Corp 23,057 1,098,205 0.36
FirstEnergy Corp 8,851 405,907 0.13
Hawaiian Electric Industries Inc 1,564 66,173 0.02
IDACORP Inc 595 68,639 0.02
National Fuel Gas Co 1,021 70,143 0.02
New Jersey Resources Corp 1,258 57,692 0.02
NextEra Energy Inc 13,548 1,147,651 0.37
NiSource Inc 5,261 167,300 0.06
NorthWestern Corp 909 54,985 0.02
NRG Energy Inc 3,241 124,325 0.04
OGE Energy Corp 3,150 128,457 0.04
ONE Gas Inc 713 62,915 0.02
PG&E Corp 20,140 240,472 0.08
Pinnacle West Capital Corp 2,342 182,910 0.06
PNM Resources Inc 1,214 57,871 0.02
Portland General Electric Co 1,510 83,276 0.03
PPL Corp 17,583 502,170 0.16
Public Service Enterprise Group Inc 6,726 470,820 0.15
Sempra Energy 3,534 594,136 0.19
South Jersey Industries Inc 1,780 61,499 0.02
Southern Co/The 15,635 1,133,694 0.37
Southwest Gas Holdings Inc 1,132 88,624 0.03
Spire Inc 921 66,091 0.02
UGI Corp 3,801 137,672 0.05
Vistra Corp 10,905 253,541 0.08
WEC Energy Group Inc 3,526 351,930 0.12
Xcel Energy Inc 6,511 469,899 0.15
Total Utilities 15,387,138 5.01
Total Equities 306,876,494 99.97
Investment Funds: 0.00% (30 September 2021: 0.01%)
Financial: 0.00% (30 September 2021: 0.01%)
Financial assets at fair value through profit or loss 306,876,494 99.97
Current assets (30 September 2021: 0.11%) 264,939 0.08
Total assets 307,141,433 100.05
Current liabilities (30 September 2021: (0.03%)) (165,204) (0.05)
Net assets attributable to holders of redeemable participating Shares 306,976,229 100.00
% of
total
assets
Analysis of Total Assets
Transferable securities admitted to an official stock exchange listing or dealt in on another regulated market 99.91
Other assets 0.09
100.00
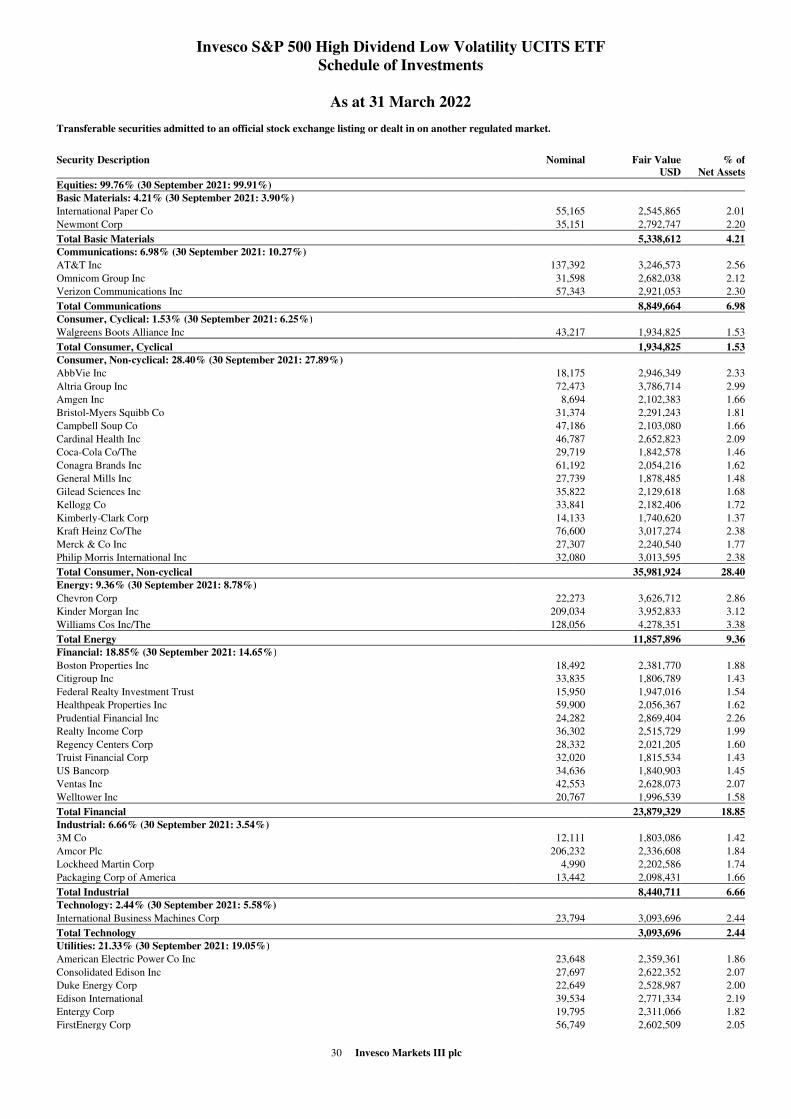
30 Invesco Markets III plc
Invesco S&P 500 High Dividend Low Volatility UCITS ETF
Schedule of Investments
As at 31 March 2022
Transferable securities admitted to an official stock exchange listing or dealt in on another regulated market.
Security Description
Nominal Fair Value
USD
% of
Net Assets
Equities: 99.76% (30 September 2021: 99.91%)
Basic Materials: 4.21% (30 September 2021: 3.90%)
International Paper Co 55,165 2,545,865 2.01
Newmont Corp 35,151 2,792,747 2.20
Total Basic Materials 5,338,612 4.21
Communications: 6.98% (30 September 2021: 10.27%)
AT&T Inc 137,392 3,246,573 2.56
Omnicom Group Inc 31,598 2,682,038 2.12
Verizon Communications Inc 57,343 2,921,053 2.30
Total Communications 8,849,664 6.98
Consumer, Cyclical: 1.53% (30 September 2021: 6.25%)
Walgreens Boots Alliance Inc 43,217 1,934,825 1.53
Total Consumer, Cyclical 1,934,825 1.53
Consumer, Non-cyclical: 28.40% (30 September 2021: 27.89%)
AbbVie Inc 18,175 2,946,349 2.33
Altria Group Inc 72,473 3,786,714 2.99
Amgen Inc 8,694 2,102,383 1.66
Bristol-Myers Squibb Co 31,374 2,291,243 1.81
Campbell Soup Co 47,186 2,103,080 1.66
Cardinal Health Inc 46,787 2,652,823 2.09
Coca-Cola Co/The 29,719 1,842,578 1.46
Conagra Brands Inc 61,192 2,054,216 1.62
General Mills Inc 27,739 1,878,485 1.48
Gilead Sciences Inc 35,822 2,129,618 1.68
Kellogg Co 33,841 2,182,406 1.72
Kimberly-Clark Corp 14,133 1,740,620 1.37
Kraft Heinz Co/The 76,600 3,017,274 2.38
Merck & Co Inc 27,307 2,240,540 1.77
Philip Morris International Inc 32,080 3,013,595 2.38
Total Consumer, Non-cyclical 35,981,924 28.40
Energy: 9.36% (30 September 2021: 8.78%)
Chevron Corp 22,273 3,626,712 2.86
Kinder Morgan Inc 209,034 3,952,833 3.12
Williams Cos Inc/The 128,056 4,278,351 3.38
Total Energy 11,857,896 9.36
Financial: 18.85% (30 September 2021: 14.65%)
Boston Properties Inc 18,492 2,381,770 1.88
Citigroup Inc 33,835 1,806,789 1.43
Federal Realty Investment Trust 15,950 1,947,016 1.54
Healthpeak Properties Inc 59,900 2,056,367 1.62
Prudential Financial Inc 24,282 2,869,404 2.26
Realty Income Corp 36,302 2,515,729 1.99
Regency Centers Corp 28,332 2,021,205 1.60
Truist Financial Corp 32,020 1,815,534 1.43
US Bancorp 34,636 1,840,903 1.45
Ventas Inc 42,553 2,628,073 2.07
Welltower Inc 20,767 1,996,539 1.58
Total Financial 23,879,329 18.85
Industrial: 6.66% (30 September 2021: 3.54%)
3M Co 12,111 1,803,086 1.42
Amcor Plc 206,232 2,336,608 1.84
Lockheed Martin Corp 4,990 2,202,586 1.74
Packaging Corp of America 13,442 2,098,431 1.66
Total Industrial 8,440,711 6.66
Technology: 2.44% (30 September 2021: 5.58%)
International Business Machines Corp 23,794 3,093,696 2.44
Total Technology 3,093,696 2.44
Utilities: 21.33% (30 September 2021: 19.05%)
American Electric Power Co Inc 23,648 2,359,361 1.86
Consolidated Edison Inc 27,697 2,622,352 2.07
Duke Energy Corp 22,649 2,528,987 2.00
Edison International 39,534 2,771,334 2.19
Entergy Corp 19,795 2,311,066 1.82
FirstEnergy Corp 56,749 2,602,509 2.05
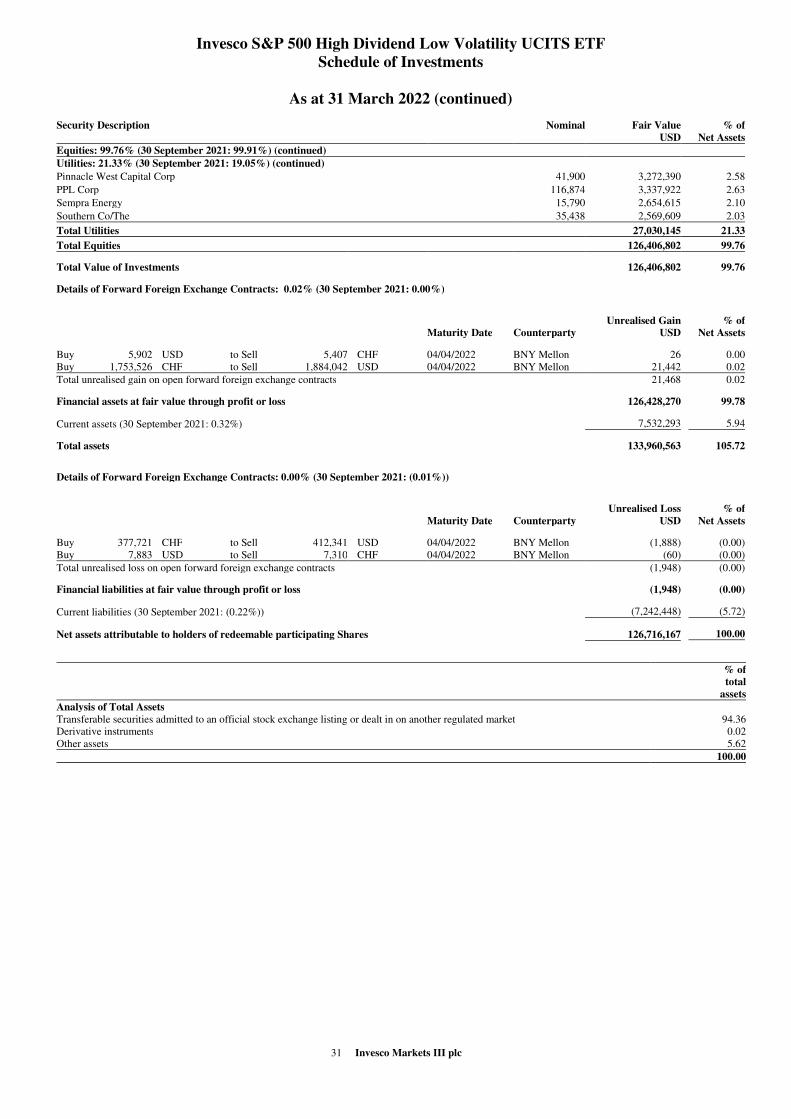
31 Invesco Markets III plc
Invesco S&P 500 High Dividend Low Volatility UCITS ETF
Schedule of Investments
As at 31 March 2022 (continued)
Security Description
Nominal Fair Value
USD
% of
Net Assets
Equities: 99.76% (30 September 2021: 99.91%) (continued)
Utilities: 21.33% (30 September 2021: 19.05%) (continued)
Pinnacle West Capital Corp 41,900 3,272,390 2.58
PPL Corp 116,874 3,337,922 2.63
Sempra Energy 15,790 2,654,615 2.10
Southern Co/The 35,438 2,569,609 2.03
Total Utilities 27,030,145 21.33
Total Equities 126,406,802 99.76
Total Value of Investments 126,406,802 99.76
Details of Forward Foreign Exchange Contracts: 0.02% (30 September 2021: 0.00%)
Maturity Date Counterparty
Unrealised Gain
USD
% of
Net Assets
Buy 5,902 USD to Sell 5,407 CHF 04/04/2022 BNY Mellon 26 0.00
Buy 1,753,526 CHF to Sell 1,884,042 USD 04/04/2022 BNY Mellon 21,442 0.02
Total unrealised gain on open forward foreign exchange contracts 21,468 0.02
Financial assets at fair value through profit or loss 126,428,270 99.78
Current assets (30 September 2021: 0.32%) 7,532,293 5.94
Total assets 133,960,563 105.72
Details of Forward Foreign Exchange Contracts: 0.00% (30 September 2021: (0.01%))
Maturity Date Counterparty
Unrealised Loss
USD
% of
Net Assets
Buy 377,721 CHF to Sell 412,341 USD 04/04/2022 BNY Mellon (1,888) (0.00)
Buy 7,883 USD to Sell 7,310 CHF 04/04/2022 BNY Mellon (60) (0.00)
Total unrealised loss on open forward foreign exchange contracts (1,948) (0.00)
Financial liabilities at fair value through profit or loss (1,948) (0.00)
Current liabilities (30 September 2021: (0.22%)) (7,242,448) (5.72)
Net assets attributable to holders of redeemable participating Shares 126,716,167 100.00
% of
total
assets
Analysis of Total Assets
Transferable securities admitted to an official stock exchange listing or dealt in on another regulated market 94.36
Derivative instruments 0.02
Other assets 5.62
100.00
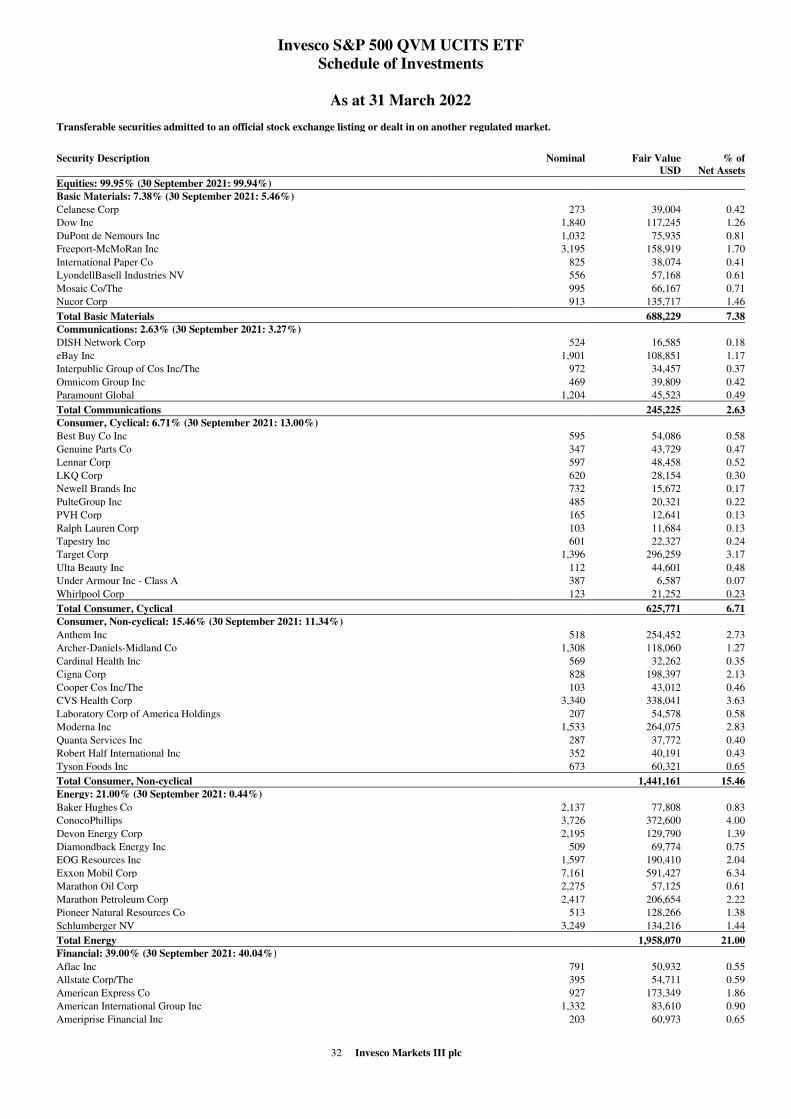
32 Invesco Markets III plc
Invesco S&P 500 QVM UCITS ETF
Schedule of Investments
As at 31 March 2022
Transferable securities admitted to an official stock exchange listing or dealt in on another regulated market.
Security Description
Nominal Fair Value
USD
% of
Net Assets
Equities: 99.95% (30 September 2021: 99.94%)
Basic Materials: 7.38% (30 September 2021: 5.46%)
Celanese Corp 273 39,004 0.42
Dow Inc 1,840 117,245 1.26
DuPont de Nemours Inc 1,032 75,935 0.81
Freeport-McMoRan Inc 3,195 158,919 1.70
International Paper Co 825 38,074 0.41
LyondellBasell Industries NV 556 57,168 0.61
Mosaic Co/The 995 66,167 0.71
Nucor Corp 913 135,717 1.46
Total Basic Materials 688,229 7.38
Communications: 2.63% (30 September 2021: 3.27%)
DISH Network Corp 524 16,585 0.18
eBay Inc 1,901 108,851 1.17
Interpublic Group of Cos Inc/The 972 34,457 0.37
Omnicom Group Inc 469 39,809 0.42
Paramount Global 1,204 45,523 0.49
Total Communications 245,225 2.63
Consumer, Cyclical: 6.71% (30 September 2021: 13.00%)
Best Buy Co Inc 595 54,086 0.58
Genuine Parts Co 347 43,729 0.47
Lennar Corp 597 48,458 0.52
LKQ Corp 620 28,154 0.30
Newell Brands Inc 732 15,672 0.17
PulteGroup Inc 485 20,321 0.22
PVH Corp 165 12,641 0.13
Ralph Lauren Corp 103 11,684 0.13
Tapestry Inc 601 22,327 0.24
Target Corp 1,396 296,259 3.17
Ulta Beauty Inc 112 44,601 0.48
Under Armour Inc - Class A 387 6,587 0.07
Whirlpool Corp 123 21,252 0.23
Total Consumer, Cyclical 625,771 6.71
Consumer, Non-cyclical: 15.46% (30 September 2021: 11.34%)
Anthem Inc 518 254,452 2.73
Archer-Daniels-Midland Co 1,308 118,060 1.27
Cardinal Health Inc 569 32,262 0.35
Cigna Corp 828 198,397 2.13
Cooper Cos Inc/The 103 43,012 0.46
CVS Health Corp 3,340 338,041 3.63
Laboratory Corp of America Holdings 207 54,578 0.58
Moderna Inc 1,533 264,075 2.83
Quanta Services Inc 287 37,772 0.40
Robert Half International Inc 352 40,191 0.43
Tyson Foods Inc 673 60,321 0.65
Total Consumer, Non-cyclical 1,441,161 15.46
Energy: 21.00% (30 September 2021: 0.44%)
Baker Hughes Co 2,137 77,808 0.83
ConocoPhillips 3,726 372,600 4.00
Devon Energy Corp 2,195 129,790 1.39
Diamondback Energy Inc 509 69,774 0.75
EOG Resources Inc 1,597 190,410 2.04
Exxon Mobil Corp 7,161 591,427 6.34
Marathon Oil Corp 2,275 57,125 0.61
Marathon Petroleum Corp 2,417 206,654 2.22
Pioneer Natural Resources Co 513 128,266 1.38
Schlumberger NV 3,249 134,216 1.44
Total Energy 1,958,070 21.00
Financial: 39.00% (30 September 2021: 40.04%)
Aflac Inc 791 50,932 0.55
Allstate Corp/The 395 54,711 0.59
American Express Co 927 173,349 1.86
American International Group Inc 1,332 83,610 0.90
Ameriprise Financial Inc 203 60,973 0.65

33 Invesco Markets III plc
Invesco S&P 500 QVM UCITS ETF
Schedule of Investments
As at 31 March 2022 (continued)
Security Description
Nominal Fair Value
USD
% of
Net Assets
Equities: 99.95% (30 September 2021: 99.94%) (continued)
Financial: 39.00% (30 September 2021: 40.04%) (continued)
Assurant Inc 96 17,456 0.19
Bank of America Corp 7,612 313,767 3.37
Berkshire Hathaway Inc 1,185 418,198 4.49
Capital One Financial Corp 891 116,979 1.25
CBRE Group Inc 788 72,118 0.77
Chubb Ltd 536 114,650 1.23
Cincinnati Financial Corp 216 29,367 0.31
Citigroup Inc 2,748 146,743 1.57
Citizens Financial Group Inc 663 30,054 0.32
Comerica Inc 233 21,070 0.23
Discover Financial Services 508 55,976 0.60
Fifth Third Bancorp 848 36,498 0.39
Franklin Resources Inc 365 10,191 0.11
Goldman Sachs Group Inc/The 467 154,157 1.65
Hartford Financial Services Group Inc/The 476 34,182 0.37
Huntington Bancshares Inc/OH 2,109 30,834 0.33
Invesco Ltd 512 11,807 0.13
JPMorgan Chase & Co 2,091 285,045 3.06
Kimco Realty Corp 1,267 31,295 0.34
Lincoln National Corp 241 15,752 0.17
Loews Corp 332 21,520 0.23
M&T Bank Corp 163 27,628 0.30
Marsh & McLennan Cos Inc 599 102,082 1.09
MetLife Inc 955 67,117 0.72
Morgan Stanley 1,743 152,338 1.63
PNC Financial Services Group Inc/The 657 121,184 1.30
Principal Financial Group Inc 303 22,243 0.24
Prudential Financial Inc 627 74,093 0.79
Raymond James Financial Inc 311 34,182 0.37
Regions Financial Corp 1,568 34,904 0.37
Synchrony Financial 960 33,418 0.36
T Rowe Price Group Inc 305 46,113 0.49
Travelers Cos Inc/The 285 52,078 0.56
US Bancorp 2,095 111,349 1.19
W R Berkley Corp 259 17,247 0.18
Wells Fargo & Co 6,803 329,673 3.54
Zions Bancorp NA 297 19,471 0.21
Total Financial 3,636,354 39.00
Industrial: 5.28% (30 September 2021: 15.04%)
Eaton Corp Plc 800 121,408 1.30
General Dynamics Corp 496 119,625 1.28
JB Hunt Transport Services Inc 164 32,930 0.35
Johnson Controls International plc 1,487 97,503 1.05
Mohawk Industries Inc 125 15,525 0.17
Textron Inc 516 38,380 0.41
Trane Technologies Plc 439 67,035 0.72
Total Industrial 492,406 5.28
Technology: 2.22% (30 September 2021: 11.35%)
DXC Technology Co 680 22,188 0.24
Fortinet Inc 408 139,430 1.49
Hewlett Packard Enterprise Co 2,725 45,535 0.49
Total Technology 207,153 2.22
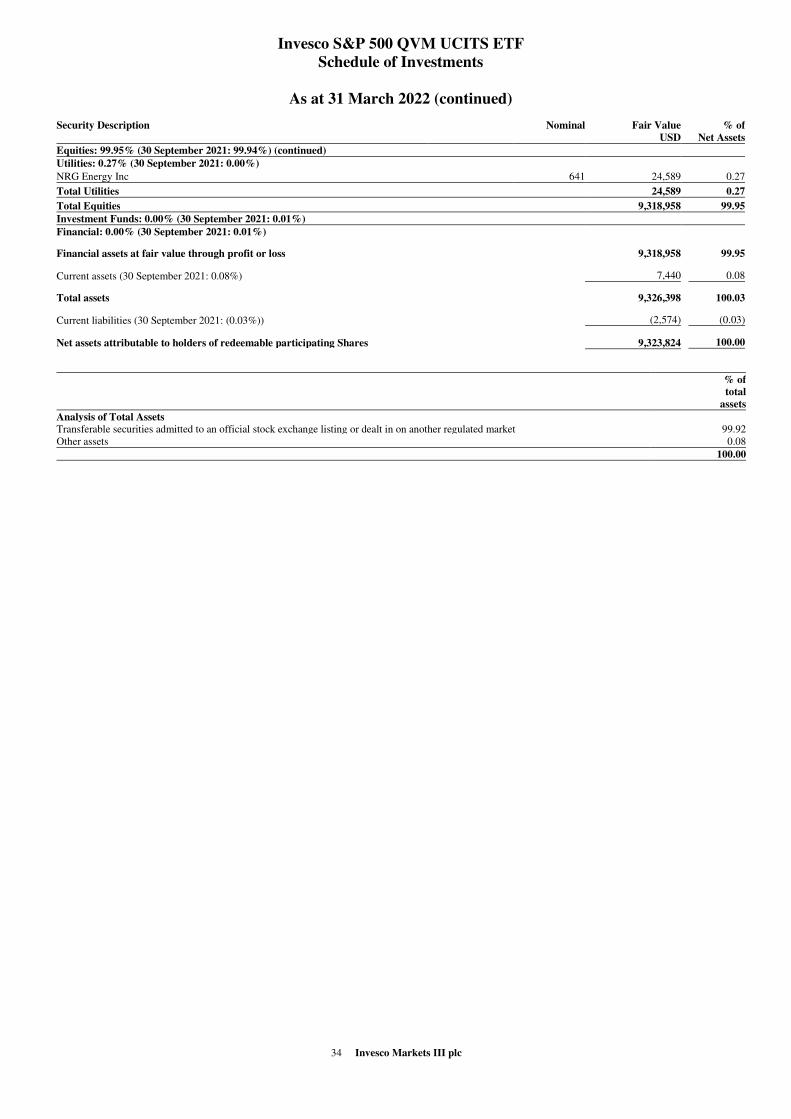
34 Invesco Markets III plc
Invesco S&P 500 QVM UCITS ETF
Schedule of Investments
As at 31 March 2022 (continued)
Security Description
Nominal Fair Value
USD
% of
Net Assets
Equities: 99.95% (30 September 2021: 99.94%) (continued)
Utilities: 0.27% (30 September 2021: 0.00%)
NRG Energy Inc 641 24,589 0.27
Total Utilities 24,589 0.27
Total Equities 9,318,958 99.95
Investment Funds: 0.00% (30 September 2021: 0.01%)
Financial: 0.00% (30 September 2021: 0.01%)
Financial assets at fair value through profit or loss 9,318,958 99.95
Current assets (30 September 2021: 0.08%) 7,440 0.08
Total assets 9,326,398 100.03
Current liabilities (30 September 2021: (0.03%)) (2,574) (0.03)
Net assets attributable to holders of redeemable participating Shares 9,323,824 100.00
% of
total
assets
Analysis of Total Assets
Transferable securities admitted to an official stock exchange listing or dealt in on another regulated market 99.92
Other assets 0.08
100.00

35 Invesco Markets III plc
Invesco Global Buyback Achievers UCITS ETF
Schedule of Investments
As at 31 March 2022
Transferable securities admitted to an official stock exchange listing or dealt in on another regulated market.
Security Description
Nominal Fair Value
USD
% of
Net Assets
Equities: 99.76% (30 September 2021: 100.03%)
Australia: 3.33% (30 September 2021: 2.51%)
Brambles Ltd 304,022 2,262,522 3.17
McMillan Shakespeare Ltd 12,720 114,626 0.16
Total Australia 2,377,148 3.33
Bermuda: 0.62% (30 September 2021: 0.60%)
Assured Guaranty Ltd 1,375 87,533 0.12
Enstar Group Ltd 301 78,606 0.11
RenaissanceRe Holdings Ltd 755 119,675 0.17
Skyworth Group Ltd 298,000 152,969 0.22
Total Bermuda 438,783 0.62
Canada: 4.34% (30 September 2021: 3.59%)
CI Financial Corp 39,503 628,086 0.88
Dream Office Real Estate Investment Trust 6,700 149,493 0.21
DREAM Unlimited Corp 4,941 196,995 0.27
Home Capital Group Inc 8,187 249,068 0.35
Mullen Group Ltd 13,083 139,934 0.20
Onex Corp 15,924 1,068,077 1.50
Parex Resources Inc 25,487 523,379 0.73
Trican Well Service Ltd 47,195 140,556 0.20
Total Canada 3,095,588 4.34
Cayman Islands: 0.09% (30 September 2021: 0.30%)
Herbalife Nutrition Ltd 2,083 63,240 0.09
Total Cayman Islands 63,240 0.09
Euro Countries: 10.21% (30 September 2021: 12.82%)
ACS Actividades de Construccion y Servicios SA 49,741 1,355,932 1.90
Aroundtown SA 273,604 1,581,181 2.22
Banca Monte dei Paschi di Siena SpA 76,059 79,160 0.11
CIE Automotive SA 9,556 219,666 0.31
Euronav NV 39,417 423,573 0.59
Rovio Entertainment Oyj 12,115 102,378 0.14
SBM Offshore NV 29,657 475,663 0.67
Scout24 SE 13,567 784,954 1.10
Vivendi SE 171,462 2,258,794 3.17
Total Euro Countries 7,281,301 10.21
Guernsey: 0.27% (30 September 2021: 0.00%)
Amdocs Ltd 2,368 194,673 0.27
Total Guernsey 194,673 0.27
Indonesia: 0.17% (30 September 2021: 0.19%)
Surya Citra Media Tbk PT 6,080,200 123,615 0.17
Total Indonesia 123,615 0.17
Israel: 0.88% (30 September 2021: 0.63%)
Gazit-Globe Ltd 10,235 93,298 0.13
Paz Oil Co Ltd 967 142,084 0.20
Plus500 Ltd 21,065 391,760 0.55
Total Israel 627,142 0.88
Japan: 10.93% (30 September 2021: 10.11%)
Chugoku Marine Paints Ltd 12,000 89,376 0.13
Enplas Corp 2,400 53,685 0.07
G-7 Holdings Inc 4,500 61,322 0.09
Haseko Corp 51,900 601,634 0.84
Hitachi Transport System Ltd 8,900 492,754 0.69
Kohnan Shoji Co Ltd 6,100 175,650 0.25
Mirait Holdings Corp 22,800 366,115 0.51
Nippon Soda Co Ltd 5,800 161,038 0.23
Obara Group Inc 2,800 68,930 0.10
Okamura Corp 17,900 178,742 0.25
Round One Corp 12,400 137,920 0.19
Ryoyo Electro Corp 4,800 78,461 0.11
Seino Holdings Co Ltd 38,100 349,688 0.49
Shinsei Bank Ltd 23,400 431,273 0.60
SoftBank Group Corp 79,200 3,627,376 5.08
Tamron Co Ltd 4,200 82,391 0.12
Tokyo Steel Manufacturing Co Ltd 26,100 250,302 0.35
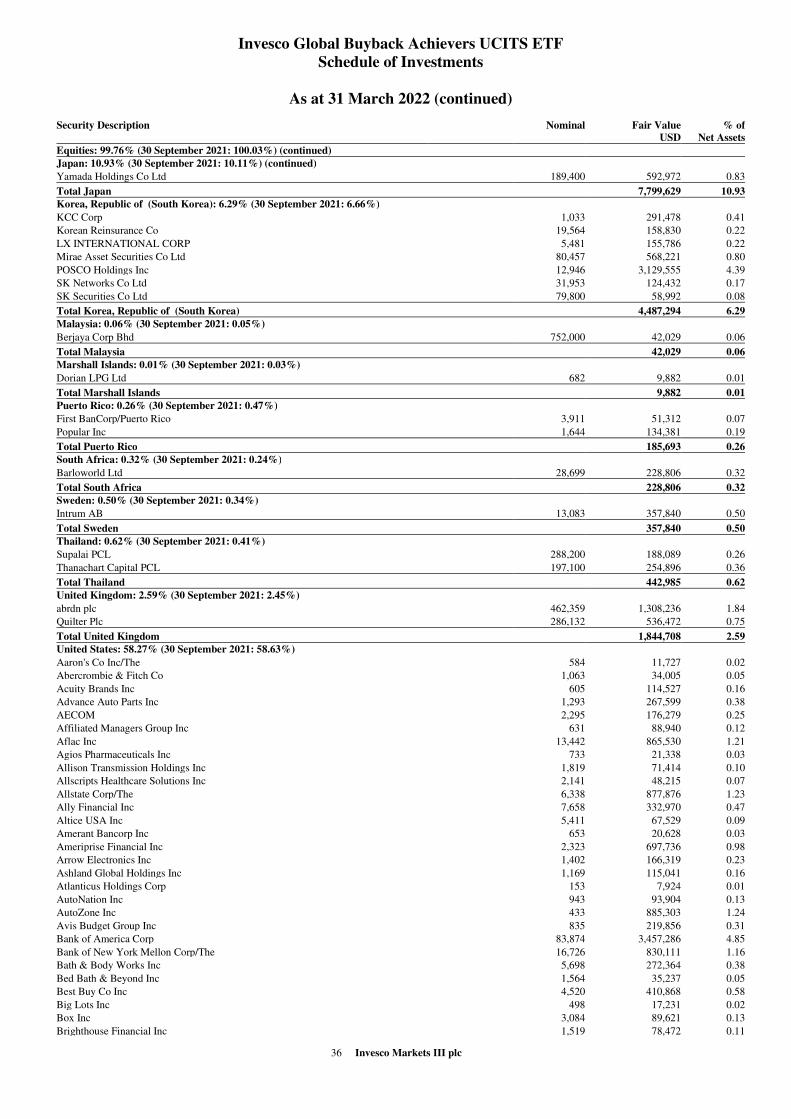
36 Invesco Markets III plc
Invesco Global Buyback Achievers UCITS ETF
Schedule of Investments
As at 31 March 2022 (continued)
Security Description
Nominal Fair Value
USD
% of
Net Assets
Equities: 99.76% (30 September 2021: 100.03%) (continued)
Japan: 10.93% (30 September 2021: 10.11%) (continued)
Yamada Holdings Co Ltd 189,400 592,972 0.83
Total Japan 7,799,629 10.93
Korea, Republic of (South Korea): 6.29% (30 September 2021: 6.66%)
KCC Corp 1,033 291,478 0.41
Korean Reinsurance Co 19,564 158,830 0.22
LX INTERNATIONAL CORP 5,481 155,786 0.22
Mirae Asset Securities Co Ltd 80,457 568,221 0.80
POSCO Holdings Inc 12,946 3,129,555 4.39
SK Networks Co Ltd 31,953 124,432 0.17
SK Securities Co Ltd 79,800 58,992 0.08
Total Korea, Republic of (South Korea) 4,487,294 6.29
Malaysia: 0.06% (30 September 2021: 0.05%)
Berjaya Corp Bhd 752,000 42,029 0.06
Total Malaysia 42,029 0.06
Marshall Islands: 0.01% (30 September 2021: 0.03%)
Dorian LPG Ltd 682 9,882 0.01
Total Marshall Islands 9,882 0.01
Puerto Rico: 0.26% (30 September 2021: 0.47%)
First BanCorp/Puerto Rico 3,911 51,312 0.07
Popular Inc 1,644 134,381 0.19
Total Puerto Rico 185,693 0.26
South Africa: 0.32% (30 September 2021: 0.24%)
Barloworld Ltd 28,699 228,806 0.32
Total South Africa 228,806 0.32
Sweden: 0.50% (30 September 2021: 0.34%)
Intrum AB 13,083 357,840 0.50
Total Sweden 357,840 0.50
Thailand: 0.62% (30 September 2021: 0.41%)
Supalai PCL 288,200 188,089 0.26
Thanachart Capital PCL 197,100 254,896 0.36
Total Thailand 442,985 0.62
United Kingdom: 2.59% (30 September 2021: 2.45%)
abrdn plc 462,359 1,308,236 1.84
Quilter Plc 286,132 536,472 0.75
Total United Kingdom 1,844,708 2.59
United States: 58.27% (30 September 2021: 58.63%)
Aaron's Co Inc/The 584 11,727 0.02
Abercrombie & Fitch Co 1,063 34,005 0.05
Acuity Brands Inc 605 114,527 0.16
Advance Auto Parts Inc 1,293 267,599 0.38
AECOM 2,295 176,279 0.25
Affiliated Managers Group Inc 631 88,940 0.12
Aflac Inc 13,442 865,530 1.21
Agios Pharmaceuticals Inc 733 21,338 0.03
Allison Transmission Holdings Inc 1,819 71,414 0.10
Allscripts Healthcare Solutions Inc 2,141 48,215 0.07
Allstate Corp/The 6,338 877,876 1.23
Ally Financial Inc 7,658 332,970 0.47
Altice USA Inc 5,411 67,529 0.09
Amerant Bancorp Inc 653 20,628 0.03
Ameriprise Financial Inc 2,323 697,736 0.98
Arrow Electronics Inc 1,402 166,319 0.23
Ashland Global Holdings Inc 1,169 115,041 0.16
Atlanticus Holdings Corp 153 7,924 0.01
AutoNation Inc 943 93,904 0.13
AutoZone Inc 433 885,303 1.24
Avis Budget Group Inc 835 219,856 0.31
Bank of America Corp 83,874 3,457,286 4.85
Bank of New York Mellon Corp/The 16,726 830,111 1.16
Bath & Body Works Inc 5,698 272,364 0.38
Bed Bath & Beyond Inc 1,564 35,237 0.05
Best Buy Co Inc 4,520 410,868 0.58
Big Lots Inc 498 17,231 0.02
Box Inc 3,084 89,621 0.13
Brighthouse Financial Inc 1,519 78,472 0.11

37 Invesco Markets III plc
Invesco Global Buyback Achievers UCITS ETF
Schedule of Investments
As at 31 March 2022 (continued)
Security Description
Nominal Fair Value
USD
% of
Net Assets
Equities: 99.76% (30 September 2021: 100.03%) (continued)
United States: 58.27% (30 September 2021: 58.63%) (continued)
CACI International Inc 419 126,228 0.18
Capital One Financial Corp 8,993 1,180,691 1.65
Carriage Services Inc 296 15,786 0.02
CDW Corp/DE 2,997 536,133 0.75
Celanese Corp 2,288 326,887 0.46
Charter Communications Inc 2,593 1,414,533 1.98
Cigna Corp 7,003 1,677,989 2.35
Citi Trends Inc 178 5,451 0.01
CNO Financial Group Inc 2,426 60,868 0.09
CNX Resources Corp 4,157 86,133 0.12
Comerica Inc 2,696 243,799 0.34
Credit Acceptance Corp 221 121,632 0.17
Crocs Inc 1,030 78,692 0.11
Crown Holdings Inc 2,826 353,504 0.50
Curtiss-Wright Corp 798 119,828 0.17
DaVita Inc 1,465 165,706 0.23
Dillard's Inc 277 74,344 0.10
Diodes Inc 856 74,463 0.10
Dollar General Corp 4,431 986,474 1.38
Domino's Pizza Inc 714 290,605 0.41
Dropbox Inc 6,852 159,309 0.22
DuPont de Nemours Inc 11,446 842,197 1.18
Dycom Industries Inc 569 54,203 0.08
eBay Inc 13,010 744,953 1.04
EchoStar Corp 759 18,474 0.03
Encore Capital Group Inc 340 21,328 0.03
Equitable Holdings Inc 7,339 226,849 0.32
Fair Isaac Corp 550 256,553 0.36
Gartner Inc 1,815 539,890 0.76
Grand Canyon Education Inc 755 73,318 0.10
Hain Celestial Group Inc/The 1,840 63,296 0.09
Hartford Financial Services Group Inc/The 6,686 480,122 0.67
HCA Healthcare Inc 4,910 1,230,544 1.72
Hibbett Inc 242 10,730 0.02
Hilltop Holdings Inc 1,203 35,368 0.05
HomeStreet Inc 390 18,478 0.03
HP Inc 22,501 816,786 1.14
Ingles Markets Inc 278 24,756 0.03
Innoviva Inc 1,277 24,710 0.03
iStar Inc 1,044 24,440 0.03
J M Smucker Co/The 2,254 305,214 0.43
Jack in the Box Inc 420 39,232 0.06
JELD-WEN Holding Inc 687 13,932 0.02
KAR Auction Services Inc 2,116 38,194 0.05
Kearny Financial Corp/MD 1,279 16,474 0.02
Kohl's Corp 2,829 171,041 0.24
L3Harris Technologies Inc 4,074 1,012,267 1.42
Laureate Education Inc 1,881 22,290 0.03
Lincoln National Corp 3,555 232,355 0.33
Loews Corp 3,869 250,789 0.35
Louisiana-Pacific Corp 1,771 110,015 0.15
Lowe's Cos Inc 14,436 2,918,815 4.09
Lumen Technologies Inc 18,790 211,763 0.30
Magnolia Oil & Gas Corp 3,134 74,119 0.10
ManpowerGroup Inc 958 89,975 0.13
Marathon Petroleum Corp 12,866 1,100,043 1.54
Masco Corp 5,125 261,375 0.37
Meta Financial Group Inc 526 28,888 0.04
MetLife Inc 15,913 1,118,366 1.57
MGM Resorts International 8,503 356,616 0.50
Mr Cooper Group Inc 1,346 61,472 0.09
Murphy USA Inc 516 103,179 0.14
Navient Corp 2,994 51,018 0.07
Nexstar Media Group Inc 859 161,904 0.23
Northfield Bancorp Inc 758 10,885 0.02
Nucor Corp 5,367 797,805 1.12
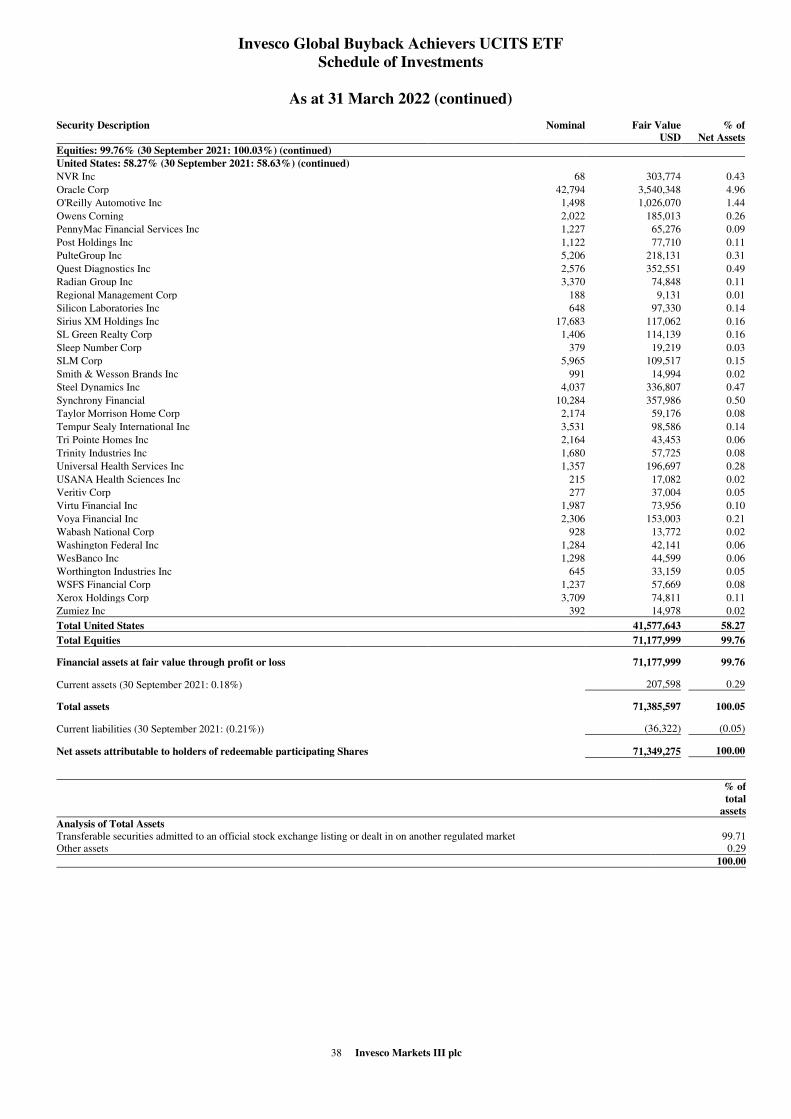
38 Invesco Markets III plc
Invesco Global Buyback Achievers UCITS ETF
Schedule of Investments
As at 31 March 2022 (continued)
Security Description
Nominal Fair Value
USD
% of
Net Assets
Equities: 99.76% (30 September 2021: 100.03%) (continued)
United States: 58.27% (30 September 2021: 58.63%) (continued)
NVR Inc 68 303,774 0.43
Oracle Corp 42,794 3,540,348 4.96
O'Reilly Automotive Inc 1,498 1,026,070 1.44
Owens Corning 2,022 185,013 0.26
PennyMac Financial Services Inc 1,227 65,276 0.09
Post Holdings Inc 1,122 77,710 0.11
PulteGroup Inc 5,206 218,131 0.31
Quest Diagnostics Inc 2,576 352,551 0.49
Radian Group Inc 3,370 74,848 0.11
Regional Management Corp 188 9,131 0.01
Silicon Laboratories Inc 648 97,330 0.14
Sirius XM Holdings Inc 17,683 117,062 0.16
SL Green Realty Corp 1,406 114,139 0.16
Sleep Number Corp 379 19,219 0.03
SLM Corp 5,965 109,517 0.15
Smith & Wesson Brands Inc 991 14,994 0.02
Steel Dynamics Inc 4,037 336,807 0.47
Synchrony Financial 10,284 357,986 0.50
Taylor Morrison Home Corp 2,174 59,176 0.08
Tempur Sealy International Inc 3,531 98,586 0.14
Tri Pointe Homes Inc 2,164 43,453 0.06
Trinity Industries Inc 1,680 57,725 0.08
Universal Health Services Inc 1,357 196,697 0.28
USANA Health Sciences Inc 215 17,082 0.02
Veritiv Corp 277 37,004 0.05
Virtu Financial Inc 1,987 73,956 0.10
Voya Financial Inc 2,306 153,003 0.21
Wabash National Corp 928 13,772 0.02
Washington Federal Inc 1,284 42,141 0.06
WesBanco Inc 1,298 44,599 0.06
Worthington Industries Inc 645 33,159 0.05
WSFS Financial Corp 1,237 57,669 0.08
Xerox Holdings Corp 3,709 74,811 0.11
Zumiez Inc 392 14,978 0.02
Total United States 41,577,643 58.27
Total Equities 71,177,999 99.76
Financial assets at fair value through profit or loss 71,177,999 99.76
Current assets (30 September 2021: 0.18%) 207,598 0.29
Total assets 71,385,597 100.05
Current liabilities (30 September 2021: (0.21%)) (36,322) (0.05)
Net assets attributable to holders of redeemable participating Shares 71,349,275 100.00
% of
total
assets
Analysis of Total Assets
Transferable securities admitted to an official stock exchange listing or dealt in on another regulated market 99.71
Other assets 0.29
100.00
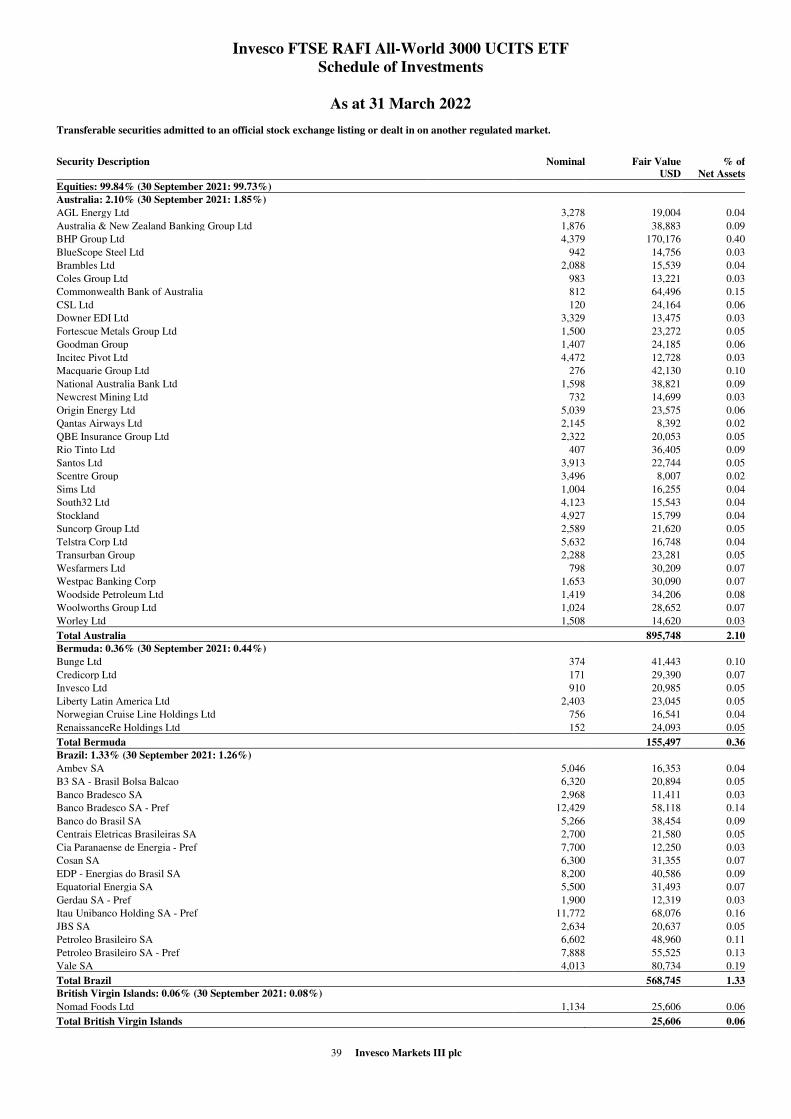
39 Invesco Markets III plc
Invesco FTSE RAFI All-World 3000 UCITS ETF
Schedule of Investments
As at 31 March 2022
Transferable securities admitted to an official stock exchange listing or dealt in on another regulated market.
Security Description
Nominal Fair Value
USD
% of
Net Assets
Equities: 99.84% (30 September 2021: 99.73%)
Australia: 2.10% (30 September 2021: 1.85%)
AGL Energy Ltd 3,278 19,004 0.04
Australia & New Zealand Banking Group Ltd 1,876 38,883 0.09
BHP Group Ltd 4,379 170,176 0.40
BlueScope Steel Ltd 942 14,756 0.03
Brambles Ltd 2,088 15,539 0.04
Coles Group Ltd 983 13,221 0.03
Commonwealth Bank of Australia 812 64,496 0.15
CSL Ltd 120 24,164 0.06
Downer EDI Ltd 3,329 13,475 0.03
Fortescue Metals Group Ltd 1,500 23,272 0.05
Goodman Group 1,407 24,185 0.06
Incitec Pivot Ltd 4,472 12,728 0.03
Macquarie Group Ltd 276 42,130 0.10
National Australia Bank Ltd 1,598 38,821 0.09
Newcrest Mining Ltd 732 14,699 0.03
Origin Energy Ltd 5,039 23,575 0.06
Qantas Airways Ltd 2,145 8,392 0.02
QBE Insurance Group Ltd 2,322 20,053 0.05
Rio Tinto Ltd 407 36,405 0.09
Santos Ltd 3,913 22,744 0.05
Scentre Group 3,496 8,007 0.02
Sims Ltd 1,004 16,255 0.04
South32 Ltd 4,123 15,543 0.04
Stockland 4,927 15,799 0.04
Suncorp Group Ltd 2,589 21,620 0.05
Telstra Corp Ltd 5,632 16,748 0.04
Transurban Group 2,288 23,281 0.05
Wesfarmers Ltd 798 30,209 0.07
Westpac Banking Corp 1,653 30,090 0.07
Woodside Petroleum Ltd 1,419 34,206 0.08
Woolworths Group Ltd 1,024 28,652 0.07
Worley Ltd 1,508 14,620 0.03
Total Australia 895,748 2.10
Bermuda: 0.36% (30 September 2021: 0.44%)
Bunge Ltd 374 41,443 0.10
Credicorp Ltd 171 29,390 0.07
Invesco Ltd 910 20,985 0.05
Liberty Latin America Ltd 2,403 23,045 0.05
Norwegian Cruise Line Holdings Ltd 756 16,541 0.04
RenaissanceRe Holdings Ltd 152 24,093 0.05
Total Bermuda 155,497 0.36
Brazil: 1.33% (30 September 2021: 1.26%)
Ambev SA 5,046 16,353 0.04
B3 SA - Brasil Bolsa Balcao 6,320 20,894 0.05
Banco Bradesco SA 2,968 11,411 0.03
Banco Bradesco SA - Pref 12,429 58,118 0.14
Banco do Brasil SA 5,266 38,454 0.09
Centrais Eletricas Brasileiras SA 2,700 21,580 0.05
Cia Paranaense de Energia - Pref 7,700 12,250 0.03
Cosan SA 6,300 31,355 0.07
EDP - Energias do Brasil SA 8,200 40,586 0.09
Equatorial Energia SA 5,500 31,493 0.07
Gerdau SA - Pref 1,900 12,319 0.03
Itau Unibanco Holding SA - Pref 11,772 68,076 0.16
JBS SA 2,634 20,637 0.05
Petroleo Brasileiro SA 6,602 48,960 0.11
Petroleo Brasileiro SA - Pref 7,888 55,525 0.13
Vale SA 4,013 80,734 0.19
Total Brazil 568,745 1.33
British Virgin Islands: 0.06% (30 September 2021: 0.08%)
Nomad Foods Ltd 1,134 25,606 0.06
Total British Virgin Islands 25,606 0.06

40 Invesco Markets III plc
Invesco FTSE RAFI All-World 3000 UCITS ETF
Schedule of Investments
As at 31 March 2022 (continued)
Security Description
Nominal Fair Value
USD
% of
Net Assets
Equities: 99.84% (30 September 2021: 99.73%) (continued)
Canada: 4.10% (30 September 2021: 4.15%)
Agnico Eagle Mines Ltd 301 18,435 0.04
Air Canada 1,377 26,733 0.06
Algonquin Power & Utilities Corp 1,273 19,761 0.05
Alimentation Couche-Tard Inc 849 38,281 0.09
Allied Properties Real Estate Investment Trust 715 26,692 0.06
ARC Resources Ltd 792 10,614 0.02
Bank of Montreal 601 70,783 0.17
Bank of Nova Scotia/The 572 41,031 0.10
Barrick Gold Corp 1,133 27,811 0.06
Bausch Health Cos Inc 740 16,920 0.04
Brookfield Asset Management Inc 1,088 61,565 0.14
Canadian Apartment Properties REIT 481 20,660 0.05
Canadian Imperial Bank of Commerce 484 58,801 0.14
Canadian National Railway Co 327 43,903 0.10
Canadian Natural Resources Ltd 956 59,247 0.14
Canadian Pacific Railway Ltd 346 28,581 0.07
Cenovus Energy Inc 1,138 18,987 0.04
CGI Inc 203 16,185 0.04
Crescent Point Energy Corp 2,144 15,551 0.04
Dollarama Inc 254 14,417 0.03
Emera Inc 476 23,616 0.06
Empire Co Ltd 1,146 40,681 0.09
Enbridge Inc 1,357 62,522 0.15
Fairfax Financial Holdings Ltd 35 19,111 0.04
First Quantum Minerals Ltd 395 13,687 0.03
Fortis Inc/Canada 554 27,423 0.06
Franco-Nevada Corp 69 10,990 0.03
Gibson Energy Inc 1,719 34,419 0.08
Granite Real Estate Investment Trust 350 27,006 0.06
Great-West Lifeco Inc 643 18,964 0.04
Kinross Gold Corp 2,661 15,637 0.04
Lundin Mining Corp 1,808 18,339 0.04
Magna International Inc 446 28,658 0.07
Manulife Financial Corp 2,279 48,642 0.11
National Bank of Canada 417 31,992 0.07
Nutrien Ltd 523 54,105 0.13
Open Text Corp 1,185 50,291 0.12
Pembina Pipeline Corp 830 31,211 0.07
Power Corp of Canada 1,076 33,338 0.08
Quebecor Inc 1,340 31,969 0.07
Rogers Communications Inc 573 32,460 0.08
Royal Bank of Canada 568 62,590 0.15
Shaw Communications Inc 656 20,377 0.05
Sun Life Financial Inc 753 42,079 0.10
Suncor Energy Inc 2,257 73,542 0.17
TC Energy Corp 811 45,781 0.11
Teck Resources Ltd 565 22,834 0.05
TELUS Corp 462 12,080 0.03
Thomson Reuters Corp 271 29,448 0.07
Toromont Industries Ltd 165 15,655 0.04
Toronto-Dominion Bank/The 1,039 82,507 0.19
Vermilion Energy Inc 576 12,105 0.03
West Fraser Timber Co Ltd 138 11,364 0.03
Wheaton Precious Metals Corp 317 15,088 0.04
WSP Global Inc 123 16,338 0.04
Total Canada 1,751,807 4.10
Cayman Islands: 1.33% (30 September 2021: 0.82%)
Alibaba Group Holding Ltd 8,200 117,376 0.27
Baidu Inc 2,050 37,040 0.09
China Conch Environment Protection Holdings Ltd 3,000 3,754 0.01
China Conch Venture Holdings Ltd 3,000 8,772 0.02
China Mengniu Dairy Co Ltd 3,656 19,701 0.05
China Resources Land Ltd 6,948 32,383 0.08
CK Asset Holdings Ltd 2,044 14,016 0.03
Country Garden Holdings Co Ltd 21,888 16,853 0.04
ENN Energy Holdings Ltd 1,200 18,005 0.04
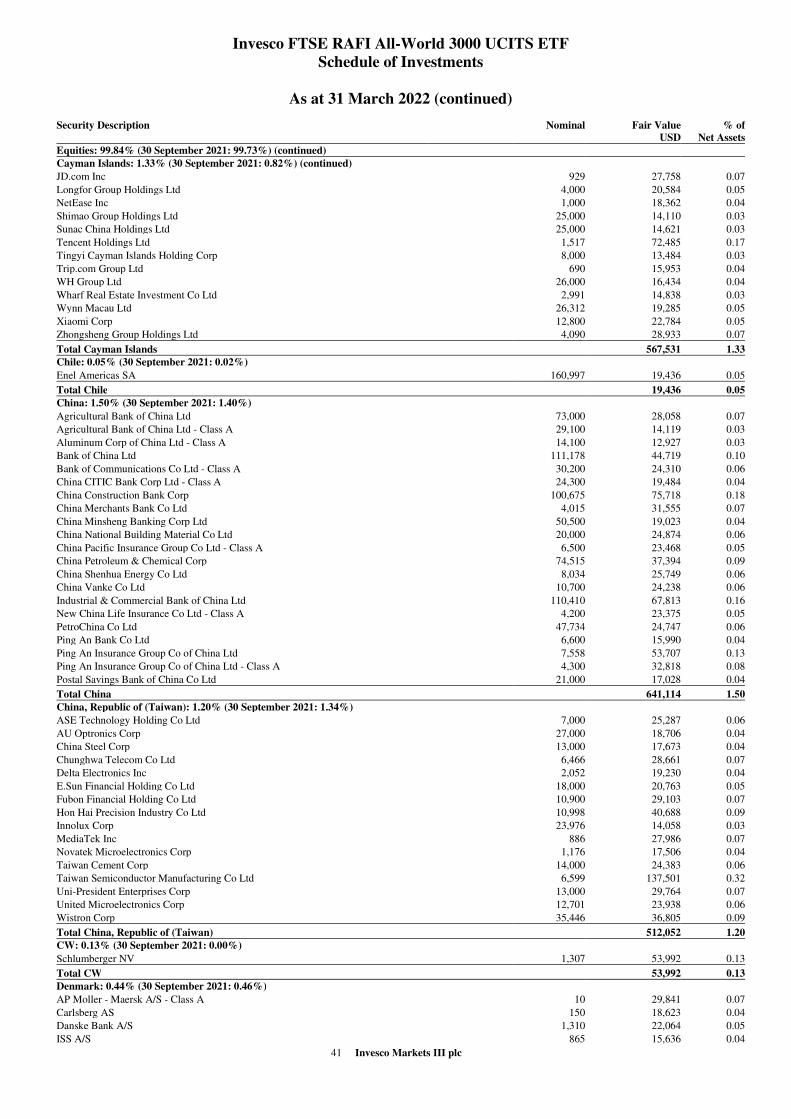
41 Invesco Markets III plc
Invesco FTSE RAFI All-World 3000 UCITS ETF
Schedule of Investments
As at 31 March 2022 (continued)
Security Description
Nominal Fair Value
USD
% of
Net Assets
Equities: 99.84% (30 September 2021: 99.73%) (continued)
Cayman Islands: 1.33% (30 September 2021: 0.82%) (continued)
JD.com Inc 929 27,758 0.07
Longfor Group Holdings Ltd 4,000 20,584 0.05
NetEase Inc 1,000 18,362 0.04
Shimao Group Holdings Ltd 25,000 14,110 0.03
Sunac China Holdings Ltd 25,000 14,621 0.03
Tencent Holdings Ltd 1,517 72,485 0.17
Tingyi Cayman Islands Holding Corp 8,000 13,484 0.03
Trip.com Group Ltd 690 15,953 0.04
WH Group Ltd 26,000 16,434 0.04
Wharf Real Estate Investment Co Ltd 2,991 14,838 0.03
Wynn Macau Ltd 26,312 19,285 0.05
Xiaomi Corp 12,800 22,784 0.05
Zhongsheng Group Holdings Ltd 4,090 28,933 0.07
Total Cayman Islands 567,531 1.33
Chile: 0.05% (30 September 2021: 0.02%)
Enel Americas SA 160,997 19,436 0.05
Total Chile 19,436 0.05
China: 1.50% (30 September 2021: 1.40%)
Agricultural Bank of China Ltd 73,000 28,058 0.07
Agricultural Bank of China Ltd - Class A 29,100 14,119 0.03
Aluminum Corp of China Ltd - Class A 14,100 12,927 0.03
Bank of China Ltd 111,178 44,719 0.10
Bank of Communications Co Ltd - Class A 30,200 24,310 0.06
China CITIC Bank Corp Ltd - Class A 24,300 19,484 0.04
China Construction Bank Corp 100,675 75,718 0.18
China Merchants Bank Co Ltd 4,015 31,555 0.07
China Minsheng Banking Corp Ltd 50,500 19,023 0.04
China National Building Material Co Ltd 20,000 24,874 0.06
China Pacific Insurance Group Co Ltd - Class A 6,500 23,468 0.05
China Petroleum & Chemical Corp 74,515 37,394 0.09
China Shenhua Energy Co Ltd 8,034 25,749 0.06
China Vanke Co Ltd 10,700 24,238 0.06
Industrial & Commercial Bank of China Ltd 110,410 67,813 0.16
New China Life Insurance Co Ltd - Class A 4,200 23,375 0.05
PetroChina Co Ltd 47,734 24,747 0.06
Ping An Bank Co Ltd 6,600 15,990 0.04
Ping An Insurance Group Co of China Ltd 7,558 53,707 0.13
Ping An Insurance Group Co of China Ltd - Class A 4,300 32,818 0.08
Postal Savings Bank of China Co Ltd 21,000 17,028 0.04
Total China 641,114 1.50
China, Republic of (Taiwan): 1.20% (30 September 2021: 1.34%)
ASE Technology Holding Co Ltd 7,000 25,287 0.06
AU Optronics Corp 27,000 18,706 0.04
China Steel Corp 13,000 17,673 0.04
Chunghwa Telecom Co Ltd 6,466 28,661 0.07
Delta Electronics Inc 2,052 19,230 0.04
E.Sun Financial Holding Co Ltd 18,000 20,763 0.05
Fubon Financial Holding Co Ltd 10,900 29,103 0.07
Hon Hai Precision Industry Co Ltd 10,998 40,688 0.09
Innolux Corp 23,976 14,058 0.03
MediaTek Inc 886 27,986 0.07
Novatek Microelectronics Corp 1,176 17,506 0.04
Taiwan Cement Corp 14,000 24,383 0.06
Taiwan Semiconductor Manufacturing Co Ltd 6,599 137,501 0.32
Uni-President Enterprises Corp 13,000 29,764 0.07
United Microelectronics Corp 12,701 23,938 0.06
Wistron Corp 35,446 36,805 0.09
Total China, Republic of (Taiwan) 512,052 1.20
CW: 0.13% (30 September 2021: 0.00%)
Schlumberger NV 1,307 53,992 0.13
Total CW 53,992 0.13
Denmark: 0.44% (30 September 2021: 0.46%)
AP Moller - Maersk A/S - Class A 10 29,841 0.07
Carlsberg AS 150 18,623 0.04
Danske Bank A/S 1,310 22,064 0.05
ISS A/S 865 15,636 0.04

42 Invesco Markets III plc
Invesco FTSE RAFI All-World 3000 UCITS ETF
Schedule of Investments
As at 31 March 2022 (continued)
Security Description
Nominal Fair Value
USD
% of
Net Assets
Equities: 99.84% (30 September 2021: 99.73%) (continued)
Denmark: 0.44% (30 September 2021: 0.46%) (continued)
Novo Nordisk A/S 558 62,508 0.15
Orsted AS 145 18,419 0.04
Vestas Wind Systems A/S 719 21,483 0.05
Total Denmark 188,574 0.44
Euro Countries: 13.85% (30 September 2021: 15.41%)
ABN AMRO Bank NV 1,222 15,829 0.04
Accenture Plc 215 72,504 0.17
ACS Actividades de Construccion y Servicios SA 667 18,182 0.04
adidas AG 103 24,284 0.06
Adient Plc 284 11,579 0.03
Aegon NV 5,705 30,481 0.07
AerCap Holdings NV 246 12,369 0.03
Ageas SA/NV 504 25,706 0.06
Air France-KLM 7,174 32,679 0.08
Air Liquide SA 350 61,888 0.14
Airbus SE 234 28,733 0.07
Akzo Nobel NV 319 27,763 0.06
Allianz SE 484 116,617 0.27
Alstom SA 662 15,667 0.04
Anheuser-Busch InBev SA/NV 1,219 73,594 0.17
APERAM SA 402 17,985 0.04
ArcelorMittal SA 1,467 47,825 0.11
Arkema SA 140 16,940 0.04
ASML Holding NV 63 42,759 0.10
ASR Nederland NV 811 38,107 0.09
Assicurazioni Generali SpA 2,371 54,793 0.13
Atos SE 531 14,634 0.03
AXA SA 2,532 74,839 0.18
Azimut Holding SpA 1,031 24,239 0.06
Banco Bilbao Vizcaya Argentaria SA 11,403 66,102 0.16
Banco BPM SpA 6,530 19,544 0.05
Banco de Sabadell SA 24,783 20,560 0.05
Banco Santander SA 28,847 99,499 0.23
Bank of Ireland Group Plc 3,325 21,487 0.05
BASF SE 1,196 68,878 0.16
Bayer AG 1,486 102,676 0.24
Bayerische Motoren Werke AG 687 60,081 0.14
BNP Paribas SA 1,804 104,235 0.24
Bouygues SA 463 16,294 0.04
CaixaBank SA 9,260 31,703 0.08
Capgemini SE 164 36,951 0.09
Cargotec Oyj 513 19,715 0.05
Carrefour SA 1,716 37,508 0.09
Cie de Saint-Gobain 727 43,899 0.10
Cie Generale des Etablissements Michelin SCA 304 41,587 0.10
CNH Industrial NV 1,299 20,806 0.05
Commerzbank AG 3,595 27,708 0.06
Continental AG 286 20,811 0.05
Covestro AG 369 18,820 0.04
Credit Agricole SA 1,865 22,589 0.05
CRH Plc 867 35,068 0.08
Daimler Truck Holding AG 673 18,892 0.04
Danone SA 566 31,507 0.07
Dassault Systemes SE 304 15,125 0.04
DCC Plc 290 22,627 0.05
Deutsche Bank AG 4,706 60,268 0.14
Deutsche Boerse AG 157 28,474 0.07
Deutsche Lufthansa AG 2,380 19,485 0.05
Deutsche Post AG 1,301 63,041 0.15
Deutsche Telekom AG 4,414 83,157 0.19
E.ON SE 3,541 41,534 0.10
Eaton Corp Plc 345 52,357 0.12
EDP - Energias de Portugal SA 5,848 29,053 0.07
Eiffage SA 117 12,138 0.03
Electricite de France SA 2,136 20,282 0.05
Endesa SA 799 17,580 0.04
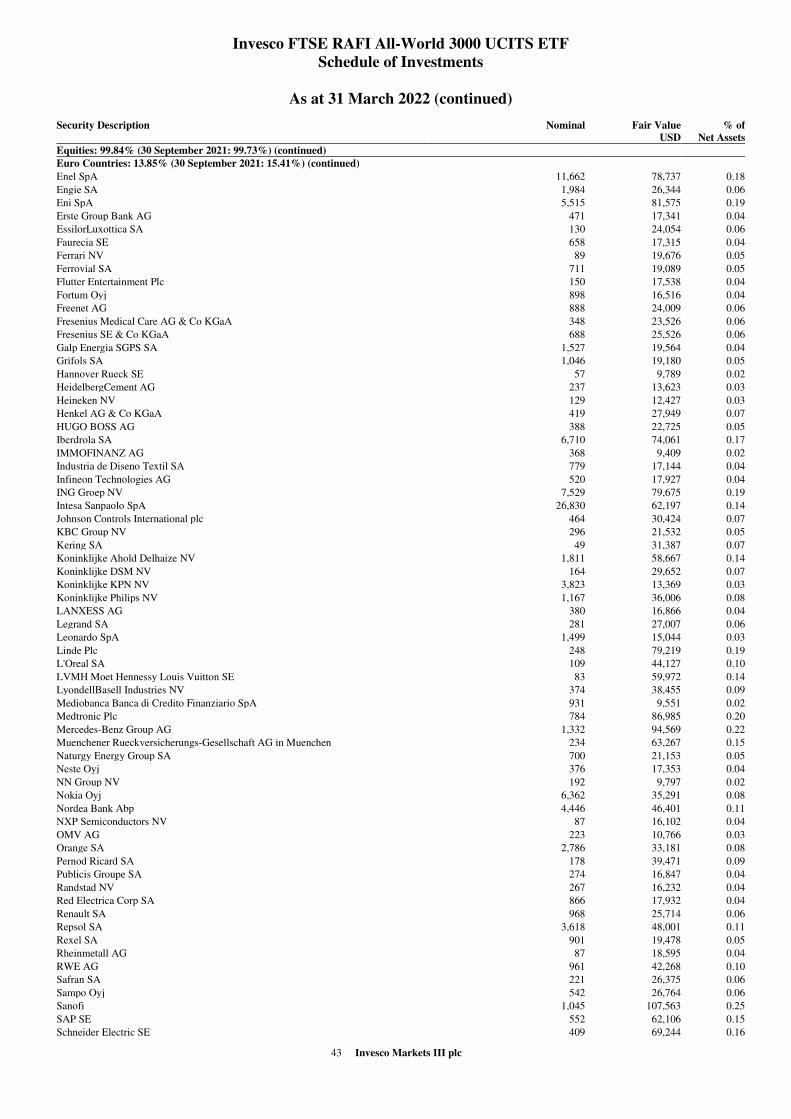
43 Invesco Markets III plc
Invesco FTSE RAFI All-World 3000 UCITS ETF
Schedule of Investments
As at 31 March 2022 (continued)
Security Description
Nominal Fair Value
USD
% of
Net Assets
Equities: 99.84% (30 September 2021: 99.73%) (continued)
Euro Countries: 13.85% (30 September 2021: 15.41%) (continued)
Enel SpA 11,662 78,737 0.18
Engie SA 1,984 26,344 0.06
Eni SpA 5,515 81,575 0.19
Erste Group Bank AG 471 17,341 0.04
EssilorLuxottica SA 130 24,054 0.06
Faurecia SE 658 17,315 0.04
Ferrari NV 89 19,676 0.05
Ferrovial SA 711 19,089 0.05
Flutter Entertainment Plc 150 17,538 0.04
Fortum Oyj 898 16,516 0.04
Freenet AG 888 24,009 0.06
Fresenius Medical Care AG & Co KGaA 348 23,526 0.06
Fresenius SE & Co KGaA 688 25,526 0.06
Galp Energia SGPS SA 1,527 19,564 0.04
Grifols SA 1,046 19,180 0.05
Hannover Rueck SE 57 9,789 0.02
HeidelbergCement AG 237 13,623 0.03
Heineken NV 129 12,427 0.03
Henkel AG & Co KGaA 419 27,949 0.07
HUGO BOSS AG 388 22,725 0.05
Iberdrola SA 6,710 74,061 0.17
IMMOFINANZ AG 368 9,409 0.02
Industria de Diseno Textil SA 779 17,144 0.04
Infineon Technologies AG 520 17,927 0.04
ING Groep NV 7,529 79,675 0.19
Intesa Sanpaolo SpA 26,830 62,197 0.14
Johnson Controls International plc 464 30,424 0.07
KBC Group NV 296 21,532 0.05
Kering SA 49 31,387 0.07
Koninklijke Ahold Delhaize NV 1,811 58,667 0.14
Koninklijke DSM NV 164 29,652 0.07
Koninklijke KPN NV 3,823 13,369 0.03
Koninklijke Philips NV 1,167 36,006 0.08
LANXESS AG 380 16,866 0.04
Legrand SA 281 27,007 0.06
Leonardo SpA 1,499 15,044 0.03
Linde Plc 248 79,219 0.19
L'Oreal SA 109 44,127 0.10
LVMH Moet Hennessy Louis Vuitton SE 83 59,972 0.14
LyondellBasell Industries NV 374 38,455 0.09
Mediobanca Banca di Credito Finanziario SpA 931 9,551 0.02
Medtronic Plc 784 86,985 0.20
Mercedes-Benz Group AG 1,332 94,569 0.22
Muenchener Rueckversicherungs-Gesellschaft AG in Muenchen 234 63,267 0.15
Naturgy Energy Group SA 700 21,153 0.05
Neste Oyj 376 17,353 0.04
NN Group NV 192 9,797 0.02
Nokia Oyj 6,362 35,291 0.08
Nordea Bank Abp 4,446 46,401 0.11
NXP Semiconductors NV 87 16,102 0.04
OMV AG 223 10,766 0.03
Orange SA 2,786 33,181 0.08
Pernod Ricard SA 178 39,471 0.09
Publicis Groupe SA 274 16,847 0.04
Randstad NV 267 16,232 0.04
Red Electrica Corp SA 866 17,932 0.04
Renault SA 968 25,714 0.06
Repsol SA 3,618 48,001 0.11
Rexel SA 901 19,478 0.05
Rheinmetall AG 87 18,595 0.04
RWE AG 961 42,268 0.10
Safran SA 221 26,375 0.06
Sampo Oyj 542 26,764 0.06
Sanofi 1,045 107,563 0.25
SAP SE 552 62,106 0.15
Schneider Electric SE 409 69,244 0.16
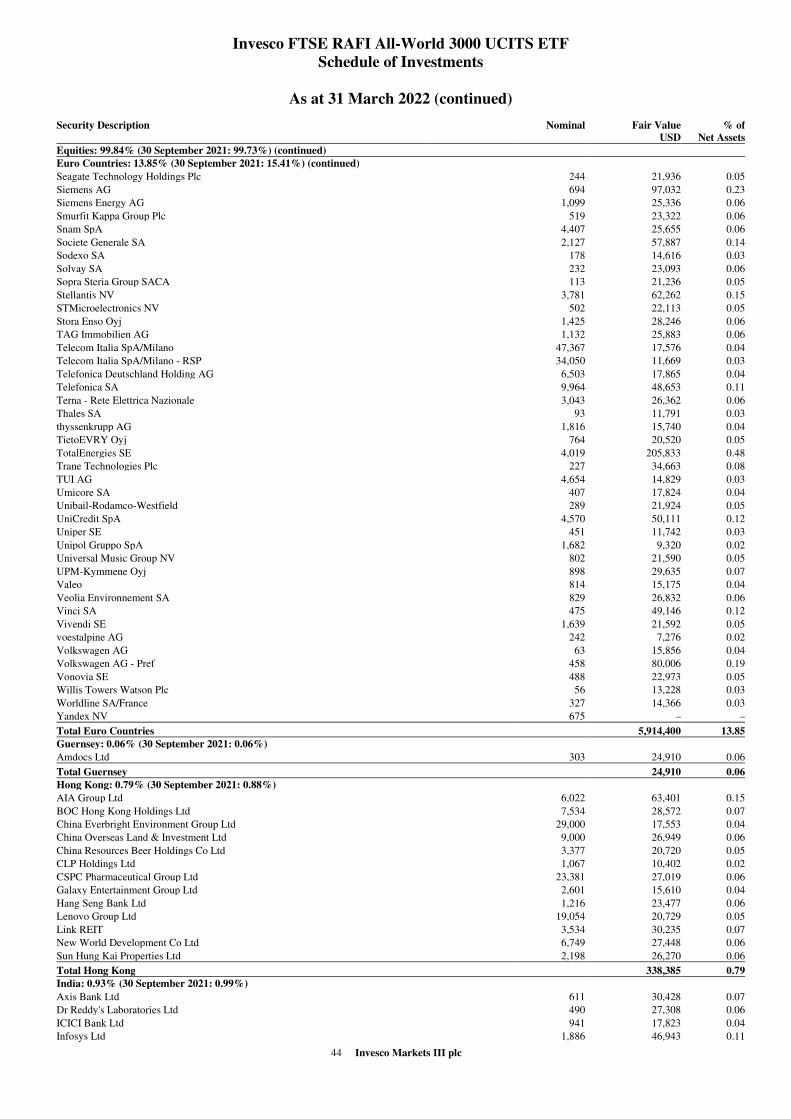
44 Invesco Markets III plc
Invesco FTSE RAFI All-World 3000 UCITS ETF
Schedule of Investments
As at 31 March 2022 (continued)
Security Description
Nominal Fair Value
USD
% of
Net Assets
Equities: 99.84% (30 September 2021: 99.73%) (continued)
Euro Countries: 13.85% (30 September 2021: 15.41%) (continued)
Seagate Technology Holdings Plc 244 21,936 0.05
Siemens AG 694 97,032 0.23
Siemens Energy AG 1,099 25,336 0.06
Smurfit Kappa Group Plc 519 23,322 0.06
Snam SpA 4,407 25,655 0.06
Societe Generale SA 2,127 57,887 0.14
Sodexo SA 178 14,616 0.03
Solvay SA 232 23,093 0.06
Sopra Steria Group SACA 113 21,236 0.05
Stellantis NV 3,781 62,262 0.15
STMicroelectronics NV 502 22,113 0.05
Stora Enso Oyj 1,425 28,246 0.06
TAG Immobilien AG 1,132 25,883 0.06
Telecom Italia SpA/Milano 47,367 17,576 0.04
Telecom Italia SpA/Milano - RSP 34,050 11,669 0.03
Telefonica Deutschland Holding AG 6,503 17,865 0.04
Telefonica SA 9,964 48,653 0.11
Terna - Rete Elettrica Nazionale 3,043 26,362 0.06
Thales SA 93 11,791 0.03
thyssenkrupp AG 1,816 15,740 0.04
TietoEVRY Oyj 764 20,520 0.05
TotalEnergies SE 4,019 205,833 0.48
Trane Technologies Plc 227 34,663 0.08
TUI AG 4,654 14,829 0.03
Umicore SA 407 17,824 0.04
Unibail-Rodamco-Westfield 289 21,924 0.05
UniCredit SpA 4,570 50,111 0.12
Uniper SE 451 11,742 0.03
Unipol Gruppo SpA 1,682 9,320 0.02
Universal Music Group NV 802 21,590 0.05
UPM-Kymmene Oyj 898 29,635 0.07
Valeo 814 15,175 0.04
Veolia Environnement SA 829 26,832 0.06
Vinci SA 475 49,146 0.12
Vivendi SE 1,639 21,592 0.05
voestalpine AG 242 7,276 0.02
Volkswagen AG 63 15,856 0.04
Volkswagen AG - Pref 458 80,006 0.19
Vonovia SE 488 22,973 0.05
Willis Towers Watson Plc 56 13,228 0.03
Worldline SA/France 327 14,366 0.03
Yandex NV 675 – –
Total Euro Countries 5,914,400 13.85
Guernsey: 0.06% (30 September 2021: 0.06%)
Amdocs Ltd 303 24,910 0.06
Total Guernsey 24,910 0.06
Hong Kong: 0.79% (30 September 2021: 0.88%)
AIA Group Ltd 6,022 63,401 0.15
BOC Hong Kong Holdings Ltd 7,534 28,572 0.07
China Everbright Environment Group Ltd 29,000 17,553 0.04
China Overseas Land & Investment Ltd 9,000 26,949 0.06
China Resources Beer Holdings Co Ltd 3,377 20,720 0.05
CLP Holdings Ltd 1,067 10,402 0.02
CSPC Pharmaceutical Group Ltd 23,381 27,019 0.06
Galaxy Entertainment Group Ltd 2,601 15,610 0.04
Hang Seng Bank Ltd 1,216 23,477 0.06
Lenovo Group Ltd 19,054 20,729 0.05
Link REIT 3,534 30,235 0.07
New World Development Co Ltd 6,749 27,448 0.06
Sun Hung Kai Properties Ltd 2,198 26,270 0.06
Total Hong Kong 338,385 0.79
India: 0.93% (30 September 2021: 0.99%)
Axis Bank Ltd 611 30,428 0.07
Dr Reddy's Laboratories Ltd 490 27,308 0.06
ICICI Bank Ltd 941 17,823 0.04
Infosys Ltd 1,886 46,943 0.11
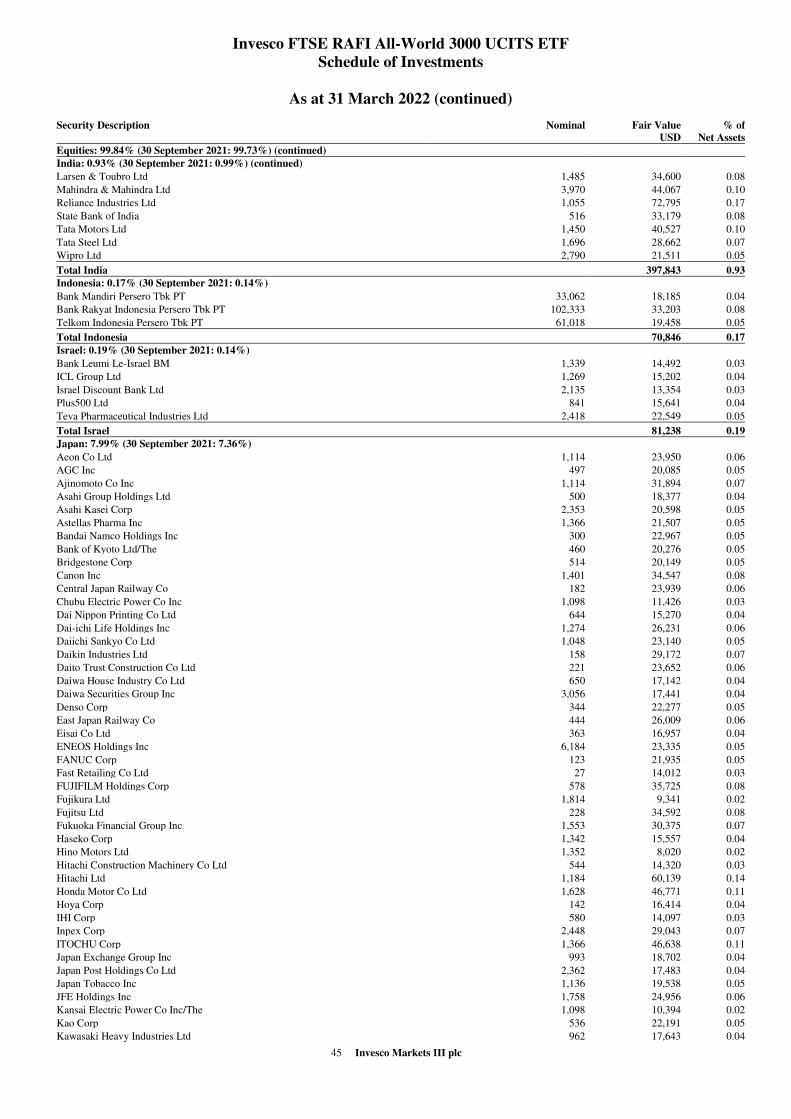
45 Invesco Markets III plc
Invesco FTSE RAFI All-World 3000 UCITS ETF
Schedule of Investments
As at 31 March 2022 (continued)
Security Description
Nominal Fair Value
USD
% of
Net Assets
Equities: 99.84% (30 September 2021: 99.73%) (continued)
India: 0.93% (30 September 2021: 0.99%) (continued)
Larsen & Toubro Ltd 1,485 34,600 0.08
Mahindra & Mahindra Ltd 3,970 44,067 0.10
Reliance Industries Ltd 1,055 72,795 0.17
State Bank of India 516 33,179 0.08
Tata Motors Ltd 1,450 40,527 0.10
Tata Steel Ltd 1,696 28,662 0.07
Wipro Ltd 2,790 21,511 0.05
Total India 397,843 0.93
Indonesia: 0.17% (30 September 2021: 0.14%)
Bank Mandiri Persero Tbk PT 33,062 18,185 0.04
Bank Rakyat Indonesia Persero Tbk PT 102,333 33,203 0.08
Telkom Indonesia Persero Tbk PT 61,018 19,458 0.05
Total Indonesia 70,846 0.17
Israel: 0.19% (30 September 2021: 0.14%)
Bank Leumi Le-Israel BM 1,339 14,492 0.03
ICL Group Ltd 1,269 15,202 0.04
Israel Discount Bank Ltd 2,135 13,354 0.03
Plus500 Ltd 841 15,641 0.04
Teva Pharmaceutical Industries Ltd 2,418 22,549 0.05
Total Israel 81,238 0.19
Japan: 7.99% (30 September 2021: 7.36%)
Aeon Co Ltd 1,114 23,950 0.06
AGC Inc 497 20,085 0.05
Ajinomoto Co Inc 1,114 31,894 0.07
Asahi Group Holdings Ltd 500 18,377 0.04
Asahi Kasei Corp 2,353 20,598 0.05
Astellas Pharma Inc 1,366 21,507 0.05
Bandai Namco Holdings Inc 300 22,967 0.05
Bank of Kyoto Ltd/The 460 20,276 0.05
Bridgestone Corp 514 20,149 0.05
Canon Inc 1,401 34,547 0.08
Central Japan Railway Co 182 23,939 0.06
Chubu Electric Power Co Inc 1,098 11,426 0.03
Dai Nippon Printing Co Ltd 644 15,270 0.04
Dai-ichi Life Holdings Inc 1,274 26,231 0.06
Daiichi Sankyo Co Ltd 1,048 23,140 0.05
Daikin Industries Ltd 158 29,172 0.07
Daito Trust Construction Co Ltd 221 23,652 0.06
Daiwa House Industry Co Ltd 650 17,142 0.04
Daiwa Securities Group Inc 3,056 17,441 0.04
Denso Corp 344 22,277 0.05
East Japan Railway Co 444 26,009 0.06
Eisai Co Ltd 363 16,957 0.04
ENEOS Holdings Inc 6,184 23,335 0.05
FANUC Corp 123 21,935 0.05
Fast Retailing Co Ltd 27 14,012 0.03
FUJIFILM Holdings Corp 578 35,725 0.08
Fujikura Ltd 1,814 9,341 0.02
Fujitsu Ltd 228 34,592 0.08
Fukuoka Financial Group Inc 1,553 30,375 0.07
Haseko Corp 1,342 15,557 0.04
Hino Motors Ltd 1,352 8,020 0.02
Hitachi Construction Machinery Co Ltd 544 14,320 0.03
Hitachi Ltd 1,184 60,139 0.14
Honda Motor Co Ltd 1,628 46,771 0.11
Hoya Corp 142 16,414 0.04
IHI Corp 580 14,097 0.03
Inpex Corp 2,448 29,043 0.07
ITOCHU Corp 1,366 46,638 0.11
Japan Exchange Group Inc 993 18,702 0.04
Japan Post Holdings Co Ltd 2,362 17,483 0.04
Japan Tobacco Inc 1,136 19,538 0.05
JFE Holdings Inc 1,758 24,956 0.06
Kansai Electric Power Co Inc/The 1,098 10,394 0.02
Kao Corp 536 22,191 0.05
Kawasaki Heavy Industries Ltd 962 17,643 0.04

46 Invesco Markets III plc
Invesco FTSE RAFI All-World 3000 UCITS ETF
Schedule of Investments
As at 31 March 2022 (continued)
Security Description
Nominal Fair Value
USD
% of
Net Assets
Equities: 99.84% (30 September 2021: 99.73%) (continued)
Japan: 7.99% (30 September 2021: 7.36%) (continued)
Kawasaki Kisen Kaisha Ltd 100 6,608 0.02
KDDI Corp 1,524 50,287 0.12
Keihan Holdings Co Ltd 898 22,270 0.05
Keyence Corp 25 11,792 0.03
Kirin Holdings Co Ltd 1,140 17,179 0.04
Kobe Steel Ltd 1,914 9,320 0.02
Komatsu Ltd 1,106 26,817 0.06
Kubota Corp 1,244 23,604 0.06
Kyocera Corp 252 14,289 0.03
Kyushu Electric Power Co Inc 2,762 18,592 0.04
Lawson Inc 433 16,678 0.04
Marubeni Corp 2,124 24,954 0.06
Mazda Motor Corp 1,940 14,529 0.03
Mebuki Financial Group Inc 13,100 27,630 0.06
MEIJI Holdings Co Ltd 453 24,670 0.06
Mitsubishi Chemical Holdings Corp 3,836 25,824 0.06
Mitsubishi Corp 1,100 41,698 0.10
Mitsubishi Electric Corp 2,132 24,767 0.06
Mitsubishi Heavy Industries Ltd 957 31,696 0.07
Mitsubishi UFJ Financial Group Inc 13,826 86,607 0.20
Mitsui & Co Ltd 1,313 36,001 0.08
Mitsui Fudosan Co Ltd 987 21,305 0.05
Mitsui OSK Lines Ltd 378 10,651 0.03
Mizuho Financial Group Inc 1,100 14,201 0.03
MS&AD Insurance Group Holdings Inc 1,106 36,249 0.09
Murata Manufacturing Co Ltd 309 20,665 0.05
NEC Corp 494 20,961 0.05
Nidec Corp 145 11,645 0.03
Nintendo Co Ltd 53 26,929 0.06
Nippon Steel Corp 1,814 32,447 0.08
Nippon Telegraph & Telephone Corp 1,344 39,254 0.09
Nippon Yusen KK 135 11,968 0.03
Nissan Motor Co Ltd 5,454 24,615 0.06
Nissin Foods Holdings Co Ltd 239 16,875 0.04
Nitto Denko Corp 318 23,108 0.05
Nomura Holdings Inc 4,594 19,500 0.05
NTN Corp 10,078 17,769 0.04
Omron Corp 315 21,318 0.05
Ono Pharmaceutical Co Ltd 716 18,087 0.04
Oriental Land Co Ltd/Japan 62 12,009 0.03
ORIX Corp 1,578 31,820 0.07
Otsuka Holdings Co Ltd 527 18,375 0.04
Panasonic Holdings Corp 2,104 20,602 0.05
Recruit Holdings Co Ltd 543 24,221 0.06
Resona Holdings Inc 3,536 15,269 0.04
Ricoh Co Ltd 1,598 13,982 0.03
SBI Holdings Inc/Japan 909 23,217 0.05
Sekisui Chemical Co Ltd 1,116 16,173 0.04
Sekisui House Ltd 1,098 21,449 0.05
Seven & i Holdings Co Ltd 860 41,188 0.10
Seven Bank Ltd 8,600 16,934 0.04
Shin-Etsu Chemical Co Ltd 221 34,213 0.08
Shinsei Bank Ltd 798 14,708 0.03
Shionogi & Co Ltd 186 11,539 0.03
Showa Denko KK 800 16,017 0.04
SoftBank Corp 3,500 41,178 0.10
SoftBank Group Corp 2,535 116,104 0.27
Sojitz Corp 670 11,134 0.03
Sompo Holdings Inc 656 29,083 0.07
Sony Group Corp 758 79,500 0.19
Subaru Corp 808 12,968 0.03
Sumitomo Corp 1,914 33,415 0.08
Sumitomo Electric Industries Ltd 1,116 13,443 0.03
Sumitomo Metal Mining Co Ltd 222 11,272 0.03
Sumitomo Mitsui Financial Group Inc 1,851 59,583 0.14
Sumitomo Mitsui Trust Holdings Inc 932 30,722 0.07

47 Invesco Markets III plc
Invesco FTSE RAFI All-World 3000 UCITS ETF
Schedule of Investments
As at 31 March 2022 (continued)
Security Description
Nominal Fair Value
USD
% of
Net Assets
Equities: 99.84% (30 September 2021: 99.73%) (continued)
Japan: 7.99% (30 September 2021: 7.36%) (continued)
Suzuki Motor Corp 609 21,139 0.05
T&D Holdings Inc 1,452 19,990 0.05
Taisei Corp 436 12,698 0.03
Takeda Pharmaceutical Co Ltd 1,964 56,602 0.13
TDK Corp 562 20,651 0.05
Terumo Corp 700 21,477 0.05
TIS Inc 959 22,732 0.05
Toho Gas Co Ltd 900 20,206 0.05
Tokio Marine Holdings Inc 680 39,934 0.09
Tokyo Electric Power Co Holdings Inc 3,276 10,877 0.03
Tokyo Electron Ltd 47 24,492 0.06
Tokyo Gas Co Ltd 972 17,874 0.04
TOPPAN INC 1,121 20,005 0.05
Toshiba Corp 610 23,370 0.05
Tosoh Corp 1,088 16,261 0.04
Toyo Suisan Kaisha Ltd 690 24,843 0.06
Toyota Industries Corp 179 12,491 0.03
Toyota Motor Corp 9,355 171,300 0.40
Toyota Tsusho Corp 648 27,015 0.06
West Japan Railway Co 497 20,846 0.05
Yamaha Motor Co Ltd 978 22,207 0.05
Yokohama Rubber Co Ltd/The 1,318 18,373 0.04
Z Holdings Corp 3,100 13,700 0.03
Total Japan 3,410,787 7.99
Jersey: 0.49% (30 September 2021: 0.41%)
Amcor Plc 1,255 14,429 0.03
Aptiv Plc 172 20,590 0.05
Ferguson Plc 257 35,124 0.08
Glencore Plc 16,817 110,710 0.26
WPP Plc 2,204 29,106 0.07
Total Jersey 209,959 0.49
Korea, Republic of (South Korea): 1.85% (30 September 2021: 2.23%)
CJ CheilJedang Corp - Pref 236 32,712 0.08
Coway Co Ltd 329 18,594 0.04
Doosan Heavy Industries & Construction Co Ltd 611 10,309 0.02
Hana Financial Group Inc 554 22,214 0.05
Hanwha Solutions Corp 447 13,258 0.03
Hyundai Mobis Co Ltd 104 18,448 0.04
Hyundai Motor Co 201 29,933 0.07
Hyundai Motor Co - Pref 129 9,217 0.02
KB Financial Group Inc 627 31,711 0.07
Kia Corp 460 28,085 0.07
Korea Electric Power Corp 922 17,230 0.04
LG Chem Ltd 50 21,946 0.05
LG Display Co Ltd 1,268 21,603 0.05
LG Electronics Inc 302 30,024 0.07
POSCO Holdings Inc 153 36,986 0.09
Samsung Electro-Mechanics Co Ltd 149 20,284 0.05
Samsung Electronics Co Ltd 3,453 198,283 0.46
Samsung Electronics Co Ltd - Pref 798 41,478 0.10
Samsung Engineering Co Ltd 706 15,261 0.04
Samsung Fire & Marine Insurance Co Ltd 83 14,997 0.03
Samsung SDI Co Ltd 33 16,227 0.04
Samsung SDS Co Ltd 171 19,540 0.05
Shinhan Financial Group Co Ltd 582 19,927 0.05
SK Hynix Inc 474 46,147 0.11
SK Inc 119 23,760 0.06
SK Innovation Co Ltd 127 22,528 0.05
SK Telecom Co Ltd 219 10,281 0.02
Total Korea, Republic of (South Korea) 790,983 1.85
Liberia: 0.04% (30 September 2021: 0.02%)
Royal Caribbean Cruises Ltd 203 17,007 0.04
Total Liberia 17,007 0.04
Malaysia: 0.07% (30 September 2021: 0.07%)
Malayan Banking Bhd 5,500 11,694 0.03
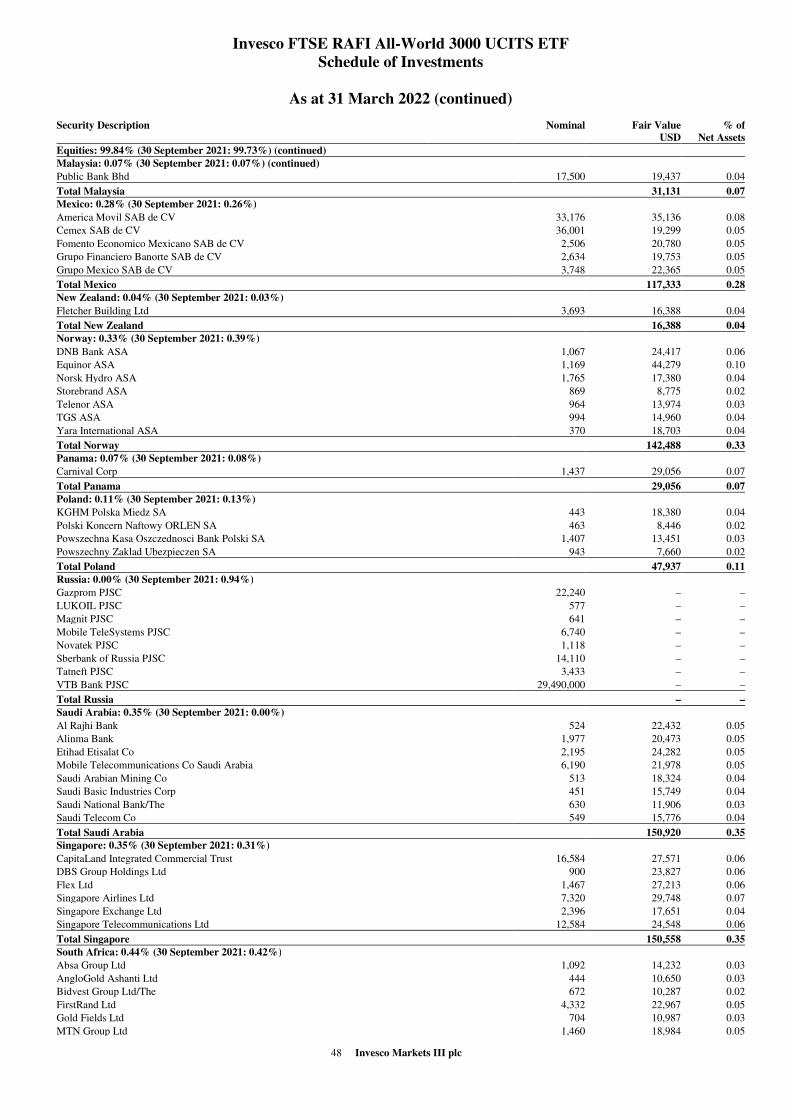
48 Invesco Markets III plc
Invesco FTSE RAFI All-World 3000 UCITS ETF
Schedule of Investments
As at 31 March 2022 (continued)
Security Description
Nominal Fair Value
USD
% of
Net Assets
Equities: 99.84% (30 September 2021: 99.73%) (continued)
Malaysia: 0.07% (30 September 2021: 0.07%) (continued)
Public Bank Bhd 17,500 19,437 0.04
Total Malaysia 31,131 0.07
Mexico: 0.28% (30 September 2021: 0.26%)
America Movil SAB de CV 33,176 35,136 0.08
Cemex SAB de CV 36,001 19,299 0.05
Fomento Economico Mexicano SAB de CV 2,506 20,780 0.05
Grupo Financiero Banorte SAB de CV 2,634 19,753 0.05
Grupo Mexico SAB de CV 3,748 22,365 0.05
Total Mexico 117,333 0.28
New Zealand: 0.04% (30 September 2021: 0.03%)
Fletcher Building Ltd 3,693 16,388 0.04
Total New Zealand 16,388 0.04
Norway: 0.33% (30 September 2021: 0.39%)
DNB Bank ASA 1,067 24,417 0.06
Equinor ASA 1,169 44,279 0.10
Norsk Hydro ASA 1,765 17,380 0.04
Storebrand ASA 869 8,775 0.02
Telenor ASA 964 13,974 0.03
TGS ASA 994 14,960 0.04
Yara International ASA 370 18,703 0.04
Total Norway 142,488 0.33
Panama: 0.07% (30 September 2021: 0.08%)
Carnival Corp 1,437 29,056 0.07
Total Panama 29,056 0.07
Poland: 0.11% (30 September 2021: 0.13%)
KGHM Polska Miedz SA 443 18,380 0.04
Polski Koncern Naftowy ORLEN SA 463 8,446 0.02
Powszechna Kasa Oszczednosci Bank Polski SA 1,407 13,451 0.03
Powszechny Zaklad Ubezpieczen SA 943 7,660 0.02
Total Poland 47,937 0.11
Russia: 0.00% (30 September 2021: 0.94%)
Gazprom PJSC 22,240 – –
LUKOIL PJSC 577 – –
Magnit PJSC 641 – –
Mobile TeleSystems PJSC 6,740 – –
Novatek PJSC 1,118 – –
Sberbank of Russia PJSC 14,110 – –
Tatneft PJSC 3,433 – –
VTB Bank PJSC 29,490,000 – –
Total Russia – –
Saudi Arabia: 0.35% (30 September 2021: 0.00%)
Al Rajhi Bank 524 22,432 0.05
Alinma Bank 1,977 20,473 0.05
Etihad Etisalat Co 2,195 24,282 0.05
Mobile Telecommunications Co Saudi Arabia 6,190 21,978 0.05
Saudi Arabian Mining Co 513 18,324 0.04
Saudi Basic Industries Corp 451 15,749 0.04
Saudi National Bank/The 630 11,906 0.03
Saudi Telecom Co 549 15,776 0.04
Total Saudi Arabia 150,920 0.35
Singapore: 0.35% (30 September 2021: 0.31%)
CapitaLand Integrated Commercial Trust 16,584 27,571 0.06
DBS Group Holdings Ltd 900 23,827 0.06
Flex Ltd 1,467 27,213 0.06
Singapore Airlines Ltd 7,320 29,748 0.07
Singapore Exchange Ltd 2,396 17,651 0.04
Singapore Telecommunications Ltd 12,584 24,548 0.06
Total Singapore 150,558 0.35
South Africa: 0.44% (30 September 2021: 0.42%)
Absa Group Ltd 1,092 14,232 0.03
AngloGold Ashanti Ltd 444 10,650 0.03
Bidvest Group Ltd/The 672 10,287 0.02
FirstRand Ltd 4,332 22,967 0.05
Gold Fields Ltd 704 10,987 0.03
MTN Group Ltd 1,460 18,984 0.05

49 Invesco Markets III plc
Invesco FTSE RAFI All-World 3000 UCITS ETF
Schedule of Investments
As at 31 March 2022 (continued)
Security Description
Nominal Fair Value
USD
% of
Net Assets
Equities: 99.84% (30 September 2021: 99.73%) (continued)
South Africa: 0.44% (30 September 2021: 0.42%) (continued)
Naspers Ltd 102 11,616 0.03
Sanlam Ltd 3,729 18,425 0.04
Sasol Ltd 695 16,885 0.04
Sibanye Stillwater Ltd 2,547 10,423 0.02
Standard Bank Group Ltd 1,671 20,828 0.05
Woolworths Holdings Ltd/South Africa 5,420 21,431 0.05
Total South Africa 187,715 0.44
Sweden: 0.98% (30 September 2021: 0.84%)
Assa Abloy AB 410 11,214 0.03
Atlas Copco AB - Class A 496 26,169 0.06
Boliden AB 505 25,907 0.06
Electrolux AB 741 11,378 0.03
Essity AB 884 21,077 0.05
H & M Hennes & Mauritz AB 1,420 19,226 0.04
Industrivarden AB - A Shares 639 18,431 0.04
Investor AB 920 20,351 0.05
Sandvik AB 946 20,403 0.05
Securitas AB 1,606 18,344 0.04
Skandinaviska Enskilda Banken AB - Class A 1,689 18,568 0.04
Skanska AB 898 20,370 0.05
SKF AB 902 14,901 0.03
SSAB AB - Class A 1,744 12,310 0.03
Svenska Cellulosa AB SCA - Class B 835 16,437 0.04
Svenska Handelsbanken AB - Class A 1,830 17,064 0.04
Swedbank AB 1,051 15,901 0.04
Swedish Match AB 2,081 15,827 0.04
Tele2 AB 922 14,078 0.03
Telefonaktiebolaget LM Ericsson - Class B 3,147 29,142 0.07
Telia Co AB 3,646 14,765 0.03
Volvo AB - Class B 1,976 37,445 0.09
Total Sweden 419,308 0.98
Switzerland: 2.75% (30 September 2021: 2.56%)
ABB Ltd 1,860 60,979 0.14
Adecco Group AG 458 20,908 0.05
Alcon Inc 330 26,429 0.06
Chubb Ltd 308 65,881 0.15
Cie Financiere Richemont SA 277 35,519 0.08
Clariant AG 1,051 18,376 0.04
Credit Suisse Group AG 5,908 47,123 0.11
Georg Fischer AG 29 34,917 0.08
Givaudan SA 5 20,793 0.05
Holcim Ltd 706 34,746 0.08
Kuehne + Nagel International AG 59 16,868 0.04
Logitech International SA 224 16,844 0.04
Lonza Group AG 29 21,183 0.05
Nestle SA 1,114 145,507 0.34
Novartis AG 1,444 127,492 0.30
Roche Holding AG 357 142,160 0.33
SGS SA 19 53,185 0.13
SIG Combibloc Group AG 1,319 33,539 0.08
Swiss Life Holding AG 69 44,553 0.11
Swiss Re AG 364 34,855 0.08
Swisscom AG 35 21,108 0.05
TE Connectivity Ltd 315 41,259 0.10
Transocean Ltd 3,057 13,970 0.03
UBS Group AG 3,803 74,985 0.18
Zurich Insurance Group AG 40 19,855 0.05
Total Switzerland 1,173,034 2.75
Thailand: 0.30% (30 September 2021: 0.40%)
Kasikornbank PCL 3,300 16,029 0.04
Krung Thai Bank PCL 48,000 19,922 0.05
PTT Exploration & Production PCL 5,500 23,819 0.05
PTT PCL 33,700 39,021 0.09
Siam Commercial Bank PCL/The 9,100 31,200 0.07
Total Thailand 129,991 0.30
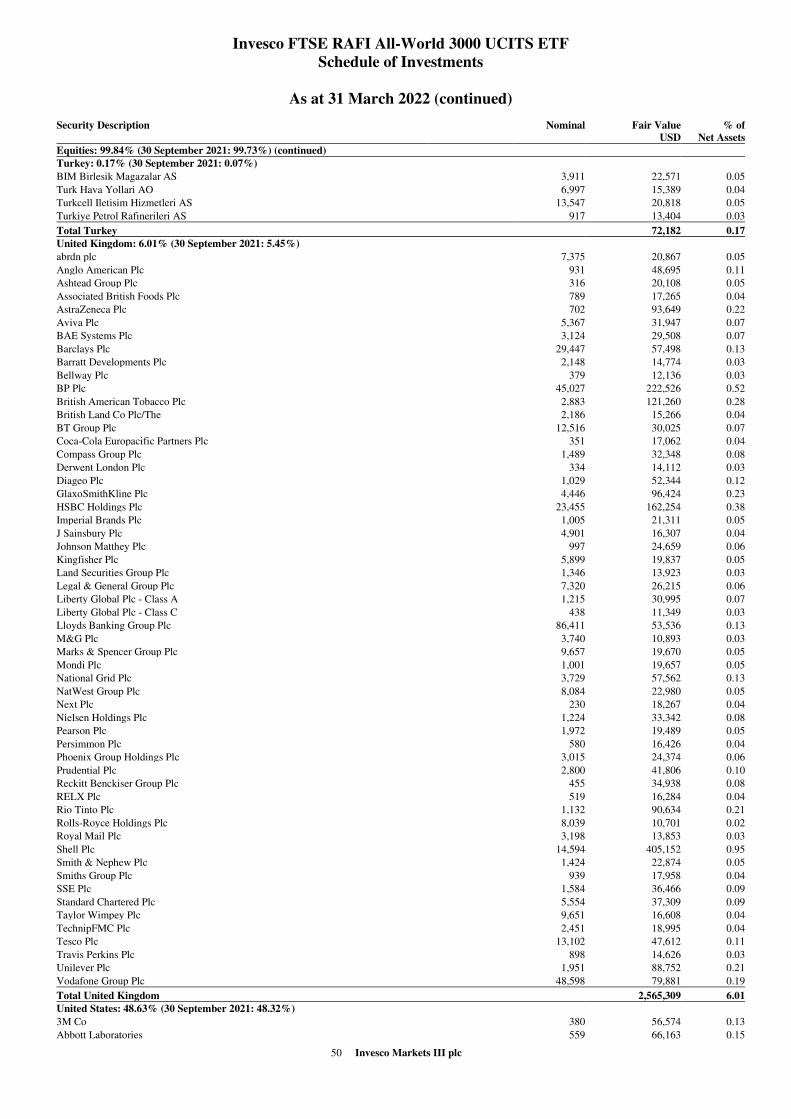
50 Invesco Markets III plc
Invesco FTSE RAFI All-World 3000 UCITS ETF
Schedule of Investments
As at 31 March 2022 (continued)
Security Description
Nominal Fair Value
USD
% of
Net Assets
Equities: 99.84% (30 September 2021: 99.73%) (continued)
Turkey: 0.17% (30 September 2021: 0.07%)
BIM Birlesik Magazalar AS 3,911 22,571 0.05
Turk Hava Yollari AO 6,997 15,389 0.04
Turkcell Iletisim Hizmetleri AS 13,547 20,818 0.05
Turkiye Petrol Rafinerileri AS 917 13,404 0.03
Total Turkey 72,182 0.17
United Kingdom: 6.01% (30 September 2021: 5.45%)
abrdn plc 7,375 20,867 0.05
Anglo American Plc 931 48,695 0.11
Ashtead Group Plc 316 20,108 0.05
Associated British Foods Plc 789 17,265 0.04
AstraZeneca Plc 702 93,649 0.22
Aviva Plc 5,367 31,947 0.07
BAE Systems Plc 3,124 29,508 0.07
Barclays Plc 29,447 57,498 0.13
Barratt Developments Plc 2,148 14,774 0.03
Bellway Plc 379 12,136 0.03
BP Plc 45,027 222,526 0.52
British American Tobacco Plc 2,883 121,260 0.28
British Land Co Plc/The 2,186 15,266 0.04
BT Group Plc 12,516 30,025 0.07
Coca-Cola Europacific Partners Plc 351 17,062 0.04
Compass Group Plc 1,489 32,348 0.08
Derwent London Plc 334 14,112 0.03
Diageo Plc 1,029 52,344 0.12
GlaxoSmithKline Plc 4,446 96,424 0.23
HSBC Holdings Plc 23,455 162,254 0.38
Imperial Brands Plc 1,005 21,311 0.05
J Sainsbury Plc 4,901 16,307 0.04
Johnson Matthey Plc 997 24,659 0.06
Kingfisher Plc 5,899 19,837 0.05
Land Securities Group Plc 1,346 13,923 0.03
Legal & General Group Plc 7,320 26,215 0.06
Liberty Global Plc - Class A 1,215 30,995 0.07
Liberty Global Plc - Class C 438 11,349 0.03
Lloyds Banking Group Plc 86,411 53,536 0.13
M&G Plc 3,740 10,893 0.03
Marks & Spencer Group Plc 9,657 19,670 0.05
Mondi Plc 1,001 19,657 0.05
National Grid Plc 3,729 57,562 0.13
NatWest Group Plc 8,084 22,980 0.05
Next Plc 230 18,267 0.04
Nielsen Holdings Plc 1,224 33,342 0.08
Pearson Plc 1,972 19,489 0.05
Persimmon Plc 580 16,426 0.04
Phoenix Group Holdings Plc 3,015 24,374 0.06
Prudential Plc 2,800 41,806 0.10
Reckitt Benckiser Group Plc 455 34,938 0.08
RELX Plc 519 16,284 0.04
Rio Tinto Plc 1,132 90,634 0.21
Rolls-Royce Holdings Plc 8,039 10,701 0.02
Royal Mail Plc 3,198 13,853 0.03
Shell Plc 14,594 405,152 0.95
Smith & Nephew Plc 1,424 22,874 0.05
Smiths Group Plc 939 17,958 0.04
SSE Plc 1,584 36,466 0.09
Standard Chartered Plc 5,554 37,309 0.09
Taylor Wimpey Plc 9,651 16,608 0.04
TechnipFMC Plc 2,451 18,995 0.04
Tesco Plc 13,102 47,612 0.11
Travis Perkins Plc 898 14,626 0.03
Unilever Plc 1,951 88,752 0.21
Vodafone Group Plc 48,598 79,881 0.19
Total United Kingdom 2,565,309 6.01
United States: 48.63% (30 September 2021: 48.32%)
3M Co 380 56,574 0.13
Abbott Laboratories 559 66,163 0.15
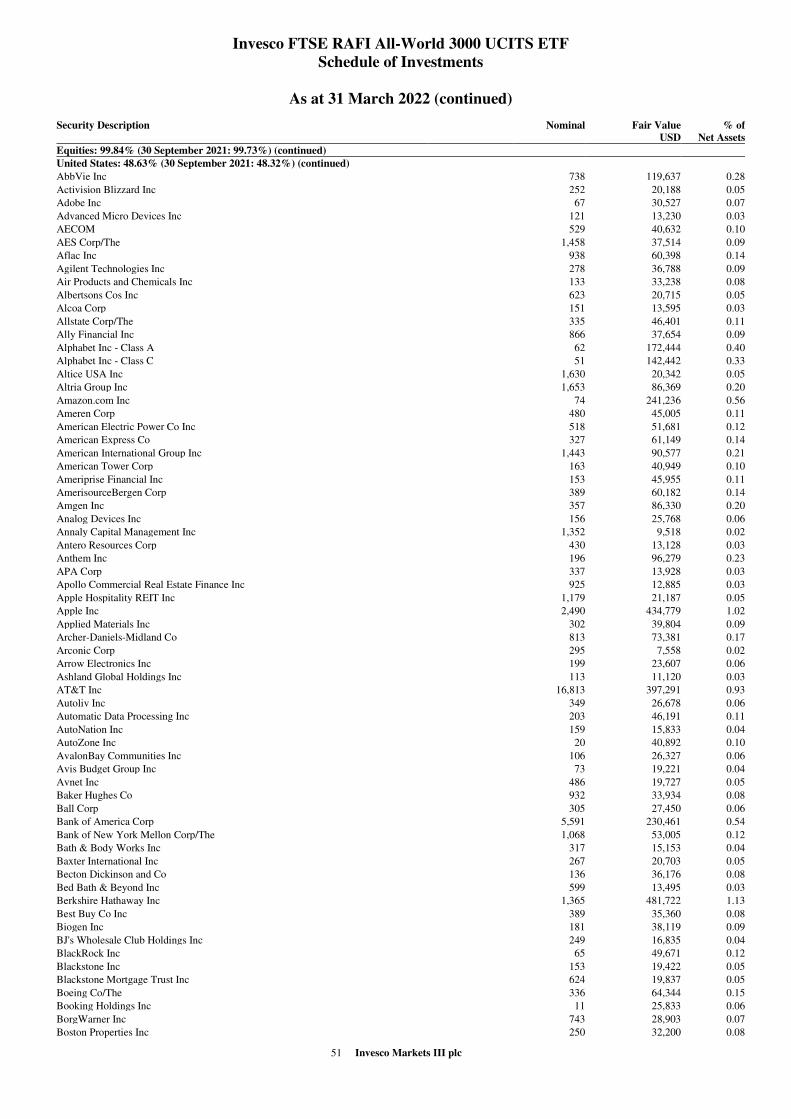
51 Invesco Markets III plc
Invesco FTSE RAFI All-World 3000 UCITS ETF
Schedule of Investments
As at 31 March 2022 (continued)
Security Description
Nominal Fair Value
USD
% of
Net Assets
Equities: 99.84% (30 September 2021: 99.73%) (continued)
United States: 48.63% (30 September 2021: 48.32%) (continued)
AbbVie Inc 738 119,637 0.28
Activision Blizzard Inc 252 20,188 0.05
Adobe Inc 67 30,527 0.07
Advanced Micro Devices Inc 121 13,230 0.03
AECOM 529 40,632 0.10
AES Corp/The 1,458 37,514 0.09
Aflac Inc 938 60,398 0.14
Agilent Technologies Inc 278 36,788 0.09
Air Products and Chemicals Inc 133 33,238 0.08
Albertsons Cos Inc 623 20,715 0.05
Alcoa Corp 151 13,595 0.03
Allstate Corp/The 335 46,401 0.11
Ally Financial Inc 866 37,654 0.09
Alphabet Inc - Class A 62 172,444 0.40
Alphabet Inc - Class C 51 142,442 0.33
Altice USA Inc 1,630 20,342 0.05
Altria Group Inc 1,653 86,369 0.20
Amazon.com Inc 74 241,236 0.56
Ameren Corp 480 45,005 0.11
American Electric Power Co Inc 518 51,681 0.12
American Express Co 327 61,149 0.14
American International Group Inc 1,443 90,577 0.21
American Tower Corp 163 40,949 0.10
Ameriprise Financial Inc 153 45,955 0.11
AmerisourceBergen Corp 389 60,182 0.14
Amgen Inc 357 86,330 0.20
Analog Devices Inc 156 25,768 0.06
Annaly Capital Management Inc 1,352 9,518 0.02
Antero Resources Corp 430 13,128 0.03
Anthem Inc 196 96,279 0.23
APA Corp 337 13,928 0.03
Apollo Commercial Real Estate Finance Inc 925 12,885 0.03
Apple Hospitality REIT Inc 1,179 21,187 0.05
Apple Inc 2,490 434,779 1.02
Applied Materials Inc 302 39,804 0.09
Archer-Daniels-Midland Co 813 73,381 0.17
Arconic Corp 295 7,558 0.02
Arrow Electronics Inc 199 23,607 0.06
Ashland Global Holdings Inc 113 11,120 0.03
AT&T Inc 16,813 397,291 0.93
Autoliv Inc 349 26,678 0.06
Automatic Data Processing Inc 203 46,191 0.11
AutoNation Inc 159 15,833 0.04
AutoZone Inc 20 40,892 0.10
AvalonBay Communities Inc 106 26,327 0.06
Avis Budget Group Inc 73 19,221 0.04
Avnet Inc 486 19,727 0.05
Baker Hughes Co 932 33,934 0.08
Ball Corp 305 27,450 0.06
Bank of America Corp 5,591 230,461 0.54
Bank of New York Mellon Corp/The 1,068 53,005 0.12
Bath & Body Works Inc 317 15,153 0.04
Baxter International Inc 267 20,703 0.05
Becton Dickinson and Co 136 36,176 0.08
Bed Bath & Beyond Inc 599 13,495 0.03
Berkshire Hathaway Inc 1,365 481,722 1.13
Best Buy Co Inc 389 35,360 0.08
Biogen Inc 181 38,119 0.09
BJ's Wholesale Club Holdings Inc 249 16,835 0.04
BlackRock Inc 65 49,671 0.12
Blackstone Inc 153 19,422 0.05
Blackstone Mortgage Trust Inc 624 19,837 0.05
Boeing Co/The 336 64,344 0.15
Booking Holdings Inc 11 25,833 0.06
BorgWarner Inc 743 28,903 0.07
Boston Properties Inc 250 32,200 0.08
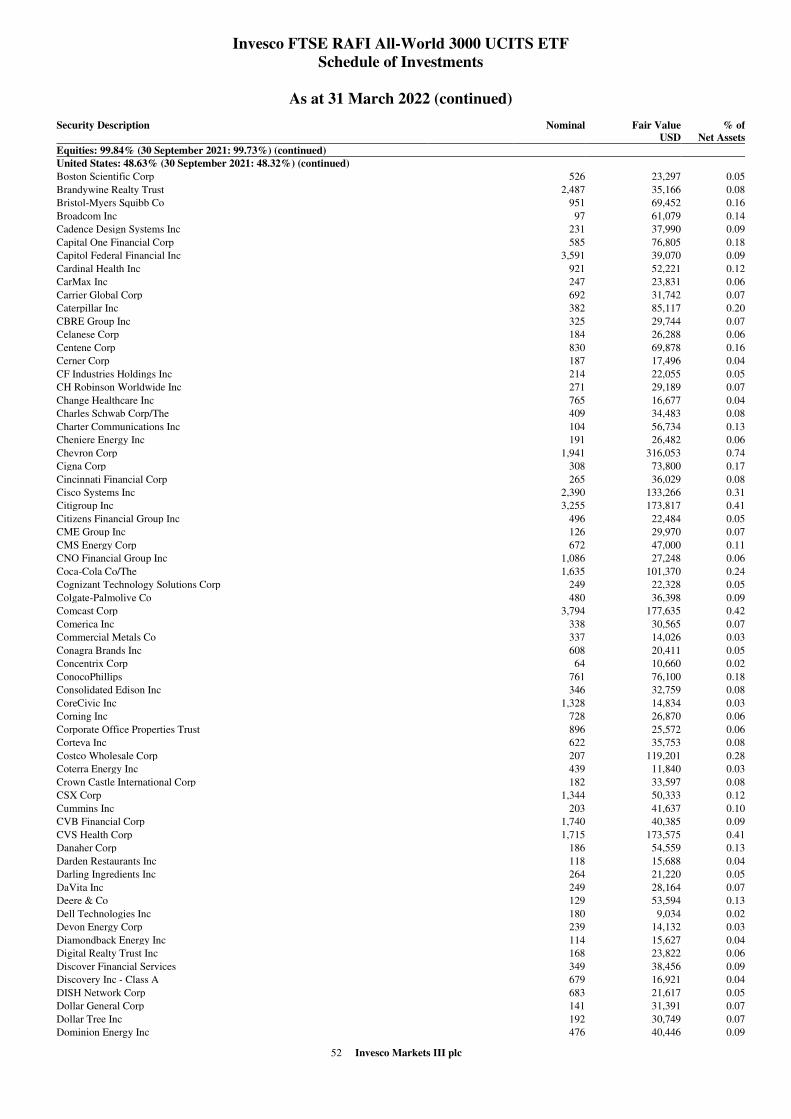
52 Invesco Markets III plc
Invesco FTSE RAFI All-World 3000 UCITS ETF
Schedule of Investments
As at 31 March 2022 (continued)
Security Description
Nominal Fair Value
USD
% of
Net Assets
Equities: 99.84% (30 September 2021: 99.73%) (continued)
United States: 48.63% (30 September 2021: 48.32%) (continued)
Boston Scientific Corp 526 23,297 0.05
Brandywine Realty Trust 2,487 35,166 0.08
Bristol-Myers Squibb Co 951 69,452 0.16
Broadcom Inc 97 61,079 0.14
Cadence Design Systems Inc 231 37,990 0.09
Capital One Financial Corp 585 76,805 0.18
Capitol Federal Financial Inc 3,591 39,070 0.09
Cardinal Health Inc 921 52,221 0.12
CarMax Inc 247 23,831 0.06
Carrier Global Corp 692 31,742 0.07
Caterpillar Inc 382 85,117 0.20
CBRE Group Inc 325 29,744 0.07
Celanese Corp 184 26,288 0.06
Centene Corp 830 69,878 0.16
Cerner Corp 187 17,496 0.04
CF Industries Holdings Inc 214 22,055 0.05
CH Robinson Worldwide Inc 271 29,189 0.07
Change Healthcare Inc 765 16,677 0.04
Charles Schwab Corp/The 409 34,483 0.08
Charter Communications Inc 104 56,734 0.13
Cheniere Energy Inc 191 26,482 0.06
Chevron Corp 1,941 316,053 0.74
Cigna Corp 308 73,800 0.17
Cincinnati Financial Corp 265 36,029 0.08
Cisco Systems Inc 2,390 133,266 0.31
Citigroup Inc 3,255 173,817 0.41
Citizens Financial Group Inc 496 22,484 0.05
CME Group Inc 126 29,970 0.07
CMS Energy Corp 672 47,000 0.11
CNO Financial Group Inc 1,086 27,248 0.06
Coca-Cola Co/The 1,635 101,370 0.24
Cognizant Technology Solutions Corp 249 22,328 0.05
Colgate-Palmolive Co 480 36,398 0.09
Comcast Corp 3,794 177,635 0.42
Comerica Inc 338 30,565 0.07
Commercial Metals Co 337 14,026 0.03
Conagra Brands Inc 608 20,411 0.05
Concentrix Corp 64 10,660 0.02
ConocoPhillips 761 76,100 0.18
Consolidated Edison Inc 346 32,759 0.08
CoreCivic Inc 1,328 14,834 0.03
Corning Inc 728 26,870 0.06
Corporate Office Properties Trust 896 25,572 0.06
Corteva Inc 622 35,753 0.08
Costco Wholesale Corp 207 119,201 0.28
Coterra Energy Inc 439 11,840 0.03
Crown Castle International Corp 182 33,597 0.08
CSX Corp 1,344 50,333 0.12
Cummins Inc 203 41,637 0.10
CVB Financial Corp 1,740 40,385 0.09
CVS Health Corp 1,715 173,575 0.41
Danaher Corp 186 54,559 0.13
Darden Restaurants Inc 118 15,688 0.04
Darling Ingredients Inc 264 21,220 0.05
DaVita Inc 249 28,164 0.07
Deere & Co 129 53,594 0.13
Dell Technologies Inc 180 9,034 0.02
Devon Energy Corp 239 14,132 0.03
Diamondback Energy Inc 114 15,627 0.04
Digital Realty Trust Inc 168 23,822 0.06
Discover Financial Services 349 38,456 0.09
Discovery Inc - Class A 679 16,921 0.04
DISH Network Corp 683 21,617 0.05
Dollar General Corp 141 31,391 0.07
Dollar Tree Inc 192 30,749 0.07
Dominion Energy Inc 476 40,446 0.09
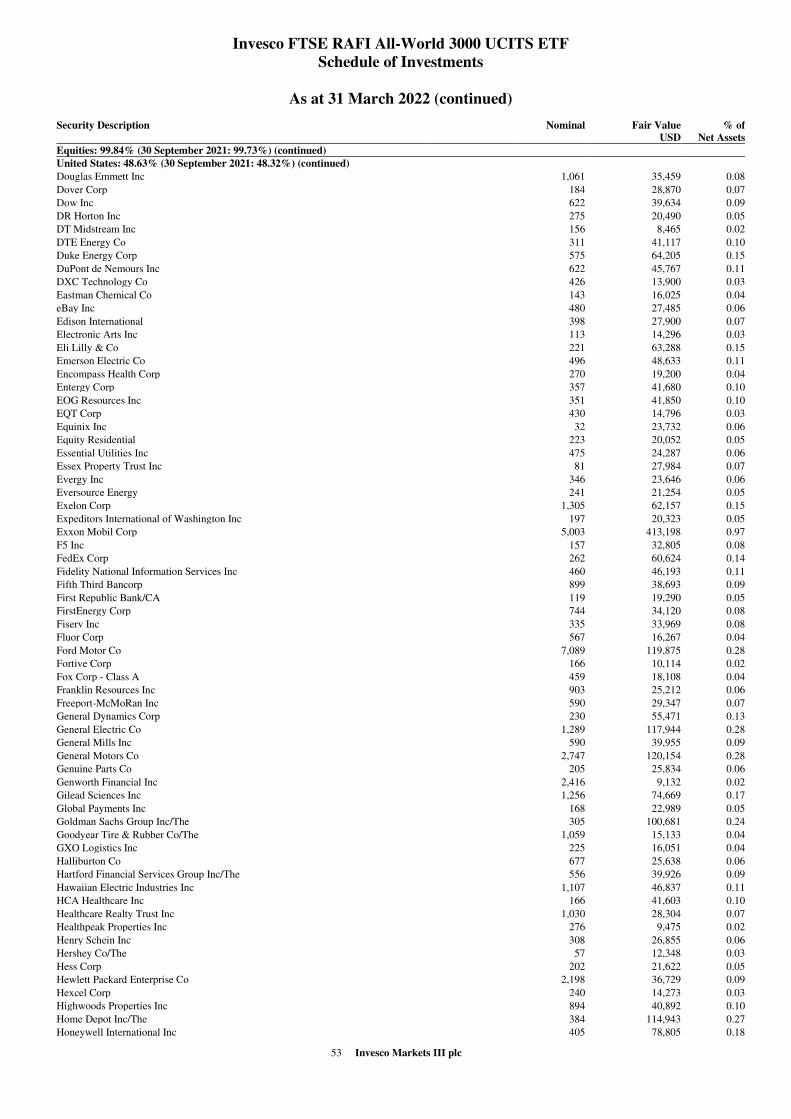
53 Invesco Markets III plc
Invesco FTSE RAFI All-World 3000 UCITS ETF
Schedule of Investments
As at 31 March 2022 (continued)
Security Description
Nominal Fair Value
USD
% of
Net Assets
Equities: 99.84% (30 September 2021: 99.73%) (continued)
United States: 48.63% (30 September 2021: 48.32%) (continued)
Douglas Emmett Inc 1,061 35,459 0.08
Dover Corp 184 28,870 0.07
Dow Inc 622 39,634 0.09
DR Horton Inc 275 20,490 0.05
DT Midstream Inc 156 8,465 0.02
DTE Energy Co 311 41,117 0.10
Duke Energy Corp 575 64,205 0.15
DuPont de Nemours Inc 622 45,767 0.11
DXC Technology Co 426 13,900 0.03
Eastman Chemical Co 143 16,025 0.04
eBay Inc 480 27,485 0.06
Edison International 398 27,900 0.07
Electronic Arts Inc 113 14,296 0.03
Eli Lilly & Co 221 63,288 0.15
Emerson Electric Co 496 48,633 0.11
Encompass Health Corp 270 19,200 0.04
Entergy Corp 357 41,680 0.10
EOG Resources Inc 351 41,850 0.10
EQT Corp 430 14,796 0.03
Equinix Inc 32 23,732 0.06
Equity Residential 223 20,052 0.05
Essential Utilities Inc 475 24,287 0.06
Essex Property Trust Inc 81 27,984 0.07
Evergy Inc 346 23,646 0.06
Eversource Energy 241 21,254 0.05
Exelon Corp 1,305 62,157 0.15
Expeditors International of Washington Inc 197 20,323 0.05
Exxon Mobil Corp 5,003 413,198 0.97
F5 Inc 157 32,805 0.08
FedEx Corp 262 60,624 0.14
Fidelity National Information Services Inc 460 46,193 0.11
Fifth Third Bancorp 899 38,693 0.09
First Republic Bank/CA 119 19,290 0.05
FirstEnergy Corp 744 34,120 0.08
Fiserv Inc 335 33,969 0.08
Fluor Corp 567 16,267 0.04
Ford Motor Co 7,089 119,875 0.28
Fortive Corp 166 10,114 0.02
Fox Corp - Class A 459 18,108 0.04
Franklin Resources Inc 903 25,212 0.06
Freeport-McMoRan Inc 590 29,347 0.07
General Dynamics Corp 230 55,471 0.13
General Electric Co 1,289 117,944 0.28
General Mills Inc 590 39,955 0.09
General Motors Co 2,747 120,154 0.28
Genuine Parts Co 205 25,834 0.06
Genworth Financial Inc 2,416 9,132 0.02
Gilead Sciences Inc 1,256 74,669 0.17
Global Payments Inc 168 22,989 0.05
Goldman Sachs Group Inc/The 305 100,681 0.24
Goodyear Tire & Rubber Co/The 1,059 15,133 0.04
GXO Logistics Inc 225 16,051 0.04
Halliburton Co 677 25,638 0.06
Hartford Financial Services Group Inc/The 556 39,926 0.09
Hawaiian Electric Industries Inc 1,107 46,837 0.11
HCA Healthcare Inc 166 41,603 0.10
Healthcare Realty Trust Inc 1,030 28,304 0.07
Healthpeak Properties Inc 276 9,475 0.02
Henry Schein Inc 308 26,855 0.06
Hershey Co/The 57 12,348 0.03
Hess Corp 202 21,622 0.05
Hewlett Packard Enterprise Co 2,198 36,729 0.09
Hexcel Corp 240 14,273 0.03
Highwoods Properties Inc 894 40,892 0.10
Home Depot Inc/The 384 114,943 0.27
Honeywell International Inc 405 78,805 0.18

54 Invesco Markets III plc
Invesco FTSE RAFI All-World 3000 UCITS ETF
Schedule of Investments
As at 31 March 2022 (continued)
Security Description
Nominal Fair Value
USD
% of
Net Assets
Equities: 99.84% (30 September 2021: 99.73%) (continued)
United States: 48.63% (30 September 2021: 48.32%) (continued)
Hormel Foods Corp 307 15,823 0.04
Host Hotels & Resorts Inc 1,119 21,742 0.05
Howmet Aerospace Inc 614 22,067 0.05
HP Inc 1,457 52,889 0.12
Humana Inc 95 41,341 0.10
Huntington Bancshares Inc/OH 1,330 19,445 0.05
Huntington Ingalls Industries Inc 177 35,301 0.08
Illinois Tool Works Inc 235 49,209 0.12
Incyte Corp 196 15,566 0.04
Intel Corp 4,184 207,359 0.49
Intercontinental Exchange Inc 121 15,987 0.04
International Business Machines Corp 965 125,469 0.29
International Paper Co 556 25,659 0.06
Interpublic Group of Cos Inc/The 467 16,555 0.04
Invitation Homes Inc 674 27,081 0.06
IPG Photonics Corp 78 8,561 0.02
Iron Mountain Inc 560 31,030 0.07
J M Smucker Co/The 165 22,343 0.05
Jabil Inc 490 30,248 0.07
Jefferies Financial Group Inc 615 20,203 0.05
Johnson & Johnson 1,243 220,297 0.52
Jones Lang LaSalle Inc 103 24,664 0.06
JPMorgan Chase & Co 2,566 349,797 0.82
KBR Inc 299 16,364 0.04
Kellogg Co 325 20,959 0.05
KeyCorp 1,039 23,253 0.05
Keysight Technologies Inc 122 19,272 0.04
Kilroy Realty Corp 438 33,472 0.08
Kimberly-Clark Corp 619 76,236 0.18
Kinder Morgan Inc 2,720 51,435 0.12
KKR & Co Inc 343 20,055 0.05
KLA Corp 86 31,481 0.07
Kohl's Corp 376 22,733 0.05
Kraft Heinz Co/The 951 37,460 0.09
Kroger Co/The 1,699 97,472 0.23
Kyndryl Holdings Inc 1,151 15,101 0.04
L3Harris Technologies Inc 103 25,592 0.06
Laboratory Corp of America Holdings 69 18,193 0.04
Lam Research Corp 57 30,644 0.07
Las Vegas Sands Corp 450 17,491 0.04
Lear Corp 162 23,100 0.05
Leidos Holdings Inc 277 29,922 0.07
Lennar Corp 257 20,861 0.05
Liberty Media Corp-Liberty SiriusXM - Class C 708 32,377 0.08
Lincoln National Corp 351 22,941 0.05
Live Nation Entertainment Inc 114 13,411 0.03
LKQ Corp 928 42,140 0.10
Lockheed Martin Corp 135 59,589 0.14
Loews Corp 560 36,299 0.08
Lowe's Cos Inc 354 71,575 0.17
Lumen Technologies Inc 4,245 47,841 0.11
M&T Bank Corp 142 24,069 0.06
Macy's Inc 879 21,412 0.05
ManpowerGroup Inc 180 16,906 0.04
Marathon Oil Corp 886 22,247 0.05
Marathon Petroleum Corp 856 73,188 0.17
Marsh & McLennan Cos Inc 262 44,650 0.10
Martin Marietta Materials Inc 62 23,863 0.06
Mastercard Inc 79 28,233 0.07
Mattel Inc 838 18,612 0.04
Maximus Inc 281 21,061 0.05
McDonald's Corp 263 65,035 0.15
McKesson Corp 284 86,941 0.20
Merck & Co Inc 1,464 120,121 0.28
Meta Platforms Inc 800 177,888 0.42
MetLife Inc 1,144 80,400 0.19

55 Invesco Markets III plc
Invesco FTSE RAFI All-World 3000 UCITS ETF
Schedule of Investments
As at 31 March 2022 (continued)
Security Description
Nominal Fair Value
USD
% of
Net Assets
Equities: 99.84% (30 September 2021: 99.73%) (continued)
United States: 48.63% (30 September 2021: 48.32%) (continued)
MGM Resorts International 349 14,637 0.03
Microchip Technology Inc 272 20,438 0.05
Micron Technology Inc 826 64,337 0.15
Microsoft Corp 1,158 357,023 0.84
Mohawk Industries Inc 126 15,649 0.04
Molina Healthcare Inc 91 30,357 0.07
Molson Coors Beverage Co 389 20,765 0.05
Mondelez International Inc 410 25,740 0.06
Morgan Stanley 967 84,516 0.20
Mosaic Co/The 368 24,472 0.06
Murphy USA Inc 120 23,995 0.06
Navient Corp 748 12,746 0.03
NetApp Inc 282 23,406 0.05
Netflix Inc 62 23,225 0.05
New Residential Investment Corp 1,836 20,159 0.05
New York Community Bancorp Inc 2,526 27,079 0.06
Newell Brands Inc 635 13,595 0.03
Newmont Corp 391 31,065 0.07
NextEra Energy Inc 823 69,716 0.16
NIKE Inc 221 29,738 0.07
NiSource Inc 317 10,081 0.02
Nordstrom Inc 484 13,121 0.03
Norfolk Southern Corp 171 48,773 0.11
Northern Trust Corp 301 35,051 0.08
Northrop Grumman Corp 88 39,355 0.09
NorthWestern Corp 503 30,426 0.07
NortonLifeLock Inc 731 19,386 0.05
NOV Inc 858 16,825 0.04
NRG Energy Inc 348 13,349 0.03
Nucor Corp 253 37,608 0.09
NVIDIA Corp 91 24,830 0.06
Occidental Petroleum Corp 1,033 58,612 0.14
ODP Corp/The 278 12,741 0.03
Olin Corp 209 10,927 0.03
Omnicom Group Inc 411 34,886 0.08
ONEOK Inc 362 25,568 0.06
Oracle Corp 838 69,328 0.16
Organon & Co 652 22,774 0.05
Oshkosh Corp 153 15,399 0.04
Otis Worldwide Corp 341 26,240 0.06
Ovintiv Inc 290 15,680 0.04
Owens & Minor Inc 228 10,037 0.02
Owens Corning 201 18,392 0.04
PACCAR Inc 325 28,623 0.07
Packaging Corp of America 210 32,783 0.08
Paramount Global 998 37,734 0.09
Parker-Hannifin Corp 57 16,174 0.04
PayPal Holdings Inc 326 37,702 0.09
PBF Energy Inc 690 16,815 0.04
PDC Energy Inc 145 10,539 0.02
PennyMac Mortgage Investment Trust 1,366 23,072 0.05
People's United Financial Inc 1,151 23,008 0.05
PepsiCo Inc 688 115,157 0.27
Performance Food Group Co 367 18,684 0.04
PerkinElmer Inc 152 26,518 0.06
Pfizer Inc 3,813 197,399 0.46
PG&E Corp 1,796 21,444 0.05
Philip Morris International Inc 1,056 99,201 0.23
Phillips 66 912 78,788 0.18
Physicians Realty Trust 1,639 28,748 0.07
Piedmont Office Realty Trust Inc 2,135 36,765 0.09
Pinnacle West Capital Corp 393 30,693 0.07
Pioneer Natural Resources Co 51 12,752 0.03
PNC Financial Services Group Inc/The 387 71,382 0.17
Portland General Electric Co 823 45,388 0.11
PPG Industries Inc 233 30,539 0.07
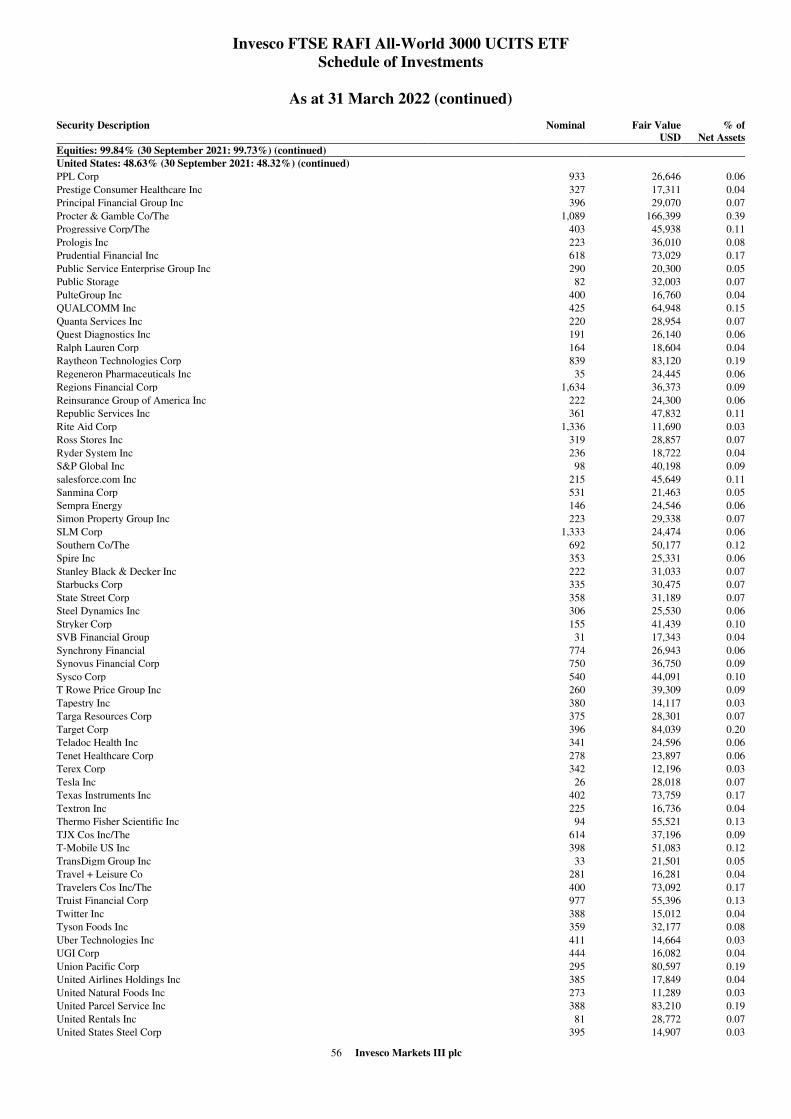
56 Invesco Markets III plc
Invesco FTSE RAFI All-World 3000 UCITS ETF
Schedule of Investments
As at 31 March 2022 (continued)
Security Description
Nominal Fair Value
USD
% of
Net Assets
Equities: 99.84% (30 September 2021: 99.73%) (continued)
United States: 48.63% (30 September 2021: 48.32%) (continued)
PPL Corp 933 26,646 0.06
Prestige Consumer Healthcare Inc 327 17,311 0.04
Principal Financial Group Inc 396 29,070 0.07
Procter & Gamble Co/The 1,089 166,399 0.39
Progressive Corp/The 403 45,938 0.11
Prologis Inc 223 36,010 0.08
Prudential Financial Inc 618 73,029 0.17
Public Service Enterprise Group Inc 290 20,300 0.05
Public Storage 82 32,003 0.07
PulteGroup Inc 400 16,760 0.04
QUALCOMM Inc 425 64,948 0.15
Quanta Services Inc 220 28,954 0.07
Quest Diagnostics Inc 191 26,140 0.06
Ralph Lauren Corp 164 18,604 0.04
Raytheon Technologies Corp 839 83,120 0.19
Regeneron Pharmaceuticals Inc 35 24,445 0.06
Regions Financial Corp 1,634 36,373 0.09
Reinsurance Group of America Inc 222 24,300 0.06
Republic Services Inc 361 47,832 0.11
Rite Aid Corp 1,336 11,690 0.03
Ross Stores Inc 319 28,857 0.07
Ryder System Inc 236 18,722 0.04
S&P Global Inc 98 40,198 0.09
salesforce.com Inc 215 45,649 0.11
Sanmina Corp 531 21,463 0.05
Sempra Energy 146 24,546 0.06
Simon Property Group Inc 223 29,338 0.07
SLM Corp 1,333 24,474 0.06
Southern Co/The 692 50,177 0.12
Spire Inc 353 25,331 0.06
Stanley Black & Decker Inc 222 31,033 0.07
Starbucks Corp 335 30,475 0.07
State Street Corp 358 31,189 0.07
Steel Dynamics Inc 306 25,530 0.06
Stryker Corp 155 41,439 0.10
SVB Financial Group 31 17,343 0.04
Synchrony Financial 774 26,943 0.06
Synovus Financial Corp 750 36,750 0.09
Sysco Corp 540 44,091 0.10
T Rowe Price Group Inc 260 39,309 0.09
Tapestry Inc 380 14,117 0.03
Targa Resources Corp 375 28,301 0.07
Target Corp 396 84,039 0.20
Teladoc Health Inc 341 24,596 0.06
Tenet Healthcare Corp 278 23,897 0.06
Terex Corp 342 12,196 0.03
Tesla Inc 26 28,018 0.07
Texas Instruments Inc 402 73,759 0.17
Textron Inc 225 16,736 0.04
Thermo Fisher Scientific Inc 94 55,521 0.13
TJX Cos Inc/The 614 37,196 0.09
T-Mobile US Inc 398 51,083 0.12
TransDigm Group Inc 33 21,501 0.05
Travel + Leisure Co 281 16,281 0.04
Travelers Cos Inc/The 400 73,092 0.17
Truist Financial Corp 977 55,396 0.13
Twitter Inc 388 15,012 0.04
Tyson Foods Inc 359 32,177 0.08
Uber Technologies Inc 411 14,664 0.03
UGI Corp 444 16,082 0.04
Union Pacific Corp 295 80,597 0.19
United Airlines Holdings Inc 385 17,849 0.04
United Natural Foods Inc 273 11,289 0.03
United Parcel Service Inc 388 83,210 0.19
United Rentals Inc 81 28,772 0.07
United States Steel Corp 395 14,907 0.03
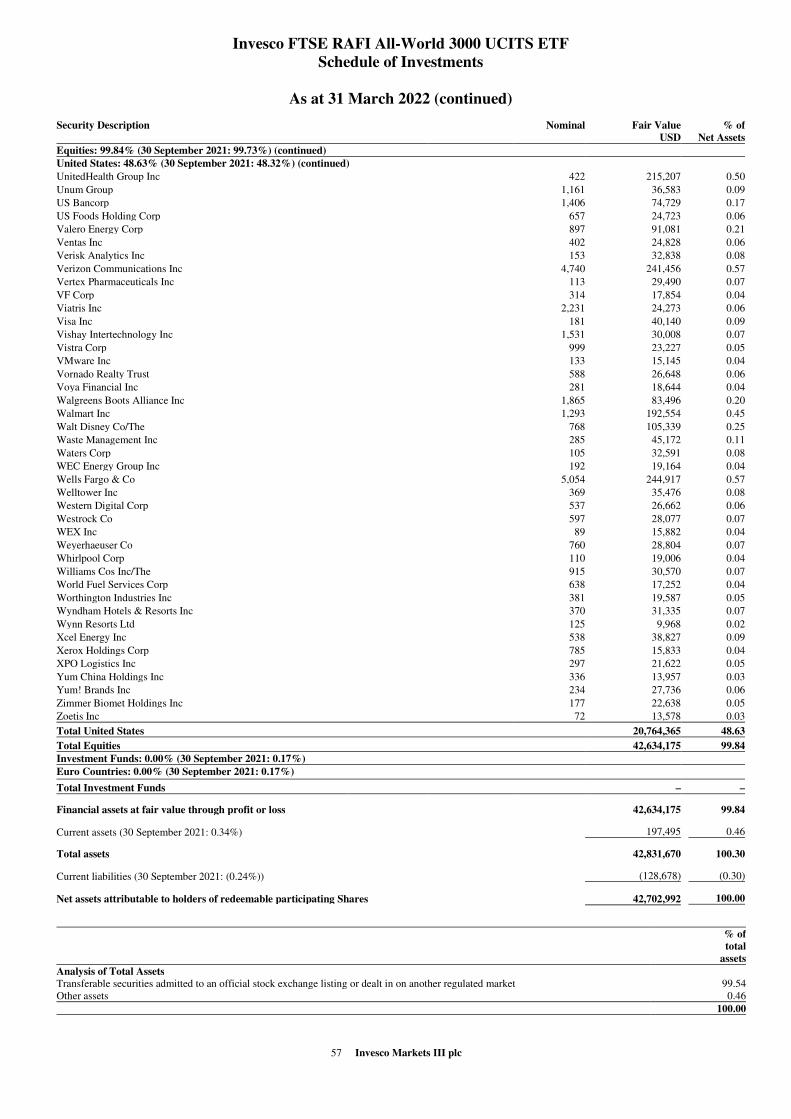
57 Invesco Markets III plc
Invesco FTSE RAFI All-World 3000 UCITS ETF
Schedule of Investments
As at 31 March 2022 (continued)
Security Description
Nominal Fair Value
USD
% of
Net Assets
Equities: 99.84% (30 September 2021: 99.73%) (continued)
United States: 48.63% (30 September 2021: 48.32%) (continued)
UnitedHealth Group Inc 422 215,207 0.50
Unum Group 1,161 36,583 0.09
US Bancorp 1,406 74,729 0.17
US Foods Holding Corp 657 24,723 0.06
Valero Energy Corp 897 91,081 0.21
Ventas Inc 402 24,828 0.06
Verisk Analytics Inc 153 32,838 0.08
Verizon Communications Inc 4,740 241,456 0.57
Vertex Pharmaceuticals Inc 113 29,490 0.07
VF Corp 314 17,854 0.04
Viatris Inc 2,231 24,273 0.06
Visa Inc 181 40,140 0.09
Vishay Intertechnology Inc 1,531 30,008 0.07
Vistra Corp 999 23,227 0.05
VMware Inc 133 15,145 0.04
Vornado Realty Trust 588 26,648 0.06
Voya Financial Inc 281 18,644 0.04
Walgreens Boots Alliance Inc 1,865 83,496 0.20
Walmart Inc 1,293 192,554 0.45
Walt Disney Co/The 768 105,339 0.25
Waste Management Inc 285 45,172 0.11
Waters Corp 105 32,591 0.08
WEC Energy Group Inc 192 19,164 0.04
Wells Fargo & Co 5,054 244,917 0.57
Welltower Inc 369 35,476 0.08
Western Digital Corp 537 26,662 0.06
Westrock Co 597 28,077 0.07
WEX Inc 89 15,882 0.04
Weyerhaeuser Co 760 28,804 0.07
Whirlpool Corp 110 19,006 0.04
Williams Cos Inc/The 915 30,570 0.07
World Fuel Services Corp 638 17,252 0.04
Worthington Industries Inc 381 19,587 0.05
Wyndham Hotels & Resorts Inc 370 31,335 0.07
Wynn Resorts Ltd 125 9,968 0.02
Xcel Energy Inc 538 38,827 0.09
Xerox Holdings Corp 785 15,833 0.04
XPO Logistics Inc 297 21,622 0.05
Yum China Holdings Inc 336 13,957 0.03
Yum! Brands Inc 234 27,736 0.06
Zimmer Biomet Holdings Inc 177 22,638 0.05
Zoetis Inc 72 13,578 0.03
Total United States 20,764,365 48.63
Total Equities 42,634,175 99.84
Investment Funds: 0.00% (30 September 2021: 0.17%)
Euro Countries: 0.00% (30 September 2021: 0.17%)
Total Investment Funds – –
Financial assets at fair value through profit or loss 42,634,175 99.84
Current assets (30 September 2021: 0.34%) 197,495 0.46
Total assets 42,831,670 100.30
Current liabilities (30 September 2021: (0.24%)) (128,678) (0.30)
Net assets attributable to holders of redeemable participating Shares 42,702,992 100.00
% of
total
assets
Analysis of Total Assets
Transferable securities admitted to an official stock exchange listing or dealt in on another regulated market 99.54
Other assets 0.46
100.00
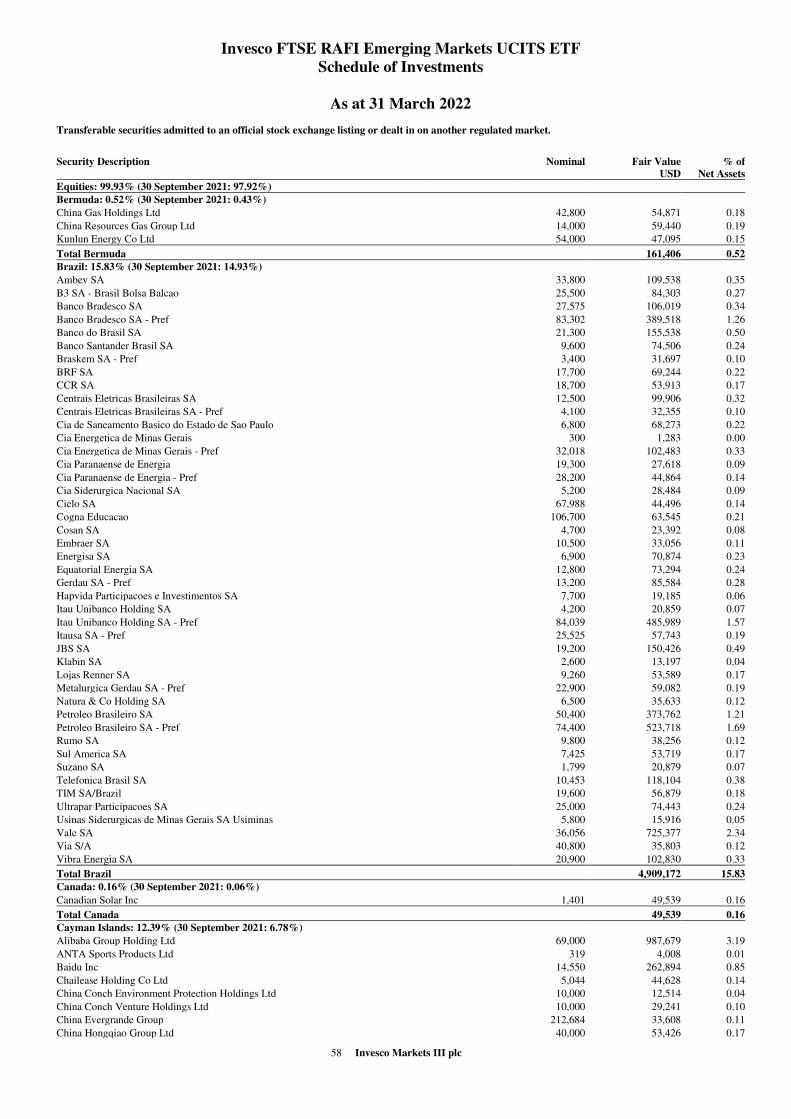
58 Invesco Markets III plc
Invesco FTSE RAFI Emerging Markets UCITS ETF
Schedule of Investments
As at 31 March 2022
Transferable securities admitted to an official stock exchange listing or dealt in on another regulated market.
Security Description
Nominal Fair Value
USD
% of
Net Assets
Equities: 99.93% (30 September 2021: 97.92%)
Bermuda: 0.52% (30 September 2021: 0.43%)
China Gas Holdings Ltd 42,800 54,871 0.18
China Resources Gas Group Ltd 14,000 59,440 0.19
Kunlun Energy Co Ltd 54,000 47,095 0.15
Total Bermuda 161,406 0.52
Brazil: 15.83% (30 September 2021: 14.93%)
Ambev SA 33,800 109,538 0.35
B3 SA - Brasil Bolsa Balcao 25,500 84,303 0.27
Banco Bradesco SA 27,575 106,019 0.34
Banco Bradesco SA - Pref 83,302 389,518 1.26
Banco do Brasil SA 21,300 155,538 0.50
Banco Santander Brasil SA 9,600 74,506 0.24
Braskem SA - Pref 3,400 31,697 0.10
BRF SA 17,700 69,244 0.22
CCR SA 18,700 53,913 0.17
Centrais Eletricas Brasileiras SA 12,500 99,906 0.32
Centrais Eletricas Brasileiras SA - Pref 4,100 32,355 0.10
Cia de Saneamento Basico do Estado de Sao Paulo 6,800 68,273 0.22
Cia Energetica de Minas Gerais 300 1,283 0.00
Cia Energetica de Minas Gerais - Pref 32,018 102,483 0.33
Cia Paranaense de Energia 19,300 27,618 0.09
Cia Paranaense de Energia - Pref 28,200 44,864 0.14
Cia Siderurgica Nacional SA 5,200 28,484 0.09
Cielo SA 67,988 44,496 0.14
Cogna Educacao 106,700 63,545 0.21
Cosan SA 4,700 23,392 0.08
Embraer SA 10,500 33,056 0.11
Energisa SA 6,900 70,874 0.23
Equatorial Energia SA 12,800 73,294 0.24
Gerdau SA - Pref 13,200 85,584 0.28
Hapvida Participacoes e Investimentos SA 7,700 19,185 0.06
Itau Unibanco Holding SA 4,200 20,859 0.07
Itau Unibanco Holding SA - Pref 84,039 485,989 1.57
Itausa SA - Pref 25,525 57,743 0.19
JBS SA 19,200 150,426 0.49
Klabin SA 2,600 13,197 0.04
Lojas Renner SA 9,260 53,589 0.17
Metalurgica Gerdau SA - Pref 22,900 59,082 0.19
Natura & Co Holding SA 6,500 35,633 0.12
Petroleo Brasileiro SA 50,400 373,762 1.21
Petroleo Brasileiro SA - Pref 74,400 523,718 1.69
Rumo SA 9,800 38,256 0.12
Sul America SA 7,425 53,719 0.17
Suzano SA 1,799 20,879 0.07
Telefonica Brasil SA 10,453 118,104 0.38
TIM SA/Brazil 19,600 56,879 0.18
Ultrapar Participacoes SA 25,000 74,443 0.24
Usinas Siderurgicas de Minas Gerais SA Usiminas 5,800 15,916 0.05
Vale SA 36,056 725,377 2.34
Via S/A 40,800 35,803 0.12
Vibra Energia SA 20,900 102,830 0.33
Total Brazil 4,909,172 15.83
Canada: 0.16% (30 September 2021: 0.06%)
Canadian Solar Inc 1,401 49,539 0.16
Total Canada 49,539 0.16
Cayman Islands: 12.39% (30 September 2021: 6.78%)
Alibaba Group Holding Ltd 69,000 987,679 3.19
ANTA Sports Products Ltd 319 4,008 0.01
Baidu Inc 14,550 262,894 0.85
Chailease Holding Co Ltd 5,044 44,628 0.14
China Conch Environment Protection Holdings Ltd 10,000 12,514 0.04
China Conch Venture Holdings Ltd 10,000 29,241 0.10
China Evergrande Group 212,684 33,608 0.11
China Hongqiao Group Ltd 40,000 53,426 0.17
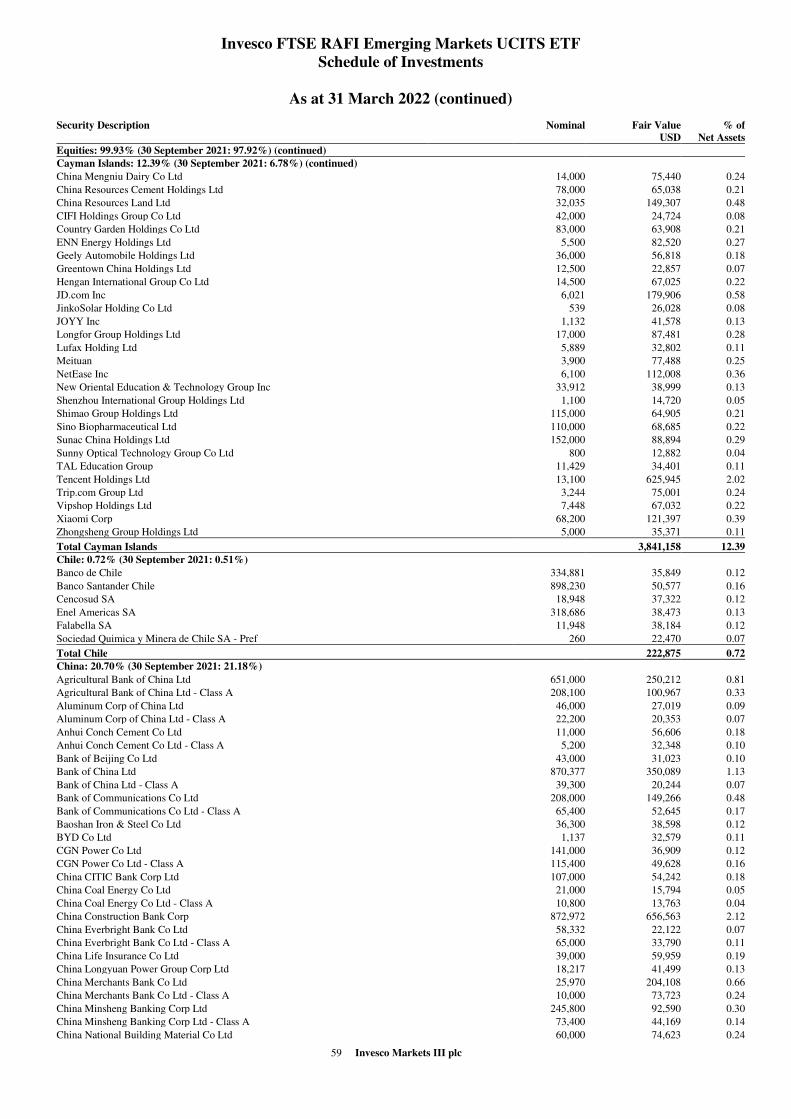
59 Invesco Markets III plc
Invesco FTSE RAFI Emerging Markets UCITS ETF
Schedule of Investments
As at 31 March 2022 (continued)
Security Description
Nominal Fair Value
USD
% of
Net Assets
Equities: 99.93% (30 September 2021: 97.92%) (continued)
Cayman Islands: 12.39% (30 September 2021: 6.78%) (continued)
China Mengniu Dairy Co Ltd 14,000 75,440 0.24
China Resources Cement Holdings Ltd 78,000 65,038 0.21
China Resources Land Ltd 32,035 149,307 0.48
CIFI Holdings Group Co Ltd 42,000 24,724 0.08
Country Garden Holdings Co Ltd 83,000 63,908 0.21
ENN Energy Holdings Ltd 5,500 82,520 0.27
Geely Automobile Holdings Ltd 36,000 56,818 0.18
Greentown China Holdings Ltd 12,500 22,857 0.07
Hengan International Group Co Ltd 14,500 67,025 0.22
JD.com Inc 6,021 179,906 0.58
JinkoSolar Holding Co Ltd 539 26,028 0.08
JOYY Inc 1,132 41,578 0.13
Longfor Group Holdings Ltd 17,000 87,481 0.28
Lufax Holding Ltd 5,889 32,802 0.11
Meituan 3,900 77,488 0.25
NetEase Inc 6,100 112,008 0.36
New Oriental Education & Technology Group Inc 33,912 38,999 0.13
Shenzhou International Group Holdings Ltd 1,100 14,720 0.05
Shimao Group Holdings Ltd 115,000 64,905 0.21
Sino Biopharmaceutical Ltd 110,000 68,685 0.22
Sunac China Holdings Ltd 152,000 88,894 0.29
Sunny Optical Technology Group Co Ltd 800 12,882 0.04
TAL Education Group 11,429 34,401 0.11
Tencent Holdings Ltd 13,100 625,945 2.02
Trip.com Group Ltd 3,244 75,001 0.24
Vipshop Holdings Ltd 7,448 67,032 0.22
Xiaomi Corp 68,200 121,397 0.39
Zhongsheng Group Holdings Ltd 5,000 35,371 0.11
Total Cayman Islands 3,841,158 12.39
Chile: 0.72% (30 September 2021: 0.51%)
Banco de Chile 334,881 35,849 0.12
Banco Santander Chile 898,230 50,577 0.16
Cencosud SA 18,948 37,322 0.12
Enel Americas SA 318,686 38,473 0.13
Falabella SA 11,948 38,184 0.12
Sociedad Quimica y Minera de Chile SA - Pref 260 22,470 0.07
Total Chile 222,875 0.72
China: 20.70% (30 September 2021: 21.18%)
Agricultural Bank of China Ltd 651,000 250,212 0.81
Agricultural Bank of China Ltd - Class A 208,100 100,967 0.33
Aluminum Corp of China Ltd 46,000 27,019 0.09
Aluminum Corp of China Ltd - Class A 22,200 20,353 0.07
Anhui Conch Cement Co Ltd 11,000 56,606 0.18
Anhui Conch Cement Co Ltd - Class A 5,200 32,348 0.10
Bank of Beijing Co Ltd 43,000 31,023 0.10
Bank of China Ltd 870,377 350,089 1.13
Bank of China Ltd - Class A 39,300 20,244 0.07
Bank of Communications Co Ltd 208,000 149,266 0.48
Bank of Communications Co Ltd - Class A 65,400 52,645 0.17
Baoshan Iron & Steel Co Ltd 36,300 38,598 0.12
BYD Co Ltd 1,137 32,579 0.11
CGN Power Co Ltd 141,000 36,909 0.12
CGN Power Co Ltd - Class A 115,400 49,628 0.16
China CITIC Bank Corp Ltd 107,000 54,242 0.18
China Coal Energy Co Ltd 21,000 15,794 0.05
China Coal Energy Co Ltd - Class A 10,800 13,763 0.04
China Construction Bank Corp 872,972 656,563 2.12
China Everbright Bank Co Ltd 58,332 22,122 0.07
China Everbright Bank Co Ltd - Class A 65,000 33,790 0.11
China Life Insurance Co Ltd 39,000 59,959 0.19
China Longyuan Power Group Corp Ltd 18,217 41,499 0.13
China Merchants Bank Co Ltd 25,970 204,108 0.66
China Merchants Bank Co Ltd - Class A 10,000 73,723 0.24
China Minsheng Banking Corp Ltd 245,800 92,590 0.30
China Minsheng Banking Corp Ltd - Class A 73,400 44,169 0.14
China National Building Material Co Ltd 60,000 74,623 0.24
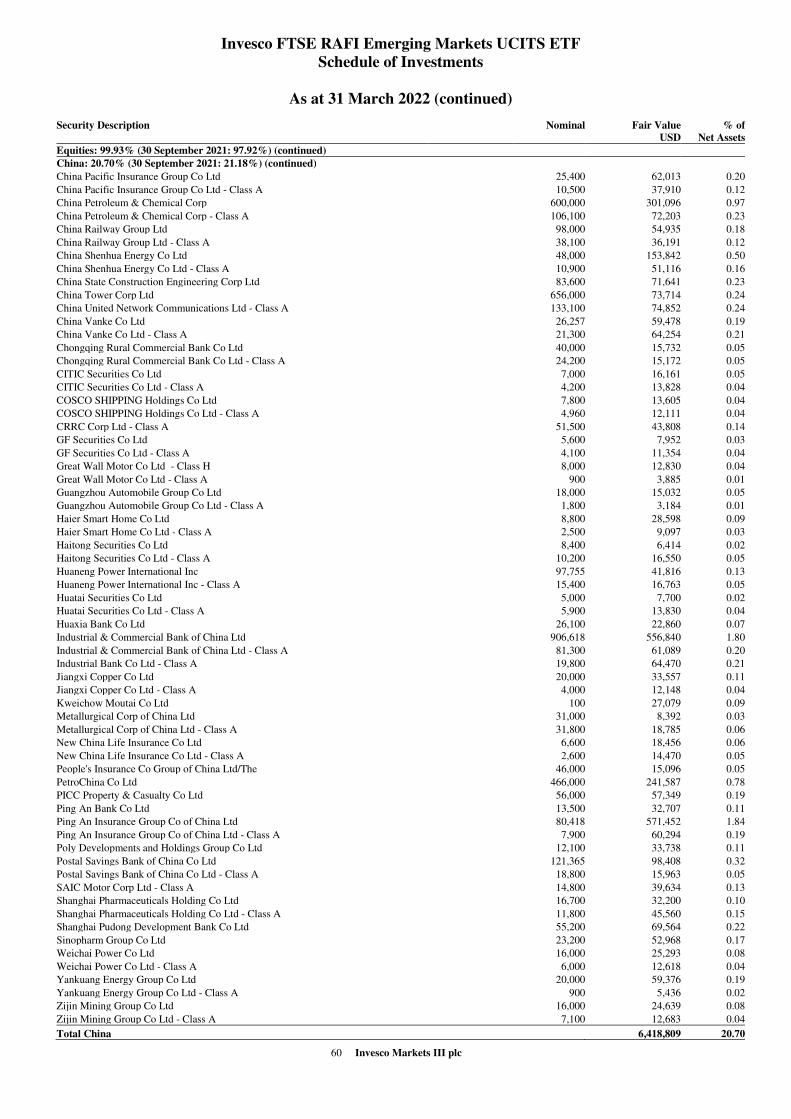
60 Invesco Markets III plc
Invesco FTSE RAFI Emerging Markets UCITS ETF
Schedule of Investments
As at 31 March 2022 (continued)
Security Description
Nominal Fair Value
USD
% of
Net Assets
Equities: 99.93% (30 September 2021: 97.92%) (continued)
China: 20.70% (30 September 2021: 21.18%) (continued)
China Pacific Insurance Group Co Ltd 25,400 62,013 0.20
China Pacific Insurance Group Co Ltd - Class A 10,500 37,910 0.12
China Petroleum & Chemical Corp 600,000 301,096 0.97
China Petroleum & Chemical Corp - Class A 106,100 72,203 0.23
China Railway Group Ltd 98,000 54,935 0.18
China Railway Group Ltd - Class A 38,100 36,191 0.12
China Shenhua Energy Co Ltd 48,000 153,842 0.50
China Shenhua Energy Co Ltd - Class A 10,900 51,116 0.16
China State Construction Engineering Corp Ltd 83,600 71,641 0.23
China Tower Corp Ltd 656,000 73,714 0.24
China United Network Communications Ltd - Class A 133,100 74,852 0.24
China Vanke Co Ltd 26,257 59,478 0.19
China Vanke Co Ltd - Class A 21,300 64,254 0.21
Chongqing Rural Commercial Bank Co Ltd 40,000 15,732 0.05
Chongqing Rural Commercial Bank Co Ltd - Class A 24,200 15,172 0.05
CITIC Securities Co Ltd 7,000 16,161 0.05
CITIC Securities Co Ltd - Class A 4,200 13,828 0.04
COSCO SHIPPING Holdings Co Ltd 7,800 13,605 0.04
COSCO SHIPPING Holdings Co Ltd - Class A 4,960 12,111 0.04
CRRC Corp Ltd - Class A 51,500 43,808 0.14
GF Securities Co Ltd 5,600 7,952 0.03
GF Securities Co Ltd - Class A 4,100 11,354 0.04
Great Wall Motor Co Ltd - Class H 8,000 12,830 0.04
Great Wall Motor Co Ltd - Class A 900 3,885 0.01
Guangzhou Automobile Group Co Ltd 18,000 15,032 0.05
Guangzhou Automobile Group Co Ltd - Class A 1,800 3,184 0.01
Haier Smart Home Co Ltd 8,800 28,598 0.09
Haier Smart Home Co Ltd - Class A 2,500 9,097 0.03
Haitong Securities Co Ltd 8,400 6,414 0.02
Haitong Securities Co Ltd - Class A 10,200 16,550 0.05
Huaneng Power International Inc 97,755 41,816 0.13
Huaneng Power International Inc - Class A 15,400 16,763 0.05
Huatai Securities Co Ltd 5,000 7,700 0.02
Huatai Securities Co Ltd - Class A 5,900 13,830 0.04
Huaxia Bank Co Ltd 26,100 22,860 0.07
Industrial & Commercial Bank of China Ltd 906,618 556,840 1.80
Industrial & Commercial Bank of China Ltd - Class A 81,300 61,089 0.20
Industrial Bank Co Ltd - Class A 19,800 64,470 0.21
Jiangxi Copper Co Ltd 20,000 33,557 0.11
Jiangxi Copper Co Ltd - Class A 4,000 12,148 0.04
Kweichow Moutai Co Ltd 100 27,079 0.09
Metallurgical Corp of China Ltd 31,000 8,392 0.03
Metallurgical Corp of China Ltd - Class A 31,800 18,785 0.06
New China Life Insurance Co Ltd 6,600 18,456 0.06
New China Life Insurance Co Ltd - Class A 2,600 14,470 0.05
People's Insurance Co Group of China Ltd/The 46,000 15,096 0.05
PetroChina Co Ltd 466,000 241,587 0.78
PICC Property & Casualty Co Ltd 56,000 57,349 0.19
Ping An Bank Co Ltd 13,500 32,707 0.11
Ping An Insurance Group Co of China Ltd 80,418 571,452 1.84
Ping An Insurance Group Co of China Ltd - Class A 7,900 60,294 0.19
Poly Developments and Holdings Group Co Ltd 12,100 33,738 0.11
Postal Savings Bank of China Co Ltd 121,365 98,408 0.32
Postal Savings Bank of China Co Ltd - Class A 18,800 15,963 0.05
SAIC Motor Corp Ltd - Class A 14,800 39,634 0.13
Shanghai Pharmaceuticals Holding Co Ltd 16,700 32,200 0.10
Shanghai Pharmaceuticals Holding Co Ltd - Class A 11,800 45,560 0.15
Shanghai Pudong Development Bank Co Ltd 55,200 69,564 0.22
Sinopharm Group Co Ltd 23,200 52,968 0.17
Weichai Power Co Ltd 16,000 25,293 0.08
Weichai Power Co Ltd - Class A 6,000 12,618 0.04
Yankuang Energy Group Co Ltd 20,000 59,376 0.19
Yankuang Energy Group Co Ltd - Class A 900 5,436 0.02
Zijin Mining Group Co Ltd 16,000 24,639 0.08
Zijin Mining Group Co Ltd - Class A 7,100 12,683 0.04
Total China 6,418,809 20.70
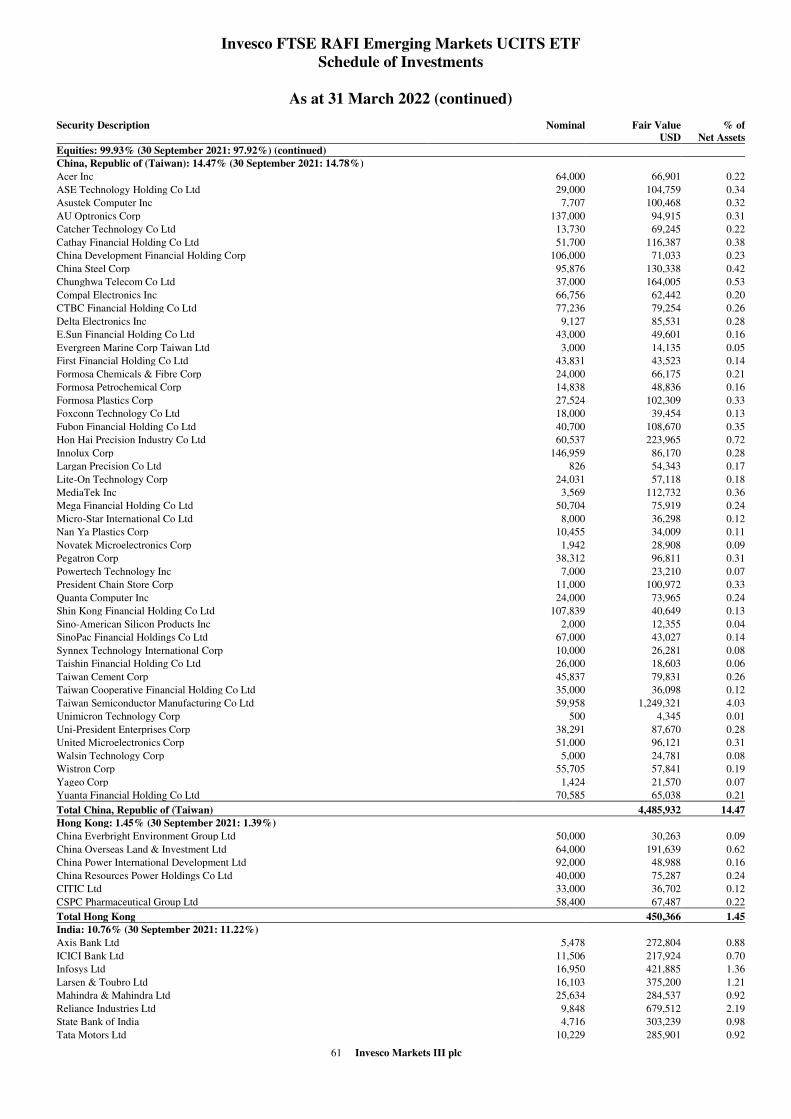
61 Invesco Markets III plc
Invesco FTSE RAFI Emerging Markets UCITS ETF
Schedule of Investments
As at 31 March 2022 (continued)
Security Description
Nominal Fair Value
USD
% of
Net Assets
Equities: 99.93% (30 September 2021: 97.92%) (continued)
China, Republic of (Taiwan): 14.47% (30 September 2021: 14.78%)
Acer Inc 64,000 66,901 0.22
ASE Technology Holding Co Ltd 29,000 104,759 0.34
Asustek Computer Inc 7,707 100,468 0.32
AU Optronics Corp 137,000 94,915 0.31
Catcher Technology Co Ltd 13,730 69,245 0.22
Cathay Financial Holding Co Ltd 51,700 116,387 0.38
China Development Financial Holding Corp 106,000 71,033 0.23
China Steel Corp 95,876 130,338 0.42
Chunghwa Telecom Co Ltd 37,000 164,005 0.53
Compal Electronics Inc 66,756 62,442 0.20
CTBC Financial Holding Co Ltd 77,236 79,254 0.26
Delta Electronics Inc 9,127 85,531 0.28
E.Sun Financial Holding Co Ltd 43,000 49,601 0.16
Evergreen Marine Corp Taiwan Ltd 3,000 14,135 0.05
First Financial Holding Co Ltd 43,831 43,523 0.14
Formosa Chemicals & Fibre Corp 24,000 66,175 0.21
Formosa Petrochemical Corp 14,838 48,836 0.16
Formosa Plastics Corp 27,524 102,309 0.33
Foxconn Technology Co Ltd 18,000 39,454 0.13
Fubon Financial Holding Co Ltd 40,700 108,670 0.35
Hon Hai Precision Industry Co Ltd 60,537 223,965 0.72
Innolux Corp 146,959 86,170 0.28
Largan Precision Co Ltd 826 54,343 0.17
Lite-On Technology Corp 24,031 57,118 0.18
MediaTek Inc 3,569 112,732 0.36
Mega Financial Holding Co Ltd 50,704 75,919 0.24
Micro-Star International Co Ltd 8,000 36,298 0.12
Nan Ya Plastics Corp 10,455 34,009 0.11
Novatek Microelectronics Corp 1,942 28,908 0.09
Pegatron Corp 38,312 96,811 0.31
Powertech Technology Inc 7,000 23,210 0.07
President Chain Store Corp 11,000 100,972 0.33
Quanta Computer Inc 24,000 73,965 0.24
Shin Kong Financial Holding Co Ltd 107,839 40,649 0.13
Sino-American Silicon Products Inc 2,000 12,355 0.04
SinoPac Financial Holdings Co Ltd 67,000 43,027 0.14
Synnex Technology International Corp 10,000 26,281 0.08
Taishin Financial Holding Co Ltd 26,000 18,603 0.06
Taiwan Cement Corp 45,837 79,831 0.26
Taiwan Cooperative Financial Holding Co Ltd 35,000 36,098 0.12
Taiwan Semiconductor Manufacturing Co Ltd 59,958 1,249,321 4.03
Unimicron Technology Corp 500 4,345 0.01
Uni-President Enterprises Corp 38,291 87,670 0.28
United Microelectronics Corp 51,000 96,121 0.31
Walsin Technology Corp 5,000 24,781 0.08
Wistron Corp 55,705 57,841 0.19
Yageo Corp 1,424 21,570 0.07
Yuanta Financial Holding Co Ltd 70,585 65,038 0.21
Total China, Republic of (Taiwan) 4,485,932 14.47
Hong Kong: 1.45% (30 September 2021: 1.39%)
China Everbright Environment Group Ltd 50,000 30,263 0.09
China Overseas Land & Investment Ltd 64,000 191,639 0.62
China Power International Development Ltd 92,000 48,988 0.16
China Resources Power Holdings Co Ltd 40,000 75,287 0.24
CITIC Ltd 33,000 36,702 0.12
CSPC Pharmaceutical Group Ltd 58,400 67,487 0.22
Total Hong Kong 450,366 1.45
India: 10.76% (30 September 2021: 11.22%)
Axis Bank Ltd 5,478 272,804 0.88
ICICI Bank Ltd 11,506 217,924 0.70
Infosys Ltd 16,950 421,885 1.36
Larsen & Toubro Ltd 16,103 375,200 1.21
Mahindra & Mahindra Ltd 25,634 284,537 0.92
Reliance Industries Ltd 9,848 679,512 2.19
State Bank of India 4,716 303,239 0.98
Tata Motors Ltd 10,229 285,901 0.92
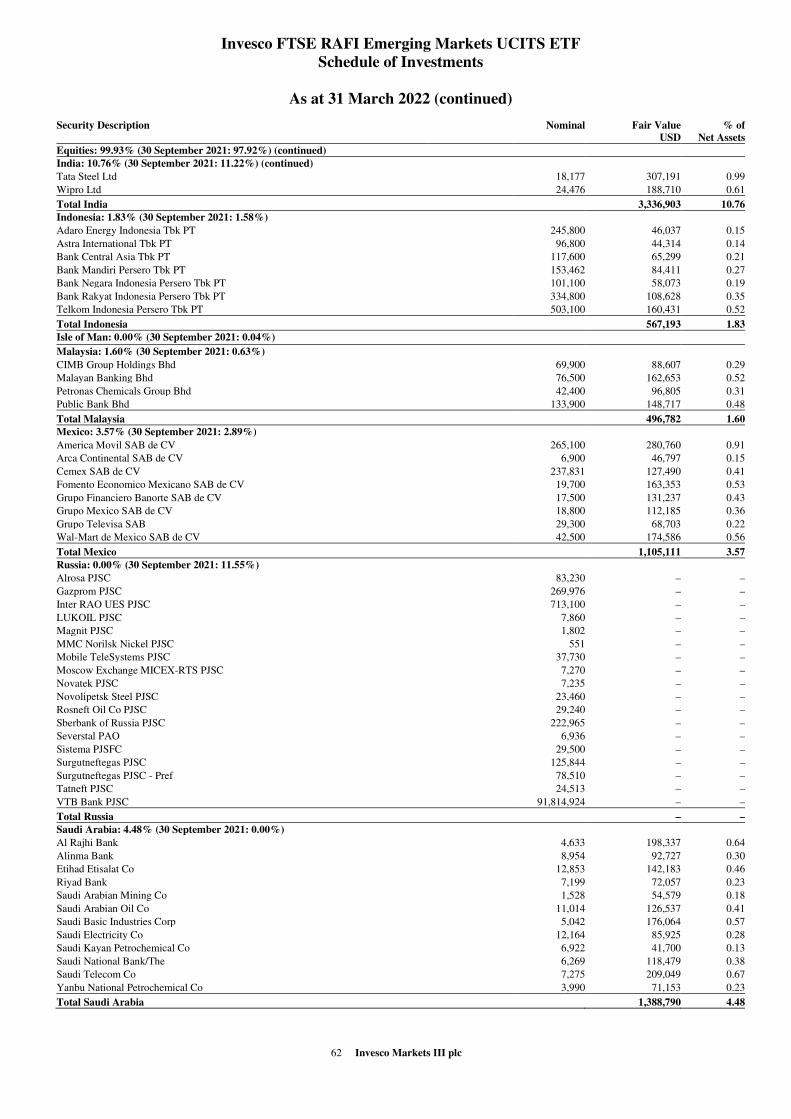
62 Invesco Markets III plc
Invesco FTSE RAFI Emerging Markets UCITS ETF
Schedule of Investments
As at 31 March 2022 (continued)
Security Description
Nominal Fair Value
USD
% of
Net Assets
Equities: 99.93% (30 September 2021: 97.92%) (continued)
India: 10.76% (30 September 2021: 11.22%) (continued)
Tata Steel Ltd 18,177 307,191 0.99
Wipro Ltd 24,476 188,710 0.61
Total India 3,336,903 10.76
Indonesia: 1.83% (30 September 2021: 1.58%)
Adaro Energy Indonesia Tbk PT 245,800 46,037 0.15
Astra International Tbk PT 96,800 44,314 0.14
Bank Central Asia Tbk PT 117,600 65,299 0.21
Bank Mandiri Persero Tbk PT 153,462 84,411 0.27
Bank Negara Indonesia Persero Tbk PT 101,100 58,073 0.19
Bank Rakyat Indonesia Persero Tbk PT 334,800 108,628 0.35
Telkom Indonesia Persero Tbk PT 503,100 160,431 0.52
Total Indonesia 567,193 1.83
Isle of Man: 0.00% (30 September 2021: 0.04%)
Malaysia: 1.60% (30 September 2021: 0.63%)
CIMB Group Holdings Bhd 69,900 88,607 0.29
Malayan Banking Bhd 76,500 162,653 0.52
Petronas Chemicals Group Bhd 42,400 96,805 0.31
Public Bank Bhd 133,900 148,717 0.48
Total Malaysia 496,782 1.60
Mexico: 3.57% (30 September 2021: 2.89%)
America Movil SAB de CV 265,100 280,760 0.91
Arca Continental SAB de CV 6,900 46,797 0.15
Cemex SAB de CV 237,831 127,490 0.41
Fomento Economico Mexicano SAB de CV 19,700 163,353 0.53
Grupo Financiero Banorte SAB de CV 17,500 131,237 0.43
Grupo Mexico SAB de CV 18,800 112,185 0.36
Grupo Televisa SAB 29,300 68,703 0.22
Wal-Mart de Mexico SAB de CV 42,500 174,586 0.56
Total Mexico 1,105,111 3.57
Russia: 0.00% (30 September 2021: 11.55%)
Alrosa PJSC 83,230 – –
Gazprom PJSC 269,976 – –
Inter RAO UES PJSC 713,100 – –
LUKOIL PJSC 7,860 – –
Magnit PJSC 1,802 – –
MMC Norilsk Nickel PJSC 551 – –
Mobile TeleSystems PJSC 37,730 – –
Moscow Exchange MICEX-RTS PJSC 7,270 – –
Novatek PJSC 7,235 – –
Novolipetsk Steel PJSC 23,460 – –
Rosneft Oil Co PJSC 29,240 – –
Sberbank of Russia PJSC 222,965 – –
Severstal PAO 6,936 – –
Sistema PJSFC 29,500 – –
Surgutneftegas PJSC 125,844 – –
Surgutneftegas PJSC - Pref 78,510 – –
Tatneft PJSC 24,513 – –
VTB Bank PJSC 91,814,924 – –
Total Russia – –
Saudi Arabia: 4.48% (30 September 2021: 0.00%)
Al Rajhi Bank 4,633 198,337 0.64
Alinma Bank 8,954 92,727 0.30
Etihad Etisalat Co 12,853 142,183 0.46
Riyad Bank 7,199 72,057 0.23
Saudi Arabian Mining Co 1,528 54,579 0.18
Saudi Arabian Oil Co 11,014 126,537 0.41
Saudi Basic Industries Corp 5,042 176,064 0.57
Saudi Electricity Co 12,164 85,925 0.28
Saudi Kayan Petrochemical Co 6,922 41,700 0.13
Saudi National Bank/The 6,269 118,479 0.38
Saudi Telecom Co 7,275 209,049 0.67
Yanbu National Petrochemical Co 3,990 71,153 0.23
Total Saudi Arabia 1,388,790 4.48
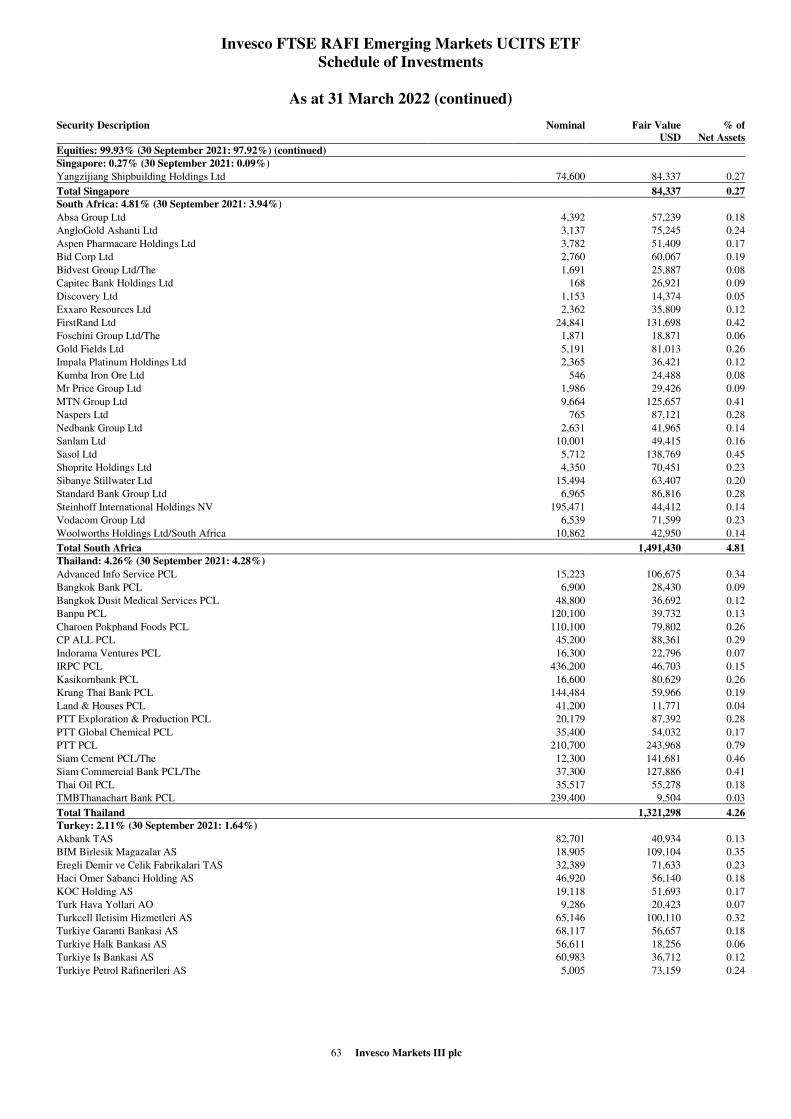
63 Invesco Markets III plc
Invesco FTSE RAFI Emerging Markets UCITS ETF
Schedule of Investments
As at 31 March 2022 (continued)
Security Description
Nominal Fair Value
USD
% of
Net Assets
Equities: 99.93% (30 September 2021: 97.92%) (continued)
Singapore: 0.27% (30 September 2021: 0.09%)
Yangzijiang Shipbuilding Holdings Ltd 74,600 84,337 0.27
Total Singapore 84,337 0.27
South Africa: 4.81% (30 September 2021: 3.94%)
Absa Group Ltd 4,392 57,239 0.18
AngloGold Ashanti Ltd 3,137 75,245 0.24
Aspen Pharmacare Holdings Ltd 3,782 51,409 0.17
Bid Corp Ltd 2,760 60,067 0.19
Bidvest Group Ltd/The 1,691 25,887 0.08
Capitec Bank Holdings Ltd 168 26,921 0.09
Discovery Ltd 1,153 14,374 0.05
Exxaro Resources Ltd 2,362 35,809 0.12
FirstRand Ltd 24,841 131,698 0.42
Foschini Group Ltd/The 1,871 18,871 0.06
Gold Fields Ltd 5,191 81,013 0.26
Impala Platinum Holdings Ltd 2,365 36,421 0.12
Kumba Iron Ore Ltd 546 24,488 0.08
Mr Price Group Ltd 1,986 29,426 0.09
MTN Group Ltd 9,664 125,657 0.41
Naspers Ltd 765 87,121 0.28
Nedbank Group Ltd 2,631 41,965 0.14
Sanlam Ltd 10,001 49,415 0.16
Sasol Ltd 5,712 138,769 0.45
Shoprite Holdings Ltd 4,350 70,451 0.23
Sibanye Stillwater Ltd 15,494 63,407 0.20
Standard Bank Group Ltd 6,965 86,816 0.28
Steinhoff International Holdings NV 195,471 44,412 0.14
Vodacom Group Ltd 6,539 71,599 0.23
Woolworths Holdings Ltd/South Africa 10,862 42,950 0.14
Total South Africa 1,491,430 4.81
Thailand: 4.26% (30 September 2021: 4.28%)
Advanced Info Service PCL 15,223 106,675 0.34
Bangkok Bank PCL 6,900 28,430 0.09
Bangkok Dusit Medical Services PCL 48,800 36,692 0.12
Banpu PCL 120,100 39,732 0.13
Charoen Pokphand Foods PCL 110,100 79,802 0.26
CP ALL PCL 45,200 88,361 0.29
Indorama Ventures PCL 16,300 22,796 0.07
IRPC PCL 436,200 46,703 0.15
Kasikornbank PCL 16,600 80,629 0.26
Krung Thai Bank PCL 144,484 59,966 0.19
Land & Houses PCL 41,200 11,771 0.04
PTT Exploration & Production PCL 20,179 87,392 0.28
PTT Global Chemical PCL 35,400 54,032 0.17
PTT PCL 210,700 243,968 0.79
Siam Cement PCL/The 12,300 141,681 0.46
Siam Commercial Bank PCL/The 37,300 127,886 0.41
Thai Oil PCL 35,517 55,278 0.18
TMBThanachart Bank PCL 239,400 9,504 0.03
Total Thailand 1,321,298 4.26
Turkey: 2.11% (30 September 2021: 1.64%)
Akbank TAS 82,701 40,934 0.13
BIM Birlesik Magazalar AS 18,905 109,104 0.35
Eregli Demir ve Celik Fabrikalari TAS 32,389 71,633 0.23
Haci Omer Sabanci Holding AS 46,920 56,140 0.18
KOC Holding AS 19,118 51,693 0.17
Turk Hava Yollari AO 9,286 20,423 0.07
Turkcell Iletisim Hizmetleri AS 65,146 100,110 0.32
Turkiye Garanti Bankasi AS 68,117 56,657 0.18
Turkiye Halk Bankasi AS 56,611 18,256 0.06
Turkiye Is Bankasi AS 60,983 36,712 0.12
Turkiye Petrol Rafinerileri AS 5,005 73,159 0.24
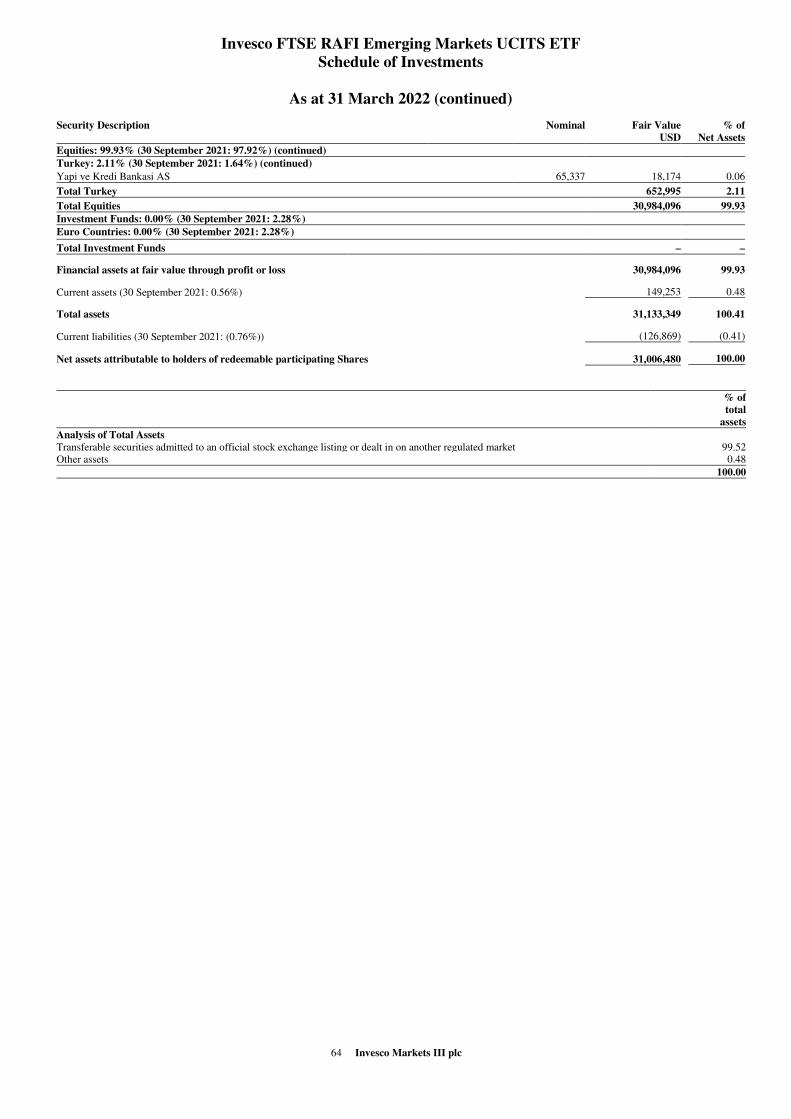
64 Invesco Markets III plc
Invesco FTSE RAFI Emerging Markets UCITS ETF
Schedule of Investments
As at 31 March 2022 (continued)
Security Description
Nominal Fair Value
USD
% of
Net Assets
Equities: 99.93% (30 September 2021: 97.92%) (continued)
Turkey: 2.11% (30 September 2021: 1.64%) (continued)
Yapi ve Kredi Bankasi AS 65,337 18,174 0.06
Total Turkey 652,995 2.11
Total Equities 30,984,096 99.93
Investment Funds: 0.00% (30 September 2021: 2.28%)
Euro Countries: 0.00% (30 September 2021: 2.28%)
Total Investment Funds – –
Financial assets at fair value through profit or loss 30,984,096 99.93
Current assets (30 September 2021: 0.56%) 149,253 0.48
Total assets 31,133,349 100.41
Current liabilities (30 September 2021: (0.76%)) (126,869) (0.41)
Net assets attributable to holders of redeemable participating Shares 31,006,480 100.00
% of
total
assets
Analysis of Total Assets
Transferable securities admitted to an official stock exchange listing or dealt in on another regulated market 99.52
Other assets 0.48
100.00
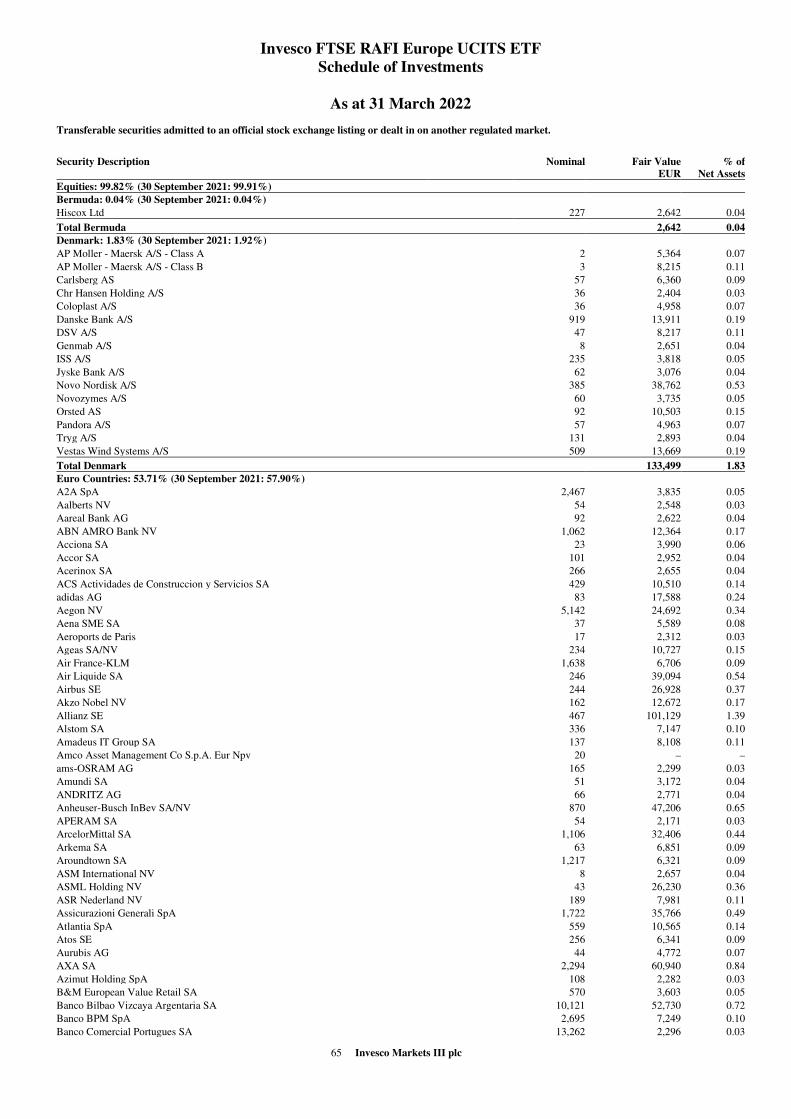
65 Invesco Markets III plc
Invesco FTSE RAFI Europe UCITS ETF
Schedule of Investments
As at 31 March 2022
Transferable securities admitted to an official stock exchange listing or dealt in on another regulated market.
Security Description
Nominal Fair Value
EUR
% of
Net Assets
Equities: 99.82% (30 September 2021: 99.91%)
Bermuda: 0.04% (30 September 2021: 0.04%)
Hiscox Ltd 227 2,642 0.04
Total Bermuda 2,642 0.04
Denmark: 1.83% (30 September 2021: 1.92%)
AP Moller - Maersk A/S - Class A 2 5,364 0.07
AP Moller - Maersk A/S - Class B 3 8,215 0.11
Carlsberg AS 57 6,360 0.09
Chr Hansen Holding A/S 36 2,404 0.03
Coloplast A/S 36 4,958 0.07
Danske Bank A/S 919 13,911 0.19
DSV A/S 47 8,217 0.11
Genmab A/S 8 2,651 0.04
ISS A/S 235 3,818 0.05
Jyske Bank A/S 62 3,076 0.04
Novo Nordisk A/S 385 38,762 0.53
Novozymes A/S 60 3,735 0.05
Orsted AS 92 10,503 0.15
Pandora A/S 57 4,963 0.07
Tryg A/S 131 2,893 0.04
Vestas Wind Systems A/S 509 13,669 0.19
Total Denmark 133,499 1.83
Euro Countries: 53.71% (30 September 2021: 57.90%)
A2A SpA 2,467 3,835 0.05
Aalberts NV 54 2,548 0.03
Aareal Bank AG 92 2,622 0.04
ABN AMRO Bank NV 1,062 12,364 0.17
Acciona SA 23 3,990 0.06
Accor SA 101 2,952 0.04
Acerinox SA 266 2,655 0.04
ACS Actividades de Construccion y Servicios SA 429 10,510 0.14
adidas AG 83 17,588 0.24
Aegon NV 5,142 24,692 0.34
Aena SME SA 37 5,589 0.08
Aeroports de Paris 17 2,312 0.03
Ageas SA/NV 234 10,727 0.15
Air France-KLM 1,638 6,706 0.09
Air Liquide SA 246 39,094 0.54
Airbus SE 244 26,928 0.37
Akzo Nobel NV 162 12,672 0.17
Allianz SE 467 101,129 1.39
Alstom SA 336 7,147 0.10
Amadeus IT Group SA 137 8,108 0.11
Amco Asset Management Co S.p.A. Eur Npv 20 – –
ams-OSRAM AG 165 2,299 0.03
Amundi SA 51 3,172 0.04
ANDRITZ AG 66 2,771 0.04
Anheuser-Busch InBev SA/NV 870 47,206 0.65
APERAM SA 54 2,171 0.03
ArcelorMittal SA 1,106 32,406 0.44
Arkema SA 63 6,851 0.09
Aroundtown SA 1,217 6,321 0.09
ASM International NV 8 2,657 0.04
ASML Holding NV 43 26,230 0.36
ASR Nederland NV 189 7,981 0.11
Assicurazioni Generali SpA 1,722 35,766 0.49
Atlantia SpA 559 10,565 0.14
Atos SE 256 6,341 0.09
Aurubis AG 44 4,772 0.07
AXA SA 2,294 60,940 0.84
Azimut Holding SpA 108 2,282 0.03
B&M European Value Retail SA 570 3,603 0.05
Banco Bilbao Vizcaya Argentaria SA 10,121 52,730 0.72
Banco BPM SpA 2,695 7,249 0.10
Banco Comercial Portugues SA 13,262 2,296 0.03
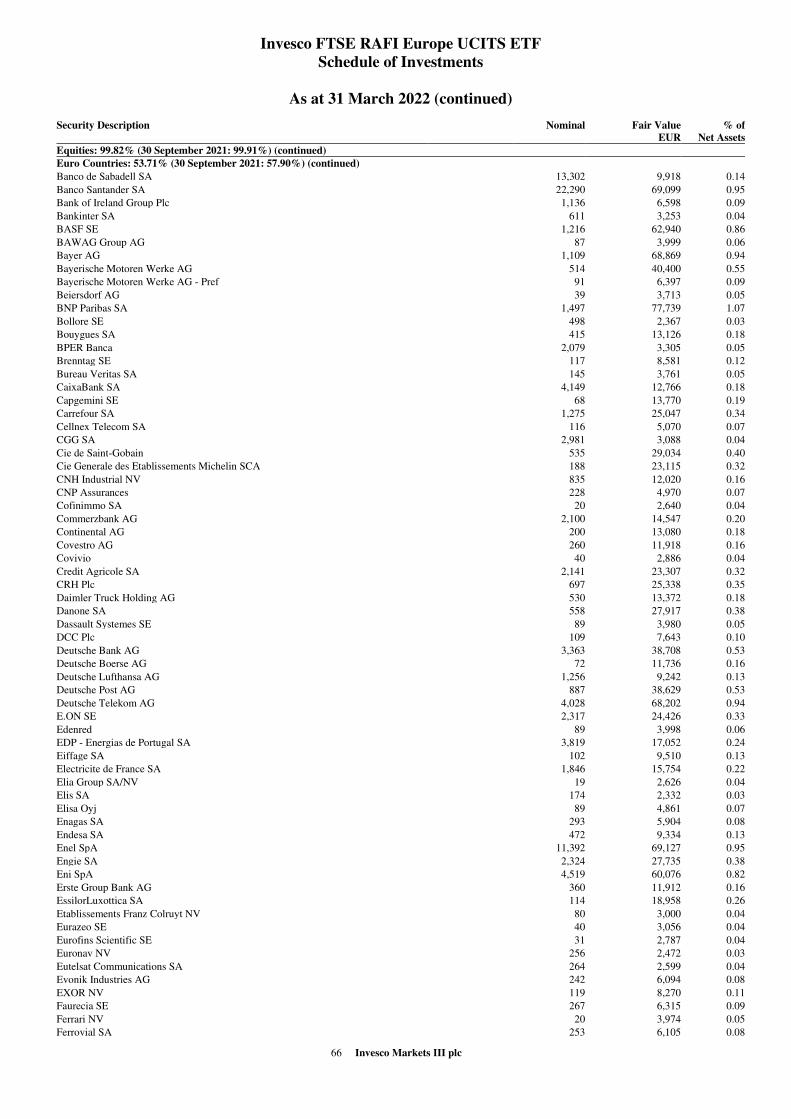
66 Invesco Markets III plc
Invesco FTSE RAFI Europe UCITS ETF
Schedule of Investments
As at 31 March 2022 (continued)
Security Description
Nominal Fair Value
EUR
% of
Net Assets
Equities: 99.82% (30 September 2021: 99.91%) (continued)
Euro Countries: 53.71% (30 September 2021: 57.90%) (continued)
Banco de Sabadell SA 13,302 9,918 0.14
Banco Santander SA 22,290 69,099 0.95
Bank of Ireland Group Plc 1,136 6,598 0.09
Bankinter SA 611 3,253 0.04
BASF SE 1,216 62,940 0.86
BAWAG Group AG 87 3,999 0.06
Bayer AG 1,109 68,869 0.94
Bayerische Motoren Werke AG 514 40,400 0.55
Bayerische Motoren Werke AG - Pref 91 6,397 0.09
Beiersdorf AG 39 3,713 0.05
BNP Paribas SA 1,497 77,739 1.07
Bollore SE 498 2,367 0.03
Bouygues SA 415 13,126 0.18
BPER Banca 2,079 3,305 0.05
Brenntag SE 117 8,581 0.12
Bureau Veritas SA 145 3,761 0.05
CaixaBank SA 4,149 12,766 0.18
Capgemini SE 68 13,770 0.19
Carrefour SA 1,275 25,047 0.34
Cellnex Telecom SA 116 5,070 0.07
CGG SA 2,981 3,088 0.04
Cie de Saint-Gobain 535 29,034 0.40
Cie Generale des Etablissements Michelin SCA 188 23,115 0.32
CNH Industrial NV 835 12,020 0.16
CNP Assurances 228 4,970 0.07
Cofinimmo SA 20 2,640 0.04
Commerzbank AG 2,100 14,547 0.20
Continental AG 200 13,080 0.18
Covestro AG 260 11,918 0.16
Covivio 40 2,886 0.04
Credit Agricole SA 2,141 23,307 0.32
CRH Plc 697 25,338 0.35
Daimler Truck Holding AG 530 13,372 0.18
Danone SA 558 27,917 0.38
Dassault Systemes SE 89 3,980 0.05
DCC Plc 109 7,643 0.10
Deutsche Bank AG 3,363 38,708 0.53
Deutsche Boerse AG 72 11,736 0.16
Deutsche Lufthansa AG 1,256 9,242 0.13
Deutsche Post AG 887 38,629 0.53
Deutsche Telekom AG 4,028 68,202 0.94
E.ON SE 2,317 24,426 0.33
Edenred 89 3,998 0.06
EDP - Energias de Portugal SA 3,819 17,052 0.24
Eiffage SA 102 9,510 0.13
Electricite de France SA 1,846 15,754 0.22
Elia Group SA/NV 19 2,626 0.04
Elis SA 174 2,332 0.03
Elisa Oyj 89 4,861 0.07
Enagas SA 293 5,904 0.08
Endesa SA 472 9,334 0.13
Enel SpA 11,392 69,127 0.95
Engie SA 2,324 27,735 0.38
Eni SpA 4,519 60,076 0.82
Erste Group Bank AG 360 11,912 0.16
EssilorLuxottica SA 114 18,958 0.26
Etablissements Franz Colruyt NV 80 3,000 0.04
Eurazeo SE 40 3,056 0.04
Eurofins Scientific SE 31 2,787 0.04
Euronav NV 256 2,472 0.03
Eutelsat Communications SA 264 2,599 0.04
Evonik Industries AG 242 6,094 0.08
EXOR NV 119 8,270 0.11
Faurecia SE 267 6,315 0.09
Ferrari NV 20 3,974 0.05
Ferrovial SA 253 6,105 0.08
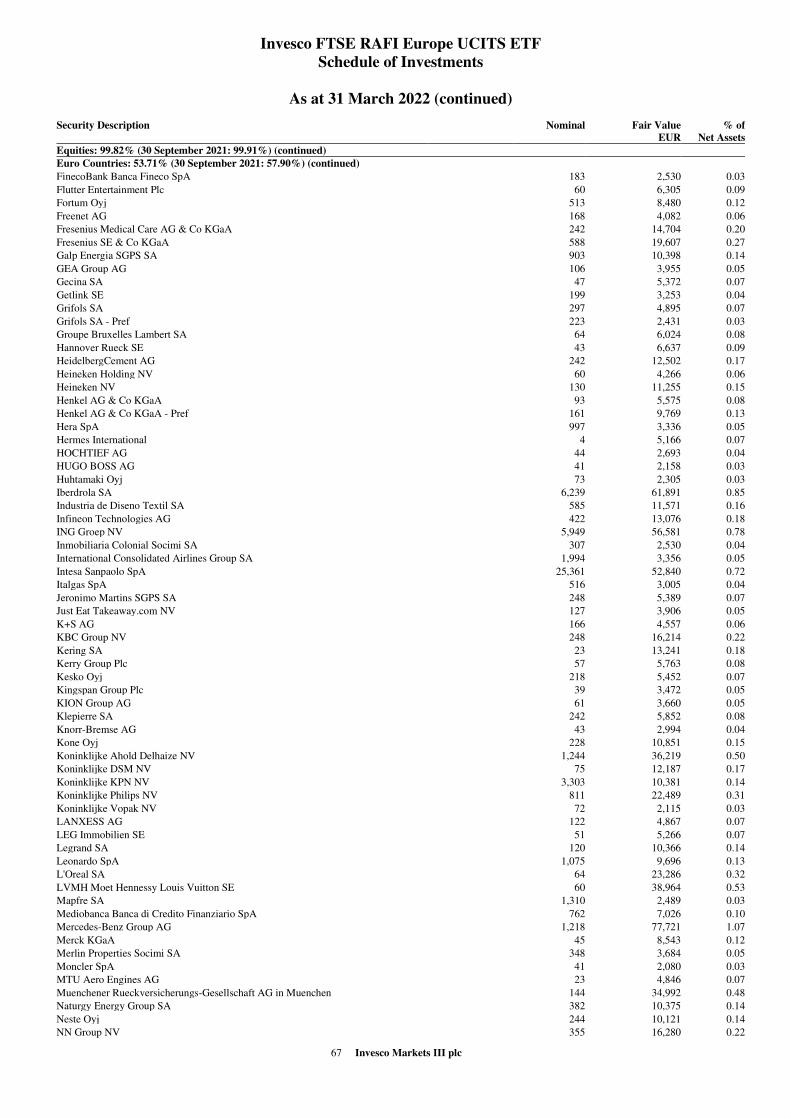
67 Invesco Markets III plc
Invesco FTSE RAFI Europe UCITS ETF
Schedule of Investments
As at 31 March 2022 (continued)
Security Description
Nominal Fair Value
EUR
% of
Net Assets
Equities: 99.82% (30 September 2021: 99.91%) (continued)
Euro Countries: 53.71% (30 September 2021: 57.90%) (continued)
FinecoBank Banca Fineco SpA 183 2,530 0.03
Flutter Entertainment Plc 60 6,305 0.09
Fortum Oyj 513 8,480 0.12
Freenet AG 168 4,082 0.06
Fresenius Medical Care AG & Co KGaA 242 14,704 0.20
Fresenius SE & Co KGaA 588 19,607 0.27
Galp Energia SGPS SA 903 10,398 0.14
GEA Group AG 106 3,955 0.05
Gecina SA 47 5,372 0.07
Getlink SE 199 3,253 0.04
Grifols SA 297 4,895 0.07
Grifols SA - Pref 223 2,431 0.03
Groupe Bruxelles Lambert SA 64 6,024 0.08
Hannover Rueck SE 43 6,637 0.09
HeidelbergCement AG 242 12,502 0.17
Heineken Holding NV 60 4,266 0.06
Heineken NV 130 11,255 0.15
Henkel AG & Co KGaA 93 5,575 0.08
Henkel AG & Co KGaA - Pref 161 9,769 0.13
Hera SpA 997 3,336 0.05
Hermes International 4 5,166 0.07
HOCHTIEF AG 44 2,693 0.04
HUGO BOSS AG 41 2,158 0.03
Huhtamaki Oyj 73 2,305 0.03
Iberdrola SA 6,239 61,891 0.85
Industria de Diseno Textil SA 585 11,571 0.16
Infineon Technologies AG 422 13,076 0.18
ING Groep NV 5,949 56,581 0.78
Inmobiliaria Colonial Socimi SA 307 2,530 0.04
International Consolidated Airlines Group SA 1,994 3,356 0.05
Intesa Sanpaolo SpA 25,361 52,840 0.72
Italgas SpA 516 3,005 0.04
Jeronimo Martins SGPS SA 248 5,389 0.07
Just Eat Takeaway.com NV 127 3,906 0.05
K+S AG 166 4,557 0.06
KBC Group NV 248 16,214 0.22
Kering SA 23 13,241 0.18
Kerry Group Plc 57 5,763 0.08
Kesko Oyj 218 5,452 0.07
Kingspan Group Plc 39 3,472 0.05
KION Group AG 61 3,660 0.05
Klepierre SA 242 5,852 0.08
Knorr-Bremse AG 43 2,994 0.04
Kone Oyj 228 10,851 0.15
Koninklijke Ahold Delhaize NV 1,244 36,219 0.50
Koninklijke DSM NV 75 12,187 0.17
Koninklijke KPN NV 3,303 10,381 0.14
Koninklijke Philips NV 811 22,489 0.31
Koninklijke Vopak NV 72 2,115 0.03
LANXESS AG 122 4,867 0.07
LEG Immobilien SE 51 5,266 0.07
Legrand SA 120 10,366 0.14
Leonardo SpA 1,075 9,696 0.13
L'Oreal SA 64 23,286 0.32
LVMH Moet Hennessy Louis Vuitton SE 60 38,964 0.53
Mapfre SA 1,310 2,489 0.03
Mediobanca Banca di Credito Finanziario SpA 762 7,026 0.10
Mercedes-Benz Group AG 1,218 77,721 1.07
Merck KGaA 45 8,543 0.12
Merlin Properties Socimi SA 348 3,684 0.05
Moncler SpA 41 2,080 0.03
MTU Aero Engines AG 23 4,846 0.07
Muenchener Rueckversicherungs-Gesellschaft AG in Muenchen 144 34,992 0.48
Naturgy Energy Group SA 382 10,375 0.14
Neste Oyj 244 10,121 0.14
NN Group NV 355 16,280 0.22
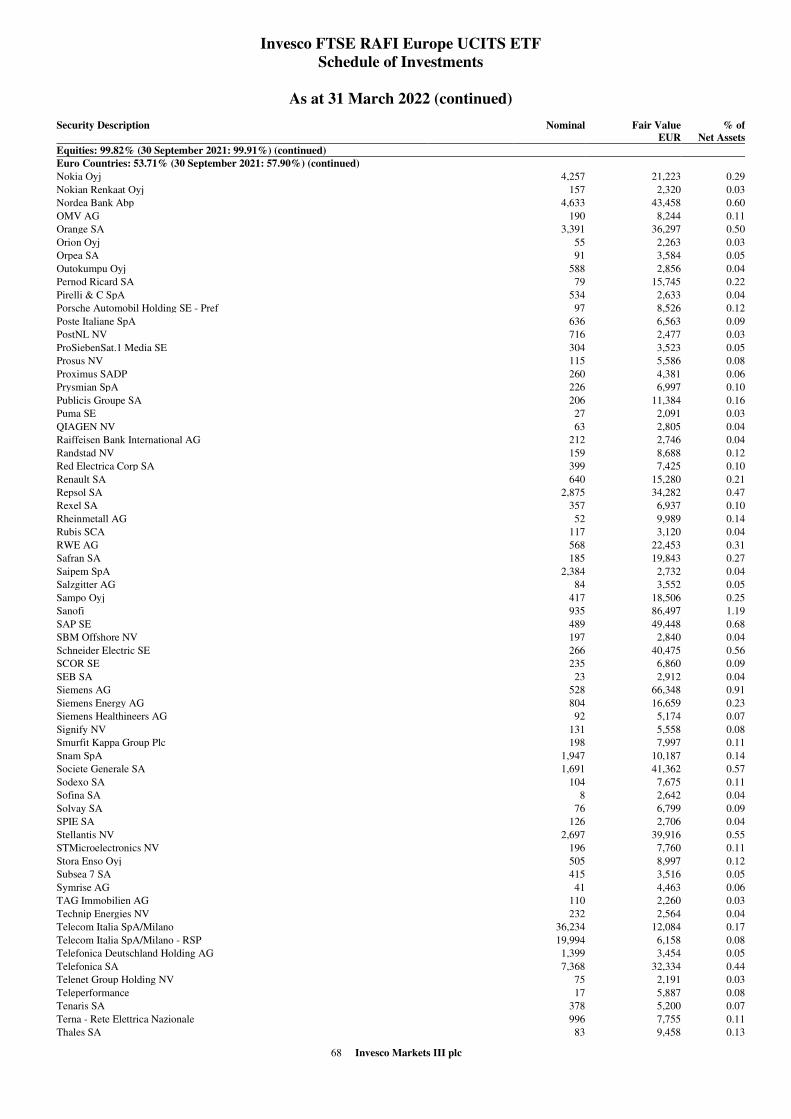
68 Invesco Markets III plc
Invesco FTSE RAFI Europe UCITS ETF
Schedule of Investments
As at 31 March 2022 (continued)
Security Description
Nominal Fair Value
EUR
% of
Net Assets
Equities: 99.82% (30 September 2021: 99.91%) (continued)
Euro Countries: 53.71% (30 September 2021: 57.90%) (continued)
Nokia Oyj 4,257 21,223 0.29
Nokian Renkaat Oyj 157 2,320 0.03
Nordea Bank Abp 4,633 43,458 0.60
OMV AG 190 8,244 0.11
Orange SA 3,391 36,297 0.50
Orion Oyj 55 2,263 0.03
Orpea SA 91 3,584 0.05
Outokumpu Oyj 588 2,856 0.04
Pernod Ricard SA 79 15,745 0.22
Pirelli & C SpA 534 2,633 0.04
Porsche Automobil Holding SE - Pref 97 8,526 0.12
Poste Italiane SpA 636 6,563 0.09
PostNL NV 716 2,477 0.03
ProSiebenSat.1 Media SE 304 3,523 0.05
Prosus NV 115 5,586 0.08
Proximus SADP 260 4,381 0.06
Prysmian SpA 226 6,997 0.10
Publicis Groupe SA 206 11,384 0.16
Puma SE 27 2,091 0.03
QIAGEN NV 63 2,805 0.04
Raiffeisen Bank International AG 212 2,746 0.04
Randstad NV 159 8,688 0.12
Red Electrica Corp SA 399 7,425 0.10
Renault SA 640 15,280 0.21
Repsol SA 2,875 34,282 0.47
Rexel SA 357 6,937 0.10
Rheinmetall AG 52 9,989 0.14
Rubis SCA 117 3,120 0.04
RWE AG 568 22,453 0.31
Safran SA 185 19,843 0.27
Saipem SpA 2,384 2,732 0.04
Salzgitter AG 84 3,552 0.05
Sampo Oyj 417 18,506 0.25
Sanofi 935 86,497 1.19
SAP SE 489 49,448 0.68
SBM Offshore NV 197 2,840 0.04
Schneider Electric SE 266 40,475 0.56
SCOR SE 235 6,860 0.09
SEB SA 23 2,912 0.04
Siemens AG 528 66,348 0.91
Siemens Energy AG 804 16,659 0.23
Siemens Healthineers AG 92 5,174 0.07
Signify NV 131 5,558 0.08
Smurfit Kappa Group Plc 198 7,997 0.11
Snam SpA 1,947 10,187 0.14
Societe Generale SA 1,691 41,362 0.57
Sodexo SA 104 7,675 0.11
Sofina SA 8 2,642 0.04
Solvay SA 76 6,799 0.09
SPIE SA 126 2,706 0.04
Stellantis NV 2,697 39,916 0.55
STMicroelectronics NV 196 7,760 0.11
Stora Enso Oyj 505 8,997 0.12
Subsea 7 SA 415 3,516 0.05
Symrise AG 41 4,463 0.06
TAG Immobilien AG 110 2,260 0.03
Technip Energies NV 232 2,564 0.04
Telecom Italia SpA/Milano 36,234 12,084 0.17
Telecom Italia SpA/Milano - RSP 19,994 6,158 0.08
Telefonica Deutschland Holding AG 1,399 3,454 0.05
Telefonica SA 7,368 32,334 0.44
Telenet Group Holding NV 75 2,191 0.03
Teleperformance 17 5,887 0.08
Tenaris SA 378 5,200 0.07
Terna - Rete Elettrica Nazionale 996 7,755 0.11
Thales SA 83 9,458 0.13

69 Invesco Markets III plc
Invesco FTSE RAFI Europe UCITS ETF
Schedule of Investments
As at 31 March 2022 (continued)
Security Description
Nominal Fair Value
EUR
% of
Net Assets
Equities: 99.82% (30 September 2021: 99.91%) (continued)
Euro Countries: 53.71% (30 September 2021: 57.90%) (continued)
thyssenkrupp AG 1,265 9,854 0.13
TotalEnergies SE 3,638 167,457 2.30
TUI AG 2,171 6,217 0.09
Ubisoft Entertainment SA 62 2,477 0.03
UCB SA 70 7,591 0.10
Umicore SA 199 7,833 0.11
Unibail-Rodamco-Westfield 179 12,204 0.17
UniCredit SpA 3,532 34,808 0.48
Uniper SE 110 2,574 0.04
Unipol Gruppo SpA 784 3,904 0.05
United Internet AG 99 3,087 0.04
Universal Music Group NV 132 3,194 0.04
UPM-Kymmene Oyj 447 13,258 0.18
Valeo 456 7,640 0.10
Valmet Oyj 91 2,567 0.04
Veolia Environnement SA 625 18,181 0.25
Vinci SA 430 39,986 0.55
Vivendi SE 335 3,966 0.05
voestalpine AG 115 3,107 0.04
Volkswagen AG 64 14,477 0.20
Volkswagen AG - Pref 362 56,834 0.78
Vonovia SE 474 20,055 0.27
Wartsila OYJ Abp 496 4,120 0.06
Wienerberger AG 86 2,356 0.03
Wolters Kluwer NV 90 8,692 0.12
Worldline SA/France 148 5,844 0.08
Zalando SE 65 2,990 0.04
Total Euro Countries 3,912,954 53.71
Isle of Man: 0.06% (30 September 2021: 0.07%)
Entain Plc 209 4,065 0.06
Total Isle of Man 4,065 0.06
Jersey: 1.77% (30 September 2021: 1.13%)
Experian Plc 264 9,219 0.13
Ferguson Plc 128 15,723 0.22
Glencore Plc 14,530 85,970 1.18
Man Group Plc/Jersey 1,144 3,168 0.04
WPP Plc 1,241 14,729 0.20
Total Jersey 128,809 1.77
Norway: 1.27% (30 September 2021: 1.46%)
Aker BP ASA 102 3,466 0.05
DNB Bank ASA 522 10,736 0.15
Equinor ASA 903 30,741 0.42
Gjensidige Forsikring ASA 124 2,787 0.04
Mowi ASA 369 9,027 0.12
Norsk Hydro ASA 1,090 9,646 0.13
Orkla ASA 528 4,253 0.06
Storebrand ASA 504 4,574 0.06
Telenor ASA 654 8,520 0.12
Yara International ASA 196 8,905 0.12
Total Norway 92,655 1.27
Poland: 0.30% (30 September 2021: 0.31%)
Bank Polska Kasa Opieki SA 180 4,383 0.06
KGHM Polska Miedz SA 116 4,325 0.06
Polski Koncern Naftowy ORLEN SA 265 4,345 0.06
Powszechna Kasa Oszczednosci Bank Polski SA 624 5,362 0.07
Powszechny Zaklad Ubezpieczen SA 491 3,584 0.05
Total Poland 21,999 0.30
Russia: 0.00% (30 September 2021: 0.00%)
Raspadskaya OJSC 243 – –
Total Russia – –
Sweden: 4.32% (30 September 2021: 4.19%)
Alfa Laval AB 151 4,737 0.07
Assa Abloy AB 381 9,366 0.13
Atlas Copco AB - Class A 218 10,337 0.14
Atlas Copco AB - Class B 128 5,302 0.07
BillerudKorsnas AB 205 2,763 0.04
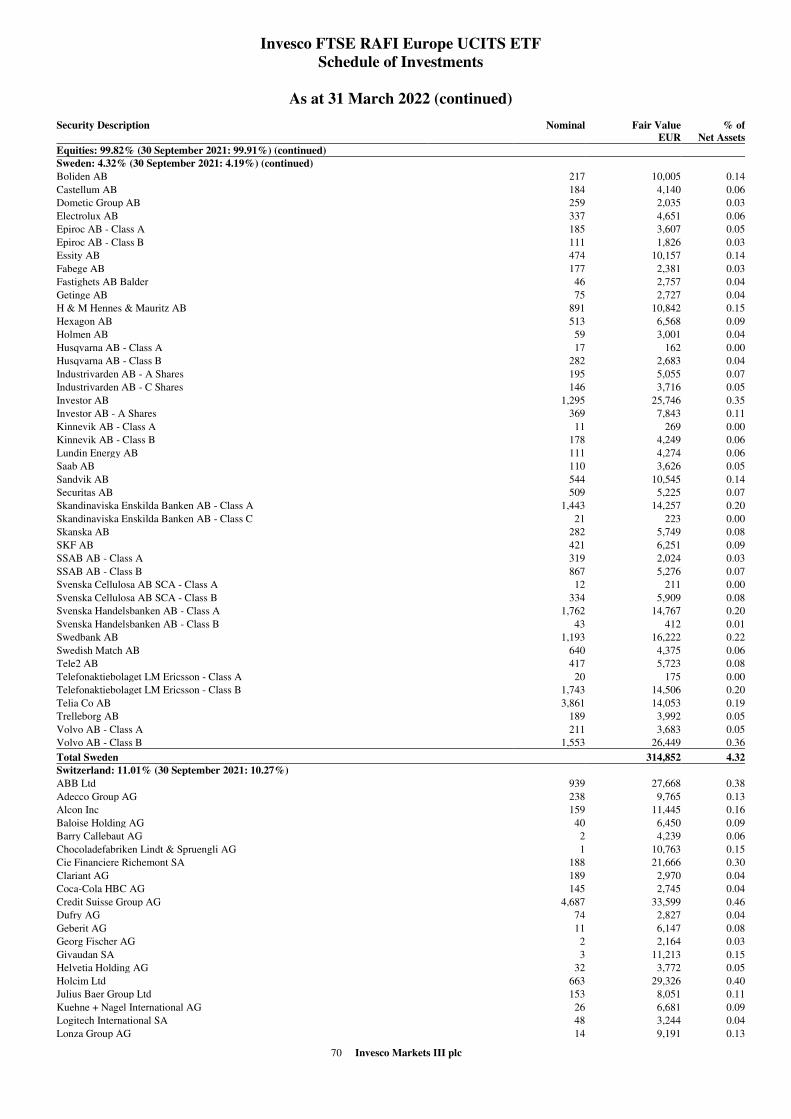
70 Invesco Markets III plc
Invesco FTSE RAFI Europe UCITS ETF
Schedule of Investments
As at 31 March 2022 (continued)
Security Description
Nominal Fair Value
EUR
% of
Net Assets
Equities: 99.82% (30 September 2021: 99.91%) (continued)
Sweden: 4.32% (30 September 2021: 4.19%) (continued)
Boliden AB 217 10,005 0.14
Castellum AB 184 4,140 0.06
Dometic Group AB 259 2,035 0.03
Electrolux AB 337 4,651 0.06
Epiroc AB - Class A 185 3,607 0.05
Epiroc AB - Class B 111 1,826 0.03
Essity AB 474 10,157 0.14
Fabege AB 177 2,381 0.03
Fastighets AB Balder 46 2,757 0.04
Getinge AB 75 2,727 0.04
H & M Hennes & Mauritz AB 891 10,842 0.15
Hexagon AB 513 6,568 0.09
Holmen AB 59 3,001 0.04
Husqvarna AB - Class A 17 162 0.00
Husqvarna AB - Class B 282 2,683 0.04
Industrivarden AB - A Shares 195 5,055 0.07
Industrivarden AB - C Shares 146 3,716 0.05
Investor AB 1,295 25,746 0.35
Investor AB - A Shares 369 7,843 0.11
Kinnevik AB - Class A 11 269 0.00
Kinnevik AB - Class B 178 4,249 0.06
Lundin Energy AB 111 4,274 0.06
Saab AB 110 3,626 0.05
Sandvik AB 544 10,545 0.14
Securitas AB 509 5,225 0.07
Skandinaviska Enskilda Banken AB - Class A 1,443 14,257 0.20
Skandinaviska Enskilda Banken AB - Class C 21 223 0.00
Skanska AB 282 5,749 0.08
SKF AB 421 6,251 0.09
SSAB AB - Class A 319 2,024 0.03
SSAB AB - Class B 867 5,276 0.07
Svenska Cellulosa AB SCA - Class A 12 211 0.00
Svenska Cellulosa AB SCA - Class B 334 5,909 0.08
Svenska Handelsbanken AB - Class A 1,762 14,767 0.20
Svenska Handelsbanken AB - Class B 43 412 0.01
Swedbank AB 1,193 16,222 0.22
Swedish Match AB 640 4,375 0.06
Tele2 AB 417 5,723 0.08
Telefonaktiebolaget LM Ericsson - Class A 20 175 0.00
Telefonaktiebolaget LM Ericsson - Class B 1,743 14,506 0.20
Telia Co AB 3,861 14,053 0.19
Trelleborg AB 189 3,992 0.05
Volvo AB - Class A 211 3,683 0.05
Volvo AB - Class B 1,553 26,449 0.36
Total Sweden 314,852 4.32
Switzerland: 11.01% (30 September 2021: 10.27%)
ABB Ltd 939 27,668 0.38
Adecco Group AG 238 9,765 0.13
Alcon Inc 159 11,445 0.16
Baloise Holding AG 40 6,450 0.09
Barry Callebaut AG 2 4,239 0.06
Chocoladefabriken Lindt & Spruengli AG 1 10,763 0.15
Cie Financiere Richemont SA 188 21,666 0.30
Clariant AG 189 2,970 0.04
Coca-Cola HBC AG 145 2,745 0.04
Credit Suisse Group AG 4,687 33,599 0.46
Dufry AG 74 2,827 0.04
Geberit AG 11 6,147 0.08
Georg Fischer AG 2 2,164 0.03
Givaudan SA 3 11,213 0.15
Helvetia Holding AG 32 3,772 0.05
Holcim Ltd 663 29,326 0.40
Julius Baer Group Ltd 153 8,051 0.11
Kuehne + Nagel International AG 26 6,681 0.09
Logitech International SA 48 3,244 0.04
Lonza Group AG 14 9,191 0.13
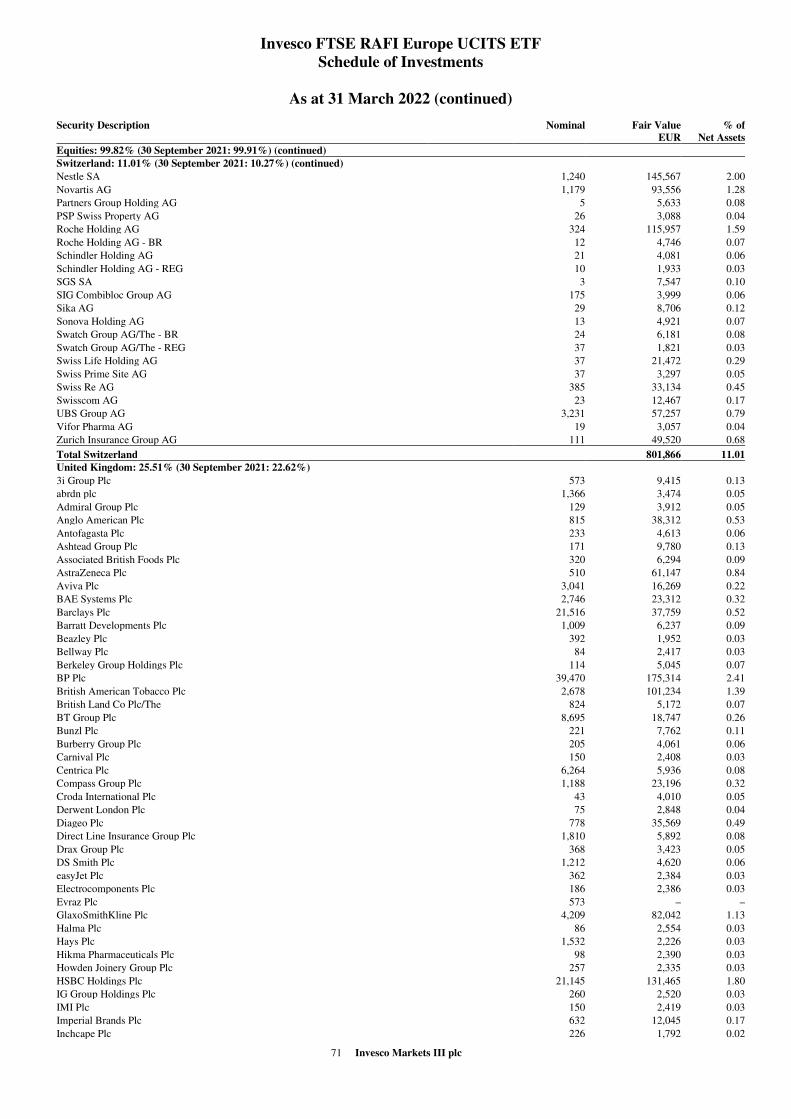
71 Invesco Markets III plc
Invesco FTSE RAFI Europe UCITS ETF
Schedule of Investments
As at 31 March 2022 (continued)
Security Description
Nominal Fair Value
EUR
% of
Net Assets
Equities: 99.82% (30 September 2021: 99.91%) (continued)
Switzerland: 11.01% (30 September 2021: 10.27%) (continued)
Nestle SA 1,240 145,567 2.00
Novartis AG 1,179 93,556 1.28
Partners Group Holding AG 5 5,633 0.08
PSP Swiss Property AG 26 3,088 0.04
Roche Holding AG 324 115,957 1.59
Roche Holding AG - BR 12 4,746 0.07
Schindler Holding AG 21 4,081 0.06
Schindler Holding AG - REG 10 1,933 0.03
SGS SA 3 7,547 0.10
SIG Combibloc Group AG 175 3,999 0.06
Sika AG 29 8,706 0.12
Sonova Holding AG 13 4,921 0.07
Swatch Group AG/The - BR 24 6,181 0.08
Swatch Group AG/The - REG 37 1,821 0.03
Swiss Life Holding AG 37 21,472 0.29
Swiss Prime Site AG 37 3,297 0.05
Swiss Re AG 385 33,134 0.45
Swisscom AG 23 12,467 0.17
UBS Group AG 3,231 57,257 0.79
Vifor Pharma AG 19 3,057 0.04
Zurich Insurance Group AG 111 49,520 0.68
Total Switzerland 801,866 11.01
United Kingdom: 25.51% (30 September 2021: 22.62%)
3i Group Plc 573 9,415 0.13
abrdn plc 1,366 3,474 0.05
Admiral Group Plc 129 3,912 0.05
Anglo American Plc 815 38,312 0.53
Antofagasta Plc 233 4,613 0.06
Ashtead Group Plc 171 9,780 0.13
Associated British Foods Plc 320 6,294 0.09
AstraZeneca Plc 510 61,147 0.84
Aviva Plc 3,041 16,269 0.22
BAE Systems Plc 2,746 23,312 0.32
Barclays Plc 21,516 37,759 0.52
Barratt Developments Plc 1,009 6,237 0.09
Beazley Plc 392 1,952 0.03
Bellway Plc 84 2,417 0.03
Berkeley Group Holdings Plc 114 5,045 0.07
BP Plc 39,470 175,314 2.41
British American Tobacco Plc 2,678 101,234 1.39
British Land Co Plc/The 824 5,172 0.07
BT Group Plc 8,695 18,747 0.26
Bunzl Plc 221 7,762 0.11
Burberry Group Plc 205 4,061 0.06
Carnival Plc 150 2,408 0.03
Centrica Plc 6,264 5,936 0.08
Compass Group Plc 1,188 23,196 0.32
Croda International Plc 43 4,010 0.05
Derwent London Plc 75 2,848 0.04
Diageo Plc 778 35,569 0.49
Direct Line Insurance Group Plc 1,810 5,892 0.08
Drax Group Plc 368 3,423 0.05
DS Smith Plc 1,212 4,620 0.06
easyJet Plc 362 2,384 0.03
Electrocomponents Plc 186 2,386 0.03
Evraz Plc 573 – –
GlaxoSmithKline Plc 4,209 82,042 1.13
Halma Plc 86 2,554 0.03
Hays Plc 1,532 2,226 0.03
Hikma Pharmaceuticals Plc 98 2,390 0.03
Howden Joinery Group Plc 257 2,335 0.03
HSBC Holdings Plc 21,145 131,465 1.80
IG Group Holdings Plc 260 2,520 0.03
IMI Plc 150 2,419 0.03
Imperial Brands Plc 632 12,045 0.17
Inchcape Plc 226 1,792 0.02
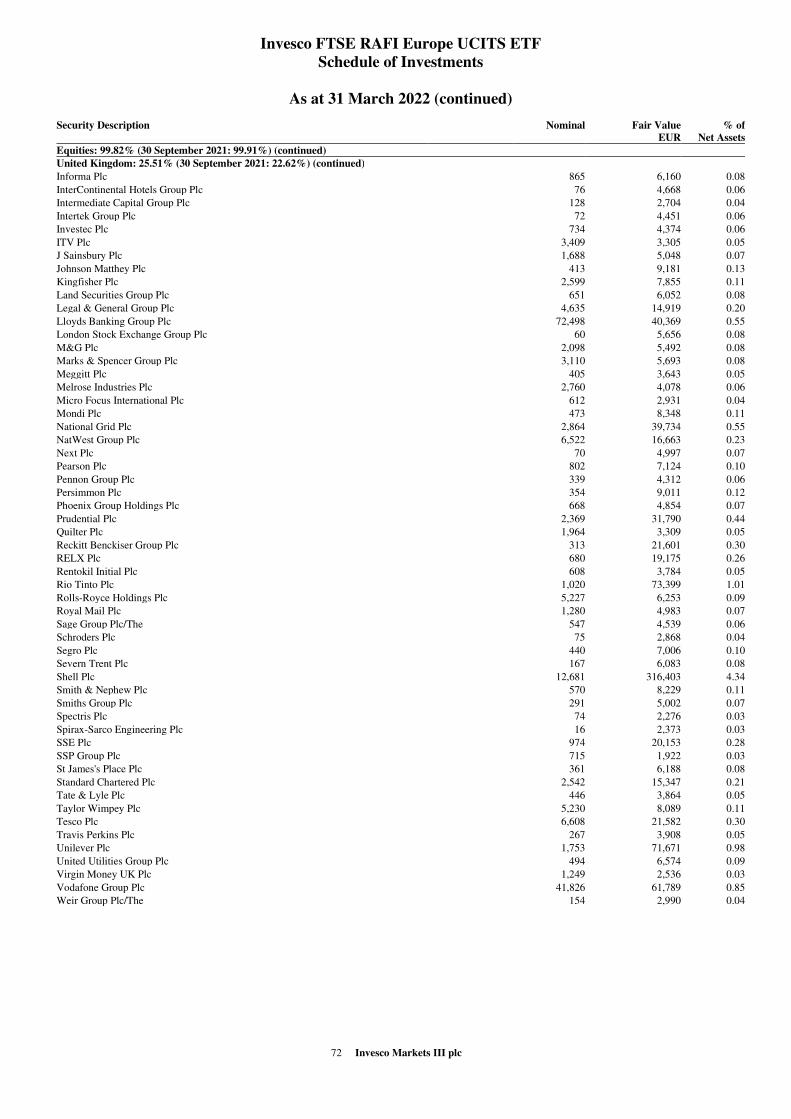
72 Invesco Markets III plc
Invesco FTSE RAFI Europe UCITS ETF
Schedule of Investments
As at 31 March 2022 (continued)
Security Description
Nominal Fair Value
EUR
% of
Net Assets
Equities: 99.82% (30 September 2021: 99.91%) (continued)
United Kingdom: 25.51% (30 September 2021: 22.62%) (continued)
Informa Plc 865 6,160 0.08
InterContinental Hotels Group Plc 76 4,668 0.06
Intermediate Capital Group Plc 128 2,704 0.04
Intertek Group Plc 72 4,451 0.06
Investec Plc 734 4,374 0.06
ITV Plc 3,409 3,305 0.05
J Sainsbury Plc 1,688 5,048 0.07
Johnson Matthey Plc 413 9,181 0.13
Kingfisher Plc 2,599 7,855 0.11
Land Securities Group Plc 651 6,052 0.08
Legal & General Group Plc 4,635 14,919 0.20
Lloyds Banking Group Plc 72,498 40,369 0.55
London Stock Exchange Group Plc 60 5,656 0.08
M&G Plc 2,098 5,492 0.08
Marks & Spencer Group Plc 3,110 5,693 0.08
Meggitt Plc 405 3,643 0.05
Melrose Industries Plc 2,760 4,078 0.06
Micro Focus International Plc 612 2,931 0.04
Mondi Plc 473 8,348 0.11
National Grid Plc 2,864 39,734 0.55
NatWest Group Plc 6,522 16,663 0.23
Next Plc 70 4,997 0.07
Pearson Plc 802 7,124 0.10
Pennon Group Plc 339 4,312 0.06
Persimmon Plc 354 9,011 0.12
Phoenix Group Holdings Plc 668 4,854 0.07
Prudential Plc 2,369 31,790 0.44
Quilter Plc 1,964 3,309 0.05
Reckitt Benckiser Group Plc 313 21,601 0.30
RELX Plc 680 19,175 0.26
Rentokil Initial Plc 608 3,784 0.05
Rio Tinto Plc 1,020 73,399 1.01
Rolls-Royce Holdings Plc 5,227 6,253 0.09
Royal Mail Plc 1,280 4,983 0.07
Sage Group Plc/The 547 4,539 0.06
Schroders Plc 75 2,868 0.04
Segro Plc 440 7,006 0.10
Severn Trent Plc 167 6,083 0.08
Shell Plc 12,681 316,403 4.34
Smith & Nephew Plc 570 8,229 0.11
Smiths Group Plc 291 5,002 0.07
Spectris Plc 74 2,276 0.03
Spirax-Sarco Engineering Plc 16 2,373 0.03
SSE Plc 974 20,153 0.28
SSP Group Plc 715 1,922 0.03
St James's Place Plc 361 6,188 0.08
Standard Chartered Plc 2,542 15,347 0.21
Tate & Lyle Plc 446 3,864 0.05
Taylor Wimpey Plc 5,230 8,089 0.11
Tesco Plc 6,608 21,582 0.30
Travis Perkins Plc 267 3,908 0.05
Unilever Plc 1,753 71,671 0.98
United Utilities Group Plc 494 6,574 0.09
Virgin Money UK Plc 1,249 2,536 0.03
Vodafone Group Plc 41,826 61,789 0.85
Weir Group Plc/The 154 2,990 0.04
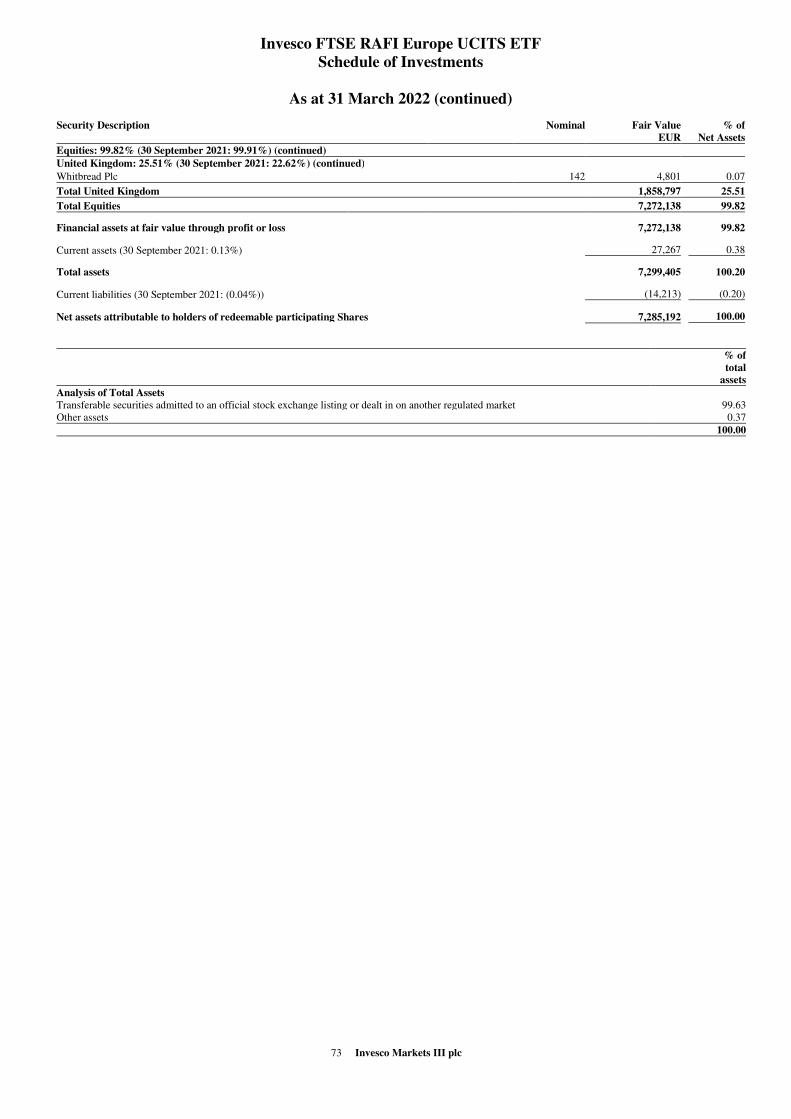
73 Invesco Markets III plc
Invesco FTSE RAFI Europe UCITS ETF
Schedule of Investments
As at 31 March 2022 (continued)
Security Description
Nominal Fair Value
EUR
% of
Net Assets
Equities: 99.82% (30 September 2021: 99.91%) (continued)
United Kingdom: 25.51% (30 September 2021: 22.62%) (continued)
Whitbread Plc 142 4,801 0.07
Total United Kingdom 1,858,797 25.51
Total Equities 7,272,138 99.82
Financial assets at fair value through profit or loss 7,272,138 99.82
Current assets (30 September 2021: 0.13%) 27,267 0.38
Total assets 7,299,405 100.20
Current liabilities (30 September 2021: (0.04%)) (14,213) (0.20)
Net assets attributable to holders of redeemable participating Shares 7,285,192 100.00
% of
total
assets
Analysis of Total Assets
Transferable securities admitted to an official stock exchange listing or dealt in on another regulated market 99.63
Other assets 0.37
100.00
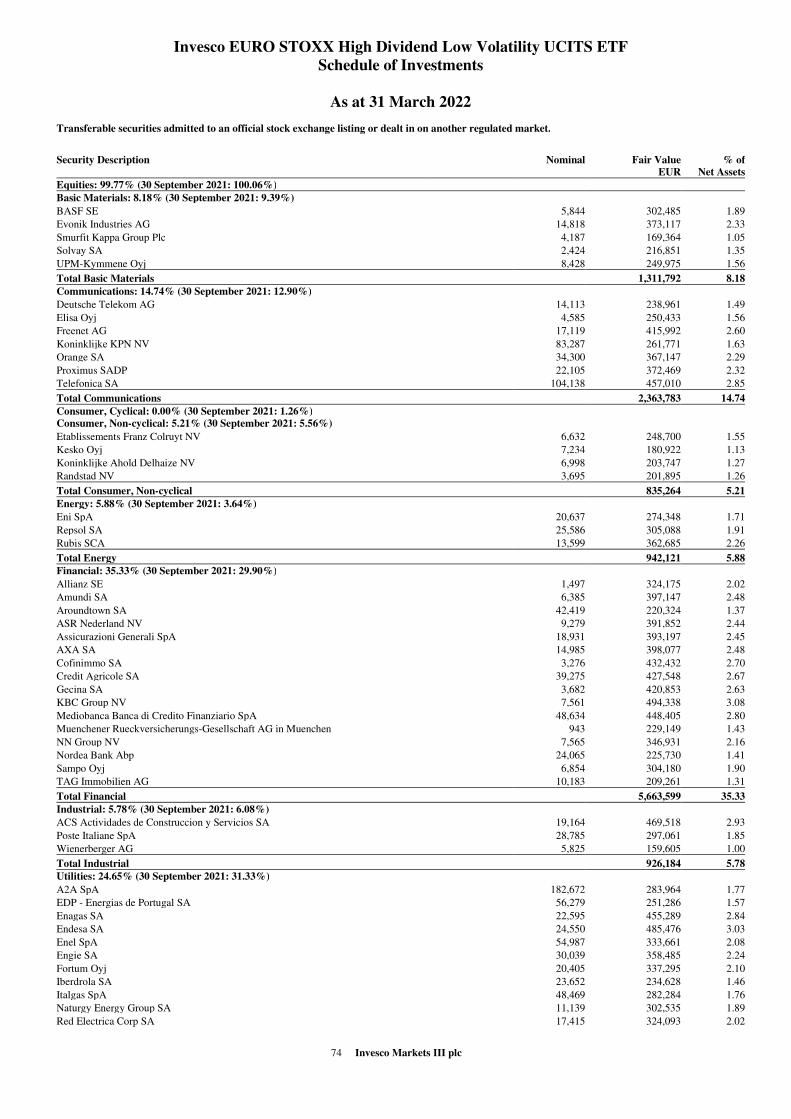
74 Invesco Markets III plc
Invesco EURO STOXX High Dividend Low Volatility UCITS ETF
Schedule of Investments
As at 31 March 2022
Transferable securities admitted to an official stock exchange listing or dealt in on another regulated market.
Security Description
Nominal Fair Value
EUR
% of
Net Assets
Equities: 99.77% (30 September 2021: 100.06%)
Basic Materials: 8.18% (30 September 2021: 9.39%)
BASF SE 5,844 302,485 1.89
Evonik Industries AG 14,818 373,117 2.33
Smurfit Kappa Group Plc 4,187 169,364 1.05
Solvay SA 2,424 216,851 1.35
UPM-Kymmene Oyj 8,428 249,975 1.56
Total Basic Materials 1,311,792 8.18
Communications: 14.74% (30 September 2021: 12.90%)
Deutsche Telekom AG 14,113 238,961 1.49
Elisa Oyj 4,585 250,433 1.56
Freenet AG 17,119 415,992 2.60
Koninklijke KPN NV 83,287 261,771 1.63
Orange SA 34,300 367,147 2.29
Proximus SADP 22,105 372,469 2.32
Telefonica SA 104,138 457,010 2.85
Total Communications 2,363,783 14.74
Consumer, Cyclical: 0.00% (30 September 2021: 1.26%)
Consumer, Non-cyclical: 5.21% (30 September 2021: 5.56%)
Etablissements Franz Colruyt NV 6,632 248,700 1.55
Kesko Oyj 7,234 180,922 1.13
Koninklijke Ahold Delhaize NV 6,998 203,747 1.27
Randstad NV 3,695 201,895 1.26
Total Consumer, Non-cyclical 835,264 5.21
Energy: 5.88% (30 September 2021: 3.64%)
Eni SpA 20,637 274,348 1.71
Repsol SA 25,586 305,088 1.91
Rubis SCA 13,599 362,685 2.26
Total Energy 942,121 5.88
Financial: 35.33% (30 September 2021: 29.90%)
Allianz SE 1,497 324,175 2.02
Amundi SA 6,385 397,147 2.48
Aroundtown SA 42,419 220,324 1.37
ASR Nederland NV 9,279 391,852 2.44
Assicurazioni Generali SpA 18,931 393,197 2.45
AXA SA 14,985 398,077 2.48
Cofinimmo SA 3,276 432,432 2.70
Credit Agricole SA 39,275 427,548 2.67
Gecina SA 3,682 420,853 2.63
KBC Group NV 7,561 494,338 3.08
Mediobanca Banca di Credito Finanziario SpA 48,634 448,405 2.80
Muenchener Rueckversicherungs-Gesellschaft AG in Muenchen 943 229,149 1.43
NN Group NV 7,565 346,931 2.16
Nordea Bank Abp 24,065 225,730 1.41
Sampo Oyj 6,854 304,180 1.90
TAG Immobilien AG 10,183 209,261 1.31
Total Financial 5,663,599 35.33
Industrial: 5.78% (30 September 2021: 6.08%)
ACS Actividades de Construccion y Servicios SA 19,164 469,518 2.93
Poste Italiane SpA 28,785 297,061 1.85
Wienerberger AG 5,825 159,605 1.00
Total Industrial 926,184 5.78
Utilities: 24.65% (30 September 2021: 31.33%)
A2A SpA 182,672 283,964 1.77
EDP - Energias de Portugal SA 56,279 251,286 1.57
Enagas SA 22,595 455,289 2.84
Endesa SA 24,550 485,476 3.03
Enel SpA 54,987 333,661 2.08
Engie SA 30,039 358,485 2.24
Fortum Oyj 20,405 337,295 2.10
Iberdrola SA 23,652 234,628 1.46
Italgas SpA 48,469 282,284 1.76
Naturgy Energy Group SA 11,139 302,535 1.89
Red Electrica Corp SA 17,415 324,093 2.02

75 Invesco Markets III plc
Invesco EURO STOXX High Dividend Low Volatility UCITS ETF
Schedule of Investments
As at 31 March 2022 (continued)
Security Description
Nominal Fair Value
EUR
% of
Net Assets
Equities: 99.77% (30 September 2021: 100.06%) (continued)
Utilities: 24.65% (30 September 2021: 31.33%) (continued)
Snam SpA 58,075 303,848 1.89
Total Utilities 3,952,844 24.65
Total Equities 15,995,587 99.77
Financial assets at fair value through profit or loss 15,995,587 99.77
Current assets (30 September 2021: 0.06%) 45,277 0.28
Total assets 16,040,864 100.05
Current liabilities (30 September 2021: (0.12%)) (8,541) (0.05)
Net assets attributable to holders of redeemable participating Shares 16,032,323 100.00
% of
total
assets
Analysis of Total Assets
Transferable securities admitted to an official stock exchange listing or dealt in on another regulated market 99.72
Other assets 0.28
100.00
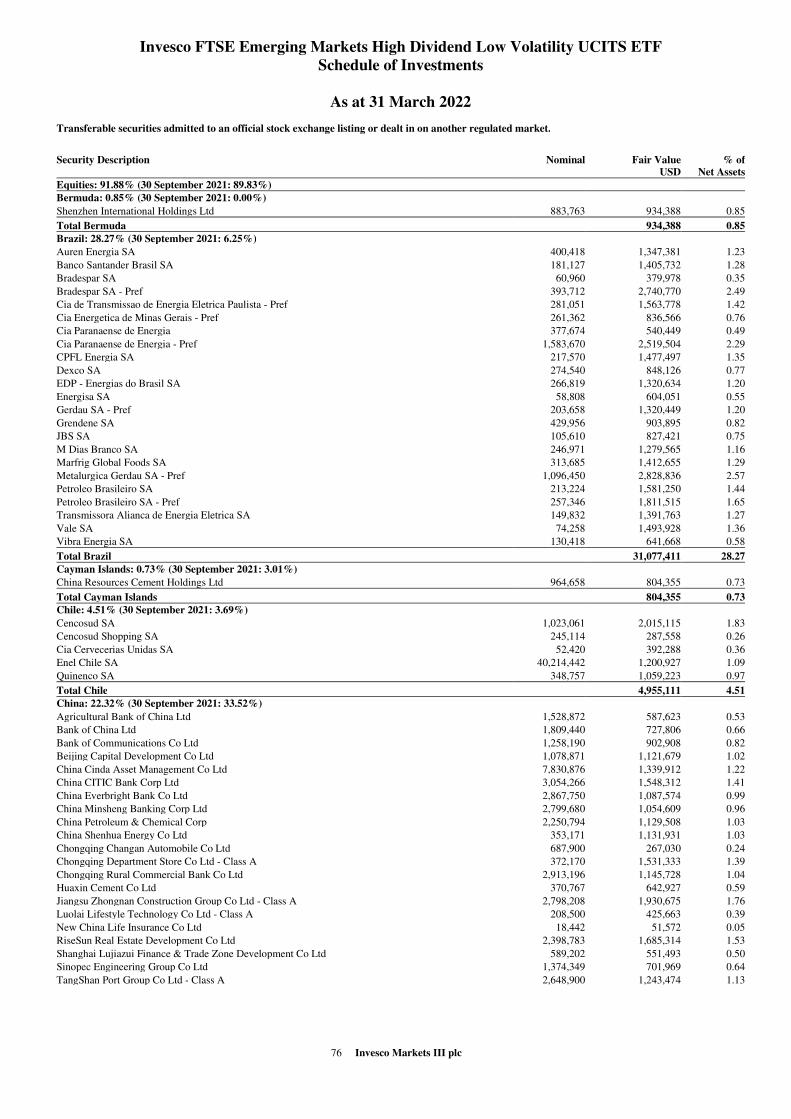
76 Invesco Markets III plc
Invesco FTSE Emerging Markets High Dividend Low Volatility UCITS ETF
Schedule of Investments
As at 31 March 2022
Transferable securities admitted to an official stock exchange listing or dealt in on another regulated market.
Security Description
Nominal Fair Value
USD
% of
Net Assets
Equities: 91.88% (30 September 2021: 89.83%)
Bermuda: 0.85% (30 September 2021: 0.00%)
Shenzhen International Holdings Ltd 883,763 934,388 0.85
Total Bermuda 934,388 0.85
Brazil: 28.27% (30 September 2021: 6.25%)
Auren Energia SA 400,418 1,347,381 1.23
Banco Santander Brasil SA 181,127 1,405,732 1.28
Bradespar SA 60,960 379,978 0.35
Bradespar SA - Pref 393,712 2,740,770 2.49
Cia de Transmissao de Energia Eletrica Paulista - Pref 281,051 1,563,778 1.42
Cia Energetica de Minas Gerais - Pref 261,362 836,566 0.76
Cia Paranaense de Energia 377,674 540,449 0.49
Cia Paranaense de Energia - Pref 1,583,670 2,519,504 2.29
CPFL Energia SA 217,570 1,477,497 1.35
Dexco SA 274,540 848,126 0.77
EDP - Energias do Brasil SA 266,819 1,320,634 1.20
Energisa SA 58,808 604,051 0.55
Gerdau SA - Pref 203,658 1,320,449 1.20
Grendene SA 429,956 903,895 0.82
JBS SA 105,610 827,421 0.75
M Dias Branco SA 246,971 1,279,565 1.16
Marfrig Global Foods SA 313,685 1,412,655 1.29
Metalurgica Gerdau SA - Pref 1,096,450 2,828,836 2.57
Petroleo Brasileiro SA 213,224 1,581,250 1.44
Petroleo Brasileiro SA - Pref 257,346 1,811,515 1.65
Transmissora Alianca de Energia Eletrica SA 149,832 1,391,763 1.27
Vale SA 74,258 1,493,928 1.36
Vibra Energia SA 130,418 641,668 0.58
Total Brazil 31,077,411 28.27
Cayman Islands: 0.73% (30 September 2021: 3.01%)
China Resources Cement Holdings Ltd 964,658 804,355 0.73
Total Cayman Islands 804,355 0.73
Chile: 4.51% (30 September 2021: 3.69%)
Cencosud SA 1,023,061 2,015,115 1.83
Cencosud Shopping SA 245,114 287,558 0.26
Cia Cervecerias Unidas SA 52,420 392,288 0.36
Enel Chile SA 40,214,442 1,200,927 1.09
Quinenco SA 348,757 1,059,223 0.97
Total Chile 4,955,111 4.51
China: 22.32% (30 September 2021: 33.52%)
Agricultural Bank of China Ltd 1,528,872 587,623 0.53
Bank of China Ltd 1,809,440 727,806 0.66
Bank of Communications Co Ltd 1,258,190 902,908 0.82
Beijing Capital Development Co Ltd 1,078,871 1,121,679 1.02
China Cinda Asset Management Co Ltd 7,830,876 1,339,912 1.22
China CITIC Bank Corp Ltd 3,054,266 1,548,312 1.41
China Everbright Bank Co Ltd 2,867,750 1,087,574 0.99
China Minsheng Banking Corp Ltd 2,799,680 1,054,609 0.96
China Petroleum & Chemical Corp 2,250,794 1,129,508 1.03
China Shenhua Energy Co Ltd 353,171 1,131,931 1.03
Chongqing Changan Automobile Co Ltd 687,900 267,030 0.24
Chongqing Department Store Co Ltd - Class A 372,170 1,531,333 1.39
Chongqing Rural Commercial Bank Co Ltd 2,913,196 1,145,728 1.04
Huaxin Cement Co Ltd 370,767 642,927 0.59
Jiangsu Zhongnan Construction Group Co Ltd - Class A 2,798,208 1,930,675 1.76
Luolai Lifestyle Technology Co Ltd - Class A 208,500 425,663 0.39
New China Life Insurance Co Ltd 18,442 51,572 0.05
RiseSun Real Estate Development Co Ltd 2,398,783 1,685,314 1.53
Shanghai Lujiazui Finance & Trade Zone Development Co Ltd 589,202 551,493 0.50
Sinopec Engineering Group Co Ltd 1,374,349 701,969 0.64
TangShan Port Group Co Ltd - Class A 2,648,900 1,243,474 1.13

77 Invesco Markets III plc
Invesco FTSE Emerging Markets High Dividend Low Volatility UCITS ETF
Schedule of Investments
As at 31 March 2022 (continued)
Security Description
Nominal Fair Value
USD
% of
Net Assets
Equities: 91.88% (30 September 2021: 89.83%) (continued)
China: 22.32% (30 September 2021: 33.52%) (continued)
Weifu High-Technology Group Co Ltd 467,734 911,412 0.83
Weifu High-Technology Group Co Ltd - Class A 149,701 468,338 0.43
Youngor Group Co Ltd - Class A 957,896 1,023,065 0.93
Zhuhai Huafa Properties Co Ltd 1,156,423 1,317,074 1.20
Total China 24,528,929 22.32
China, Republic of (Taiwan): 7.09% (30 September 2021: 8.05%)
Asia Cement Corp 610,140 1,034,948 0.94
Catcher Technology Co Ltd 249,435 1,257,992 1.15
China Motor Corp 199,169 421,257 0.38
Inventec Corp 1,133,886 977,505 0.89
Lite-On Technology Corp 362,245 860,998 0.78
Taiwan Cement Corp 444,598 774,320 0.71
Wistron Corp 993,577 1,031,671 0.94
Yulon Nissan Motor Co Ltd 163,226 1,432,781 1.30
Total China, Republic of (Taiwan) 7,791,472 7.09
Colombia: 0.00% (30 September 2021: 0.34%)
Czech Republic: 0.00% (30 September 2021: 1.54%)
Egypt: 0.26% (30 September 2021: 0.00%)
Eastern Co SAE 436,727 286,930 0.26
Total Egypt 286,930 0.26
Hong Kong: 3.91% (30 September 2021: 11.06%)
China Everbright Ltd 573,474 568,246 0.52
Shanghai Industrial Holdings Ltd 943,695 1,417,099 1.29
Shenzhen Investment Ltd 3,400,516 759,878 0.69
Sino-Ocean Group Holding Ltd 2,381,139 507,765 0.46
Yuexiu Property Co Ltd 1,054,275 1,048,703 0.95
Total Hong Kong 4,301,691 3.91
Indonesia: 1.26% (30 September 2021: 0.00%)
Gudang Garam Tbk PT 375,911 827,069 0.75
Hanjaya Mandala Sampoerna Tbk PT 8,726,839 562,042 0.51
Total Indonesia 1,389,111 1.26
Kuwait: 1.82% (30 September 2021: 0.00%)
Humansoft Holding Co KSC 188,020 1,998,400 1.82
Total Kuwait 1,998,400 1.82
Malaysia: 3.38% (30 September 2021: 2.25%)
Astro Malaysia Holdings Bhd 955,461 249,959 0.23
British American Tobacco Malaysia Bhd 513,169 1,518,250 1.38
Malayan Banking Bhd 916,248 1,948,108 1.77
Total Malaysia 3,716,317 3.38
Mexico: 2.54% (30 September 2021: 0.00%)
Concentradora Fibra Danhos SA de CV 225,972 267,876 0.24
Fibra Uno Administracion SA de CV 1,006,610 1,176,111 1.07
Grupo Aeroportuario del Centro Norte SAB de CV 180,828 1,349,544 1.23
Total Mexico 2,793,531 2.54
Pakistan: 2.74% (30 September 2021: 1.89%)
Fauji Fertilizer Co Ltd 3,766,703 2,336,239 2.12
Habib Bank Ltd 247,167 152,210 0.14
Oil & Gas Development Co Ltd 1,163,289 527,429 0.48
Total Pakistan 3,015,878 2.74
Philippines: 0.19% (30 September 2021: 0.00%)
LT Group Inc 1,181,372 203,193 0.19
Total Philippines 203,193 0.19
Qatar: 0.00% (30 September 2021: 0.60%)
Russia: 0.00% (30 September 2021: 13.19%)
Bashneft PJSC - Pref 35,548 – –
Gazprom PJSC 475,744 – –
Magnit PJSC 14,504 – –
Magnitogorsk Iron & Steel Works PJSC 1,567,160 – –
Mobile TeleSystems PJSC 409,119 – –
Novolipetsk Steel PJSC 223,387 – –
PhosAgro PJSC 16,744 – –
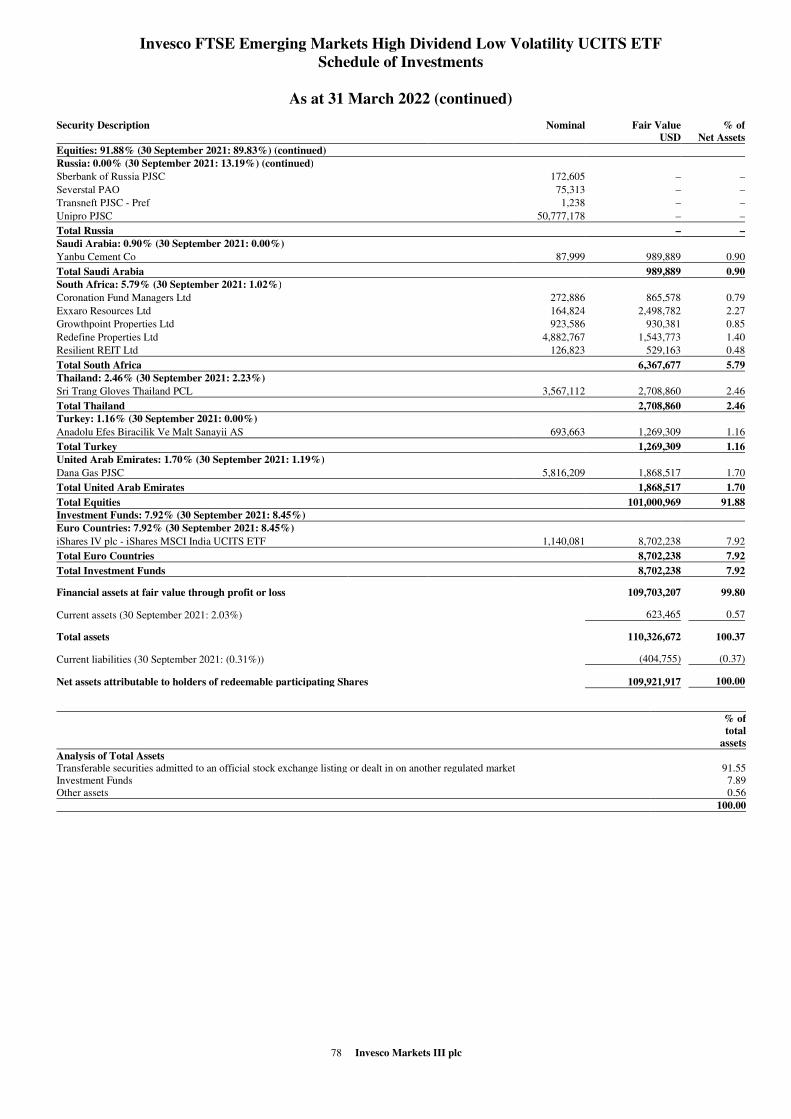
78 Invesco Markets III plc
Invesco FTSE Emerging Markets High Dividend Low Volatility UCITS ETF
Schedule of Investments
As at 31 March 2022 (continued)
Security Description
Nominal Fair Value
USD
% of
Net Assets
Equities: 91.88% (30 September 2021: 89.83%) (continued)
Russia: 0.00% (30 September 2021: 13.19%) (continued)
Sberbank of Russia PJSC 172,605 – –
Severstal PAO 75,313 – –
Transneft PJSC - Pref 1,238 – –
Unipro PJSC 50,777,178 – –
Total Russia – –
Saudi Arabia: 0.90% (30 September 2021: 0.00%)
Yanbu Cement Co 87,999 989,889 0.90
Total Saudi Arabia 989,889 0.90
South Africa: 5.79% (30 September 2021: 1.02%)
Coronation Fund Managers Ltd 272,886 865,578 0.79
Exxaro Resources Ltd 164,824 2,498,782 2.27
Growthpoint Properties Ltd 923,586 930,381 0.85
Redefine Properties Ltd 4,882,767 1,543,773 1.40
Resilient REIT Ltd 126,823 529,163 0.48
Total South Africa 6,367,677 5.79
Thailand: 2.46% (30 September 2021: 2.23%)
Sri Trang Gloves Thailand PCL 3,567,112 2,708,860 2.46
Total Thailand 2,708,860 2.46
Turkey: 1.16% (30 September 2021: 0.00%)
Anadolu Efes Biracilik Ve Malt Sanayii AS 693,663 1,269,309 1.16
Total Turkey 1,269,309 1.16
United Arab Emirates: 1.70% (30 September 2021: 1.19%)
Dana Gas PJSC 5,816,209 1,868,517 1.70
Total United Arab Emirates 1,868,517 1.70
Total Equities 101,000,969 91.88
Investment Funds: 7.92% (30 September 2021: 8.45%)
Euro Countries: 7.92% (30 September 2021: 8.45%)
iShares IV plc - iShares MSCI India UCITS ETF 1,140,081 8,702,238 7.92
Total Euro Countries 8,702,238 7.92
Total Investment Funds 8,702,238 7.92
Financial assets at fair value through profit or loss 109,703,207 99.80
Current assets (30 September 2021: 2.03%) 623,465 0.57
Total assets 110,326,672 100.37
Current liabilities (30 September 2021: (0.31%)) (404,755) (0.37)
Net assets attributable to holders of redeemable participating Shares 109,921,917 100.00
% of
total
assets
Analysis of Total Assets
Transferable securities admitted to an official stock exchange listing or dealt in on another regulated market 91.55
Investment Funds 7.89
Other assets 0.56
100.00
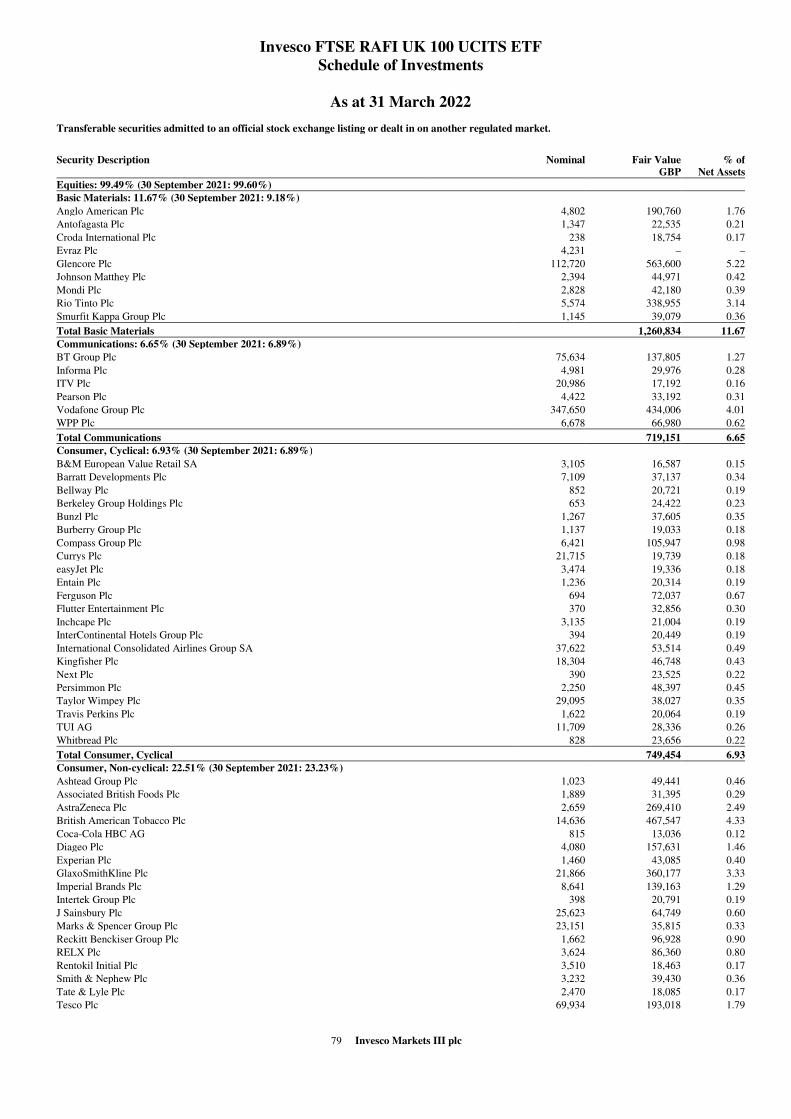
79 Invesco Markets III plc
Invesco FTSE RAFI UK 100 UCITS ETF
Schedule of Investments
As at 31 March 2022
Transferable securities admitted to an official stock exchange listing or dealt in on another regulated market.
Security Description
Nominal Fair Value
GBP
% of
Net Assets
Equities: 99.49% (30 September 2021: 99.60%)
Basic Materials: 11.67% (30 September 2021: 9.18%)
Anglo American Plc 4,802 190,760 1.76
Antofagasta Plc 1,347 22,535 0.21
Croda International Plc 238 18,754 0.17
Evraz Plc 4,231 – –
Glencore Plc 112,720 563,600 5.22
Johnson Matthey Plc 2,394 44,971 0.42
Mondi Plc 2,828 42,180 0.39
Rio Tinto Plc 5,574 338,955 3.14
Smurfit Kappa Group Plc 1,145 39,079 0.36
Total Basic Materials 1,260,834 11.67
Communications: 6.65% (30 September 2021: 6.89%)
BT Group Plc 75,634 137,805 1.27
Informa Plc 4,981 29,976 0.28
ITV Plc 20,986 17,192 0.16
Pearson Plc 4,422 33,192 0.31
Vodafone Group Plc 347,650 434,006 4.01
WPP Plc 6,678 66,980 0.62
Total Communications 719,151 6.65
Consumer, Cyclical: 6.93% (30 September 2021: 6.89%)
B&M European Value Retail SA 3,105 16,587 0.15
Barratt Developments Plc 7,109 37,137 0.34
Bellway Plc 852 20,721 0.19
Berkeley Group Holdings Plc 653 24,422 0.23
Bunzl Plc 1,267 37,605 0.35
Burberry Group Plc 1,137 19,033 0.18
Compass Group Plc 6,421 105,947 0.98
Currys Plc 21,715 19,739 0.18
easyJet Plc 3,474 19,336 0.18
Entain Plc 1,236 20,314 0.19
Ferguson Plc 694 72,037 0.67
Flutter Entertainment Plc 370 32,856 0.30
Inchcape Plc 3,135 21,004 0.19
InterContinental Hotels Group Plc 394 20,449 0.19
International Consolidated Airlines Group SA 37,622 53,514 0.49
Kingfisher Plc 18,304 46,748 0.43
Next Plc 390 23,525 0.22
Persimmon Plc 2,250 48,397 0.45
Taylor Wimpey Plc 29,095 38,027 0.35
Travis Perkins Plc 1,622 20,064 0.19
TUI AG 11,709 28,336 0.26
Whitbread Plc 828 23,656 0.22
Total Consumer, Cyclical 749,454 6.93
Consumer, Non-cyclical: 22.51% (30 September 2021: 23.23%)
Ashtead Group Plc 1,023 49,441 0.46
Associated British Foods Plc 1,889 31,395 0.29
AstraZeneca Plc 2,659 269,410 2.49
British American Tobacco Plc 14,636 467,547 4.33
Coca-Cola HBC AG 815 13,036 0.12
Diageo Plc 4,080 157,631 1.46
Experian Plc 1,460 43,085 0.40
GlaxoSmithKline Plc 21,866 360,177 3.33
Imperial Brands Plc 8,641 139,163 1.29
Intertek Group Plc 398 20,791 0.19
J Sainsbury Plc 25,623 64,749 0.60
Marks & Spencer Group Plc 23,151 35,815 0.33
Reckitt Benckiser Group Plc 1,662 96,928 0.90
RELX Plc 3,624 86,360 0.80
Rentokil Initial Plc 3,510 18,463 0.17
Smith & Nephew Plc 3,232 39,430 0.36
Tate & Lyle Plc 2,470 18,085 0.17
Tesco Plc 69,934 193,018 1.79
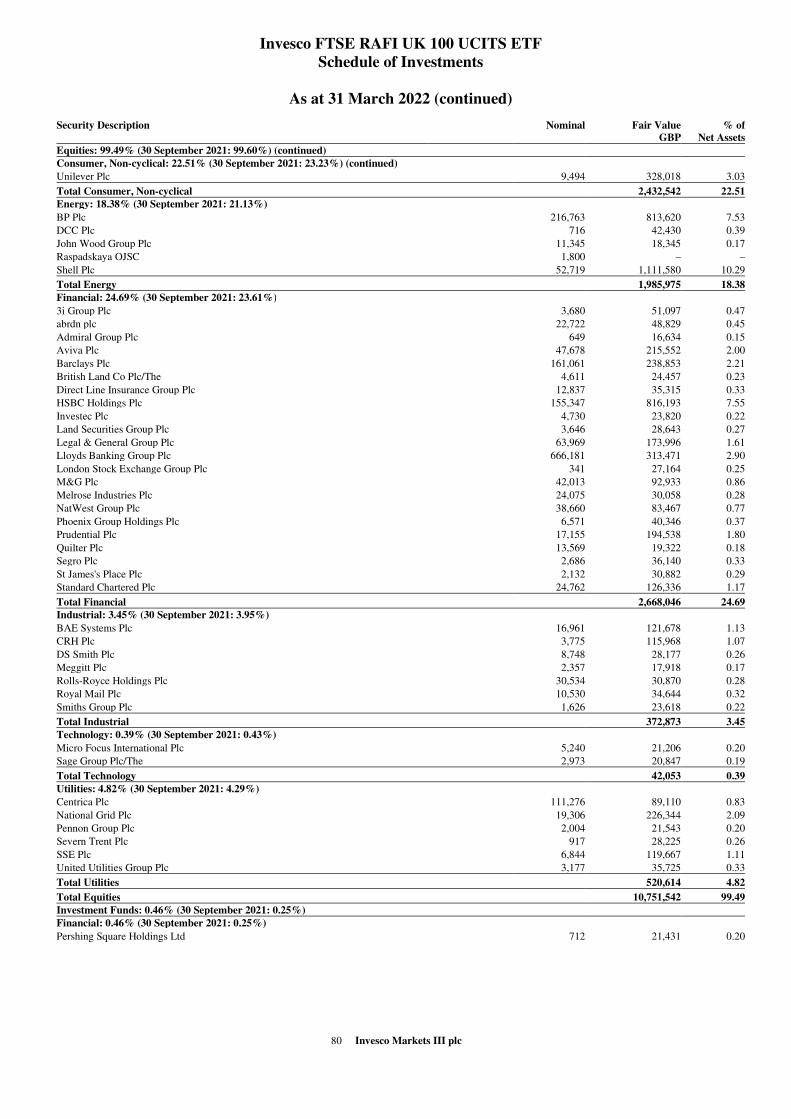
80 Invesco Markets III plc
Invesco FTSE RAFI UK 100 UCITS ETF
Schedule of Investments
As at 31 March 2022 (continued)
Security Description
Nominal Fair Value
GBP
% of
Net Assets
Equities: 99.49% (30 September 2021: 99.60%) (continued)
Consumer, Non-cyclical: 22.51% (30 September 2021: 23.23%) (continued)
Unilever Plc 9,494 328,018 3.03
Total Consumer, Non-cyclical 2,432,542 22.51
Energy: 18.38% (30 September 2021: 21.13%)
BP Plc 216,763 813,620 7.53
DCC Plc 716 42,430 0.39
John Wood Group Plc 11,345 18,345 0.17
Raspadskaya OJSC 1,800 – –
Shell Plc 52,719 1,111,580 10.29
Total Energy 1,985,975 18.38
Financial: 24.69% (30 September 2021: 23.61%)
3i Group Plc 3,680 51,097 0.47
abrdn plc 22,722 48,829 0.45
Admiral Group Plc 649 16,634 0.15
Aviva Plc 47,678 215,552 2.00
Barclays Plc 161,061 238,853 2.21
British Land Co Plc/The 4,611 24,457 0.23
Direct Line Insurance Group Plc 12,837 35,315 0.33
HSBC Holdings Plc 155,347 816,193 7.55
Investec Plc 4,730 23,820 0.22
Land Securities Group Plc 3,646 28,643 0.27
Legal & General Group Plc 63,969 173,996 1.61
Lloyds Banking Group Plc 666,181 313,471 2.90
London Stock Exchange Group Plc 341 27,164 0.25
M&G Plc 42,013 92,933 0.86
Melrose Industries Plc 24,075 30,058 0.28
NatWest Group Plc 38,660 83,467 0.77
Phoenix Group Holdings Plc 6,571 40,346 0.37
Prudential Plc 17,155 194,538 1.80
Quilter Plc 13,569 19,322 0.18
Segro Plc 2,686 36,140 0.33
St James's Place Plc 2,132 30,882 0.29
Standard Chartered Plc 24,762 126,336 1.17
Total Financial 2,668,046 24.69
Industrial: 3.45% (30 September 2021: 3.95%)
BAE Systems Plc 16,961 121,678 1.13
CRH Plc 3,775 115,968 1.07
DS Smith Plc 8,748 28,177 0.26
Meggitt Plc 2,357 17,918 0.17
Rolls-Royce Holdings Plc 30,534 30,870 0.28
Royal Mail Plc 10,530 34,644 0.32
Smiths Group Plc 1,626 23,618 0.22
Total Industrial 372,873 3.45
Technology: 0.39% (30 September 2021: 0.43%)
Micro Focus International Plc 5,240 21,206 0.20
Sage Group Plc/The 2,973 20,847 0.19
Total Technology 42,053 0.39
Utilities: 4.82% (30 September 2021: 4.29%)
Centrica Plc 111,276 89,110 0.83
National Grid Plc 19,306 226,344 2.09
Pennon Group Plc 2,004 21,543 0.20
Severn Trent Plc 917 28,225 0.26
SSE Plc 6,844 119,667 1.11
United Utilities Group Plc 3,177 35,725 0.33
Total Utilities 520,614 4.82
Total Equities 10,751,542 99.49
Investment Funds: 0.46% (30 September 2021: 0.25%)
Financial: 0.46% (30 September 2021: 0.25%)
Pershing Square Holdings Ltd 712 21,431 0.20

81 Invesco Markets III plc
Invesco FTSE RAFI UK 100 UCITS ETF
Schedule of Investments
As at 31 March 2022 (continued)
Security Description
Nominal Fair Value
GBP
% of
Net Assets
Investment Funds: 0.46% (30 September 2021: 0.25%) (continued)
Financial: 0.46% (30 September 2021: 0.25%) (continued)
Scottish Mortgage Investment Trust Plc 2,731 28,020 0.26
Total Financial 49,451 0.46
Total Investment Funds 49,451 0.46
Financial assets at fair value through profit or loss 10,800,993 99.95
Current assets (30 September 2021: 0.29%) 99,231 0.92
Total assets 10,900,224 100.87
Current liabilities (30 September 2021: (0.14%)) (93,852) (0.87)
Net assets attributable to holders of redeemable participating Shares 10,806,372 100.00
% of
total
assets
Analysis of Total Assets
Transferable securities admitted to an official stock exchange listing or dealt in on another regulated market 98.64
Investment Funds 0.45
Other assets 0.91
100.00

82 Invesco Markets III plc
Invesco Euro Cash 3 Months UCITS ETF (formerly Invesco EuroMTS Cash 3 Months UCIS ETF)
Schedule of Investments
As at 31 March 2022
Transferable securities admitted to an official stock exchange listing or dealt in on another regulated market.
Security Description
Nominal Fair Value
EUR
% of
Net Assets
Bonds: 99.98% (30 September 2021: 99.95%)
Euro Countries: 99.98% (30 September 2021: 99.95%)
Dutch Treasury Certificate 28/04/2022 820,000 820,397 1.59
Dutch Treasury Certificate 30/05/2022 690,000 690,737 1.34
Dutch Treasury Certificate 29/06/2022 450,000 450,761 0.87
Dutch Treasury Certificate 28/07/2022 168,000 168,375 0.33
Dutch Treasury Certificate 30/08/2022 250,000 250,698 0.49
Dutch Treasury Certificate 29/09/2022 270,000 270,916 0.52
France Treasury Bill BTF 13/04/2022 797,000 797,141 1.54
France Treasury Bill BTF 21/04/2022 1,200,000 1,200,398 2.33
France Treasury Bill BTF 27/04/2022 670,000 670,322 1.30
France Treasury Bill BTF 04/05/2022 773,000 773,468 1.50
France Treasury Bill BTF 11/05/2022 850,000 850,621 1.65
France Treasury Bill BTF 18/05/2022 1,128,000 1,129,086 2.19
France Treasury Bill BTF 25/05/2022 690,000 690,703 1.34
France Treasury Bill BTF 01/06/2022 481,000 481,506 0.93
France Treasury Bill BTF 09/06/2022 850,000 850,800 1.65
France Treasury Bill BTF 15/06/2022 926,000 927,295 1.80
France Treasury Bill BTF 22/06/2022 500,000 500,758 0.97
France Treasury Bill BTF 29/06/2022 863,000 864,360 1.68
France Treasury Bill BTF 13/07/2022 929,000 930,742 1.80
France Treasury Bill BTF 27/07/2022 800,000 801,682 1.55
France Treasury Bill BTF 10/08/2022 880,000 882,080 1.71
France Treasury Bill BTF 24/08/2022 250,000 250,846 0.49
France Treasury Bill BTF 07/09/2022 1,000,000 1,002,835 1.94
German Treasury Bill 21/04/2022 2,808,000 2,808,982 5.44
German Treasury Bill 18/05/2022 2,485,000 2,487,322 4.82
German Treasury Bill 22/06/2022 2,454,000 2,457,620 4.76
German Treasury Bill 20/07/2022 2,115,000 2,119,399 4.11
German Treasury Bill 24/08/2022 1,490,000 1,493,889 2.90
German Treasury Bill 21/09/2022 1,750,000 1,755,254 3.40
Italy Buoni Ordinari del Tesoro BOT 14/04/2022 804,000 804,162 1.56
Italy Buoni Ordinari del Tesoro BOT 29/04/2022 763,000 763,392 1.48
Italy Buoni Ordinari del Tesoro BOT 13/05/2022 948,000 948,678 1.84
Italy Buoni Ordinari del Tesoro BOT 31/05/2022 738,000 738,803 1.43
Italy Buoni Ordinari del Tesoro BOT 14/06/2022 1,064,000 1,065,336 2.07
Italy Buoni Ordinari del Tesoro BOT 14/07/2022 1,140,000 1,142,047 2.21
Italy Buoni Ordinari del Tesoro BOT 29/07/2022 732,000 733,422 1.42
Italy Buoni Ordinari del Tesoro BOT 12/08/2022 1,085,000 1,087,119 2.11
Italy Buoni Ordinari del Tesoro BOT 31/08/2022 855,000 856,843 1.66
Italy Buoni Ordinari del Tesoro BOT 14/09/2022 1,020,000 1,022,399 1.98
Italy Certificati di Credito del Tesoro Zero Coupon 30/05/2022 2,078,000 2,079,860 4.03
Italy Certificati di Credito del Tesoro Zero Coupon 28/09/2022 1,530,000 1,533,045 2.97
Kingdom of Belgium Treasury Bill 12/05/2022 1,133,000 1,133,877 2.20
Kingdom of Belgium Treasury Bill 14/07/2022 1,073,000 1,074,810 2.08
Kingdom of Belgium Treasury Bill 08/09/2022 540,000 541,282 1.05
Portugal Treasury Bill 20/05/2022 284,000 284,303 0.55
Portugal Treasury Bill 22/07/2022 178,000 178,432 0.35
Portugal Treasury Bill 23/09/2022 100,000 100,273 0.19
Spain Letras del Tesoro 08/04/2022 1,142,000 1,142,089 2.21
Spain Letras del Tesoro 06/05/2022 1,111,000 1,111,654 2.15
Spain Letras del Tesoro 10/06/2022 1,111,000 1,112,270 2.16
Spain Letras del Tesoro 08/07/2022 890,000 891,591 1.73
Spain Letras del Tesoro 12/08/2022 965,000 967,268 1.88
Spain Letras del Tesoro 09/09/2022 890,000 892,320 1.73
Total Euro Countries 51,584,268 99.98
Total Bonds 51,584,268 99.98
Financial assets at fair value through profit or loss 51,584,268 99.98
Current assets (30 September 2021: 0.06%) 20,030 0.03
Total assets 51,604,298 100.01
Current liabilities (30 September 2021: (0.01%)) (7,187) (0.01)
Net assets attributable to holders of redeemable participating Shares 51,597,111 100.00
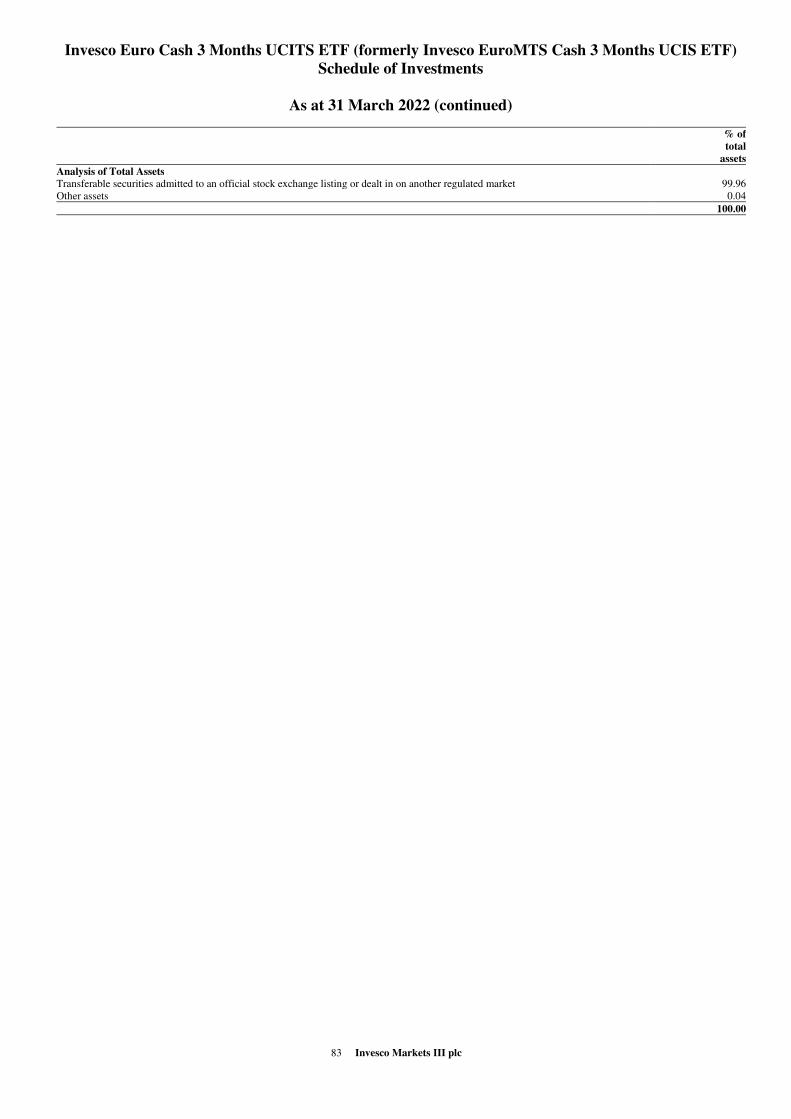
83 Invesco Markets III plc
Invesco Euro Cash 3 Months UCITS ETF (formerly Invesco EuroMTS Cash 3 Months UCIS ETF)
Schedule of Investments
As at 31 March 2022 (continued)
% of
total
assets
Analysis of Total Assets
Transferable securities admitted to an official stock exchange listing or dealt in on another regulated market 99.96
Other assets 0.04
100.00

84 Invesco Markets III plc
Invesco US High Yield Fallen Angels UCITS ETF
Schedule of Investments
As at 31 March 2022
Transferable securities admitted to an official stock exchange listing or dealt in on another regulated market.
Security Description
Nominal Fair Value
USD
% of
Net Assets
Bonds: 92.70% (30 September 2021: 102.68%)
Bermuda: 0.00% (30 September 2021: 4.21%)
Canada: 2.45% (30 September 2021: 2.90%)
Methanex Corp 4.25% USD 01/12/2024 1,041,000 1,042,327 0.44
Methanex Corp 5.25% USD 15/12/2029 2,551,000 2,605,158 1.10
Methanex Corp 5.65% USD 01/12/2044 1,178,000 1,083,760 0.46
TransAlta Corp 6.5% USD 15/03/2040 1,040,000 1,073,420 0.45
Total Canada 5,804,665 2.45
Cayman Islands: 4.90% (30 September 2021: 4.94%)
Seagate HDD Cayman 4.75% USD 01/06/2023 1,897,000 1,928,670 0.81
Seagate HDD Cayman 4.875% USD 01/03/2024 1,550,000 1,582,682 0.67
Seagate HDD Cayman 4.75% USD 01/01/2025 1,699,000 1,752,224 0.74
Seagate HDD Cayman 4.875% USD 01/06/2027 1,548,000 1,585,996 0.67
Seagate HDD Cayman 4.091% USD 01/06/2029 1,475,000 1,433,899 0.60
Seagate HDD Cayman 4.125% USD 15/01/2031 1,745,000 1,656,965 0.70
Seagate HDD Cayman 5.75% USD 01/12/2034 1,655,000 1,691,435 0.71
Total Cayman Islands 11,631,871 4.90
Euro Countries: 3.15% (30 September 2021: 1.59%)
Perrigo Finance Unlimited Co 3.9% USD 15/12/2024 2,015,000 2,034,392 0.86
Perrigo Finance Unlimited Co 4.375% USD 15/03/2026 2,300,000 2,297,133 0.97
Perrigo Finance Unlimited Co 3.9% USD 15/06/2030 2,270,000 2,137,331 0.90
Perrigo Finance Unlimited Co 4.9% USD 15/12/2044 1,175,000 1,000,449 0.42
Total Euro Countries 7,469,305 3.15
Liberia: 2.68% (30 September 2021: 3.24%)
Royal Caribbean Cruises Ltd 10.875% USD 01/06/2023 1,950,000 2,077,052 0.88
Royal Caribbean Cruises Ltd 11.5% USD 01/06/2025 2,558,000 2,813,596 1.19
Royal Caribbean Cruises Ltd 7.5% USD 15/10/2027 650,000 692,019 0.29
Royal Caribbean Cruises Ltd 3.7% USD 15/03/2028 852,000 761,262 0.32
Total Liberia 6,343,929 2.68
Panama: 0.00% (30 September 2021: 0.69%)
United States: 79.52% (30 September 2021: 85.11%)
American Airlines 2014-1 Class A Pass Through Trust 3.7% USD 01/10/2026 1,806,056 1,748,388 0.74
American Airlines 2015-1 Class A Pass Through Trust 3.375% USD 01/05/2027 2,536,397 2,446,126 1.03
Apache Corp 4.375% USD 15/10/2028 1,244,000 1,274,702 0.54
Apache Corp 4.25% USD 15/01/2030 1,620,000 1,647,532 0.69
Apache Corp 6% USD 15/01/2037 1,390,000 1,563,681 0.66
Apache Corp 5.1% USD 01/09/2040 3,468,000 3,500,894 1.48
Apache Corp 5.25% USD 01/02/2042 1,001,000 1,000,630 0.42
Apache Corp 4.75% USD 15/04/2043 1,055,000 1,005,204 0.42
Apache Corp 5.35% USD 01/07/2049 905,000 871,664 0.37
Assurant Inc 7% USD 27/03/2048 613,000 649,780 0.27
Bed Bath & Beyond Inc 3.749% USD 01/08/2024 1,060,000 1,037,565 0.44
Bed Bath & Beyond Inc 5.165% USD 01/08/2044 2,570,000 1,825,175 0.77
Brightsphere Investment Group Inc 4.8% USD 27/07/2026 2,003,000 1,935,549 0.82
Brinker International Inc 5% USD 01/10/2024 1,497,000 1,495,263 0.63
Buckeye Partners LP 4.15% USD 01/07/2023 1,847,000 1,858,470 0.78
Buckeye Partners LP 4.35% USD 15/10/2024 897,000 902,602 0.38
Buckeye Partners LP 3.95% USD 01/12/2026 1,980,000 1,939,044 0.82
Buckeye Partners LP 4.125% USD 01/12/2027 1,377,000 1,317,741 0.56
Buckeye Partners LP 5.85% USD 15/11/2043 1,329,000 1,135,591 0.48
Buckeye Partners LP 5.6% USD 15/10/2044 1,075,000 903,322 0.38
Carpenter Technology Corp 4.45% USD 01/03/2023 1,635,000 1,666,269 0.70
Carpenter Technology Corp 6.375% USD 15/07/2028 2,273,000 2,285,024 0.96
Diversified Healthcare Trust 4.75% USD 01/05/2024 1,075,000 1,032,005 0.44
Diversified Healthcare Trust 4.75% USD 15/02/2028 2,225,000 2,030,212 0.86
DPL Inc 4.35% USD 15/04/2029 1,365,000 1,338,956 0.56
Elanco Animal Health Inc 5.772% USD 28/08/2023 1,375,000 1,421,853 0.60
Elanco Animal Health Inc 6.4% USD 28/08/2028 1,470,000 1,582,014 0.67
EnLink Midstream Partners LP 4.4% USD 01/04/2024 629,000 638,263 0.27
EnLink Midstream Partners LP 4.15% USD 01/06/2025 1,045,000 1,041,437 0.44
EnLink Midstream Partners LP 4.85% USD 15/07/2026 1,020,000 1,024,024 0.43
EnLink Midstream Partners LP 5.6% USD 01/04/2044 599,000 517,835 0.22
EnLink Midstream Partners LP 5.05% USD 01/04/2045 529,000 431,302 0.18
EnLink Midstream Partners LP 5.45% USD 01/06/2047 682,000 577,668 0.24
EQM Midstream Partners LP 4.75% USD 15/07/2023 1,230,000 1,241,107 0.52
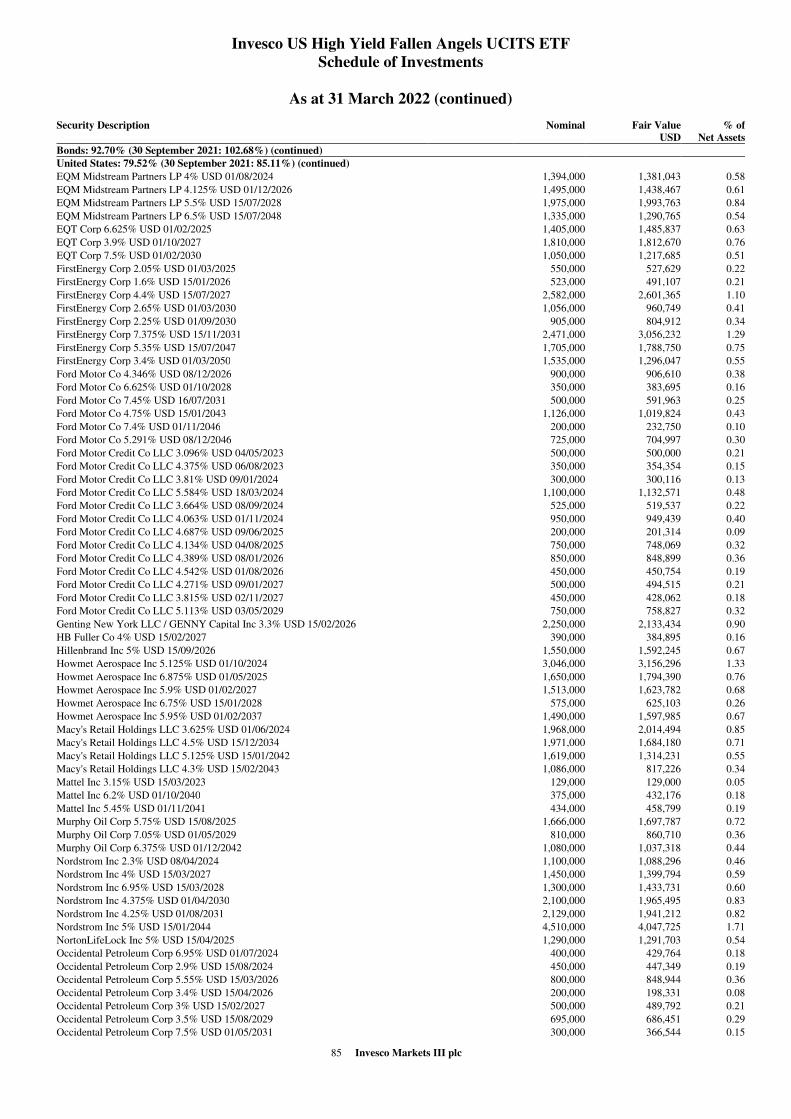
85 Invesco Markets III plc
Invesco US High Yield Fallen Angels UCITS ETF
Schedule of Investments
As at 31 March 2022 (continued)
Security Description
Nominal Fair Value
USD
% of
Net Assets
Bonds: 92.70% (30 September 2021: 102.68%) (continued)
United States: 79.52% (30 September 2021: 85.11%) (continued)
EQM Midstream Partners LP 4% USD 01/08/2024 1,394,000 1,381,043 0.58
EQM Midstream Partners LP 4.125% USD 01/12/2026 1,495,000 1,438,467 0.61
EQM Midstream Partners LP 5.5% USD 15/07/2028 1,975,000 1,993,763 0.84
EQM Midstream Partners LP 6.5% USD 15/07/2048 1,335,000 1,290,765 0.54
EQT Corp 6.625% USD 01/02/2025 1,405,000 1,485,837 0.63
EQT Corp 3.9% USD 01/10/2027 1,810,000 1,812,670 0.76
EQT Corp 7.5% USD 01/02/2030 1,050,000 1,217,685 0.51
FirstEnergy Corp 2.05% USD 01/03/2025 550,000 527,629 0.22
FirstEnergy Corp 1.6% USD 15/01/2026 523,000 491,107 0.21
FirstEnergy Corp 4.4% USD 15/07/2027 2,582,000 2,601,365 1.10
FirstEnergy Corp 2.65% USD 01/03/2030 1,056,000 960,749 0.41
FirstEnergy Corp 2.25% USD 01/09/2030 905,000 804,912 0.34
FirstEnergy Corp 7.375% USD 15/11/2031 2,471,000 3,056,232 1.29
FirstEnergy Corp 5.35% USD 15/07/2047 1,705,000 1,788,750 0.75
FirstEnergy Corp 3.4% USD 01/03/2050 1,535,000 1,296,047 0.55
Ford Motor Co 4.346% USD 08/12/2026 900,000 906,610 0.38
Ford Motor Co 6.625% USD 01/10/2028 350,000 383,695 0.16
Ford Motor Co 7.45% USD 16/07/2031 500,000 591,963 0.25
Ford Motor Co 4.75% USD 15/01/2043 1,126,000 1,019,824 0.43
Ford Motor Co 7.4% USD 01/11/2046 200,000 232,750 0.10
Ford Motor Co 5.291% USD 08/12/2046 725,000 704,997 0.30
Ford Motor Credit Co LLC 3.096% USD 04/05/2023 500,000 500,000 0.21
Ford Motor Credit Co LLC 4.375% USD 06/08/2023 350,000 354,354 0.15
Ford Motor Credit Co LLC 3.81% USD 09/01/2024 300,000 300,116 0.13
Ford Motor Credit Co LLC 5.584% USD 18/03/2024 1,100,000 1,132,571 0.48
Ford Motor Credit Co LLC 3.664% USD 08/09/2024 525,000 519,537 0.22
Ford Motor Credit Co LLC 4.063% USD 01/11/2024 950,000 949,439 0.40
Ford Motor Credit Co LLC 4.687% USD 09/06/2025 200,000 201,314 0.09
Ford Motor Credit Co LLC 4.134% USD 04/08/2025 750,000 748,069 0.32
Ford Motor Credit Co LLC 4.389% USD 08/01/2026 850,000 848,899 0.36
Ford Motor Credit Co LLC 4.542% USD 01/08/2026 450,000 450,754 0.19
Ford Motor Credit Co LLC 4.271% USD 09/01/2027 500,000 494,515 0.21
Ford Motor Credit Co LLC 3.815% USD 02/11/2027 450,000 428,062 0.18
Ford Motor Credit Co LLC 5.113% USD 03/05/2029 750,000 758,827 0.32
Genting New York LLC / GENNY Capital Inc 3.3% USD 15/02/2026 2,250,000 2,133,434 0.90
HB Fuller Co 4% USD 15/02/2027 390,000 384,895 0.16
Hillenbrand Inc 5% USD 15/09/2026 1,550,000 1,592,245 0.67
Howmet Aerospace Inc 5.125% USD 01/10/2024 3,046,000 3,156,296 1.33
Howmet Aerospace Inc 6.875% USD 01/05/2025 1,650,000 1,794,390 0.76
Howmet Aerospace Inc 5.9% USD 01/02/2027 1,513,000 1,623,782 0.68
Howmet Aerospace Inc 6.75% USD 15/01/2028 575,000 625,103 0.26
Howmet Aerospace Inc 5.95% USD 01/02/2037 1,490,000 1,597,985 0.67
Macy's Retail Holdings LLC 3.625% USD 01/06/2024 1,968,000 2,014,494 0.85
Macy's Retail Holdings LLC 4.5% USD 15/12/2034 1,971,000 1,684,180 0.71
Macy's Retail Holdings LLC 5.125% USD 15/01/2042 1,619,000 1,314,231 0.55
Macy's Retail Holdings LLC 4.3% USD 15/02/2043 1,086,000 817,226 0.34
Mattel Inc 3.15% USD 15/03/2023 129,000 129,000 0.05
Mattel Inc 6.2% USD 01/10/2040 375,000 432,176 0.18
Mattel Inc 5.45% USD 01/11/2041 434,000 458,799 0.19
Murphy Oil Corp 5.75% USD 15/08/2025 1,666,000 1,697,787 0.72
Murphy Oil Corp 7.05% USD 01/05/2029 810,000 860,710 0.36
Murphy Oil Corp 6.375% USD 01/12/2042 1,080,000 1,037,318 0.44
Nordstrom Inc 2.3% USD 08/04/2024 1,100,000 1,088,296 0.46
Nordstrom Inc 4% USD 15/03/2027 1,450,000 1,399,794 0.59
Nordstrom Inc 6.95% USD 15/03/2028 1,300,000 1,433,731 0.60
Nordstrom Inc 4.375% USD 01/04/2030 2,100,000 1,965,495 0.83
Nordstrom Inc 4.25% USD 01/08/2031 2,129,000 1,941,212 0.82
Nordstrom Inc 5% USD 15/01/2044 4,510,000 4,047,725 1.71
NortonLifeLock Inc 5% USD 15/04/2025 1,290,000 1,291,703 0.54
Occidental Petroleum Corp 6.95% USD 01/07/2024 400,000 429,764 0.18
Occidental Petroleum Corp 2.9% USD 15/08/2024 450,000 447,349 0.19
Occidental Petroleum Corp 5.55% USD 15/03/2026 800,000 848,944 0.36
Occidental Petroleum Corp 3.4% USD 15/04/2026 200,000 198,331 0.08
Occidental Petroleum Corp 3% USD 15/02/2027 500,000 489,792 0.21
Occidental Petroleum Corp 3.5% USD 15/08/2029 695,000 686,451 0.29
Occidental Petroleum Corp 7.5% USD 01/05/2031 300,000 366,544 0.15

86 Invesco Markets III plc
Invesco US High Yield Fallen Angels UCITS ETF
Schedule of Investments
As at 31 March 2022 (continued)
Security Description
Nominal Fair Value
USD
% of
Net Assets
Bonds: 92.70% (30 September 2021: 102.68%) (continued)
United States: 79.52% (30 September 2021: 85.11%) (continued)
Occidental Petroleum Corp 7.875% USD 15/09/2031 350,000 437,342 0.18
Occidental Petroleum Corp 6.45% USD 15/09/2036 1,450,000 1,711,435 0.72
Occidental Petroleum Corp 0% USD 10/10/2036 1,120,000 603,008 0.25
Occidental Petroleum Corp 4.3% USD 15/08/2039 539,000 510,479 0.22
Occidental Petroleum Corp 6.2% USD 15/03/2040 230,000 255,776 0.11
Occidental Petroleum Corp 4.5% USD 15/07/2044 325,000 311,252 0.13
Occidental Petroleum Corp 4.625% USD 15/06/2045 675,000 656,201 0.28
Occidental Petroleum Corp 6.6% USD 15/03/2046 1,050,000 1,235,971 0.52
Occidental Petroleum Corp 4.4% USD 15/04/2046 604,000 574,954 0.24
Occidental Petroleum Corp 4.2% USD 15/03/2048 400,000 374,716 0.16
Occidental Petroleum Corp 4.4% USD 15/08/2049 535,000 504,013 0.21
Oceaneering International Inc 4.65% USD 15/11/2024 1,190,000 1,179,135 0.50
Oceaneering International Inc 6% USD 01/02/2028 710,000 691,810 0.29
PBF Holding Co LLC / PBF Finance Corp 9.25% USD 15/05/2025 1,770,000 1,825,507 0.77
Pitney Bowes Inc 4.625% USD 15/03/2024 355,000 354,533 0.15
QVC Inc 4.375% USD 15/03/2023 2,202,000 2,213,010 0.93
QVC Inc 4.85% USD 01/04/2024 1,650,000 1,690,177 0.71
QVC Inc 4.45% USD 15/02/2025 1,850,000 1,843,950 0.78
QVC Inc 4.75% USD 15/02/2027 1,674,000 1,605,877 0.68
QVC Inc 5.45% USD 15/08/2034 1,376,000 1,151,726 0.49
QVC Inc 5.95% USD 15/03/2043 900,000 744,332 0.31
Resorts World Las Vegas LLC / RWLV Capital Inc 4.625% USD 06/04/2031 1,700,000 1,495,208 0.63
Rockies Express Pipeline LLC 3.6% USD 15/05/2025 1,519,000 1,495,395 0.63
Rockies Express Pipeline LLC 4.95% USD 15/07/2029 1,974,000 1,916,063 0.81
Rockies Express Pipeline LLC 4.8% USD 15/05/2030 1,491,000 1,415,458 0.60
Rockies Express Pipeline LLC 7.5% USD 15/07/2038 900,000 915,052 0.39
Rockies Express Pipeline LLC 6.875% USD 15/04/2040 1,955,000 1,936,398 0.82
Service Properties Trust 4.5% USD 15/06/2023 1,300,000 1,289,665 0.54
Service Properties Trust 4.65% USD 15/03/2024 820,000 790,291 0.33
Service Properties Trust 4.35% USD 01/10/2024 1,930,000 1,863,994 0.79
Service Properties Trust 4.5% USD 15/03/2025 420,000 394,252 0.17
Service Properties Trust 7.5% USD 15/09/2025 2,600,000 2,732,730 1.15
Service Properties Trust 5.25% USD 15/02/2026 775,000 727,826 0.31
Service Properties Trust 4.75% USD 01/10/2026 965,000 884,133 0.37
Service Properties Trust 4.95% USD 15/02/2027 825,000 767,374 0.32
Service Properties Trust 3.95% USD 15/01/2028 900,000 766,777 0.32
Service Properties Trust 4.95% USD 01/10/2029 860,000 743,393 0.31
Service Properties Trust 4.375% USD 15/02/2030 935,000 777,869 0.33
Southeast Supply Header LLC 4.25% USD 15/06/2024 1,820,000 1,823,591 0.77
Spirit AeroSystems Inc 3.95% USD 15/06/2023 900,000 892,449 0.38
Spirit AeroSystems Inc 3.85% USD 15/06/2026 1,005,000 963,504 0.41
Spirit AeroSystems Inc 4.6% USD 15/06/2028 2,653,000 2,495,889 1.05
Standard Industries Inc/NJ 5% USD 15/02/2027 1,500,000 1,491,075 0.63
Standard Industries Inc/NJ 4.75% USD 15/01/2028 1,820,000 1,748,146 0.74
Standard Industries Inc/NJ 4.375% USD 15/07/2030 3,050,000 2,809,797 1.18
Standard Industries Inc/NJ 3.375% USD 15/01/2031 2,110,000 1,852,063 0.78
Stericycle Inc 5.375% USD 15/07/2024 1,282,000 1,308,659 0.55
Topaz Solar Farms LLC 5.75% USD 30/09/2039 814,818 894,532 0.38
Travel + Leisure Co 3.9% USD 01/03/2023 653,000 653,816 0.28
Travel + Leisure Co 5.65% USD 01/04/2024 819,000 849,934 0.36
Travel + Leisure Co 6.6% USD 01/10/2025 342,000 363,707 0.15
Travel + Leisure Co 6% USD 01/04/2027 756,000 781,515 0.33
Trinity Industries Inc 4.55% USD 01/10/2024 1,564,000 1,592,582 0.67
Under Armour Inc 3.25% USD 15/06/2026 1,559,000 1,511,006 0.64
US Airways 2013-1 Class A Pass Through Trust 3.95% USD 15/11/2025 1,477,872 1,414,829 0.60
Xerox Corp 4.625% USD 15/03/2023 1,900,000 1,914,250 0.81
Xerox Corp 3.8% USD 15/05/2024 360,000 362,664 0.15
Xerox Corp 4.8% USD 01/03/2035 520,000 451,360 0.19
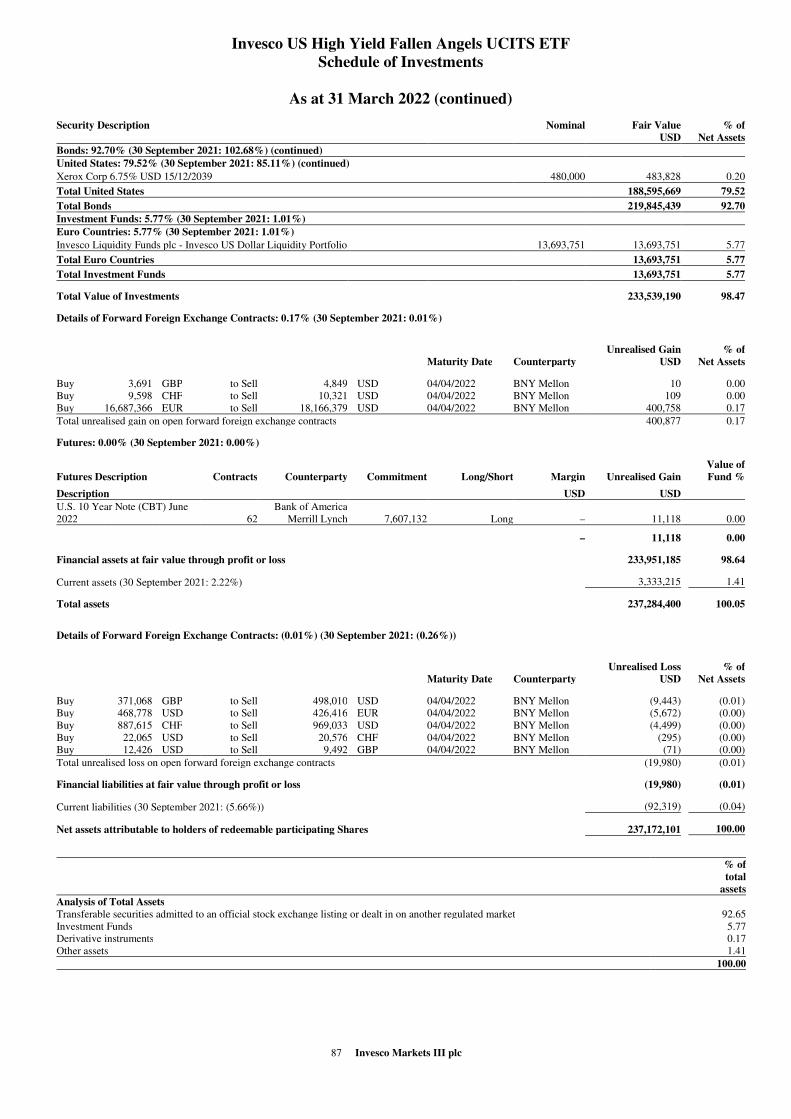
87 Invesco Markets III plc
Invesco US High Yield Fallen Angels UCITS ETF
Schedule of Investments
As at 31 March 2022 (continued)
Security Description
Nominal Fair Value
USD
% of
Net Assets
Bonds: 92.70% (30 September 2021: 102.68%) (continued)
United States: 79.52% (30 September 2021: 85.11%) (continued)
Xerox Corp 6.75% USD 15/12/2039 480,000 483,828 0.20
Total United States 188,595,669 79.52
Total Bonds 219,845,439 92.70
Investment Funds: 5.77% (30 September 2021: 1.01%)
Euro Countries: 5.77% (30 September 2021: 1.01%)
Invesco Liquidity Funds plc - Invesco US Dollar Liquidity Portfolio 13,693,751 13,693,751 5.77
Total Euro Countries 13,693,751 5.77
Total Investment Funds 13,693,751 5.77
Total Value of Investments 233,539,190 98.47
Details of Forward Foreign Exchange Contracts: 0.17% (30 September 2021: 0.01%)
Maturity Date Counterparty
Unrealised Gain
USD
% of
Net Assets
Buy 3,691 GBP to Sell 4,849 USD 04/04/2022 BNY Mellon 10 0.00
Buy 9,598 CHF to Sell 10,321 USD 04/04/2022 BNY Mellon 109 0.00
Buy 16,687,366 EUR to Sell 18,166,379 USD 04/04/2022 BNY Mellon 400,758 0.17
Total unrealised gain on open forward foreign exchange contracts 400,877 0.17
Futures: 0.00% (30 September 2021: 0.00%)
Futures Description Contracts Counterparty Commitment Long/Short Margin Unrealised Gain
Value of
Fund %
Description USD USD
U.S. 10 Year Note (CBT) June
2022 62
Bank of America
Merrill Lynch 7,607,132 Long – 11,118 0.00
– 11,118 0.00
Financial assets at fair value through profit or loss 233,951,185 98.64
Current assets (30 September 2021: 2.22%) 3,333,215 1.41
Total assets 237,284,400 100.05
Details of Forward Foreign Exchange Contracts: (0.01%) (30 September 2021: (0.26%))
Maturity Date Counterparty
Unrealised Loss
USD
% of
Net Assets
Buy 371,068 GBP to Sell 498,010 USD 04/04/2022 BNY Mellon (9,443) (0.01)
Buy 468,778 USD to Sell 426,416 EUR 04/04/2022 BNY Mellon (5,672) (0.00)
Buy 887,615 CHF to Sell 969,033 USD 04/04/2022 BNY Mellon (4,499) (0.00)
Buy 22,065 USD to Sell 20,576 CHF 04/04/2022 BNY Mellon (295) (0.00)
Buy 12,426 USD to Sell 9,492 GBP 04/04/2022 BNY Mellon (71) (0.00)
Total unrealised loss on open forward foreign exchange contracts (19,980) (0.01)
Financial liabilities at fair value through profit or loss (19,980) (0.01)
Current liabilities (30 September 2021: (5.66%)) (92,319) (0.04)
Net assets attributable to holders of redeemable participating Shares 237,172,101 100.00
% of
total
assets
Analysis of Total Assets
Transferable securities admitted to an official stock exchange listing or dealt in on another regulated market 92.65
Investment Funds 5.77
Derivative instruments 0.17
Other assets 1.41
100.00

Statement of Financial Position
88 Invesco Markets III plc
As at 31 March 2022
ny
Invesco
Invesco Invesco S&P 500 Invesco
EQQQ FTSE RAFI High Dividend S&P 500
NASDAQ-100 US 1000 Low Volatility QVM
Total UCITS ETF UCITS ETF UCITS ETF UCITS ETF
USD USD USD USD USD
Current Assets
Cash and bank balances 4,471,957 3,661,678 – – 830
Financial assets at fair value through profit or loss 7,775,815,217 6,747,235,912 306,876,494 126,428,270 9,318,958
Accrued income and other receivables 5,414,723 891,744 264,939 316,199 6,610
Capital shares receivable 97,047,504 89,831,410 – 7,216,094 –
Total assets 7,882,749,401 6,841,620,744 307,141,433 133,960,563 9,326,398
Liabilities - amounts falling due within one year
Bank overdraft (634,902) (48,757) (64,461) (9,746) –
Financial liabilities at fair value through profit or loss (2,921,555) (2,899,627) – (1,948) –
Accrued expenses (1,897,302) (1,559,645) (100,743) (29,480) (2,574)
Securities purchased payable (98,356,210) (91,009,769) – (7,203,222) –
Capital shares payable (1,332,127) (1,332,127) – – –
Other payable (253,564) – – – –
Total liabilities (excluding net assets attributable to
holders of redeemable participating Shares) (105,395,660) (96,849,925) (165,204) (7,244,396) (2,574)
Net assets attributable to holders of redeemable
participating Shares 7,777,353,741 6,744,770,819 306,976,229 126,716,167 9,323,824
Number of redeemable participating Shares
Class CHF Hedged – 428,945 – 70,380 –
Class EUR Hedged – 751,336 – – –
Class GBP Hedged – 241,284 – – –
Class US Dollar – 15,020,642 10,848,701 3,476,877 200,001
Class US Dollar Unhedged Accumulation – 3,342,612 – – –
Net asset value per share attributable to holders of
redeemable participating Shares
Class CHF Hedged – 277.65 – 30.10 –
Class EUR Hedged – 281.50 – – –
Class GBP Hedged – 291.35 – – –
Class US Dollar – 363.01 28.30 35.78 46.62
Class US Dollar Unhedged Accumulation – 249.77 – – –
The accompanying notes form an integral part of the financial statements.
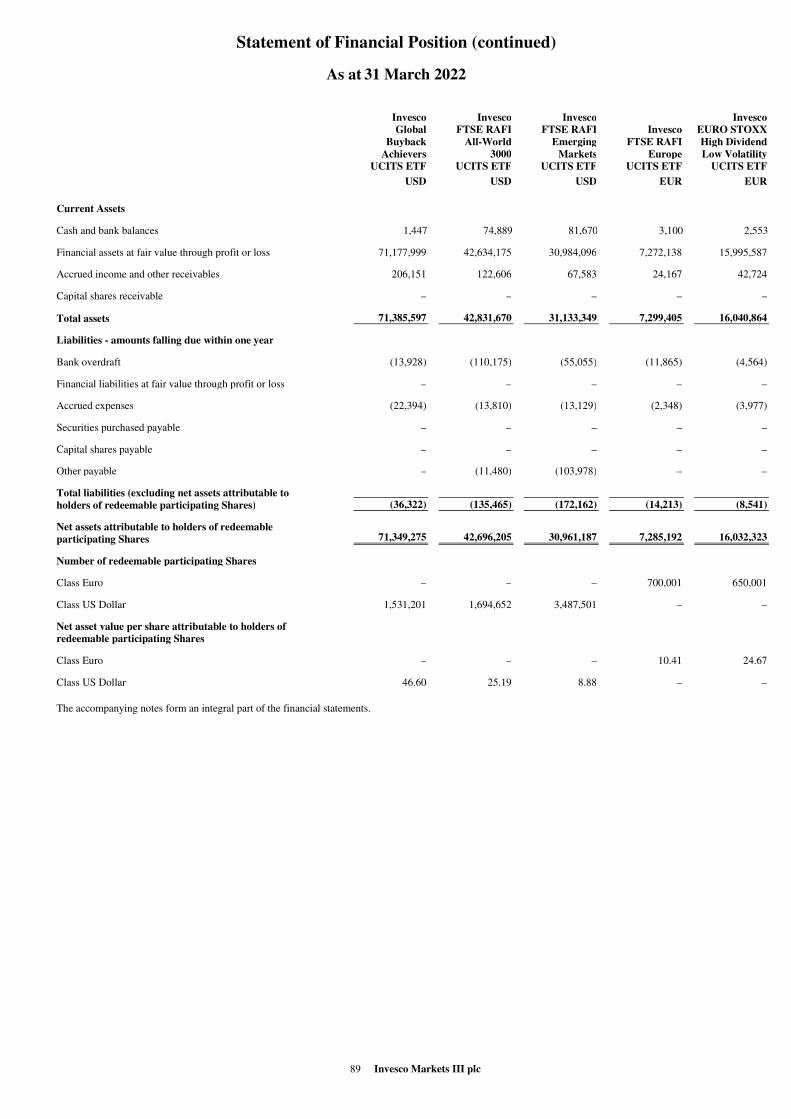
Statement of Financial Position (continued)
89 Invesco Markets III plc
As at 31 March 2022
Invesco Invesco Invesco Invesco
Global FTSE RAFI FTSE RAFI Invesco EURO STOXX
Buyback All-World Emerging FTSE RAFI High Dividend
Achievers 3000 Markets Europe Low Volatility
UCITS ETF UCITS ETF UCITS ETF UCITS ETF UCITS ETF
USD USD USD EUR EUR
Current Assets
Cash and bank balances 1,447 74,889 81,670 3,100 2,553
Financial assets at fair value through profit or loss 71,177,999 42,634,175 30,984,096 7,272,138 15,995,587
Accrued income and other receivables 206,151 122,606 67,583 24,167 42,724
Capital shares receivable – – – – –
Total assets 71,385,597 42,831,670 31,133,349 7,299,405 16,040,864
Liabilities - amounts falling due within one year
Bank overdraft (13,928) (110,175) (55,055) (11,865) (4,564)
Financial liabilities at fair value through profit or loss – – – – –
Accrued expenses (22,394) (13,810) (13,129) (2,348) (3,977)
Securities purchased payable – – – – –
Capital shares payable – – – – –
Other payable – (11,480) (103,978) – –
Total liabilities (excluding net assets attributable to
holders of redeemable participating Shares) (36,322) (135,465) (172,162) (14,213) (8,541)
Net assets attributable to holders of redeemable
participating Shares 71,349,275 42,696,205 30,961,187 7,285,192 16,032,323
Number of redeemable participating Shares
Class Euro – – – 700,001 650,001
Class US Dollar 1,531,201 1,694,652 3,487,501 – –
Net asset value per share attributable to holders of
redeemable participating Shares
Class Euro – – – 10.41 24.67
Class US Dollar 46.60 25.19 8.88 – –
The accompanying notes form an integral part of the financial statements.
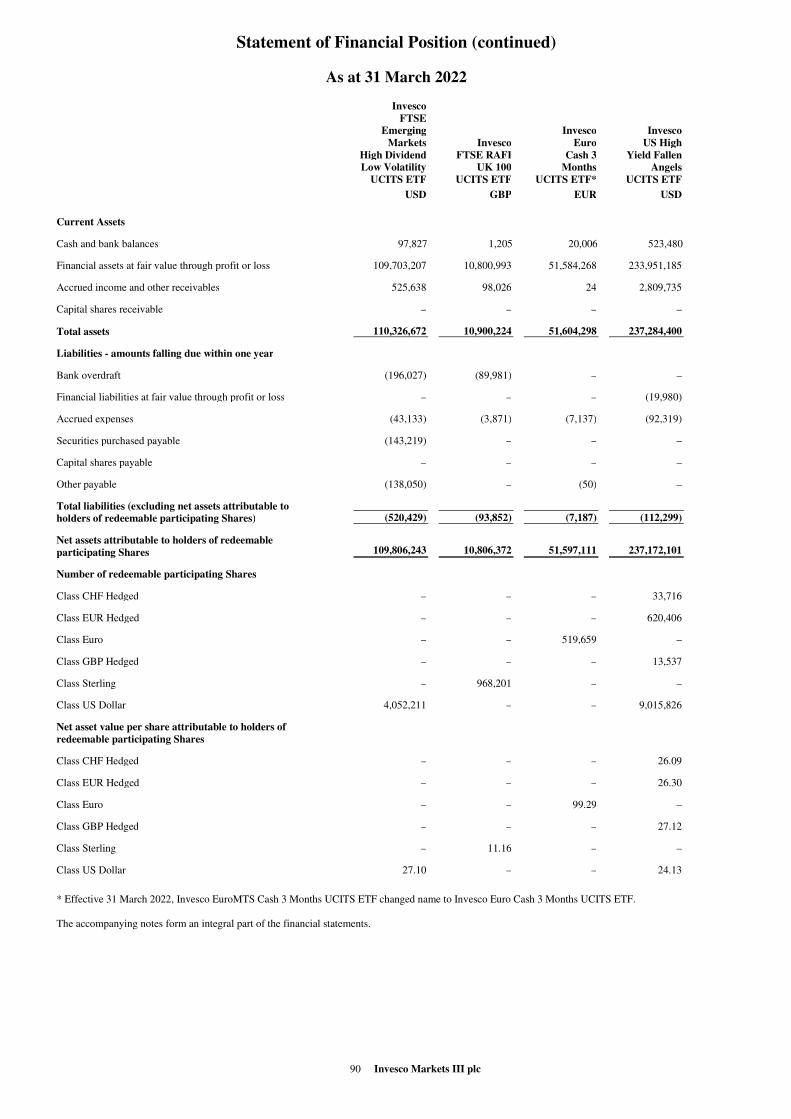
Statement of Financial Position (continued)
90 Invesco Markets III plc
As at 31 March 2022
Invesco
FTSE
Emerging Invesco Invesco
Markets Invesco Euro US High
High Dividend FTSE RAFI Cash 3 Yield Fallen
Low Volatility UK 100 Months Angels
UCITS ETF UCITS ETF UCITS ETF* UCITS ETF
USD GBP EUR USD
Current Assets
Cash and bank balances 97,827 1,205 20,006 523,480
Financial assets at fair value through profit or loss 109,703,207 10,800,993 51,584,268 233,951,185
Accrued income and other receivables 525,638 98,026 24 2,809,735
Capital shares receivable – – – –
Total assets 110,326,672 10,900,224 51,604,298 237,284,400
Liabilities - amounts falling due within one year
Bank overdraft (196,027) (89,981) – –
Financial liabilities at fair value through profit or loss – – – (19,980)
Accrued expenses (43,133) (3,871) (7,137) (92,319)
Securities purchased payable (143,219) – – –
Capital shares payable – – – –
Other payable (138,050) – (50) –
Total liabilities (excluding net assets attributable to
holders of redeemable participating Shares) (520,429) (93,852) (7,187) (112,299)
Net assets attributable to holders of redeemable
participating Shares 109,806,243 10,806,372 51,597,111 237,172,101
Number of redeemable participating Shares
Class CHF Hedged – – – 33,716
Class EUR Hedged – – – 620,406
Class Euro – – 519,659 –
Class GBP Hedged – – – 13,537
Class Sterling – 968,201 – –
Class US Dollar 4,052,211 – – 9,015,826
Net asset value per share attributable to holders of
redeemable participating Shares
Class CHF Hedged – – – 26.09
Class EUR Hedged – – – 26.30
Class Euro – – 99.29 –
Class GBP Hedged – – – 27.12
Class Sterling – 11.16 – –
Class US Dollar 27.10 – – 24.13
* Effective 31 March 2022, Invesco EuroMTS Cash 3 Months UCITS ETF changed name to Invesco Euro Cash 3 Months UCITS ETF.
The accompanying notes form an integral part of the financial statements.
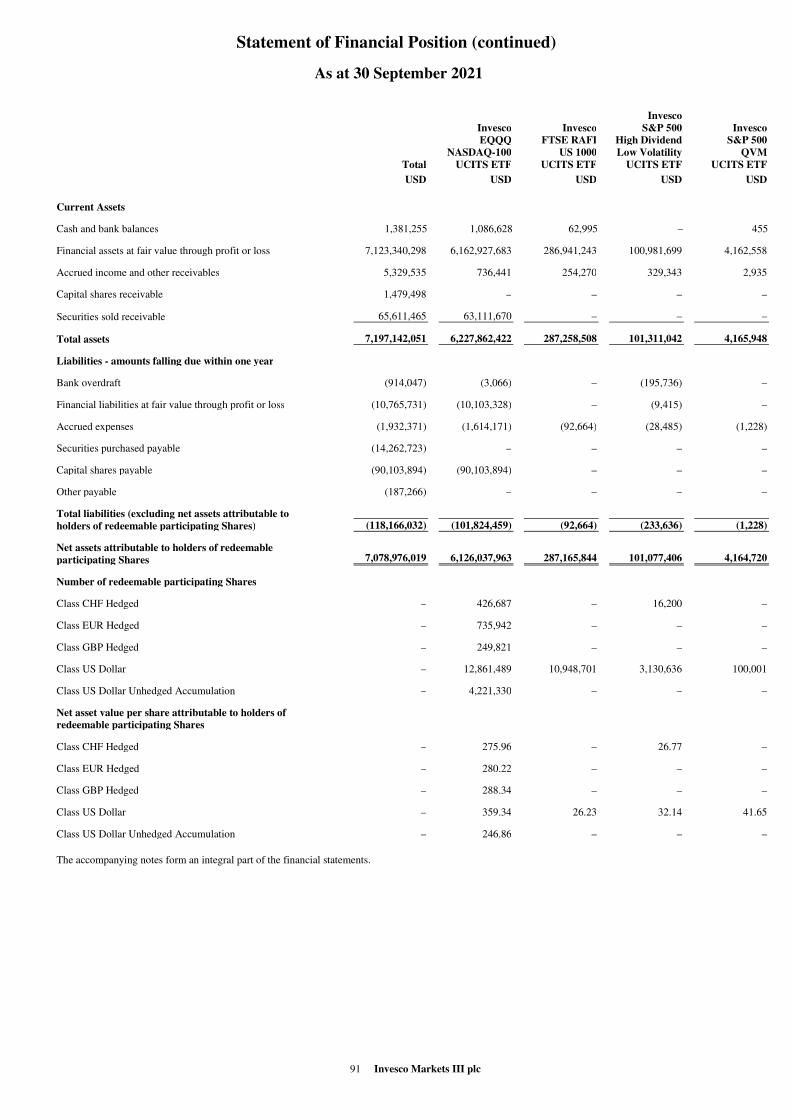
Statement of Financial Position (continued)
91 Invesco Markets III plc
As at 30 September 2021
Invesco
Invesco Invesco S&P 500 Invesco
EQQQ FTSE RAFI High Dividend S&P 500
NASDAQ-100 US 1000 Low Volatility QVM
Total UCITS ETF UCITS ETF UCITS ETF UCITS ETF
USD USD USD USD USD
Current Assets
Cash and bank balances 1,381,255 1,086,628 62,995 – 455
Financial assets at fair value through profit or loss 7,123,340,298 6,162,927,683 286,941,243 100,981,699 4,162,558
Accrued income and other receivables 5,329,535 736,441 254,270 329,343 2,935
Capital shares receivable 1,479,498 – – – –
Securities sold receivable 65,611,465 63,111,670 – – –
Total assets 7,197,142,051 6,227,862,422 287,258,508 101,311,042 4,165,948
Liabilities - amounts falling due within one year
Bank overdraft (914,047) (3,066) – (195,736) –
Financial liabilities at fair value through profit or loss (10,765,731) (10,103,328) – (9,415) –
Accrued expenses (1,932,371) (1,614,171) (92,664) (28,485) (1,228)
Securities purchased payable (14,262,723) – – – –
Capital shares payable (90,103,894) (90,103,894) – – –
Other payable (187,266) – – – –
Total liabilities (excluding net assets attributable to
holders of redeemable participating Shares) (118,166,032) (101,824,459) (92,664) (233,636) (1,228)
Net assets attributable to holders of redeemable
participating Shares 7,078,976,019 6,126,037,963 287,165,844 101,077,406 4,164,720
Number of redeemable participating Shares
Class CHF Hedged – 426,687 – 16,200 –
Class EUR Hedged – 735,942 – – –
Class GBP Hedged – 249,821 – – –
Class US Dollar – 12,861,489 10,948,701 3,130,636 100,001
Class US Dollar Unhedged Accumulation – 4,221,330 – – –
Net asset value per share attributable to holders of
redeemable participating Shares
Class CHF Hedged – 275.96 – 26.77 –
Class EUR Hedged – 280.22 – – –
Class GBP Hedged – 288.34 – – –
Class US Dollar – 359.34 26.23 32.14 41.65
Class US Dollar Unhedged Accumulation – 246.86 – – –
The accompanying notes form an integral part of the financial statements.
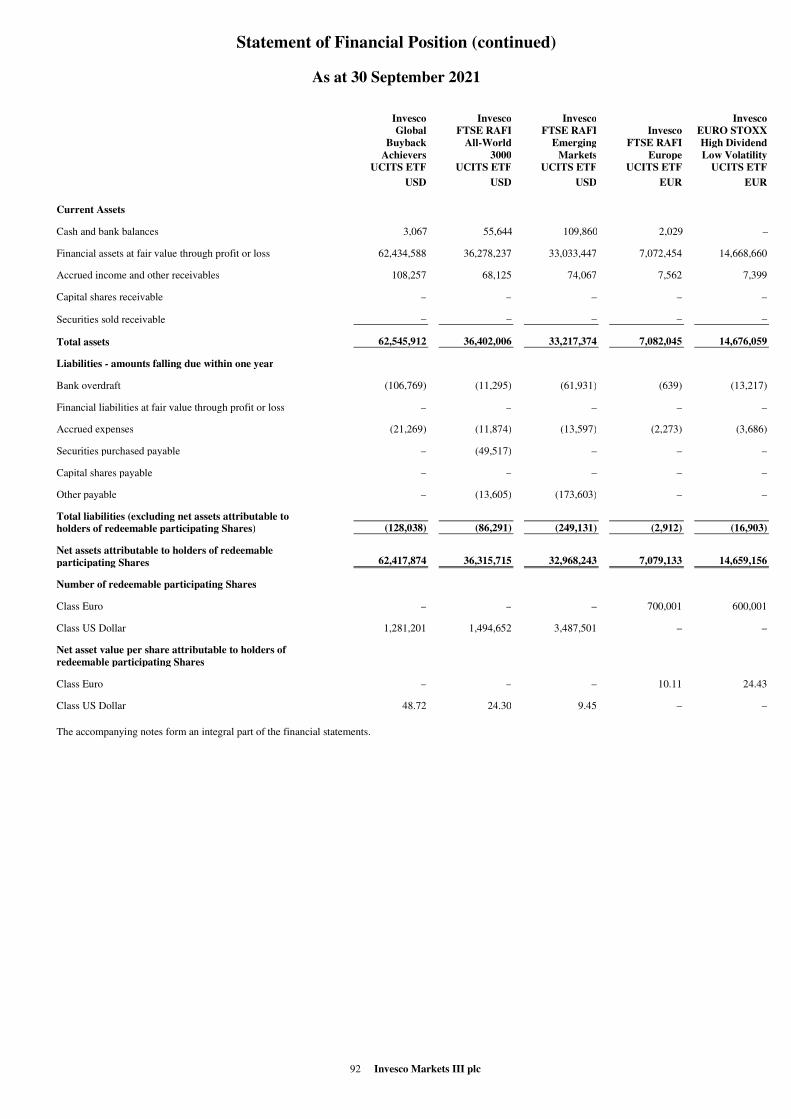
Statement of Financial Position (continued)
92 Invesco Markets III plc
As at 30 September 2021
Invesco Invesco Invesco Invesco
Global FTSE RAFI FTSE RAFI Invesco EURO STOXX
Buyback All-World Emerging FTSE RAFI High Dividend
Achievers 3000 Markets Europe Low Volatility
UCITS ETF UCITS ETF UCITS ETF UCITS ETF UCITS ETF
USD USD USD EUR EUR
Current Assets
Cash and bank balances 3,067 55,644 109,860 2,029 –
Financial assets at fair value through profit or loss 62,434,588 36,278,237 33,033,447 7,072,454 14,668,660
Accrued income and other receivables 108,257 68,125 74,067 7,562 7,399
Capital shares receivable – – – – –
Securities sold receivable – – – – –
Total assets 62,545,912 36,402,006 33,217,374 7,082,045 14,676,059
Liabilities - amounts falling due within one year
Bank overdraft (106,769) (11,295) (61,931) (639) (13,217)
Financial liabilities at fair value through profit or loss – – – – –
Accrued expenses (21,269) (11,874) (13,597) (2,273) (3,686)
Securities purchased payable – (49,517) – – –
Capital shares payable – – – – –
Other payable – (13,605) (173,603) – –
Total liabilities (excluding net assets attributable to
holders of redeemable participating Shares) (128,038) (86,291) (249,131) (2,912) (16,903)
Net assets attributable to holders of redeemable
participating Shares 62,417,874 36,315,715 32,968,243 7,079,133 14,659,156
Number of redeemable participating Shares
Class Euro – – – 700,001 600,001
Class US Dollar 1,281,201 1,494,652 3,487,501 – –
Net asset value per share attributable to holders of
redeemable participating Shares
Class Euro – – – 10.11 24.43
Class US Dollar 48.72 24.30 9.45 – –
The accompanying notes form an integral part of the financial statements.

Statement of Financial Position (continued)
93 Invesco Markets III plc
As at 30 September 2021
n
Invesco
FTSE
Emerging Invesco Invesco
Markets Invesco Euro US High
High Dividend FTSE RAFI Cash 3 Yield Fallen
Low Volatility UK 100 Months Angels
UCITS ETF UCITS ETF UCITS ETF* UCITS ETF
USD GBP EUR USD
Current Assets
Cash and bank balances 28,614 9,090 16,712 16
Financial assets at fair value through profit or loss 97,176,747 12,815,285 26,649,426 266,043,654
Accrued income and other receivables 500,967 28,672 24 3,199,104
Capital shares receivable 1,479,498 – – –
Securities sold receivable – – – 2,499,795
Total assets 99,185,826 12,853,047 26,666,162 271,742,569
Liabilities - amounts falling due within one year
Bank overdraft (268,384) (14,326) – (231,492)
Financial liabilities at fair value through profit or loss – – – (652,988)
Accrued expenses (39,322) (4,057) (3,288) (93,574)
Securities purchased payable – – – (14,213,206)
Capital shares payable – – – –
Other payable – – (50) –
Total liabilities (excluding net assets attributable to
holders of redeemable participating Shares) (307,706) (18,383) (3,338) (15,191,260)
Net assets attributable to holders of redeemable
participating Shares 98,878,120 12,834,664 26,662,824 256,551,309
Number of redeemable participating Shares
Class CHF Hedged – – – 35,816
Class EUR Hedged – – – 998,809
Class Euro – – 267,409 –
Class GBP Hedged – – – 11,622
Class Sterling – 1,268,201 – –
Class US Dollar 3,341,611 – – 8,547,207
Net asset value per share attributable to holders of
redeemable participating Shares
Class CHF Hedged – – – 27.74
Class EUR Hedged – – – 27.93
Class Euro – – 99.71 –
Class GBP Hedged – – – 28.68
Class Sterling – 10.12 – –
Class US Dollar 29.59 – – 26.06
* Effective 31 March 2022, Invesco EuroMTS Cash 3 Months UCITS ETF changed name to Invesco Euro Cash 3 Months UCITS ETF.
The accompanying notes form an integral part of the financial statements.
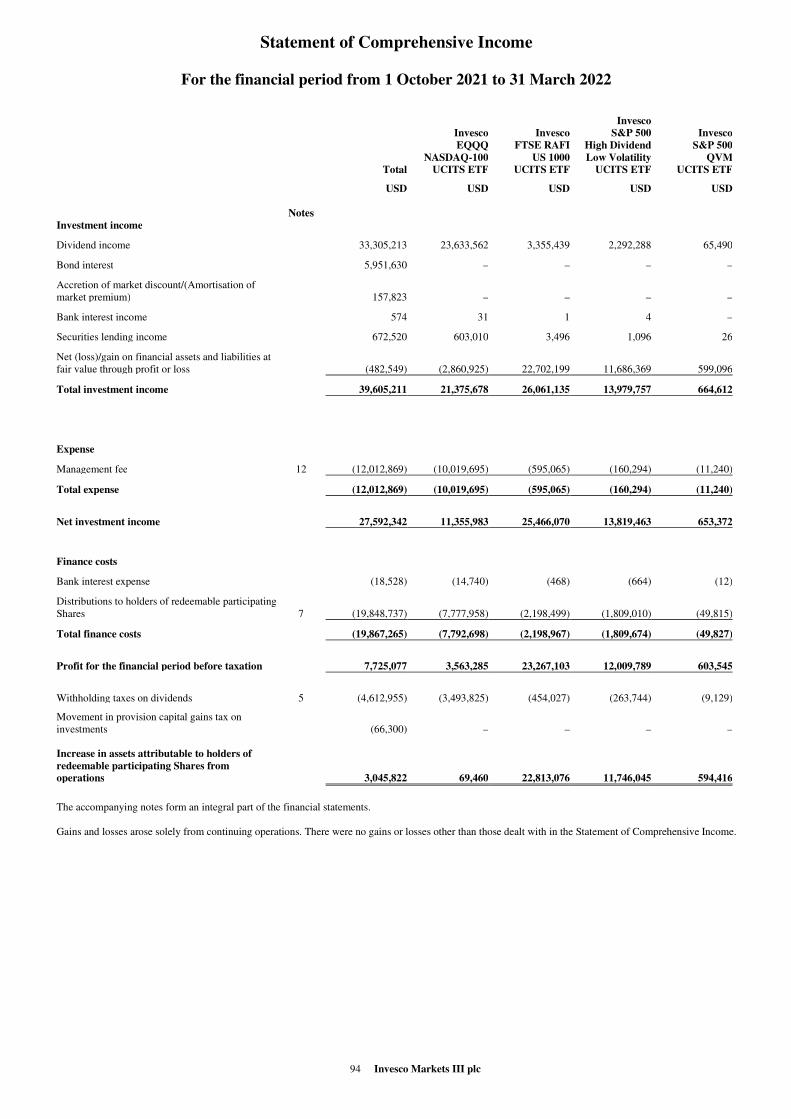
Statement of Comprehensive Income
94 Invesco Markets III plc
For the financial period from 1 October 2021 to 31 March 2022
Invesco
Invesco Invesco S&P 500 Invesco
EQQQ FTSE RAFI High Dividend S&P 500
NASDAQ-100 US 1000 Low Volatility QVM
Total UCITS ETF UCITS ETF UCITS ETF UCITS ETF
USD USD USD USD USD
Notes
Investment income
Dividend income 33,305,213 23,633,562 3,355,439 2,292,288 65,490
Bond interest 5,951,630 – – – –
Accretion of market discount/(Amortisation of
market premium) 157,823 – – – –
Bank interest income 574 31 1 4 –
Securities lending income 672,520 603,010 3,496 1,096 26
Net (loss)/gain on financial assets and liabilities at
fair value through profit or loss (482,549) (2,860,925) 22,702,199 11,686,369 599,096
Total investment income 39,605,211 21,375,678 26,061,135 13,979,757 664,612
Expense
Management fee 12 (12,012,869) (10,019,695) (595,065) (160,294) (11,240)
Total expense (12,012,869) (10,019,695) (595,065) (160,294) (11,240)
Net investment income 27,592,342 11,355,983 25,466,070 13,819,463 653,372
Finance costs
Bank interest expense (18,528) (14,740) (468) (664) (12)
Distributions to holders of redeemable participating
Shares 7 (19,848,737) (7,777,958) (2,198,499) (1,809,010) (49,815)
Total finance costs (19,867,265) (7,792,698) (2,198,967) (1,809,674) (49,827)
Profit for the financial period before taxation 7,725,077 3,563,285 23,267,103 12,009,789 603,545
Withholding taxes on dividends 5 (4,612,955) (3,493,825) (454,027) (263,744) (9,129)
Movement in provision capital gains tax on
investments (66,300) – – – –
Increase in assets attributable to holders of
redeemable participating Shares from
operations 3,045,822 69,460 22,813,076 11,746,045 594,416
The accompanying notes form an integral part of the financial statements.
Gains and losses arose solely from continuing operations. There were no gains or losses other than those dealt with in the Statement of Comprehensive Income.
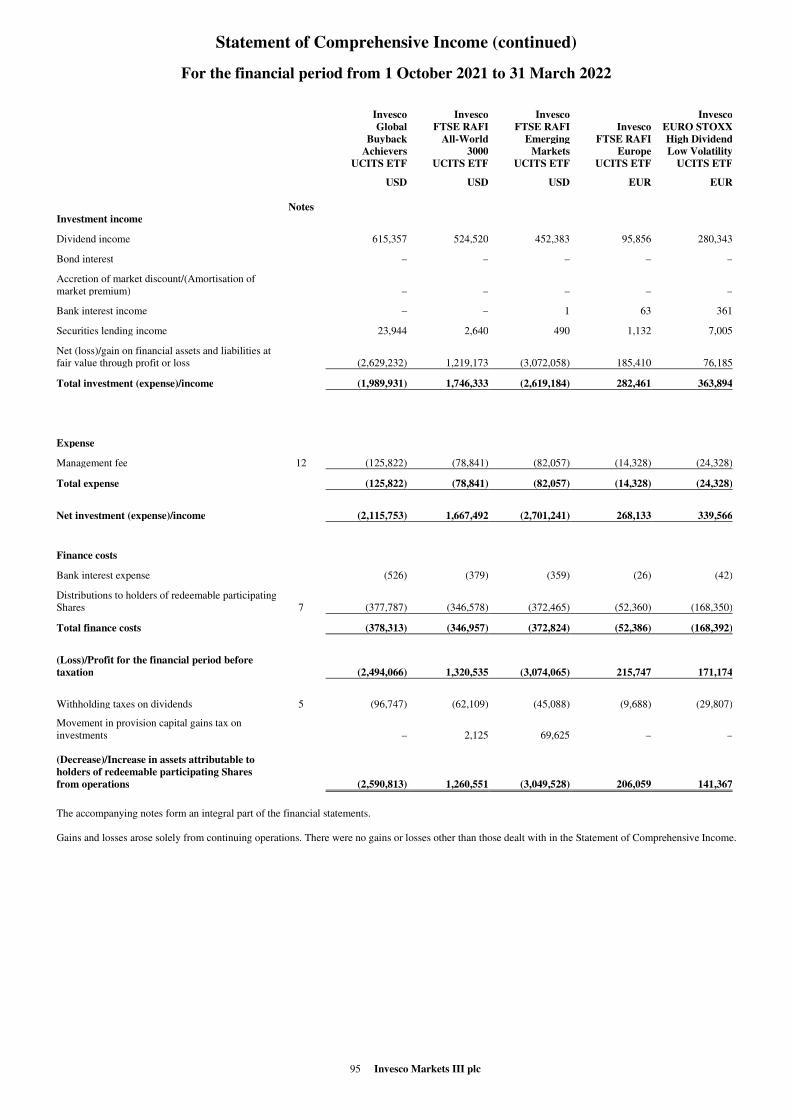
Statement of Comprehensive Income (continued)
95 Invesco Markets III plc
For the financial period from 1 October 2021 to 31 March 2022
Invesco Invesco Invesco Invesco
Global FTSE RAFI FTSE RAFI Invesco EURO STOXX
Buyback All-World Emerging FTSE RAFI High Dividend
Achievers 3000 Markets Europe Low Volatility
UCITS ETF UCITS ETF UCITS ETF UCITS ETF UCITS ETF
USD USD USD EUR EUR
Notes
Investment income
Dividend income 615,357 524,520 452,383 95,856 280,343
Bond interest – – – – –
Accretion of market discount/(Amortisation of
market premium) – – – – –
Bank interest income – – 1 63 361
Securities lending income 23,944 2,640 490 1,132 7,005
Net (loss)/gain on financial assets and liabilities at
fair value through profit or loss (2,629,232) 1,219,173 (3,072,058) 185,410 76,185
Total investment (expense)/income (1,989,931) 1,746,333 (2,619,184) 282,461 363,894
Expense
Management fee 12 (125,822) (78,841) (82,057) (14,328) (24,328)
Total expense (125,822) (78,841) (82,057) (14,328) (24,328)
Net investment (expense)/income (2,115,753) 1,667,492 (2,701,241) 268,133 339,566
Finance costs
Bank interest expense (526) (379) (359) (26) (42)
Distributions to holders of redeemable participating
Shares 7 (377,787) (346,578) (372,465) (52,360) (168,350)
Total finance costs (378,313) (346,957) (372,824) (52,386) (168,392)
(Loss)/Profit for the financial period before
taxation (2,494,066) 1,320,535 (3,074,065) 215,747 171,174
Withholding taxes on dividends 5 (96,747) (62,109) (45,088) (9,688) (29,807)
Movement in provision capital gains tax on
investments – 2,125 69,625 – –
(Decrease)/Increase in assets attributable to
holders of redeemable participating Shares
from operations (2,590,813) 1,260,551 (3,049,528) 206,059 141,367
The accompanying notes form an integral part of the financial statements.
Gains and losses arose solely from continuing operations. There were no gains or losses other than those dealt with in the Statement of Comprehensive Income.
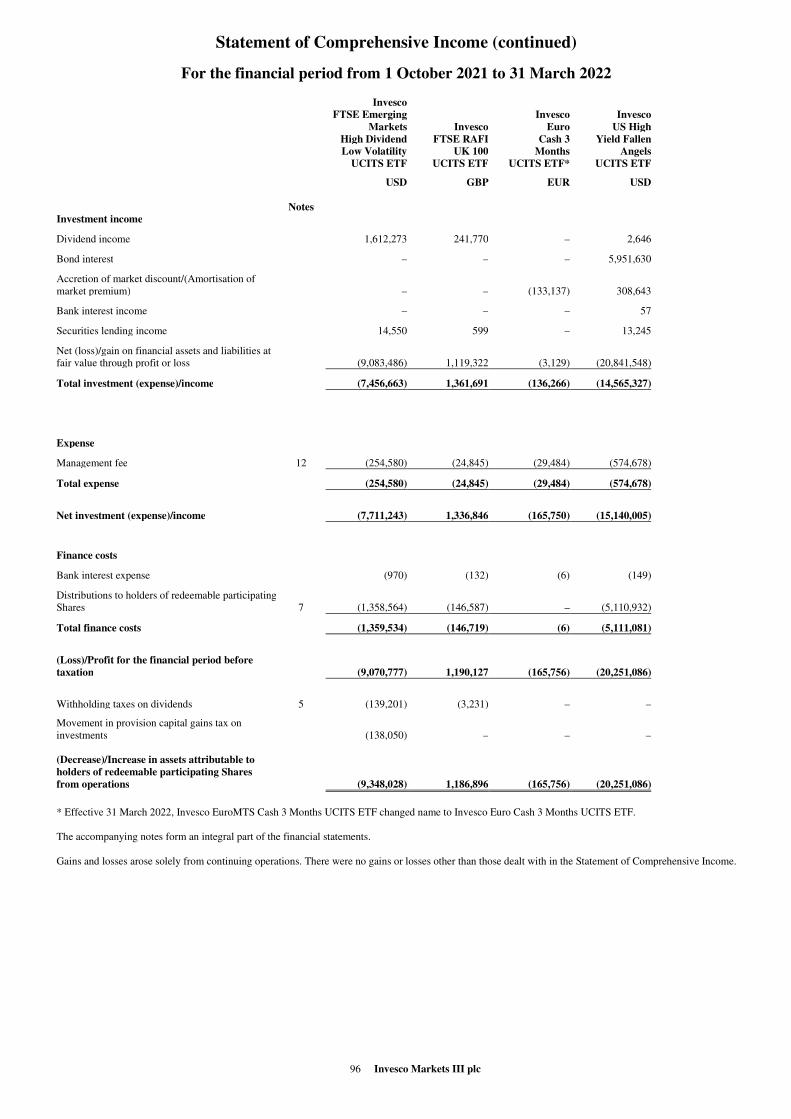
Statement of Comprehensive Income (continued)
96 Invesco Markets III plc
For the financial period from 1 October 2021 to 31 March 2022
Invesco
FTSE Emerging Invesco Invesco
Markets Invesco Euro US High
High Dividend FTSE RAFI Cash 3 Yield Fallen
Low Volatility UK 100 Months Angels
UCITS ETF UCITS ETF UCITS ETF* UCITS ETF
USD GBP EUR USD
Notes
Investment income
Dividend income 1,612,273 241,770 – 2,646
Bond interest – – – 5,951,630
Accretion of market discount/(Amortisation of
market premium) – – (133,137) 308,643
Bank interest income – – – 57
Securities lending income 14,550 599 – 13,245
Net (loss)/gain on financial assets and liabilities at
fair value through profit or loss (9,083,486) 1,119,322 (3,129) (20,841,548)
Total investment (expense)/income (7,456,663) 1,361,691 (136,266) (14,565,327)
Expense
Management fee 12 (254,580) (24,845) (29,484) (574,678)
Total expense (254,580) (24,845) (29,484) (574,678)
Net investment (expense)/income (7,711,243) 1,336,846 (165,750) (15,140,005)
Finance costs
Bank interest expense (970) (132) (6) (149)
Distributions to holders of redeemable participating
Shares 7 (1,358,564) (146,587) – (5,110,932)
Total finance costs (1,359,534) (146,719) (6) (5,111,081)
(Loss)/Profit for the financial period before
taxation (9,070,777) 1,190,127 (165,756) (20,251,086)
Withholding taxes on dividends 5 (139,201) (3,231) – –
Movement in provision capital gains tax on
investments (138,050) – – –
(Decrease)/Increase in assets attributable to
holders of redeemable participating Shares
from operations (9,348,028) 1,186,896 (165,756) (20,251,086)
* Effective 31 March 2022, Invesco EuroMTS Cash 3 Months UCITS ETF changed name to Invesco Euro Cash 3 Months UCITS ETF.
The accompanying notes form an integral part of the financial statements.
Gains and losses arose solely from continuing operations. There were no gains or losses other than those dealt with in the Statement of Comprehensive Income.

Statement of Comprehensive Income (continued)
97 Invesco Markets III plc
For the financial period from 1 October 2020 to 31 March 2021
Invesco
Invesco Invesco S&P 500 Invesco
EQQQ FTSE RAFI High Dividend S&P 500
NASDAQ-100 US 1000 Low Volatility QVM
Total UCITS ETF UCITS ETF UCITS ETF UCITS ETF
USD USD USD USD USD
Notes
Investment income
Dividend income 29,178,847 22,120,984 2,316,312 2,063,720 60,262
Bond interest 7,839,945 – – – –
Accretion of market discount/(Amortisation of
market premium) 995,686 – – – –
Bank interest income 213 – – – –
Net gain on financial assets and liabilities at fair
value through profit or loss 844,947,544 698,594,715 56,481,896 21,635,253 824,482
Total investment income 882,962,235 720,715,699 58,798,208 23,698,973 884,744
Expense
Management fee 12 (9,896,975) (8,179,838) (387,750) (123,880) (11,331)
Total expense (9,896,975) (8,179,838) (387,750) (123,880) (11,331)
Net investment income 873,065,260 712,535,861 58,410,458 23,575,093 873,413
Finance costs
Bank interest expense (9,037) (6,744) (281) (581) (5)
Distributions to holders of redeemable participating
Shares 7 (21,024,266) (7,688,239) (1,550,382) (1,600,414) (39,795)
Total finance costs (21,033,303) (7,694,983) (1,550,663) (1,600,995) (39,800)
Profit for the financial period before taxation 852,031,957 704,840,878 56,859,795 21,974,098 833,613
Withholding taxes on dividends 5 (4,222,201) (3,309,996) (308,543) (223,175) (8,410)
Movement in provision capital gains tax on
investments 89,223 – – – –
Increase in assets attributable to holders of
redeemable participating Shares from
operations 847,898,979 701,530,882 56,551,252 21,750,923 825,203
The accompanying notes form an integral part of the financial statements.
Gains and losses arose solely from continuing operations. There were no gains or losses other than those dealt with in the Statement of Comprehensive Income.
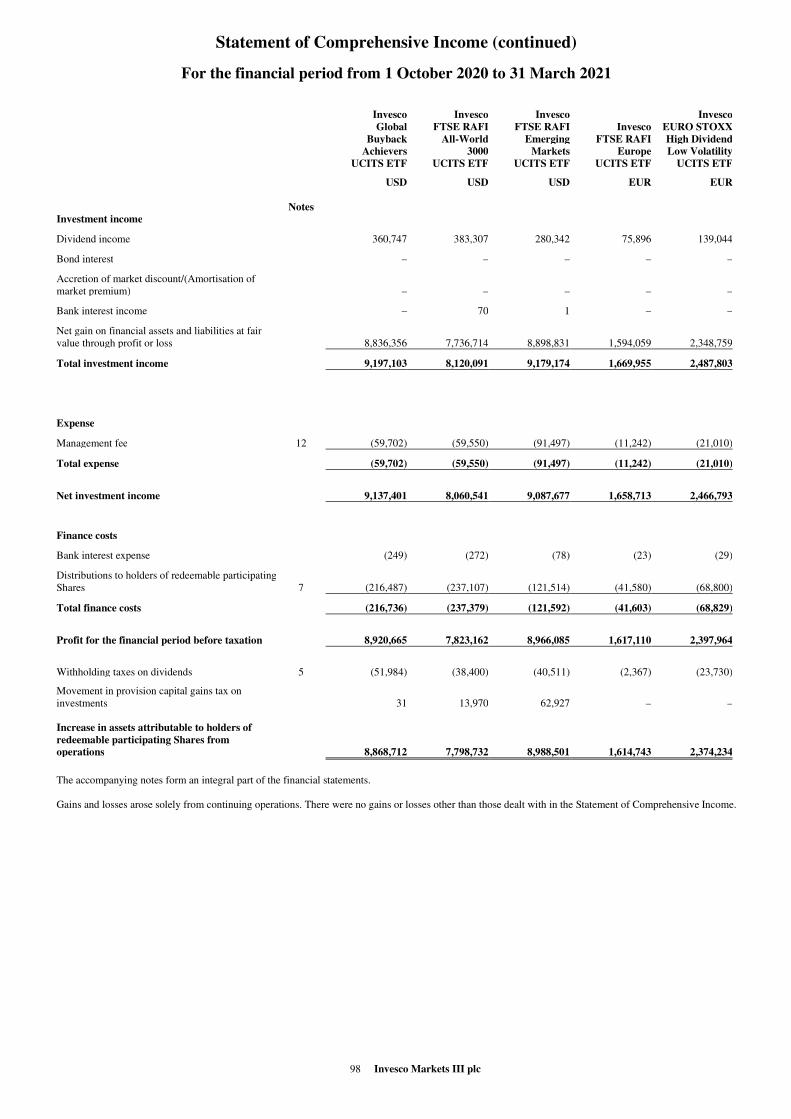
Statement of Comprehensive Income (continued)
98 Invesco Markets III plc
For the financial period from 1 October 2020 to 31 March 2021
Invesco Invesco Invesco Invesco
Global FTSE RAFI FTSE RAFI Invesco EURO STOXX
Buyback All-World Emerging FTSE RAFI High Dividend
Achievers 3000 Markets Europe Low Volatility
UCITS ETF UCITS ETF UCITS ETF UCITS ETF UCITS ETF
USD USD USD EUR EUR
Notes
Investment income
Dividend income 360,747 383,307 280,342 75,896 139,044
Bond interest – – – – –
Accretion of market discount/(Amortisation of
market premium) – – – – –
Bank interest income – 70 1 – –
Net gain on financial assets and liabilities at fair
value through profit or loss 8,836,356 7,736,714 8,898,831 1,594,059 2,348,759
Total investment income 9,197,103 8,120,091 9,179,174 1,669,955 2,487,803
Expense
Management fee 12 (59,702) (59,550) (91,497) (11,242) (21,010)
Total expense (59,702) (59,550) (91,497) (11,242) (21,010)
Net investment income 9,137,401 8,060,541 9,087,677 1,658,713 2,466,793
Finance costs
Bank interest expense (249) (272) (78) (23) (29)
Distributions to holders of redeemable participating
Shares 7 (216,487) (237,107) (121,514) (41,580) (68,800)
Total finance costs (216,736) (237,379) (121,592) (41,603) (68,829)
Profit for the financial period before taxation 8,920,665 7,823,162 8,966,085 1,617,110 2,397,964
Withholding taxes on dividends 5 (51,984) (38,400) (40,511) (2,367) (23,730)
Movement in provision capital gains tax on
investments 31 13,970 62,927 – –
Increase in assets attributable to holders of
redeemable participating Shares from
operations 8,868,712 7,798,732 8,988,501 1,614,743 2,374,234
The accompanying notes form an integral part of the financial statements.
Gains and losses arose solely from continuing operations. There were no gains or losses other than those dealt with in the Statement of Comprehensive Income.
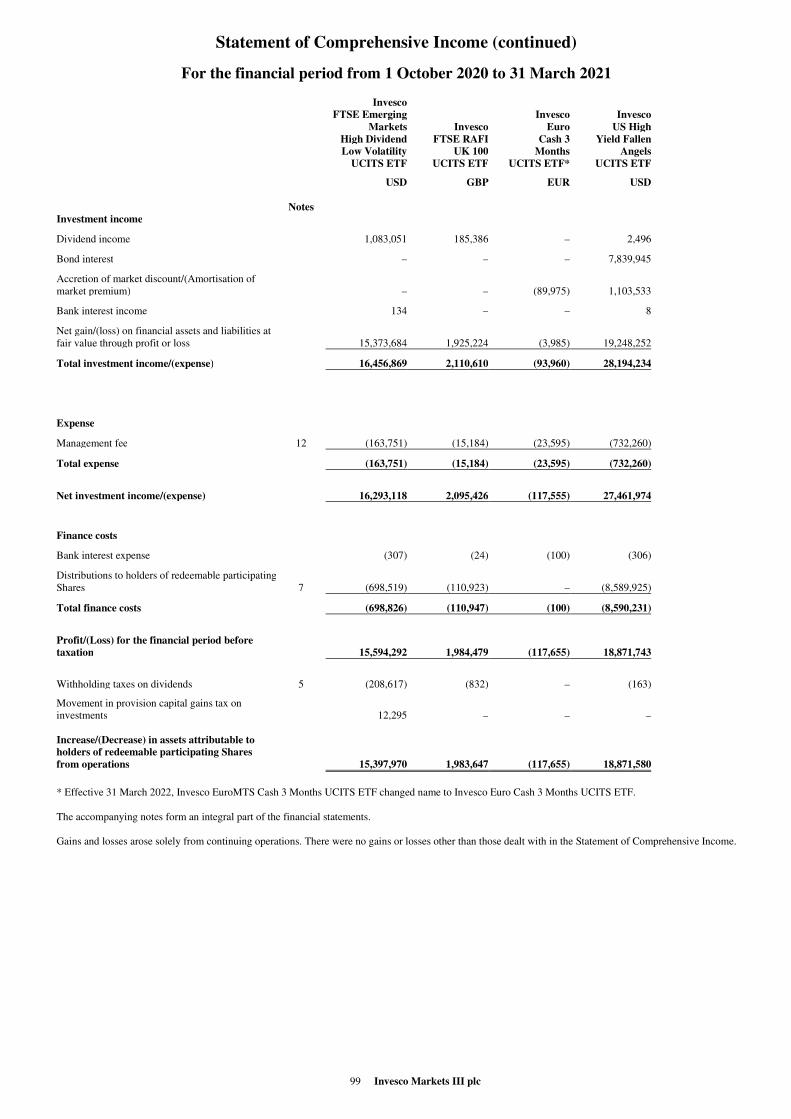
Statement of Comprehensive Income (continued)
99 Invesco Markets III plc
For the financial period from 1 October 2020 to 31 March 2021
Invesco
FTSE Emerging Invesco Invesco
Markets Invesco Euro US High
High Dividend FTSE RAFI Cash 3 Yield Fallen
Low Volatility UK 100 Months Angels
UCITS ETF UCITS ETF UCITS ETF* UCITS ETF
USD GBP EUR USD
Notes
Investment income
Dividend income 1,083,051 185,386 – 2,496
Bond interest – – – 7,839,945
Accretion of market discount/(Amortisation of
market premium) – – (89,975) 1,103,533
Bank interest income 134 – – 8
Net gain/(loss) on financial assets and liabilities at
fair value through profit or loss 15,373,684 1,925,224 (3,985) 19,248,252
Total investment income/(expense) 16,456,869 2,110,610 (93,960) 28,194,234
Expense
Management fee 12 (163,751) (15,184) (23,595) (732,260)
Total expense (163,751) (15,184) (23,595) (732,260)
Net investment income/(expense) 16,293,118 2,095,426 (117,555) 27,461,974
Finance costs
Bank interest expense (307) (24) (100) (306)
Distributions to holders of redeemable participating
Shares 7 (698,519) (110,923) – (8,589,925)
Total finance costs (698,826) (110,947) (100) (8,590,231)
Profit/(Loss) for the financial period before
taxation 15,594,292 1,984,479 (117,655) 18,871,743
Withholding taxes on dividends 5 (208,617) (832) – (163)
Movement in provision capital gains tax on
investments 12,295 – – –
Increase/(Decrease) in assets attributable to
holders of redeemable participating Shares
from operations 15,397,970 1,983,647 (117,655) 18,871,580
* Effective 31 March 2022, Invesco EuroMTS Cash 3 Months UCITS ETF changed name to Invesco Euro Cash 3 Months UCITS ETF.
The accompanying notes form an integral part of the financial statements.
Gains and losses arose solely from continuing operations. There were no gains or losses other than those dealt with in the Statement of Comprehensive Income.
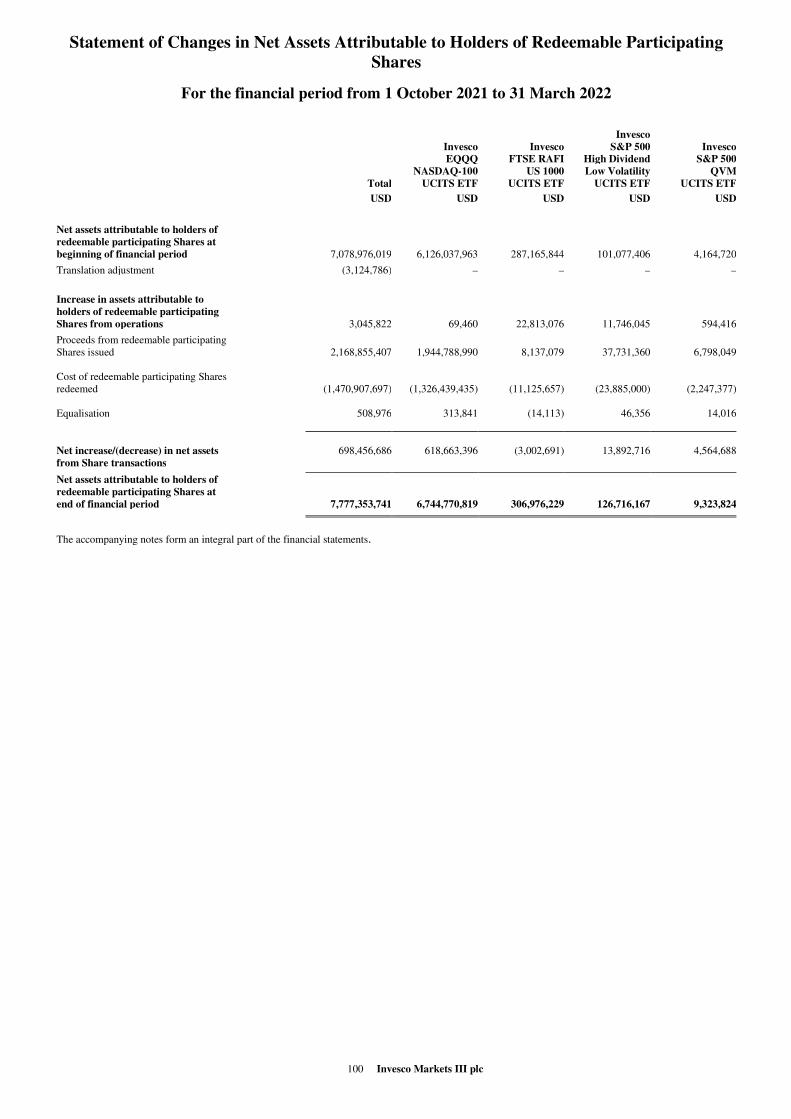
Statement of Changes in Net Assets Attributable to Holders of Redeemable Participating
Shares
100 Invesco Markets III plc
For the financial period from 1 October 2021 to 31 March 2022
Invesco
Invesco Invesco S&P 500 Invesco
EQQQ FTSE RAFI High Dividend S&P 500
NASDAQ-100 US 1000 Low Volatility QVM
Total UCITS ETF UCITS ETF UCITS ETF UCITS ETF
USD USD USD USD USD
Net assets attributable to holders of
redeemable participating Shares at
beginning of financial period 7,078,976,019 6,126,037,963 287,165,844 101,077,406 4,164,720
Translation adjustment (3,124,786) – – – –
Increase in assets attributable to
holders of redeemable participating
Shares from operations 3,045,822 69,460 22,813,076 11,746,045 594,416
Proceeds from redeemable participating
Shares issued 2,168,855,407 1,944,788,990 8,137,079 37,731,360 6,798,049
Cost of redeemable participating Shares
redeemed (1,470,907,697) (1,326,439,435) (11,125,657) (23,885,000) (2,247,377)
Equalisation 508,976 313,841 (14,113) 46,356 14,016
Net increase/(decrease) in net assets
from Share transactions
698,456,686 618,663,396 (3,002,691) 13,892,716 4,564,688
Net assets attributable to holders of
redeemable participating Shares at
end of financial period 7,777,353,741 6,744,770,819 306,976,229 126,716,167 9,323,824
The accompanying notes form an integral part of the financial statements.
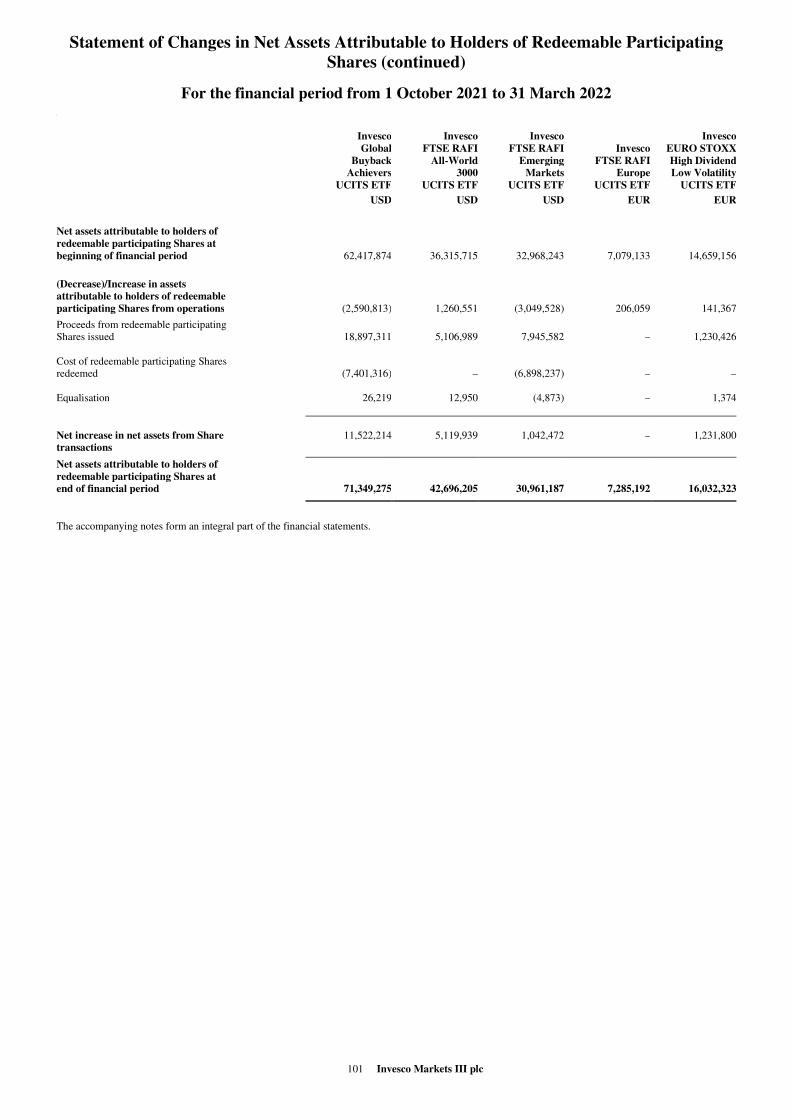
Statement of Changes in Net Assets Attributable to Holders of Redeemable Participating
Shares (continued)
101 Invesco Markets III plc
For the financial period from 1 October 2021 to 31 March 2022
a
Invesco Invesco Invesco Invesco
Global FTSE RAFI FTSE RAFI Invesco EURO STOXX
Buyback All-World Emerging FTSE RAFI High Dividend
Achievers 3000 Markets Europe Low Volatility
UCITS ETF UCITS ETF UCITS ETF UCITS ETF UCITS ETF
USD USD USD EUR EUR
Net assets attributable to holders of
redeemable participating Shares at
beginning of financial period 62,417,874 36,315,715 32,968,243 7,079,133 14,659,156
(Decrease)/Increase in assets
attributable to holders of redeemable
participating Shares from operations (2,590,813) 1,260,551 (3,049,528) 206,059 141,367
Proceeds from redeemable participating
Shares issued 18,897,311 5,106,989 7,945,582 – 1,230,426
Cost of redeemable participating Shares
redeemed (7,401,316) – (6,898,237) – –
Equalisation 26,219 12,950 (4,873) – 1,374
Net increase in net assets from Share
transactions
11,522,214 5,119,939 1,042,472 – 1,231,800
Net assets attributable to holders of
redeemable participating Shares at
end of financial period 71,349,275 42,696,205 30,961,187 7,285,192 16,032,323
The accompanying notes form an integral part of the financial statements.
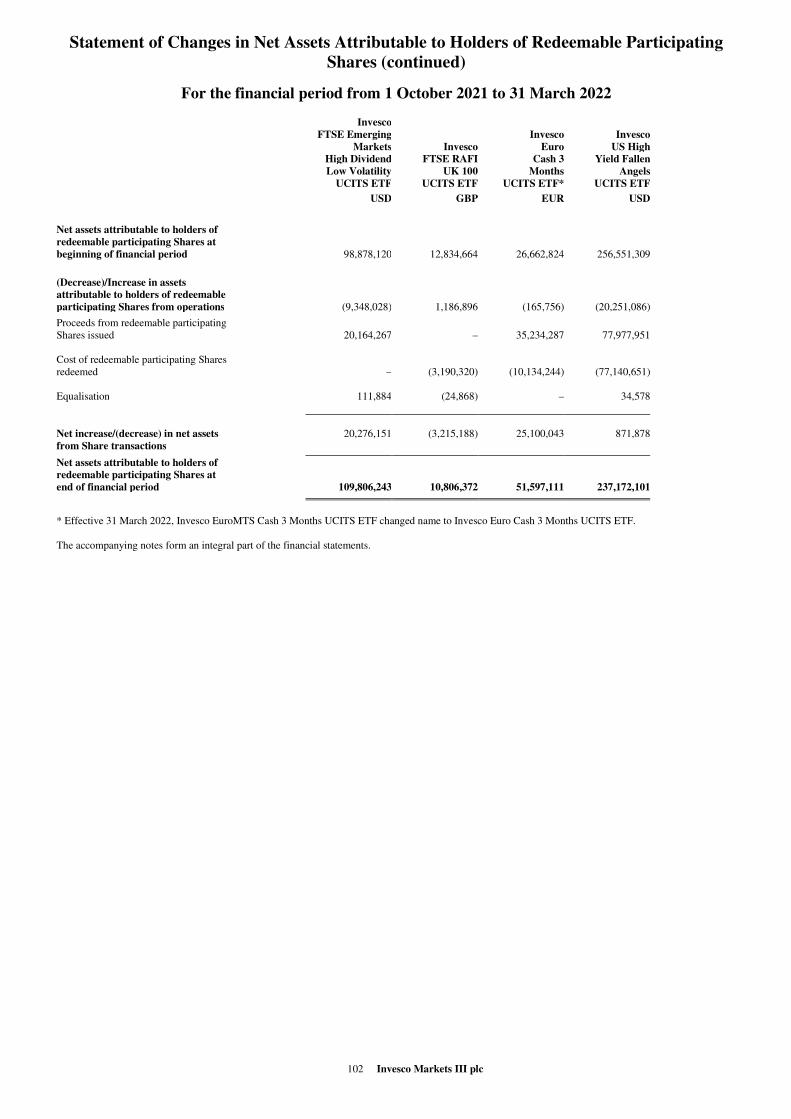
Statement of Changes in Net Assets Attributable to Holders of Redeemable Participating
Shares (continued)
102 Invesco Markets III plc
For the financial period from 1 October 2021 to 31 March 2022
Invesco
FTSE Emerging Invesco Invesco
Markets Invesco Euro US High
High Dividend FTSE RAFI Cash 3 Yield Fallen
Low Volatility UK 100 Months Angels
UCITS ETF UCITS ETF UCITS ETF* UCITS ETF
USD GBP EUR USD
Net assets attributable to holders of
redeemable participating Shares at
beginning of financial period 98,878,120 12,834,664 26,662,824 256,551,309
(Decrease)/Increase in assets
attributable to holders of redeemable
participating Shares from operations (9,348,028) 1,186,896 (165,756) (20,251,086)
Proceeds from redeemable participating
Shares issued 20,164,267 – 35,234,287 77,977,951
Cost of redeemable participating Shares
redeemed – (3,190,320) (10,134,244) (77,140,651)
Equalisation 111,884 (24,868) – 34,578
Net increase/(decrease) in net assets
from Share transactions
20,276,151 (3,215,188) 25,100,043 871,878
Net assets attributable to holders of
redeemable participating Shares at
end of financial period 109,806,243 10,806,372 51,597,111 237,172,101
* Effective 31 March 2022, Invesco EuroMTS Cash 3 Months UCITS ETF changed name to Invesco Euro Cash 3 Months UCITS ETF.
The accompanying notes form an integral part of the financial statements.

Statement of Changes in Net Assets Attributable to Holders of Redeemable Participating
Shares (continued)
103 Invesco Markets III plc
For the financial period from 1 October 2020 to 31 March 2021
Invesco
Invesco Invesco S&P 500 Invesco
EQQQ FTSE RAFI High Dividend S&P 500
NASDAQ-100 US 1000 Low Volatility QVM
Total UCITS ETF UCITS ETF UCITS ETF UCITS ETF
USD USD USD USD USD
Net assets attributable to holders of
redeemable participating Shares at
beginning of financial period 6,006,449,524 5,323,097,858 164,992,480 75,852,166 6,794,831
Translation adjustment 807,989 – – – –
Increase in assets attributable to
holders of redeemable participating
Shares from operations 847,898,979 701,530,882 56,551,252 21,750,923 825,203
Proceeds from redeemable participating
Shares issued 1,438,218,498 1,126,517,105 40,354,133 42,048,223 –
Cost of redeemable participating Shares
redeemed (2,107,380,641) (1,939,538,571) (27,164,409) (45,686,472) (1,875,131)
Equalisation 288,506 (839,741) 23,171 (41,893) (1,830)
Net (decrease)/increase in net assets
from Share transactions
(668,873,637) (813,861,207) 13,212,895 (3,680,142) (1,876,961)
Net assets attributable to holders of
redeemable participating Shares at
end of financial period 6,186,282,855 5,210,767,533 234,756,627 93,922,947 5,743,073
The accompanying notes form an integral part of the financial statements.
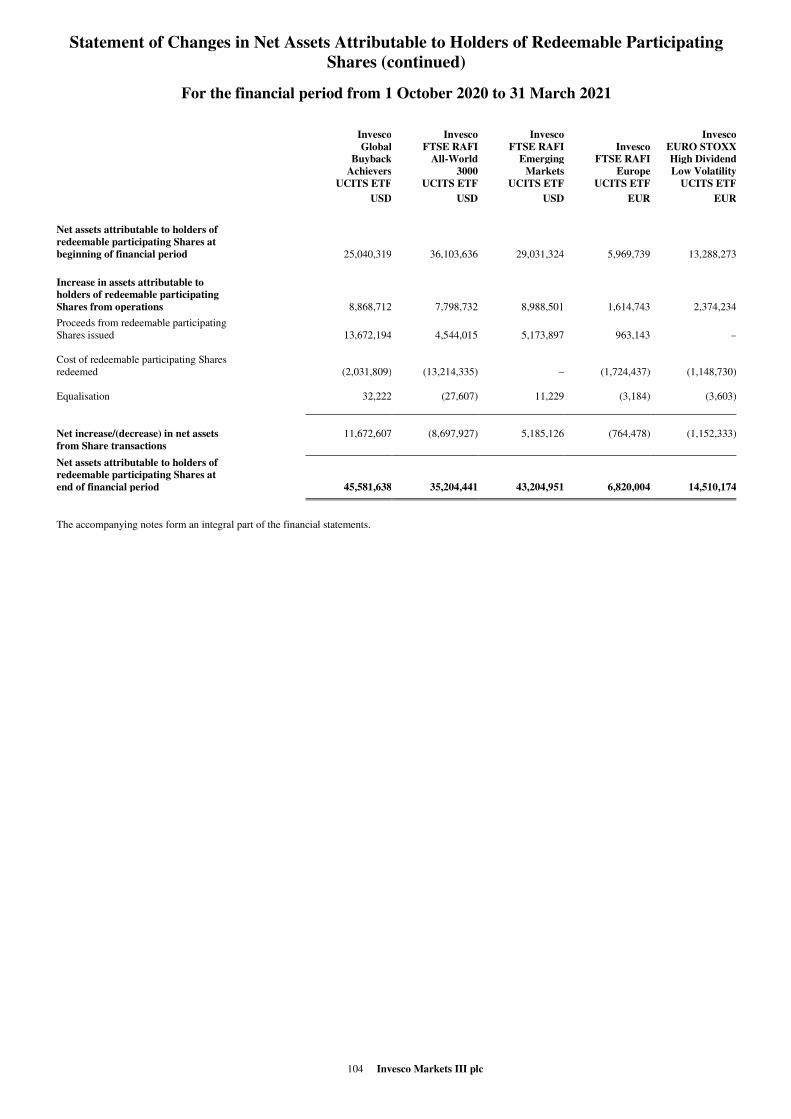
Statement of Changes in Net Assets Attributable to Holders of Redeemable Participating
Shares (continued)
104 Invesco Markets III plc
For the financial period from 1 October 2020 to 31 March 2021
Invesco Invesco Invesco Invesco
Global FTSE RAFI FTSE RAFI Invesco EURO STOXX
Buyback All-World Emerging FTSE RAFI High Dividend
Achievers 3000 Markets Europe Low Volatility
UCITS ETF UCITS ETF UCITS ETF UCITS ETF UCITS ETF
USD USD USD EUR EUR
Net assets attributable to holders of
redeemable participating Shares at
beginning of financial period 25,040,319 36,103,636 29,031,324 5,969,739 13,288,273
Increase in assets attributable to
holders of redeemable participating
Shares from operations 8,868,712 7,798,732 8,988,501 1,614,743 2,374,234
Proceeds from redeemable participating
Shares issued 13,672,194 4,544,015 5,173,897 963,143 –
Cost of redeemable participating Shares
redeemed (2,031,809) (13,214,335) – (1,724,437) (1,148,730)
Equalisation 32,222 (27,607) 11,229 (3,184) (3,603)
Net increase/(decrease) in net assets
from Share transactions
11,672,607 (8,697,927) 5,185,126 (764,478) (1,152,333)
Net assets attributable to holders of
redeemable participating Shares at
end of financial period 45,581,638 35,204,441 43,204,951 6,820,004 14,510,174
The accompanying notes form an integral part of the financial statements.
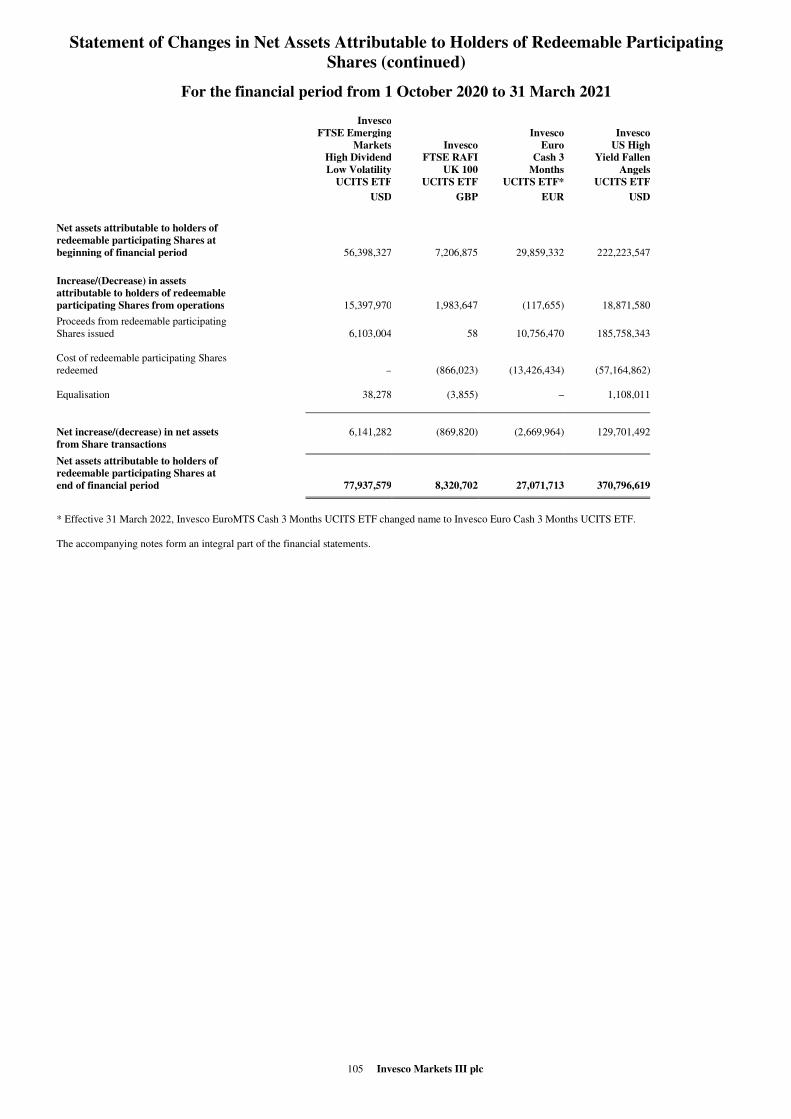
Statement of Changes in Net Assets Attributable to Holders of Redeemable Participating
Shares (continued)
105 Invesco Markets III plc
For the financial period from 1 October 2020 to 31 March 2021
Invesco
FTSE Emerging Invesco Invesco
Markets Invesco Euro US High
High Dividend FTSE RAFI Cash 3 Yield Fallen
Low Volatility UK 100 Months Angels
UCITS ETF UCITS ETF UCITS ETF* UCITS ETF
USD GBP EUR USD
Net assets attributable to holders of
redeemable participating Shares at
beginning of financial period 56,398,327 7,206,875 29,859,332 222,223,547
Increase/(Decrease) in assets
attributable to holders of redeemable
participating Shares from operations 15,397,970 1,983,647 (117,655) 18,871,580
Proceeds from redeemable participating
Shares issued 6,103,004 58 10,756,470 185,758,343
Cost of redeemable participating Shares
redeemed – (866,023) (13,426,434) (57,164,862)
Equalisation 38,278 (3,855) – 1,108,011
Net increase/(decrease) in net assets
from Share transactions
6,141,282 (869,820) (2,669,964) 129,701,492
Net assets attributable to holders of
redeemable participating Shares at
end of financial period 77,937,579 8,320,702 27,071,713 370,796,619
* Effective 31 March 2022, Invesco EuroMTS Cash 3 Months UCITS ETF changed name to Invesco Euro Cash 3 Months UCITS ETF.
The accompanying notes form an integral part of the financial statements.
Notes to the Financial Statements
106 Invesco Markets III plc
1. Establishment
The Company is an open-ended investment company with variable capital incorporated in Ireland, on 5 February 2002 with limited liability pursuant to the
Companies Act 2014. The Company was authorised on 13 September 2002 by the Central Bank of Ireland and is now regulated by the Central Bank of Ireland
as an Undertaking for Collective Investments in Transferable Securities, a “UCITS”. It is authorised pursuant to the European Communities (Undertaking for
Collective Investments in Transferable Securities) Regulations 2011 (as amended) (the “UCITS Regulations”) and the Central Bank (Supervision and
Enforcement) Act 2013 (Section 48(1)) (Undertakings for Collective Investment in Transferable Securities) (Amendment) Regulations 2019 (the “Central
Bank UCITS Regulations”).
The Company has segregated liability between its Funds. Accordingly, each Fund is treated as bearing its own liabilities exclusively from its own assets.
The Company is structured as an umbrella fund which may comprise one or more Funds. The Company may at any time establish new classes of shares within
a Fund as well as new Funds. Any new Fund will require the prior approval of the Central Bank of Ireland and the establishment of any new class of shares
must be notified in advance to the Central Bank of Ireland. As at 31 March 2022 the Company has thirteen active Funds. There were seven share classes in
issue as at 31 March 2022, a number of which were hedged share classes.
Objectives Please refer to the Investment Policy and Description of the Fund on pages 6 and 7 where the objectives of each Fund are listed.
2. Significant Accounting Policies
Basis of Preparation These unaudited condensed financial statements for the financial period ended 31 March 2022 have been prepared in accordance with FRS 104: “Interim
Financial Reporting” and the Transparency Directive (Directive 2004/109/EC) Regulations 2007 (the “Transparency Directive”), the UCITS Regulations and
the Central Bank UCITS Regulations. The unaudited condensed financial statements should be read in conjunction with the audited financial statements for the
year ended 30 September 2021, which have been prepared in accordance with applicable accounting standards and in accordance with Irish statute. The
significant accounting policies and estimation techniques adopted by the Company for the financial period are consistent with those adopted by the Company
for the annual financial statements for the financial year ended 30 September 2021.
The Company has availed of the exemption available to open-ended investment funds that hold a substantial proportion of highly liquid and fair valued
investments under Section 7 of FRS 104 and is not presenting cash flow statements.
3. Soft Commissions
There were no soft commission agreements entered into during the financial period ended 31 March 2022 or during the financial year ended 30 September
2021.
4. Exchange Rates
The following exchange rates at 31 March 2022 were used to translate foreign currency assets and liabilities:
USD/AED 3.6730 USD/HKD 7.8314 USD/PKR 183.3500 EUR/DKK 7.4384
USD/AUD 1.3316 USD/HUF 330.0589 USD/PLN 4.1673 EUR/GBP 0.8451
USD/BRL 4.7519 USD/IDR 14,362.5005 USD/QAR 3.6417 EUR/NOK 9.7290
USD/CAD 1.2491 USD/ILS 3.1912 USD/RUB 82.3501 EUR/PLN 4.6367
USD/CHF 0.9203 USD/JPY 121.3750 USD/SAR 3.7515 EUR/SEK 10.3692
USD/CLP 786.9250 USD/KRW 1,212.0501 USD/SEK 9.3194 EUR/USD 1.1126
USD/CNH 6.3481 USD/KWD 0.3038 USD/SGD 1.3534 GBP/EUR 1.1834
USD/CZK 21.9525 USD/MXN 19.9420 USD/THB 33.2500 GBP/USD 1.3167
USD/DKK 6.6853 USD/MYR 4.2047 USD/TRY 14.6678
USD/EGP 18.2800 USD/NOK 8.7440 USD/TWD 28.6515
USD/EUR 0.8988 USD/NZD 1.4377 USD/ZAR 14.6125
USD/GBP 0.7595 USD/PHP 51.7450 EUR/CHF 1.0239
Average Rates for the financial period from 1 October 2021 to 31 March 2022:
USD/EUR 0.8828
USD/GBP 0.7437
Notes to the Financial Statements (continued)
107 Invesco Markets III plc
4. Exchange Rates (continued)
The following exchange rates at 30 September 2021 were used to translate foreign currency assets and liabilities:
USD/AED 3.6732 USD/EGP 15.7200 USD/NOK 8.7292 USD/TWD 27.8605
USD/AUD 1.3844 USD/EUR 0.8629 USD/NZD 1.4496 USD/ZAR 15.0450
USD/BRL 5.4489 USD/GBP 0.7416 USD/PHP 51.0100 EUR/CHF 1.0811
USD/CAD 1.2668 USD/HKD 7.7846 USD/PKR 170.2500 EUR/DKK 7.4358
USD/CHF 0.9328 USD/HUF 309.9487 USD/PLN 3.9713 EUR/GBP 0.8595
USD/CLP 812.2001 USD/IDR 14,312.5005 USD/QAR 3.6410 EUR/NOK 10.1165
USD/CNH 6.4540 USD/ILS 3.2262 USD/RUB 72.7850 EUR/PLN 4.6024
USD/CNY 6.4622 USD/JPY 111.5750 USD/SEK 8.7485 EUR/SEK 10.1389
USD/COP 3,811.9304 USD/KRW 1,184.0002 USD/SGD 1.3576 EUR/USD 1.1589
USD/CZK 21.8672 USD/MXN 20.5445 USD/THB 33.8350 GBP/EUR 1.1635
USD/DKK 6.4161 USD/MYR 4.1865 USD/TRY 8.8842 GBP/USD 1.3484
Average Rates for the financial year from 1 October 2020 to 30 September 2021:
USD/EUR 0.8368
USD/GBP 0.8368
The following exchange rates at 31 March 2021 were used to translate foreign currency assets and liabilities:
USD/AED 3.6732 USD/EGP 15.7175 USD/NOK 8.5363 USD/TWD 28.5330
USD/AUD 1.3129 USD/EUR 0.8508 USD/NZD 1.4278 USD/ZAR 14.7663
USD/BRL 5.6430 USD/GBP 0.7248 USD/PHP 48.5375 EUR/CHF 1.1061
USD/CAD 1.2568 USD/HKD 7.7744 USD/PKR 152.7000 EUR/DKK 7.4373
USD/CHF 0.9411 USD/HUF 308.2149 USD/PLN 3.9460 EUR/GBP 0.8519
USD/CLP 718.4000 USD/IDR 14,525.0007 USD/QAR 3.6410 EUR/NOK 10.0328
USD/CNH 6.5612 USD/ILS 3.3347 USD/RUB 75.5188 EUR/PLN 4.6378
USD/CNY 6.5550 USD/JPY 110.5000 USD/SEK 8.7163 EUR/SEK 10.2444
USD/COP 3,675.0004 USD/KRW 1,131.7500 USD/SGD 1.3436 EUR/USD 1.1753
USD/CZK 22.2241 USD/MXN 20.4605 USD/THB 31.2500 GBP/EUR 1.1739
USD/DKK 6.3280 USD/MYR 4.1465 USD/TRY 8.2763 GBP/USD 1.3797
Average Rates for the financial period from 1 October 2020 to 31 March 2021:
USD/EUR 0.8341
USD/GBP 0.7411
5. Taxation
Under current law and practice the Company qualifies as an investment undertaking as defined in Section 739B of the Taxes Consolidation Act, 1997, as
amended. On that basis, it is not chargeable to Irish tax on its income or gains.
However, Irish tax may arise on the happening of a “chargeable event”. A chargeable event includes any distribution payments to shareholders, any
encashment, redemption, cancellation or transfer of shares and the holding of shares at the end of each eight year beginning with the acquisition of such shares.
No Irish tax will arise on the Company in respect of chargeable events in respect of:
a) A Shareholder who is neither Irish resident nor ordinarily resident in Ireland for tax purposes, at the time of the chargeable event, provided appropriate valid
declarations in accordance with the provisions of the Taxes Consolidation Act, 1997, as amended, are held by the Company or Company has been authorised
by the Irish Revenue to make gross payments in the absence of appropriate declarations; and
b) Certain exempted Irish tax resident shareholders who have provided the Company with the necessary signed statutory declarations.
Dividends, interest and capital gains (if any) received on investments made by the Company may be subject to withholding taxes imposed by the country from
which the investment income/gains are received and such taxes may not be recoverable by the Company or its shareholders.
The Finance Act 2010 provides that the Revenue Commissioners may grant approval for investment funds marketed outside of Ireland to make payments to
non-resident investors without deduction of Irish tax where no relevant declaration is in place, subject to meeting the “equivalent measures”. A company
wishing to receive approval must apply in writing to the Revenue Commissioners, confirming compliance with the relevant conditions.
6. Fair value levels
Under amendments to FRS 102 – Fair Value Hierarchy Disclosures, the Company is required to classify fair value measurements using a fair value hierarchy
that reflects the significance of the inputs used in making the measurements.
The fair value hierarchy has the following levels:
Level 1 - Quoted prices (unadjusted) in active markets for identical assets or liabilities;
Level 2 - Inputs other than quoted prices included within Level 1 that are observable for the asset or liability, either directly (as prices) or indirectly (derived
from prices); and
Notes to the Financial Statements (continued)
108 Invesco Markets III plc
6. Fair value levels (continued)
Level 3 - Inputs for the asset or liability that are not based on observable market data (unobservable inputs).
The determination of what constitutes 'observable' requires significant judgement by the Company. The Company considers observable data to be that market
data that is readily available, regularly distributed or updated, reliable and verifiable, not proprietary, and provided by independent sources that are actively
involved in the relevant market.
Furthermore, for those instruments which have significant unobservable inputs (Level 3), the standard requires disclosures on the transfers into and out of
Level 3, a reconciliation of the opening and closing balances, total gains and losses for the financial period split between those recognised in the Statement of
Comprehensive Income and recognised through the statement of total recognised gains and losses, purchases, sales issues and settlements, and a sensitivity
analysis of assumptions used in determining the fair value of Level 3 positions.
The value of securities classified as Level 1, Level 2 and Level 3 at 31 March 2022 is as follows:
As at 31 March 2022
Fair Value
Level 1
Fair Value
Level 2
Fair Value
Level 3 Total
Currency
Invesco EQQQ NASDAQ-100 UCITS ETF
Equities USD 6,741,792,471 – – 6,741,792,471
Forward Foreign Exchange Contracts USD – 2,543,814 – 2,543,814
Invesco FTSE RAFI US 1000 UCITS ETF
Equities USD 306,876,494 – – 306,876,494
Invesco S&P 500 High Dividend Low Volatility UCITS ETF
Equities USD 126,406,802 – – 126,406,802
Forward Foreign Exchange Contracts USD – 19,520 – 19,520
Invesco S&P 500 QVM UCITS ETF
Equities USD 9,318,958 – – 9,318,958
Invesco Global Buyback Achievers UCITS ETF
Equities USD 71,177,999 – – 71,177,999
Invesco FTSE RAFI All-World 3000 UCITS ETF
Equities USD 42,634,175 – – 42,634,175
Invesco FTSE RAFI Emerging Markets UCITS ETF
Equities USD 30,984,096 – – 30,984,096
Invesco FTSE RAFI Europe UCITS ETF
Equities EUR 7,272,138 – – 7,272,138
Invesco EURO STOXX High Dividend Low Volatility
UCITS ETF
Equities EUR 15,995,587 – – 15,995,587
Invesco FTSE Emerging Markets High Dividend Low
Volatility UCITS ETF
Equities USD 101,000,969 – – 101,000,969
Investment Funds USD 8,702,238 – – 8,702,238
Invesco FTSE RAFI UK 100 UCITS ETF
Equities GBP 10,751,542 – – 10,751,542
Investment Funds GBP 49,451 – – 49,451
Invesco Euro Cash 3 Months UCITS ETF (formerly
Invesco EuroMTS Cash 3 Months UCIS ETF)
Bonds EUR 47,971,363 3,612,905 – 51,584,268
Invesco US High Yield Fallen Angels UCITS ETF
Bonds USD – 219,845,439 – 219,845,439
Investment Funds USD 13,693,751 – – 13,693,751
Futures Contracts USD 11,118 – – 11,118
Forward Foreign Exchange Contracts USD – 380,897 – 380,897
Funds may hold rights issues as a result of corporate actions. Rights issues are classified as Level 1. Securities may also be classified as Level 2 if the price of
the security is stale due to a lack of trading activity.
Significant transfers between levels during the financial period 31 March 2022.
There were no transfers between levels during the financial period 31 March 2022.
Notes to the Financial Statements (continued)
109 Invesco Markets III plc
6. Fair value levels (continued)
As at 30 September 2021
Fair Value
Level 1
Fair Value
Level 2
Fair Value
Level 3 Total
Currency
Invesco EQQQ NASDAQ-100 UCITS ETF
Equities USD 6,162,183,316 – – 6,162,183,316
Forward Foreign Exchange Contracts USD – (9,358,961) – (9,358,961)
Invesco FTSE RAFI US 1000 UCITS ETF
Equities USD 286,921,134 – – 286,921,134
Investment Funds USD 20,109 – – 20,109
Invesco S&P 500 High Dividend Low Volatility UCITS ETF
Equities USD 100,981,476 – – 100,981,476
Forward Foreign Exchange Contracts USD – (9,192) – (9,192)
Invesco S&P 500 QVM UCITS ETF
Equities USD 4,162,112 – – 4,162,112
Investment Funds USD 446 – – 446
Invesco Global Buyback Achievers UCITS ETF
Equities USD 62,434,588 – – 62,434,588
Invesco FTSE RAFI All-World 3000 UCITS ETF
Equities USD 36,214,848 2,078 – 36,216,926
Investment Funds USD 61,311 – – 61,311
Invesco FTSE RAFI Emerging Markets UCITS ETF
Equities USD 32,281,108 1,144 – 32,282,252
Investment Funds USD 751,195 – – 751,195
Invesco FTSE RAFI Europe UCITS ETF
Equities EUR 7,072,454 – – 7,072,454
Invesco EURO STOXX High Dividend Low Volatility
UCITS ETF
Equities EUR 14,668,660 – – 14,668,660
Invesco FTSE Emerging Markets High Dividend Low
Volatility UCITS ETF
Equities USD 88,818,722 – – 88,818,722
Investment Funds USD 8,358,025 – – 8,358,025
Invesco FTSE RAFI UK 100 UCITS ETF
Equities GBP 12,783,426 – – 12,783,426
Investment Funds GBP 31,859 – – 31,859
Invesco Euro Cash 3 Months UCITS ETF (formerly
Invesco EuroMTS Cash 3 Months UCIS ETF)
Bonds EUR 20,635,027 6,014,399 – 26,649,426
Invesco US High Yield Fallen Angels UCITS ETF
Bonds USD – 263,441,892 – 263,441,892
Investment Funds USD 2,586,449 – – 2,586,449
Forward Foreign Exchange Contracts USD – (637,675) – (637,675)
Funds may also hold rights issues as a result of corporate actions. Rights issues are classified as Level 2. Securities may also be classified as Level 2 if the
price of the security is stale due to a lack of trading activity.
Significant transfers between levels during the year 30 September 2021.
There were no transfers between levels during the financial period ended 31 March 2022 or the financial year ended 30 September 2021.
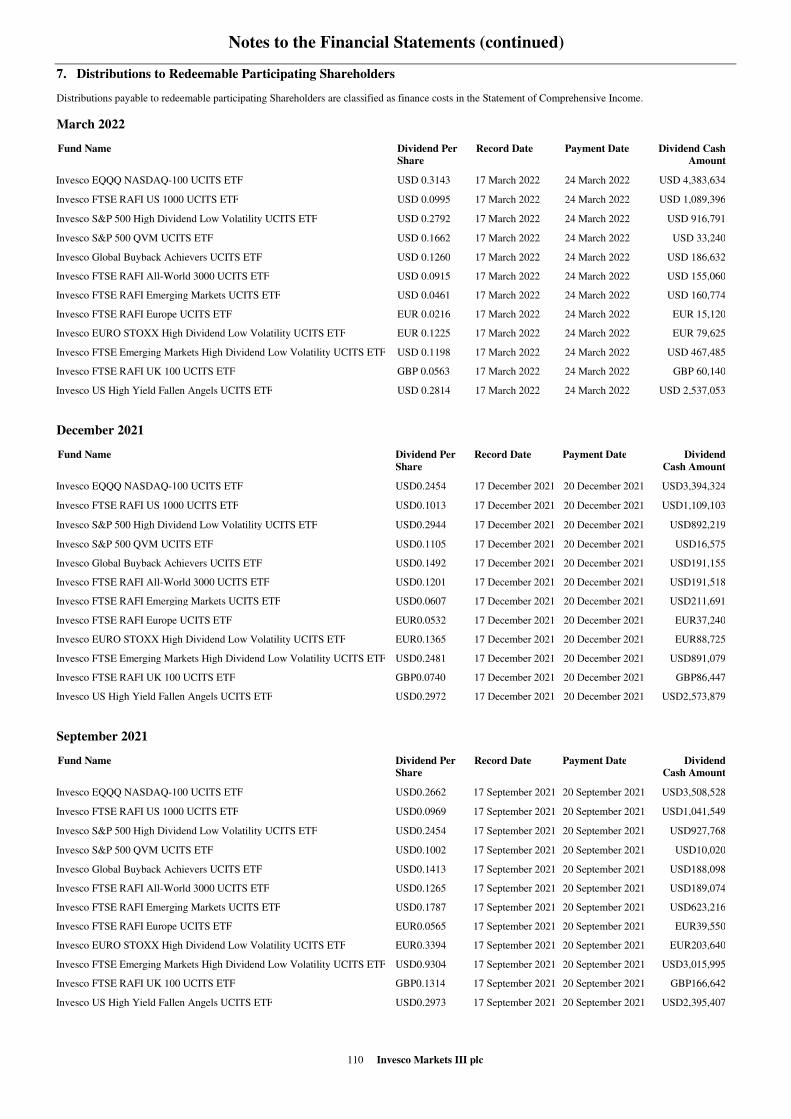
Notes to the Financial Statements (continued)
110 Invesco Markets III plc
7. Distributions to Redeemable Participating Shareholders
Distributions payable to redeemable participating Shareholders are classified as finance costs in the Statement of Comprehensive Income.
March 2022
Fund Name Dividend Per
Share
Record Date Payment Date Dividend Cash
Amount
Invesco EQQQ NASDAQ-100 UCITS ETF USD 0.3143 17 March 2022 24 March 2022 USD 4,383,634
Invesco FTSE RAFI US 1000 UCITS ETF USD 0.0995 17 March 2022 24 March 2022 USD 1,089,396
Invesco S&P 500 High Dividend Low Volatility UCITS ETF USD 0.2792 17 March 2022 24 March 2022 USD 916,791
Invesco S&P 500 QVM UCITS ETF USD 0.1662 17 March 2022 24 March 2022 USD 33,240
Invesco Global Buyback Achievers UCITS ETF USD 0.1260 17 March 2022 24 March 2022 USD 186,632
Invesco FTSE RAFI All-World 3000 UCITS ETF USD 0.0915 17 March 2022 24 March 2022 USD 155,060
Invesco FTSE RAFI Emerging Markets UCITS ETF USD 0.0461 17 March 2022 24 March 2022 USD 160,774
Invesco FTSE RAFI Europe UCITS ETF EUR 0.0216 17 March 2022 24 March 2022 EUR 15,120
Invesco EURO STOXX High Dividend Low Volatility UCITS ETF EUR 0.1225 17 March 2022 24 March 2022 EUR 79,625
Invesco FTSE Emerging Markets High Dividend Low Volatility UCITS ETF USD 0.1198 17 March 2022 24 March 2022 USD 467,485
Invesco FTSE RAFI UK 100 UCITS ETF GBP 0.0563 17 March 2022 24 March 2022 GBP 60,140
Invesco US High Yield Fallen Angels UCITS ETF USD 0.2814 17 March 2022 24 March 2022 USD 2,537,053
December 2021
Fund Name Dividend Per
Share
Record Date Payment Date Dividend
Cash Amount
Invesco EQQQ NASDAQ-100 UCITS ETF USD0.2454 17 December 2021 20 December 2021 USD3,394,324
Invesco FTSE RAFI US 1000 UCITS ETF USD0.1013 17 December 2021 20 December 2021 USD1,109,103
Invesco S&P 500 High Dividend Low Volatility UCITS ETF USD0.2944 17 December 2021 20 December 2021 USD892,219
Invesco S&P 500 QVM UCITS ETF USD0.1105 17 December 2021 20 December 2021 USD16,575
Invesco Global Buyback Achievers UCITS ETF USD0.1492 17 December 2021 20 December 2021 USD191,155
Invesco FTSE RAFI All-World 3000 UCITS ETF USD0.1201 17 December 2021 20 December 2021 USD191,518
Invesco FTSE RAFI Emerging Markets UCITS ETF USD0.0607 17 December 2021 20 December 2021 USD211,691
Invesco FTSE RAFI Europe UCITS ETF EUR0.0532 17 December 2021 20 December 2021 EUR37,240
Invesco EURO STOXX High Dividend Low Volatility UCITS ETF EUR0.1365 17 December 2021 20 December 2021 EUR88,725
Invesco FTSE Emerging Markets High Dividend Low Volatility UCITS ETF USD0.2481 17 December 2021 20 December 2021 USD891,079
Invesco FTSE RAFI UK 100 UCITS ETF GBP0.0740 17 December 2021 20 December 2021 GBP86,447
Invesco US High Yield Fallen Angels UCITS ETF USD0.2972 17 December 2021 20 December 2021 USD2,573,879
September 2021
Fund Name Dividend Per
Share
Record Date Payment Date Dividend
Cash Amount
Invesco EQQQ NASDAQ-100 UCITS ETF USD0.2662 17 September 2021 20 September 2021 USD3,508,528
Invesco FTSE RAFI US 1000 UCITS ETF USD0.0969 17 September 2021 20 September 2021 USD1,041,549
Invesco S&P 500 High Dividend Low Volatility UCITS ETF USD0.2454 17 September 2021 20 September 2021 USD927,768
Invesco S&P 500 QVM UCITS ETF USD0.1002 17 September 2021 20 September 2021 USD10,020
Invesco Global Buyback Achievers UCITS ETF USD0.1413 17 September 2021 20 September 2021 USD188,098
Invesco FTSE RAFI All-World 3000 UCITS ETF USD0.1265 17 September 2021 20 September 2021 USD189,074
Invesco FTSE RAFI Emerging Markets UCITS ETF USD0.1787 17 September 2021 20 September 2021 USD623,216
Invesco FTSE RAFI Europe UCITS ETF EUR0.0565 17 September 2021 20 September 2021 EUR39,550
Invesco EURO STOXX High Dividend Low Volatility UCITS ETF EUR0.3394 17 September 2021 20 September 2021 EUR203,640
Invesco FTSE Emerging Markets High Dividend Low Volatility UCITS ETF USD0.9304 17 September 2021 20 September 2021 USD3,015,995
Invesco FTSE RAFI UK 100 UCITS ETF GBP0.1314 17 September 2021 20 September 2021 GBP166,642
Invesco US High Yield Fallen Angels UCITS ETF USD0.2973 17 September 2021 20 September 2021 USD2,395,407
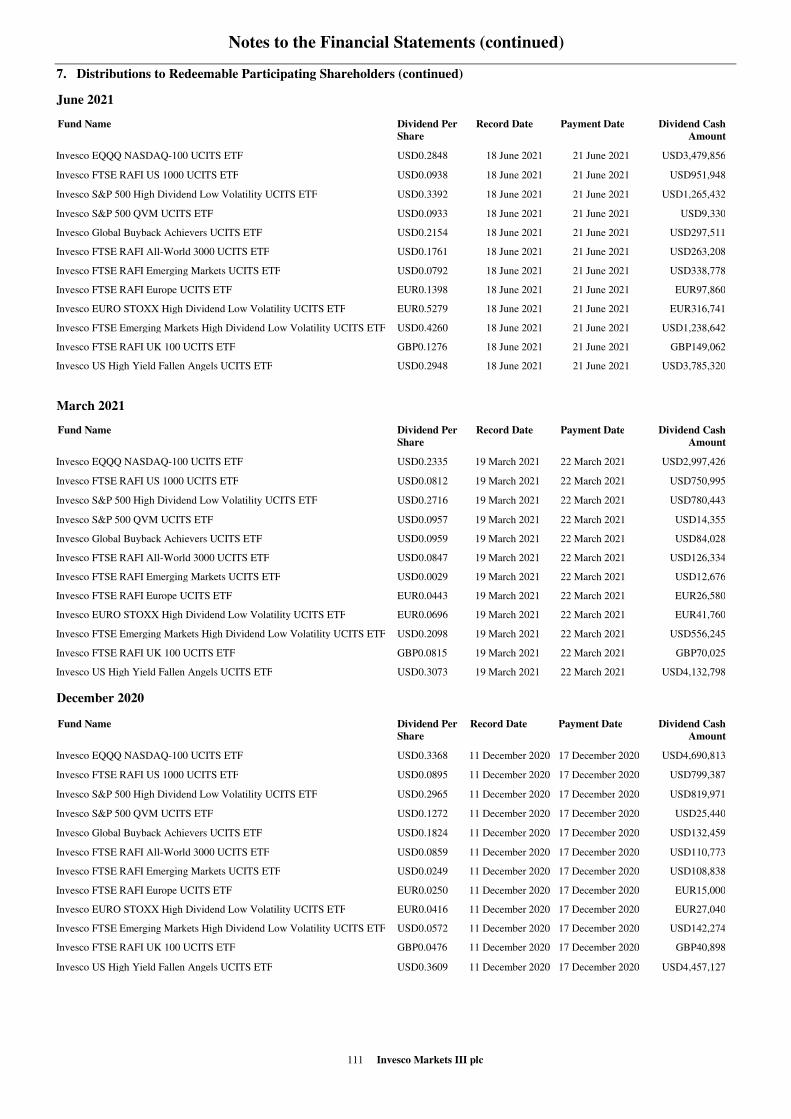
Notes to the Financial Statements (continued)
111 Invesco Markets III plc
7. Distributions to Redeemable Participating Shareholders (continued)
June 2021
Fund Name Dividend Per
Share
Record Date Payment Date Dividend Cash
Amount
Invesco EQQQ NASDAQ-100 UCITS ETF USD0.2848 18 June 2021 21 June 2021 USD3,479,856
Invesco FTSE RAFI US 1000 UCITS ETF USD0.0938 18 June 2021 21 June 2021 USD951,948
Invesco S&P 500 High Dividend Low Volatility UCITS ETF USD0.3392 18 June 2021 21 June 2021 USD1,265,432
Invesco S&P 500 QVM UCITS ETF USD0.0933 18 June 2021 21 June 2021 USD9,330
Invesco Global Buyback Achievers UCITS ETF USD0.2154 18 June 2021 21 June 2021 USD297,511
Invesco FTSE RAFI All-World 3000 UCITS ETF USD0.1761 18 June 2021 21 June 2021 USD263,208
Invesco FTSE RAFI Emerging Markets UCITS ETF USD0.0792 18 June 2021 21 June 2021 USD338,778
Invesco FTSE RAFI Europe UCITS ETF EUR0.1398 18 June 2021 21 June 2021 EUR97,860
Invesco EURO STOXX High Dividend Low Volatility UCITS ETF EUR0.5279 18 June 2021 21 June 2021 EUR316,741
Invesco FTSE Emerging Markets High Dividend Low Volatility UCITS ETF USD0.4260 18 June 2021 21 June 2021 USD1,238,642
Invesco FTSE RAFI UK 100 UCITS ETF GBP0.1276 18 June 2021 21 June 2021 GBP149,062
Invesco US High Yield Fallen Angels UCITS ETF USD0.2948 18 June 2021 21 June 2021 USD3,785,320
March 2021
Fund Name Dividend Per
Share
Record Date Payment Date Dividend Cash
Amount
Invesco EQQQ NASDAQ-100 UCITS ETF USD0.2335 19 March 2021 22 March 2021 USD2,997,426
Invesco FTSE RAFI US 1000 UCITS ETF USD0.0812 19 March 2021 22 March 2021 USD750,995
Invesco S&P 500 High Dividend Low Volatility UCITS ETF USD0.2716 19 March 2021 22 March 2021 USD780,443
Invesco S&P 500 QVM UCITS ETF USD0.0957 19 March 2021 22 March 2021 USD14,355
Invesco Global Buyback Achievers UCITS ETF USD0.0959 19 March 2021 22 March 2021 USD84,028
Invesco FTSE RAFI All-World 3000 UCITS ETF USD0.0847 19 March 2021 22 March 2021 USD126,334
Invesco FTSE RAFI Emerging Markets UCITS ETF USD0.0029 19 March 2021 22 March 2021 USD12,676
Invesco FTSE RAFI Europe UCITS ETF EUR0.0443 19 March 2021 22 March 2021 EUR26,580
Invesco EURO STOXX High Dividend Low Volatility UCITS ETF EUR0.0696 19 March 2021 22 March 2021 EUR41,760
Invesco FTSE Emerging Markets High Dividend Low Volatility UCITS ETF USD0.2098 19 March 2021 22 March 2021 USD556,245
Invesco FTSE RAFI UK 100 UCITS ETF GBP0.0815 19 March 2021 22 March 2021 GBP70,025
Invesco US High Yield Fallen Angels UCITS ETF USD0.3073 19 March 2021 22 March 2021 USD4,132,798
December 2020
Fund Name Dividend Per
Share
Record Date Payment Date Dividend Cash
Amount
Invesco EQQQ NASDAQ-100 UCITS ETF USD0.3368 11 December 2020 17 December 2020 USD4,690,813
Invesco FTSE RAFI US 1000 UCITS ETF USD0.0895 11 December 2020 17 December 2020 USD799,387
Invesco S&P 500 High Dividend Low Volatility UCITS ETF USD0.2965 11 December 2020 17 December 2020 USD819,971
Invesco S&P 500 QVM UCITS ETF USD0.1272 11 December 2020 17 December 2020 USD25,440
Invesco Global Buyback Achievers UCITS ETF USD0.1824 11 December 2020 17 December 2020 USD132,459
Invesco FTSE RAFI All-World 3000 UCITS ETF USD0.0859 11 December 2020 17 December 2020 USD110,773
Invesco FTSE RAFI Emerging Markets UCITS ETF USD0.0249 11 December 2020 17 December 2020 USD108,838
Invesco FTSE RAFI Europe UCITS ETF EUR0.0250 11 December 2020 17 December 2020 EUR15,000
Invesco EURO STOXX High Dividend Low Volatility UCITS ETF EUR0.0416 11 December 2020 17 December 2020 EUR27,040
Invesco FTSE Emerging Markets High Dividend Low Volatility UCITS ETF USD0.0572 11 December 2020 17 December 2020 USD142,274
Invesco FTSE RAFI UK 100 UCITS ETF GBP0.0476 11 December 2020 17 December 2020 GBP40,898
Invesco US High Yield Fallen Angels UCITS ETF USD0.3609 11 December 2020 17 December 2020 USD4,457,127
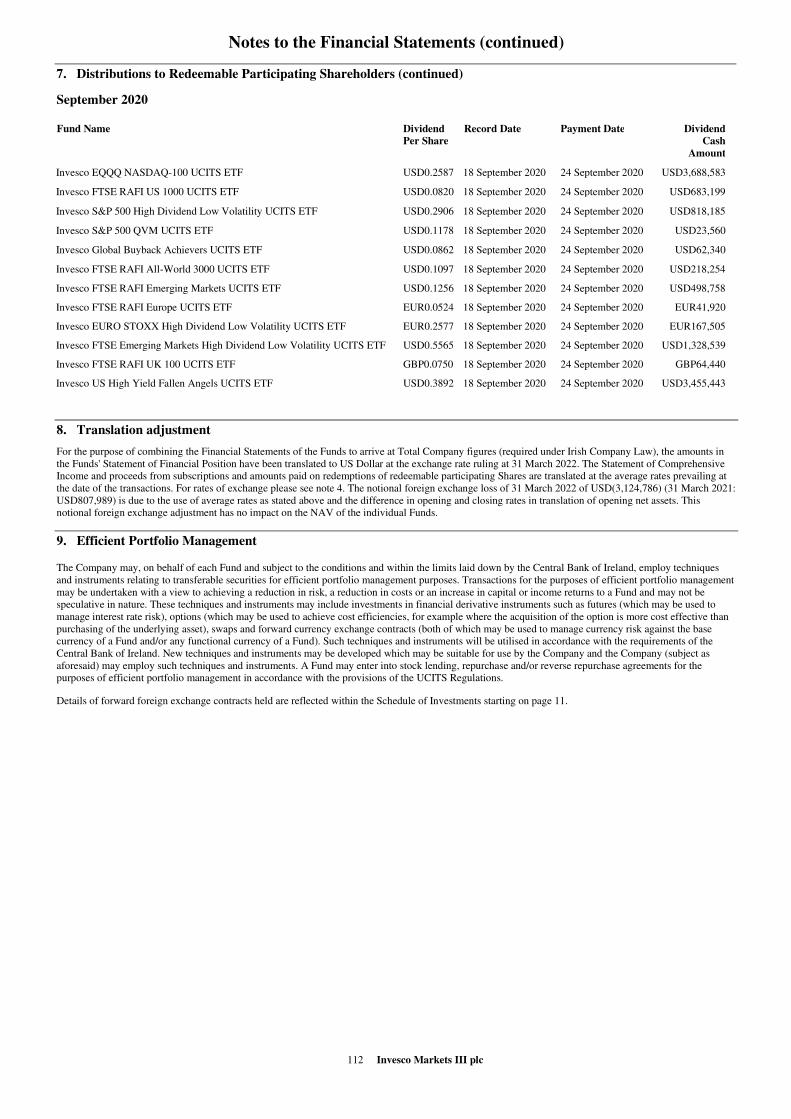
Notes to the Financial Statements (continued)
112 Invesco Markets III plc
7. Distributions to Redeemable Participating Shareholders (continued)
September 2020
Fund Name Dividend
Per Share
Record Date Payment Date Dividend
Cash
Amount
Invesco EQQQ NASDAQ-100 UCITS ETF USD0.2587 18 September 2020 24 September 2020 USD3,688,583
Invesco FTSE RAFI US 1000 UCITS ETF USD0.0820 18 September 2020 24 September 2020 USD683,199
Invesco S&P 500 High Dividend Low Volatility UCITS ETF USD0.2906 18 September 2020 24 September 2020 USD818,185
Invesco S&P 500 QVM UCITS ETF USD0.1178 18 September 2020 24 September 2020 USD23,560
Invesco Global Buyback Achievers UCITS ETF USD0.0862 18 September 2020 24 September 2020 USD62,340
Invesco FTSE RAFI All-World 3000 UCITS ETF USD0.1097 18 September 2020 24 September 2020 USD218,254
Invesco FTSE RAFI Emerging Markets UCITS ETF USD0.1256 18 September 2020 24 September 2020 USD498,758
Invesco FTSE RAFI Europe UCITS ETF EUR0.0524 18 September 2020 24 September 2020 EUR41,920
Invesco EURO STOXX High Dividend Low Volatility UCITS ETF EUR0.2577 18 September 2020 24 September 2020 EUR167,505
Invesco FTSE Emerging Markets High Dividend Low Volatility UCITS ETF USD0.5565 18 September 2020 24 September 2020 USD1,328,539
Invesco FTSE RAFI UK 100 UCITS ETF GBP0.0750 18 September 2020 24 September 2020 GBP64,440
Invesco US High Yield Fallen Angels UCITS ETF USD0.3892 18 September 2020 24 September 2020 USD3,455,443
8. Translation adjustment
For the purpose of combining the Financial Statements of the Funds to arrive at Total Company figures (required under Irish Company Law), the amounts in
the Funds' Statement of Financial Position have been translated to US Dollar at the exchange rate ruling at 31 March 2022. The Statement of Comprehensive
Income and proceeds from subscriptions and amounts paid on redemptions of redeemable participating Shares are translated at the average rates prevailing at
the date of the transactions. For rates of exchange please see note 4. The notional foreign exchange loss of 31 March 2022 of USD(3,124,786) (31 March 2021:
USD807,989) is due to the use of average rates as stated above and the difference in opening and closing rates in translation of opening net assets. This
notional foreign exchange adjustment has no impact on the NAV of the individual Funds.
9. Efficient Portfolio Management
The Company may, on behalf of each Fund and subject to the conditions and within the limits laid down by the Central Bank of Ireland, employ techniques
and instruments relating to transferable securities for efficient portfolio management purposes. Transactions for the purposes of efficient portfolio management
may be undertaken with a view to achieving a reduction in risk, a reduction in costs or an increase in capital or income returns to a Fund and may not be
speculative in nature. These techniques and instruments may include investments in financial derivative instruments such as futures (which may be used to
manage interest rate risk), options (which may be used to achieve cost efficiencies, for example where the acquisition of the option is more cost effective than
purchasing of the underlying asset), swaps and forward currency exchange contracts (both of which may be used to manage currency risk against the base
currency of a Fund and/or any functional currency of a Fund). Such techniques and instruments will be utilised in accordance with the requirements of the
Central Bank of Ireland. New techniques and instruments may be developed which may be suitable for use by the Company and the Company (subject as
aforesaid) may employ such techniques and instruments. A Fund may enter into stock lending, repurchase and/or reverse repurchase agreements for the
purposes of efficient portfolio management in accordance with the provisions of the UCITS Regulations.
Details of forward foreign exchange contracts held are reflected within the Schedule of Investments starting on page 11.
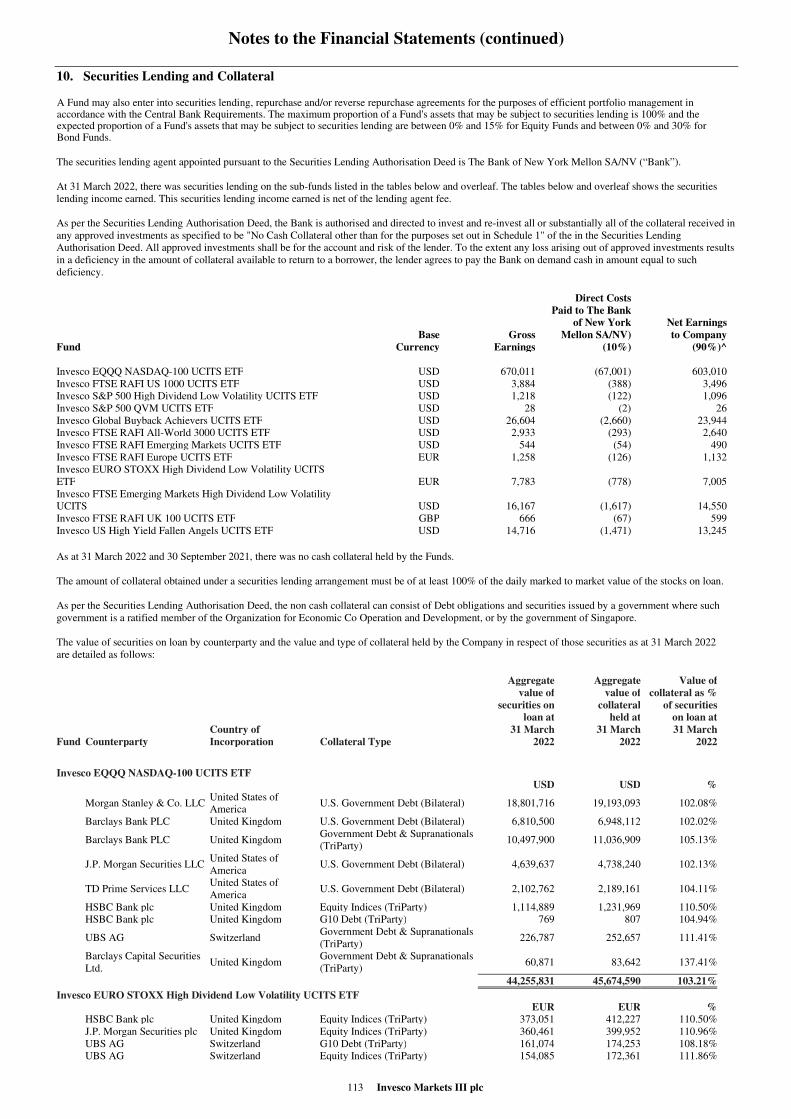
Notes to the Financial Statements (continued)
113 Invesco Markets III plc
10. Securities Lending and Collateral
A Fund may also enter into securities lending, repurchase and/or reverse repurchase agreements for the purposes of efficient portfolio management in accordance with the Central Bank Requirements. The maximum proportion of a Fund's assets that may be subject to securities lending is 100% and the expected proportion of a Fund's assets that may be subject to securities lending are between 0% and 15% for Equity Funds and between 0% and 30% for Bond Funds.
The securities lending agent appointed pursuant to the Securities Lending Authorisation Deed is The Bank of New York Mellon SA/NV (“Bank”).
At 31 March 2022, there was securities lending on the sub-funds listed in the tables below and overleaf. The tables below and overleaf shows the securities
lending income earned. This securities lending income earned is net of the lending agent fee.
As per the Securities Lending Authorisation Deed, the Bank is authorised and directed to invest and re-invest all or substantially all of the collateral received in
any approved investments as specified to be "No Cash Collateral other than for the purposes set out in Schedule 1" of the in the Securities Lending
Authorisation Deed. All approved investments shall be for the account and risk of the lender. To the extent any loss arising out of approved investments results
in a deficiency in the amount of collateral available to return to a borrower, the lender agrees to pay the Bank on demand cash in amount equal to such
deficiency.
Fund
Base
Currency
Gross
Earnings
Direct Costs
Paid to The Bank
of New York
Mellon SA/NV)
(10%)
Net Earnings
to Company
(90%)^
Invesco EQQQ NASDAQ-100 UCITS ETF USD 670,011 (67,001) 603,010
Invesco FTSE RAFI US 1000 UCITS ETF USD 3,884 (388) 3,496
Invesco S&P 500 High Dividend Low Volatility UCITS ETF USD 1,218 (122) 1,096
Invesco S&P 500 QVM UCITS ETF USD 28 (2) 26
Invesco Global Buyback Achievers UCITS ETF USD 26,604 (2,660) 23,944
Invesco FTSE RAFI All-World 3000 UCITS ETF USD 2,933 (293) 2,640
Invesco FTSE RAFI Emerging Markets UCITS ETF USD 544 (54) 490
Invesco FTSE RAFI Europe UCITS ETF EUR 1,258 (126) 1,132
Invesco EURO STOXX High Dividend Low Volatility UCITS
ETF EUR 7,783 (778) 7,005
Invesco FTSE Emerging Markets High Dividend Low Volatility
UCITS USD 16,167 (1,617) 14,550
Invesco FTSE RAFI UK 100 UCITS ETF GBP 666 (67) 599
Invesco US High Yield Fallen Angels UCITS ETF USD 14,716 (1,471) 13,245
As at 31 March 2022 and 30 September 2021, there was no cash collateral held by the Funds.
The amount of collateral obtained under a securities lending arrangement must be of at least 100% of the daily marked to market value of the stocks on loan.
As per the Securities Lending Authorisation Deed, the non cash collateral can consist of Debt obligations and securities issued by a government where such
government is a ratified member of the Organization for Economic Co Operation and Development, or by the government of Singapore.
The value of securities on loan by counterparty and the value and type of collateral held by the Company in respect of those securities as at 31 March 2022
are detailed as follows:
Fund Counterparty
Country of
Incorporation Collateral Type
Aggregate
value of
securities on
loan at
31 March
2022
Aggregate
value of
collateral
held at
31 March
2022
Value of
collateral as %
of securities
on loan at
31 March
2022
Invesco EQQQ NASDAQ-100 UCITS ETF USD USD %
Morgan Stanley & Co. LLC
United States of
America U.S. Government Debt (Bilateral) 18,801,716 19,193,093 102.08%
Barclays Bank PLC United Kingdom U.S. Government Debt (Bilateral) 6,810,500 6,948,112 102.02%
Barclays Bank PLC United Kingdom
Government Debt & Supranationals
(TriParty) 10,497,900 11,036,909 105.13%
J.P. Morgan Securities LLC
United States of
America U.S. Government Debt (Bilateral) 4,639,637 4,738,240 102.13%
TD Prime Services LLC
United States of
America U.S. Government Debt (Bilateral) 2,102,762 2,189,161 104.11%
HSBC Bank plc United Kingdom Equity Indices (TriParty) 1,114,889 1,231,969 110.50%
HSBC Bank plc United Kingdom G10 Debt (TriParty) 769 807 104.94%
UBS AG Switzerland
Government Debt & Supranationals
(TriParty) 226,787 252,657 111.41%
Barclays Capital Securities
Ltd. United Kingdom
Government Debt & Supranationals
(TriParty) 60,871 83,642 137.41%
44,255,831 45,674,590 103.21%
Invesco EURO STOXX High Dividend Low Volatility UCITS ETF EUR EUR %
HSBC Bank plc United Kingdom Equity Indices (TriParty) 373,051 412,227 110.50%
J.P. Morgan Securities plc United Kingdom Equity Indices (TriParty) 360,461 399,952 110.96%
UBS AG Switzerland G10 Debt (TriParty) 161,074 174,253 108.18%
UBS AG Switzerland Equity Indices (TriParty) 154,085 172,361 111.86%
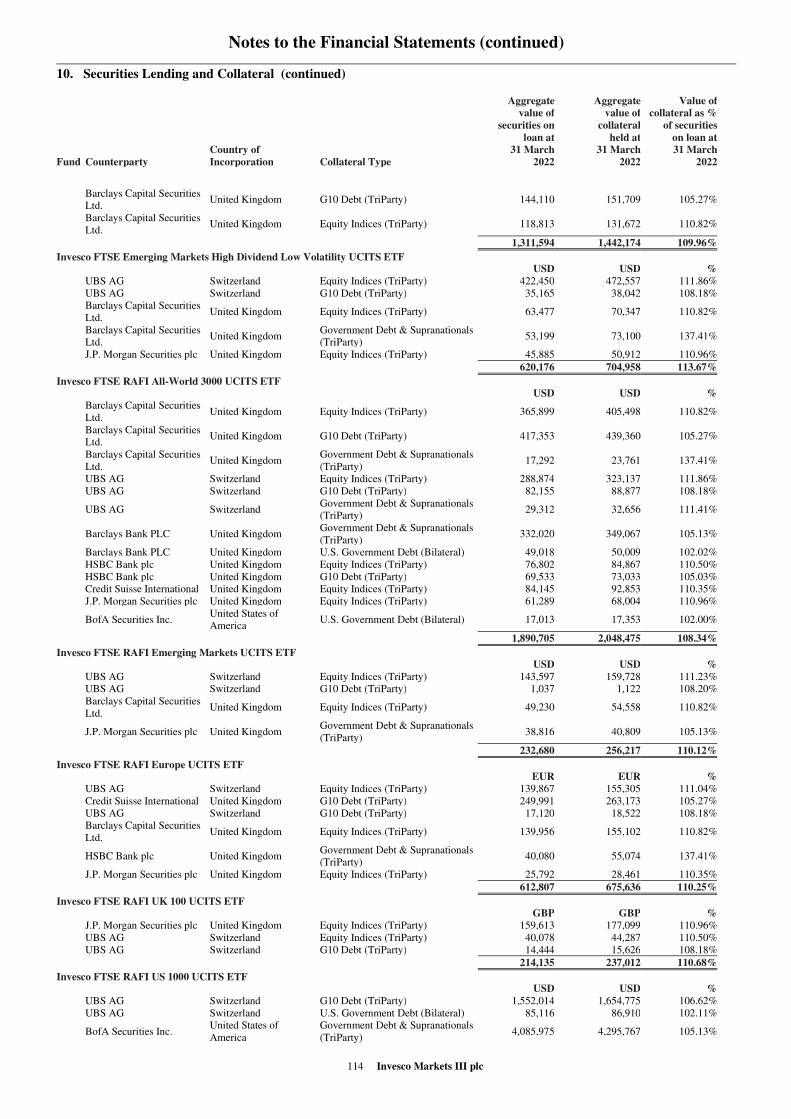
Notes to the Financial Statements (continued)
114 Invesco Markets III plc
10. Securities Lending and Collateral (continued)
Fund Counterparty
Country of
Incorporation Collateral Type
Aggregate
value of
securities on
loan at
31 March
2022
Aggregate
value of
collateral
held at
31 March
2022
Value of
collateral as %
of securities
on loan at
31 March
2022
Barclays Capital Securities
Ltd. United Kingdom G10 Debt (TriParty) 144,110 151,709 105.27%
Barclays Capital Securities
Ltd. United Kingdom Equity Indices (TriParty) 118,813 131,672 110.82%
1,311,594 1,442,174 109.96%
Invesco FTSE Emerging Markets High Dividend Low Volatility UCITS ETF USD USD %
UBS AG Switzerland Equity Indices (TriParty) 422,450 472,557 111.86%
UBS AG Switzerland G10 Debt (TriParty) 35,165 38,042 108.18%
Barclays Capital Securities
Ltd. United Kingdom Equity Indices (TriParty) 63,477 70,347 110.82%
Barclays Capital Securities
Ltd. United Kingdom
Government Debt & Supranationals
(TriParty) 53,199 73,100 137.41%
J.P. Morgan Securities plc United Kingdom Equity Indices (TriParty) 45,885 50,912 110.96%
620,176 704,958 113.67%
Invesco FTSE RAFI All-World 3000 UCITS ETF USD USD %
Barclays Capital Securities
Ltd. United Kingdom Equity Indices (TriParty) 365,899 405,498 110.82%
Barclays Capital Securities
Ltd. United Kingdom G10 Debt (TriParty) 417,353 439,360 105.27%
Barclays Capital Securities
Ltd. United Kingdom
Government Debt & Supranationals
(TriParty) 17,292 23,761 137.41%
UBS AG Switzerland Equity Indices (TriParty) 288,874 323,137 111.86%
UBS AG Switzerland G10 Debt (TriParty) 82,155 88,877 108.18%
UBS AG Switzerland
Government Debt & Supranationals
(TriParty) 29,312 32,656 111.41%
Barclays Bank PLC United Kingdom
Government Debt & Supranationals
(TriParty) 332,020 349,067 105.13%
Barclays Bank PLC United Kingdom U.S. Government Debt (Bilateral) 49,018 50,009 102.02%
HSBC Bank plc United Kingdom Equity Indices (TriParty) 76,802 84,867 110.50%
HSBC Bank plc United Kingdom G10 Debt (TriParty) 69,533 73,033 105.03%
Credit Suisse International United Kingdom Equity Indices (TriParty) 84,145 92,853 110.35%
J.P. Morgan Securities plc United Kingdom Equity Indices (TriParty) 61,289 68,004 110.96%
BofA Securities Inc.
United States of
America U.S. Government Debt (Bilateral) 17,013 17,353 102.00%
1,890,705 2,048,475 108.34%
Invesco FTSE RAFI Emerging Markets UCITS ETF USD USD %
UBS AG Switzerland Equity Indices (TriParty) 143,597 159,728 111.23%
UBS AG Switzerland G10 Debt (TriParty) 1,037 1,122 108.20%
Barclays Capital Securities
Ltd. United Kingdom Equity Indices (TriParty) 49,230 54,558 110.82%
J.P. Morgan Securities plc United Kingdom
Government Debt & Supranationals
(TriParty) 38,816 40,809 105.13%
232,680 256,217 110.12%
Invesco FTSE RAFI Europe UCITS ETF EUR EUR %
UBS AG Switzerland Equity Indices (TriParty) 139,867 155,305 111.04%
Credit Suisse International United Kingdom G10 Debt (TriParty) 249,991 263,173 105.27%
UBS AG Switzerland G10 Debt (TriParty) 17,120 18,522 108.18%
Barclays Capital Securities
Ltd. United Kingdom Equity Indices (TriParty) 139,956 155,102 110.82%
HSBC Bank plc United Kingdom
Government Debt & Supranationals
(TriParty) 40,080 55,074 137.41%
J.P. Morgan Securities plc United Kingdom Equity Indices (TriParty) 25,792 28,461 110.35%
612,807 675,636 110.25%
Invesco FTSE RAFI UK 100 UCITS ETF GBP GBP %
J.P. Morgan Securities plc United Kingdom Equity Indices (TriParty) 159,613 177,099 110.96%
UBS AG Switzerland Equity Indices (TriParty) 40,078 44,287 110.50%
UBS AG Switzerland G10 Debt (TriParty) 14,444 15,626 108.18%
214,135 237,012 110.68%
Invesco FTSE RAFI US 1000 UCITS ETF USD USD %
UBS AG Switzerland G10 Debt (TriParty) 1,552,014 1,654,775 106.62%
UBS AG Switzerland U.S. Government Debt (Bilateral) 85,116 86,910 102.11%
BofA Securities Inc.
United States of
America
Government Debt & Supranationals
(TriParty) 4,085,975 4,295,767 105.13%
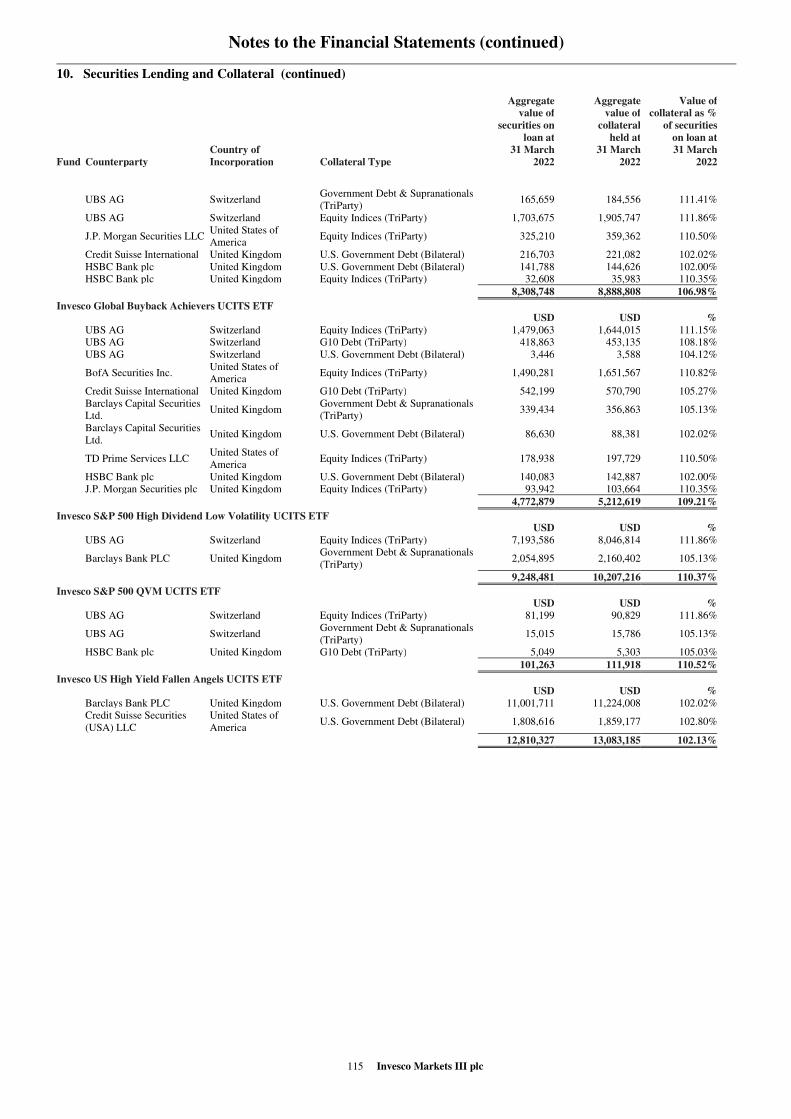
Notes to the Financial Statements (continued)
115 Invesco Markets III plc
10. Securities Lending and Collateral (continued)
Fund Counterparty
Country of
Incorporation Collateral Type
Aggregate
value of
securities on
loan at
31 March
2022
Aggregate
value of
collateral
held at
31 March
2022
Value of
collateral as %
of securities
on loan at
31 March
2022
UBS AG Switzerland
Government Debt & Supranationals
(TriParty) 165,659 184,556 111.41%
UBS AG Switzerland Equity Indices (TriParty) 1,703,675 1,905,747 111.86%
J.P. Morgan Securities LLC
United States of
America Equity Indices (TriParty) 325,210 359,362 110.50%
Credit Suisse International United Kingdom U.S. Government Debt (Bilateral) 216,703 221,082 102.02%
HSBC Bank plc United Kingdom U.S. Government Debt (Bilateral) 141,788 144,626 102.00%
HSBC Bank plc United Kingdom Equity Indices (TriParty) 32,608 35,983 110.35%
8,308,748 8,888,808 106.98%
Invesco Global Buyback Achievers UCITS ETF USD USD %
UBS AG Switzerland Equity Indices (TriParty) 1,479,063 1,644,015 111.15%
UBS AG Switzerland G10 Debt (TriParty) 418,863 453,135 108.18%
UBS AG Switzerland U.S. Government Debt (Bilateral) 3,446 3,588 104.12%
BofA Securities Inc.
United States of
America Equity Indices (TriParty) 1,490,281 1,651,567 110.82%
Credit Suisse International United Kingdom G10 Debt (TriParty) 542,199 570,790 105.27%
Barclays Capital Securities
Ltd. United Kingdom
Government Debt & Supranationals
(TriParty) 339,434 356,863 105.13%
Barclays Capital Securities
Ltd. United Kingdom U.S. Government Debt (Bilateral) 86,630 88,381 102.02%
TD Prime Services LLC
United States of
America Equity Indices (TriParty) 178,938 197,729 110.50%
HSBC Bank plc United Kingdom U.S. Government Debt (Bilateral) 140,083 142,887 102.00%
J.P. Morgan Securities plc United Kingdom Equity Indices (TriParty) 93,942 103,664 110.35%
4,772,879 5,212,619 109.21%
Invesco S&P 500 High Dividend Low Volatility UCITS ETF USD USD %
UBS AG Switzerland Equity Indices (TriParty) 7,193,586 8,046,814 111.86%
Barclays Bank PLC United Kingdom
Government Debt & Supranationals
(TriParty) 2,054,895 2,160,402 105.13%
9,248,481 10,207,216 110.37%
Invesco S&P 500 QVM UCITS ETF USD USD %
UBS AG Switzerland Equity Indices (TriParty) 81,199 90,829 111.86%
UBS AG Switzerland
Government Debt & Supranationals
(TriParty) 15,015 15,786 105.13%
HSBC Bank plc United Kingdom G10 Debt (TriParty) 5,049 5,303 105.03%
101,263 111,918 110.52%
Invesco US High Yield Fallen Angels UCITS ETF USD USD %
Barclays Bank PLC United Kingdom U.S. Government Debt (Bilateral) 11,001,711 11,224,008 102.02%
Credit Suisse Securities
(USA) LLC
United States of
America U.S. Government Debt (Bilateral) 1,808,616 1,859,177 102.80%
12,810,327 13,083,185 102.13%
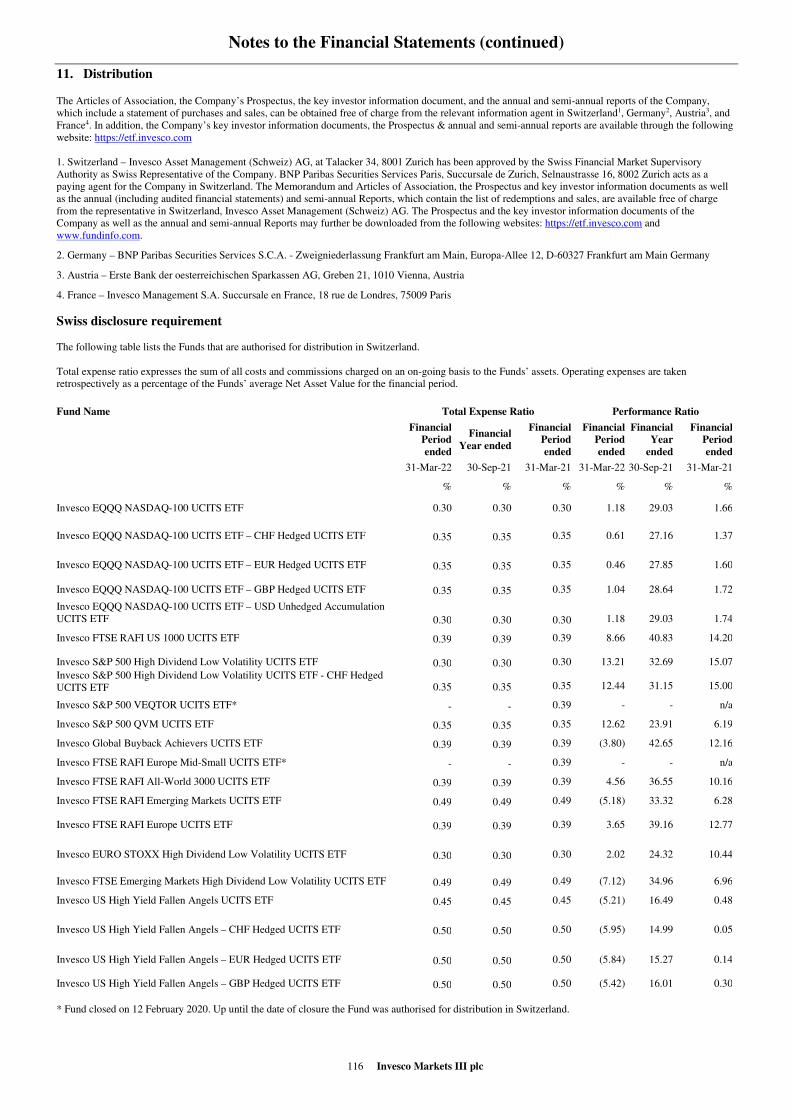
Notes to the Financial Statements (continued)
116 Invesco Markets III plc
11. Distribution
The Articles of Association, the Company’s Prospectus, the key investor information document, and the annual and semi-annual reports of the Company,
which include a statement of purchases and sales, can be obtained free of charge from the relevant information agent in Switzerland1, Germany2, Austria3, and
France4. In addition, the Company’s key investor information documents, the Prospectus & annual and semi-annual reports are available through the following
website: https://etf.invesco.com
1. Switzerland – Invesco Asset Management (Schweiz) AG, at Talacker 34, 8001 Zurich has been approved by the Swiss Financial Market Supervisory
Authority as Swiss Representative of the Company. BNP Paribas Securities Services Paris, Succursale de Zurich, Selnaustrasse 16, 8002 Zurich acts as a
paying agent for the Company in Switzerland. The Memorandum and Articles of Association, the Prospectus and key investor information documents as well
as the annual (including audited financial statements) and semi-annual Reports, which contain the list of redemptions and sales, are available free of charge
from the representative in Switzerland, Invesco Asset Management (Schweiz) AG. The Prospectus and the key investor information documents of the
Company as well as the annual and semi-annual Reports may further be downloaded from the following websites: https://etf.invesco.com and
www.fundinfo.com.
2. Germany – BNP Paribas Securities Services S.C.A. - Zweigniederlassung Frankfurt am Main, Europa-Allee 12, D-60327 Frankfurt am Main Germany
3. Austria – Erste Bank der oesterreichischen Sparkassen AG, Greben 21, 1010 Vienna, Austria
4. France – Invesco Management S.A. Succursale en France, 18 rue de Londres, 75009 Paris
Swiss disclosure requirement
The following table lists the Funds that are authorised for distribution in Switzerland.
Total expense ratio expresses the sum of all costs and commissions charged on an on-going basis to the Funds’ assets. Operating expenses are taken
retrospectively as a percentage of the Funds’ average Net Asset Value for the financial period.
Fund Name Total Expense Ratio Performance Ratio
Financial
Period
ended
Financial
Year ended
Financial
Period
ended
Financial
Period
ended
Financial
Year
ended
Financial
Period
ended
31-Mar-22 30-Sep-21 31-Mar-21 31-Mar-22 30-Sep-21 31-Mar-21
% % % % % %
Invesco EQQQ NASDAQ-100 UCITS ETF 0.30 0.30 0.30 1.18 29.03 1.66
Invesco EQQQ NASDAQ-100 UCITS ETF – CHF Hedged UCITS ETF 0.35 0.35 0.35 0.61 27.16 1.37
Invesco EQQQ NASDAQ-100 UCITS ETF – EUR Hedged UCITS ETF 0.35 0.35 0.35 0.46 27.85 1.60
Invesco EQQQ NASDAQ-100 UCITS ETF – GBP Hedged UCITS ETF 0.35 0.35 0.35 1.04 28.64 1.72
Invesco EQQQ NASDAQ-100 UCITS ETF – USD Unhedged Accumulation
UCITS ETF 0.30 0.30 0.30 1.18 29.03 1.74
Invesco FTSE RAFI US 1000 UCITS ETF 0.39 0.39 0.39 8.66 40.83 14.20
Invesco S&P 500 High Dividend Low Volatility UCITS ETF 0.30 0.30 0.30 13.21 32.69 15.07
Invesco S&P 500 High Dividend Low Volatility UCITS ETF - CHF Hedged
UCITS ETF 0.35 0.35 0.35 12.44 31.15 15.00
Invesco S&P 500 VEQTOR UCITS ETF* - - 0.39 - - n/a
Invesco S&P 500 QVM UCITS ETF 0.35 0.35 0.35 12.62 23.91 6.19
Invesco Global Buyback Achievers UCITS ETF 0.39 0.39 0.39 (3.80) 42.65 12.16
Invesco FTSE RAFI Europe Mid-Small UCITS ETF* - - 0.39 - - n/a
Invesco FTSE RAFI All-World 3000 UCITS ETF 0.39 0.39 0.39 4.56 36.55 10.16
Invesco FTSE RAFI Emerging Markets UCITS ETF 0.49 0.49 0.49 (5.18) 33.32 6.28
Invesco FTSE RAFI Europe UCITS ETF 0.39 0.39 0.39 3.65 39.16 12.77
Invesco EURO STOXX High Dividend Low Volatility UCITS ETF 0.30 0.30 0.30 2.02 24.32 10.44
Invesco FTSE Emerging Markets High Dividend Low Volatility UCITS ETF 0.49 0.49 0.49 (7.12) 34.96 6.96
Invesco US High Yield Fallen Angels UCITS ETF 0.45 0.45 0.45 (5.21) 16.49 0.48
Invesco US High Yield Fallen Angels – CHF Hedged UCITS ETF 0.50 0.50 0.50 (5.95) 14.99 0.05
Invesco US High Yield Fallen Angels – EUR Hedged UCITS ETF 0.50 0.50 0.50 (5.84) 15.27 0.14
Invesco US High Yield Fallen Angels – GBP Hedged UCITS ETF 0.50 0.50 0.50 (5.42) 16.01 0.30
* Fund closed on 12 February 2020. Up until the date of closure the Fund was authorised for distribution in Switzerland.
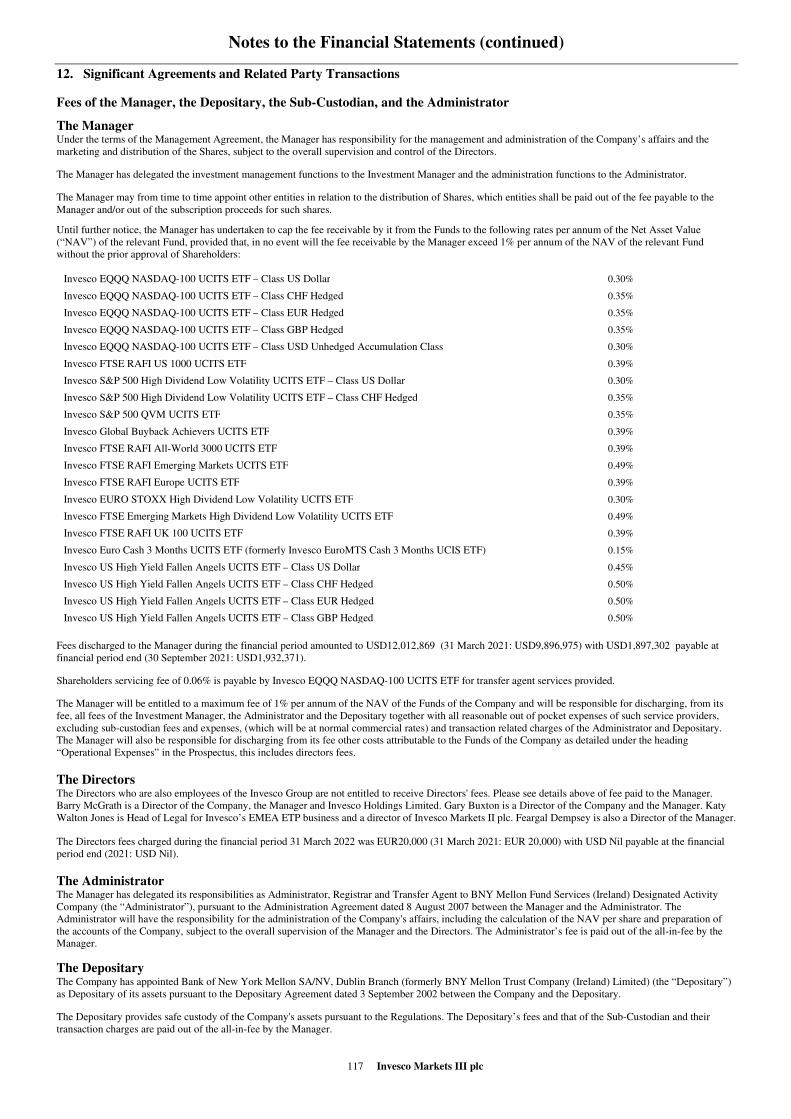
Notes to the Financial Statements (continued)
117 Invesco Markets III plc
12. Significant Agreements and Related Party Transactions
Fees of the Manager, the Depositary, the Sub-Custodian, and the Administrator
The Manager Under the terms of the Management Agreement, the Manager has responsibility for the management and administration of the Company’s affairs and the
marketing and distribution of the Shares, subject to the overall supervision and control of the Directors.
The Manager has delegated the investment management functions to the Investment Manager and the administration functions to the Administrator.
The Manager may from time to time appoint other entities in relation to the distribution of Shares, which entities shall be paid out of the fee payable to the
Manager and/or out of the subscription proceeds for such shares.
Until further notice, the Manager has undertaken to cap the fee receivable by it from the Funds to the following rates per annum of the Net Asset Value
(“NAV”) of the relevant Fund, provided that, in no event will the fee receivable by the Manager exceed 1% per annum of the NAV of the relevant Fund
without the prior approval of Shareholders:
Invesco EQQQ NASDAQ-100 UCITS ETF – Class US Dollar 0.30%
Invesco EQQQ NASDAQ-100 UCITS ETF – Class CHF Hedged 0.35%
Invesco EQQQ NASDAQ-100 UCITS ETF – Class EUR Hedged 0.35%
Invesco EQQQ NASDAQ-100 UCITS ETF – Class GBP Hedged 0.35%
Invesco EQQQ NASDAQ-100 UCITS ETF – Class USD Unhedged Accumulation Class 0.30%
Invesco FTSE RAFI US 1000 UCITS ETF 0.39%
Invesco S&P 500 High Dividend Low Volatility UCITS ETF – Class US Dollar 0.30%
Invesco S&P 500 High Dividend Low Volatility UCITS ETF – Class CHF Hedged 0.35%
Invesco S&P 500 QVM UCITS ETF 0.35%
Invesco Global Buyback Achievers UCITS ETF 0.39%
Invesco FTSE RAFI All-World 3000 UCITS ETF 0.39%
Invesco FTSE RAFI Emerging Markets UCITS ETF 0.49%
Invesco FTSE RAFI Europe UCITS ETF 0.39%
Invesco EURO STOXX High Dividend Low Volatility UCITS ETF 0.30%
Invesco FTSE Emerging Markets High Dividend Low Volatility UCITS ETF 0.49%
Invesco FTSE RAFI UK 100 UCITS ETF 0.39%
Invesco Euro Cash 3 Months UCITS ETF (formerly Invesco EuroMTS Cash 3 Months UCIS ETF) 0.15%
Invesco US High Yield Fallen Angels UCITS ETF – Class US Dollar 0.45%
Invesco US High Yield Fallen Angels UCITS ETF – Class CHF Hedged 0.50%
Invesco US High Yield Fallen Angels UCITS ETF – Class EUR Hedged 0.50%
Invesco US High Yield Fallen Angels UCITS ETF – Class GBP Hedged 0.50%
Fees discharged to the Manager during the financial period amounted to USD12,012,869 (31 March 2021: USD9,896,975) with USD1,897,302 payable at
financial period end (30 September 2021: USD1,932,371).
Shareholders servicing fee of 0.06% is payable by Invesco EQQQ NASDAQ-100 UCITS ETF for transfer agent services provided.
The Manager will be entitled to a maximum fee of 1% per annum of the NAV of the Funds of the Company and will be responsible for discharging, from its
fee, all fees of the Investment Manager, the Administrator and the Depositary together with all reasonable out of pocket expenses of such service providers,
excluding sub-custodian fees and expenses, (which will be at normal commercial rates) and transaction related charges of the Administrator and Depositary.
The Manager will also be responsible for discharging from its fee other costs attributable to the Funds of the Company as detailed under the heading
“Operational Expenses” in the Prospectus, this includes directors fees.
The Directors The Directors who are also employees of the Invesco Group are not entitled to receive Directors' fees. Please see details above of fee paid to the Manager.
Barry McGrath is a Director of the Company, the Manager and Invesco Holdings Limited. Gary Buxton is a Director of the Company and the Manager. Katy
Walton Jones is Head of Legal for Invesco’s EMEA ETP business and a director of Invesco Markets II plc. Feargal Dempsey is also a Director of the Manager.
The Directors fees charged during the financial period 31 March 2022 was EUR20,000 (31 March 2021: EUR 20,000) with USD Nil payable at the financial
period end (2021: USD Nil).
The Administrator The Manager has delegated its responsibilities as Administrator, Registrar and Transfer Agent to BNY Mellon Fund Services (Ireland) Designated Activity
Company (the “Administrator”), pursuant to the Administration Agreement dated 8 August 2007 between the Manager and the Administrator. The
Administrator will have the responsibility for the administration of the Company's affairs, including the calculation of the NAV per share and preparation of
the accounts of the Company, subject to the overall supervision of the Manager and the Directors. The Administrator’s fee is paid out of the all-in-fee by the
Manager.
The Depositary The Company has appointed Bank of New York Mellon SA/NV, Dublin Branch (formerly BNY Mellon Trust Company (Ireland) Limited) (the “Depositary”)
as Depositary of its assets pursuant to the Depositary Agreement dated 3 September 2002 between the Company and the Depositary.
The Depositary provides safe custody of the Company's assets pursuant to the Regulations. The Depositary’s fees and that of the Sub-Custodian and their
transaction charges are paid out of the all-in-fee by the Manager.
Notes to the Financial Statements (continued)
118 Invesco Markets III plc
12. Significant Agreements and Related Party Transactions (continued)
The Depositary (continued)
Investment Manager Invesco Capital Management LLC is the Investment Manager to the Funds. The Funds paid no fees directly to the Investment Manager and all other
expenses were paid by the Manager on behalf of the Funds.
Related Parties
The Manager is deemed related to the Company.
As at 31 March 2022, the holdings of Invesco FTSE RAFI All-World 3000 UCITS ETF, Invesco FTSE RAFI US 1000 UCITS ETF and Invesco S&P 500
QVM UCITS ETF contained a security “Invesco Ltd”. The security is related to the Investment Manager by virtue of Invesco Limited being the ultimate parent
of Invesco Capital Management LLC. The security was bought and valued at arms length. See Schedule of Investments on page 11 to 87 for details of related
party investments note above.
The Manager will discharge the legal fees out of its all-in-fee.
Invesco Capital Management LLC holds one Subscriber Share in the Company.
Some employees of Invesco Investment Management Limited hold subscriber shares in the Company.
Invesco US High Yield Fallen Angels UCITS ETF invests in Invesco Liquidity Funds plc - Invesco US Dollar Liquidity Portfolio as at 31 March 2022. See the
Schedule of Investments on page 11 to 87 for details of related party investments note above.
Transactions with connected persons
In accordance with Regulation 43 of the Central Bank UCITS Regulations, any transaction carried out with the Company by its promoter, manager, depositary,
investment adviser and/or associated or group companies of these entities (“connected persons”) must be carried out as if at arm’s length. It is authorised
pursuant to the European Communities (Undertaking for Collective Investments in Transferable Securities) Regulations 2011, as amended (the “UCITS
Regulations”) and the Central Bank (Supervision and Enforcement) Act 2013 (Section 48(1)) (Undertakings for Collective Investment in Transferable
Securities) Regulations 2019 (the “Central Bank UCITS Regulations”). Such transactions must be in the best interests of the shareholders. In addition to those
transactions, there are also transactions carried out by connected persons on behalf of the Company to which the Directors have no direct access and in respect
of which the Directors must rely upon assurances from its delegates that the connected persons carrying out those transactions do carry them out on a similar
basis.
Having regard to confirmations from the Company’s management and its relevant delegates, the Board of Directors of the Company is satisfied that (i) there
are arrangements (as evidenced by written procedures documented by the Investment Manager) in place to ensure that the obligations described above are
applied to all transactions with connected persons; and (ii) transactions with connected persons entered into during the period complied with these obligations,
as attested by the Investment Manager through regular updates to the Directors. The Board of Directors is not aware of any transactions with connected persons
during the six months ended 31 March 2022, other than those disclosed in these financial statements.
13. Reconciliation to the published NAV
The Funds below have exposure to Brazilian equities. In accordance with FRS 102, the Funds must recognise a provision for potential capital gains tax payable
taking into consideration the unrealised positions and capital gains tax payments not reflected in the published NAV at the financial period end. These
adjustments have led to the below difference between the NAV per Share as recorded in the financial statements and the published NAV per Share.
Invesco
Invesco Invesco FTSE Emerging
FTSE RAFI FTSE RAFI Markets
All-World Emerging High Dividend
3000 Markets Low Volatility
UCITS ETF UCITS ETF UCITS ETF
USD USD USD
30 March 2022
Net Assets Attributable to holders of redeemable participating Shares in
accordance with FRS 102 42,696,205 30,961,187 109,806,243
Add: capital gains tax adjustments 6,787 45,293 115,674
Published Net Assets Attributable to Equity Holders 42,702,992 31,006,480 109,921,917
NAV per Share in accordance with FRS 102 25.19 8.88 27.10
Published NAV per Share 25.20 8.89 27.13
14. Significant Events during the financial period
Effective 6 December 2021, the registered office and the Manager changed their address from Central Quay, Riverside IV, Sir John Rogerson’s Quay, Dublin
2, D02 RR77, Ireland to Ground Floor, 2 Cumberland Place, Fenian Street, Dublin 2, D02 H0V5, Ireland.
Effective 21 February 2022 the minimum subscription and redemption amount for both in kind and cash was reduced from 25,000 shares to 10,000 share for
the share classes of Invesco EQQQ NASDAQ-100 UCITS ETF.
Effective 31 March 2022, Invesco EuroMTS Cash 3 Months UCITS ETF changed name to Invesco Euro Cash 3 Months UCITS ETF.
Managing the risks presented by the outbreak of Coronavirus
The spread of the coronavirus (COVID-19) disease has caused significant volatility within the global economy and financial markets. To date, the primary
focus of our response has been threefold:
• to ensure the health and safety of our employees;
• to preserve our ability to serve our clients; and
• to appropriately manage client assets in a highly dynamic market environment.

Notes to the Financial Statements (continued)
119 Invesco Markets III plc
14. Significant Events during the financial period (continued)
We have established cross-functional teams in each region (Americas, Asia Pacific and EMEA) that are monitoring the situation globally and regionally. These
teams, which namely include representatives from Distribution, Portfolio Management, Trading, Technology/Operations, Human Resources, Business
Continuity, Compliance, are taking steps to ensure an appropriate and effective response during a highly fluid situation.
The Directors of the 13 active Funds at 31 March 2022 are actively monitoring the situation and, with the support of the investment manager, continue to
manage the Fund’s assets within its investment and risk parameters that have been established. The Directors will continue to review the situation in order to
navigate through this period of heightened uncertainty.
During this period of market volatility as a result of COVID-19, the volume of net redemptions has not been significant. None of the Funds with large net
redemptions during this period give the Board of Directors for the Company cause for concern.
Russian-Ukraine Conflict
During the period financial markets have fallen significantly due primarily to geopolitical tensions arising from Russia’s incursion into Ukraine and the impact
of a subsequent range of sanctions, regulations and other measures which impaired normal trading in Russian securities. As at the balance sheet date the
Invesco FTSE RAFI All-World 3000 UCITS ETF, Invesco FTSE RAFI Emerging Markets UCITS ETF, Invesco FTSE RAFI Europe UCITS ETF, Invesco
FTSE RAFI Emerging Markets High Dividend Low Volatility UCITS ETF and Invesco FTSE RAFI UK 100 UCITS ETF had zero exposure to companies
whose principle activities are in Russia.
Brexit Pursuant to the European Referendum Act 2015, a referendum on the UK’s membership of the EU was held on 23 June 2016 with the majority voting to leave
the EU.
On 29 March 2017, the UK Government exercised its right under Article 50 of the Treaty of the European Union and officially notified the EU of the United
Kingdom’s intention to withdraw from the EU.
The UK consequently left the EU on 31 January 2020 and entered into a transition period which lasted until 31 December 2020. The transition period ended
with arrangements in place between the UK and the Member States of the EU.
The Manager does not believe that Brexit presents significant issues that cannot be mitigated given that the Funds are domiciled in Ireland and can still
passported into Europe (ex UK) and are all currently registered for marketing into the UK under the FCA’s Temporary Passporting Regime (TPR).
Core counterparties of and service providers to the Company have contingency arrangements available as necessary to ensure that activities can continue with
minimal disruption. The Manager has plans to ensure that the Funds will continue to be recognised for sale in the UK once the TPR ends. The Manager is part
of a global group and has been committed for many years to meeting clients’ needs across Europe in both EU and non-EU countries.
The change in the UK’s status from an EU to a non-EU country has not changed the group’s focus or commitment to serve its clients across Europe. The
Manager is monitoring developments closely, through a Brexit Steering Committee, to ensure that the impact on clients and the Company is minimal.
Apart from the above there were no other significant events during the financial period that require disclosure in the financial statements.
15. Significant Events after the financial period end date
Effective 4 April 2022, an updated Prospectus for the Company was issued to reflect the name change on Invesco Euro Cash 3 Months UCITS ETF.
There were no other significant events after the financial period end date that required to be disclosed in the financial statements.
16. Approval of Financial Statements
The Directors approved the financial statements on 17 May 2022.
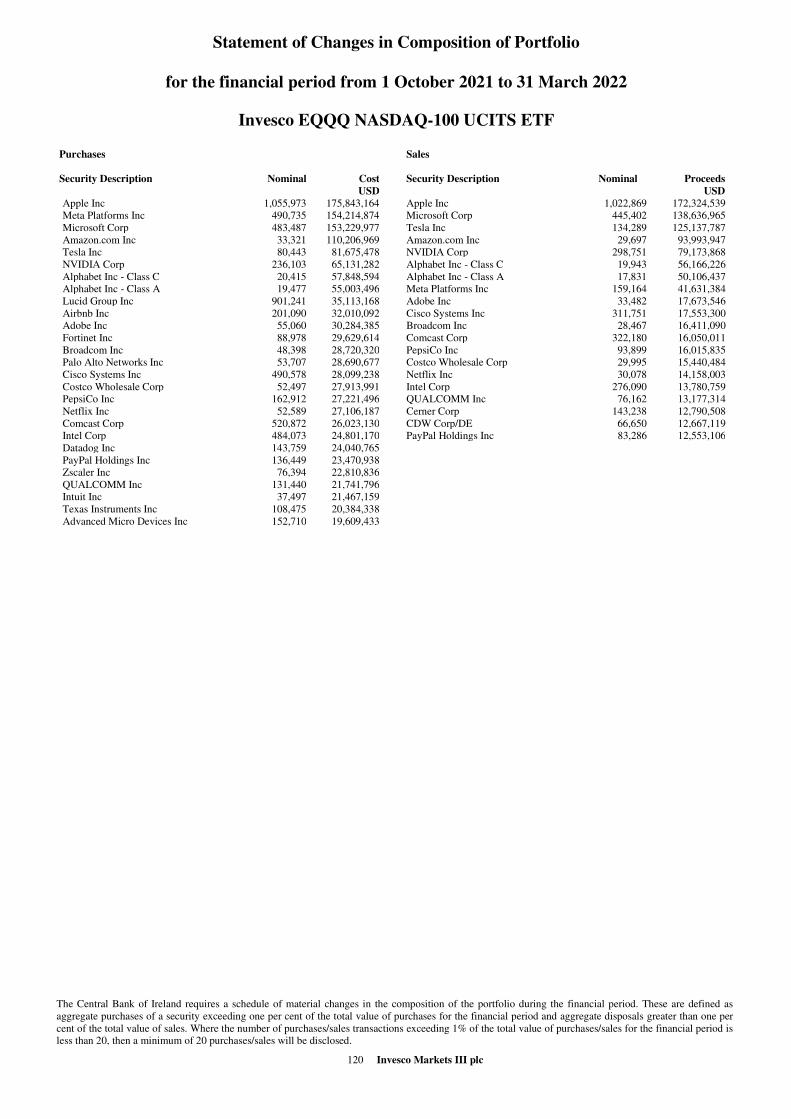
Statement of Changes in Composition of Portfolio
for the financial period from 1 October 2021 to 31 March 2022
Invesco EQQQ NASDAQ-100 UCITS ETF
The Central Bank of Ireland requires a schedule of material changes in the composition of the portfolio during the financial period. These are defined as
aggregate purchases of a security exceeding one per cent of the total value of purchases for the financial period and aggregate disposals greater than one per
cent of the total value of sales. Where the number of purchases/sales transactions exceeding 1% of the total value of purchases/sales for the financial period is
less than 20, then a minimum of 20 purchases/sales will be disclosed.
120 Invesco Markets III plc
Purchases
Security Description Nominal Cost
USD
Apple Inc 1,055,973 175,843,164
Meta Platforms Inc 490,735 154,214,874
Microsoft Corp 483,487 153,229,977
Amazon.com Inc 33,321 110,206,969
Tesla Inc 80,443 81,675,478
NVIDIA Corp 236,103 65,131,282
Alphabet Inc - Class C 20,415 57,848,594
Alphabet Inc - Class A 19,477 55,003,496
Lucid Group Inc 901,241 35,113,168
Airbnb Inc 201,090 32,010,092
Adobe Inc 55,060 30,284,385
Fortinet Inc 88,978 29,629,614
Broadcom Inc 48,398 28,720,320
Palo Alto Networks Inc 53,707 28,690,677
Cisco Systems Inc 490,578 28,099,238
Costco Wholesale Corp 52,497 27,913,991
PepsiCo Inc 162,912 27,221,496
Netflix Inc 52,589 27,106,187
Comcast Corp 520,872 26,023,130
Intel Corp 484,073 24,801,170
Datadog Inc 143,759 24,040,765
PayPal Holdings Inc 136,449 23,470,938
Zscaler Inc 76,394 22,810,836
QUALCOMM Inc 131,440 21,741,796
Intuit Inc 37,497 21,467,159
Texas Instruments Inc 108,475 20,384,338
Advanced Micro Devices Inc 152,710 19,609,433
Sales
Security Description Nominal Proceeds
USD
Apple Inc 1,022,869 172,324,539
Microsoft Corp 445,402 138,636,965
Tesla Inc 134,289 125,137,787
Amazon.com Inc 29,697 93,993,947
NVIDIA Corp 298,751 79,173,868
Alphabet Inc - Class C 19,943 56,166,226
Alphabet Inc - Class A 17,831 50,106,437
Meta Platforms Inc 159,164 41,631,384
Adobe Inc 33,482 17,673,546
Cisco Systems Inc 311,751 17,553,300
Broadcom Inc 28,467 16,411,090
Comcast Corp 322,180 16,050,011
PepsiCo Inc 93,899 16,015,835
Costco Wholesale Corp 29,995 15,440,484
Netflix Inc 30,078 14,158,003
Intel Corp 276,090 13,780,759
QUALCOMM Inc 76,162 13,177,314
Cerner Corp 143,238 12,790,508
CDW Corp/DE 66,650 12,667,119
PayPal Holdings Inc 83,286 12,553,106

Statement of Changes in Composition of Portfolio
for the financial period from 1 October 2021 to 31 March 2022
Invesco FTSE RAFI US 1000 UCITS ETF
The Central Bank of Ireland requires a schedule of material changes in the composition of the portfolio during the financial period. These are defined as
aggregate purchases of a security exceeding one per cent of the total value of purchases for the financial period and aggregate disposals greater than one per
cent of the total value of sales. Where the number of purchases/sales transactions exceeding 1% of the total value of purchases/sales for the financial period is
less than 20, then a minimum of 20 purchases/sales will be disclosed.
121 Invesco Markets III plc
Purchases
Security Description Nominal Cost
USD
AT&T Inc 98,621 2,306,081
Berkshire Hathaway Inc 4,769 1,607,748
Amazon.com Inc 415 1,340,187
Meta Platforms Inc 5,188 1,145,488
Intel Corp 23,213 1,110,321
Verizon Communications Inc 20,132 1,029,491
JPMorgan Chase & Co 5,165 751,762
Comcast Corp 14,007 666,385
Citigroup Inc 7,504 449,604
Walmart Inc 2,929 422,345
Johnson & Johnson 2,369 408,390
General Motors Co 8,762 405,251
Walt Disney Co/The 2,729 389,355
PayPal Holdings Inc 3,083 369,707
Cardinal Health Inc 6,276 358,248
Paramount Global 9,153 339,614
3M Co 2,123 320,237
T-Mobile US Inc 2,365 300,452
Medtronic Plc 2,653 294,521
Raytheon Technologies Corp 2,883 278,807
Sales
Security Description Nominal Proceeds
USD
Apple Inc 11,865 1,946,722
Wells Fargo & Co 30,576 1,570,076
Ford Motor Co 65,745 1,122,708
Pfizer Inc 20,516 1,113,442
Exxon Mobil Corp 14,364 1,100,892
ConocoPhillips 9,382 922,303
Bank of America Corp 20,099 869,266
Chevron Corp 4,760 732,301
UnitedHealth Group Inc 1,464 730,794
Occidental Petroleum Corp 12,099 663,300
Schlumberger NV 15,463 608,063
Avis Budget Group Inc 2,125 599,878
Costco Wholesale Corp 1,064 594,422
Marathon Petroleum Corp 6,709 519,281
Procter & Gamble Co/The 3,080 464,879
Anthem Inc 980 463,640
Nucor Corp 2,603 350,320
Kroger Co/The 6,330 344,494
Macy's Inc 12,384 342,021
PepsiCo Inc 2,041 334,289
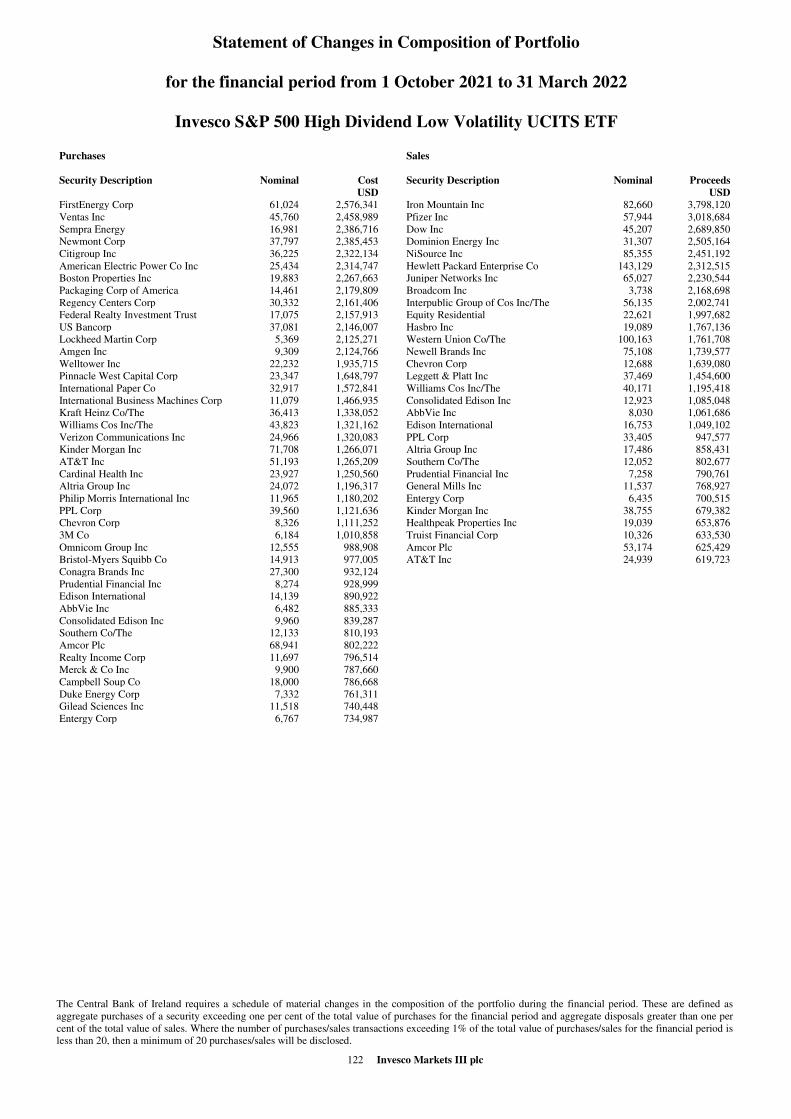
Statement of Changes in Composition of Portfolio
for the financial period from 1 October 2021 to 31 March 2022
Invesco S&P 500 High Dividend Low Volatility UCITS ETF
The Central Bank of Ireland requires a schedule of material changes in the composition of the portfolio during the financial period. These are defined as
aggregate purchases of a security exceeding one per cent of the total value of purchases for the financial period and aggregate disposals greater than one per
cent of the total value of sales. Where the number of purchases/sales transactions exceeding 1% of the total value of purchases/sales for the financial period is
less than 20, then a minimum of 20 purchases/sales will be disclosed.
122 Invesco Markets III plc
Purchases
Security Description Nominal Cost
USD
FirstEnergy Corp 61,024 2,576,341
Ventas Inc 45,760 2,458,989
Sempra Energy 16,981 2,386,716
Newmont Corp 37,797 2,385,453
Citigroup Inc 36,225 2,322,134
American Electric Power Co Inc 25,434 2,314,747
Boston Properties Inc 19,883 2,267,663
Packaging Corp of America 14,461 2,179,809
Regency Centers Corp 30,332 2,161,406
Federal Realty Investment Trust 17,075 2,157,913
US Bancorp 37,081 2,146,007
Lockheed Martin Corp 5,369 2,125,271
Amgen Inc 9,309 2,124,766
Welltower Inc 22,232 1,935,715
Pinnacle West Capital Corp 23,347 1,648,797
International Paper Co 32,917 1,572,841
International Business Machines Corp 11,079 1,466,935
Kraft Heinz Co/The 36,413 1,338,052
Williams Cos Inc/The 43,823 1,321,162
Verizon Communications Inc 24,966 1,320,083
Kinder Morgan Inc 71,708 1,266,071
AT&T Inc 51,193 1,265,209
Cardinal Health Inc 23,927 1,250,560
Altria Group Inc 24,072 1,196,317
Philip Morris International Inc 11,965 1,180,202
PPL Corp 39,560 1,121,636
Chevron Corp 8,326 1,111,252
3M Co 6,184 1,010,858
Omnicom Group Inc 12,555 988,908
Bristol-Myers Squibb Co 14,913 977,005
Conagra Brands Inc 27,300 932,124
Prudential Financial Inc 8,274 928,999
Edison International 14,139 890,922
AbbVie Inc 6,482 885,333
Consolidated Edison Inc 9,960 839,287
Southern Co/The 12,133 810,193
Amcor Plc 68,941 802,222
Realty Income Corp 11,697 796,514
Merck & Co Inc 9,900 787,660
Campbell Soup Co 18,000 786,668
Duke Energy Corp 7,332 761,311
Gilead Sciences Inc 11,518 740,448
Entergy Corp 6,767 734,987
Sales
Security Description Nominal Proceeds
USD
Iron Mountain Inc 82,660 3,798,120
Pfizer Inc 57,944 3,018,684
Dow Inc 45,207 2,689,850
Dominion Energy Inc 31,307 2,505,164
NiSource Inc 85,355 2,451,192
Hewlett Packard Enterprise Co 143,129 2,312,515
Juniper Networks Inc 65,027 2,230,544
Broadcom Inc 3,738 2,168,698
Interpublic Group of Cos Inc/The 56,135 2,002,741
Equity Residential 22,621 1,997,682
Hasbro Inc 19,089 1,767,136
Western Union Co/The 100,163 1,761,708
Newell Brands Inc 75,108 1,739,577
Chevron Corp 12,688 1,639,080
Leggett & Platt Inc 37,469 1,454,600
Williams Cos Inc/The 40,171 1,195,418
Consolidated Edison Inc 12,923 1,085,048
AbbVie Inc 8,030 1,061,686
Edison International 16,753 1,049,102
PPL Corp 33,405 947,577
Altria Group Inc 17,486 858,431
Southern Co/The 12,052 802,677
Prudential Financial Inc 7,258 790,761
General Mills Inc 11,537 768,927
Entergy Corp 6,435 700,515
Kinder Morgan Inc 38,755 679,382
Healthpeak Properties Inc 19,039 653,876
Truist Financial Corp 10,326 633,530
Amcor Plc 53,174 625,429
AT&T Inc 24,939 619,723

Statement of Changes in Composition of Portfolio
for the financial period from 1 October 2021 to 31 March 2022
Invesco S&P 500 QVM UCITS ETF
The Central Bank of Ireland requires a schedule of material changes in the composition of the portfolio during the financial period. These are defined as
aggregate purchases of a security exceeding one per cent of the total value of purchases for the financial period and aggregate disposals greater than one per
cent of the total value of sales. Where the number of purchases/sales transactions exceeding 1% of the total value of purchases/sales for the financial period is
less than 20, then a minimum of 20 purchases/sales will be disclosed.
123 Invesco Markets III plc
Purchases
Security Description Nominal Cost
USD
Exxon Mobil Corp 8,989 612,797
Moderna Inc 1,927 453,679
ConocoPhillips 4,680 368,344
CVS Health Corp 2,970 299,626
Anthem Inc 651 293,543
Berkshire Hathaway Inc 931 287,615
Bank of America Corp 6,369 282,400
Wells Fargo & Co 5,241 268,368
JPMorgan Chase & Co 1,648 246,008
Target Corp 1,116 245,042
Goldman Sachs Group Inc/The 585 214,012
Morgan Stanley 2,196 208,001
Marathon Petroleum Corp 3,042 206,605
Citigroup Inc 3,461 205,370
EOG Resources Inc 2,010 190,335
Cigna Corp 634 142,808
Schlumberger NV 4,061 137,217
Apple Inc 845 136,008
General Dynamics Corp 622 133,262
American Express Co 718 127,483
Devon Energy Corp 2,744 127,203
Pioneer Natural Resources Co 641 125,716
Fortinet Inc 386 123,039
Marsh & McLennan Cos Inc 751 122,082
eBay Inc 1,893 113,915
PNC Financial Services Group Inc/The 543 107,780
Freeport-McMoRan Inc 2,466 107,334
Nucor Corp 850 106,029
Capital One Financial Corp 721 105,804
Eaton Corp Plc 642 101,878
CBRE Group Inc 985 96,862
Sales
Security Description Nominal Proceeds
USD
Apple Inc 2,523 431,761
United Parcel Service Inc 1,302 268,967
Applied Materials Inc 1,434 209,565
Bank of America Corp 3,797 163,863
Deere & Co 453 157,200
Exxon Mobil Corp 1,828 144,388
BlackRock Inc 148 135,206
Lam Research Corp 201 134,501
Berkshire Hathaway Inc 411 127,686
General Motors Co 2,089 115,210
Ford Motor Co 5,757 113,763
JPMorgan Chase & Co 736 104,546
Wells Fargo & Co 2,057 102,665
ConocoPhillips 954 92,203
CVS Health Corp 856 87,398
Target Corp 358 78,523
Carrier Global Corp 1,365 71,322
TE Connectivity Ltd 451 70,536
IDEXX Laboratories Inc 109 67,239
Anthem Inc 133 60,070
Moderna Inc 394 59,452
PNC Financial Services Group Inc/The 301 57,676
DR Horton Inc 555 57,171
Capital One Financial Corp 380 53,991
Corteva Inc 1,155 53,212
American Express Co 294 51,219
Cigna Corp 214 50,696
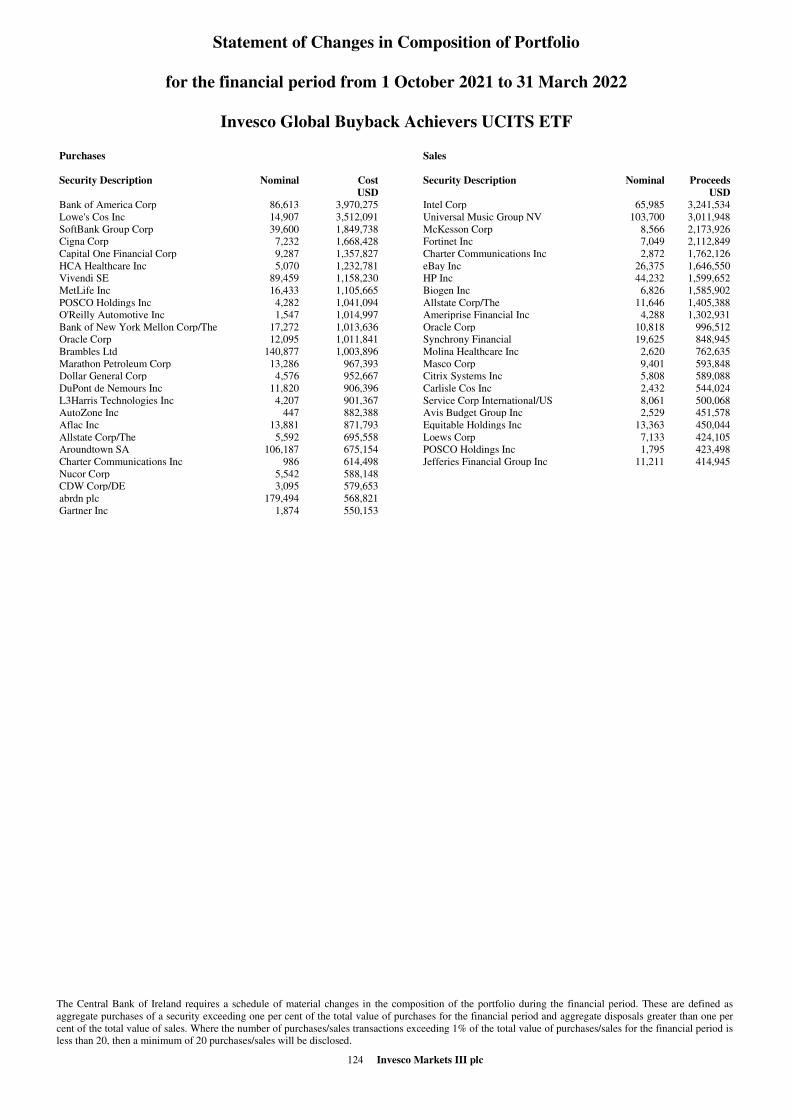
Statement of Changes in Composition of Portfolio
for the financial period from 1 October 2021 to 31 March 2022
Invesco Global Buyback Achievers UCITS ETF
The Central Bank of Ireland requires a schedule of material changes in the composition of the portfolio during the financial period. These are defined as
aggregate purchases of a security exceeding one per cent of the total value of purchases for the financial period and aggregate disposals greater than one per
cent of the total value of sales. Where the number of purchases/sales transactions exceeding 1% of the total value of purchases/sales for the financial period is
less than 20, then a minimum of 20 purchases/sales will be disclosed.
124 Invesco Markets III plc
Purchases
Security Description Nominal Cost
USD
Bank of America Corp 86,613 3,970,275
Lowe's Cos Inc 14,907 3,512,091
SoftBank Group Corp 39,600 1,849,738
Cigna Corp 7,232 1,668,428
Capital One Financial Corp 9,287 1,357,827
HCA Healthcare Inc 5,070 1,232,781
Vivendi SE 89,459 1,158,230
MetLife Inc 16,433 1,105,665
POSCO Holdings Inc 4,282 1,041,094
O'Reilly Automotive Inc 1,547 1,014,997
Bank of New York Mellon Corp/The 17,272 1,013,636
Oracle Corp 12,095 1,011,841
Brambles Ltd 140,877 1,003,896
Marathon Petroleum Corp 13,286 967,393
Dollar General Corp 4,576 952,667
DuPont de Nemours Inc 11,820 906,396
L3Harris Technologies Inc 4,207 901,367
AutoZone Inc 447 882,388
Aflac Inc 13,881 871,793
Allstate Corp/The 5,592 695,558
Aroundtown SA 106,187 675,154
Charter Communications Inc 986 614,498
Nucor Corp 5,542 588,148
CDW Corp/DE 3,095 579,653
abrdn plc 179,494 568,821
Gartner Inc 1,874 550,153
Sales
Security Description Nominal Proceeds
USD
Intel Corp 65,985 3,241,534
Universal Music Group NV 103,700 3,011,948
McKesson Corp 8,566 2,173,926
Fortinet Inc 7,049 2,112,849
Charter Communications Inc 2,872 1,762,126
eBay Inc 26,375 1,646,550
HP Inc 44,232 1,599,652
Biogen Inc 6,826 1,585,902
Allstate Corp/The 11,646 1,405,388
Ameriprise Financial Inc 4,288 1,302,931
Oracle Corp 10,818 996,512
Synchrony Financial 19,625 848,945
Molina Healthcare Inc 2,620 762,635
Masco Corp 9,401 593,848
Citrix Systems Inc 5,808 589,088
Carlisle Cos Inc 2,432 544,024
Service Corp International/US 8,061 500,068
Avis Budget Group Inc 2,529 451,578
Equitable Holdings Inc 13,363 450,044
Loews Corp 7,133 424,105
POSCO Holdings Inc 1,795 423,498
Jefferies Financial Group Inc 11,211 414,945
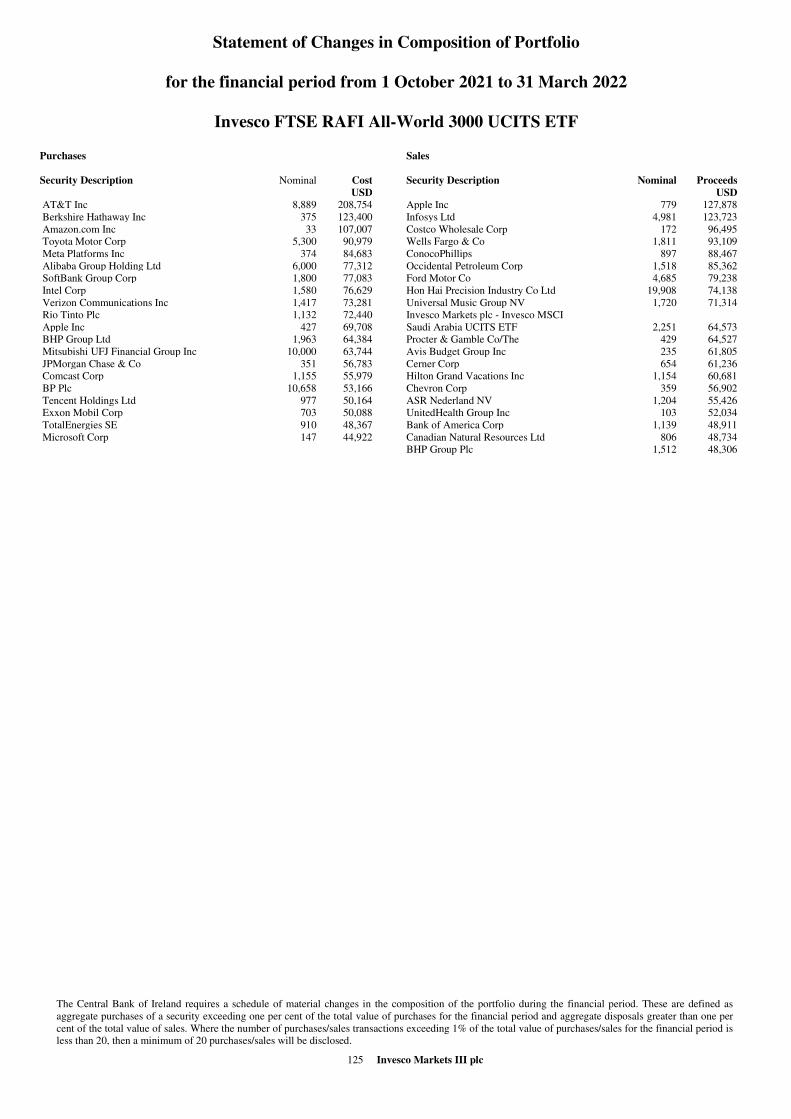
Statement of Changes in Composition of Portfolio
for the financial period from 1 October 2021 to 31 March 2022
Invesco FTSE RAFI All-World 3000 UCITS ETF
The Central Bank of Ireland requires a schedule of material changes in the composition of the portfolio during the financial period. These are defined as
aggregate purchases of a security exceeding one per cent of the total value of purchases for the financial period and aggregate disposals greater than one per
cent of the total value of sales. Where the number of purchases/sales transactions exceeding 1% of the total value of purchases/sales for the financial period is
less than 20, then a minimum of 20 purchases/sales will be disclosed.
125 Invesco Markets III plc
Purchases
Security Description Nominal Cost
USD
AT&T Inc 8,889 208,754
Berkshire Hathaway Inc 375 123,400
Amazon.com Inc 33 107,007
Toyota Motor Corp 5,300 90,979
Meta Platforms Inc 374 84,683
Alibaba Group Holding Ltd 6,000 77,312
SoftBank Group Corp 1,800 77,083
Intel Corp 1,580 76,629
Verizon Communications Inc 1,417 73,281
Rio Tinto Plc 1,132 72,440
Apple Inc 427 69,708
BHP Group Ltd 1,963 64,384
Mitsubishi UFJ Financial Group Inc 10,000 63,744
JPMorgan Chase & Co 351 56,783
Comcast Corp 1,155 55,979
BP Plc 10,658 53,166
Tencent Holdings Ltd 977 50,164
Exxon Mobil Corp 703 50,088
TotalEnergies SE 910 48,367
Microsoft Corp 147 44,922
Sales
Security Description Nominal Proceeds
USD
Apple Inc 779 127,878
Infosys Ltd 4,981 123,723
Costco Wholesale Corp 172 96,495
Wells Fargo & Co 1,811 93,109
ConocoPhillips 897 88,467
Occidental Petroleum Corp 1,518 85,362
Ford Motor Co 4,685 79,238
Hon Hai Precision Industry Co Ltd 19,908 74,138
Universal Music Group NV 1,720 71,314
Invesco Markets plc - Invesco MSCI
Saudi Arabia UCITS ETF 2,251 64,573
Procter & Gamble Co/The 429 64,527
Avis Budget Group Inc 235 61,805
Cerner Corp 654 61,236
Hilton Grand Vacations Inc 1,154 60,681
Chevron Corp 359 56,902
ASR Nederland NV 1,204 55,426
UnitedHealth Group Inc 103 52,034
Bank of America Corp 1,139 48,911
Canadian Natural Resources Ltd 806 48,734
BHP Group Plc 1,512 48,306
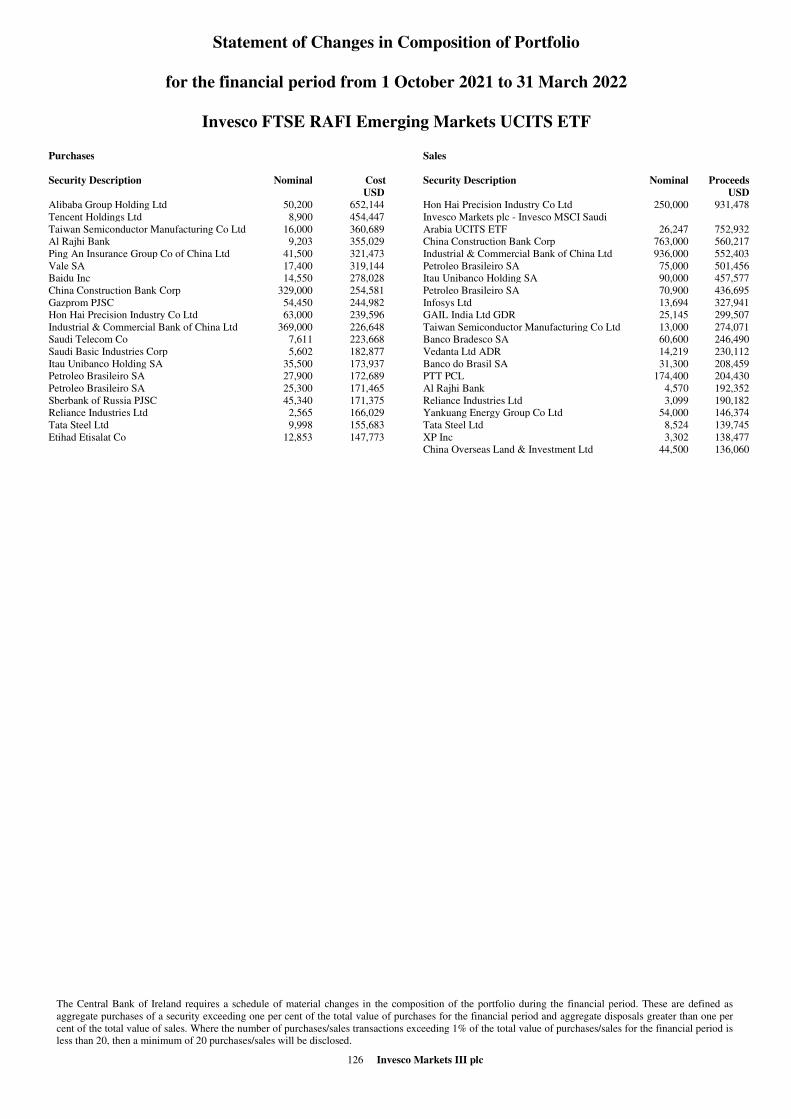
Statement of Changes in Composition of Portfolio
for the financial period from 1 October 2021 to 31 March 2022
Invesco FTSE RAFI Emerging Markets UCITS ETF
The Central Bank of Ireland requires a schedule of material changes in the composition of the portfolio during the financial period. These are defined as
aggregate purchases of a security exceeding one per cent of the total value of purchases for the financial period and aggregate disposals greater than one per
cent of the total value of sales. Where the number of purchases/sales transactions exceeding 1% of the total value of purchases/sales for the financial period is
less than 20, then a minimum of 20 purchases/sales will be disclosed.
126 Invesco Markets III plc
Purchases
Security Description Nominal Cost
USD
Alibaba Group Holding Ltd 50,200 652,144
Tencent Holdings Ltd 8,900 454,447
Taiwan Semiconductor Manufacturing Co Ltd 16,000 360,689
Al Rajhi Bank 9,203 355,029
Ping An Insurance Group Co of China Ltd 41,500 321,473
Vale SA 17,400 319,144
Baidu Inc 14,550 278,028
China Construction Bank Corp 329,000 254,581
Gazprom PJSC 54,450 244,982
Hon Hai Precision Industry Co Ltd 63,000 239,596
Industrial & Commercial Bank of China Ltd 369,000 226,648
Saudi Telecom Co 7,611 223,668
Saudi Basic Industries Corp 5,602 182,877
Itau Unibanco Holding SA 35,500 173,937
Petroleo Brasileiro SA 27,900 172,689
Petroleo Brasileiro SA 25,300 171,465
Sberbank of Russia PJSC 45,340 171,375
Reliance Industries Ltd 2,565 166,029
Tata Steel Ltd 9,998 155,683
Etihad Etisalat Co 12,853 147,773
Sales
Security Description Nominal Proceeds
USD
Hon Hai Precision Industry Co Ltd 250,000 931,478
Invesco Markets plc - Invesco MSCI Saudi
Arabia UCITS ETF 26,247 752,932
China Construction Bank Corp 763,000 560,217
Industrial & Commercial Bank of China Ltd 936,000 552,403
Petroleo Brasileiro SA 75,000 501,456
Itau Unibanco Holding SA 90,000 457,577
Petroleo Brasileiro SA 70,900 436,695
Infosys Ltd 13,694 327,941
GAIL India Ltd GDR 25,145 299,507
Taiwan Semiconductor Manufacturing Co Ltd 13,000 274,071
Banco Bradesco SA 60,600 246,490
Vedanta Ltd ADR 14,219 230,112
Banco do Brasil SA 31,300 208,459
PTT PCL 174,400 204,430
Al Rajhi Bank 4,570 192,352
Reliance Industries Ltd 3,099 190,182
Yankuang Energy Group Co Ltd 54,000 146,374
Tata Steel Ltd 8,524 139,745
XP Inc 3,302 138,477
China Overseas Land & Investment Ltd 44,500 136,060

Statement of Changes in Composition of Portfolio
for the financial period from 1 October 2021 to 31 March 2022
Invesco FTSE RAFI Europe UCITS ETF
The Central Bank of Ireland requires a schedule of material changes in the composition of the portfolio during the financial period. These are defined as
aggregate purchases of a security exceeding one per cent of the total value of purchases for the financial period and aggregate disposals greater than one per
cent of the total value of sales. Where the number of purchases/sales transactions exceeding 1% of the total value of purchases/sales for the financial period is
less than 20, then a minimum of 20 purchases/sales will be disclosed.
127 Invesco Markets III plc
Purchases
Security Description Nominal Cost
EUR
British American Tobacco Plc 912 34,544
Glencore Plc 6,056 34,475
HSBC Holdings Plc 4,424 26,506
Vodafone Group Plc 14,513 22,137
Shell Plc 882 20,524
Enel SpA 3,277 19,024
Rio Tinto Plc 238 15,945
Credit Suisse Group AG 2,091 15,432
BP Plc 2,767 12,047
Allianz SE 51 10,832
Prudential Plc 817 10,527
Koninklijke Philips NV 335 9,539
Barclays Plc 4,586 9,445
Iberdrola SA 924 9,060
Siemens Energy AG 420 9,012
Holcim Ltd 188 8,512
TotalEnergies SE 172 7,991
Swiss Re AG 95 7,943
BNP Paribas SA 141 7,677
BASF SE 137 7,603
Sales
Security Description Nominal Proceeds
EUR
BHP Group Plc 1,500 42,919
Equinor ASA 815 25,346
GlaxoSmithKline Plc 1,163 22,311
UniCredit SpA 2,182 21,144
Nestle SA 157 18,415
AstraZeneca Plc 124 14,090
Nokia Oyj 2,770 13,432
Novo Nordisk A/S 129 12,853
Unibail-Rodamco-Westfield 204 12,787
Bayer AG 219 12,700
CaixaBank SA 3,520 11,218
Banco Santander SA 3,534 11,023
Roche Holding AG 30 10,655
Diageo Plc 237 10,562
Deutsche Wohnen SE 223 10,483
Suez SA 511 10,133
Stellantis NV 684 10,027
Wm Morrison Supermarkets Plc 2,832 9,645
Deutsche Bank AG 819 9,026
Koninklijke Ahold Delhaize NV 318 8,971
Universal Music Group NV 391 8,904
Cie Financiere Richemont SA 77 8,850
K+S AG 334 8,468
Eni SpA 638 8,118
TechnipFMC Plc 1,353 7,997
UBS Group AG 452 7,543
ArcelorMittal SA 260 7,374
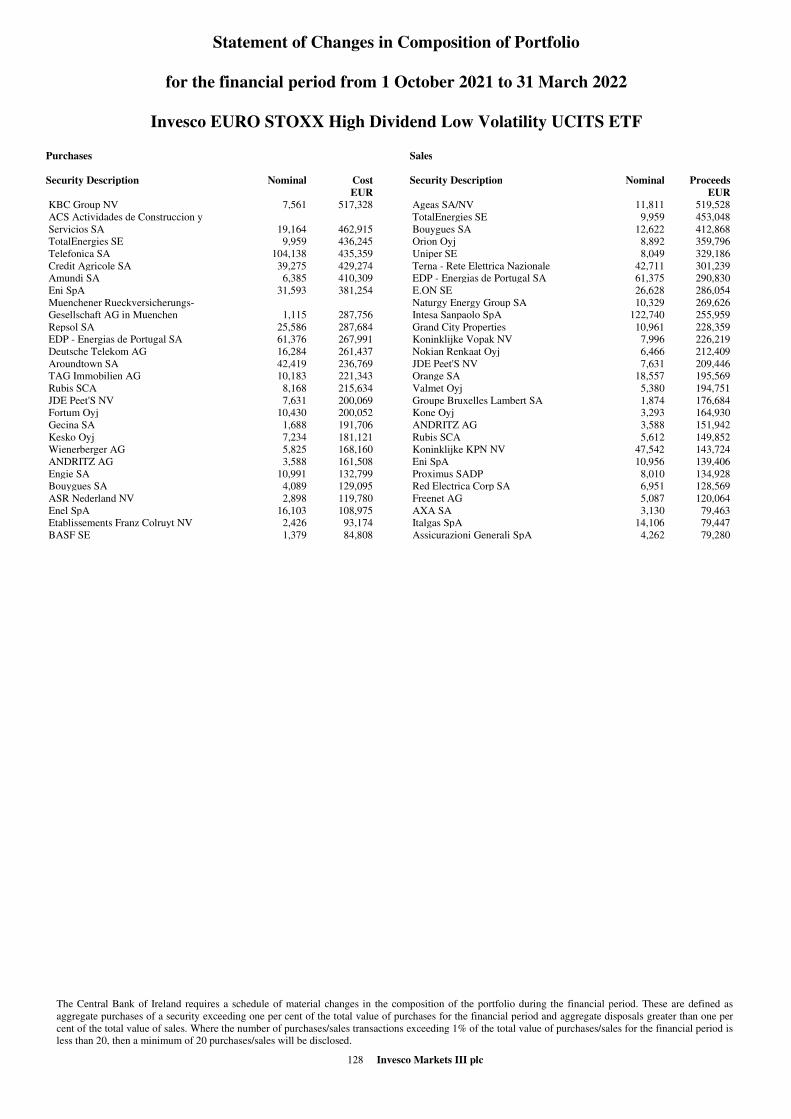
Statement of Changes in Composition of Portfolio
for the financial period from 1 October 2021 to 31 March 2022
Invesco EURO STOXX High Dividend Low Volatility UCITS ETF
The Central Bank of Ireland requires a schedule of material changes in the composition of the portfolio during the financial period. These are defined as
aggregate purchases of a security exceeding one per cent of the total value of purchases for the financial period and aggregate disposals greater than one per
cent of the total value of sales. Where the number of purchases/sales transactions exceeding 1% of the total value of purchases/sales for the financial period is
less than 20, then a minimum of 20 purchases/sales will be disclosed.
128 Invesco Markets III plc
Purchases
Security Description Nominal Cost
EUR
KBC Group NV 7,561 517,328
ACS Actividades de Construccion y
Servicios SA 19,164 462,915
TotalEnergies SE 9,959 436,245
Telefonica SA 104,138 435,359
Credit Agricole SA 39,275 429,274
Amundi SA 6,385 410,309
Eni SpA 31,593 381,254
Muenchener Rueckversicherungs-
Gesellschaft AG in Muenchen 1,115 287,756
Repsol SA 25,586 287,684
EDP - Energias de Portugal SA 61,376 267,991
Deutsche Telekom AG 16,284 261,437
Aroundtown SA 42,419 236,769
TAG Immobilien AG 10,183 221,343
Rubis SCA 8,168 215,634
JDE Peet'S NV 7,631 200,069
Fortum Oyj 10,430 200,052
Gecina SA 1,688 191,706
Kesko Oyj 7,234 181,121
Wienerberger AG 5,825 168,160
ANDRITZ AG 3,588 161,508
Engie SA 10,991 132,799
Bouygues SA 4,089 129,095
ASR Nederland NV 2,898 119,780
Enel SpA 16,103 108,975
Etablissements Franz Colruyt NV 2,426 93,174
BASF SE 1,379 84,808
Sales
Security Description Nominal Proceeds
EUR
Ageas SA/NV 11,811 519,528
TotalEnergies SE 9,959 453,048
Bouygues SA 12,622 412,868
Orion Oyj 8,892 359,796
Uniper SE 8,049 329,186
Terna - Rete Elettrica Nazionale 42,711 301,239
EDP - Energias de Portugal SA 61,375 290,830
E.ON SE 26,628 286,054
Naturgy Energy Group SA 10,329 269,626
Intesa Sanpaolo SpA 122,740 255,959
Grand City Properties 10,961 228,359
Koninklijke Vopak NV 7,996 226,219
Nokian Renkaat Oyj 6,466 212,409
JDE Peet'S NV 7,631 209,446
Orange SA 18,557 195,569
Valmet Oyj 5,380 194,751
Groupe Bruxelles Lambert SA 1,874 176,684
Kone Oyj 3,293 164,930
ANDRITZ AG 3,588 151,942
Rubis SCA 5,612 149,852
Koninklijke KPN NV 47,542 143,724
Eni SpA 10,956 139,406
Proximus SADP 8,010 134,928
Red Electrica Corp SA 6,951 128,569
Freenet AG 5,087 120,064
AXA SA 3,130 79,463
Italgas SpA 14,106 79,447
Assicurazioni Generali SpA 4,262 79,280

Statement of Changes in Composition of Portfolio
for the financial period from 1 October 2021 to 31 March 2022
Invesco FTSE Emerging Markets High Dividend Low Volatility UCITS ETF
The Central Bank of Ireland requires a schedule of material changes in the composition of the portfolio during the financial period. These are defined as
aggregate purchases of a security exceeding one per cent of the total value of purchases for the financial period and aggregate disposals greater than one per
cent of the total value of sales. Where the number of purchases/sales transactions exceeding 1% of the total value of purchases/sales for the financial period is
less than 20, then a minimum of 20 purchases/sales will be disclosed.
129 Invesco Markets III plc
Purchases
Security Description Nominal Cost
USD
Sri Trang Gloves Thailand PCL 3,584,044 2,823,169
Bradespar SA - Pref 395,658 2,779,110
Metalurgica Gerdau SA - Pref 1,101,718 2,672,401
Humansoft Holding Co KSC 204,223 2,468,183
Cia Paranaense de Energia - Pref 1,591,767 2,361,077
Exxaro Resources Ltd 165,683 2,356,738
iShares IV plc - iShares MSCI India UCITS
ETF 291,828 2,260,875
Chicony Electronics Co Ltd 698,289 2,244,283
Yulon Nissan Motor Co Ltd 226,759 2,019,859
Cencosud SA 1,028,753 2,007,150
Asia Cement Corp 1,159,647 1,883,265
Transcend Information Inc 738,944 1,874,783
Formosa Taffeta Co Ltd 1,788,176 1,842,687
Dana Gas PJSC 5,846,039 1,837,157
Jiangsu Zhongnan Construction Group Co Ltd -
Class A 2,813,700 1,672,134
Petroleo Brasileiro SA - Pref 258,843 1,583,078
Chongqing Department Store Co Ltd - Class A 374,586 1,520,476
Redefine Properties Ltd 4,915,250 1,433,965
Vale SA 74,748 1,433,737
Petroleo Brasileiro SA 214,614 1,421,611
Wistron Corp 1,287,842 1,395,489
Marfrig Global Foods SA 315,944 1,344,956
Catcher Technology Co Ltd 249,435 1,329,225
Grupo Aeroportuario del Centro Norte SAB
de CV
180,828 1,305,397
Banco Santander Brasil SA 182,436 1,280,184
Gerdau SA - Pref 203,658 1,239,567
EDP - Energias do Brasil SA 266,819 1,178,727
China Development Financial Holding Corp 1,767,285 1,178,166
Fibra Uno Administracion SA de CV 1,006,610 1,144,988
Anadolu Efes Biracilik Ve Malt Sanayii AS 693,663 1,136,001
TangShan Port Group Co Ltd - Class A 2,648,900 1,134,021
China Petroleum & Chemical Corp 2,250,794 1,058,456
Sales
Security Description Nominal Proceeds
USD
Chicony Electronics Co Ltd 1,180,072 3,750,019
Yankuang Energy Group Co Ltd 1,405,329 3,703,299
China Power International Development Ltd 6,663,217 3,475,449
Transcend Information Inc 1,251,029 3,221,378
AES Andes SA 19,966,547 3,137,675
Formosa Taffeta Co Ltd 3,023,300 3,037,427
Land & Houses PCL 10,359,806 2,964,485
China Shenhua Energy Co Ltd - Class A 641,522 2,539,811
Transmissora Alianca de Energia Eletrica SA 298,970 2,529,804
PICC Property & Casualty Co Ltd 2,450,395 2,466,565
Telefonica Brasil SA 209,447 2,211,118
Asia Cement Corp 1,342,540 2,199,209
Dubai Islamic Bank PJSC 1,236,293 2,016,816
Yulon Nissan Motor Co Ltd 228,591 2,013,106
Shougang Fushan Resources Group Ltd 5,733,270 1,878,440
China Resources Power Holdings Co Ltd 857,710 1,705,284
China Development Financial Holding Corp 2,481,996 1,682,315
Nanjing Iron & Steel Co Ltd 2,922,168 1,654,448
iShares IV plc - iShares MSCI India UCITS ETF 216,328 1,620,328
China Merchants Shekou Industrial Zone
Holdings Co Ltd 732,560 1,598,689
Bank of Beijing Co Ltd 2,116,519 1,462,299
Vodacom Group Ltd 132,635 1,396,546
China Everbright Environment Group Ltd 2,142,742 1,372,114
Shandong Buchang Pharmaceuticals Co
Ltd
385,045 1,363,398
O2 Czech Republic AS 108,743 1,322,505
Shenzhen Expressway Co Ltd 1,358,623 1,315,474
China South Publishing & Media Group Co Ltd 857,452 1,306,719
Wistron Corp 1,174,972 1,267,326
Huadian Power International Corp Ltd 3,795,201 1,223,850
China Shenhua Energy Co Ltd 457,887 1,210,949
Hubei Jumpcan Pharmaceutical Co Ltd 290,781 1,120,634
Bank of Communications Co Ltd - Class A 1,386,258 1,060,505
Yuexiu Property Co Ltd 997,703 993,789
Liuzhou Iron & Steel Co Ltd 1,214,235 934,692
Shandong Hi-speed Co Ltd 1,160,900 934,078
China Minsheng Banking Corp Ltd - Class A 1,562,841 912,549
Wens Foodstuffs Group Co Ltd 279,006 908,342
Bank of Communications Co Ltd 1,309,463 900,484
Guangzhou R&F Properties Co Ltd 1,849,275 850,056
BBMG Corp 5,473,465 845,123

Statement of Changes in Composition of Portfolio
for the financial period from 1 October 2021 to 31 March 2022
Invesco FTSE RAFI UK 100 UCITS ETF
The Central Bank of Ireland requires a schedule of material changes in the composition of the portfolio during the financial period. These are defined as
aggregate purchases of a security exceeding one per cent of the total value of purchases for the financial period and aggregate disposals greater than one per
cent of the total value of sales. Where the number of purchases/sales transactions exceeding 1% of the total value of purchases/sales for the financial period is
less than 20, then a minimum of 20 purchases/sales will be disclosed.
130 Invesco Markets III plc
Purchases
Security Description Nominal Cost
GBP
Rio Tinto Plc 6,678 264,043
Unilever Plc 2,423 84,679
Vodafone Group Plc 58,344 73,871
Prudential Plc 5,357 58,685
Legal & General Group Plc 16,270 45,189
BP Plc 11,388 41,484
Glencore Plc 9,510 41,329
Flutter Entertainment Plc 370 35,857
HSBC Holdings Plc 7,069 34,178
Aviva Plc 6,421 27,122
Phoenix Group Holdings Plc 4,115 26,475
Johnson Matthey Plc 1,285 24,946
Anglo American Plc 629 22,065
Antofagasta Plc 1,347 22,033
Entain Plc 1,236 21,297
Pershing Square Holdings Ltd 712 20,157
abrdn plc 9,241 19,569
Persimmon Plc 796 18,359
CRH Plc 512 18,149
Croda International Plc 238 18,142
B&M European Value Retail SA 3,105 18,053
Rentokil Initial Plc 3,510 18,004
Shell PLC 966 17,927
British American Tobacco Plc 611 17,728
NatWest Group Plc 7,865 17,123
Shell PLC 858 15,955
GlaxoSmithKline Plc 962 15,384
Sales
Security Description Nominal Proceeds
GBP
BP Plc 147,352 524,917
Shell Plc 21,773 421,728
HSBC Holdings Plc 70,059 337,726
BHP Group PLC 8,606 203,284
GlaxoSmithKline Plc 9,743 156,278
Rio Tinto Plc 4,585 146,311
British American Tobacco Plc 4,841 144,051
Glencore Plc 33,027 144,028
BT Group Plc 77,358 136,241
Lloyds Banking Group Plc 286,110 135,795
Shell PLC 7,805 124,353
Vodafone Group Plc 92,594 111,645
Shell PLC 6,980 111,299
Wm Morrison Supermarkets Plc 35,908 102,809
Barclays Plc 54,091 94,195
National Grid Plc 7,506 83,308
Unilever Plc 2,261 81,462
AstraZeneca Plc 855 77,866
Tesco Plc 27,530 76,788
Diageo Plc 1,698 63,437
WPP Plc 5,471 58,209
Rio Tinto Plc 1,104 58,019
Centrica Plc 73,538 56,114
Aviva Plc 13,191 54,718
Imperial Brands Plc 3,200 50,409
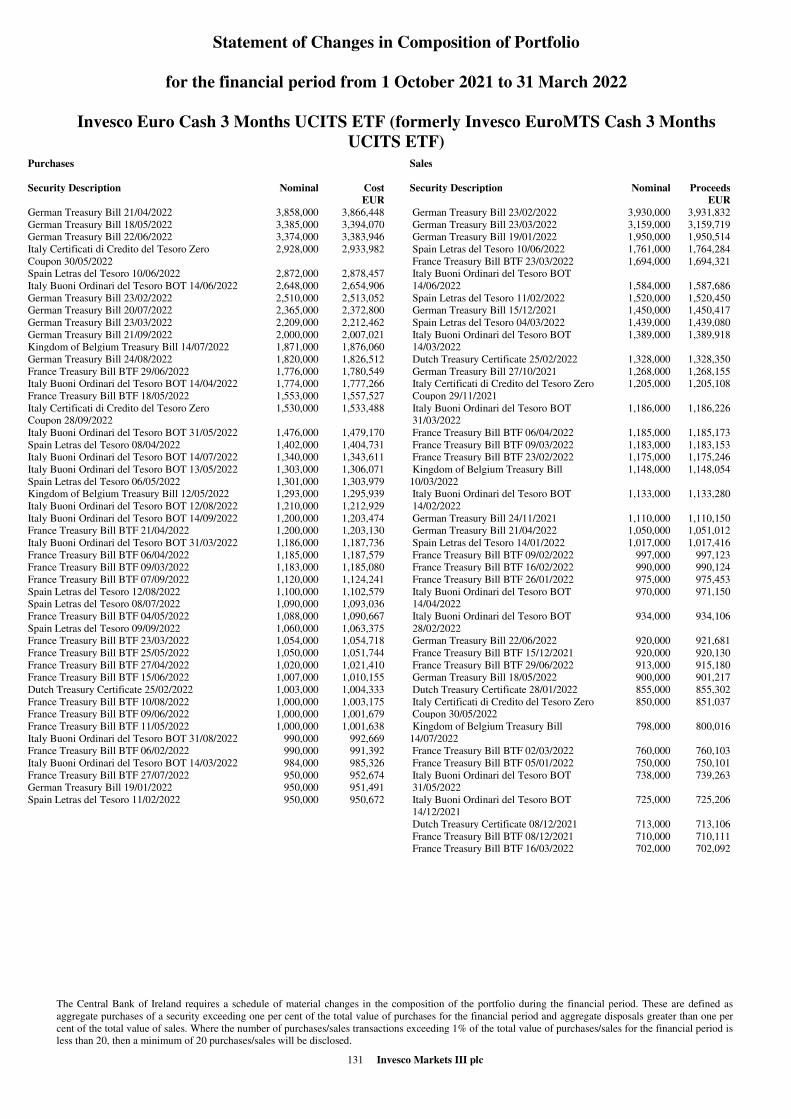
Statement of Changes in Composition of Portfolio
for the financial period from 1 October 2021 to 31 March 2022
Invesco Euro Cash 3 Months UCITS ETF (formerly Invesco EuroMTS Cash 3 Months
UCITS ETF)
The Central Bank of Ireland requires a schedule of material changes in the composition of the portfolio during the financial period. These are defined as
aggregate purchases of a security exceeding one per cent of the total value of purchases for the financial period and aggregate disposals greater than one per
cent of the total value of sales. Where the number of purchases/sales transactions exceeding 1% of the total value of purchases/sales for the financial period is
less than 20, then a minimum of 20 purchases/sales will be disclosed.
131 Invesco Markets III plc
Purchases
Security Description Nominal Cost
EUR
German Treasury Bill 21/04/2022 3,858,000 3,866,448
German Treasury Bill 18/05/2022 3,385,000 3,394,070
German Treasury Bill 22/06/2022 3,374,000 3,383,946
Italy Certificati di Credito del Tesoro Zero
Coupon 30/05/2022
2,928,000 2,933,982
Spain Letras del Tesoro 10/06/2022 2,872,000 2,878,457
Italy Buoni Ordinari del Tesoro BOT 14/06/2022 2,648,000 2,654,906
German Treasury Bill 23/02/2022 2,510,000 2,513,052
German Treasury Bill 20/07/2022 2,365,000 2,372,800
German Treasury Bill 23/03/2022 2,209,000 2,212,462
German Treasury Bill 21/09/2022 2,000,000 2,007,021
Kingdom of Belgium Treasury Bill 14/07/2022 1,871,000 1,876,060
German Treasury Bill 24/08/2022 1,820,000 1,826,512
France Treasury Bill BTF 29/06/2022 1,776,000 1,780,549
Italy Buoni Ordinari del Tesoro BOT 14/04/2022 1,774,000 1,777,266
France Treasury Bill BTF 18/05/2022 1,553,000 1,557,527
Italy Certificati di Credito del Tesoro Zero
Coupon 28/09/2022
1,530,000 1,533,488
Italy Buoni Ordinari del Tesoro BOT 31/05/2022 1,476,000 1,479,170
Spain Letras del Tesoro 08/04/2022 1,402,000 1,404,731
Italy Buoni Ordinari del Tesoro BOT 14/07/2022 1,340,000 1,343,611
Italy Buoni Ordinari del Tesoro BOT 13/05/2022 1,303,000 1,306,071
Spain Letras del Tesoro 06/05/2022 1,301,000 1,303,979
Kingdom of Belgium Treasury Bill 12/05/2022 1,293,000 1,295,939
Italy Buoni Ordinari del Tesoro BOT 12/08/2022 1,210,000 1,212,929
Italy Buoni Ordinari del Tesoro BOT 14/09/2022 1,200,000 1,203,474
France Treasury Bill BTF 21/04/2022 1,200,000 1,203,130
Italy Buoni Ordinari del Tesoro BOT 31/03/2022 1,186,000 1,187,736
France Treasury Bill BTF 06/04/2022 1,185,000 1,187,579
France Treasury Bill BTF 09/03/2022 1,183,000 1,185,080
France Treasury Bill BTF 07/09/2022 1,120,000 1,124,241
Spain Letras del Tesoro 12/08/2022 1,100,000 1,102,579
Spain Letras del Tesoro 08/07/2022 1,090,000 1,093,036
France Treasury Bill BTF 04/05/2022 1,088,000 1,090,667
Spain Letras del Tesoro 09/09/2022 1,060,000 1,063,375
France Treasury Bill BTF 23/03/2022 1,054,000 1,054,718
France Treasury Bill BTF 25/05/2022 1,050,000 1,051,744
France Treasury Bill BTF 27/04/2022 1,020,000 1,021,410
France Treasury Bill BTF 15/06/2022 1,007,000 1,010,155
Dutch Treasury Certificate 25/02/2022 1,003,000 1,004,333
France Treasury Bill BTF 10/08/2022 1,000,000 1,003,175
France Treasury Bill BTF 09/06/2022 1,000,000 1,001,679
France Treasury Bill BTF 11/05/2022 1,000,000 1,001,638
Italy Buoni Ordinari del Tesoro BOT 31/08/2022 990,000 992,669
France Treasury Bill BTF 06/02/2022 990,000 991,392
Italy Buoni Ordinari del Tesoro BOT 14/03/2022 984,000 985,326
France Treasury Bill BTF 27/07/2022 950,000 952,674
German Treasury Bill 19/01/2022 950,000 951,491
Spain Letras del Tesoro 11/02/2022 950,000 950,672
Sales
Security Description Nominal Proceeds
EUR
German Treasury Bill 23/02/2022 3,930,000 3,931,832
German Treasury Bill 23/03/2022 3,159,000 3,159,719
German Treasury Bill 19/01/2022 1,950,000 1,950,514
Spain Letras del Tesoro 10/06/2022 1,761,000 1,764,284
France Treasury Bill BTF 23/03/2022 1,694,000 1,694,321
Italy Buoni Ordinari del Tesoro BOT
14/06/2022 1,584,000 1,587,686
Spain Letras del Tesoro 11/02/2022 1,520,000 1,520,450
German Treasury Bill 15/12/2021 1,450,000 1,450,417
Spain Letras del Tesoro 04/03/2022 1,439,000 1,439,080
Italy Buoni Ordinari del Tesoro BOT
14/03/2022
1,389,000 1,389,918
Dutch Treasury Certificate 25/02/2022 1,328,000 1,328,350
German Treasury Bill 27/10/2021 1,268,000 1,268,155
Italy Certificati di Credito del Tesoro Zero
Coupon 29/11/2021
1,205,000 1,205,108
Italy Buoni Ordinari del Tesoro BOT
31/03/2022
1,186,000 1,186,226
France Treasury Bill BTF 06/04/2022 1,185,000 1,185,173
France Treasury Bill BTF 09/03/2022 1,183,000 1,183,153
France Treasury Bill BTF 23/02/2022 1,175,000 1,175,246
Kingdom of Belgium Treasury Bill
10/03/2022
1,148,000 1,148,054
Italy Buoni Ordinari del Tesoro BOT
14/02/2022
1,133,000 1,133,280
German Treasury Bill 24/11/2021 1,110,000 1,110,150
German Treasury Bill 21/04/2022 1,050,000 1,051,012
Spain Letras del Tesoro 14/01/2022 1,017,000 1,017,416
France Treasury Bill BTF 09/02/2022 997,000 997,123
France Treasury Bill BTF 16/02/2022 990,000 990,124
France Treasury Bill BTF 26/01/2022 975,000 975,453
Italy Buoni Ordinari del Tesoro BOT
14/04/2022
970,000 971,150
Italy Buoni Ordinari del Tesoro BOT
28/02/2022
934,000 934,106
German Treasury Bill 22/06/2022 920,000 921,681
France Treasury Bill BTF 15/12/2021 920,000 920,130
France Treasury Bill BTF 29/06/2022 913,000 915,180
German Treasury Bill 18/05/2022 900,000 901,217
Dutch Treasury Certificate 28/01/2022 855,000 855,302
Italy Certificati di Credito del Tesoro Zero
Coupon 30/05/2022
850,000 851,037
Kingdom of Belgium Treasury Bill
14/07/2022
798,000 800,016
France Treasury Bill BTF 02/03/2022 760,000 760,103
France Treasury Bill BTF 05/01/2022 750,000 750,101
Italy Buoni Ordinari del Tesoro BOT
31/05/2022
738,000 739,263
Italy Buoni Ordinari del Tesoro BOT
14/12/2021
725,000 725,206
Dutch Treasury Certificate 08/12/2021 713,000 713,106
France Treasury Bill BTF 08/12/2021 710,000 710,111
France Treasury Bill BTF 16/03/2022 702,000 702,092
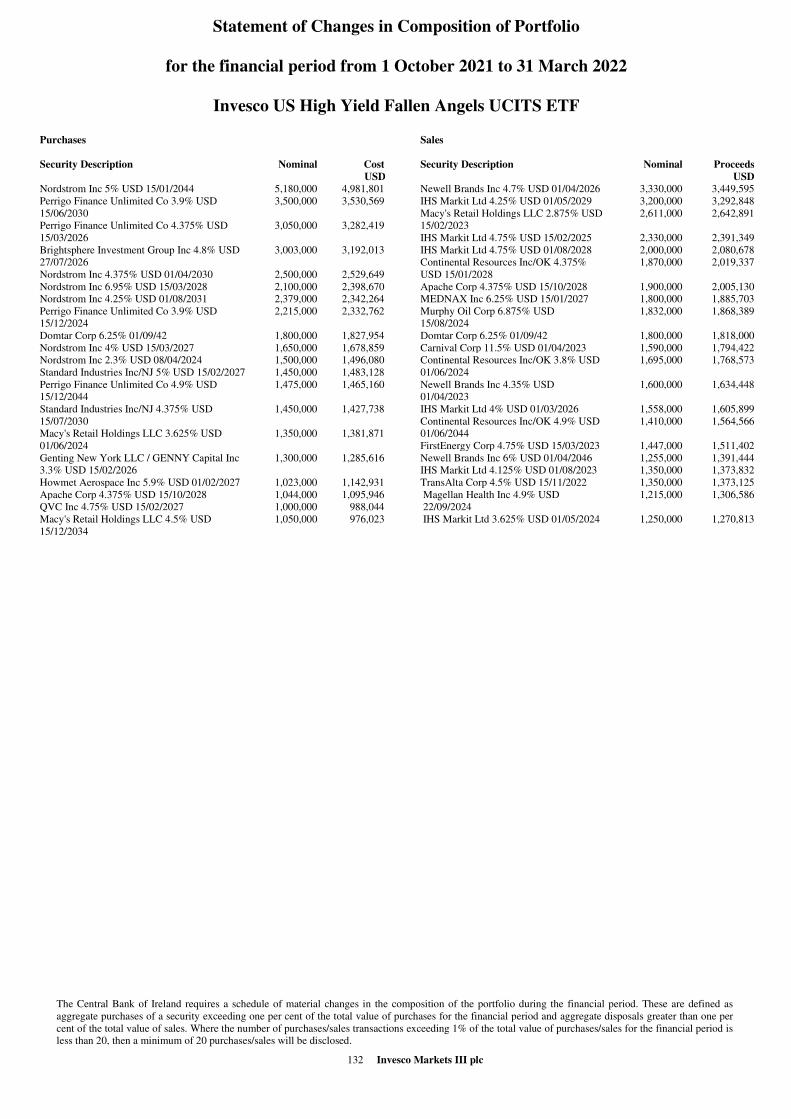
Statement of Changes in Composition of Portfolio
for the financial period from 1 October 2021 to 31 March 2022
Invesco US High Yield Fallen Angels UCITS ETF
The Central Bank of Ireland requires a schedule of material changes in the composition of the portfolio during the financial period. These are defined as
aggregate purchases of a security exceeding one per cent of the total value of purchases for the financial period and aggregate disposals greater than one per
cent of the total value of sales. Where the number of purchases/sales transactions exceeding 1% of the total value of purchases/sales for the financial period is
less than 20, then a minimum of 20 purchases/sales will be disclosed.
132 Invesco Markets III plc
Purchases
Security Description Nominal Cost
USD
Nordstrom Inc 5% USD 15/01/2044 5,180,000 4,981,801
Perrigo Finance Unlimited Co 3.9% USD
15/06/2030
3,500,000 3,530,569
Perrigo Finance Unlimited Co 4.375% USD
15/03/2026
3,050,000 3,282,419
Brightsphere Investment Group Inc 4.8% USD
27/07/2026
3,003,000 3,192,013
Nordstrom Inc 4.375% USD 01/04/2030 2,500,000 2,529,649
Nordstrom Inc 6.95% USD 15/03/2028 2,100,000 2,398,670
Nordstrom Inc 4.25% USD 01/08/2031 2,379,000 2,342,264
Perrigo Finance Unlimited Co 3.9% USD
15/12/2024
2,215,000 2,332,762
Domtar Corp 6.25% 01/09/42 1,800,000 1,827,954
Nordstrom Inc 4% USD 15/03/2027 1,650,000 1,678,859
Nordstrom Inc 2.3% USD 08/04/2024 1,500,000 1,496,080
Standard Industries Inc/NJ 5% USD 15/02/2027 1,450,000 1,483,128
Perrigo Finance Unlimited Co 4.9% USD
15/12/2044
1,475,000 1,465,160
Standard Industries Inc/NJ 4.375% USD
15/07/2030
1,450,000 1,427,738
Macy's Retail Holdings LLC 3.625% USD
01/06/2024
1,350,000 1,381,871
Genting New York LLC / GENNY Capital Inc
3.3% USD 15/02/2026
1,300,000 1,285,616
Howmet Aerospace Inc 5.9% USD 01/02/2027 1,023,000 1,142,931
Apache Corp 4.375% USD 15/10/2028 1,044,000 1,095,946
QVC Inc 4.75% USD 15/02/2027 1,000,000 988,044
Macy's Retail Holdings LLC 4.5% USD
15/12/2034
1,050,000 976,023
Sales
Security Description Nominal Proceeds
USD
Newell Brands Inc 4.7% USD 01/04/2026 3,330,000 3,449,595
IHS Markit Ltd 4.25% USD 01/05/2029 3,200,000 3,292,848
Macy's Retail Holdings LLC 2.875% USD
15/02/2023
2,611,000 2,642,891
IHS Markit Ltd 4.75% USD 15/02/2025 2,330,000 2,391,349
IHS Markit Ltd 4.75% USD 01/08/2028 2,000,000 2,080,678
Continental Resources Inc/OK 4.375%
USD 15/01/2028
1,870,000 2,019,337
Apache Corp 4.375% USD 15/10/2028 1,900,000 2,005,130
MEDNAX Inc 6.25% USD 15/01/2027 1,800,000 1,885,703
Murphy Oil Corp 6.875% USD
15/08/2024
1,832,000 1,868,389
Domtar Corp 6.25% 01/09/42 1,800,000 1,818,000
Carnival Corp 11.5% USD 01/04/2023 1,590,000 1,794,422
Continental Resources Inc/OK 3.8% USD
01/06/2024
1,695,000 1,768,573
Newell Brands Inc 4.35% USD
01/04/2023
1,600,000 1,634,448
IHS Markit Ltd 4% USD 01/03/2026 1,558,000 1,605,899
Continental Resources Inc/OK 4.9% USD
01/06/2044
1,410,000 1,564,566
FirstEnergy Corp 4.75% USD 15/03/2023 1,447,000 1,511,402
Newell Brands Inc 6% USD 01/04/2046 1,255,000 1,391,444
IHS Markit Ltd 4.125% USD 01/08/2023 1,350,000 1,373,832
TransAlta Corp 4.5% USD 15/11/2022 1,350,000 1,373,125
Magellan Health Inc 4.9% USD
22/09/2024
1,215,000 1,306,586
IHS Markit Ltd 3.625% USD 01/05/2024 1,250,000 1,270,813
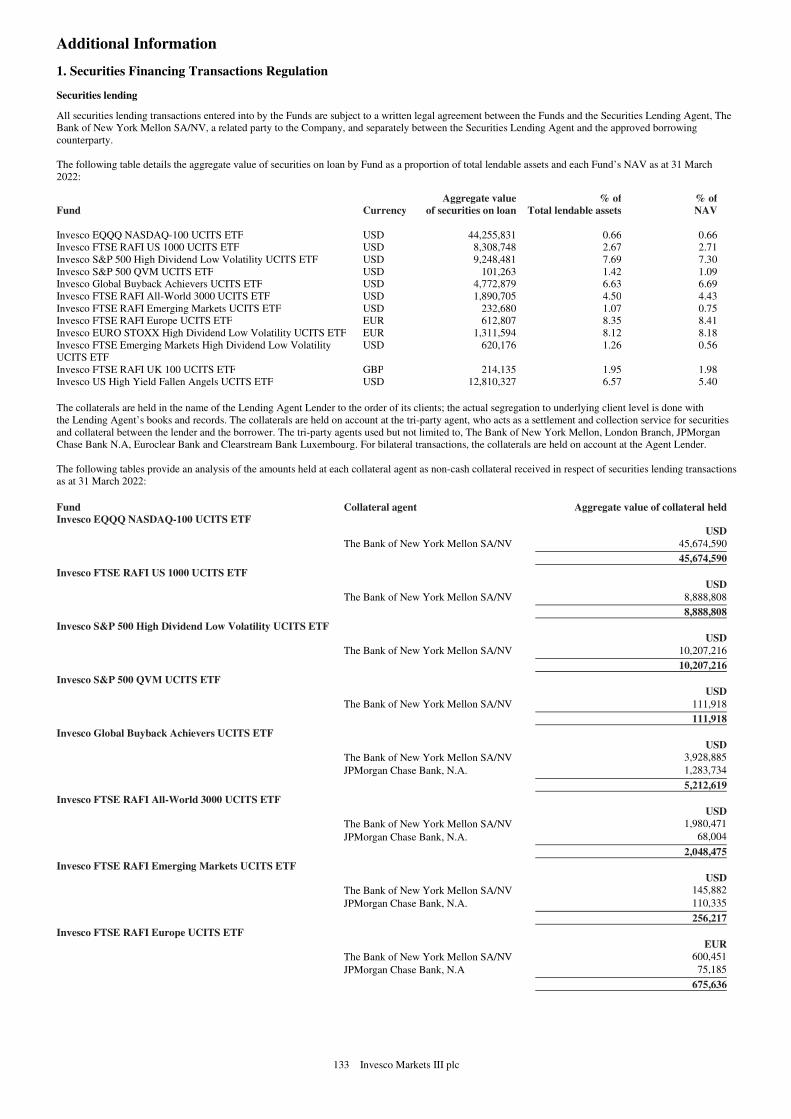
133 Invesco Markets III plc
Additional Information
1. Securities Financing Transactions Regulation
Securities lending
All securities lending transactions entered into by the Funds are subject to a written legal agreement between the Funds and the Securities Lending Agent, The
Bank of New York Mellon SA/NV, a related party to the Company, and separately between the Securities Lending Agent and the approved borrowing
counterparty.
The following table details the aggregate value of securities on loan by Fund as a proportion of total lendable assets and each Fund’s NAV as at 31 March
2022:
Fund Currency
Aggregate value
of securities on loan
% of
Total lendable assets
% of
NAV
Invesco EQQQ NASDAQ-100 UCITS ETF USD 44,255,831 0.66 0.66
Invesco FTSE RAFI US 1000 UCITS ETF USD 8,308,748 2.67 2.71
Invesco S&P 500 High Dividend Low Volatility UCITS ETF USD 9,248,481 7.69 7.30
Invesco S&P 500 QVM UCITS ETF USD 101,263 1.42 1.09
Invesco Global Buyback Achievers UCITS ETF USD 4,772,879 6.63 6.69
Invesco FTSE RAFI All-World 3000 UCITS ETF USD 1,890,705 4.50 4.43
Invesco FTSE RAFI Emerging Markets UCITS ETF USD 232,680 1.07 0.75
Invesco FTSE RAFI Europe UCITS ETF EUR 612,807 8.35 8.41
Invesco EURO STOXX High Dividend Low Volatility UCITS ETF EUR 1,311,594 8.12 8.18
Invesco FTSE Emerging Markets High Dividend Low Volatility
UCITS ETF
USD 620,176 1.26 0.56
Invesco FTSE RAFI UK 100 UCITS ETF GBP 214,135 1.95 1.98
Invesco US High Yield Fallen Angels UCITS ETF USD 12,810,327 6.57 5.40
The collaterals are held in the name of the Lending Agent Lender to the order of its clients; the actual segregation to underlying client level is done with
the Lending Agent’s books and records. The collaterals are held on account at the tri-party agent, who acts as a settlement and collection service for securities
and collateral between the lender and the borrower. The tri-party agents used but not limited to, The Bank of New York Mellon, London Branch, JPMorgan
Chase Bank N.A, Euroclear Bank and Clearstream Bank Luxembourg. For bilateral transactions, the collaterals are held on account at the Agent Lender.
The following tables provide an analysis of the amounts held at each collateral agent as non-cash collateral received in respect of securities lending transactions
as at 31 March 2022:
Fund Collateral agent Aggregate value of collateral held
Invesco EQQQ NASDAQ-100 UCITS ETF USD
The Bank of New York Mellon SA/NV 45,674,590a a
45,674,590a a
Invesco FTSE RAFI US 1000 UCITS ETF USD
The Bank of New York Mellon SA/NV 8,888,808a a
8,888,808a a
Invesco S&P 500 High Dividend Low Volatility UCITS ETF USD
The Bank of New York Mellon SA/NV 10,207,216a a
10,207,216a a
Invesco S&P 500 QVM UCITS ETF USD
The Bank of New York Mellon SA/NV 111,918a a
111,918a a
Invesco Global Buyback Achievers UCITS ETF USD
The Bank of New York Mellon SA/NV 3,928,885
JPMorgan Chase Bank, N.A. 1,283,734a a
5,212,619a a
Invesco FTSE RAFI All-World 3000 UCITS ETF USD
The Bank of New York Mellon SA/NV 1,980,471
JPMorgan Chase Bank, N.A. 68,004 a a
2,048,475a a
Invesco FTSE RAFI Emerging Markets UCITS ETF USD
The Bank of New York Mellon SA/NV 145,882
JPMorgan Chase Bank, N.A. 110,335 a a
256,217a a
Invesco FTSE RAFI Europe UCITS ETF EUR
The Bank of New York Mellon SA/NV 600,451
JPMorgan Chase Bank, N.A 75,185 a a
675,636a a
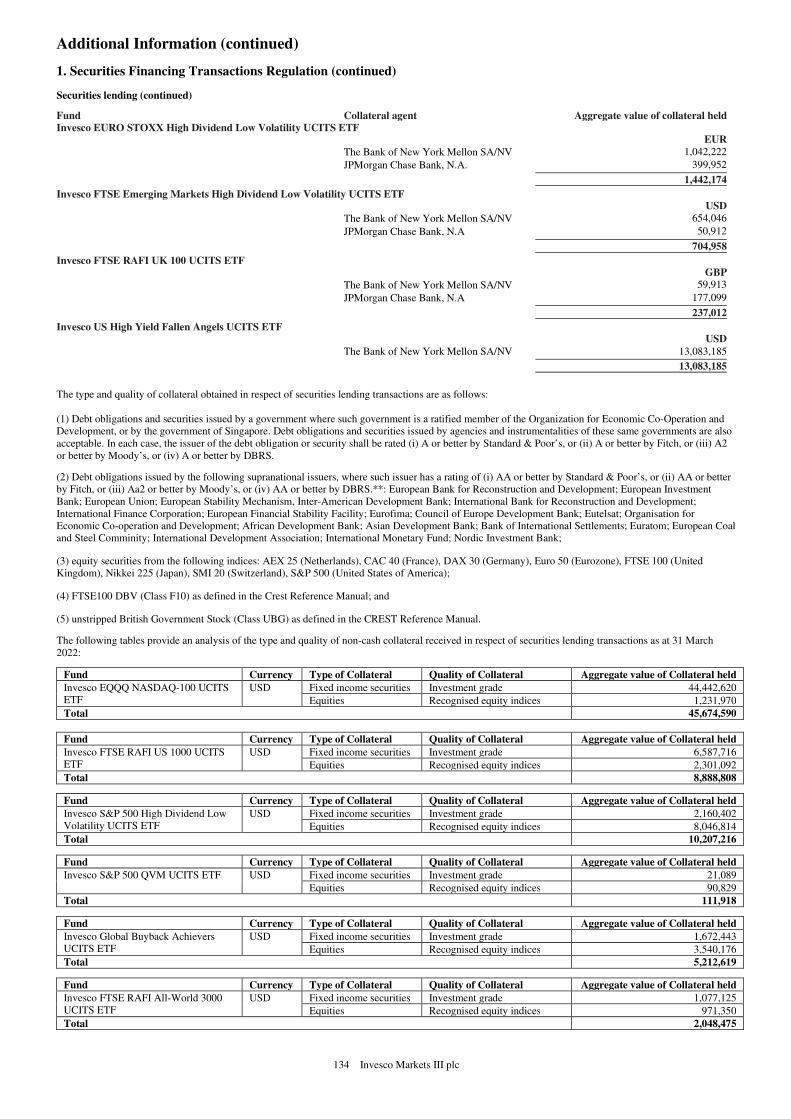
134 Invesco Markets III plc
Additional Information (continued)
1. Securities Financing Transactions Regulation (continued)
Securities lending (continued)
Fund Collateral agent Aggregate value of collateral held
Invesco EURO STOXX High Dividend Low Volatility UCITS ETF EUR
The Bank of New York Mellon SA/NV 1,042,222
JPMorgan Chase Bank, N.A. 399,952 a a
1,442,174a a
Invesco FTSE Emerging Markets High Dividend Low Volatility UCITS ETF USD
The Bank of New York Mellon SA/NV 654,046
JPMorgan Chase Bank, N.A 50,912 a a
704,958a a
Invesco FTSE RAFI UK 100 UCITS ETF GBP
The Bank of New York Mellon SA/NV 59,913
JPMorgan Chase Bank, N.A 177,099 a a
237,012a a
Invesco US High Yield Fallen Angels UCITS ETF USD
The Bank of New York Mellon SA/NV 13,083,185a a
13,083,185a a
The type and quality of collateral obtained in respect of securities lending transactions are as follows:
(1) Debt obligations and securities issued by a government where such government is a ratified member of the Organization for Economic Co-Operation and
Development, or by the government of Singapore. Debt obligations and securities issued by agencies and instrumentalities of these same governments are also
acceptable. In each case, the issuer of the debt obligation or security shall be rated (i) A or better by Standard & Poor’s, or (ii) A or better by Fitch, or (iii) A2
or better by Moody’s, or (iv) A or better by DBRS.
(2) Debt obligations issued by the following supranational issuers, where such issuer has a rating of (i) AA or better by Standard & Poor’s, or (ii) AA or better
by Fitch, or (iii) Aa2 or better by Moody’s, or (iv) AA or better by DBRS.**: European Bank for Reconstruction and Development; European Investment
Bank; European Union; European Stability Mechanism, Inter-American Development Bank; International Bank for Reconstruction and Development;
International Finance Corporation; European Financial Stability Facility; Eurofima; Council of Europe Development Bank; Eutelsat; Organisation for
Economic Co-operation and Development; African Development Bank; Asian Development Bank; Bank of International Settlements; Euratom; European Coal
and Steel Comminity; International Development Association; International Monetary Fund; Nordic Investment Bank;
(3) equity securities from the following indices: AEX 25 (Netherlands), CAC 40 (France), DAX 30 (Germany), Euro 50 (Eurozone), FTSE 100 (United
Kingdom), Nikkei 225 (Japan), SMI 20 (Switzerland), S&P 500 (United States of America);
(4) FTSE100 DBV (Class F10) as defined in the Crest Reference Manual; and
(5) unstripped British Government Stock (Class UBG) as defined in the CREST Reference Manual.
The following tables provide an analysis of the type and quality of non-cash collateral received in respect of securities lending transactions as at 31 March
2022:
Fund Currency Type of Collateral Quality of Collateral Aggregate value of Collateral held
Invesco EQQQ NASDAQ-100 UCITS
ETF
USD Fixed income securities Investment grade 44,442,620
Equities Recognised equity indices 1,231,970
Total 45,674,590
Fund Currency Type of Collateral Quality of Collateral Aggregate value of Collateral held
Invesco FTSE RAFI US 1000 UCITS
ETF
USD Fixed income securities Investment grade 6,587,716
Equities Recognised equity indices 2,301,092
Total 8,888,808
Fund Currency Type of Collateral Quality of Collateral Aggregate value of Collateral held
Invesco S&P 500 High Dividend Low
Volatility UCITS ETF
USD Fixed income securities Investment grade 2,160,402
Equities Recognised equity indices 8,046,814
Total 10,207,216
Fund Currency Type of Collateral Quality of Collateral Aggregate value of Collateral held
Invesco S&P 500 QVM UCITS ETF USD Fixed income securities Investment grade 21,089
Equities Recognised equity indices 90,829
Total 111,918
Fund Currency Type of Collateral Quality of Collateral Aggregate value of Collateral held
Invesco Global Buyback Achievers
UCITS ETF
USD Fixed income securities Investment grade 1,672,443
Equities Recognised equity indices 3,540,176
Total 5,212,619
Fund Currency Type of Collateral Quality of Collateral Aggregate value of Collateral held
Invesco FTSE RAFI All-World 3000
UCITS ETF
USD Fixed income securities Investment grade 1,077,125
Equities Recognised equity indices 971,350
Total 2,048,475
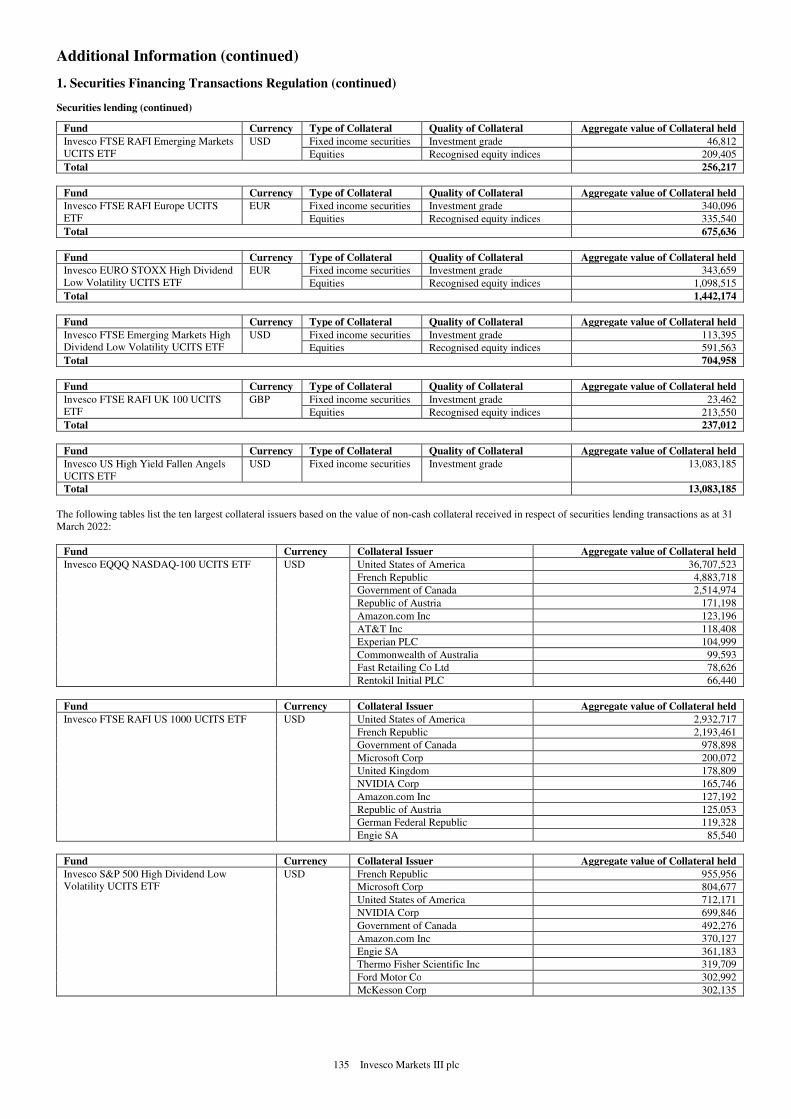
135 Invesco Markets III plc
Additional Information (continued)
1. Securities Financing Transactions Regulation (continued)
Securities lending (continued)
Fund Currency Type of Collateral Quality of Collateral Aggregate value of Collateral held
Invesco FTSE RAFI Emerging Markets
UCITS ETF
USD Fixed income securities Investment grade 46,812
Equities Recognised equity indices 209,405
Total 256,217
Fund Currency Type of Collateral Quality of Collateral Aggregate value of Collateral held
Invesco FTSE RAFI Europe UCITS
ETF
EUR Fixed income securities Investment grade 340,096
Equities Recognised equity indices 335,540
Total 675,636
Fund Currency Type of Collateral Quality of Collateral Aggregate value of Collateral held
Invesco EURO STOXX High Dividend
Low Volatility UCITS ETF
EUR Fixed income securities Investment grade 343,659
Equities Recognised equity indices 1,098,515
Total 1,442,174
Fund Currency Type of Collateral Quality of Collateral Aggregate value of Collateral held
Invesco FTSE Emerging Markets High
Dividend Low Volatility UCITS ETF
USD Fixed income securities Investment grade 113,395
Equities Recognised equity indices 591,563
Total 704,958
Fund Currency Type of Collateral Quality of Collateral Aggregate value of Collateral held
Invesco FTSE RAFI UK 100 UCITS
ETF
GBP Fixed income securities Investment grade 23,462
Equities Recognised equity indices 213,550
Total 237,012
Fund Currency Type of Collateral Quality of Collateral Aggregate value of Collateral held
Invesco US High Yield Fallen Angels
UCITS ETF
USD Fixed income securities Investment grade 13,083,185
Total 13,083,185
The following tables list the ten largest collateral issuers based on the value of non-cash collateral received in respect of securities lending transactions as at 31
March 2022:
Fund Currency Collateral Issuer Aggregate value of Collateral held
Invesco EQQQ NASDAQ-100 UCITS ETF USD United States of America 36,707,523
French Republic 4,883,718
Government of Canada 2,514,974
Republic of Austria 171,198
Amazon.com Inc 123,196
AT&T Inc 118,408
Experian PLC 104,999
Commonwealth of Australia 99,593
Fast Retailing Co Ltd 78,626
Rentokil Initial PLC 66,440
Fund Currency Collateral Issuer Aggregate value of Collateral held
Invesco FTSE RAFI US 1000 UCITS ETF USD United States of America 2,932,717
French Republic 2,193,461
Government of Canada 978,898
Microsoft Corp 200,072
United Kingdom 178,809
NVIDIA Corp 165,746
Amazon.com Inc 127,192
Republic of Austria 125,053
German Federal Republic 119,328
Engie SA 85,540
Fund Currency Collateral Issuer Aggregate value of Collateral held
Invesco S&P 500 High Dividend Low
Volatility UCITS ETF
USD French Republic 955,956
Microsoft Corp 804,677
United States of America 712,171
NVIDIA Corp 699,846
Government of Canada 492,276
Amazon.com Inc 370,127
Engie SA 361,183
Thermo Fisher Scientific Inc 319,709
Ford Motor Co 302,992
McKesson Corp 302,135
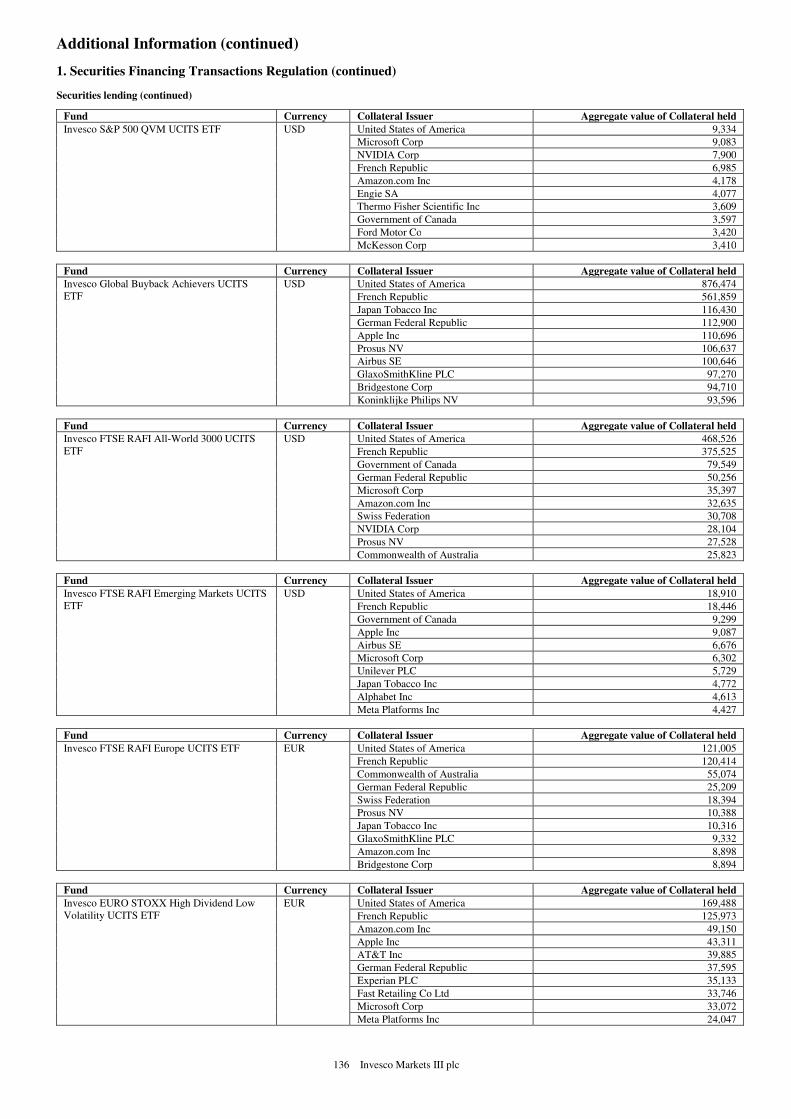
136 Invesco Markets III plc
Additional Information (continued)
1. Securities Financing Transactions Regulation (continued)
Securities lending (continued)
Fund Currency Collateral Issuer Aggregate value of Collateral held
Invesco S&P 500 QVM UCITS ETF USD United States of America 9,334
Microsoft Corp 9,083
NVIDIA Corp 7,900
French Republic 6,985
Amazon.com Inc 4,178
Engie SA 4,077
Thermo Fisher Scientific Inc 3,609
Government of Canada 3,597
Ford Motor Co 3,420
McKesson Corp 3,410
Fund Currency Collateral Issuer Aggregate value of Collateral held
Invesco Global Buyback Achievers UCITS
ETF
USD United States of America 876,474
French Republic 561,859
Japan Tobacco Inc 116,430
German Federal Republic 112,900
Apple Inc 110,696
Prosus NV 106,637
Airbus SE 100,646
GlaxoSmithKline PLC 97,270
Bridgestone Corp 94,710
Koninklijke Philips NV 93,596
Fund Currency Collateral Issuer Aggregate value of Collateral held
Invesco FTSE RAFI All-World 3000 UCITS
ETF
USD United States of America 468,526
French Republic 375,525
Government of Canada 79,549
German Federal Republic 50,256
Microsoft Corp 35,397
Amazon.com Inc 32,635
Swiss Federation 30,708
NVIDIA Corp 28,104
Prosus NV 27,528
Commonwealth of Australia 25,823
Fund Currency Collateral Issuer Aggregate value of Collateral held
Invesco FTSE RAFI Emerging Markets UCITS
ETF
USD United States of America 18,910
French Republic 18,446
Government of Canada 9,299
Apple Inc 9,087
Airbus SE 6,676
Microsoft Corp 6,302
Unilever PLC 5,729
Japan Tobacco Inc 4,772
Alphabet Inc 4,613
Meta Platforms Inc 4,427
Fund Currency Collateral Issuer Aggregate value of Collateral held
Invesco FTSE RAFI Europe UCITS ETF EUR United States of America 121,005
French Republic 120,414
Commonwealth of Australia 55,074
German Federal Republic 25,209
Swiss Federation 18,394
Prosus NV 10,388
Japan Tobacco Inc 10,316
GlaxoSmithKline PLC 9,332
Amazon.com Inc 8,898
Bridgestone Corp 8,894
Fund Currency Collateral Issuer Aggregate value of Collateral held
Invesco EURO STOXX High Dividend Low
Volatility UCITS ETF
EUR United States of America 169,488
French Republic 125,973
Amazon.com Inc 49,150
Apple Inc 43,311
AT&T Inc 39,885
German Federal Republic 37,595
Experian PLC 35,133
Fast Retailing Co Ltd 33,746
Microsoft Corp 33,072
Meta Platforms Inc 24,047
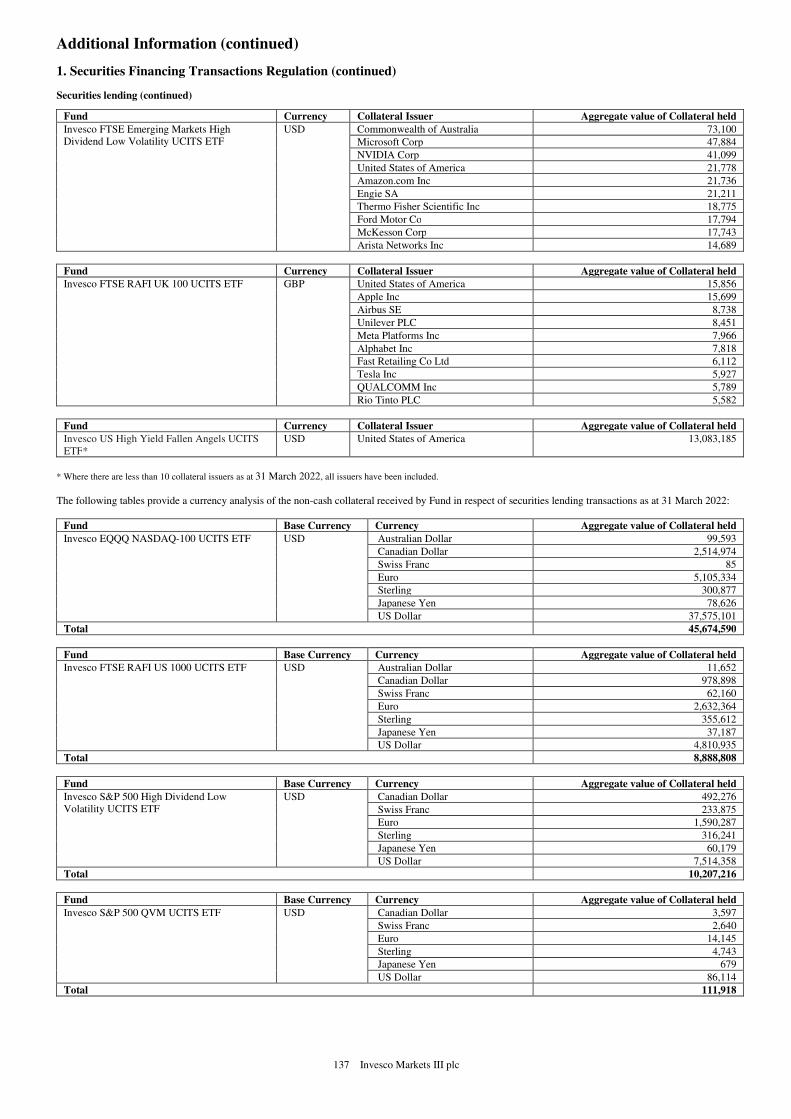
137 Invesco Markets III plc
Additional Information (continued)
1. Securities Financing Transactions Regulation (continued)
Securities lending (continued)
Fund Currency Collateral Issuer Aggregate value of Collateral held
Invesco FTSE Emerging Markets High
Dividend Low Volatility UCITS ETF
USD Commonwealth of Australia 73,100
Microsoft Corp 47,884
NVIDIA Corp 41,099
United States of America 21,778
Amazon.com Inc 21,736
Engie SA 21,211
Thermo Fisher Scientific Inc 18,775
Ford Motor Co 17,794
McKesson Corp 17,743
Arista Networks Inc 14,689
Fund Currency Collateral Issuer Aggregate value of Collateral held
Invesco FTSE RAFI UK 100 UCITS ETF GBP United States of America 15,856
Apple Inc 15,699
Airbus SE 8,738
Unilever PLC 8,451
Meta Platforms Inc 7,966
Alphabet Inc 7,818
Fast Retailing Co Ltd 6,112
Tesla Inc 5,927
QUALCOMM Inc 5,789
Rio Tinto PLC 5,582
Fund Currency Collateral Issuer Aggregate value of Collateral held
Invesco US High Yield Fallen Angels UCITS
ETF*
USD United States of America 13,083,185
* Where there are less than 10 collateral issuers as at 31 March 2022, all issuers have been included.
The following tables provide a currency analysis of the non-cash collateral received by Fund in respect of securities lending transactions as at 31 March 2022:
Fund Base Currency Currency Aggregate value of Collateral held
Invesco EQQQ NASDAQ-100 UCITS ETF USD Australian Dollar 99,593
Canadian Dollar 2,514,974
Swiss Franc 85
Euro 5,105,334
Sterling 300,877
Japanese Yen 78,626
US Dollar 37,575,101
Total 45,674,590
Fund Base Currency Currency Aggregate value of Collateral held
Invesco FTSE RAFI US 1000 UCITS ETF USD Australian Dollar 11,652
Canadian Dollar 978,898
Swiss Franc 62,160
Euro 2,632,364
Sterling 355,612
Japanese Yen 37,187
US Dollar 4,810,935
Total 8,888,808
Fund Base Currency Currency Aggregate value of Collateral held
Invesco S&P 500 High Dividend Low
Volatility UCITS ETF
USD Canadian Dollar 492,276
Swiss Franc 233,875
Euro 1,590,287
Sterling 316,241
Japanese Yen 60,179
US Dollar 7,514,358
Total 10,207,216
Fund Base Currency Currency Aggregate value of Collateral held
Invesco S&P 500 QVM UCITS ETF USD Canadian Dollar 3,597
Swiss Franc 2,640
Euro 14,145
Sterling 4,743
Japanese Yen 679
US Dollar 86,114
Total 111,918

138 Invesco Markets III plc
Additional Information (continued)
1. Securities Financing Transactions Regulation (continued)
Securities lending (continued)
Fund Base Currency Currency Aggregate value of Collateral held
Invesco Global Buyback Achievers UCITS
ETF
USD Canadian Dollar 81,316
Swiss Franc 70,081
Euro 1,598,666
Sterling 829,692
Japanese Yen 717,912
US Dollar 1,914,952
Total 5,212,619
Fund Base Currency Currency Aggregate value of Collateral held
Invesco FTSE RAFI All-World 3000 UCITS
ETF
USD Australian Dollar 25,823
Canadian Dollar 79,549
Swiss Franc 57,529
Euro 654,820
Sterling 199,846
Japanese Yen 153,970
US Dollar 876,938
Total 2,048,475
Fund Base Currency Currency Aggregate value of Collateral held
Invesco FTSE RAFI Emerging Markets UCITS
ETF
USD Canadian Dollar 9,299
Swiss Franc 1,458
Euro 67,704
Sterling 41,300
Japanese Yen 30,825
US Dollar 105,631
Total 256,217
Fund Base Currency Currency Aggregate value of Collateral held
Invesco FTSE RAFI Europe UCITS ETF EUR Australian Dollar 55,074
Swiss Franc 24,803
Euro 225,757
Sterling 77,839
Japanese Yen 64,212
US Dollar 227,951
Total 675,636
Fund Base Currency Currency Aggregate value of Collateral held
Invesco EURO STOXX High Dividend Low
Volatility UCITS ETF
EUR Swiss Franc 15,724
Euro 318,797
Sterling 225,798
Japanese Yen 115,359
US Dollar 766,496
Total 1,442,174
Fund Base Currency Currency Aggregate value of Collateral held
Invesco FTSE Emerging Markets High
Dividend Low Volatility UCITS ETF
USD Australian Dollar 73,100
Swiss Franc 13,745
Euro 92,032
Sterling 49,668
Japanese Yen 33,059
US Dollar 443,354
Total 704,958
Fund Base Currency Currency Aggregate value of Collateral held
Invesco FTSE RAFI UK 100 UCITS ETF GBP Swiss Franc 39
Euro 50,341
Sterling 48,335
Japanese Yen 21,718
US Dollar 116,579
Total 237,012
Fund Base Currency Currency Aggregate value of Collateral held
Invesco US High Yield Fallen Angels UCITS
ETF
USD US Dollar 13,083,185
Total 13,083,185
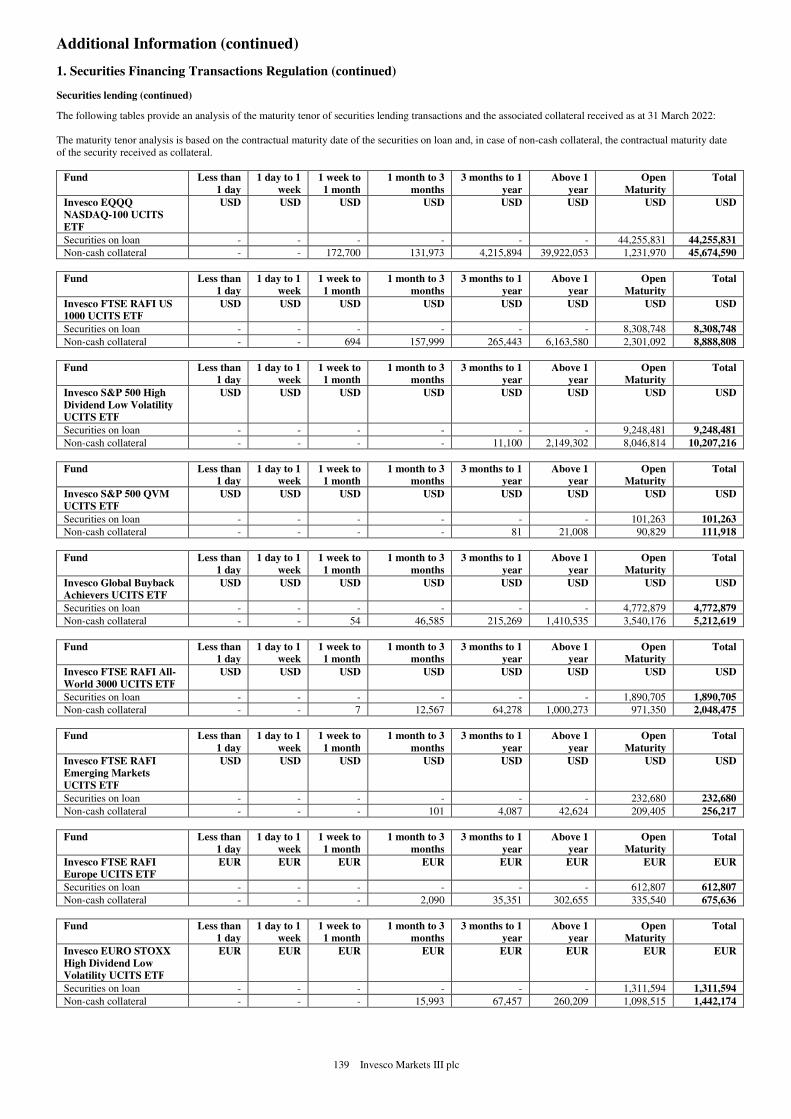
139 Invesco Markets III plc
Additional Information (continued)
1. Securities Financing Transactions Regulation (continued)
Securities lending (continued)
The following tables provide an analysis of the maturity tenor of securities lending transactions and the associated collateral received as at 31 March 2022:
The maturity tenor analysis is based on the contractual maturity date of the securities on loan and, in case of non-cash collateral, the contractual maturity date
of the security received as collateral.
Fund Less than
1 day
1 day to 1
week
1 week to
1 month
1 month to 3
months
3 months to 1
year
Above 1
year
Open
Maturity
Total
Invesco EQQQ
NASDAQ-100 UCITS
ETF
USD USD USD USD USD USD USD USD
Securities on loan - - - - - - 44,255,831 44,255,831
Non-cash collateral - - 172,700 131,973 4,215,894 39,922,053 1,231,970 45,674,590
Fund Less than
1 day
1 day to 1
week
1 week to
1 month
1 month to 3
months
3 months to 1
year
Above 1
year
Open
Maturity
Total
Invesco FTSE RAFI US
1000 UCITS ETF
USD USD USD USD USD USD USD USD
Securities on loan - - - - - - 8,308,748 8,308,748
Non-cash collateral - - 694 157,999 265,443 6,163,580 2,301,092 8,888,808
Fund Less than
1 day
1 day to 1
week
1 week to
1 month
1 month to 3
months
3 months to 1
year
Above 1
year
Open
Maturity
Total
Invesco S&P 500 High
Dividend Low Volatility
UCITS ETF
USD USD USD USD USD USD USD USD
Securities on loan - - - - - - 9,248,481 9,248,481
Non-cash collateral - - - - 11,100 2,149,302 8,046,814 10,207,216
Fund Less than
1 day
1 day to 1
week
1 week to
1 month
1 month to 3
months
3 months to 1
year
Above 1
year
Open
Maturity
Total
Invesco S&P 500 QVM
UCITS ETF
USD USD USD USD USD USD USD USD
Securities on loan - - - - - - 101,263 101,263
Non-cash collateral - - - - 81 21,008 90,829 111,918
Fund Less than
1 day
1 day to 1
week
1 week to
1 month
1 month to 3
months
3 months to 1
year
Above 1
year
Open
Maturity
Total
Invesco Global Buyback
Achievers UCITS ETF
USD USD USD USD USD USD USD USD
Securities on loan - - - - - - 4,772,879 4,772,879
Non-cash collateral - - 54 46,585 215,269 1,410,535 3,540,176 5,212,619
Fund Less than
1 day
1 day to 1
week
1 week to
1 month
1 month to 3
months
3 months to 1
year
Above 1
year
Open
Maturity
Total
Invesco FTSE RAFI All-
World 3000 UCITS ETF
USD USD USD USD USD USD USD USD
Securities on loan - - - - - - 1,890,705 1,890,705
Non-cash collateral - - 7 12,567 64,278 1,000,273 971,350 2,048,475
Fund Less than
1 day
1 day to 1
week
1 week to
1 month
1 month to 3
months
3 months to 1
year
Above 1
year
Open
Maturity
Total
Invesco FTSE RAFI
Emerging Markets
UCITS ETF
USD USD USD USD USD USD USD USD
Securities on loan - - - - - - 232,680 232,680
Non-cash collateral - - - 101 4,087 42,624 209,405 256,217
Fund Less than
1 day
1 day to 1
week
1 week to
1 month
1 month to 3
months
3 months to 1
year
Above 1
year
Open
Maturity
Total
Invesco FTSE RAFI
Europe UCITS ETF
EUR EUR EUR EUR EUR EUR EUR EUR
Securities on loan - - - - - - 612,807 612,807
Non-cash collateral - - - 2,090 35,351 302,655 335,540 675,636
Fund Less than
1 day
1 day to 1
week
1 week to
1 month
1 month to 3
months
3 months to 1
year
Above 1
year
Open
Maturity
Total
Invesco EURO STOXX
High Dividend Low
Volatility UCITS ETF
EUR EUR EUR EUR EUR EUR EUR EUR
Securities on loan - - - - - - 1,311,594 1,311,594
Non-cash collateral - - - 15,993 67,457 260,209 1,098,515 1,442,174
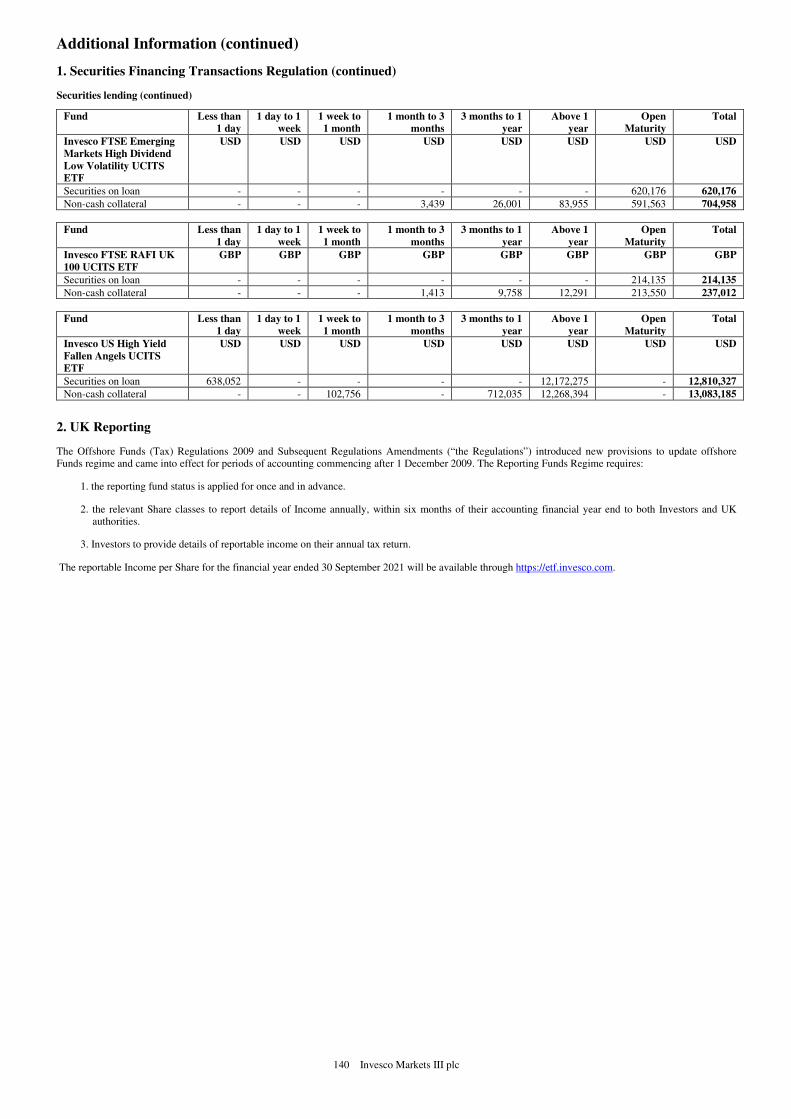
140 Invesco Markets III plc
Additional Information (continued)
1. Securities Financing Transactions Regulation (continued)
Securities lending (continued)
Fund Less than
1 day
1 day to 1
week
1 week to
1 month
1 month to 3
months
3 months to 1
year
Above 1
year
Open
Maturity
Total
Invesco FTSE Emerging
Markets High Dividend
Low Volatility UCITS
ETF
USD USD USD USD USD USD USD USD
Securities on loan - - - - - - 620,176 620,176
Non-cash collateral - - - 3,439 26,001 83,955 591,563 704,958
Fund Less than
1 day
1 day to 1
week
1 week to
1 month
1 month to 3
months
3 months to 1
year
Above 1
year
Open
Maturity
Total
Invesco FTSE RAFI UK
100 UCITS ETF
GBP GBP GBP GBP GBP GBP GBP GBP
Securities on loan - - - - - - 214,135 214,135
Non-cash collateral - - - 1,413 9,758 12,291 213,550 237,012
Fund Less than
1 day
1 day to 1
week
1 week to
1 month
1 month to 3
months
3 months to 1
year
Above 1
year
Open
Maturity
Total
Invesco US High Yield
Fallen Angels UCITS
ETF
USD USD USD USD USD USD USD USD
Securities on loan 638,052 - - - - 12,172,275 - 12,810,327
Non-cash collateral - - 102,756 - 712,035 12,268,394 - 13,083,185
2. UK Reporting
The Offshore Funds (Tax) Regulations 2009 and Subsequent Regulations Amendments (“the Regulations”) introduced new provisions to update offshore
Funds regime and came into effect for periods of accounting commencing after 1 December 2009. The Reporting Funds Regime requires:
1. the reporting fund status is applied for once and in advance.
2. the relevant Share classes to report details of Income annually, within six months of their accounting financial year end to both Investors and UK
authorities.
3. Investors to provide details of reportable income on their annual tax return.
The reportable Income per Share for the financial year ended 30 September 2021 will be available through https://etf.invesco.com.