1
CHAPTER 1
INTRODUCTION ABOUT POWER INDUSTRY
2
INTRODUCTION OF POWER INDUSTRY
INDUSTRY PROFILE
The power sector has witnessed several ups and downs over a
period of time. The key issue has been power shortage due to inadequate capacity
addition and T&D ( Transmission & Distribution ) losses. The patchy quality of power
distributed resulted in lower tariff disbursals leading to huge losses for power
producers in the country. The capacity addition targets for the Eighth and Ninth
Plans were 30358 mw and 40245 mw respectively. But the actual achievement was
16,422 mw i.e. 53.8% of the Eighth Plan target. The likely capacity addition at the
end of Ninth Plan ( March 31, 2002) is about 19,000 mw(47% of the target).The tenth
plan however pegs the capacity addition target to 46,185 mw and an addition of
60,855 mw in the Eleventh Plan Period taking it to the total capacity addition of
1,00,000 mw by the end of 2012 .
The Accelerated Power Development Programme (APDP) is the key
central instrument in the State Power Distribution Sector. The APDP is proposed to
be restructured in the forthcoming budget as a mechanism for supporting Power
Reforms in the states linked to certain fulfillment criteria by way of benchmarks. The
agreement in respect of this being possible only after the MOU has been signed by
the respective SEBs for the formation of State Electricity Regulatory Commissions(
SERCs).The APDP has been duly rechristened as APDRP ( Accelerated Power
Development and Reform Programme).The incentive formula for corporatisation of
the distribution system is also on the anvil. Recently ,the Naptha-based Power
Projects got a major boost with the waiver granted on total excise duty ( ruling at
16% ) on naptha and has benefited seven projects viz; projects commissioned in
different parts of the country by Reliance Group,Tanir Bavi,Nagarjuna Group,
BSES,Essar ,Paguthan ( JV between China Light & Power and PowerGen India )
3
and GPCL thus bringing down the effective tariffs. The Centre has recently planned
the formation of Rs.80, 000 cr transmission grid across the country to enable easy
transfer of electricity from surplus to deficient states. The actual execution would be
carried out by Power Grid Corporation and government is exploring the possibility of
setting up JVs with various companies to raise funds for the project.
INDUSTRY DEMANDS
The Udesh Kohli Committee set up to analyze the fund requirements
in power sector has envisaged the requirement of Rs.8,00,000 cr in next 10 years
to achieve the estimated installed capacity of 2,07,266 MW and generation
capacity of 1,00,000 MW by 2012.The banks would be in a position to bring in
Rs.3,80,922 cr over 10 years with the ceiling on the sector limited to 15%.
The Electricity Bill proposed by (CEA) envisages the freeing up of
distribution of power which has been the major bottleneck in power sector reforms
and suggests the removal of SEB monopoly in power distribution which is subjected
to losses due to theft, technical loopholes coupled with bureaucratic structures. The
losses are slated to be brought down to 15% from current 50%.
Power industry is consist of three major sub-category i.e. Power Generation, Power
Transmission and last is Power Distribution. Indian Government expect about US
$150 billon investment opportunity in power sector over next 5 years.
4
1. POWER GENERATION
The Ministry of Power has set a goal - Mission 2012: Power for All. A comprehensive
Blueprint for Power Sector development has been prepared encompassing an
integrated strategy for the sector development with objectives of Sufficient power to
achieve GDP growth rate of 8%, Reliable of power, Quality power, Optimum power
cost, Commercial viability of power industry and Power for all.
India has fifth largest Electricity Generation capacity in the world. India had
generation
capacity of 149.39 GW (149,391.91 MW) as on 31st March 2009. Out of which 52.5
% of Electricity generated by States Electricity Board, 34% by Central Sector and
13.5 % Generated by Private Companies. If we talk about in terms of fuel, 64.6 % of
total electricity generated by using Coal, Oil and Gas i.e. Thermal Power, 24.7 % by
Hydro, 2.7 % by Nuclear and 7.7 % by Renewable Energy Sources.
Currently India is facing huge demand-supply Gap. All India average energy
shortfalls of 9 % in regular time and 14 % in peak demand As a result there is need
for huge investment in a power generation sector. The Government of India has an
ambitious mission of ‘POWER FOR ALL BY 2012’. This mission would require that
our installed generation capacity should be at least 2, 00,000 MW by 2012 from the
present level of 149,391.91 MW.
5
2. POWER TRANSMISSION
Power transmission can be defined as a Transmission of electricity is defined as bulk
transfer of power over a long distance a high voltage, generally of 132 kV and above.
In India bulk transmission has increased from 3708 ckm in 1950 to more than
265,000 ckm today. The entire country has been divided into five regions for
transmission systems, namely, Northern Region, North Eastern Region, Eastern
Region, Southern Region and Western Region. The interconnected transmission
system within each region is also called the regional grid.
To be able to reach this power to the entire country an expansion of the regional
transmission network and inter regional capacity to transmit power would be
essential. The latter is required because resources are unevenly distributed in the
country and power needs to be carried great distances to areas where load centers
exist.
The transmission system planning in the country, in the past, had traditionally been
linked to generation projects as part of the evacuation system. Ability of the power
system to safely withstand a contingency without generation rescheduling or load-
shedding was the main criteria for planning the transmission system. However, due
to various reasons such as spatial development of load in the network, non-
commissioning of load centre generating units originally planned and deficit in
reactive compensation, certain pockets in the power system could not safely operate
even under normal conditions. This had necessitated backing down of generation
and operating at a lower load generation balance in the past. Transmission planning
has therefore moved away from the earlier generation evacuation system planning to
integrated system planning.
While the predominant technology for electricity transmission and distribution has
been Alternating Current (AC) technology, High Voltage Direct Current (HVDC)
technology has also been used for interconnection of all regional grids across the
country and for bulk transmission of power over long distances.
6
3. POWER DISTRIBUTION
The total Installed generating capacity in the country is over 149,000 MW and the
total number of consumers is over 144 million. Apart from an extensive transmission
system network at 500 kV HVDC ,400kV 220 kV, 132 kV and 66 kV which has
developed to transmit the Power from the generating station to the grid substations,
a vast network of sub transmission in distribution system has also come up for the
utilization of the power by the ultimate consumers.
However, due to lack of adequate investment on T&D works, the T&D losses have
been consistently on higher side, and reached to the level of 32.86% in the year
2000-01.The reduction of these losses was essential to bring economic viability to
the State Utilities.
As the T&D loss was not able to capture all the losses in the net work, concept of
Aggregate Technical and Commercial (AT&C) loss was introduced. AT&C loss
captures technical as well as commercial losses in the network and is a true indicator
of total losses in the system.
High technical losses in the system are primarily due to inadequate investments over
the years for system improvement works, which has resulted in unplanned
extensions of the distribution lines, overloading of the system elements like
transformers and conductors, and lack of adequate reactive power support.
The commercial losses are mainly due to low metering efficiency, theft & pilferages.
This may be eliminated by improving metering efficiency, proper energy accounting
& auditing and improved billing & collection efficiency. Fixing of accountability of the
personnel / feeder managers may help considerably in reduction of AT&C loss.
4. VARIOUS GOVERNMENT INITIATIVES
With the initiative of the Government of India and of the States, the Accelerated
Power Development & Reform Programme (APDRP) was launched in 2001, for
7
the strengthening of Sub Transmission and Distribution network and reduction in
AT&C losses.
The focus of the program shall be on actual, demonstrable performance in terms of
sustained loss reduction. Establishment of reliable and automated systems for
sustained collection of accurate base line data, and the adoption of Information
Technology in the areas of energy accounting will be essential before taking up the
regular distribution strengthening projects.
The main objective of the programme was to bring Aggregate Technical &
Commercial (AT&C) losses below 15% in five years in urban and in high-density
areas. The programme, along with other initiatives of the Government of India and of
the States, has led to reduction in the overall AT&C loss from 38.86% in 2001-02 to
34.54% in 2005-06. The commercial loss of the State Power Utilities reduced
significantly during this period from Rs. 29331 Crores to Rs. 19546 Crores. The loss
as percentage of turnover was reduced from 33% in 2000-01 to 16.60% in 2005-06.
The APDRP programme is being restructured by the Government of India, so that
the desired level of 15% AT&C loss could be achieved by the end of 11th plan.
Second Initiatives of Government is Rajiv Gandhi Grameen Vidyutikaran Yojana.
Rajiv Gandhi Grameen Vidyutikaran Yojana (RGGVY) was launched in April-05 by
merging all ongoing schemes. Under the programme 90% grant is provided by Govt.
of India and 10% as loan by REC to the State Governments. REC is the nodal
agency for the programme. The RGGVY aims at:
• Electrifying all villages and habitations as per new definition
• Providing access to electricity to all rural households

8
CHAPTER 2
INTRODUCTION ABOUT COMPANY
9
BRIEF INTRODUCTION OF KALPATARU POWER TRANSMISSION LTD (KPTL)
Kalpataru Power Transmission was established in 1981 with the name HT Power
Structure. The Kalpataru Power Transmission Ltd. adopted its current name in 1994.
Kalpataru Power Transmission Ltd is a part of Kalpataru Group. Kalpataru Group
was started in 1969 by Mr. Mofatraj Munot with establishment of Kalpataru
Properties Pvt Ltd. Today Kalpataru Group has foray into Power Transmission, Oil-
Gas Pipeline, Tower Business, Biomass, Power Distribution, and Logistics business
Kalpataru word was derived from “KALPAYRUKSHA”. It means Standing tall.
Looking ahead. The embodiment of realization beneath which one's every wish
would be fulfilled. The resourceful tree of knowledge that has a significant presence
in mythology. It is this tree that governs the functional and philosophical ideologies at
Kalpataru, a synonym of the word Kalpavruksha.
Kalpataru Power Transmission Ltd (KPTL) Engaged in the business of designing,
fabricating/galvanising and supplying Towers and Construction and Commissioning
of High Tension Power Transmission Lines (up to 800 KV) on a Turnkey / EPC
basis-in India and Overseas.
A Turnkey Project is a contract under which a firm agrees to fully design, construct
and equip a manufacturing/ business/ service facility and turn the project over to the
purchaser when it is ready for operation for remuneration. It is one of the special
modes of carrying out International Business.
As an EPC contractor, company’s scope of work includes design, testing, fabrication,
galvanizing of towers and construction activities from survey, civil works/ foundation,
erection to stringing and commissioning of EHV lines, besides procurement of items
such as conductors, insulators, hardware accessories etc. Kalpataru also
participates in Substation projects on a partnership basis.
The Kalpataru Power Transmission Company has become one of the topmost
companies in the sector of turnkey projects. The construction division of the
10
company has been conducting surveys, erection, foundation work, and has set up
over 6,500 km of projects based on turnkey in the country.
Kalpataru Power Transmission Ltd.'s clients include several State Electricity Boards
and the Power Grid Corporation of India. The company has already designed and
supplied around 450,000 MT of sub-station and towers structures.
Kalpataru Power Transmission has 2 fabrication units and the production capacity of
these plants is around 108,000 MT per year. KPTL has one Plant for a Domestic
requirement which is situated in Sector 28 Gandhinagar, which has a capacity of
78,000 MTs per annum. And second plant is situated in Sector 25, Gandhinagar
which is 100% EOU plant for Export purpose and has capacity of 30000 MTs per
annum. The average capacity utilisation Rate is around 96 % of total Capacity
Installed.
The plants of the company are technologically advanced and comparable to the best
in the world. Kalpataru Power Transmission has also exported the tower plants to
Algeria, Mexico, Thailand, Bangladesh, Australia, Peru, and Turkey. Kalpataru
Power Transmission has also executed jobs for international companies like Cobra,
ABB, Sumitomo, Alstom, and EnelPower.
Equity Share of the company are listed on the Bombay Stock Exchange(BSE) and
National Stock Exchange(NSE). The company had issued bonus share on Equity
share in 200
KPTL had reported Net Sales of Rs 1882.49 Crores in 2008-09 as compared to Rs
1737.58 Crores in 2007-08 which saw 9 % increase in compare to last year. But Net
profit after tax decline to Rs 94.41 Crores in 2008-09 from 149.95 Crores in 2007-08
which saw 37 % decrease in a Net Profit. There is a mainly one reason for that the
sharp increase in cost of Raw material and especially in Steel price which is
essential for Tower Manufacturing.
KPTL has order book of Rs 5000 + Crores which saw almost 50 % increase from the
last year which was around Rs 3400 Crores at end of 2007-08. This saw company
future prospect and growth story.
11
The total Export Turnover of KPTL (including overseas projects) stood at Rs 518.96
Crores (US$ 102 Million) or approx 27 % of Revenue of Company in 2008-09 as
compared to Rs. 500.59 Crores in 2007-08 (US$ 98 Million) in 2007-08. KPTL is/ has
already Exported Towers or is Executing / has executed Turnkey Projects in
continents like Asia (Nepal, Bangladesh, Thailand, Indonesia, Vietnam, Malaysia,
and Philippines), Middle East (Iraq, Turkey, Syria, Qatar, UAE, and Kuwait), Africa
(South Africa, Uganda, Tanzania, Kenya, Nigeria, Zambia, and Ethiopia), America
(USA, Canada, Mexico, and Peru) and Australia.
As a part of Diversification policy of Company, Company had foray into Power
Generation Business by Setting up of Two Bio-Mass based power plant in
Rajasthan. Company had entered into Power Distribution Business. KPTL has
submitted few tenders related to power Distribution. In short I can say that, Kalpataru
Power Transmission Ltd is a Pure Power Company, which has commenced its
business in all three segment of Power Industry, which none other company had
done this.
KPTL had entered into Civil Construction Business by acquiring 51% stake in JMC
projects Ahmedabad based company. KPTL had entered into Oil-Gas Pipeline
Sector, Logistic Business and also in Real-Estate Sector.
12
The Kalpataru Group’s credo of “No compromise” embodies strong commitment to
highest standards of excellence and ethics. It encourages innovation and people
development, which in turn lead to superior quality product and services and result
in maximum customer satisfaction
ETHICS OF KPTL :
The genesis of Taking its name from Kalpavruksha - the mythological tree of wish
fulfillment. Kalpataru embodies the tree's ability to fulfill every person's wish, a
fulfillment that we would like to provide to each one of our customers
KPTL AT GANDHINAGAR:
The company was established in 1981 is public limited company situated in Gandhinagar. It was started with 5700 shareholders. USD 300 million diversified Kalpatru group, which holds more than 76% of the equity.
It is engaged in the business of designing, fabricating/galvanizing & supplying Towers and construction and commissioning of extra high voltage transmission lines (up to 800kv) on a Turnkey / EPC basis in India and overseas.
Fabrication plant at Gandhinagar, Gujarat spread over 48,000 sq. mts. With 5 Nos CNC Punching and Drilling M/c’s (from Ficep, Italy) and an automatic temperature-control Galvanizing bath (8 Mt*1 Mt*2.4 Mt) with an installed capacity of 54,000 Mt p.a. (second largest in India). It is one of the most sophisticated and cost-efficient Fabrication Plant for Steel Galvanized Towers.
MISSION STATEMENT OF KPTL:
13
The company has its own in-house sophisticated Tower Testing Station and R & D Centre(near Gandhinagar), which is a state-of-the art facility with a capacity to test square / rectangular base towers(27Mt*27Mt) up to 800 kV D/C as well as Multi-Circuit Towers Max .height 80 mts and is one of the largest in Asia.
The company is the best performer among all Indian Transmission Line (TL) players on almost every financial parameter.
It is first company in 1994 to obtain ISO 9001 certification in the Indian Transmission Tower Industry. It is second company in India to get UNFCCC registration for its Certified Emission Reductions (CER’s), under the CDM mechanism of Kyoto Protocol for its Biomass Power Plant at Padampur, Ganganagar. The company is generating CER’s by using agricultural residues like mustard husk/cotton stalk to prevent environmental degradation, by generating electricity from them.
STRENGTHS OF THE COMPANY :
� Design and Engineering
� Testing station and R &D center
� Fabrication
� Galvanization
� Supply chain (by air, sea, etc.)
� Construction(of towers)
� Customers
� Across India :-
14
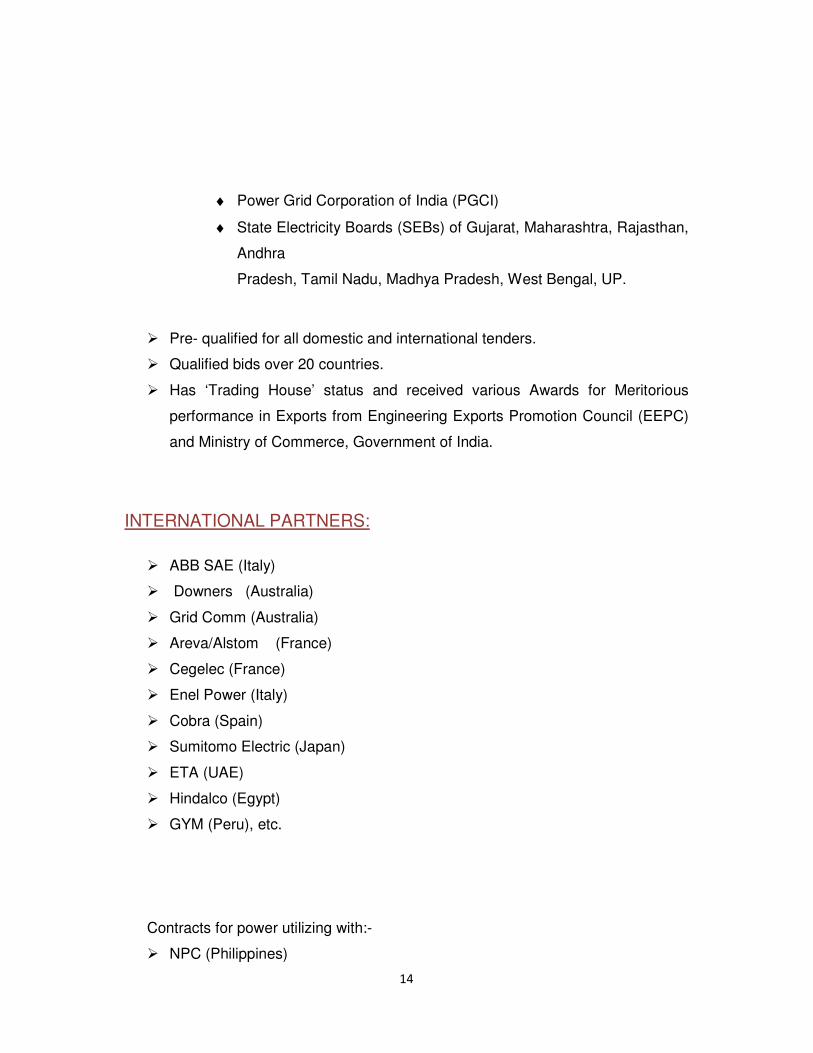
♦ Power Grid Corporation of India (PGCI)
♦ State Electricity Boards (SEBs) of Gujarat, Maharashtra, Rajasthan,
Andhra
Pradesh, Tamil Nadu, Madhya Pradesh, West Bengal, UP.
� Pre- qualified for all domestic and international tenders.
� Qualified bids over 20 countries.
� Has ‘Trading House’ status and received various Awards for Meritorious
performance in Exports from Engineering Exports Promotion Council (EEPC)
and Ministry of Commerce, Government of India.
INTERNATIONAL PARTNERS:
� ABB SAE (Italy)
� Downers (Australia)
� Grid Comm (Australia)
� Areva/Alstom (France)
� Cegelec (France)
� Enel Power (Italy)
� Cobra (Spain)
� Sumitomo Electric (Japan)
� ETA (UAE)
� Hindalco (Egypt)
� GYM (Peru), etc.
Contracts for power utilizing with:-
� NPC (Philippines)
15
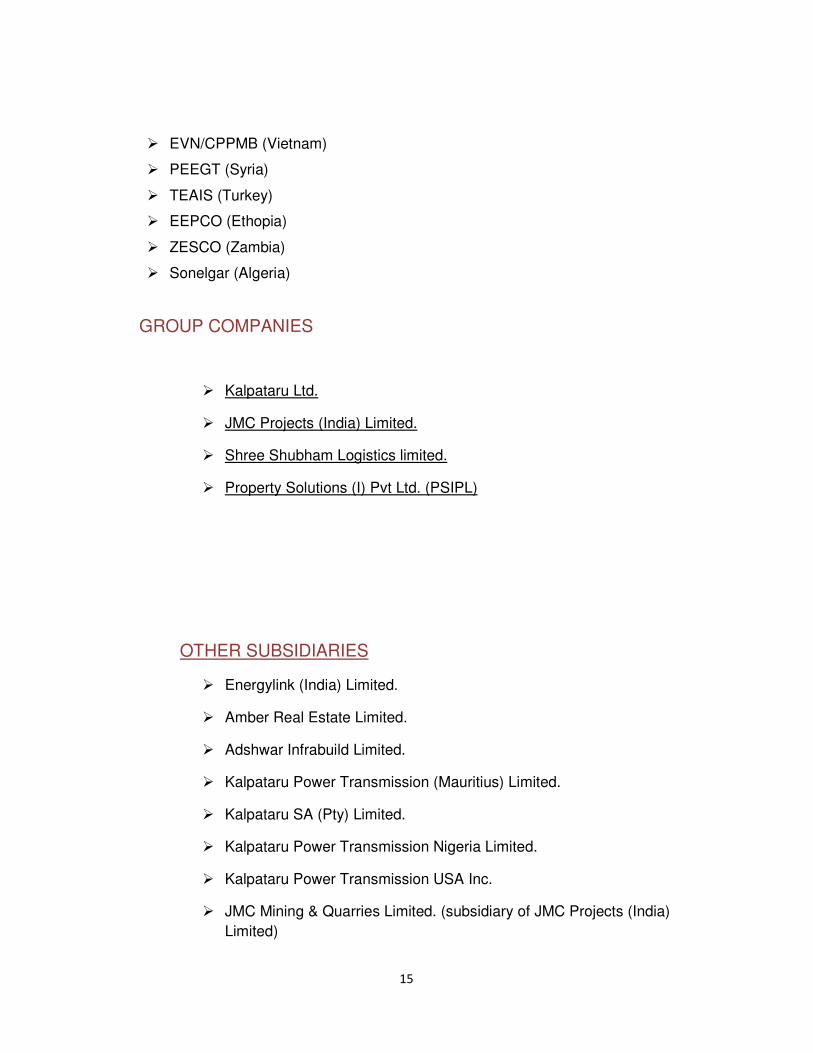
� EVN/CPPMB (Vietnam)
� PEEGT (Syria)
� TEAIS (Turkey)
� EEPCO (Ethopia)
� ZESCO (Zambia)
� Sonelgar (Algeria)
GROUP COMPANIES
� Kalpataru Ltd.
� JMC Projects (India) Limited.
� Shree Shubham Logistics limited.
� Property Solutions (I) Pvt Ltd. (PSIPL)
OTHER SUBSIDIARIES
� Energylink (India) Limited.
� Amber Real Estate Limited.
� Adshwar Infrabuild Limited.
� Kalpataru Power Transmission (Mauritius) Limited.
� Kalpataru SA (Pty) Limited.
� Kalpataru Power Transmission Nigeria Limited.
� Kalpataru Power Transmission USA Inc.
� JMC Mining & Quarries Limited. (subsidiary of JMC Projects (India)
Limited)

16
� Saicharan Properties Limited . (Subsidiary of Energylink (India) Limited)
MANAGEMENT TEAM OF KPTL
Members of Board of Director of Kalpataru Power Transmission Ltd are as follows:
Chairman : Mr. Mofatraj P Munot
Managing Director : Mr. K. V. Mani
Dy.Managing Director : Mr. Pankaj Sachdeva
Executive Director : Mr. Ajay Munot
Executive Director : Mr. Manish Munot
Director : Mr. Parag M. Munot
Director : Mr Sanjjanraj Mehta
Director : Mr. Vimal Bhandari
Director : Mr. Shitin Desai
Director : Mr. Narayan Seshdari
Director : Mr. S.P. Talwar
Director : Mr. Sanju Ahuja
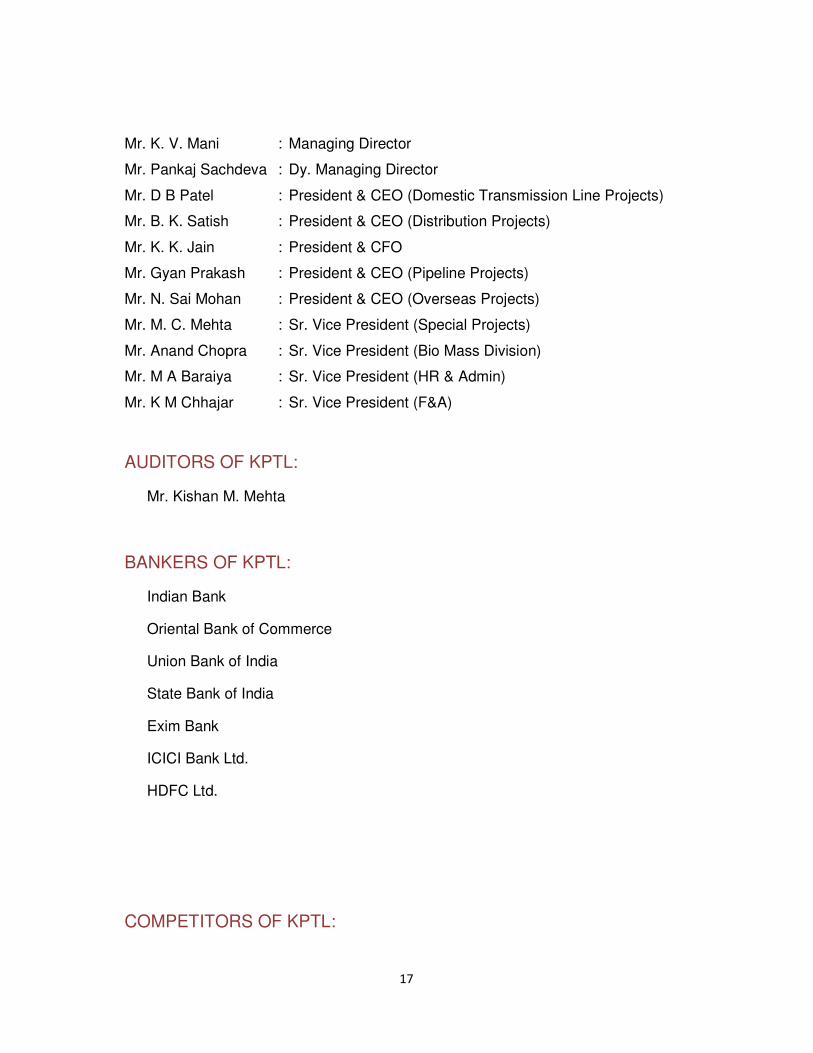
Core Management Team of Kalpataru Power Transmission Ltd as Follows
17
Mr. K. V. Mani : Managing Director
Mr. Pankaj Sachdeva : Dy. Managing Director
Mr. D B Patel : President & CEO (Domestic Transmission Line Projects)
Mr. B. K. Satish : President & CEO (Distribution Projects)
Mr. K. K. Jain : President & CFO
Mr. Gyan Prakash : President & CEO (Pipeline Projects)
Mr. N. Sai Mohan : President & CEO (Overseas Projects)
Mr. M. C. Mehta : Sr. Vice President (Special Projects)
Mr. Anand Chopra : Sr. Vice President (Bio Mass Division)
Mr. M A Baraiya : Sr. Vice President (HR & Admin)
Mr. K M Chhajar : Sr. Vice President (F&A)
AUDITORS OF KPTL:
Mr. Kishan M. Mehta
BANKERS OF KPTL:
Indian Bank
Oriental Bank of Commerce
Union Bank of India
State Bank of India
Exim Bank
ICICI Bank Ltd.
HDFC Ltd.
COMPETITORS OF KPTL:

18
Alstom India Ltd.
Alstom T&D India Ltd.
Bil Energy Systems Ltd.
Indo Tech Transformers Ltd.
Jyoti Structures Ltd.
KEC International Ltd.
Modern Malleables Ltd.
Power Grid Corporation of India Ltd.
RPG Transmission Ltd.[Merged]
Sujana Towers Ltd.
Transformers & Rectifiers (India) Ltd.
CORPORATE OFFICE:
111, Maker Chambers IV, Nariman Point
Mumbai – 400 021. India.
Tel No.: 91-22-2282 2888 / 2288 4780
Fax No.: 91-22-2204 1548
FACTORY AND REGISTERED OFFICE:
Plot No. 101, Part III,
G.I.D.C. Estate, Sector 28,
Gandhinagar – 382 028, Gujarat, India

19
Tel No.: 91-79-23214000
Fax No.: 91-79-2321 1966 / 68 / 71
Email:[email protected]
WEBSITE OF KPTL:
www.kalpatarupower.com
www.jmcprojects.com
www.kalpataru.com
www.ssll.in
CHAPTER 3

20
LIETRATURE REVIEW
LITERATURE REVIEW OF STUDY
21
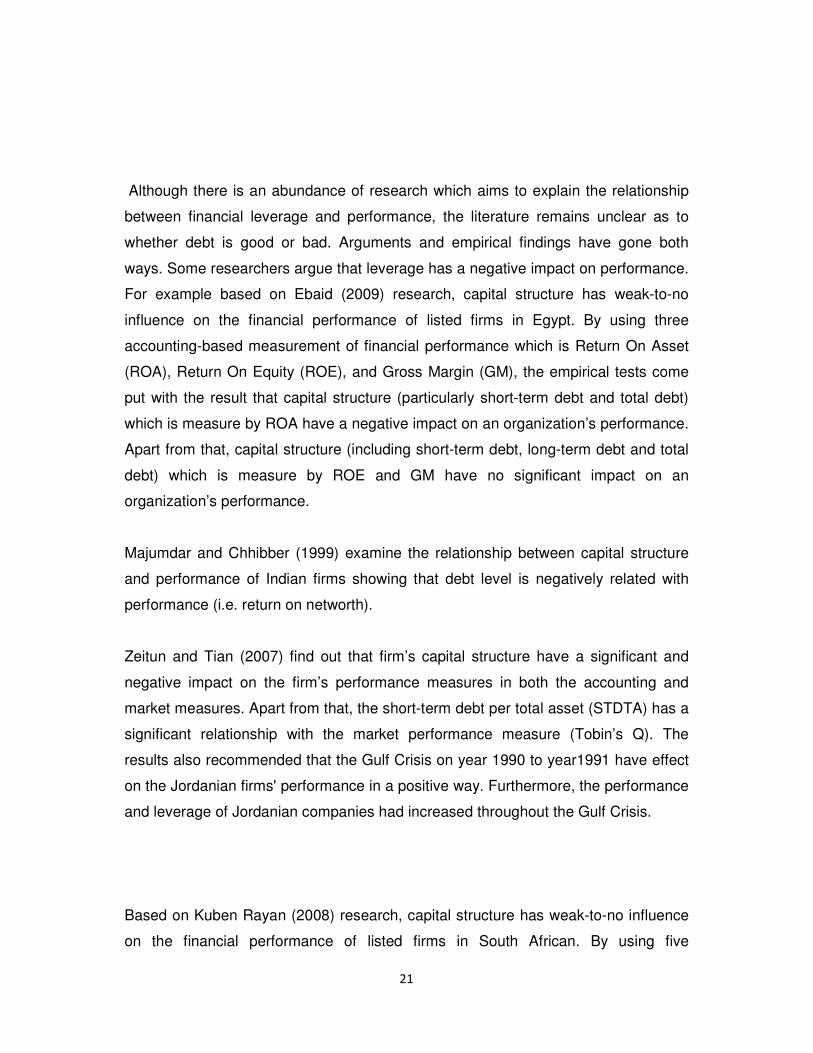
Although there is an abundance of research which aims to explain the relationship
between financial leverage and performance, the literature remains unclear as to
whether debt is good or bad. Arguments and empirical findings have gone both
ways. Some researchers argue that leverage has a negative impact on performance.
For example based on Ebaid (2009) research, capital structure has weak-to-no
influence on the financial performance of listed firms in Egypt. By using three
accounting-based measurement of financial performance which is Return On Asset
(ROA), Return On Equity (ROE), and Gross Margin (GM), the empirical tests come
put with the result that capital structure (particularly short-term debt and total debt)
which is measure by ROA have a negative impact on an organization’s performance.
Apart from that, capital structure (including short-term debt, long-term debt and total
debt) which is measure by ROE and GM have no significant impact on an
organization’s performance.
Majumdar and Chhibber (1999) examine the relationship between capital structure
and performance of Indian firms showing that debt level is negatively related with
performance (i.e. return on networth).
Zeitun and Tian (2007) find out that firm’s capital structure have a significant and
negative impact on the firm’s performance measures in both the accounting and
market measures. Apart from that, the short-term debt per total asset (STDTA) has a
significant relationship with the market performance measure (Tobin’s Q). The
results also recommended that the Gulf Crisis on year 1990 to year1991 have effect
on the Jordanian firms' performance in a positive way. Furthermore, the performance
and leverage of Jordanian companies had increased throughout the Gulf Crisis.
Based on Kuben Rayan (2008) research, capital structure has weak-to-no influence
on the financial performance of listed firms in South African. By using five

22
accounting-based measurement and creation value measurement of financial
performance which is general the ROE, ROA, and OPM ratio a signification
correlation to the financial leverage ratio. However the results for EVA in all cases
show no signification correlation.
CHAPTER 4

23
RESEARCH METHODOLOGY
RESEARCH METHODOLOGY
24
OBJECTIVE OF STUDY:
1. To know the relationship between the Financial Leverage and EVA , MVA ,
CVA.
2. To know the performance of EVA , MVA , AND CVA on the companies capital
structure.
LIMITATION OF STUDY:
* The project report can be done within the 45 days.
* The data are taken from the companies published annual report and Balance
sheet, thus some error can be occurred.
SOURCES OF DATA:
The research can be done on the secondary data basis.
The secondary data can be taken from:
• Financial books
• From web based information
• Through the using SPSS Stastical tool.
VARIABLE USED IN STUDY:
25
- Independed variable ( Financial Leverage D/E ratio)
- Depended variable ( EVA, MVA, CVA)
TECHNIQUES USED IN STUDY:
- Correlation
- Regression
- Hypothesis
Data analysis, interpretation and conclusion.
26
CHAPTER 5
FINANCIAL PERFORMANCE OF KPTL
27
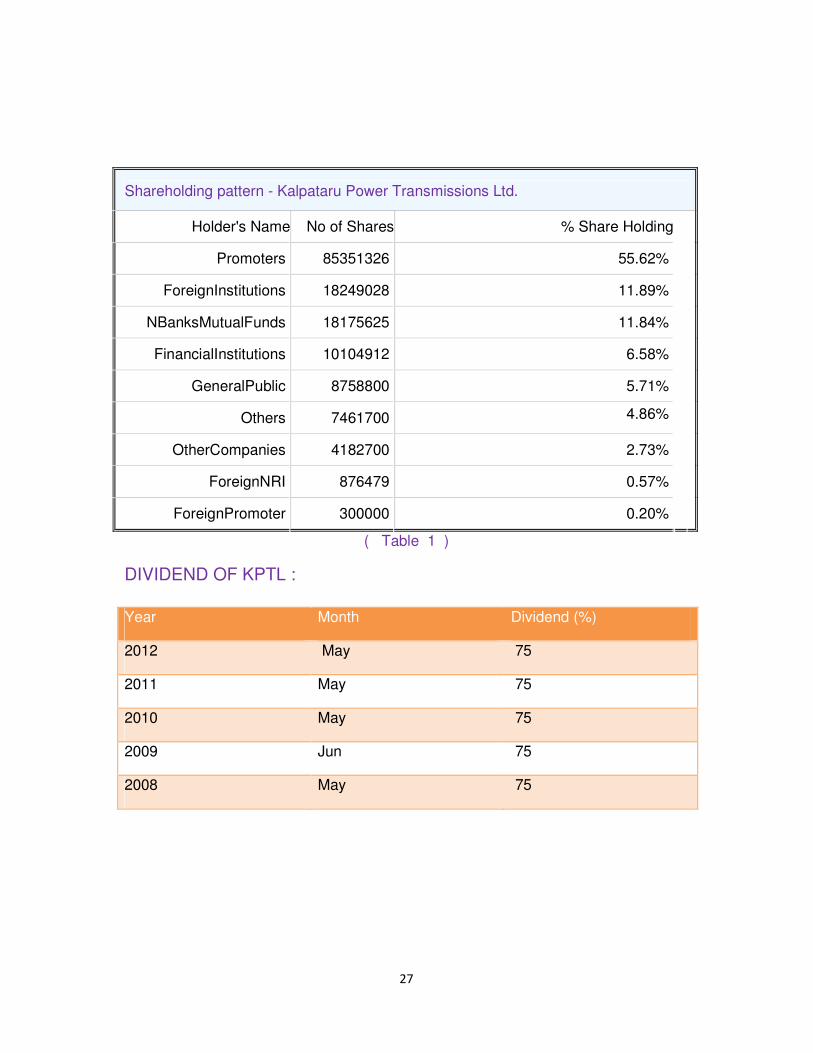
Shareholding pattern - Kalpataru Power Transmissions Ltd.
Holder's Name No of Shares % Share Holding
Promoters 85351326 55.62%
ForeignInstitutions 18249028 11.89%
NBanksMutualFunds 18175625 11.84%
FinancialInstitutions 10104912 6.58%
GeneralPublic 8758800 5.71%
Others 7461700 4.86%
OtherCompanies 4182700 2.73%
ForeignNRI 876479 0.57%
ForeignPromoter 300000 0.20%
( Table 1 )
DIVIDEND OF KPTL :
Year Month Dividend (%)
2012 May 75
2011 May 75
2010 May 75
2009 Jun 75
2008 May 75
R TR(TINING REPORT
28
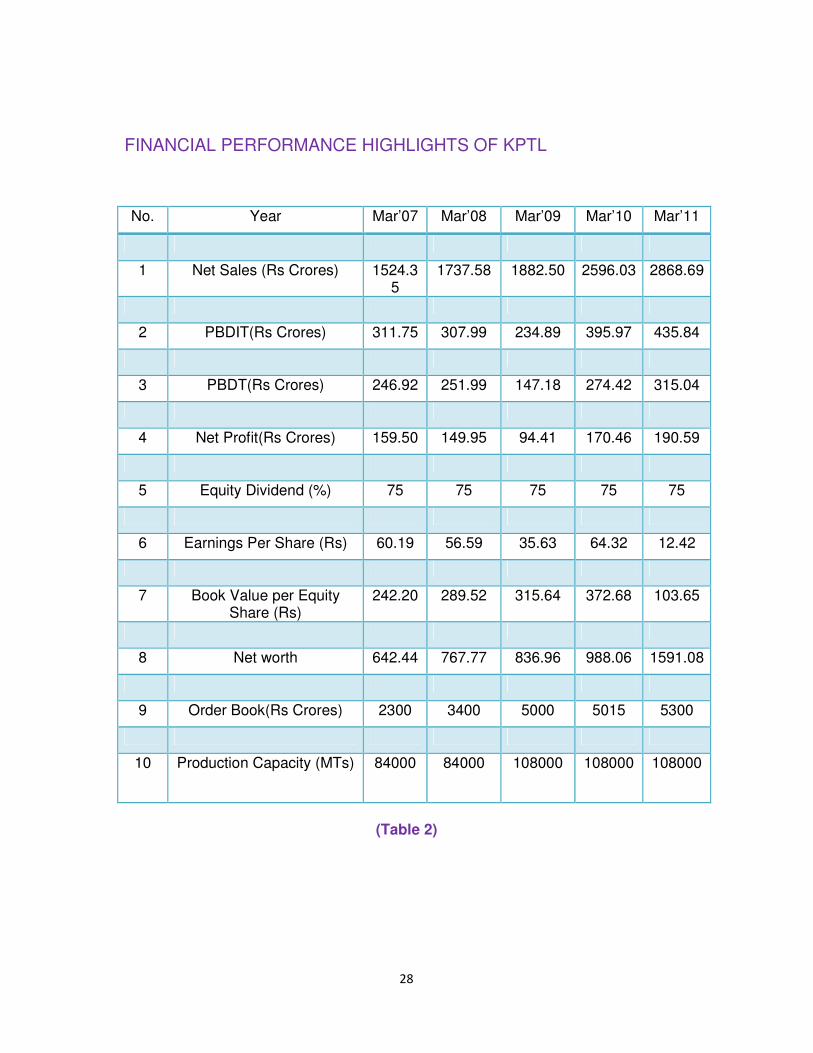
FINANCIAL PERFORMANCE HIGHLIGHTS OF KPTL
No. Year Mar’07 Mar’08 Mar’09 Mar’10 Mar’11
1 Net Sales (Rs Crores) 1524.35
1737.58 1882.50 2596.03 2868.69
2 PBDIT(Rs Crores) 311.75 307.99 234.89 395.97 435.84
3 PBDT(Rs Crores) 246.92 251.99 147.18 274.42 315.04
4 Net Profit(Rs Crores) 159.50 149.95 94.41 170.46 190.59
5 Equity Dividend (%) 75 75 75 75 75
6 Earnings Per Share (Rs) 60.19 56.59 35.63 64.32 12.42
7 Book Value per Equity Share (Rs)
242.20 289.52 315.64 372.68 103.65
8 Net worth 642.44 767.77 836.96 988.06 1591.08
9 Order Book(Rs Crores) 2300 3400 5000 5015 5300
10 Production Capacity (MTs) 84000 84000 108000 108000 108000
(Table 2)

29
CHAPTER 6 INTROSUCTION ABOUT LEVERAGE & EVA, MVA, CVA
MEANING OF LEVERAGE:
30
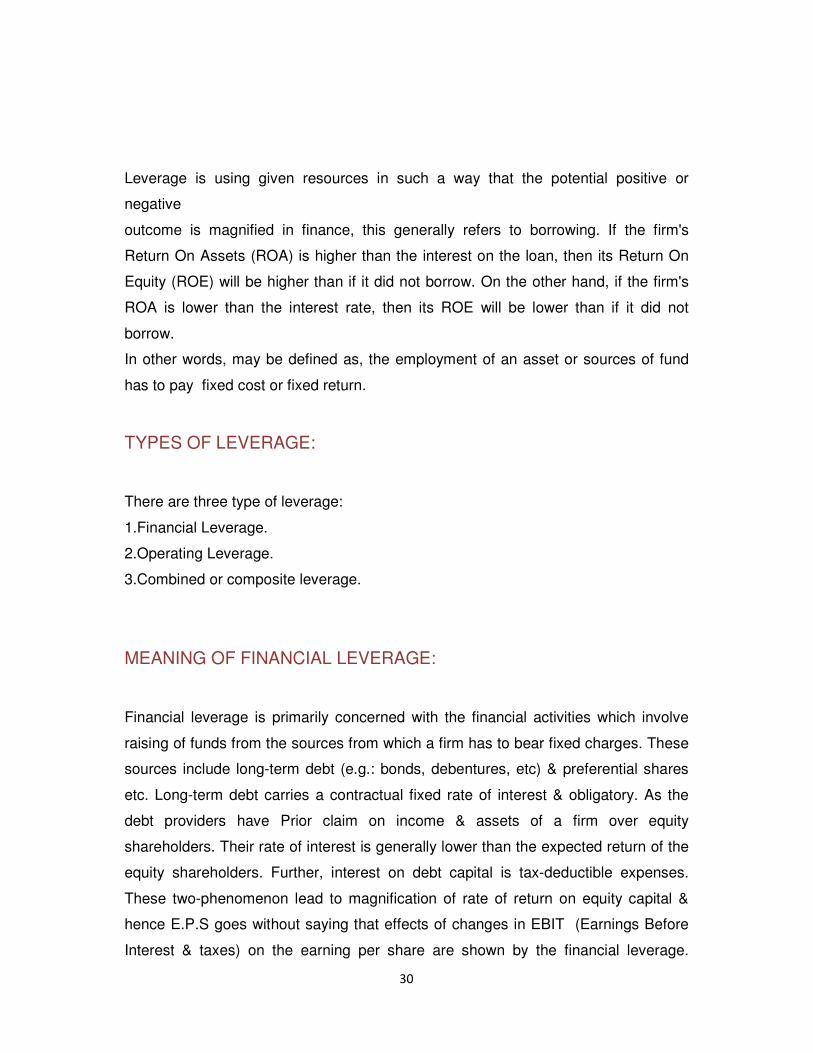
Leverage is using given resources in such a way that the potential positive or
negative
outcome is magnified in finance, this generally refers to borrowing. If the firm's
Return On Assets (ROA) is higher than the interest on the loan, then its Return On
Equity (ROE) will be higher than if it did not borrow. On the other hand, if the firm's
ROA is lower than the interest rate, then its ROE will be lower than if it did not
borrow.
In other words, may be defined as, the employment of an asset or sources of fund
has to pay fixed cost or fixed return.
TYPES OF LEVERAGE:
There are three type of leverage:
1.Financial Leverage.
2.Operating Leverage.
3.Combined or composite leverage.
MEANING OF FINANCIAL LEVERAGE:
Financial leverage is primarily concerned with the financial activities which involve
raising of funds from the sources from which a firm has to bear fixed charges. These
sources include long-term debt (e.g.: bonds, debentures, etc) & preferential shares
etc. Long-term debt carries a contractual fixed rate of interest & obligatory. As the
debt providers have Prior claim on income & assets of a firm over equity
shareholders. Their rate of interest is generally lower than the expected return of the
equity shareholders. Further, interest on debt capital is tax-deductible expenses.
These two-phenomenon lead to magnification of rate of return on equity capital &
hence E.P.S goes without saying that effects of changes in EBIT (Earnings Before
Interest & taxes) on the earning per share are shown by the financial leverage.
31
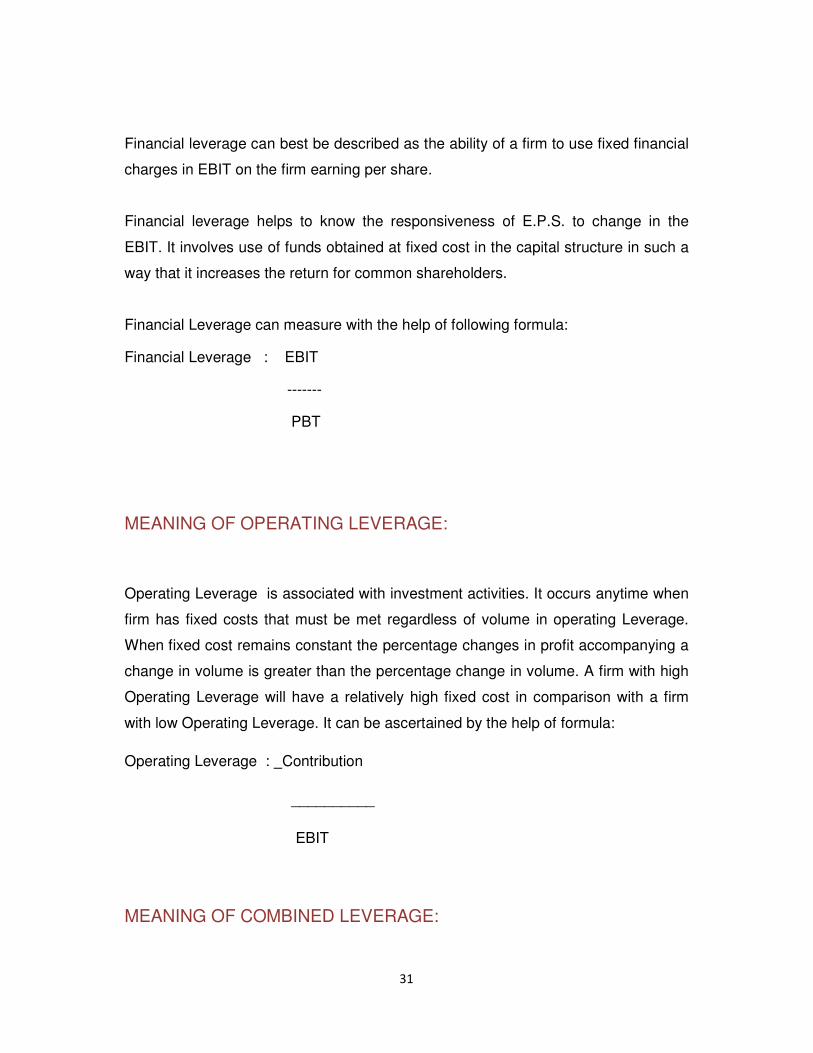
Financial leverage can best be described as the ability of a firm to use fixed financial
charges in EBIT on the firm earning per share.
Financial leverage helps to know the responsiveness of E.P.S. to change in the
EBIT. It involves use of funds obtained at fixed cost in the capital structure in such a
way that it increases the return for common shareholders.
Financial Leverage can measure with the help of following formula:
Financial Leverage : EBIT
-------
PBT
MEANING OF OPERATING LEVERAGE:
Operating Leverage is associated with investment activities. It occurs anytime when
firm has fixed costs that must be met regardless of volume in operating Leverage.
When fixed cost remains constant the percentage changes in profit accompanying a
change in volume is greater than the percentage change in volume. A firm with high
Operating Leverage will have a relatively high fixed cost in comparison with a firm
with low Operating Leverage. It can be ascertained by the help of formula:
Operating Leverage : Contribution
__________
EBIT
MEANING OF COMBINED LEVERAGE:
32
Combined Leverage is the combination of Financial Leverage and Operating
Leverage.
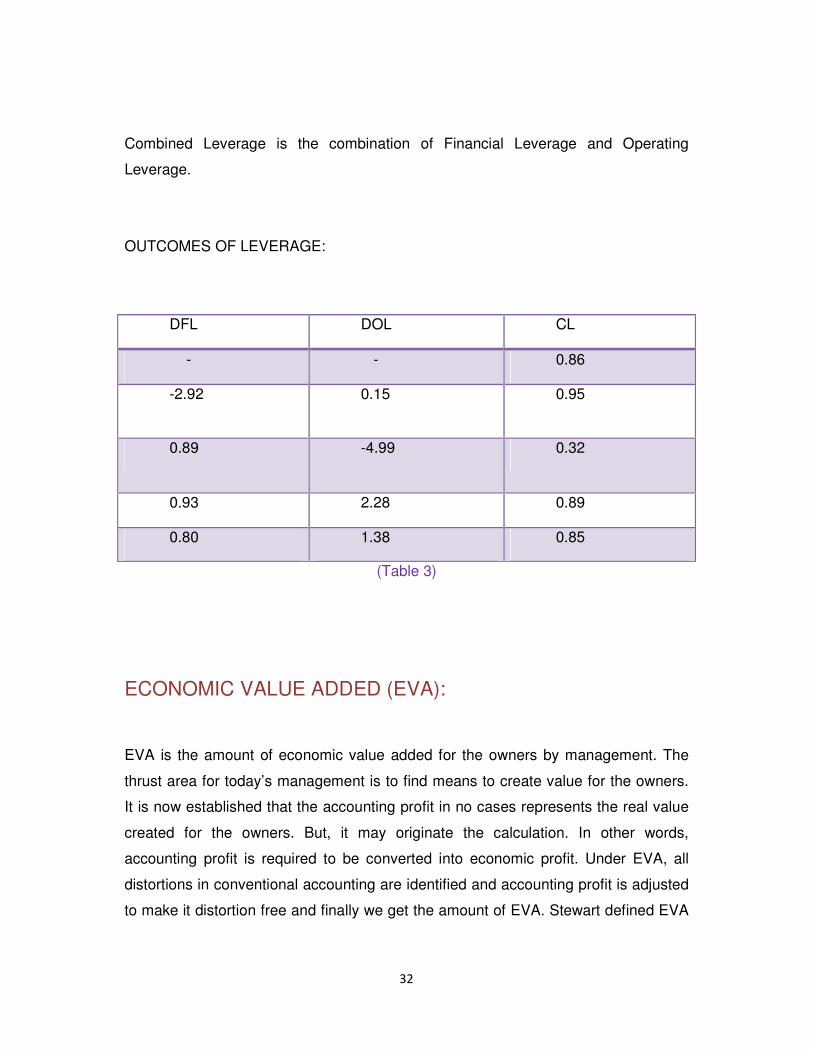
OUTCOMES OF LEVERAGE:
DFL DOL CL
- - 0.86
-2.92 0.15 0.95
0.89 -4.99 0.32
0.93 2.28 0.89
0.80 1.38 0.85
(Table 3)
ECONOMIC VALUE ADDED (EVA):
EVA is the amount of economic value added for the owners by management. The
thrust area for today’s management is to find means to create value for the owners.
It is now established that the accounting profit in no cases represents the real value
created for the owners. But, it may originate the calculation. In other words,
accounting profit is required to be converted into economic profit. Under EVA, all
distortions in conventional accounting are identified and accounting profit is adjusted
to make it distortion free and finally we get the amount of EVA. Stewart defined EVA
33
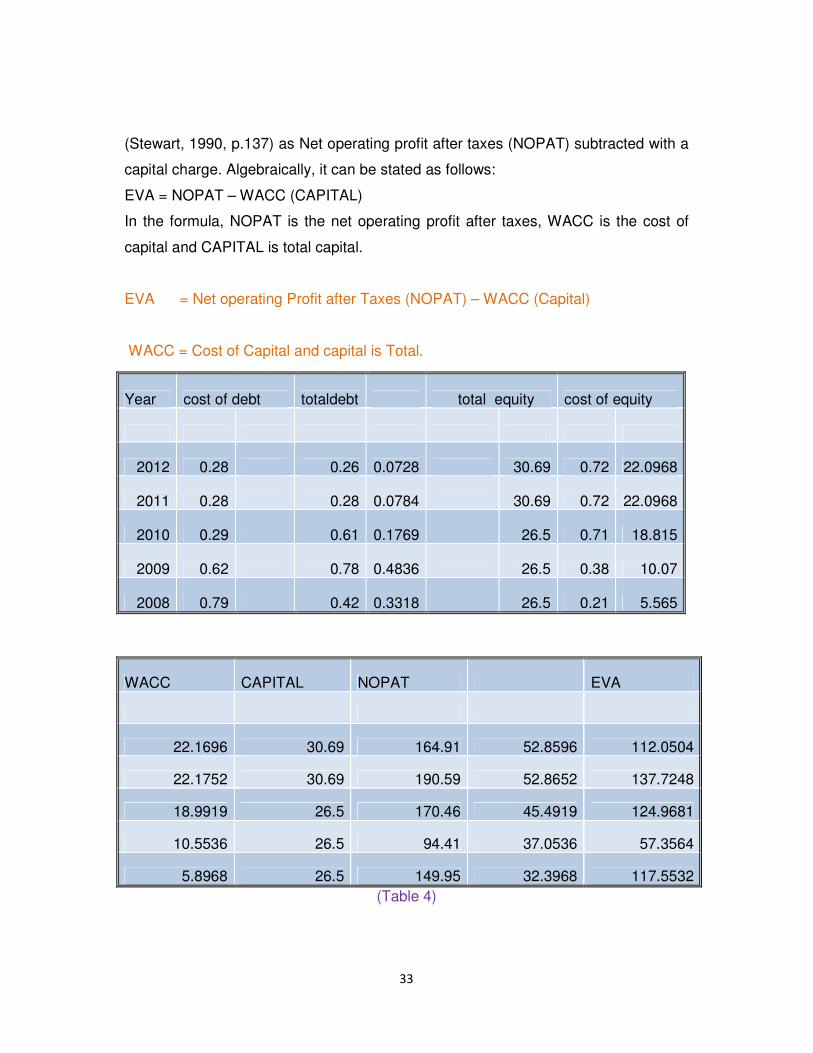
(Stewart, 1990, p.137) as Net operating profit after taxes (NOPAT) subtracted with a
capital charge. Algebraically, it can be stated as follows:
EVA = NOPAT – WACC (CAPITAL)
In the formula, NOPAT is the net operating profit after taxes, WACC is the cost of
capital and CAPITAL is total capital.
EVA = Net operating Profit after Taxes (NOPAT) – WACC (Capital)
WACC = Cost of Capital and capital is Total.
(Table 4)
Year cost of debt totaldebt total equity cost of equity
2012 0.28 0.26 0.0728 30.69 0.72 22.0968
2011 0.28 0.28 0.0784 30.69 0.72 22.0968
2010 0.29 0.61 0.1769 26.5 0.71 18.815
2009 0.62 0.78 0.4836 26.5 0.38 10.07
2008 0.79 0.42 0.3318 26.5 0.21 5.565
WACC CAPITAL NOPAT EVA
22.1696 30.69 164.91 52.8596 112.0504
22.1752 30.69 190.59 52.8652 137.7248
18.9919 26.5 170.46 45.4919 124.9681
10.5536 26.5 94.41 37.0536 57.3564
5.8968 26.5 149.95 32.3968 117.5532
34
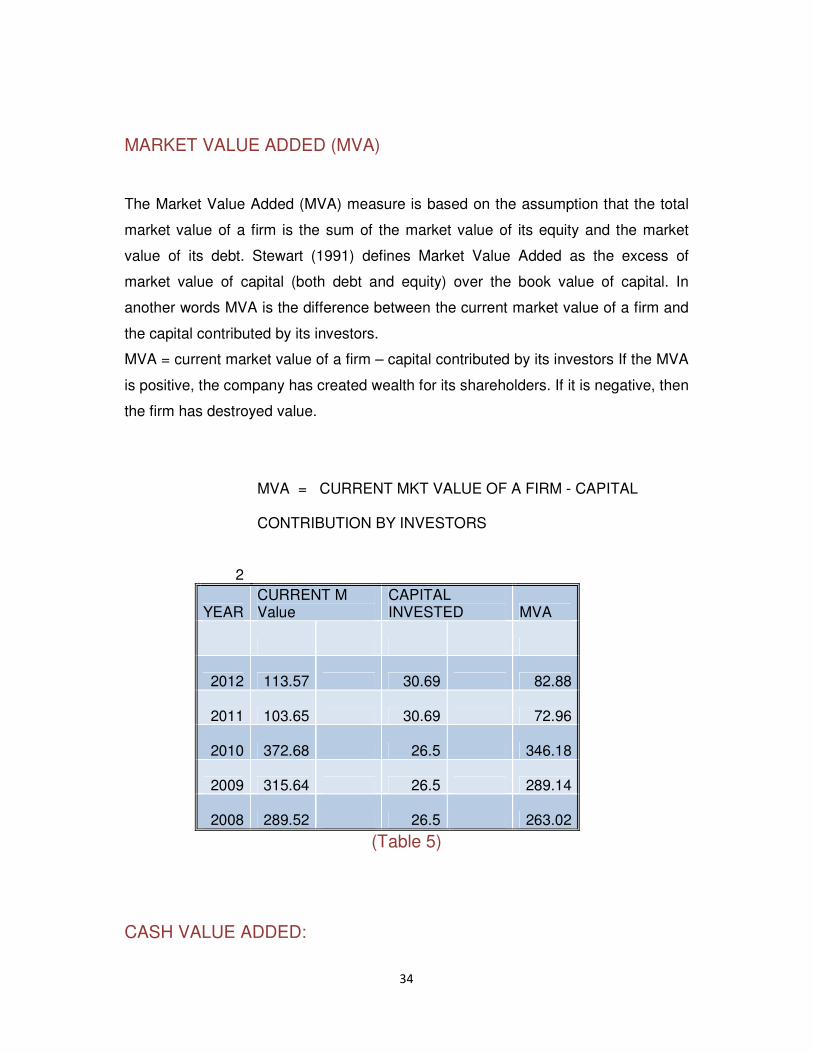
MARKET VALUE ADDED (MVA)
The Market Value Added (MVA) measure is based on the assumption that the total
market value of a firm is the sum of the market value of its equity and the market
value of its debt. Stewart (1991) defines Market Value Added as the excess of
market value of capital (both debt and equity) over the book value of capital. In
another words MVA is the difference between the current market value of a firm and
the capital contributed by its investors.
MVA = current market value of a firm – capital contributed by its investors If the MVA
is positive, the company has created wealth for its shareholders. If it is negative, then
the firm has destroyed value.
2
MVA = CURRENT MKT VALUE OF A FIRM - CAPITAL CONTRIBUTION BY INVESTORS
YEAR CURRENT M Value
CAPITAL INVESTED MVA
2012 113.57 30.69 82.88
2011 103.65 30.69 72.96
2010 372.68 26.5 346.18
2009 315.64 26.5 289.14
2008 289.52 26.5 263.02
(Table 5)
CASH VALUE ADDED:
35
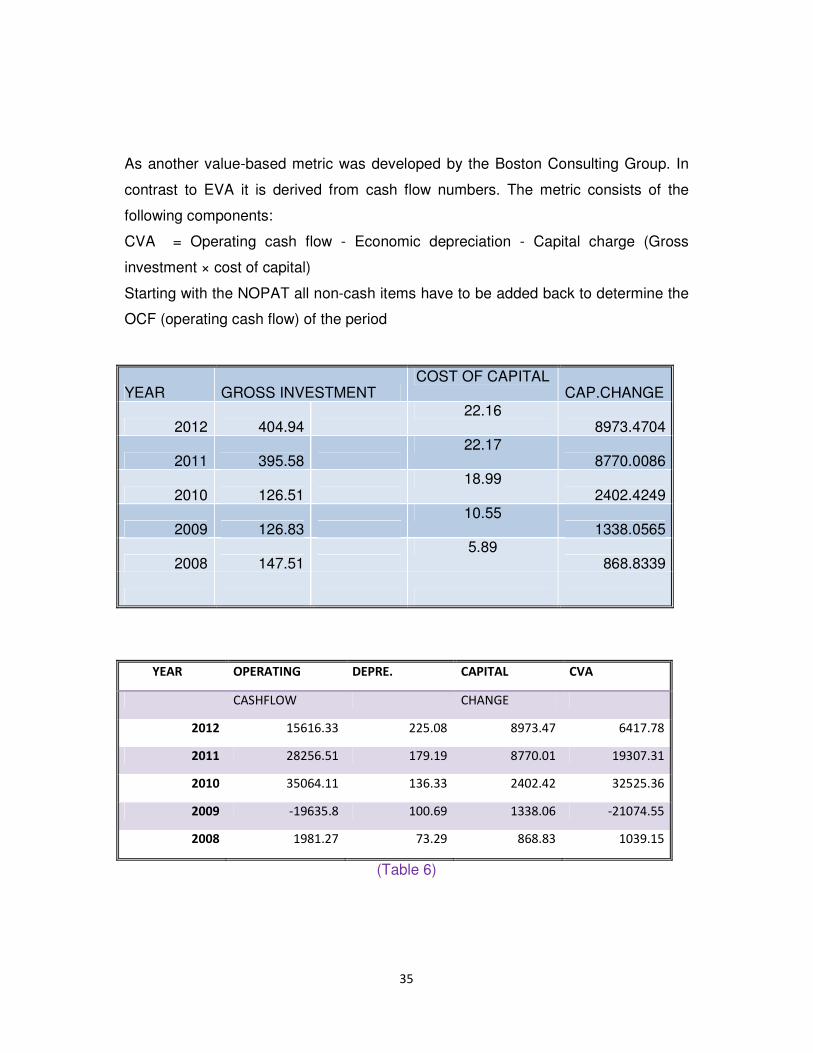
As another value-based metric was developed by the Boston Consulting Group. In
contrast to EVA it is derived from cash flow numbers. The metric consists of the
following components:
CVA = Operating cash flow - Economic depreciation - Capital charge (Gross
investment × cost of capital)
Starting with the NOPAT all non-cash items have to be added back to determine the
OCF (operating cash flow) of the period
YEAR OPERATING DEPRE. CAPITAL CVA
CASHFLOW CHANGE
2012 15616.33 225.08 8973.47 6417.78
2011 28256.51 179.19 8770.01 19307.31
2010 35064.11 136.33 2402.42 32525.36
2009 -19635.8 100.69 1338.06 -21074.55
2008 1981.27 73.29 868.83 1039.15
(Table 6)
YEAR GROSS INVESTMENT COST OF CAPITAL
CAP.CHANGE
2012 404.94 22.16
8973.4704
2011 395.58 22.17
8770.0086
2010 126.51 18.99
2402.4249
2009 126.83 10.55
1338.0565
2008 147.51 5.89
868.8339

36
CHAPTER 7
TECHNIQUES OF DATA ANALYSIS
37
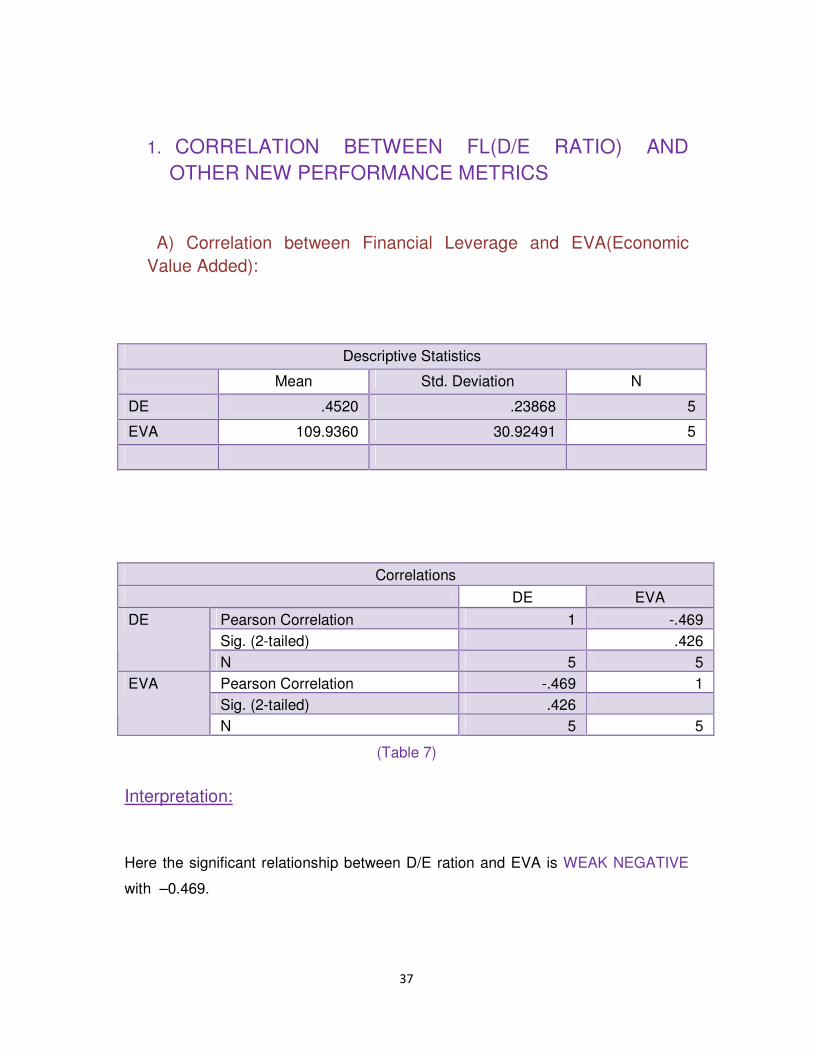
1. CORRELATION BETWEEN FL(D/E RATIO) AND OTHER NEW PERFORMANCE METRICS
A) Correlation between Financial Leverage and EVA(Economic Value Added):
Correlations DE EVA
Pearson Correlation 1 -.469 Sig. (2-tailed) .426
DE
N 5 5 Pearson Correlation -.469 1 Sig. (2-tailed) .426
EVA
N 5 5
(Table 7)
Interpretation:
Here the significant relationship between D/E ration and EVA is WEAK NEGATIVE
with –0.469.
Descriptive Statistics
Mean Std. Deviation N
DE .4520 .23868 5
EVA 109.9360 30.92491 5
38
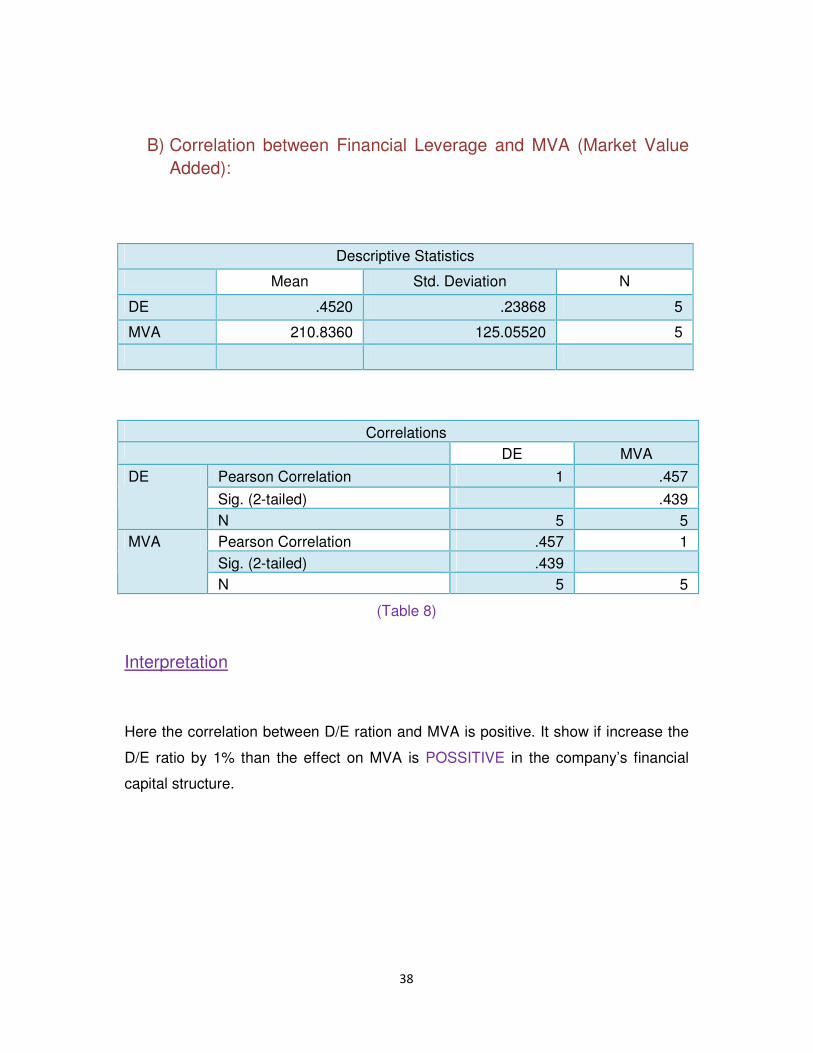
B) Correlation between Financial Leverage and MVA (Market Value Added):
Descriptive Statistics
Mean Std. Deviation N
DE .4520 .23868 5
MVA 210.8360 125.05520 5
Correlations
DE MVA
Pearson Correlation 1 .457
Sig. (2-tailed) .439
DE
N 5 5 Pearson Correlation .457 1 Sig. (2-tailed) .439
MVA
N 5 5
(Table 8)
Interpretation
Here the correlation between D/E ration and MVA is positive. It show if increase the
D/E ratio by 1% than the effect on MVA is POSSITIVE in the company’s financial
capital structure.
39
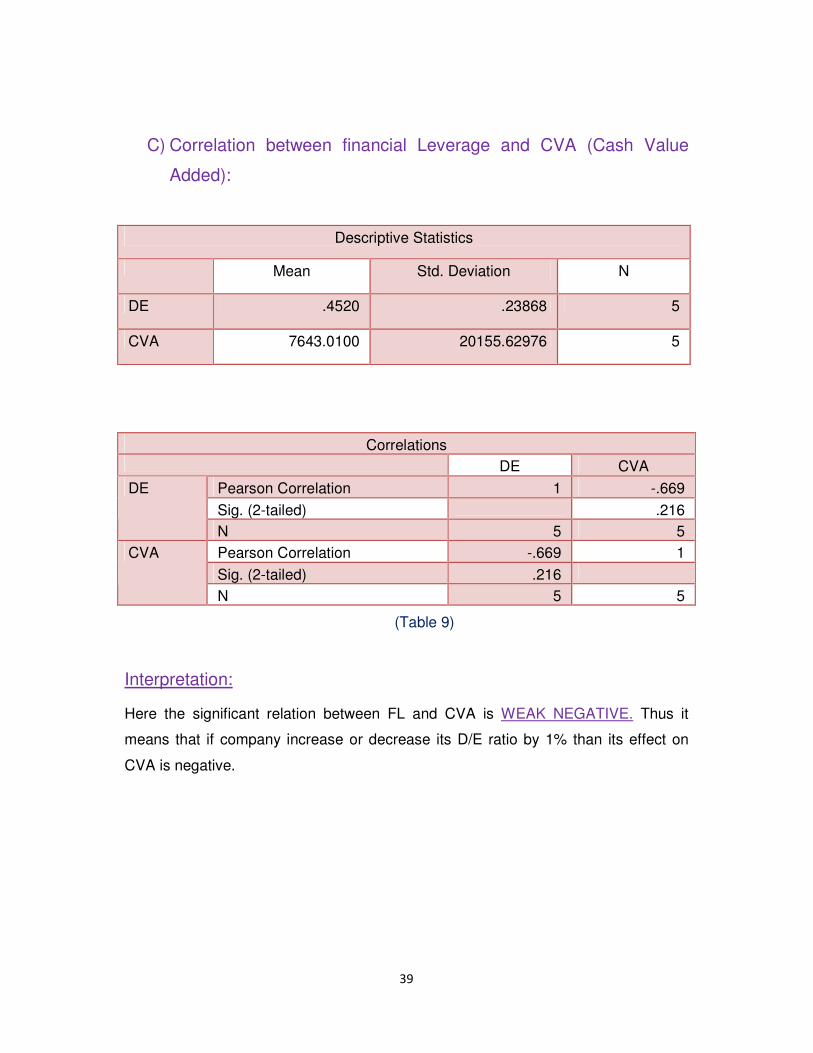
C) Correlation between financial Leverage and CVA (Cash Value
Added):
Descriptive Statistics
Mean Std. Deviation N
DE .4520 .23868 5
CVA 7643.0100 20155.62976 5
Correlations DE CVA
Pearson Correlation 1 -.669
Sig. (2-tailed) .216
DE
N 5 5 Pearson Correlation -.669 1
Sig. (2-tailed) .216 CVA
N 5 5
(Table 9)
Interpretation:
Here the significant relation between FL and CVA is WEAK NEGATIVE. Thus it
means that if company increase or decrease its D/E ratio by 1% than its effect on
CVA is negative.
40
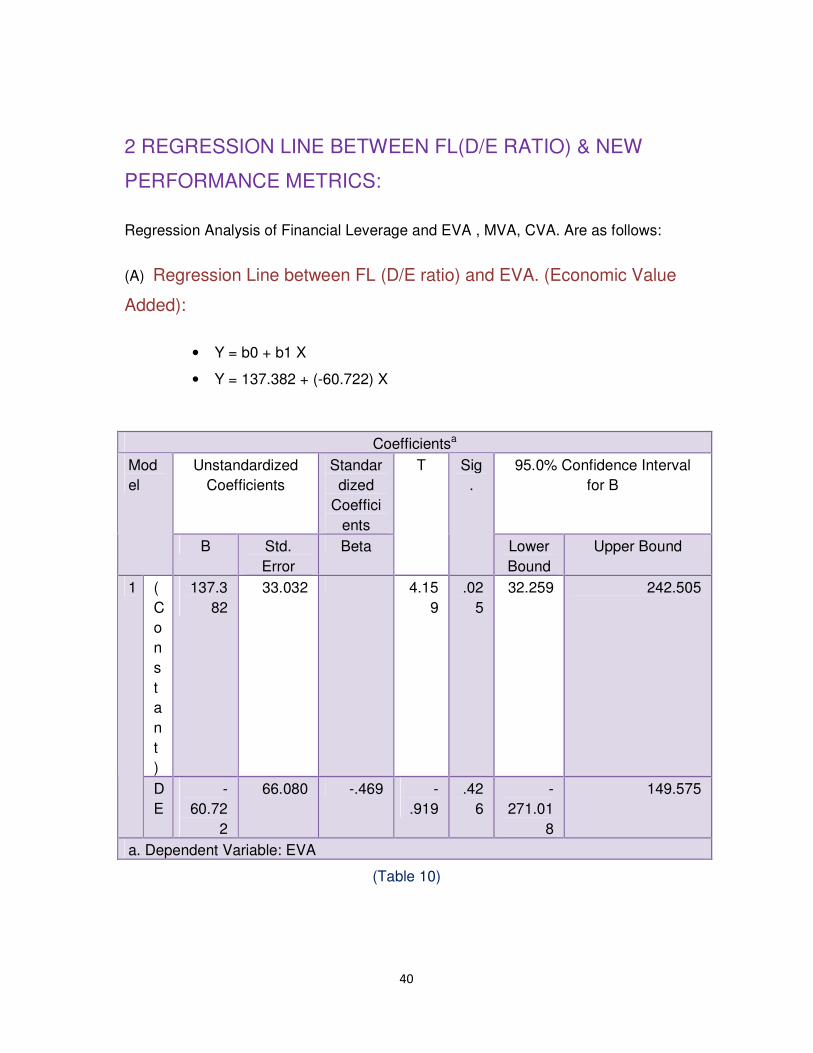
2 REGRESSION LINE BETWEEN FL(D/E RATIO) & NEW
PERFORMANCE METRICS:
Regression Analysis of Financial Leverage and EVA , MVA, CVA. Are as follows:
(A) Regression Line between FL (D/E ratio) and EVA. (Economic Value
Added):
• Y = b0 + b1 X
• Y = 137.382 + (-60.722) X
Coefficientsa
Unstandardized Coefficients
Standardized
Coefficients
95.0% Confidence Interval for B
Model
B Std. Error
Beta
T Sig.
Lower Bound
Upper Bound
(Constant)
137.382
33.032 4.159
.025
32.259 242.505 1
DE
-60.72
2
66.080 -.469 -.919
.426
-271.01
8
149.575
a. Dependent Variable: EVA
(Table 10)
41
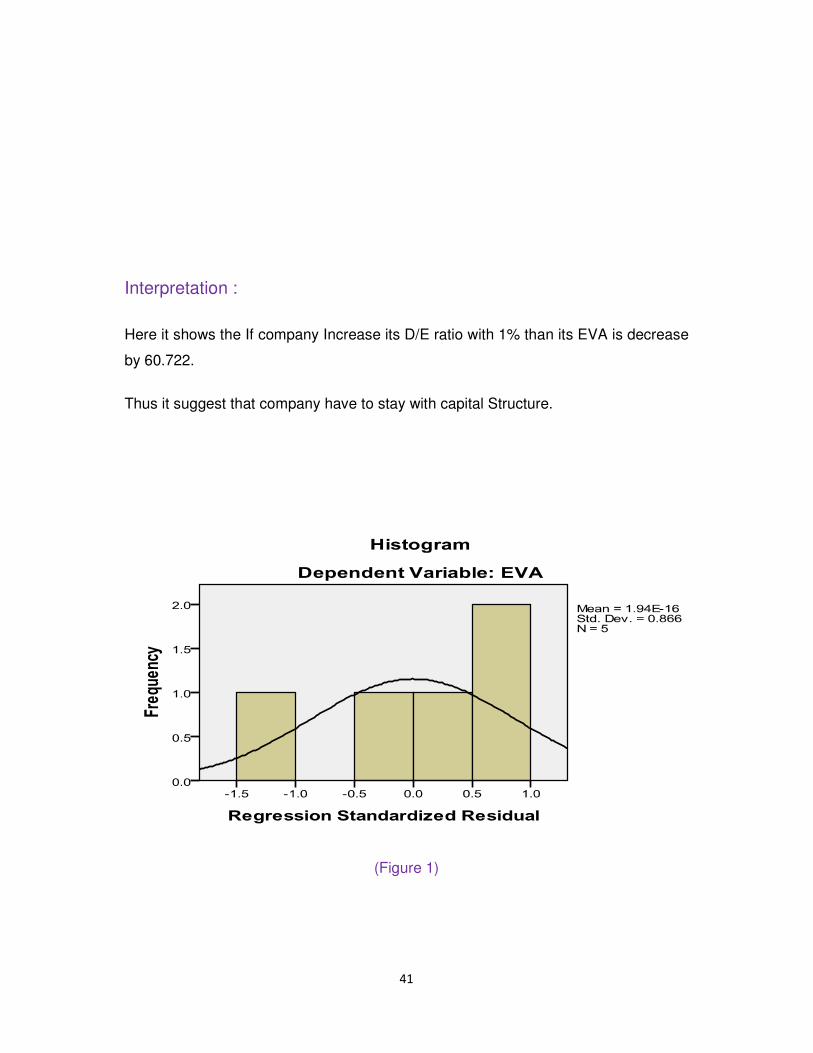
Interpretation :
Here it shows the If company Increase its D/E ratio with 1% than its EVA is decrease
by 60.722.
Thus it suggest that company have to stay with capital Structure.
(Figure 1)
42
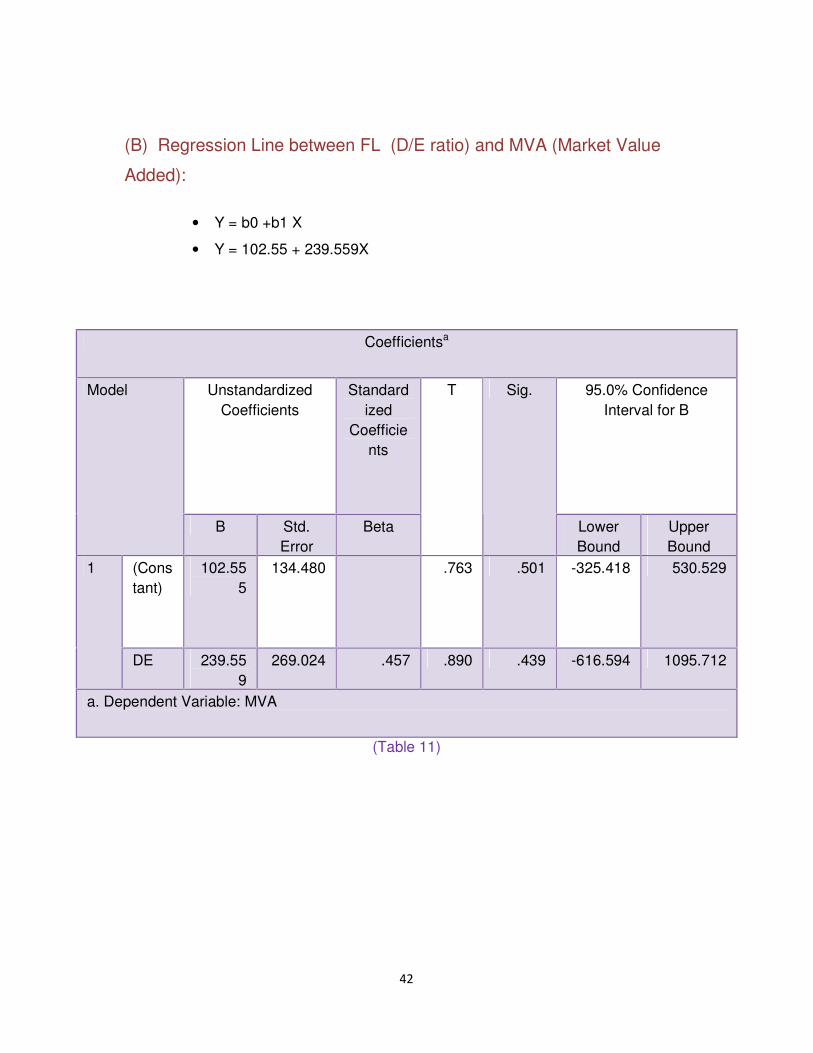
(B) Regression Line between FL (D/E ratio) and MVA (Market Value
Added):
• Y = b0 +b1 X
• Y = 102.55 + 239.559X
(Table 11)
Coefficientsa
Unstandardized Coefficients
Standardized
Coefficients
95.0% Confidence Interval for B
Model
B Std. Error
Beta
T Sig.
Lower Bound
Upper Bound
(Constant)
102.555
134.480 .763 .501 -325.418 530.529 1
DE 239.559
269.024 .457 .890 .439 -616.594 1095.712
a. Dependent Variable: MVA
43
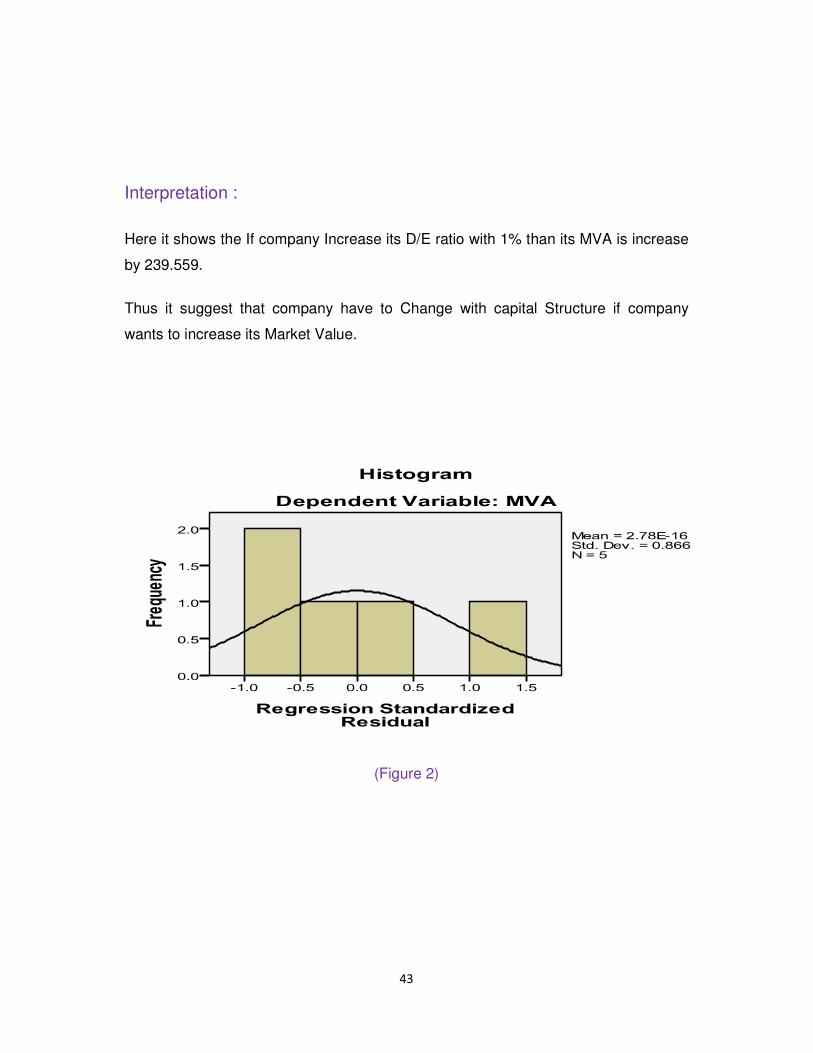
Interpretation :
Here it shows the If company Increase its D/E ratio with 1% than its MVA is increase
by 239.559.
Thus it suggest that company have to Change with capital Structure if company
wants to increase its Market Value.
(Figure 2)
44
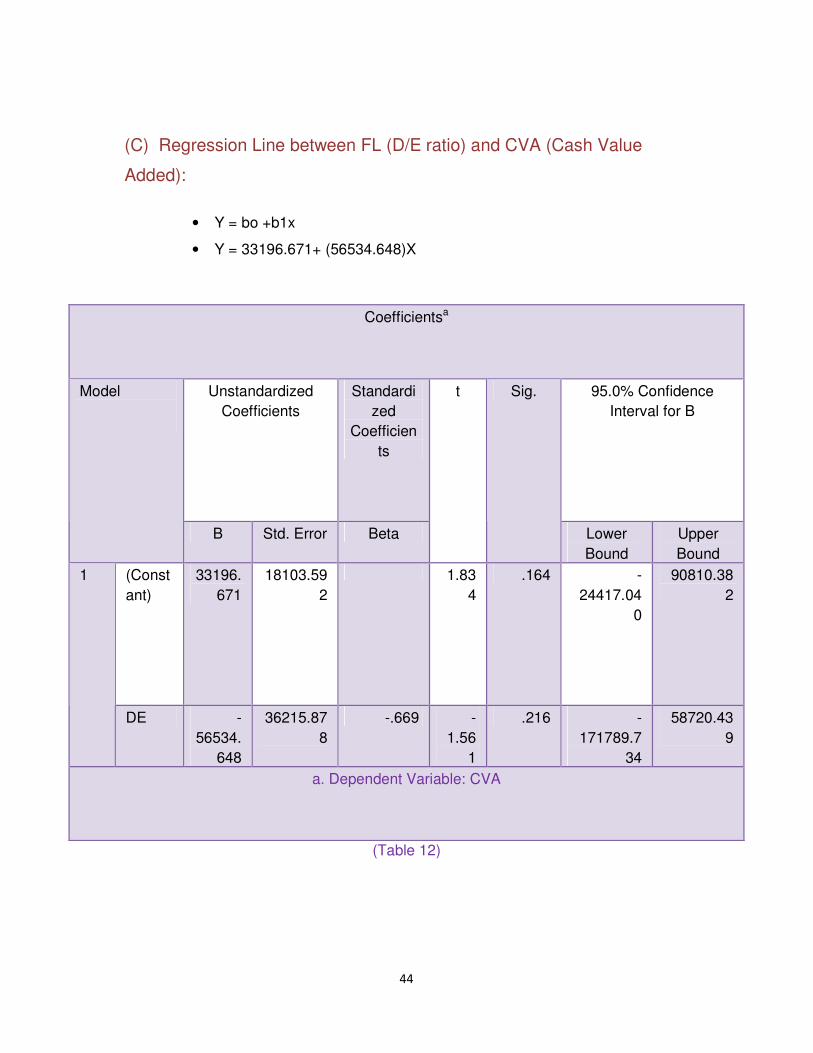
(C) Regression Line between FL (D/E ratio) and CVA (Cash Value
Added):
• Y = bo +b1x
• Y = 33196.671+ (56534.648)X
(Table 12)
Coefficientsa
Unstandardized Coefficients
Standardized
Coefficients
95.0% Confidence Interval for B
Model
B Std. Error Beta
t Sig.
Lower Bound
Upper Bound
(Constant)
33196.671
18103.592
1.834
.164 -24417.04
0
90810.382
1
DE -56534.
648
36215.878
-.669 -1.56
1
.216 -171789.7
34
58720.439
a. Dependent Variable: CVA
45
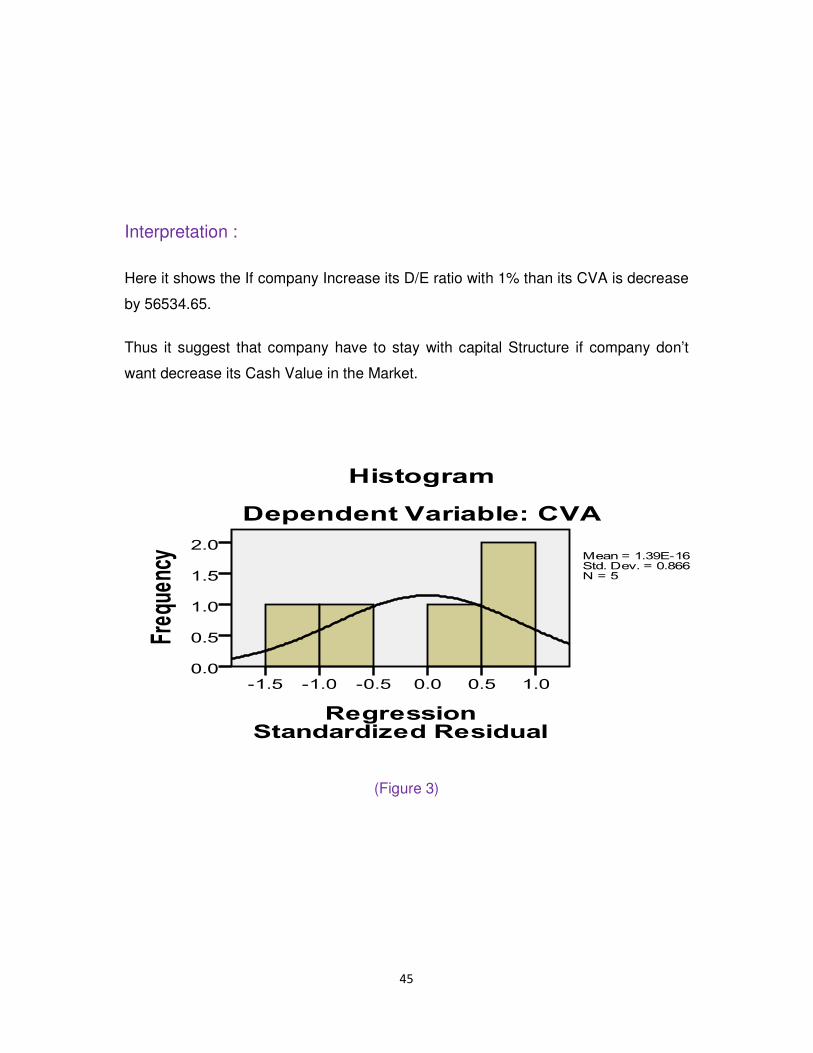
Interpretation :
Here it shows the If company Increase its D/E ratio with 1% than its CVA is decrease
by 56534.65.
Thus it suggest that company have to stay with capital Structure if company don’t
want decrease its Cash Value in the Market.
(Figure 3)
46
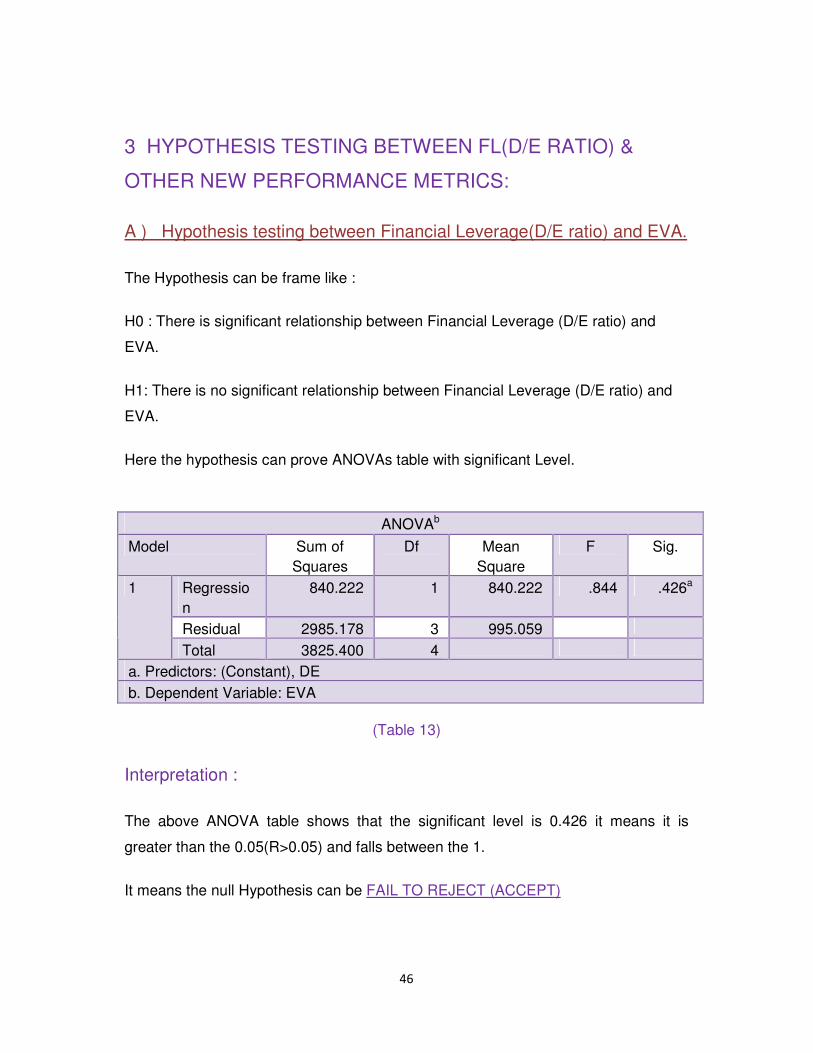
3 HYPOTHESIS TESTING BETWEEN FL(D/E RATIO) &
OTHER NEW PERFORMANCE METRICS:
A ) Hypothesis testing between Financial Leverage(D/E ratio) and EVA.
The Hypothesis can be frame like :
H0 : There is significant relationship between Financial Leverage (D/E ratio) and
EVA.
H1: There is no significant relationship between Financial Leverage (D/E ratio) and
EVA.
Here the hypothesis can prove ANOVAs table with significant Level.
ANOVAb
Model Sum of Squares
Df Mean Square
F Sig.
Regression
840.222 1 840.222 .844 .426a
Residual 2985.178 3 995.059
1
Total 3825.400 4
a. Predictors: (Constant), DE b. Dependent Variable: EVA
(Table 13)
Interpretation :
The above ANOVA table shows that the significant level is 0.426 it means it is
greater than the 0.05(R>0.05) and falls between the 1.
It means the null Hypothesis can be FAIL TO REJECT (ACCEPT)
47
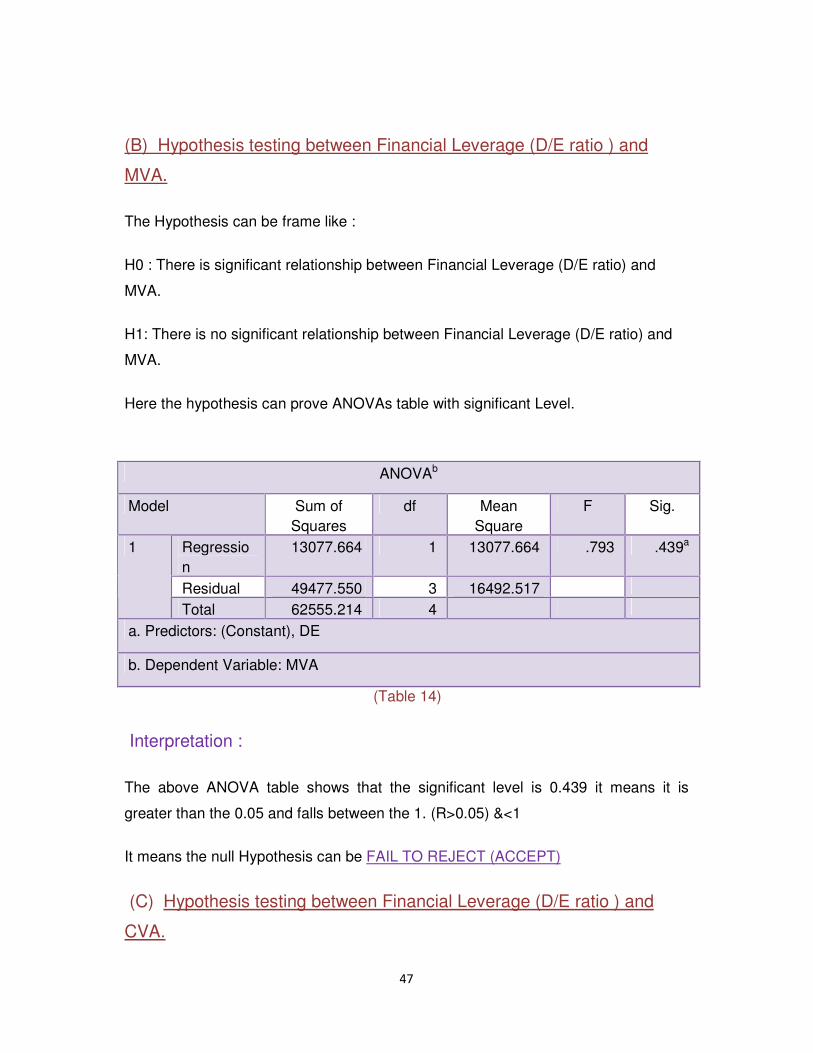
(B) Hypothesis testing between Financial Leverage (D/E ratio ) and
MVA.
The Hypothesis can be frame like :
H0 : There is significant relationship between Financial Leverage (D/E ratio) and
MVA.
H1: There is no significant relationship between Financial Leverage (D/E ratio) and
MVA.
Here the hypothesis can prove ANOVAs table with significant Level.
(Table 14)
Interpretation :
The above ANOVA table shows that the significant level is 0.439 it means it is
greater than the 0.05 and falls between the 1. (R>0.05) &<1
It means the null Hypothesis can be FAIL TO REJECT (ACCEPT)
(C) Hypothesis testing between Financial Leverage (D/E ratio ) and
CVA.
ANOVAb
Model Sum of Squares
df Mean Square
F Sig.
Regression
13077.664 1 13077.664 .793 .439a
Residual 49477.550 3 16492.517
1
Total 62555.214 4
a. Predictors: (Constant), DE
b. Dependent Variable: MVA
48
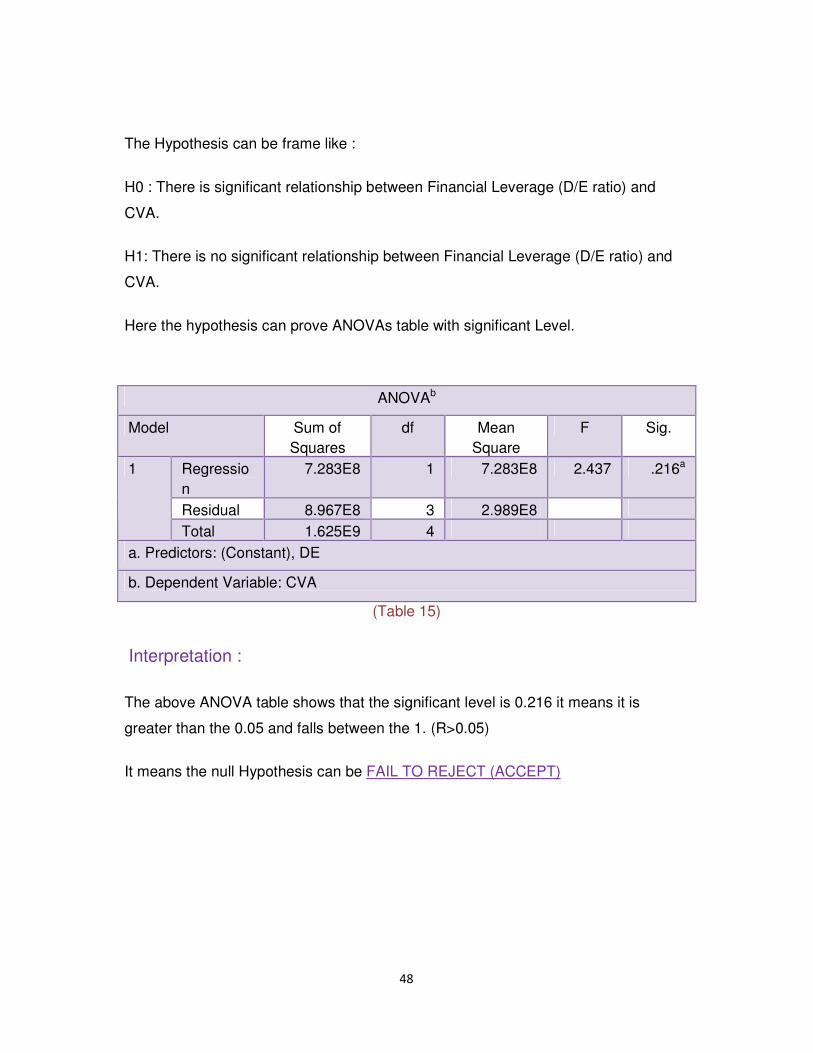
The Hypothesis can be frame like :
H0 : There is significant relationship between Financial Leverage (D/E ratio) and
CVA.
H1: There is no significant relationship between Financial Leverage (D/E ratio) and
CVA.
Here the hypothesis can prove ANOVAs table with significant Level.
(Table 15)
Interpretation :
The above ANOVA table shows that the significant level is 0.216 it means it is
greater than the 0.05 and falls between the 1. (R>0.05)
It means the null Hypothesis can be FAIL TO REJECT (ACCEPT)
ANOVAb
Model Sum of Squares
df Mean Square
F Sig.
Regression
7.283E8 1 7.283E8 2.437 .216a
Residual 8.967E8 3 2.989E8
1
Total 1.625E9 4
a. Predictors: (Constant), DE
b. Dependent Variable: CVA

49
CHAPTER 8
FINDINGS OF STUDY
50
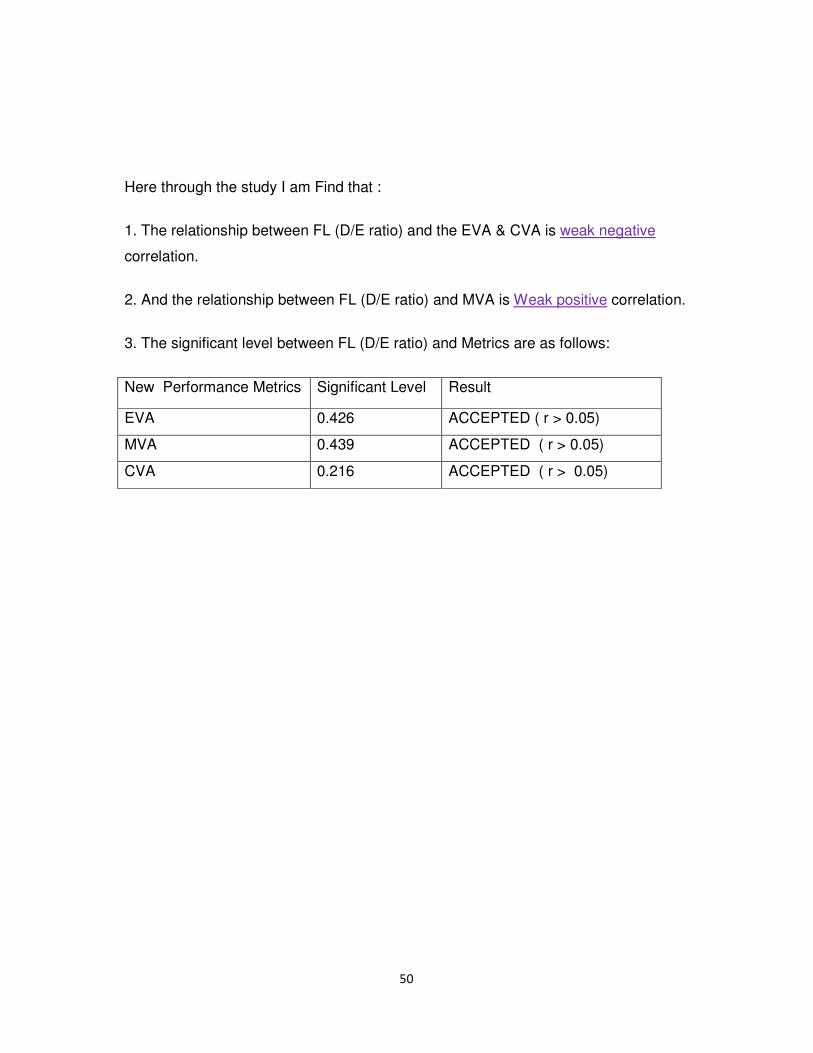
Here through the study I am Find that :
1. The relationship between FL (D/E ratio) and the EVA & CVA is weak negative
correlation.
2. And the relationship between FL (D/E ratio) and MVA is Weak positive correlation.
3. The significant level between FL (D/E ratio) and Metrics are as follows:
New Performance Metrics Significant Level Result
EVA 0.426 ACCEPTED ( r > 0.05)
MVA 0.439 ACCEPTED ( r > 0.05)
CVA 0.216 ACCEPTED ( r > 0.05)

51
CHAPTER 9
CONCLUSION OF STUDY
52
From the above Analysis it is conclude that:
*A vast literature investigates the implications of capital structure on firm’s value
since the seminal work of Modigliani and Miller (1958). Most of these studies
investigate these implications in the developed countries, very little is empirically
known about such implications in emerging or transition economies such Iran. The
study investigates the impact of capital structure on value of listed firms in Kalpataru
Power Transmission as one of emerging or transition economies.
* Based on a sample of Kalpataru Power Transmission and using THREE of creation
value measures of financial performance (EVA, MVA, and CVA), the empirical tests
indicate that capital structure (total debt /equity (D/E)) impacts negatively the firm’s
performance measured by EVA and CVA.
*On the other hand LEV no significant impact on firm’s value measured by MVA.
These results lead the study to conclude that capital structure, in general terms, has
weak-to-no influence on the financial performance of listed firms in Kalpataru Power
Transmission.
In short the conclusion of the study is:
1. Increase in D/E ratio Than increase in MVA
Î D/E RATIO Î MVA
2. Increase in D/E ratio than decrease in EVA, CVA
D/E RATIO Î EVA, CVA

53
BIBLIOGRAPHY
� By Khan M.Y.& Jain P. K., Financial Management, Tata McGraw-Hill
Publication Ltd, New Delhi, 6th Edition, 2007
� Chandra prasanna ,Financial Management, Tata McGraw – Hill Publication
Ltd, new Delhi, 8th Edition, 2011
� Annual Report of Kalpataru Power Transmission Ltd for year2011-2012,
2010-11, 2009-10 and 2008-9, 07-08.
http://economictimes.indiatimes.com/kalpataru-power-transmissions-
ltd/quotecompare/companyid-8534.cms as on 8th July 2012
http://www.evanomics.com/download/Intro.pdf as on 10th July 2012
http://www.kalpatarupower.com/images/kptl-ar-11-12.pdf as on 10th July 2012
http://pruss.narod.ru/Erik_CVA.pdf as on 11th July 2012
http://www.image-management.com/finance/EVA%20&%20MVA%20slides.pdf as on 11th
July 2012
http://economictimes.indiatimes.com/kalpataru-power-transmissions-ltd/balancesheet/companyid-
8534.cms as on 12th July 2012
54
Annxure
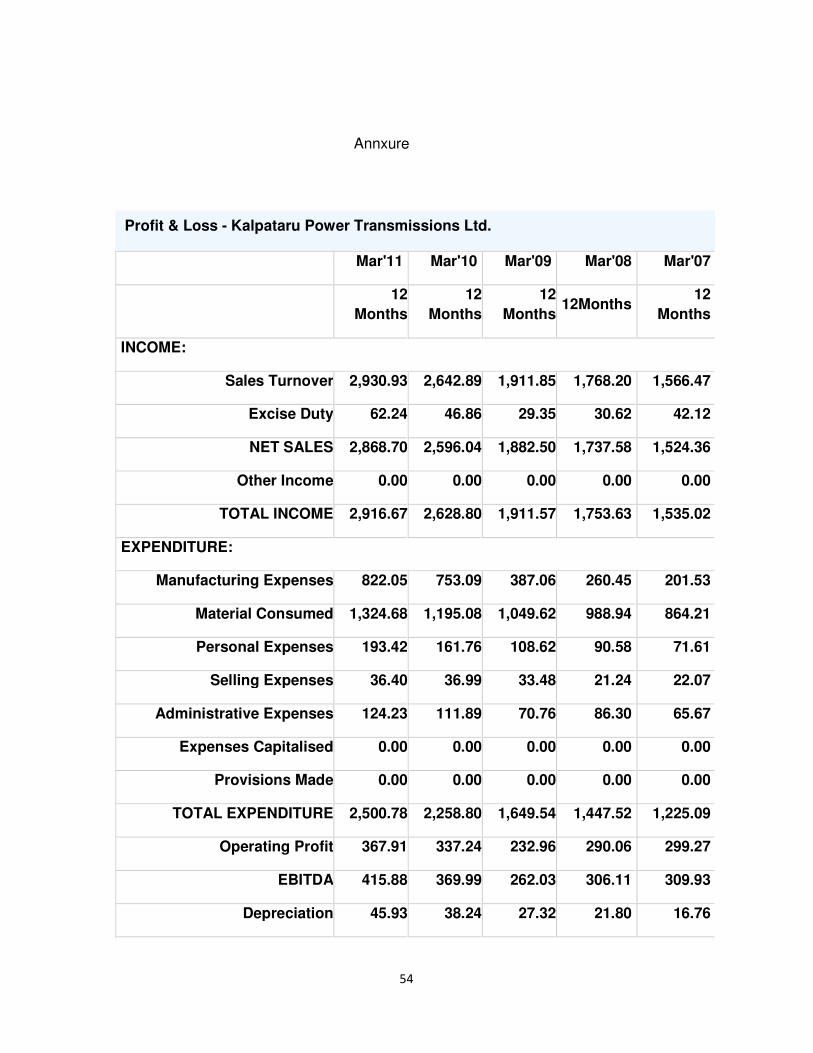
Profit & Loss - Kalpataru Power Transmissions Ltd.
Mar'11 Mar'10 Mar'09 Mar'08 Mar'07
12
Months
12
Months
12
Months 12Months
12
Months
INCOME:
Sales Turnover 2,930.93 2,642.89 1,911.85 1,768.20 1,566.47
Excise Duty 62.24 46.86 29.35 30.62 42.12
NET SALES 2,868.70 2,596.04 1,882.50 1,737.58 1,524.36
Other Income 0.00 0.00 0.00 0.00 0.00
TOTAL INCOME 2,916.67 2,628.80 1,911.57 1,753.63 1,535.02
EXPENDITURE:
Manufacturing Expenses 822.05 753.09 387.06 260.45 201.53
Material Consumed 1,324.68 1,195.08 1,049.62 988.94 864.21
Personal Expenses 193.42 161.76 108.62 90.58 71.61
Selling Expenses 36.40 36.99 33.48 21.24 22.07
Administrative Expenses 124.23 111.89 70.76 86.30 65.67
Expenses Capitalised 0.00 0.00 0.00 0.00 0.00
Provisions Made 0.00 0.00 0.00 0.00 0.00
TOTAL EXPENDITURE 2,500.78 2,258.80 1,649.54 1,447.52 1,225.09
Operating Profit 367.91 337.24 232.96 290.06 299.27
EBITDA 415.88 369.99 262.03 306.11 309.93
Depreciation 45.93 38.24 27.32 21.80 16.76
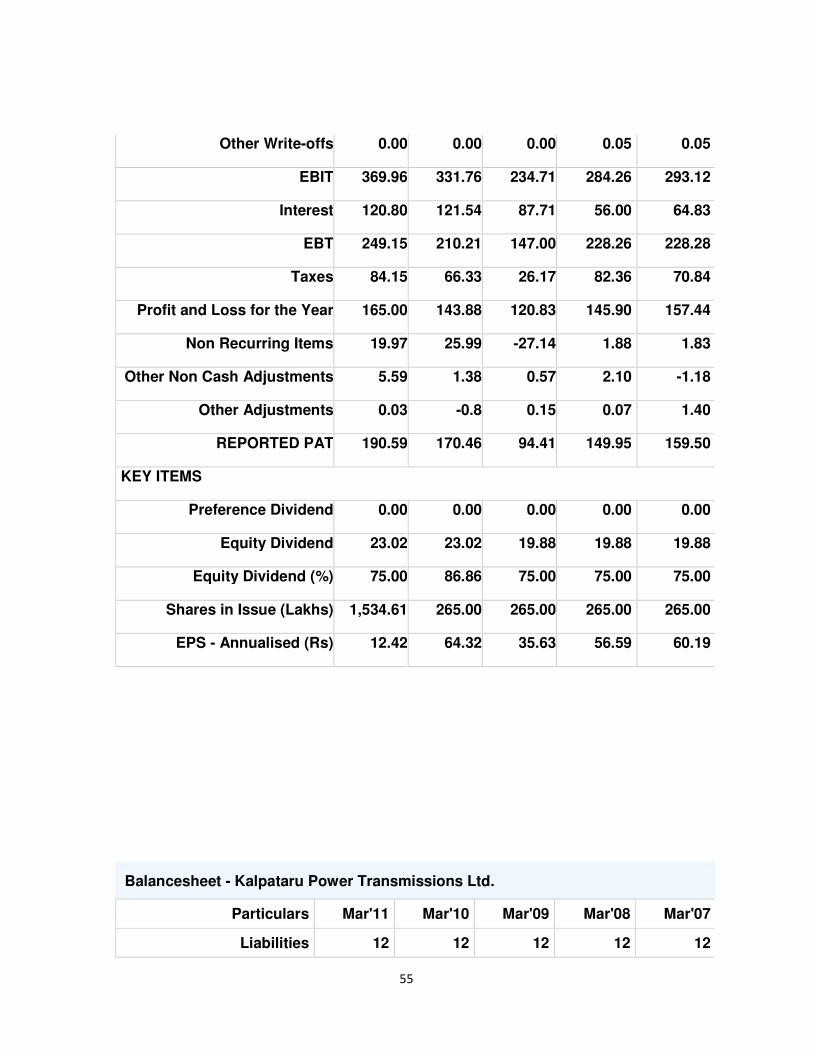
55
Other Write-offs 0.00 0.00 0.00 0.05 0.05
EBIT 369.96 331.76 234.71 284.26 293.12
Interest 120.80 121.54 87.71 56.00 64.83
EBT 249.15 210.21 147.00 228.26 228.28
Taxes 84.15 66.33 26.17 82.36 70.84
Profit and Loss for the Year 165.00 143.88 120.83 145.90 157.44
Non Recurring Items 19.97 25.99 -27.14 1.88 1.83
Other Non Cash Adjustments 5.59 1.38 0.57 2.10 -1.18
Other Adjustments 0.03 -0.8 0.15 0.07 1.40
REPORTED PAT 190.59 170.46 94.41 149.95 159.50
KEY ITEMS
Preference Dividend 0.00 0.00 0.00 0.00 0.00
Equity Dividend 23.02 23.02 19.88 19.88 19.88
Equity Dividend (%) 75.00 86.86 75.00 75.00 75.00
Shares in Issue (Lakhs) 1,534.61 265.00 265.00 265.00 265.00
EPS - Annualised (Rs) 12.42 64.32 35.63 56.59 60.19
Balancesheet - Kalpataru Power Transmissions Ltd.
Particulars Mar'11 Mar'10 Mar'09 Mar'08 Mar'07
Liabilities 12 12 12 12 12
56
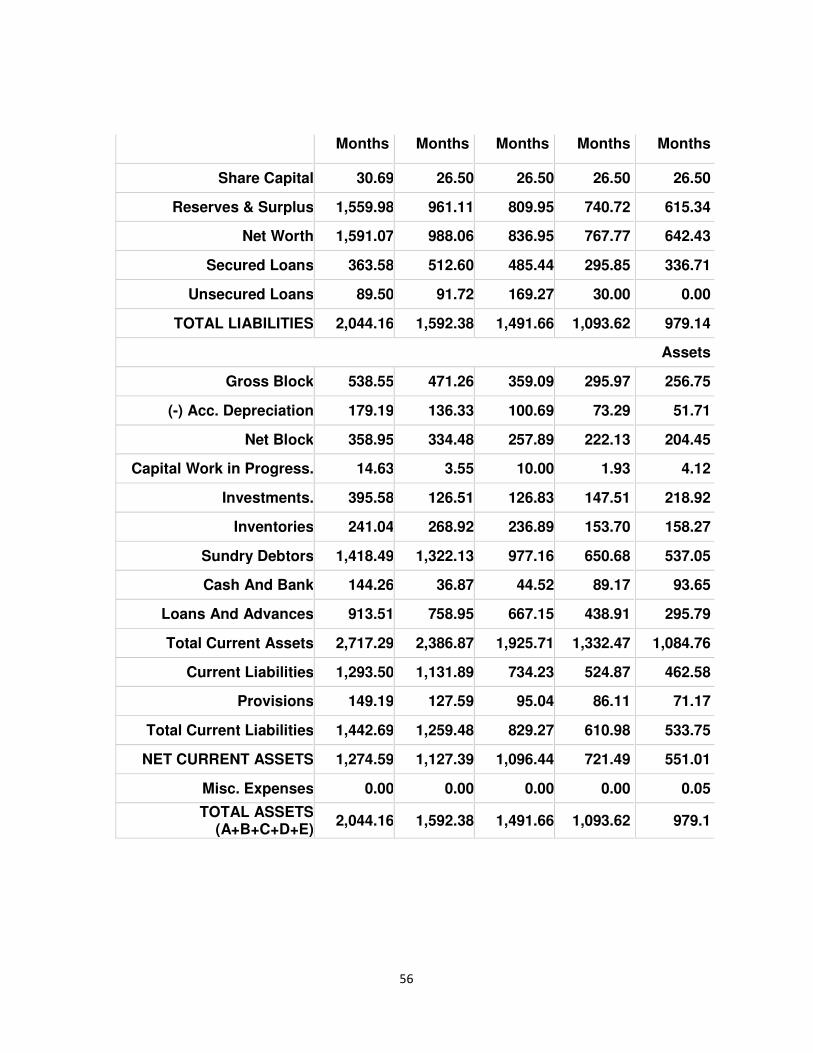
Months Months Months Months Months
Share Capital 30.69 26.50 26.50 26.50 26.50
Reserves & Surplus 1,559.98 961.11 809.95 740.72 615.34
Net Worth 1,591.07 988.06 836.95 767.77 642.43
Secured Loans 363.58 512.60 485.44 295.85 336.71
Unsecured Loans 89.50 91.72 169.27 30.00 0.00
TOTAL LIABILITIES 2,044.16 1,592.38 1,491.66 1,093.62 979.14
Assets
Gross Block 538.55 471.26 359.09 295.97 256.75
(-) Acc. Depreciation 179.19 136.33 100.69 73.29 51.71
Net Block 358.95 334.48 257.89 222.13 204.45
Capital Work in Progress. 14.63 3.55 10.00 1.93 4.12
Investments. 395.58 126.51 126.83 147.51 218.92
Inventories 241.04 268.92 236.89 153.70 158.27
Sundry Debtors 1,418.49 1,322.13 977.16 650.68 537.05
Cash And Bank 144.26 36.87 44.52 89.17 93.65
Loans And Advances 913.51 758.95 667.15 438.91 295.79
Total Current Assets 2,717.29 2,386.87 1,925.71 1,332.47 1,084.76
Current Liabilities 1,293.50 1,131.89 734.23 524.87 462.58
Provisions 149.19 127.59 95.04 86.11 71.17
Total Current Liabilities 1,442.69 1,259.48 829.27 610.98 533.75
NET CURRENT ASSETS 1,274.59 1,127.39 1,096.44 721.49 551.01
Misc. Expenses 0.00 0.00 0.00 0.00 0.05
TOTAL ASSETS (A+B+C+D+E)
2,044.16 1,592.38 1,491.66 1,093.62 979.1