Spaceborne canopy LiDAR measurements for the constraints
of terrestrial carbon budgetHideki Kobayashi
Japan Agency for Marine‐Earth Science and Technology
Hideki KobayashiJapan Agency for Marine‐Earth
Science and Technology
International Workshop on Vegetation Lidar and Application from Space 2017 May 26, 2017 at Chiba University, Sho‐in Hall

Acknowledgement
•
JSPS grant in aid for scientific research, Kiban‐B (16H02948)
•
Japanese Ministry of Environment, the Environment Research and Technology Development Fund, 2RF1601
•
JAXA GCOM‐C RA6 #111•
Drs. Wei Yang, Masato Hayashi, Ryuichi Hirata,
Nobuko Saigusa and Ms. Kyoko Ikeda

Rogers et al., New Phytologist ,2017
The recommendation on the improvement
of terrestrial biosphere models

Phenology from NDVI
Low
High Sun‐Induced Chlorophyll Fluorescence, SIF (NIES‐GOSAT team Drs. Oshio, Yoshida, Noda)

Global leaf area index (MODIS, GCOM‐C)
Global canopy height (ICESat/GLAS), Simard et al., 2010

Rogers et al., New Phytologist ,2017
Remote sensing data and terrestrial biosphere models
•
Remote sensing observations can be used for terrestrial biosphere model parameterizations and
the interactions of plant and environment over the continental scale
•
Improvement of radiative transfer contributes to improve the representation of the light
environment and computation of carbon fluxes•
LiDAR observations, such as MOLI and GEDI, can
be used to constrain forest structures

Global radiative transfer scheme with LiDAR observations
Canopy height
Tree Density
# of tree ineach quadrat
X-Y Coordinate
Canopy height (Max and Min)
Canopy Height
DBHCrown Radius/Length
Neyman /Possiondistribution Weibull distribution
Simplified forest structure model (Yang et al., submitted)
Tree density (Crowther et al., Nature 2015)
Global RT run

Validation and calibration of the forest landscape by airborne LiDAR
Aerial photographAt FKH AsiaFlux site
DCHM
Crown maps
comparison

Global APAR simulated by 3D RT
(μmol m‐2
s‐1)
Incident PAR fAPAR
Input satellite data:‐Aerosol AOT‐LAI‐LiDAR canopy height‐Tree density
Currently, the forest structures are fixed
for each biome. In the future, when LiDAR
data are available, we can set the
appropriate representation of forest
structure in each grid and run the model
August, 2009

How much forest structure affects the canopy photosynthesis?
Guanter et al., PNAS 2014
Sun‐induced Chlorophyll Fluorescence

Data application schemes
Global leaf area index
Global canopy height
Tree density
RT SIF (RT simulation)
Sunlit
Shaded
Floor
Downscaling toleaf leaf levelproperties
Data
Satellite‐SIF
Validation
Terrestrial biosphere model

3D radiative transfer simulation3D radiative transfer simulation
Diffuse PAR
13
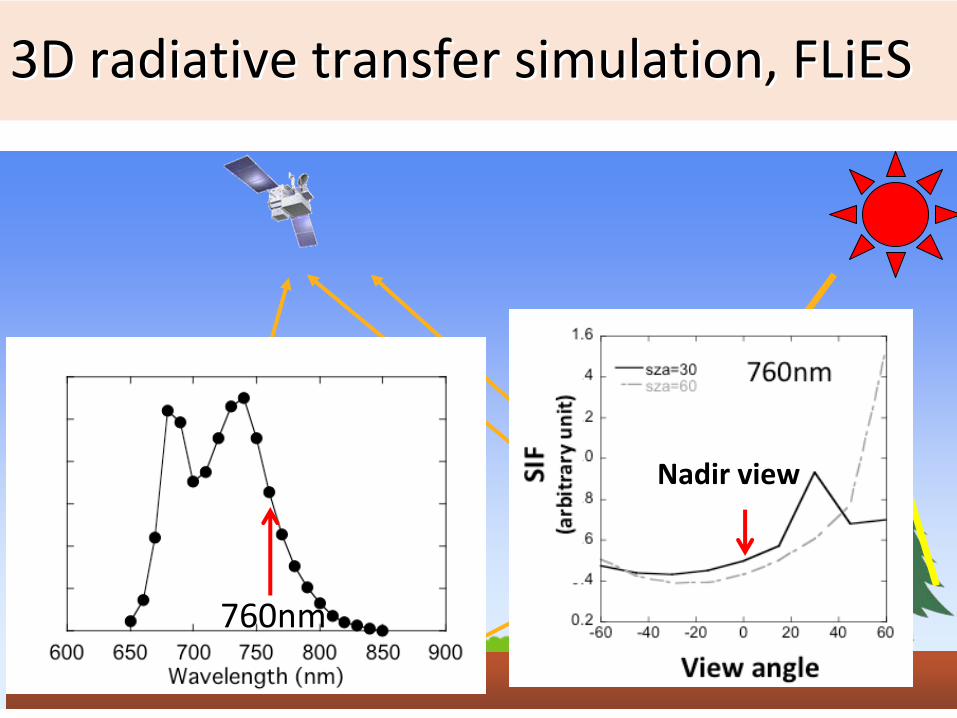
3D radiative transfer simulation, FLiES3D radiative transfer simulation, FLiES
Diffuse PAR
14
Nadir view
760nm

SimulatioSimulation conditionsn conditionsLeaf‐level fluorescence yield
1. 3D no shoot clumping2. 3D shoot clumping (γ=1.67)
3. 1D spherical leaf angle dist.
4. 1D erectrophle leaf angle dist.5. 1D planophle leaf angle dist.
All LAI = 3.5
0.0050
0.0025
0.0075
0.0100
<10mE
F
G
10‐15m>15m
fluorescence yield

Diurnal SIFDiurnal SIF
Clear day43%
19%
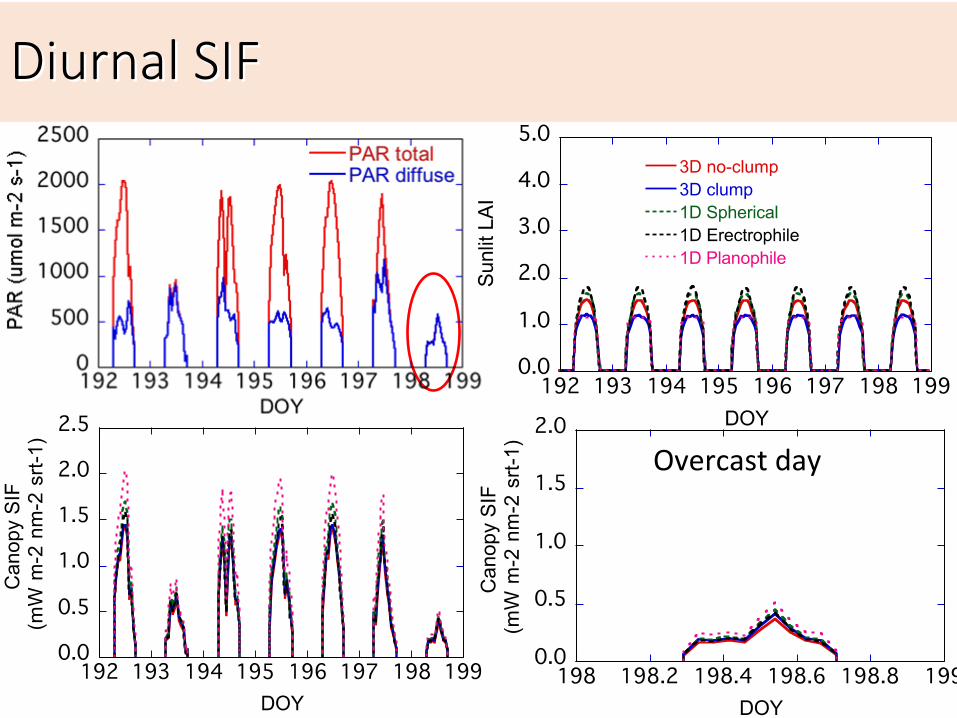
Diurnal SIFDiurnal SIF
Overcast day

Contribution of Contribution of ssun/shade SIFun/shade SIF
1D Spherical 1D Planophile
3D no clump100
80
60
40
20
0
%3D with shoot clump
100
80
60
40
20
0
%
1D Erectrophile100
80
60
40
20
0
%
Multiple scatterings100
80
60
40
20
0
%
3D no clump

SIF
Low
High
GOSAT‐SIF
SIF simulated by RT model
MOE‐ERTDF 2RF1601
Low
High

Summary
•
Forest structure does matter to compute canopy scale SIF (and thus photosynthesis)
•
LiDAR
based canopy height is one of the essential variables to characterize the forest structure
•
Preparing a model‐data scheme to take advantage of using LiDAR
data from MOLI and GEDI
•
Collection of airborne LiDAR
data is also necessary to validate the forest structure and spaceborne
canopy height