Interest Groups and Political Economy of Public Education Spending
Ece H. Guleryuz
Istanbul 29 Mayis University
Abstract
This paper examines the relationship between the lobbying power of different interest groups and public education spending in
a panel data estimation during the period 1996-2009 for 132 countries. The resource rents, manufacture exports, and agriculture
value added are used as proxy variables for the lobbying power of the natural resource owners, manufacturers, and landowners,
respectively, in order to substantiate the definition of the lobbying power of the interest groups more with economic fundamentals.
As lobbying power is mediated through political institutions, different governance indicators are used individually and in
interaction terms with the proxy variables in the estimations. It is found that when the country is more politically stable and the
more the rule of law applies, the negative (positive) effect of the lobbying power of natural resource owners (manufacturers) on
public education spending intensifies. The negative effect of landowners’ lobbying power diminishes as institutional quality as
measured by governance indicators improves. .
Keywords: Public education spending, Human capital, Lobbying power, Interest groups, Governance indicators.
JEL Classifications: I25, O13, O15, O43, P16, Q00
Assistant Professor of Economics, Department of Economics, Istanbul 29 Mayis University (E-mail:

I. INTRODUCTION
The Industrial Revolution marked the start of a long series of social and economic
transformations leading to substantial divergence across countries in terms of income per capita,
economic development, and political and economic institutions. The period of industrialization
both intensified social class stratification by creating new classes and increased the demand for
human capital, a complementary factor of production to physical capital. Due to credit market
imperfections, public education spending has become the primary tool for human capital
accumulation to maintain sustainable economic growth (Galor et al., 2009, Lagerlof and
Tangeras, 2008). Nonetheless, human capital may not be as beneficial for some sectors in the
economy, and the interest groups who operate in these sectors as the owners of primary factors
of production would not support human capital accumulation through public education
(Acemoglu and Robinson, 2000). For instance, Galor et al. (2009) argue that given the low level
of complementarity between human capital and land, increases in human capital reduce the return
to land as labor migrates from the agricultural sector to the manufacturing sector. When they
have political power, the landowners would choose to invest little, if at all, in public education
unless they also earn returns from the industrial sector.
In this paper we examine the relationship between lobbying power of various interest groups
and public education spending in a panel data estimation during the period 1996-2009 for 132
countries. Furthermore, as lobbying power is mediated through political institutions, we explore
how different governance indicators affect the overall impact of the lobbying power of interest
groups on public education spending.
The choice of the production sectors and interest group stratification is based on the multi-
sector, multi-class models in Acemoglu and Robinson (2006a, 2006b), and Galor et al. (2009).
In this paper, we model three sectors: the natural resource, manufacturing, and agriculture
sectors. Hence, the three interest groups whose economic power and relative political influence
on public education spending are investigated are the natural resource owners, manufacturers and
landowners. In this paper we do not define workers as a separate interest group assuming that the
members of the three interest groups; natural resource owners, manufacturers, and landowners;
both work and own factors of production in their corresponding sectors.
Different aspects of the link between economic sectors and growth have been analyzed in detail
in the literature. Matsuyama (1992) examines the relationship between agricultural productivity
and economic growth in a two-sector model, and argues that agricultural productivity has a
positive effect on economic growth in a closed economy, but in the case of a small open economy
there is a negative relationship between agricultural productivity and economic growth. In his
model, he does not differentiate between an agriculture sector and a natural resource sector.
Lagerlof and Tangeras (2008) analyze the trade-off between rent seeking activities, such as
resource competition or land conquest, and productive activities, such as trade or manufacturing,
which use human capital as a factor of production. They show that a rise in the availability of
natural resources increases rent seeking activities and reduces human capital productivity, and is
harmful for economic growth in the crucial takeoff period. Bourguignon and Verdier (2000)
explore in a political economy model the conditions under which the educated oligarchy chooses
to invest in the education of the poor, and so initiates a transition to democracy by integrating the
educated poor into the political participation process.
Empirical studies on the determinants of public education spending highlight various aspects.
Busemeyer (2007) examines the determinants of public education spending in 21 OECD
countries in a pooled time-series analysis. The control variables used include the degree of tax
revenue decentralization, veto index, and cabinet shares of social democrats, Christian
democrats, and conservatives. In a study of the determinants of public education spending in the
US states, Poterba (1997) highlights the importance of the effect of demographic composition on
the level of per-child education spending.
The main results we obtain in what follows are that the lobbying power of natural resource
owners and landowners has a direct negative effect on public education spending, whereas the
lobbying power of manufacturers exerts a positive one. Moreover, the quality of different
dimensions of governance and institutions plays a significant role in determining the overall net
effect of the lobbying power of different interest groups on public education spending. The rest
of the paper is organized as follows. Section II describes the data set and the econometric strategy.
Section III discusses estimation results, section IV talks about the robustness check measures of
the empirical results, and section V presents concluding remarks.
II. ECONOMETRIC STRATEGY AND DATA DETAILS
The main hypothesis proposed in this paper follows from the multi-social class theoretical
models of Acemoglu (2008), Acemoglu and Robinson (2006a). Interest groups are classified
according to the type of economic activity from which they generate their income, their wealth
composition, and their ownership of factors of production in distinguished sectors. As a result,
economic interests and preferences of different interest groups diverge. When one interest
group’s economic contribution to the aggregate output increases, that group gains in political
power relative to other groups, and social and economic policy decisions increasingly reflect that
group’s economic interests. We identify interest groups’ political power as de facto political
power. De facto political power can emerge as an outcome of the ability of solving collective
action problem, or having resources to hire own armies and supporters, or using financial
resources for lobbying and bribing activities (Acemoglu, 2008). In this paper, we adopt the third
outcome, and so define the de facto political power as lobbying power.
Therefore, relative economic contribution to the aggregate output maps into relative political
influence and lobbying power in the society. The differences in economic and social policy
choices generate variations in public education spending levels. Economic contribution to
aggregate output and distribution of resources determine distribution of de facto political power.
Since institutions mediate as the intermediate channel between lobbying power and policy
outcomes we examine how different governance indicators affect the overall impact of social
classes’ lobbying power on public education spending. Figure 1 explains these theoretical
foundations in the following:
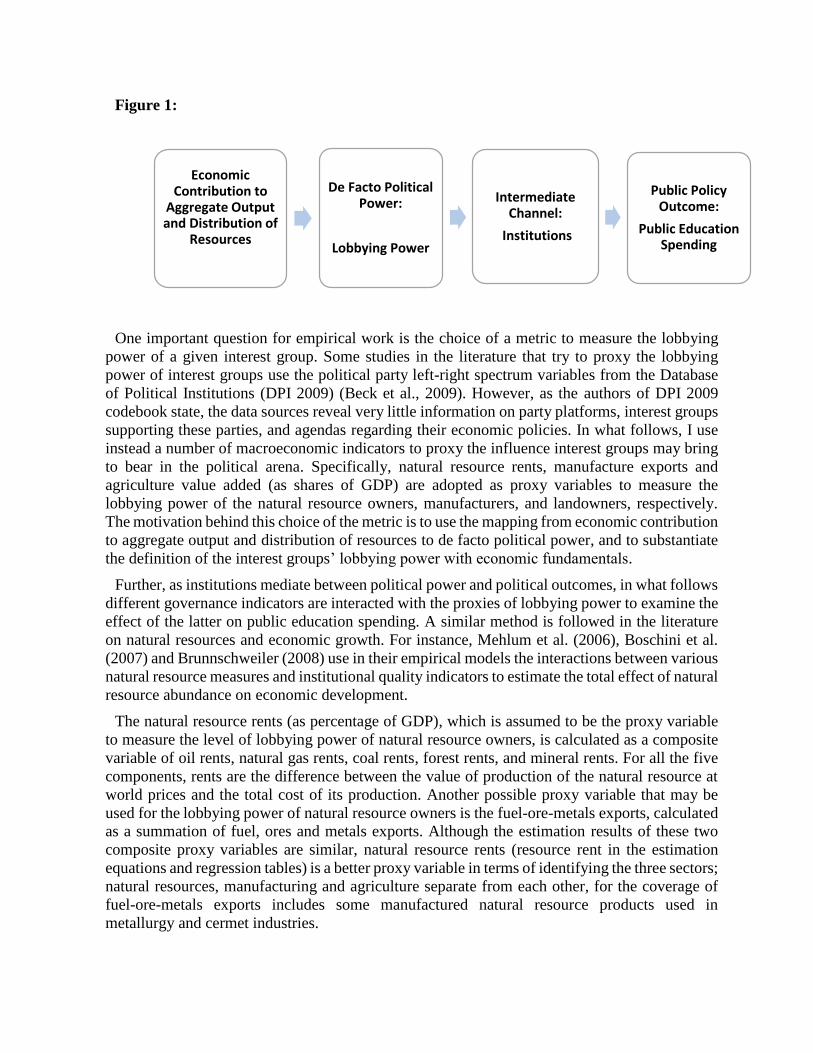
Figure 1:
One important question for empirical work is the choice of a metric to measure the lobbying
power of a given interest group. Some studies in the literature that try to proxy the lobbying
power of interest groups use the political party left-right spectrum variables from the Database
of Political Institutions (DPI 2009) (Beck et al., 2009). However, as the authors of DPI 2009
codebook state, the data sources reveal very little information on party platforms, interest groups
supporting these parties, and agendas regarding their economic policies. In what follows, I use
instead a number of macroeconomic indicators to proxy the influence interest groups may bring
to bear in the political arena. Specifically, natural resource rents, manufacture exports and
agriculture value added (as shares of GDP) are adopted as proxy variables to measure the
lobbying power of the natural resource owners, manufacturers, and landowners, respectively.
The motivation behind this choice of the metric is to use the mapping from economic contribution
to aggregate output and distribution of resources to de facto political power, and to substantiate
the definition of the interest groups’ lobbying power with economic fundamentals.
Further, as institutions mediate between political power and political outcomes, in what follows
different governance indicators are interacted with the proxies of lobbying power to examine the
effect of the latter on public education spending. A similar method is followed in the literature
on natural resources and economic growth. For instance, Mehlum et al. (2006), Boschini et al.
(2007) and Brunnschweiler (2008) use in their empirical models the interactions between various
natural resource measures and institutional quality indicators to estimate the total effect of natural
resource abundance on economic development.
The natural resource rents (as percentage of GDP), which is assumed to be the proxy variable
to measure the level of lobbying power of natural resource owners, is calculated as a composite
variable of oil rents, natural gas rents, coal rents, forest rents, and mineral rents. For all the five
components, rents are the difference between the value of production of the natural resource at
world prices and the total cost of its production. Another possible proxy variable that may be
used for the lobbying power of natural resource owners is the fuel-ore-metals exports, calculated
as a summation of fuel, ores and metals exports. Although the estimation results of these two
composite proxy variables are similar, natural resource rents (resource rent in the estimation
equations and regression tables) is a better proxy variable in terms of identifying the three sectors;
natural resources, manufacturing and agriculture separate from each other, for the coverage of
fuel-ore-metals exports includes some manufactured natural resource products used in
metallurgy and cermet industries.
Economic Contribution to
Aggregate Output and Distribution of
Resources
De Facto Political Power:
Lobbying Power
Intermediate Channel:
Institutions
Public Policy Outcome:
Public Education Spending
Manufacture exports are used to proxy the lobbying power that the manufacturers possess.
Another possible macroeconomic indicator for this purpose is manufacturing value added.
Manufacture exports broadly cover chemicals, basic manufactures, machinery and transport
equipment, and miscellaneous manufactured goods, while manufacturing value added includes
manufactures of agricultural products, hence if manufacturing value added was used as the proxy
variable there would be an overlap between the manufacturing sector and agriculture sector.
Therefore, manufacture exports provide a better representation of the manufacturing sector.
Agriculture value added, the assumed proxy variable to measure the lobbying power that the
landowners possess, includes the value added amounts of hunting, fishing, cultivation of
agricultural crops, and livestock production. Another possible indicator that could have
potentially been used as a proxy would have been agricultural raw materials exports, but this
variable only includes crude materials, so its coverage is not as good as the coverage of
agriculture value added in terms of representing the agriculture sector production in an accurate
and comprehensive way.
There are five governance quality indicators, political stability-absence of violence
(politicalstability in regression tables), regulatory quality (regquality in regression tables), rule
of law (ruleoflaw in regression tables), corruption control (corruption in regression tables), and
government effectiveness (govteffectiveness in regression tables), used in regressions as control
variables individually and as a component of interaction terms with the proxy variables. Political
stability-absence of violence measures the probability that the government will be destabilized
or overthrown by unconstitutional or violent means. Regulatory quality captures perceptions of
the ability of the government to formulate and implement policies and regulations which favor
private sector development. Rule of law covers issues such as the nature of contract enforcement,
property rights, quality of law enforcement through security and courts. Corruption control
measures the probability that public power is exercised for private gain for elites. Government
effectiveness captures perceptions of the quality of public services, and credibility of the
government’s commitment to policies (Kaufmann et al., 2011). In the regressions, the lobbying
power of the interest groups is allowed to affect public education spending both directly and
through the channel of governance indicators. In the related literature the rule of law is often used
to capture institutional quality (Brunnschweiler, 2008 and Bulte et al., 2005). The main purpose
in these studies is to explore the effect of natural resource abundance on development and
economic growth in countries with differing institutional quality levels. On the other hand, the
five governance indicators identify different dimensions of the governance rules and institutions
through which the authority and policies are exercised in a country. Therefore, the lobbying
power of each of the three interest groups may interact with each of the governance indicators,
and so affect public education spending in a different way. Thus, for the purposes of this paper
it is useful to employ different governance indicators in the regressions.
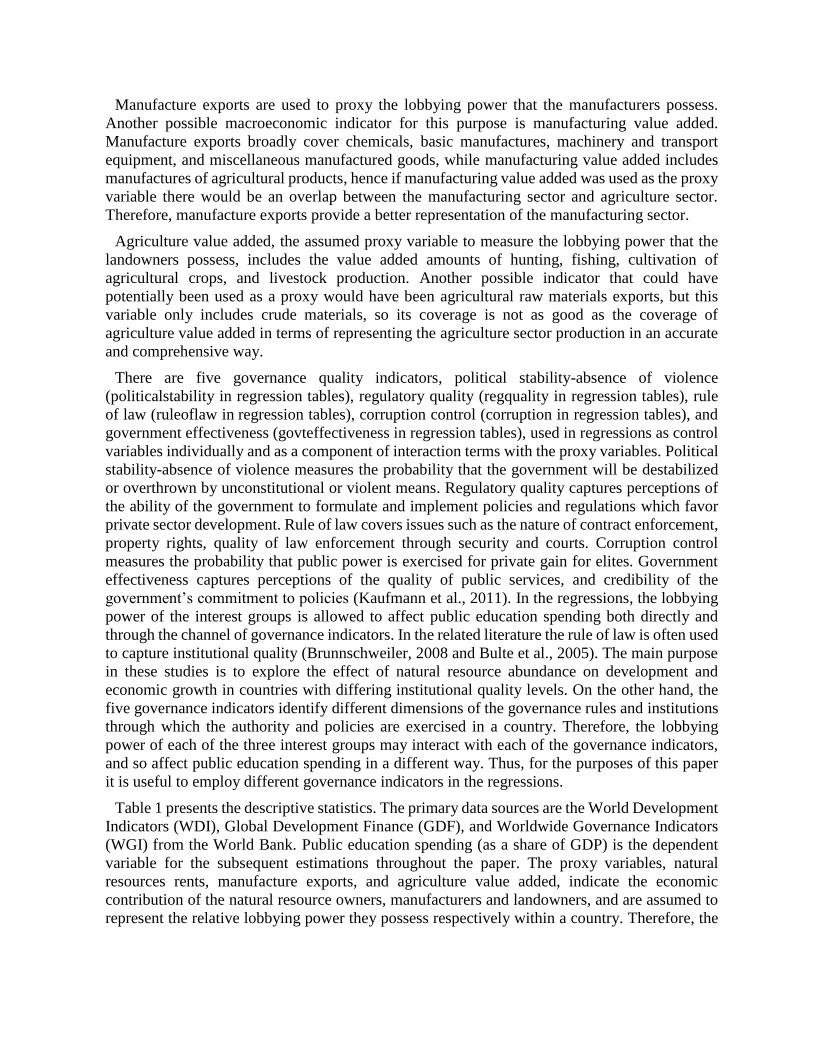
Table 1 presents the descriptive statistics. The primary data sources are the World Development
Indicators (WDI), Global Development Finance (GDF), and Worldwide Governance Indicators
(WGI) from the World Bank. Public education spending (as a share of GDP) is the dependent
variable for the subsequent estimations throughout the paper. The proxy variables, natural
resources rents, manufacture exports, and agriculture value added, indicate the economic
contribution of the natural resource owners, manufacturers and landowners, and are assumed to
represent the relative lobbying power they possess respectively within a country. Therefore, the
main assumption here is that as an interest group’s economic contribution to the aggregate output
and portion of its resources increase, its political influence and lobbying power in the society also
increases as explained in Figure 1.
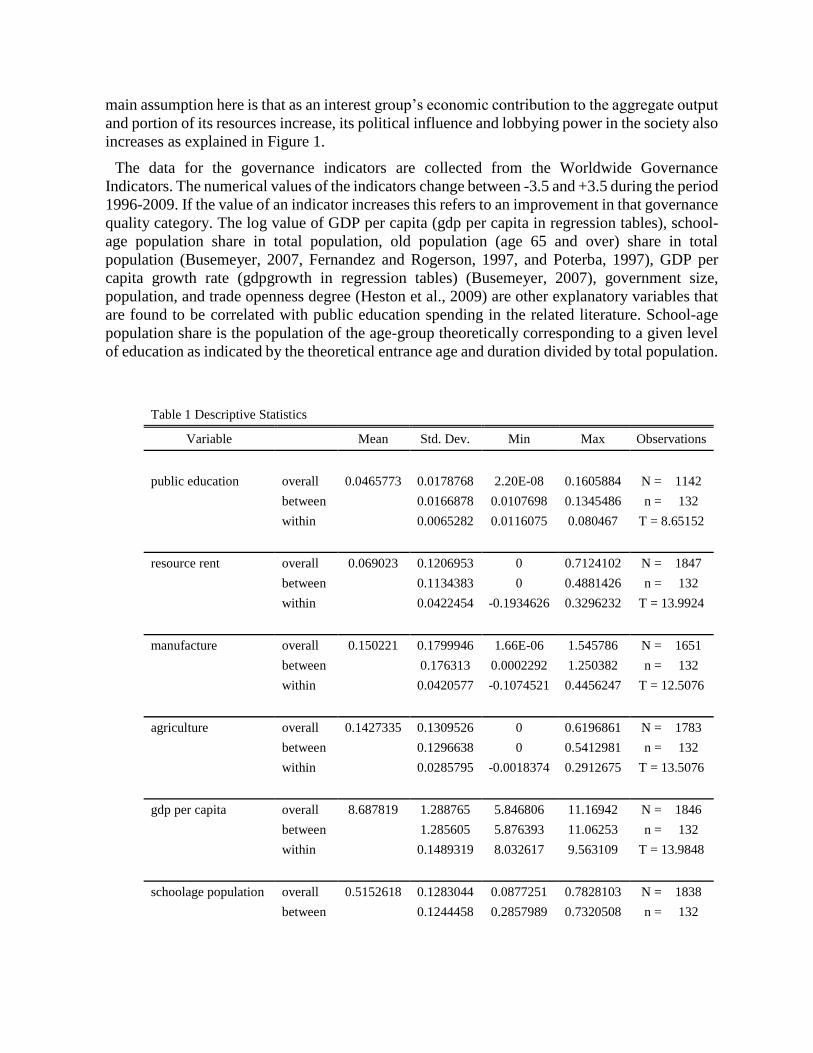
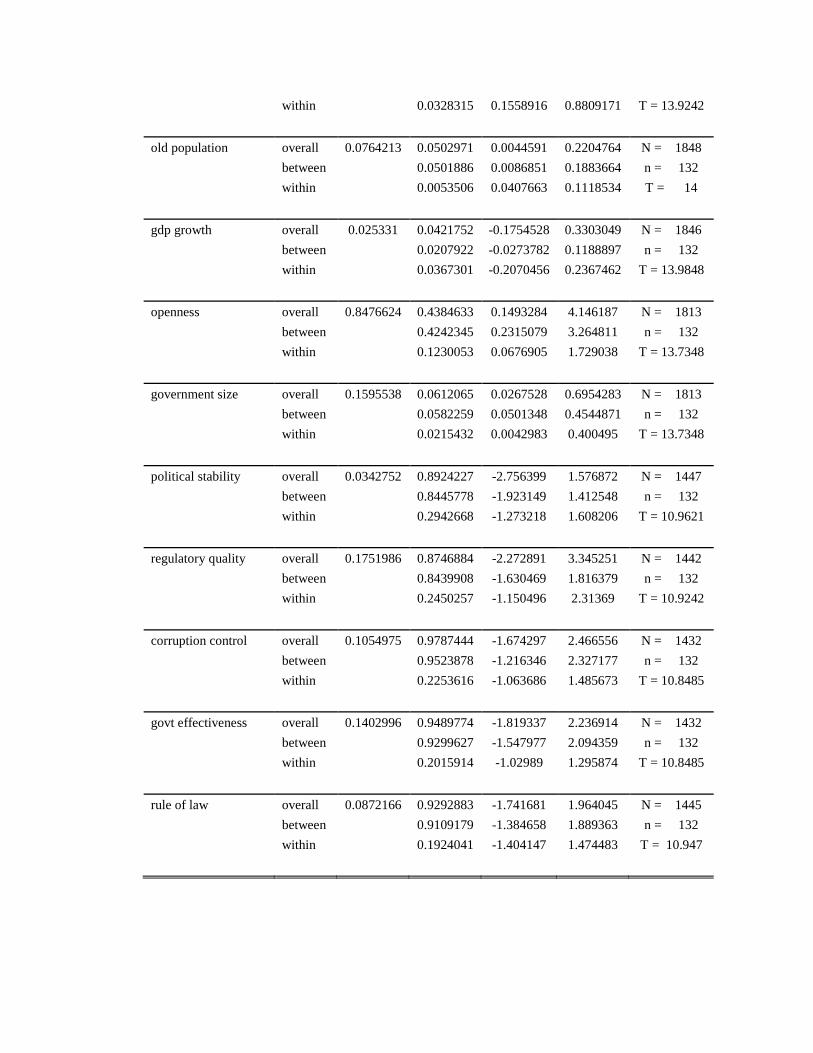
The data for the governance indicators are collected from the Worldwide Governance
Indicators. The numerical values of the indicators change between -3.5 and +3.5 during the period
1996-2009. If the value of an indicator increases this refers to an improvement in that governance
quality category. The log value of GDP per capita (gdp per capita in regression tables), school-
age population share in total population, old population (age 65 and over) share in total
population (Busemeyer, 2007, Fernandez and Rogerson, 1997, and Poterba, 1997), GDP per
capita growth rate (gdpgrowth in regression tables) (Busemeyer, 2007), government size,
population, and trade openness degree (Heston et al., 2009) are other explanatory variables that
are found to be correlated with public education spending in the related literature. School-age
population share is the population of the age-group theoretically corresponding to a given level
of education as indicated by the theoretical entrance age and duration divided by total population.
Table 1 Descriptive Statistics
Variable Mean Std. Dev. Min Max Observations
public education overall 0.0465773 0.0178768 2.20E-08 0.1605884 N = 1142
between 0.0166878 0.0107698 0.1345486 n = 132
within 0.0065282 0.0116075 0.080467 T = 8.65152
resource rent overall 0.069023 0.1206953 0 0.7124102 N = 1847
between 0.1134383 0 0.4881426 n = 132
within 0.0422454 -0.1934626 0.3296232 T = 13.9924
manufacture overall 0.150221 0.1799946 1.66E-06 1.545786 N = 1651
between 0.176313 0.0002292 1.250382 n = 132
within 0.0420577 -0.1074521 0.4456247 T = 12.5076
agriculture overall 0.1427335 0.1309526 0 0.6196861 N = 1783
between 0.1296638 0 0.5412981 n = 132
within 0.0285795 -0.0018374 0.2912675 T = 13.5076
gdp per capita overall 8.687819 1.288765 5.846806 11.16942 N = 1846
between 1.285605 5.876393 11.06253 n = 132
within 0.1489319 8.032617 9.563109 T = 13.9848
schoolage population overall 0.5152618 0.1283044 0.0877251 0.7828103 N = 1838
between 0.1244458 0.2857989 0.7320508 n = 132
within 0.0328315 0.1558916 0.8809171 T = 13.9242
old population overall 0.0764213 0.0502971 0.0044591 0.2204764 N = 1848
between 0.0501886 0.0086851 0.1883664 n = 132
within 0.0053506 0.0407663 0.1118534 T = 14
gdp growth overall 0.025331 0.0421752 -0.1754528 0.3303049 N = 1846
between 0.0207922 -0.0273782 0.1188897 n = 132
within 0.0367301 -0.2070456 0.2367462 T = 13.9848
openness overall 0.8476624 0.4384633 0.1493284 4.146187 N = 1813
between 0.4242345 0.2315079 3.264811 n = 132
within 0.1230053 0.0676905 1.729038 T = 13.7348
government size overall 0.1595538 0.0612065 0.0267528 0.6954283 N = 1813
between 0.0582259 0.0501348 0.4544871 n = 132
within 0.0215432 0.0042983 0.400495 T = 13.7348
political stability overall 0.0342752 0.8924227 -2.756399 1.576872 N = 1447
between 0.8445778 -1.923149 1.412548 n = 132
within 0.2942668 -1.273218 1.608206 T = 10.9621
regulatory quality overall 0.1751986 0.8746884 -2.272891 3.345251 N = 1442
between 0.8439908 -1.630469 1.816379 n = 132
within 0.2450257 -1.150496 2.31369 T = 10.9242
corruption control overall 0.1054975 0.9787444 -1.674297 2.466556 N = 1432
between 0.9523878 -1.216346 2.327177 n = 132
within 0.2253616 -1.063686 1.485673 T = 10.8485
govt effectiveness overall 0.1402996 0.9489774 -1.819337 2.236914 N = 1432
between 0.9299627 -1.547977 2.094359 n = 132
within 0.2015914 -1.02989 1.295874 T = 10.8485
rule of law overall 0.0872166 0.9292883 -1.741681 1.964045 N = 1445
between 0.9109179 -1.384658 1.889363 n = 132
within 0.1924041 -1.404147 1.474483 T = 10.947
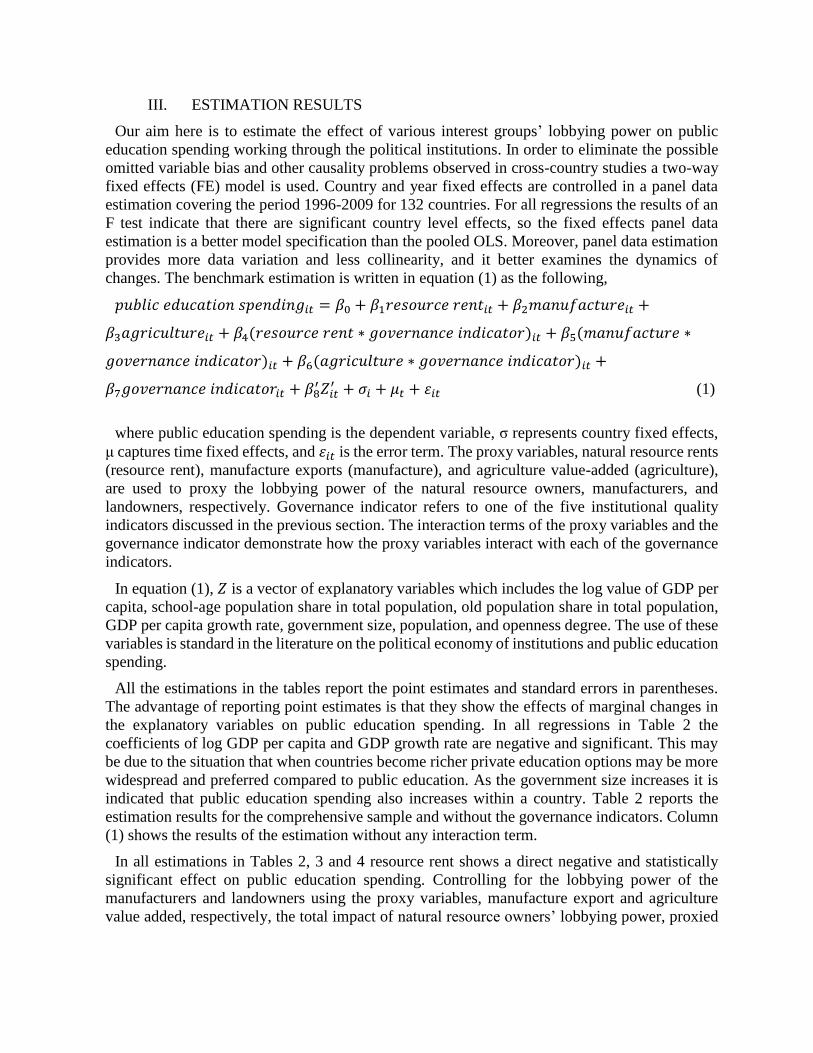
III. ESTIMATION RESULTS
Our aim here is to estimate the effect of various interest groups’ lobbying power on public
education spending working through the political institutions. In order to eliminate the possible
omitted variable bias and other causality problems observed in cross-country studies a two-way
fixed effects (FE) model is used. Country and year fixed effects are controlled in a panel data
estimation covering the period 1996-2009 for 132 countries. For all regressions the results of an
F test indicate that there are significant country level effects, so the fixed effects panel data
estimation is a better model specification than the pooled OLS. Moreover, panel data estimation
provides more data variation and less collinearity, and it better examines the dynamics of
changes. The benchmark estimation is written in equation (1) as the following,
𝑝𝑢𝑏𝑙𝑖𝑐 𝑒𝑑𝑢𝑐𝑎𝑡𝑖𝑜𝑛 𝑠𝑝𝑒𝑛𝑑𝑖𝑛𝑔𝑖𝑡 = 𝛽0 + 𝛽1𝑟𝑒𝑠𝑜𝑢𝑟𝑐𝑒 𝑟𝑒𝑛𝑡𝑖𝑡 + 𝛽2𝑚𝑎𝑛𝑢𝑓𝑎𝑐𝑡𝑢𝑟𝑒𝑖𝑡 +
𝛽3𝑎𝑔𝑟𝑖𝑐𝑢𝑙𝑡𝑢𝑟𝑒𝑖𝑡 + 𝛽4(𝑟𝑒𝑠𝑜𝑢𝑟𝑐𝑒 𝑟𝑒𝑛𝑡 ∗ 𝑔𝑜𝑣𝑒𝑟𝑛𝑎𝑛𝑐𝑒 𝑖𝑛𝑑𝑖𝑐𝑎𝑡𝑜𝑟)𝑖𝑡 + 𝛽5(𝑚𝑎𝑛𝑢𝑓𝑎𝑐𝑡𝑢𝑟𝑒 ∗
𝑔𝑜𝑣𝑒𝑟𝑛𝑎𝑛𝑐𝑒 𝑖𝑛𝑑𝑖𝑐𝑎𝑡𝑜𝑟)𝑖𝑡 + 𝛽6(𝑎𝑔𝑟𝑖𝑐𝑢𝑙𝑡𝑢𝑟𝑒 ∗ 𝑔𝑜𝑣𝑒𝑟𝑛𝑎𝑛𝑐𝑒 𝑖𝑛𝑑𝑖𝑐𝑎𝑡𝑜𝑟)𝑖𝑡 +
𝛽7𝑔𝑜𝑣𝑒𝑟𝑛𝑎𝑛𝑐𝑒 𝑖𝑛𝑑𝑖𝑐𝑎𝑡𝑜𝑟𝑖𝑡 + 𝛽8′ 𝑍𝑖𝑡
′ + 𝜎𝑖 + 𝜇𝑡 + 𝜀𝑖𝑡 (1)
where public education spending is the dependent variable, σ represents country fixed effects,
μ captures time fixed effects, and 𝜀𝑖𝑡 is the error term. The proxy variables, natural resource rents
(resource rent), manufacture exports (manufacture), and agriculture value-added (agriculture),
are used to proxy the lobbying power of the natural resource owners, manufacturers, and
landowners, respectively. Governance indicator refers to one of the five institutional quality
indicators discussed in the previous section. The interaction terms of the proxy variables and the
governance indicator demonstrate how the proxy variables interact with each of the governance
indicators.
In equation (1), 𝑍 is a vector of explanatory variables which includes the log value of GDP per
capita, school-age population share in total population, old population share in total population,
GDP per capita growth rate, government size, population, and openness degree. The use of these
variables is standard in the literature on the political economy of institutions and public education
spending.
All the estimations in the tables report the point estimates and standard errors in parentheses.
The advantage of reporting point estimates is that they show the effects of marginal changes in
the explanatory variables on public education spending. In all regressions in Table 2 the
coefficients of log GDP per capita and GDP growth rate are negative and significant. This may
be due to the situation that when countries become richer private education options may be more
widespread and preferred compared to public education. As the government size increases it is
indicated that public education spending also increases within a country. Table 2 reports the
estimation results for the comprehensive sample and without the governance indicators. Column
(1) shows the results of the estimation without any interaction term.
In all estimations in Tables 2, 3 and 4 resource rent shows a direct negative and statistically
significant effect on public education spending. Controlling for the lobbying power of the
manufacturers and landowners using the proxy variables, manufacture export and agriculture
value added, respectively, the total impact of natural resource owners’ lobbying power, proxied
by resource rent, on public education spending is measured by its direct effect as well as through
its indirect effect via institutions.
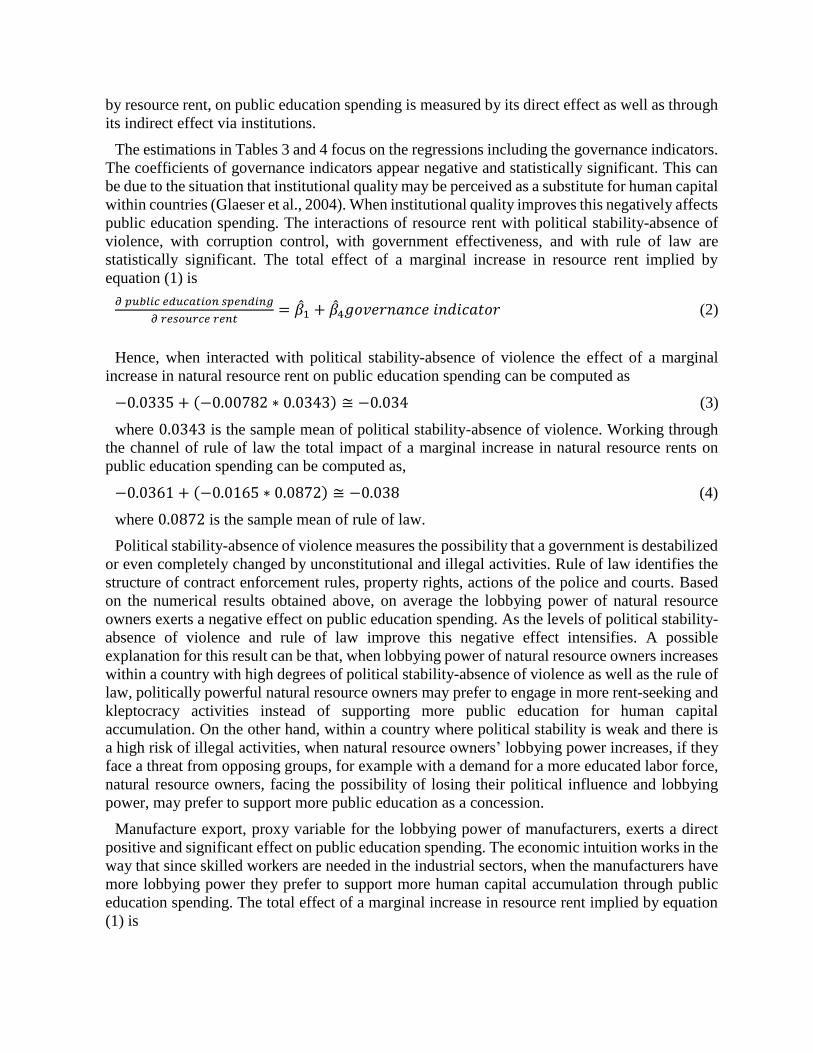
The estimations in Tables 3 and 4 focus on the regressions including the governance indicators.
The coefficients of governance indicators appear negative and statistically significant. This can
be due to the situation that institutional quality may be perceived as a substitute for human capital
within countries (Glaeser et al., 2004). When institutional quality improves this negatively affects
public education spending. The interactions of resource rent with political stability-absence of
violence, with corruption control, with government effectiveness, and with rule of law are
statistically significant. The total effect of a marginal increase in resource rent implied by
equation (1) is
𝜕 𝑝𝑢𝑏𝑙𝑖𝑐 𝑒𝑑𝑢𝑐𝑎𝑡𝑖𝑜𝑛 𝑠𝑝𝑒𝑛𝑑𝑖𝑛𝑔
𝜕 𝑟𝑒𝑠𝑜𝑢𝑟𝑐𝑒 𝑟𝑒𝑛𝑡= �̂�1 + �̂�4𝑔𝑜𝑣𝑒𝑟𝑛𝑎𝑛𝑐𝑒 𝑖𝑛𝑑𝑖𝑐𝑎𝑡𝑜𝑟 (2)
Hence, when interacted with political stability-absence of violence the effect of a marginal
increase in natural resource rent on public education spending can be computed as
−0.0335 + (−0.00782 ∗ 0.0343) ≅ −0.034 (3)
where 0.0343 is the sample mean of political stability-absence of violence. Working through
the channel of rule of law the total impact of a marginal increase in natural resource rents on
public education spending can be computed as,
−0.0361 + (−0.0165 ∗ 0.0872) ≅ −0.038 (4)
where 0.0872 is the sample mean of rule of law.
Political stability-absence of violence measures the possibility that a government is destabilized
or even completely changed by unconstitutional and illegal activities. Rule of law identifies the
structure of contract enforcement rules, property rights, actions of the police and courts. Based
on the numerical results obtained above, on average the lobbying power of natural resource
owners exerts a negative effect on public education spending. As the levels of political stability-
absence of violence and rule of law improve this negative effect intensifies. A possible
explanation for this result can be that, when lobbying power of natural resource owners increases
within a country with high degrees of political stability-absence of violence as well as the rule of
law, politically powerful natural resource owners may prefer to engage in more rent-seeking and
kleptocracy activities instead of supporting more public education for human capital
accumulation. On the other hand, within a country where political stability is weak and there is
a high risk of illegal activities, when natural resource owners’ lobbying power increases, if they
face a threat from opposing groups, for example with a demand for a more educated labor force,
natural resource owners, facing the possibility of losing their political influence and lobbying
power, may prefer to support more public education as a concession.
Manufacture export, proxy variable for the lobbying power of manufacturers, exerts a direct
positive and significant effect on public education spending. The economic intuition works in the
way that since skilled workers are needed in the industrial sectors, when the manufacturers have
more lobbying power they prefer to support more human capital accumulation through public
education spending. The total effect of a marginal increase in resource rent implied by equation
(1) is
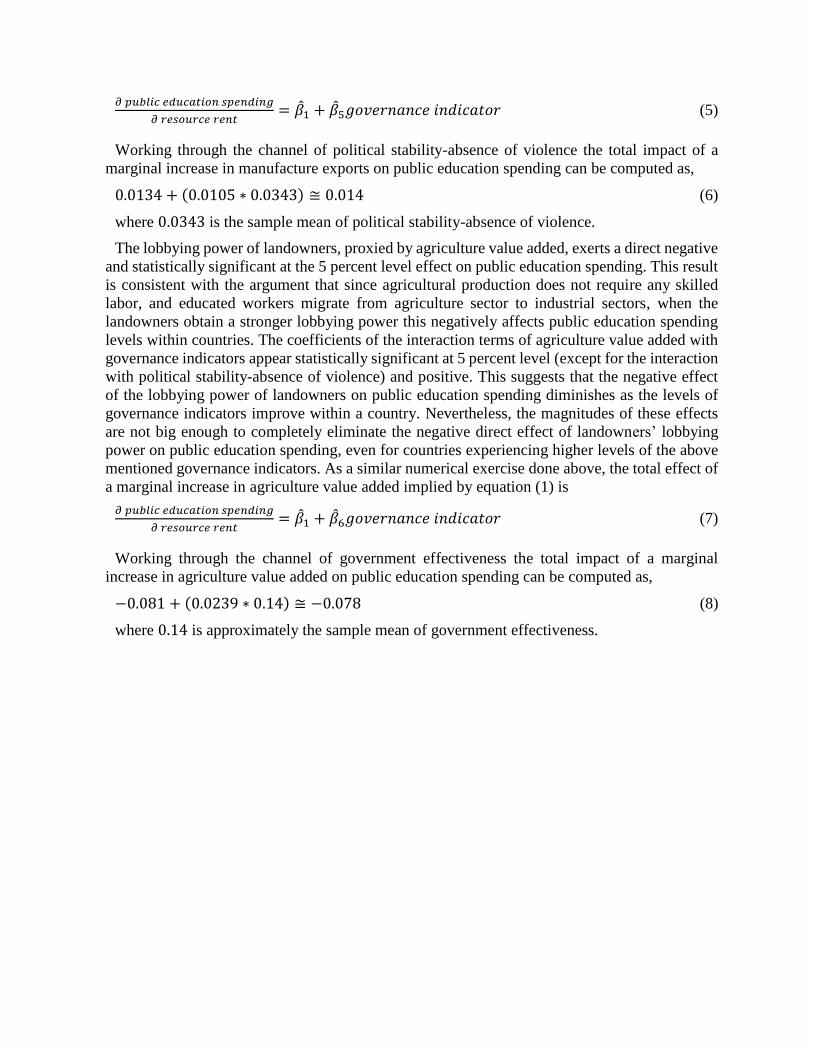
𝜕 𝑝𝑢𝑏𝑙𝑖𝑐 𝑒𝑑𝑢𝑐𝑎𝑡𝑖𝑜𝑛 𝑠𝑝𝑒𝑛𝑑𝑖𝑛𝑔
𝜕 𝑟𝑒𝑠𝑜𝑢𝑟𝑐𝑒 𝑟𝑒𝑛𝑡= �̂�1 + �̂�5𝑔𝑜𝑣𝑒𝑟𝑛𝑎𝑛𝑐𝑒 𝑖𝑛𝑑𝑖𝑐𝑎𝑡𝑜𝑟 (5)
Working through the channel of political stability-absence of violence the total impact of a
marginal increase in manufacture exports on public education spending can be computed as,
0.0134 + (0.0105 ∗ 0.0343) ≅ 0.014 (6)
where 0.0343 is the sample mean of political stability-absence of violence.
The lobbying power of landowners, proxied by agriculture value added, exerts a direct negative
and statistically significant at the 5 percent level effect on public education spending. This result
is consistent with the argument that since agricultural production does not require any skilled
labor, and educated workers migrate from agriculture sector to industrial sectors, when the
landowners obtain a stronger lobbying power this negatively affects public education spending
levels within countries. The coefficients of the interaction terms of agriculture value added with
governance indicators appear statistically significant at 5 percent level (except for the interaction
with political stability-absence of violence) and positive. This suggests that the negative effect
of the lobbying power of landowners on public education spending diminishes as the levels of
governance indicators improve within a country. Nevertheless, the magnitudes of these effects
are not big enough to completely eliminate the negative direct effect of landowners’ lobbying
power on public education spending, even for countries experiencing higher levels of the above
mentioned governance indicators. As a similar numerical exercise done above, the total effect of
a marginal increase in agriculture value added implied by equation (1) is
𝜕 𝑝𝑢𝑏𝑙𝑖𝑐 𝑒𝑑𝑢𝑐𝑎𝑡𝑖𝑜𝑛 𝑠𝑝𝑒𝑛𝑑𝑖𝑛𝑔
𝜕 𝑟𝑒𝑠𝑜𝑢𝑟𝑐𝑒 𝑟𝑒𝑛𝑡= �̂�1 + �̂�6𝑔𝑜𝑣𝑒𝑟𝑛𝑎𝑛𝑐𝑒 𝑖𝑛𝑑𝑖𝑐𝑎𝑡𝑜𝑟 (7)
Working through the channel of government effectiveness the total impact of a marginal
increase in agriculture value added on public education spending can be computed as,
−0.081 + (0.0239 ∗ 0.14) ≅ −0.078 (8)
where 0.14 is approximately the sample mean of government effectiveness.

Table 2 Regression Results – No Governance Indicators
(1) (2) (3) (4) (5) (6)
pubedu pubedu pubedu pubedu pubedu pubedu
resourcerent -0.0270** -0.0356** -0.0341** -0.0335** -0.0311** -0.0361**
(0.00617) (0.00757) (0.00721) (0.00745) (0.00703) (0.00735)
manufacture 0.0149** 0.0152** 0.0170** 0.0134* 0.0163** 0.0160**
(0.00616) (0.00708) (0.00717) (0.00731) (0.00737) (0.00703)
agriculture -0.0999** -0.0793** -0.0810** -0.0934** -0.0858** -0.0826**
(0.0115) (0.0143) (0.0139) (0.0136) (0.0138) (0.0145)
Gdp percapita -0.00824** -0.00867** -0.00647** -0.00648** -0.00700** -0.00756**
(0.00278) (0.00317) (0.00316) (0.00320) (0.00319) (0.00314)
population 0.0136* 0.0138 0.0128 0.0181** 0.0136 0.0139
(0.00769) (0.00895) (0.00896) (0.00900) (0.00908) (0.00905)
old population 0.0819 0.0692 0.0765 0.0855 0.0816 0.0630
(0.0629) (0.0704) (0.0700) (0.0708) (0.0703) (0.0706)
Gdp growth -0.0114* -0.0147* -0.0152** -0.0153** -0.0169** -0.0174**
(0.00677) (0.00765) (0.00760) (0.00768) (0.00767) (0.00765)
govtsize 0.0611** 0.0487** 0.0497** 0.0543** 0.0506** 0.0485**
(0.0121) (0.0136) (0.0133) (0.0135) (0.0136) (0.0134)
openness -0.00490* -0.00688** -0.00661** -0.00762** -0.00662** -0.00733**
(0.00253) (0.00292) (0.00289) (0.00290) (0.00289) (0.00291)
schoolage 0.0109 0.0142 0.0107 0.0127 0.0124 0.0139
(0.00904) (0.00967) (0.00963) (0.00968) (0.00965) (0.00967)
Observations 1012 826 826 824 826 826
R2 0.188 0.198 0.206 0.194 0.198 0.201 Note: Public education spending is the dependent variable. Fixed effects model is used in all estimations. Point estimates are reported. Standard errors are shown in parentheses. * Significant at 10%; ** significant at 5%. All regressions include a constant term and year fixed effects (not reported).

Table 3 Regression Results with Governance Indicators
(1) (2) (3)
pubedu pubedu pubedu
resourcerent -0.0270** -0.0356** -0.0341**
(0.00617) (0.00757) (0.00721)
manufacture 0.0149** 0.0152** 0.0170**
(0.00616) (0.00708) (0.00717)
agriculture -0.0999** -0.0793** -0.0810**
(0.0115) (0.0143) (0.0139)
corruption -0.00477**
(0.00189)
resourcerent*corruption -0.0131*
(0.00790)
manufacture*corruption 0.00518
(0.00460)
agriculture*corruption 0.0287**
(0.0102)
govteffectiveness -0.00600**
(0.00177)
resourcerent*govteffectiveness -0.0127*
(0.00751)
manufacture*govteffectiveness 0.00131
(0.00413)
agriculture*govteffectiveness 0.0239**
(0.00877)
Observations 1012 826 826
R2 0.188 0.198 0.206 Note: Public education spending is the dependent variable. Fixed effects model is used in all estimations. Point estimates are
reported. Standard errors are shown in parentheses. * Significant at 10%; ** significant at 5%. All regressions include a constant term and year fixed effects (not reported).

Table 4 Regression Results with Governance Indicators
(1) (2) (3) (4)
resourcerent -0.0270** -0.0335** -0.0311** -0.0361**
(0.00617) (0.00745) (0.00703) (0.00735)
manufacture 0.0149** 0.0134* 0.0163** 0.0160**
(0.00616) (0.00731) (0.00737) (0.00703)
agriculture -0.0999** -0.0934** -0.0858** -0.0826**
(0.0115) (0.0136) (0.0138) (0.0145)
politicalstability -0.00228
(0.00167)
resourcerent*politicalstability -0.00782*
(0.00576)
manufacture*politicalstability 0.0105**
(0.00448)
agriculture*politicalstability 0.00441
(0.00571)
regquality -0.0120**
(0.00340)
resourcerent*regquality -0.00788
(0.00706)
manufacture*regquality 0.00215
(0.00472)
agriculture*regquality 0.0266**
(0.00973)
ruleoflaw -0.0164**
(0.00386)
resourcerent*ruleoflaw -0.0165**
(0.00727)
manufacture*ruleoflaw 0.00508
(0.00458)
agriculture*ruleoflaw 0.0224**
(0.00942)
Observations 1012 824 826 826
R2 0.188 0.194 0.198 0.201 Note: Public education spending is the dependent variable. Fixed effects model is used in all estimations. Point estimates are
reported. Standard errors are shown in parentheses. * Significant at 10%; ** significant at 5%. All regressions include a constant term and year fixed effects (not reported).
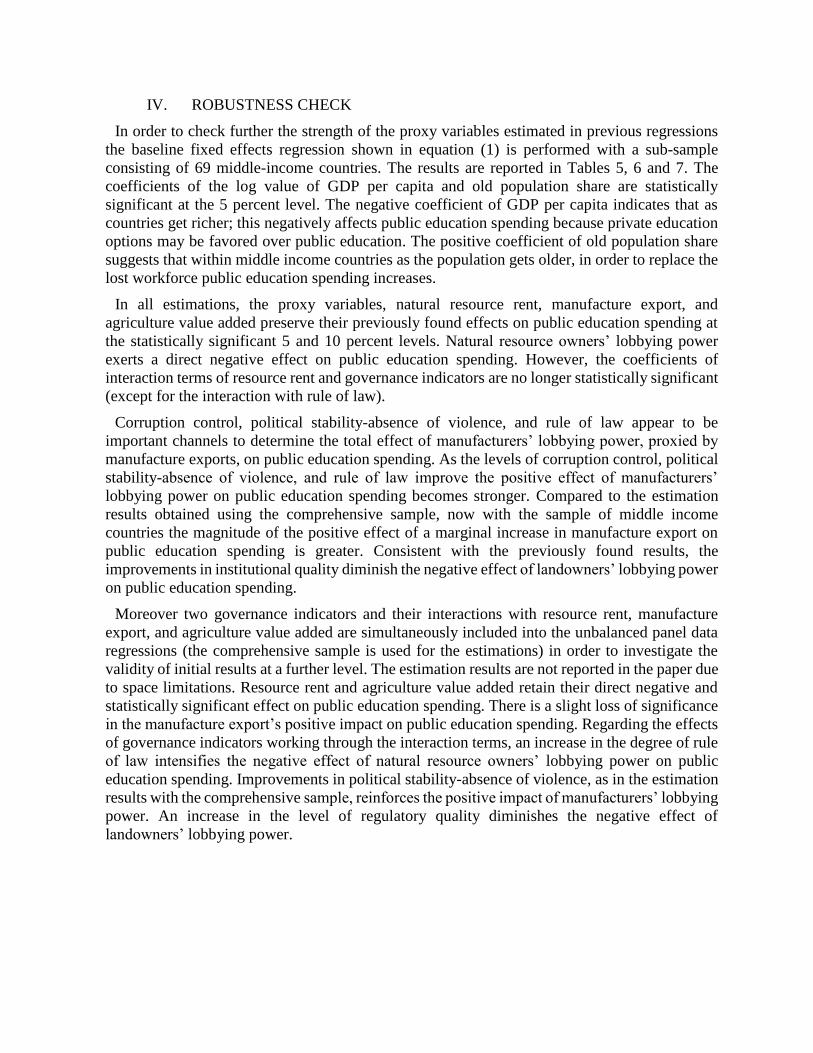
IV. ROBUSTNESS CHECK
In order to check further the strength of the proxy variables estimated in previous regressions
the baseline fixed effects regression shown in equation (1) is performed with a sub-sample
consisting of 69 middle-income countries. The results are reported in Tables 5, 6 and 7. The
coefficients of the log value of GDP per capita and old population share are statistically
significant at the 5 percent level. The negative coefficient of GDP per capita indicates that as
countries get richer; this negatively affects public education spending because private education
options may be favored over public education. The positive coefficient of old population share
suggests that within middle income countries as the population gets older, in order to replace the
lost workforce public education spending increases.
In all estimations, the proxy variables, natural resource rent, manufacture export, and
agriculture value added preserve their previously found effects on public education spending at
the statistically significant 5 and 10 percent levels. Natural resource owners’ lobbying power
exerts a direct negative effect on public education spending. However, the coefficients of
interaction terms of resource rent and governance indicators are no longer statistically significant
(except for the interaction with rule of law).
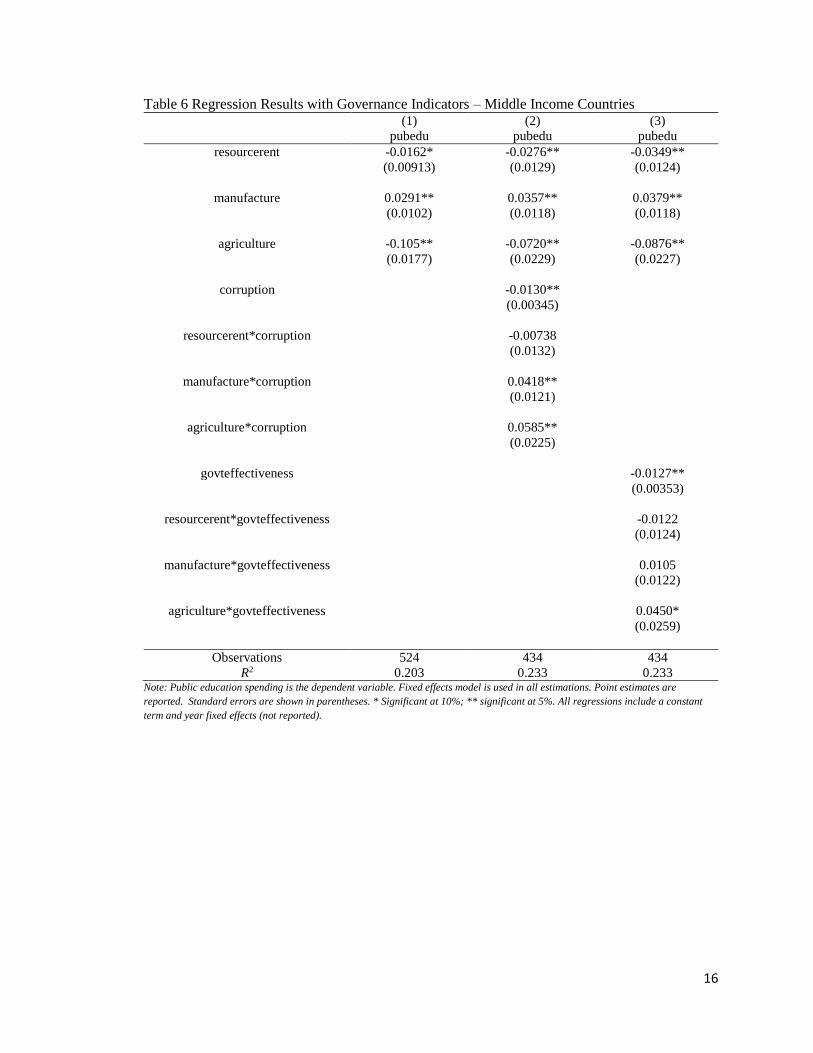
Corruption control, political stability-absence of violence, and rule of law appear to be
important channels to determine the total effect of manufacturers’ lobbying power, proxied by
manufacture exports, on public education spending. As the levels of corruption control, political
stability-absence of violence, and rule of law improve the positive effect of manufacturers’
lobbying power on public education spending becomes stronger. Compared to the estimation
results obtained using the comprehensive sample, now with the sample of middle income
countries the magnitude of the positive effect of a marginal increase in manufacture export on
public education spending is greater. Consistent with the previously found results, the
improvements in institutional quality diminish the negative effect of landowners’ lobbying power
on public education spending.
Moreover two governance indicators and their interactions with resource rent, manufacture
export, and agriculture value added are simultaneously included into the unbalanced panel data
regressions (the comprehensive sample is used for the estimations) in order to investigate the
validity of initial results at a further level. The estimation results are not reported in the paper due
to space limitations. Resource rent and agriculture value added retain their direct negative and
statistically significant effect on public education spending. There is a slight loss of significance
in the manufacture export’s positive impact on public education spending. Regarding the effects
of governance indicators working through the interaction terms, an increase in the degree of rule
of law intensifies the negative effect of natural resource owners’ lobbying power on public
education spending. Improvements in political stability-absence of violence, as in the estimation
results with the comprehensive sample, reinforces the positive impact of manufacturers’ lobbying
power. An increase in the level of regulatory quality diminishes the negative effect of
landowners’ lobbying power.

Table 5 Regression Results Middle Income Countries – No Governance Indicators
(1) (2) (3) (4) (5) (6)
pubedu pubedu pubedu pubedu pubedu pubedu
resourcerent -0.0162* -0.0276** -0.0349** -0.0222* -0.0273** -0.0325**
(0.00913) (0.0129) (0.0124) (0.0113) (0.0116) (0.0129)
manufacture 0.0291** 0.0357** 0.0379** 0.0300** 0.0356** 0.0472**
(0.0102) (0.0118) (0.0118) (0.0118) (0.0119) (0.0120)
agriculture -0.105** -0.0720** -0.0876** -0.0851** -0.0991** -0.0809**
(0.0177) (0.0229) (0.0227) (0.0207) (0.0216) (0.0236)
Gdp percapita -0.0185** -0.0195** -0.0146** -0.0159** -0.0157** -0.0181**
(0.00419) (0.00489) (0.00488) (0.00502) (0.00500) (0.00474)
population -0.0156 -0.0270** -0.0153 -0.0245* -0.0176 -0.0249*
(0.0110) (0.0132) (0.0129) (0.0129) (0.0130) (0.0128)
oldpopulation 0.524** 0.425** 0.375** 0.510** 0.398** 0.436**
(0.125) (0.145) (0.144) (0.149) (0.147) (0.146)
Gdp growth -0.0156 -0.0153 -0.0198* -0.0176 -0.0208* -0.0195*
(0.0101) (0.0114) (0.0113) (0.0113) (0.0114) (0.0113)
government size 0.0476** 0.0417** 0.0443** 0.0487** 0.0419** 0.0403**
(0.0182) (0.0206) (0.0206) (0.0206) (0.0207) (0.0203)
openness -0.0118** -0.0118** -0.0135** -0.0127** -0.0125** -0.0152**
(0.00407) (0.00469) (0.00471) (0.00469) (0.00474) (0.00471)
schoolage 0.0120 0.0138 0.0136 0.0126 0.0159 0.0188
(0.0127) (0.0137) (0.0136) (0.0136) (0.0137) (0.0135)
Observations 524 434 434 432 434 434
R2 0.203 0.233 0.233 0.238 0.220 0.248 Note: Public education spending is the dependent variable. Fixed effects model is used in all estimations. Point estimates are reported. Standard errors are shown in parentheses. *
Significant at 10%; ** significant at 5%. All regressions include a constant term and year fixed effects (not reported).
16
Table 6 Regression Results with Governance Indicators – Middle Income Countries (1) (2) (3)
pubedu pubedu pubedu
resourcerent -0.0162* -0.0276** -0.0349**
(0.00913) (0.0129) (0.0124)
manufacture 0.0291** 0.0357** 0.0379**
(0.0102) (0.0118) (0.0118)
agriculture -0.105** -0.0720** -0.0876**
(0.0177) (0.0229) (0.0227)
corruption -0.0130**
(0.00345)
resourcerent*corruption -0.00738
(0.0132)
manufacture*corruption 0.0418**
(0.0121)
agriculture*corruption 0.0585**
(0.0225)
govteffectiveness -0.0127**
(0.00353)
resourcerent*govteffectiveness -0.0122
(0.0124)
manufacture*govteffectiveness 0.0105
(0.0122)
agriculture*govteffectiveness 0.0450*
(0.0259)
Observations 524 434 434
R2 0.203 0.233 0.233 Note: Public education spending is the dependent variable. Fixed effects model is used in all estimations. Point estimates are
reported. Standard errors are shown in parentheses. * Significant at 10%; ** significant at 5%. All regressions include a constant
term and year fixed effects (not reported).

17
Table 7 Regression Results with Governance Indicators – Middle Income Countries (1) (2) (3) (4)
resourcerent -0.0162* -0.0222* -0.0273** -0.0325**
(0.00913) (0.0113) (0.0116) (0.0129)
manufacture 0.0291** 0.0300** 0.0356** 0.0472**
(0.0102) (0.0118) (0.0119) (0.0120)
agriculture -0.105** -0.0851** -0.0991** -0.0809**
(0.0177) (0.0207) (0.0216) (0.0236)
politicalstability -0.00822**
(0.00294)
resourcerent*politicalstability -0.0000491
(0.00855)
manufacture*politicalstability 0.0367**
(0.00788)
agriculture*politicalstability 0.0233
(0.0146)
regquality -0.0120**
(0.00340)
resourcerent*regquality -0.00536
(0.0107)
manufacture*regquality 0.0158
(0.0116)
agriculture*regquality 0.0602**
(0.0227)
ruleoflaw -0.0164**
(0.00386)
resourcerent*ruleoflaw -0.00892
(0.0121)
manufacture*ruleoflaw 0.0439**
(0.0116)
agriculture*ruleoflaw 0.0667**
(0.0239)
Observations 524 432 434 434
R2 0.203 0.238 0.220 0.248 Note: Public education spending is the dependent variable. Fixed effects model is used in all estimations. Point estimates are reported.
Standard errors are shown in parentheses. * Significant at 10%; ** significant at 5%. All regressions include a constant term and year fixed
effects (not reported).
18
V. CONCLUDING REMARKS
This paper presents empirical results about the effect of lobbying power of different interest
groups on public education spending in a panel data estimation during the period 1996-2009 for
132 countries. Macroeconomic indicators are used as proxy variables to define the lobbying
power of the interest groups in order to substantiate the definition of lobbying power with
economic fundamentals, and so generate a mapping from the economic contribution to aggregate
output and portion of resources to lobbying power. The governance indicators, corruption
control, government effectiveness, political stability-absence of violence, regulatory quality, and
rule of law, are used to explore how the political power of interest group interacts with the
different aspects of institutions, and how these interactions affect the overall relationship between
the interest groups’ lobbying power and public education spending.
Natural resource rent is assumed as the proxy variable to represent the lobbying power of the
natural resource owners. It shows a direct negative effect on public education spending. The
interaction terms of resource rent with governance indicators also contribute significantly to the
overall impact of natural resource owners’ lobbying power. When institutional quality increases
the direct negative effect of natural resource owners’ economic and lobbying power get stronger.
In most regressions manufacture export, the proxy variable assumed to define the lobbying
power of the manufacturers, exerts a direct positive and statistically significant effect on public
education spending. Therefore as the lobbying power of manufacturers increases this positively
affects public education spending level. Considering estimations done with the middle income
countries sample, the statistically significant and positive coefficients of the interaction terms of
manufacture export with political stability-absence of violence, corruption control and rule of
law indicate that improvements in these governance indicators reinforce the positive influence of
the lobbying power of manufacturers on public education spending within a country.
Agriculture value added is assumed to be the proxy for the lobbying power of landowners. It
shows a direct negative effect on public education spending indicating that when the lobbying
power of landowners increases this negatively affects the level of public education spending.
Improvements in institutional quality diminish this direct negative effect, but they are not
sufficient to completely crowd it out.
In the cases of controlling multiple interaction terms simultaneously and repeating the
benchmark regressions with a sample of middle income countries as robustness checks, resource
rent, manufacture export, and agriculture value added preserve the nature and significance of
their effects on public education spending in most of the estimations.
Regarding how this paper is related to the natural resources, institutional quality and economic
growth literature, Mehlum et al. (2006) argue that resource abundance is beneficial for economic
growth when the institutions are producer friendly and harmful for economic growth when the
institutions are grabber friendly. They use the share of primary exports in GNP in 1970 from
Sachs and Warner (1995) as resource abundance indicator and a composite index for institutional
quality. Other studies draw attention to the interactions between institutional quality and different
types of resources, and their varying effects on economic growth (Boschini et al., 2007 and Stijns,
2006). Brunnschweiler (2008) uses subsoil wealth per capita as resource abundance indicator,
and rule of law and government effectiveness from the Worldwide Governance Indicators to
define institutional quality. She finds that resource abundance has a direct positive effect on

19
economic growth although the negative coefficients of the interaction terms suggest that this
positive effect diminishes as the quality of institutions improves. In all these studies, the
dependent variable is an economic growth indicator. Aslaksen (2007) uses panel data
specification controlling for country and time fixed effects to estimate the impact of resource
abundance on corruption. In this respect, this paper provides a contribution to the natural
resources and economic development literature from a political economy perspective.
In order to explore different aspects of the interaction between institutional quality and political
influences of the interest groups, five governance indicators are used in the regressions. The
estimation results examining the effects of proxy variables show that through the interaction
terms the governance indicators play significant roles in determining the total impacts of natural
resource owners’, manufacturers’, and landowners’ political influence on public education
spending, referring to the argument that the quality of political institutions is an important factor
in determining economic development (Glaeser et al., 2004) which is discussed in detail in
economic growth and political economy literature.
Future research prospects include single country case studies to find out how country-specific
political party platforms and interest group structure affect economic development; country-
group studies to explore how similar geographical, regional or economic conditions, potential
political conflicts between countries affect economic growth. Moreover, the integration of
political coalition structure into the empirical framework would be useful.

20
Country List
Argentina Gambia, The Nicaragua
Armenia Georgia Niger
Australia Germany Norway
Austria Ghana Oman
Azerbaijan Guatemala Pakistan
Bangladesh Guinea Panama
Barbados Guyana Paraguay
Belarus Hong Kong SAR, China Peru
Belgium Hungary Philippines
Belize Iceland Poland
Bhutan India Portugal
Bolivia Indonesia Romania
Botswana Iran, Islamic Rep. Russian Federation
Brazil Ireland Rwanda
Brunei Darussalam Italy Saudi Arabia
Bulgaria Jamaica Senegal
Burkina Faso Japan Sierra Leone
Burundi Kazakhstan Slovak Republic
Cambodia Kenya Slovenia
Cameroon Korea, Rep. South Africa
Canada Kuwait Spain
Cape Verde Kyrgyz Republic Sri Lanka
Central African Republic Latvia St. Lucia
Chile Lebanon St. Vincent and the Grenadines
China Lesotho Swaziland
Colombia Lithuania Sweden
Comoros Macao SAR, China Switzerland
Costa Rica Madagascar Syrian Arab Republic
Cote d'Ivoire Malawi Tanzania
Croatia Malaysia Thailand
Cyprus Maldives Togo
Czech Republic Mali Tonga
Denmark Malta Trinidad and Tobago
Dominican Republic Mauritania Tunisia
Ecuador Mauritius Turkey
Egypt, Arab Rep. Mexico Uganda
El Salvador Moldova Ukraine

21
Eritrea Mongolia United Arab Emirates
Estonia Morocco United Kingdom
Ethiopia Mozambique United States
Fiji Namibia Uruguay
Finland Nepal Vanuatu
France Netherlands Venezuela, RB
Gabon New Zealand Zambia
22
References
Acemoglu, Daron (2008). Introduction to modern economic growth, Princeton University
Press.
Acemoglu, Daron and James A. Robinson (2000). Political Losers as a Barrier to Economic
Development, American Economic Review, Papers and Proceedings. 90 (2): 126-130.
Acemoglu, Daron and James A. Robinson (2006a). Economic Origins of Dictatorship and
Democracy: Cambridge University Press.
Acemoglu, Daron and James A. Robinson (2006b). Economic Backwardness in Political
Perspective, American Political Science Review. 100 (1):115-131.
Aslaksen, Silje (2007). Corruption and Oil: Evidence from Panel Data, Unpublished
Manuscript, University of Oslo.
Beck, Thorsten, Philip E. Keefer and George R. Clarke (2009). Database of Political
Institutions (DPI 2009) Codebook, World Bank Economic Review.
Boschini, Anne D., Jan Pettersson and Jesper Roine (2007). Resource curse or not: a
question of appropriability, The Scandinavian Journal of Economics. 109 (3): 593-617.
Bourguignon, Francois, and Thierry Verdier (2000). Oligarchy, democracy, inequality and
growth, Journal of development Economics. 62 (2): 285-313.
Brunnschweiler, Christa N. (2008). Cursing the Blessings? Natural Resource Abundance,
Institutions, and Economic Growth, World Development. 36: 399-419.
Bulte, Erwin H., Richard Damania and Robert T. Deacon (2005). Resource Intensity,
Institutions and Development, World Development. 33: 1029-1044.

23
Busemeyer, Marius R. (2007). Determinants of public education spending in 21 OECD
democracies, 1980-2001, Journal of European Public Policy. 14 (4): 582-610.
Fernandez, Raquel and Richard Rogerson (1997). The determinants of public education
expenditures: evidence from the States, 1950-1990, No. w5995. National Bureau of
Economic Research.
Galor, Oded, Omer Moav and Dietrich Vollrath (2009). Inequality in Land Ownership, the
Emergence of Human Capital Promoting Institutions, and the Great Divergence, Review
of Economic Studies. 76: 143-179.
Glaeser, Edward L., Rafael La Porta, Florencio Lopez-De-Silanes and Andrei Shleifer
(2004). Do Institutions Cause Growth?, Journal of Economic Growth. 9: 271-303.
Heston, Alan, Robert Summers and Bettina Aten (2009). Penn World Table Version 6.3.
Center for International Comparisons of Production, Income and Prices at the University
of Pennsylvania.
Kaufmann, Daniel, Aart Kraay and Massimo Mastruzzi (2011). The Worldwide
Governance Indicators: Methodology and Analytical Issues, Hague Journal on the Rule of
Law. 3 (02): 220-246.
Lagerlof, Nils-Petter and Thomas Tangeras (2008). From rent seeking to human capital: a
model where resource shocks cause transitions from stagnation to growth, Canadian
Journal of Economics. 41 (3): 760-780.
Matsuyama, Kiminori (1992). Agricultural productivity, comparative advantage, and
economic growth, Journal of Economic Theory. 58: 317-334.
24
Mehlum, Halvor, Karl Moene and Ragnar Torvik (2006). Institutions and the resource
curse, Economic Journal. 116: 1-20.
Poterba, James M. (1997). Demographic Structure and the Political Economy of Public
Education, Journal of Policy Analysis and Management. 16 (1): 48-66.
Sachs, Jeffrey D. and Andrew M. Warner (1995). Natural Resource Abundance and
Economic Growth, No. w5398. National Bureau of Economic Research.
Stijns, Jean-Philippe (2006). Natural Resource Abundance and Human Capital
Accumulation, World Development. 34 (6): 1060-1083.