Influence of real phase equilibria
on the sizing of pressure relief
devices
ACHEMA CONGRESS 2015
15th June 2015, Frankfurt am Main
Stephan Dreisch, Frank Westphal, Monika Christ
15th June 2015 © consilab Gesellschaft für Anlagensicherheit mbH Slide 2
Motivation / Facts to start with
“Influence of real phase equilibria on pressure relief
devices” - Bachelor Thesis by Stephan Dreisch, 2014, in
continuation of a study by Christ, 2009 – “Influence of
improper input data on the size of a safety valve for a
tempered system”
Wrong temperatures at sizing conditions can lead to the most
decisive deviations for the sizing result
Sizing often based on vapour pressure curves of idealized
systems
Influence of real phase equilibria was not investigated
systematically until now

15th June 2015 © consilab Gesellschaft für Anlagensicherheit mbH Slide 3
Design case example
working
pressure
max. allowable
working
pressure
max. allowable
pressure during relief
closing
pressure
pressure
time
failure of
steam
control
M
safety valve
steam
Scenario: failure of external heating
15th June 2015 © consilab Gesellschaft für Anlagensicherheit mbH Slide 4
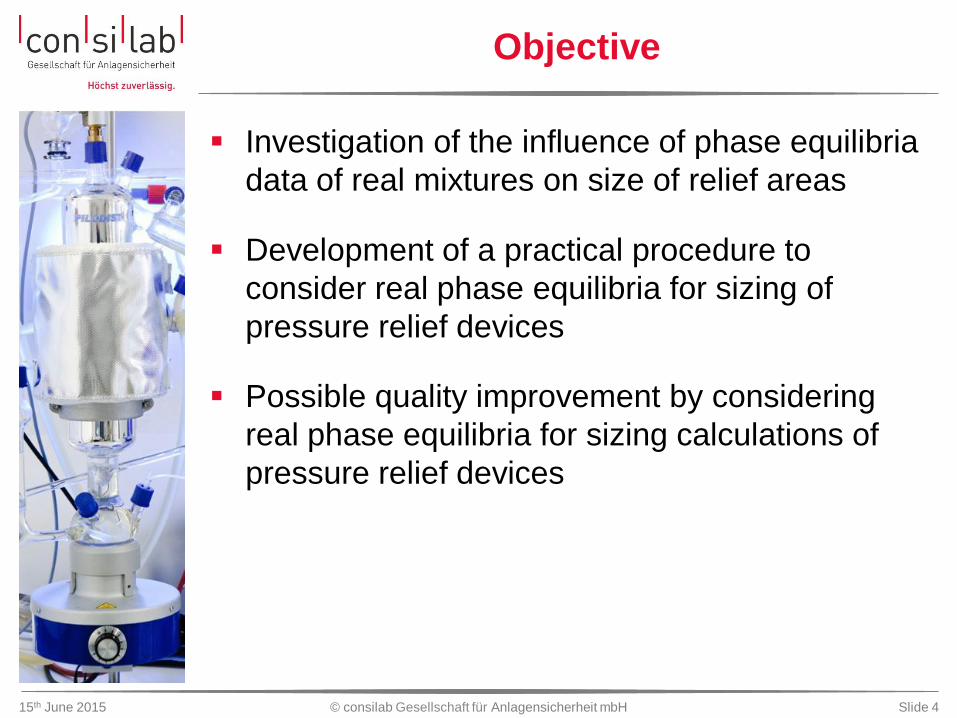
Objective
Investigation of the influence of phase equilibria
data of real mixtures on size of relief areas
Development of a practical procedure to
consider real phase equilibria for sizing of
pressure relief devices
Possible quality improvement by considering
real phase equilibria for sizing calculations of
pressure relief devices

15th June 2015 © consilab Gesellschaft für Anlagensicherheit mbH Slide 5
Approach
Selection of three binary solvent mixtures with
different characteristics and measurement of phase
equilibrium data by using a Vapour-Liquid-Equilibrium
apparatus (VLE)
Transfer of the phase equilibrium data into a
simulation software (ChemCAD®) and determination
of the phase equilibrium parameters
Vent sizing according to ISO 4126-10: “Safety devices
for protection against excessive pressure – Sizing of
safety valves for gas/liquid two phase flow”
Comparison of the vent sizing results to those based
on idealised systems and evaluation of occurring
errors
15th June 2015 © consilab Gesellschaft für Anlagensicherheit mbH Slide 6
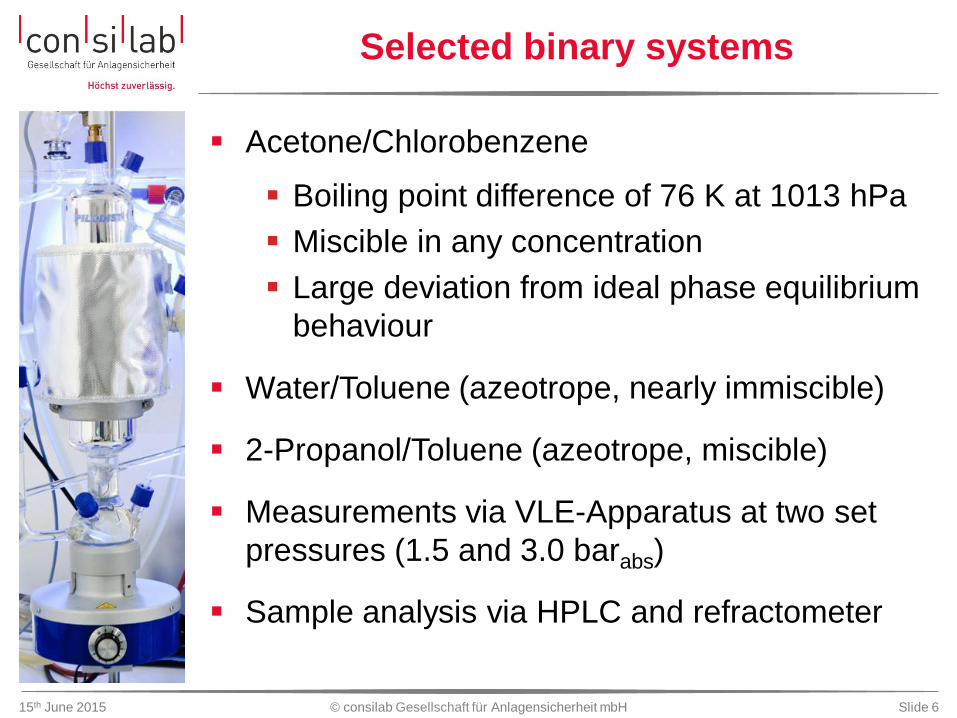
Selected binary systems
Acetone/Chlorobenzene
Boiling point difference of 76 K at 1013 hPa
Miscible in any concentration
Large deviation from ideal phase equilibrium
behaviour
Water/Toluene (azeotrope, nearly immiscible)
2-Propanol/Toluene (azeotrope, miscible)
Measurements via VLE-Apparatus at two set
pressures (1.5 and 3.0 barabs)
Sample analysis via HPLC and refractometer
15th June 2015 © consilab Gesellschaft für Anlagensicherheit mbH Slide 7
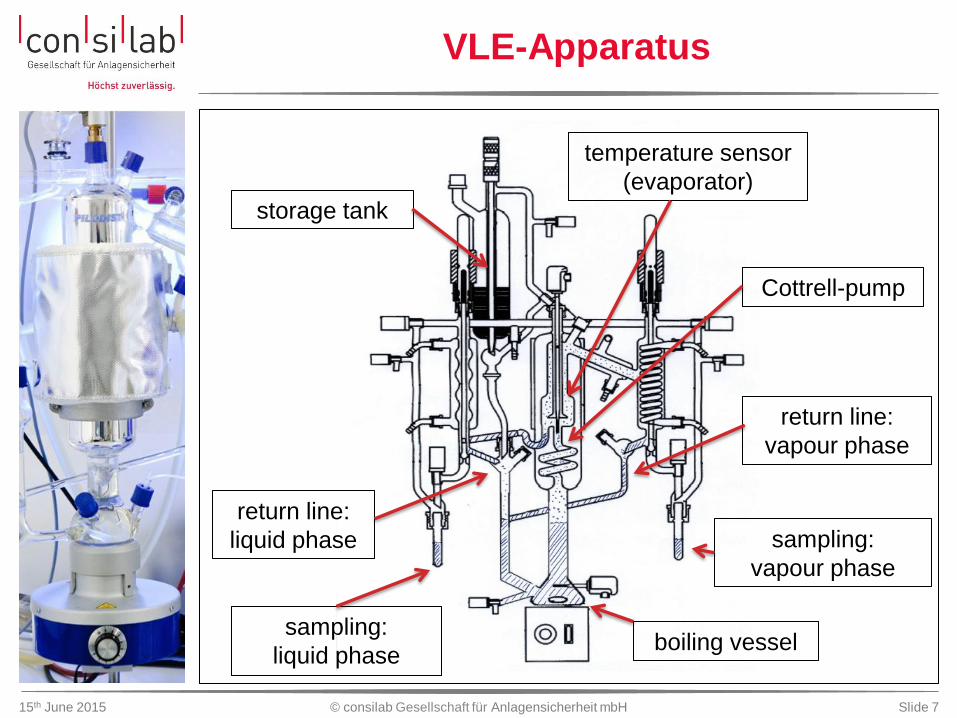
VLE-Apparatus
boiling vessel
sampling:
vapour phase
return line:
liquid phase
sampling:
liquid phase
return line:
vapour phase
Cottrell-pump
storage tank
temperature sensor
(evaporator)

15th June 2015 © consilab Gesellschaft für Anlagensicherheit mbH Slide 8
Results: acetone/chlorobenzene at 1.5 bar
0,0
0,1
0,2
0,3
0,4
0,5
0,6
0,7
0,8
0,9
1,0
0,0 0,1 0,2 0,3 0,4 0,5 0,6 0,7 0,8 0,9 1,0
ma
ss f
ract
ion
of
ace
ton
e in
ga
s p
ha
se
mass fraction of acetone in liquid phase
YX-diagram for an acetone/chlorobenzene system at 1.5 barabs
Measured values ChemCAD-Simulation Idealised
15th June 2015 © consilab Gesellschaft für Anlagensicherheit mbH Slide 9
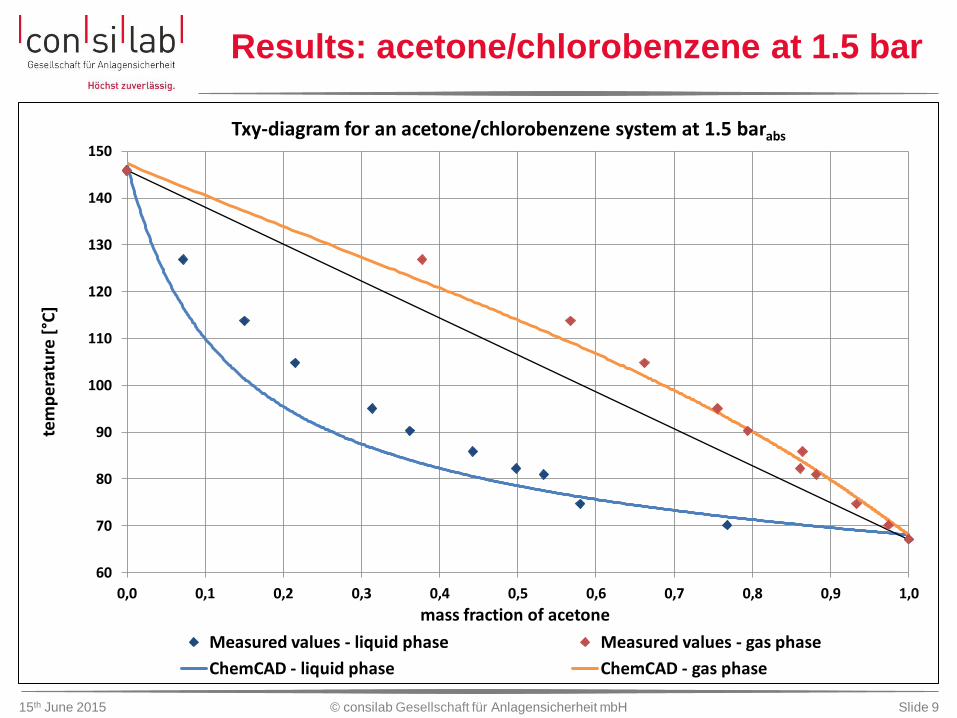
Results: acetone/chlorobenzene at 1.5 bar
60
70
80
90
100
110
120
130
140
150
0,0 0,1 0,2 0,3 0,4 0,5 0,6 0,7 0,8 0,9 1,0
tem
per
atu
re [
°C]
mass fraction of acetone
Txy-diagram for an acetone/chlorobenzene system at 1.5 barabs
Measured values - liquid phase Measured values - gas phase
ChemCAD - liquid phase ChemCAD - gas phase

15th June 2015 © consilab Gesellschaft für Anlagensicherheit mbH Slide 10
Summary of the experimental results
Good agreement of measured boiling points of
pure substances and simulated values
Good correlation of the trends in the YX- und
Txy-diagrams comparing the measured and
simulated values of the material systems
acetone/chlorobenzene and 2-propanol/toluene
Most of the measured equilibrium temperatures
are higher than the simulated temperatures

15th June 2015 © consilab Gesellschaft für Anlagensicherheit mbH Slide 11
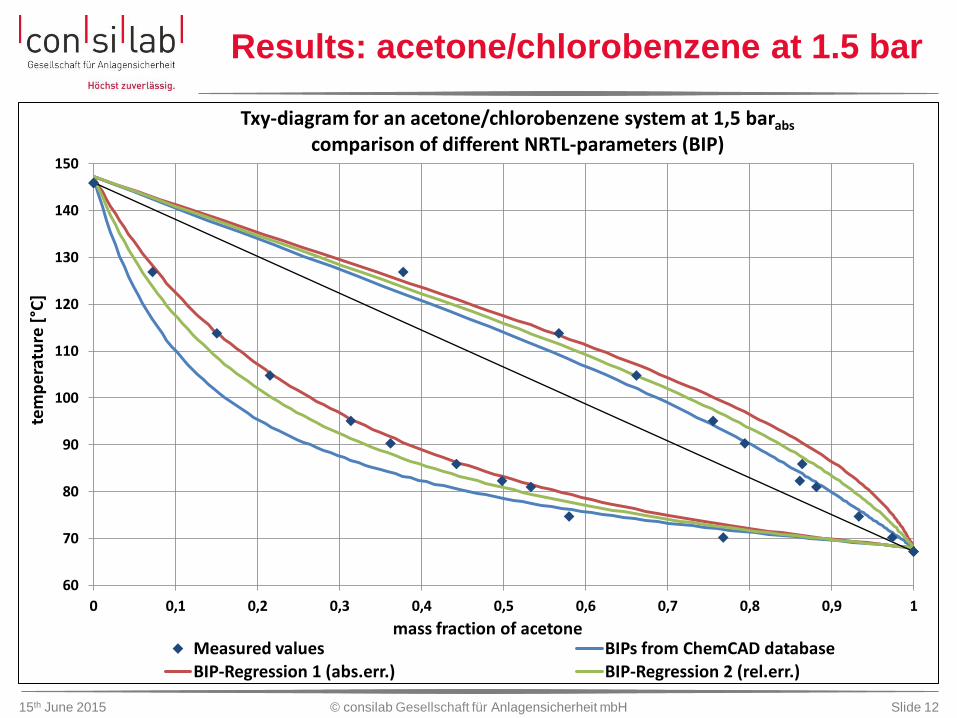
Determination of simulation parameters
(Binary Interaction Parameters - BIP)
Fit of the NRTL parameters (BIP) to measured
VLE data using ChemCAD®
Simulations in ChemCAD® using different
NRTL parameters at pressure levels 1.5 and
3.0 barabs:
BIP from ChemCAD® database
BIP-Regression 1 via ChemCAD®
(minimisation of the absolute errors)
BIP-Regression 2 via ChemCAD®
(minimisation of the relative errors)
15th June 2015 © consilab Gesellschaft für Anlagensicherheit mbH Slide 12
Results: acetone/chlorobenzene at 1.5 bar
60
70
80
90
100
110
120
130
140
150
0 0,1 0,2 0,3 0,4 0,5 0,6 0,7 0,8 0,9 1
tem
per
atu
re [
°C]
mass fraction of acetone
Txy-diagram for an acetone/chlorobenzene system at 1,5 barabs comparison of different NRTL-parameters (BIP)
Measured values BIPs from ChemCAD database BIP-Regression 1 (abs.err.) BIP-Regression 2 (rel.err.)
15th June 2015 © consilab Gesellschaft für Anlagensicherheit mbH Slide 13
Summary of the simulation results
Successful determination of the NRTL
parameters using measured VLE data of the
investigated systems
Good fit of the simulated trends with the trends
of the measured values
Large differences in equilibrium temperatures
(deviations up to 10 K)

15th June 2015 © consilab Gesellschaft für Anlagensicherheit mbH Slide 14
Vent sizing calculation
(according to ISO 4126-10)
Design Case: external heating / vapour system
Basic data: Vessel Volume: 10 m³
Heating Area: 15 m²
Liquid Surface Area: 3.8 m²
Steam Temperature: 200°C
Heat Transfer Coefficient: 800 W/(m²K)
Calculations for set pressures of 1.5 barabs and 3.0 barabs
Determination of the required relief area for
single phase vapour flow
two-phase flow
Physical properties of pure components from ChemCAD®-database
15th June 2015 © consilab Gesellschaft für Anlagensicherheit mbH Slide 15
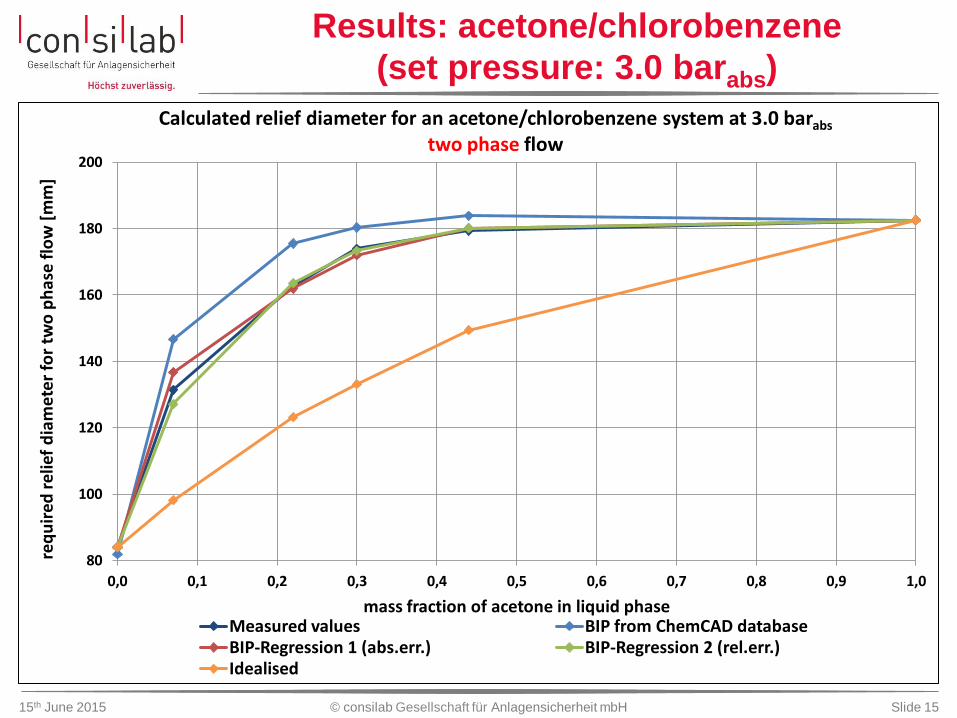
Results: acetone/chlorobenzene
(set pressure: 3.0 barabs)
80
100
120
140
160
180
200
0,0 0,1 0,2 0,3 0,4 0,5 0,6 0,7 0,8 0,9 1,0
req
uir
ed r
elie
f d
iam
ete
r fo
r tw
o p
has
e f
low
[m
m]
mass fraction of acetone in liquid phase
Calculated relief diameter for an acetone/chlorobenzene system at 3.0 barabs two phase flow
Measured values BIP from ChemCAD database BIP-Regression 1 (abs.err.) BIP-Regression 2 (rel.err.) Idealised

15th June 2015 © consilab Gesellschaft für Anlagensicherheit mbH Slide 16
Deviation of the sizing results
Deviation of the sizing results derived from NRTL models in
relation to the results derived from calculations with
measured data from VLE apparatus:
Negative values: sizing based on simulated data < sizing
based on measured data
system flow
regime
NRTL-
simulations idealised
min max min
acetone/chlorobenzene
(set pressure 3.0 barabs)
two phase -3.2% 11.6% -25.3%
vapour -2.7% 12.5% -19.2%
15th June 2015 © consilab Gesellschaft für Anlagensicherheit mbH Slide 17
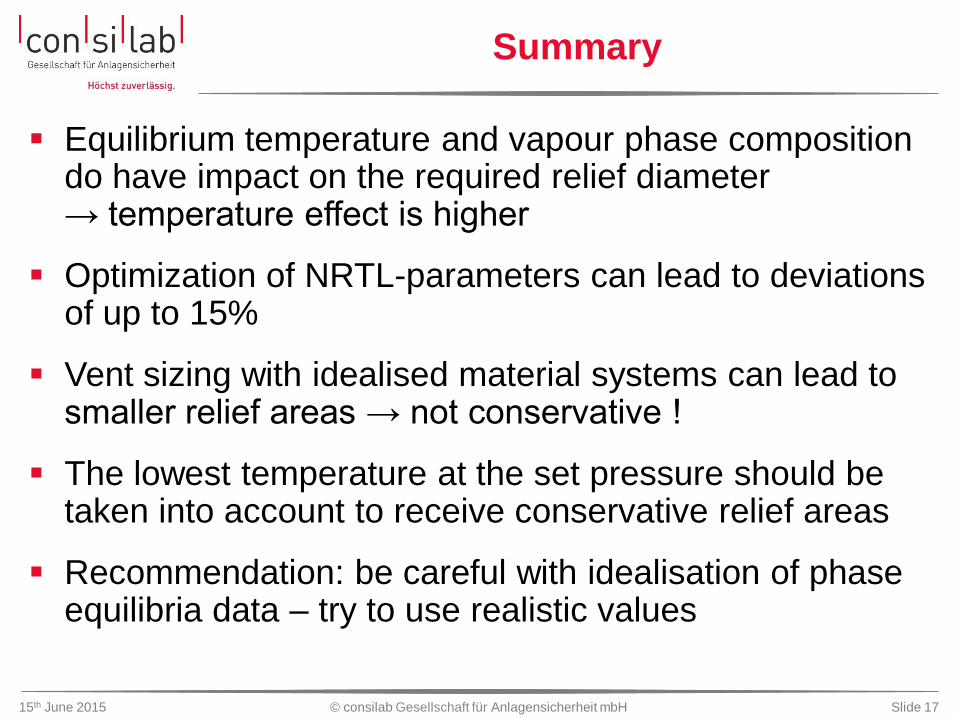
Summary
Equilibrium temperature and vapour phase composition do have impact on the required relief diameter → temperature effect is higher
Optimization of NRTL-parameters can lead to deviations of up to 15%
Vent sizing with idealised material systems can lead to smaller relief areas → not conservative !
The lowest temperature at the set pressure should be taken into account to receive conservative relief areas
Recommendation: be careful with idealisation of phase equilibria data – try to use realistic values
Thank you for
your attention. consilab
Gesellschaft für Anlagensicherheit mbH
Industriepark Höchst, G 830
65926 Frankfurt am Main
www.consilab.de
Stephan Dreisch, B. Sc.
T +49(0)69-305-30015
F +49(0)69-305-30014