Induced Mutations in Yeast Cell Populations Adapting toan Unforeseen ChallengeLindsay S. Moore1, Wu Wei2, Elad Stolovicki1, Tamar Benbenishty3, Stefan Wilkening4,
Lars M. Steinmetz2,4, Erez Braun1, Lior David3*
1Department of Physics & Network Biology Research Laboratories, Technion-Israel Institute of Technology, Haifa, Israel, 2 Stanford Genome Technology Center, Palo Alto,
California, United States of America, 3Department of Animal Sciences, The Hebrew University of Jerusalem, Rehovot, Israel, 4 European Molecular Biology Laboratory,
Genome Biology Unit, Heidelberg, Germany
Abstract
The modern evolutionary synthesis assumes that mutations occur at random, independently of the environment in whichthey confer an advantage. However, there are indications that cells facing challenging conditions can adapt rapidly, utilizingprocesses beyond selection of pre-existing genetic variation. Here, we show that a strong regulatory challenge can inducemutations in many independent yeast cells, in the absence of general mutagenesis. Whole genome sequencing of celllineages reveals a repertoire of independent mutations within a single lineage that arose only after the cells were exposedto the challenging environment, while other cells in the same lineage adapted without any mutation in their genomes.Thus, our experiments uncovered multiple alternative routes for heritable adaptation that were all induced in the samelineage during a short time period. Our results demonstrate the existence of adaptation mechanisms beyond randommutation, suggesting a tight connection between physiological and genetic processes.
Citation: Moore LS, Wei W, Stolovicki E, Benbenishty T, Wilkening S, et al. (2014) Induced Mutations in Yeast Cell Populations Adapting to an UnforeseenChallenge. PLoS ONE 9(10): e111133. doi:10.1371/journal.pone.0111133
Editor: Joseph Schacherer, University of Strasbourg, France
Received July 23, 2014; Accepted September 22, 2014; Published October 23, 2014
Copyright: � 2014 Moore et al. This is an open-access article distributed under the terms of the Creative Commons Attribution License, which permitsunrestricted use, distribution, and reproduction in any medium, provided the original author and source are credited.
Data Availability: The authors confirm that all data underlying the findings are fully available without restriction. Some relevant data is in SupportingInformation files. The sequencing data for the yeast strains was deposited in the Sequence Read Archive (SRA) of the NCBI database under the accession numberSRP033016.
Funding: LSM was supported by the Aly Kaufman postdoctoral Fellowship. This study was funded by the Israeli Science Foundation grants FIRST program 95/08to EB and LD and 496/10 to EB. Funding for this research was obtained also from the National Institutes of Health and the European Research Council under theEuropean Union’s Seventh Framework Programme (FP7/2007-2013)/ERC Grant agreement no. AdG-294542 to LMS. The funders had no role in study design, datacollection and analysis, decision to publish, or preparation of the manuscript.
Competing Interests: The authors have declared that no competing interests exist.
* Email: [email protected]
Introduction
Changes in the environment impose challenges that, unless
resolved by the organism, might drive its population to extinction.
The current consensus based on the modern synthesis separates
physiological processes from evolutionary adaptation. The former
are transient responses in an individual, while the latter relies on
selection of genetic variation that accumulates in the population
independently of the selective environment [1]. Recent research
however, has highlighted physiological and epigenetic processes
beyond genetics that could respond directly to environmental cues
and facilitate inheritance of adaptive traits [2–4]. Currently,
however, there is no framework that connects genetics to other
processes that might promote the occurrence of specific mutations
without an increase in the overall mutation rate.
Notwithstanding the success of the Neo-Darwinian framework
of adaptation based on random mutation and selection, this
framework alone cannot explain the entire spectrum of processes
that can lead to inherited adaptation. In particular, there are
indications that the rate of beneficial mutation is low [5–7] and
thus might be a problem for survival in unstable environments.
Alternatively, there are some indications that mutagenesis can be
induced under stressful conditions [8,9]. However, since deleteri-
ous mutations are more likely than beneficial ones, there are limits
to how pervasive this solution can be, and most efforts in this area
have explored the constraints on increased mutation rates in
response to a challenging environment [10–12]. In this paper, we
show by direct comparison of the genomic sequences of adapting
cells within a single lineage that mutations are induced by the
challenging environment within a strictly limited time window.
Furthermore, we demonstrate that mutations can emerge in
specific genes at a very high rate, but not due to general
mutagenesis in these lineages.
We have previously developed an experimental system to study
adaptation of genome-rewired yeast cells to an unforeseen
challenge. HIS3, an essential gene in the histidine biosynthesis
pathway has been placed under the exclusive regulation of the
GAL system, responsible for galactose utilization [13]. These
genome-rewired cells are faced with multiple challenges, primarily
those of gene regulation, and most notably the repression of HIS3in glucose based medium. We have previously shown that such
populations adapt quickly, within ,10 generations, to grow
exponentially in glucose medium lacking histidine (Glu-his) and
that this adaptation is inherited for many generations at the
population level [13,14]. Moreover, detailed experiments have
shown that, on average, 50% of the naı̈ve cells adapt on Glu-his
plates, suggesting that the rapid adaptation is not due to selection
of a rare pre-existing subpopulation but rather due to the
PLOS ONE | www.plosone.org 1 October 2014 | Volume 9 | Issue 10 | e111133
availability of multiple adaptation solutions [14]. In some adapted
populations, mutations in regulatory elements of the GAL system,
such as the repressor GAL80, were found, but by themselves these
mutations were not sufficient to stabilize the adapted phenotype
[15]. Naı̈ve, rewired cells with GAL80 mutation allele replacement
do not grow exponentially in Glu-his medium although as a
population they are more successful in this environment than
naı̈ve rewired cells with intact GAL80. These findings set the stage
to address two important questions: First, given that the
challenging environment induced the phenotypic adaptation
process, did the environment also induce the mutations that arise
in some of the cells? Second, does the observed, remarkable, high
rate of adaptation in our experiments also imply an exceptionally
high rate of mutation? To address these questions, we analyzed the
mutation repertoire in lineages originating from isolated single
cells following their adaptation to the glucose medium.
Results
We first measured the course of adaptation in lineages
originating from single cells by following the growth of individual,
adapting colonies using time-lapse microscopy. A naı̈ve, rewired
cell that had never before been exposed to Glu-his was placed on a
Glu-his agar plate after growth in galactose medium lacking
histidine (Gal-his). Previous measurements have shown that ,50%
of naı̈ve cells plated this way will grow an adapted colony within
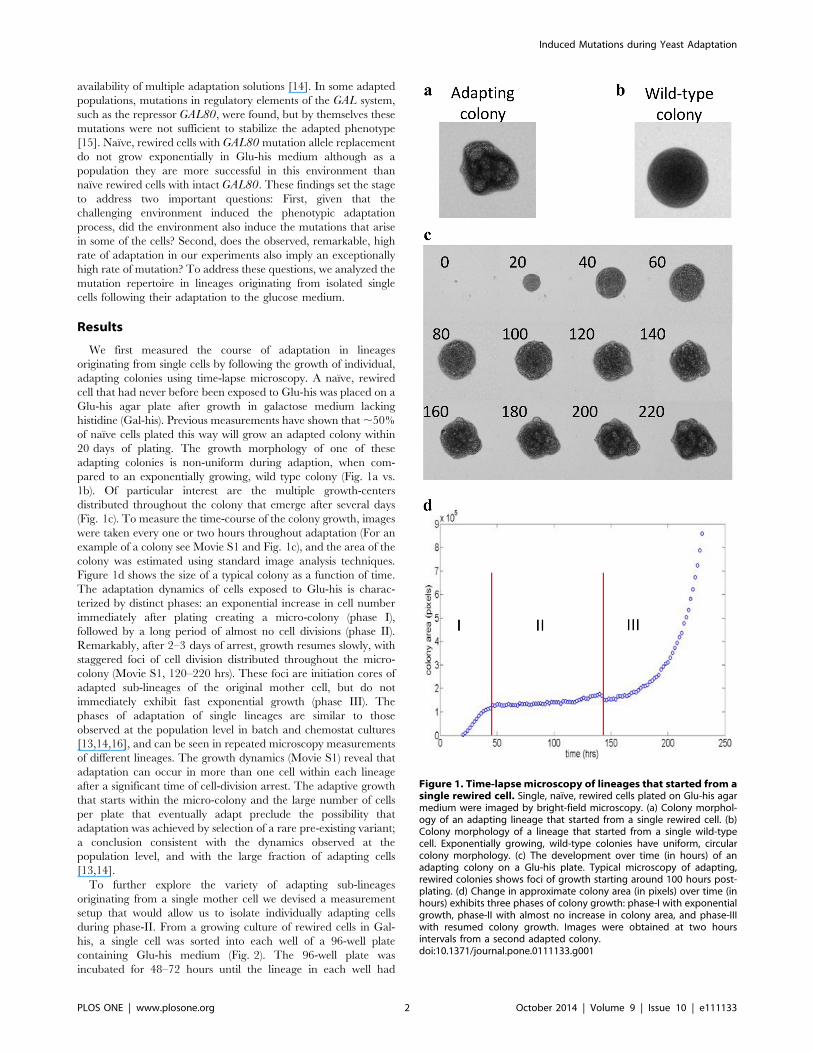
20 days of plating. The growth morphology of one of these
adapting colonies is non-uniform during adaption, when com-
pared to an exponentially growing, wild type colony (Fig. 1a vs.
1b). Of particular interest are the multiple growth-centers
distributed throughout the colony that emerge after several days
(Fig. 1c). To measure the time-course of the colony growth, images
were taken every one or two hours throughout adaptation (For an
example of a colony see Movie S1 and Fig. 1c), and the area of the
colony was estimated using standard image analysis techniques.
Figure 1d shows the size of a typical colony as a function of time.
The adaptation dynamics of cells exposed to Glu-his is charac-
terized by distinct phases: an exponential increase in cell number
immediately after plating creating a micro-colony (phase I),
followed by a long period of almost no cell divisions (phase II).
Remarkably, after 2–3 days of arrest, growth resumes slowly, with
staggered foci of cell division distributed throughout the micro-
colony (Movie S1, 120–220 hrs). These foci are initiation cores of
adapted sub-lineages of the original mother cell, but do not
immediately exhibit fast exponential growth (phase III). The
phases of adaptation of single lineages are similar to those
observed at the population level in batch and chemostat cultures
[13,14,16], and can be seen in repeated microscopy measurements
of different lineages. The growth dynamics (Movie S1) reveal that
adaptation can occur in more than one cell within each lineage
after a significant time of cell-division arrest. The adaptive growth
that starts within the micro-colony and the large number of cells
per plate that eventually adapt preclude the possibility that
adaptation was achieved by selection of a rare pre-existing variant;
a conclusion consistent with the dynamics observed at the
population level, and with the large fraction of adapting cells
[13,14].
To further explore the variety of adapting sub-lineages
originating from a single mother cell we devised a measurement
setup that would allow us to isolate individually adapting cells
during phase-II. From a growing culture of rewired cells in Gal-
his, a single cell was sorted into each well of a 96-well plate
containing Glu-his medium (Fig. 2). The 96-well plate was
incubated for 48–72 hours until the lineage in each well had
Figure 1. Time-lapse microscopy of lineages that started from asingle rewired cell. Single, naı̈ve, rewired cells plated on Glu-his agarmedium were imaged by bright-field microscopy. (a) Colony morphol-ogy of an adapting lineage that started from a single rewired cell. (b)Colony morphology of a lineage that started from a single wild-typecell. Exponentially growing, wild-type colonies have uniform, circularcolony morphology. (c) The development over time (in hours) of anadapting colony on a Glu-his plate. Typical microscopy of adapting,rewired colonies shows foci of growth starting around 100 hours post-plating. (d) Change in approximate colony area (in pixels) over time (inhours) exhibits three phases of colony growth: phase-I with exponentialgrowth, phase-II with almost no increase in colony area, and phase-IIIwith resumed colony growth. Images were obtained at two hoursintervals from a second adapted colony.doi:10.1371/journal.pone.0111133.g001
Induced Mutations during Yeast Adaptation
PLOS ONE | www.plosone.org 2 October 2014 | Volume 9 | Issue 10 | e111133

completely reached the end of phase-I, as marked by the effective
halt in cell division. At this stage, all cells from a single well were
spread on a Glu-his agar plate, physically isolating all daughter
cells of the lineage (lineages at the end of phase-I contained 400–
3000 cells). Plates were then incubated for 21 days. Notably, no
mature colonies were observed on the plates in the first five days of
incubation, indicating that after completing phase-I in the wells,
cells were not yet adapted (otherwise colony formation would have
immediately followed single-cell plating). Given more incubation
time, a subset of the plated sub-lineages resumed growth similar to
the staggering division foci observed in the time-lapse microscopy
and formed visible, adapted colonies. Fifty-six lineages, each
originating from separate wells, were grown in this way from a
total of three different batch cultures sorted into 96-well plates.
The number of adapted colonies per lineage was variable, with an
average of 19 independently-adapting sub-lineages per lineage
(Figure S1).
In contrast to adaptation of populations in batch or chemostat
cultures, adaptation on agar plates lacks competition among sub-
lineages, and thus provides a faithful representation of the
spectrum of adaptation solutions. We have previously identified
the gene GAL80 as a common locus for mutations in long-term
adaptation experiments, suggesting that the mutation either arises
early in adaptation or that it confers some selection advantage
[15]. Having eliminated the possible selective advantage of
mutations in this gene by the plate assay, we measured the
frequency of GAL80 mutations in 11 independent lineages by
sequencing this locus in all of the 192 adapted colonies belonging
to these lineages. Eight of the 192 adapted colonies (,4.2%) were
found to have a mutation in GAL80 and all these different
mutations were non-synonymous (Table 1).
In general, the incidence of mutations in GAL80 is much higher
than expected from previously estimated rates of random
mutations in yeast which were on the order of 1028 210210 per
base per generation [5,6,17], indicating that these mutations
emerged due to an unusual process. Indeed, we found colonies
with and without a GAL80 mutation within the same lineage and
different mutations were found between and even within lineages.
Thus, these mutations occurred independently, in different
colonies only after the daughter cells of each lineage were
separated on the Glu-his plates. Seven of the mutations were found
by Sanger sequencing. Since reliable base calling in this method
requires most sequenced molecules to have an identical base at
any given position, the identification of GAL80 mutations
indicates that these mutations emerged within the first 1–3
generations of adapted growth in the colony. If the mutation
emerged in the first adapted cell, all cells in the resulting colony,
being daughters of this first cell, will carry this mutation. If the
mutation emerged in one of the four cells resulting from the first
two divisions of the first adapted cell, J of the cells in the mature
colony will carry this mutation. Mutations emerging later than that
would be difficult to detect by Sanger sequencing.
More importantly, emergence of the mutations close to the time
of initial adapted growth rules out the option that the high
incidence of GAL80 mutation was a result of selection of a few
rare, advantageous variants that existed in the cell population
prior to spreading on Glu-his plates. With respect to the role of
selection in this adaptation process, the mutation emergence time
is consistent with the long time required for adapted colonies to
grow on the Glu-his plates, both indicating against selection of pre-
existing variants. The negligible role of selection is even clearer
when considering that remarkably, one adapted colony contained
adapted cells with and without a GAL80 mutation, while another
colony contained cells with one GAL80 mutation along with cells
containing a second mutation (Table 1). This gives further support
to the fact that the different mutations emerged independently,
Figure 2. Schematic of lineage separation technique. Single cells were sorted from a growing Gal-his culture of rewired cells into each well of a96-well plate containing 200 mL Glu-his medium. The 96-well plate was incubated for 48–72 hours at 30uC, shaking at 350 rpm until a halt in celldivision. All cells from a single well were then spread on a Glu-his agar plate and incubated for 21 days at 30uC. Each plate contained only a singlelineage, and each colony that grew represented an independently-adapted sub-lineage.doi:10.1371/journal.pone.0111133.g002
Induced Mutations during Yeast Adaptation
PLOS ONE | www.plosone.org 3 October 2014 | Volume 9 | Issue 10 | e111133

very early upon the resumption of growth of the sub-lineage that
formed this colony and certainly after plating.
Our results from adaptation in lineages therefore suggest that
either these mutation were generated as part of a general
mutagenesis process, or that they were induced due to a directed
physiological process after exposure to the challenging environ-
ment. To evaluate the possibility of general mutagenesis and to
verify the independence of the adapting sub-lineages, we
performed whole genome sequencing of two lineages. Lineage 1
included 17 independently adapting colonies, two with a mutation
in GAL80, and 15 without, while lineage 2 included nine
independently adapting colonies, one with a mutation in
GAL80, and eight without. Two additional clones with GAL80mutations from other lineages were also sequenced. The analysis
of the sequencing results was limited to adapted strains that had
genome coverage greater than five reads per base in 80% or more
of their nuclear genome. Mitochondrial DNA mutations were
excluded from the analysis. To identify mutations, the sequences
of the adapted strains were compared with the sequence of the
naı̈ve ancestral strain YPH499 plus the plasmid.
Comparing the 28 adapted strains to the naı̈ve reference strain,
three types of polymorphisms were found: chromosome duplica-
tions, insertions/deletions (indels) and single nucleotide polymor-
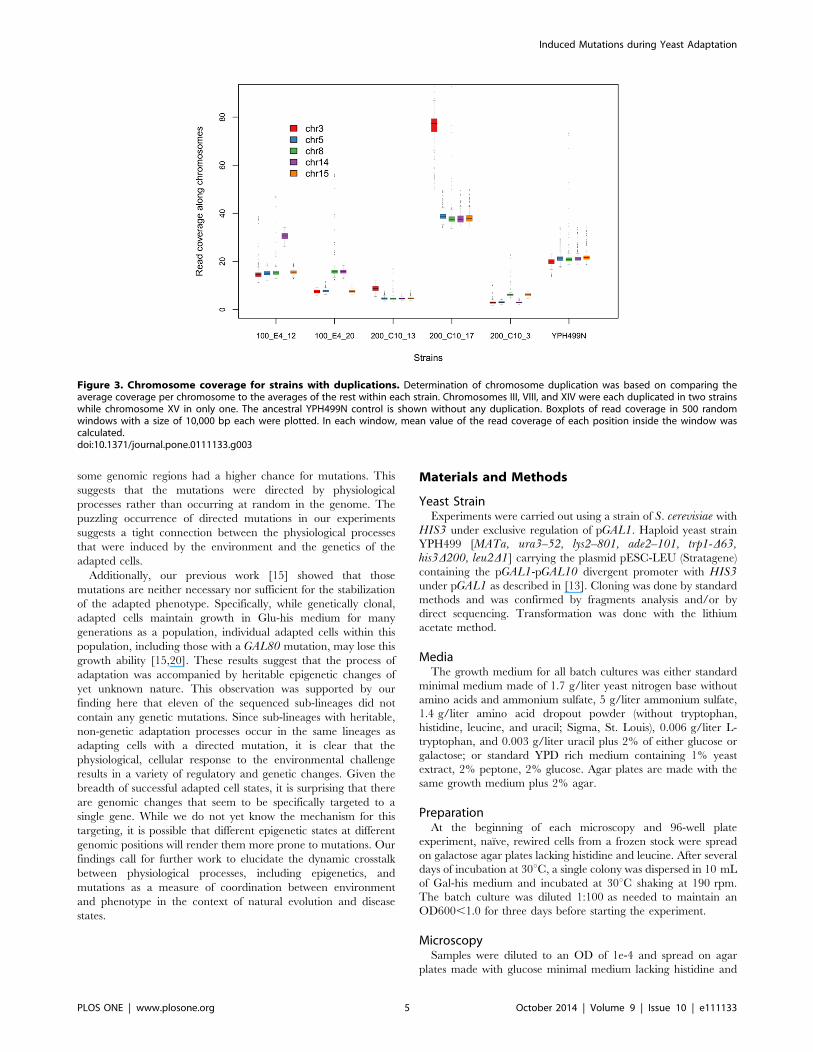
phisms (SNPs). First, we found that five strains had one or two
duplicated chromosomes (Fig. 3). Chromosomes III, VIII, and
XIV were each duplicated in two strains while chromosome XV in
only one. Second, after removing uncertain indels in low
complexity and repetitive sequences, five indels were found inside
genes (Fig. 4a and Table S1). Three of the indels kept the gene
sequence in-frame while two interrupted the open reading frame
(ORF) causing a frame shift and premature stop codons. Finally,
we found 18 SNPs in the 28 sequenced genomes: four intergenic,
four synonymous, three nonsense and seven missense (Fig. 4b and
Table S1). Excluding chromosome duplications, one genome
contained three mutations, four contained two, twelve contained
one mutation and, remarkably, eleven strains had no mutations at
all (Fig. 4c). The distribution of mutations in these sub-lineages,
and lack of repetition corroborates the conclusions from the
GAL80 sequencing that the mutations occurred independently
post plating.
Discussion
By separating sub-lineages on plates after completion of the
initial growth, we clearly demonstrated that not only was the
adapted phenotype gained after this first growth phase in the
challenging condition, but also the genetic changes were induced
after introduction of the challenge. Thus, the adaptation of these
rewired cells did not rely on selection of a few, rare genetic variants
that pre-existed prior to the challenge imposed by the environ-
ment. Given the large proportion of independently adapting cells,
we analyzed the repertoire of mutations in order to detect signs of
general mutagenesis that might underlie this prevalent adaptation.
Excluding chromosome duplications, the number of mutations per
genome was remarkably low (on average only 0.82 mutations per
genome). Therefore, there was no evidence for a general
mutagenesis process that could explain the high incidence of
independent GAL80 mutations. The per-base mutation incidence
can be estimated by dividing the sum of all SNPs and indels (23
mutations in total) by the sum of bases in 28 nuclear genomes. All
together, the per-base probability for a mutation was 6.861028
and the incidence of each polymorphism type was similar
(Table 2). These results are similar to those found in previous
studies [5,6,17]. Thus, neither the number of mutations per
genome, nor the normal per-base probability for mutations
indicates the existence of increased mutagenesis. Furthermore,
the strains with the known mutation in GAL80 did not have the
large number of additional mutations that would be required to
explain the high incidence of mutation in that gene under a
scenario of general mutagenesis.
This system of genome-rewired cells exposed to an unforeseen
challenge has uncovered a process of phenotypic adaptation
induced at unprecedented rates of 50%, on average [13,14].
Analysis and comparison of adapting sub-lineages descending
from a single mother cell showed that specific mutations were
induced in a narrow time window after exposure to the
challenging environment, but were not a result of general
mutagenesis. The existence of directed mutations and the current
understanding of stress-induced mutations are subjects of fierce
debates [8,9,18,19]. GAL80 comprises approximately 0.0001 of
the genome sequence and the incidence of mutations in that gene
was 0.042. Thus, our results indicate that during the time at which
cells experienced the regulatory stress of the Glu-his environment,
Table 1. GAL80 mutations identified in lineages of adapted clones.
LineageNumber ofadapted clones
Mutated clone(sub-clone)
DNApolymorphism1
Proteinpolymorphism2 Remarks
1 1 24 6 1174, C .T 392, Q.* Heterogeneous colony bySanger sequencing
2 1 24 8(14) 457, C.G 153, R.G Co-existed in onecolony with 3
3 1 24 8(12) 281, 1bp deletion Frame shift and * Co-existed in onecolony with 2
4 1 24 10 421, G.T 141, E.* Not detected bySanger sequencing
5 1 24 18 1189, G .T 397, E.*
6 2 19 5 457, C.G 153, R.G
7 3 16 9 458, G.C 153, R.P
8 4 32 8 893, G.A 298, G.D
1The position in base pairs relative to the first base of the start codon, the original and new nucleotides.2The protein sequence position, the original and new amino acids. * denotes a change into stop codon.doi:10.1371/journal.pone.0111133.t001
Induced Mutations during Yeast Adaptation
PLOS ONE | www.plosone.org 4 October 2014 | Volume 9 | Issue 10 | e111133
some genomic regions had a higher chance for mutations. This
suggests that the mutations were directed by physiological
processes rather than occurring at random in the genome. The
puzzling occurrence of directed mutations in our experiments
suggests a tight connection between the physiological processes
that were induced by the environment and the genetics of the
adapted cells.
Additionally, our previous work [15] showed that those
mutations are neither necessary nor sufficient for the stabilization
of the adapted phenotype. Specifically, while genetically clonal,
adapted cells maintain growth in Glu-his medium for many
generations as a population, individual adapted cells within this
population, including those with a GAL80 mutation, may lose this
growth ability [15,20]. These results suggest that the process of
adaptation was accompanied by heritable epigenetic changes of
yet unknown nature. This observation was supported by our
finding here that eleven of the sequenced sub-lineages did not
contain any genetic mutations. Since sub-lineages with heritable,
non-genetic adaptation processes occur in the same lineages as
adapting cells with a directed mutation, it is clear that the
physiological, cellular response to the environmental challenge
results in a variety of regulatory and genetic changes. Given the
breadth of successful adapted cell states, it is surprising that there
are genomic changes that seem to be specifically targeted to a
single gene. While we do not yet know the mechanism for this
targeting, it is possible that different epigenetic states at different
genomic positions will render them more prone to mutations. Our
findings call for further work to elucidate the dynamic crosstalk
between physiological processes, including epigenetics, and
mutations as a measure of coordination between environment
and phenotype in the context of natural evolution and disease
states.
Materials and Methods
Yeast StrainExperiments were carried out using a strain of S. cerevisiae with
HIS3 under exclusive regulation of pGAL1. Haploid yeast strain
YPH499 [MATa, ura3–52, lys2–801, ade2–101, trp1-D63,his3D200, leu2D1] carrying the plasmid pESC-LEU (Stratagene)
containing the pGAL1-pGAL10 divergent promoter with HIS3under pGAL1 as described in [13]. Cloning was done by standard
methods and was confirmed by fragments analysis and/or by
direct sequencing. Transformation was done with the lithium
acetate method.
MediaThe growth medium for all batch cultures was either standard
minimal medium made of 1.7 g/liter yeast nitrogen base without
amino acids and ammonium sulfate, 5 g/liter ammonium sulfate,
1.4 g/liter amino acid dropout powder (without tryptophan,
histidine, leucine, and uracil; Sigma, St. Louis), 0.006 g/liter L-
tryptophan, and 0.003 g/liter uracil plus 2% of either glucose or
galactose; or standard YPD rich medium containing 1% yeast
extract, 2% peptone, 2% glucose. Agar plates are made with the
same growth medium plus 2% agar.
PreparationAt the beginning of each microscopy and 96-well plate
experiment, naı̈ve, rewired cells from a frozen stock were spread
on galactose agar plates lacking histidine and leucine. After several
days of incubation at 30uC, a single colony was dispersed in 10 mL
of Gal-his medium and incubated at 30uC shaking at 190 rpm.
The batch culture was diluted 1:100 as needed to maintain an
OD600,1.0 for three days before starting the experiment.
MicroscopySamples were diluted to an OD of 1e-4 and spread on agar
plates made with glucose minimal medium lacking histidine and
Figure 3. Chromosome coverage for strains with duplications. Determination of chromosome duplication was based on comparing theaverage coverage per chromosome to the averages of the rest within each strain. Chromosomes III, VIII, and XIV were each duplicated in two strainswhile chromosome XV in only one. The ancestral YPH499N control is shown without any duplication. Boxplots of read coverage in 500 randomwindows with a size of 10,000 bp each were plotted. In each window, mean value of the read coverage of each position inside the window wascalculated.doi:10.1371/journal.pone.0111133.g003
Induced Mutations during Yeast Adaptation
PLOS ONE | www.plosone.org 5 October 2014 | Volume 9 | Issue 10 | e111133

leucine. Plates were incubated for 10–20hours at 30uC to allow a
few cell divisions to occur. An agar plate was placed on a 40 plate
holder on a Zeiss inverted microscope fitted with an OXO
incubator at 30uC and a homemade humidifier. Individual
colonies were identified by eye and imaged using Zeiss Axiovision
software together with an ASI stage that allows for acquisition of
many positions per time-point. Colonies were imaged every one or
two hours and the focus was corrected manually every eight hours
for the duration of the imaging. Images were analyzed using a
homemade segmentation routine (Matlab) to estimate colony area.
96-well plate assayTwo-hundred micro-liters of Glu-his medium were put in each
well of a 96-well plate. Naı̈ve yeast cells were deposited, 1 cell per
well, using FACS. The 96-well plates were closed with the lids that
came with the plates to allow air flow into the samples. The plates
were incubated at 30uC for 48–72 hours under a bell jar to
maintain humidity, until the lineage in the well had ceased
exponential growth. Wells were verified to contain populations
using light microscopy before all 200 micro-liters was pipetted
onto the surface of a 9 cm Glu-his agar plate and spread with
sterile glass beads.
96-well plate assay controlsWe verified that one cell was being deposited per well of the
plate by depositing single cells by FACS into wells of a 96-well
plate that had been previously filled with YPD agar. The 96 well
plates were incubated for 12 hours and then scanned using light
microscopy to determine how many micro-colonies were growing
in each well. Two 96-well plates were filled with YPD agar and a
single cell was plated in each well. After 12 hours incubation,
1 well had foreign contamination, 2 wells had bubbles interrupting
the surface of the agar, making imaging impossible, and 1 well had
2 micro-colonies. Therefore, the error rate of single-cell plating is
1/189, or 0.05%.
The average number of cells in each well during phase-II was
determined by plating the entire contents of 16 phase-II wells onto
16 YPD agar plates. The plates were incubated at 30uC for 3 days
and then counted. The mean number of colonies that grew was
1357, with a standard deviation of 676 and an estimated standard
error of 169.
Two single-lineage Glu-his agar plates were inspected with
brightfield microscopy after 21-day incubation using a 10x
objective to count the number of colonies that were invisible to
the naked eye. The first plate had approximately 700 cells in 27
small colonies of 3–100 cells in addition to 8 colonies that were
adapted and visible. The second plate had approximately 300 cells
in 7 small colonies of 3–150 cells in addition to 7 adapted colonies.
Sanger SequencingAll adapted colonies of each lineage were picked from the agar
Glu-his plates and stored in 96-well plates containing YPD rich
medium and glycerol. Stamps of these plates were used to grow
100 mL cultures in YPD for DNA extraction. GAL80 sequencing
was done directly on PCR products cleaned by ExoSAP using four
Figure 4. Distribution of mutation types and locations.Mutations in nuclear DNA from the 28 adapted strains from twolineages contained indels, SNPs and chromosome duplications. A)Distribution by chromosome of each mutation type. B) Distribution ofthe different kinds of SNPs and indels in the 28 strains show noenrichment of a single mutation type. C) Distribution of the number ofmutations per strain (excluding chromosome duplication) across the 28adapted strains. Most genomes contained one mutation or nomutations at all.doi:10.1371/journal.pone.0111133.g004
Table 2. The per-base mutation incidence in adapted strains by mutation types.
Mutation type Per-base incidence
Intergenic 1.18E-08
Synonymous 1.18E-08
Missense 2.07E-08
Nonsense 8.88E-09
Indel 1.48E-08
All types 6.8E-08
doi:10.1371/journal.pone.0111133.t002
Induced Mutations during Yeast Adaptation
PLOS ONE | www.plosone.org 6 October 2014 | Volume 9 | Issue 10 | e111133

primer pairs with at least 100 bp overlap between products, which
together covered the sequence of the promoter and GAL80 ORF.
Each PCR amplicon was sequenced in both directions using the
PCR primers. Sequences of each colony were assembled, aligned,
and analyzed for polymorphisms using the SeqScape V2.6
software (Applied Biosystems) with settings to detect heterozygous
loci with a rare allele frequency of 25% or more. Before whole
genome sequencing, identified mutations in GAL80 were
sequenced again to verify the identity of the DNA sent for further
analysis. In the case that two different GAL80 mutations were
found within one adapted colony, single cells were spread on a
plate and 10 representative clones were sequenced to verify the
existence of both mutations in different cells.
Whole genome Illumina sequencing and analysisGenomic DNA of YPH499N and 39 adapted strains was
extracted and subjected to whole-genome resequencing using
paired-end sequencing on Illumina Genome Analyzer IIx.
Indexing strains for pooling, libraries preparation and sequencing
were done as described before [21]. The sequencing reads from all
samples were aligned to the reference genome using Novoalign
V2.07.18 (http://www.novocraft.com) with parameters -rRan-
dom. The S. cerevisiae S288c genome (SGD R64, http://www.
yeastgenome.org), along with the sequences of the plasmid, were
used as reference genome sequences. The sequencing data for the
yeast strains was deposited in NCBI database and can be accessed
through BioProject (PRJNA227232, http://www.ncbi.nlm.nih.
gov/bioproject/227232) or the Sequence Read Archive (SRA,
SRP033016, http://www.ncbi.nlm.nih.gov/sra/
?term=SRP033016). SAMtools [22] was used to detect all
potential SNPs and Indels for further analysis. Adapted strain
specific SNPs were inferred by comparing the frequencies of each
nucleotide at each position to the frequencies obtained from the
original YPH499N strain. Adapted strain specific Indels were
manually checked by comparing to the alignments in YPH499N
strain. Whole chromosome duplication was estimated by the read
coverage of each chromosome comparing to the whole genome
coverage.
Supporting Information
Figure S1 Number of adapted colonies per lineage. A
single, naı̈ve, rewired cell was sorted into each well of a 96-well
plate containing Glu-his medium. After 48–72 hours incubation,
the contents of each well that corresponds to a single lineage were
spread on Glu-his agar plates. Colonies were counted after 21 days
incubation at 30uC. A histogram of the number of adapted
colonies that grew per lineage shows a surprisingly large number of
independently adapting sub-lineages (average 19, standard
deviation 13.6).
(TIF)
Table S1 List of 23 mutations found in 28 adaptedstrains.
(DOCX)
Movie S1 Time-lapse microscopy of a single lineage.Single, naı̈ve, rewired cells plated on Glu-his agar medium were
imaged every one hour. Video shows typical dynamics of an
adapting lineage grown in this way, depicting continuous
progression of adaptation growth of a single lineage. Note that
adaptive growth starts at multiple foci within the cell lineage.
(MP4)
Acknowledgments
The authors would like to thank the LS&E Infrastructure Unit of the
Technion, in particular Dr. Sarah Maurice for outstanding technical
support.
Author Contributions
Conceived and designed the experiments: EB LSM ES LMS LD.
Performed the experiments: LSM TB ES SW LD. Analyzed the data:
LSM WW EB LD. Contributed reagents/materials/analysis tools: EB LD
LMS WW LSM. Contributed to the writing of the manuscript: LSM EB
LD.
References
1. Huxley J (1942) Evolution: the modern synthesis. London: Allen & Unwin.
2. Jablonka E, Raz G (2009) Transgenerational epigenetic inheritance: prevalence,mechanisms and implications for the study of heredity and evolution. The
Quarterly Review of Biology 84: 131–176.3. Johannes F, Colot V, Jansen RC (2008) OPINION Epigenome dynamics: a
quantitative genetics perspective. Nature Reviews Genetics 9: 883–890.
4. Rando OJ, Verstrepen KJ (2007) Timescales of genetic and epigeneticinheritance. Cell 128: 655–668.
5. Kondrashov FA, Kondrashov AS (2010) Measurements of spontaneous rates ofmutations in the recent past and the near future. Philosophical Transactions of
the Royal Society B: Biological Sciences 365: 1169–1176.6. Lang GI, Murray AW (2008) Estimating the Per-Base-Pair Mutation Rate in the
Yeast Saccharomyces cerevisiae. Genetics 178: 67–82.
7. Luria SE, Delbruck M (1943) Mutations of bacteria from virus sensitivity to virusresistance. Genetics 28: 491–511.
8. Martincorena I, Luscombe NM (2013) Non-random mutation: The evolution oftargeted hypermutation and hypomutation. BioEssays : news and reviews in
molecular, cellular and developmental biology 35: 123–130.
9. Rosenberg SM, Shee C, Frisch RL, Hastings PJ (2012) Stress-induced mutationvia DNA breaks in Escherichia coli: A molecular mechanism with implications
for evolution and medicine. Bioessays 34: 885–892.10. Ram Y, Hadany L (2012) The evolution of stress-induced hypermutation in
asexual populations. Evolution 66: 2315–2328.11. Sniegowski PD, Gerrish PJ, Johnson T, Shaver A (2000) The evolution of
mutation rates: separating causes from consequences. Bioessays 22: 1057–1066.
12. Sniegowski PD, Murphy HA (2006) Evolvability. Current Biology 16: R831–R834.
13. Stolovicki E, Dror T, Brenner N, Braun E (2006) Synthetic gene recruitment
reveals adaptive reprogramming of gene regulation in yeast. Genetics 173: 75–
85.
14. David L, Stolovicki E, Haziz E, Braun E (2010) Inherited adaptation of genome-
rewired cells in response to a challenging environment. HFSP Journal 4: 131–
141.
15. David L, Ben-Harosh Y, Stolovicki E, Moore LS, Michelle N, et al. (2013)
Multiple Genomic changes associated with reorganization of gene regulation
and adaptation in yeast. Molecular Biology and Evolution 30: 1514–1526.
16. Stern S, Dror T, Stolovicki E, Brenner N, Braun E (2007) Transcriptional
plasticity underlies cellular adaptation to novel challenge. Molecular Systems
Biology 3.
17. Zeyl C (2004) Capturing the adaptive mutation in yeast. Research in
Microbiology 155: 217–223.
18. Hall BG (1998) Adaptive mutagenesis: a process that generates almost
exclusively beneficial mutations. Genetica 102–3: 109–125.
19. Roth JR, Kugelberg E, Reams AB, Kofoid E, Andersson DI (2006) Origin of
Mutations Under Selection: The Adaptive Mutation Controversy. Annual
Review of Microbiology 60: 477–501.
20. Stolovicki E, Braun E (2011) Collective Dynamics of Gene Expression in Cell
Populations. PLoS ONE 6: e20530.
21. Wilkening S, Tekkedil M, Lin G, Fritsch E, Wei W, et al. (2013) Genotyping
1000 yeast strains by next-generation sequencing. BMC Genomics 14: 90.
22. Li H, Handsaker B, Wysoker A, Fennell T, Ruan J, et al. (2009) The Sequence
Alignment/Map format and SAMtools. Bioinformatics 25: 2078–2079.
Induced Mutations during Yeast Adaptation
PLOS ONE | www.plosone.org 7 October 2014 | Volume 9 | Issue 10 | e111133