Indirect Local Government Productivity Measurement
1
Indirect Local Government
Productivity Measurement Essential Services Commission Final Report April 2017

Indirect Local Government Productivity Measurement
i
Contents
Glossary ii
Executive summary iii
1 Background 7
1.1 Local government rate capping framework 7 1.2 Productivity in local government 7 1.3 Issues with measuring productivity in local government 7 1.4 Direct and indirect measures of productivity 8 1.5 This report 8
2 Data and approach 10
2.1 Australian Bureau of Statistics productivity data 10 2.2 Approach to estimating productivity measures 10
Use of overall market productivity values 12
3 Gross output measures 13
3.1 Advantages and disadvantages 13 3.2 Labour productivity 13 3.3 Capital productivity 14 3.4 Multi-factor productivity 15 3.5 KLEMS MFP 16 3.6 Assessment of gross output measures 17
4 Value added measures 18
4.1 Advantages and disadvantages 18 4.2 Labour productivity 18 4.3 Capital productivity 19 4.4 Capital-labour MFP 20 4.5 Assessment of value added measures 22
5 Discussion 23
5.1 Overall comparison of measures 23 5.2 Measurement period 24 5.3 Negative productivity 24 5.4 Gross output and value added measures 24 5.5 Labour, capital and multifactor productivity measures 25 5.6 Industries to use 25
References 27
Appendix A: Use of longer time series in estimating productivity 28
Appendix B: Considerations for negative productivity factors 30
Limitation of our work 32
General use restriction 32

Indirect Local Government Productivity Measurement
ii
Glossary
Acronym Full name
ABS Australian Bureau of Statistics
ANZSIC Australian and New Zealand Standard Industrial Classification
ESC Essential Services Commission
KLEMS K-capital, L-labour, E-energy, M-materials, and S-purchased services
MFP Multi-factor productivity

Commercial-in-confidence
Indirect Local Government Productivity Measurement
iii
Executive summary
In February 2015 the Victorian Government appointed the Essential
Services Commission (ESC) to undertake an independent inquiry and
provide advice on the introduction of a rates capping framework for local
government.
In September 2015, the ESC published its report on the proposed
framework. The Government responded in October 2015, resulting in the
Local Government Amendment (Fair Go Rates) Act 2015, assented to
December 2015. The framework was applied for the 2016-17 year.
The initial rate cap was set using a formula of 0.6 x Consumer Price Index
+0.4 x Wage Price Index - Productivity Factor. The ESC suggested the
efficiency factor should be zero for 2016-17 and increase by 0.05% per
annum each year.
However, the ESC has undertaken to review this efficiency factor and we
understand is undertaking two streams of work. The first stream is
focussed on directly measuring local government productivity, whereas the
aim of the second stream – and the subject of this report – is to identify
and calculate indirect measures of productivity improvement which could be
used in the rate cap formula.
Overview of report
This report focuses on the productivity factor in the rate-capping formula,
and considers estimates for the factor based on indirect measures of
productivity.
It considers the seven indirect measures outlined by NERA (2016) using the
Organisation for Economic Co-operation and Development’s framework (see
Figure i:). Deloitte Access Economics also considered alternative indirect
measures of productivity but did not identify any that were suitable to add
to the OECD’s framework.
Figure i: OECD classification of aggregate measures
Source: OECD 2011, cited in NERA 2016
Commercial-in-confidence
Indirect Local Government Productivity Measurement
iv
Data was collected from the Australian Bureau of Statistics (ABS) to
calculate each of the measures of productivity for the Victorian local
government sector. All of this baseline data is publicly available,
transparent and independently verifiable.
It is important to note that the ABS does not provide productivity data for
three key industries, at least two of which reflect some of the activities
undertaken by local government. These are the Public Administration and
Safety, Health Care and Social Assistance, and Education and Training
industry classifications. This means that data for other industries must be
used instead.
This report is supplemented by a spreadsheet, provided to the ESC, which
collates the data and calculates each of these measures.
Methodology for estimating productivity
In deciding whether and how to use an indirect productivity measure in the
rate-capping formula, decisions need to be made on a range of matters
including:
the period over which productivity is to be measured – averaging over a
longer period will produce less ‘volatile’ results but may result in
estimates reflecting historical factors which are not relevant today;
how to deal with negative productivity results
whether to use a gross output or a value added approach
whether to use a labour, capital or multifactor productivity (MFP)
estimate of productivity
which industries to use in the productivity calculation. This choice boils
down to whether to use a weighted sub-set of industries that best
reflect local government activities, or whether to use the ABS all-
industries estimate.
These issues are discussed in section 5 of this report. Ultimately, selection
of the best indirect proxy for potential productivity improvement in the
Victorian local government sector to use in the rate capping formula is not
straightforward. There is no unambiguously preferable measure.
Productivity estimates
We have calculated a range of historic indirect productivity estimates using
ABS data over range of periods, including four measures based on gross
output and three based on value-added approaches.
The following table summarises these productivity estimates, presented as
an average annual productivity growth rate (%). A positive number
indicates an average annual improvement in productivity, while a negative
number indicates an annual average reduction in productivity.
Note that most estimates in the table below use a weighting of three
industries - administrative and support services, arts and recreation
services and transport, and postal and warehousing industries based on
expenditure data at the Victorian local government level. In the last row we
have also shown the 16 sector average for value added MFP (noting that
the ABS does not produce a 16 sector average for gross output MFP).
Features of the productivity estimates are that:
they are quite different depending on the measure used;

Commercial-in-confidence
Indirect Local Government Productivity Measurement
v
there is significant inter-year variation across most of the individual
estimates; and
slightly more than half of the estimates show negative productivity
growth i.e. productivity reductions.
Table i: Gross output and value added productivity growth rates
Five years
to 2014-15
Average
since 2005-
06
15-year
average
(since
2000-01)
Average
since 1995-
96
Gross
output
Labour
productivity 0.46% 0.66% 0.77% 0.62%
Capital
productivity -1.32% -2.43% -3.63% -3.23%
MFP -0.17% -0.20% 0.11% 0.29%
KLEMS MFP 0.16% -0.12% -0.01% 0.00%
Value
added
Labour
productivity -0.68% -0.40% 0.08% 0.17%
Capital
productivity -1.77% -3.08% -3.05% -3.50%
MFP -0.95% -0.90% -0.45% -0.46%
MFP (16
market sector
industries)*
0.17% -0.16% 0.13% 0.47%
* 16 market sector industries as defined by the Australian Bureau of Statistics
The table above shows that the longer term estimates (i.e. averaging over
10 years +) of productivity using the MFP and labour productivity fall in the
range of -0.9% to +0.8%: the ESC’s current value of +0.05% lies roughly
in the midpoint of this.
However, capital productivity measures are much more significantly
negative, noting that capital productivity growth has been consistently
negative across most Australian sectors for some time. This reflects high
levels of capital expenditure and output per unit of capital decreasing as
capital is employed to increasingly marginal uses. The mining and oil and
gas sectors are a particular example, and indeed much of the output growth
in these industries has occurred since 2014-15, meaning that while the
input increase is reflected in the productivity estimates, the output growth
is not.
Deloitte Access Economics notes that value added MFP may be the measure
most suited to estimating productivity growth in Victorian local government.
Local government uses both capital and labour inputs and the rate capping
formula reflects both capital and labour factors.
Deloitte Access Economics also recommends the use of productivity
estimates from industries weighted by actual Victorian Government
expenditure. Alternatively, the ABS estimates productivity for 16 market
sector industries. The following table summarises the averages using both
approaches; while using the three weighted industries is preferred by DAE,
both measures are appropriate.

Commercial-in-confidence
Indirect Local Government Productivity Measurement
vi
Table ii: Comparison of growth rates using different industries
5-year
average
(since 2010-
11)
10-year
average
(since 2005-
06)
15 year
average
(since 2000-
01)
20-year
average
(since 1995-
96)
3 weighted
industries -0.95% -0.90% -0.45% -0.46%
16 market
sector
industries
0.17% -0.16% 0.13% 0.47%
Deloitte Access Economics

7
1 Background
1.1 Local government rate capping framework
In February 2015 the Victorian Government appointed the Essential
Services Commission to undertake an independent inquiry and provide
advice on the introduction of a rates capping framework for local
government.
In September 2015, the Commission published its report on the proposed
framework. The Government responded in October 2015, resulting in the
Local Government Amendment (Fair Go Rates) Act 2015, assented to
December 2015. The framework was applied for the 2016-17 year.
The initial rate cap was set using a formula of 0.6 x Consumer Price Index
+0.4 x Wage Price Index - Productivity Factor. The Commission suggested
the efficiency factor should be zero for 2016-17 and increase by 0.05% per
annum each year.
1.2 Productivity in local government
Achieving productivity improvements in the public sector is an important
government goal. In 2013, Deloitte Access Economics considered the key
drivers of productivity in the public sector for the NSW Public Service
Commission, identifying priority areas where reform could lead to change.
These included:
increasing the contestability of service provision;
adopting new technologies;
improving workforce flexibility;
employment measurement and benchmarking;
developing a skilled workforce; and
establishing a culture of innovation.
While it is clear that productivity improvements are of benefit to local
government and the broader public (in the form of more efficient use of
council resources), in practice, productivity improvements are more
challenging to measure.
1.3 Issues with measuring productivity in local government
There are a number of challenges in directly measuring the productivity of
councils. Councils provide a wide range of different goods and services,
moreover, the range of goods and services generally differ between
councils, reflecting the different service needs and preferences of councils
and their communities. This makes simplistic comparisons between councils
difficult as their outputs are not homogenous.
Further, the same output of two or more councils may not be strictly
compatible due to quality differences. A council which expends more
resources per kilometre of roads than a neighbouring council would appear
prima facie to be less productive if quality is not taken into account.
Councils also operate in different environments and can face different
labour costs. These factors can significantly affect a council’s productivity
but can be outside of the council’s ability to control. For instance, rural
councils may have greater trouble hiring certain highly skilled professionals
or achieving economies of scale relative to metropolitan councils.

8
Finally, many council outputs are non-market-based, for example, libraries
or sporting fields. Non-market-based goods often have positive
externalities, so are undersupplied by the private sector. However, since
there is no price mechanism it is difficult to measure the value created by
these goods.
1.4 Direct and indirect measures of productivity
Despite the challenges noted above, well-designed direct measures can
provide an accurate estimation of councils’ productivity. Although it is a
complex task, well-specified models allow for a comparison of the
productivity of individual councils.
On the other hand, indirect measures estimate the productivity using a
proxy, such as the productivity of a wider sector of the economy. The
accuracy of indirect measures, therefore, depends on the extent to which
the proxy’s productivity mirrors that of an ‘average’ local government
council.
The ABS publishes a number of annual measures of productivity at
Australian and New Zealand Standard Industrial Classification (ANZSIC)
division level for the Australian economy. These measures are updated
annually and are publicly available and free. Indirect measures, therefore,
can be a more cost-effective and practical approach to productivity
measurement.
1.5 This report
This report focuses on the productivity factor in the rate-capping formula,
and considers estimates for the factor based on indirect measures of
productivity. It considers the seven indirect measures outlined by NERA
(2016) using the Organisation for Economic Co-operation and
Development’s framework (see Figure 1.1:). Deloitte Access Economics also
considered alternative measures of productivity but did not identify any that
were suitable to add to the OECD’s framework.
Figure 1.1: OECD classification of aggregate measures
Source: OECD 2011
Data was collected from the Australian Bureau of Statistics (ABS) to
calculate each of the measures of productivity. This report provides an
assessment of each of the measures and recommends value-added multi-

9
factor productivity as the most suitable proxy measure for use in the ESC’s
rate capping formula.
This report is supplemented by a spreadsheet, provided to the ESC, which
collates the data and calculates each of these measures.
10
2 Data and approach
2.1 Australian Bureau of Statistics productivity data
The productivity data used in each of the measures has been sourced from
the Australian Bureau of Statistics (ABS). Specifically, the productivity
catalogues used were:
5260.0.55.002 Estimates of Industry Multifactor Productivity
5260.0.55.004 Experimental Estimates of Industry Level KLEMS
Multifactor Productivity
The data in these catalogues is presented at the national level,
disaggregated by ANZSIC industries. While data by state is not available
from the ABS (either publicly or via request - we made enquiries of the
ABS), this is not seen as a major limitation of the data as opportunities for
productivity improvements in the local government sector are likely to be
broadly consistent across Australia.
There are a number of reasons the ABS productivity data is useful for
estimating achievable productivity in the local government sector:
the data is publicly available, at no cost;
it is updated regularly (on an annual basis for most measures);
both gross output and value added measures are available;
time series data is available to understand changes over time. Data is
available from 1995-95;
productivity measures are indexed to allow for comparability across
measures; and
the ABS Data Quality Framework ensures the collected data is held to a
high standard. 1
However, one key drawback is that the ABS does not estimate productivity
in non-market industries (Public Administration and Safety, Education and
Training, and Health Care and Social Assistance). This is a problem to the
extent that the activities of local government alight reasonably well
(although not exactly) with the Public Administration and Safety sector.
The ABS notes that in these industries the majority of output is provided
free of charge or at prices which are not necessarily related to the cost,
supply and demand for the services. Output measures for non-market
industries are typically derived using input costs, so by this definition,
there is no productivity growth.
2.2 Approach to estimating productivity measures
There are several potential approaches to using the ABS data to estimate
productivity measures including:
using the Administration and Support Services sector as a proxy for the
local government sector
using a small number of relevant sectors, with appropriate weightings;
using the ABS overall estimate of productivity, which combines the 16
market sectors.

11
One approach is to use the productivity estimate for the ‘Administrative and
Support Services’ sector as a proxy for the local government sector.1
However, we note it can be challenging to measure outputs in the labour-
intensive Administration and Support Services sector, and further, the
composition of the sector does not exactly reflect the range of activities
undertaken by local government. For instance, local government is
responsible for general construction (mostly roads and drainage), running
public libraries and providing waste management services, which more
closely align with other ABS sectors.
Weighting across sectors
The ABS Government Finance Statistics 2014-15 (ABS Catalogue number
5512.0) provide a breakdown of expenditure data at the Victorian local
government level, which allows an estimate to be made of the split of
services provided by local governments.
The main categories of expenditure by Victorian local government are
housing and community amenities (21%), recreation and culture (18%),
transport and communications (18%) and general public services (16%), as
shown in the following table.
Table 2.1: Victorian local government expenses by purpose, 2014-15
Expense Proportion of total
General public services 16%
Public order and safety 2%
Education 1%
Health 2%
Social security and welfare 12%
Housing and community amenities 21%
Recreation and culture 18%
Fuel and energy 0%
Agriculture, forestry and fishing 0%
Mining, manufacturing and construction 0%
Transport and communications 18%
Other economic affairs 5%
Public debt transactions 1%
Other purposes 1%
Source: ABS Cat. No. 5512.0 Table 332
It is therefore possible to derive a weighted productivity estimate which
reflects a small number of industries which most best reflect local
government expenditure. We have used three industries - administrative
and support services, arts and recreation services and transport, and postal
and warehousing industries.
The ABS also estimates ‘GDP per hour worked’ based on National Accounts. This is a measure of labour productivity which includes all sectors (including non-market
sectors). However, while Public Administration and Safety is an input into this measure it cannot be singled out for analysis.
12
The ANZSIC industry weights we have used are 18% for the transport
postal and warehousing industry (reflecting transport and communications
in the table above), 40% for arts and recreation (reflecting recreation and
culture and housing and community amenities) and 42% for administrative
and support services (reflecting all other expense categories.) Obviously, it
would be possible to use alternative weightings, and we have provided the
base data in the attached spreadsheet to enable this to be done.
Weighting has been applied to the indices prior to calculation of growth
rates over time. To account for variability across years, and the fact that
2015-16 data is available for value added but not gross output measures,
an average of productivity growth over the five years to 2014-15 has been
used as the estimate in each case. Acknowledging the volatility of measures
over time, averages over longer time series are included in Appendix A.
Use of overall market productivity values
Another approach is using the estimate of productivity values for the entire
market sector, as defined by the ABS. This approach is used by IPART in its
rate peg calculations; to estimate a productivity factor to be applied to the
Local Government Cost Index (LGCI).
This approach does not require the estimation of weights by sector, which
can be subjective, and hence is also more straightforward in terms of
estimation. Using an overall measure can also assist in overcoming
difficulties and volatilities associated with individual industry measurement.
That said, this approach includes a number of industries which are not
directly related to the operations of local government – for example mining,
accommodation and food services, retail trade and agriculture, forestry and
fishing. Further, productivity estimates in Australia in recent years have
been heavily influenced by the mining sector, which is largely unrelated to
local government operations. Finally, these estimates are available for
value added measures only. Chapter 4 provides estimates of productivity
using the 16 market sector industries identified by the ABS, which includes:
Agriculture, Forestry and Fishing;
Mining;
Manufacturing;
Electricity, Gas, Water and Waste Services;
Construction;
Wholesale Trade;
Retail Trade;
Accommodation and Food Services;
Transport, Postal and Warehousing;
Information, Media and Telecommunications;
Financial and Insurance Services;
Rental, Hiring and Real Estate Services;
Professional, Scientific and Technical Services;
Administrative and Support Services;
Arts and Recreation Services; and
Other Services.

13
3 Gross output measures
There are two broad approaches to measuring productivity at an aggregate
level: gross output-based and value added-based. Gross output measures
the total output of an industry including the production of intermediate
inputs (goods and services sold for the production of other goods and
services rather than for final consumption). The value added approach
measures total (gross) output less intermediate inputs. This chapter
discusses gross output measures, while value added measures are
discussed in chapter 4.
3.1 Advantages and disadvantages
The gross output approach also incorporates intermediate inputs (along
with capital and labour) and provide a more complete picture of the
production process. Gross output measures are also able to account for
technological change and improved efficiency.
However, the inclusion of intra-industry flows of intermediate products may
result in double counting on both the input and output sides (NERA 2016).
3.2 Labour productivity
Labour productivity measures the amount of gross output for a given
amount of time worked. For the purpose of this report figures are based on
a ‘Quality adjusted hours worked’ basis.
Gross Output labour productivity is calculated using tables 16 and 9 of ABS
5260.0.55.002:
𝐿𝑎𝑏𝑜𝑢𝑟 𝑝𝑟𝑜𝑑𝑢𝑐𝑡𝑖𝑣𝑖𝑡𝑦 = 𝐺𝑟𝑜𝑠𝑠 𝑜𝑢𝑡𝑝𝑢𝑡 𝑖𝑛𝑑𝑒𝑥
𝐿𝑎𝑏𝑜𝑢𝑟 𝑖𝑛𝑝𝑢𝑡 𝑖𝑛𝑑𝑒𝑥
𝐿𝑎𝑏𝑜𝑢𝑟 𝑝𝑟𝑜𝑑𝑢𝑐𝑡𝑖𝑣𝑖𝑡𝑦 = 𝑇𝑎𝑏𝑙𝑒 16
𝑇𝑎𝑏𝑙𝑒 9
The following table provides the growth rates in gross output labour
productivity by sector, with a weighted value representing Victorian local
government expenditure. However, it should be noted that this measure is
sensitive to the substitution of labour, particularly where outsourcing
occurs.
Using this measure, it is estimated that average annual productivity growth
over the past 5 years was 0.46%. This is the highest positive estimate of
productivity growth using the gross output measures.
Table 3.1: Gross output labour productivity growth rates
Sector 2010-11 2011-12 2012-13 2013-14 2014-15 2015-16 Ave*.
Admin and Support Services 0.58% 1.36% 1.78% 2.58% 0.34% n/a 1.33%
Arts and Recreation Services -3.96% 1.82% -2.56% 8.02% -6.29% n/a -0.59%

14
Transport, Postal & W ’housing 2.66% 6.02% 0.42% -2.79% -0.85% n/a 1.09%
Weighted -0.96% 2.41% -0.24% 3.69% -2.60% n/a 0.46%
* Note that averages shown in tables are simple (not compound) averages
Chart 3.1: Gross output labour productivity growth rates
3.3 Capital productivity
Gross output capital productivity measures the amount of gross output for a
given amount of capital inputs. Capital productivity is calculated using
tables 16 and 10 of ABS 5260.0.55.002:
𝐶𝑎𝑝𝑖𝑡𝑎𝑙 𝑝𝑟𝑜𝑑𝑢𝑐𝑡𝑖𝑣𝑖𝑡𝑦 = 𝐺𝑟𝑜𝑠𝑠 𝑜𝑢𝑡𝑝𝑢𝑡 𝑖𝑛𝑑𝑒𝑥𝑒𝑠
𝐶𝑎𝑝𝑖𝑡𝑎𝑙 𝑠𝑒𝑟𝑣𝑖𝑐𝑒𝑠 𝑖𝑛𝑑𝑒𝑥𝑒𝑠
𝐶𝑎𝑝𝑖𝑡𝑎𝑙 𝑝𝑟𝑜𝑑𝑢𝑐𝑡𝑖𝑣𝑖𝑡𝑦 = 𝑇𝑎𝑏𝑙𝑒 16
𝑇𝑎𝑏𝑙𝑒 10
The following table provides the growth rates in gross output capital
productivity by sector. The weighted productivity value estimates an
average annual decline in productivity of 1.32%. Compared with the gross
output measures, this capital measure suggests the worst productivity
performance over the period.
Table 3.2: Gross output capital productivity growth rates
Sector 2010-11 2011-12 2012-13 2013-14 2014-15 2015-16 Ave.
Admin and Support Services 1.26% 0.74% -3.11% -1.48% 0.36% n/a -0.44%
Arts and Recreation Services -3.17% -1.65% -3.86% -1.42% -0.86% n/a -2.19%

15
Transport, Postal & W ’housing 0.41% -1.27% -1.10% -4.55% -0.05% n/a -1.31%
Weighted -0.73% -0.60% -3.04% -2.04% -0.20% n/a -1.32%
Chart 3.2: Gross output capital productivity growth rates
3.4 Multi-factor productivity
Capital-labour-intermediate input multi-factor productivity (MFP) measures
the amount of gross output for a given amount of labour and capital and
intermediate inputs. For the purpose of this report figures are based on
quality-adjusted hours worked basis.
The gross capital-labour-intermediate MFP can be found in Table 15.
Alternatively it can be calculated using Tables 16 and 17.
𝑀𝐹𝑃 = 𝐺𝑟𝑜𝑠𝑠 𝑜𝑢𝑡𝑝𝑢𝑡 𝑖𝑛𝑑𝑒𝑥𝑒𝑠
𝐶𝑜𝑚𝑏𝑖𝑛𝑒𝑑 𝑖𝑛𝑝𝑢𝑡𝑠 (𝑙𝑎𝑏𝑜𝑢𝑟, 𝑐𝑎𝑝𝑖𝑡𝑎𝑙 𝑎𝑛𝑑 𝑖𝑛𝑡𝑒𝑟𝑚𝑒𝑑𝑖𝑎𝑡𝑒 𝑖𝑛𝑝𝑢𝑡𝑠) 𝑖𝑛𝑑𝑒𝑥𝑒𝑠
𝑀𝐹𝑃 = 𝑇𝑎𝑏𝑙𝑒 16
𝑇𝑎𝑏𝑙𝑒 17
Table 3.3: shows the growth rates in gross output MFP by sector, with a
weighted value representing Victorian local government expenditure. It is
estimated that there was an average annual decline in productivity, using
this measure, of 0.17%.
Table 3.3: Gross output MFP productivity growth rates
Sector 2010-11 2011-12 2012-13 2013-14 2014-15 2015-16 Ave.
Admin and Support Services 0.37% -2.93% 1.65% 1.68% 0.07% n/a 0.17%
Arts and Recreation Services -0.92% -0.11% -0.99% 2.64% -2.32% n/a -0.34%

16
Transport, Postal & W ’housing -0.92% -0.11% -0.99% 2.64% -2.32% n/a -0.34%
Weighted 0.02% 1.40% 0.23% -1.07% -1.42% n/a -0.17%
Chart 3.3: Gross output MFP productivity growth rates
3.5 KLEMS MFP
KLEMS (K-capital, L-labor, E-energy, M-materials, and S-purchased
services) refers to categories of intermediate inputs used in the production
of goods and services.
Data for the KLEMS MFP was sourced from 5260.0.55.004 Experimental
Estimates of Industry Level KLEMS Multifactor Productivity, Australia.
KLEMS is provided as percentage change. For comparison with ABS
5260.0.55.002and in order to calculate weighted KLEMS, an index was
created.
𝐼𝑛𝑑𝑒𝑥𝑡 =𝐼𝑛𝑑𝑒𝑥𝑡+1
1 + 𝑔𝑟𝑜𝑤𝑡ℎ𝑡+1
The following table provides the growth rates in KLEMS MFP by sector and
weighted to Victorian local government expenditure. Using this measure, it
is estimated that average annual productivity growth was 0.16%.
Table 3.4: Gross output KLEMS MFP productivity growth rates
Sector 2010-11 2011-12 2012-13 2013-14 2014-15 2015-16 Ave.
Admin and Support Services 0.32% -2.93% 1.89% 1.93% n/a n/a 0.30%
Arts and Recreation Services -0.90% -0.08% -0.79% 1.79% n/a n/a 0.00%
Transport, Postal & W ’housing 0.08% 1.45% 0.48% -1.25% n/a n/a 0.19%
Weighted -0.21% -0.99% 0.55% 1.27% n/a n/a 0.16%

17
Chart 3.4: Gross output KLEMS MFP productivity growth rates
3.6 Assessment of gross output measures
The four gross output measures present a range of annual productivity
estimates from -1.32% (capital productivity) to 0.46% (labour
productivity).
Given the estimates are all derived from the same ABS data source, there
are no particular data issues associated with the measures and they are all
straightforward to calculate and reliable. The range of values alone cannot
determine which is the most appropriate measure, however, some
considerations about the appropriateness of the measures is presented in
section 5.5.

18
4 Value added measures
4.1 Advantages and disadvantages
The value added approach differs from the the gross output approach in
that it does not include intermediate inputs. In the local government
context, it represents the contribution of the sector itself to aggregate gross
product, and is comparable across industries.
On the other hand, value added measures can be limited by not allowing for
substitution of capital and labour with intermediate inputs. This can be an
unrealistic assumption as fluctuations in the price or efficiency of
intermediate inputs tends to influence the relative use of capital and labour
in an industry, as well as overall productivity.
Value added measures also tend to be higher than estimates based on
gross output, may distort industry productivity growth rates over time, and
may distort inter-industry comparisons of productivity growth (NERA 2016).
However, in this instance, the weighted value added estimates are lower
than those estimated using gross output measures. The calculated value
added productivity estimates also appear to be more volatile than the gross
output measures, which limits the ability to use single-year measures of
productivity.
As noted in section 2.2, this chapter also includes estimates of productivity
based on the 16 market sector industries as defined by the ABS, as a
comparator to the weighted estimate calculated by Deloitte Access
Economics.
4.2 Labour productivity
Labour productivity measures the amount of output for a given amount of
time worked. For the purpose of this report figures are based on
Quality adjusted hours worked basis.
Valued-added labour productivity can be directly sourced from Table 6. It
can alternatively be calculated using tables 8 and 9 of ABS 5260.0.55.002:
𝐿𝑎𝑏𝑜𝑢𝑟 𝑝𝑟𝑜𝑑𝑢𝑐𝑡𝑖𝑣𝑖𝑡𝑦 = 𝐺𝑟𝑜𝑠𝑠 𝑣𝑎𝑙𝑢𝑒 𝑎𝑑𝑑𝑒𝑑 𝑐ℎ𝑎𝑖𝑛 𝑣𝑜𝑙𝑢𝑚𝑒 𝑖𝑛𝑑𝑒𝑥𝑒𝑠
𝐿𝑎𝑏𝑜𝑢𝑟 𝑖𝑛𝑝𝑢𝑡 𝑖𝑛𝑑𝑒𝑥𝑒𝑠
𝐿𝑎𝑏𝑜𝑢𝑟 𝑝𝑟𝑜𝑑𝑢𝑐𝑡𝑖𝑣𝑖𝑡𝑦 = 𝑇𝑎𝑏𝑙𝑒 8
𝑇𝑎𝑏𝑙𝑒 9
The following table provides the growth rates in value added labour
productivity by sector, with a weighted value representing Victorian local
government expenditure. Using this measure, it is estimated that average
annual productivity growth over the past 6 years2 was -0.68%.
2 Note that because 2015-16 data is available for value added measures, but not gross output measures, we have included an extra year of data.

19
Table 4.1: Value added labour productivity growth rates
Sector 2010-11 2011-12 2012-13 2013-14 2014-15 2015-16 Ave.
Admin and Support Services 0.62% -5.33% 3.45% 3.37% 0.13% -6.97% -0.79%
Arts and Recreation Services -2.61% 0.83% -2.11% 10.28% -7.64% -4.00% -0.88%
Transport, Postal & W ’housing 0.90% 6.15% 1.16% -1.68% -3.52% -1.36% 0.28%
Weighted -0.64% -0.77% 0.75% 5.10% -3.75% -4.76% -0.68%
16 market sector industries -0.34% 3.03% 2.04% 1.91% 0.88% 0.95% 1.41%
Note: Average calculated for 2010-11 to 2014-15 for consistency across measures. Market sector
industries as defined by ABS.
Chart 4.1: Value added labour productivity growth rates
4.3 Capital productivity
Value-added capital productivity measures the amount of gross valued-
added for a given amount of capital inputs.
Valued-added capital productivity can be directly sourced from Table 7. It
can alternatively be calculated using tables 8 and 10 of ABS 5260.0.55.002:
𝑉𝑎𝑙𝑢𝑒𝑑 − 𝑎𝑑𝑑𝑒𝑑 𝑐𝑎𝑝𝑖𝑡𝑎𝑙 𝑝𝑟𝑜𝑑𝑢𝑐𝑡𝑖𝑣𝑖𝑡𝑦 = 𝐺𝑟𝑜𝑠𝑠 𝑣𝑎𝑙𝑢𝑒 𝑎𝑑𝑑𝑒𝑑 𝑐ℎ𝑎𝑖𝑛 𝑣𝑜𝑙𝑢𝑚𝑒 𝑖𝑛𝑑𝑒𝑥𝑒𝑠
𝐶𝑎𝑝𝑖𝑡𝑎𝑙 𝑠𝑒𝑟𝑣𝑖𝑐𝑒𝑠 𝑖𝑛𝑑𝑒𝑥𝑒𝑠
𝑉𝑎𝑙𝑢𝑒𝑑 − 𝑎𝑑𝑑𝑒𝑑 𝑐𝑎𝑝𝑖𝑡𝑎𝑙 𝑝𝑟𝑜𝑑𝑢𝑐𝑡𝑖𝑣𝑖𝑡𝑦 = 𝑇𝑎𝑏𝑙𝑒 8
𝑇𝑎𝑏𝑙𝑒 10
Table 4.2: presents the growth rates in value added capital productivity by
sector. The weighted value suggests that that average annual productivity
declined by 1.77% per year, the largest negative growth estimate across all
measures.

20
Capital productivity growth has been consistently negative across most
Australian sectors over the past half a decade. During this time there has
been notable capital deepening in the Australian economy (an increase in
the capital to labour input ratio). All else equal, capital deepening generally
increases labour productivity as each input of labour has more capital with
which to produces goods and services. However, output per unit of capital
decreases as capital is employed to increasingly unproductive uses (the
most productive use of capital are employed first).
Table 4.2: Value added capital productivity growth rates
Sector 2010-11 2011-12 2012-13 2013-14 2014-15 2015-16 Ave.
Admin and Support Services 1.31% -5.91% -1.52% -0.72% 0.15% -5.26% -1.99%
Arts and Recreation Services -1.81% -2.61% -3.41% 0.64% -2.30% 0.18% -1.55%
Transport, Postal & W ’housing -1.31% -1.15% -0.37% -3.44% -2.75% -1.12% -1.69%
Weighted -0.43% -3.73% -2.06% -0.70% -1.37% -2.34% -1.77%
16 market sector industries -2.18% -1.93% -2.48% -1.39% -0.74% 0.05% -1.45%
Note: Average calculated for 2010-11 to 2014-15 for consistency across measures. Market sector
industries as defined by ABS.
Chart 4.2: Value added capital productivity growth rates
4.4 Capital-labour MFP
Capital-labour MFP measures the amount of output for a given amount of
labour and capital (for value added MFP, intermediate inputs are not
21
included). For the purpose of this report figures are based on
quality adjusted hours worked basis.
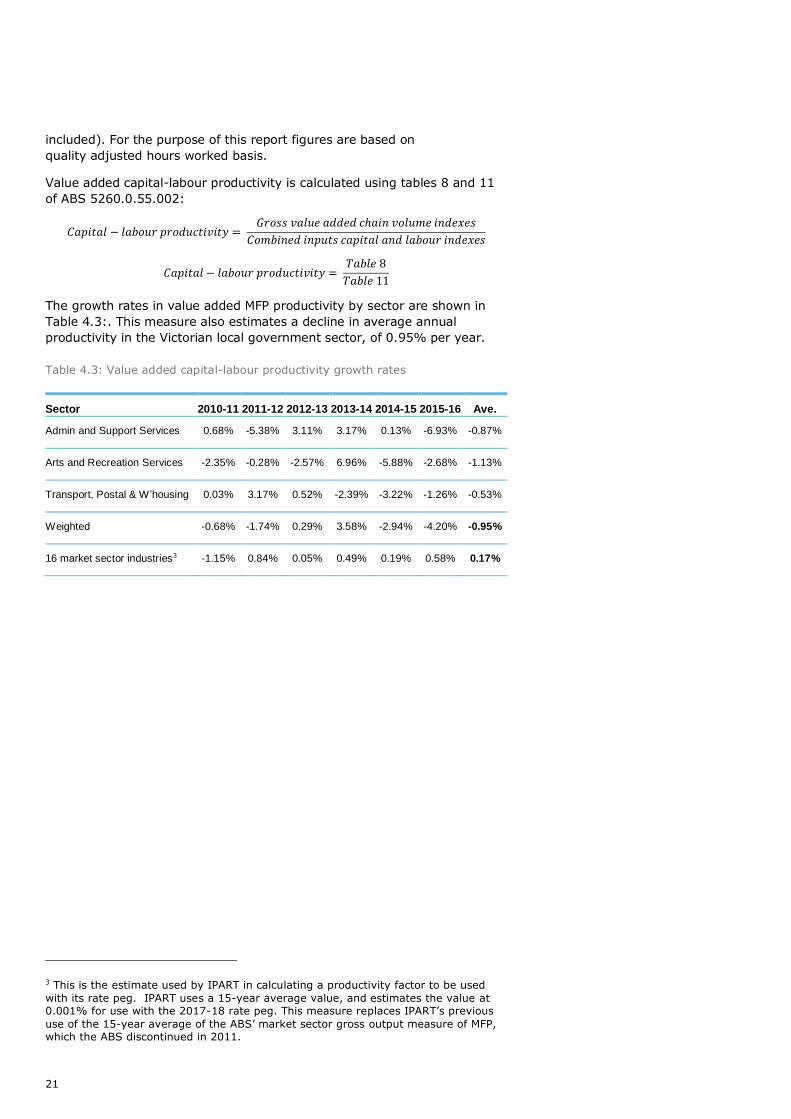
Value added capital-labour productivity is calculated using tables 8 and 11
of ABS 5260.0.55.002:
𝐶𝑎𝑝𝑖𝑡𝑎𝑙 − 𝑙𝑎𝑏𝑜𝑢𝑟 𝑝𝑟𝑜𝑑𝑢𝑐𝑡𝑖𝑣𝑖𝑡𝑦 = 𝐺𝑟𝑜𝑠𝑠 𝑣𝑎𝑙𝑢𝑒 𝑎𝑑𝑑𝑒𝑑 𝑐ℎ𝑎𝑖𝑛 𝑣𝑜𝑙𝑢𝑚𝑒 𝑖𝑛𝑑𝑒𝑥𝑒𝑠
𝐶𝑜𝑚𝑏𝑖𝑛𝑒𝑑 𝑖𝑛𝑝𝑢𝑡𝑠 𝑐𝑎𝑝𝑖𝑡𝑎𝑙 𝑎𝑛𝑑 𝑙𝑎𝑏𝑜𝑢𝑟 𝑖𝑛𝑑𝑒𝑥𝑒𝑠
𝐶𝑎𝑝𝑖𝑡𝑎𝑙 − 𝑙𝑎𝑏𝑜𝑢𝑟 𝑝𝑟𝑜𝑑𝑢𝑐𝑡𝑖𝑣𝑖𝑡𝑦 = 𝑇𝑎𝑏𝑙𝑒 8
𝑇𝑎𝑏𝑙𝑒 11
The growth rates in value added MFP productivity by sector are shown in
Table 4.3:. This measure also estimates a decline in average annual
productivity in the Victorian local government sector, of 0.95% per year.
Table 4.3: Value added capital-labour productivity growth rates
Sector 2010-11 2011-12 2012-13 2013-14 2014-15 2015-16 Ave.
Admin and Support Services 0.68% -5.38% 3.11% 3.17% 0.13% -6.93% -0.87%
Arts and Recreation Services -2.35% -0.28% -2.57% 6.96% -5.88% -2.68% -1.13%
Transport, Postal & W ’housing 0.03% 3.17% 0.52% -2.39% -3.22% -1.26% -0.53%
Weighted -0.68% -1.74% 0.29% 3.58% -2.94% -4.20% -0.95%
16 market sector industries3 -1.15% 0.84% 0.05% 0.49% 0.19% 0.58% 0.17%
3 This is the estimate used by IPART in calculating a productivity factor to be used
with its rate peg. IPART uses a 15-year average value, and estimates the value at 0.001% for use with the 2017-18 rate peg. This measure replaces IPART’s previous
use of the 15-year average of the ABS’ market sector gross output measure of MFP, which the ABS discontinued in 2011.

22
Note: Average calculated for 2010-11 to 2014-15 for consistency across measures. Market sector
industries as defined by ABS.
Chart 4.3: Value added capital-labour productivity growth rates
4.5 Assessment of value added measures
The three value added measures of productivity estimate average annual
productivity growth to be between –0.68% and -1.77%.
As was the case with gross output measures, value added capital
productivity estimates suggested the largest decline in productivity growth
on average while the labour productivity estimates presented the strongest
pictures of productivity growth. Further considerations about the
appropriateness of the measures is presented in section 5.5.

23
5 Discussion
In the absence of direct productivity measures for local government, our
view is that is appropriate to use indirect measures of historic productivity
improvement in other sectors order to set a reasonable expectation of what
productivity improvements are achievable in the Victorian local government
sector.
We support the use of ABS data for this task as it is publicly available,
transparent and independently verifiable.
However, as this report highlights, this is not a straightforward task and
there are a range of issues around estimating productivity that the ESC
needs to consider.
5.1 Overall comparison of measures
As can be seen in the previous chapters, there is a fairly significant
variation in productivity estimates, depending on measure. In general,
capital productivity measures are the lowest and labour productivity
measures are the highest. This is consistent with the trend of capital
deepening discussed in 4.3.
Consequently, depending on which measure is chosen there will be a
significant difference in the productivity ‘hurdle’ that is given to local
government. The average weighted measures range from 0.46% to
-1.77%.
Chart 5.1: Comparison of measures of productivity
24
5.2 Measurement period
In this report, we have presented productivity data for the most recent five
years (for gross output measures) and six years (for value-added
measures), and calculated average growth rates in productivity over that
period. This approach has the advantage of providing ‘smoother’ and less
volatile estimates of productivity by reducing the influence of one-off factors
in particular years.
However, it should be noted that productivity estimates reflect lags between
investment (when an input is measured) and when it is utilised in
production. As such, productivity estimates for 2010-11 may actually
reflect inputs from 2008-09. It can be argued that it is not appropriate to
include productivity influences from this far back in the rate-capping
formula as technology from seven years ago can be very different to what is
available today. The same arguments would apply when examining data
over a longer period.
We note that IPART uses a 15 year average for their productivity factor – in
our view this is at the longer end of what might be regarded a reasonable
period for measurement.
On the other hand, using a single year, or a small number of years of more
recent data will make the estimate of productivity more volatile and
susceptible to influence of individual factors and years. Using single year
estimates in the rate capping formula could result in widely different rate
caps from year to year.
These considerations should be balanced when selecting an appropriate
measurement period for productivity. A range of 5-10 years may best
balance the objective of removing volatility, but still remaining relevant.
5.3 Negative productivity
As can be seen in chapters 3 and 4, the ABS measures of productivity
growth can often be negative. In fact, the weighted productivity measure is
negative just over 50% of the time. A decision needs to be made as to how
best to deal with the issue of negative numbers.
The simplest approach is to allow negative productivity estimates to flow
through directly into the rate capping formula. This would provide for a
rate cap that is higher than the CPI. However it may be difficult to explain
to ratepayers why it is reasonable to expect local government to become
less efficient.
Another option would be to set the productivity factor in the rate cap
formula to zero in those years when it would otherwise be negative. We
understand this is the approach adopted by IPART. However, in doing so it
is arguably necessary to adjust productivity factors in subsequent years to
reflect the years for which productivity was set to zero. Otherwise local
government would implicitly be required to achieve cumulative productivity
improvements greater than those achieved elsewhere in the economy.
An example of how this may be done is set out in Appendix B.
5.4 Gross output and value added measures
The main difference between gross output and value added measures are
that gross output measures consider intermediate inputs. Practically, the
differences in estimates from the two approaches are small at the
aggregate level but can be more pronounced at the industry level.

25
While in this instance, all data is sourced from the ABS, and hence data
quality issues are likely to be minimised, some estimates of productivity
may still be more ‘accurate’ than others. This reflects the fact that outputs
are more easily measured in some industries relative to others (for example
in transport, postal and warehousing, relative to administration and support
services).
In the local government sector, gross output is difficult to define,
suggesting that value added may be a more relevant measure. Gross
output measures can also be more sensitive to substitution between inputs,
and, as NERA has noted, the inclusion of intra-industry flows of
intermediate products may result in double counting on both the input and
output side.
On this basis the use of value-added measures has appeal.
5.5 Labour, capital and multifactor productivity measures
Labour, capital and MFP measures are all valid approaches to productivity
measurement. However each has strengths and weaknesses.
While labour-based productivity is a simple concept, it is more difficult
to measure. Further many local government activities tend to be
reasonably capital intensive.
Capital-based productivity can be simpler to measure. However local
government capital activities focus on roads, while capital productivity
measures take into account a range of other capital infrastructure
MFP measures are more complex, and use of MFP measures as a proxy
rely on relationships between capital and labour being broadly
consistent with those in local government. At the same time they are
more comprehensive and can reflect the changing mix of labour and
capital over time.
Noting the challenges associated with using labour and capital productivity
measures, this could suggest that MFP, and specifically value added MFP,
may be the measure most suited to estimating productivity growth in
Victorian local government. Local government uses both capital and labour
inputs and the rate capping formula reflects both capital and labour factors.
5.6 Industries to use
A key issue is which ABS industries to use in the measure of productivity.
Given that the ABS does not provide productivity estimates for a range of
non-market industries, the choice comes down to using the ABS average
across all 16 market industries, or constructing a weighted average across a
subset of the most relevant industries.
Our concern with using the broader average across all industries is that it
includes a number of industries which are not relevant to local government.
In addition, the mining industry has had a large influence on estimates of
productivity in Australia over the recent past.
Our suggestion is therefore to use a measure which draws from a subset of
three ABS industry data sets - administrative and support services, arts and
recreation services and transport, and postal and warehousing industries.
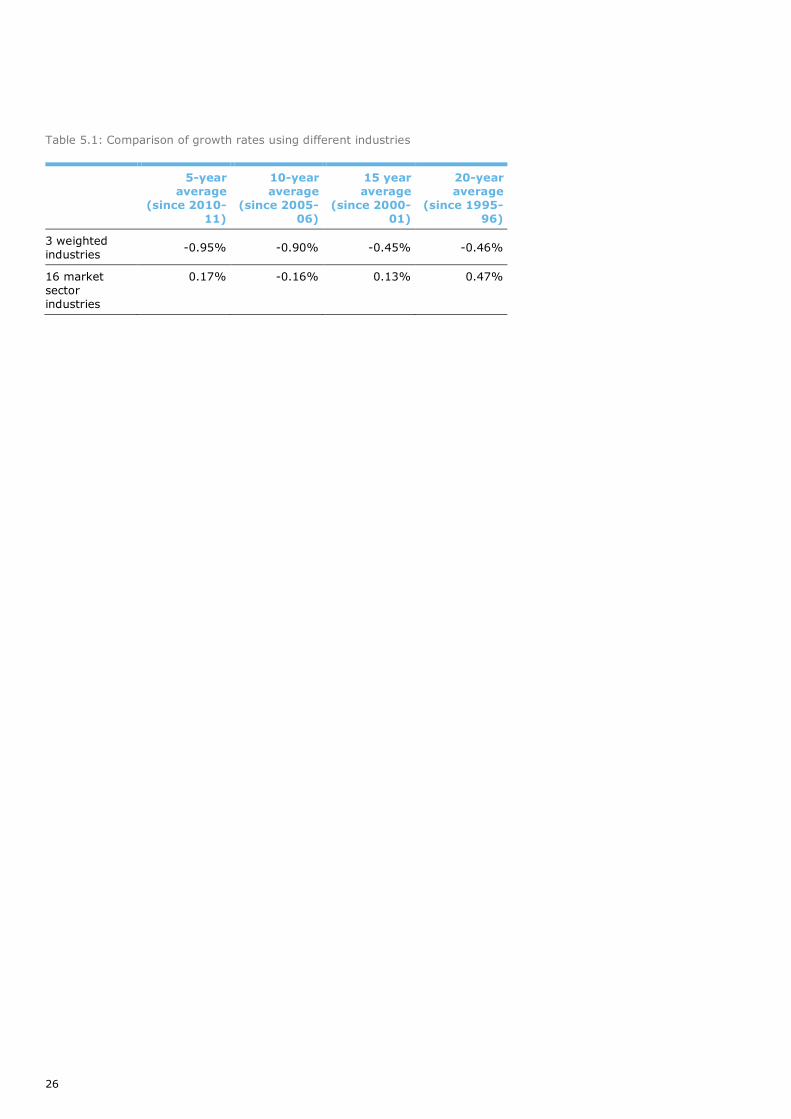
The following table summarises the averages using both approaches; while
using the three weighted industries is preferred by DAE, both measures are
appropriate.
26
Table 5.1: Comparison of growth rates using different industries
5-year
average
(since 2010-
11)
10-year
average
(since 2005-
06)
15 year
average
(since 2000-
01)
20-year
average
(since 1995-
96)
3 weighted
industries -0.95% -0.90% -0.45% -0.46%
16 market
sector
industries
0.17% -0.16% 0.13% 0.47%

27
References
Australian Bureau of Statistics (2016a), Estimates of Industry Multifactor
Productivity, 2015-16, Available at:
http://www.abs.gov.au/ausstats/[email protected]/mf/5260.0.55.002.
(2016b), Experimental Estimates of Industry Level KLEMS Multifactor
Productivity, 2013-14, Available at:
http://www.abs.gov.au/ausstats/[email protected]/mf/5260.0.55.004.
(2016c), Government Finance Statistics, Australia, 2014-15, Available
at:
http://www.abs.gov.au/ausstats%[email protected]/0/F1DC7CA0706C3A0
3CA25771500031665?Opendocument.
Cobbold, T (2013) A comparison of gross output and value-added methods
for productivity estimation. Productivity Commission. Available at:
http://www.pc.gov.au/research/supporting/comparison-gross-output-
value-added-methods/cgovam.pdf.
NERA Economic Consulting (2016), Forecasting productivity for local
government; alternative approaches – A report for ESC.
OECD (2001) Measuring productivity, OECD Manual, Measurement of
aggregate and industry level productivity growth. Available at:
https://www.oecd.org/std/productivity-stats/2352458.pdf.
28
Appendix A: Use of longer time series in
estimating
productivity
Estimates of productivity can vary significantly over time, with one-off
factors likely to influence productivity growth in a given year. Use of a
longer time series of data is one way to overcome the influence of these
factors.
While the report uses five-year averages of growth rates in productivity,
this appendix presents the averages over:
A the period from 2005-06 to 2015-16;
B the period form 2000-01 to 2015-16; and
C the duration of available data (1995-96 to 2015-16).
However, using a longer time series is not necessarily “better” or more
accurate. While one-off factors have less of an impact when there are more
data points for consideration, using a longer time series introduces
estimates which may not be relevant for the current situation. For
example, technologies and operating practices which affected local
government productivity 20 years ago may no longer be relevant today.
The longer the time period used, the less relevant each additional year’s
data will be for current estimates.
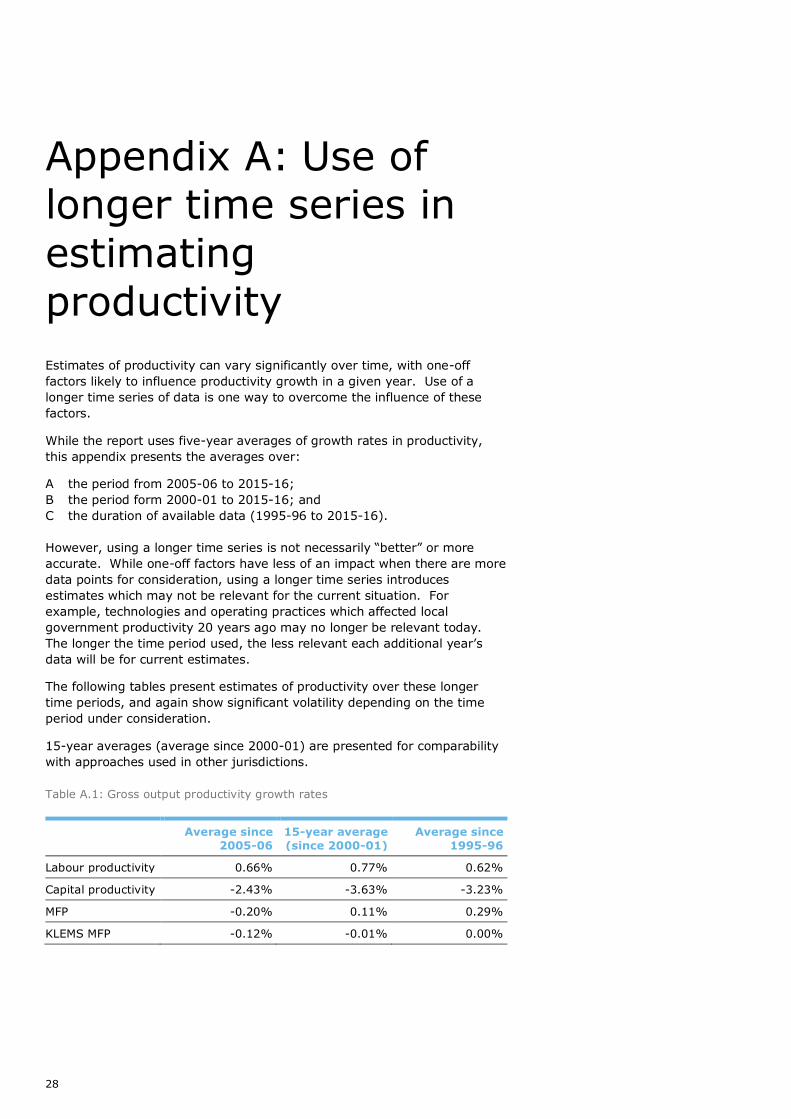
The following tables present estimates of productivity over these longer
time periods, and again show significant volatility depending on the time
period under consideration.
15-year averages (average since 2000-01) are presented for comparability
with approaches used in other jurisdictions.
Table A.1: Gross output productivity growth rates
Average since
2005-06
15-year average
(since 2000-01)
Average since
1995-96
Labour productivity 0.66% 0.77% 0.62%
Capital productivity -2.43% -3.63% -3.23%
MFP -0.20% 0.11% 0.29%
KLEMS MFP -0.12% -0.01% 0.00%
29
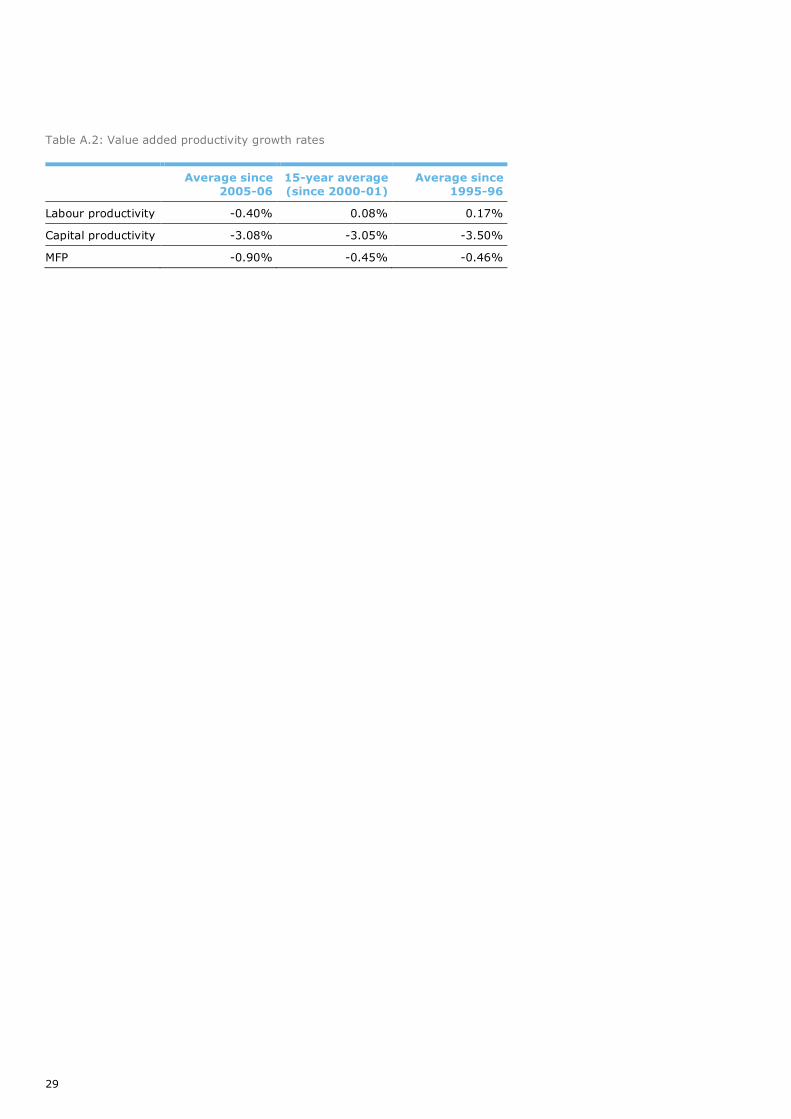
Table A.2: Value added productivity growth rates
Average since
2005-06
15-year average
(since 2000-01)
Average since
1995-96
Labour productivity -0.40% 0.08% 0.17%
Capital productivity -3.08% -3.05% -3.50%
MFP -0.90% -0.45% -0.46%

30
Appendix B: Considerations for
negative productivity
factors
As noted in section 5.3, when the ABS measures of productivity growth are
negative, one approach is to set the productivity factor in the rate cap
formula to zero.
If this approach is adopted, there are implications for the future calculation
of productivity factors.
Take a simple example, using an approach where the productivity factor is
set on an annual basis, based on the previous year’s value. Suppose in
year 1 there is a productivity decrease of -2.0%, followed by a productivity
increase of +4.0% in year 2. If the first year’s productivity change is set to
zero in the rate cap formula, then the productivity change used in the
second year in the rate cap should be set to (4.0% - 2.0%) = 2.0%. 4 The
change in the third year can be applied without adjustment (assuming it is
positive).
The approach of setting the productivity factor to zero when there is a
negative factor becomes more complex when the productivity factor is
calculated over a multi-year period, and some simplifications are
recommended to keep the calculations transparent.
For example, suppose a five-year value-added MFP measure based on
weighted sectors, as recommended in this report. In using a five multi-year
average, where there are negatives, either in individual years or overall,
then options include:
Setting individual years to zero in the calculation of the average,
where they would otherwise be negative; or
Setting the overall average to zero where it would otherwise be
negative.
The simplest approach is to set the overall average to zero where it would
otherwise be negative. And then only apply a positive factor once the
overall average becomes positive, taking into account any years that are
set to zero.
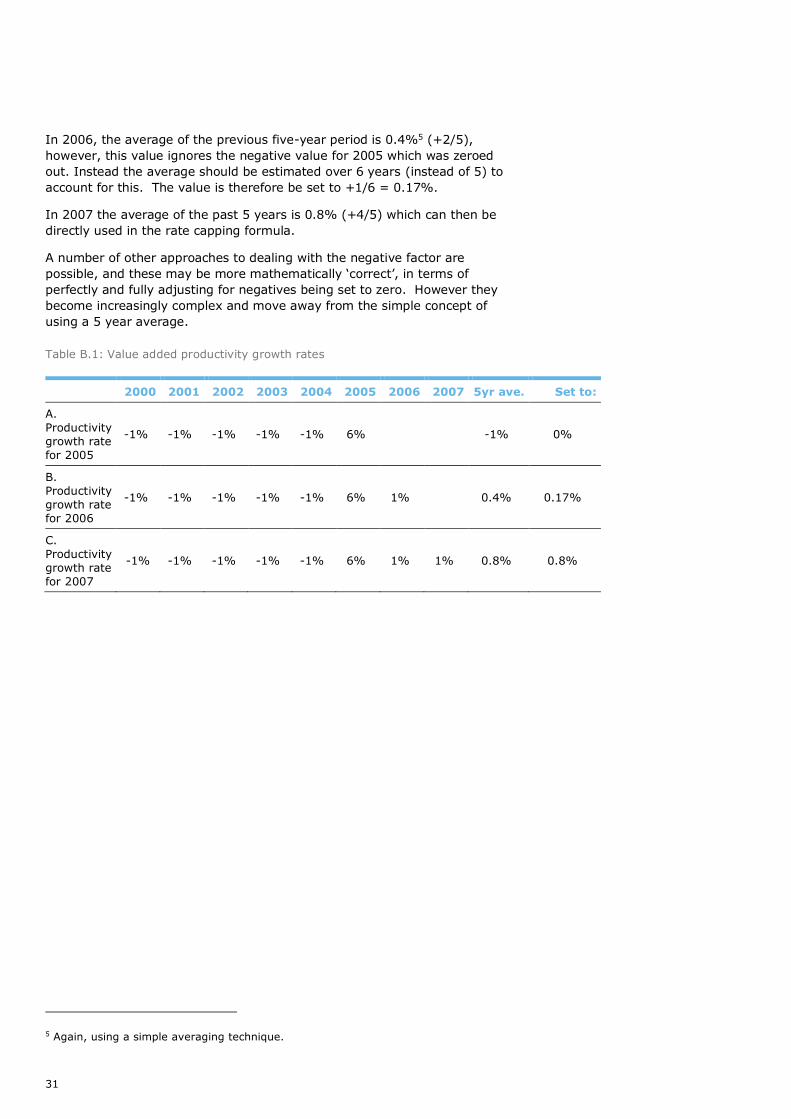
For example, in A below, when setting the productivity factor to apply in
2005, the average of the previous five-year period is -1%, so this would be
set to zero.
4 Using a simple averaging technique. Using a strictly more mathematically correct compounding approach the second year factor would be 1.92%.
31
In 2006, the average of the previous five-year period is 0.4%5 (+2/5),
however, this value ignores the negative value for 2005 which was zeroed
out. Instead the average should be estimated over 6 years (instead of 5) to
account for this. The value is therefore be set to +1/6 = 0.17%.
In 2007 the average of the past 5 years is 0.8% (+4/5) which can then be
directly used in the rate capping formula.
A number of other approaches to dealing with the negative factor are
possible, and these may be more mathematically ‘correct’, in terms of
perfectly and fully adjusting for negatives being set to zero. However they
become increasingly complex and move away from the simple concept of
using a 5 year average.
Table B.1: Value added productivity growth rates
2000 2001 2002 2003 2004 2005 2006 2007 5yr ave. Set to:
A.
Productivity
growth rate
for 2005
-1% -1% -1% -1% -1% 6% -1% 0%
B.
Productivity
growth rate
for 2006
-1% -1% -1% -1% -1% 6% 1% 0.4% 0.17%
C.
Productivity
growth rate
for 2007
-1% -1% -1% -1% -1% 6% 1% 1% 0.8% 0.8%
5 Again, using a simple averaging technique.

32
Limitation of our work
General use restriction
This report is prepared solely for the internal use of the Essential Services
Commission. This report is not intended to and should not be used or relied
upon by anyone else and we accept no duty of care to any other person or
entity. The report has been prepared for the purpose as outlined in our
engagement letter. You should not refer to or use our name or the advice
for any other purpose.

33
Contact us
Deloitte Access Economics
ACN: 149 633 116
8 Brindabella Circuit
Brindabella Business Park
Canberra Airport ACT 2609
Tel: +61 2 6263 7000
Fax: +61 2 6263 7004
Deloitte Access Economics is Australia’s pre-eminent economics advisory practice and a member of Deloitte's global economics
group. For more information, please visit our website
www.deloitte.com/au/deloitte-access-economics
Deloitte refers to one or more of Deloitte Touche Tohmatsu Limited, a UK private company limited by guarantee, and its network
of member firms, each of which is a legally separate and independent entity. Please see www.deloitte.com/au/about for a
detailed description of the legal structure of Deloitte Touche Tohmatsu Limited and its member firms.
The entity named herein is a legally separate and independent entity. In providing this document, the author only acts in the
named capacity and does not act in any other capacity. Nothing in this document, nor any related attachments or
communications or services, have any capacity to bind any other entity under the ‘Deloitte’ network of member firms (including
those operating in Australia).
About Deloitte
Deloitte provides audit, tax, consulting, and financial advisory services to public and private clients spanning multiple industries.
With a globally connected network of member firms in more than 150 countries, Deloitte brings world-class capabilities and high-
quality service to clients, delivering the insights they need to address their most complex business challenges. Deloitte's
approximately 200,000 professionals are committed to becoming the standard of excellence.
About Deloitte Australia
In Australia, the member firm is the Australian partnership of Deloitte Touche Tohmatsu. As one of Australia’s leading
professional services firms. Deloitte Touche Tohmatsu and its affiliates provide audit, tax, consulting, and financial advisory
services through approximately 6000 people across the country. Focused on the creation of value and growth, and known as an
employer of choice for innovative human resources programs, we are dedicated to helping our clients and our people excel. For
more information, please visit our web site at www.deloitte.com.au.
Liability limited by a scheme approved under Professional Standards Legislation.
Member of Deloitte Touche Tohmatsu Limited
© 2017 Deloitte Touche Tohmatsu