ISSN 0973-3167Registration Number: KERENG/2009/32718
Edited, printed and published by Dr. D. Radhakrishnan Nair on behalf of SCMS-COCHIN [School of Communication and Management Studies] and pr in ted
at Maptho Printings, Kalamassery, Cochin-683104 and published at Muttom, Aluva-683106, Cochin.
For information, please visit our website <www.scmsgroup.org>
SCMS COCHIN Estd. 1976
(SCHOOL OF COMMUNICATION AND MANAGEMENT STUDIES)PRATHAP NAGAR, MUTTOM, ALWAYE, COCHIN-683106, KERALA, Ph: 0484 - 2623803/04, 2623885/87, Fax: 0484-2623855
Email: [email protected], Website: <www.scmsgroup.org>Journal Website: <www.scms.edu.in/scmsjim>
SCMS-COCHIN-The first
accredited, AIU recognized and ISO certified
business school inSouthern India
♦ Recognized as equivalent to MBA by theAssociation of Indian Universities (AIU).
♦ Centrally air-conditioned world-class campus, anexcellent team of 56 full time faculty, well-stockedlibrary, full-fledged computer centre, superiorteaching aids etc.
♦ Academic tie-ups with Foreign Universities to givethe programme global focus and innovation. Ninefaculty members from the universities of USA,Australia & Switzerland teach full course at SCMS.
♦ Dewang Mehta National Award for excellence inleadership training systems.
♦ Impact Marketing National Award forintegration of exceptional communication skilldevelopment system.
♦ The only recipient of a grant for track record inperformance from AICTE.
♦ Ranking within the first 25 B.Schools in theA++ category.
♦ Only B.School which has a Universityapproved Research Centre for PhD inManagement.
♦ Only B.School in India to establish a Chair forClimate Change.
♦ SCMS-COCHIN is, now, one of the sevenACBSP (US) accredited B-Schools in India.
PGDM of SCMS
ISSN-0973-3167
Estonia’s Export-led Path to Prosperity : Since IndependenceKishore G. Kulkarni and Brian Patrick Sara
Institutional Capacity Building : A Systematic Approach R. Krishnaveni and R Sujatha
Consumer Behaviour : Kitchen DurablesAnilkumar N. and Jelsy Joseph
Work Life Balance : Women Police ConstablesS. Padma and Sudhir Reddy
Linkages Among Stock Markets: Asia - Pacific RegionM.S. Ramaratnam, R. Jayaraman and G. Vasanthi
Organizational Health : Knowledge Based Sectoral EmployeesP. Sivapragasam and R. P. Raya
Managing Non -financial Risks : Business & GrowthBhavana Raj and Sindhu
Global Competitiveness: World Passenger Car IndustryAtul Mittal, Paroma Mitra Mukherjee, and Dilip Roy
Enablers and Disablers : Academic and Job PerformanceApurva Lagwankar, Anamika Sinha, and Tripura Sundari Joshi
Cause - brand alliance : Purchase IntentionKota Neel Mani Kanta, D.V. Ramana and P. Srivalli
SCMS-COCHIN [Night View]
INDIA Inc. emerges from here at SCMS-COCHIN
SC
MS
Jo
urn
al o
f In
dia
n M
anag
emen
t,
Vo
lum
e X
, N
um
ber
4,
O
ctob
er -
Dec
embe
r 2
01
3,
Pag
es 1
-108
SCMS COCHIN SCHOOL OF BUSINESS, INDIA
ACCRE D I T E D
B . S C H O O L


Articles005 Estonia’s Export-led Path to Prosperity : Since Independence
Kishore G. Kulkarni and Brian Patrick Sara
017 Institutional Capacity Building : A Systematic Approach
R. Krishnaveni and R Sujatha
024 Consumer Behaviour : Kitchen Durables
Anilkumar N. and Jelsy Joseph
039 Work Life Balance : Women Police Constables
S. Padma and Sudhir Reddy
048 Linkages Among Stock Markets: Asia - Pacific Region
M.S. Ramaratnam, R. Jayaraman and G. Vasanthi
055 Organizational Health : Knowledge Based Sectoral Employees
P. Sivapragasam and R. P. Raya
063 Managing Non -financial Risks : Business & Growth
Bhavana Raj and Sindhu
075 Global Competitiveness: World Passenger Car Industry
Atul Mittal, Paroma Mitra Mukherjee, and Dilip Roy
086 Enablers and Disablers : Academic and Job PerformanceApurva Lagwankar, Anamika Sinha, and Tripura Sundari Joshi
095 Cause - brand alliance : Purchase Intention
Kota Neel Mani Kanta, D.V. Ramana and P. Srivalli
Contents October - December 2013, Vol. X, Issue No. 4
Articles

Overview
Estonia was among the first Soviet republics to break away from the former Soviet Union. Since its
transition to an independent capitalist economy in 1991, the country has turned out to be one of the
fastest growing economies in the world.
The economic growth of this northern-most Baltic republic is more than five times faster than that of
the European Union as a whole. As eurozone’s fastest growing economy, the remarkable economic
resurgence of Estonia is observed by many as quite startling. They even named Estonia as a Baltic
Tiger.
Among the Baltic people there is a popular saying that Latvia has the best politicians, Lithuania the
best prophets, and Estonia the best economists.
In this background, it will be quite refreshing for our readers to read a well-researched lead article - a
study on ‘Estonia’s Export-led Path to Prosperity since Independence.’
In the present highly competitive world, progressive organisations are all continuously striving for
capacity building. That means, they are working on improving their ability to do more things better.
They develop the ability to do new things they weren’t able to do before and at the same time to do
the things they used to do, more effectively and efficiently. So, our second lead article is on ’Institutional
Capacity Building.’
We have in this issue, as usual, many more learned articles on a variety of contemporary topics like
Consumer Behaviour, Work-Life Balance, Stock Markets, Organisational Health among Employees,
Managing Non-financial Risks, Global Competiveness, Cause Related Marketing, and so on.
I am confident that this issue will be truly informative and educative to our readers.
Dr. G. P. C. NAYAR
Chairman, SCMS Group of Educational Institutions.

SCMS Journal of Indian ManagementA Quarterly Publication of
SCMS-COCHIN
Editors
Editor-in-ChiefDr. G. P. C. Nayar
ChairmanSCMS Group of Educational Institutions
EditorDr. D. Radhakrishnan NairProfessorSCMS-COCHIN
Dr. Subramanian SwamyProfessor, Harvard University
Cambridge, MA, USFormerly Professor of Economics
IIT, Delhi
Editorial Board
Dr. V. Raman NairDirector
SCMS-COCHIN
Dr. Radha ThevannoorDirector, SCMS School of
Technology and ManagementCochin
Dr. Abhilash S. NairChair Person-Finance, Accounting
and Control Area IIMK, Kerala
Dr. I.M. PandeyProfessor
Delhi School of Economics,Delhi University
Dr. Azhar KazmiProfessor, King Fahd University
of Petroleum and MineralsDhahran, Saudi Arabia
Dr. George SleebaJoint Mg. Director, V Guard
Industries Ltd., Cochin
Mr. Jiji Thomson IAS Director General
Sports Authority of IndiaGovernment of India, New Delhi
Dr. Thomas StegerChair of Leadership and Organization
University of RegensburgGermany
Dr. Kishore G. Kulkarni Distinguished Professor of Economics and Editor
Indian Journal of Economics and BusinessDenver, US
Dr. Naoyuki YoshinoProfessor of Economics
Keio UniversityTokyo, Japan
Dr. Jose Maria Cubillo-PinillaDirector of Marketing Management
ESIC Business and Marketing School Madrid, Spain
Dr. Mathew J. ManimalaProfessor
Indian Institute ofManagement, Bangalore

SCMS Journal o f Indian Management , October - December, 2013 4
A Quarterly Journal
Editorial
Dr. D. Radhakrishnan Nair
Edi to r ia l Ass i s tan t :
Ms. Jessy Baby
Prof. K. J. Paulose
Prof. A.V. Jose
Prof. B. Unnikrishnan
Edi tor ia l Commit tee :
Invoke Solar Energy: Save thEcology and Culture
The ecological idea of culture has been predicated upon twin convictions: culture is limited to the
human species and culture is the product of human creation. But, a closer and deeper study
broadens our perception: culture is also concerned with nature, and with the intimate relationship
between human beings and the natural environment. This revelation leads to a long leap in the idea
of culture and this demands opening the doors to nature; to natural environment; and other species.
The ecological idea of culture springs out from the ‘environmental movement’ sweeping all over the world spreading the
message that the lack of knowledge on environment will ultimately annihilate nature and exterminate the human race from
the surface of this globe. We believe that economics and technology have not liberated us from our traditional dependency on
the natural environment. They, instead, have increased our dependency.
Now, there is a greater awareness: natural environment provides human beings with the sustenance they need for survival and
human beings owe incredible dependency to all forms of plant, animal, and mineral life. Cultures that ignore this intimate
relationship between human beings and the natural environment run the risk of over extending themselves, collapsing, and
disappearing from the global scene because they are unsustainable. History is full of examples of this.
Culture is also predicated on the conviction that it is the organizational form structures of different species, both human and
nonhuman. It is another leap to the idea of culture. They all obey laws of nature: of birth and death, growth and decay,
consumption, digestion, and elimination. Therefore we talk about the culture of plants and animals. We use phrases: wolf
culture and plant culture, we use terms like horti-culture, agriculture, silvi-culture and perma-culture. The former refers to
activities involving other species. The latter refers to activities involving human beings.
Everybody generally agrees with the biological idea of culture. Like human beings they also see and interpret the world. They
organize themselves in groups like a flock of geese, communities like a colony of ants, as a pack of wolves, as cats basking in
the sun, playing with each other. The life abiding by the well-defined systems of queen, drone, and worker bees, rigid
hierarchies and divisions of labour, finely tuned communication net works, and sensing capabilities, highly evolves production,
distribution, and consumption mechanisms act to ensure the survival of bees as a species and to their biological and non
biological requirements, guaranteeing continuous supply of products: honey, wax, the beehive, and the honey comb; of
functional and aesthetic significance. Ecology linked culture is the need of the hour.

SCMS Journal o f Indian Management , October - December, 2013 5
A Quarterly Journal
Estonia’s Export-led Path to Prosperity:
Since Independence
Kishore G. Kulkarni and Brian Patrick Sara
Key words: CEO, CEO reputation, stock attractiveness, attribution theory, investors’ judgment
Abstract
Kishore G. Kulkarni, PhD, Distinguished Professor ofEconomics, and Editor, IJEB CB 77, P. O. Box 173362,Metropolitan State University of Denver, Denver,CO 80217-3362. E-mail: [email protected]
Brian Patrick Sara, Graduate Student, Josef Korbel School ofInternational Studies, University of Denver,2201 South Gaylord Street, Denver, CO 80208.
The history of Estonia is one of resi l ience
in the face of external dominance. With
their homeland having been traded between the
Danes, Swedes, Poles, Russians, Germans and the Soviet
Union, the Estonians struggled to create and enjoy their own
fortune. Only three decades ago, the rigid Soviet system still
dictated the specifics of worker collectives and individual
compensation in Estonia. After the fall, each former Soviet
state managed the transition from communism to capitalism
differently. Some, like Turkmenistan, traded one authoritarian
regime for another, and their citizens have yet to enjoy
significant wealth progress from Soviet-era levels. Others,
particularly the Baltic Sea states, jumped into capitalism and
can celebrate their fiscal successes and status as mainstream
European economies. Since i ts complete sovereign
independence from the USSR in September 1991, Estonia
The fall of the Soviet Union’s constellation of planned economies provides a compelling set of case studies for comparative
political economists. Particularly interesting is how each former communist republic, from Uzbekistan to Ukraine, managed the
unenviable task of radically transforming themselves into contemporary capitalist states. Estonia stands out as the country with
the lowest debt-to-GDP ratio in Europe, and The Economist projected its 2014 GDP growth to outpace the rest of the Eurozone.1
How this small former Soviet republic skyrocketed from the 85th-wealthiest country in the world on a per capita basis in 1995
to the 44th-wealthiest is a story of strong fiscal discipline and a commitment to export-led growth.2 This paper tests the links
between Estonia’s exports, imports and the strategies it used to expand GDP and boast a trade surplus.
Abstract
T
1 “European Economy Guide: Taking Europe’s Pulse.”Economist.com . The Economist Newspaper, Ltd., 15 May2013. Web.
2 “GDP per Capita (current US$), 1980-2012” World BankData. World Bank, 2013. Web.

SCMS Journal o f Indian Management , October - December, 2013 6
A Quarterly Journal
successfully worked its way out of communism to become a
thriving capitalist economy and a beacon of high-tech
innovation. In many ways, Estonia stands atop the post-
Soviet states in terms of growth not just in personal wealth,
but also in health, educational attainment and technical
sophistication.
Today, this small Nordic state3 hosts NATO’s Cooperative
Cyber Defense Centre of Excellence, is home to the developers
of the pioneering telephony software Skype, and serves as a
high-tech production center for major firms like ABB and
Ericsson. Impressive economic and quality of life indicator
numbers tell the story of a country that pursued an economic
strategy to propel itself out of the post-communist doldrums
and into relative prosperity. Estonia’s GDP per capita
increased sixfold between 1995 and 2012. Tertiary school
enrollment jumped from 25 to 64 percent over the same time
period. Having skyrocketed from being the 85th-wealthiest
country in the world on a per capita basis in 1995 to the 44th-
wealthiest, Estonia provides a case study in strong fiscal
discipline and a commitment to export-led growth.4
These gains appear even more impressive when one considers
the high degree of restructuring Estonian leaders had little
choice but to pursue after independence. The country
successfully boosted foreign trade, attracted international
investors and distanced itself from what it saw as a negative
relationship with Moscow. Much of this came about as a
result of early aggressive devaluation of the Estonian kroon,
which served as the domestic currency from 1992 until
adoption of the euro in January 2011. After the kroon reform,
foreign trade increased rapidly.5 Early data show that the
subsequent euro adoption further boosted trade in 2011 and
2012.6
Despite its great technological leap forward, its strident gains
in wealth and its accession to the European Union in 2004 (or
perhaps because of these), all is not perfect in Estonia.
Domestic producers cannot meet the demands of the Estonian
consumer base. As a result, the country must trade for goods
and services it cannot produce at a competitive price. More
important, the country’s rapid growth and integration into
the European community outpaced its ability to structure
trade in a way that would make Estonian exports competitive
in the high value-added EU marketplace. While Estonia’s
export market sat at a whopping 90 percent of GDP in 2011,
it lacks diversity in both the variety of goods and services
produced and in its portfolio of trading partners.7 Though in
many respects Estonia’s economy does outshine Latvia’s and
Lithuania’s, it does not have the same level of maturity as the
neighboring Nordic economies and thus cannot protect itself
against severe external shocks. This stands out as one of
Estonia’s most pressing concerns. It then comes as no surprise
that the global financial crisis of the late 2000s hit Estonia
harder than nearly any other European state. In 2009, only
neighboring Latvia, Lithuania and Ukraine had more severe
recessions; Estonia’s 14.1 percent drop in nominal GDP was
fourth-worst in the world, including both developed and
developing economies.8 Even Iceland and Ireland, with their
banking system collapses, suffered less of a contraction and
lower unemployment than Estonia.9 When studying the
Estonian case, therefore, one must take into account its
successes alongside its failures and acknowledge how its
eagerness to integrate into the Western marketplace has been
both a blessing and a curse.
This paper seeks to chart the course of the Estonian economy
from 1991 to 2011, prior to euro adoption, focusing on three
major areas of interest ultimately related to the country’s
current account balance:
1. The many reasons for the rapid rise of Estonian GDP
during the two-decade period, especially in relation to
its post-independence monetary policy;
3 Estonia, though typically grouped together with the former
Soviet Baltic states of Lithuania and Latvia, is closer culturally,
linguistically and historically with Finland and the other Nordic
nations. In this paper, I use the terms “Baltic” and “Nordic”
interchangeably.4 “GDP per Capita (current US$), 1980-2012.”5 Reiljan, Janno, and Anneli Ivanov. “Estonian Foreign Trade on
the Threshold of Joining the EU.” Intereconomics 35.6 (2000):
274-81. Print.
6 “Last Year Exports of Goods Grew Moderately.” Statistics Estonia(Statistikaamet). Government of Estonia, 11 Feb. 2013. Web.
7 “Exports of Goods and Services (% of GDP).” World Bank Data.World Bank, 2013. Web.; also, “Last Year Exports of GoodsGrew Moderately.”
8 “GDP growth (annual %).” World Bank Data. World Bank, 2013.Web.
9 Thorhallson, Baldur, and Peader Kirby. “Financial Crises inIceland and Ireland: Does European Union and Euro MembershipMatter?” Journal of Common Market Studies 50.5 (2012): 801-18. Print.
SCMS Journal o f Indian Management , October - December, 2013 7
A Quarterly Journal
2. The relationship between Estonia’s exchange rate and
exports;
3. Estonia’s export levels and GDP, which are correlated
(though not causally) in part because of the degree to
which Estonia’s economy is dependent upon export
revenue as a portion of GDP.
Ultimately, Estonia restructured its economy remarkably well
given its dire situation in the early years following Soviet
disintegration. Given its ups and downs, it provides a
compelling and vivid case study for the relationship between
GDP, trade, investment and the perils of interconnectedness
in the world marketplace.
We obviously acknowledge the wide variety of crucial factors
that have an impact on imports, export and GDP growth,
including domestic savings rates, spikes or sudden decreases
in consumption, political concerns and competition. In noting
these, we choose not to ignore them but simply to focus on
the particular links between Estonia’s post-independence
currency devaluation. More important, this paper offers a
compelling case study for GDP’s effect on imports and the
autonomy of exports vis-à-vis GDP. We have also chosen to
highlight and discuss explanations for Estonia’s post-Soviet
success available in the existing literature, which may include
some other factors as the determinants of Exports and GDP.
In the next section we shall review some such theories and
draw some insight from them.
SECTION II: THEORIES IN QUESTION
Theory Part I: Devaluation and its Effects on the CurrentAccount Balance
Economic theory asserts that while GDP largely determines
imports, exports follow the “domestic currency’s real
exchange rate against foreign currency” in addition to changes
in foreign disposable income.10 Any increase in the real
exchange rate – that is, any decrease in the value of the domestic
currency – will precipitate a trend toward surplus figures in
the current account. Conversely, a decrease in the real
exchange rate pushes the current account toward deficit. In
simplest terms, a falling domestic currency value should
attract foreign buyers given the now relatively cheaper goods
and services. For example, let us say that Estonia could
harvest, process and ship timber to Finland in 2005 for 10
Estonian kroons per board foot. Let us also assume that 10
kroons equal 1 euro in 2005. One year later in 2006, assuming
production and shipping costs remain flat in Estonia, but the
exchange rate changes to 15 kroons per 1 euro, a Finnish
buyer could purchase more Estonian timber for fewer euros,
even if that buyer’s income level remained unchanged. It is
this principle that drives the assumption that exchange rates
help set export numbers. This paper tests that principle with
Estonia’s exchange rate and export relationship over the past
two decades.
In addition to simply recounting the phases of Estonian
development after 1991, this paper offers a concrete example
of the effects of real currency devaluation on exports and
foreign direct investment. Estonian monetary policy decisions,
particularly in the early 1990s and then again in the early
2000s, led to systematic change in Estonian foreign trade.
This paper will discuss those changes in detail, and then it
will show how tightly linked the exchange rate and exports of
goods and services are in Estonia’s case. By extension, the
exchange rate fluctuations have an effect on the Estonian
current account balance, given the aforementioned relationship
between exchange rates and exports. Since Estonia’s export
revenues equal between 60 and 90 percent of GDP, the current
account balance swings wildly depending upon export
fluctuations, and therefore examining this first theory is crucial
to understanding the second theory question.11
Theory Part II: GDP as a Determinant of Imports and the
Autonomy of Exports
This paper also seeks to test the macroeconomic hypothesis
that a nation’s GDP determines its import levels. Estonia’s
near continuous rise in gross domestic product between 1995
and 2011 shows a direct relationship to imports of goods and
services produced abroad. Similarly, the few years in which
GDP fell for Estonia, the country saw a correlated decrease
in imports . Estonia’s nat ional wealth and i ts new
interconnectedness through trade with the West both
contributed to the rise in imports, as expected. Quantitative
analysis will confirm this hypothesis.
Economic theory also states that exports remain autonomous
to changes in domestic wealth. GDP has little to no effect
upon export levels, as exports are autonomous to GDP. It is
10 Krugman, Paul R., and Maurice Obstfeld. InternationalEconomics: Theory and Policy. 7th ed. Boston, Mass. Pearson/Addison Wesley, 2006. Print.; pp409
11 “Exports of Goods and Services (% of GDP).”

SCMS Journal o f Indian Management , October - December, 2013 8
A Quarterly Journal
demonstrated that, in the Estonian context, there is, instead,
a direct linear relationship between GDP and exports of goods
and services from 1995 onward.12 Unlike the first theory, in
which monetary devaluation had a clear causal effect upon
import levels, it is not argued that GDP growth is causing
export growth; rather, the opposite is true. Given that exports
comprise such a massive proportion of Estonia’s GDP, it is
unsurprising that any rise or fall in exports will directly affect
GDP.
Literature Survey
Several economists offer their take on the trends in Estonian
GDP, exchange rates and the current account balance. In a
December 2000 article in Intereconomics, Estonian economists
Janno Reiljan and Anneli Ivanov deconstruct their country’s
fiscal and trade situation from 1991 through the end of the
first decade of Estonia’s independence. Citing an historical
emphasis upon trade by the state (Estonia was independent
for several decades between World Wars I and II), the authors
argue that Estonia’s trade deficit is of primary concern to
policymakers in Tallinn. The deficit, they claim, is largely a
result of wealth outpacing export competitiveness as the
government fully restructured the economy. Reiljan and Ivanov
posit that the 1990s Estonian situation was an “emergency
situation in which investment goods are mainly imported,”
and that this process would likely improve the country’s
export potential in the long run.13 Following the USSR’s
dissolution, nearly every former Soviet republic experienced
severe economic contraction, with GDP losses of up to 40
percent. Estonia, along with other former Soviet states,
received emergency loans that helped artificially boost wealth
while industrial producers struggled to catch up with new
Western competitors. Even during the height of the USSR,
Estonia and the “satellite” republics all reported deficits,
largely because of the “core-periphery” nature of their
relationship with the Central Planning Committee.14 And thus,
coming out of a situation in which the economy was
administratively restricted by Moscow, Estonia lacked
diversification both in trading relationships and in the goods
and services it could theoretically trade.
The country took full control of its finances by issuing a
currency, the kroon, in 1992. Estonia began a controlled
monetary devaluation process shortly thereafter. This process
had two goals. First, Estonian lawmakers wanted to combat
hyperinflation that was occurring due to the issuance of the
kroon, the privatization of industry and, mostly, the Russian
influence on the Estonian market. 15 Nonetheless, the
government still sought some devaluation, albeit in a controlled
manner. Second, they hoped that a rising exchange rate against
the falling value of the kroon would make its goods cheap
enough in the global markets. The devaluation proved
successful, and trade did rise in nominal terms, slowly chipping
away at the surplus between 1992 and 1998.16 Unfortunately
a massive devaluation by Russia on their ruble in 1998 had
the effect of negating positive gains among Estonian exports,
especially minerals.17
Despite the difficulty Estonia faced early on, in terms of
diversification and export competitiveness, Reiljan and Ivanov
note the various positive steps Estonia took to consistently
cut their current account deficit. They argue that a smaller
share of overall Estonian exports head to the same ten to
twelve markets, the kroon devaluation did help Estonia catch
up, and the increasing sophistication of domestic producers,
all signal a brighter future for its current account. Plus, the
prospect of joining the European Union should boost
competitiveness by breaking down the various tariffs and
trade barriers that have forced Estonian products out of many
of the otherwise protected EU member states’ markets.18 In
short, Reiljan and Ivanov’s prescriptions for the Estonian
economy (increased diversification, a decrease in barriers to
entry into foreign markets) and their prediction that the EU
accession would help flip the current account deficit proved
correct at face value. Complicating the accuracy of their causal
mechanism, however, is the global recession of the late-2000s.
The current Estonian trade surplus is likely more a result of
severe GDP contraction, and thus one would need several
“normal” years of data to test the accuracy of the authors’
suggestions.
What Reiljan and Ivanov cannot discuss is the rapid shift
from deficit to surplus in 2008, and therefore any assertion
they might have made about exchange rates is left untested.
Writing in Intereconomics a decade after Reiljan and Ivanov,
12 1995 is the first year that the World Bank published figures forimports, exports and GDP for Estonia.
13 Reiljan and Ivanov, 27614 Reiljan and Ivanov, 27515 Lindner, Axel. “Macroeconomic Adjustment: The Baltic States
versus Euro Area Crisis Countries.” Intereconomics 46.6 (2011):340-45. Print.
16 Reiljan and Ivanov, 27517 Reiljan and Ivanov, 27718 Reiljan and Ivanov, 281; This article was written prior
to accession, hence the discussion of a potential accession tothe EU.
SCMS Journal o f Indian Management , October - December, 2013 9
A Quarterly Journal
Axel Lindner contends that, at least in the case of EU memberstates (which Estonia has since become), “current accountimbalances can vanish very quickly…even if exchange ratesare kept constant.”19 Lindner searches for the reasons behindthe abrupt swing in the current account balances of the Balticstates by comparing them to the situation of SouthernEuropean countries like Greece and Portugal. During the globalrecession that began in 2008, the Baltic states’ GDP levelsplummeted, with contractions three to five times as deep asthe Greek and Portuguese domestic recessions. Today, Greeceand Portugal’s current account deficits continue to hoveraround 10 to 15 percent of GDP, while Estonia’s currentaccount went into surplus after 2008.20 Furthermore, Estonialargely recovered from a GDP standpoint from the recession,while Spain and Portugal languish at recession-level GDPs.
Lindner wonders what separates Estonia and its Balticneighbours from the floundering Southern economies, despitethe fact that both felt the brunt of the financial crisis. Hefinds that a combination of factors, specifically the reactionof private citizens and the larger financial markets, differedgreatly between the Baltic states, Greece and Portugal. As aresult, Lindner believes the differences in reactions by privatecitizens explain the varied shift in current account balancesbetween north and south.21 First, while imports collapsedacross Europe during the recession, Estonia’s demand fell 32percent, compared to Greece’s 25 percent and Portugal’s 18percent.22 The differences in the demand levels begin to explainwhy Estonia’s trade deficit began to sharply trend towardsurplus.
Next, Lindner notes that financial markets lost confidence inGreece and Portugal, while faith in Estonia’s fiscal situation
still remained high both home and abroad. What Lindner
declines to mention is the sharp difference in debt-to-GDP
ratios between Estonia and Southern Europe. During the crisis,
Estonia’s public debt level never rose above 7.5 percent of
GDP, while Portugal and Greece’s soared to 84 percent and
129 percent, respectively, by 2009. Debt levels have
continued to climb for Portugal and Greece since then while
Estonia’s remains exceedingly low.23
Nevertheless, Lindner argues that the private actors in the
economy were the true point of contrast between Estonia and
the Southern European states’ current account movements.
Immediately after the recession hit, private actors drastically
reduced spending, with Estonia’s financial account plummeting
25 percent while Greece and Portugal’s spending dropped by
single digits. That dramatic change in spending habits among
Estonian households and firms is mirrored in their decreased
demand for imports.24 It is no wonder that the relatively high
savings rate of Baltic citizens in reaction to the recession left
them with a current account surplus, while the free-spending
Southern economies could not pull off a substantial shift away
from a balance of payments deficit. Crucially, Lindner argues
that this all happens in spite of exchange rate fluctuations.
His argument, however, fails to adequately explain why the
major shifts in Estonia’s exchange rate had no measurable
effect on its current account. Portugal’s and Spain’s exchange
rate did not change considerably during the crisis, and their
economies languished. Estonia’s kroon rose dramatically and
fell shortly after the recession, and the current account appears
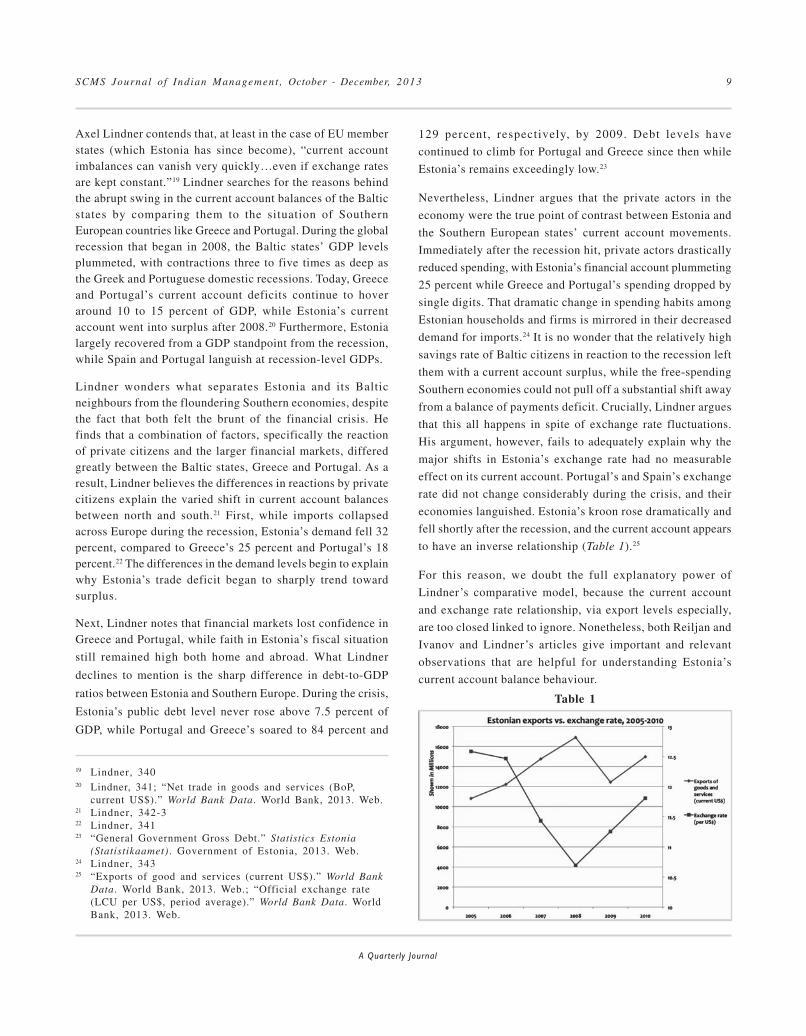
to have an inverse relationship (Table 1).25
For this reason, we doubt the full explanatory power of
Lindner’s comparative model, because the current account
and exchange rate relationship, via export levels especially,
are too closed linked to ignore. Nonetheless, both Reiljan and
Ivanov and Lindner’s articles give important and relevant
observations that are helpful for understanding Estonia’s
current account balance behaviour.
Table 1
19 Lindner, 34020 Lindner, 341; “Net trade in goods and services (BoP,
current US$).” World Bank Data. World Bank, 2013. Web.21 Lindner, 342-322 Lindner, 34123 “General Government Gross Debt.” Statistics Estonia
(Statistikaamet) . Government of Estonia, 2013. Web.24 Lindner, 34325 “Exports of good and services (current US$).” World Bank
Data. World Bank, 2013. Web.; “Official exchange rate(LCU per US$, period average).” World Bank Data. WorldBank, 2013. Web.

SCMS Journal o f Indian Management , October - December, 2013 10
A Quarterly Journal
SECTION III: APPLICATION OF THE THEORIES INESTONIA’S CASE
Theory Application I: Devaluation and its Effects on theCurrent Account Balance
Prior to its adoption of the euro in 2011, Estonia’s currency,the kroon, was pegged to the Russian ruble, then the Germanmark and finally the euro. In the first two years after breakingfrom Moscow, Estonia saw rampant inflation of the kroon,partly because of retaliatory price-fixing of minerals and oilby Russia against the Baltic states.26 By pegging the fixed-rate kroon to the German deutschmark and backing the currencywith at least 100 percent foreign reserves, the Estoniangovernment quickly quelled fears of any chance for long-termrunaway hyperinflation.27 It was perhaps because of this earlyexchange rate scare that Estonia practises such tight fiscaldiscipline. After Germany dropped its deutschmark, theEstonian government subsequently re-pegged the kroon tothe euro. By the late 1990s, domestic price levels in Estoniaremained steady, as did inflation.28
Testing the hypothesis that currency devaluation and
subsequent rises in the exchange rate will increase export
power by using the first few years of Estonian data, is
problematic. Given the massive restructuring of the Estonian
economy, its early exchange rate battle with Russia and the
dearth of data before 1995 make it difficult, if not impossible,
to trust any attempt at relating exchange rates and exports.
After 1995, however, the complicating factors begin to fall
away. Hyperinflation ceased. The currency peg restored
investor confidence. Still, Estonia kept its markets, especially
its money market, quite liberalized, and inflation continued
at high rates thanks to “an increase in taxes ensuing from the
currency reform and further price liberalization.”29 Plus, the
country would not enjoy equal trading terms with the
European Union until its bilateral free trade agreement with
the bloc went into effect after 1999, and Estonians cite this
as a major win for their export competitiveness.30 Additionally,
Estonia joined the World Trade Organization in 1999,
furthering equalizing terms of trade between the Baltic state
and its far more powerful trading partners on the continent
and abroad.31 After 2001, the exchange rate and exports from
Estonia move almost without exception in opposite direction,
as would be expected (Table 2).32
26 Fifka, Matthias S. “The Baltics: Continuing Boom or BurstingBubble?” Business Economics 43.4 (2008): 25-35. Print.
27 Sörg, Mart, and Vello Vensel. “Development of the Banking Systemunder the Estonian Currency Board.” International Advances inEconomic Research 8.1 (2002): 35-48. Print.
28 Sörg and Vensel, 37
29 Sörg and Vensel, 3830 Reiljan and Ivanov, 28131 Fifka, 27-832 “Exports of good and services (current US$).”; “Official exchange
rate (LCU per US$, period average).”
Table2

SCMS Journal o f Indian Management , October - December, 2013 11
A Quarterly Journal
A critical observer might note that the two lines do not
perfectly interact. The period in which the export-exchange
rate relationship appears entirely disconnected, is the full
period before 2001 – note the significant exchange rate jump
compared to a small increase in exports. After 2001, however,
with trade barriers removed between Estonia and its largest
trading partners (thanks to free trade agreements and its
accession to the WTO), the exchange rate and export lines
move in a more expected trajectory against each other.
Theory Application II: GDP as a Determinant of Imports;
the Autonomy of Exports
The USSR’s dissolution left Estonia and the rest of the Baltic
states in economic shambles. In the years following
independence, Estonia’s GDP charted a similar course as its
fellow post-Soviet states. The modernization and liberalization
of its markets and the move toward European integration
were tough on the Baltic states, though the restructuring would
prove fruitful in the long run. The average GDP growth among
the post-Soviet states remained negative until 1996. After
1996, though, the former USSR begins to see a slow gain in
GDP. Estonia’s fortunes tend to track along with the average
GDP growth in the rest of the former USSR, albeit with more
volatility (Table 3).33
Table 3
The first hypothesis in question suggests that imports will
parallel GDP, so that any gains in GDP will be matched by an
increase of imports in goods and services, while losses in
GDP will result in fewer imports. In Estonia’s case, import
movement correlates very strongly with GDP movement
(Table 4).34
33 “GDP growth (annual %).”34 “GDP per Capita (current US$), 1980-2012.”; “Imports of good and services (current US$).” World Bank Data. World Bank, 2013. Web.

SCMS Journal o f Indian Management , October - December, 2013 12
A Quarterly Journal
Here, rising GDP per capita results in rising imports. Only in
2010 do the two indicators contradict, though this occurs in
the waning years of the recession. Imports rise accordingly
again in 2011 with a jump in GDP, though Estonia’s adoption
of the euro in January 2011 likely facilitates the sharp increase
in imports as well.
Unlike imports, however, exports are assumed to be
autonomous to GDP in that they are largely responsive to
changes in exchange rates (and thus relative price levels
between trading partners). In fact, Estonia is somewhat unique
in that its economy is so heavily export-driven. In comparison
to other EU economies, exports comprise a higher proportion
of Estonia’s GDP than nearly any other, except Hungary,
Ireland and Luxembourg (Table 5).35 The other 22 member
states have smaller figures.
35 “Exports of Goods and Services (% of GDP).”
Table 4
Table 5

SCMS Journal o f Indian Management , October - December, 2013 13
A Quarterly Journal
In any country, its GDP is an aggregate of consumption,
investment, government expenditures, plus the difference
between exports and imports.36 When there is a trade or
current account surplus – that is, when exports outpace
imports – the result is a gain in GDP. Conversely, any deficit
will cause a drop in overall GDP, though economies can still
grow by increasing any of the other GDP factors. Though
current account deficits do not necessarily signal economic
destitution, leaders everywhere are concerned about their
national trade balance. Much of the reason for this is that, to
finance a current account deficit, governments must borrow.37
Therefore, it remains a priority of governments, especially
small but growing ones like Estonia, to prioritize the growth
of exports to boost national wealth. Estonia has done so
through trade agreements, accession to the EU and sound
monetary policy, as we have seen. While major powers like
the United States can afford to be less concerned about such
imbalances and debt given the longstanding solvency of their
financial systems and subsequent investor faith, Estonia’s
short sovereign history does not afford it such a luxury. For
this reason, Estonia’s leaders see export strength as a top
priority.38
Table 6
With exports at such a high percentage compared to GDP, it
therefore comes as no surprise that GDP and exports are
very tightly linked for Estonia. Even during the rise and fall
of Estonian GDP between 2005 and 2011, the data show a
relatively linked pattern with the movement of exports
(Table6).39
There is a great deal of focus in various articles about Baltic
economies during the 1990s and 2000s and their dismal trade
deficit levels, as has been discussed. Indeed, at Estonia’s pre-
recession peak GDP in 2007 and 2008, the current account
reached its deepest deficit of the decade, but it then quickly
rocketed into surplus levels as GDP plummeted in 2009
(Table7).40
36 Krugman and Obstfeld, 28437 Krugman and Obstfeld, 286-738 Reiljan and Ivanov, 28139
“GDP per Capita (current US$), 1980-2012.”; “Exports of good and services (current US$).”
40“GDP per Capita (current US$), 1980-2012.”; “Current account balance (BoP, current US$).” World Bank Data. World Bank, 2013. Web.

SCMS Journal o f Indian Management , October - December, 2013 14
A Quarterly Journal
Not until the Baltic states took a major hit on their GDP
growth in 2008 and 2009 did their trade imbalances “self-
correct.”41 Estonia achieved a trade surplus (and thus a
positive current account balance) in 2009, right after the global
recession took hold in the region. Only for a brief time in
1999 did the country see its current account turn positive,
but that achievement lasted only one quarter.42 It was not
until 2009 onwards that Estonia boasted a surplus, and it
seems somewhat likely to do so into the future, thanks to the
leverage it has as a relatively low-wage member of the EU.
Already, manufacturing for other European firms has relocated
to Estonia to take advantage of its comparative advantage in
human capital, but this is a question of foreign direct
investment and a topic for another discussion.43
SECTION IV: CONCLUSIONS
Summary and Conclusion
Ultimately, Estonia appears to provide a clean and solid case
study for testing the theories of currency devaluation’s effect
on exports as well as GDP’s relationship to imports and
exports. After 2001, the inverse relationship between the
exchange rate and exports is clear and convincing. Prior to
2001, the complications presented by total economic
restructuring and the uneven tariffs Estonia had to pay to its
European trading partners (who themselves enjoyed relatively
free trade through the EU) make it too complex to trust any
assertion that exports and the exchange rate are strongly
correlated, much less causally related.
Movements in Estonia’s GDP certainly cause a responsive
reaction in imports. When GDP rises throughout the 1990s
and early 2000s, so too do imports. When GDP contracts
during 2008 and 2009, imports also slow dramatically. Even
the degree to which GDP rises has an effect on imports; small
percentage increases in GDP beget small percentage increases
for imports of goods and services while large GDP shifts
create large import shifts. While there are of course intervening
variables—EU accession, euro adoption, global crises—the
correlation is remarkably tight between GDP and imports.
Table7
41 “Current Account Transactions. Exports, Imports and Balance.” Statistics Estonia (Statistikaamet). Government of Estonia, 2013.Web.
42 Reiljan and Ivanov, 27743 Reiljan and Ivanov

SCMS Journal o f Indian Management , October - December, 2013 15
A Quarterly Journal
Lessons Learned
Given Estonia’s unique recent past, an even more useful and
trustworthy case study would arise years from now, when
there are more years of data to test statistically. A follow-up
to this paper would seek to understand the link between
exchange rates and exports from a statistical standpoint,
particularly by running a regression on the data to understand
the significance of the relationship. Estonia’s adoption of the
euro brought the country into a new era, one where it cannot
fix its exchange rate or even have considerable control over
euro valuation. As a result, one would expect prices and wages
in Estonia to converge with the rest of Europe, and the effects
of that on trade and GDP have yet to be seen.44
Estonia’s government would do well to continue its strong
tradition of fiscal discipline, which served the purpose of
bringing the country out of communism and into the ranks of
the European Union in just over a decade’s time.45 Still, its
accession into the EU causes one to wonder if the gains it will
receive by joining the common monetary union and market
outweigh the loss of sovereignty it must accept. Given its
already high dependence upon the European market for
exports, it continues to run the risk of exposure to volatility
in the regional economy. Furthermore, its policy of maintaining
such exceptionally low debt levels means that unemployment
will likely remain high. Critics assert that Estonia’s ability to
recover from the punishing recession is reduced by its “cheap”
fiscal habits.46 Clearly, given the wide swings in GDP,
Estonia’s domestic economy needs a greater buffer against
European f iscal swings. Leaders must seek trading
relationships outside the EU to hedge against future shocks.
The trading surplus that arose out of Estonia’s falling GDP
was certainly a positive consequence, but it may not have
been worth the costs everyday Estonians had to pay in terms
of lost wealth and rising unemployment.
REFERENCE
“Current account balance (BoP, current US$).” World Bank
Data. World Bank, 2013.
“Current Account Transactions. Exports, Imports andBalance.” Statist ics Estonia (Stat ist ikaamet) .Government of Estonia, 2013.
“European Economy Guide: Taking Europe’s
Pulse.” Economist.com. The Economist Newspaper,
Ltd., 15 May 2013.
“Exports of goods and services (% of GDP).” World Bank
Data. World Bank, 2013.
“Exports of goods and services (current US$).” World Bank
Data. World Bank, 2013.
Fifka, Matthias S. “The Baltics: Continuing Boom or Bursting
Bubble?” Business Economics 43.4 (2008): 25-35.
“GDP growth (annual %).” World Bank Data. World Bank,
2013.
“GDP per Capita (current US$), 1980-2012.” World Bank
Data. World Bank, 2013.
“General Government Gross Debt.” Statistics Estonia
(Statistikaamet). Government of Estonia, 2013.
“Imports of good and services (current US$).” World Bank
Data. World Bank, 2013.
Krugman, Paul R. “Estonian Rhapsody.” Editorial. The
Opinion Pages - Conscience of a Liberal. The New York
Times, 6 June 2012.
Krugman, Paul R., and Maurice Obstfeld. International
Economics: Theory and Policy. 7th ed. Boston, Mass.
Pearson/Addison-Wesley, 2006
“Last Year Exports of Goods Grew Moderately.” Statistics
Estonia (Statistikaamet). Government of Estonia, 11 Feb.
2013.
Lindner, Axel. “Macroeconomic Adjustment: The Baltic
States versus Euro Area Crisis Countries.”
Intereconomics 46.6 (2011): 340-45.
“Net trade in goods and services (BoP, current US$).” World
Bank Data. World Bank, 2013.
“Official exchange rate (LCU per US$, period average).”
World Bank Data. World Bank, 2013.
Reiljan, Janno, and Anneli Ivanov. “Estonian Foreign Trade
on the Threshold of Joining the EU.”
Intereconomics 35.6 (2000): 274-81.
44 Reiljan and Ivanov, 281
45 Rohde, Armin, and Ole Janssen. “Estonia’s Monetary Integration into EMU.”Intereconomics 35.4 (2000): 176-82. Print.46 Krugman, Paul. “Estonian Rhapsody.” Editorial. The Opinion Pages - Conscience of a Liberal. The New York Times, 6 June 2012. Web.

SCMS Journal o f Indian Management , October - December, 2013 16
A Quarterly Journal
Rohde, Armin, and Ole Janssen. “Estonia’s Monetary
Integration into EMU.”Intereconomics 35.4 (2000): 176-
82.
Sörg, Mart, and Vello Vensel. “Development of the Banking
System under the Estonian Currency Board.”
International Advances in Economic Research 8.1 (2002):35-48.
Thorhallson, Baldur, and Peader Kirby. “Financial Crises inIceland and Ireland: Does European Union and EuroMembership Matter?” Journal of Common Market Studies
50.5 (2012): 801-18. Print.

SCMS Journal o f Indian Management , October - December, 2013 17
A Quarterly Journal
Institutional Capacity Building:
A Systematic Approach
R.Krishnaveni and R.Sujatha
Abstract
Key words:Capacity Building, Institutions, Systematic Approach, Assessment, Demand-driven Strategies
he business world is highly turbulent with competition
and uncertainty. To face the challenges and opportunities
brought by globalization and knowledge-based economy,
organizations need to be more productive and effective. Developing
human resources in both public and private sector organizations,
is a critical issue in an increasingly knowledge-based and global
economy. To increase effectiveness, organizations need to build
the capacities of human resources and maximize their potential.
Capacity is the ability to perform appropriate tasks i.e., to achieve
what is required effectively and efficiently, and sustainable at an
individual, group, community, organization or government (Antwiand Analoui, 2008). Zafarullah and Rahman (2008) define
capacity as attaining or carrying out stated objectives. Capacityrepresents the potential for using resources effectively and
maintaining gains in performance with gradually reduced levels of
external support. It may be understood as the inherent endowment
possessed by individuals or organizations to achieve their fullest
potential (Jay D.Jurie, 2000).
T
Dr.R.Krishnaveni, Professor, PSG Institute of ManagementCoimbatore – 641 004, India
R.Sujatha, Assistant Professor, PSG Institute of Management,Coimbatore – 641 004, India, [email protected]
Capacity is the ability of individuals, organizations or institutions to carry out their tasks with their fullest potential.
Capacity building concept is gaining popularity these days and is extensively used by non-profit organizations, government and
non-government organizations, UNDP community development agencies etc. Macro level capacity building focuses on building
the capacity of Institutions like governments, non-governmental groups and communities to strengthen their ability to serve
their citizens. Extensive review of literature indicates that even though Institutional capacity building is an occurring
phenomenon in many countries, there is no systematic methodology for the capacity building efforts. This paper addresses the
research gap by developing a six step-by-step approach for Institutional capacity building process. The systematic approach
helps institutions to build capacity to promote better governance and improves the structures of economic policy making to
strengthen their civil society.

SCMS Journal o f Indian Management , October - December, 2013 18
A Quarterly Journal
Capacity Building
Capacity building is a popular and expansive term these days andit has its roots from the concepts of institutional building andorganizational development. It means much to individuals makingspecific decisions about programs and grant strategies. UNDPdefines Capacity Building as “the creation of an enablingenvironment with appropriate policy and legal frameworks,institutional development, including community participation,human resources development and strengthening of managerialsystems.” UNCED recognizes that fundamental goal of capacitybuilding is to enhance the abilities of stakeholders to evaluate andaddress crucial questions related to policy choices and differentoptions for development. Straussman (2007) examines theconcept of capacity building as a phrase used by developmentspecialists, international donors and foundations to describe myriadefforts to assist developing and transitional countries that seek toimprove their governance processes. It is an ongoing processthrough which individuals, groups, organizations and societiesenhance their abilities to identify and meet development challenges.But there is no universally accepted definition for CapacityBuilding. The concept has been used by researchers in differentcontexts based on their research dimension. Review of literatureidentifies that Capacity Building is carried out at three levels –individual, organizational, and institutional/government level.
Organizational and Individual Capacity Building
Organizational capacity refers to the ability of organizations toimplement and manage projects, to exercise financial and productaccountability, to employ and train staff competent to undertakespecific tasks, and to report on their work in ways which areacceptable to their donors and management. Improvingorganizational capacity might aim to: strengthen internalmanagement, review resource allocation, address knowledgemanagement, develop leadership qualities, or build partnerships.Allan Kaplan (1995), a leading NGO scholar argues thatorganizations concentrate on developing robust capability, ratherthan relying on the setting up of organizational structures andprocedures, the securing of material resources, or the specificskills of staff. Organizational capacity building finds itssignificance in various sectors like health services (Azariah, 1999;Aherne and Pereira, 2005), educational institutions (Brucekingand Newmann, 2001; Sackney and Walker, 2006; Hua 2007;Collinson 2008; Davis 2009), managing water resources (Pres,2008), large manufacturing firms (Jurie, 2000); Jung-Erceg et al,2007), technical institutions (Meyer, 2008), small and mediumenterprises (Braun and Hollick, 2006; Bhaskaran and Gligorovska2009) and so on.
Individual capacity building enables all individuals of an
organization to carry out their tasks to the best of their ability.
Individual capacity building as process is practised for varied
purposes in different sectors like capacity building of managers in
small and medium enterprises (Pansiri and Temtime, 2008), ICT
regulatory staff (Goulden, 2005), capacity building in
decentralization activities in government (Pick, et al, 2007),
educator sector (Lozano–Garcia et al, 2008), strategic cash
management (Agundu, 2008), research of scientists (Melkers and
Wu, 2009), volunteers in health services (Coady, 2009), women
empowerment (Shibanda and Seru, 2002), leadership development
(Weiss and Molinaro, 2006) etc.
Institutional Capacity Building
Institutional Capacity Building has become the key component
and is considered as one of the main types of capacity building
efforts. It is the process of improving the ability of an institution
to carry out its mandate in an effective manner, by using its
resources in the most efficient manner possible (Tadele, 2009).
Institutional Capacity Building addresses capacity building beyond
the provision of education and training of professionals. An
institution’s capacity covers political, technical, fiscal and
administrative and may overlap and complement one another. A
government should have the capacity to formulate coherent,
plausible, and broadly responsive policy guidelines to attain its
goals (Zafarullah and Rahman, 2008).
Institutional Capacity Building aims to enhance the capacity of
governments, non-governmental groups and communities to
strengthen their ability to serve their citizens, communities, and
constituents and to plan and manage efficiently and effectively.
This implies addressing Capacity Building on a long-term, strategic
level. Concepts such as leadership, awareness, and constituency
building are part and parcel of institution building. Capacity-
building efforts focus on institutional strengthening, including the
design of new organizational structures to improve the “goodness
of fit” between the policy contexts for sustainable development
and enacting institutions in both the public and private sectors.
These institutions include education and training institutions as
well as extension agencies, research institutions, NGOs, and
community organizations among others. A multiplier effect can be
achieved if strong linkages among education institutions, NGOs,
research organizations, public and private extension services and
others are fostered. This approach recognizes that integrated
institutional network capacity building is required (Crowder, 1996).

SCMS Journal o f Indian Management , October - December, 2013 19
A Quarterly Journal
Consult with all stakeholders
Identify existing capacity
Evaluate the lacking capacity
Form multi -stakeholder working
group
Develop demand -driven strategies
Assess the impact of capacity built
An Occurring Phenomenon
Institutional Capacity Building is carried out in many developing
and under-developed countries like United Kingdom, India, Brazil,
Asia Pacific region, Africa, Ethiopia, Ghana etc. to enhance the
knowledge, expertise, experience and competence of the regions,
communities and their citizens. The purpose and nature of capacity
building varies from country to country and some listed in the
literature are disaster management (Tadele, 2009), community
capacity building for regeneration (O’Hare, 2010), e-records
management (Wamukoya and Mutula, 2005), government
decentralization (Antwi and Analoui, 2008), information and
communication technology in governments (Samarajiva and
Gamage, 2007), environmental capacity building (Kirchoff, 2006)
and innovation capacity building (Rodriguez and Marti, 2006;
Schiuma and Antonio, 2008). Institutional capacity building
involves massive efforts of evaluating the existing capacity and
then undertaking measures to build capacity of governments,
communities or regions. Governments and other non-governmental
institutions at a larger scale build capacity to tackle poverty,
environmental disasters, women empowerment etc, but no attempt
has been made to develop step-by-step approach for the capacity
building process. Reviewing the concept of capacity building
initiatives in institutional development, literature reveals that there
is a lack of systematic capacity building framework at macro level.
This paper attempts to develop a systematic step-by-step
approach towards macro level capacity building.
The Two Perspectives
Institutional capacity building has two perspectives – macro
perspective and micro perspective. Macro dimensions of capacity
are strategies to produce good governance and strong civil societies.
The building of capacity from this perspective includes major
market oriented economic reforms and governmental changes to
support them. Micro dimension of capacity is fundamentally
about human resource management, specifically improving the
skills and quality of government personnel. Micro perspective of
capacity building focuses on the recruitment, training and retention
of skilled personnel for strategically placed organizations, if
performance is to be improved (Straussman, 2007). Samarajiva
and Gamage (2007) conceptualizes capacity building narrowly or
broadly. In narrow conception, capacity is improved in
government by training officials or hiring qualified persons. In
the broad conception, capacity is built among all stakeholders in
addition to government. Institutions should focus on the
magnitude and scope of the capacity building strategies for its
benefits.
Systematic Approach to Capacity Building
A comprehensive search and evaluation of literature provided
insights into institutional capacity building efforts that led to the
development of a systematic approach consisting of six steps as
shown in the figure 1 given below,
Figure 1 – Systematic Capacity Building Approach

SCMS Journal o f Indian Management , October - December, 2013 20
A Quarterly Journal
Identifying Existing Capacity
The absence of capacity necessitates capacity building; hence,
effective capacity building must be preceded by an assessment of
existing capacity (Antwi and Analoui, 2008). Hamadu and Okafor
(2009) stress that institutional capacity building efforts should
start from the grassroots level to identify the capacity inherent
within the institutions. Wamukoya and Mutula (2005) indicate
that understanding the problems of the institutions is essential for
capacity building. The numerous challenges and problems posed
by institutions include lack of skills and competencies, inadequate
resources, and lack of awareness among government authorities.
Rodriguez and Marti (2006) argue that because of the complexities
and uncertainties inherent to capacity building, policy makers
must use comprehensive metrics and management systems to
effectively help the economy gain a more competitive knowledge
edge. Strategic benchmarking plays a fundamental role, choosing
an appropriate benchmark against which to assess the present
capacity helps policy makers focus on what core resources,
competencies and features of the general environment ought to be
developed to attain competitiveness. Benchmarking can contribute
significantly to grounding the analysis and allocating resources
more effectively. This first task helps institutions to build on the
existing capacity and set benchmark for future development.
Assess the lacking capacity
Of special concern to development planning and to situations
where there are limited resources is the need to build on what
exists. World Bank’s definition states that “Capacity Assessment
is a structured and analytical process whereby the various
dimensions of capacity are measured and evaluated within the
broader environmental or systems context as well as specific
entities and individuals within the system.” So special emphasis
must be given to assess existing and future capacities. Hamadu
and Okafor (2009) state that the countries should assess the
capacity which it lacks and then develop strategies to build them.
UNDP states that “A capacity assessment is an analysis of desired
future capacities against current capacities; this assessment
generates an understanding of capacity assets and needs, which in
turn leads to the formulation of capacity development response
strategies.” Capacity assessments provide a systematic analysis
of what key capacities exist, and a point of dialogue and negotiation
on what additional capacities may be required to reach a desired
development outcome.
Consult with stakeholders and form multi-stakeholder working
group
Capacity has to be developed among all the stakeholders
(Samarajiva and Gamage, 2007) and unless all partners are willing
to participate, integrated capacity building will struggle to make a
lasting influence (Tadele, 2009). Consultations with concerned
stakeholders are important for inclusive growth of the Institutions
(Kwiatkowski, et al, 2009). The engagement of local people in
the capacity building efforts that target their development is
considered to be incontestable and hence gear up their capacity
building activities (O’Hare, 2010). Capacity building strategies
are undoubtedly complex and bring with them a schedule of
activities or partners operating alien structures and process. The
stakeholders want to be involved in the development,
implementation, and interpretation of the impact assessment which
affects their community. A multi-stakeholder working group has
to be formed to advice on the implementation of the capacity
building strategies (Kwiatkowski, et al, 2009). Stakeholder
participation would enable effective participation by many players
in the regulatory process (Samarajiva and Gamage, 2007).
Develop demand-driven strategies to build capacity
As capacity building concept is gaining importance, there is growing
interest in dynamics and efficacy of different capacity building
interventions (Hailey and James, 2003). Effective capacity building
strategies need to be developed that brings together institutions
with the core responsibility for bridging the lacking capacity
(Wamukoya and Mutula, 2005). The strategies for capacity
building mean different things and they are different when applied
to concrete cases (Straussman, 2007). They should be based on
the needs of the institutions for future. Tadele (2009) states that
the institutional capacity building programs should be demand-
driven and beneficiary based rather than supply-driven and should
be holistic and integrated with co-ordination. These interventions
can be physical, technical/managerial, and human resource based
with an overall integrated effect of improving institutional
performance. Institutional capacity programs should be based on
the needs of the government which include policy familiarization,
human resources development, physical capacity development
and testing the policy. Literature gives a list of strategies adopted
by institutions for capacity building. They are listed in table 1.

SCMS Journal o f Indian Management , October - December, 2013 21
A Quarterly Journal
Table 1 – Strategies to Build Capacity
Authors Strategies to build capacity
Wamukoya and Mutula (2005) Collaboration and partnerships, continuing professionaldevelopment and establishment of centers of excellence.
Kirchoff (2006) Training and education, organizations and management,network linkages among organizations, public policy andinstitutional arrangements, overall context regardingeconomic, social and political environment in whichorganizations operate
Rodriguez and Marti (2006) Formation of micro-clusters to build capacity of regionsand create wealth
Kevany (2007) Proactive education, individual stewardship,transformative learning and experiential learning
Straussman (2007) Workshops with participants, pilot projects as learningcases and train-the-trainer’s program
White (2007) Establishing and strengthening independent and competentethical review process/committees strengthening researchcapacity, developing technologies appropriate, training,educating the community
Samarajiva and Gamage (2007) Different approaches like developing in-situ expertise,especially just-in-time learning and open-source research
Hamadu and Okafor (2009) Regular in-house training programs, instituting well-designed staff development programs and seeking technicalassistance from international donors
Kwiatkowski, Tikhonov, Peace and Bourassa (2009) Training, conducting workshops, indigenous communityengagement through research, a multi-stakeholder workinggroup
O’Hare (2010) Methodical approaches to the micro-relationships betweengovernance actors and “community-led” partnerships
Assessment of Impact of Capacity Building
As capacity building has been increasingly prioritized at the coreof many development strategies there is a necessity to assesstheir long term impact. Resource constraints and availability offunds have necessitated for increased accountability of usage offunds and the long-term impact of capacity building strategies onthe society (Hailey and James, 2003). Impact assessment isconcerned with assessing the long term and sustainable changesresulting from specific capacity building interventions. Toeffectively assess capacity building impact, it is first necessary tocome to consensus about what the capacity building impact is andhow it occurs. Also the question of who will assess the impact
raises another considerable challenge. There is a growing awarenessthat externally led evaluation is often inappropriate orcounterproductive (Hailey and James, 2003). The challenges inassessing the impact lie in being multi-dimensional and user-friendly, demonstrating attribution and measuring intangiblechanges in relationship (Hailey and James, 2003).
It becomes necessary to determine performance measurementindicators (Templeton, 2009) and techniques to assess the impactof capacity building. The indicators and key evaluation questionsif answered will result in assessing the impact. The indicatorscould be capacity inputs, capacity outputs and capacity outcomes.Key evaluation questions could include measuring the knowledge

SCMS Journal o f Indian Management , October - December, 2013 22
A Quarterly Journal
and skills acquired from training applied regularly in the society(Templeton, 2009). Gordon and Chadwick (2007) suggestquantitative approaches for measuring the impacts and benefits.A benefit-cost analysis aims to measure the direct and indirectimpacts of investment in quantitative terms but these need not betranslated into monetary value. Another quantitative measure isindicator analysis in which the indicators reflect real values.Modeling is building a model or relationships identified along thepathway from investment impacts to estimate impacts and netbenefits. Scoring models used in capacity measurements assessthe achievements against a set of objectives. Qualitativeapproaches like multi-criteria analysis report on achievementsagainst a set of criteria. Contribution analysis provides a credibleperformance story to substantiate the claim that a project hasmade a significant contribution to an observed change (Gordonand Chadwick, 2007). A combination and balance of qualitativeindicators and quantitative measures can be used to assess theimpact of capacity building in institutions (Hailey and James,2003; Templeton, 2009).
Conclusion
Capacity Building is the long-term, voluntary process of increasingthe ability of a country to identify and solve its own problemsand risks and to maximize opportunities. It encompasses thecountry’s human specific, technological, organizational, andinstitutional and resource capabilities. In conclusion, InstitutionalCapacity Building is to promote democratic governance, to improvethe structures and institutions of economic policymaking, tostimulate the strength of civil society to contribute to nationaldevelopment, and to create an environment of social empowermentfor the people where they can meaningfully contribute to decisionsthat affect their life and the development process. This entails theavailability of the human, material and financial resources essentialfor efficiently managing the institution and the identification andrecruitment of personnel with the required knowledge, expertise,experience, competence and leadership to manage the institution.Essentially, it is about unbundling the creative energies of thepeople, improving those energies and providing the legal,institutional and material context in which those energies willflourish.
From a research perspective, given the significance of capacitybuilding and in particular institutional capacity building, this paperattempted to develop a systematic approach, and address the gapin literature of capacity building. This six step process will provideguidance to any institution willing to undertake capacity buildingefforts for its benefits.
References
Aherne, M. and Pereira, J. (2005) “A generative response topalliative service capacity in Canada”Leadership in HealthServices, Vol.18, No.1, 2005, iii-xxi.
Antwi, K.B. and Analoui, F. (2008) “Challenges in building thecapacity of human resource development in decentralizedlocal governments – Evidence from Ghana,” ManagementResearch News, Vol.31, No.7, 2008, 504-517.
Azariah, S. (1999) “Participatory system development – A casestudy from Urban Health Lahore component DFID secondfamily health project,” Journal of Management in Medicine,Vol.13, No.2, 1999, 114-121.
Bhaskaran, S. and Gligorovska, E. (2009) “Developing andsustaining joint enterprises in transitional economy.” BritishFood Journal, Vol.III, No.7, 2009, 643-659.
Bolden, R. and Bagnell, J. (2009) “Building regional capacity :lessons from Leadership South West.” Journal of Educationand Training, Vol.51, No.8/9, 2009, 635-647.
Braun, P. and Hollick, M. (2006) “Tourism skills delivery : sharingtourism knowledge online.” Education+Training, Vol.48,No.819, 2006, 693-703.
Coady, M. (2009) “Enabling volunteer health planning capacity :a rural Canadian case study.” Journal of EnterprisingCommunities : People and places in the Global Economy,Vol.3, No.4, 2009, 393-404.
Collinson, V. (2008) “Leading by learning : new directions in thetwenty-first century.” Journal of EducationalAdministration, Vol.46, No.4, 2008, 443-460.
Crowder, L. V. (1996) “Human Resource and Institutional CapacityBuilding Through Agricultural Education.” SD Dimensions,1996.
Davis, S. F. (2009) “Knowledge exchange : Capacity building in asmall university.” Journal of Education + Training, Vol.51,No.8/9, 2009, 682-695.
Gordon, J. and Chadwick, K. (2007). “Impact assessment ofcapacity building and training: assessment framework andtwo case studies.” Impact Assessment Series Report No.44, February 2007.
Hamadu, D. and Okafor, R. (2009) “On statistical capacitybuilding in Nigeria: A necessary step towards achievingmillennium development goals (MDGs).” Statistical Journalof the IAOS, 26 (2009) 21–32.
Jung-Erceg, P., Pandza, K., H. Armbruster, and C.Dreher (2007)“Absorptive Capacity in European Manufacturing : a Delphi

SCMS Journal o f Indian Management , October - December, 2013 23
A Quarterly Journal
Study.” Industrial Management & Data Systems, Vol.107,
No.1, 2007, 37-51.
Jurie, J. D. (2000) “Building Capacity – Organizational
Competence and Critical theory.” Journal of Organizational
Change Management, Vol.13, No.3, 2000, 264-274
Kevany, K. D. (2007) “Building the requisite capacity for
stewardship and sustainable development.” International
Journal of sustainability in Higher Education, Vol.8, No.2.,
2007, 107-122.
Kirchoff, D. (2006) “Capacity building for EIA in Brazil :
Preliminary considerations and problems to be overcome.”
Journal of Environmental Assessment Policy and
Management, Vol.8, No.1, 2006, 1-18.
Kwiatkowski, R. E., Tikhonov, C., Peace, D. M. and Bourassa,
C. (2009) “Canadian Indigenous engagement and capacity
building in health impact assessment.” Impact Assessment
and Project Appraisal, 27(1), March 2009 57–67.
Li-Hua, R. (2007) “Knowledge transfer in international educational
collaboration programme – The China Perspective.” Journal
of Technology Management in China, Vol.2, No.1, 2007,
84-97.
Lozano–Garcia, F. J., Gandara, G., O. Perrni, and Mario Manzano,
M. (2008) “Capacity building : a course on sustainable
development to education the educators.” International
Journal of Sustainability in Higher education, Vol.9, No.3,
257-281.
M.Bruceking, M. and Newmann, F. M. (2001) “Building school
capacity through professional development : conceptual
and empirical consideration.” The international Journal of
Educational Management, 15/2, 2001, 86-93.
Melkers J & Wu Y, “Evaluating the Improved Research Capacity
of EPSCoR States : R & D Funding and collaborative
networks in the NPS EPSCoR Program.” Review of Policy
Research, Vol.26, No.6, 2009.
Meyer, A. (2008) “Technology strategy and China’s technology
capacity building,” Journal of Technology Management in
China, Vol.3, No.2, 2008, 137-153.
O’Hare, P. (2010) “Capacity building for Community-led
regeneration – Facilitating or frustrating public engagement.”
International Journal of sociology and social policy, Vol.30,
Nos.1/2, 2010, 32-47.
Prince Umor C.Agundu, “Credibility and capacity building in
local government – Strategic cash management imperatives
– A case study of rivers state of Nigeria,” Journal of FinancialManagement and Analysis, 2008, vol.21(2) 57-64.
Rodriguez, B. M. and Marti, J. M. V. (2006) “The region’sintellectual capital benchmarking system : enabling economicgrowth through evaluation.” Journal of KnowledgeManagement, Vol.10, No.5, 2006, 41-54
Sackney, L. and Walker, K. (2006) “Canadian perspectives onbeginning principals : their role in building capacity forlearning communities.” Journal of EducationalAdministration, Vol.44, No.4, 2006, 341-358.
Samarajiva, R. and Gamage, S. (2007) “Building the Divide :Building Asia-Pacific Capacity for effective reform.” Theinformation society, 23:109-117, 2007.
Schiuma, G and Lerro, A. (2008) “Knowledge based capital inbuilding regional innovation capacity”, Journal of KnowledgeManagement, vol.12, No.5, 2008, 121-136.
Shibanda, G. G. and Seru, F. I. (2002) “Human resource strategyfor Kenyan women shareholders.” women in ManagementReview, Vol.17, No.6, 2002, 285-296.
Straussman, J. D. (2007) “An Essay on the Meaning(s) of“Capacity Building”—With an Application to Serbia”, IntlJournal of Public Administration, 30: 1103–1120, 2007.
Tadele, F. (2009) “Building disaster resilence through capacitybuilding in Ethiopia”, Disaster Prevention and Management,Vol.18, No.3, 2009, 317-326.
Templeton, D. J. (2009) “A framework for assessing of the Impactof Capacity Building”, presented at the InternationalAssociation of Agricultural Economists 2009 Conference,Beijing, China, August 16-22, 2009.
Wamukoya, J. and Mutula, S. M. (2005) “Capacity Buildingrequirements for e-records management, the case in Eastand Southern Africa”, Records Management Journal, Vol.15,No.2, 2005, 71-79.
Weiss, D. and Molinaro, V. (2006) “Integrated leadershipdevelopment,” Industrial and commercial training, Vol.38,No.1, 2006, 3-11.
White, M. T. (2007) “A Right To Benefit From InternationalResearch: A New Approach To Capacity Building In Less-Developed Countries.” Accountability In Research, 14:73–92, 2007.
Zafarullah, H. and Rahman, R. (2008) “The impaired state :assessing state capacity and governance in Bangladesh.”International Journal of Public Sector Management, Vol.21,No.7, 2008, 739-752.

SCMS Journal o f Indian Management , October - December, 2013 24
A Quarterly Journal
n the ultra modern current lifestyle adopted by an
increasing number of working women in dual earner
families in Kerala, the household cooking chores and
related activities are largely assisted by the kitchen durables
tailored to meet the exact needs of cooking. We know that
food is an essential item for sustaining life and hence cooking
is inevitable in any household. Thus the biogenic importance
of cooking and its facilitation through modern cooking ware
products have profound influence in daily life. The onset of
mixer grinder-juicer-food processor and table top wet grinders
in customized design in varying sizes etc have revolutionized
the traditional labor by innovative use of kitchen durables .
The introduction of modern compact mixer grinders and table
top wet grinders have virtually resolved many of the teething
problems of preparations for cooking by way of convenience,
saving of labour/ time/fuel and cleaning efficiency. Further,
the latest shift has been due to induction cooker and MWO
suitable for use to match diverse dietary lifestyles. The
monopolistic scenario has changed now with the Market
Consumer Behaviour:
Kitchen Durables
Consumer behaviour(CB) has been the most researched area in marketing and market segmentation studies in history. Consumer attitude
is antecedent to behaviour and it is a relatively global and enduring evaluation of an object of consumption, issue, person or an act. It is
well known that attitudes guides one’s thoughts, influence feelings and affect behaviours. Changes in behavioural patterns of consumers
over the years have been due to several factors and best described by the consumer acculturation. A study of current Consumer purchase
behaviour-attitude towards most popular modern kitchen durables (Mixers/Grinders) nexus conditioned by the consumer related personal
factors, social factors and the market factors as per TPB blended with TAM, are discussed herein based on a study conducted in Kochi
based on random sampling with HH sample size of 200 & retailer sample size of 40.The Consumer attitude has gained larger importance
in the modern market segmentation, targeting and product positioning, and is discernable /imperative in the new acculturated
consumerist Kerala society, at a commercial urban center, Kochi.
Abstract
Key words: Consumer Attitude, BI, Behaviour, Grinders, SN, PBC,, Motive, Family dynamics, TPB,TAM.
Anilkumar N. and Jelsy Joseph
Anilkumar N., Sai Kripa, Lotus Garden, Hidayat Nagar,HMT Colony P.O, Kalamassery, Ernakulam, Kerala.09447986364(Cell);E mail : [email protected], [email protected],
Dr. Jelsey Joseph, Research Scholar & Chief Manager, Dean,Department of Commerce& Business Management,Karpagam University, Coimbatore, Tamil NaduE-mail : [email protected],
I

SCMS Journal o f Indian Management , October - December, 2013 25
A Quarterly Journal
perception) simultaneously interact to influence theconsumer’s purchasing decision (Brijball, 2003; Du Preez andVisser, 2003).
1.3.2 Consumer Attitude :Attitude is an inclination to reactto stimuli (Mellott, 1983). Attitude is a psychologicaltendency that is expressed by evaluating a particular entitywith some degree of favour/disfavour (Eagly &Chaiken,1993).Research studies have shown that customer’s behaviouralintention is influenced by their attitude toward that behaviour(Ajzen 1991, Ajzen and Fishbein 1980).Attitude is a vectorwith strength and valence among other features. Attitude isdefined as an ‘affective evaluation,’ which is made up of beliefsabout the consequences of behaviour. Subjective norms arenormative beliefs about the behavioural expectations ofsignificant others: the person’s evaluations of how mostpeople important to him/her would feel he or she shouldbehave (Liska 1984). According to the TPB model, attitudesand subjective norms affect behavioural intentions, which inturn affect the final behaviour. Belief that performance of abehaviour will result in a positive outcome leads to favourableattitudes toward that behaviour. Similarly, if an individualbelieves that the behaviour will lead to a negative outcome,the attitude toward that behaviour will be negative (Ajzen &Fishbein, 1975; Mykytyn & Harrison, 1993). Subjectivenorms are determined by an individual’s belief about howpeople whom he/she cares about will view the behaviour inquestion (Eagly & Chaiken, 1993). Subjective norms areinfluenced by normative beliefs and the motivation to comply.Normative belief is the perception about how family andfriends will perceive the outcome of the behaviour. Themotivation to comply is the degree to which perception of anoutcome influences whether the behaviour is carried out.Finally, intention is the likelihood of performing an act orbehaviour toward a product or service. Schiffman and Kanuk(2004) state that attitude could be regarded as permanent ifconsumer behaviour matches up with consumer attitude.Attitudes are antecedent to behavioural intention and certainsalient beliefs are antecedent to these attitudes(Allen etal,1992, Dabhilkar1994, Taylor & Todd, 1995, Curran &Meuter 2005). Attitudes perceived as being important aremore likely to be used when processing information, formingintentions, and taking action (Boninger, Krosnick, & Berent,1995; Fishbein & Ajzen, 1975. The original TAM of FredDavis(1989) and the modified TAM2 of Venkatesh &Davis(2000) pertain to the perceived usefulness and ease ofuse/application of technology products/ equipments afterpurchase. The Attitude as per TPB (Ajzen&Madden,1986)has background factors of the consumer like personal-
leaders like Sumeet, Maharaja, Philips, Preethi for Mixergrinders and brands like Ultra, Butterfly, Prestige for Tabletop wet grinders, competing fiercely with host of new brandswooing the MC consumer segments in a big way in UrbanKochi. The key search attributes and salient search attributesof product shape the consumer’s quest.
1.3 Literature Review
1.3.1 Consumer Behaviour:
Consumer behaviour traditionally blends various disciplineslike Psychology, Sociology, Learning theories, Cognitivetheories, Gestalt & Field theories and motivational theoriesculminating in social humanism today. The decision makingof the consumer is determined by the pre purchase behaviour,which is preceded by the intention to buy/consume and ahost of other antecedent factors. Some of these factors areintrinsic to the consumer like the personal aspects –beliefs/evaluation based attitude towards the act(purchase),while theextrinsic variables like social aspects- subjective norms andthe perceived /actual behavioural control etc conditionedwithin the situational construct, influence the consumer’sbehavioural intention. Attitude–behaviour consistency hasbeen of great interest to researchers since the 1930s. In theearly 1970s, a number of researchers (e.g. Acock & Defleur1972; Ajzen & Fishbein 1975; Triandis 1977) developedattitude–behaviour models that focused on the causalrelationship between attitudes and behaviours. According toAjzen and Fishbein (1975), behaviour is a function ofbehavioural intentions, which are themselves a function ofattitudes and subjective norms. The Theory of ReasonedAction stipulates that beliefs underlie a person’s attitudesand subjective norms, which ultimately determine intentionsand behaviour (Fishbein and Ajzen, 1980). Researchers havedrawn on attitude-behaviour relationship, namely the theoryof planned behaviour (TPB; Ajzen, 1985), to explain consumerbehaviour. The extrinsic aspects also condition the attitudedimension, and the attitude functions(consumption motive)thus influencing the final purchase decision of the consumer.The purchasing decision of the consumer is an individual one(Du Plessis and Rousseau, 2003) and the complexity of thedecision depends on the consumer’s degree of informationsearch, the evaluation of alternatives and the choice ofproducts (Du Preez, 2003). The consumer decision-makingprocess is a sequential and repetitive series of psychologicaland physical activities ranging from problem recognition topost-purchase behaviour (Brijball, 2003). Market-dominatedvariables(environment and advertising) and consumer-dominated variables (such as needs, motives, personality and

SCMS Journal o f Indian Management , October - December, 2013 26
A Quarterly Journal
demographics-psychological motive aspects, psychographics,the social factors like Family/Ref groups/ sub-cultural aspectsand intervening factors l ike Situat ional aspects andEnvironmental-Market aspects. These drive the interactingbehavioural beliefs, normative beliefs and control beliefswhich in turn lead to the ATB, SN and PBC respectively,which sum up to form the behavioural intention to culminatein the consumer behaviour. Attributes projected by theproduct’s image which lead to the choice of that product(Alpert, 1971). The consumer considers each product througha bundle of salient attributes. Also consumers develops a setof brand beliefs about where each brand stands on eachattribute/brand image. A consumer is assumed to have a utilityfor each attribute. The utility function describes how theconsumer expects product satisfaction to vary with differentlevels of each at tr ibute. The consumer arr ives atat tr ibutes(Judgments/preferences) towards the brandalternatives through some evaluation procedure. Petty andCacioppo’s (1986) elaboration likelihood model of persuasion(ELM) provides the theoretical foundation for the relationshipbetween attitude toward the ad and attitude toward the brand;their direct relationship may result from message processingthat occurs in the peripheral route of the ELM (Miniard,Bhatla, and Rose 1990). Attitude toward the Ad may affectprocessing in the central ELM route by influencing brandcognitions, which in turn affect attitude toward the brand(Miniard, Bhatla, and Rose 1990). Previous research furtherexplicates the relationship between attitude toward the adand attitude toward the brand in terms of general paths.
1.3.3 Consumption motive(Attitude Function) at DrivingEnd:
Consumer motivation relates to a wide spectrum of wantsand needs. Consumer motivation is an internal state that drivespeople to identify and buy products or services that fulfillconscious and unconscious needs or desires. The fulfillmentof those needs can then motivate them to make a repeatpurchase or to find different goods and services to betterfulfill those needs. Motivation is an activated internal statearousing /directing & leading to behaviour. Kim and Jin (2001)argue that consumer motives are known to be the drivers ofbehaviour that bring consumers to the retail store. Based onpast research, consumer motives can be categorized from fourperspectives. Firstly, the social influences on consumermotives such as the culture, sub-culture, social class, referencegroups and families (Peter & Donnell, 2007). Secondly, thesituational influences on consumer motives such as physicalfeatures, social features, time, task features and current
conditions (Belk, 1975). Thirdly, psychological influenceson consumer motives include product knowledge and productinvolvement (Peter & Olson, 2005). Finally, the marketingmix influences on consumer motives such as product, price,promotion and place (Peter & Donnell, 2007). Buying motivescould be product oriented or patronage oriented ,of rational/emotional type. The motive theory on Attitude of Katz (1960)stated four major functions that attitude can serve: Theutilitarian and instrumental, the ego-defensive, the value-expressive, and the knowledge function. Consumers purchasein response to a recognized need (Solomon, 2004).Consumerswould often reject cook ware with mass appeal and preferproducts that are tailored to reflect their specific needs(Elsasser, 2004).The various functions of attitude lead to theconsumer’s overall attitude toward engaging in the givenpurchase decision, thus influencing behavioural intention(Hawkins et al., 2001). Behavioural intention reflectsthe consumer’s plan of action or a proposition associatingone’s self with a future consumption action or behaviour(Peter & Olson, 1999). Price is main motive in buying as perGitomer J. (2005).
1.3.4 Societal Influence/Compliance as Norm: Socialinfluence has been an important area of study for researchersin consumer behaviour, including effects of reference groups(e.g. Bearden and Etzel 1982; Escalas and Bettman 2005),group membership (e.g., Briley and Wyer 2002), groupdecision making (e.g., Aribarg, Arora, and Bodur 2002), andpublic versus private consumption (e.g., Ratner and Kahn2002). In addition, researchers have examined the impact ofthe social environment on consumers in domains such asvariety seeking (Ariely and Levav 2000), levels of foodconsumption (Herman, Roth, and Polivy 2003), and productevaluations (Burnkrant and Cousineau 1975).The socialinfluences affecting the attitude of a consumer are largely dueto the family and the social reference groups. The consumer’schoices and preferences can be altered by the input providedby other individuals and by the desire to present oneselffavourably to others. Choices and preferences might beinfluenced by information provided by others. Burnkrantand Cousineau (1975) found that people’s evaluations wereinfluenced by viewing the evaluations of others. Groupinfluences on consumer attitudes and behaviours can activateconsumers’ need to cope, particularly when group opinionsare different than consumers’ personal views (Duhachek2005). Not only does direct face-to-face communication withothers affect individual attitudes, but recent research suggeststhat even indirect means, such as online communication, canproduce group influence effects (Schlosser 2005). In fact,

SCMS Journal o f Indian Management , October - December, 2013 27
A Quarterly Journal
merely anticipating group interaction has been shown to exerta strong impact on attitudes (Schlosser and Shavitt 1999,2002). The social influence on attitude and behaviour hasbeen a focal research area for decades (Festinger 1957; Heider1958). Research into these phenomena has shown that socialcontext influences individual attitude by shifting attitude inthe direction of salient others with whom individuals shareties, operating through both social comparison (Festinger1950) and normative mechanisms (Boster and Cruz 2002).Although consumers may frequently rely on social cues informing attitudes, situational characteristics may amplify theeffect of social context.
1.3.5 Family dynamics/Subjective norms(Normativedimensions) as Default mode
Family core values influence attitudes. Consumers buy keybenefits of the products and are based on beliefs leading toattitude formation. For a large size family, the priority wouldbe on more efficient use of disposable income, perceived riskreduction, higher information search; while for a higher incomefamily time is the most valuable resource with less informationsearch and lower brand loyalty. Past research in this area hasfound that the roles played by family members differ withregard to the product being purchased, the stage in decision-making process, and characteristics of families and spouses(Belch and Ceresino, 1985; Davis, 1976; Piron, 2002; Webster,1995). These roles may change over the period due to changesin the environment such as economic development, whichconsequently may lead to adjustments in the role structure ofthe decision-making process. Changes are occurring inperception of role of women. These changes in education, theadvent of career women, and the growing number of dual-income families have challenged earlier beliefs on the rolestructure and purchase influence (Webster, 1995). Changes inthe economic environment have led to changes in the roles ofhusbands and wives (Cherlin, 1992;McConocho and Tully,1993).The family decision making involves decision roles/relat ive influence/influence strategies & decisionstages(Commuri & Gentry,2000). When making consumerdecisions, husbands and wives commonly attempt to influenceeach other to arrive at what they feel to be the best outcome.Family decision making involves the play of familydeliberations between Husband -Wife, Parents-Kids, Familyvalues, roles, WFC and Conflict resolution mechanisms andsocial lifestyle. Modernization causes shift in cultural norms,such as sex role norms, creates more opportunities for womento work outside the house, delays in marriages, and shiftssocietal standards (Lee and Beatty, 2002; Qualls, 1987).The
social reference group is the benchmark for the consumer incomparing with others, which apart from family could befriends, relatives, peers etc.
1.3.6 Personal /Psycho-socioeconomic demographics/PBCDimensions as Baseline
Research by Brunner and Wänke (2006) indicates thatconsumers are likely to evaluate one brand against the otherwhen they are placed in the same context, illustrating theimportance of consumers’ perception of brands. Du Preez(2003) illustrated that the complexity of the purchase decisiondepends on the extent of the consumer’s information search,which according to Du Plessis and Rousseau (2003) dependsmore on the individual’s personality than on productcharacteristics itself. The demographic characteristics of theconsumer may influence the attitude towards purchase ofcookware like the family size, FLC stages, Educational andprofessional status, Income and others. An added dimensionherein is the psychographic variable like self image(based onpersonality-internal) and the manifested lifestyle(externalActivity-Interest-Opinions) not proposed to be explored inthis study. Further, the situational and environmental factorshave an extraneous influence on consumer attitude and decisionmaking, which is beyond the study as elaborate.
1.3.7 TAM application in Use of Mixers/Grinders inmodular Kitchens
Technology acceptance model of Davis(1986) is the theoreticalframework for user acceptance of technology based productsapplicable to durables as well. The use of the durable is decidedby the BI to use and the antecedent of which are the Attitudeand PU. The Attitude and PU are moderated by PEOU.
1.3.8 TPB application in explaining Consumer behaviouron Kitchen appliances
This landmark theory indicates that BI determines thebehaviour for which the antecedents are Attitude, SN andPBC(Ajzen,1985,1991,2002) and is the foundation inconsumer behaviour.
1.3.9 Past Behaviour/Memory recall /Cognitivedissonance as modulators of Behaviour:
Past experience and memory moderates the consumer’s future
purchase behaviour. Cognitive dissonance and actual
experience on the brand/product increases knowledge on the
product and guides future purchase decisions. Cognitive
SCMS Journal o f Indian Management , October - December, 2013 28
A Quarterly Journal
dissonance(Festinger L. , 1957) is the feeling of uncomfortable
tension which comes from holding two conflicting thoughts
in the mind at the same time. Dissonance increases with
� The importance of the subject to us
� How strongly the dissonant thoughts conflict
� Our inability to rationalize and explain away the conflict
Dissonance is often strong when we believe something about
ourselves and then do something against that belief. If I believe
I am good but do something bad, then the discomfort I feel as
a result is cognitive dissonance. Cognitive dissonance is a
very powerful motivator which will often lead us to change
one or other of the conflicting belief or action. The discomfort
often feels like a tension between the two opposing thoughts.
To release the tension we can take one of three actions:
� Change our behaviour
� Justify our behaviour by changing the conflicting
cognition
� Justify our behaviour by adding new cognitions
Dissonance is most powerful when it is about our self-image.
Feelings of foolishness, immorality and so on (including
internal projections during decision-making) are dissonance
in action. If an action has been completed and cannot be
undone, then the after-the-fact dissonance compels us to
change our beliefs. If beliefs are moved, then the dissonance
appears during decision-making, forcing us to take actions we
would not have taken before. Cognitive dissonance appears
in virtually all evaluations and decisions and is the central
mechanism by which we experience new differences in the
world. When we see other people behave differently to our
images of them, when we hold any conflicting thoughts, we
experience dissonance. Dissonance increases with the
importance and impact of the decision, along with the
difficulty of reversing it.
Sutton(1994) stated that with repeated performance,
behaviours become determined by one’s past behaviour rather
than by cognitions. Self reported past behaviour is an addition
to TPB(Norman & Conner,2006;Conner & Armitage,
1998,Cheng et al 2005, Astrom,2004).
1.4 Statement of the Research Problem: The purpose and
significance of the study is to identify the current preference/
purchase behaviour of consumers towards modern Kitchen
durable products in Kochi.
1.5 Scope of the study: The study is limited to Kochi cityand urban suburbs and is aimed at the limited segment ofmiddleclass domestic Consumer HHs (single entity) to studytheir purchase behaviour being the largest consumer segment.Institutional/Commercial consumers are excluded from thisstudy. The attitude object is table top Mixer Grinder Juicerand table top wet grinders, as the durables. The study isbased on the most popular household item used by women infamily and most sold in Kerala market, especially at thecommercial hub of the state of Kerala, the fastest growingurban metro of Kochi.
1.6 Objectives of study: The key objectives of this marketresearch study is on consumer purchase behaviour withrelevance to following specific objectives -
1. To identify the product attributes, quality influencing thekitchen durables and brand preference,
2. To explore aspects like socio demographic profile whichinfluence the attitude- preference of consumers towardskitchen durables,
3. To assess the consumers perception-awareness on varieddurables brands/loyalty,
4. To identify buying motives for branded durablesconsumption,
5. To gauge the consumer satisfaction level with respect tovarious attributes of durables, and
6. Evolve a simple Regression model as per TAM+TPB, Pastbehavioural usage aspects influencing BI.
1.7 Null Hypothesis formulation (H0) Elaboration:
1. There is no significant association between the qualityof kitchen durables and brand preference /loyalty for theconsumer.
2. There exist high degree of positive association betweenthe general satisfaction level of consumers and incidenceof low level of complaints / defects on kitchen durablesin post purchase scenario.
3. There is no significant association between the incomegroup and Brand Loyalty for durables.
4. There is no strong association between income group ofconsumers and frequency of purchase of durables foractual rational use.
5. There is no association between income group ofconsumers and the frequency of purchase of durablesfor presentation/gifting purpose.

SCMS Journal o f Indian Management , October - December, 2013 29
A Quarterly Journal
6. There is significant posit ive correlation between
consumer’s purchase behaviour at the retailer showroom
and direct feedback with regard to the durable products.
7. The personal aspects of the consumer does not
significantly influence the favorable attitude towards
purchase behaviour towards durables.
8. The social(other’s influence) aspect of the consumer does
not significantly influence the favorable attitude towards
the purchase behaviour of durables.
1.8 Research methodology: Descriptive exploratory
Research on consumer attitude/preference on qualitative
variables is undertaken herein.(1)Sampling Design: The
Consumer Survey was conducted on a sample of 200HHs
drawn from a population of over 5lakh HHs in Kochi. Also
40 retail outlets were sampled from over 200 sales /retail
outlets for kitchen durables in Kochi; (2)Sampling Method:
The sample size of 200 Households (HHs) was chosen from
a population of 5 lakh HHs in Kochi. Random sampling
applied to select the sample households of the Urban areas;
(3) Method of Data Collection: Survey method of primary
data collection using Combined Interview and questionnaire
adopted for collection of primary data through field survey
was undertaken in Kochi city limits in 2012.
1.9 Discussion / Findings; The Primary survey results on
HHs are detailed below in descriptive form. The demographics
are: the maximum age range of husbands were 40-50 yrs
while the same for housewives were 30-40 yrs. 80% of
households had only 2-4 members. The education level of
husbands were maximum in the Professional level (35 percent)
and among Housewives, Graduation level (50percent). Almost
90 percent and 82.67 percent of the husbands & housewives
respectively of the sample population were employed in Govt.
/ Pvt. Sector. The average monthly income of 40 percent of
households were in the range of Rs. 10,000/- Rs. 20,000/-
and 30.33 percent of the households belonged to the income
range of Rs.20,000/- to Rs.30,000/-, falling in the income
group classification M, for analysis. The lower levels of
Income (below Rs. 10,000/- per household) accounted for 13
percent and the higher levels of income (above Rs. 33,000/-
per household) was found in 16.66 percent of the sample
population of households. In 79.67percent households, wives
made the decisions on purchase of kitchen durables and self
help (no servant) has been practised in the kitchens of
61percent of households, usually working housewives. The
fuel used in kitchen was predominantly LPG (88.67 percent
households), wood (7.33 percent) and Kerosene (4 percent)
have also been used. In 89.33 percent cases, the need
prompted purchase of kitchen durables. The average age of
person handling cooking ranges between 30-50 yrs (82.67
percent) with mostly twice a day cooking schedule (71
percent). The surveyed sample population covered mostly
Keralites/south Indians residing in and around Kochi city in
the urban/town areas and hence the figures applicable mostly
to urban population - 82.67 percent were Kerala residents
and 12.67 percent were south Indian (non-Keralite) with 4.67
percent accounting for North Indians residing in Kochi. On
an average one number each of Mixer grinder and wet grinders
were currently used per household. Almost 96 percent of the
sample population used mixer grinders and wet grinders. The
maximum average useful life of durables is 5-10yrs (39.33
percent). The major problems faced in use were parts failure
(39.33 percent), subsequent wear & Tear (29.67 percent) and
handling damage/breakages (24 percent). 60 percent of the
sample population opined that time saving was the striking
advantage while 44.67 percent indicated labour saving and
19.33 percent opted for ease of use/cleaning/operation.
Regarding factors influencing new purchase of kitchen
durables based on product attributes, several salient attributes
were identified as relevant of which the most prominent ones
are Product quality, Convenience of handling & use, Price
Tag, Brand specific choice, Affordability, Safety of operation,
Utility, Past experience etc. in the high→low ranking. The
cooking quantity of food was assessed and found to be as
follows on daily basis-80 percent used less than 1Kg and 16
percent used 1-2Kg of cereals, almost 95 percent used less
than 1Kg of pulses and about 78.67 percent opted for use of
less than 1Kg and 17.33 percent opted for use of 1-2kg of
meat/fish – Non vegetarian food needing deep fry using
nonstick ware,etc. The consumption of fish, eggs, meat
(Chicken, beef, mutton and pork) is currently soaring as also
their cost in the market in view of high demand in the state
and abroad. Most of the meat related products, vegetables
and cereals/pulses are imported from neighboring southern
states like T. Nadu, Karnataka and A.P.
The average time spent on cooking at a time was 30minutes-
one hour for 40.33 percent households, 1-2hours for 30.67
percent households and more than 2 hours for 12.67 percent
households. The sample households bought modern kitchen
durables for actual use as once in 5-10yrs (41.33 percent) &
;

SCMS Journal o f Indian Management , October - December, 2013 30
A Quarterly Journal
more than 10yrs (39.67percent). Further, 6.33 percent
households, bought modern kitchen durables once in 3-4 years
period. Among the households, 42.67 percent bought grinders
in a period of more than one year for presentation/gift purpose
while 30.33 percent bought the same once in 6 months
(emotional motive) for the social functions like marriage,
House warming, wedding/Birth Anniversary etc; choosing it
as a gift item. Hence the purchase is not fully rational in
motive, as imitation/ gift value/ affinity relationships,
affordability on price front etc; act as influences with opinions
leaders/ social sub class ratings affecting status of householder.
Several brands are in the market at various price/size to meet
the growing demand for the perennial consumption item like
grinders. Eighty-seven percent of the respondents/households
indicated that their purchase style is dominated by reason
(rational motive) weighing the merits/ demerits and the C-B
ratio on cookware products. Clear opinion on retail outlet
choice from which consumers preferred to purchase- 50.67
percent preferred authorised retail dealer while 35.67percent
opted for the now ubiquitous Shopping Malls & Hyper
markets. For 39.01percent of households ,the Others influence
was as fol lows:39.01percent influenced by Family
members,17.85percent influenced by friends,15.93percent
influenced by close relatives,14.01percent influenced by
colleagues/peers, 12.08percent influenced by neighbors and
1.12percent influenced by others like salesmen etc. This
shows the normative influence on attitude towards purchase
of Grinders. The mass media as a communication source
influenced the household attitude as below:32.77percent were
influenced through TV Ads-celebri ty endorsements,
25.11percent were influenced through newspaper Ads,17.02
percent through Ads/review in popular household
magazines,16.17percent through the WWW(Internet)Web
sites/E shopping sites,5.1 percent through Retailer/Dealer
network exhibitions/pamphlets and 3.83percent through
hoardings/LCD TV Ads in street corners & shopping malls.
Interestingly, there is little influence through Radio on the
urban households. Regarding the quality of the after sales
complaint management-spares services support received on
branded Grinders for the households: Only 17.45 percent ratedthe services as excellent, while 69.78 percent rated theaftercare services as good, and 9.79 percent rated the servicesas sat isfactory and 2.98 percent rated them as bad(complaints).The likelihood of repeat purchase of existingownership of brands (brand loyalty)in Grinders in householdshave been :Most likely (46.12 percent), More Likely (17.62percent), Less likely (12.03 percent), Unlikely (7.28percent)and the Undecided (16.95 percent).With respect to the final
conflict resolver-decision maker in the family for purchase ofcookware: In 56.17percent households, the conflict resolverin the household was jointly by involvement of most
members, while in 33.19 percent households the husband
resolved the purchase conflicts, in 5.53 percent households
only the wife was the conflict resolver, in 2.98 percent casesthe kids were the conflict resolver for purchase decision makingand only 2.12 percent households were strongly influencedby parents/in laws. On the sales promotion preference front,the household attraction towards the various modes of salespromotion schemes available in the market for the brands/marketers of Grinders has been: majority chose Advertise-ments (44.32 percent), Celebrity endorsement (22.45percent), Hoardings/Banners/Posters–Flex boards (19.87percent) and others like dealer gifts/discounts offer pamphlets(13.36 percent). The purchase behaviour adopted by thehouseholds for cookware are broadly : Habit-routine styleadopted by 7.87 percent, Limited problem solving styleadopted by 19.21 percent, Extensive problem solving styleadopted by the majority (38.35 percent) and Variety/choiceseeking style by 34.57 percent of the households sampled.The overall purchase attitude towards the act of purchase ofmodern table top grinders by the households have been aclear majority of favourable (62.14 percent), Unfavourable( 14.58 percent), Neutral / ambivalent( 13.68 percent) and aminority of Can’t tell/ Undecided( 9.67 percent) in the sample.
Table 1: Ownership Profile of Durables in Urban Kochi HH:
Ownership of durables in HH %(Sample:100)
Refrigerator 99.8
Washing machines 98.4
MWO/OTG 88.6
Induction cooker/LPG Hobs & Hoods/Hybrid cookers 99.2

SCMS Journal o f Indian Management , October - December, 2013 31
A Quarterly Journal
Kitchen grinders are used in almost all HHs sampled, alongwith other kitchen durables like Refrigerators. Grinders ofMixer-Juicer-Food processor for dry or semi dry or wetprocessing of food materials in Kitchen and Wet flour grindersfor preparation of Dosa, Iddaly, Apppam, Pathiri, IdiyappamVada etc which are ethnic Keralite food are inevitable in anymiddle class kitchen. All grinding works in wet or dry form
Vaccum cleaner /Water purifier 96.3
LED/LCD/Plasma Color TV with STB/DTH 100
Home theatre/DVD Music systems 5.1 Hi Fi Speaker systems 95.9
Air conditioners/Split AC units 85.6
Mobile phones(Hi tech 3G)/I pod//Digi Camera/Camcorder 100
PC/Laptop with broadband connections/Tablet/Notebook/PS2 98.4
Home Gym –Indoor Health Equipments/ Bi Cycles 76.7
Premium Two wheelers and Petrol/Diesel Cars(Luxury) 98.8
Mixer Grinder-Juicer-Food Processor, Table top Wet Grinders 100
are handled by Grinders and hence they are important in Keralite
Kitchens today. Wet grinders which have higher capacity than
Mixer Grinders are used in tandem with Refrigerators for
storage of Flour materials for upto seven days or more and
essential when the family size is relatively larger. From Table
1 above, every modular Kitchen has Mixer-Wet grinders.
Table No. 2: Key Search Attributes for Table top Kitchen Grinders
S No. Salient Product search attributes forTable top Mixer/Wet Grinders Mean S D
1 Power rating of Motor(500/500/750W for Mixer and 1/1.5/2KW
for Wet Grinder)) 4.22 0.71
2 Safety locks & protections; Knob controls 4.12 0.72
3 Speed/rpm of motor/ blades/stone type & design variety
(18,000-20000 for Mixer) 3.84 1.24
4 Sound level generated-Low noise design 4.10 0.53
S SS- body with unbreakable grip handles/lockable
un Unbreakable Polycarbonate top lids 4.18 0.76
6 Efficiency-Performance aspects relating to grinding
of food materials in shortest time in custom form
desired for use in Stove/MWO 4.66 0.47
7 Capacity-size of Bowl. Vessel & number of jars 4.31 0.66
8 Power consumed-BEE Star rating/Operating Cost involved 4.16 0.91
9 After sales service-spares support/ease of service 4.26 0.95
10 Model, style and physical shape-dimensions/weight,
colour choice apart from white 4.11 0.71
11 Pricing and exchange schemes, terms of buy, Warrantee coverage
for motor 4.54 0.56
12 Make, Brand Image & maturity 4.46 0.57

SCMS Journal o f Indian Management , October - December, 2013 32
A Quarterly Journal
From Table 3 above, ULTRA brand is most popular amongWet grinders while for Mixer grinder Juicer PREETHIfollowed by Butterfly and Kenstar have been popular in theUrban HHs of Kochi.
Hypothesis Testing:
1)Null Hypothesis H01:There is no significant associationbetween the quality of kitchen durable product(Grinder)and brand preference /loyalty for the consumer.
a)By Association of Attributes method : (Test associationof quality of product and brand preference/Loyalty) Observedfrequency (AB) =23 is >Exp. Frequency of 18.2. Hence there’sassociation between attributes of product Quality & BrandLoyalty. Yules Coefficient, (of degree of Asscn ) Q =0.864
High degree of Association between Quality of Product &Brand Loyalty.
b)By Proportion method: (AB) /(B)=0.821 and (Aβ)/ (β)= 0.25;
As (AB) > (Aβ) , there’s positive association between A
and B or product quality & Brand Loyalty
B in A& α : (AB) = 0.88 ; (αB) = 0.357
(A) (α)
As (AB) > (αB); positive association between A&B ; (A)
(α) ;
i.e , positive association between product Quality & Brand
Loyalty. There is high degree of positive association between
Brand Loyalty & product Quality.
2)Null Hypothesis H02: There exists high degree of positive
association between the general satisfaction level of consumers
and incidence of low level of complaints / defects on Grinders
in post purchase phase.
a)By Association of Attributes method(Test extent of
relationship between satisfaction level of consumers and
defects/complaints on post purchase by consumers.)Since
Observed (AB) =13 > Expected freq=9; since actual or
observed (AB) > Expected freq (AB), there’s positive
Association between attributes A&B.;Yule’s Coefficient of
Association. Q=0.7843; There’s fairly high degree of
Association between A&B.
1 PREMIER 4.23 .92 1 BUTTERFLY 4.30 .91
2 INALSA 4.27 .91 2 KENSTAR 4.28 .92
3 BUTTERFLY 4.61 .70 3 MORPHY RICHARDS 3.89 1.13
44 PIGEON 4.36 .88 4 HAVELLS 3.11 1.40
55 PRESTIGE 4.48 .78 5 PREETHI 4.49 .76
66 VIJAYALAKSHMI 3.69 1.24 6 SUJATA 3.77 1.18
77 ULTRA 4.67 .64 7 PHILIPS 4.10 .98
88 Mr. BUTLER 4.24 .91 8 PRESTIGE 3.68 1.25
99 AVION 4.36 .87 9 MAHARAJA 4.02 1.15
110 AVG 3.01 1.41 10 PANASONIC 2.91 1.35
Clearly, from Table 2 above, the efficiency or performance is the most dominant attribute chosen by Consumers.
Table No.3: Brand Preference for top ten brands of Kitchen Grinders in Kochi market
S. No Leading Brands for Table Mean S D S . Leading Brands for Mean S S Dtop Wet Grinders No Mixer-Juicer-Grinders
(B) (β)

SCMS Journal o f Indian Management , October - December, 2013 33
A Quarterly Journal
b)By Proportion method: A in B & β :
Since (AB) > (A β) ,Viz., 0.541>0.125,there’s positive
association between A & B
B in A&α:
Since (AB) / (A) > (αB) ) / (α ), Viz.,0.867>0.44 , there’s
positive Association between A&B; There’s high degree of+ve Association between general satisfaction level ofconsumers and incidence of low level of complaints / defectson Grinders on post purchase phase.
3)Null Hypothesis H03: There is no significant association
between the income group and Brand Loyalty for Mixer
Grinders. HI: There’s significant association between Income
group s& Brand loyalty Using chi square test, Computed
value of x2 = ξ (O-E)2 / E) = 38.6292 with d.f = 4 and for αof 0.05, X2 value from table = 9.49: Statistical Inference: As
computed value of x2 > table value of x2 above, H0 is rejected.
There’s significant association between income group and
Brand Loyalty for Mixer /Grinders.
4)Null Hypothesis H04: There is no significant association
between income group and Brand Loyalty for Wet grinder
products. On testing, there’s an association between income
group & Brand Loyalty .Using chi square test, Computed the
Value of x2 = 51.9511; d.f = (r-1) (c-1) = (4-1) (3-1) = 6 &
for α = 0.05, X2 value from table = 12.592; Statistical
Inference: As computed value of x2> table value of x2, H0
rejected. There’s significant association between income
group & Brand Loyalty for Wet grinders.
5) Null Hypothesis H05 : There’s no association between
income groups and freq. of purchase for actual rational use.
On testing, there’s association income groups and freq. of
purchase for actual rational use. Applying chi square test,
Computed value of x2 = 13.1936; d.f = 6; for α = 0.05, X2
value from table = 12.592; Statistical Inference :As computed
value of x2 is greater than table value of x2 above, H0 is
rejected. There exist strong association between income group
of consumers and freq. of purchase of grinders for actualrational use.
6)Null Hypothesis H06: . There is no association between
income group of consumers and the frequency of purchase
of grinders for presentation/gifting purpose. Applying x2
test on relationship of income group & freq. of purchase of
cookware for gifting /presentation use (emotive motive). Ho:
There’s no association between income groups and freq. of
purchase for gifting/presentation use/purchase ;H1: There’s
an association between income groups and freq. of purchase
for gifting/presentation use/purchase; Computed value of
x2 = 758.6426; d.f = (r-1) (c-1) = (4-1) (3-1) = 6; for α = 0.05;
x2 from table = 12.592; Statistical Inference - Since computed
value of x2 is greater than table value of x2 above, H0 is
rejected. There is strong association between income group
of consumers and freq. of purchase of grinders for
presentation/gifting purpose.
7)Null Hypothesis H07: There is no significant positive
correlation between consumer’s purchase behaviour at the
retailer showroom and direct feedback with regard to the
kitchen durable products.
Test the correlation of Retailer view points and consumer’s
view points w.r.t salient product attributes influencing
purchase behaviour of grinders. Using rank Correlation
Method
Spearman’s Rank Correlation
A high level of relationship exist between X & Y; Now Test
the correlation coefficient. r using t test; Hypothesis test on
r; H0 : P=0 No correlation between variables of population;
H1: P>0 There’s positive correlation in the population; Use
one tail test on t distribution, Level of significance α =
0.05,Degree of freedom = n-2 =3, Test statistic
From t distribution. Tables, value of t = 2.353; As computed
test statistical value is greater than table value, H0 is rejected.
There is s ignif icant posi t ive correlat ion between
retailer’s(indirect) & consumer’s viewpoints(direct) with
regard to the Grinder attributes in their actual purchase
behaviour.
(B) ( β)
r = 1 - = 0.82;6 D2Σn (n -1)2
t = r x = 3.849 ;n-21-r2
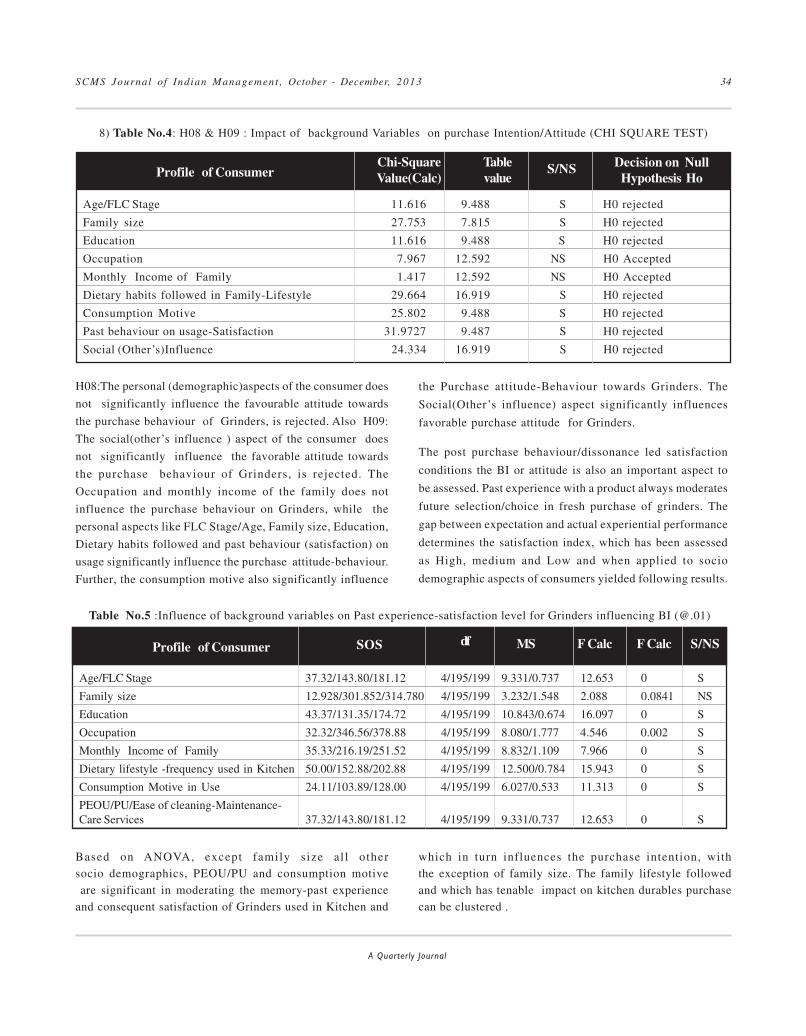
SCMS Journal o f Indian Management , October - December, 2013 34
A Quarterly Journal
8) Table No.4: H08 & H09 : Impact of background Variables on purchase Intention/Attitude (CHI SQUARE TEST)
H08:The personal (demographic)aspects of the consumer does
not significantly influence the favourable attitude towards
the purchase behaviour of Grinders, is rejected. Also H09:
The social(other’s influence ) aspect of the consumer does
not significantly influence the favorable attitude towards
the purchase behaviour of Grinders, is rejected. The
Occupation and monthly income of the family does not
influence the purchase behaviour on Grinders, while the
personal aspects like FLC Stage/Age, Family size, Education,
Dietary habits followed and past behaviour (satisfaction) on
usage significantly influence the purchase attitude-behaviour.
Further, the consumption motive also significantly influence
Based on ANOVA, except family size al l othersocio demographics, PEOU/PU and consumption motive are significant in moderating the memory-past experienceand consequent satisfaction of Grinders used in Kitchen and
the Purchase attitude-Behaviour towards Grinders. The
Social(Other’s influence) aspect significantly influences
favorable purchase attitude for Grinders.
The post purchase behaviour/dissonance led satisfaction
conditions the BI or attitude is also an important aspect to
be assessed. Past experience with a product always moderates
future selection/choice in fresh purchase of grinders. The
gap between expectation and actual experiential performance
determines the satisfaction index, which has been assessed
as High, medium and Low and when applied to socio
demographic aspects of consumers yielded following results.
Table No.5 :Influence of background variables on Past experience-satisfaction level for Grinders influencing BI (@.01)
Age/FLC Stage 11.616 9.488 S H0 rejected
Family size 27.753 7.815 S H0 rejected
Education 11.616 9.488 S H0 rejected
Occupation 7.967 12.592 NS H0 Accepted
Monthly Income of Family 1.417 12.592 NS H0 Accepted
Dietary habits followed in Family-Lifestyle 29.664 16.919 S H0 rejected
Consumption Motive 25.802 9.488 S H0 rejected
Past behaviour on usage-Satisfaction 31.9727 9.487 S H0 rejected
Social (Other’s)Influence 24.334 16.919 S H0 rejected
Profile of ConsumerDecision on NullHypothesis Ho
Chi-SquareValue(Calc)
Tablevalue
S/NS
which in turn influences the purchase intention, withthe exception of family size. The family lifestyle followedand which has tenable impact on kitchen durables purchasecan be clustered .
Profile of Consumer SOS df MSProfile of Consumer SOS df MS F Calc F Calc S/NS
Age/FLC Stage 37.32/143.80/181.12 4/195/199 9.331/0.737 12.653 0 S
Family size 12.928/301.852/314.780 4/195/199 3.232/1.548 2.088 0.0841 NS
Education 43.37/131.35/174.72 4/195/199 10.843/0.674 16.097 0 S
Occupation 32.32/346.56/378.88 4/195/199 8.080/1.777 4.546 0.002 S
Monthly Income of Family 35.33/216.19/251.52 4/195/199 8.832/1.109 7.966 0 S
Dietary lifestyle -frequency used in Kitchen 50.00/152.88/202.88 4/195/199 12.500/0.784 15.943 0 S
Consumption Motive in Use 24.11/103.89/128.00 4/195/199 6.027/0.533 11.313 0 S
PEOU/PU/Ease of cleaning-Maintenance-Care Services 37.32/143.80/181.12 4/195/199 9.331/0.737 12.653 0 S
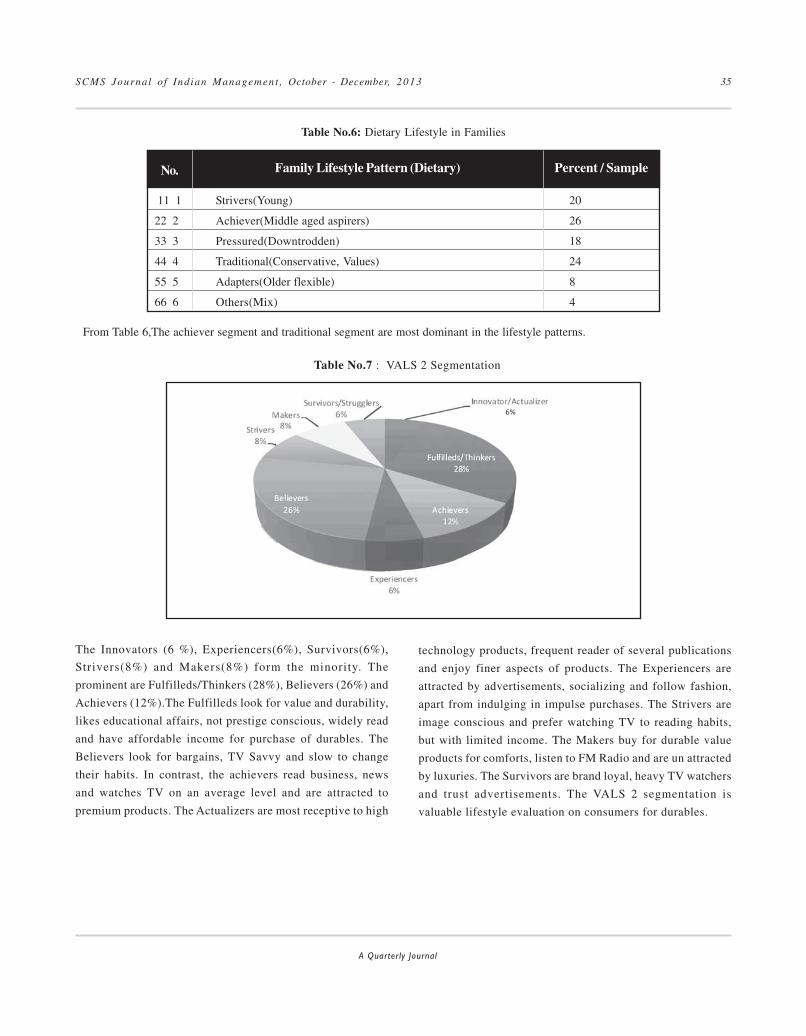
SCMS Journal o f Indian Management , October - December, 2013 35
A Quarterly Journal
11 1 Strivers(Young) 20
22 2 Achiever(Middle aged aspirers) 26
33 3 Pressured(Downtrodden) 18
44 4 Traditional(Conservative, Values) 24
55 5 Adapters(Older flexible) 8
66 6 Others(Mix) 4
Table No.6: Dietary Lifestyle in Families
No. Family Lifestyle Pattern (Dietary) Percent / Sample
From Table 6,The achiever segment and traditional segment are most dominant in the lifestyle patterns.
Table No.7 : VALS 2 Segmentation
6%
The Innovators (6 %), Experiencers(6%), Survivors(6%),
Strivers(8%) and Makers(8%) form the minority. The
prominent are Fulfilleds/Thinkers (28%), Believers (26%) and
Achievers (12%).The Fulfilleds look for value and durability,
likes educational affairs, not prestige conscious, widely read
and have affordable income for purchase of durables. The
Believers look for bargains, TV Savvy and slow to change
their habits. In contrast, the achievers read business, news
and watches TV on an average level and are attracted to
premium products. The Actualizers are most receptive to high
technology products, frequent reader of several publications
and enjoy finer aspects of products. The Experiencers are
attracted by advertisements, socializing and follow fashion,
apart from indulging in impulse purchases. The Strivers are
image conscious and prefer watching TV to reading habits,
but with limited income. The Makers buy for durable value
products for comforts, listen to FM Radio and are un attracted
by luxuries. The Survivors are brand loyal, heavy TV watchers
and trust advertisements. The VALS 2 segmentation is
valuable lifestyle evaluation on consumers for durables.

SCMS Journal o f Indian Management , October - December, 2013 36
A Quarterly Journal
The structural model analysis yielded fit index :P value-0.097, GFI-0.98,AGFI-0.92,CFI-0.95,RMR-0.048,RMSEA-0.07 and NFI-0.94.The structural model indicates adequatefit with the observed data. A number of previous studiessupport the significant effect of PEOU as well as PU onBI(Davis etal,1989;Jackson etal.,1997;Venkatesh,1999).SN ismost dominant(0.32) in moderating Attitude, while PBC ismost dominant in impacting BI(0.31).This closely matcheswith the outcome of studies of David Njite & HG Parsa(2005)and Amandeep Singh, Anil Chandhok & MS Pabla(2011).
From the retailer sample survey, it was clear that quality,price, brand, service are the most important product attributesthat influence consumer decision. The product-qualityfeatures, services & warranties, Price-List price(MRP),discounts/exchange, credit facility; promotion- advertising,sales promotion and publicity; place/market – coverage, retailoutlet quality, technology application, relationship have tobe reviewed and beefed up. The four parameters involved inthe cookware marketing in Kochi specifically are competition,market life cycle impact, product life cycle impact andconsumer values/needs/expectation/satisfaction/preferences.Sumeet brand on Mixer grinders had been strong with anindelible stamp of quality-durability in the minds of themiddle class market segment, but which has now stoppedproduction. Prestige has already launched product orientedapproach through their Smart plus/smart modular kitchenconcept & products and grinders, cookware product to matchwestern standards/quality of kitchen practices-convenience.The trend now in kitchen ware is on Induction bottom ware,an alternative to LPG Cooktops, hybrid cooktops and MWO,modular kitchen to facilitate faster cooking of new dishes, amarked deviation from traditional & copper bottom cookware.Nonetheless the role of Mixer grinder and wet grinders havenot diminished at all and is now inevitable in any Kerala style
kitchen. Preethi is the market leader. Most housewives
unemployed preferred Preethi brand while most professionals
chose Butterfly and Kenstar. The cost of spares service for
Kenstar is the highest. Husbands are more satisfied with
grinders than the wives. Also employed wives are more
satisfied than housewives/unemployed in use of Grinders.
Quality is outlined in Preethi brand while other brands like
Butterfly, Kenstar project price competitiveness. The brands
like Maharaja, Panasonic and Morphy Richards accord
priority for Certifications. Capacity and speed determined
the satisfaction in performance of the grinders. PEOU has
been significant in Wet grinders and Juicers. Among Food
Processor-Juicer, Sujata is the most preferred brand with wider
utility for heavy duty models in shops/hotels as well. Sound
and Power Consumption as also Bowl-Blade-Stone aspects
do influence the consumer’s consideration.
2.0 Limitations and Constraints: The sample population
considered were mainly consumers residing in the urban areas
of Kochi(Ernakulam). The elite social groups as also low
class/illiterate social groups were not included in the sample
survey. The verbal statements of retailers may not actually
reflect their actual consumer behaviour. The method of
observation, in the collection of data on consumer behaviour
/attitude at the retail shops could only be partially carried
out due to lack of time. Thus the study is based on the
assumptions as per TPB and TAM that consumers undertake
reasoned action for Grinder purchase.
2.1 Suggestions: Kochi is one of the fastest growing metros
of India and a premier test marketing site in India. The
Consumers in urban Kochi are well known for their high
literacy level, Quality-Price consciousness and metropolitan
consumption patterns; higher purchasing power of the
population, in the backdrop of the very high level of NRI
The implication of TAM and TPB in the use of kitchen durables like Mixer/Grinder is as outlined below.
Table No.8:Inter construct correlations
Attitude 1 0.22
Subjective Norms/Social aspect 0.32 0.28
PBC/Personal aspect 0.25 0.31
PU 0.29 0.29
PEOU 0.27 0.21
Variables Impact on Attitude Impact on BI
SCMS Journal o f Indian Management , October - December, 2013 37
A Quarterly Journal
remittance from abroad and aiming at decorating kitchen more
than the drawing room with latest gadgets. The present
scenario demands grinder-cookware companies to be market
oriented, problem solving and innovative so as to remain/
sustain in business. Innovative technology driven consumer-
product orientation, problem solving approach to consumer.
This study can be extended to rural areas of Kochi as well and
the other districts/ Panchayath /Villages in Kerala(though the
urban-rural divide is not wider evidenced in past studies) .
2.2 Conclusion :This study of consumer behaviour on the
various attributes of modern grinder products has outlined
the various facets of consumer likes/ dislikes and attitudes/
brand preference were brought out. Pertinent data on
consumer awareness level, decision making and buying
motives, satisfaction w.r.t product attributes and the statistical
inferences/ association/ correlation tests have brought forth
the dynamics of consumer behaviour on the modern wet
grinder and mixer grinder products prevalent in Kochi.
Appropriate marketing strategy on product positioning,
targeting, product improvements, brand enrichment, etc., to
generate higher profits/ market share/ Sales volume and to
satisfy the dynamic global lifestyle/ consumption patterns of
modern middle class consumers / HHs can be evolved by
strategic use of marketing mix. Customized Innovative
products and services are the solutions to the variegated
acculturated consumer behaviour demand patterns of modern
consumers. The consumer dissatisfaction with the durable
goods on attributes like quality/after sales care have to be
addressed by the marketing companies and dissonant
behaviour has to be translated to consumer delight for the
products/brands. Better awareness and assurance/extended
warrantee and support schemes to be mooted to erase the
dissatisfaction and complaint prevalent among consumers and
adversely reflecting in their new purchase attitudes towards
durables for domestic consumption.
2.3 References:
Ajzen,I(1988).From Intentions to actions: A TPB, in J. Kuhl
& J.Beckmann (Eds). Action control: “From cognitive
to behaviour.” NY:Springer-Verlag. 11-39.
Ajzen, I and & M. Fishbein (2000). “Attitudes and attitude
behaviour: Reasoned and automatic processes”.
European review of Social Psychology. W. Stroebe, M.
Hewstone, (eds). Wiley, Chichester, England.
Azhagaiah, Ramachandran and Ezhilarasi, Eganathan
“Consumer behaviour towards durable goods” ,Indian
Journal of Marketing,Vol.42, No.2, Feb 2012, ISSN
0973-8703
Catherine. W.M. Young, Robert. S. Wyer Jr, (2004) “Affect,
Appraisal and consumer Judgment”, Journal of
consumer Research, 31(2), Sept 2004, 412-424.
Christine Moorman et al (2004) “Subjective knowledge ,search
locations & consumer choice” Journal of consumer
Research, 31(3), Dec 2004, 673-680.
Davis,HL,(1976)”Decision making within the household”
Journal of Consumer Research, 2 March,1976, 241-60.
Davis,F.D(1989), “Perceived usefulness, perceived ease of
use, and user acceptance of IT. “MIAS Quarterly, 13(3),
319-340.
Ellen. C Garbarino,(1997) Jule. E. Wilkes, “ Cognitve effort,
affect & choice” Journal of Consumer Research”, 24(2),
Sept.1997, 147-158.
Itamar Simonson, “Determinates of customers.” Journal of
Marketing, 69(1), Jan 2005.
Jagdish. N. Sheth Models of Buyer Behaviour ( conceptual
quantitative & empirical), Harper & Row Pub, NY, 1074,
17 – 434.
James. H Myers, William, H Reynolds. Consumer Behaviour
and Marketing Management, Boston, Houghton Mifflin
Co, 37 – 260.
James. N. McNeal. Dimensions of Consumer Behaviour,
NY: Appleton Century Crofts, 17-446.
Kotler, Philip. Marketing Management, 7th ed, Englewood
Cliffs, Prentice Hall, 1997.
Leon.G Schiff man, Leslie Lazar Kanuk(1998). Consumer
Behaviour, 6th ed., New Delhi : Prentice Hall, 1998,
1-672.
Martin Fishbein, Readings in Att i tude theory and
Measurement, Wiley Eastern Co , 1967.
Pankaj Aggarwal, (2004) “ The effects of brand relationship
norms on consumer attitude & behaviour,” Journal of
consumer Research, 31(1), June 2004, 87-101.

SCMS Journal o f Indian Management , October - December, 2013 38
A Quarterly Journal
Qualls,WJ,(1984) “Sex roles, Husaband-wife influence andFamily decision behaviour,” Advances in Consumer
Research, 11.3,1984, 270-75.
Robert.J. Holloway, Robert S. Hancock. Marketing in a
changing environment ,2nd ed, John Wiley & Sons, NY,
177-256.
Robert Y. Allen, Robert. F. Spolin and I.Herbert Wilson(1987),
Selling Dynamics, Mcgraw Hill Book Co, NY, 1987,
1-475.
Roy, S. and P. Goswami, (2007). “Psychographics and ItsEffect on Purchase Frequency. A Study on CollegeGoers of Kolkota, India, Decision” – Journal of Indian
Institute of Management, Calcutta, 34, 63-93.
Stem, Barbara B. (2001). “The why of consumption:Contemporary perspectives on consumer motives, goalsand desires.” Journal of Advertising Research,2001.
S.L. Rao and I Natarajan(2011). “Indian Market Demographics– the consumer classes”, Global business press,”NCAER.
SCMS Journal o f Indian Management , October - December, 2013 39
A Quarterly Journal
ork Life and Personal Life are the two sides of acoin. These two are often interrelated and interconnected. Balancing them is always a challenging
game for the employees. Work Life Balance refers to have the‘right’ combination of participation in paid work and otheraspects of their lives. This combination may not be the samein all occasions, may change over a time period. The TermWork Life Balance is first used in United Kingdom in late1970s describing the balance between an individual’s workand personal life. In the United States this term is used in1986.
Women with the changing economic, political and socialchanges are joining into the workforce for various reasons.Balancing work and household responsibilities is a skillfulexercise that they perform every day. The qualified andeducated women try to attain work life balance by utilizingvarious benefits provided by their employer where as womenwith low education qualifications are often imbalanced becauseof poor support from family members and employers.
Ms. S. Padma, Research Scholar
Jawaharlal Nehru Technological University
Hyderabad.
Email id: [email protected]
Dr. M. Sudhir Reddy , Project Officer
NTMIS, Jawaharlal Nehru Technological University-
Hyderabad.
Email Id: [email protected]
W
Work Life Balance:
Women Police Constables
S. Padma and Sudhir Reddy
Societal changes in India have made women to come out from home and participate in all the fields equally with men. In this
process, women have participated in various societal activities including demonstration and riots. As the existing strength of
Female Police Personnel is inadequate, the need to hire more number of Female Personnel in Police Department is identified.
As Women are sensitive and delicate in nature, they face various difficulties in balancing their personal life and Work. Hence
the present study is conducted on Women Police Constable with the objectives to find the factors that are affecting their Work
Life balance and to study the impact of the demographics like Age, Marital Status, Designation and Education Qualifications
of Women Police Constables on their Work Life Balance. Percentages, Factor Analysis, One Sample t-test and ANOVA tests are
conducted to meet the objectives.
Abstract
Key words: Balance, Family, Work, Women and Demographics.

SCMS Journal o f Indian Management , October - December, 2013 40
A Quarterly Journal
Literature Review
Various academicians and authors viewed and perceived worklife balance differently, hence there is no standard andconsistent definition for it. But all the definitions have givena similar meaning to it as giving equal priority to work andnon work roles. Greenhaus, Collins and Shaw (2003) haveexplained three components of work life balance. First is TimeBalance- an equal amount of time spent for work and familyroles, second is involvement balance- equal amount ofinvolvement for both the roles, and the third is satisfactionbalance- equal amount of satisfaction derived from both theroles.
Burke (2000) in his study has observed that both men andwomen prefer to work in those organizations that havesupportive work life balance practices. Rana and Seema (2012)have conducted an empirical study on impact of demographicvariables on the critical factors of work life balance and foundthat gender, level of employment and experience have asignificant impact on the critical factors of work life balance.
The studies on Work Life Balance of women have taken highimportance in the present day scenario. Women prefer to givefirst priority to their family and never try to compromise inthis. To fulfill their career ambitions, meet the financial needsof the family and to have financial independence, women havejoined in the global work force. There are various researchstudies conducted in India and abroad on Work Life Balanceof Women in various sectors.
Buffardi et al (1999) have assessed the impact of child careand gender on work life balance and job satisfaction and havefound that elder care responsibility is associated with lowerlevel of satisfaction. Organizational support, pay and leavebenefits have positive impact on work life balance. Gersickand Kram (2002) have conducted a study on high achievingwomen in senior management position and found that maturityis one of the factors that help women leaders to cope up withcareer barriers.
Sundar et al (2012) have conducted their study on womenemployees of banks located at Pondicherry Union Territory,India and found that women employees working in bankingindustry find it difficult to balance home life and work life. Itis because of high stress involved in those jobs which ishindering them from climbing the organizational ladder, thoughthey possess sufficient qualification, good communicationskills and competencies to handle responsibilities.
Mominul (2011) has made a study on Work Life Balance inservice context and found that the variables such as workculture, job sat isfact ion, employee benefi ts , workenvironment, work load, f lexible work t imings anddiscrimination influence work life balance of employees.
Narayanan et al (2012) have conducted a study on IT sectorin Tamilnadu, India and found that work timings, excess workload, routine t imings, work on holidays are stronglyinfluencing work life balance of employees. Murthy et al(2013) have made a study on gender issues of womenemployees at work place in Indian BPO Sector and foundthat age, educational qualifications, job position, monthlyincome are negatively correlated with work life balance ofwomen employees in Indian BPO sector.
Vijaya Lakshmi et al (2012) have studied Work Life BalanceIssues of Women Faculty working in educational institutionsand found that women faculty have faced a constant strugglebetween the family obligations and expectations of theirinstitution that cause imbalance in their personal and worklife. Santhana Lakshmi and Sujatha Gopinath (2013) havemade a study on Work Life Balance of women employeeswith reference to teaching faculties and found that maritalstatus, working hours, flexibility requirement, additionalworking hours and overtime are the critical factors that areinfluencing work life balance of school teachers. Hence fromthe above studies it is understood the factors that areinfluencing work life balance are changing as per the job andindustry.
Women Police Personnel
The societal changes in India have made women to come outof their home and work equally along with men in all thefields. In this scenario they are participating in all socialactivities including demonstration and riots which sometimeslead to violence. These situations have identified the need forwomen police personnel in order to deal with womendemonstrators.
Police life is not so easy. It entails long working hours,hazardous and arduous tasks that cause stress, tiredness andoften imbalance their work and personal life. Rakesh Kumar(2007) has conducted a study on Stress management in CRPF
and found that most of the Officers and NGOs are under
stress and reasons for stress are both job and family related
issues. Rekha Rani and Pooja (2010) have conducted a study
on burn out and marital adjustment of Police Personnel and

SCMS Journal o f Indian Management , October - December, 2013 41
A Quarterly Journal
found that there exists a negative correlation between Burnout
and Marital adjustment. Samatha and Amulya Khurana (2006)
have conducted a study on Organizational Role stress and
Job satisfaction on paramilitary Personnel in Kashmir and
found that role stagnation (stress to take new roles) is the
main cause of job dissatisfaction.
Banerjee(2010), IPS(Retired) and former DGP of Anti
Corruption Bureau,Gujarat has conducted a study on analysis
of problems of inducting Women Personnel in Central Police
Forces (CPF) and found that the strength of female personnel
was very less and inadequate to the requirement. Hence he
recommended increasing the number of police personnel in
CPF. He has highlighted various problems of women police
personnel like separate toilet, rough language of their male
bosses, lack of female instructors at training programs, uniform
at pre-natal and post natal periods and family issues. From
the above literature it is understood very few studies have
been conducted on female police personnel hence the present
study is aimed to study on work life balance issues of Female
Police Personnel.
Research Objectives
The present research study has the following objectives
• To study on various factors those are influencing
work life balance of Women Police Constables.
• To measure the association between demographic
factors and Work Life Balance.
Research Hypotheses
The following Research Hypotheses are formulated to test
the objectives.
H01:
There is no significant difference in Work Life Balance
with respect to Designation.
H02
: There is no significant difference between Marital Status
and Work Life balance of Female Police Constables.
H03:
There is no significant difference between Age category
and Work Life Balance of Women Constables
H04:
There is no significant difference between Qualification
of the Women Police Constables and their Work Life
Balance.
Methodology and Sample Design
The study is an explorative research to find the various factors
that are influencing work life balance of female police
constable. A convenience sample of 56 respondents is drawn
from 14 districts of Andhra Pradesh.
Data for the study is collected by administering a structured
questionnaire. The items in the questionnaire are adopted
from the literature. The statements have been modified and
reworded according to the organization taken for conducting
the study. The questionnaire consists of two parts. The first
part consists of demographic and personal information of the
respondents and the second part consists of various items to
study work life balance. The questionnaire consists of a series
of statements where the respondents needed to provide
answers in the form of agreement or disagreement to express
their attitude towards their work life issues on a 5-point Likert
scale (Strongly Agree-5, Agree-4, Neutral-3, Disagree-2, and
Strongly Disagree-1). Table 1 shows the descriptive statistics
of the respondents.
Results and Discussions
Data is analyzed using Statistical Package for Social Sciences
(20.0) version and Percentage, Factor Analysis, One Sample
t-test and One Way ANOVA tests are the various statistical
tools are used.
The data is analyzed with the help of Statistical Package for
Social Sciences (SPSS) 20.0 version. An analysis is conducted
for checking the reliability of the questionnaire and the results
are obtained. The Cronbach’s alpha (a measure of reliability)
is calculated for the questionnaire. This coefficient (0.814)
indicates reliability as it meets the minimum accepted level.
Table 1: Reliability Statistics
Cron bach’s Alpha No. of Items
.814 32

SCMS Journal o f Indian Management , October - December, 2013 42
A Quarterly Journal
Table 2 has explained the demographic profiles of therespondents. From Table 2 it is understood that most FemalePolice Constable are of age group between 36 to 45 years and75% of them married and the remaining are unmarried.
75 percent of them are women police constables and the restare Head Constables. It is found from the table that 53% arehaving very low educational qualification as Xth Class andIntermediate.
Table 2: Description of the Respondents
Age Below 25 yrs. 12 21.4
Between 26 to 35 yrs. 8 14.3
Between 36 to 45 yrs. 26 46.4
Above 46 yrs. 10 17.9
Designation Women Police Constable 42 75
Head Constable 14 25
Marital Status Married 41 73.2
Unmarried 25 26.8
Qualification SSC or 10th Class 15 26.8
Intermediate 15 26.8
Graduation 20 35.7
Post Graduation 6 10.7
Item Description Frequency Percentage
As the main objective of this paper is to identify the factorsthat influence Work Life Balance among women constables,Factor Analysis is conducted to ascertain the relative strength
of various factors in this regard. The KMO measure indicates
sample adequacy of 0.612 which is fairly good. The Bartlett’s
test has confirmed normality of the samples as supported by
statistically significant Chi-Square value.
Table 3: KMO and Bartlett’s Test
Kaiser-Meyer-Olkin Measure of Sampling Adequacy. 0.612
Approx. Chi-Square 997.524
Bartlett’s Test of Sphericity Df 96
Sig. .000

SCMS Journal o f Indian Management , October - December, 2013 43
A Quarterly Journal
Table 4:Total Variance Explained
1 5.057 15.804 15.804 5.057 15.804 15.804 4.715 14.734 14.734
2 4.723 14.758 30.562 4.723 14.758 30.562 4.262 13.318 28.052
3 3.401 10.628 41.190 3.401 10.628 41.190 4.204 13.138 41.190
4 2.322 7.255 48.445
5 2.031 6.348 54.793
6 1.689 5.278 60.071
7 1.401 4.377 64.448
8 1.336 4.175 68.623
9 1.147 3.584 72.207
10 1.062 3.320 75.527
11 1.006 3.143 78.670
12 .838 2.618 81.288
13 .734 2.294 83.582
14 .648 2.026 85.608
15 .587 1.835 87.443
16 .527 1.648 89.090
17 .508 1.586 90.676
18 .430 1.344 92.021
19 .375 1.171 93.192
20 .353 1.104 94.296
21 .303 .948 95.244
22 .264 .824 96.068
23 .229 .717 96.785
24 .217 .678 97.462
25 .176 .551 98.013
26 .142 .445 98.458
27 .128 .401 98.859
28 .114 .357 99.216
29 .078 .245 99.461
30 .076 .236 99.697
31 .061 .189 99.886
32 .036 .114 100.000
Extraction Method: Principal
Component Analysis.
Component Initial Eigen values
Total % ofvariance
Cummulative%
Extraction Sums of SquaredLoadings
Rotation Sums of SquaredLoadings
Total % ofvariance
Cummulative%
Total % ofvariance
Cummulative%
It can be noted from Table 4, that among various factorsincluded for the factor analysis, the first three componentsalone explained more than 41% of variance in Work Life
Balance. This means the factors chosen for analysis arerelevant.

SCMS Journal o f Indian Management , October - December, 2013 44
A Quarterly Journal
Table 5: Rotated Component Matrixa
Spouse Household activities .705
Spouse Child care .745
Elder Parents Household activities .488
Elder Parents Child care .806
Friends Household activities
Neighbors Household activities
Peer House hold activities
Time for children .801
Time for Spouse .792
Time for friends .625
Time for hobbies .550
Time for Health care .551
Time for picnics/outings .647
Time for Shopping Malls .726
Time for movies in theatre .555
Time for social functions .635
Reach workplace on time -.485
Extra time at work place .795
Support from superiors
Support from peer group
Clear in job roles .743
Aware of organizational policies .663
No mental harassment at work place .578
Leaves not lapsed .601
No physical harassment at workplace .510
Ready for urgent works .541
Time to organize functions .622
Can opt for flexible work timings .499
’Time off’ for emergencies
Easy sanction of leaves
Neighbors Child care .736
Career growth .715
Extraction Method: Principal Component Analysis. Rotation Method: Varimax with Kaiser Normalization.
a. Rotation converged in 5 iterations.
Component
1 2 3

SCMS Journal o f Indian Management , October - December, 2013 45
A Quarterly Journal
By analyzing the Rotated Component Matrix from Table 5, itis clear that first component has seven factors with heavyloading, viz. support from spouse, elder parents and neighborsin child care and support from spouse and elder parents forhousehold activities, sufficient time available to spend withchildren and spouse. This is very clear from the table the firstcomponent discusses about family responsibilities. Most ofthe women professionals feel that female spouse is expectedto take care of the family responsibilities in Indian Societyand it has significant impact on career decisions and theycould not utilize their potential because of their familyresponsibilities (Sanghamitra, 2009, Deepak Chawla et al ,2011)
The Second Component consists of nine factors that explainabout the time she categorized for her personal care and fornon work related activities like time for her healthcare, hobbiesand friends for her satisfaction. She tries to adjust her timefor Shopping for entire family, spend her time with familymembers in picnics/outings and watching movies for recreation,fun and entertainment. She also spares some time for attending
social functions to maintain societal relationship and
categorizes some time for organizing functions for her
children’s birthdays, marriages etc. She tries to opt for flexible
work timings if available so that she can balance personal and
work life (Pattu Meenakshi, 2012).
The third component consists of eight factors that explain
her work responsibilities. She can give her best performance
when she is clear about her job roles, completely aware of her
organizational policies and objectives. Being a career motive
woman, she prefers to work hard and spend extra time at
work place when the job provides good career growth
opportunities. Women perform well when they work in a
safety place where there are no physical and mental
harassment. She shows her readiness to perform urgent works
by consuming less number of leave (Divya et al, 2010,
Vanishree, 2012, Varathraj et al, 2012).
In order to meet the second objective of the study the following
statistical tests like one sample t-test and ANOVA have been
conducted to test the hypotheses.
The above Table 6 describes the t- test results of the first twohypotheses. One Sample t-test is conducted to compare themeans of two categories of designations (Women PoliceConstable & Head Constable) and Work Life Balance ofWomen Police Personnel. As significant value (0.292) is morethan 0.05, the Null hypothesis (H
01) was accepted. It means
there is no significant difference between Women PoliceConstable and Head Constable with respect to their work life
balance. Similarly One sample t-test was conducted to test
the second hypothesis between Marital Status and Work Life
balance. As the significant value (0.000) is less than 0.05,
rejected Null Hypothesis (H02
). That means there is a
significant difference between Married and Unmarried Women
Police Constable and the past research results of Pattu
Meenakshi (2012) are in accordance with the research result.
Table 6: T-test Results
Demographics T-test value Sig Result
H01
: Designation Vs.WLB 1.063 0.292 Accept H01
H02
:Marital Status Vs.WLB -4.131 0.000 Reject H 02
Table 7: ANOVA test Results
Demographics T-test value Sig Result
H03
: Age Category Vs.WLB 3.020 0.038 Reject H03
H04
:Qualifications Vs.WLB 1.042 0.382 Accept H04
Table 7 depicts the results of ANOVA table. The age isclassified into four categories like less than 25 years, between26 to 35 Yrs, between 36 to 45 Yrs and above 45 years. Thef-value is 3.020 and the significant value is 0.038 which is
less than 0.05. Hence the Null hypothesis is rejected (H03
).That means there is a significant difference between variousage groups of Women Police Constables and their Work LifeBalance. These results are in accordance with the results of

SCMS Journal o f Indian Management , October - December, 2013 46
A Quarterly Journal
Smith et al (2007) and Kumari et al (2012). The Womenconstables have various educational qualifications like SSC,Intermediate, Degree and Post graduation. The f-value was1.042 and the significant value is 0.382 which is more than0.05. Hence accept Null hypothesis (H
04). That means that
various qualified women police constables perceived abouttheir work life balance in a similar manner. The result is inaccordance with the study of Santhana, (2012) conducted onWork Life Balance of Women Teachers.
Conclusion
The factor analysis has classified the factors that areinfluencing work life balance of Female Police Personnel intothree components like Family issues, Personal care issues andWork issues. Women need more support from her familymembers i.e from Spouse and Elder Parents to relieve stress inbalancing their work and personal life. The study has foundthat Age Category and Marital Status of Women PoliceConstable have significant impact on Work Life Balance. Elderage group women and high designated women can easily managetheir work life balance. The above study is very useful to thePolice Department in planning various Work Life Balancepractices like crèche and create harmonious work environmentto enable Women Police Personnel rightly balance their workand personal life that improve their performance levels.
Reference
Banerjee S. (2010). “An analysis of Problems of inducting
Women Personnel in Central Police Forces.” The Indian
Police Journal, 57(1), 87-98.
Buffardi LC, JL Smith, AS O’Brien and C.J Erdwins CJ (1999).
“The Impact of Dependent-Care Responsibility and
Gender on Work Attitudes.” Journal on Occupational
Health Psychology 4(4): 356-367.
Burke, R.J. (2000). “Do managerial men benefit from
organisational values supporting work-personal life
balance?” Management Review, 15 (2), 81-89.
Deepak Chawla and Neena Sondhi (2011). “Assessing Work-
Life Balance among Indian Women Professionals.” The
Indian Journal of Industrial Relations,47(2),341-352.
Divya D, L. Suganthi, and A. Samuel Anand (2010).”Work-
Life Balance of IT Women Professionals belonging to
the age group 20-35 in India .” Advances in
Management,3(1), 37-46.
Gersick, C.J.G. and K.E. Kram. (2002). “High-achieving
women at midlife: An exploratory study.” Journal of
Management Inquiry, 11(2), 129.
Greenhaus, J.H., K.M. Collins and J.D. Shaw, (2003). “The
relation between work– family balance and quality of
life.” Journal of Vocational Behaviour, 63(3), 510–531.
Kumari and Devi (2012). “Impact of Demographic Variables
on Work Life Balance of Women Employees(with
special reference to Bangalore City.” International
Journal of Advances in Management and Economics,
1(6), 226-229.
Mominul Haque Talukder A.K.M (2011). “A shifting
paradigm of Work Life Balance in service context – an
empirical study.” Industrial Journal of Management
and Social sciences, 5(1), 10-23.
Murthy T N, Govinda Pedireddy & Sayyad Imtiyaaz (2013).
“Gender issues of Women Employees at work place in
Indian BPO Sector.” Abhinav Journals, 2(2), 72-80.
Narayanan A G V & R Lakshmi Narayanan (2012), “An
empirical study on factors affecting Work Life Balance
of IT professional.” European Journal of Social
sciences, 31(3), 302-313.
Pattu Meenakshi and Ravichandran(2012). “A Study on Work
Life Balance among Women Teachers working in Self
Financing Engineering Institutions.” International
Journal of Research in Commerce, IT and Management,
2(3), 51-55.
Rakesh Kumar Singh (2007). “Stress Management in CRPF.”
The Indian Police Journal, 54(2), 69-77.
Rana Zehra Masood & Seema Mahlawat (2012) Impact of
Demographic Variables on the Critical Factors of Work
Life Balance: An Empirical Study, Journal of
Organizational Management,1(1), 1-13.
Rekha Rani and Pooja Garg (2010). “A Study of Burnout and
Marital Adjustment of Police Personnel”, The Indian
Police Journal, 57(2),51-57.
Samatha and Amulya Khurana(2006). “ A Study of
Paramilitary Personnel in Kashmir.” The Indian Police
Journal, 53(2), 68-77.
Sanghamitra Buddhapriya (2009).”Work Family Challenges
and their impact on career decisions: A Study on Indian
Women Professionals.” Vikalpa, 34(1), 31-45.

SCMS Journal o f Indian Management , October - December, 2013 47
A Quarterly Journal
Santhana Lakshmi and Sujatha Gopinath (2013), “Work LifeBalance of Women Employees with reference to teaching
faculties” Abhinav Journals, 2(3), 53-62.
Smith and Gardener(2007), “Factors affecting Employee use
of Work Life Balance Initiatives,” NewZealand Journal
of Psychology, 36(1),3-12.
Sunder K and Ashok Kumar P. (2012), “A Study on Women
Employees in Banks in Pondicherry Union Territory,
India,” Arth Prabhand: A Journal of Economics and
Management, 1(9), 1-15.
Vanishree(2012),”Work-Life Balance in the BPO Sector,”
Journal of Business Management & Social Sciences
Research,1(2), 35-39
Varatharaj, and S. Vasantha (2012),”Work Life Balances A
Source of Job Satisfaction - An Exploratory Study on
the view of Women Employees in the Service Sector,”
ZENITH International Journal of Multidisciplinary
Research,2(3),450-458.
Vijaya Lakshmi B and T. Navneetha (2012), “Work Life
Balance of Women Faculty working in Educational
Institutions :Issues and Problems,” International
Journal of Research in Commerce, Economics &
Management, 3(4), 73-75.
SCMS Journal o f Indian Management , October - December, 2013 48
A Quarterly Journal
Linkages Among Stock Markets:
Asia-Pacific Region
M.S.Ramaratnam , R.Jayaraman and G. Vasanthi
This paper has made an attempt to examine the relationship between the Indian stock market and rest of the selected
international markets. The study is tested with cross correlation, Unit root test, Granger causality test and Johansen
cointegration test to seek the relationship, stationarity, directional causality and either short or long run equilibrium
between the Sensex and the selected indices of various stock markets. The result obtained by the econometric tools shows
that the correlation between the sensex and the other selected indices is high and significant, the data are stationary in the
first difference, both unidirectional and bidirectional causality occurs and the long term relationship is found between
sensex and other selected indices.
Key words: Cross Correlation, Unit root test, Granger causality test and Johansen cointegration test
M.S.Ramaratnam, Assistant Professor (Senior Grade),Faculty of Management Studies,SCSVMVUniversity,Kanchipuram,Tamil Nadu –631561.Cell:(0)9842754984E-Mail:[email protected]
R.Jayaraman, Assistant Professor of Management Studies,SCSVMV University, Kanchipuram,Tamil Nadu – 631561Cell:(0)9942125400E- Mail:[email protected]
Dr. G. Vasanthi, Professor of Commerce,AnnamalaiUniversity,Annamalainagar,Tamil nadu -608 002.Cell:(0)9994220202E- mail:[email protected]
rior to the globalization, investor community andacademicians were not much interested in analyzingthe indices of the stock market since the markets
did not show any remarkable sign for the analysis. But in theera of liberalization and globalization, Indian stock marketplays a vital role for the investors’ community in taking theirinvestment decision and the movement of indices of stockmarket helps the investor to take advantage of pricefluctuations from one exchange to another exchange. Theprocess of making gain by selling the script from one exchangeto another exchange is known as arbitrage. Normally integratedmechanism among the stock exchanges within the countryrestricts the investor to get abnormal gain due to the differencein the price of the same script in different exchanges. Thoughthe stock exchanges within the country are well connected, itremains unanswered whether the Indian stock market isintegrated with international market. This paper has made anattempt to find if any relationship exists and further the saidrelationship is in long term.
Abstract
P

SCMS Journal o f Indian Management , October - December, 2013 49
A Quarterly Journal
Literature Review
Bailey & Stulz (1990) applied simple correlation technique
to find interrelationship among US and Pacific basin stock
market and found that the correlation differed in terms of
daily, weekly and monthly time series data.
Arshanapall i & Doukas (1996) applied Johansen
cointegration technique on daily data belonging to different
Asian markets and found that there was no long term
relationship among the Asian stock market.
Ghosh (1999) in contrary to Arshanapalli & Doukas (1996)found that some of the Asian market showed a long run
equilibrium relationship with the world’s major stock market.
Floros (2005) found a long term relationship among the stock
prices of US, Japan and UK. He also observed that through
Granger causality test some of the stock indices have shown
bidirectional effect and some other showed unidirectional
effect.
Amanulla & Kamaiah (1995) examined the long run
equilibrium between the RBI stock price indices of Bombay,
Calcutta, Madras, Delhi and Ahmedbad. They found that there
existed long run equilibrium.
Nath & Verma (2003) tested the cointegration between India
and other selected countries with daily price indices and found
that no cointegration existed among India, Taiwan and
Singapore for the period January 1994 to November 2002.
Jayanthi & Pandiyan (2008) tested the cointegration
between the stock price indices of India, Malaysia, Taiwan,
china, South Korea, US, UK, Germany, Singapore, Hong Kong
and Japan. The study period was from April 2000 to March
2007 and they found that no correlation and cointegration
among the selected stock price indices.
Anindya Chakravarty & Dr.Bidyut Kumar Ghosh (2011)made an attempt to find the relationship among the indices of
Sensex 30, S&P 100 and FTSE 100 through Granger causality
test and found that unidirectional causality occurred for S&P
100 and FTSE 100 from Sensex.
Som Sankar Sen (2011) made an attempt to investigate the
relationship between Sensex and some selected Stock Price
Indices of the Asia Pacific region and found that the correlation
among the selected Stock Price Indices were highly correlated
and signif icant . Granger causal i ty test revealed the
unidirectional effect from the Asian tigers to Sensex and
Johansen cointegration test clearly showed that there existed
a long run relationship between sensex and stock indices of
the major Asian Pacific countries.
It is worth mentioning that the present study is carried out as
an extension of the study of Som Sankar Sen (2011) with
the time interval from January 2000 to June 2013 to find out
the relationship among the selected market indices in amidst
recent recessionary trends.
Objectives of the study
1. To test the stationarity of the selected Stock Market
Indices
2. To examine directional effect among the selected share
indices
3. To understand the effect of Long term relationship among
the selected market.
Data & Methodology
Monthly closing price indices of selected stock markets were
taken from the period of 2000 to 2013. The above data was
collected from yahoofinance.com. The monthly data was
collected as against the daily data to avoid representation
bias. The returns of the respective stock indices were collected
using the formula
Ln (It/ I
t-1)
It→ Index value at time t
It-1
→Index value at time t -1
Methodology
Following econometric models were used for further analysis
• Cross Correlation,
• Unit root test,
• Granger causality test, and
• Johansen cointegration test.
Cross Correlation
In order to find the co movement of selected indices and the
lag relationship between them, pairwise cross correlation was
used between Sensex and other price indices.

SCMS Journal o f Indian Management , October - December, 2013 50
A Quarterly Journal
Where K is greater than, equal or less than zero
Unit root test
Normally time series data are tested for stationarity. As andwhen the data are non stationary the application of regressionon the data would be spurious. To test the stationarity, theunit root test has been applied on time series data. In thisregard this study is applied with both ADF and Phillips –Perron tests to find whether the data are stationary.
The Augmented Dickey-Fuller (ADF) Test
The standard DF test is carried out by estimating the followingEquation after subtracting y
t-1 from both sides of the
equation:
Dyt = ayt – 1 + xt ¢d + et,
where a = r – 1. The null and alternative hypotheses may bewritten as,
H0: a = 0
H1: a < 0
The Phillips – Perron test
The Phillips – Perron test is carried out by estimating thefollowing equation
Where ytis the time series data under consideration.
Granger causality test
The test was carried out to identify the directional effect ofselected indices. To test for Granger causality, the followingtwo equations were estimated
and
Johansen cointegration test
The condition for testing Johansen cointegration test for anytime series data is that the data should be non stationary attheir level i.e. the natural logarithm of time series data shouldbe non stationary and the first difference in the data shouldbe stationary. If the return indices of different markets arecorrelated, the value may raise or fall. On the other hand, ifthe time series data are cointegreted, then the series in thelong run will come to equilibrium point.
Empirical ResultsDescriptive Statistics
Table 1 showing the Descriptive Statistics of Sample Stock Indices data
Statistic NIKKEIHSI JKSE KISE KOSPI Sensex
Mean 9.703059 7.199588 6.930852 7.066629 9.361426 9.095754 7.744146
Median 9.726207 7.202011 6.842277 7.212417 9.308685 9.259454 7.764607
Maximum 10.35305 8.530826 7.480733 7.692734 9.920213 9.928623 8.244255
Minimum 9.063515 5.881175 6.350676 6.173119 8.931740 7.941509 7.145054
Std. Dev. 0.298931 0.842431 0.315598 0.449355 0.242181 0.676020 0.288247
Skewness -0.272011 -0.083175 0.054338 -0.320624 0.432771 -0.323812 -0.309910
Kurtosis 2.097949 1.598552 1.743495 1.696333 2.098178 1.518472 1.944113
Observations 162 162 162 162 162 162 162
STI
Source: Computed Data
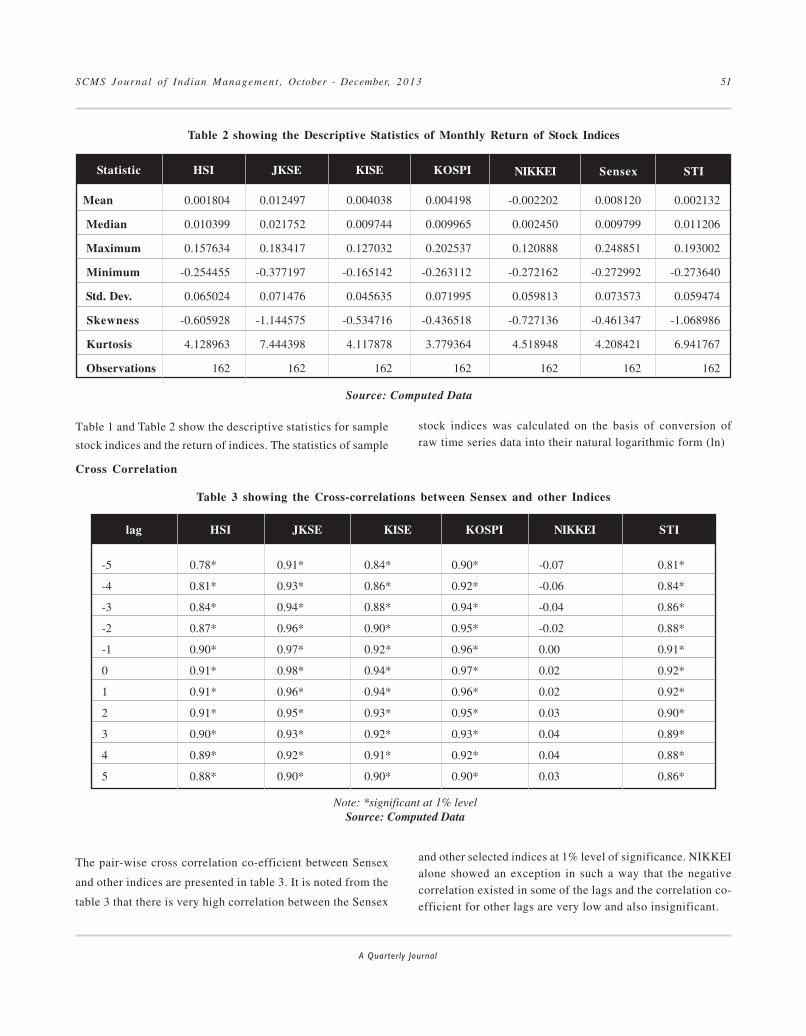
SCMS Journal o f Indian Management , October - December, 2013 51
A Quarterly Journal
Table 1 and Table 2 show the descriptive statistics for sample
stock indices and the return of indices. The statistics of sample
Table 2 showing the Descriptive Statistics of Monthly Return of Stock Indices
Statistic NIKKEIHSI JKSE KISE KOSPI Sensex
Mean 0.001804 0.012497 0.004038 0.004198 -0.002202 0.008120 0.002132
Median 0.010399 0.021752 0.009744 0.009965 0.002450 0.009799 0.011206
Maximum 0.157634 0.183417 0.127032 0.202537 0.120888 0.248851 0.193002
Minimum -0.254455 -0.377197 -0.165142 -0.263112 -0.272162 -0.272992 -0.273640
Std. Dev. 0.065024 0.071476 0.045635 0.071995 0.059813 0.073573 0.059474
Skewness -0.605928 -1.144575 -0.534716 -0.436518 -0.727136 -0.461347 -1.068986
Kurtosis 4.128963 7.444398 4.117878 3.779364 4.518948 4.208421 6.941767
Observations 162 162 162 162 162 162 162
STI
Source: Computed Data
stock indices was calculated on the basis of conversion ofraw time series data into their natural logarithmic form (ln)
Cross Correlation
Table 3 showing the Cross-correlations between Sensex and other Indices
Note: *significant at 1% levelSource: Computed Data
lag HSI JKSE KISE KOSPI NIKKEI STI
-5 0.78* 0.91* 0.84* 0.90* -0.07 0.81*
-4 0.81* 0.93* 0.86* 0.92* -0.06 0.84*
-3 0.84* 0.94* 0.88* 0.94* -0.04 0.86*
-2 0.87* 0.96* 0.90* 0.95* -0.02 0.88*
-1 0.90* 0.97* 0.92* 0.96* 0.00 0.91*
0 0.91* 0.98* 0.94* 0.97* 0.02 0.92*
1 0.91* 0.96* 0.94* 0.96* 0.02 0.92*
2 0.91* 0.95* 0.93* 0.95* 0.03 0.90*
3 0.90* 0.93* 0.92* 0.93* 0.04 0.89*
4 0.89* 0.92* 0.91* 0.92* 0.04 0.88*
5 0.88* 0.90* 0.90* 0.90* 0.03 0.86*
The pair-wise cross correlation co-efficient between Sensex
and other indices are presented in table 3. It is noted from the
table 3 that there is very high correlation between the Sensex
and other selected indices at 1% level of significance. NIKKEIalone showed an exception in such a way that the negativecorrelation existed in some of the lags and the correlation co-efficient for other lags are very low and also insignificant.
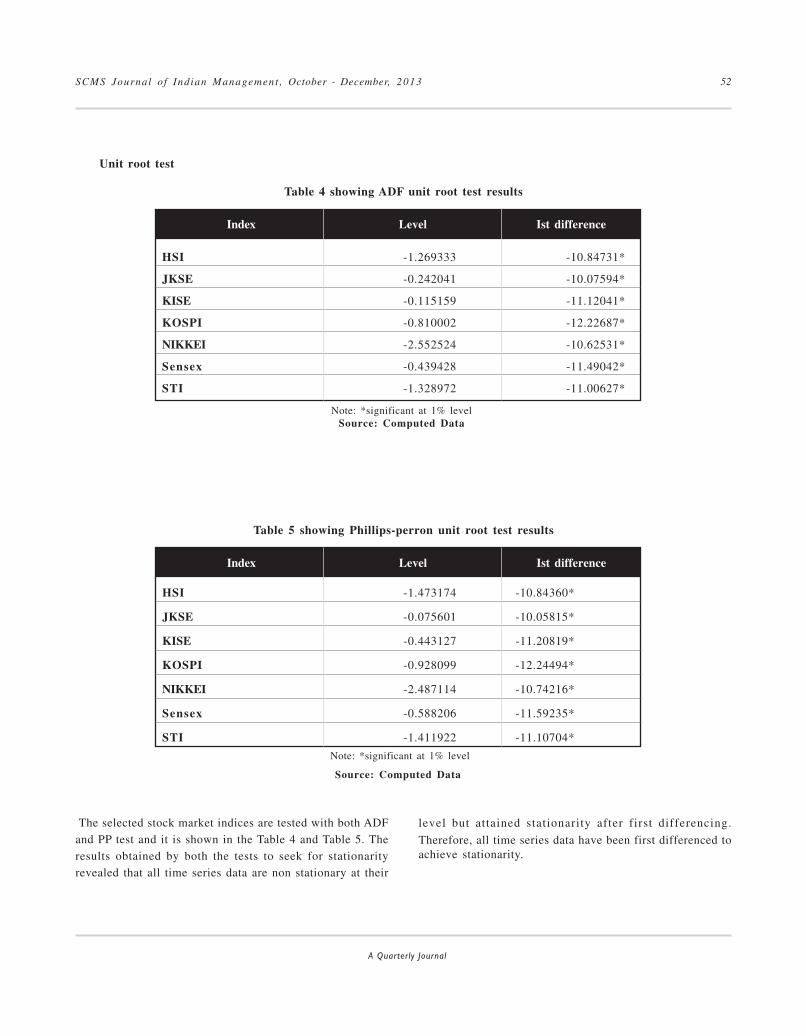
SCMS Journal o f Indian Management , October - December, 2013 52
A Quarterly Journal
The selected stock market indices are tested with both ADFand PP test and it is shown in the Table 4 and Table 5. Theresults obtained by both the tests to seek for stationarityrevealed that all time series data are non stationary at their
Unit root test
Table 4 showing ADF unit root test results
Index
HSI -1.269333 -10.84731*
JKSE -0.242041 -10.07594*
KISE -0.115159 -11.12041*
KOSPI -0.810002 -12.22687*
NIKKEI -2.552524 -10.62531*
Sensex -0.439428 -11.49042*
STI -1.328972 -11.00627*
Level Ist difference
Note: *significant at 1% levelSource: Computed Data
Table 5 showing Phillips-perron unit root test results
Index
HSI -1.473174 -10.84360*
JKSE -0.075601 -10.05815*
KISE -0.443127 -11.20819*
KOSPI -0.928099 -12.24494*
NIKKEI -2.487114 -10.74216*
Sensex -0.588206 -11.59235*
STI -1.411922 -11.10704*
Level Ist difference
Note: *significant at 1% level
Source: Computed Data
level but attained stationarity after first differencing.
Therefore, all time series data have been first differenced toachieve stationarity.

SCMS Journal o f Indian Management , October - December, 2013 53
A Quarterly Journal
Note : * significant at 5%, ** significant at 1%Source: Computed Data
The pair wise Granger causality test is shown in Table 6. Thestudy has taken the choice of lag length from 1 to 5. Theempirical result shows that at lag 1 either unidirectional orbidirectional effect was not seen in most of the cases. In lag 2Sensex showed unidirectional causality to HSI, JKSE, KISE
and KOSPI. The above result indicates that four out of six
monthly index returns have short run relationship with that
of the Sensex. In Lag 5 both unidirectional and bidirectional
causality effect were seen in most of the selected indices.
Table 6 showing the Granger causality test results
Null Hypothesis
HSI does not Granger Cause SENSEX 2.08653 3.44376** 9.60958** 7.08429** 5.80313**
SENSEX does not Granger Cause HSI 5.69262** 4.32105** 3.72508** 2.48751** 3.17193**
JKSE does not Granger Cause SENSEX 0.06761** 0.34792 3.50265** 3.15902** 4.77003**
SENSEX does not Granger Cause JKSE 1.29148 2.47084* 1.53644 0.56482 4.05415**
KISE does not Granger Cause SENSEX 0.26855 0.80478 0.77622 0.92555 0.62739
SENSEX does not Granger Cause KISE 3.47637* 3.56673** 2.24688* 1.51785 1.38117
KOSPI does not Granger Cause SENSEX 1.15546 1.91883 4.06541** 3.35083 2.78359**
SENSEX does not Granger Cause KOSPI 3.69467** 2.39122* 4.12346** 3.72926** 3.47739**
NIKKEI does not Granger Cause SENSEX 0.35595 0.49070 0.36601 0.50385 0.37472
SENSEX does not Granger Cause NIKKEI 0.14483 0.03303 0.10892 0.08583 1.35309
STI does not Granger Cause SENSEX 0.00218 0.20703 3.36160 2.25542 2.04379
SENSEX does not Granger Cause STI 2.43877* 1.33581 2.66720* 2.11816* 2.66453*
F- Statistics
Lag 1 Lag 2 Lag 3 Lag 4 Lag 5
Johansen cointegration test
Table 7 showing the Johnasen cointegration test result (lags interval: 1 to 4)
Trace test indicates 2 cointegrating eqn(s) at the 0.05 level * denotes rejection of the hypothesis at the 0.05 level
**MacKinnon-Haug-Michelis (1999) p-values Source: Computed Data
Hypothesized No. of CE(s) Eigen valueTrace
Statistic0.05 Critical
ValueProb.**
None * 0.343328 170.3393 125.6154 0.0000
At most 1 * 0.202807 104.3097 95.75366 0.0113
At most 2 0.179836 68.72430 69.81889 0.0609
At most 3 0.118962 37.59885 47.85613 0.3198
At most 4 0.051116 17.71413 29.79707 0.5872
At most 5 0.035301 9.476594 15.49471 0.3231
At most 6 0.024125 3.834071 3.841466 0.0502
Granger Causality Test
SCMS Journal o f Indian Management , October - December, 2013 54
A Quarterly Journal
The result obtained in the table 7 through Johansencointegration test revealed that trace statistics is significantat 1% level in only two cases and it leads to conclude thatthere is long run equilibrium between the Sensex and selectedindices of the stock market. The Null hypothesis of nocointegration effect is rejected in most cases.
Conclusion
The study reveals certain facts that there is high correlationbetween Sensex and other selected indices during the studyperiod. Further it is worth noted that both unidirectional andbidirectional causality effect took place among the selectedindices. The result obtained through cointegration test provedexists long run equilibrium between the Sensex and otherselected market indices. Due to this cointegration prices indifferent markets cannot move away far from each other andtherefore the investor community cannot get abnormal gaindue to the price difference among the markets. The majoraspect of the study is in tandem with the earlier work of SomSankar Sen (2011) except in the case of Granger causalitytest.
References
Amanulla & Kamaiah (1995). “Market Integration as analternative test of market efficiency: A case of IndianStock market.” Artha Vijana, No.3,pp. 215 – 230.
Arshanapalli & Doukas (1996). “Pacific Basin Stock Marketlinkages.” Research in International Business and
Finance, Supplement, No.1, 101 – 109.
Anindya Chakravarty & Dr.Bidyut Kumar Ghosh (2011).
“Long run financial market cointegration and its effect
on International Portfolio Diversification.” Indian
Journal of Finance, NO.4, Vol.5, April 2011, 27 – 37.
Bailey & Stulz (1990). “Benefi ts of International
Diversification: The case of Pacific Basin Stock
Markets.” Journal of Portfolio Management, Vol.16,
No.4, 57 – 61.
Floros (2005). “ Price linkages between the US, Japan and
UK stock markets”, Financial Markets and Portfolio
Management, Vol.19, No.02, 169-178.
Ghosh (1999). “Who moves the Asia Pacific Stock Markets:
US or Japan? Empirical Evidence based on theory of
cointegration,” Financial Review, Vol.34, No.1, 159-170.
Jayanthi & Pandiyan (2008). “An empirical study of
cointegration and correlation among Indian-Emerging and
Developed markets”, The IUP Journal of applied
Finance, Vol.14, No.11, 35-47.
Nath & Verma (2003). “Study of common stochastic trend
and cointegretion in the emerging markets: A case study
of India, Singapore and Taiwan.” NSE News July,
6 – 12.
Som Sankar Sen (2011). “Relationship between Sensex and
some selected Stock Price Indices of the Asia Pacific
region”, The IUP Journal of applied finance, Vol.17,
No.1, 43-53.

SCMS Journal o f Indian Management , October - December, 2013 55
A Quarterly Journal
Organizational Health :
Knowledge Based Sectoral Employees
We live the greater part of our lives spent in organizational settings. But the competitive nature of today’s marketplace
forces organizations and individuals to focus on trying to beat others rather than do their best and live up to their potential.
This phenomenon has a number of implications and is expressed by a new ideal for management to seek- organizational
health. At present, limited work has been done to define what a healthy organization is and how to measure it. Therefore,
this study is conducted to determine the factors of organizational health among knowledge professionals in the hope that
a more analytical approach would offer insights into how to create them. The results suggest that managerial efficiency,
HRM practices, employee citizenship, team work orientation and value-based management are critical; otherwise the goal
of sustained performance will remain elusive.
Key words: Organizational health, healthy workplace, organizational performance,
HRM, well-being, superior-subordinate relationships, power relations, team work orientation, etc.
Abstract
he greater part of our lives is spent in work and inorganizational settings. We not only work for theseorganizations, we also belong to them. But, over the
last 30 years, major changes have taken place in theorganizational settings. New technologies, globalization,changing demographics, increased competitiveness and theneed for continuous improvement in productivity have allhad a profound impact on how, when and where work getsdone (DeJoy, & Wilson, 2010). Today, for the organizations,staying in front requires a faster and smarter performanceeach year enabled by the capability of attracting and retaininga highly skilled workforce. Equally, today’s knowledgeprofessionals are gifted with higher level of education,intelligence, and therefore they command very competitivewages.
While work in today’s economy offers the potential forsatisfaction, repetitive and intensive work, stringent targetsand tight supervisory control and monitoring are creating
T
P.Sivapragasam and R.P.Raya
P. Sivapragasam, Department of Management Studies,Pondicherry University, R.V.Nagar, Kalapet, Puducherry-605014. Mob:098843 48588Email:- [email protected]
Dr. R.P.Raya, Dean- School of Management, Professor-Department of Management Studies, Pondicherry University,R.V.Nagar, Kalapet, Puducherry-605014,Email:- [email protected]

SCMS Journal o f Indian Management , October - December, 2013 56
A Quarterly Journal
dissatisfaction (Taylor & Bain, 1999). As a result, mostorganizations in the knowledge based category are experiencingthe highest turnover compared to other sectors (Maudgalya,Wallace, Daraiseh, & Salem, 2006). The reason is quiteobvious. The ways in which work is organized—particularlyits pace and intensity; control over one’s work process andfor realizing a sense of self-efficacy, justice, and employmentsecurity all are impacting the health and well-being of theorganizational members and performance, thus inviting studyfrom a variety of perspectives (Warr, 1990; Cooper &Cartwright, 1994; Marie McHugh & Chris Brotherton, 2000;Sparks, Faragher & Cooper, 2001; Addley, McQuillan &Ruddle, 2001; Ajay Jain & Arvind Sinha, 2005; Kelloway &Day, 2005; Joan Burton, 2010).
The Concept of Organizational Health
Health is a positive concept emphasizing social and personalresources as well as physical capabilities (Ramnik Ahuja &Debasis Bhattacharya, 2007). It describes our ability toflourish and enjoy life, and to cope and survive in adversity.Ironically, the concern for health and well-being in theorganizational context are no means new. From an almostexclusive focus on the physical work environment (the realmof traditional occupational health and safety), the definitionhas broadened to include health practice factors- lifestyle(Addley, McQuillan & Ruddle, 2001); psychosocial factors(Lowe, Schellenberg, & Shannon, 2003; James CampbellQuick, Marilyn Macik-Frey & Cary L. Cooper, 2007); and alink to the external environment (Ian Saunders & Steve Barkers,2001); all of which can have a profound effect on employeehealth and well-being (Brad Gilbreath & Philip Benson, 2004;Grawitch, Gottschalk & Munz, 2006). To say so, we observea paradigm shift in conceptualizing health from a ‘bio-medicalconcept’ (health as the absence of disease) to a ‘humanistichealth concept’ (health as individual perceived well-being).The evolution of this research paradigm now takes the term“organizational health” which undermines the range oforganizational and job related opportunities that are availableto an individual person to meet his or her needs of well-being,productivity and positive self-experience (Sauter, Lim &Murphy, 1996; Aaron De Smet, Mark Loch & Bill Schaninger,2007).
According to Cox (1988), organizational health embeds thenotion of health into work organization with an underlyingassumption that it should be possible to identify healthyfrom the unhealthy ones. This means that as a construct, theframework of organizational health helps us in understandinghow individual and organizational factors interact and
influence particular employee and organizational outcomes.While these two perspectives are very different, a nexusbetween them means issues in one affecting the other. Currentthinking suggests that individual level well-being leads to ahigher level of individual-level performance (Judge, & Bono,2001), in turn leading to better organizational performance(Bakker, & Schaufeli, 2008), motivates workers, enhancesmorale, reduces absenteeism, reduces personnel and welfareproblems, competitiveness and public image (Chu, Breucker,Harris & Stitzel, 2000; Kramer & Cole 2003; Whitehead 2006).Similarly, the consequences of unhealthy work organizationare many and include work-related accidents, high rates ofabsenteeism, a high turnover, high levels of stress, loss ofproductivity and a high incidence of health-related litigation(Whitehead 2006).
Statement of the problem
In recent years, management scholars have been increasinglyinterested in the impact of organizational context on itsmembers (Danna & Griffin, 1999; Dugdill, 2000; Verow &Hargreaves, 2000; Peter Cotton & Peter Hart, 2003; RobertMacIntosh, Donald MacLean & Harry Burns, 2007; Kuenzi,Schminke, 2009). Research has also shown that while theindividual health practices of employees influence their overallheal th, condit ions in their physical and social workenvironments also play an important role. The work andorganizational context is also important because it gives thesalience and meaningfulness to the employees. In seeking tounderstand organizational and job factors of health, feedbackfrom internal stakeholders, employees, is of particularimportance. Therefore, research on organizational healthassumes more relevance in today’s scenario where oureconomy is thriving and greater majority of the youngworkforce are spending longer hours at work in a competitiveenvironment. Employees perception of their organizationaffect their perception of the climate, which impacts the waypeople relate to their jobs and see their future in theirorganizations, ultimately impacting their adjustment,productivity and well-being (Wilson, DeJoy, Vandenberg,Richardson, & McGrath, 2004). Although researches onorganizational health have been steadily increasing, empiricalknowledge as to their use, their determinants remain ratherlimited. The present investigation is to address these issues.
Operational Definition
At the core of organizational health, are five key concepts,which the authors believe are essential for the health of anyorganization. Therefore for the purpose of this research,
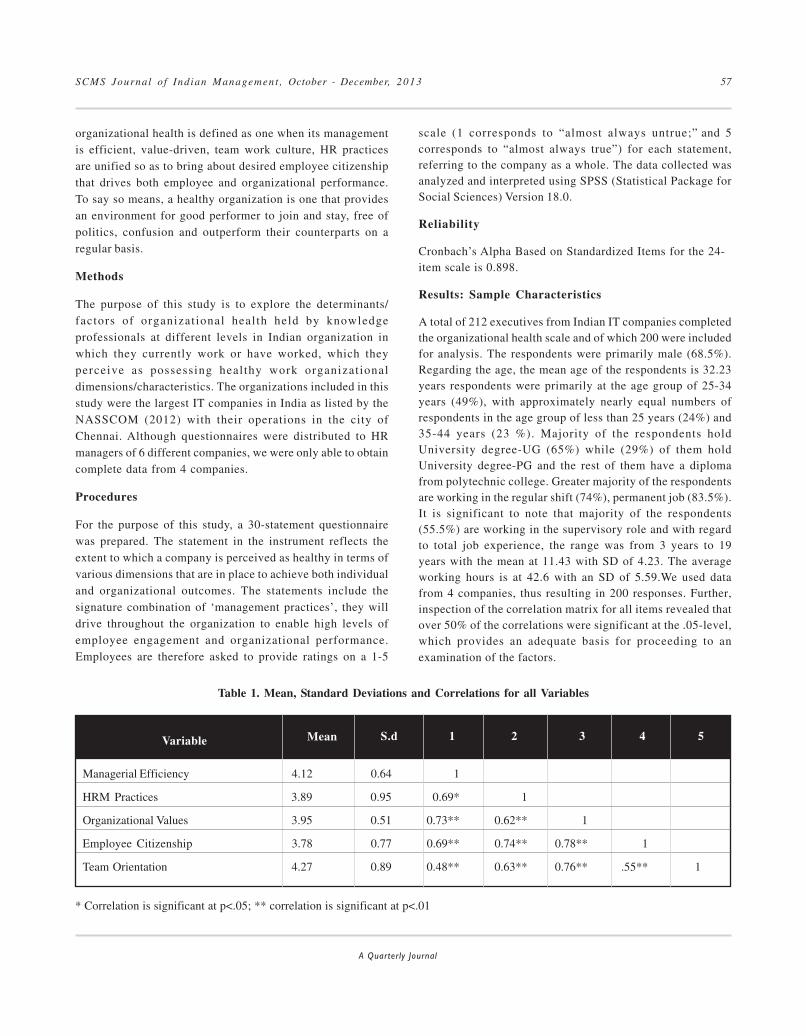
SCMS Journal o f Indian Management , October - December, 2013 57
A Quarterly Journal
organizational health is defined as one when its managementis efficient, value-driven, team work culture, HR practicesare unified so as to bring about desired employee citizenshipthat drives both employee and organizational performance.To say so means, a healthy organization is one that providesan environment for good performer to join and stay, free ofpolitics, confusion and outperform their counterparts on aregular basis.
Methods
The purpose of this study is to explore the determinants/factors of organizat ional heal th held by knowledgeprofessionals at different levels in Indian organization inwhich they currently work or have worked, which theyperceive as possessing healthy work organizat ionaldimensions/characteristics. The organizations included in thisstudy were the largest IT companies in India as listed by theNASSCOM (2012) with their operations in the city ofChennai. Although questionnaires were distributed to HRmanagers of 6 different companies, we were only able to obtaincomplete data from 4 companies.
Procedures
For the purpose of this study, a 30-statement questionnairewas prepared. The statement in the instrument reflects theextent to which a company is perceived as healthy in terms ofvarious dimensions that are in place to achieve both individualand organizational outcomes. The statements include thesignature combination of ‘management practices’, they willdrive throughout the organization to enable high levels ofemployee engagement and organizational performance.Employees are therefore asked to provide ratings on a 1-5
scale (1 corresponds to “almost always untrue;” and 5corresponds to “almost always true”) for each statement,referring to the company as a whole. The data collected wasanalyzed and interpreted using SPSS (Statistical Package forSocial Sciences) Version 18.0.
Reliability
Cronbach’s Alpha Based on Standardized Items for the 24-item scale is 0.898.
Results: Sample Characteristics
A total of 212 executives from Indian IT companies completedthe organizational health scale and of which 200 were includedfor analysis. The respondents were primarily male (68.5%).Regarding the age, the mean age of the respondents is 32.23years respondents were primarily at the age group of 25-34years (49%), with approximately nearly equal numbers ofrespondents in the age group of less than 25 years (24%) and35-44 years (23 %). Majority of the respondents holdUniversity degree-UG (65%) while (29%) of them holdUniversity degree-PG and the rest of them have a diplomafrom polytechnic college. Greater majority of the respondentsare working in the regular shift (74%), permanent job (83.5%).It is significant to note that majority of the respondents(55.5%) are working in the supervisory role and with regardto total job experience, the range was from 3 years to 19years with the mean at 11.43 with SD of 4.23. The averageworking hours is at 42.6 with an SD of 5.59.We used datafrom 4 companies, thus resulting in 200 responses. Further,inspection of the correlation matrix for all items revealed thatover 50% of the correlations were significant at the .05-level,which provides an adequate basis for proceeding to anexamination of the factors.
Table 1. Mean, Standard Deviations and Correlations for all Variables
* Correlation is significant at p<.05; ** correlation is significant at p<.01
Variable Mean S.d
Managerial Efficiency 4.12 0.64 1
HRM Practices 3.89 0.95 0.69* 1
Organizational Values 3.95 0.51 0.73** 0.62** 1
Employee Citizenship 3.78 0.77 0.69** 0.74** 0.78** 1
Team Orientation 4.27 0.89 0.48** 0.63** 0.76** .55** 1
1 2 3 4 5
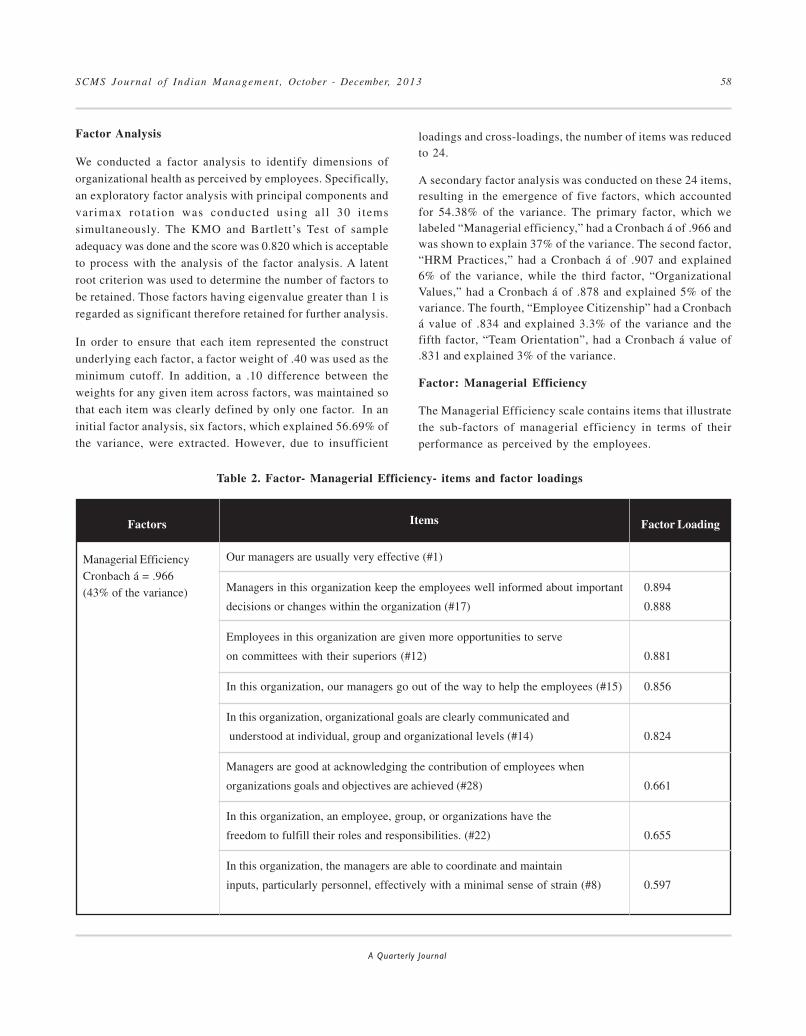
SCMS Journal o f Indian Management , October - December, 2013 58
A Quarterly Journal
Factor Analysis
We conducted a factor analysis to identify dimensions of
organizational health as perceived by employees. Specifically,
an exploratory factor analysis with principal components and
varimax rotat ion was conducted using al l 30 i tems
simultaneously. The KMO and Bartlett’s Test of sample
adequacy was done and the score was 0.820 which is acceptable
to process with the analysis of the factor analysis. A latent
root criterion was used to determine the number of factors to
be retained. Those factors having eigenvalue greater than 1 is
regarded as significant therefore retained for further analysis.
In order to ensure that each item represented the construct
underlying each factor, a factor weight of .40 was used as the
minimum cutoff. In addition, a .10 difference between the
weights for any given item across factors, was maintained so
that each item was clearly defined by only one factor. In an
initial factor analysis, six factors, which explained 56.69% of
the variance, were extracted. However, due to insufficient
loadings and cross-loadings, the number of items was reducedto 24.
A secondary factor analysis was conducted on these 24 items,resulting in the emergence of five factors, which accountedfor 54.38% of the variance. The primary factor, which welabeled “Managerial efficiency,” had a Cronbach á of .966 andwas shown to explain 37% of the variance. The second factor,“HRM Practices,” had a Cronbach á of .907 and explained6% of the variance, while the third factor, “OrganizationalValues,” had a Cronbach á of .878 and explained 5% of thevariance. The fourth, “Employee Citizenship” had a Cronbachá value of .834 and explained 3.3% of the variance and thefifth factor, “Team Orientation”, had a Cronbach á value of.831 and explained 3% of the variance.
Factor: Managerial Efficiency
The Managerial Efficiency scale contains items that illustratethe sub-factors of managerial efficiency in terms of theirperformance as perceived by the employees.
Table 2. Factor- Managerial Efficiency- items and factor loadings
Factors Items
Managerial EfficiencyCronbach á = .966(43% of the variance)
Factor Loading
Our managers are usually very effective (#1)
Managers in this organization keep the employees well informed about important 0.894
decisions or changes within the organization (#17) 0.888
Employees in this organization are given more opportunities to serve
on committees with their superiors (#12) 0.881
In this organization, our managers go out of the way to help the employees (#15) 0.856
In this organization, organizational goals are clearly communicated and
understood at individual, group and organizational levels (#14) 0.824
Managers are good at acknowledging the contribution of employees when
organizations goals and objectives are achieved (#28) 0.661
In this organization, an employee, group, or organizations have the
freedom to fulfill their roles and responsibilities. (#22) 0.655
In this organization, the managers are able to coordinate and maintain
inputs, particularly personnel, effectively with a minimal sense of strain (#8) 0.597

SCMS Journal o f Indian Management , October - December, 2013 59
A Quarterly Journal
Factor: HRM Practices
HRM practices scale contains items that illustrate HRM practices as the sub-factor of organizational health as perceived by theemployees.
Factors Items
HRM PracticesCronbach á =.907(6% of the variance)
Factor Loading
Employees in this organization are given challenging and interesting jobs. (#11) 0.915
In this organization, significant investment is spent for thecontinuous training and development of the employee. (#19) 0.889
This organization is very selective in hiring and is clear about the attributes, competencies, attitudes and values that we want in anew employee. (#20) 0.827
The organization works (as much as possible) to provide me withopportunities for career growth. (#21) 0.798
In this organization, performance is assessed based on a set of clearlydefined competencies (#7) 0.692
Factor: Organizational Values
Organizational Values scale illustrates organizational values as the sub-factor of organizational health as perceived by theemployees.
Table 3. Factor- HRM Practices- items and factor loadings
Factor: Employee Citizenship
Employee Citizenship scale contains items that illustrate employee work behaviour as the sub-factor of organizational health asperceived by the employees.
Factors Items
OrganizationalValuesCronbach á = .878(5% of the variance)
Factor Loading
In this organization, there is a good degree of respect for non-conformity(for example, disagreeing with superiors in the interest of the organization) (#13) 0.845
Work atmosphere in this organization allows employees to be inventive, diverse, creative, and risk-taking (#16) 0.773
This organization provides work conditions (e.g., flexible schedules. child carefacilities. telecommuting programs) which take into account the emergent needsof employees (#24) 0.742
Management seeks the involvement of the employees opinion when makingimportant decisions(#27) 0.662
Table 4. Factor- Organizational Values- items and factor loadings

SCMS Journal o f Indian Management , October - December, 2013 60
A Quarterly Journal
Table 5. Factor- Employee Citizenship - items and factor loadings
Factor: Team Orientation
Team Orientation scale contains items that illustrate team orientation as the sub-factor of organizational health as perceived bythe employees.
Discussion
The major working premise in this s tudy is that an
organization is healthy if it could achieve the balance in
establishing an active and dynamic interdependence and
mutuality in satisfaction between the organizational top
management, immediate reporting managers and employees
in the business end directly interacting to the customers. An
initial item pool of 30 items thought to be factorial dimensions
of organizational health was completed by a sample of 200
employees belonging to various organizations in the knowledge
based category in the Chennai City. Factor analysis extracted
five factors such as managerial efficiency, HRM Practices,
Organizational Values, Employee Citizenship and Team
Orientation. This means that when employees feel that they
Factors Items
Employee Citizenship
Cronbach á =.834(3% of the variance)
Factor Loading
Employees are mindful of how their behaviour affects otherpeople’s job (#2) 0.773
This organization has a great deal of personal meaning for itsemployees (#3) 0.752
Employees in this organization put a lot of energy into everythingthey do (#6) 0.745
Employees in this organization put considerable pressure on one anotherto live up to the expected code of conduct (#29) 0.743
Factors Items
Employee Citizenship
Cronbach á =.834(3% of the variance)
Factor Loading
In this organization people sensibly know when they should collaborateand when they should compete. (#23) 0.621
In this organization, employees or groups have a clear sense of identify,are attracted to membership, want to stay, and are willing to influenceand to be influenced. (#25) 0.605
This organization is characterized to possess equitable distribution ofinfluence between the leader and members of his/her work unit (#5) 0.572
Table 6. Factor- Team Orientation- items and factor loadings
are employed by a good employer with competency in
managing the performance cycle, respects the employees for
their contribution, provides them with opportunities to have
a meaningful and satisfying work life; the employees are more
likely to align their values to that of their organization, tend
to be more likely to be productive, committed to their work
teams and exhibit citizenship behaviour – which are the
hallmarks of an healthy organization. Organizational Health
thus emerged should be seen as a composite outcome of the
way in which identified factors interact with each other. There
are several limitations to this study. It must be emphasized
that this research is of exploratory in nature to construct
dimensions of organizational health, and not testing for the
characteristics of a sample population.

SCMS Journal o f Indian Management , October - December, 2013 61
A Quarterly Journal
Conclusion
A healthy organization is integral to achieving excellence andthe focus is basically on creating the right work environmentfor employees to actualize their potential and optimallycontribute to organizational goals while staying well. Forbusiness leaders and managers therefore it is essential tounderstand the business case for leading in the pursuit oforganizational health for long term business success. In today’sbusiness environment, organization will only be perceived ashealthy if it embraces values and practices in alignment to thenature and well-being of its stakeholders- employees inparticular. Becoming aware of the dimensions of health is thefirst step in confronting the challenge. Otherwise, the goal ofsustained performance will likely remain elusive.
References
Aaron De Smet, Mark Loch and Bill Schaninger (2007).“Anatomy of a Healthy Corporat ion.” Indian
Management; 62-68.
Addley, K.P., McQuillan and Ruddle, M. (2001). “CreatingHealthy Workplaces in Northern Ireland: Evaluation ofa Lifestyle and Physical Activi ty AssessmentProgramme.” Journal of Occupational Medicine 51: 439-49.
Ajay K. Jain, and Arvind K. Sinha (2005). “General Health inOrganizations: Relative Relevance of EmotionalIntelligence, Trust, and Organizational Support.”International Journal of Stress Management. 12(3): 257-273.
Bakker, A.B.,and W.B. Schaufel i , (2008). Posi t iveOrganizational Behaviour: Engaged Employees inFlourishing Organizations,” Journal of Organizational
Behaviour, 29: 147–154.
Brad Gilbreath and Phil ip G. Benson (2004). “TheContribution of Supervisor Behaviour to EmployeePsychological Well-being.” Work and Stress, 18(3): 255-266
Chu, C.G., Breucker, H. Harris and A. Stitzel, (2000). “Health-Promoting Workplaces - International Sett ingsDevelopment.” Health Promotion International, 15(2):155-95.
Cooper, C. L., and S. Cartwright, (1994). “Healthy Mind;Healthy Organization: A Proactive Approach toOccupational Stress,” Human Relations. 47(4): 455–471.
Cox, T. (1988). “Editorial: Organizational health.” Work &
Stress, Vol. 2, No.1, 1–2.
Danna, K., & R.W. Griffin, (1999). “Health and Well-being inthe Workplace: A Review and Synthesis of theLiterature.” Journal of Management. 25(3): 357–384.
DeJoy, D.M., and M.G. Wilson, (2010). “Assessing theImpact of Healthy Work Organization Intervention.”Journal of Occupational and Organizational Psychology.83: 139–165.
Dugdill, L. (2000). “Developing a Holistic Understanding ofWorkplace Health: the Case of Bank Workers.”Ergonomics, 43, 1738 – 1749.
Grawitch, M. J., M.Gottschalk, & D. C. Munz, (2006). “ThePath to a Healthy Workplace: A Critical Review LinkingHealthy Workplace Practices, Employee Well-being, andOrganizational Improvements.” Consulting Psychology
Journal. 58: 129–147.
Ian Saunders & Steve Barkers (2001). “Organizational Health:A Framework for Checking Organizations Fitness forSuccess.” Journal of Change Management. 2(2): 173-183.
James Campbell Quick, Marilyn Macik-Frey and Cary L.Cooper (2007). “Managerial Dimensions ofOrganizational Health: The Healthy Leader at Work.”Journal of Management Studies, 44(2): 189-205.
Joan Burton, (2010). WHO Healthy Workplace Framework
and Model: Background and Supporting Literature and
Practices (Unpublished Report: Submitted to EvelynKortum, WHO Headquarters, Geneva, Switzerland).
Judge, T.A., and J.E. Bono, (2001). “Relationship of CoreSelf-evaluations Traits—Self-esteem, Generalized self-efficacy, Locus of control, and Emotional Stability—with Job Satisfaction and Job Performance: A Meta-analysis.” Journal of Applied Psychology, 86: 80–92.
Kelloway, E.K., and A. Day, (2005). “Building HealthyWorkplaces. What We Know So Far.” Canadian Journal
of Behavioural Science, 34(7): 223-235.
Kramer, D.M. and D.C. Cole. (2003). “Sustained, IntensiveEngagement to Promote Health and Safety KnowledgeTransfer to and Utilization by Workplaces.” Science
Communication, 25(1): 56-82.
Kuenzi, M., and M. Schminke, (2009). “A FragmentedLiterature? A Review, Critique, and Proposed Research

SCMS Journal o f Indian Management , October - December, 2013 62
A Quarterly Journal
Agenda of the Work Climate Literature.” Journal ofManagement, 35, 634-717.
Lowe, G.S., Schellenberg, G., and H.S. Shannon, (2003).“Correlates of Employees’ Perceptions of a HealthyWork Environment.” American Journal of HealthPromotion, 17: 390–399.
Marie McHugh & Chris Brotherton (2000). “Health is wealth:Organisat ional Utopia or myopia?” Journal ofManagerial Psychology, 15(8): 744-770.
Maudgalya, T, Wallace, S, N. Daraiseh, and S Salem,(2006).“Workplace Stress Factors and ‘Burnout’ amongInformation Technology Professionals: A SystematicReview.” Theoretical Issues in Ergonomics Science, 7(3):285-297.
Pfeffer, J. (1994). Competitive Advantage through People:Unleashing the Power of the Workforce (9th Edition).Boston:Harvard Business School Press.
Peter Cotton and Peter M. Hart (2003). “OccupationalWellbeing and Performance: A Review of OrganizationalHealth Research.” Australian Psychologist. 38(2): 118-127.
Ramnik Ahuja and Debasis Bhattacharya (2007). HealthyWorkplace in Corporate Sector- India, An Operationalresearch conducted by Confederation of IndianIndustries (CII), supported by WHO India CountryOffice.
Robert MacIntosh, Donald MacLean and Harry Burns (2007).“Health in Organization: Towards a Process Based
View.” Journal of Management Studies. 44(2): 206-221.
Sauter, S. L., S. Lim, , and L.R.Murphy, (1996). “Organiza-
tional health: A New Paradigm for Occupational StressResearch at NIOSH.” Occupational Mental Health, 4(4):248–254.
Sparks K., B. Faragher , C. L. Cooper (2001). “Well-beingand Occupational Health in the 21st CenturyWorkplace.” Journal of Occupational and
Organizational Psychology, 74(4): 489-509.
Taylor, P., and P. Bain, (1999). “An Assembly-line in theHead: Work and Employee Relations in the Call Centre.”Industrial Relations Journal, 30(2): 101-117.
Verow, P., and C. Hargreaves, (2000). “Healthy WorkplaceIndicators: Costing Reasons for Sickness Absence withinthe UK National Health Service.” Journal of
Occupational Medicine. 50: 251-57.
Warr, P. (1990). “The Measurement of Well-being and OtherAspects of Mental Health,” Journal of Occupational
Psychology, 63: 193 – 210.
Whitehead, D. (2006). “Workplace Health Promotion: TheRole and Responsibility of Healthcare Managers.”Journal of Nursing Management, 14: 59-68.
Wilson, M.G., D.M.DeJoy, R.J.Vandenberg, H. Richardson,and A. Mc Grath, (2004). “Work characteristics andemployee health and well-being: Test of a model ofhealthy work organization.” Journal of Occupational
and Organizational Psychology, 77, 1-24.

SCMS Journal o f Indian Management , October - December, 2013 63
A Quarterly Journal
Managing Non-financial Risks :
Business & Growth
Bhavana Raj, Senior Research Fellow, School of ManagementStudies (SMS), JNTUH University (Jawaharlal NehruTechnological University Hyderabad), Kukatpally,Hyderabad-500085, & Faculty Member at IBS(ICFAI Business School), Hyderabad-501203,E-mail:[email protected]
Dr. Sindhu, Associate Professor, Ph.D., School of ManagementStudies(SMS), JNTUH University(Jawaharlal Nehru TechnologicalUniversity Hyderabad), Kukatpally, Hyderabad-500085, &Research Coordinator R & D (Research and Development),JNTUH University(Jawaharlal Nehru Technological UniversityHyderabad), Kukatpally, Hyderabad-500085,E-mail: [email protected]
Key words: Risk Management, Banking, Basel, Credit Risk, Market Risk, Operational RiskJEL Classification : F 22, F 21, G21, G 24, G 32, and G 34
isk is associated with uncertainty and reflected byway of change in the basic structure. These Risksare inter-dependent and events affecting one area of
Risk can have ramifications and penetrations for a range ofother categories of Risks. Risk Management may broadly bedefined as an Art or Science that facilitates identification andmanagement of the possible deficiencies in any activity thatmay result in its failure or underperformance. Risk is thepossibility of the actual outcome being different from theexpected outcome. Banking has been undergoing metamorphicchanges, depending upon the economic drivers, geo-physicalconditions, social compulsions and practices throwing upnew challenges in Risk Management. The Risk Managers areconstantly evolving sound banking practices that could takecare of the effective Risk Management, so that both the ‘giver’and ‘taker’ are reasonably protected from the possibleadversities and thus safeguard sound economic activity. Thecore spirit of Risk Management would be ‘to be aware of theRisks’ and ‘find the ways and means to mitigate Risks,’ ratherthan develop the ‘tendency of Risk-Averse.’ The mosteffective Risk Management is to assess the impact of the
With a view to strengthening the Risk Management in the Banks across the Globe, Basel Frameworks have madeconcerted efforts to address all the issues relating to Financial Risks like Credit and Market Risks and some Non-Financial Risks as well. The impact of the non-Financial Risks is all pervasive and can be severe enough that theycan lead to total collapse of the Banks. As assessment of the impact of Non-Financial Risks is rather ticklish, BaselII has introduced a new Capital Charge for Operational Risk based on the Gross Income. Despite the controversiessurrounding the rationale underlying the computation of Capital Charge for Operational Risk (arguably due to thesevere impact on the Capital position of the Banks), it is a welcome step. Basel Committee in its wisdom did notattempt to address certain of the Non-Financial Risks like Strategic Risk, Reputation Risk and Political Risk andenvisaged that the Banks concerned evolve the respective policies depending upon the socio-economic compulsionsand geo-physical conditions.
Abstract
Bhavana Raj and Sindhu
R

SCMS Journal o f Indian Management , October - December, 2013 64
A Quarterly Journal
Risks and attempt to mitigate or manage them, so as to reducetheir impact.
RISK MANAGEMENT
Risk is all pervasive and is prevalent in every activity, be itmanufacturing or trading or service related. Human beingsalways attempt to manage the Risks faced by them in theirday-to-day activities of life. Keeping inflammable materialaway from fire, saving for possible future needs, creation of alegal protection etc. are some of the attempts at managing theRisks.
While there is no formal documentation of Risk Managementin the primitive form of economic activity like ‘barter’ system,it would be reasonable to assume that both sides of theexchange-trade were prudently applying the basics of RiskManagement viz. no loss or low loss. The extent of loss,whatever it may be, should have been the dictate of the ‘need.’Broadly, this dictate of the ‘need’ may be classified as theprimitive form of Risk-Return Trade-off.
Managing Risk is nothing but managing the Risk before theRisk manages. Every Industry strives to arrest the Risks
with a view to minimizing its losses and making optimumrevenue. Banking Industry, primarily dealing with financial
services can be no exception and thus, encounters with many
related Risks. It is imperative that Banks have to identify
and measure various Risks faced by them and initiate suitable
remedial measures to mitigate them.
RISKS IN THE BANKING INDUSTRY
The Risks that the Banks face can fundamentally be
subdivided into two types: Financial and Non-Financial Risks.
Financial Risks involve all those acts which deal mainly with
financial aspects of the Bank and can be broadly stratified as
Credit Risk and Market Risk. Both Credit and Market Risks
may further be subdivided, as per the intensity and nuances
of the Risk Management. Non-Financial Risks include all the
Risks faced by the Banks in their normal functioning, like
Operational Risk, Strategic Risk, Reputational Risk, and
Political Risk.
A snapshot of the Risks that the Banking Industry may face
is as under:
The above list is only indicative, but not exhaustive. TheFinancial Risks associated with Credit and Market Risks areinter-twined and complimentary. Any adverse affect on eitherof them may lead to adverse effect on the other. The Non-financial Risks like Operational Risk and Strategic Risk areall pervasive and can fuel the ill-effects of both Credit andMarket Risks.
RISK MANAGEMENT ENVISAGED BY THE BASELFRAMEWORKS
BASEL – I:
Liquidation of ‘Bank Herstatt’ by the German Regulators in1974 resulted in huge losses to various Banks who have taken
Table 1: Table showing Financial Risks and Non-financial Risks
Source: International Convergence of Capital Measurement and Capital Standards, A Revised Framework, Comprehensive Version, June2006.
Financial Risks
Counter Party or Borrower Risk Interest Rate Risk Operational Risk
Intrinsic or Industry Risk Liquidity Risk Strategic Risk
Portfolio or Concentration Risk Forex Currency Risk Reputational Risk
Political Risk
Cyclical Risk
Idiosyncratic Risk
Systemic Risk
Non Financial Risks
Credit Risk Market Risk

SCMS Journal o f Indian Management , October - December, 2013 65
A Quarterly Journal
the exposures on the said German Bank. This Cross-border
Settlement Risk was a major trigger point that prompted the
Banks across the Globe to think of comprehensive
methodologies on Risk evaluation and mitigation. In this
direction, as an initiative of G20 Countries, Basel Committee
on Banking Supervision (Basel Committee) was formed under
the aegis of Bank for International Settlement.
Basel Committee had brought out the first set of guidelines in
1988 (Basel I) for calculation of Capital Charge on Exposures
(both fund based and non-fund based) and other Assets, based
on the Risk Weights applicable to the counter-party, which
primarily were intended to capture the Credit Risk. The
Market Risk Amendment was introduced in 1996. Basel I
envisages Risk Weights to the counter-party under the
premise ‘One-Size-Fits-All.’ In nutshell, Basel I is less Risk
sensitive to the ever-growing and multi-dimensional exposures
of the Banking Industry.
BASEL - II:
Basel Committee, with a view to make computation of Capital
Charge on the Exposures and other Assets more Risk-
sensitive, had brought out revised guidelines in June, 2004
(Basel II). A Comprehensive version, inter-alia including
1996 Market Risk Amendment and 2005 paper on Trading
Activities and Treatment of Double Default Effects, was
released in June 2006.
Basel II is not mandatory either on the member Banks or
otherwise. However, it is rather surprising that while
developing Economies like India and South Africa preferred
to migrate to Basel II as per the given time-lines, a developed
Economy like USA resisted its introduction. However, over
a period of time, the Banks across the Globe, in their own
interest, have voluntarily preferred to adopt Basel II, albeit
late to suit their local conditions.
Basel II envisages that stability of Financial Markets rests on
3 mutually reinforcing Pillars viz.:
Table 2: Table showing the Three Basic Pillars of Basel II
Pillar I MinimumCapital Requirements
Pillar II SupervisoryReview
Pillar III MarketDiscipline
Maintenance of Risk-adequate computation of Capital requirements, which explicitlyincludes the Operational Risk, in addition to the Credit Risk and the Market Risk
Establishment of robust Risk Management practices, which includes compilation ofInternal Capital Adequacy Assessment Process (ICAAP) Policy and their review bythe Supervisors
Increased transparency through expanded disclosers in the larger interests of all theStakeholders.
Table 2: Table showing the Three Basic Pillars of Basel II
Source: International Convergence of Capital Measurement and Capital Standards, A Revised Framework, Comprehensive Version, June2006.

SCMS Journal o f Indian Management , October - December, 2013 66
A Quarterly Journal
Tree of Basel II Framework – A Diagram
Figure 1: Compiled.
SCMS Journal o f Indian Management , October - December, 2013 67
A Quarterly Journal
Pillar I
The Magnum Opus of Basel II Framework is a magnificent
effort to document various methodologies to calculate the
Capital Charge on various Exposures taken by the Banks.
Under Pillar I, Basel II has formulated a 3-tier migration to
the Risk Management viz. i) Basic Approaches ii) Middle
Approaches and iii) Advanced Approaches. Each of these
approaches contained a set of guidelines to capture Capital
Charge for Credit, Market, and Operational Risks. Basel II
has introduced a new Capital Charge for Operational Risk,
based on the Gross Income, which is expected to protect the
Banks to some extent, in case of adversities.
Pillar II
Under Pillar II, Banks are encouraged to formulate the Internal
Capital Adequacy Assessment Process (ICAAP) Policy, inter-
alia capturing a realistic Risk Profile of the Exposures taken
by them and assess the Capital Charge required, which will
be subjected to Supervisory Review by the Regulators
concerned. Developing a realistic ICAAP Policy is gigantic
exercise requiring ingenuity, spirit of truthfulness and robust
Risk Management skills.
The ICAAP Policy has to be realistic and robust enough to
stand the scrutiny of the Regulators. The Regulators in their
wisdom may prescribe additional Capital Charge for the
Idiosyncratic Risk of the Bank concerned and the Systematic
Risk the Banking Industry per-se. A pragmatic ICAAP Policy
is intended to lead to the concept of Economic Capital and
reduce the Capital Arbitrage by the Regulators. However, in
view of the conflicting interests of the players in the system,
evolution of Economic Capital appears to be a distant dream.
The Banks are also encouraged to conduct Risk Controller
and Self Assessment (RCSA) exercises across the cross-
section of its employees (who are one of the stakeholders).
RCSA exercises are intended to equip the employees mainly
to address the issues relating to its Systems and Procedures,
Risk Monitoring and Corporate Governance. This proved to
be non-starter and the Banks are yet to take them seriously.
Pillar III
Basel Committee observed that the information given by the
Banks in the Balance Sheets is barely intelligible for the
common Customers and other Stakeholders. Under Pillar III,
Banks are expected to maintain transparency and make
additional disclosures with a desired level of integrity, over
and above the statements that have already been made in the
Balance Sheets (which are made in line with the local
Accounting Standards), so as to facilitate the Stakeholders
take an informed decision about the Bank concerned. In the
absence of the specific guidelines by Basel III on this aspect,
the Regulators are expected to formulate appropriate policies,
as per the dictates of the banking practices prevalent in the
Country concerned. However, ‘User Test’ is indicated as one
of the barometers to decide the level of these additional
disclosures.
BASEL – III:
There are many and varied reasons that led to the financial
crises leading to failure or closure of many of the Banks in US
and European Union. Evidently, no two Economists agree on
a single analysis on such events. However, the main reasons
can be traced to lack of Corporate Governance and inadequate
Capital base. To address the deficiencies revealed by the late
2000s financial crisis, Basel Committee has come out with
Basel III Framework in 2010, scheduled to be introduced from
2013 until 2019. Basel III is designated to be a global
regulatory standard on Banks’ Capital Adequacy, Stress
Testing and Liquidity Risk.
Basel III Framework aims to achieve the following objectives:
� Strengthening the Risk Management and Corporate
Governance
� Augmenting buffer Capital to address the Cyclical,
Idiosyncratic and Systemic Risks
� Improving the ability to absorb shocks arising from
Financial and Economic Stress
� Enhancing Transparency in Transactions and
Disclosures.
The Banks across the Globe are preparing themselves to
comply with Basel III Framework and provide the required
Capital. However, it is disturbing to note that many a Bank
is willing to provide additional Capital (which has a Cost) to
meet Basel Norms, rather than strengthen their Risk
Management practices and reduce the impact of both Financial
and Non-Financial Risks and thus, save the Capital allocated
for taking such exposures and the cost thereof.

SCMS Journal o f Indian Management , October - December, 2013 68
A Quarterly Journal
MANAGING NON-FINANCIAL RISKS - IMPACT ONBUSINESS & GROWTH
Basel Frameworks, for the Banks, on the face of it, appear tobe very difficult to digest [Basel Norms seek to introducenew concepts like Haircut, Probability of Default (PD), LossGiven Default (LGD), Exposure at Default (EAD),Idiosyncratic Risk and Systemic Risk and seem to haunt thetraditional mind-set of the Risk Managers with the ‘fear ofthe unknown.’
Banking has been undergoing metamorphic changes, inaccordance with the economic drivers, geo-physical conditionsand social compulsions. Rapid growth in industrializationand agricultural production has dramatically changed thescope of Banking and expanded its horizons. With the adventof Computers and Information Technology, there has been aparadigm shift in the banking practices giving rise to morecomplex banking products and services, thus exposing theBanks to various new types of Risks.
Technological advancements in telecommunication andtransportation have reduced the geo-physical barriers and theBanks have stretched themselves overseas. These expandedhorizons have further increased the Risk profile of the Banks.While new avenues for the Banks have opened up, they havebrought with them new Risks as well, which the Banks willhave to manage and attempt to mitigate.
Against this backdrop, Basel Committee has made amagnificent effort to map all the possible Financial and non-Financial Risks the Banks are likely to face. It has introducedcertain time-tested and some more new Statistical and otherTools, to facilitate measurement of the impact of the Risks.It has made a pragmatic account of the impact of the FinancialRisks like Credit and Market Risks, while retaining the methodof computation of Capital Charge based on Risk WeightedAssets. As the type of Financial Exposures taken by theBanks is more or less similar, the movement, impact andmeasurement of the Financial Risks associated with suchFinancial Exposures can be measured to a reasonable extentwith the methodologies envisaged by Basel Frameworks.
Many of such Risks that may not directly relate to theFinancial Exposures taken by the Banks, but have an indirectimpact on such Financial Exposures, are coined as Non-Financial Risks. It is pertinent to observe that the Non-Financial Risks also have financial impact on the Exposurestaken by the Banks and the Services offered by them.
However, it is rather ticklish and difficult to make a fair
measurement of the impact of such Non-Financial Risks.
The impact of the non-Financial Risks is all pervasive and
can be severe enough that they can lead to a total failure or
collapse of the Banks. Hence, Basel II has rightly introduced
a new Capital Charge for Operational Risk based on the Gross
Income. Despite the controversies surrounding the rationale
underlying the compilation of Capital Charge for Operational
Risk (arguably due to the severe impact on the Capital position
of the Banks), it is a welcome step. If the 2000s Economic
Crises and the recent failure of US and European Banks is
any indication, the introduction of Capital Charge for
Operational Risk by Basel II is well justified.
The impact of Operational Risk is all encompassing and can
adversely affect any Exposure of the Banks, but, by itself
Operational Risk it is not the end of all Non-Financial Risks.
The Banks are also adversely affected by other Non-Financial
Risks like:
� Strategic Risk
� Reputational Risk
� Political Risk
� Legal Risk
� Cyclical Risk
� Idiosyncratic Risk
� Systemic Risk
The above broad identification of Non-Financial Risks is made
basing on the experience of the Risk Managers, considering
the gravity with which they are likely to have an adverse
impact on the finances and business of the Banks. The Risk
Managers may encounter many more new Non-Financial
Risks, which have to be tackled as per the dictates of the
situation and need.
While introducing Operational Risk in Basel II (which is
expected to provide some cushion to the Banks in case of
adversities), Basel Committee in its wisdom did not attempt
to address many of the non-Financial Risks like Strategic
Risk, Reputation Risk and Political Risk. and envisaged that
the Banks concerned evolve the respective policies depending
upon the socio-economic conditions and geo-physical barriers.

SCMS Journal o f Indian Management , October - December, 2013 69
A Quarterly Journal
The Non-Financial Risks contribute their might in adverselyaffecting the Exposures taken by the Banks and the Servicesoffered by them. Hence, in the larger interests of Businessand Growth, it would be prudent for the Banks to study theimpact of the Non-Financial Risks and find reasonable waysand means to manage them effectively, so as to reduce theirimpact, if not mitigate them fully.
Operational Risk
Operational Risk is defined as the Risk of loss resulting frominadequate or failed internal processes, people and systems,or from external events. The Basel II definition includes LegalRisk, but excludes Strategic Risk (due to poor strategicbusiness decision) and Reputational Risk (due to loss ofreputation or standing), although a significant but non-catastrophic operational loss could still affect the reputationof the Banks, possibly leading to a further collapse of itsbusiness and consequent organizational failure. Though BaselII has reckoned Legal Risk as a part of Operational Risk, forthe purpose this study, Legal Risk is analyzed separately.
Operational Risk includes:
� business disruption, system failure andtechnology failure
� inadequate document retention or record-keeping
� poor management, lack of supervision,accountability and control
� errors in business practices, products,financial models and reports
� deficiency in execution, delivery and processmanagement
� improper employee practices and workplacesafety
� attempts to conceal losses or make personalgains (rogue trading)
· third party fraud (internal and external)
Basel Recommendations:
Historically Banks have accepted Operational Risk as anunavoidable cost of doing business . It is observed that theRisk Managers tend to attribute the losses to the Credit or
Market Risk, (positively due to their selfish reasons), ratherthan map the adverse affects of Operational Risk. Further,many of the Banks do not have the historical database of theloss events, so as to make a meaningful interpolation of theevents and the resultant losses. Knowing this limitation,Basel II preferred to introduce Capital Charge based on GrossIncome, given as under:
i) The Basic Indicator Approach: Banks are expectedto hold Capital for Operational Risk equal to 15%(alpha) of average Annual Gross Income over theprevious three years. Gross income is defined as netinterest income plus net non-interest income excludingrealized profits/losses from the sale of securities inthe banking book and extraordinary or irregular items.
i i ) The Standardized Approach: Bank’s activities arecategorized into 8 Business Lines. The capital chargefor each business line is calculated by multiplyingGross Income by a factor (beta) ranging from 12% to18% assigned to that business line.
iii) The Advanced Measurement Approach: Under thisapproach, the Operational Risk measure generated bythe Bank’s internal data using the quantitative andqualitative criteria is expected to be nearer to theregulatory prescriptions.
Measure of Losses:
There are a large number of events (direct or indirect) thatcould potentially affect a business. No analysis could everconsider all of them. Hence, one way of measuring the possiblelosses would be by interpolating the likelihood of events,through the Probability of Distributions of both frequencyand impact. The stochastic models like Poisson Process canalso be used in frequent events. Making this event structurehelps to answer the modalities, prevention and minimizationof length of impact as well as the mitigation strategy.However, for any Statistical Interpretation to be nearer toreality warrants database over a longer time horizon (5 to 7years), which the Banks do not have.
Preventing Operational Losses
Efficiency is a pre-requisite for operational excellence inbusiness. Inexperienced staffing is the important Risk factorthat leads to unexpected losses. Internal Controls aim tosafeguard the firm’s assets from external and internal threats.The Risk comes from breakdowns in Internal Controls and
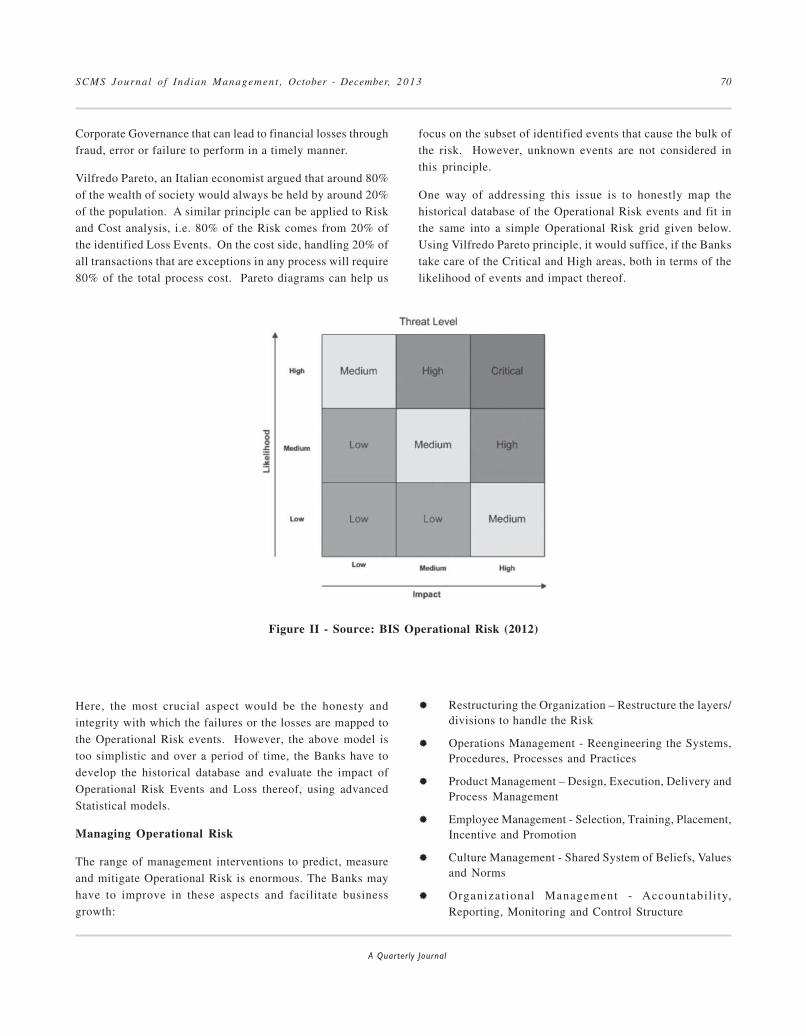
SCMS Journal o f Indian Management , October - December, 2013 70
A Quarterly Journal
Corporate Governance that can lead to financial losses throughfraud, error or failure to perform in a timely manner.
Vilfredo Pareto, an Italian economist argued that around 80%of the wealth of society would always be held by around 20%of the population. A similar principle can be applied to Riskand Cost analysis, i.e. 80% of the Risk comes from 20% ofthe identified Loss Events. On the cost side, handling 20% ofall transactions that are exceptions in any process will require80% of the total process cost. Pareto diagrams can help us
focus on the subset of identified events that cause the bulk ofthe risk. However, unknown events are not considered inthis principle.
One way of addressing this issue is to honestly map thehistorical database of the Operational Risk events and fit inthe same into a simple Operational Risk grid given below.Using Vilfredo Pareto principle, it would suffice, if the Bankstake care of the Critical and High areas, both in terms of thelikelihood of events and impact thereof.
Here, the most crucial aspect would be the honesty andintegrity with which the failures or the losses are mapped tothe Operational Risk events. However, the above model istoo simplistic and over a period of time, the Banks have todevelop the historical database and evaluate the impact ofOperational Risk Events and Loss thereof, using advancedStatistical models.
Managing Operational Risk
The range of management interventions to predict, measureand mitigate Operational Risk is enormous. The Banks mayhave to improve in these aspects and facilitate businessgrowth:
Figure II - Source: BIS Operational Risk (2012)
� Restructuring the Organization – Restructure the layers/divisions to handle the Risk
� Operations Management - Reengineering the Systems,Procedures, Processes and Practices
� Product Management – Design, Execution, Delivery andProcess Management
� Employee Management - Selection, Training, Placement,Incentive and Promotion
� Culture Management - Shared System of Beliefs, Valuesand Norms
� Organizational Management - Accountabil i ty,Reporting, Monitoring and Control Structure

SCMS Journal o f Indian Management , October - December, 2013 71
A Quarterly Journal
� Relationship Management - Shareholders, Investors,Staff, Customers, Competitors, Regulators and Media .
� Total Quality Management - Quality Control, Assuranceand Management
� Document Management – Correct Documentation andDocument Retention and Retrieval
� Audit Management - Risk Based Internal Audit,Inspection, Internal Control and Compliance
� Identifying Potential Risk - abandon High RiskExposures and Contingency Planning
� Boundary Systems – Setting Risk Limits for Discretionand Sanction
� Securi ty Management – Personnel , Computers,Systems, Technology and Other Assets
� Changing the form of Risk - Use of Margin and CollateralThird Party Guarantees
� Hedging - Sales, Transfer , Insurance, ForwardContracts/Futures/Swaps/Options
� Pareto Analysis, Fault Tree analysis, Fish BoneDiagrams and Process Maps
Strategic Risk
A Strategic Risk is borne out of inadequate understanding ofthe perceptions of the consumers, market and market makers.Generally, the new products do not take off on the expectedlines not because they are bad, but mainly because theOrganizational Structure and Operating Staff are not fullyequipped to meet the new challenges. The following wouldhelp ignite business growth:
i) Strategy Formulation: Conducting scan of key externalopportunities and threats, an internal audit of thestrengths/weaknesses, formulation of vision statementand long-term objectives.
ii) Strategy Implementation: Modificat ion oforganizational structures and processes to achieveplanned results. Establishment of annual goals/policies,the allocation of resources to obtain objectives andadjusting motivation and reward systems to bettermatch new strategic thrusts.
iii) Strategy Evaluation: Control Processes, which includereview and feedback to determine if plans, strategiesand objectives are being achieved, to facilitate correctiveaction.
The Banks may have to address the following issues to reducethe impact of Strategic Risk and help business growth of theBanks:
� Knowledge of the perceptions of the consumers,market and market makers.
� Recognizing and avoiding the Risks from undesirableemployee behaviour
� Maintaining the creative tension between HighInnovation and Risk Management
� Integrat ing Risk Management into strategyformulation and execution processes
� Managing the Risks from external and non-controllable events
� Responding to reputational and brand Risks
� Corporate Governance and Organizat ionalDevelopment
Reputational Risk
For service organizations like Banks, reputation is the basicfoundation of business. As Warren Buffett rightly puts, ‘ittakes 20 years to build a reputation and 5 minutes to ruin it.’Customer Delight is the key for building a Bank’s reputation.It has been a well established norm that it is 4 times costlierto attract a new customer, as compared to retaining the existingcustomer. Reputation Risk has a cost which is difficult tomeasure immediately, but its impact is seen over a period oftime. While there is no cardinal method to measure the impactof Reputation Risk, the following remedial actions couldreduce its impact and help business growth of the Banks:
i) Vision Expansion: Banks have to draw upon the bestpractices followed by other risk-heavy businesses likeconsumer goods or automotive sector, which have largesupply chains.
ii) Employee Belief: The quality of work of employees,both on the Bank’s payroll or outsourcing partners has adirect bearing on its reputation. Banks should sensitizethe employees to the fact that any slip-up on their partcould adversely affect their goodwill.
iii) Employee Satisfaction: Banks have to follow transparentpolicies which are sensitive to the needs of the workforceand treat them as partners in the organizat iondevelopment.

SCMS Journal o f Indian Management , October - December, 2013 72
A Quarterly Journal
iv) Knowledge Banks: The staff be made aware, throughtraining or otherwise, of the historical cases/precedentsthat had or would have jeopardized the reputation of theBank.
v) Enterprise-wide Solution: Enterprise-wide solutions haveto be drawn giving a holistic view of organizational risks,early distress signals, enabling timely problem resolution.
vi) Analytics: Banks have to use analytics to sift throughthe mounds of information for managing Reputation Risk.Despite adequate data, not much has been done in thisdirection.
vii) Social Media: Banks have to leverage the social mediaplatform to initiate customer engagement programs aspart of their reputation building measure.
Political Risk
The Political Risk refers to the possibility that Banks maylose or makes less money than expected due to politicaldecisions, conditions or events occurring in the countries onwhich they have taken the exposures. The main problemsareas could be government instability, political interference,legal impediments, regulatory prescriptions, nationalization,level of convertibility of the currency and socio-culturalconditions & compulsions.
The Political Risk is country specific and subjectivelydifferent depending upon the country’s socio-economicconditions and sovereign policies. Historical mapping of thecountry, economic policies, social compulsions and balanceof payments etc. would be very useful in assessing the healthof the country and severity of the Political Risk. SovereignRatings made by International Credit Assessment Institutionslike Standard and Poor’s, Moody’s and Fitch-IBCA can alsobe benchmarked for this purpose. Despite the best ofinformation, it is rather difficult to correctly assess the impactof the Political Risk, which is more of an unsystemic risk.Hence, Banks are content with setting the relative Risk Limits,which appears to be a practical solution as of now.
Legal Risk
Banking transactions primarily rest on a concept known as‘Banker ’s Faith,’ where the customer conducts histransactions with the Bank, simply because he/she believesthat the Banker has no malafide or other intentions. We needto appreciate that not everything can be done purely on the
basis of faith, more so in the light of complex and multi-
dimensional banking activities giving rise to the aspect of
legal protection in case of a future dispute. Legal Risk is
borne out of improper or inadequate documentation, which
may not stand the scrutiny of law of the land.
Hence, it is imperative that the Banks review the legality of
the documents being exchanged by them with the customers,
in consonance with the law of the land. Banks may revise the
documents, if considered necessary. This one-time exercise
(which is very cost-effective) would go a long way in
protecting the interests of the Bank, in case of failure of the
exposures or a future dispute.
The main crux of the problem is not in the ‘quality’ of the
documents, but in the ability of the operating personnel who
execute the documents on behalf of the Bank. In a study of
the legal cases being handled by the Banks it is observed that,
in many a case, the Banks have lost the cases in the Courts of
Law on account of execution of improper or inadequate
documents. Hence, Banks have to keep their operating
personnel abreast of the developments and changes in the law
of the land and also update the documentation process on an
on-going basis. Risk Based Internal Audit would also be of
immense help in preventing such future disasters. These
measures would help Banks in avoiding the possible and potent
Legal Risk and facilitate a healthy business growth.
Cyclical Risk
Every economic activity is affected by business cycles leading
to Cyclical Risk and Banking can be no exception. Banking is
invariably affected by the peak and trough of a business or
other economic cycle. Cyclical Risk does not typically have
a tangible measure, but instead is reflected in the prices or
valuations of assets that are deemed to have higher or lower
Cyclical Risks than the market. Inflation and Deflation also
have a cascading adverse affect on this. Basel III, sensing the
difficulty in mapping this intangible risk, has suggested
adequate buffer capital to meet the adversities arising out of
Cyclical Risks. Apart from this, Banks have to draw up the
business plans in tandem with business cycles, so as to capture
the right business at the right time and thus ensure continuity
of business growth.
Idiosyncratic Risk
Idiosyncratic Risk in banking parlance is defined as the Risk
inherent in a particular Bank. Every Bank suffers from

SCMS Journal o f Indian Management , October - December, 2013 73
A Quarterly Journal
Idiosyncratic Risk, due the ill effects of the legacy or practicesand not-so-robust Risk Management Framework. SinceIdiosyncratic Risk generally is unpredictable, the Banksshould seek to minimize its negative impact on a portfolio bydiversification or hedging. Idiosyncratic Risk is imbibed intothe Bank. Bank can rarely come out of it in a shorter horizonand no amount of diversification or hedging would protect itfrom its adverse impact.
Basel III, aware of this reality has suggested adequate Buffercapital to meet the adversities arising out of IdiosyncraticRisk. Banks, in their own interest, have to evaluate theirinadequacies and maintain sufficient buffer capital over andabove Basel definition. An honest ICAAP Policy wouldfacilitate a realistic picture of the inadequacies the Bank issuffering from. One way to address this issue would be toreengineer the systems, procedures and processes and educate& motivate the employees, so as to reduce its impact andthus ensure stability in business growth.
Systemic Risk
Systemic Risk in banking industry is referred to as the sumtotal of the risks the particular banking industry is facing andcan be generated by a variety of sources. It is also known asAggregate Risk, which is generally borne out of the fiscal,monetary and regulatory policies of the Country. In somecases, shocks from phenomena like weather and naturaldisasters have their impact on this. Basel III, accepting thisas a necessary evil of the Banking Industry has suggestedadequate buffer capital to meet the adversities arising out ofSystemic Risk.
Conclusions & Recommendations
The Banks have to put in place the following to reduce theimpact of non-financial risks, which would go a long way inimproving the Business and Growth of the Banks and alsomake them globally competitive.
� Update the Skill Levels of the Employees
� Strengthen the value system of the Employees
� Map the perceptions of the Market and MarketMakers
� Reengineer the Systems & Procedures
� Strengthen the MIS and Data capturing capabilities
� Augment adequate good quality Capital
� Improve Corporate Governance, Monitoring andOversight
� Map a real is t ic Internal Capital AdequacyAssessment Process Policy
� Increase integrity in mapping the Risks
� Develop mechanisms to quantify the impact of theRisks and
� Initiate suitable remedial measures to mitigate theRisks
Bibliography
Acharya, V., and M.Richardson, (Eds.). Restoring financial
stability: how to repair a failed system, Vol. 542,2009,Wiley Publications.
Ahmed Arif and Ahmed Nauman Anees, “Liquidity risk andperformance of banking system,” Emerald : Journal of
Financial Regulation and Compliance, Vol. 20 , No. 2,2012, 182-195.
Akkizidis, I. S., and V. Bouchereau, Guide to optimal
operational risk and Basel II, 2009, CRC (ChristoffersonRobb & Company) Press.
Alam, I. M. S. “A non-parametric approach for assessingproductivity dynamics of large bank,” Journal of Money,
Credit, and Banking, Vol. 33, No. 2, Feb 2001 , 121-139.
Alberto Burchi “Capital Requirements for Market Risks:Value-at-Risk Models and Stressed-VaR after thefinancial crisis,” Journal of Financial Regulation and
Compliance, Vol. 21, No. 3, 2013, 284-304.
Ammann, M. Credit risk valuation: Methods, models, and
applications, Berlin: Springer-Verlag, 2001, 47-74.
Anthony Loviscek and Elven Riley “ The Impact of the GlobalFinancial Crisis on Firm-Level Risk of the S&P 500,”Managerial Finance, Vol. 39, No. 7, 2013, 641 - 652.
Bank for International Settlement (BIS), International
Convergence of Capital Measurement and Capital
Standards, BIS Press, Basel, July 1988.
Bank of England, Financial Stability Report, Bank of England,
London, No. 29, June 2011 .
Banks, Systematic Risk, and Industrial Concentration: Theory
and Evidence Arne Kildegaard Universidad de
Guanajuato, Peter M. Williams University of North
Alabama.

SCMS Journal o f Indian Management , October - December, 2013 74
A Quarterly Journal
Barfield, R., S. Du Plessis, and P. Fell , “Basel III –implications for risk management and supervision,”Compliance Officer Bulletin, Vol. 89, 2011, 1-26.
Barth, J.R., Nolle, D.E., T.Phumiwasana, and G.Yago, “Across-country analysis of the bank supervisoryframework and bank performances, Financial Marketsand Institution and Instruments, Vol. 12, No. 2, 2003,67-120.
Basel Committee on Banking Supervision, Amendment to theCapital Accord to incorporate Market Risks, January,1996.
Basel Committee on Banking Supervision, Implementation ofBasel II, Practical Considerations, July 2004.
Basel Committee on Banking Supervision, Sound Practicesfor the Management and Supervision of OperationalRisk, February 2003.
Basel II Framework brought out by Bank for InternationalSettlements (BIS) in June 2011.
Basel II Framework brought out by Bank for InternationalSettlements (BIS) in June 2012.
Basel III: International Framework for Liquidity RiskMeasurement, Standards and Monitoring, Bank forInternational Settlements, December 2010.
Financial Innovations, Idiosyncratic Risk and the JointEvolution of Real and Financial Volatilities, J. ChristinaWang, Federal Reserve Bank of Boston, November 2006.
International Convergence of Capital Measurement and
Capital Standards, Basel Committee on Banking
Supervision, July 1988.
International Convergence of Capital Measurement and
Capital Standards: A Revised Framework
Comprehensive Version, Bank for International
Settlements, June, 2006.
Jones, David, “Emerging problems with the Basel Capital
Accord: Regulatory Capital Arbitrage and Related
Issues.” Journal of Banking & Finance, Vol. 24, No. (1-
2), 2000, 35–58.
Shamshad, Akhtar. “Demystifying Basel-II.” Journal of
Islamic Banking and Finance. 2006.
Shedding Light on Non-Financial Risks – a European Survey,
EDHEC-Risk Institute, January 2012.
The Banks battle back, a behind-the-scenes brawl over new
Capital and Liquidity Rules, Economist, May 2010.
The Global Implementation of Basel-II: Prospects and
Outstanding Problems, International Developments in
Financial Regulations Discussion Paper, Conford
Andrew, Financial Market Center, June 2005.
The International Convergence of Capital Measurement and
Capital Standards, A Revised Framework, Bank for
International Settlements, June 2004.

SCMS Journal o f Indian Management , October - December, 2013 75
A Quarterly Journal
Key words: Global competitiveness, Passenger Car, market share.
Atul Mittal, MBA student, Asia-Pacific Institute of Management,New Delhi-25., E-mail:[email protected], Mob.: 09716573967
Dr. Paroma Mitra Mukherjee, Assistant Professor, Asia-PacificInstitute of Management, New Delhi- 25.E-mail: [email protected], Mob.: 09871910557
Dr. Dilip Roy, Ex- Director, Center for Management Studies,University of Burdwan, Golapbag,Burdwan, West Bengal. Mob. : 09832157221, E-mail: [email protected]
Global Competitiveness:
World Passenger Car Industry
lobalization and trade liberalization along with easy
flow of information and advancement in
communications technology have resulted in an
increase of market competition worldwide. With this
background, Porter (1998) stressed upon the urgency of
strengthening competence of nations, countries and firms to
handle the resultant threats. According to Haider (2007),meaning, implication, adaptation and achievement of
competitiveness may vary from firm to firm, industry to
industry and nation to nation across the world. The World
Economic Forum since 2005, has based its competitiveness
analysis on the Global Competitiveness Index (GCI), a
comprehensive tool that measures the microeconomic and
macroeconomic foundations of national competitiveness. They
define competitiveness as the set of institutions, policies,
and factors that determine the level of productivity of a
country. According to Global Competition Report 2012-13, Switzerland is the leading country and is followed by
Abstract
The degree of competition helps to examine the present status and future prospects of an industry. In view of the growing
demand for quantification of competitive factor prevailing in a product field, a measure for the degree of competition
based on the market shares of the existing player in passenger car has been studied in this article. Time series analysis has
been carried out on degree of competition to indicate the past trend and future direction for this industry. The position of
India has also been indicted along with those of a few leading nations. We have used statistical techniques to analyze the
situation of various Passenger Car production countries.
G
,
Atul Mittal, Paroma Mitra Mukherjee, and Dilip Roy

SCMS Journal o f Indian Management , October - December, 2013 76
A Quarterly Journal
Singapore, Finland, Sweden, Netherland, Germany, and UnitedStates in the stated order. India ranks 59th amongst 144economies in the Global Competitiveness Index for 2012-13,as against 56th position out of 142 economies covered in 2011-12. GCI is constructed based on 12 pillars of competitiveness.These pillars are institution, infrastructure, macroeconomicstability, health and primary education, higher education andtraining, goods market efficiency, labour market efficiency,financial market sophistication, technological readiness,market size, business sophistication and innovation.
The twelve pillars may be grouped into three parts:
a) Basic requirement sub index where the pillarsinstitution, infrastructure, macroeconomic stability,health and primary education, are measured. Theweight for India is 60%.
b) Efficiency enhancer sub index where highereducation and training, goods market efficiency,labour market eff iciency, f inancial marketsophistication, technological readiness, market sizeare the pillars. The weight for India is 35%.
c) Innovation and sophistication factors sub indexwhere business sophistication and innovation arethe pillars. The weight for India is 5%.
India’s performance with a GCI score of 4.32 (on a scale of 1-7) in the year 2012-13 is an improvement over last year scoreof 4.30. India has also improved its performance in respect ofeach individual component of the index.
Based on due end result one may make an attempt to measurethe degree of competition. Roy D (2006) proposed the formulafor degree of competition as where m
i is the market share the
ith nation /industry. Data requirement being less, it is easy tocarry out industry analysis based on market share basedmeasure.
Why automotive industry?
The automotive industry is an important global driver ofgrowth, income, employment, and innovation. This industryenables a degree of flexibility and mobility that was undreamedof even a century ago. Though the size of this industry issmall compared to the overall activity of the economy yetbecause of its strong linkages with other parts of the economyit has a significant impact on the economy. For developedcountries, the automobile is the primary mode of
transportation. For many decades, the automobile productionwas led by United States. Before the Great Depression in1929, the world had 32,028,500 automobiles in use, and theUS automobile industry produced over 90% of them. At thattime, the US had one car per 4.87 persons. After World War IIthe US covered 3/4 of world’s auto production. In 1980, theUS was overtaken by Japan and became world’s leader againin 1994. In 2006, Japan narrowly overtook US in carproduction and held the first rank until 2008. In 2009 Chinatook the lead with a difference of around 6 million units withJapan. In 2012, in the total production of vehicle Chinaproduced 19.3 million units which were nearly twice thenumber of automobiles made by USA with second position(10.3million units), followed by Japan in third place with 9.9million units. Germany was in fourth place with 5.6 millionunits and S.Korea in fifth rank by 4.6 million units. India wasin sixth rank by 4.1 million units.
Motor vehicle productions can be grouped into passengerproduction of car, light commercial vehicles, heavy trucks,buses and coaches. Cars make up approximately 74% of thetotal motor vehicle annual production in the world. Theremaining 26% is for others. In this paper, we are going tostudy only the global passenger car production and itscompetitiveness along with the position of India and theoverall trend of this industry.
THE OBJECTIVE OF THE STUDY
The global production figures of passenger car industry canhelp us to indicate the position of Indian companies withrespect to its global competitors. The objective of this paperis therefore to measure the global competitiveness among thepassenger car producing countries for the period 1999 to 2012.We want to analyze whether it maintains the same trend ornot.
LITERATURE REVIEW
Porter (1990, 1998) claimed that nations have their owncompeti t ive advantages in the modern competi t ivemarketplace. A nation’s competitiveness depends on thecapacity of its industry to innovate and upgrade. Companiesgain edge over the world’s best competitors only underpressure and challenge. They also gain advantage from havingstrong domestic rivals, aggressive home-based suppliers, anddemanding local customers. Since the basis for globalcompetition has shifted more and more towards the creationand assimilation of knowledge, the role of the nation has come
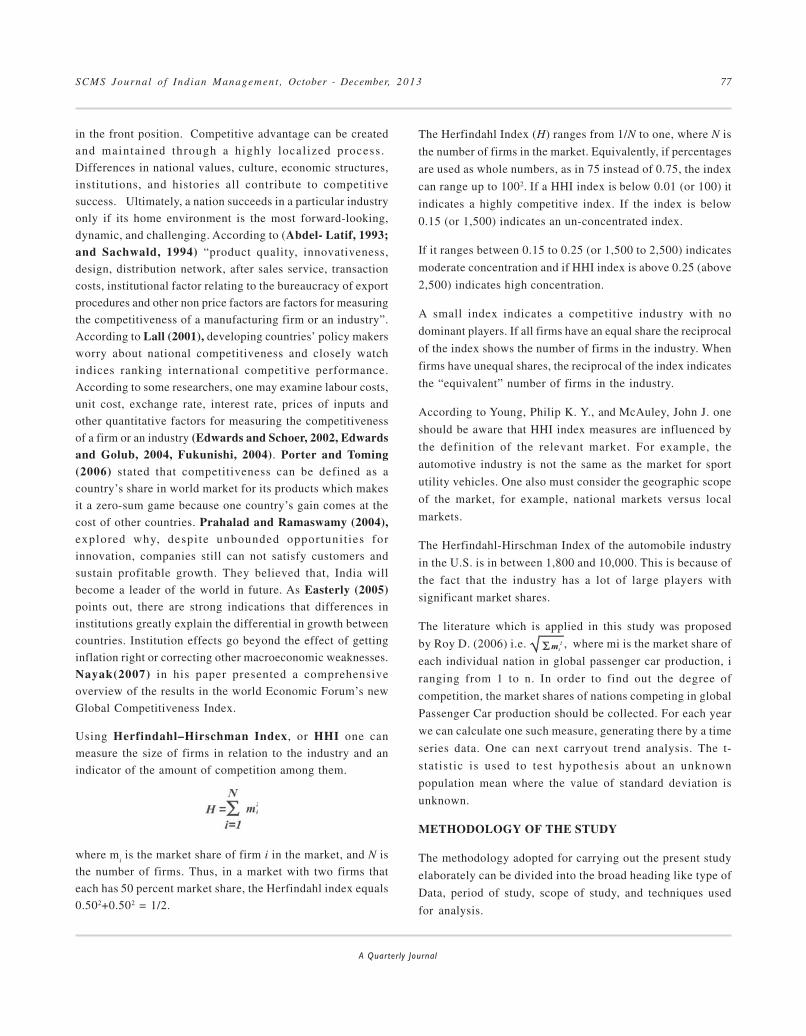
SCMS Journal o f Indian Management , October - December, 2013 77
A Quarterly Journal
in the front position. Competitive advantage can be created
and maintained through a highly local ized process.
Differences in national values, culture, economic structures,
institutions, and histories all contribute to competitive
success. Ultimately, a nation succeeds in a particular industry
only if its home environment is the most forward-looking,
dynamic, and challenging. According to (Abdel- Latif, 1993;and Sachwald, 1994) “product quality, innovativeness,
design, distribution network, after sales service, transaction
costs, institutional factor relating to the bureaucracy of export
procedures and other non price factors are factors for measuring
the competitiveness of a manufacturing firm or an industry”.
According to Lall (2001), developing countries’ policy makers
worry about national competitiveness and closely watch
indices ranking international competitive performance.
According to some researchers, one may examine labour costs,
unit cost, exchange rate, interest rate, prices of inputs and
other quantitative factors for measuring the competitiveness
of a firm or an industry (Edwards and Schoer, 2002, Edwardsand Golub, 2004, Fukunishi, 2004). Porter and Toming(2006) stated that competitiveness can be defined as a
country’s share in world market for its products which makes
it a zero-sum game because one country’s gain comes at the
cost of other countries. Prahalad and Ramaswamy (2004),explored why, despite unbounded opportunit ies for
innovation, companies still can not satisfy customers and
sustain profitable growth. They believed that, India will
become a leader of the world in future. As Easterly (2005)points out, there are strong indications that differences in
institutions greatly explain the differential in growth between
countries. Institution effects go beyond the effect of getting
inflation right or correcting other macroeconomic weaknesses.
Nayak(2007) in his paper presented a comprehensive
overview of the results in the world Economic Forum’s new
Global Competitiveness Index.
Using Herfindahl–Hirschman Index, or HHI one can
measure the size of firms in relation to the industry and an
indicator of the amount of competition among them.
where mi is the market share of firm i in the market, and N is
the number of firms. Thus, in a market with two firms that
each has 50 percent market share, the Herfindahl index equals
0.502+0.502 = 1/2.
The Herfindahl Index (H) ranges from 1/N to one, where N is
the number of firms in the market. Equivalently, if percentages
are used as whole numbers, as in 75 instead of 0.75, the index
can range up to 1002. If a HHI index is below 0.01 (or 100) it
indicates a highly competitive index. If the index is below
0.15 (or 1,500) indicates an un-concentrated index.
If it ranges between 0.15 to 0.25 (or 1,500 to 2,500) indicates
moderate concentration and if HHI index is above 0.25 (above
2,500) indicates high concentration.
A small index indicates a competitive industry with no
dominant players. If all firms have an equal share the reciprocal
of the index shows the number of firms in the industry. When
firms have unequal shares, the reciprocal of the index indicates
the “equivalent” number of firms in the industry.
According to Young, Philip K. Y., and McAuley, John J. one
should be aware that HHI index measures are influenced by
the definition of the relevant market. For example, the
automotive industry is not the same as the market for sport
utility vehicles. One also must consider the geographic scope
of the market, for example, national markets versus local
markets.
The Herfindahl-Hirschman Index of the automobile industry
in the U.S. is in between 1,800 and 10,000. This is because of
the fact that the industry has a lot of large players with
significant market shares.
The literature which is applied in this study was proposed
by Roy D. (2006) i.e. m 2i, where mi is the market share of
each individual nation in global passenger car production, i
ranging from 1 to n. In order to find out the degree of
competition, the market shares of nations competing in global
Passenger Car production should be collected. For each year
we can calculate one such measure, generating there by a time
series data. One can next carryout trend analysis. The t-
statistic is used to test hypothesis about an unknown
population mean where the value of standard deviation is
unknown.
METHODOLOGY OF THE STUDY
The methodology adopted for carrying out the present study
elaborately can be divided into the broad heading like type of
Data, period of study, scope of study, and techniques used
for analysis.

SCMS Journal o f Indian Management , October - December, 2013 78
A Quarterly Journal
Types of Data
In this paper, the data type we have used is secondary data.The data collected from website of International Organizationof Motor Vehicle Manufacture (IOMVM), World AutomobileOrganization.
Period of Study
The period from 1999- 2012 has been selected depending onthe availability of secondary data.
Scope of study
This study will help researchers, economists, and companyplanners and others to measure the degree of globalcompetitiveness in their respective studies.
Techniques used for analysis
The analysis deals with descriptive analysis and statisticalanalysis. The statistical analysis is to find out the trend indegree of competition among the global competing countriesin passenger car manufacturing. The correspondinghypothesis follows the null hypothesis Ho that there is noincrease in the global competition in the passenger carmanufacturing against the alternative hypothesis Ha that thereis increase or decrease in the same.
Test statistic: The under lying statistic for testing forsignificance of regression coefficient is t- statistic. The t-statistic is used to test hypothesis about an unknownpopulation mean where the value of standard deviation isunknown. The formula for the t- statistic is
where,
yi is the ith observation on the α dependent variable.
xi is the ith observation on the independent variable.
is the estimated intercept
is the estimated regression coefficient or slope.
n is the number of observation.
For our study y represents the degree of competition and xrepresents the time.
Sequence of our analysis: While trying to measure the degreeand nature of global competition among the passenger carproducing countries, we first started with taking the majorpassenger car producing countries. We have collected timeseries data of production of major passenger car producingcountries from 2001 to 2011. For simplicity, we havepresented only the production data of top eleven majorpassenger car producing countries in the world. Rank-wisewe have selected eleven countries viz. China, Japan, UnitedStates, Russia, South Korea, Germany, India, France, Mexico,Spain and Brazil. Then we have calculated their market shares.We have next calculated squares of these individual marketshares for a particular year and then added those squares toget for that year. The entire process can be repeated forobtaining for all the years. Next, we have calculated the
value of (1- )m 2i to obtain the degree of competition for all
the years. All those (1- )m 2i values calculated for the period
under study have given rise to a time series data on the degreeof competition. We have next plotted these values againsttime to get an idea about the trend equation to find out if thecompetition is stable, increasing or decreasing.
DESCRIPTIVE ANALYSIS
The following data represents the production figure of worldpassenger car from 1999 to 2012, followed by their respectivemarket shares and their squares.

SCMS Journal o f Indian Management , October - December, 2013 79
A Quarterly Journal
Table 1: The production of world passenger car from 1999 to 2012
Country 1999 2000 2001 2002 2003 2004 2005 2006 2007 2008 2009 2010 2011 2012
China 565366 604677 703,521 1,101,696 2,018,875 2,480,231 3,078,153 5,233,132 6,381,116 6,737,745 10,383,831 13,897,083 14,485,326 15,523,658
Japan 8100169 8359434 8,117,563 8,618,354 8,478,328 8,720,385 9,016,735 9,756,515 9,944,637 9,928,143 6,862,161 8,310,362 7,158,525 8,554,219
Germany 5309524 5131918 5,301,189 5,123,238 5,145,403 5,192,101 5,350,187 5,398,508 5,709,139 5,532,030 4,964,523 5,552,409 5,871,918 5,388,456
S. Korea 2361735 2602008 2,471,444 2,651,273 2,767,716 3,122,600 3,357,094 3,489,136 3,723,482 3,450,478 3,158,417 3,866,206 4,221,617 4,167,089
USA 5637949 5542217 4,879,119 5,018,777 4,510,469 4,229,625 4,321,272 4,366,220 3,924,268 3,776,641 2,195,588 2,731,105 2,966,133 4,105,853
India 533149 517957 654,557 703,948 907,968 1,178,354 1,264,000 1,473,000 1,713,479 1,846,051 2,175,220 2,831,542 3,038,332 3,285,496
Brazil 1107751 1351998 1,501,586 1,520,285 1,505,139 1,862,780 2,009,494 2,092,029 2,391,354 2,545,729 2,575,418 2,584,690 2,534,534 2,623,704
Russia 943732 969235 1,021,682 980,061 1,010,436 1,110,079 1,068,145 1,177,918 1,288,652 1,469,429 599,265 1,208,362 1,738,163 1,968,789
Mexico 993772 1279089 1,000,715 960,097 774,048 903,313 989,840 1,097,619 1,209,097 1,217,458 942,876 1,386,148 1,657,080 1,810,007
France 2784469 2879810 3,181,549 3,292,797 3,220,329 3,227,416 3,112,961 2,723,196 2,550,869 2,145,935 1,189,497 1,924,171 1,931,030 1,682,814
Spain 2281617 2366359 2,211,172 2,266,902 2,399,374 2,402,501 2,098,168 2,078,639 2,195,780 1,943,049 1,812,688 1,913,513 1,819,453 1,539,680
Other 9140614 9610951 8,781,791 9,120,966 9,230,581 10,124,883 11,196,929 11,032,666 12,169,473 12,133,429 10,913,114 12,136,112 12,448,727 12,419,776
Total 39759847 41215653 39,825,888 41,358,394 41,968,666 44,554,268 46,862,978 49,918,578 53,201,346 52,726,117 47,772,598 58,341,703 59,870,838 63,069,541
Source: International Organization of Motor Vehicle Manufacture (http://oica.net/category/production-statistics/)
Table 2: The market share for top producing countries year wise.
Country 1999 2000 2001 2002 2003 2004 2005 2006 2007 2008 2009 2010 2011 2012
China 0.014 0.015 0.018 0.027 0.048 0.056 0.066 0.105 0.120 0.128 0.217 0.238 0.242 0.246
Japan 0.204 0.203 0.204 0.208 0.202 0.196 0.192 0.195 0.187 0.188 0.144 0.142 0.120 0.136
Germany 0.134 0.125 0.133 0.124 0.123 0.117 0.114 0.108 0.107 0.105 0.104 0.095 0.098 0.085
S. Korea 0.059 0.063 0.062 0.064 0.066 0.070 0.072 0.070 0.070 0.065 0.066 0.066 0.071 0.066
USA 0.142 0.134 0.123 0.121 0.107 0.095 0.092 0.087 0.074 0.072 0.046 0.047 0.050 0.065
India 0.013 0.013 0.016 0.017 0.022 0.026 0.027 0.030 0.032 0.035 0.046 0.049 0.051 0.052
Brazil 0.028 0.033 0.038 0.037 0.036 0.042 0.043 0.042 0.045 0.048 0.054 0.044 0.042 0.042
Russia 0.024 0.024 0.026 0.024 0.024 0.025 0.023 0.024 0.024 0.028 0.013 0.021 0.029 0.031
Mexico 0.025 0.031 0.025 0.023 0.018 0.020 0.021 0.022 0.023 0.023 0.020 0.024 0.028 0.029
France 0.07 0.07 0.080 0.080 0.077 0.072 0.066 0.055 0.048 0.041 0.025 0.033 0.032 0.027
Spain 0.057 0.057 0.056 0.055 0.057 0.054 0.045 0.042 0.041 0.037 0.038 0.033 0.030 0.024
Other 0.23 0.233 0.221 0.221 0.220 0.227 0.239 0.221 0.229 0.230 0.228 0.208 0.208 0.197
Total 1 1 1 1 1 1 1 1 1 1 1 1 1 1
Source: Derived from Table No. 1
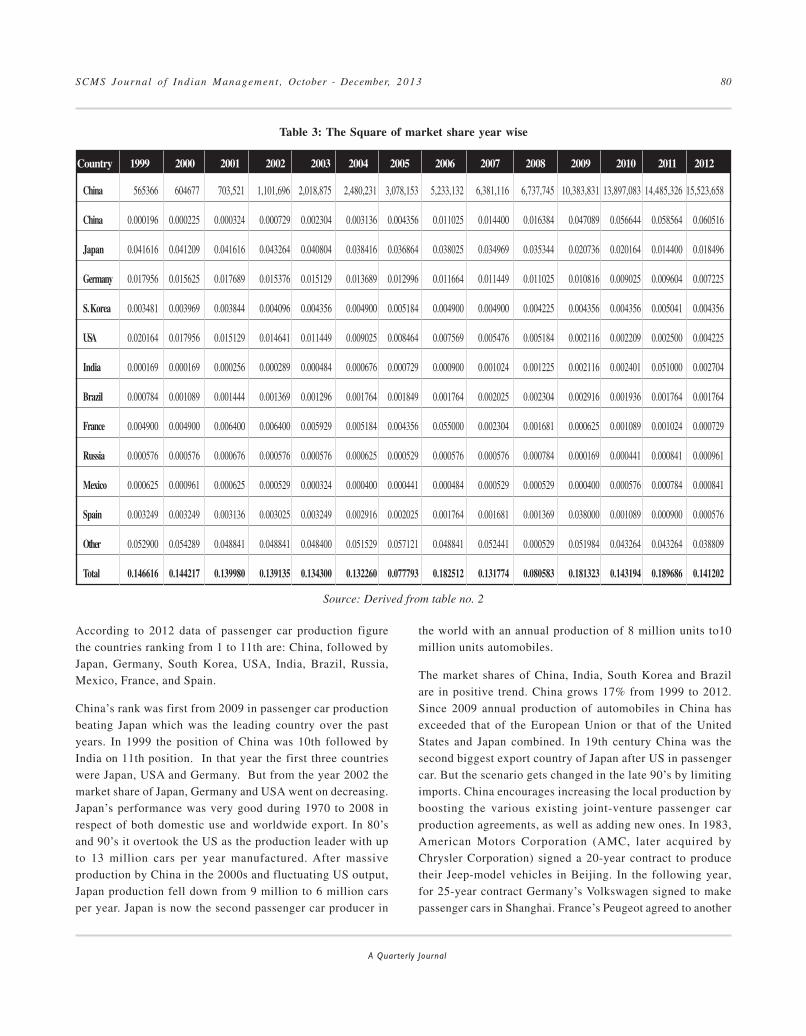
SCMS Journal o f Indian Management , October - December, 2013 80
A Quarterly Journal
According to 2012 data of passenger car production figurethe countries ranking from 1 to 11th are: China, followed byJapan, Germany, South Korea, USA, India, Brazil, Russia,Mexico, France, and Spain.
China’s rank was first from 2009 in passenger car productionbeating Japan which was the leading country over the pastyears. In 1999 the position of China was 10th followed byIndia on 11th position. In that year the first three countrieswere Japan, USA and Germany. But from the year 2002 themarket share of Japan, Germany and USA went on decreasing.Japan’s performance was very good during 1970 to 2008 inrespect of both domestic use and worldwide export. In 80’sand 90’s it overtook the US as the production leader with upto 13 million cars per year manufactured. After massiveproduction by China in the 2000s and fluctuating US output,Japan production fell down from 9 million to 6 million carsper year. Japan is now the second passenger car producer in
Table 3: The Square of market share year wise
Country 1999 2000 2001 2002 2003 2004 2005 2006 2007 2008 2009 2010 2011 2012
China 565366 604677 703,521 1,101,696 2,018,875 2,480,231 3,078,153 5,233,132 6,381,116 6,737,745 10,383,831 13,897,083 14,485,326 15,523,658
China 0.000196 0.000225 0.000324 0.000729 0.002304 0.003136 0.004356 0.011025 0.014400 0.016384 0.047089 0.056644 0.058564 0.060516
Japan 0.041616 0.041209 0.041616 0.043264 0.040804 0.038416 0.036864 0.038025 0.034969 0.035344 0.020736 0.020164 0.014400 0.018496
Germany 0.017956 0.015625 0.017689 0.015376 0.015129 0.013689 0.012996 0.011664 0.011449 0.011025 0.010816 0.009025 0.009604 0.007225
S. Korea 0.003481 0.003969 0.003844 0.004096 0.004356 0.004900 0.005184 0.004900 0.004900 0.004225 0.004356 0.004356 0.005041 0.004356
USA 0.020164 0.017956 0.015129 0.014641 0.011449 0.009025 0.008464 0.007569 0.005476 0.005184 0.002116 0.002209 0.002500 0.004225
India 0.000169 0.000169 0.000256 0.000289 0.000484 0.000676 0.000729 0.000900 0.001024 0.001225 0.002116 0.002401 0.051000 0.002704
Brazil 0.000784 0.001089 0.001444 0.001369 0.001296 0.001764 0.001849 0.001764 0.002025 0.002304 0.002916 0.001936 0.001764 0.001764
France 0.004900 0.004900 0.006400 0.006400 0.005929 0.005184 0.004356 0.055000 0.002304 0.001681 0.000625 0.001089 0.001024 0.000729
Russia 0.000576 0.000576 0.000676 0.000576 0.000576 0.000625 0.000529 0.000576 0.000576 0.000784 0.000169 0.000441 0.000841 0.000961
Mexico 0.000625 0.000961 0.000625 0.000529 0.000324 0.000400 0.000441 0.000484 0.000529 0.000529 0.000400 0.000576 0.000784 0.000841
Spain 0.003249 0.003249 0.003136 0.003025 0.003249 0.002916 0.002025 0.001764 0.001681 0.001369 0.038000 0.001089 0.000900 0.000576
Other 0.052900 0.054289 0.048841 0.048841 0.048400 0.051529 0.057121 0.048841 0.052441 0.000529 0.051984 0.043264 0.043264 0.038809
Total 0.146616 0.144217 0.139980 0.139135 0.134300 0.132260 0.077793 0.182512 0.131774 0.080583 0.181323 0.143194 0.189686 0.141202
Source: Derived from table no. 2
the world with an annual production of 8 million units to10million units automobiles.
The market shares of China, India, South Korea and Brazilare in positive trend. China grows 17% from 1999 to 2012.Since 2009 annual production of automobiles in China hasexceeded that of the European Union or that of the UnitedStates and Japan combined. In 19th century China was thesecond biggest export country of Japan after US in passengercar. But the scenario gets changed in the late 90’s by limitingimports. China encourages increasing the local production byboosting the various existing joint-venture passenger carproduction agreements, as well as adding new ones. In 1983,American Motors Corporation (AMC, later acquired byChrysler Corporation) signed a 20-year contract to producetheir Jeep-model vehicles in Beijing. In the following year,for 25-year contract Germany’s Volkswagen signed to makepassenger cars in Shanghai. France’s Peugeot agreed to another

SCMS Journal o f Indian Management , October - December, 2013 81
A Quarterly Journal
fell down particularly due to old and new competition fromSouth Korea, China and India. Nevertheless, Japan’s carindustry continues to flourish, its market share has risen again,and in the first quarter of 2008 Toyota surpassed AmericanGeneral Motors to become the world’s largest carmanufacturer. The United States is also the home to threelarge vehicle manufacturers: General Motors, Ford MotorCompany and Chrysler, which have historically been referredto as the “Big Three.”
Russia and Mexico are having constant market share trends.
STATISTICAL STUDY OF WORLD PASSENGER CARPRODUCTION
The original time series data set on global passenger carproduction have been used to study the trend in competitionfrom 2001 to 2011. The formula to be used for measuring the
degree of competition is (1- )m 2i , where mi is the market
share of the ith country. In Table 3 we have calculated the mi2derived from Table 2 for each country for each year. To examinethe trend of competition over the years for detecting anychange in the degree of competition in global Passenger Car
production, we would like to plot the values of (1- )m 2i
over the years, which can be observed in Table 4.
passenger car project to make vehicles in the prosperous
southern city of Guangzhou. These early joint ventures did
not allow the Chinese to borrow much foreign technology, as
knock-down-kit (a kit containing the parts needed to assemble
a product) may not have been allowed to slip past borders.
Few more big and small joint-ventures turned the passenger
car production in China in a positive way.
India overtook Brazil and became the sixth largest passenger
vehicle producer in the world (beating such old and new auto
makers as Belgium, United Kingdom, Italy, Canada, Mexico,
Russia, Spain, France, Brazil), grew from 16% to 18% to sell
around three million units in the course of 2011-12. In 2009,
India emerged as Asia’s fourth largest exporter of passenger
cars, and is behind Japan, South Korea, and Thailand. In 2010,
India beat Thailand to become Asia’s third largest exporter of
passenger cars. The market share of India rose from 1.3% to
5.2 %.
Japan, USA and Germany are having a negative trend in market
share in the said period, though Japanese manufacturers
produced very affordable, rel iable, and popular cars
throughout the 1990s. Japan who was the leader for many
years in passenger car industry from 2009 its market share
1999 0.146616 0.853384 0.92378785
2000 0.144217 0.855783 0.9250854
2001 0.139980 0.860020 0.92737263
2002 0.139135 0.860865 0.92782811
2003 0.134300 0.865700 0.93043001
2004 0.132260 0.867740 0.93152563
2005 0.077793 0.922207 0.96031609
2006 0.182512 0.817488 0.90415043
2007 0.131774 0.868226 0.93178646
2008 0.080583 0.919417 0.95886235
2009 0.181323 0.818677 0.90480771
2010 0.143194 0.856806 0.92563816
2011 0.189686 0.810314 0.90017443
2012 0.141202 0.858798 0.92671355
Year √1-Σmi2Σm
i2 1- Σm
i2
Source: Derived from Table No. 3
Table 4: The degree of global competition√√√√√1-ΣΣΣΣΣmi2 in global passenger car production plotted against time over the years.

SCMS Journal o f Indian Management , October - December, 2013 82
A Quarterly Journal
Let the linear trend equation of Global Competitiveness ofpassenger car producing countries for the period 1999-2005is represented by
PC1t = x
1 + y
1 t + ε
1t , (1)
where PC1t is the global competitiveness of passenger car
production during the period t, x and y are the regressionparameters, t is the time variable, and ε
t is the error term.
Using the least square method one can estimate x and y usingtime series data from Table 4.
The corresponding analysis is presented below
In view of Figure 1, we propose to go for linear regression
analysis. But as the time series generated is having lots of
variation and to get rid of the variation we have plotted the
data accordingly. We could find out the different periods
describing the inherent variation of degree of competition.
The periods are:
i) From 1999-2005,
ii) From 2006-2008 and
iii) From 2008-2012.
We shall consider the hypothesis H0 as null hypothesis that
there is no change in the degree of global competition in
passenger car production over the years against Ha as
alternative hypothesis, that there is an increase or decrease in
the same over the years.
Figure 1: Graph for the degree of global competitiveness in world car passenger industry along with the trend line.

SCMS Journal o f Indian Management , October - December, 2013 83
A Quarterly Journal
The estimated value of x1 and y
1 are x1
and y1 . Herex1 is .9143
and y1 is -.0149. To examine the significance of y1 value, the
regression coefficient of this linear regression curve, we liketo test the null hypothesis, H
0: y
1 = 0 against the alternative
hypothesis that y is greater or lesser than zero, i.e. Ha: y
1 >
0 or Ha: y
1 < 0. The observed value of t is 2.669, with a tail
probability of .044, which is less than .05. Hence, rejectingthe null hypothesis at 5% level of significance i.e. the globalcompetitiveness of world passenger car production is“significantly increasing over the year” as the coefficient oftime is positive. The multiple correlation, i.e. R value, is0.766 which is also on the higher side. The correspondinganalysis of variance table provides with F ratio as 7.122 forwhich the upper tail probability is 0.044, which is less than
5% level of significance. So, we conclude that, the linearly
increasing trend equation is a good fit for the said problem.
Let the linear trend equation of Global Competitiveness of
passenger car producing countries for the period 2006-2008
is represented by
PC2t = x
2 + y
2 t + ε
2t , (2)
where PC2t is the global competitiveness of passenger car
during the period t, x2 and y
2 are the regression parameters, t
is the time variable, and ε2t is the error term.
The corresponding analysis is presented below
The estimated value of x2 and y
2 are x12 and y12
. Here x12 is .877and y12
is .027. To examine the significance of y2 value, the
regression coefficient of this linear regression curve, we liketo test the null hypothesis, H
0: y
2= 0 against the alternative
hypothesis that y is greater or lesser than zero, i.e. Ha: y
2> 0
or Ha: y
2 < 0. The observed value of t is 169.179, with a tail
probability of .004, which is less than .05. Hence, rejectingthe null hypothesis at 5% level of significance we can say, theglobal competitiveness of world passenger car production is“significantly increasing over time”. The multiple correlation,i.e. R value, is 1.000 which is also on the higher side. Thecorresponding analysis of variance table provides with F ratioas 28621.474 for which the upper tail probability is 0.004,which is less than 5% level of significance. So, we concludethat, the linearly increasing trend equation is a good fit forthe said problem.
For the third period extend of variation is beyond any modelingas the fluctuation is ascertain. In 2009, the production ofpassenger car dropped due to the effect of 2008’s globalfinancial crisis.
Though, the first two periods show increase in trend but fromthe figure 1 it is clear that the trend line for the overall periodis negative to the origin.
CONCLUSION
Thus, from the above study it is clear that the opportunitiesfor Indian car passenger companies are growing over the years.We have noticed from the output table for degree ofcompetitiveness among the global car passenger productioncountries that the global competition is decreasing over theyears. So, decreasing global competition coupled with

SCMS Journal o f Indian Management , October - December, 2013 84
A Quarterly Journal
increasing market share of India indicates a positive sign forIndian car passenger industry.
Porter’s (1980) generic strategy of overall cost leadershipmay be the ideal choice, to remain afloat in the global market.Reduction of manufacturing cost can ensure the competitiveedge in the global market and can also accelerate the rate ofgrowth within the country, largely with the cost of labourand energy.
Among the top producing countries of global car passengerproduction the market shares of China, India, Brazil, Russia,Mexico and S. Korea are increasing. Scenario is reverse forJapan, United States, Germany, France and Spain.
The position of India in the passenger car market size can becomparable to some of the developed economies of the world,now. As, the degree of completion is also decreasing over theyears along with better performance of its own, India is in abetter position. A floating economic growth, growing middleclass population, young population, steadily improvingdependency ratio, growing urbanization and trend towardssmaller, nuclear families, rising disposable income levels,relatively low penetration of cars and adequate availability offinancing - these all trends in turn result in higher savings andincreased ability to purchase vehicles, as well as explainingthe preference for smaller cars. With most major marketsfacing excess capacity and demand saturation, the Indianmarket is likely to remain a key destination for global majorsover the medium term. With global demand shifting to smallercars, global players are likely to focus on strategies ofproducing cars of the same platforms in low-cost countriesl ike India, Thailand and Mexico. In terms of costcompetitiveness, India has built up the scale and significantcompetencies and cost advantages in the production of smallcars. It benefits from lower development and labour costs,and improving auto component manufacturing base. MarutiSuzuki and Hyundai have already establish meaningfulpresence in exports out of India, and now many other globalplayers including Renault-Nissan, VW, Ford have eitheradopted strategy or are in the process of exploringopportunities to develop India as part of their globalmanufacturing hub. Interestingly, China despite being knownfor its low-cost manufacturing capabilit ies and largeautomotive market supported by presence of internationalplayers is yet to establish a meaningful presence in exportingcars, though the situation may change over the medium term,especially considering rising capabilities and aspirations ofits large local players.
Additionally, auto ancillaries will have to ramp-up their capital
investment to develop new platforms and increase their
localization contents. Besides localization of components,
key challenges facing new entrants would be establishing a
strong service/ distribution network, which has become
increasingly prohibitive due to rising real estate costs in many
markets. Going forward sharing and co-operation on
distribution network and service facilities could play a
significant role in rationalizing cost structures. In terms of
product launch, while most global majors are likely to choose
from their existing portfolio for launch in India, key to success
would be the ability to incorporate changes necessary to meet
Indian preferences and market conditions.
After India’s liberalization, the government of India also has
taken several measures like relaxation of the foreign exchange
and equity regulations, reduction of tariffs on imports, and
banking liberalization that has fueled financing-driven
purchases.
BIBLIOGRAPHY
Abdel-Latif and M. Abla (1993). “The non price determinants
of export success or failure: the Egyptian ready-made
garment industry, 1975 – 1989.” World Development,
Vol.21, No. 10, pp. 1677-1684.International Iron and
Steel Institute, 2004 and 2006.
“Automobile Industry.” Wikipedia: the free encyclopedia.
Wikimedia Foundation, Inc. retrieves on 14 March 2012.
< http://en.wikipedia.org/wiki/Automotive_industry>
Cleaver T. (2004). “Economics: The Basics, Routledge.
Brittanica, 1994, Isocosts and Isoquants,” accessed May
16, 2010 from: http://media-2.web.britannica.com/eb-
media/42/142-004-2E61196E.gif.
Easterly,W. (2005). “National Policies and Economic Growth:
A Reappraisal”, Handbook of Economic Growth, ed.
By Philippe Aghion and Steven Durlauf Elsevier.
Edwards, L. and S. Volker, (2002) . “Measures of
competitiveness: a dynamic approach to South Africa’s
trade performance in the 1990’s,” The South African
Journal of Economics, Vol.70, No. 6, pp. 1008-1045.
Edwards, L. and S. G. Stephen (2004), “South Africa’s
international cost competitiveness and exports in
manufacturing,” World Development, Vol.32, No. 8, pp.
1323-1339.

SCMS Journal o f Indian Management , October - December, 2013 85
A Quarterly Journal
Haider, M. Z. (2007). “Competitiveness of the BangladeshReadymade Garment Industry in Major InternationalMarket,” Asia pacific Trade and Investment Review,Vol.3, No.1.
Jones, Chris . (2009) . Financial economics , London:Routledge.
Just, R.; Hueth, D. and A. Schmitz, (2002). “Applied WelfareEconomics and Public Policy”, Prentice Hall.
Krugman P. (2000). “The return of depression Economics,”W. W. Norton and Company.
Lall, S. (2001). “Competitiveness Indices and DevelopingCountries: An Economic Evaluation of the GlobalCompetitiveness Report.” Oxford: UK, Queen ElizabethHouse.
Mitra, P.,M. and D.Roy, (2010). “Global Competitivenessin the Steel Industry”, published in Asia –Pacific
Business Review , Volume 6, Number 4, October-December 2010, ISSN: 0973-2470, 79-87.
Mittal, A., P.M. Mitra, and D. Roy, .(2013, Feb). Analysis of
degree of global competitiveness on world passenger
car production presented in an international conference
Global Competitiveness and Corporate Governance
Imperatives in Emerging Economics, Ansal University,
New Delhi.
Nayak, K. M. (2007), “Measuring Global Competitivenessthrough Index”, Conference Proceedings of Conference
on Global Competition & Competitiveness of Indian
Corporate, 19 May, 2007, 101 – 113. DSpace at IndianInstitute of Management, Kozhikode. Retrieved fromhttp://dspace.iimk.ac.in/bitstream/2259/446/1/101-114++.pdf
“Passenger car production”, retrieve on 14 March 2012 <http://oica.net/category/production-statistics/>
Porter, M. (1990, 1998, 2003). “Competitive Strategy,” NewYork, Free Press, 1980, republished in 1990, 1998, 2003.
Porter, M. (1990, 1998). The competitive Advantage of
Nations, New York :The Free Press, 1990, republishedin 1998.
Prahalad, C. K. and V.Ramaswamy, (2004). The future of
Competition, Penguin Books India.
Roy D. (2006), “Discourse on Strategic Management,” Asian
Books Private Ltd., Chapter 13.

SCMS Journal o f Indian Management , October - December, 2013 86
A Quarterly Journal
Key words: Learning, organisational environment, enablers and disablers, cognition, metacognition and affective learning, job performance.
Entrepreneurial orientation, Entrepreneurial resourcefulness, Socio-demographic factors, Household income, Entrepreneurship.
Apurva Lagwankar, Management Trainee, FINO Pay Tech Ltd.Shree Saawan Knowledge Park, MIDC, Juinagar,Navi Mumbai- 400705 Ph- 08452003020Email : [email protected]
Dr. Anamika Sinha, Asst Prof. ( HR & OB Area) Institute ofManagement, Nirma University, SG Highway, Ahmedabad-382481. Ph- 02712-241900-04 Ext 643Ph-9909963360, Email [email protected]
Prof. Tripura Sundari Joshi, Asst Prof. (Marketing Area)IMNU, Ahmedabad, 30 D Sulay Deluxe row houses, Bakericity, Makaraba road, Ahmedabad-51.
n recent years, there has been a sustained debateabout the relevance, value and purpose of Mastersin Business Administration courses. To cater to the
market demand for management trainees, B schools have beenactively considering their identity and mission and, in somecases, reviewing the focus of their research, education andengagement activities. B Schools today struggle to providethe best learning opportunity to students, and create researchaided theories relevant to manage corporate functions.
Constant innovative processes are built with an aim to getbetter job performance in the students. Since the nature ofmanagement education is vocational, practical, and specificto a context, no standard theory is relevant and managementeducation systems have to constantly relook their ownstructures and systems to identify areas for improvement.
Management education is interplay of attitude developmentand knowledge creation. Thus, an equal emphasis is needed
Abstract
This study measures the student’s perception of what they consider as enabling or disabling in their environment forlearning. The cause-effect relationship between organisational environment studied as enabing/disabling and academiclearning is studied through regression analysis. The extent of influence of learning on job performance is also tested tounderstand the learning transference on the job. A questionnaire was designed to record data. For this purpose, a sampleof alumni who had completed at least one appraisal cycle was taken. Out of the 200 respondents contacted, 67 responded.None of the respondents perceived the learning environment as disabling at an aggregate level. Hypothesis providedsignificant evidence to prove that enablers influenced metacognitive and affective learning. There was no evidence tocomment on cause effect relationship between enablers and cognitive learning. All the three types of learning significantlyimpacted job performance. Though many other factors like peers, attitude, age, etc affect learning transference, this studyfocuses only a few factors and their influence (in isolation). The study concludes by describing the role of organizationalenvironment in learning and its ultimate impact on job performance.
I
Enablers and Disablers:
Academic and Job Performance
Apurva Lagwankar, Anamika Sinha, and Tripura Sundari Joshi

SCMS Journal o f Indian Management , October - December, 2013 87
A Quarterly Journal
for learning transference, as cognitive, contextual, attitude
formation and developing skills for application.
The present paper explores the organisational enablers and
disablers in the light of learning transference theory to identify
what factors the alumnus body considered as critical in their
alma mater that enabled academic and job performance.
Literature review
The Output of a training or education related intervention
can be measured in terms of learning; which in turn can be
measured in terms of cognitive, affective and metacognitive
learning outcomes.We define Cognitive learning as structural
knowledge which enables people to learn by using their reason,
intuition, and perception. Affective learning is defined as
subjective states that are either positive or pleasant (cheerful,
confident, attentive), or negative and unpleasant (nervous,
distressed, irritable) (Gray & Watson, 2001). Affective
outcomes also comprise for interest, attitude and motivation
towards the training programme (Brown 2005). When learners
find the content appealing, they tend to experience “positiveaffect” and vice versa. Further, Metacognitive learning refers
to the declarative, procedural and conditional knowledge
associated with learning, for example learning to read (Pressley,
2002).
Integrating the three definit ions i t is suggested that
metacognitive and cognitive knowledge act as moderating
variables between affective learning and actual performance.
(Kraayenoord et al, 1999).
Thus while affective learning was important to build an
attitude, metacognitive and cognitive learning was important
in bringing about a behavioural change. The three together
constitute the components of learning outcome of an MBA
Program. The researchers thus make an attempt to understand
what organizational factors enable and or disable the three
learning components.
While studies have been conducted on enabling environments
for learning in child development psychology, similar work in
management education is not available.
Perceived barriers and enablers and academic learning
Lent, Brown, & Hackett (2000) mentioned that perceived
barriers and enablers are environmental events or conditions
that are believed to exist or be encountered and thought toimpede (barriers) or facilitate (enablers) progress.
Mathieu, Tannenbaum, & Salas, (1992) debated that whenthe participants perceive disablers, it leads to frustration,their motivation to learn decreases, and they lower their effortas they no longer believe that effort would improveperformance. They are more likely to put efforts if theybelieve, their attempt would be encouraged and vice versa.
Based on Brown and Ford’s (2002) IPO model (input-process-output) of learning, Colquitt, LePine, and Noe (2000) alsosuggested that learner characteristics, organizational enablersand disablers, and instructor’s capability together create amotivation to learn which in turn facilitates cognitive, metacognitive and affective learning.
Biggs (1989) in 3P model suggested learning as an interplayof three variables : learning process, learning environment orpresage, and learning outcome or product. The three togethercontributed to a manager’s effectiveness.
Lizzio, Wilson and Simon (2002), Entwistle and Tait (1990),Wilson (1996) also found that the students’ perception oflearning environment affected their learning outcomes andachievements at school.
Thus the first set of hypothesis was arrived at
H1 Organizational enablers have an influence on cognitive
learning
H2 Organizational enablers have an inf luence on
metacognitive learning
H3 Organizational enablers have an influence on affective
learning
Academic learning and Job Performance
According to the causal model of job performance proposedby Schmidt and Hunter (1986) cognitive ability is the mostsignificant cause of job performance. Kuncel, Hezlet, &Ones(2004) again supported that cognitive learning doesinfluence job performance. One of the seminal papers by Wise(1975) has argued that cognitive scores do lead to better jobperformance. Some researchers have studied the role ofaffective learning and its impact on job performance as well.Gintis (1971) found that affective learning imparted througheducation also enhances job performance.The researcherscould not find any study on the impact of metacognitive
learning on job performance. However, since metacognitive
learning inputs are important for a business management

SCMS Journal o f Indian Management , October - December, 2013 88
A Quarterly Journal
course, the same was decided to be studied. Thus the second
set of hypothesis was arrived at as follows:
H4 Cognitive learning influences job performance.
H5 Metacognitive learning influences job performance.
H6 Affective learning influences job performances.
Figure 1. Theoretically hypothesized model
The present study is descriptive in nature since certain
relationships among the key constructs derived out of a review
of relevant literature are hypothesized for their validity.
The study used purposive snowball sampling through the
medium of social network (Browne 2005). Alumni of leading
Gujarat based management institutes; who had undergone
atleast one performance appraisal cycle post their campus
placements were identified through Facebook. Alumni thus
identified were sent an online questionnaire with a request to
participate in the survey. Of the 200 respondents contacted
67 responded to the questionnaire, thus a response rate of
34% was achieved.
Measurement
The cognitive learning was measured using the composite grade
point average of the sampled students at the end of two years
of study. Job performance was measured using a self- reported
score on a single question. For measuring the perceived enablers
and disablers as well as the affective and metacognitive
learning components, separate questions were designed and
administered. A preliminary face and content validity was
done by sending the questionnaire to seven experts and to
check for constructs identified and semantics of the tool.
Some language modification was made based on their
suggestions. Further, the tool was initially introduced to 10
alumni for pilot study. Some alumni students visiting college
were asked to read the items carefully and mark their response.
Some items which were ambiguous, or not very clear were
then modified based on their feedback.
To establish the internal consistency of the item within the
tool used in the study and test for the reliability of the newly
derived items for measurement of affective and metacognitive
learning and organizational enablers, and disablers’ Cronbach
alpha was calculated with a resulting value of 0.73. Inter item
correlation was also found to be consistent and above 0.5 for
all items. Therefore all items were retained.
STRUCTURE OF THE QUESTIONAIRE
1. Perceived Enablers and Disablers:Based on literature
review, several key interventions of the institutes, which were
perceived by students as enabling/disabling in their learning,
were used in the study. These items were marked on a 7 point
Likert scale to measure extent of enabling or disabling effect.

SCMS Journal o f Indian Management , October - December, 2013 89
A Quarterly Journal
ENABLERS AND DISABLERS
Library
Location
Campus
Hostel facility
Internet facility
Reading material
Table 1. The broad constructs of organizational environment.
Faculty quality
Peer pressure for performance
Administrative procedures
Discipline and evaluation
Friendly and encouraging environment
Institutional culture and values.
The total score of all the 12 factors was considered to decidethe overall influence of the learning environment as enablingor disabling (i.e. respondents scoring less than or equal to 30were considered to be perceiving the environment as disablingwhile those scoring above 30 were considered to be perceivingthe environment as enabling.)
2. (a) Metacognitive Learning: The metacognitive learning
component was measured through three questions using the
Likert scale. The scores of 1 to 5 were assigned from “highly
disagree” to “highly agree” options. The questions included
are as follows:
I could relate the discussion in class with my past experiences (This question measured the application of the concept at the
time of learning).
Looking at an issue, I knew I would be able to solve it (This question covered the declarative knowledge of the respondent).
While working at office, I am reminded of previous classroom discussions (This question attempts to measure the current level
of metacognitive learning).
2. (b) Affective Learning: This dimension focused oncapturing the emotions of the respondent about the learningexperience. The scores were assigned on the basis ofpositivity or negativity of emotions. The first two questions
measured the emotions about the learning content. The thirdquestion measured the overall effect of the candidate duringthe learning process. The questions for measuring affectivelearning are as follows:
The MBA programme added value to my learning.
I am satisfied with the learning derived from the course.
I enjoyed the 2 years of MBA.
Table 2 Scores of enablers/disablers
Responses Strongly Disabling Disabling Neutral Enabling Strongly Enabling
Scores assigned 1 2 3 4 5

SCMS Journal o f Indian Management , October - December, 2013 90
A Quarterly Journal
RESULTS
The mean score on each of the variables studied are shown below:
From the above table it is evident that students perceivedthat educational environment of the institute was enabling.Of the 12 items studied, all items scored more than 2.5; highestenablers identified from hard areas of enablers namely campus,hostel, library and internet services. Factors scoring low, eventhough found to be enabling were administrative processes,
quality of faculty, institutional culture, discipline, andevaluation system.
The data collected was statistically evaluated throughregression analysis to test for the causal effect of identifiedvariables on learning and on job performance.
Table 4 Findings
Responses P value at 0.05% significance
Hypothesis acceptedor rejected
Organisational enablers have an rejected, organizational influence on cognitive learning 0.631 0.04 enablers do not influence
cognitive learning.
Organisational enablers have an influence Accepted, organizationalon metacognitive learning 0.00 0.388 enablers do influence
metacognitive learning
R square value
1 Environment (in terms of
friendliness) 16 38 5 7 1 67 3.91
2 Discipline and Evaluation system
(Weightage assigned to
components) 8 40 11 7 1 67 3.7
3 Institutional culture and values 13 25 19 6 4 67 3.55
4 Library 18 33 15 0 1 67 4
5 Location 13 29 15 8 2 67 3.64
6 Campus 34 29 4 0 0 67 4.45
7 Hostel facility 26 31 7 2 1 67 4.18
8 Internet facility 22 30 9 3 3 67 3.97
9 Peer pressure for performance 9 35 18 3 2 67 3.69
10 Quality of faculty 5 27 23 7 5 67 3.3
11 Administrative Process 6 17 29 11 4 67 3.15
12 Reading material 11 36 18 1 1 67 3.82
# Question StronglyEnabling
Enabling Neutral DisablingStrongly
DisablingResponses Mean
Table 3 Mean average of organizational enablers and disablers

SCMS Journal o f Indian Management , October - December, 2013 91
A Quarterly Journal
Organisational enablers have an influence on 0.000 0.492 Accepted, there is affective affective learning learning in presence of
organizational enablers
Cognitive learning influences job 0.047 0.06 Accepted, there is a significantperformance influence in job performance
because of cognitive learning
Metacognitive learning influences job 0.002 0.136 Accepted, Metacognitiveperformance learning does influence job
performance.
Affective learning influences job performances 0.004 0.121 Accepted, Affective learningdoes influence job performance.
ResponsesP value at 0.05% significance
Hypothesis acceptedor rejected
R square value
Influence of enablers on:
Cognitive 0.060 0.233 0.004 -0.012 0.631 0.482
Metacognitive 0.537 26.276 0.288 0.277 0.000 5.126
Affective 7.939 63.029 0.492 0.484 0.000 7.939
Job performance influenced by
Cognitive 0.245 4.093 0.06 0.045 0.047 2.023
Metacognitive 0.143 10.229 0.136 0.123 0.002 3.198
Affective 0.348 8.965 0.121 0.108 0.004 2.994
â F R2 Adj R2 P-value t-value
Table 5 Summary of Hypothesis tests
Figure 2 Statistically validated model
SCMS Journal o f Indian Management , October - December, 2013 92
A Quarterly Journal
DISCUSSION
1) There was no conclusive evidence to prove that there was
cognitive learning because of organizational enablers. In this
case, the perception about library, hostel facility, course
material and other factors (in aggregation) do not significantly
affect the CGPA of student. There could be other factors
affecting cognitive learning. The S-S learning theory(Cognitive
learning theory SS Learning) could be referred to support this
finding. The two main types of cognitive learning are Latentlearning and Insight learning. Latent learning (also known
as incidental learning) occurs without reinforcement and is
not immediately demonstrated when it occurs. Here, the
student may perceive library, course material, faculty guidance
as enabling but he does not use the learning immediately.
Hence, it is difficult to establish a direct link. Even in the case
of insight, where an individual finds a new way of solving
problem, it is difficult to establish the link. The emphasis in
this case is more on the internal learning process rather than
the external learning environment. During the two years of
MBA program, the student has no way of testing this except
for the scores in exam. Also, most students tend to be goal
focused, so the cognitive part is taken by them only to the
extent that it would help them in their immediate job. This
may also be explained by way of information processing
theory. Though the input may be uniform for all the students,
the output may be different. The main reason is every student
processes the information differently. The learning styles can
also be different.
2) It could be conclusively established that organizational
enablers influenced metacognitive learning. Here the two main
factors coming into play are gaining more knowledge and
application of previously gained (cognitive) knowledge.
Students perceive that organizational enablers have a larger
role in influencing the application of the knowledge which
comes handy as a professional. This finding to an extent defies
the argument against the state of MBA schools in India; where
it has been argued that Indian MBA Schools have become just
a teaching shop and placement agency (Guptoo 2013). The
alumnus of the sample represented does feel the institute’s
environment enabling and helping in metacognitive learning
which is an important skill set for managers.
3) There was sufficient evidence to support that there was
affective learning because of organizational enablers. The
respondent’s perception about the hard and soft enablers
(hostel, campus, library, and friends) affects his emotions
during the learning process (MBA course). Though explained
more by hygiene theories of motivation, this finding also gets
support from goal setting theories. In presence of hygiene
factors and motivators, students set higher goals for
themselves and are able to achieve the same. Being adult
learners, it may be presumed that the students set self-
directed learning goals and they perceive role of active
engagement with faculty to be lesser than their own learnt or
developed concepts through readings or group discussions.
This is also supplemented by the larger enabling score of
reading material that the faculty provides for them.
4) It could be conclusively established that cognitive learning
influences job performance. A higher job performance rating
was observed for students scoring better in CGPA. Good
academic score develops a sense of accomplishment and
therefore a better esteem. Academic rigour, establishes a
routine for further diligence, which also translates in job
performance. Further, even if it is not at the ready recall,
understanding of the basic concepts of theory enable students
to enter the double loop of learning and find better solutions
when encountered with challenges in job.
5) The Metacognitive learning does influence job performance
according to the study. The ability of an individual to relate
the learning to past experiences or the external environment
helps him in applying the knowledge in the job environment
also. The declarative knowledge increases probability to
measure his own potential. This helps him/her in doing work
more efficiently.
6) There was sufficient evidence to establish a cause-effect
relationship between affective learning and job performance.
The more positive an individual felt about his learning
experience, more likely was he to perform better at his job.
The affective learning may include the motivation to learn
during the course and level of satisfaction after the course.
The importance of posi t ive at t i tude during learning
transference is reinforced through this finding.
CONCLUSION
The research provided an insight that the environment was
perceived to be enabling. The top three factors rated
favourably on this scale were campus, hostel facility and
library. The factors scoring the least were administrative
processes, quality of faculty and discipline. Interestingly, all
the factors in the top three were hard in nature while all the
three at the bottom were soft factors of the learning

SCMS Journal o f Indian Management , October - December, 2013 93
A Quarterly Journal
environment. The research provided a direct link between
organizational enablers and metacognitive learning as well as
organizational enablers and affective learning. The enablers
could not be directly linked with cognitive learning. The
learning environment in an organization should provide
adequate support to different styles of learners for enabling
cognitive learning. The enablers or disablers are determined
by the perception of the learner. The organization should
maintain a balance between the available factors for learning.
The three types of learning measured for their relevance at
the workplace were found to be important for creating a better
job performance. Most evaluation systems in MBA Schools
cater to measurement of cognit ive learning; s ince
metacognitive and affective learning is also important
influencer for job performance, efforts must be made by faculty
to integrate this in delivery as well as evaluation.
CONTRIBUTION OF THE RESEARCH
The research provided a perspective on role of organization
environment on learning with respect to management
education. It further links this learning at three levels and
tries to explore its impact on job performance, a most
important deliverable for any management institute. The
research brings out, which component of learning have an
influence on the job performance of a manager. This research
adds to the literature an enabling environment in higher
education and its impact on job and academic performance.
LIMITATIONS OF THE STUDY
The sample was collected from one college/institute and
therefore may be a unique phenomenon of the institute in
question. In terms of organizational enablers and disablers
there could be more variables that may play a role, but have
not been considered as relevant in the context studied. The
sampling technique used is through social media, where there
is a possibility of over reporting. According to Daniel
Kahneman 1999 the peak/end rule suggests that when the
students are on the campus, their response to some disablers
would be much stronger, as compared to when they are already
placed. As time passes by, the hurt or disablers perceived and
their impact tends to diminish. This study could ideally be
done over a longitudinal period, where perception of enablers
and disablers may be studied while the students are on campus
and subsequently after a certain length of time in job roles.
REFERENCES
Biggs, J.B. (1989). “Approaches to the enhancement of
tertiary teaching,” Higher Education Research and
Development, 8, 7–25.
Biswaroop Guptoo (2013). “Entrepreneurs not job seekers
are the solution for the countries problems.” The
Economic Times , Apri l 12 2013. ht tp: / /art icles.
economictimes.indiatimes.com/2013-04-12/news/
38491511_1_entrepreneurship-business-ideas-job-
creators, retrieved on 12.5.13 at 12 pm.
Brown, K. (2005). “An Examination of the Structure and
Nomological Network of Trainee Reactions: A Closer
Look at “Smile Sheets.” Journal of Experimental
Psychology: Applied, 90(5), 991-1001.
Brown, K.G., and J.K. Ford, (2002). “Using computer
technology in training.” In Kraiger K (Ed.). Creating,
implementing, and managing effective training and
development (pp. 192– 233). San Francisco: Jossey-
Bass.
Browne K. (2005). “Snowball Sampling: Using social networks
to study heterosexual behaviour in women.”
International Journal of Social Research Methodology.
Vol 8 Issue 1
Colquitt, J.A, LePine, J.A, R.A.Noe, (2000). “Toward an
integrative theory of training motivation: Ameta-analytic
path analysis of 20 years of research.” Journal of Applied
Psychology, 85, 678–707.
Entwistle, N. J., and H.Tait, (1990). “Approaches to learning,
evaluations of teaching, and preferences for contrasting
academic environments,” Higher Education 19, 169-194.
Gintis , A. (1971). “Education technology and the
characteristic of worker productivity,” American
Economic Review Process, May 41, 266-71
Gray, E., and D. Watson, (2001). “Emotion, mood, and
temperament: Similarities, differences, and a synthesis.”
In R. L. Payne & C. L. Cooper (Eds.), Emotions at
work: Theory, research, and applications in
management (pp. 21–44). New York: Wiley.
Kahneman Daniel (1994), “New Challenges to the Rationality
Assumption,” Journal of Institutional and Theoretical
Economics,Vol. 150, No. 1, March 1994

SCMS Journal o f Indian Management , October - December, 2013 94
A Quarterly Journal
Kraayenoord, C.E.V. and W. E. Schneider, (1999). “ReadingAchievement, Metacognition, reading self concept andinterest: A study of German students in Grade threeand Four.” European Journal of Psychology in
Education,Vol 14 no 3, 305-324.
Kuncel N.R., Sarah A. Hezlett and S.Denise One (2004).“Academic Performance, Career Potential, Creativity,and Job Performance:Can One construct Predict themAll?” Journal of Personality and Social Psychology, Vol96 No 1, 148-161.
Lent, R.W., S.D.Brown, and G.Hackett (2000). “Contextualsupports and barriers to career choice: A social cognitiveanalysis.” Journal of Counseling Psychology, 47, 36–49.
Lizzio, A., Keithia Wilson and Roland Simons (2002).“University students’ Perceptions of the LearningEnvironment and Academic Outcomes: Implications forTheory and Practice.” Studies in Higher Education
Volume 27, No. 1.
Mathieu J.E., S.I. Tannenbaum, and E.Salas (1992). “Influencesof individual and situational characteristics on measuresof training effectiveness”. Academy of ManagementJournal, 35, 828–847.
Pressley, M. (2002). “Comprehension strategies instruction:A turn-of-the-century status report.” In C.C. Block,&M. Pressley (Eds.) , Comprehension instruction:Research based best practices (pp. 11–27). New York:Guilford.
Schmidt, F. L., & J. E. Hunter, (1986). “Causal Model of jobexperience, abili ty and performance.” AmericanPsychlogical Association. Washington, D. C.
Wilson B.G. (1996) Ed. Constructivist learning Environment:Case studies In Instructional Design., EducationalTechnology Publications, Inc., Englewood Cliffs NewJersey.
Wise D.A. (1975), “Academic Achievement and jobPerformance.” The American Economic Review, Vol.65, No.3. June 1975.

SCMS Journal o f Indian Management , October - December, 2013 95
A Quarterly Journal
Cause - brand alliance:
Purchase Intention
Cause related marketing has became a meaningful part of a marketing plan. For the success of the cause marketing
campaign, the charity programme selected to support by the organization and the product/brand associated should
be compatible, in this study we state it as Cause Brand alliance. The study tries to understand the effect of Cause
brand alliance on relationship between the attitude towards company and purchase intention. The study has been
conducted in Indian context. The research design of the study is to test the causal relationship among the variables
considered in the study. The study is conducted through online survey. The study contributes important insights on
cause-brand alliance and its influence on attitude and purchase intention helpful at the design stage of cause
marketing.
Abstract
Kota Neel Mani Kanta, Asst Professor, KSRM College ofManagement Studies, Kadapa, AP.Email: [email protected]. Ph:09848071295
Prof D.V Ramana,School of Business Management,SV University, Tirupathi., Ph:9393608039
P. Srivalli,Asst Professor,KSRM College of ManagementStudies, Kadapa, AP., Email: [email protected]:09885292244
Key words: Cause Related Marketing, Cause Brand Alliance, Purchase Intention
fter the recent 2004 tsunami in Asia, the WashingtonPost profiled a number of companies who donatedmoney to the relief effort. For example, Starbucks
chose to donate two dollars to disaster relief in Indonesia foreach pound of Sumatran coffee purchased, while Avon agreedto donate three dollars to reconstruction efforts for each“Heart of Asia” pin purchased by its customers (Cooperman,2005). This type of corporate charitable donation is anexample of cause related marketing: a program designed tocreate a partnership between a sponsoring firm and a non-profit cause to raise money through product sales (Varadarajanand Menon,1988).
The increasing strategic importance and consumer relevanceof such socially responsible marketing initiatives is evidencedin the results of a Cone and Roper consumer survey (ConeInc., 2004). Approximately 80 percent of consumers surveyedstated corporations who support a cause generate greatertrust, 86 percent said they would switch brands to a cause-
A
Kota Neel Mani Kanta, D.V. Ramana and P. Srivalli

SCMS Journal o f Indian Management , October - December, 2013 96
A Quarterly Journal
supporting product when faced with a choice of equal productprice and quality, and 85 percent said the company’scommitment to a social cause was important when decidingwhom to do business with in their local community.
These results suggest that while marketing in general is focusedon the process of selling, influencing and persuading the enduser to purchase a product, companies feel compelled to serveand satisfy the human needs of their customers (Kotler andLevy, 1969) and of their other internal and external publics(Kotler, 1972), both out of obligation to society, and to achievepositive consumer rewards. Cause related marketing allowsthe marketer to reach these publics by tying a company’s“economic activity to a higher social purpose” (Kotler andLevy, 1969, 15).
But how do companies ensure the success of such corporatesocial responsibility (CSR) initiatives, specifically in the caseof using cause-related marketing campaigns? Research inmarketing addressing this question generally falls into twocategories:
• The effect of positive attitude on purchase intent and
• The degree of congruence between the brand and causeas perceived by the customer and its influence onattitude and purchase intent.
Conceptual Frame work
In a seminal paper on cause-related marketing, Varadarajanand Menon (1988, 60) offer the most comprehensive cause-related marketing conceptualization, defining it as: . . . theprocess of formulating and implementing marketing activitiesthat are characterized by an offer from the firm to contributea specified amount to a designated cause when customersengage in revenue-providing exchanges that sat isfyorganizational and individual objectives.
Among other benefits to the sponsoring company, causerelated marketing programs can generate favourable purchaseintent or product choice among the sponsoring firm’scustomers (Shell, 1989; Lawrence, 1993; Mohr et al, 2001)and favorable customer attitudes towards the sponsoring firm(Ross et al, 1990-1991, 1992; Brown and Dacin, 1997). Forthe participating cause, cause-related marketing programsaccrue rewards such as new sources of much-needed funds,and heightened public awareness (Caesar, 1986; Varadarajanand Menon, 1988). And consumers benefit by gaining a senseof additional perceived value to their purchase (Webb and
Mohr, 1998) and satisfying their altruistic needs of the self
by helping society (Polonsky and Wood, 2001).
It is proposed that to maximize these benefits, sponsoring
companies should carefully consider several important
variables:
• The degree of company – cause fit in the minds of the
consumer;
• The level of customer attitude with the company; and
• The level of customer intent to purchase.
According to Assael (2004) a positive attitude towards a brand
leads to a higher purchase intention of the brand. Consumers
who have prior experience with CRM already made a CRM
purchase before and for that reason they are likely to have
favorable attitudes towards CRM products, as well, as
otherwise they would not have bought a CRM product in the
first place. As a result, consumers with prior CRM experience
may still have elevated attitudes towards CRM and higher
purchase intentions of CRM endorsed products. A positive
relationship between assigned public serving motives and
consumers’ attitudes towards companies actively engaged in
CRM and purchase intentions of CRM products is expected
in this s tudy that invest igates CRM from a general
perspective. It is important to note that what consumers say
when asked for a reaction to a hypothetical situation may not
be an accurate reflection of their ultimate market behaviour.
However, we can presume that the success of CRM campaigns
reflects, at least in part, the favourability of consumer
responses to a company’s support of a cause, culminating in
the choices of that company’s products or service (Barone et
al, 2000). Hence, we hypothesize:
H1: Positive attitude on the firm/ product will lead the
customer for purchase intention when the company/brand is
associated to a charity programme.
The Study argues for the importance of fit between the
company and the sponsored cause in a cause related marketing
alliance. Fit is defined as the perceived link between the
company’s image, positioning and target market and the
cause’s image and constituency (Varadarajan and Menon, 1988;
Ellen et al, 2000). Sponsorship researchers have highlighted
the importance of fit between the sponsor and the event
(Speed and Thompson, 2000), while results from the popular
press suggest that to maximize cause related marketing results,

SCMS Journal o f Indian Management , October - December, 2013 97
A Quarterly Journal
the sponsoring firm should select a cause that is compatiblewith its identity and is compelling to the firm’s target market(e.g. Higgins, 1986; Shell, 1989; Larson,1994).
Attitude towards cause brand alliance (CBA-Moderatingvariable) will positively influence the relationship betweenattitudes towards company leading to purchase intention,cause instead of brand induce the objective of a company inestablishing a relationship with nonprofit organization is togenerate sales and connate to the cause. The CRM campaignis designed to give consumers the incentive to buy the brandbased on altruistic motivations. Some preliminary researchsuggests that the alliance does influence purchase intent Hajjat2003; Olsen, Pracejus & Brown 2003). The strong associationbetween the cause and the brand that was formed by the allianceand the fact that the donation will be made to the cause basedon purchasing the brand, it is anticipated that attitude towardsthe alliance will affect the purchase intent (however, becausepurchase intention are directly linked to buying the advertisedproduct and not the cause)
The intent of the cause – brand alliance is for consumers toformulate new evaluations and associations for both the causeand the brand. This in turn can affect attitudes toward thecause and the brand following the alliance. As suggested byinformation integration theory, as new information is receivedand evaluated, attitudes are modified and then this informationis integrated with prior attitudes. Thus potentially alteringthose prior attitudes in the brand extension literature, there isevidence that poor brand extensions present some risk bypossibly diluting consumer evaluations of the core brand(Loken and Roedder- John 1993; Sullivan 1990). For example,
Walt Disney Co. found that consumers would not acceptDisney movies for adults so they launched Touchstone Films(Wilkie 1994) the core brand could be considered the anchorbrand according to Yadav (1994) in the bundling literature.The author found it was easier to hurt an anchor with a poortie-in than it was to help an anchor with a moderate tie-insuggesting a dilution effect as well. On the flip side Lokenand Roedder – John (1993) found brand enhancement can bethe positive cause brand alliance and prior attitudes towardsthe company are essential to profit organization to stimulatefavourable purchase intention (Roedder – John 1993) occur ifthe extensions are perceived positively. In addition, if a priorextension was successful, (Keller and Aaker (1992) foundthat evaluations increased not only for the proposed extensionbut for the core brand itself.
In a brand alliance context, a similar potential exists for analliance to influence the partner brands. Attitudes toward eachparticipating brand were found to change when consumerswere exposed to a brand alliance (Simonin and Ruth 1998). Inother words, more favourably evaluated alliances tended toproduce more favourable subsequent evaluations on the twopartners. This effect would seem to be similar for a cause-brand alliance. Since an alliance represents a new type ofassociation, it is expected that post exposure attitudes willbe affected. Hence it is hypothesized as:
H2: Cause-brand alliance has positive moderating effect on
relationship between attitude towards company and
purchase intention.
Research methodology
The study is conducted among the selected respondents; the
respondents are selected through predetermined members,
these members administer the questionnaire to their known
people. The study has collected response from a structured
quest ionnaire among 846 respondents of India. Therespondents were reached through selected members (researchscholars , faculty members, working students) , thequestionnaires were sent to these members and after collecting

SCMS Journal o f Indian Management , October - December, 2013 98
A Quarterly Journal
the opinions of the respondents, the questionnaires were sentback to the researcher for further analysis. The study includedthree measured variables: attitude towards company, purchaseintention and attitude towards cause-brand alliance.
The study considered experimental design of after only withoutcontrol group. The study has designed with five experimentalgroups. The experimental groups are named as “V-ray Corp,”“Indian Electronics,” “db drive,” “Bread India,” and “HorseBreweries,” these names are given after the company namesadopted in the advertisement. The experimental group consistsof different contexts, highlighting the brief outline of companyperformance in the industry and the cause attributessupported by the company. An advertisement is designed foreach experimental group, highlighting the cause campaignassociated by the company. The advertisement also gives thedetails of the nonprofit organization associated by thecompany.
The attitude toward cause brand alliance is a measure offavourable/unfavourableness of respondents towards thealliance between cause and brand. It is understood from studyfavourableness can be achieved by a good fit between thecause supported by the company and the brand. Studyconsiders attitude towards cause brand alliance as a moderatingvariable on the relationship between the attitude toward thecompany and purchase intention. To measure the attitude afour schematic items were adopted (Mitchell & Olson 1981).The i tems are “Bad”/”Good,” “Disl ike”/”Like,”“Unfavourable”/”Favourable,” and “Negative”/ “Positive” onseven point scale.
Attitude towards the company is the degree of favourablenesstowards the company/product. It is significant since once the
attitudes are formed, they are relatively stable and enduring(Fishbein and Ajzen 1975). To measure the attitude a fourschematic items were adopted (Mitchell & Olson 1981). Theitems are “Bad”/”Good,” “Dislike”/”Like,” “Unfavorable”/”Favorable,” and “Negative”/ “Positive” on seven point scale.
Customer willingness to purchase a product of a company isknown as purchase intention. Purchase intention is significantfactor in customer purchase decision process, it is importantto understand the antecedents in making cause relatedmarketing a successful campaign. In this study purchaseintention is dependent variable. The variable is measured byfollowing items “I think this Campaign is a good idea,” “Iwould be willing to participate in this campaign by purchasinga product of the company,” “I would consider purchasing“db Drive Solutions Ltd” in order to provide help to thecause,” “It is likely that I would contribute to this cause bygetting involved in this campaign” rated on 7 point Likertscale from “strongly agree” to “strongly disagree.”
The study adopted Correlation and Regression analysis forhypothesis testing. The data collected is organized andtabulated. SPSS package tool is used for analysis. The nextsection explains the results arrived by the study.
Analysis
The respondents participated in the study are 846 membersof different regions of India, among the respondents294(34.8%) are between 20-30 years, 368(43.5%) are between31-40 years, 109(13.0%) are between 51-60 years, and36(4.3%) are between 61 and above. In the study 476respondents are male and 370 respondents are female.
AGE GROUP 20-30 34.8% 294
31-40 43.5% 368
41-50 13.0% 109
51-60 4.3% 36
61 AND ABOVE 4.6% 39
GENDER MALE 56.5% 476
FEMALE 43.5% 370
Coloumn N %
Table:1 Demographic profile of Respondents
Count

SCMS Journal o f Indian Management , October - December, 2013 99
A Quarterly Journal
The following Table:2 details the means and skewness results,the means are observed to be above the average. Therespondents have relatively positive atti tude towardscompany with a weighted mean of 4.69. The study has
revealed a positive opinion on cause brand alliance with aweighted mean of 4.76. The respondents stated they haveintention to purchase the product associated in supporting acharity (wt mean= 5.02).
The skewness states the normality of data, mandatory forfurther analysis. The skewness is a measure of the extent towhich a probability distribution of a real-valued randomvariable ”leans” to one side of the mean. The skewness valuecan be positive or negative, or even undefined. The resultsstate that data is within the standard norms of -1 to 1. TheTable: 3 details about the internal coherence of the variables.Cronbach’s alpha is a measure of internal consistency, the
value of alpha should be greater than 0.6 according to research
standards to state there is internal consistency between the
items measuring the variable. Attitude towards company has
four items with a Cronbach’s alpha .776, attitude towards
cause brand alliance has four items with internal consistency
of .887 and purchase intention has four items with Cronbach’s
alpha of .965.
Table: 2 Descriptive Statistics
N
Purchase Intention 846 5.0298 1.75213 -.839 .350
Attitude towards Product/Company 846 4.6957 1.83932 -.195 .350
Attitude towards Cause Brand Alliance 846 4.7611 2.00139 -.500 .354
Mean Std. Deviation Std. Deviation
Statistic Statistic Statistic Statistic Std. Error
H1 states Attitude towards company has positive influenceon purchase intention. To test hypothesis, correlation analysisis performed between attitude towards company and purchase
intention. To understand the magnitude of variance explainedin the dependent variable by the independent variable,regression analysis is performed.
Table: 3 Cronbach’s Alpha
N
1 Attitude towards Cause Brand Alliance 4 .887
2 Attitude towards Company 4 .776
3 Purchase Intention 4 .965
Variable Number of Items Cronbach’s Alpha
Table: 4 Correlations between Attitude towards company and purchase intention
Attitude towards company Pearson Correlation .303**
Sig. (2-tailed) .024
N 846
Purchase Intention
Table: 5 Regression of Attitude towards Company on Purchase Intention
Model R2 F Change Sig F change
1 0.091 85.621 .000
**. Correlation is significant at the 0.01 level (2-tailed).

SCMS Journal o f Indian Management , October - December, 2013 100
A Quarterly Journal
The above results in Table: 4 & 5 indicate attitude towardscompany have positive relationship (.303, p- value = 0.24)with purchase intention. The independent variable attitudetowards company is able to explain significant variance (9.2%,p-value =0.00) in purchase intention, thus supporting H1.However, it is observed that relationship between attitudestowards company is having moderate relationship andrelatively less in explaining variance in purchase intention.
H2 stated that there would be positive moderating effect of
at t i tude towards cause brand al l iance (CBA) on therelationship of attitude towards company (ACo) and purchaseintention (PI). To test the hypothesis, regression was runwith purchase intention as dependent variable, attitudetowards product/company as independent variable andattitude towards cause brand alliance as a moderating variable.To test the moderating effect, the individual means of attitudetowards company and cause-brand alliance are multiplied intoa separate variable (ACo X CBA). See Table: 6 for test results
a. Predictors: (Constant), A Co
b. Predictors: (Constant), ACo, ACo X CBA
c. Dependent Variable: PI
The above table reveals H2 is supported, there is significantrelationship between attitude towards product/company (R2
= .091, F- 84.63, p-Value = .000) and purchase intention canbe understood from model 1 of regression analysis.
The moderating effect of attitude towards cause brand alliance(R2 = .113, F- 84.63, p-Value = .000) on Purchase intentioncan be observed from model 2 of regression analysis. Theregression model explains 11.3% of variance in the dependentvariable, indicating there are other variables influencingPurchase intention.
Discussion
The study has revealed from analysis that attitude towardscause brand alliance influences the relationship between theattitude towards company and purchase intention positively.The trade and academic literature is vast in explaining thatconsumers usually have positive evaluations and attitudetowards company sponsoring social causes (Adkins, 1999,Barnes, 1992; Berger, Cunningham & Kozinets, 1996). Weknow that consumer with positive attitude on company willhave intention to purchase the product (Lutz, 1985). Einwilleret al (2006) found that when respondents were presentedwith negative information about the company, the attitudes
Table: 6 Regression of Cause Brand alliance on the relationship between Attitude towards company and purchaseintention
Model R2 F Change Sig F change
ACo 0.091 84.637 .000
ACo X CBA 0.113 20.407 .000
formed due to the consequences of the information affectedthe intention. Given the relationship between the attitudeand purchase intention in the literature, it is likely that theattitude towards company will have direct relationship withpurchase intention in cause brand alliance context also. Thisstudy is one of the first to take attitude towards cause brandalliance as moderating variable and analyze its effect on therelationship between the attitude on company and purchaseintention.
A common marketing strategy has been to associate a productwith an object possessing positive attributes. For instance,in event sponsorship, a product is often associate with anevent that is well liked by the public. Celebrity endorsement,on the other hand, typically pairs a product with well-regardedpublic figure. The increasingly popular brand extensionstrategy ties a new product with an existing reputable brand.In a similar view, in CRM context, a product is paired with anonprofit organization/ cause, toward which people generallyhold positive attitudes. For all these marketing strategies, thematching, or fit between the product and the object it isassociated with has been regarded as a critical issue (Aakerand Keller 1990; Drumwright 1996; Kamins and Gupta 1994)
This study assumes good fit between Cause and brand as animportant factor to consider. Sponsorship linkages have beencharacterized as either logical or strategic (Cornwell, 1995).Logical links are those where the connection between brandand cause are obvious, where as strategic links are connections

SCMS Journal o f Indian Management , October - December, 2013 101
A Quarterly Journal
between brand and cause whose target markets sharecharacteristic. While achieving a match in these areas isimportant, it is necessary to recognize that brand and causecan also have rooted in similarities of values between sponsorand cause. A sponsorship of a cause that is based strongly onshared values between mission of the cause and the sponsoringfirm potentially enables to persuasively communicate theimportance of supporting the cause to its target market.
Furthermore, understanding the characteristics of nonprofitorganization is also cri t ical during the formation ofpartnership. The values and beliefs of the nonprofi torganization with which the company considers partnershipmust be known before committing resources. Meeting withnonprofit organization, learn more about their values as wellas examination of other sponsors aligned with the cause andtheir values are ways to gain this insight. This research servesto highlight the importance of choosing congruent partners,something that is always not addressed in the market place.Donation structure, time limits, and amount of the donationmay also play a key role in consumer’s attitude and intentions
Several studies investigate the degree of fit between company’sbrand and the cause. Lafferty et al (2004) found that thedegree of fit between the cause and brand is important inCRM campaign, and the alliance will transfer attitudes toboth the cause and the brand. When the cause brand allianceseems reasonable, consumer attribute authenticity to theefforts and respond more favourably. Till and Nowak. (2000)has found that cause brand partnerships have been effectivein creating positive associations when the cause and the brandare seen by consumers as an innate and probable fit. Suchresults reinforce the importance of cause brand alliance.
Ultimately, the goal of a CRM campaign is to generate salesfor the brand in order to donate to the cause. This marketingstrategy is designed to give consumers the incentive to buythat brand based on the altruistic motivations. Given the strongaffective association between the cause and the brand that isformed by the alliance and the fact that the donation will bemade to the cause based on purchasing the brand, it isanticipated that attitude toward the alliance will affect thepurchase intent.
Consistent with the above discussion, the study reflects thesame, that there is significant favourable moderating effect ofattitude towards cause brand alliance on the relationshipbetween the at t i tude towards company and purchaseintention. So, the marketers should be rigid in forming
association with cause and nonprofit organizations. CRMgenerally appeals only to those who are sympathetic towardscause, or to whom the cause is relevant. In a heterogeneoussociety it is difficult to find causes that appeal to all thesection of the market. Having said that a society characterizedby a strong social desirability bias toward specific cause-affection for a company that supports the cause does notspill over the market segment. So, the cause chosen should becongruent with the product/ brand to elicit more positiveattitudes towards company and influence purchasing theproduct. The associating organization should be familiar andhave good image in the market place.
Managerial implication
The study highlights the issues that managers need to considerwhile choosing partners in cause related marketing campaign.This research highlights the importance of choosing congruentpartners, something that is not always discussed in the marketplace. This research emphasize, on congruency between thepartners. The marketer has to form partnership with the causeagents who are credible, and also increase the company image.The partner should be compatible with the company image.The partner should not pose any risks and threats to thecompany image in the future.
The cause selected for the campaign need to be compatible tothe brand image and the characteristics of the product. Thecause should be felt important by the target customers of theproduct. In this regard the company need to consider theabove factors in designing the successful CRM campaign.
Limitation
The l imitat ion of the study is incorporat ing a printadvertisement in exclusion of other effective media vehicles.The print advertisement was adopted due to the limitation ofthe researcher. The other tools like press release or visualscan be more effective.
The study is done through an online survey and selected therespondents well versed English language. These are thepossible limitation of the study. The study hasn’t consideredthe respondents who do not have email ids and not well versedin English language. The online survey method with itsinherent limitations is also included in the study.
The final limitation of the study is the model itself, while themodel fit the data reasonably well, that does not mean it isthe only model or the best one to assess the relationships

SCMS Journal o f Indian Management , October - December, 2013 102
A Quarterly Journal
inherent in a CRM programme context. The determinants in
the study provide some indication of what influences the
endogenous variables; clearly there is unexplained variance in
the model. Therefore, while there may be other models with
greater explanatory power, this model does present a
reasonably good conceptualization.
Future Research
Future research needs to examine the different types of
congruency like cause - company product, consumer, brand
image and target group to determine, if these react in the same
manner. In addition, many issues such as donation structures
could be examined in the light of differing types of congruency.
Likewise, this research has examined only monetary gifts. An
important area of research regarding congruency would be the
donations of some other assets such as product in the place
of money.
The future research needs to concentrate on the Skepticism
of consumer in participating in these kinds of campaigns.
Generally, the public have some level of skepticism toward
companies participating in social initiatives. The future
research needs to explore the factors influencing the
skepticism.
Conclusion
Cause related marketing is essentially maintaining economic
success and commercial advantage by building good
relationship and trust. The customer wants a reliable supplier
of product with good reputation and quality in market, the
society and stakeholders have expecations at doing good to the
community by the organization. Cause related marketing is a
strategic tool to satisfy the commercial advantage and societal
expectations.
The present study has explored the relationship of very
important factor. Cause-brand alliance with purchase
intention. The entire study highlights one important thing to
be remembered by the organizations participating in CRM
campaigns is the image of product/Brand should be compatible
to the charity/ cause selected for association. The more
congruency between the brand and the charity, the higher will
be the positive attitude. The enhanced attitude will increase
the intention to purchase the product. Thus cause related
marketing is an innovative mix of promotion and philanthropy
designed by the marketers, to enhance the sales objective of
the organization.
References
Aaker, D. and P.Brown, (1972), “Evaluating vehicle source
effects.” Journal of Advertising Research, Vol. 12 No. 4,
pp. 11-16.
Adkins, S. (1999 b), “The wider benefits of backing a good
cause,” Marketing, 2 September: 20-21.
Barnes, N.G., and D.A. Fitzgibbons, (1992). “Strategic
marketing for charitable organizations.” Health
Marketing Quarterly, 9(3/4), 103-114.
Barone, M.J., A.D.Miyazai, and K.A. Taylor, (2000). “The
influence of cause related marketing on consumer choice:
Does one good turn deserve another?” Journal of the
Academy of Marketing Science, 28(2), 248-262.
Berger, I.E., P.H. Cunningham , and R.V. Kozinets, (1996).
The processing of cause related marketing claims: Cues,
biases or motivators? In 1996 AMA Summer Educators
Conference : Enhancing Knowledge Development in
Marketing,” Vol. 7, Cornelia Droge and Roger Calantone,
eds. Chicago: American Marketing Association, 71-72
Brown, T.J. and P.A.Dacin, (1997). “The Company and the
product: corporate associations and consumer product
responses,” Journal of Marketing, Vol. 61 No.1, 68-84.
Caesar, P. (1986). “Cause related marketing: the new face of
corporate philanthropy,” Business and Society Review,
Vol. 59, 15-20.
Cone C. (2000), Cause Branding in the 21st Century, Retrieved
January 25,2001
Cooperman, A. (2005), Cause and effect; tsunami aid is
goodwill and good business, The Washington Post,
January 26, p. E01.
Cornwell, T.B., 1995. Sponsorship-Linked Marketing
Development. Sport Marketing Quarterly. 4(4), 13-24.
Drumwright, Minette E. (1996), Company Advertising with
a Social Dimension: The Role of Noneconomic Criteria,
Journal of Marketing, 60 (October), 17–87.
Einwiller, S., A. Fedorikhin, A. Johnson, and M. Kamins,
(2006). “Enough is enough! When identification no
longer prevents negative corporate associations.”
“Journal of the Academy of Marketing Science, 34, 185-
194.

SCMS Journal o f Indian Management , October - December, 2013 103
A Quarterly Journal
Higgins, K.T. (1986), “Cause related marketing: does it passthe bottom line test?,” Marketing News, Vol. 20 No. 10,1-4.
Kamins, Michael A., and Kamal Gupta (1994), Congruencebetween spokesperson and product type: A MatchupHypothesis Perspective, Psychology and Marketing,11 (6), 569–586.
Keller, Kevin L. (1998), Strategic Brand Management, UpperSaddle River, NJ: Prentice-Hall.(2003),Brand Synthesis:The Multidimensionality of Brand Knowledge, Journalof Consumer Research, 29 (March), 595–600.
Kotler, P. (1972), “A generic concept of marketing,” Journal
of Marketing, Vol. 36 No. 2, 45-54.
Kotler, P. and Levy, S. (1969), “Broadening the concept ofmarketing,” Journal of Marketing, Vol. 23 No. 1, 10-15.
Lawrence, E.L. (1993), Doing Well While Doing Good,Prentice-Hall, Englewood Cliffs, NJ.
Lafferty, B., R.Goldsmith, and T.Hult, (2004), “The impactof the alliance on the partners: a look at cause-brandalliances,” Psychology and Marketing, Vol. 21 No. 7,509-31.
Lutz, Richard. (1985), “Affective and cognitive antecedentsof attitude toward the Ad: A conceptual framework,Psychological process and advertisement effect” Theory,
Research and Application, Linda and Andrew Mitchell,eds, Hillsdale, NJ.
Mohr L.A., D.J. Webb and K.E. Harris, (2001), “Doconsumers expect companies to be socially responsible?
The impact of corporate social responsibility on buying
behaviour.” The Journal of Consumer Affairs, Vol. 35
No. 1, 47-72.
Polonsky, M.J. and G. Wood, (2001), “Can the over
commercialization of cause related marketing harm
society?,” Journal of Macro marketing, Vol. 21 No. 1,
8-22.
Ross J.K., M.A. Stutts, and L. Patterson, (1990-1991)
“Tactical Considerations for the Effective Use of Cause-
Related Marketing.” Journal of Applied Business
Research, 7 (2) 58-66.
Shell, A. (1989) Cause related marketing: big risks, big
potential. Public Relations Journal, Vol. 45 No. 7, 8-13.
Speed, R. and P. Thompson, (2000). “Determinants of sports
sponsorship response.” Academy of Marketing Science
Journal, Vol. 28 No. 2, 226.
Till, B. and L. Nowak (2000). “Using toward effective use of
cause-related marketing alliances,” Journal of Product
and Brand Management, Vol. 9 No. 7, 472-84.
Varadarajan, P.R., and A.Menon (1988). “Cause related
marketing: A co alignment of Marketing Strategy,”
Journal of Marketing 52 (3) 58-75.Vol. 17 No. 2, 226-
38.
Webb, D.J. and L.A.Mohr (1998). “A typology of consumer
responses to cause related marketing: from skeptics to
socially concerned,” Journal of Public Policy and
Marketing, 17(2), 226-238.

SCMS Journal o f Indian Management , October - December, 2013 104
A Quarterly Journal
SCMS Journal o f Indian Management , October - December, 2013 105
A Quarterly Journal
SCMS JOURNAL OF INDIAN MANAGEMENT
Aims and Scope
The SCMS Journal of Indian Management is a blind peer-reviewed Journal. The Journal deems it its mission tosubmit to the readers fresh fruit of management thoughts and rich cream of current innovative research. The format ofthe Journal is designed reader-friendly. The academia and the corporates have an easy access to the Journal.
The Journal looks for articles conceptually sound, at once methodologically rigorous. The Journal loves to deal knowl-edge in management theory and practice individually and in unison. We wish our effort would bear fruit. We hope theJournal will have a long life in the shelves catering to the needs of b-students and b-faculty.
§ Proposals for articles that demonstrate clear and bold thinking, fresh and useful ideas, accessible and jargon-free expression, and unambiguous authority are invited. The following may be noted while articles are pre-pared.
§ What is the central message of the article you propose to write? Moreover, what is new, useful, counterintuitive,or important about your idea?
§ What are the real-world implications of the proposed article? Can the central message be applied in businessestoday, and if so, how?
§ Who is the audience for your article? Why should a busy manager stop and read it?
§ What kind of research have you conducted to support the argument or logic in your article?
§ What academic, professional, or personal experience will you draw on to make the argument convincing? Inother words, what is the source of your authority?
§ The manuscript of reasonable length shall be sent to the Editor—SCMS Journal of India Management (Both forpostal and electronic submission details are given here under).
The manuscript should accompany the following separately:
§ An abstract (about 100 words), a brief biographical sketch of above 100 words for authors describingdesignation, affi l iat ion, specialization, number of books and art icles published in the referee journals,membership on editorial boards and companies etc.
§ The declaration to the effect that the work is original and it has not been published earlier shall be sent.
§ Tables, charts and graphs should be typed in separate sheets. They should be numbered as Table 1, Graph 1 etc.
§ References used should be listed at the end of the text.
§ Editors reserve the right to modify and improve the manuscripts to meet the Journal’s standards of presentation andstyle.
§ Editors have full right to accept or reject an article for publication. Editorial decisions will be communicated within a period of four weeks of the receipt of the manuscripts.
§ All footnotes will be appended at the end of the article as a separate page. The typo script should use smaller size fonts.
Address for SubmissionElectronic Submission : E-mail: edi [email protected]/
[email protected] electronic submission must be in the form of an attachment with a coveringletter to be sent as e-mail
Post Submission : The EditorSCMS Journal of Indian Management,SCMS New Campus, Prathap Nagar, Muttom,Aluva – 683106, Kochi, Kerala, IndiaPh : +91 484 2623803, 2623804, 2623885, 2623887Fax : +91 484 2623855

SCMS Journal o f Indian Management , October - December, 2013 106
A Quarterly Journal
CERTIFICATE OF REGISTRATION
Title of Newspaper : SCMS JOURNAL OF INDIAN MANAGEMENT
Language : English(in which it is to be published)
Registration Number : KERENG/2009/32718
Periodicity of the publication and the : Quarterlyday on which it is published 1 January, 1 April, 1 July, and 1 October
Retailing Selling price of the : ` 1000/- (One Year Subscription)Journal
Publisher’s Name : Dr. D. Radhakrishnan Nair
Nationality : Indian
Address : 25/74, Ambady,Kothamangalam-686691, Ernakulam.
Place of publication : Prathap Nagar, Muttom,(with complete Postal address) Aluva-683106, Ernakulam District, Kerala.
Printer’s Name : Dr. D. Radhakrishnan Nair
Nationality : Indian
Address : 25/74, Ambady,Kothamangalam-686691, Ernakulam.
Name of the Printing Press(with complete address where printing : Maptho Printings, Kalamassery, Cochin-683104is to be conducted)
Editor’s Name : Dr. D. Radhakrishnan Nair
Nationality : Indian
Address : 25/74, Ambady,Kothamangalam-686691, Ernakulam.
Owner’s Name : SCMS COCHIN SCHOOL OF BUSINESS
Place : Prathap Nagar, Muttom.

SCMS Journal o f Indian Management , October - December, 2013 107
A Quarterly Journal
SCMS Journal of Indian Managementa quarterly publication
ofSCMS COCHIN SCHOOL OF BUSINESS
Dates of Release: -
Number I – January-March on 1 April
Number II – A p r i l - J u n e o n 1 J u l y
Number III – July-September on 1 October
Number IV – October-December on 1 January
© SCMS Journal of Indian Management, SCMS New Campus, Prathap Nagar, Muttom, Aluva-683106, Kochi, Kerala, IndiaPh: 91-484-262 3803 / 262 3804 / 262 3885 / 262 3887 Fax: 91-484-262 3855, Website: www.scms.edu.inE-mail:[email protected] / [email protected], Journal Website : www.scms.edu.in/scmsjim
All rights reserved. No part of this publication may be reproduced in any form without the written consent of thepublisher. School of Communication and Management Studies and SCMS Journal of Indian Management assume noresponsibility for the views expressed or information furnished by the authors. Edited and published by the Editorfor and on behalf of SCMS and printed at Maptho Printings, Cochin-683104.
SCMS Journal of Indian ManagementSCMS COCHIN SCHOOL OF BUSINESS
SCMS New Campus, Prathap Nagar
Muttom, Aluva-683 106, Kochi, Kerala, India
Ph: 91-484-262 3803 / 262 3804 / 262 3885 / 262 3887 Fax: 91-484-262 3855
E-mail: ed i [email protected] / scmsedi [email protected]
Website: www.scms.edu.in/scmsjim

SCMS Journal o f Indian Management , October - December, 2013 108
A Quarterly Journal
Name :
Address :
City :
Zip Code :
Country :
E-mail :
Phone :
Draft Number :
(in favour of “SCMS Cochin”)
Advertisement Rate
Outside back cover : 30,000 in colour, 15,000 in black and white
Inside front cover : 17,500 in colour, 10,000 in black and white
Inside back cover : 15,000 in colour, 6,000 in black and white
Inner full-page : 7500 in colour, 4,000 in black and white
Inner half-page : 5000 in colour, 3,000 in black and white
Subscription Rates 1 Year 2 Years Per Issue
Companies/Academic Institutes: 1000 ($60) 1800 ($100) 250 ($15)
Individual 800 1500 200
SCMS Journal of Indian Management
Subscription / Advertisement Form
Contact:Editor, SCMS Journal of Indian Management, Prathap Nagar, Muttom,
Aluva - 683106, Ernakulam, Kerala, India.Phone: 91-484-262 3803 / 262 3804 / 262 3885 / 262 3887 Fax: 91-484-262 3855E-mail: [email protected], Journal Website: <www.scms.edu.in/scmsjim>


ISSN 0973-3167Registration Number: KERENG/2009/32718
Edited, printed and published by Dr. D. Radhakrishnan Nair on behalf of SCMS-COCHIN [School of Communication and Management Studies] and pr in ted
at Maptho Printings, Kalamassery, Cochin-683104 and published at Muttom, Aluva-683106, Cochin.
For information, please visit our website <www.scmsgroup.org>
SCMS COCHIN Estd. 1976
(SCHOOL OF COMMUNICATION AND MANAGEMENT STUDIES)PRATHAP NAGAR, MUTTOM, ALWAYE, COCHIN-683106, KERALA, Ph: 0484 - 2623803/04, 2623885/87, Fax: 0484-2623855
Email: [email protected], Website: <www.scmsgroup.org>Journal Website: <www.scms.edu.in/scmsjim>
SCMS-COCHIN-The first
accredited, AIU recognized and ISO certified
business school inSouthern India
♦ Recognized as equivalent to MBA by theAssociation of Indian Universities (AIU).
♦ Centrally air-conditioned world-class campus, anexcellent team of 56 full time faculty, well-stockedlibrary, full-fledged computer centre, superiorteaching aids etc.
♦ Academic tie-ups with Foreign Universities to givethe programme global focus and innovation. Ninefaculty members from the universities of USA,Australia & Switzerland teach full course at SCMS.
♦ Dewang Mehta National Award for excellence inleadership training systems.
♦ Impact Marketing National Award forintegration of exceptional communication skilldevelopment system.
♦ The only recipient of a grant for track record inperformance from AICTE.
♦ Ranking within the first 25 B.Schools in theA++ category.
♦ Only B.School which has a Universityapproved Research Centre for PhD inManagement.
♦ Only B.School in India to establish a Chair forClimate Change.
♦ SCMS-COCHIN is, now, one of the sevenACBSP (US) accredited B-Schools in India.
PGDM of SCMS
ISSN-0973-3167
Estonia’s Export-led Path to Prosperity : Since IndependenceKishore G. Kulkarni and Brian Patrick Sara
Institutional Capacity Building : A Systematic Approach R. Krishnaveni and R Sujatha
Consumer Behaviour : Kitchen DurablesAnilkumar N. and Jelsy Joseph
Work Life Balance : Women Police ConstablesS. Padma and Sudhir Reddy
Linkages Among Stock Markets: Asia - Pacific RegionM.S. Ramaratnam, R. Jayaraman and G. Vasanthi
Organizational Health : Knowledge Based Sectoral EmployeesP. Sivapragasam and R. P. Raya
Managing Non -financial Risks : Business & GrowthBhavana Raj and Sindhu
Global Competitiveness: World Passenger Car IndustryAtul Mittal, Paroma Mitra Mukherjee, and Dilip Roy
Enablers and Disablers : Academic and Job PerformanceApurva Lagwankar, Anamika Sinha, and Tripura Sundari Joshi
Cause - brand alliance : Purchase IntentionKota Neel Mani Kanta, D.V. Ramana and P. Srivalli
SCMS-COCHIN [Night View]
INDIA Inc. emerges from here at SCMS-COCHIN
SC
MS
Jo
urn
al o
f In
dia
n M
anag
emen
t,
Vo
lum
e X
, N
um
ber
4,
O
ctob
er -
Dec
embe
r 2
01
3,
Pag
es 1
-108
SCMS COCHIN SCHOOL OF BUSINESS, INDIA
ACCRE D I T E D
B . S C H O O L