ICON plcGoldman Sachs Mid-Cap
ConferenceMarch 11th 2005
ICON plcGoldman Sachs Mid-Cap
ConferenceMarch 11th 2005
www.iconclinical.comwww.iconclinical.com

Overview
www.iconclinical.comwww.iconclinical.com
Certain statements contained herein including, without limitation, statements
containing the words “believes,” “anticipates,” “intends,” “expects” and words
of similar import, constitute forward-looking statements concerning the
Company's operations, performance, financial condition and prospects.
Because such statements involve known and unknown risks and uncertainties,
actual results may differ materially from those expressed or implied by such
forward-looking statements. Given these uncertainties, prospective investors
are cautioned not to place undue reliance on such forward-looking statements.
The Company undertakes no obligation to publicly update or revise any forward-
looking statements, whether as a result of new information, future events or
otherwise.
Forward Looking Statements

Snapshot
www.iconclinical.comwww.iconclinical.com
Fourth largest Clinical CRO in the world
Quintiles
PPD
Parexel
ICON
Dedicated team model and quality ethos differentiates ICON from competitors
Over $300m in Net Revenues and approx 2700 staff
37 offices in 23 countries on five continents

Offices: US
www.iconclinical.comwww.iconclinical.com
Chicago
Houston
Nashville
Tampa
San Francisco
Irvine
Baltimore
Raleigh-Durham
New York City
Long Island
Philadelphia
Delaware
Doylestown

Offices: Europe and Middle East
www.iconclinical.comwww.iconclinical.com
Riga
Amsterdam
Frankfurt
MarlowStockholm
Dublin
Manchester
Eastleigh
Paris
Tel Aviv
Moscow
Barcelona
Budapest

Offices: ROW
www.iconclinical.comwww.iconclinical.com
Sydney
Buenos Aires
Johannesburg
Taiwan
Seoul
Bangkok
Singapore
Chennai
Tokyo
Hong Kong
Montreal

www.iconclinical.comwww.iconclinical.com
Current Services in Drug Development
Pre-clinical Phase I Phase II Phase III Launch Phase IV
6% Strategic Drug Development and Regulatory Consulting (US & EU)
5% Phase I
8% Central lab (Global)
16% Data Management & Statistical Consulting (Global)
57% Trial Management & Monitoring (Global)
2.5% Contract Staffing (US)
2.5% Central Imaging Lab (US & EU)
3% IVRS (Global)

ICON plc
Market Dynamics
ICON plc
Market Dynamics
www.iconclinical.comwww.iconclinical.com

Three Elements Supporting Growth
www.iconclinical.comwww.iconclinical.com
Growth in Underlying spending (1)
Total 2005 R&D spend estimated at > $82bn; 10% growth forecast to continue
Total 2005 Development Spend estimated at >$54bn; 11% growth forecast
Continued growth in outsourcing(1)
Industry estimated to outsource approximately 27% of development and growing by 1% per annum.
Market growth estimated at 14%
Pharma reducing supplier numbers
Fewer CROs servicing Large Pharma = Market share gains for Global and multi-service CROs
(1) Source Jeffries & Co.

Strong Market Strong Market EnvironmentEnvironment
Preferred Providers
Improving Pipelines
Biotech / Specialty Companies
Regulatory Environment
www.iconclinical.comwww.iconclinical.com

RFP Volume / Value Trends – US
Last 4 Quarters
www.iconclinical.comwww.iconclinical.com
53.0%
14%
-23%
36%
-25.0%
-15.0%
-5.0%
5.0%
15.0%
25.0%
35.0%
45.0%
55.0%
65.0%Q
3
Ma
y-04
Au
g-04
No
v-04
RFP Value Growth
66%
43%39%
-5%
-25.0%
-15.0%
-5.0%
5.0%
15.0%
25.0%
35.0%
45.0%
55.0%
65.0%
75.0%
RFP Volume Growth

Bio-Tech, Mid-Sized and Japanese companies are now significant outsourcers
www.iconclinical.comwww.iconclinical.com
Biotech and specialty companies account for a growing percentage of projects in development: 55% of 2002 Clinical trials are derived from biotech companies.
Currently estimated to be more compounds in development in biotech/specialty than in all of Top 20 Pharma
ICON’s sales to non Top 20 pharma companies have been rising strongly:
16% 14%23% 22%
13% 11%
5% 12%
12% 17%27% 31%
0%
10%
20%
30%
40%
50%
FY2000 FY2001 FY2002 FY2003 FY2004 FY2005YTD
% o
f IC
ON
re
ve
nu
es
Non-Bio / Non-Big Pharma Biotech
21%26%
35%39% 40% 42%
Scope for
Growth

www.iconclinical.comwww.iconclinical.com
ICON Gross Business WinsLast 9 Quarters
$72 $73
$93
$136
$84
$101 $99$93
$129
$0$10$20$30$40$50$60$70$80$90
$100$110$120$130$140$150
Q2 Nov02
Feb-03 May-03 Aug-03 Nov-03 Feb-04 May-04 Aug-04 Nov-04
$ m
illio
ns

Total Backlog $Millions
$241 $246$223 $235
$276 $282
$336 $327$352
$422 $427
$464$488
$450 $453
$0
$50
$100
$150
$200
$250
$300
$350
$400
$450
$500
May-01 Aug-01 Nov-01 Feb-02 May-02 Aug-02 Nov-02 Feb-03 May-03 Aug-03 Nov-03 Feb-04 May-04 01-Aug Nov-04
$ m
illi
on
s

www.iconclinical.comwww.iconclinical.com
ICON plcFinancial
Performance(Fiscal Years ending May
31)
ICON plcFinancial
Performance(Fiscal Years ending May
31)

www.iconclinical.comwww.iconclinical.com
$60
$81
$116
$157
$226
$297
$0
$100
$200
$300
FY1999 FY2000 FY2001 FY2002 FY2003 FY2004
Mil
lio
ns
Net Revenue CAGR of 38% over last 5 Years
CAGR 38%

www.iconclinical.comwww.iconclinical.com
$0.23
$0.48
$0.66 $0.70
$0.92
$1.16
$1.50
$1.88
$0.00
$0.20
$0.40
$0.60
$0.80
$1.00
$1.20
$1.40
$1.60
$1.80
$2.00
FY1997 FY1998 FY1999 FY2000 FY2001 FY2002 FY2003 FY2004
Millio
ns CAGR =35%
7 Years of Earnings Per Share Growth….

www.iconclinical.comwww.iconclinical.com
1.80%
0.80%
3.60%
1.30%
3.00%
4.30%
1.80%
3.00%
1.40%
0.60%
3.60%
2.30%1.70%
10.00%
0.40%
3.60%
0%
1%
2%
3%
4%
5%
6%
7%
8%
9%
10%
Q301
Q401
Q102
Q202
Q302
Q402
Q103
Q203
Q303
Q403
Q104
Q204
Q304
Q404
Q105
Q205
…However, ICON Has Traditionally Experienced Low Cancellation Rates but in Q1 05……
Cancellations as % of Opening Backlog
$46m cancellations inc. 2 major
projects

$4.1 $4.4 $4.6$5.1 $5.2
$6.3 $6.2
$7.2$7.6
$8.4$8.8
$7.0
$9.5$9.6
$0.0
$2.0
$4.0
$6.0
$8.0
$10.0
$12.0
Q102
Q202
Q302
Q402
Q103
Q203
Q303
Q403
Q104
Q204
Q304
Q404
Q105
Q205
$ M
illio
ns
www.iconclinical.comwww.iconclinical.com
Quarterly Revenue and Operating Profit
$36.2 $37.8 $39.6$43.0
$46.9
$53.5$59.3
$66.0$68.9
$73.2$79.5$78.3$77.9
$76.9

www.iconclinical.comwww.iconclinical.com
Quarterly EPS
15c
47c
51c 52c
41c
45c44c43c
38c36c
33c31c
29c28c27c25c
23c22c21c20c19c17c
-$0.05
$0.05
$0.15
$0.25
$0.35
$0.45
$0.55
Q1 Q2 Q3 Q4 Q1 Q2 Q3 Q4 Q1 Q2 Q3 Q4 Q1 Q2 Q3 Q4 Q1 Q2 Q3 Q4 Q1 Q2
FY2000 FY2001 FY2005FY2004FY2003FY2002

Summary Balance Sheet and Cashflow ($ millions)
www.iconclinical.comwww.iconclinical.com
Nov 30, 2004
(Half Year)
May 31, 2004(Year)
Cash and cash equivalents $71.0 $78.8
Total assets $370.4 $335.3
Total debt $10.0 $0.0
Shareholder’s equity $236.3 $216.8
Cashflow from operations ($2.0) $43.6
Capital expenditures $7.5 $13.1
Fully diluted shares outstanding
14.1 13.7
Current Issues /
Strategic
Development
Current Issues /
Strategic
Development www.iconclinical.comwww.iconclinical.com

Current Tactical Issues
Recovery from Exceptional Cancellation Quarter to Restore Growth
Net Wins $120m in Nov Qtr
Good net wins again expected for Feb quarter
www.iconclinical.comwww.iconclinical.com
Capitalise on Lab Investments and Sales Success to Eliminate Losses
Continue Sales Success
Add more major clients
Develop technological base

www.iconclinical.comwww.iconclinical.com
ICON LABS Net New Business Wins
Net Business Wins Book to Bill Ratio
$8.8
$6.6
$10.8$12.0
$4.9
$11.3
$6.9
$9.3
$0
$5
$10
$15
$20
Q3 03 Q4 03 Q1 04 Q2 04 Q3 04 Q4 04 Q1 05 Q2 05
$ m
illi
on
s
1.4
1.8
1.5
1.1
0.7
1.41.9
0.97
Average
Book-to-Bill
1.35

Strategic MissionStrategic Mission
To continue to develop our business as a global, full service, clinically focused CRO, and to leverage the synergies between our multiple services.
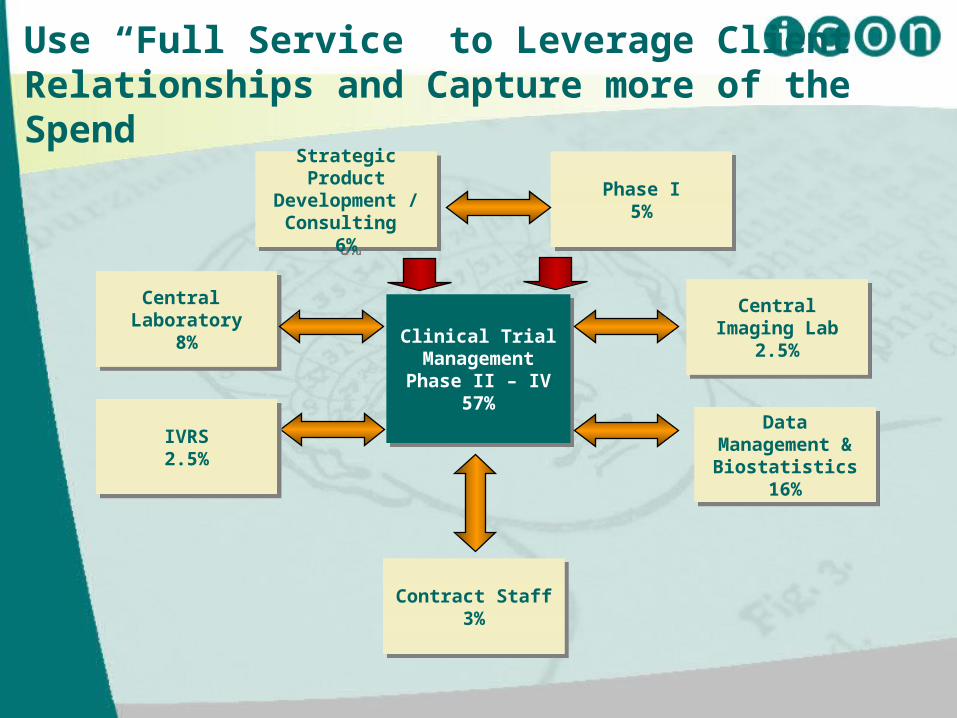
Use “Full Service” to Leverage Client Relationships and Capture more of the Spend
Strategic ProductDevelopment /
Consulting 6%
Strategic ProductDevelopment /
Consulting 6%
Clinical Trial ManagementPhase II – IV
57%
Clinical Trial ManagementPhase II – IV
57%
Phase I5%
Phase I5%
Central Laboratory
8%
Central Laboratory
8%
IVRS2.5%
IVRS2.5%
Contract Staff3%
Contract Staff3%
Central Imaging Lab2.5%
Central Imaging Lab2.5%
Data Management &
Biostatistics16%
Data Management &
Biostatistics16%

Current Current Strategic Strategic InitiativesInitiatives
Investing in Operations in Japan
Creation of Data Management Operation in India
Partnership with Medidata Solutions in EDC
Developing specialised Phase IV Division
New IT in 2005 to enhance efficiency
New Trial Management and Project Collaboration Systems
New Document Management System
New eLearning System

Current Current Acquisition / InvestmentAcquisition / InvestmentFocusFocus
Central Labs
to increase scale
Additional Central Imaging Expertise
to broaden offering
Phase I in US
to compliment EU facility
Analytical Labs
to compliment EU facility
New Expertise in any of core areas
to add scale / unique expertise

OrganicOrganic
Get more business from current clients
Add new clients
Sell more new services - IVRS/Lab/Consulting/Phase I
Expand global presence
Increase therapeutic experience
AcquisitionsAcquisitions Add new services and broaden existing ones
GoalGoal To be the best
Future Development
www.iconclinical.comwww.iconclinical.com