HYPOTHESIS TESTING (TWO SAMPLE) - CHAPTER 8 1
PREVIOUSLY
• estimation
how can a sample be used to estimate the unknown parametersof a population
use confidence intervals around point estimates of centraltendency (mean) and variability (variance, standard deviation)
HYPOTHESIS TESTING (TWO SAMPLE) - CHAPTER 8 2
• hypothesis testing, single sample
does a population parameter estimated from sample data differfrom some claimed value
almost always results in the same answer as confidenceintervals - exception possible with proportions due to differencein how standard errors are calculated in hypothesis testingversus confidence intervals
• in either case, make a statement about a single parameterestimated from sample data
HYPOTHESIS TESTING (TWO SAMPLE) - CHAPTER 8 3
NEW QUESTION
• test a claim about two parameters, both estimated with sampledata
• Rosner - underlying parameters of two different populations,neither of whose values are known, are compared
• more frequently encountered than one sample hypothesistesting

HYPOTHESIS TESTING (TWO SAMPLE) - CHAPTER 8 4
Example from Rosner - what is the relationship between oralcontraceptive (OC) use and the level of blood pressure (BP) inwomen - two different approaches...
LONGITUDINAL STUDY
• identify a group of non-pregnant, pre-menopausal women ofchildbearing age who are not OC users and measure their BP(baseline value)
• rescreen the women after one year and find all the women whoremained non-pregnant throughout the year and who havebecome OC users - this is the study population
• measure the BP of the women in the study population andcompare the values to the baseline values (two groups of thesame women, measuring BP at two different times)
HYPOTHESIS TESTING (TWO SAMPLE) - CHAPTER 8 5
CROSS-SECTIONAL STUDY
• identify two groups of non-pregnant, pre-menopausal women ofchildbearing age, one of OC users and another that does notuse OC, measure their BP
• compare the BP of the OC users and non-users (two groups ofdifferent women, measuring BP at the same time)

HYPOTHESIS TESTING (TWO SAMPLE) - CHAPTER 8 6
LONGITUDINAL STUDY
• same group of people followed over time
• paired-sample design - each person within the group serves ashis/her own control
• also possible to have measurements on two different peoplewho have been matched to each other based on criteria suchas age and sex
• the two samples are NOT independent
HYPOTHESIS TESTING (TWO SAMPLE) - CHAPTER 8 7
CROSS-SECTIONAL STUDY
• different groups of people
• the two sample are INDEPENDENT

HYPOTHESIS TESTING (TWO SAMPLE) - CHAPTER 8 8
WHAT TYPE OF STUDY IS BETTER FOR OC AND BP
• longitudinal helps to rule out other factors (confounders) thatmight also influence BP
• harder to rule out other factors in a cross-sectional study(statistical methods often used for adjusment)
• IMPORTANT to remember that different statistical methods areused to test for differences in NON-INDEPENDENT versusINDEPENDENT data

HYPOTHESIS TESTING (TWO SAMPLE) - CHAPTER 8 9
INDEPENDENT SAMPLES
• proportions
proportions are based on data from two random samples thatare independent (values in one sample are not related to valuesin the other), for example...
compare the ovarian cancer rates between a group of "lightOC users" (used OC for less than 5 years) and a group of"heavy OC users" (used OC for 5+ years)
Triola... for each sample, the NUMBER of successes and failuresis at least 5 (same as saying NP$5 and NQ$5)
Rosner... for each sample, NPQ$5 (normal approximation to thebinomial)

HYPOTHESIS TESTING (TWO SAMPLE) - CHAPTER 8 10
H p p0 1 2: =
• two-sample test for proportions (normal-theory)...
z p p p p pq n pq n= − − − +(( $ $ ) ( )) / ( / ) ( / )1 2 1 2 1 2
with a null hypothesis...
reduces to...
z p p pq n n= − +( $ $ ) / (( / ) ( / ))1 2 1 21 1
where...
p x x n n= + +( ) / ( )1 2 1 2
q p= −1
HYPOTHESIS TESTING (TWO SAMPLE) - CHAPTER 8 11
Example from Rosner - what is the relationship between oralcontraceptive (OC) use and heart disease in women... cross-sectional study...
among women 40-44 years of age...
13 of 5,000 OC users have an MI over a 3-year period7 of 10,000 non-OC users have an MI over a 3-year period
HYPOTHESIS TESTING (TWO SAMPLE) - CHAPTER 8 12
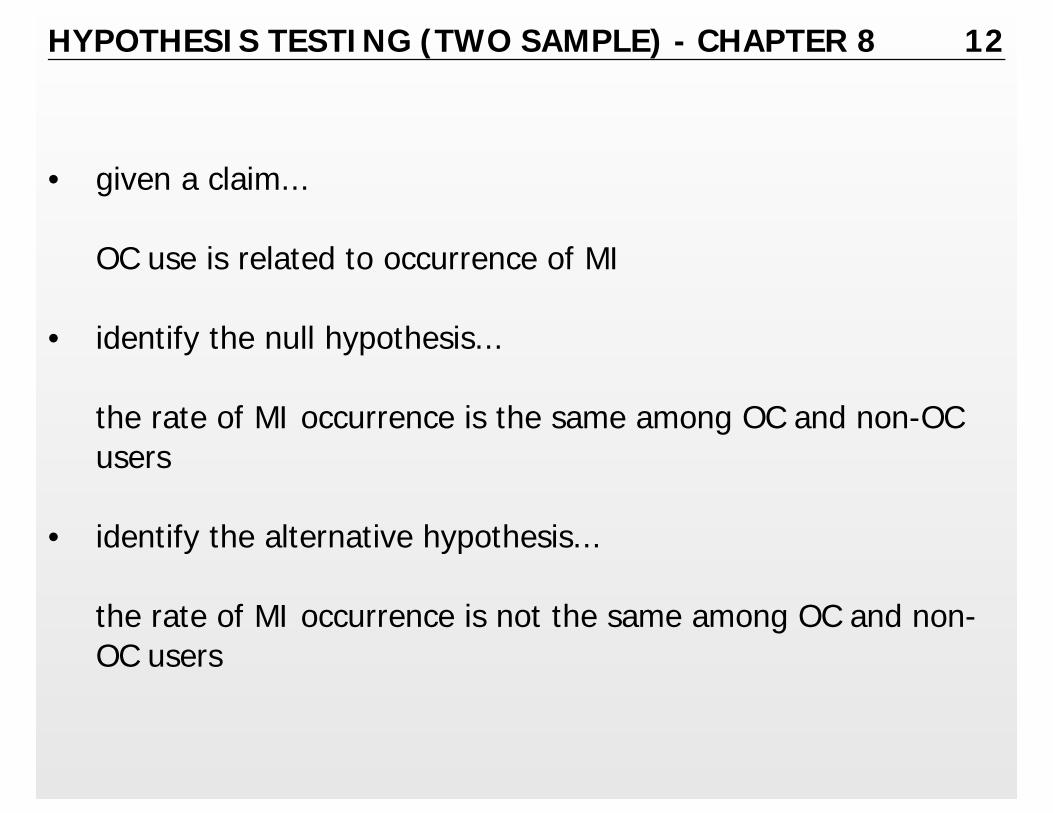
• given a claim...
OC use is related to occurrence of MI
• identify the null hypothesis...
the rate of MI occurrence is the same among OC and non-OCusers
• identify the alternative hypothesis...
the rate of MI occurrence is not the same among OC and non-OC users

HYPOTHESIS TESTING (TWO SAMPLE) - CHAPTER 8 13
• express the null and alternative hypothesis is symbolic form...
H p pH p p
0 1 2
1 1 2
::
=≠
• given a claim and sample data, calculate the value of the teststatistic...
p x x n n= + + = + + =( ) / ( ) ( ) / ( ) .1 2 1 2 13 7 5000 10000 0 00133$ / / .p x n1 1 1 13 5000 0 0026= = =$ / / .p x n2 2 2 7 10000 0 0007= = =
z p p pq n n= − +( $ $ ) / (( / ) ( / ))1 2 1 21 1z = − +( . . ) / ( . )( . )(( / ) ( / ))0 0026 0 0007 0 00133 0 99867 1 5000 1 10000z = =0 0019 00063 302. /. .
HYPOTHESIS TESTING (TWO SAMPLE) - CHAPTER 8 14
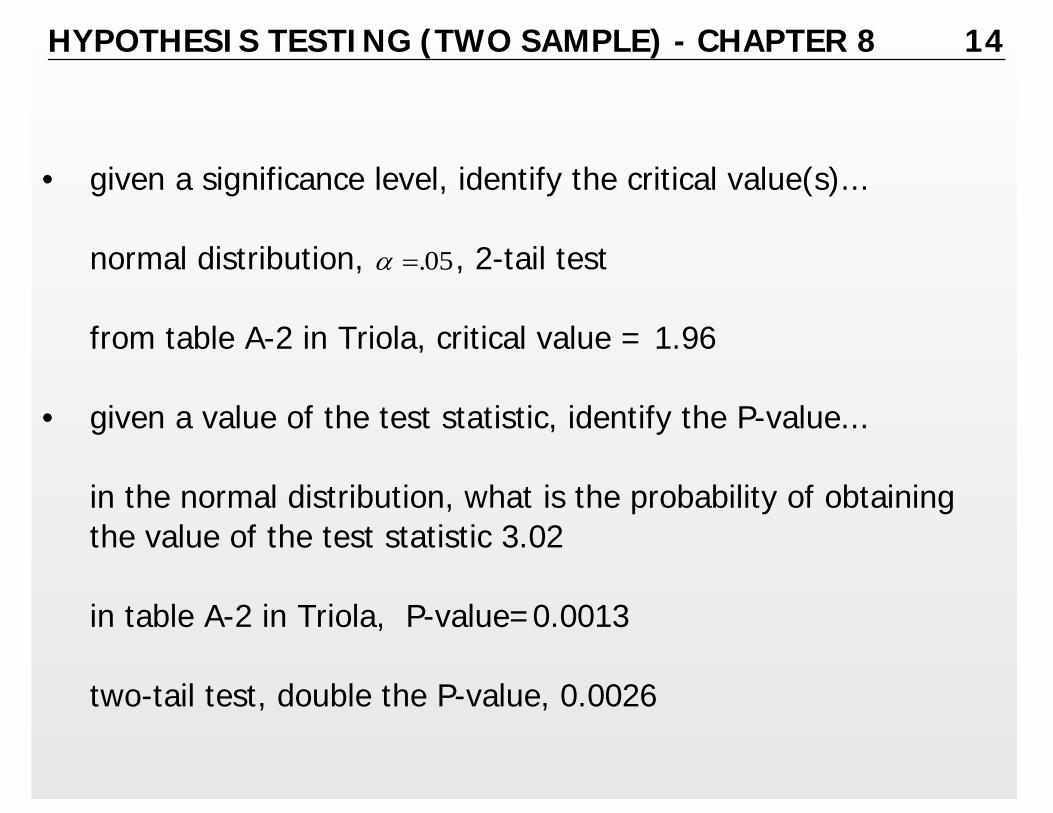
• given a significance level, identify the critical value(s)...
normal distribution, , 2-tail testα =.05
from table A-2 in Triola, critical value = 1.96
• given a value of the test statistic, identify the P-value...
in the normal distribution, what is the probability of obtainingthe value of the test statistic 3.02
in table A-2 in Triola, P-value=0.0013
two-tail test, double the P-value, 0.0026
HYPOTHESIS TESTING (TWO SAMPLE) - CHAPTER 8 15
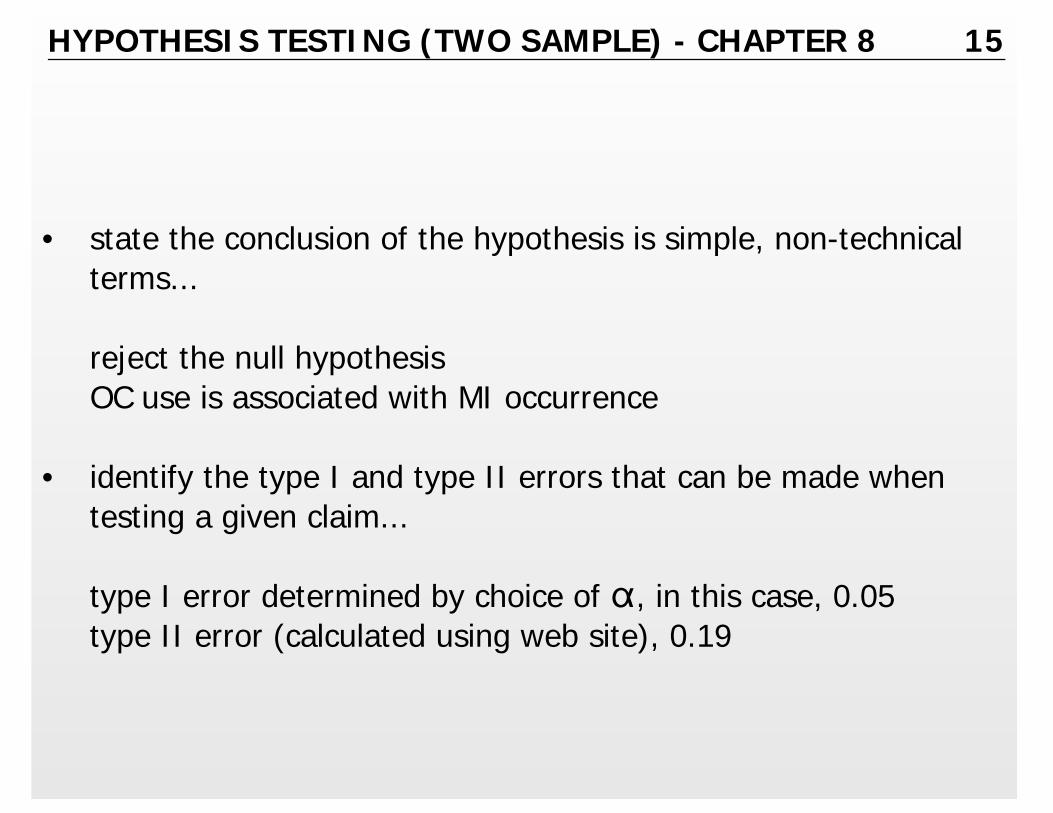
• state the conclusion of the hypothesis is simple, non-technicalterms...
reject the null hypothesisOC use is associated with MI occurrence
• identify the type I and type II errors that can be made whentesting a given claim...
type I error determined by choice of ", in this case, 0.05type II error (calculated using web site), 0.19

HYPOTHESIS TESTING (TWO SAMPLE) - CHAPTER 8 16
• NOTE: Rosner uses a continuity correction in the numerator ofthe equation used to calculate the value of the test statistic...
( $ $ ) (( / ) ( / ))p p n n1 2 1 21 2 1 2− − +( . . ) (( / ( )) ( / ( )))0 0026 0 0007 1 2 5000 1 2 10000− − +( . . ) (( / ) ( / )) .0 0026 0 0007 1 10000 1 20000 0 00175− − + =
applying the continuity correction leads to z=2.77 (not 3.02)

HYPOTHESIS TESTING (TWO SAMPLE) - CHAPTER 8 17
• compute a confidence interval for the difference between thetwo proportions
the pooled estimate of p is NOT used in calculating the marginof error...
E z p q n p q n= +α / ( $ $ / ) ( $ $ / )2 1 1 1 2 2 2
E = +196 0 0026 0 9974 5000 0 0007 0 9993 10000. / (( . )( . ) / ) (( . )( . ) / )
E = 0 0015.
confidence interval...
( $ $ ) ( ) ( $ $ )p p E p p p p E1 2 1 2 1 2− − < − < − +( . . ) . ( ) ( . . ) .0 0026 0 0007 0 0015 0 0026 0 0007 0 00151 2− − < − < − +p p0 0004 0 00341 2. ( ) .< − <p p
same conclusion as hypothesis test since 0 is outside the band

HYPOTHESIS TESTING (TWO SAMPLE) - CHAPTER 8 18
• compute a confidence band on both proportions and see if thebands overlap...
E z p q n
E1 2 1 1 1
1 196 0 0026 0 9974 5000 0 0014
=
= =α / $ $ /
. ( . )( . ) / .$ $ . . . .. .
p E p p E pp
1 1 1 1 1 10 0026 0 0014 0 0026 0 00140 0012 1 0 0040
− < < + = − < < +< <
E z p q n
Ep E p p E p
p
2 2 2 2 2
2
2 2 2 2 2
2
196 0 0007 0 9993 10000 0 00050 0007 0 0005 2 0 0007 0 0005
0 0002 0 0012
=
= =− < < + = − < < +
< <
α / $ $ /
. ( . )( . ) / .$ $ . . . .. .
confidence bands "close" to overlap (actually do overlap withless rounding of the values) --- "...rejection of the nullhypothesis by the method of overlap implies rejection by thestandard method, whereas failure to reject...does NOT implyfailure to reject by the standard method..." --- moreconservative, less powerful method
HYPOTHESIS TESTING (TWO SAMPLE) - CHAPTER 8 19
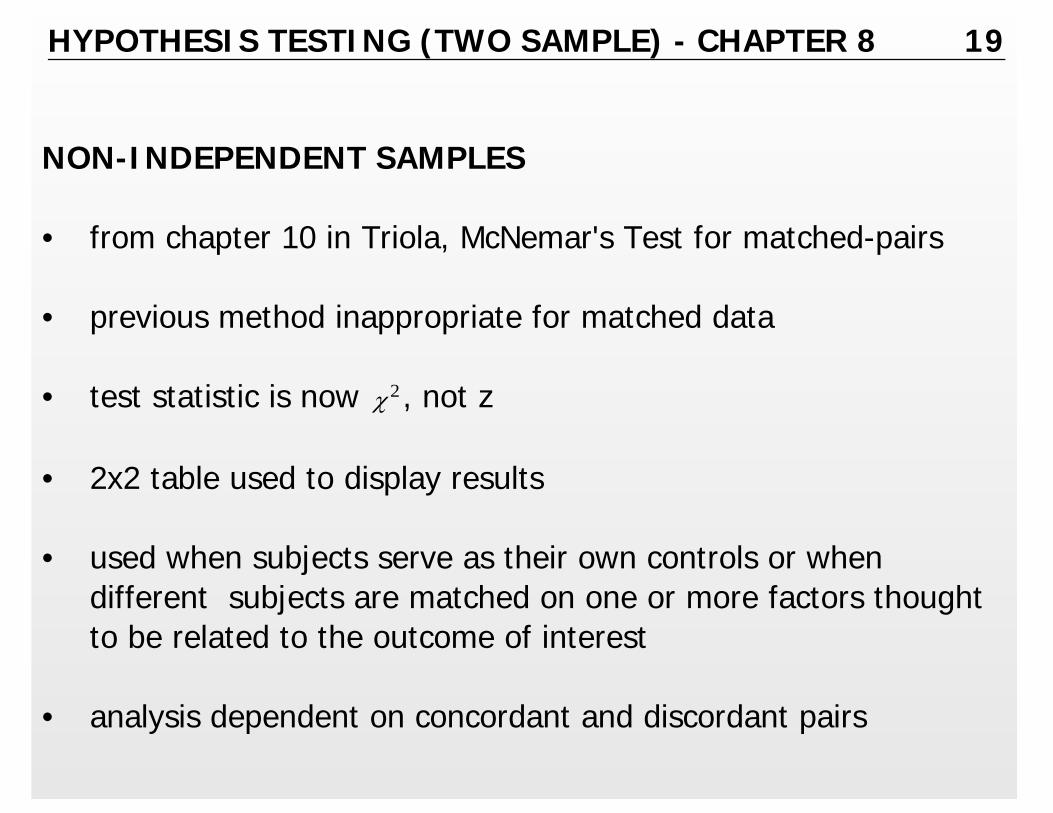
NON-INDEPENDENT SAMPLES
• from chapter 10 in Triola, McNemar's Test for matched-pairs
• previous method inappropriate for matched data
• test statistic is now , not zχ2
• 2x2 table used to display results
• used when subjects serve as their own controls or whendifferent subjects are matched on one or more factors thoughtto be related to the outcome of interest
• analysis dependent on concordant and discordant pairs

HYPOTHESIS TESTING (TWO SAMPLE) - CHAPTER 8 20
Modified example from Rosner... 22 patients have their bloodpressure evaluated by both a computerized device and the standardmethod (a person)... the results look as follows with...H-hypertensive, N-normal BP
person computer standard person computer standard
1 N N 12 H N
2 N N 13 H N
3 H N 14 N N
4 H H 15 H N
5 N N 16 N H
6 H N 17 H N
7 N N 18 H N
8 H H 19 N N
9 H H 20 N N
10 N N 21 N N
11 H N 22 N H

HYPOTHESIS TESTING (TWO SAMPLE) - CHAPTER 8 21
• question... are results different from the computer versus theperson
• wrong approach... compute proportion of hypertensive found byeach method...
p(computer) = 11/22 = 0.50p(standard) = 5/22 = 0.23
and compare with method shown for independent samples(looks as if there are 44 subjects, 22 in each group)
• correct approach... McNemar's Test
HYPOTHESIS TESTING (TWO SAMPLE) - CHAPTER 8 22
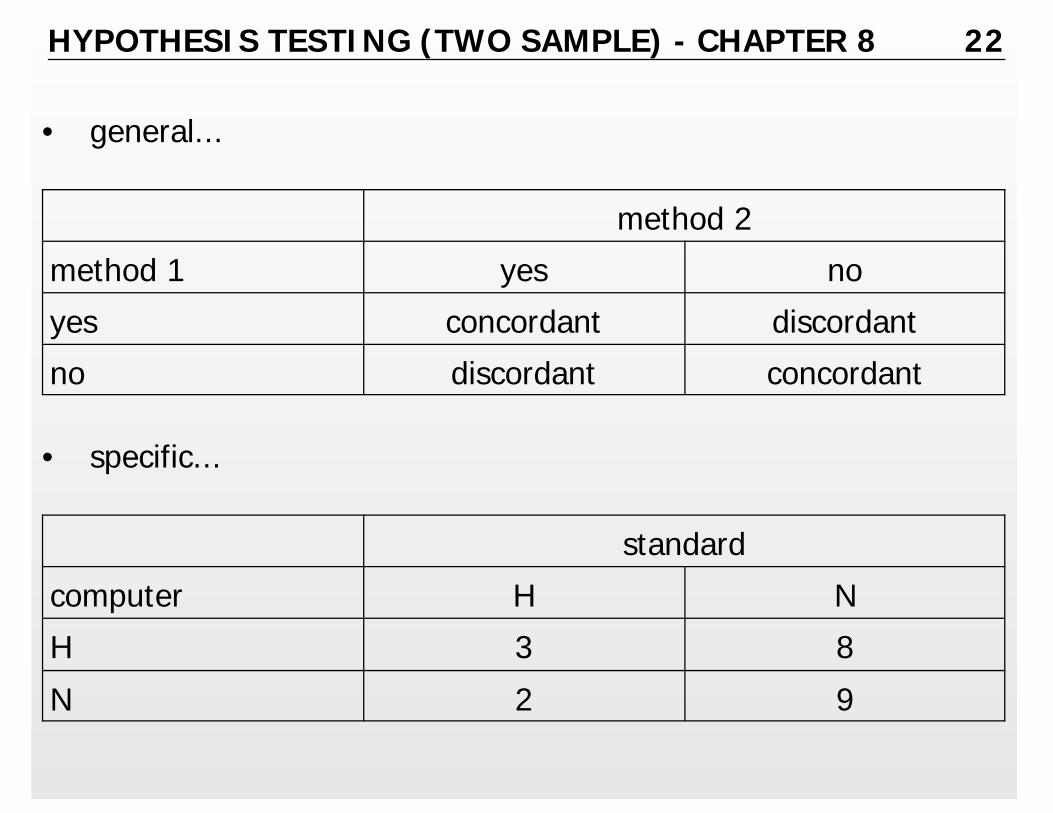
• general...
method 2
method 1 yes no
yes concordant discordant
no discordant concordant
• specific...
standard
computer H N
H 3 8
N 2 9

HYPOTHESIS TESTING (TWO SAMPLE) - CHAPTER 8 23
• requirements for using McNemar's Test
same issues as to sampling as before (random, representative)
sample data comprise matched-pairs
data are at a nominal level of measurement and eachobservation can be observation can be classified in two-ways (inthe example... method used, BP category)
number of discordant pairs $ 10 (Rosner... $ 20), otherwise anexact method must be used
• test statistic is χ2
• critical value located in right tail only with 1 degree of freedom

HYPOTHESIS TESTING (TWO SAMPLE) - CHAPTER 8 24
• claim... the two methods produce identical results
• null hypothesis... H p pH p p
0 1 2
1 1 2
::
=≠
• test statistic... χ
χ
2 2
2 2
1
8 2 1 8 2 2 5
= − − +
= − − + =
(| | ) / ( )
(| | ) / ( ) .
b c b c
• critical value... with "=0.05, 1 DF (table A-4), 3.841
• P-value... hard to determine from table in Triolause other tables (Rosner), or softwarefrom Statcrunch, P-value = 0.1138
• conclusion... fail to reject the null hypothesisno evidence to say the methods differ

HYPOTHESIS TESTING (TWO SAMPLE) - CHAPTER 8 25
• exact method (when number of discordant pairs < 10, but alsoworks anytime)
• based on exact binomial probabilities
if na = number of discordant pairs in which the group A memberhas the event and the group B member does not
if nd = total number of discordant pairs
binomial with p=0.5, n=nd, k=naif na<nd/2, p = 2 x probability of k events or lessif na>nd/2, p = 2 x probability of k events or moreif na=nd/2, p = 1
HYPOTHESIS TESTING (TWO SAMPLE) - CHAPTER 8 26
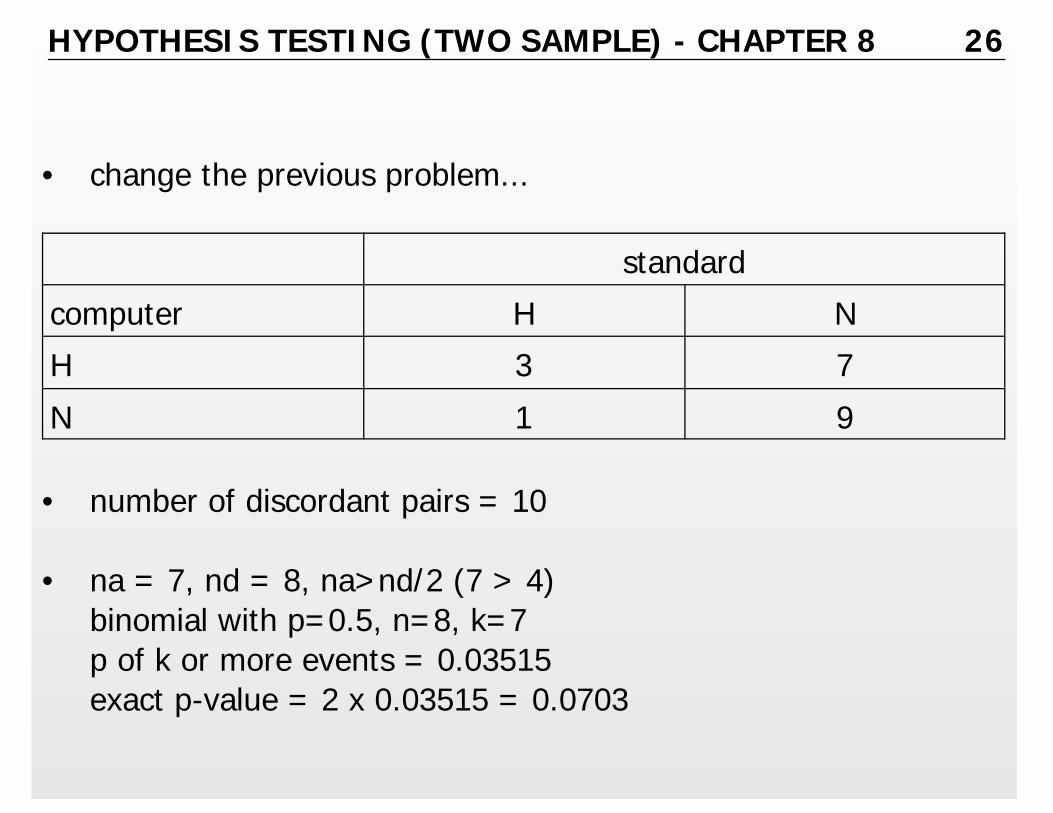
• change the previous problem...
standard
computer H N
H 3 7
N 1 9
• number of discordant pairs = 10
• na = 7, nd = 8, na>nd/2 (7 > 4)binomial with p=0.5, n=8, k=7p of k or more events = 0.03515exact p-value = 2 x 0.03515 = 0.0703
HYPOTHESIS TESTING (TWO SAMPLE) - CHAPTER 8 27
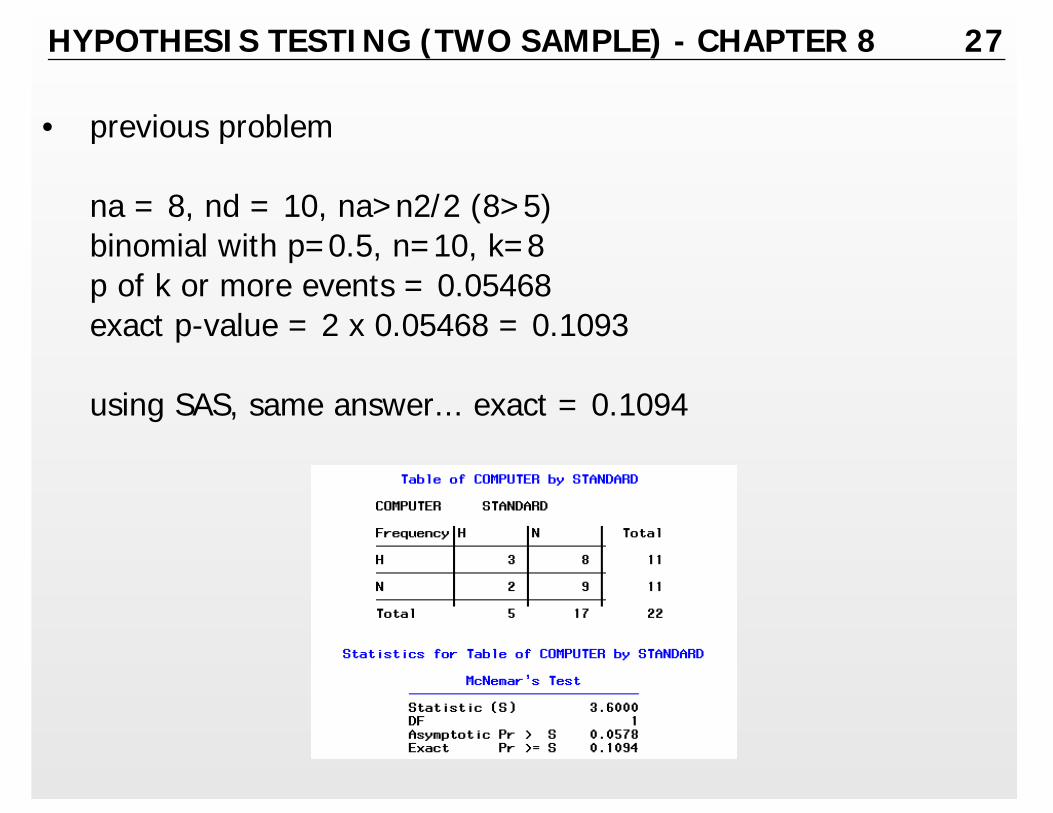
• previous problem
na = 8, nd = 10, na>n2/2 (8>5)binomial with p=0.5, n=10, k=8p of k or more events = 0.05468exact p-value = 2 x 0.05468 = 0.1093
using SAS, same answer... exact = 0.1094
HYPOTHESIS TESTING (TWO SAMPLE) - CHAPTER 8 28
• another type of matching, not same subjects...
example from Rosner... compare two different regimens ofchemotherapy for breast cancer after mastectomy... matchedstudy using two groups of women where pairs of women arematched on age and clinical condition... random member ofeach pair gets treatment A, other gets treatment B... outcomemeasure is survival at the end of 5 years of follow up
621 pairs (1242 women)526 (p=0.847) in group A survive515 (p=0.829) in group B survive
HYPOTHESIS TESTING (TWO SAMPLE) - CHAPTER 8 29
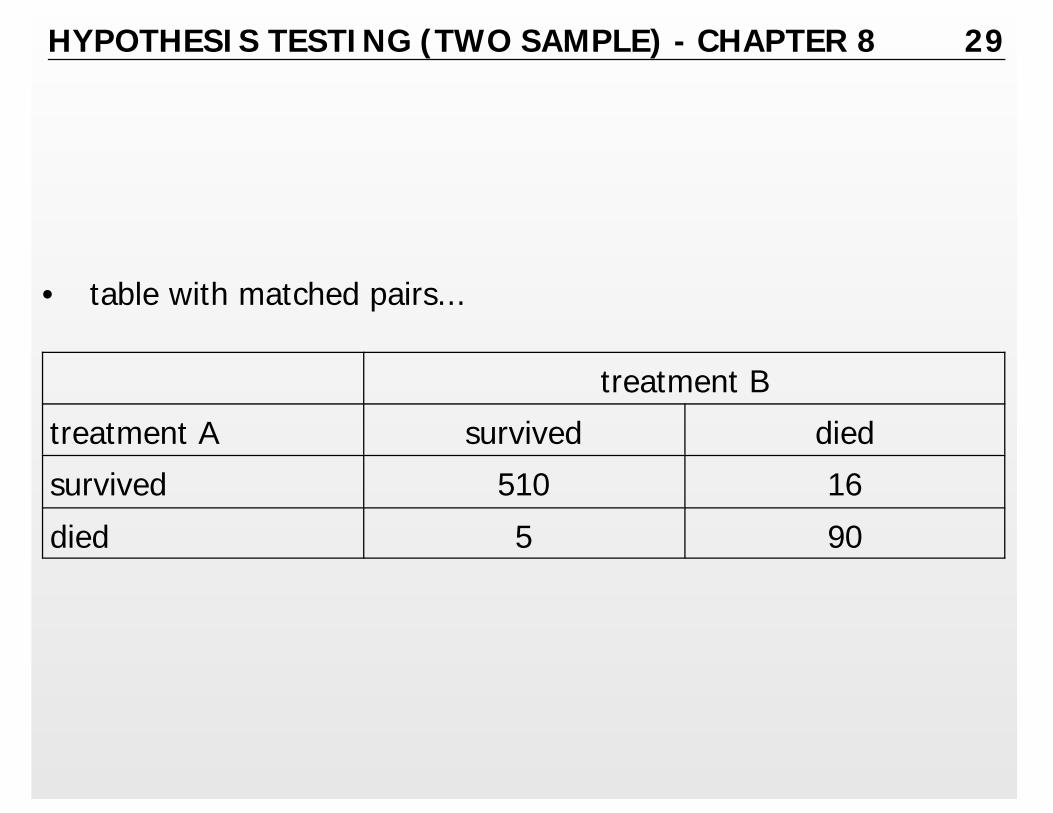
• table with matched pairs...
treatment B
treatment A survived died
survived 510 16
died 5 90
HYPOTHESIS TESTING (TWO SAMPLE) - CHAPTER 8 30
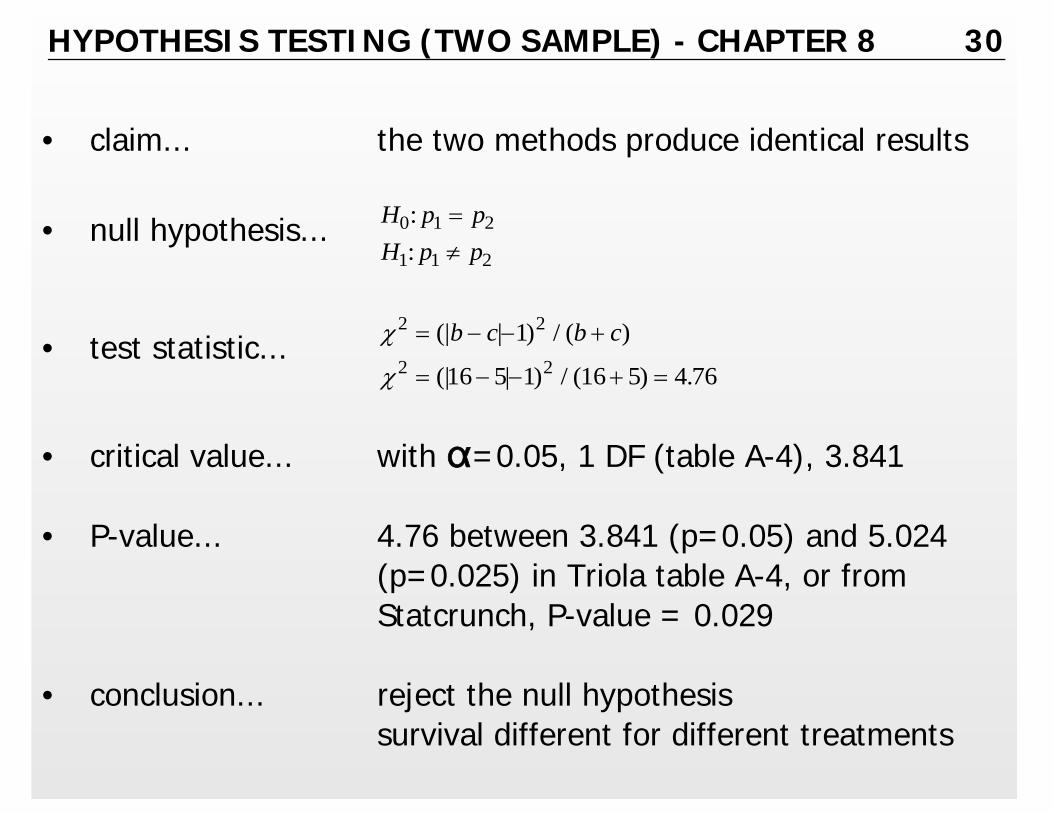
• claim... the two methods produce identical results
• null hypothesis... H p pH p p
0 1 2
1 1 2
::
=≠
• test statistic... χ
χ
2 2
2 2
1
16 5 1 16 5 4 76
= − − +
= − − + =
(| | ) / ( )
(| | ) / ( ) .
b c b c
• critical value... with "=0.05, 1 DF (table A-4), 3.841
• P-value... 4.76 between 3.841 (p=0.05) and 5.024(p=0.025) in Triola table A-4, or fromStatcrunch, P-value = 0.029
• conclusion... reject the null hypothesissurvival different for different treatments

HYPOTHESIS TESTING (TWO SAMPLE) - CHAPTER 8 31
MATCHED PAIRS
• continuous data
• test statistic is t
• requirements
same issues as to sampling as before (random, representative)
sample data comprise matched pairs
either or both conditions: number of matched pairs > 30;distribution of differences between matched pairs isapproximately normally distributed
HYPOTHESIS TESTING (TWO SAMPLE) - CHAPTER 8 32
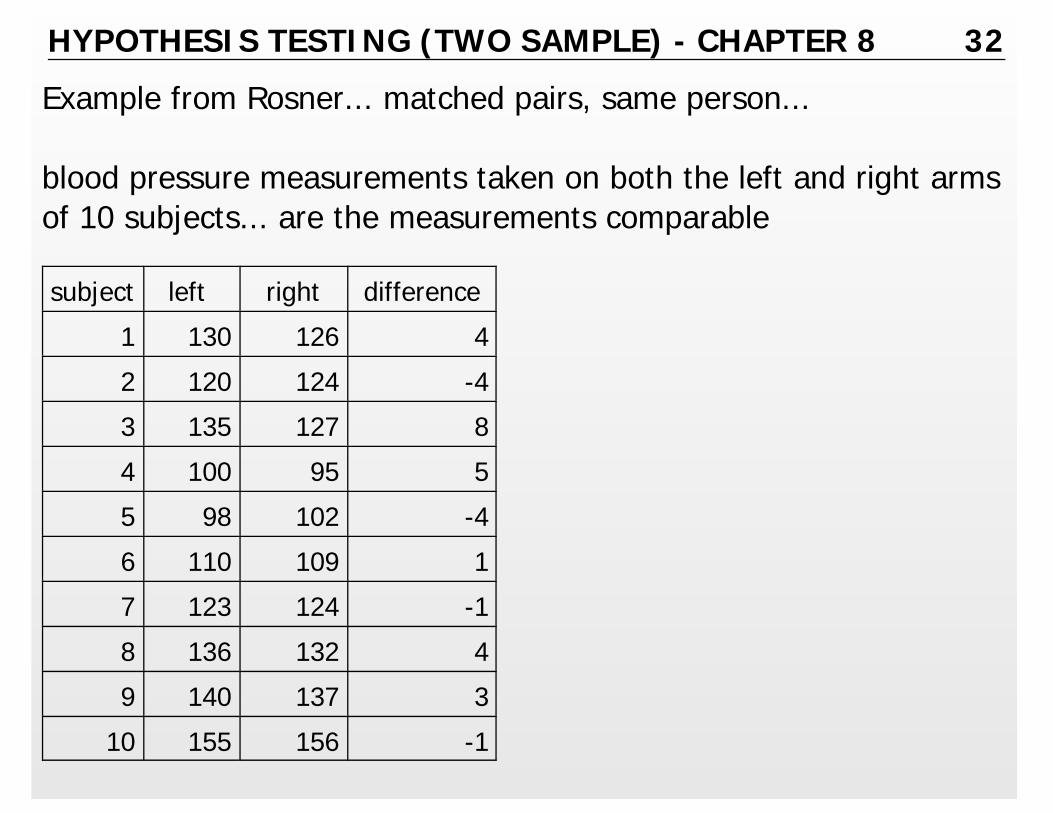
Example from Rosner... matched pairs, same person...
blood pressure measurements taken on both the left and right armsof 10 subjects... are the measurements comparable
subject left right difference
1 130 126 4
2 120 124 -4
3 135 127 8
4 100 95 5
5 98 102 -4
6 110 109 1
7 123 124 -1
8 136 132 4
9 140 137 3
10 155 156 -1

HYPOTHESIS TESTING (TWO SAMPLE) - CHAPTER 8 33
• claim... measurements on the two arms produceidentical results
• null hypothesis... HH
d
d
0
1
00
::µµ
=≠
• test statistic... t d s n
td=
= =
/ ( / )
. / ( . / ) .150 3979 10 119
• critical value... with "=0.05, 9 DF, two-tails (table A-3),2.262
• P-value... hard to determine from table in Triolause other tables (Rosner), or softwarefrom Statcrunch, P-value = 0.264
• conclusion... fail to reject the null hypothesisno evidence to say the BP differs from onearm to the other

HYPOTHESIS TESTING (TWO SAMPLE) - CHAPTER 8 34
• confidence interval for matched pairs
E t s n
Ed E d E
d
d
d
d
=
= =
− < < +− < < +
− < <
α
µµ
µ
/ ( / )
. ( . / ) .
. . . .. .
2
2 262 3979 10 2 85
150 2 85 150 2 85135 4 35
same conclusion as hypothesis test since zero (no difference) iswithin the confidence band

HYPOTHESIS TESTING (TWO SAMPLE) - CHAPTER 8 35
Subject Treatment Control Difference
1 6.9 6.4 0.5
2 7.6 6.7 0.9
3 7.3 5.4 1.9
4 7.6 8.2 -0.6
5 6.8 5.3 1.5
6 7.2 6.6 0.6
7 8.0 5.8 2.2
8 5.5 5.7 -0.2
9 5.8 6.2 -0.4
10 7.3 7.1 0.2
11 8.2 7.0 1.2
12 6.8 6.9 -0.1
13 6.8 5.6 0.8
14 5.7 4.2 1.5
15 8.6 5.8 2.8
Example from Rosner... matched pairs, differentpersons...
30 pregnant women, 15matched pairs (age andweight as matching criteria,women are within 5 poundsof each other and within 2years of age), member ofeach pair randomlyassigned to a drug orplacebo to see if the drug iseffective in reducingpremature births (outcomemeasure is birth weight, inpounds)
HYPOTHESIS TESTING (TWO SAMPLE) - CHAPTER 8 36
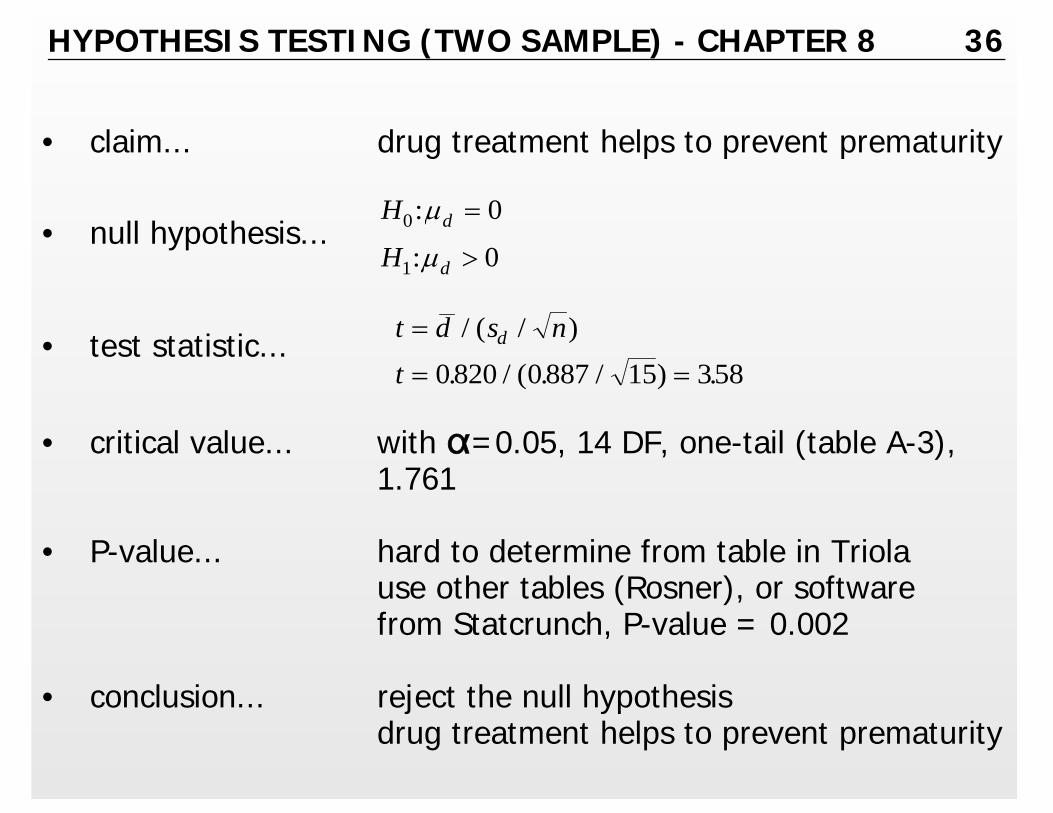
• claim... drug treatment helps to prevent prematurity
• null hypothesis... H
Hd
d
0
1
0
0
:
:
µ
µ
=
>
• test statistic... t d s nt
d=
= =
/ ( / ). / ( . / ) .0820 0887 15 358
• critical value... with "=0.05, 14 DF, one-tail (table A-3),1.761
• P-value... hard to determine from table in Triolause other tables (Rosner), or softwarefrom Statcrunch, P-value = 0.002
• conclusion... reject the null hypothesisdrug treatment helps to prevent prematurity
HYPOTHESIS TESTING (TWO SAMPLE) - CHAPTER 8 37
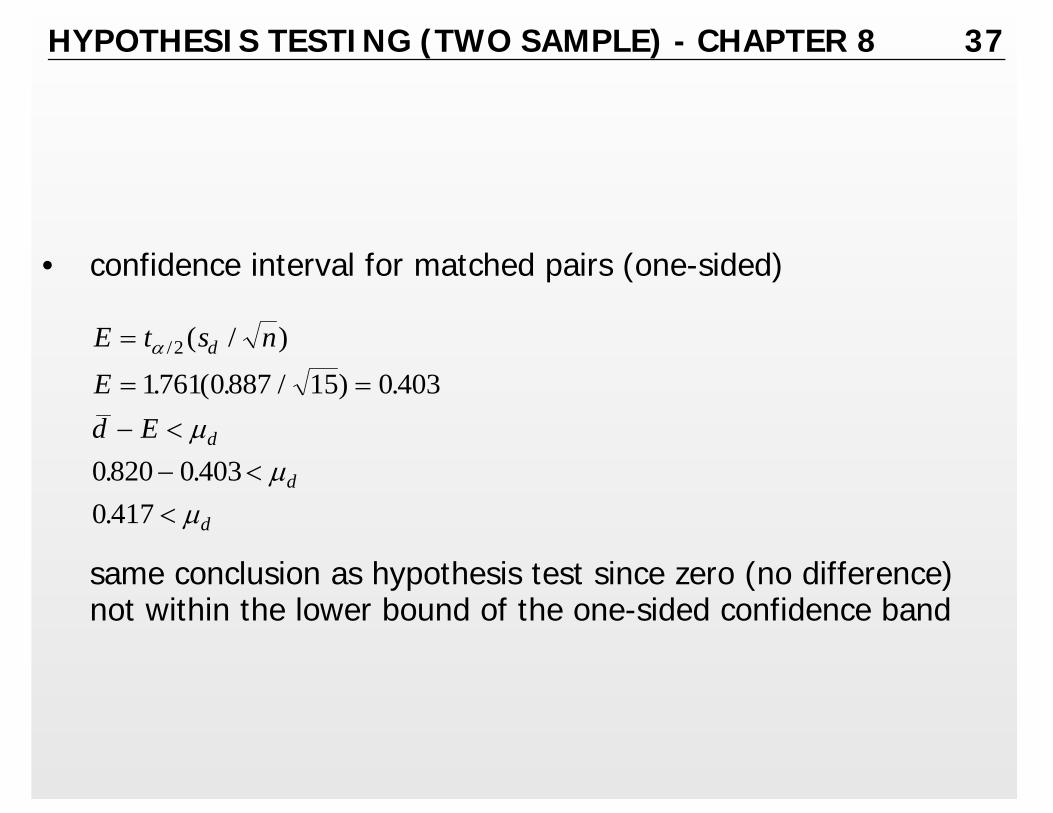
• confidence interval for matched pairs (one-sided)
E t s n
Ed E
d
d
d
d
=
= =
− <− <<
α
µµ
µ
/ ( / )
. ( . / ) .
. .
.
2
1761 0887 15 0 403
0820 0 4030 417
same conclusion as hypothesis test since zero (no difference)not within the lower bound of the one-sided confidence band

HYPOTHESIS TESTING (TWO SAMPLE) - CHAPTER 8 38
TWO MEANS - INDEPENDENT SAMPLES
• continuous data
• test statistic is t
• requirements
same issues as to sampling as before (random, representative)
two samples are independent
either or both conditions: in both sample, sample size > 30;both samples come from populations having normal distributions(test is robust in that departures from normality requirement isnot strict as long as there are no outliers and that data are notextrememly far from being normally distributed)

HYPOTHESIS TESTING (TWO SAMPLE) - CHAPTER 8 39
ISSUES
• how to compute the standard error of the difference betweentwo means
• how to compute the degrees of freedom to use when lookingup the critical values and when computing P-values
HYPOTHESIS TESTING (TWO SAMPLE) - CHAPTER 8 40
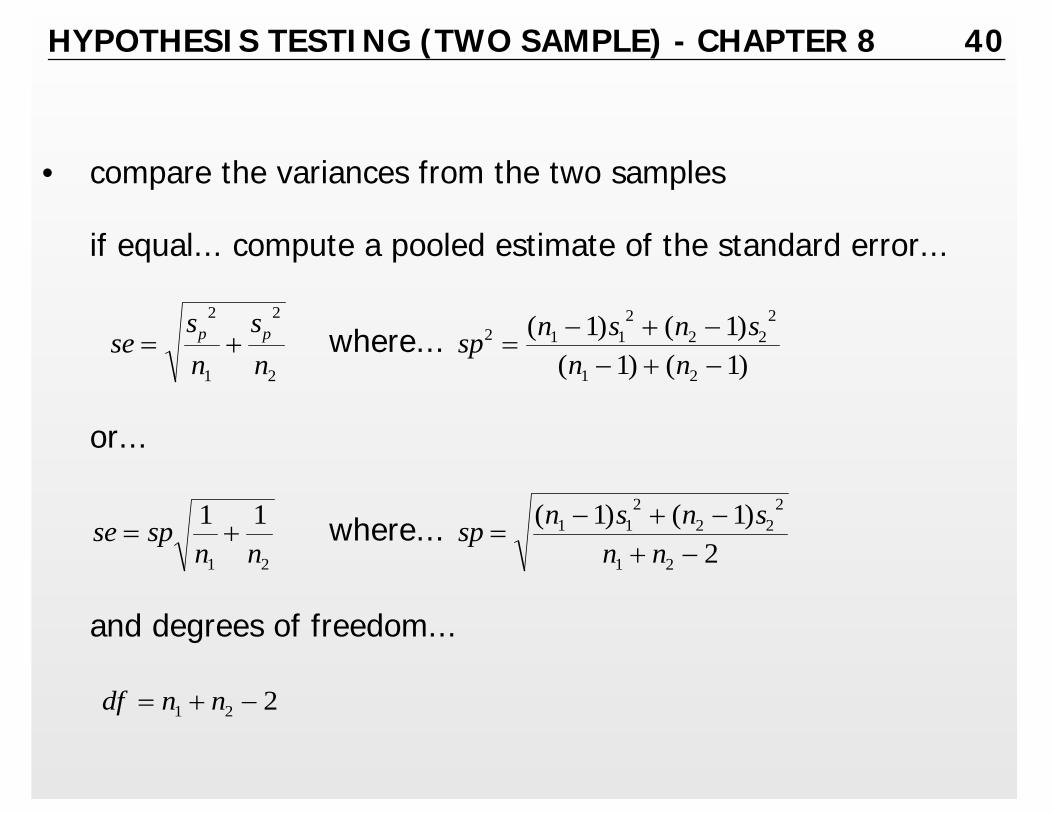
• compare the variances from the two samples
if equal... compute a pooled estimate of the standard error...
where... sesn
sn
p p= +2
1
2
2
sp n s n sn n
2 1 12
2 22
1 2
1 11 1
=− + −− + −
( ) ( )( ) ( )
or...
where... se spn n
= +1 11 2
sp n s n sn n
=− + −
+ −( ) ( )1 1
22 2
2
1 2
1 12
and degrees of freedom...
df n n= + −1 2 2
HYPOTHESIS TESTING (TWO SAMPLE) - CHAPTER 8 41
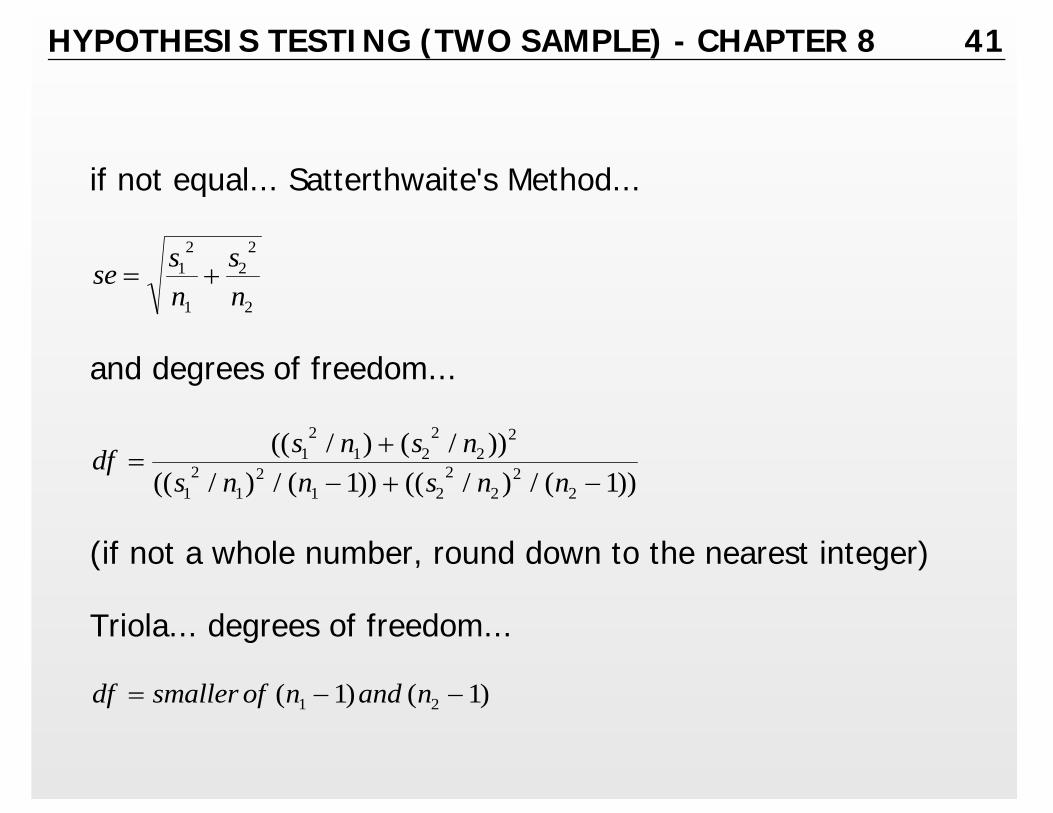
if not equal... Satterthwaite's Method...
se sn
sn
= +12
1
22
2
and degrees of freedom...
df s n s ns n n s n n
=+
− + −(( / ) ( / ))
(( / ) / ( )) (( / ) / ( ))12
1 22
22
12
12
1 22
22
21 1
(if not a whole number, round down to the nearest integer)
Triola... degrees of freedom...
df smaller of n and n= − −( ) ( )1 21 1
HYPOTHESIS TESTING (TWO SAMPLE) - CHAPTER 8 42
TWO VARIANCES - INDEPENDENT SAMPLES
• test statistic is F
• requirements
same issues as to sampling as before (random, representative)
two samples are independent
two populations are normally distributed (important sincemethods used to compare variances are extremely sensitive todepartures from normality)
HYPOTHESIS TESTING (TWO SAMPLE) - CHAPTER 8 43
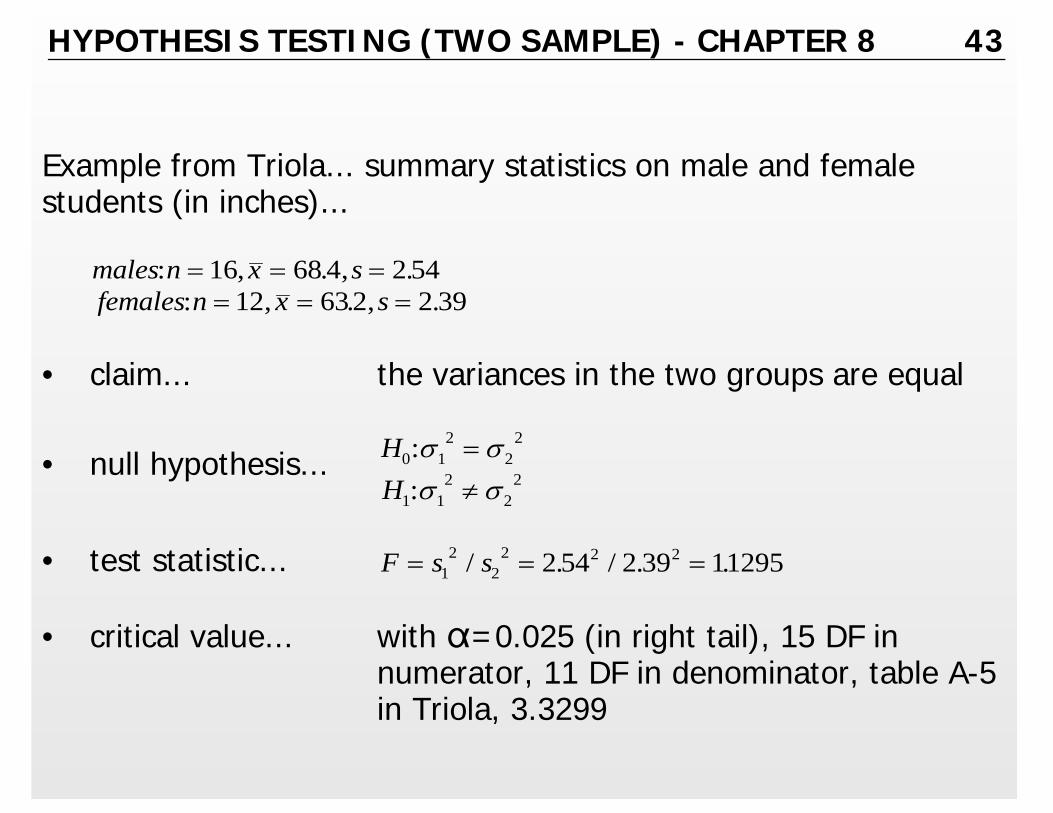
Example from Triola... summary statistics on male and femalestudents (in inches)...
males n x s: , . , .= = =16 68 4 2 54females n x s: , . , .= = =12 632 2 39
• claim... the variances in the two groups are equal
• null hypothesis... HH
0 12
22
1 12
22
::σ σσ σ
=≠
• test statistic... F s s= = =12
22 2 22 54 2 39 11295/ . / . .
• critical value... with "=0.025 (in right tail), 15 DF innumerator, 11 DF in denominator, table A-5in Triola, 3.3299

HYPOTHESIS TESTING (TWO SAMPLE) - CHAPTER 8 44

HYPOTHESIS TESTING (TWO SAMPLE) - CHAPTER 8 45
• reverse variances in calculation of test statistic...
F = = =σ σ22
12 2 22 39 2 54 08854/ . / . .
look in the left-tail, critical value is now 0.3003
NOTE: after reversing the degrees of freedom,left-tail critical value = 1 / right-tail critical value
HYPOTHESIS TESTING (TWO SAMPLE) - CHAPTER 8 46
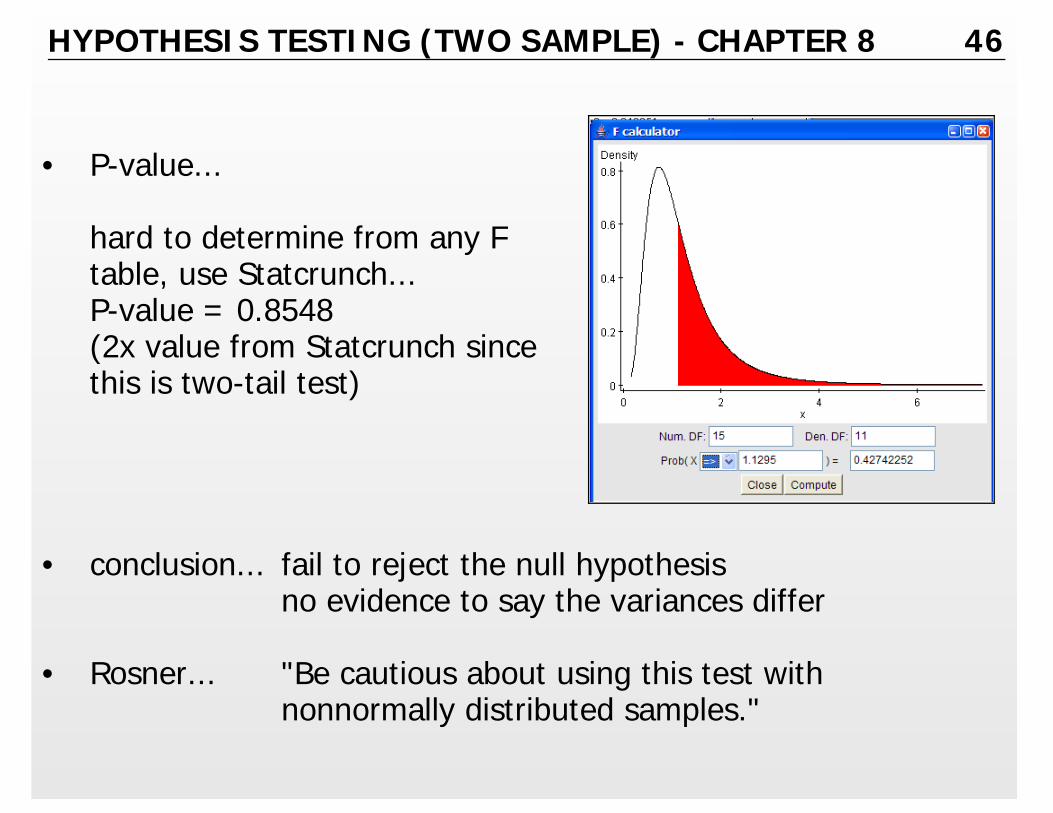
• P-value...
hard to determine from any Ftable, use Statcrunch...P-value = 0.8548(2x value from Statcrunch sincethis is two-tail test)
• conclusion... fail to reject the null hypothesisno evidence to say the variances differ
• Rosner... "Be cautious about using this test withnonnormally distributed samples."

HYPOTHESIS TESTING (TWO SAMPLE) - CHAPTER 8 47
• confidence interval on the ratio of two variances...
( )( ) ( )( )ss F
ss FR L
12
22
12
22
12
22
1 1< <σσ
( ..
)(.
) ( ..
)(.
)2 542 39
133299
2 542 39
10 3325
2
212
22
2
2< <σσ
0 3392 3396912
22. .< <
σσ
• same conclusion... no evidence to say the variances differconfidence interval includes 1

HYPOTHESIS TESTING (TWO SAMPLE) - CHAPTER 8 48
WHAT SHOULD YOU DO
• Triola suggests...
ignore the preliminary variance test
do not pool the sample variances
use the smaller sample size in the two groups to find DF
• others...
perform a preliminary test to see if variances are equal
if equal, use a pooled estimate of the variance and use a DF ofn1+n2-2
if unequal, do not pool the sample variances and useSatterthwaite's method to compute DF
HYPOTHESIS TESTING (TWO SAMPLE) - CHAPTER 8 49
• for quiz problems, you should...
perform a preliminary test to see if variances are equal
if equal, use a pooled estimate of the variance and use...DF = n1+n2-2
if unequal, do not pool the sample variances and use the smallersample size in the two groups to find DF (don't bother to useSatterthwaite's method)

HYPOTHESIS TESTING (TWO SAMPLE) - CHAPTER 8 50
Example from Triola... effectiveness of paroxetine for treatingbipolar depression... scores on a depression scale...
placebo group n x s: , . , .= = =43 2157 387treatment group n x s: , . , .= = =33 20 38 391
• claim... there is no difference between theplacebo and treatment groups
• null hypothesis...HH
0 1 2
1 1 2
::µ µµ µ
=≠
• compare variances... F = =391 387 102082 2. / . .
critical value with "=0.05, 32 DF innumerator, 42 DF in denominator,1.9078 (no evidence to reject nullhypothesis of equal variances)
HYPOTHESIS TESTING (TWO SAMPLE) - CHAPTER 8 51
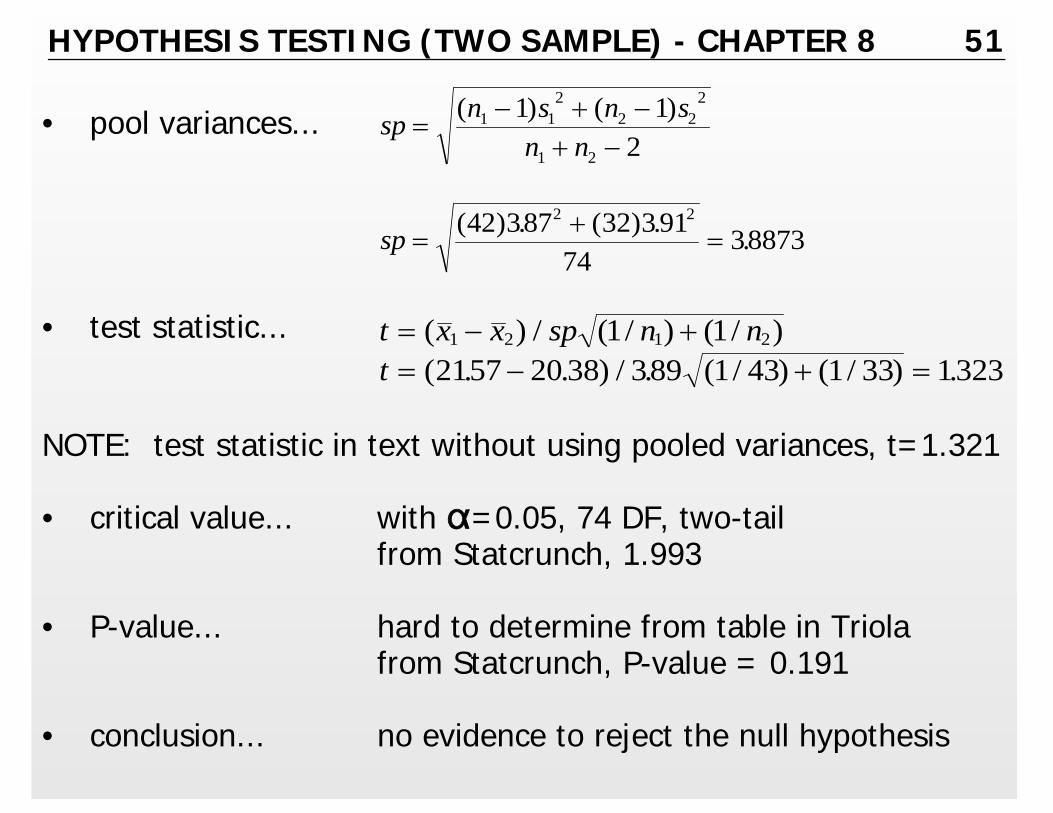
• pool variances... sp n s n sn n
=− + −
+ −( ) ( )1 1
22 2
2
1 2
1 12
sp = +=
( ) . ( ) . .42 387 32 39174
388732 2
• test statistic... t x x sp n n= − +( ) / ( / ) ( / )1 2 1 21 1t = − + =( . . ) / . ( / ) ( / ) .2157 20 38 389 1 43 1 33 1323
NOTE: test statistic in text without using pooled variances, t=1.321
• critical value... with "=0.05, 74 DF, two-tailfrom Statcrunch, 1.993
• P-value... hard to determine from table in Triolafrom Statcrunch, P-value = 0.191
• conclusion... no evidence to reject the null hypothesis