


June 25, 2012
Asia
Asia Derivatives Views Options Research
HSCEI vs. SPX relative trades: Outperformance options and call vs. call pairs
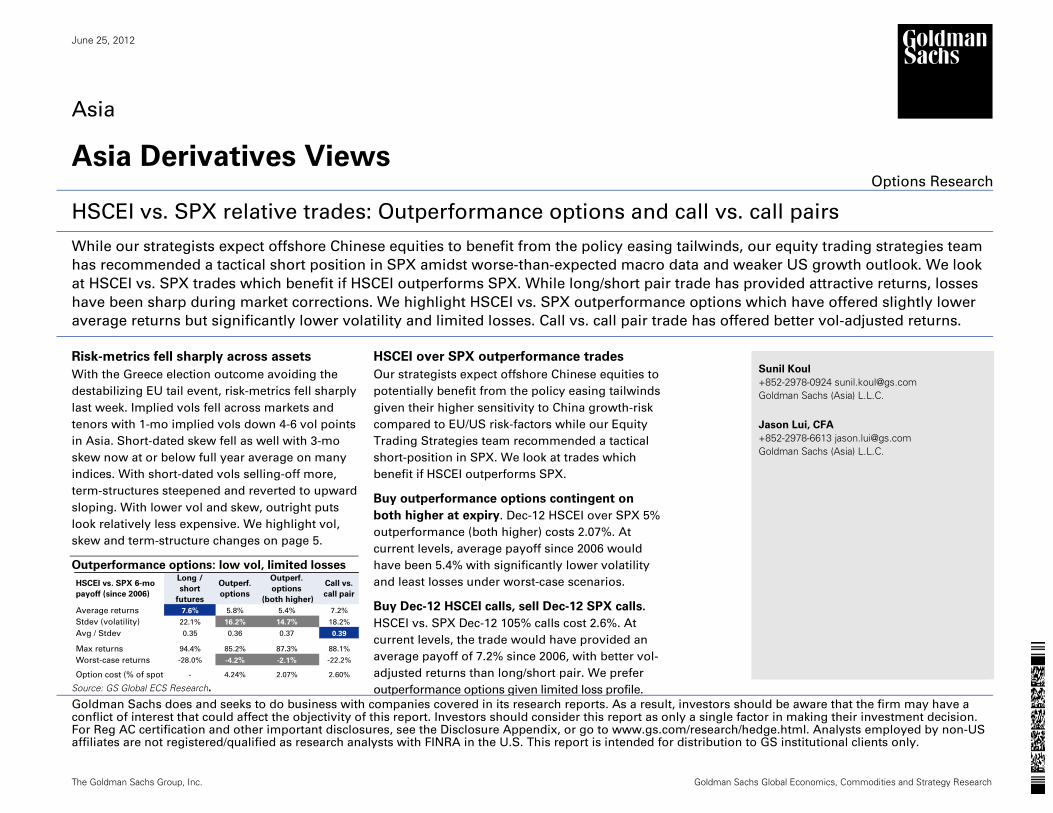
While our strategists expect offshore Chinese equities to benefit from the policy easing tailwinds, our equity trading strategies team
has recommended a tactical short position in SPX amidst worse-than-expected macro data and weaker US growth outlook. We look
at HSCEI vs. SPX trades which benefit if HSCEI outperforms SPX. While long/short pair trade has provided attractive returns, losses
have been sharp during market corrections. We highlight HSCEI vs. SPX outperformance options which have offered slightly lower
average returns but significantly lower volatility and limited losses. Call vs. call pair trade has offered better vol-adjusted returns.
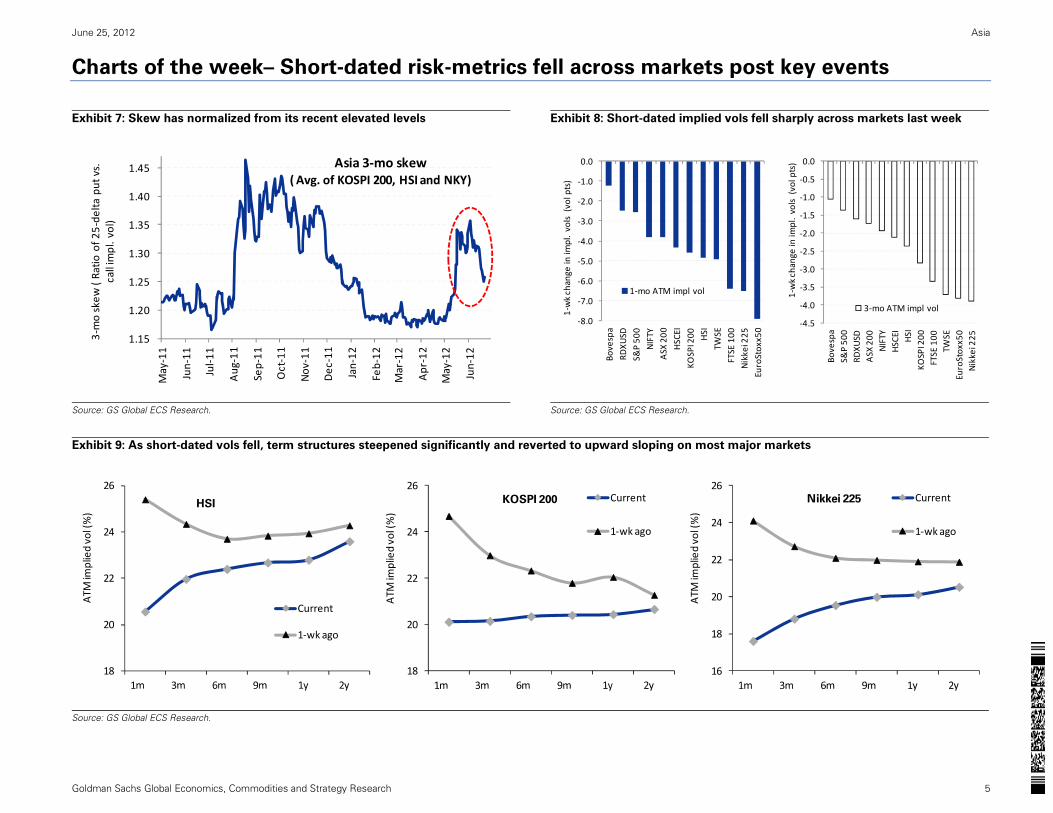
Risk-metrics fell sharply across assets
With the Greece election outcome avoiding the
destabilizing EU tail event, risk-metrics fell sharply
last week. Implied vols fell across markets and
tenors with 1-mo implied vols down 4-6 vol points
in Asia. Short-dated skew fell as well with 3-mo
skew now at or below full year average on many
indices. With short-dated vols selling-off more,
term-structures steepened and reverted to upward
sloping. With lower vol and skew, outright puts
look relatively less expensive. We highlight vol,
skew and term-structure changes on page 5.
Outperformance options: low vol, limited losses
Source: GS Global ECS Research.
HSCEI over SPX outperformance trades
Our strategists expect offshore Chinese equities to
potentially benefit from the policy easing tailwinds
given their higher sensitivity to China growth-risk
compared to EU/US risk-factors while our Equity
Trading Strategies team recommended a tactical
short-position in SPX. We look at trades which
benefit if HSCEI outperforms SPX.
Buy outperformance options contingent on
both higher at expiry. Dec-12 HSCEI over SPX 5%
outperformance (both higher) costs 2.07%. At
current levels, average payoff since 2006 would
have been 5.4% with significantly lower volatility
and least losses under worst-case scenarios.
Buy Dec-12 HSCEI calls, sell Dec-12 SPX calls.
HSCEI vs. SPX Dec-12 105% calls cost 2.6%. At
current levels, the trade would have provided an
average payoff of 7.2% since 2006, with better vol-
adjusted returns than long/short pair. We prefer
outperformance options given limited loss profile.
Sunil Koul
+852-2978-0924 [email protected] Goldman Sachs (Asia) L.L.C.
Jason Lui, CFA
+852-2978-6613 [email protected] Goldman Sachs (Asia) L.L.C.
Goldman Sachs does and seeks to do business with companies covered in its research reports. As a result, investors should be aware that the firm may have a conflict of interest that could affect the objectivity of this report. Investors should consider this report as only a single factor in making their investment decision. For Reg AC certification and other important disclosures, see the Disclosure Appendix, or go to www.gs.com/research/hedge.html. Analysts employed by non-US affiliates are not registered/qualified as research analysts with FINRA in the U.S. This report is intended for distribution to GS institutional clients only.
The Goldman Sachs Group, Inc. Goldman Sachs Global Economics, Commodities and Strategy Research
HSCEI vs. SPX 6-mo
payoff (since 2006)
Long /
short
futures
Outperf.
options
Outperf.
options
(both higher)
Call vs.
call pair
Average returns 7.6% 5.8% 5.4% 7.2%
Stdev (volatility) 22.1% 16.2% 14.7% 18.2%
Avg / Stdev 0.35 0.36 0.37 0.39
Max returns 94.4% 85.2% 87.3% 88.1%
Worst-case returns -28.0% -4.2% -2.1% -22.2%
Option cost (% of spot - 4.24% 2.07% 2.60%
June 25, 2012 Asia
Goldman Sachs Global Economics, Commodities and Strategy Research 2
HSCEI vs. SPX relative trades: Outperformance options and call vs. call pairs
Our strategists expect offshore Chinese equities to benefit from the policy easing tailwinds. As highlighted in our latest
Growth Markets Perspective: Strategies for a China loosening cycle (June 21), offshore Chinese equities have a higher risk-
sensitivity to China growth risk compared to EU/US risk-factors and could potentially benefit from the ongoing and further policy
easing. While HSCEI sold off 11% amidst EU sovereign concerns in May, onshore China equities (CSI 300) ended the month
essentially flat suggesting offshore equities could close the gap relative to A-shares, should global macro risks normalize. Easier
financial conditions, coupled with inexpensive valuations and light positioning drives our positive strategic stance for Chinese
equities.
On the other hand, our Equity Trading Strategies team recommended a tactical short position in S&P 500. Our Equity Trading
Strategists in their recent report (Trade Update: Recommending short position in the S&P 500, June 21) recommend a tactical short
position in SPX with a near-term downside target of 1285, on the back of worse-than-expected macro data and weaker US-growth
outlook while our US strategist expects SPX to trade at 1250 by year-end (6.5% downside from current levels).
We look at relative option trades to express our preference for HSCEI over SPX. An easier China policy with deteriorating US
growth outlook could cause HSCEI to outperform SPX during 2H12, in our view. We look at HSCEI vs. SPX trades which could benefit if
HSCEI outperforms SPX. We compare HSCEI vs. SPX outperformance options and call vs. call pair trades to a long-short futures
pair trade as shown below:
(1) Long Dec-12 HSCEI over SPX 105% outperformance options, contingent on both indices higher, for 2.07%.
Outperformance options contingent on both indices higher has a bullish bias to equities and provides positive returns only if SPX
and HSCEI are both higher at expiration by year-end. The advantage of contingent options is a lower upfront premium. Currently
Dec-12 (28-Dec-12 expiry) HSCEI over SPX 5% strike outperformance, contingent on both indices higher, costs 2.07%, at more than
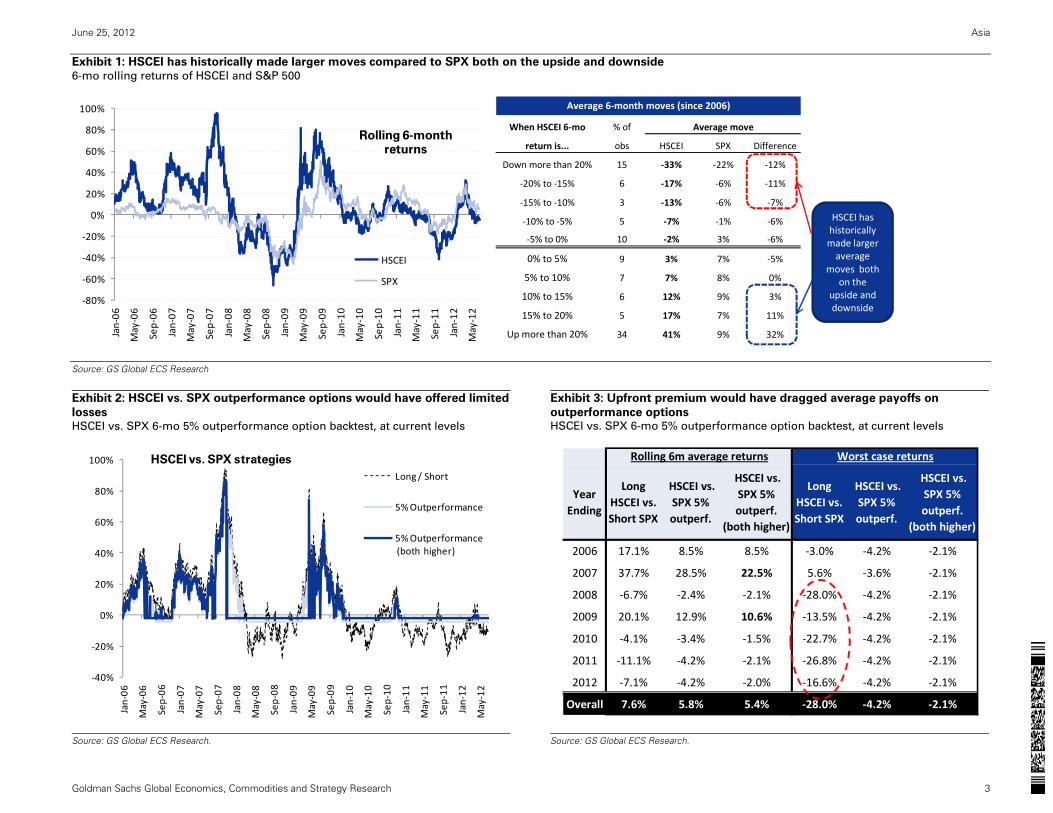
50% discount to vanilla 5% strike outperformance options (4.24%). HSCEI has historically made larger directional moves compared
to SPX, both on the up-side and down-side (Exhibit 1 in p.3). So the risk-reward on outperformance options contingent on both
indices higher looks better compared to vanilla outperformance options. The disadvantage however is that the trade provides no
return if HSCEI rallies while SPX falls. As shown in exhibit 2 and 3, we look at the historical profitability of a 6-mo HSCEI over SPX
5% outperformance options when entered at current levels. Since 2006, the average payoff for the outperformance option
contingent on both indices higher, has been 5.4%, less than long/short or call vs. call pair trade but with significantly lower
volatility and limited losses. Risk is loss of upfront premium.
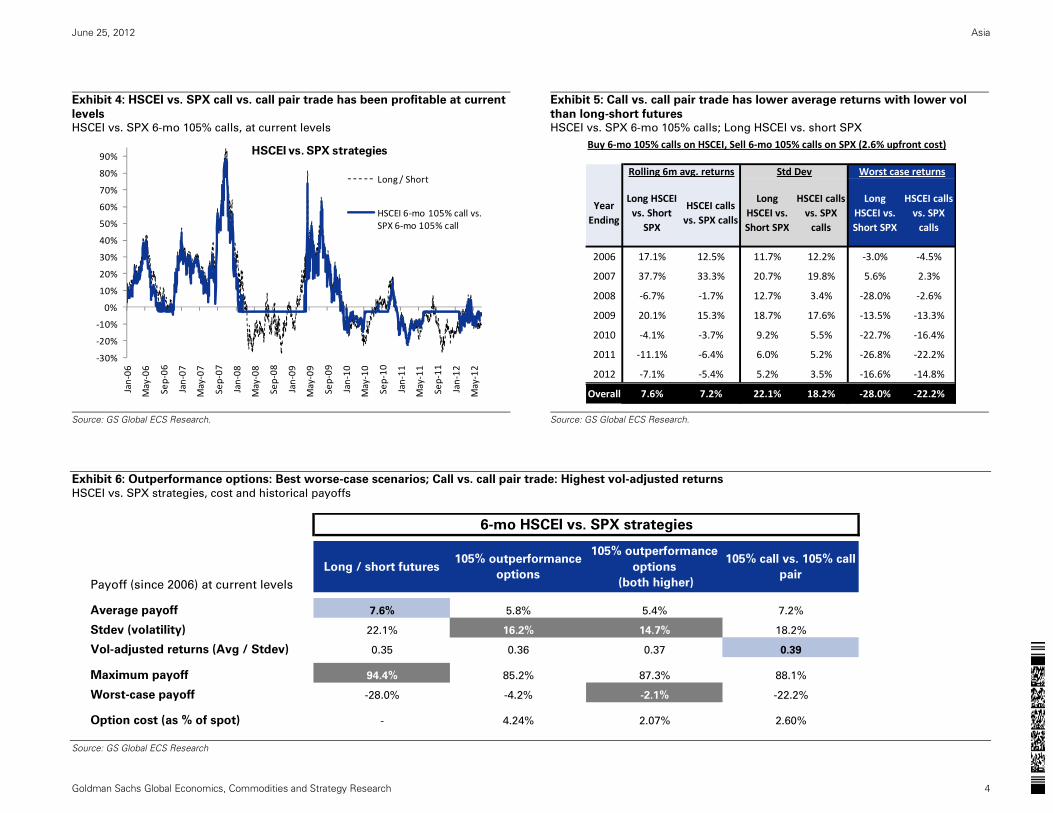
(2) Long HSCEI Dec-12 105% calls vs. short SPX Dec-12 105% calls. Pay 2.6% in upfront premium.
Compared to a long/short futures trade, call vs. call pair trade isolates returns to the case where either of the markets is higher at
expiration. While HSCEI/SPX long-short pair has had sharp negative returns during market corrections, the call vs. call pair trade will
have a maximum loss of 2.6% upfront premium if SPX is lower at expiry. As shown in Exhibit 4 on p.4, we look at historical payoff of
buying 6-mo HSCEI 105% calls vs. selling 6-mo SPX 105% calls. At current levels, the trade would have provided an average return
of 7.2% since 2006 (vs. 7.6% for long/short pair) but with lower volatility and thus better vol-adjusted returns. Risks: Buyers of HSCEI
vs. SPX call vs. call pair trade risk unlimited loss if SPX rallies significantly more than HSCEI by expiry.
We prefer outperformance options to long/short futures or call vs. call pair trade given limited loss profile of the trade.
June 25, 2012 Asia
Goldman Sachs Global Economics, Commodities and Strategy Research 3
Exhibit 1: HSCEI has historically made larger moves compared to SPX both on the upside and downside
6-mo rolling returns of HSCEI and S&P 500
Source: GS Global ECS Research
Exhibit 2: HSCEI vs. SPX outperformance options would have offered limited
losses HSCEI vs. SPX 6-mo 5% outperformance option backtest, at current levels
Exhibit 3: Upfront premium would have dragged average payoffs on
outperformance options HSCEI vs. SPX 6-mo 5% outperformance option backtest, at current levels
Source: GS Global ECS Research.
Source: GS Global ECS Research.
‐80%
‐60%
‐40%
‐20%
0%
20%
40%
60%
80%
100%Jan‐06
May‐06
Sep‐06
Jan‐07
May‐07
Sep‐07
Jan‐08
May‐08
Sep‐08
Jan‐09
May‐09
Sep‐09
Jan‐10
May‐10
Sep‐10
Jan‐11
May‐11
Sep‐11
Jan‐12
May‐12
HSCEI
SPX
Rolling 6-month returns
Average 6‐month moves (since 2006)
When HSCEI 6‐mo % of Average move
return is... obs HSCEI SPX Difference
Down more than 20% 15 ‐33% ‐22% ‐12%
‐20% to ‐15% 6 ‐17% ‐6% ‐11%
‐15% to ‐10% 3 ‐13% ‐6% ‐7%
‐10% to ‐5% 5 ‐7% ‐1% ‐6%
‐5% to 0% 10 ‐2% 3% ‐6%
0% to 5% 9 3% 7% ‐5%
5% to 10% 7 7% 8% 0%
10% to 15% 6 12% 9% 3%
15% to 20% 5 17% 7% 11%
Up more than 20% 34 41% 9% 32%
HSCEI has historically made larger average
moves both on the
upside anddownside
‐40%
‐20%
0%
20%
40%
60%
80%
100%
Jan‐06
May‐06
Sep‐06
Jan‐07
May‐07
Sep‐07
Jan‐08
May‐08
Sep‐08
Jan‐09
May‐09
Sep‐09
Jan‐10
May‐10
Sep‐10
Jan‐11
May‐11
Sep‐11
Jan‐12
May‐12
Long / Short
5% Outperformance
5% Outperformance(both higher)
HSCEI vs. SPX strategies
Year Ending
Long HSCEI vs. Short SPX
HSCEI vs. SPX 5% outperf.
HSCEI vs. SPX 5% outperf.
(both higher)
Long HSCEI vs. Short SPX
HSCEI vs. SPX 5% outperf.
HSCEI vs. SPX 5% outperf.
(both higher)
2006 17.1% 8.5% 8.5% ‐3.0% ‐4.2% ‐2.1%
2007 37.7% 28.5% 22.5% 5.6% ‐3.6% ‐2.1%
2008 ‐6.7% ‐2.4% ‐2.1% ‐28.0% ‐4.2% ‐2.1%
2009 20.1% 12.9% 10.6% ‐13.5% ‐4.2% ‐2.1%
2010 ‐4.1% ‐3.4% ‐1.5% ‐22.7% ‐4.2% ‐2.1%
2011 ‐11.1% ‐4.2% ‐2.1% ‐26.8% ‐4.2% ‐2.1%
2012 ‐7.1% ‐4.2% ‐2.0% ‐16.6% ‐4.2% ‐2.1%
Overall 7.6% 5.8% 5.4% ‐28.0% ‐4.2% ‐2.1%
Rolling 6m average returns Worst case returns
June 25, 2012 Asia
Goldman Sachs Global Economics, Commodities and Strategy Research 4
Exhibit 4: HSCEI vs. SPX call vs. call pair trade has been profitable at current
levels HSCEI vs. SPX 6-mo 105% calls, at current levels
Exhibit 5: Call vs. call pair trade has lower average returns with lower vol
than long-short futures HSCEI vs. SPX 6-mo 105% calls; Long HSCEI vs. short SPX
Source: GS Global ECS Research.
Source: GS Global ECS Research.
Exhibit 6: Outperformance options: Best worse-case scenarios; Call vs. call pair trade: Highest vol-adjusted returns
HSCEI vs. SPX strategies, cost and historical payoffs
Source: GS Global ECS Research
‐30%
‐20%
‐10%
0%
10%
20%
30%
40%
50%
60%
70%
80%
90%
Jan‐06
May‐06
Sep‐06
Jan‐07
May‐07
Sep‐07
Jan‐08
May‐08
Sep‐08
Jan‐09
May‐09
Sep‐09
Jan‐10
May‐10
Sep‐10
Jan‐11
May‐11
Sep‐11
Jan‐12
May‐12
Long / Short
HSCEI 6‐mo 105% call vs. SPX 6‐mo 105% call
HSCEI vs. SPX strategiesBuy 6‐mo 105% calls on HSCEI, Sell 6‐mo 105% calls on SPX (2.6% upfront cost)
Year Ending
Long HSCEI vs. Short
SPX
HSCEI calls vs. SPX calls
Long HSCEI vs. Short SPX
HSCEI calls vs. SPX calls
Long HSCEI vs. Short SPX
HSCEI calls vs. SPX calls
2006 17.1% 12.5% 11.7% 12.2% ‐3.0% ‐4.5%
2007 37.7% 33.3% 20.7% 19.8% 5.6% 2.3%
2008 ‐6.7% ‐1.7% 12.7% 3.4% ‐28.0% ‐2.6%
2009 20.1% 15.3% 18.7% 17.6% ‐13.5% ‐13.3%
2010 ‐4.1% ‐3.7% 9.2% 5.5% ‐22.7% ‐16.4%
2011 ‐11.1% ‐6.4% 6.0% 5.2% ‐26.8% ‐22.2%
2012 ‐7.1% ‐5.4% 5.2% 3.5% ‐16.6% ‐14.8%
Overall 7.6% 7.2% 22.1% 18.2% ‐28.0% ‐22.2%
Rolling 6m avg. returns Std Dev Worst case returns
Payoff (since 2006) at current levels
Long / short futures105% outperformance
options
105% outperformance
options
(both higher)
105% call vs. 105% call
pair
Average payoff 7.6% 5.8% 5.4% 7.2%
Stdev (volatility) 22.1% 16.2% 14.7% 18.2%
Vol-adjusted returns (Avg / Stdev) 0.35 0.36 0.37 0.39
Maximum payoff 94.4% 85.2% 87.3% 88.1%
Worst-case payoff -28.0% -4.2% -2.1% -22.2%
Option cost (as % of spot) - 4.24% 2.07% 2.60%
6-mo HSCEI vs. SPX strategies
June 25, 2012 Asia
Goldman Sachs Global Economics, Commodities and Strategy Research 5
Charts of the week– Short-dated risk-metrics fell across markets post key events
Exhibit 7: Skew has normalized from its recent elevated levels
Exhibit 8: Short-dated implied vols fell sharply across markets last week
Source: GS Global ECS Research.
Source: GS Global ECS Research.
Exhibit 9: As short-dated vols fell, term structures steepened significantly and reverted to upward sloping on most major markets
Source: GS Global ECS Research.
1.15
1.20
1.25
1.30
1.35
1.40
1.45May‐11
Jun‐11
Jul‐1
1
Aug
‐11
Sep‐11
Oct‐11
Nov
‐11
Dec
‐11
Jan‐12
Feb‐12
Mar‐12
Apr‐12
May‐12
Jun‐12
3‐mo skew
( Ratio
of 2
5‐de
lta put vs.
call impl. vol)
Asia 3‐mo skew ( Avg. of KOSPI 200, HSI and NKY)
‐8.0
‐7.0
‐6.0
‐5.0
‐4.0
‐3.0
‐2.0
‐1.0
0.0
Bovespa
RDXU
SDS&
P 50
0NIFTY
ASX
200
HSCEI
KOSPI 200 HSI
TWSE
FTSE 100
Nikkei 225
EuroStoxx50
1‐wk change
in im
pl. vols (vol pts)
1‐mo ATM impl vol
‐4.5
‐4.0
‐3.5
‐3.0
‐2.5
‐2.0
‐1.5
‐1.0
‐0.5
0.0
Bovespa
S&P 50
0RD
XUSD
ASX
200
NIFTY
HSCEI HSI
KOSPI 200
FTSE 100
TWSE
EuroStoxx50
Nikkei 225
1‐wk change
in im
pl. vols (vol pts)
3‐mo ATM impl vol
18
20
22
24
26
ATM
implied vol (%)
Current
1‐wk ago
HSI
18
20
22
24
26
ATM
implied vol (%)
Current
1‐wk ago
KOSPI 200
16
18
20
22
24
26
ATM
implied vol (%)
Current
1‐wk ago
Nikkei 225
June 25, 2012 Asia
Goldman Sachs Global Economics, Commodities and Strategy Research 6
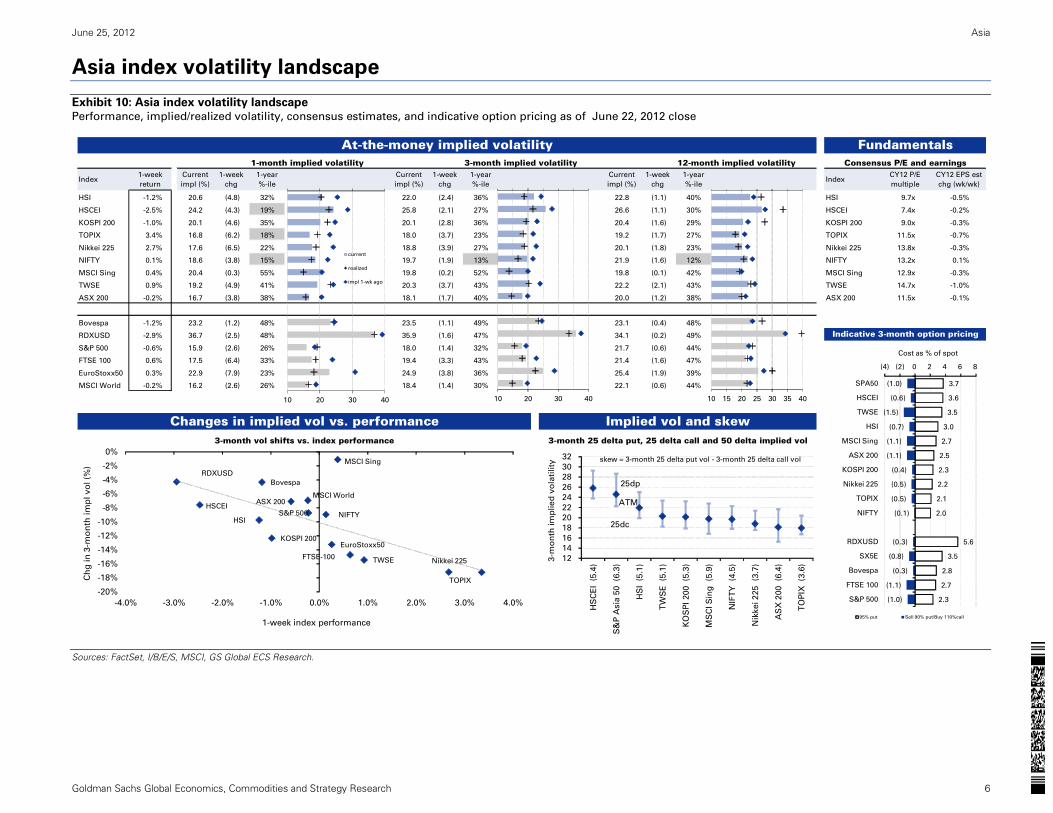
Asia index volatility landscape
Exhibit 10: Asia index volatility landscape
Performance, implied/realized volatility, consensus estimates, and indicative option pricing as of June 22, 2012 close
Sources: FactSet, I/B/E/S, MSCI, GS Global ECS Research.
1-month implied volatility 3-month implied volatility 12-month implied volatility
Index1-week
return
Current
impl (%)
1-week
chg
1-year
%-ile
Current
impl (%)
1-week
chg
1-year
%-ile
Current
impl (%)
1-week
chg
1-year
%-ileIndex
CY12 P/E
multiple
CY12 EPS est
chg (wk/wk)
HSI -1.2% 20.6 (4.8) 32% 22.0 (2.4) 36% 22.8 (1.1) 40% HSI 9.7x -0.5%
HSCEI -2.5% 24.2 (4.3) 19% 25.8 (2.1) 27% 26.6 (1.1) 30% HSCEI 7.4x -0.2%
KOSPI 200 -1.0% 20.1 (4.6) 35% 20.1 (2.8) 36% 20.4 (1.6) 29% KOSPI 200 9.0x -0.3%
TOPIX 3.4% 16.8 (6.2) 18% 18.0 (3.7) 23% 19.2 (1.7) 27% TOPIX 11.5x -0.7%
Nikkei 225 2.7% 17.6 (6.5) 22% 18.8 (3.9) 27% 20.1 (1.8) 23% Nikkei 225 13.8x -0.3%
NIFTY 0.1% 18.6 (3.8) 15% 19.7 (1.9) 13% 21.9 (1.6) 12% NIFTY 13.2x 0.1%
MSCI Sing 0.4% 20.4 (0.3) 55% 19.8 (0.2) 52% 19.8 (0.1) 42% MSCI Sing 12.9x -0.3%
TWSE 0.9% 19.2 (4.9) 41% 20.3 (3.7) 43% 22.2 (2.1) 43% TWSE 14.7x -1.0%
ASX 200 -0.2% 16.7 (3.8) 38% 18.1 (1.7) 40% 20.0 (1.2) 38% ASX 200 11.5x -0.1%
Bovespa -1.2% 23.2 (1.2) 48% 23.5 (1.1) 49% 23.1 (0.4) 48%
RDXUSD -2.9% 36.7 (2.5) 48% 35.9 (1.6) 47% 34.1 (0.2) 49%
S&P 500 -0.6% 15.9 (2.6) 26% 18.0 (1.4) 32% 21.7 (0.6) 44%
FTSE 100 0.6% 17.5 (6.4) 33% 19.4 (3.3) 43% 21.4 (1.6) 47%
EuroStoxx50 0.3% 22.9 (7.9) 23% 24.9 (3.8) 36% 25.4 (1.9) 39%
MSCI World -0.2% 16.2 (2.6) 26% 18.4 (1.4) 30% 22.1 (0.6) 44%
3-month 25 delta put, 25 delta call and 50 delta implied vol3-month vol shifts vs. index performance
FundamentalsConsensus P/E and earnings
Changes in implied vol vs. performance
At-the-money implied volatility
Implied vol and skew
Indicative 3-month option pricing
12
14
16
18
20
22
24
26
28
30
32
HS
CE
I (
5.4
)
S&
P A
sia
50
(6
.3)
HS
I (
5.1
)
TW
SE
(5
.1)
KO
SP
I 200
(5
.3)
MS
CI S
ing
(5
.9)
NIF
TY
(4
.5)
Nik
kei 2
25
(3.7
)
AS
X 2
00
(6.4
)
TO
PIX
(3
.6)
3-m
on
th im
plie
d v
ola
tility
ATM
25dc
skew = 3-month 25 delta put vol - 3-month 25 delta call vol
25dp
3.7
3.6
3.5
3.0
2.7
2.5
2.3
2.2
2.1
2.0
5.6
3.5
2.8
2.7
2.3
(1.0)
(0.6)
(1.5)
(0.7)
(1.1)
(1.1)
(0.4)
(0.5)
(0.5)
(0.1)
(0.3)
(0.8)
(0.3)
(1.1)
(1.0)
(4) (2) 0 2 4 6 8
SPA50
HSCEI
TWSE
HSI
MSCI Sing
ASX 200
KOSPI 200
Nikkei 225
TOPIX
NIFTY
RDXUSD
SX5E
Bovespa
FTSE 100
S&P 500
Cost as % of spot
95% put Sell 90% put/Buy 110%call
10 20 30 40
current
realized
impl 1-wk ago
10 20 30 40 10 15 20 25 30 35 40
HSI
HSCEI
KOSPI 200
TOPIX
Nikkei 225
NIFTY
MSCI Sing
TWSE
ASX 200
Bovespa
S&P 500
FTSE-100
EuroStoxx50
RDXUSD
MSCI World
-20%
-18%
-16%
-14%
-12%
-10%
-8%
-6%
-4%
-2%
0%
-4.0% -3.0% -2.0% -1.0% 0.0% 1.0% 2.0% 3.0% 4.0%
Ch
g i
n 3
-mo
nth
im
pl
vo
l (%
)
1-week index performance
June 25, 2012 Asia
Goldman Sachs Global Economics, Commodities and Strategy Research 7
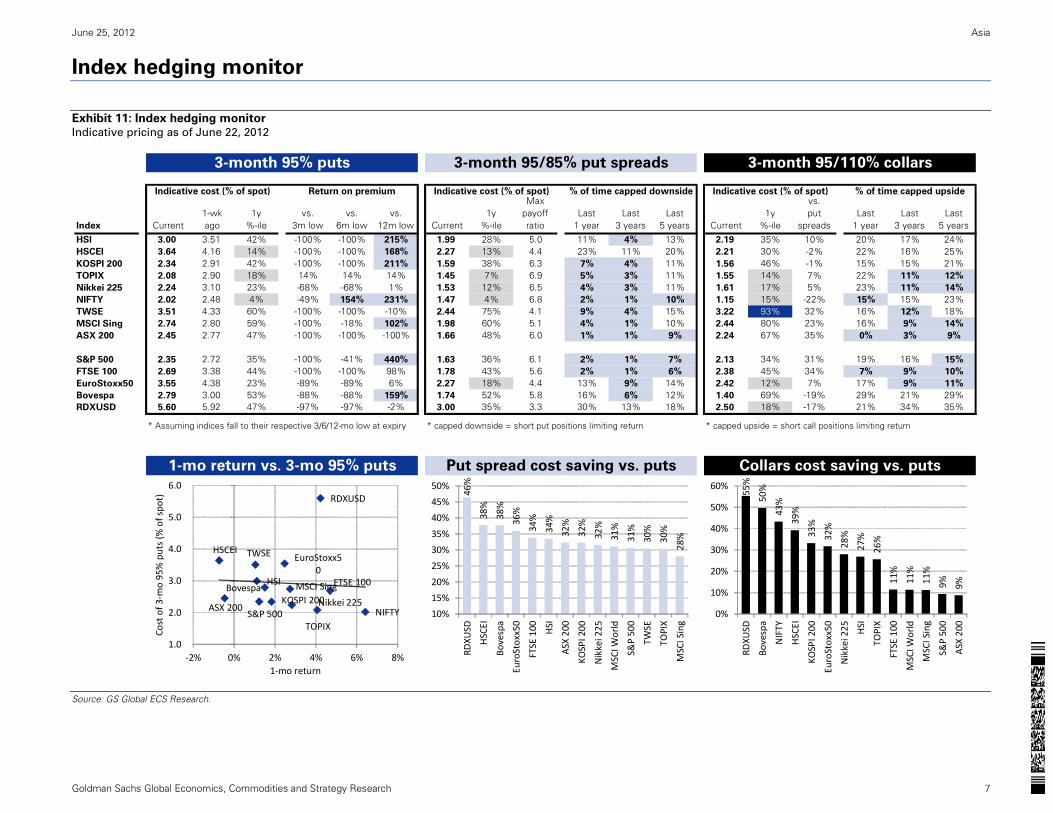
Index hedging monitor
Exhibit 11: Index hedging monitor
Indicative pricing as of June 22, 2012
Source: GS Global ECS Research.
3-month 95% puts 3-month 95/85% put spreads 3-month 95/110% collars
Indicative cost (% of spot) Return on premium Indicative cost (% of spot) % of time capped downside Indicative cost (% of spot) % of time capped upside
Index Current1-wk ago
1y %-ile
vs. 3m low
vs. 6m low
vs. 12m low Current
1y %-ile
Max payoff ratio
Last 1 year
Last 3 years
Last 5 years Current
1y %-ile
vs. put
spreadsLast
1 yearLast
3 yearsLast
5 years
HSI 3.00 3.51 42% -100% -100% 215% 1.99 28% 5.0 11% 4% 13% 2.19 35% 10% 20% 17% 24%HSCEI 3.64 4.16 14% -100% -100% 168% 2.27 13% 4.4 23% 11% 20% 2.21 30% -2% 22% 16% 25%KOSPI 200 2.34 2.91 42% -100% -100% 211% 1.59 38% 6.3 7% 4% 11% 1.56 46% -1% 15% 15% 21%TOPIX 2.08 2.90 18% 14% 14% 14% 1.45 7% 6.9 5% 3% 11% 1.55 14% 7% 22% 11% 12%
Nikkei 225 2.24 3.10 23% -68% -68% 1% 1.53 12% 6.5 4% 3% 11% 1.61 17% 5% 23% 11% 14%
NIFTY 2.02 2.48 4% -49% 154% 231% 1.47 4% 6.8 2% 1% 10% 1.15 15% -22% 15% 15% 23%TWSE 3.51 4.33 60% -100% -100% -10% 2.44 75% 4.1 9% 4% 15% 3.22 93% 32% 16% 12% 18%MSCI Sing 2.74 2.80 59% -100% -18% 102% 1.98 60% 5.1 4% 1% 10% 2.44 80% 23% 16% 9% 14%
ASX 200 2.45 2.77 47% -100% -100% -100% 1.66 48% 6.0 1% 1% 9% 2.24 67% 35% 0% 3% 9%
S&P 500 2.35 2.72 35% -100% -41% 440% 1.63 36% 6.1 2% 1% 7% 2.13 34% 31% 19% 16% 15%
FTSE 100 2.69 3.38 44% -100% -100% 98% 1.78 43% 5.6 2% 1% 6% 2.38 45% 34% 7% 9% 10%
EuroStoxx50 3.55 4.38 23% -89% -89% 6% 2.27 18% 4.4 13% 9% 14% 2.42 12% 7% 17% 9% 11%
Bovespa 2.79 3.00 53% -88% -88% 159% 1.74 52% 5.8 16% 6% 12% 1.40 69% -19% 29% 21% 29%RDXUSD 5.60 5.92 47% -97% -97% -2% 3.00 35% 3.3 30% 13% 18% 2.50 18% -17% 21% 34% 35%
* Assuming indices fall to their respective 3/6/12-mo low at expiry * capped downside = short put positions limiting return * capped upside = short call positions limiting return
1-mo return vs. 3-mo 95% puts Put spread cost saving vs. puts Collars cost saving vs. puts
HSI
HSCEI
KOSPI 200
TOPIX
Nikkei 225NIFTY
TWSE
MSCI Sing
ASX 200S&P 500
FTSE 100
EuroStoxx50
Bovespa
RDXUSD
1.0
2.0
3.0
4.0
5.0
6.0
‐2% 0% 2% 4% 6% 8%
Cost of 3
‐mo 95% puts (%
of spo
t)
1‐mo return
46%
38%
38%
36%
34%
34%
32%
32%
32%
31%
31%
30%
30%
28%
10%
15%
20%
25%
30%
35%
40%
45%
50%
RDXU
SD
HSCEI
Bovespa
EuroStoxx50
FTSE 100 HSI
ASX 200
KOSPI 200
Nikkei 225
MSCI W
orld
S&P 500
TWSE
TOPIX
MSCI Sing
55%
50%
43%
39%
33%
32%
28%
27%
26%
11%
11%
11%
9% 9%
0%
10%
20%
30%
40%
50%
60%
RDXU
SD
Bovespa
NIFTY
HSCEI
KOSPI 200
EuroStoxx50
Nikkei 225 HSI
TOPIX
FTSE 100
MSCI W
orld
MSCI Sing
S&P 500
ASX 200
June 25, 2012 Asia
Goldman Sachs Global Economics, Commodities and Strategy Research 8
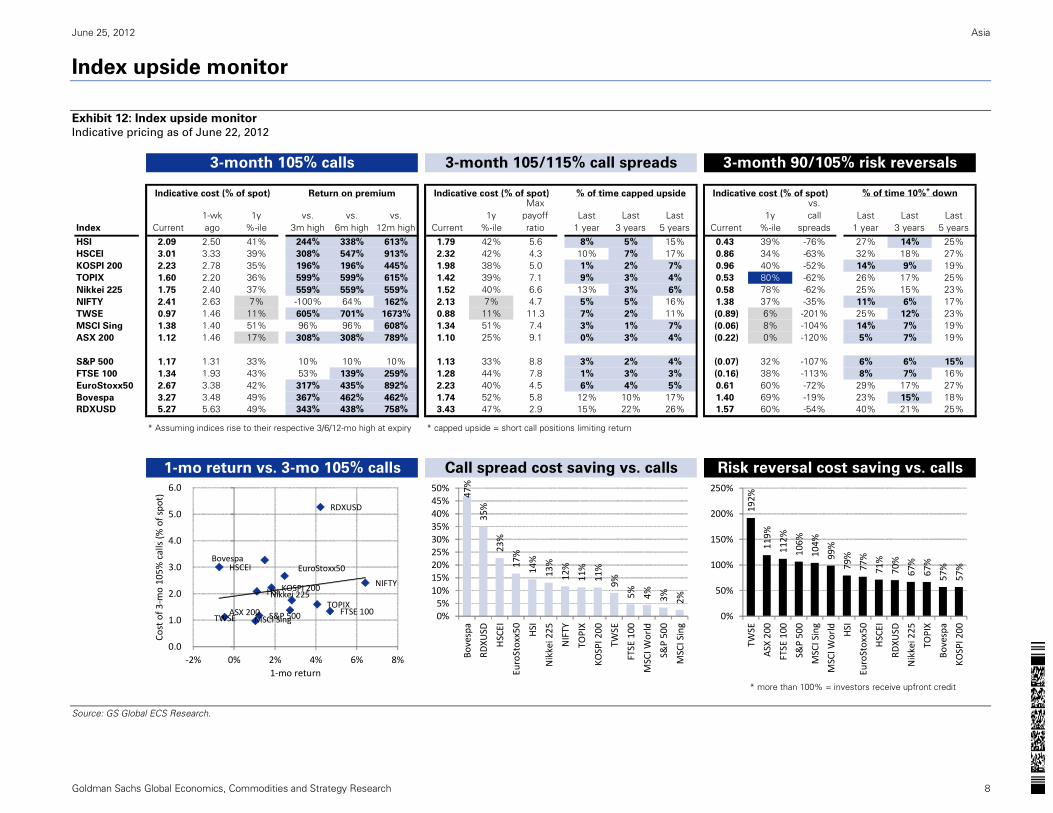
Index upside monitor
Exhibit 12: Index upside monitor
Indicative pricing as of June 22, 2012
Source: GS Global ECS Research.
3-month 105% calls 3-month 105/115% call spreads 3-month 90/105% risk reversals
Indicative cost (% of spot) Return on premium Indicative cost (% of spot) % of time capped upside Indicative cost (% of spot) % of time 10%+ down
Index Current1-wk ago
1y %-ile
vs. 3m high
vs. 6m high
vs. 12m high Current
1y %-ile
Max payoff ratio
Last 1 year
Last 3 years
Last 5 years Current
1y %-ile
vs. call
spreadsLast
1 yearLast
3 yearsLast
5 years
HSI 2.09 2.50 41% 244% 338% 613% 1.79 42% 5.6 8% 5% 15% 0.43 39% -76% 27% 14% 25%HSCEI 3.01 3.33 39% 308% 547% 913% 2.32 42% 4.3 10% 7% 17% 0.86 34% -63% 32% 18% 27%KOSPI 200 2.23 2.78 35% 196% 196% 445% 1.98 38% 5.0 1% 2% 7% 0.96 40% -52% 14% 9% 19%TOPIX 1.60 2.20 36% 599% 599% 615% 1.42 39% 7.1 9% 3% 4% 0.53 80% -62% 26% 17% 25%Nikkei 225 1.75 2.40 37% 559% 559% 559% 1.52 40% 6.6 13% 3% 6% 0.58 78% -62% 25% 15% 23%NIFTY 2.41 2.63 7% -100% 64% 162% 2.13 7% 4.7 5% 5% 16% 1.38 37% -35% 11% 6% 17%TWSE 0.97 1.46 11% 605% 701% 1673% 0.88 11% 11.3 7% 2% 11% (0.89) 6% -201% 25% 12% 23%MSCI Sing 1.38 1.40 51% 96% 96% 608% 1.34 51% 7.4 3% 1% 7% (0.06) 8% -104% 14% 7% 19%ASX 200 1.12 1.46 17% 308% 308% 789% 1.10 25% 9.1 0% 3% 4% (0.22) 0% -120% 5% 7% 19%
S&P 500 1.17 1.31 33% 10% 10% 10% 1.13 33% 8.8 3% 2% 4% (0.07) 32% -107% 6% 6% 15%
FTSE 100 1.34 1.93 43% 53% 139% 259% 1.28 44% 7.8 1% 3% 3% (0.16) 38% -113% 8% 7% 16%EuroStoxx50 2.67 3.38 42% 317% 435% 892% 2.23 40% 4.5 6% 4% 5% 0.61 60% -72% 29% 17% 27%Bovespa 3.27 3.48 49% 367% 462% 462% 1.74 52% 5.8 12% 10% 17% 1.40 69% -19% 23% 15% 18%RDXUSD 5.27 5.63 49% 343% 438% 758% 3.43 47% 2.9 15% 22% 26% 1.57 60% -54% 40% 21% 25%
* Assuming indices rise to their respective 3/6/12-mo high at expiry * capped upside = short call positions limiting return
1-mo return vs. 3-mo 105% calls Call spread cost saving vs. calls Risk reversal cost saving vs. calls
* more than 100% = investors receive upfront credit
HSI
HSCEI
KOSPI 200
TOPIXNikkei 225
NIFTY
TWSE MSCI SingASX 200 S&P 500 FTSE 100
EuroStoxx50Bovespa
RDXUSD
0.0
1.0
2.0
3.0
4.0
5.0
6.0
‐2% 0% 2% 4% 6% 8%
Cost of 3
‐mo 105%
calls (%
of spo
t)
1‐mo return
47%
35%
23%
17%
14%
13%
12%
11%
11%
9%
5% 4% 3% 2%
0%5%
10%15%20%25%30%35%40%45%50%
Bovespa
RDXU
SD
HSCEI
EuroStoxx50
HSI
Nikkei 225
NIFTY
TOPIX
KOSPI 200
TWSE
FTSE 100
MSCI W
orld
S&P 500
MSCI Sing
192%
119%
112%
106%
104%
99%
79%
77%
71%
70%
67%
67%
57%
57%
0%
50%
100%
150%
200%
250%
TWSE
ASX
200
FTSE 100
S&P 500
MSCI Sing
MSCI W
orld
HSI
EuroStoxx50
HSCEI
RDXU
SD
Nikkei 225
TOPIX
Bovespa
KOSPI 200
June 25, 2012 Asia
Goldman Sachs Global Economics, Commodities and Strategy Research 9
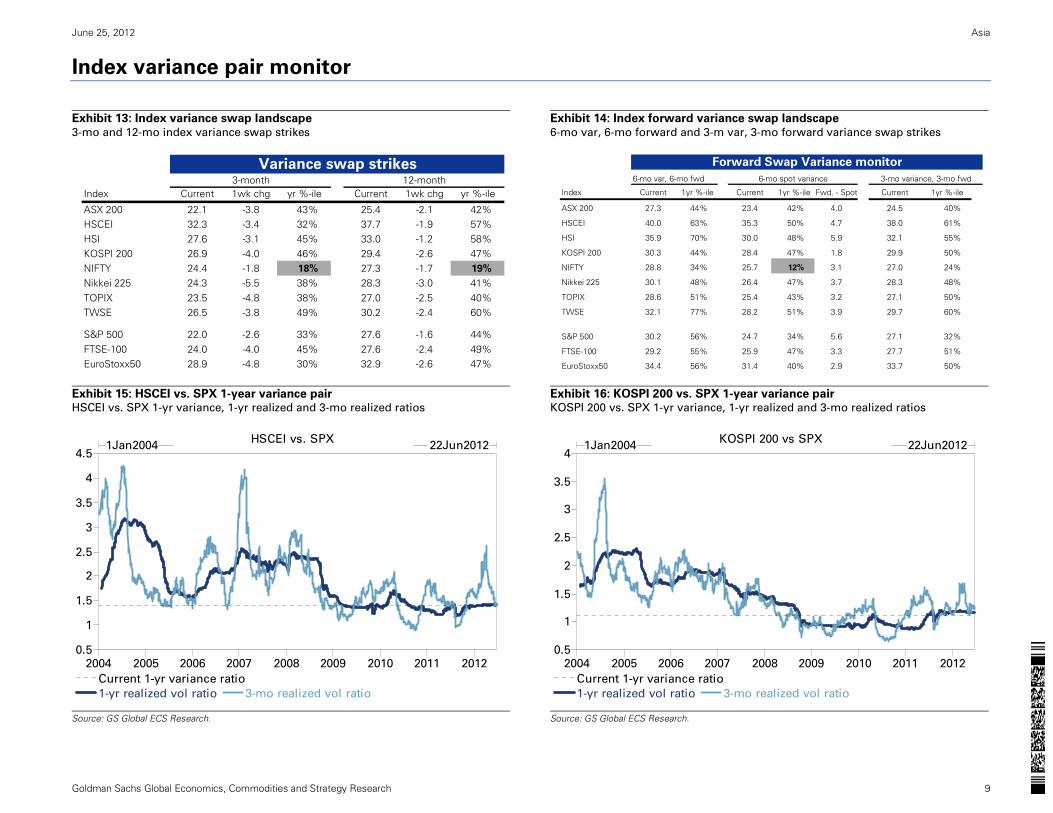
Index variance pair monitor
Exhibit 13: Index variance swap landscape
3-mo and 12-mo index variance swap strikes
Exhibit 14: Index forward variance swap landscape
6-mo var, 6-mo forward and 3-m var, 3-mo forward variance swap strikes
Exhibit 15: HSCEI vs. SPX 1-year variance pair HSCEI vs. SPX 1-yr variance, 1-yr realized and 3-mo realized ratios
Exhibit 16: KOSPI 200 vs. SPX 1-year variance pair KOSPI 200 vs. SPX 1-yr variance, 1-yr realized and 3-mo realized ratios
Source: GS Global ECS Research.
Source: GS Global ECS Research.
3-month 12-monthIndex Current 1wk chg yr %-ile Current 1wk chg yr %-ile
ASX 200 22.1 -3.8 43% 25.4 -2.1 42%HSCEI 32.3 -3.4 32% 37.7 -1.9 57%HSI 27.6 -3.1 45% 33.0 -1.2 58%KOSPI 200 26.9 -4.0 46% 29.4 -2.6 47%NIFTY 24.4 -1.8 18% 27.3 -1.7 19%
Nikkei 225 24.3 -5.5 38% 28.3 -3.0 41%TOPIX 23.5 -4.8 38% 27.0 -2.5 40%TWSE 26.5 -3.8 49% 30.2 -2.4 60%
S&P 500 22.0 -2.6 33% 27.6 -1.6 44%FTSE-100 24.0 -4.0 45% 27.6 -2.4 49%EuroStoxx50 28.9 -4.8 30% 32.9 -2.6 47%
Variance swap strikes6-mo var, 6-mo fwd 6-mo spot variance 3-mo variance, 3-mo fwd
Index Current 1yr %-ile Current 1yr %-ile Fwd. - Spot Current 1yr %-ile
ASX 200 27.3 44% 23.4 42% 4.0 24.5 40%
HSCEI 40.0 63% 35.3 50% 4.7 38.0 61%
HSI 35.9 70% 30.0 48% 5.9 32.1 55%
KOSPI 200 30.3 44% 28.4 47% 1.8 29.9 50%
NIFTY 28.8 34% 25.7 12% 3.1 27.0 24%
Nikkei 225 30.1 48% 26.4 47% 3.7 28.3 48%
TOPIX 28.6 51% 25.4 43% 3.2 27.1 50%
TWSE 32.1 77% 28.2 51% 3.9 29.7 60%
S&P 500 30.2 56% 24.7 34% 5.6 27.1 32%
FTSE-100 29.2 55% 25.9 47% 3.3 27.7 51%
EuroStoxx50 34.4 56% 31.4 40% 2.9 33.7 50%
Forward Swap Variance monitor
1-yr realized vol ratio 3-mo realized vol ratio
Current 1-yr variance ratio
HSCEI vs. SPX
0.5
1
1.5
2
2.5
3
3.5
4
4.5
2004 2005 2006 2007 2008 2009 2010 2011 2012
1Jan2004 22Jun2012
1-yr realized vol ratio 3-mo realized vol ratio
Current 1-yr variance ratio
KOSPI 200 vs SPX
0.5
1
1.5
2
2.5
3
3.5
4
2004 2005 2006 2007 2008 2009 2010 2011 2012
1Jan2004 22Jun2012
June 25, 2012 Asia
Goldman Sachs Global Economics, Commodities and Strategy Research 10
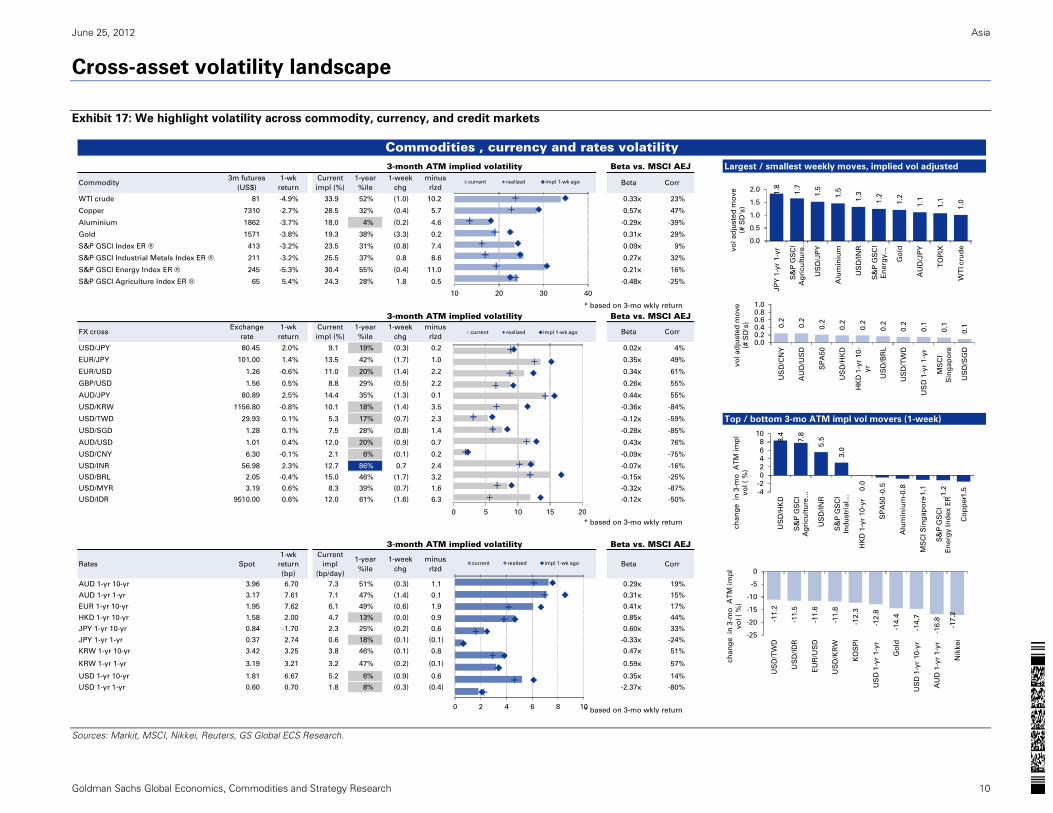
Cross-asset volatility landscape
Exhibit 17: We highlight volatility across commodity, currency, and credit markets
Sources: Markit, MSCI, Nikkei, Reuters, GS Global ECS Research.
Largest / smallest weekly moves, implied vol adjusted
Commodity3m futures
(US$)
1-wk
return
Current
impl (%)
1-year
%ile
1-week
chg
minus
rlzdBeta Corr
WTI crude 81 -4.9% 33.9 52% (1.0) 10.2 0.33x 23%
Copper 7310 -2.7% 28.5 32% (0.4) 5.7 0.57x 47%
Aluminium 1862 -3.7% 18.0 4% (0.2) 4.6 -0.29x -39%
Gold 1571 -3.8% 19.3 38% (3.3) 0.2 0.31x 29%
S&P GSCI Index ER ® 413 -3.2% 23.5 31% (0.8) 7.4 0.09x 9%
S&P GSCI Industrial Metals Index ER ® 211 -3.2% 25.5 37% 0.8 8.6 0.27x 32%
S&P GSCI Energy Index ER ® 245 -5.3% 30.4 55% (0.4) 11.0 0.21x 16%
S&P GSCI Agriculture Index ER ® 65 5.4% 24.3 28% 1.8 0.5 -0.48x -25%
* based on 3-mo wkly return
FX crossExchange
rate
1-wk
return
Current
impl (%)
1-year
%ile
1-week
chg
minus
rlzdBeta Corr
USD/JPY 80.45 2.0% 9.1 19% (0.3) 0.2 0.02x 4%
EUR/JPY 101.00 1.4% 13.5 42% (1.7) 1.0 0.35x 49%
EUR/USD 1.26 -0.6% 11.0 20% (1.4) 2.2 0.34x 61%
GBP/USD 1.56 0.5% 8.8 29% (0.5) 2.2 0.26x 55%
AUD/JPY 80.89 2.5% 14.4 35% (1.3) 0.1 0.44x 55%
USD/KRW 1156.80 -0.8% 10.1 18% (1.4) 3.5 -0.36x -84%
USD/TWD 29.93 0.1% 5.3 17% (0.7) 2.3 -0.12x -59% Top / bottom 3-mo ATM impl vol movers (1-week)
USD/SGD 1.28 0.1% 7.5 28% (0.8) 1.4 -0.28x -85%
AUD/USD 1.01 0.4% 12.0 20% (0.9) 0.7 0.43x 76%
USD/CNY 6.30 -0.1% 2.1 6% (0.1) 0.2 -0.09x -75%
USD/INR 56.98 2.3% 12.7 86% 0.7 2.4 -0.07x -16%
USD/BRL 2.05 -0.4% 15.0 46% (1.7) 3.2 -0.15x -25%
USD/MYR 3.19 0.6% 8.3 39% (0.7) 1.6 -0.32x -87%
USD/IDR 9510.00 0.6% 12.0 61% (1.6) 6.3 -0.12x -50%
* based on 3-mo wkly return
Rates Spot
1-wk
return
(bp)
Current
impl
(bp/day)
1-year
%ile
1-week
chg
minus
rlzdBeta Corr
AUD 1-yr 10-yr 3.96 6.70 7.3 51% (0.3) 1.1 0.29x 19%
AUD 1-yr 1-yr 3.17 7.61 7.1 47% (1.4) 0.1 0.31x 15%
EUR 1-yr 10-yr 1.95 7.62 6.1 49% (0.6) 1.9 0.41x 17%
HKD 1-yr 10-yr 1.58 2.00 4.7 13% (0.0) 0.9 0.85x 44%
JPY 1-yr 10-yr 0.84 -1.70 2.3 25% (0.2) 0.6 0.60x 33%
JPY 1-yr 1-yr 0.37 2.74 0.6 18% (0.1) (0.1) -0.33x -24%
KRW 1-yr 10-yr 3.42 3.25 3.8 46% (0.1) 0.8 0.47x 51%
KRW 1-yr 1-yr 3.19 3.21 3.2 47% (0.2) (0.1) 0.59x 57%
USD 1-yr 10-yr 1.81 6.67 5.2 6% (0.9) 0.6 0.35x 14%
USD 1-yr 1-yr 0.60 0.70 1.8 8% (0.3) (0.4) -2.37x -80%
* based on 3-mo wkly return
3-month ATM implied volatility Beta vs. MSCI AEJ
Commodities , currency and rates volatility3-month ATM implied volatility Beta vs. MSCI AEJ
3-month ATM implied volatility Beta vs. MSCI AEJ
0 5 10 15 20
current realized impl 1-wk ago
10 20 30 40
current realized impl 1-wk ago
0 2 4 6 8 10
current realized impl 1-wk ago
1.8
1.7
1.5
1.5
1.3
1.2
1.2
1.1
1.1
1.0
0.0
0.5
1.0
1.5
2.0
JP
Y 1
-yr
1-y
r
S&
P G
SC
I
Ag
ricu
ltu
re …
US
D/J
PY
Alu
min
ium
US
D/I
NR
S&
P G
SC
I
En
erg
y …
Go
ld
AU
D/J
PY
TO
PIX
WT
I cru
devo
l ad
juste
d m
ove
(# S
D's
)
0.2
0.2
0.2
0.2
0.2
0.2
0.2
0.1
0.1
0.1
0.00.20.40.60.81.0
US
D/C
NY
AU
D/U
SD
SP
A50
US
D/H
KD
HK
D 1
-yr
10-
yr
US
D/B
RL
US
D/T
WD
US
D 1
-yr
1-y
r
MS
CI
Sin
gap
ore
US
D/S
GD
vo
l ad
juste
d m
ove
(# S
D's
)
8.4
7.8
5.5
3.0
0.0
-0.5
-0.8
-1.1
-1.2
-1.5-4
-2
0246
810
US
D/H
KD
S&
P G
SC
I
Ag
ricu
ltu
re …
US
D/IN
R
S&
P G
SC
I
Ind
ustr
ial …
HK
D 1
-yr
10-y
r
SP
A50
Alu
min
ium
MS
CI S
ing
ap
ore
S&
P G
SC
I
En
erg
y In
dex E
R
Co
pp
er
ch
an
ge in
3-m
o A
TM
im
pl
vo
l (
%)
-11.2
-11.5
-11.6
-11.8
-12.3
-12.8
-14.4
-14.7
-16
.8
-17.2
-25
-20
-15
-10
-5
0
US
D/T
WD
US
D/I
DR
EU
R/U
SD
US
D/K
RW
KO
SP
I
US
D 1
-yr
1-y
r
Go
ld
US
D 1
-yr
10-y
r
AU
D 1
-yr
1-y
r
Nik
kei
ch
an
ge in
3-m
o A
TM
im
pl
vo
l (
%)
June 25, 2012 Asia
Goldman Sachs Global Economics, Commodities and Strategy Research 11
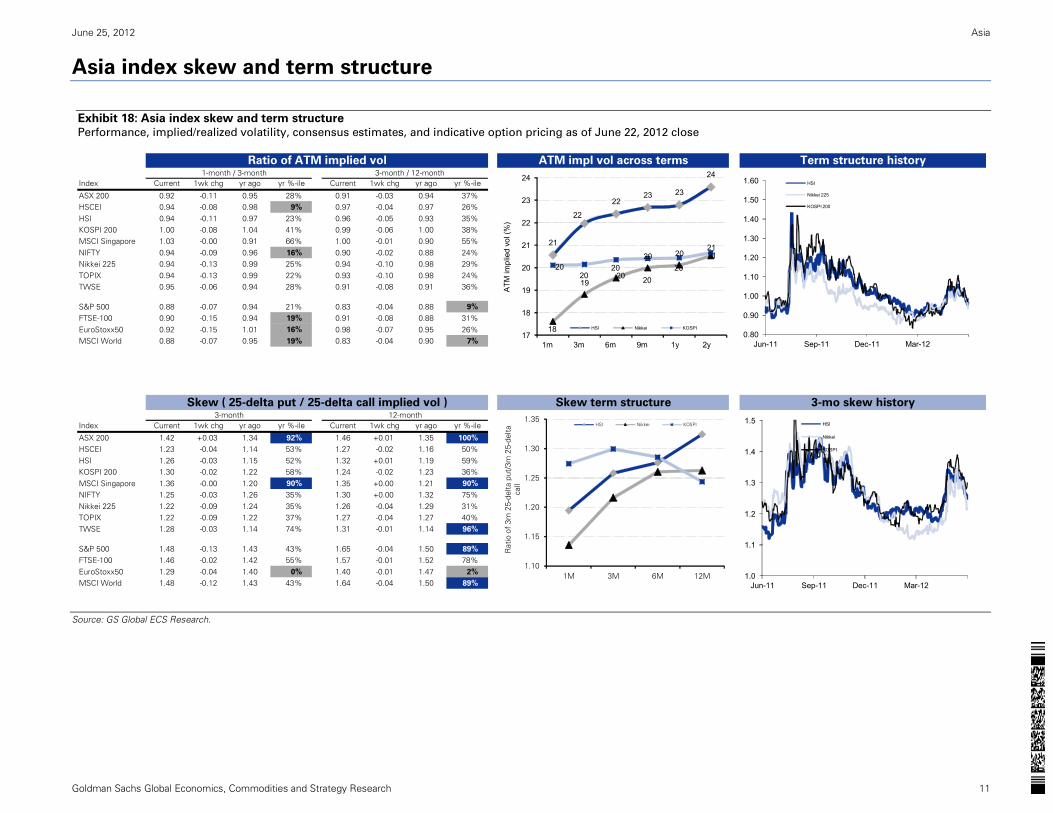
Asia index skew and term structure
Exhibit 18: Asia index skew and term structure
Performance, implied/realized volatility, consensus estimates, and indicative option pricing as of June 22, 2012 close
Source: GS Global ECS Research.
1-month / 3-month 3-month / 12-monthIndex Current 1wk chg yr ago yr %-ile Current 1wk chg yr ago yr %-ile
ASX 200 0.92 -0.11 0.95 28% 0.91 -0.03 0.94 37%HSCEI 0.94 -0.08 0.98 9% 0.97 -0.04 0.97 26%HSI 0.94 -0.11 0.97 23% 0.96 -0.05 0.93 35%KOSPI 200 1.00 -0.08 1.04 41% 0.99 -0.06 1.00 38%MSCI Singapore 1.03 -0.00 0.91 66% 1.00 -0.01 0.90 55%NIFTY 0.94 -0.09 0.96 16% 0.90 -0.02 0.88 24%Nikkei 225 0.94 -0.13 0.99 25% 0.94 -0.10 0.98 29%TOPIX 0.94 -0.13 0.99 22% 0.93 -0.10 0.98 24%TWSE 0.95 -0.06 0.94 28% 0.91 -0.08 0.91 36%
S&P 500 0.88 -0.07 0.94 21% 0.83 -0.04 0.88 9%
FTSE-100 0.90 -0.15 0.94 19% 0.91 -0.08 0.88 31%EuroStoxx50 0.92 -0.15 1.01 16% 0.98 -0.07 0.95 26%MSCI World 0.88 -0.07 0.95 19% 0.83 -0.04 0.90 7%
3-month 12-monthIndex Current 1wk chg yr ago yr %-ile Current 1wk chg yr ago yr %-ile
ASX 200 1.42 +0.03 1.34 92% 1.46 +0.01 1.35 100%
HSCEI 1.23 -0.04 1.14 53% 1.27 -0.02 1.16 50%HSI 1.26 -0.03 1.15 52% 1.32 +0.01 1.19 59%KOSPI 200 1.30 -0.02 1.22 58% 1.24 -0.02 1.23 36%MSCI Singapore 1.36 -0.00 1.20 90% 1.35 +0.00 1.21 90%
NIFTY 1.25 -0.03 1.26 35% 1.30 +0.00 1.32 75%Nikkei 225 1.22 -0.09 1.24 35% 1.26 -0.04 1.29 31%TOPIX 1.22 -0.09 1.22 37% 1.27 -0.04 1.27 40%TWSE 1.28 -0.03 1.14 74% 1.31 -0.01 1.14 96%
S&P 500 1.48 -0.13 1.43 43% 1.65 -0.04 1.50 89%
FTSE-100 1.46 -0.02 1.42 55% 1.57 -0.01 1.52 78%EuroStoxx50 1.29 -0.04 1.40 0% 1.40 -0.01 1.47 2%
MSCI World 1.48 -0.12 1.43 43% 1.64 -0.04 1.50 89%
Term structure history
3-mo skew historySkew ( 25-delta put / 25-delta call implied vol )
Ratio of ATM implied vol ATM impl vol across terms
Skew term structure
1.0
1.1
1.2
1.3
1.4
1.5
Jun-11 Sep-11 Dec-11 Mar-12
HSI
Nikkei
KOSPI
1.10
1.15
1.20
1.25
1.30
1.35
1M 3M 6M 12M
Rat
io o
f 3m
25-
delta
put
/3m
25-
delta
ca
ll
HSI Nikkei KOSPI
21
22
2223 23
24
18
19
2020 20
21
2020 20 20
2021
17
18
19
20
21
22
23
24
ATM
impl
ied
vol (
%)
HSI Nikkei KOSPI0.80
0.90
1.00
1.10
1.20
1.30
1.40
1.50
1.60
Jun-11 Sep-11 Dec-11 Mar-12
HSI
Nikkei 225
KOSPI 200
June 25, 2012 Asia
Goldman Sachs Global Economics, Commodities and Strategy Research 12
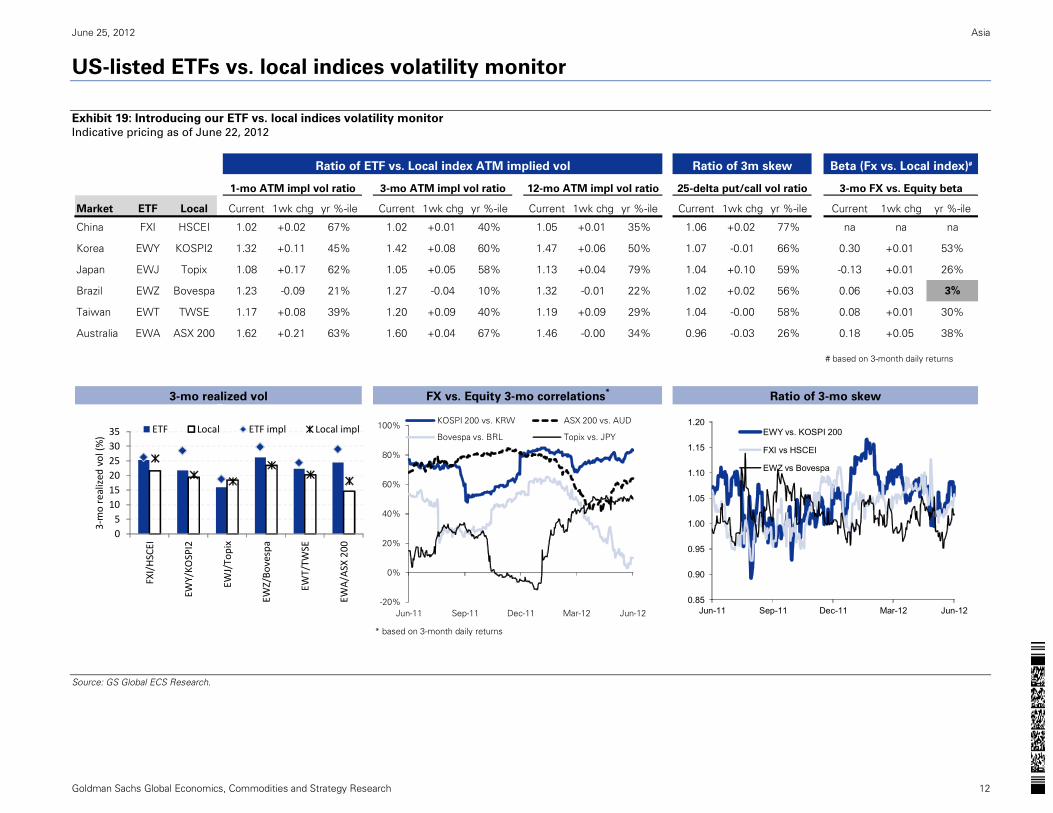
US-listed ETFs vs. local indices volatility monitor
Exhibit 19: Introducing our ETF vs. local indices volatility monitor
Indicative pricing as of June 22, 2012
Source: GS Global ECS Research.
Market ETF Local Current 1wk chg yr %-ile Current 1wk chg yr %-ile Current 1wk chg yr %-ile Current 1wk chg yr %-ile Current 1wk chg yr %-ile
China FXI HSCEI 1.02 +0.02 67% 1.02 +0.01 40% 1.05 +0.01 35% 1.06 +0.02 77% na na na
Korea EWY KOSPI2 1.32 +0.11 45% 1.42 +0.08 60% 1.47 +0.06 50% 1.07 -0.01 66% 0.30 +0.01 53%
Japan EWJ Topix 1.08 +0.17 62% 1.05 +0.05 58% 1.13 +0.04 79% 1.04 +0.10 59% -0.13 +0.01 26%
Brazil EWZ Bovespa 1.23 -0.09 21% 1.27 -0.04 10% 1.32 -0.01 22% 1.02 +0.02 56% 0.06 +0.03 3%
Taiwan EWT TWSE 1.17 +0.08 39% 1.20 +0.09 40% 1.19 +0.09 29% 1.04 -0.00 58% 0.08 +0.01 30%
Australia EWA ASX 200 1.62 +0.21 63% 1.60 +0.04 67% 1.46 -0.00 34% 0.96 -0.03 26% 0.18 +0.05 38%
# based on 3-month daily returns
* based on 3-month daily returns
Beta (Fx vs. Local index)#
3-mo FX vs. Equity beta
FX vs. Equity 3-mo correlations*
Ratio of 3-mo skew
Ratio of 3m skew
3-mo ATM impl vol ratio 12-mo ATM impl vol ratio
Ratio of ETF vs. Local index ATM implied vol
3-mo realized vol
25-delta put/call vol ratio1-mo ATM impl vol ratio
05
101520253035
FXI/HSCEI
EWY/KO
SPI2
EWJ/Topix
EWZ/Bo
vespa
EWT/TW
SE
EWA/ASX
200
3‐mo realized
vol (%
)
ETF Local ETF impl Local impl
-20%
0%
20%
40%
60%
80%
100%
Jun-11 Sep-11 Dec-11 Mar-12 Jun-12
KOSPI 200 vs. KRW ASX 200 vs. AUD
Bovespa vs. BRL Topix vs. JPY
0.85
0.90
0.95
1.00
1.05
1.10
1.15
1.20
Jun-11 Sep-11 Dec-11 Mar-12 Jun-12
EWY vs. KOSPI 200
FXI vs HSCEI
EWZ vs Bovespa
June 25, 2012 Asia
Goldman Sachs Global Economics, Commodities and Strategy Research 13
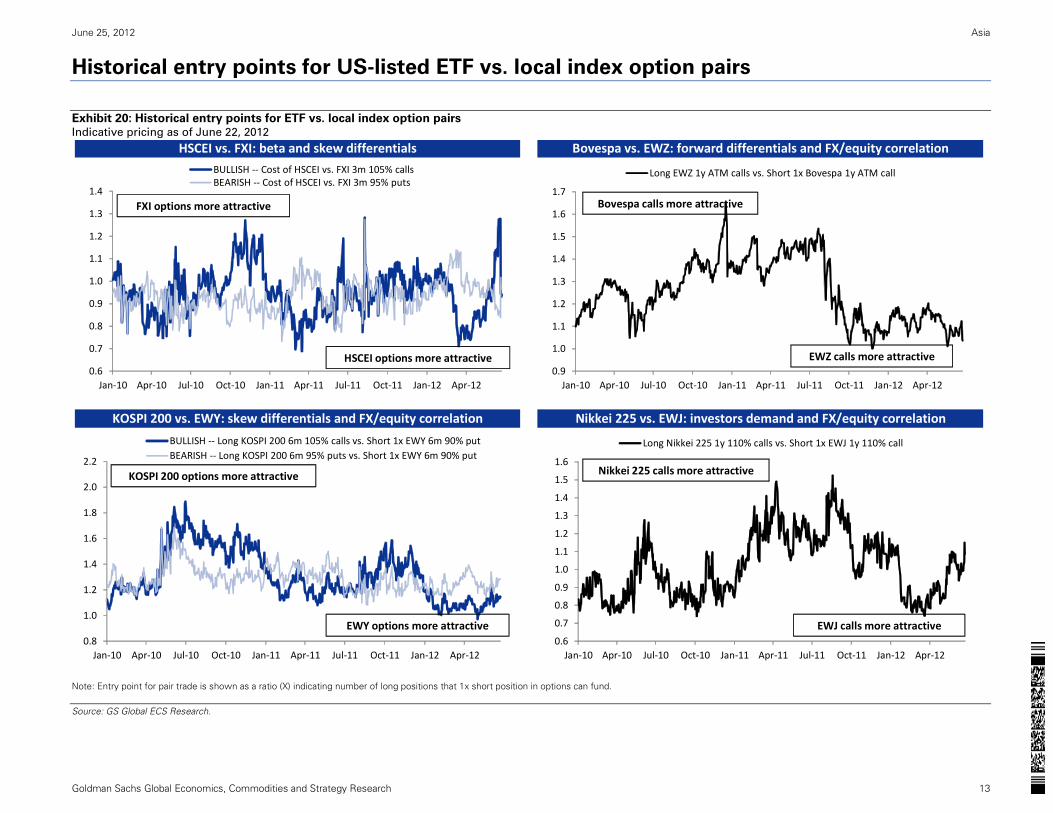
Historical entry points for US-listed ETF vs. local index option pairs
Exhibit 20: Historical entry points for ETF vs. local index option pairs Indicative pricing as of June 22, 2012
Note: Entry point for pair trade is shown as a ratio (X) indicating number of long positions that 1x short position in options can fund.
Source: GS Global ECS Research.
HSCEI vs. FXI: beta and skew differentials Bovespa vs. EWZ: forward differentials and FX/equity correlation
Nikkei 225 vs. EWJ: investors demand and FX/equity correlationKOSPI 200 vs. EWY: skew differentials and FX/equity correlation
0.6
0.7
0.8
0.9
1.0
1.1
1.2
1.3
1.4
Jan‐10 Apr‐10 Jul‐10 Oct‐10 Jan‐11 Apr‐11 Jul‐11 Oct‐11 Jan‐12 Apr‐12
BULLISH ‐‐ Cost of HSCEI vs. FXI 3m 105% callsBEARISH ‐‐ Cost of HSCEI vs. FXI 3m 95% puts
FXI options more attractive
HSCEI options more attractive0.9
1.0
1.1
1.2
1.3
1.4
1.5
1.6
1.7
Jan‐10 Apr‐10 Jul‐10 Oct‐10 Jan‐11 Apr‐11 Jul‐11 Oct‐11 Jan‐12 Apr‐12
Long EWZ 1y ATM calls vs. Short 1x Bovespa 1y ATM call
Bovespa calls more attractive
EWZ calls more attractive
0.8
1.0
1.2
1.4
1.6
1.8
2.0
2.2
Jan‐10 Apr‐10 Jul‐10 Oct‐10 Jan‐11 Apr‐11 Jul‐11 Oct‐11 Jan‐12 Apr‐12
BULLISH ‐‐ Long KOSPI 200 6m 105% calls vs. Short 1x EWY 6m 90% putBEARISH ‐‐ Long KOSPI 200 6m 95% puts vs. Short 1x EWY 6m 90% put
KOSPI 200 options more attractive
EWY options more attractive0.6
0.7
0.8
0.9
1.0
1.1
1.2
1.3
1.4
1.5
1.6
Jan‐10 Apr‐10 Jul‐10 Oct‐10 Jan‐11 Apr‐11 Jul‐11 Oct‐11 Jan‐12 Apr‐12
Long Nikkei 225 1y 110% calls vs. Short 1x EWJ 1y 110% call
Nikkei 225 calls more attractive
EWJ calls more attractive
June 25, 2012 Asia
Goldman Sachs Global Economics, Commodities and Strategy Research 14
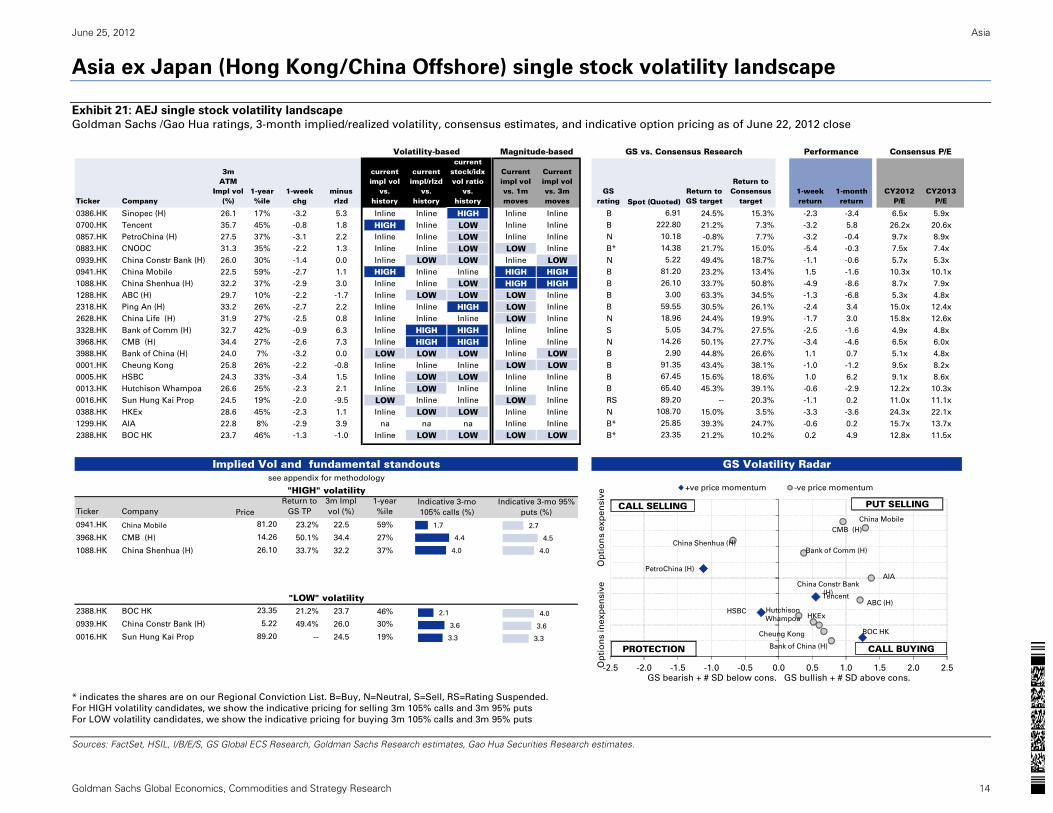
Asia ex Japan (Hong Kong/China Offshore) single stock volatility landscape
Exhibit 21: AEJ single stock volatility landscape
Goldman Sachs /Gao Hua ratings, 3-month implied/realized volatility, consensus estimates, and indicative option pricing as of June 22, 2012 close
* indicates the shares are on our Regional Conviction List. B=Buy, N=Neutral, S=Sell, RS=Rating Suspended.
For HIGH volatility candidates, we show the indicative pricing for selling 3m 105% calls and 3m 95% puts
For LOW volatility candidates, we show the indicative pricing for buying 3m 105% calls and 3m 95% puts
Sources: FactSet, HSIL, I/B/E/S, GS Global ECS Research, Goldman Sachs Research estimates, Gao Hua Securities Research estimates.
Ticker Company
3m ATM
Impl vol (%)
1-year %ile
1-week chg
minus rlzd
current impl vol
vs. history
current impl/rlzd
vs. history
current stock/idx vol ratio
vs. history
Current impl vol vs. 1m moves
Current impl vol vs. 3m moves
GS rating
Return to GS target
Return to Consensus
target1-week return
1-month return
CY2012 P/E
CY2013 P/E
0386.HK Sinopec (H) 26.1 17% -3.2 5.3 Inline Inline HIGH Inline Inline B 24.5% 15.3% -2.3 -3.4 6.5x 5.9x
0700.HK Tencent 35.7 45% -0.8 1.8 HIGH Inline LOW Inline Inline B 21.2% 7.3% -3.2 5.8 26.2x 20.6x
0857.HK PetroChina (H) 27.5 37% -3.1 2.2 Inline Inline LOW Inline Inline N -0.8% 7.7% -3.2 -0.4 9.7x 8.9x
0883.HK CNOOC 31.3 35% -2.2 1.3 Inline Inline LOW LOW Inline B* 21.7% 15.0% -5.4 -0.3 7.5x 7.4x
0939.HK China Constr Bank (H) 26.0 30% -1.4 0.0 Inline LOW LOW Inline LOW N 49.4% 18.7% -1.1 -0.6 5.7x 5.3x
0941.HK China Mobile 22.5 59% -2.7 1.1 HIGH Inline Inline HIGH HIGH B 23.2% 13.4% 1.5 -1.6 10.3x 10.1x
1088.HK China Shenhua (H) 32.2 37% -2.9 3.0 Inline Inline LOW HIGH HIGH B 33.7% 50.8% -4.9 -8.6 8.7x 7.9x
1288.HK ABC (H) 29.7 10% -2.2 -1.7 Inline LOW LOW LOW Inline B 63.3% 34.5% -1.3 -6.8 5.3x 4.8x
2318.HK Ping An (H) 33.2 26% -2.7 2.2 Inline Inline HIGH LOW Inline B 30.5% 26.1% -2.4 3.4 15.0x 12.4x
2628.HK China Life (H) 31.9 27% -2.5 0.8 Inline Inline Inline LOW Inline N 24.4% 19.9% -1.7 3.0 15.8x 12.6x
3328.HK Bank of Comm (H) 32.7 42% -0.9 6.3 Inline HIGH HIGH Inline Inline S 34.7% 27.5% -2.5 -1.6 4.9x 4.8x
3968.HK CMB (H) 34.4 27% -2.6 7.3 Inline HIGH HIGH Inline Inline N 50.1% 27.7% -3.4 -4.6 6.5x 6.0x
3988.HK Bank of China (H) 24.0 7% -3.2 0.0 LOW LOW LOW Inline LOW B 44.8% 26.6% 1.1 0.7 5.1x 4.8x
0001.HK Cheung Kong 25.8 26% -2.2 -0.8 Inline Inline Inline LOW LOW B 43.4% 38.1% -1.0 -1.2 9.5x 8.2x
0005.HK HSBC 24.3 33% -3.4 1.5 Inline LOW LOW Inline Inline B 15.6% 18.6% 1.0 6.2 9.1x 8.6x
0013.HK Hutchison Whampoa 26.6 25% -2.3 2.1 Inline LOW Inline Inline Inline B 45.3% 39.1% -0.6 -2.9 12.2x 10.3x
0016.HK Sun Hung Kai Prop 24.5 19% -2.0 -9.5 LOW Inline Inline LOW Inline RS -- 20.3% -1.1 0.2 11.0x 11.1x
0388.HK HKEx 28.6 45% -2.3 1.1 Inline LOW LOW Inline Inline N 15.0% 3.5% -3.3 -3.6 24.3x 22.1x
1299.HK AIA 22.8 8% -2.9 3.9 na na na Inline Inline B* 39.3% 24.7% -0.6 0.2 15.7x 13.7x
2388.HK BOC HK 23.7 46% -1.3 -1.0 Inline LOW LOW LOW LOW B* 21.2% 10.2% 0.2 4.9 12.8x 11.5x
Implied Vol and fundamental standouts GS Volatility Radar
Ticker Company
Return to
GS TP
3m Impl
vol (%)
1-year
%ile
0941.HK China Mobile 23.2% 22.5 59%
3968.HK CMB (H) 50.1% 34.4 27%
1088.HK China Shenhua (H) 33.7% 32.2 37%
2388.HK BOC HK 21.2% 23.7 46%
0939.HK China Constr Bank (H) 49.4% 26.0 30%
0016.HK Sun Hung Kai Prop -- 24.5 19%
Volatility-based Magnitude-based
25.85
23.35
PerformanceGS vs. Consensus Research
108.70
Spot (Quoted)
222.80
10.18
Consensus P/E
91.35
67.45
65.40
89.20
59.55
18.96
5.05
14.26
2.90
14.38
5.22
81.20
26.10
3.00
6.91
see appendix for methodology
26.10
14.26
81.20
Price
Indicative 3-mo
105% calls (%)
"HIGH" volatilityIndicative 3-mo 95%
puts (%)
"LOW" volatility
89.20
5.22
23.35
1.7
4.4
4.0
2.1
3.6
3.3
2.7
4.5
4.0
4.0
3.6
3.3
Tencent
PetroChina (H)
HSBC
BOC HK
China Constr Bank
(H)
China Mobile
China Shenhua (H)
ABC (H)
Bank of Comm (H)
CMB (H)
Bank of China (H)
Cheung Kong
Hutchison
Whampoa HKEx
AIA
-2.5 -2.0 -1.5 -1.0 -0.5 0.0 0.5 1.0 1.5 2.0 2.5GS bearish + # SD below cons. GS bullish + # SD above cons.
+ve price momentum -ve price momentum
CALL SELLING
CALL BUYING
PUT SELLING
PROTECTION
Op
tio
ns in
ex
pe
nsiv
e
Op
tio
ns e
xp
en
siv
e
June 25, 2012 Asia
Goldman Sachs Global Economics, Commodities and Strategy Research 15
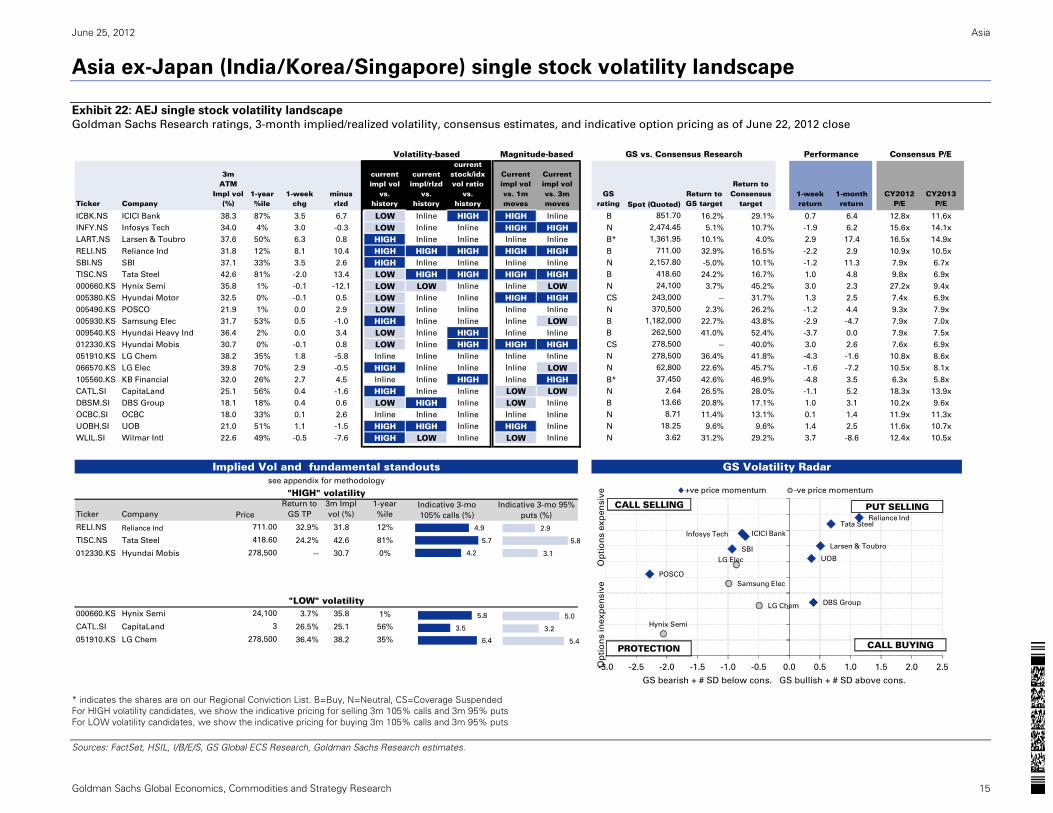
Asia ex-Japan (India/Korea/Singapore) single stock volatility landscape
Exhibit 22: AEJ single stock volatility landscape
Goldman Sachs Research ratings, 3-month implied/realized volatility, consensus estimates, and indicative option pricing as of June 22, 2012 close
* indicates the shares are on our Regional Conviction List. B=Buy, N=Neutral, CS=Coverage Suspended For HIGH volatility candidates, we show the indicative pricing for selling 3m 105% calls and 3m 95% puts For LOW volatility candidates, we show the indicative pricing for buying 3m 105% calls and 3m 95% puts
Sources: FactSet, HSIL, I/B/E/S, GS Global ECS Research, Goldman Sachs Research estimates.
Ticker Company
3m ATM
Impl vol (%)
1-year %ile
1-week chg
minus rlzd
current impl vol
vs. history
current impl/rlzd
vs. history
current stock/idx vol ratio
vs. history
Current impl vol vs. 1m moves
Current impl vol vs. 3m moves
GS rating
Return to GS target
Return to Consensus
target1-week return
1-month return
CY2012 P/E
CY2013 P/E
ICBK.NS ICICI Bank 38.3 87% 3.5 6.7 LOW Inline HIGH HIGH Inline B 16.2% 29.1% 0.7 6.4 12.8x 11.6x
INFY.NS Infosys Tech 34.0 4% 3.0 -0.3 LOW Inline Inline HIGH HIGH N 5.1% 10.7% -1.9 6.2 15.6x 14.1x
LART.NS Larsen & Toubro 37.6 50% 6.3 0.8 HIGH Inline Inline Inline Inline B* 10.1% 4.0% 2.9 17.4 16.5x 14.9x
RELI.NS Reliance Ind 31.8 12% 8.1 10.4 HIGH HIGH HIGH HIGH HIGH B 32.9% 16.5% -2.2 2.9 10.9x 10.5x
SBI.NS SBI 37.1 33% 3.5 2.6 HIGH Inline Inline Inline Inline N -5.0% 10.1% -1.2 11.3 7.9x 6.7x
TISC.NS Tata Steel 42.6 81% -2.0 13.4 LOW HIGH HIGH HIGH HIGH B 24.2% 16.7% 1.0 4.8 9.8x 6.9x
000660.KS Hynix Semi 35.8 1% -0.1 -12.1 LOW LOW Inline Inline LOW N 3.7% 45.2% 3.0 2.3 27.2x 9.4x
005380.KS Hyundai Motor 32.5 0% -0.1 0.5 LOW Inline Inline HIGH HIGH CS -- 31.7% 1.3 2.5 7.4x 6.9x
005490.KS POSCO 21.9 1% 0.0 2.9 LOW Inline Inline Inline Inline N 2.3% 26.2% -1.2 4.4 9.3x 7.9x
005930.KS Samsung Elec 31.7 53% 0.5 -1.0 HIGH Inline Inline Inline LOW B 22.7% 43.8% -2.9 -4.7 7.9x 7.0x
009540.KS Hyundai Heavy Ind 36.4 2% 0.0 3.4 LOW Inline HIGH Inline Inline B 41.0% 52.4% -3.7 0.0 7.9x 7.5x
012330.KS Hyundai Mobis 30.7 0% -0.1 0.8 LOW Inline HIGH HIGH HIGH CS -- 40.0% 3.0 2.6 7.6x 6.9x
051910.KS LG Chem 38.2 35% 1.8 -5.8 Inline Inline Inline Inline Inline N 36.4% 41.8% -4.3 -1.6 10.8x 8.6x
066570.KS LG Elec 39.8 70% 2.9 -0.5 HIGH Inline Inline Inline LOW N 22.6% 45.7% -1.6 -7.2 10.5x 8.1x
105560.KS KB Financial 32.0 26% 2.7 4.5 Inline Inline HIGH Inline HIGH B* 42.6% 46.9% -4.8 3.5 6.3x 5.8x
CATL.SI CapitaLand 25.1 56% 0.4 -1.6 HIGH Inline Inline LOW LOW N 26.5% 28.0% -1.1 5.2 18.3x 13.9x
DBSM.SI DBS Group 18.1 18% 0.4 0.6 LOW HIGH Inline LOW Inline B 20.8% 17.1% 1.0 3.1 10.2x 9.6x
OCBC.SI OCBC 18.0 33% 0.1 2.6 Inline Inline Inline Inline Inline N 11.4% 13.1% 0.1 1.4 11.9x 11.3x
UOBH.SI UOB 21.0 51% 1.1 -1.5 HIGH HIGH Inline HIGH Inline N 9.6% 9.6% 1.4 2.5 11.6x 10.7x
WLIL.SI Wilmar Intl 22.6 49% -0.5 -7.6 HIGH LOW Inline LOW Inline N 31.2% 29.2% 3.7 -8.6 12.4x 10.5x
Implied Vol and fundamental standouts GS Volatility Radar
Ticker Company
Return to
GS TP
3m Impl
vol (%)
1-year
%ile
RELI.NS Reliance Ind 32.9% 31.8 12%
TISC.NS Tata Steel 24.2% 42.6 81%
012330.KS Hyundai Mobis -- 30.7 0%
000660.KS Hynix Semi 3.7% 35.8 1%
CATL.SI CapitaLand 26.5% 25.1 56%
051910.KS LG Chem 36.4% 38.2 35%
711.00
418.60
278,500
"LOW" volatility24,100
3
278,500
18.25
3.62
see appendix for methodology
"HIGH" volatility
Price
Indicative 3-mo
105% calls (%)
Indicative 3-mo 95%
puts (%)
8.71
24,100
243,000
370,500
1,182,000
262,500
278,500
278,500
62,800
37,450
2.64
13.66
Consensus P/E
Spot (Quoted)
418.60
Volatility-based Magnitude-based GS vs. Consensus Research Performance
851.70
2,474.45
1,361.95
711.00
2,157.80
4.9
5.7
4.2
5.8
3.5
6.4
2.9
5.8
3.1
5.0
3.2
5.4
ICICI BankInfosys Tech
Larsen & Toubro
Reliance Ind
SBI
Tata Steel
POSCO
DBS Group
UOB
Hynix Semi
Samsung Elec
LG Chem
LG Elec
-3.0 -2.5 -2.0 -1.5 -1.0 -0.5 0.0 0.5 1.0 1.5 2.0 2.5
GS bearish + # SD below cons. GS bullish + # SD above cons.
+ve price momentum -ve price momentum
CALL SELLING
CALL BUYING
PUT SELLING
PROTECTION
Op
tio
ns in
ex
pe
nsiv
e
Op
tio
ns e
xp
en
siv
e
June 25, 2012 Asia
Goldman Sachs Global Economics, Commodities and Strategy Research 16
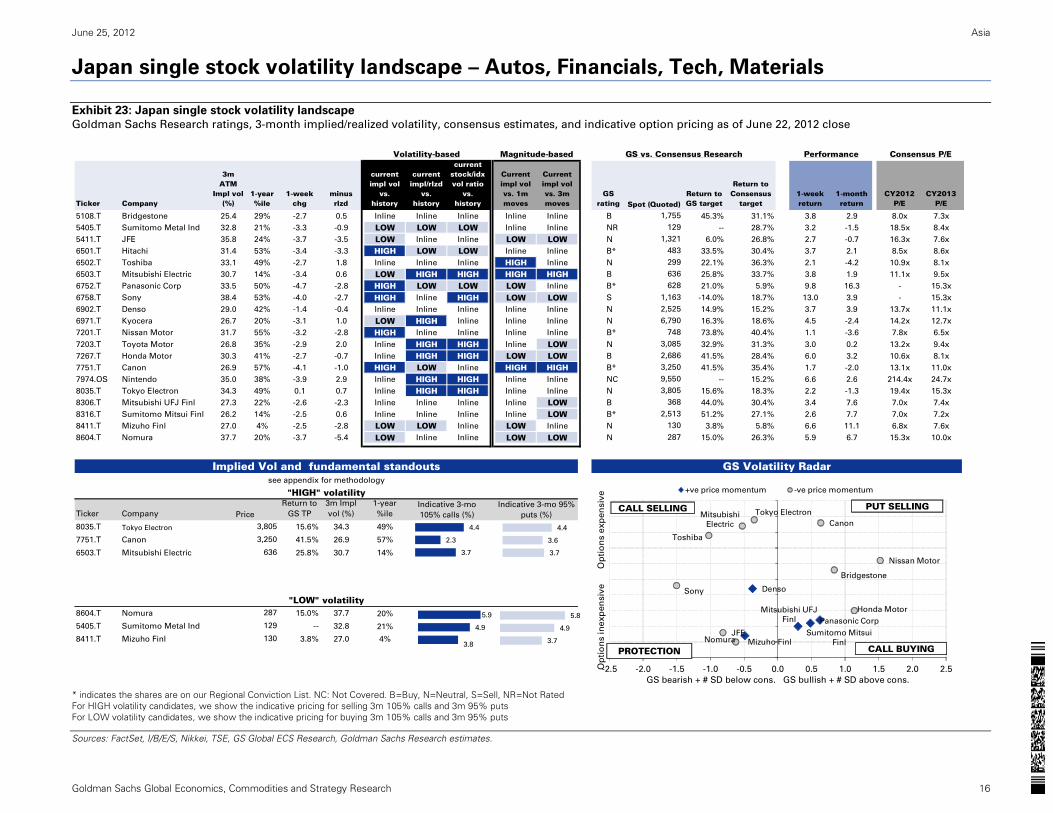
Japan single stock volatility landscape – Autos, Financials, Tech, Materials
Exhibit 23: Japan single stock volatility landscape
Goldman Sachs Research ratings, 3-month implied/realized volatility, consensus estimates, and indicative option pricing as of June 22, 2012 close
* indicates the shares are on our Regional Conviction List. NC: Not Covered. B=Buy, N=Neutral, S=Sell, NR=Not Rated For HIGH volatility candidates, we show the indicative pricing for selling 3m 105% calls and 3m 95% puts For LOW volatility candidates, we show the indicative pricing for buying 3m 105% calls and 3m 95% puts
Sources: FactSet, I/B/E/S, Nikkei, TSE, GS Global ECS Research, Goldman Sachs Research estimates.
Ticker Company
3m ATM
Impl vol (%)
1-year %ile
1-week chg
minus rlzd
current impl vol
vs. history
current impl/rlzd
vs. history
current stock/idx vol ratio
vs. history
Current impl vol vs. 1m moves
Current impl vol vs. 3m moves
GS rating
Return to GS target
Return to Consensus
target1-week return
1-month return
CY2012 P/E
CY2013 P/E
5108.T Bridgestone 25.4 29% -2.7 0.5 Inline Inline Inline Inline Inline B 45.3% 31.1% 3.8 2.9 8.0x 7.3x
5405.T Sumitomo Metal Ind 32.8 21% -3.3 -0.9 LOW LOW LOW Inline Inline NR -- 28.7% 3.2 -1.5 18.5x 8.4x
5411.T JFE 35.8 24% -3.7 -3.5 LOW Inline Inline LOW LOW N 6.0% 26.8% 2.7 -0.7 16.3x 7.6x
6501.T Hitachi 31.4 53% -3.4 -3.3 HIGH LOW LOW Inline Inline B* 33.5% 30.4% 3.7 2.1 8.5x 8.6x
6502.T Toshiba 33.1 49% -2.7 1.8 Inline Inline Inline HIGH Inline N 22.1% 36.3% 2.1 -4.2 10.9x 8.1x
6503.T Mitsubishi Electric 30.7 14% -3.4 0.6 LOW HIGH HIGH HIGH HIGH B 25.8% 33.7% 3.8 1.9 11.1x 9.5x
6752.T Panasonic Corp 33.5 50% -4.7 -2.8 HIGH LOW LOW LOW Inline B* 21.0% 5.9% 9.8 16.3 - 15.3x
6758.T Sony 38.4 53% -4.0 -2.7 HIGH Inline HIGH LOW LOW S -14.0% 18.7% 13.0 3.9 - 15.3x
6902.T Denso 29.0 42% -1.4 -0.4 Inline Inline Inline Inline Inline N 14.9% 15.2% 3.7 3.9 13.7x 11.1x
6971.T Kyocera 26.7 20% -3.1 1.0 LOW HIGH Inline Inline Inline N 16.3% 18.6% 4.5 -2.4 14.2x 12.7x
7201.T Nissan Motor 31.7 55% -3.2 -2.8 HIGH Inline Inline Inline Inline B* 73.8% 40.4% 1.1 -3.6 7.8x 6.5x
7203.T Toyota Motor 26.8 35% -2.9 2.0 Inline HIGH HIGH Inline LOW N 32.9% 31.3% 3.0 0.2 13.2x 9.4x
7267.T Honda Motor 30.3 41% -2.7 -0.7 Inline HIGH HIGH LOW LOW B 41.5% 28.4% 6.0 3.2 10.6x 8.1x
7751.T Canon 26.9 57% -4.1 -1.0 HIGH LOW Inline HIGH HIGH B* 41.5% 35.4% 1.7 -2.0 13.1x 11.0x
7974.OS Nintendo 35.0 38% -3.9 2.9 Inline HIGH HIGH Inline Inline NC -- 15.2% 6.6 2.6 214.4x 24.7x
8035.T Tokyo Electron 34.3 49% 0.1 0.7 Inline HIGH HIGH Inline Inline N 15.6% 18.3% 2.2 -1.3 19.4x 15.3x
8306.T Mitsubishi UFJ Finl 27.3 22% -2.6 -2.3 Inline Inline Inline Inline LOW B 44.0% 30.4% 3.4 7.6 7.0x 7.4x
8316.T Sumitomo Mitsui Finl 26.2 14% -2.5 0.6 Inline Inline Inline Inline LOW B* 51.2% 27.1% 2.6 7.7 7.0x 7.2x
8411.T Mizuho Finl 27.0 4% -2.5 -2.8 LOW LOW Inline LOW Inline N 3.8% 5.8% 6.6 11.1 6.8x 7.6x
8604.T Nomura 37.7 20% -3.7 -5.4 LOW Inline Inline LOW LOW N 15.0% 26.3% 5.9 6.7 15.3x 10.0x
Implied Vol and fundamental standouts GS Volatility Radar
Ticker Company
Return to
GS TP
3m Impl
vol (%)
1-year
%ile
8035.T Tokyo Electron 15.6% 34.3 49%
7751.T Canon 41.5% 26.9 57%
6503.T Mitsubishi Electric 25.8% 30.7 14%
8604.T Nomura 15.0% 37.7 20%
5405.T Sumitomo Metal Ind -- 32.8 21%
8411.T Mizuho Finl 3.8% 27.0 4%
Indicative 3-mo
105% calls (%)
"HIGH" volatilityIndicative 3-mo 95%
puts (%)
"LOW" volatility
130
129
287
see appendix for methodology
636
3,250
3,805
Price
Consensus P/E
3,250
9,550
3,805
368
2,525
6,790
748
3,085
2,686
483
299
636
628
1,163
1,755
Volatility-based Magnitude-based
130
287
PerformanceGS vs. Consensus Research
2,513
Spot (Quoted)
129
1,321
4.4
2.3
3.7
5.9
4.9
3.8
4.4
3.6
3.7
5.8
4.9
3.7
Panasonic Corp
Denso
Mitsubishi UFJ
Finl
Sumitomo Mitsui
FinlMizuho Finl
Bridgestone
JFE
Toshiba
Mitsubishi
Electric
Sony
Nissan Motor
Honda Motor
Canon
Tokyo Electron
Nomura
-2.5 -2.0 -1.5 -1.0 -0.5 0.0 0.5 1.0 1.5 2.0 2.5
GS bearish + # SD below cons. GS bullish + # SD above cons.
+ve price momentum -ve price momentum
CALL SELLING
CALL BUYING
PUT SELLING
PROTECTION
Op
tio
ns in
exp
en
siv
e
Op
tio
ns e
xp
en
siv
e
June 25, 2012 Asia
Goldman Sachs Global Economics, Commodities and Strategy Research 17
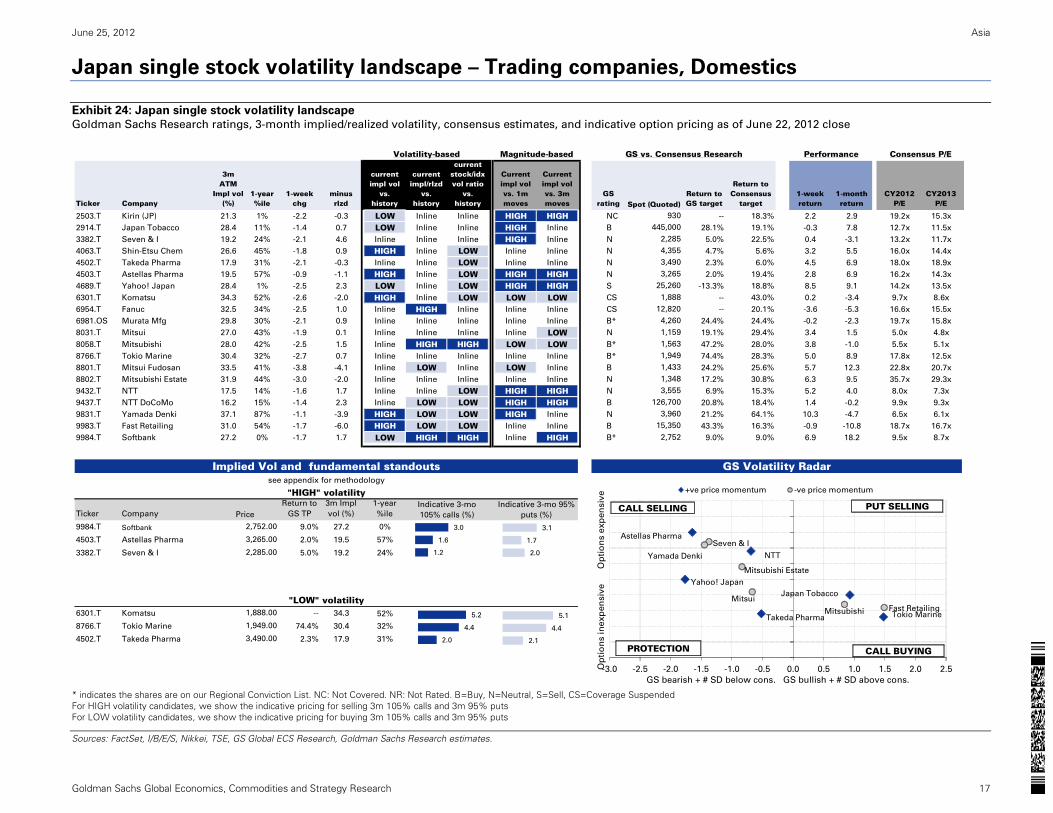
Japan single stock volatility landscape – Trading companies, Domestics
Exhibit 24: Japan single stock volatility landscape
Goldman Sachs Research ratings, 3-month implied/realized volatility, consensus estimates, and indicative option pricing as of June 22, 2012 close
* indicates the shares are on our Regional Conviction List. NC: Not Covered. NR: Not Rated. B=Buy, N=Neutral, S=Sell, CS=Coverage Suspended For HIGH volatility candidates, we show the indicative pricing for selling 3m 105% calls and 3m 95% puts For LOW volatility candidates, we show the indicative pricing for buying 3m 105% calls and 3m 95% puts
Sources: FactSet, I/B/E/S, Nikkei, TSE, GS Global ECS Research, Goldman Sachs Research estimates.
Ticker Company
3m ATM
Impl vol (%)
1-year %ile
1-week chg
minus rlzd
current impl vol
vs. history
current impl/rlzd
vs. history
current stock/idx vol ratio
vs. history
Current impl vol vs. 1m moves
Current impl vol vs. 3m moves
GS rating
Return to GS target
Return to Consensus
target1-week return
1-month return
CY2012 P/E
CY2013 P/E
2503.T Kirin (JP) 21.3 1% -2.2 -0.3 LOW Inline Inline HIGH HIGH NC -- 18.3% 2.2 2.9 19.2x 15.3x
2914.T Japan Tobacco 28.4 11% -1.4 0.7 LOW Inline Inline HIGH Inline B 28.1% 19.1% -0.3 7.8 12.7x 11.5x
3382.T Seven & I 19.2 24% -2.1 4.6 Inline Inline Inline HIGH Inline N 5.0% 22.5% 0.4 -3.1 13.2x 11.7x
4063.T Shin-Etsu Chem 26.6 45% -1.8 0.9 HIGH Inline LOW Inline Inline N 4.7% 5.6% 3.2 5.5 16.0x 14.4x
4502.T Takeda Pharma 17.9 31% -2.1 -0.3 Inline Inline LOW Inline Inline N 2.3% 6.0% 4.5 6.9 18.0x 18.9x
4503.T Astellas Pharma 19.5 57% -0.9 -1.1 HIGH Inline LOW HIGH HIGH N 2.0% 19.4% 2.8 6.9 16.2x 14.3x
4689.T Yahoo! Japan 28.4 1% -2.5 2.3 LOW Inline LOW HIGH HIGH S -13.3% 18.8% 8.5 9.1 14.2x 13.5x
6301.T Komatsu 34.3 52% -2.6 -2.0 HIGH Inline LOW LOW LOW CS -- 43.0% 0.2 -3.4 9.7x 8.6x
6954.T Fanuc 32.5 34% -2.5 1.0 Inline HIGH Inline Inline Inline CS -- 20.1% -3.6 -5.3 16.6x 15.5x
6981.OS Murata Mfg 29.8 30% -2.1 0.9 Inline Inline Inline Inline Inline B* 24.4% 24.4% -0.2 -2.3 19.7x 15.8x
8031.T Mitsui 27.0 43% -1.9 0.1 Inline Inline Inline Inline LOW N 19.1% 29.4% 3.4 1.5 5.0x 4.8x
8058.T Mitsubishi 28.0 42% -2.5 1.5 Inline HIGH HIGH LOW LOW B* 47.2% 28.0% 3.8 -1.0 5.5x 5.1x
8766.T Tokio Marine 30.4 32% -2.7 0.7 Inline Inline Inline Inline Inline B* 74.4% 28.3% 5.0 8.9 17.8x 12.5x
8801.T Mitsui Fudosan 33.5 41% -3.8 -4.1 Inline LOW Inline LOW Inline B 24.2% 25.6% 5.7 12.3 22.8x 20.7x
8802.T Mitsubishi Estate 31.9 44% -3.0 -2.0 Inline Inline Inline Inline Inline N 17.2% 30.8% 6.3 9.5 35.7x 29.3x
9432.T NTT 17.5 14% -1.6 1.7 Inline Inline LOW HIGH HIGH N 6.9% 15.3% 5.2 4.0 8.0x 7.3x
9437.T NTT DoCoMo 16.2 15% -1.4 2.3 Inline LOW LOW HIGH HIGH B 20.8% 18.4% 1.4 -0.2 9.9x 9.3x
9831.T Yamada Denki 37.1 87% -1.1 -3.9 HIGH LOW LOW HIGH Inline N 21.2% 64.1% 10.3 -4.7 6.5x 6.1x
9983.T Fast Retailing 31.0 54% -1.7 -6.0 HIGH LOW LOW Inline Inline B 43.3% 16.3% -0.9 -10.8 18.7x 16.7x
9984.T Softbank 27.2 0% -1.7 1.7 LOW HIGH HIGH Inline HIGH B* 9.0% 9.0% 6.9 18.2 9.5x 8.7x
Implied Vol and fundamental standouts GS Volatility Radar
Ticker Company
Return to
GS TP
3m Impl
vol (%)
1-year
%ile
9984.T Softbank 9.0% 27.2 0%
4503.T Astellas Pharma 2.0% 19.5 57%
3382.T Seven & I 5.0% 19.2 24%
6301.T Komatsu -- 34.3 52%
8766.T Tokio Marine 74.4% 30.4 32%
4502.T Takeda Pharma 2.3% 17.9 31%
Consensus P/E
Spot (Quoted)
3,265
Volatility-based Magnitude-based GS vs. Consensus Research Performance
930
445,000
2,285
4,355
3,490
3,960
25,260
1,888
12,820
4,260
1,159
1,563
1,949
1,433
1,348
3,555
126,700
15,350
2,752
see appendix for methodology
"HIGH" volatility
Price
Indicative 3-mo
105% calls (%)
Indicative 3-mo 95%
puts (%)
2,752.00
3,265.00
2,285.00
"LOW" volatility1,888.00
1,949.00
3,490.00
3.0
1.6
1.2
5.2
4.4
2.0
3.1
1.7
2.0
5.1
4.4
2.1
Japan Tobacco
Takeda Pharma
Astellas Pharma
Yahoo! Japan
Tokio Marine
Mitsubishi Estate
Seven & I
Mitsui
Mitsubishi
NTTYamada Denki
Fast Retailing
-3.0 -2.5 -2.0 -1.5 -1.0 -0.5 0.0 0.5 1.0 1.5 2.0 2.5
GS bearish + # SD below cons. GS bullish + # SD above cons.
+ve price momentum -ve price momentum
CALL SELLING
CALL BUYING
PUT SELLING
PROTECTION
Op
tio
ns in
exp
en
siv
e
Op
tio
ns e
xp
en
siv
e
June 25, 2012 Asia
Goldman Sachs Global Economics, Commodities and Strategy Research 18
MSCI disclosure
All MSCI data used in this report is the exclusive property of MSCI, Inc. (MSCI). Without prior written permission of MSCI, this
information and any other MSCI intellectual property may not be reproduced or redisseminated in any form and may not be used to
create any financial instruments or products or any indices. This information is provided on an “as is” basis, and the user of this
information assumes the entire risk of any use made of this information. Neither MSCI, any of its affiliates nor any third party
involved in, or related to, computing or compiling the data makes any express or implied warranties or representations with respect
to this information (or the results to be obtained by the use thereof), and MSCI, its affiliates and any such third party hereby
expressly disclaim all warranties of originality, accuracy, completeness, merchantability or fitness for a particular purpose with
respect to any of this information. Without limiting any of the foregoing, in no event shall MSCI, any of its affiliates or any third
party involved in, or related to, computing or compiling the data have any liability for any direct, indirect, special, punitive,
consequential or any other damages (including lost profits) even if notified of the possibility of such damages. MSCI and the MSCI
indexes are service marks of MSCI and its affiliates. The Global Industry Classification Standard (GICS) were developed by and is the
exclusive property of MSCI and Standard & Poor’s. GICS is a service mark of MSCI and S&P and has been licensed for use by The
Goldman Sachs Group, Inc.
June 25, 2012 Asia
Goldman Sachs Global Economics, Commodities and Strategy Research 19
Disclosure Appendix
Reg AC
We, Sunil Koul and Jason Lui, CFA, hereby certify that all of the views expressed in this report accurately reflect our personal views about the subject company or companies and its or their securities.
We also certify that no part of our compensation was, is or will be, directly or indirectly, related to the specific recommendations or views expressed in this report.
Disclosures
Option Specific Disclosures
Price target methodology: Please refer to the analyst’s previously published research for methodology and risks associated with equity price targets.
Pricing Disclosure: Option prices and volatility levels in this note are indicative only, and are based on our estimates of recent mid-market levels(unless otherwise noted). All prices and levels
exclude transaction costs unless otherwise stated.
General Options Risks – The risks below and any other options risks mentioned in this research report pertain both to specific derivative trade recommendations mentioned and to discussion of
general opportunities and advantages of derivative strategies. Unless otherwise noted, options strategies mentioned in this report may be a combination of the strategies below and therefore carry
with them the risks of those strategies.
Buying Options - Investors who buy call (put) options risk loss of the entire premium paid if the underlying security finishes below (above) the strike price at expiration. Investors who buy call or put
spreads also risk a maximum loss of the premium paid. The maximum gain on a long call or put spread is the difference between the strike prices, less the premium paid.
Selling Options - Investors who sell calls on securities they do not own risk unlimited loss of the security price less the strike price. Investors who sell covered calls (sell calls while owning the
underlying security) risk having to deliver the underlying security or pay the difference between the security price and the strike price, depending on whether the option is settled by physical delivery or
cash-settled. Investors who sell puts risk loss of the strike price less the premium received for selling the put. Investors who sell put or call spreads risk a maximum loss of the difference between the
strikes less the premium received, while their maximum gain is the premium received.
For options settled by physical delivery, the above risks assume the options buyer or seller, buys or sells the resulting securities at the settlement price on expiry.
Distribution of ratings/investment banking relationships
Goldman Sachs Investment Research global coverage universe
Rating Distribution Investment Banking Relationships
Buy Hold Sell Buy Hold Sell
Global 31% 54% 15% 48% 41% 36%
As of April 1, 2012, Goldman Sachs Global Investment Research had investment ratings on 3,507 equity securities. Goldman Sachs assigns stocks as Buys and Sells on various regional Investment
Lists; stocks not so assigned are deemed Neutral. Such assignments equate to Buy, Hold and Sell for the purposes of the above disclosure required by NASD/NYSE rules. See 'Ratings, Coverage
groups and views and related definitions' below.
Disclosures required by United States laws and regulations
See company-specific regulatory disclosures above for any of the following disclosures required as to companies referred to in this report: manager or co-manager in a pending transaction; 1% or
other ownership; compensation for certain services; types of client relationships; managed/co-managed public offerings in prior periods; directorships; for equity securities, market making and/or
specialist role. Goldman Sachs usually makes a market in fixed income securities of issuers discussed in this report and usually deals as a principal in these securities.
The following are additional required disclosures: Ownership and material conflicts of interest: Goldman Sachs policy prohibits its analysts, professionals reporting to analysts and members of their
households from owning securities of any company in the analyst's area of coverage. Analyst compensation: Analysts are paid in part based on the profitability of Goldman Sachs, which includes
investment banking revenues. Analyst as officer or director: Goldman Sachs policy prohibits its analysts, persons reporting to analysts or members of their households from serving as an officer,
June 25, 2012 Asia
Goldman Sachs Global Economics, Commodities and Strategy Research 20
director, advisory board member or employee of any company in the analyst's area of coverage. Non-U.S. Analysts: Non-U.S. analysts may not be associated persons of Goldman, Sachs & Co. and
therefore may not be subject to NASD Rule 2711/NYSE Rules 472 restrictions on communications with subject company, public appearances and trading securities held by the analysts.
Additional disclosures required under the laws and regulations of jurisdictions other than the United States
The following disclosures are those required by the jurisdiction indicated, except to the extent already made above pursuant to United States laws and regulations. Australia: Goldman Sachs Australia
Pty Ltd and its affiliates are not authorised deposit-taking institutions (as that term is defined in the Banking Act 1959 (Cth)) in Australia and do not provide banking services, nor carry on a banking
business, in Australia. This research, and any access to it, is intended only for "wholesale clients" within the meaning of the Australian Corporations Act, unless otherwise agreed by Goldman
Sachs. Brazil: Disclosure information in relation to CVM Instruction 483 is available at http://www.gs.com/worldwide/brazil/area/gir/index.html. Where applicable, the Brazil-registered analyst primarily
responsible for the content of this research report, as defined in Article 16 of CVM Instruction 483, is the first author named at the beginning of this report, unless indicated otherwise at the end of the
text. Canada: Goldman, Sachs & Co. has approved of, and agreed to take responsibility for, this research in Canada if and to the extent it relates to equity securities of Canadian issuers. Analysts may
conduct site visits but are prohibited from accepting payment or reimbursement by the company of travel expenses for such visits. Hong Kong: Further information on the securities of covered
companies referred to in this research may be obtained on request from Goldman Sachs (Asia) L.L.C. India: Further information on the subject company or companies referred to in this research may
be obtained from Goldman Sachs (India) Securities Private Limited; Japan: See below. Korea: Further information on the subject company or companies referred to in this research may be obtained
from Goldman Sachs (Asia) L.L.C., Seoul Branch. New Zealand: Goldman Sachs New Zealand Limited and its affiliates are neither "registered banks" nor "deposit takers" (as defined in the Reserve
Bank of New Zealand Act 1989) in New Zealand. This research, and any access to it, is intended for "wholesale clients" (as defined in the Financial Advisers Act 2008) unless otherwise agreed by
Goldman Sachs. Russia: Research reports distributed in the Russian Federation are not advertising as defined in the Russian legislation, but are information and analysis not having product
promotion as their main purpose and do not provide appraisal within the meaning of the Russian legislation on appraisal activity. Singapore: Further information on the covered companies referred
to in this research may be obtained from Goldman Sachs (Singapore) Pte. (Company Number: 198602165W). Taiwan: This material is for reference only and must not be reprinted without permission.
Investors should carefully consider their own investment risk. Investment results are the responsibility of the individual investor. United Kingdom: Persons who would be categorized as retail clients
in the United Kingdom, as such term is defined in the rules of the Financial Services Authority, should read this research in conjunction with prior Goldman Sachs research on the covered companies
referred to herein and should refer to the risk warnings that have been sent to them by Goldman Sachs International. A copy of these risks warnings, and a glossary of certain financial terms used in
this report, are available from Goldman Sachs International on request.
European Union: Disclosure information in relation to Article 4 (1) (d) and Article 6 (2) of the European Commission Directive 2003/126/EC is available at
http://www.gs.com/disclosures/europeanpolicy.html which states the European Policy for Managing Conflicts of Interest in Connection with Investment Research.
Japan: Goldman Sachs Japan Co., Ltd. is a Financial Instrument Dealer under the Financial Instrument and Exchange Law, registered with the Kanto Financial Bureau (Registration No. 69), and is a
member of Japan Securities Dealers Association (JSDA) and Financial Futures Association of Japan (FFAJ). Sales and purchase of equities are subject to commission pre-determined with clients plus
consumption tax. See company-specific disclosures as to any applicable disclosures required by Japanese stock exchanges, the Japanese Securities Dealers Association or the Japanese Securities
Finance Company.
Ratings, coverage groups and views and related definitions
Buy (B), Neutral (N), Sell (S) -Analysts recommend stocks as Buys or Sells for inclusion on various regional Investment Lists. Being assigned a Buy or Sell on an Investment List is determined by a
stock's return potential relative to its coverage group as described below. Any stock not assigned as a Buy or a Sell on an Investment List is deemed Neutral. Each regional Investment Review
Committee manages various regional Investment Lists to a global guideline of 25%-35% of stocks as Buy and 10%-15% of stocks as Sell; however, the distribution of Buys and Sells in any particular
coverage group may vary as determined by the regional Investment Review Committee. Regional Conviction Buy and Sell lists represent investment recommendations focused on either the size of the
potential return or the likelihood of the realization of the return.
Return potential represents the price differential between the current share price and the price target expected during the time horizon associated with the price target. Price targets are required for all
covered stocks. The return potential, price target and associated time horizon are stated in each report adding or reiterating an Investment List membership.
Coverage groups and views: A list of all stocks in each coverage group is available by primary analyst, stock and coverage group at http://www.gs.com/research/hedge.html. The analyst assigns one
of the following coverage views which represents the analyst's investment outlook on the coverage group relative to the group's historical fundamentals and/or valuation. Attractive (A). The
investment outlook over the following 12 months is favorable relative to the coverage group's historical fundamentals and/or valuation. Neutral (N). The investment outlook over the following 12
months is neutral relative to the coverage group's historical fundamentals and/or valuation. Cautious (C). The investment outlook over the following 12 months is unfavorable relative to the coverage
group's historical fundamentals and/or valuation.
Not Rated (NR). The investment rating and target price have been removed pursuant to Goldman Sachs policy when Goldman Sachs is acting in an advisory capacity in a merger or strategic
transaction involving this company and in certain other circumstances. Rating Suspended (RS). Goldman Sachs Research has suspended the investment rating and price target for this stock, because
there is not a sufficient fundamental basis for determining, or there are legal, regulatory or policy constraints around publishing, an investment rating or target. The previous investment rating and
price target, if any, are no longer in effect for this stock and should not be relied upon. Coverage Suspended (CS). Goldman Sachs has suspended coverage of this company. Not Covered (NC). Goldman Sachs does not cover this company. Not Available or Not Applicable (NA). The information is not available for display or is not applicable. Not Meaningful (NM). The
information is not meaningful and is therefore excluded.
Global product; distributing entities
The Global Investment Research Division of Goldman Sachs produces and distributes research products for clients of Goldman Sachs on a global basis. Analysts based in Goldman Sachs offices
around the world produce equity research on industries and companies, and research on macroeconomics, currencies, commodities and portfolio strategy. This research is disseminated in Australia
by Goldman Sachs Australia Pty Ltd (ABN 21 006 797 897); in Brazil by Goldman Sachs do Brasil Corretora de Títulos e Valores Mobiliários S.A.; in Canada by Goldman, Sachs & Co. regarding
Canadian equities and by Goldman, Sachs & Co. (all other research); in Hong Kong by Goldman Sachs (Asia) L.L.C.; in India by Goldman Sachs (India) Securities Private Ltd.; in Japan by Goldman
June 25, 2012 Asia
Goldman Sachs Global Economics, Commodities and Strategy Research 21
Sachs Japan Co., Ltd.; in the Republic of Korea by Goldman Sachs (Asia) L.L.C., Seoul Branch; in New Zealand by Goldman Sachs New Zealand Limited; in Russia by OOO Goldman Sachs; in
Singapore by Goldman Sachs (Singapore) Pte. (Company Number: 198602165W); and in the United States of America by Goldman, Sachs & Co. Goldman Sachs International has approved this
research in connection with its distribution in the United Kingdom and European Union.
European Union: Goldman Sachs International, authorized and regulated by the Financial Services Authority, has approved this research in connection with its distribution in the European Union and
United Kingdom; Goldman Sachs AG, regulated by the Bundesanstalt für Finanzdienstleistungsaufsicht, may also distribute research in Germany.
General disclosures
This research is for our clients only. Other than disclosures relating to Goldman Sachs, this research is based on current public information that we consider reliable, but we do not represent it is
accurate or complete, and it should not be relied on as such. We seek to update our research as appropriate, but various regulations may prevent us from doing so. Other than certain industry reports
published on a periodic basis, the large majority of reports are published at irregular intervals as appropriate in the analyst's judgment.
Goldman Sachs conducts a global full-service, integrated investment banking, investment management, and brokerage business. We have investment banking and other business relationships with a
substantial percentage of the companies covered by our Global Investment Research Division. Goldman, Sachs & Co., the United States broker dealer, is a member of SIPC (http://www.sipc.org).
Our salespeople, traders, and other professionals may provide oral or written market commentary or trading strategies to our clients and our proprietary trading desks that reflect opinions that are
contrary to the opinions expressed in this research. Our asset management area, our proprietary trading desks and investing businesses may make investment decisions that are inconsistent with the
recommendations or views expressed in this research.
The analysts named in this report may have from time to time discussed with our clients, including Goldman Sachs salespersons and traders, or may discuss in this report, trading strategies that
reference catalysts or events that may have a near-term impact on the market price of the equity securities discussed in this report, which impact may be directionally counter to the analysts' published
price target expectations for such stocks. Any such trading strategies are distinct from and do not affect the analysts' fundamental equity rating for such stocks, which rating reflects a stock's return
potential relative to its coverage group as described herein.
We and our affiliates, officers, directors, and employees, excluding equity and credit analysts, will from time to time have long or short positions in, act as principal in, and buy or sell, the securities or
derivatives, if any, referred to in this research.
This research is not an offer to sell or the solicitation of an offer to buy any security in any jurisdiction where such an offer or solicitation would be illegal. It does not constitute a personal
recommendation or take into account the particular investment objectives, financial situations, or needs of individual clients. Clients should consider whether any advice or recommendation in this
research is suitable for their particular circumstances and, if appropriate, seek professional advice, including tax advice. The price and value of investments referred to in this research and the income
from them may fluctuate. Past performance is not a guide to future performance, future returns are not guaranteed, and a loss of original capital may occur. Fluctuations in exchange rates could have
adverse effects on the value or price of, or income derived from, certain investments.
Certain transactions, including those involving futures, options, and other derivatives, give rise to substantial risk and are not suitable for all investors. Investors should review current options
disclosure documents which are available from Goldman Sachs sales representatives or at http://www.theocc.com/about/publications/character-risks.jsp. Transaction costs may be significant in option
strategies calling for multiple purchase and sales of options such as spreads. Supporting documentation will be supplied upon request.
In producing research reports, members of the Global Investment Research Division of Goldman Sachs Australia may attend site visits and other meetings hosted by the issuers the subject of its
research reports. In some instances the costs of such site visits or meetings may be met in part or in whole by the issuers concerned if Goldman Sachs Australia considers it is appropriate and
reasonable in the specific circumstances relating to the site visit or meeting.
All research reports are disseminated and available to all clients simultaneously through electronic publication to our internal client websites. Not all research content is redistributed to our clients or
available to third-party aggregators, nor is Goldman Sachs responsible for the redistribution of our research by third party aggregators. For all research available on a particular stock, please contact
your sales representative or go to http://360.gs.com.
Disclosure information is also available at http://www.gs.com/research/hedge.html or from Research Compliance, 200 West Street, New York, NY 10282.
© 2012 Goldman Sachs.
No part of this material may be (i) copied, photocopied or duplicated in any form by any means or (ii) redistributed without the prior written consent of The Goldman Sachs Group, Inc.


