HOW DO WE DEBUG IT?
Ariel Almog, Software Architect
May, 2020
NVIDIA

AGENDA
▪ Vision
▪ Debug flow
▪ Ethernet vs. RDMA
▪ rdmatool
▪ What Just Happened?
2 OpenFabrics Alliance Workshop 2020

VISION
▪ RDMA clusters are becoming bigger and more dense• Various applications are using the network
• Network admin are not aware/familiar with the users and their use case
▪ Target is to have • Run time monitor
• Real Time Alerting – Know when something bad had happened
• Provide alert debug information
• Self healing
• If problem needs support, provide a way to gather all needed debugging information
• Debug tools
• Ability to query device for current state
• Traces, counters
• Allow customer preform high level debug
▪ Distribution - all tools must be (in prioritized order) • Upstream – part of upstream, added to inbox
• Open source tools
▪ Security is an issue
3 OpenFabrics Alliance Workshop 2020

DEBUG FLOW DOCUMENTATION
▪ RoCE debug flow walk through
▪ https://community.mellanox.com/s/article/RoCE-Debug-
Flow-for-Linux
▪ Currently handles debug flow for broken application
▪ Future is to have additional flows for performance
tuning
• Based on drops, retries
▪ Using standard tools
• rdmatool (iproute2)
• ip link
• show gids
• ibv_rc_pingpong
• …
4 OpenFabrics Alliance Workshop 2020
Check ip connectivity (ping)
test #3
Check rdma connectivity
test #1
Verify ip, eth connectivity
Test #4
Basic RDMA Check Test #2
Done
Call Support
Done
Call Support
Call Support
Performance improvement
tests to be supported in the
future
Start

ETHERNET VS RDMA (1/2)
▪ Ethtool - Query or control network driver and hardware settings • Ethtool Statistics (-S) - Port statistics, ring statistics, performance, errors
• RoCE extension : Distinguish RoCE counters per virtual port
• Improvement: Adding ib only info to Ethernet tools
• Ethtool Pause - configure global pause
▪ ip link/ifconfig - network device configuration• Link up/down, mtu, mac setting, , shaping … - the same interface
• RoCE only : Gids, ib info - show_gids, ibv_devinfo
• RoCE only : RDMA related counters (nowqe, rnr,…) via sysfs
• RoCE only : congestion control configure and counters via sysfs
▪ Tcp dump - dump traffic on a network • RoCE only : Ibdump
▪ Iperf3 - perform network throughput tests • RoCE only : Ib_send_lat & ib_send_bw
▪ Netstat/ss - Print network connections, routing tables, interface statistics, masquerade connections, and multicast memberships• RoCE only : Rdma tool
5 OpenFabrics Alliance Workshop 2020
ETHERNET VS RDMA (2/2)
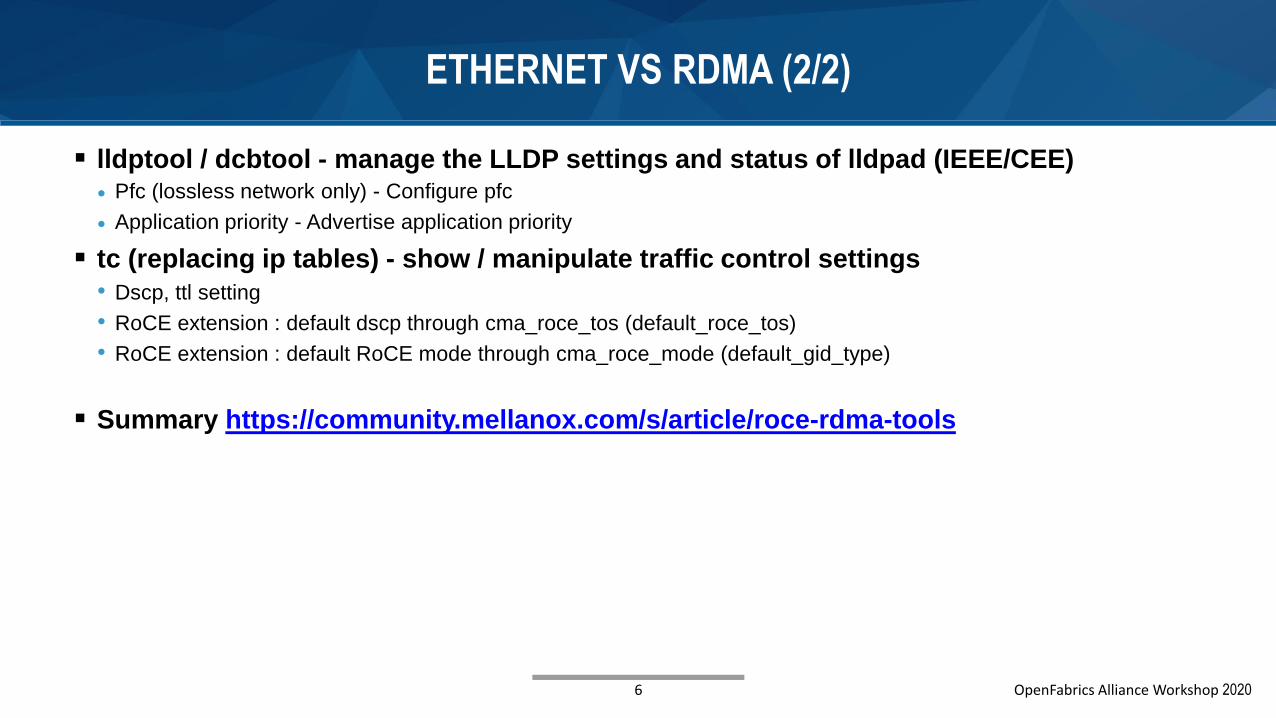
▪ lldptool / dcbtool - manage the LLDP settings and status of lldpad (IEEE/CEE)
• Pfc (lossless network only) - Configure pfc
• Application priority - Advertise application priority
▪ tc (replacing ip tables) - show / manipulate traffic control settings
• Dscp, ttl setting
• RoCE extension : default dscp through cma_roce_tos (default_roce_tos)
• RoCE extension : default RoCE mode through cma_roce_mode (default_gid_type)
▪ Summary https://community.mellanox.com/s/article/roce-rdma-tools
6 OpenFabrics Alliance Workshop 2020

RDMA TOOL
▪ A tool initiated by Mellanox 2 years ago to address RDMA managing
• Author is Leon Romanovsky [email protected]
▪ Upstream solution, part of iproute2 package
▪ man page https://www.man7.org/linux/man-pages/man8/rdma.8.html
▪ Divided to
• rdma-dev
• rdma-link
• rdma-resource
• rdma-system
• rdma-statistic
7 OpenFabrics Alliance Workshop 2020

RDMA TOOL – DEV
▪ Show the device state and caps[build]$ /opt/verutils/bin/rdma dev -dd
4: rocep0s8f0: node_type ca fw 20.27.6000 node_guid b859:9f03:00c5:8c82 sys_image_guid
b859:9f03:00c5:8c82 adaptive-moderation on
caps: <BAD_PKEY_CNTR, BAD_QKEY_CNTR, AUTO_PATH_MIG, CHANGE_PHY_PORT, PORT_ACTIVE_EVENT,
SYS_IMAGE_GUID, RC_RNR_NAK_GEN, MEM_WINDOW, XRC, MEM_MGT_EXTENSIONS,
BLOCK_MULTICAST_LOOPBACK, MEM_WINDOW_TYPE_2B, RAW_IP_CSUM, CROSS_CHANNEL,
MANAGED_FLOW_STEERING, SIGNATURE_HANDOVER, ON_DEMAND_PAGING, SG_GAPS_REG,
RAW_SCATTER_FCS, PCI_WRITE_END_PADDING>
5: rocep0s8f1: node_type ca fw 20.27.6000 node_guid b859:9f03:00c5:8c83 sys_image_guid
b859:9f03:00c5:8c82 adaptive-moderation on
caps: <BAD_PKEY_CNTR, BAD_QKEY_CNTR, AUTO_PATH_MIG, CHANGE_PHY_PORT, PORT_ACTIVE_EVENT,
SYS_IMAGE_GUID, RC_RNR_NAK_GEN, MEM_WINDOW, XRC, MEM_MGT_EXTENSIONS,
BLOCK_MULTICAST_LOOPBACK, MEM_WINDOW_TYPE_2B, RAW_IP_CSUM, CROSS_CHANNEL,
MANAGED_FLOW_STEERING, SIGNATURE_HANDOVER, ON_DEMAND_PAGING, SG_GAPS_REG,
RAW_SCATTER_FCS, PCI_WRITE_END_PADDING>
8 OpenFabrics Alliance Workshop 2020

RDMA TOOL – LINK
▪ Show link state[build]$ /opt/verutils/bin/rdma link
link rocep0s8f0/1 state ACTIVE physical_state LINK_UP netdev eth2 netdev_index 15
link rocep0s8f1/1 state DOWN physical_state DISABLED netdev eth3 netdev_index 16
9 OpenFabrics Alliance Workshop 2020

RDMA TOOL – RESOURCES
▪ Show the count of the basic RDMA resources[build]$ /opt/verutils/bin/rdma res //.
4: rocep0s8f0: pd 4 cq 4 qp 3 cm_id 0 mr 1 ctx 1
5: rocep0s8f1: pd 3 cq 3 qp 1 cm_id 0 mr 0 ctx 0
▪ Each request in the rdma tool can be dumped in JSON format using ‘-j’[build]$ /opt/verutils/bin/rdma res -j
[{"ifindex":4,"ifname":"rocep0s8f0","pd":4,"cq":4,"qp":3,"cm_id":0,"mr":1,"ctx":1},{"ifindex":5,"ifname":"rocep0s8f1","pd":3,"cq":3,"qp":1,"cm_id":0,"mr":0,"ctx":0}]
▪ Show specific objects and get the driver details with -dd[build]$ /opt/verutils/bin/rdma res show -dd qp
link rocep0s8f0/lqpn 1 type GSI state RTS sq-psn 0 comm ib_core
link rocep0s8f0/1 lqpn 320 rqpn 320 type RC state ERR rq-psn 0 sq-psn 0 path-mig-state MIGRATED pdn 34 pid 29251 comm python3
link rocep0s8f0/1 lqpn 321 type UD state RTS sq-psn 0 pdn 34 pid 29251 comm python3
link rocep0s8f1/lqpn 1 type GSI state RTS sq-psn 0 comm ib_core
▪ Also support CMID, CQ, MR and PD. (in the same convention “rdma res show pd”)
10 OpenFabrics Alliance Workshop 2020
RDMA TOOL – STATISTICS 1/2
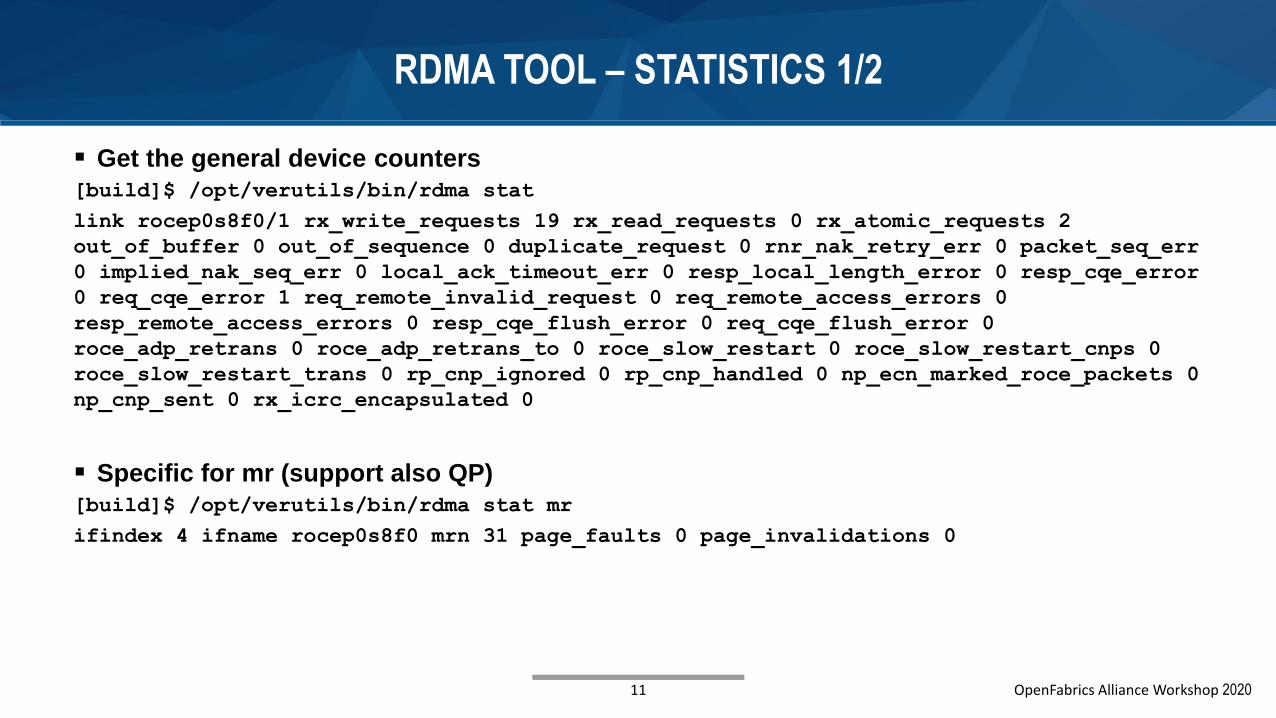
▪ Get the general device counters
[build]$ /opt/verutils/bin/rdma stat
link rocep0s8f0/1 rx_write_requests 19 rx_read_requests 0 rx_atomic_requests 2
out_of_buffer 0 out_of_sequence 0 duplicate_request 0 rnr_nak_retry_err 0 packet_seq_err
0 implied_nak_seq_err 0 local_ack_timeout_err 0 resp_local_length_error 0 resp_cqe_error
0 req_cqe_error 1 req_remote_invalid_request 0 req_remote_access_errors 0
resp_remote_access_errors 0 resp_cqe_flush_error 0 req_cqe_flush_error 0
roce_adp_retrans 0 roce_adp_retrans_to 0 roce_slow_restart 0 roce_slow_restart_cnps 0
roce_slow_restart_trans 0 rp_cnp_ignored 0 rp_cnp_handled 0 np_ecn_marked_roce_packets 0
np_cnp_sent 0 rx_icrc_encapsulated 0
▪ Specific for mr (support also QP)
[build]$ /opt/verutils/bin/rdma stat mr
ifindex 4 ifname rocep0s8f0 mrn 31 page_faults 0 page_invalidations 0
11 OpenFabrics Alliance Workshop 2020

RDMA TOOL – STATISTICS 2/2
▪ Each QP can be bounded to counter manually or auto depends on QP type.
• mode – indicate the QP counter bound method (manually or auto)
[build]$ /opt/verutils/bin/rdma stat qp mode
link rocep0s8f0/1 mode qp auto off
link rocep0s8f1/1 mode qp auto off
▪ Bind QP to counter manually (QP can be unbind.)
[build]$ sudo /opt/verutils/bin/rdma stat qp bind link rocep0s8f0/1 lqpn 322
▪ Show all bounded QP counters.
[build]$ /opt/verutils/bin/rdma stat qp
link rocep0s8f0/1 cntn 4 pid 29600 comm python3 rx_write_requests 0 rx_read_requests 0
rx_atomic_requests 0 out_of_buffer 0 out_of_sequence 0 duplicate_request 0
rnr_nak_retry_err 0 packet_seq_err 0 implied_nak_seq_err 0 local_ack_timeout_err 0
resp_local_length_error 0 resp_cqe_error 0 req_cqe_error 0 req_remote_invalid_request 0
req_remote_access_errors 0 resp_remote_access_errors 0 resp_cqe_flush_error 0
req_cqe_flush_error 0 roce_adp_retrans 0 roce_adp_retrans_to 0 roce_slow_restart 0
roce_slow_restart_cnps 0 roce_slow_restart_trans 0 rp_cnp_ignored 0 rp_cnp_handled 0
np_ecn_marked_roce_packets 0 np_cnp_sent 0 rx_icrc_encapsulated 0
LQPN: <322>
12 OpenFabrics Alliance Workshop 2020

WHAT JUST HAPPENED?
▪ Event Driven telemetry
▪ Supported on switches and HCA to provide full network visibility
▪ Components • WJH applications Collectors & analyzers
• Off the shelf – Kibana, Grafana, Neo, etc.
• Use WJH library
• WJH library Database
• Influx db, stream into perthaner DB
• Uses user space tool and direct sockets to the driver
• User space tools
• Standard user spaces tools : devlink, ip, ethtool, etc.
• Driver
• Connecting the hw/fw to user space
• Marinating configuration
• Threshold passing
• Counters
• HW/FW – capturing, monitoring and generating events toward the kernel module
13 OpenFabrics Alliance Workshop 2020
HW+FW
Driver / kernel
WJH applications
WJH library
User space tools

▪ Main RoCE landing page
• https://community.mellanox.com/s/article/recommended-network-configuration-examples-for-roce-deployment
▪ Acknowledgments
• Yaniv Serlin – [email protected]
• Ido Kalir - [email protected]
• Leon Romanovsky [email protected]
14 OpenFabrics Alliance Workshop 2020
THANK YOUAriel Almog, Software Architect
NVIDIA