HOW DO WE DEBUG IT? Ariel Almog, Software Architect May, 2020 NVIDIA

Welcome message from author
This document is posted to help you gain knowledge. Please leave a comment to let me know what you think about it! Share it to your friends and learn new things together.
Transcript

HOW DO WE DEBUG IT?
Ariel Almog, Software Architect
May, 2020
NVIDIA

AGENDA
▪ Vision
▪ Debug flow
▪ Ethernet vs. RDMA
▪ rdmatool
▪ What Just Happened?
2 OpenFabrics Alliance Workshop 2020

VISION
▪ RDMA clusters are becoming bigger and more dense• Various applications are using the network
• Network admin are not aware/familiar with the users and their use case
▪ Target is to have • Run time monitor
• Real Time Alerting – Know when something bad had happened
• Provide alert debug information
• Self healing
• If problem needs support, provide a way to gather all needed debugging information
• Debug tools
• Ability to query device for current state
• Traces, counters
• Allow customer preform high level debug
▪ Distribution - all tools must be (in prioritized order) • Upstream – part of upstream, added to inbox
• Open source tools
▪ Security is an issue
3 OpenFabrics Alliance Workshop 2020

DEBUG FLOW DOCUMENTATION
▪ RoCE debug flow walk through
▪ https://community.mellanox.com/s/article/RoCE-Debug-
Flow-for-Linux
▪ Currently handles debug flow for broken application
▪ Future is to have additional flows for performance
tuning
• Based on drops, retries
▪ Using standard tools
• rdmatool (iproute2)
• ip link
• show gids
• ibv_rc_pingpong
• …
4 OpenFabrics Alliance Workshop 2020
Check ip connectivity (ping)
test #3
Check rdma connectivity
test #1
Verify ip, eth connectivity
Test #4
Basic RDMA Check Test #2
Done
Call Support
Done
Call Support
Call Support
Performance improvement
tests to be supported in the
future
Start

ETHERNET VS RDMA (1/2)
▪ Ethtool - Query or control network driver and hardware settings • Ethtool Statistics (-S) - Port statistics, ring statistics, performance, errors
• RoCE extension : Distinguish RoCE counters per virtual port
• Improvement: Adding ib only info to Ethernet tools
• Ethtool Pause - configure global pause
▪ ip link/ifconfig - network device configuration• Link up/down, mtu, mac setting, , shaping … - the same interface
• RoCE only : Gids, ib info - show_gids, ibv_devinfo
• RoCE only : RDMA related counters (nowqe, rnr,…) via sysfs
• RoCE only : congestion control configure and counters via sysfs
▪ Tcp dump - dump traffic on a network • RoCE only : Ibdump
▪ Iperf3 - perform network throughput tests • RoCE only : Ib_send_lat & ib_send_bw
▪ Netstat/ss - Print network connections, routing tables, interface statistics, masquerade connections, and multicast memberships• RoCE only : Rdma tool
5 OpenFabrics Alliance Workshop 2020
ETHERNET VS RDMA (2/2)
▪ lldptool / dcbtool - manage the LLDP settings and status of lldpad (IEEE/CEE)
• Pfc (lossless network only) - Configure pfc
• Application priority - Advertise application priority
▪ tc (replacing ip tables) - show / manipulate traffic control settings
• Dscp, ttl setting
• RoCE extension : default dscp through cma_roce_tos (default_roce_tos)
• RoCE extension : default RoCE mode through cma_roce_mode (default_gid_type)
▪ Summary https://community.mellanox.com/s/article/roce-rdma-tools
6 OpenFabrics Alliance Workshop 2020

RDMA TOOL
▪ A tool initiated by Mellanox 2 years ago to address RDMA managing
• Author is Leon Romanovsky [email protected]
▪ Upstream solution, part of iproute2 package
▪ man page https://www.man7.org/linux/man-pages/man8/rdma.8.html
▪ Divided to
• rdma-dev
• rdma-link
• rdma-resource
• rdma-system
• rdma-statistic
7 OpenFabrics Alliance Workshop 2020

RDMA TOOL – DEV
▪ Show the device state and caps[build]$ /opt/verutils/bin/rdma dev -dd
4: rocep0s8f0: node_type ca fw 20.27.6000 node_guid b859:9f03:00c5:8c82 sys_image_guid
b859:9f03:00c5:8c82 adaptive-moderation on
caps: <BAD_PKEY_CNTR, BAD_QKEY_CNTR, AUTO_PATH_MIG, CHANGE_PHY_PORT, PORT_ACTIVE_EVENT,
SYS_IMAGE_GUID, RC_RNR_NAK_GEN, MEM_WINDOW, XRC, MEM_MGT_EXTENSIONS,
BLOCK_MULTICAST_LOOPBACK, MEM_WINDOW_TYPE_2B, RAW_IP_CSUM, CROSS_CHANNEL,
MANAGED_FLOW_STEERING, SIGNATURE_HANDOVER, ON_DEMAND_PAGING, SG_GAPS_REG,
RAW_SCATTER_FCS, PCI_WRITE_END_PADDING>
5: rocep0s8f1: node_type ca fw 20.27.6000 node_guid b859:9f03:00c5:8c83 sys_image_guid
b859:9f03:00c5:8c82 adaptive-moderation on
caps: <BAD_PKEY_CNTR, BAD_QKEY_CNTR, AUTO_PATH_MIG, CHANGE_PHY_PORT, PORT_ACTIVE_EVENT,
SYS_IMAGE_GUID, RC_RNR_NAK_GEN, MEM_WINDOW, XRC, MEM_MGT_EXTENSIONS,
BLOCK_MULTICAST_LOOPBACK, MEM_WINDOW_TYPE_2B, RAW_IP_CSUM, CROSS_CHANNEL,
MANAGED_FLOW_STEERING, SIGNATURE_HANDOVER, ON_DEMAND_PAGING, SG_GAPS_REG,
RAW_SCATTER_FCS, PCI_WRITE_END_PADDING>
8 OpenFabrics Alliance Workshop 2020

RDMA TOOL – LINK
▪ Show link state[build]$ /opt/verutils/bin/rdma link
link rocep0s8f0/1 state ACTIVE physical_state LINK_UP netdev eth2 netdev_index 15
link rocep0s8f1/1 state DOWN physical_state DISABLED netdev eth3 netdev_index 16
9 OpenFabrics Alliance Workshop 2020

RDMA TOOL – RESOURCES
▪ Show the count of the basic RDMA resources[build]$ /opt/verutils/bin/rdma res //.
4: rocep0s8f0: pd 4 cq 4 qp 3 cm_id 0 mr 1 ctx 1
5: rocep0s8f1: pd 3 cq 3 qp 1 cm_id 0 mr 0 ctx 0
▪ Each request in the rdma tool can be dumped in JSON format using ‘-j’[build]$ /opt/verutils/bin/rdma res -j
[{"ifindex":4,"ifname":"rocep0s8f0","pd":4,"cq":4,"qp":3,"cm_id":0,"mr":1,"ctx":1},{"ifindex":5,"ifname":"rocep0s8f1","pd":3,"cq":3,"qp":1,"cm_id":0,"mr":0,"ctx":0}]
▪ Show specific objects and get the driver details with -dd[build]$ /opt/verutils/bin/rdma res show -dd qp
link rocep0s8f0/lqpn 1 type GSI state RTS sq-psn 0 comm ib_core
link rocep0s8f0/1 lqpn 320 rqpn 320 type RC state ERR rq-psn 0 sq-psn 0 path-mig-state MIGRATED pdn 34 pid 29251 comm python3
link rocep0s8f0/1 lqpn 321 type UD state RTS sq-psn 0 pdn 34 pid 29251 comm python3
link rocep0s8f1/lqpn 1 type GSI state RTS sq-psn 0 comm ib_core
▪ Also support CMID, CQ, MR and PD. (in the same convention “rdma res show pd”)
10 OpenFabrics Alliance Workshop 2020
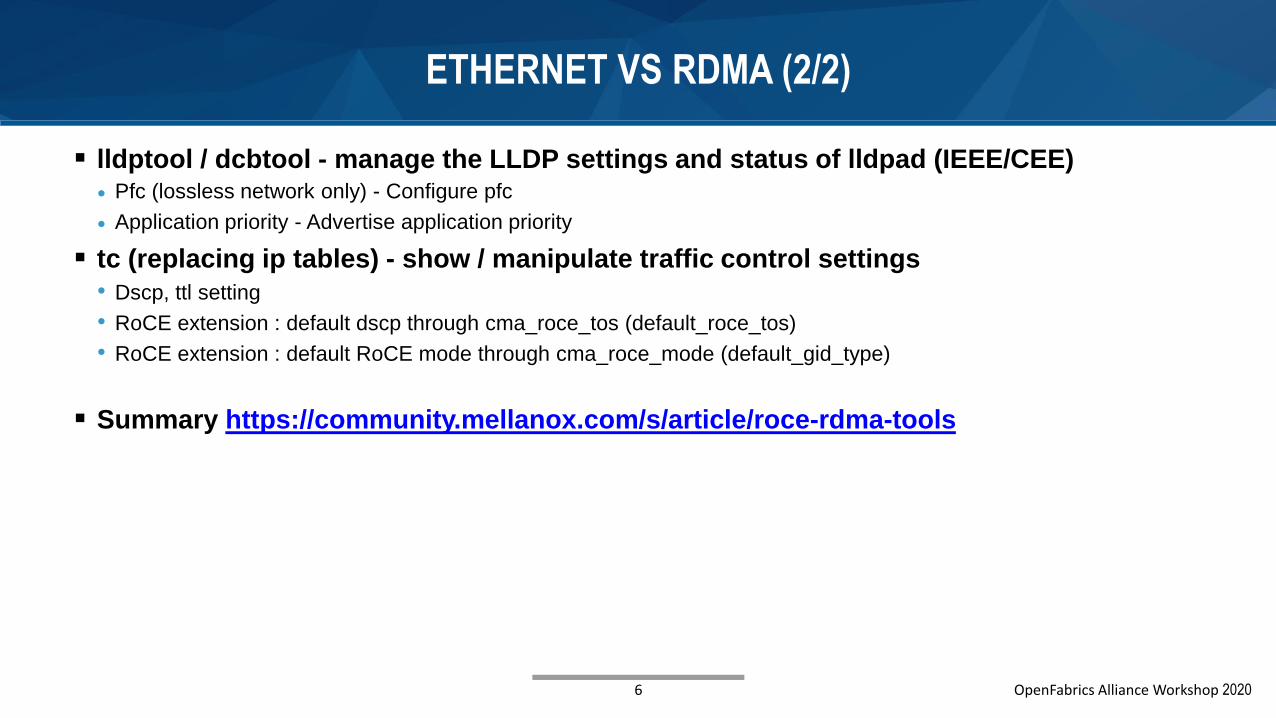
RDMA TOOL – STATISTICS 1/2
▪ Get the general device counters
[build]$ /opt/verutils/bin/rdma stat
link rocep0s8f0/1 rx_write_requests 19 rx_read_requests 0 rx_atomic_requests 2
out_of_buffer 0 out_of_sequence 0 duplicate_request 0 rnr_nak_retry_err 0 packet_seq_err
0 implied_nak_seq_err 0 local_ack_timeout_err 0 resp_local_length_error 0 resp_cqe_error
0 req_cqe_error 1 req_remote_invalid_request 0 req_remote_access_errors 0
resp_remote_access_errors 0 resp_cqe_flush_error 0 req_cqe_flush_error 0
roce_adp_retrans 0 roce_adp_retrans_to 0 roce_slow_restart 0 roce_slow_restart_cnps 0
roce_slow_restart_trans 0 rp_cnp_ignored 0 rp_cnp_handled 0 np_ecn_marked_roce_packets 0
np_cnp_sent 0 rx_icrc_encapsulated 0
▪ Specific for mr (support also QP)
[build]$ /opt/verutils/bin/rdma stat mr
ifindex 4 ifname rocep0s8f0 mrn 31 page_faults 0 page_invalidations 0
11 OpenFabrics Alliance Workshop 2020

RDMA TOOL – STATISTICS 2/2
▪ Each QP can be bounded to counter manually or auto depends on QP type.
• mode – indicate the QP counter bound method (manually or auto)
[build]$ /opt/verutils/bin/rdma stat qp mode
link rocep0s8f0/1 mode qp auto off
link rocep0s8f1/1 mode qp auto off
▪ Bind QP to counter manually (QP can be unbind.)
[build]$ sudo /opt/verutils/bin/rdma stat qp bind link rocep0s8f0/1 lqpn 322
▪ Show all bounded QP counters.
[build]$ /opt/verutils/bin/rdma stat qp
link rocep0s8f0/1 cntn 4 pid 29600 comm python3 rx_write_requests 0 rx_read_requests 0
rx_atomic_requests 0 out_of_buffer 0 out_of_sequence 0 duplicate_request 0
rnr_nak_retry_err 0 packet_seq_err 0 implied_nak_seq_err 0 local_ack_timeout_err 0
resp_local_length_error 0 resp_cqe_error 0 req_cqe_error 0 req_remote_invalid_request 0
req_remote_access_errors 0 resp_remote_access_errors 0 resp_cqe_flush_error 0
req_cqe_flush_error 0 roce_adp_retrans 0 roce_adp_retrans_to 0 roce_slow_restart 0
roce_slow_restart_cnps 0 roce_slow_restart_trans 0 rp_cnp_ignored 0 rp_cnp_handled 0
np_ecn_marked_roce_packets 0 np_cnp_sent 0 rx_icrc_encapsulated 0
LQPN: <322>
12 OpenFabrics Alliance Workshop 2020

WHAT JUST HAPPENED?
▪ Event Driven telemetry
▪ Supported on switches and HCA to provide full network visibility
▪ Components • WJH applications Collectors & analyzers
• Off the shelf – Kibana, Grafana, Neo, etc.
• Use WJH library
• WJH library Database
• Influx db, stream into perthaner DB
• Uses user space tool and direct sockets to the driver
• User space tools
• Standard user spaces tools : devlink, ip, ethtool, etc.
• Driver
• Connecting the hw/fw to user space
• Marinating configuration
• Threshold passing
• Counters
• HW/FW – capturing, monitoring and generating events toward the kernel module
13 OpenFabrics Alliance Workshop 2020
HW+FW
Driver / kernel
WJH applications
WJH library
User space tools

▪ Main RoCE landing page
• https://community.mellanox.com/s/article/recommended-network-configuration-examples-for-roce-deployment
▪ Acknowledgments
• Yaniv Serlin – [email protected]
• Ido Kalir - [email protected]
• Leon Romanovsky [email protected]
14 OpenFabrics Alliance Workshop 2020
THANK YOUAriel Almog, Software Architect
NVIDIA
Related Documents