GraphX:Unifying Data-Parallel and Graph-Parallel Analytics Presented by Joseph Gonzalez
Joint work with Reynold Xin, Daniel Crankshaw, Ankur Dave, Michael Franklin, and Ion Stoica
Strata 2014
*These slides are best viewed in PowerPoint with animation.
Graphs are Central to Analytics
Raw Wikipedia
< / >< / >< / >XML
Hyperlinks PageRank Top 20 PagesTitle PR
TextTableTitle Body
Topic Model(LDA) Word Topics
Word
Topic
Editor GraphCommunityDetection
User Community
UserCom
.
Term-DocGraph
DiscussionTableUser Disc.
CommunityTopic
TopicCom
.

Update ranks in parallel
Iterate until convergence
Rank of user i Weighted sum of
neighbors’ ranks
3
PageRank: Identifying Leaders
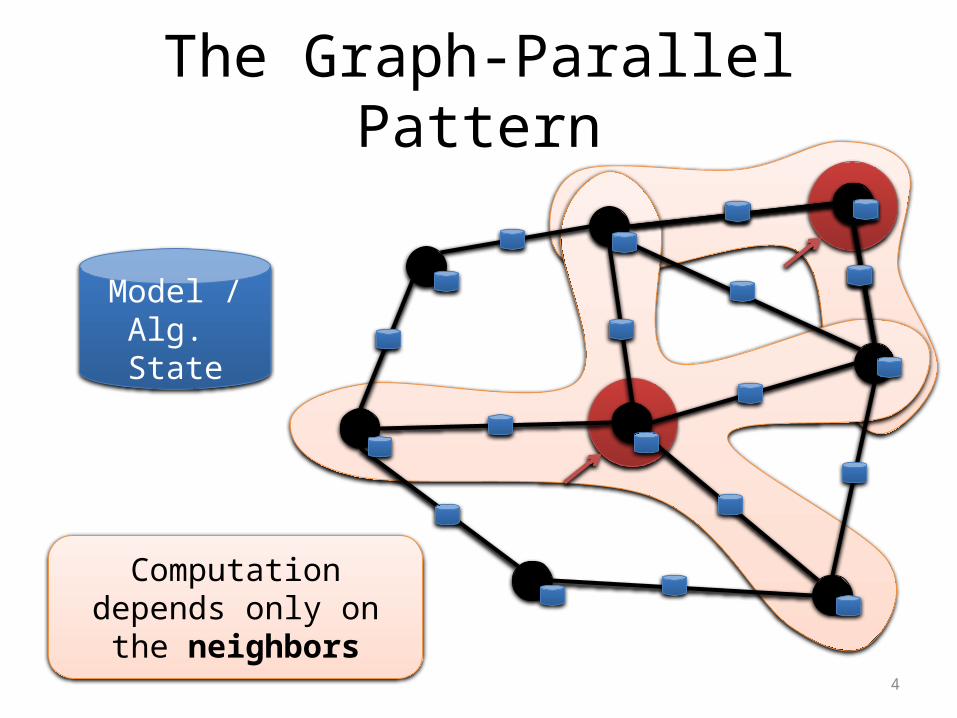
The Graph-Parallel Pattern
4
Model / Alg. State
Computation depends only on the
neighbors
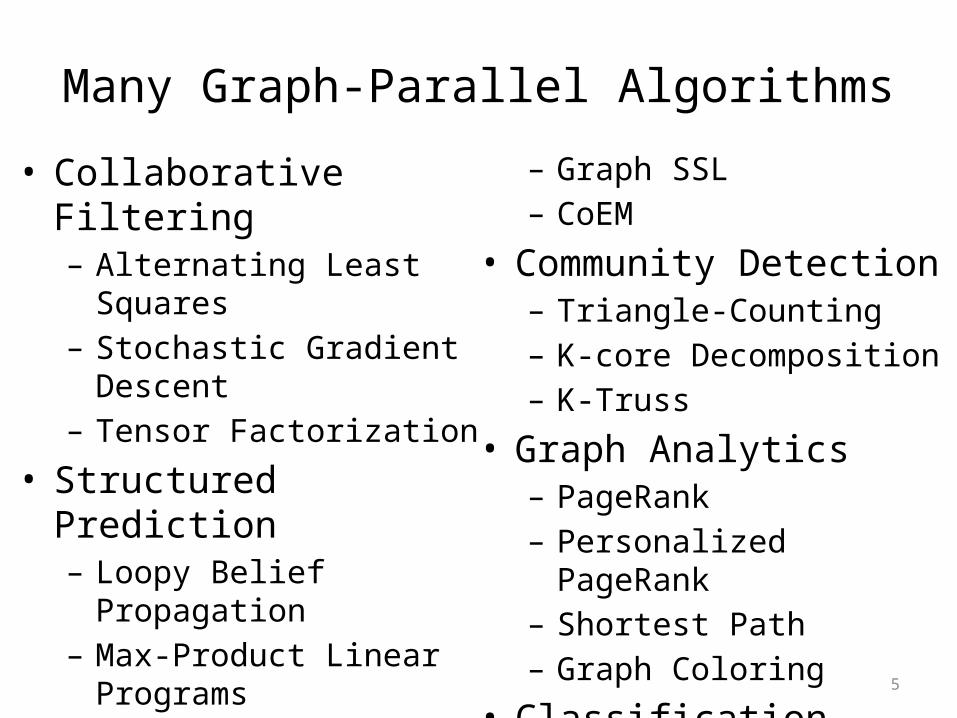
Many Graph-Parallel Algorithms
• Collaborative Filtering– Alternating Least
Squares– Stochastic Gradient
Descent– Tensor Factorization
• Structured Prediction– Loopy Belief
Propagation– Max-Product Linear
Programs– Gibbs Sampling
• Semi-supervised ML
– Graph SSL – CoEM
• Community Detection– Triangle-Counting– K-core Decomposition– K-Truss
• Graph Analytics– PageRank– Personalized PageRank– Shortest Path– Graph Coloring
• Classification– Neural Networks
5

Graph-Parallel Systems
6
Pregeloogle
Expose specialized APIs to simplify graph programming.
Exploit graph structure to achieve orders-of-magnitude performance
gains over more general data-parallel systems.

PageRank on the Live-Journal Graph
GraphLab
Naïve Spark
Mahout/Hadoop
0 200 400 600 800 1000 1200 1400 1600
22
354
1340
Runtime (in seconds, PageRank for 10 iter-ations)
GraphLab is 60x faster than HadoopGraphLab is 16x faster than Spark

Graphs are Central to Analytics
Raw Wikipedia
< / >< / >< / >XML
Hyperlinks PageRank Top 20 PagesTitle PR
TextTableTitle Body
Topic Model(LDA) Word Topics
Word
Topic
Editor GraphCommunityDetection
User Community
UserCom
.
Term-DocGraph
DiscussionTableUser Disc.
CommunityTopic
TopicCom
.

Separate Systems to Support Each View
Table View Graph View
Dependency Graph
Pregel
Table
Result
Row
Row
Row
Row

Having separate systems for each view is
difficult to use and inefficient
10
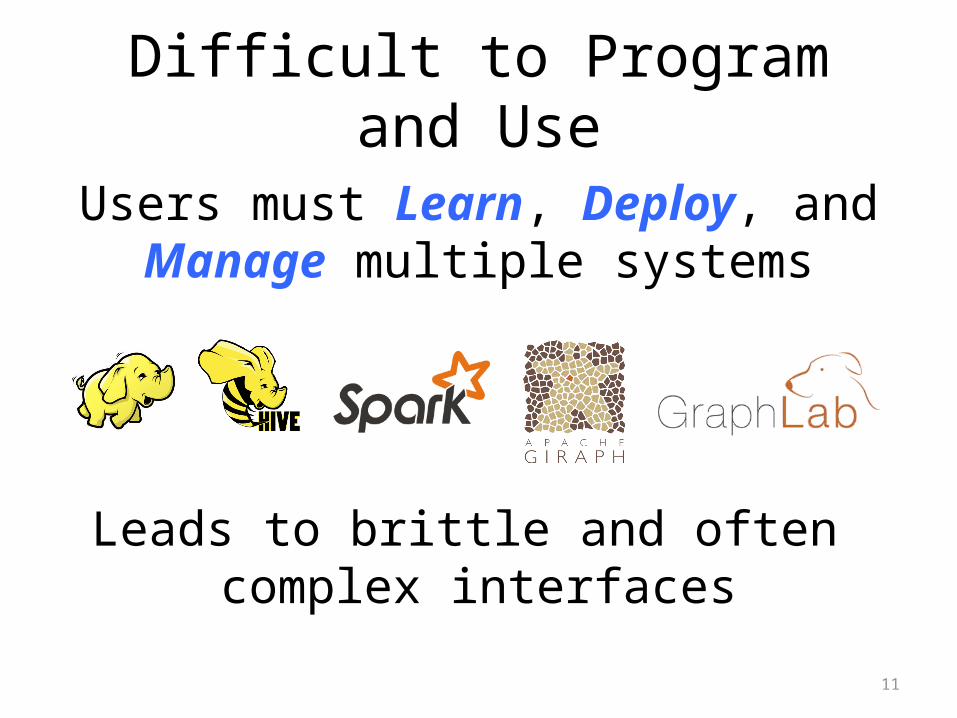
Difficult to Program and Use
Users must Learn, Deploy, and Manage multiple systems
Leads to brittle and often complex interfaces
11
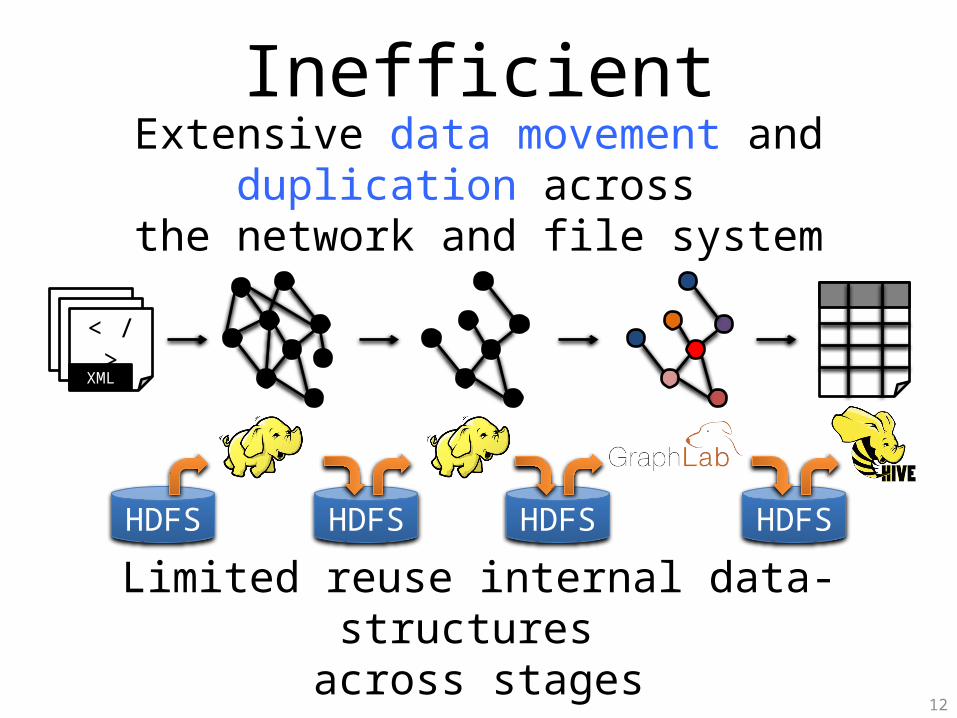
Inefficient
12
Extensive data movement and duplication across
the network and file system
< / >< / >< / >XML
HDFS HDFS HDFS HDFS
Limited reuse internal data-structures across stages
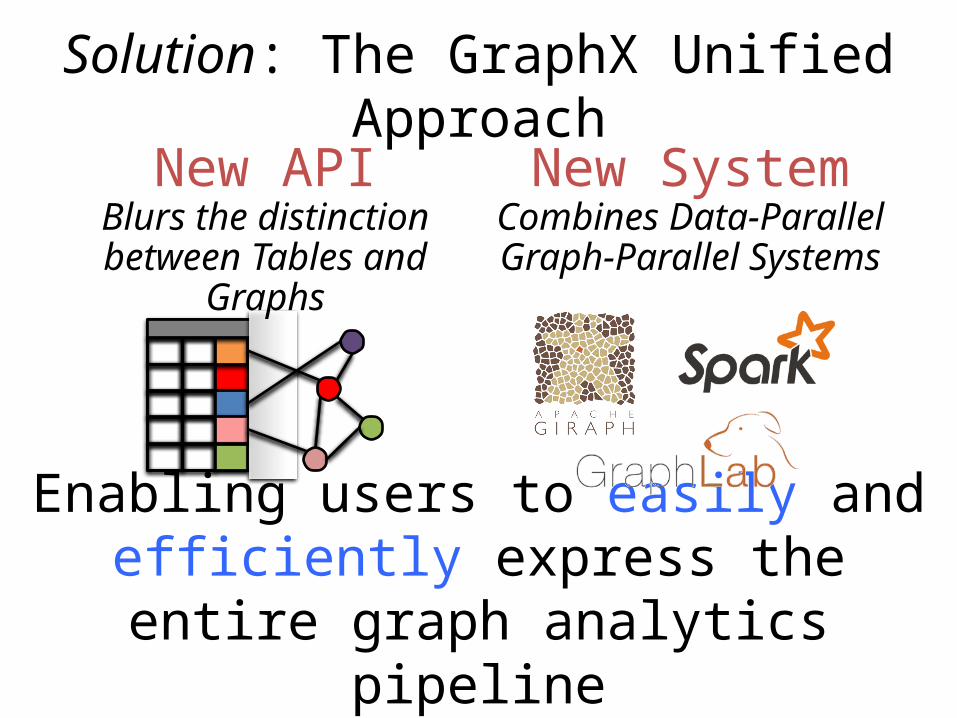
Solution: The GraphX Unified Approach
Enabling users to easily and efficiently express the entire graph
analytics pipeline
New APIBlurs the distinction between Tables and
Graphs
New SystemCombines Data-Parallel Graph-
Parallel Systems

Tables and Graphs are composable
views of the same physical data
GraphX Unified
Representation
Graph ViewTable View
Each view has its own operators that
exploit the semantics of the view to achieve efficient execution

View a Graph as a Table
Id
Rxin
Jegonzal
Franklin
Istoica
SrcId DstId
rxin jegonzal
franklin
rxin
istoica franklin
franklin
jegonzal
Property (E)
Friend
Advisor
Coworker
PI
Property (V)
(Stu., Berk.)
(PstDoc, Berk.)
(Prof., Berk)
(Prof., Berk)
R
J
F
I
Property GraphVertex Property Table
Edge Property Table

Table OperatorsTable (RDD) operators are inherited from Spark:
16
map
filter
groupBy
sort
union
join
leftOuterJoin
rightOuterJoin
reduce
count
fold
reduceByKey
groupByKey
cogroup
cross
zip
sample
take
first
partitionBy
mapWith
pipe
save
...

class Graph [ V, E ] { def Graph(vertices: Table[ (Id, V) ], edges: Table[ (Id, Id, E) ])
// Table Views -----------------def vertices: Table[ (Id, V) ]def edges: Table[ (Id, Id, E) ]def triplets: Table [ ((Id, V), (Id, V), E) ]// Transformations ------------------------------def reverse: Graph[V, E]def subgraph(pV: (Id, V) => Boolean,
pE: Edge[V,E] => Boolean): Graph[V,E]def mapV(m: (Id, V) => T ): Graph[T,E] def mapE(m: Edge[V,E] => T ): Graph[V,T]// Joins ----------------------------------------def joinV(tbl: Table [(Id, T)]): Graph[(V, T), E ]def joinE(tbl: Table [(Id, Id, T)]): Graph[V, (E, T)]// Computation ----------------------------------def mrTriplets(mapF: (Edge[V,E]) => List[(Id, T)],
reduceF: (T, T) => T): Graph[T, E]}
Graph Operators
17

Triplets Join Vertices and Edges
The triplets operator joins vertices and edges:
The mrTriplets operator sums adjacent triplets.SELECT t.dstId, reduceUDF( mapUDF(t) ) AS sum
FROM triplets AS t GROUPBY t.dstId
TripletsVertices Edges
B
A
C
D
A B
A C
B C
C D
A BA
B A C
B C
C D

F
E
Map Reduce Triplets
Map-Reduce for each vertex
D
B
A
C
mapF( )A B
mapF( )A C
A1
A2
reduceF( , )A1 A2 A
19
F
E
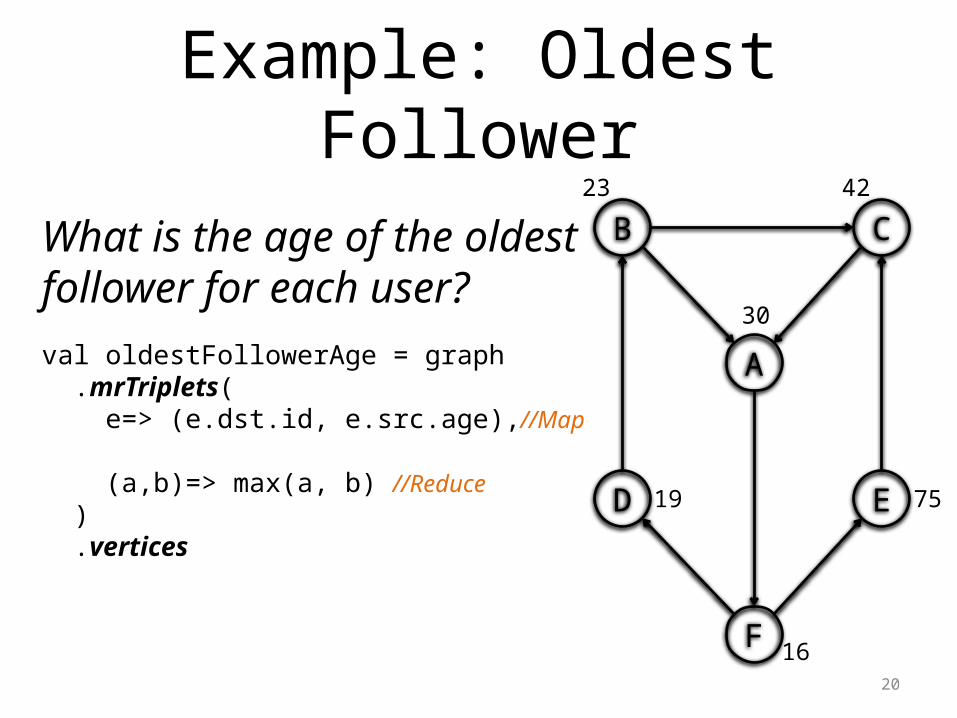
Example: Oldest Follower
D
B
A
CWhat is the age of the oldest follower for each user?val oldestFollowerAge = graph .mrTriplets( e=> (e.dst.id, e.src.age),//Map (a,b)=> max(a, b) //Reduce ) .vertices
23 42
30
19 75
1620

21
By composing these operators we canconstruct entire graph-analytics
pipelines.
GraphX System Design
Part. 2
Part. 1
Vertex Table (RDD)
B C
A D
F E
A D
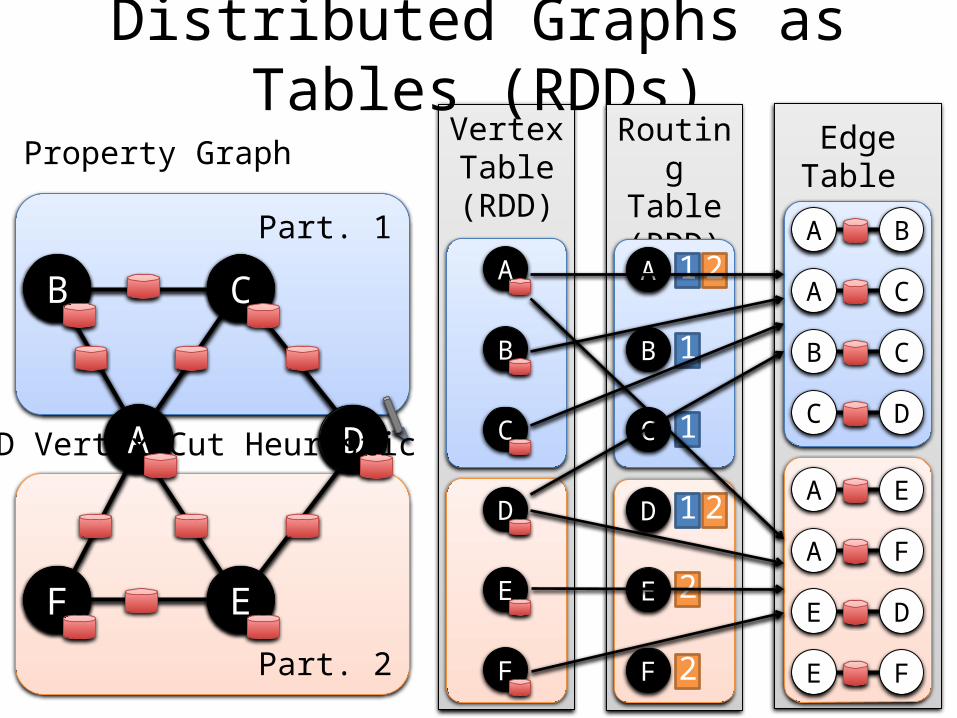
Distributed Graphs as Tables (RDDs)
D
Property Graph
B C
D
E
AA
F
Edge Table (RDD)A B
A C
C D
B C
A E
A F
E F
E D
B
C
D
E
A
F
Routing
Table (RDD)
B
C
D
E
A
F
1
2
1 2
1 2
1
2
2D Vertex Cut Heuristic

Vertex Table (RDD)
Caching for Iterative mrTripletsEdge Table
(RDD)
A B
A C
C D
B C
A E
A F
E F
E D
MirrorCache
B
C
D
A
MirrorCache
D
E
F
A
B
C
D
E
A
F
B
C
D
E
A
F
A
D

Vertex Table (RDD)
Edge Table (RDD)
A B
A C
C D
B C
A E
A F
E F
E D
MirrorCache
B
C
D
A
MirrorCache
D
E
F
A
Incremental Updates for Iterative mrTriplets
B
C
D
E
A
F
Change AA
Change E
Sca
n

Vertex Table (RDD)
Edge Table (RDD)
A B
A C
C D
B C
A E
A F
E F
E D
MirrorCache
B
C
D
A
MirrorCache
D
E
F
A
Aggregation for Iterative mrTriplets
B
C
D
E
A
F
Change
Change
Sca
n
Change
Change
Change
Change
LocalAggregate
LocalAggregate
B
C
D
F

Reduction in Communication Due to
Cached Updates
0 2 4 6 8 10 12 14 160.1
1
10
100
1000
10000
Connected Components on Twitter Graph
Iteration
Netw
ork
Com
m.
(MB
)
Most vertices are within 8 hopsof all vertices in their comp.

Benefit of Indexing Active Edges
0 2 4 6 8 10 12 14 160
5
10
15
20
25
30
Connected Components on Twitter Graph
Scan
Indexed
Iteration
Ru
nti
me (
Secon
ds)
Scan All Edges
Index of “Active” Edges
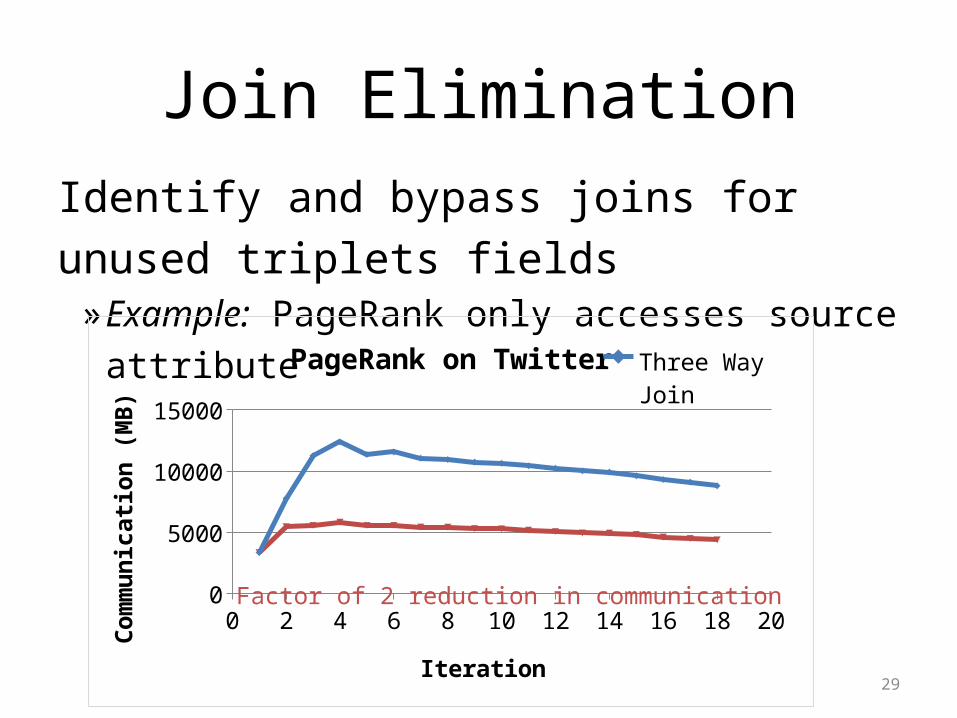
Join EliminationIdentify and bypass joins for unused triplets fields
»Example: PageRank only accesses source attribute
29
0 2 4 6 8 10 12 14 16 18 200
5000
10000
15000
PageRank on TwitterThree Way Join
Join Elimination
IterationCom
mu
nic
ati
on
(M
B)
Factor of 2 reduction in communication

Additional Query Optimizations
Indexing and Bitmaps:»To accelerate joins across graphs»To efficiently construct sub-graphs
Substantial Index and Data Reuse:»Reuse routing tables across graphs and
sub-graphs»Reuse edge adjacency information and
indices30
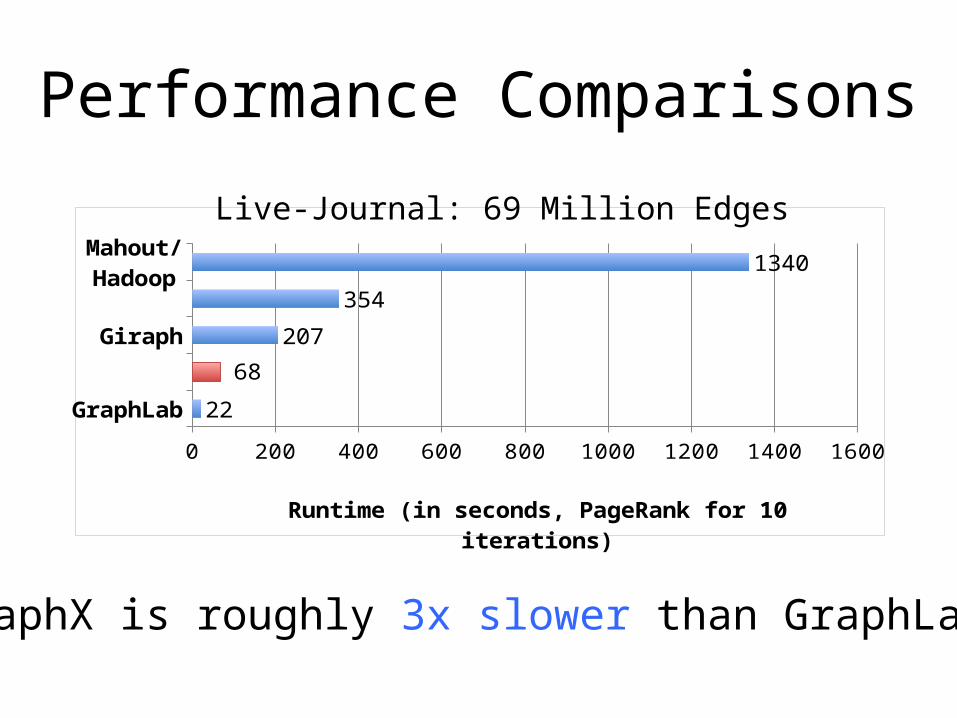
Performance Comparisons
GraphLab
Giraph
Mahout/Hadoop
0 200 400 600 800 1000 1200 1400 1600
22
68
207
354
1340
Runtime (in seconds, PageRank for 10 iter-ations)
GraphX is roughly 3x slower than GraphLab
Live-Journal: 69 Million Edges

GraphX scales to larger graphs
GraphLab
GraphX
Giraph
0 200 400 600 800
203
451
749
Runtime (in seconds, PageRank for 10 iter-ations)
GraphX is roughly 2x slower than GraphLab»Scala + Java overhead: Lambdas, GC time, …»No shared memory parallelism: 2x increase in comm.
Twitter Graph: 1.5 Billion Edges

PageRank is just one stage….
What about a pipeline?

HDFSHDFS
ComputeSpark PreprocessSpark Post.
A Small Pipeline in GraphX
Timed end-to-end GraphX is faster than GraphLab
Raw Wikipedia
< / >< / >< / >XML
Hyperlinks PageRank Top 20 Pages
GraphLab + Spark
Giraph + Spark
0 200 400 600 800 1000 1200 1400 1600
342
1492
Total Runtime (in Seconds)
605
375

The GraphX Stack(Lines of Code)
GraphX (3575)
Spark
Pregel (28) + GraphLab (50)
PageRank (5)
Connected Comp. (10)
Shortest Path (10)
ALS(40) LDA
(120)
K-core(51)
Triangle
Count(45)
SVD(40)

StatusAlpha release as part of Spark 0.9
Seeking collaborators and feedback

Conclusion and Observations
Domain specific views: Tables and Graphs
»tables and graphs are first-class composable objects
»specialized operators which exploit view semantics
Single system that efficiently spans the pipeline
»minimize data movement and duplication»eliminates need to learn and manage
multiple systems
Graphs through the lens of database systems
»Graph-Parallel Pattern Triplet joins in relational alg.
»Graph Systems Distributed join optimizations
37
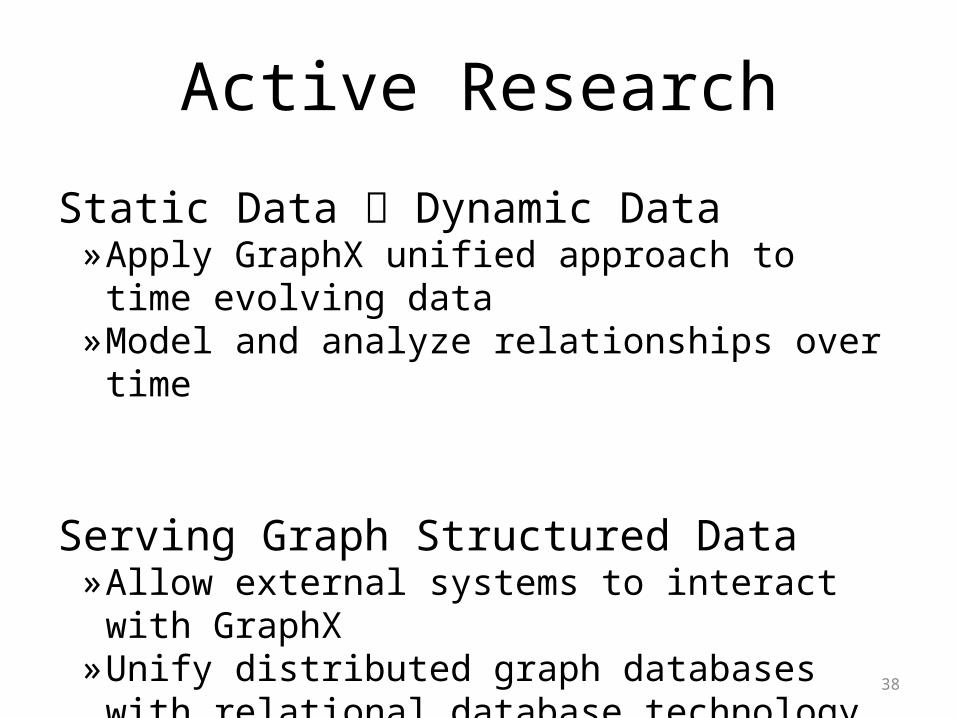
Active Research
Static Data Dynamic Data»Apply GraphX unified approach to time
evolving data»Model and analyze relationships over time
Serving Graph Structured Data»Allow external systems to interact with
GraphX»Unify distributed graph databases with
relational database technology38

Graph Property 1Real-World Graphs
39
Top 1% of vertices are adjacent to50% of the
edges!
Nu
mb
er
of
Vert
ices
AltaVista WebGraph1.4B Vertices, 6.6B Edges
Degree
More than 108 vertices have one neighbor.
-Slope = α ≈
2 2008 2009 2010 2011 20120
20406080
100120140160180200
Year
Rati
o o
f Ed
ges
to V
ert
ices
Power-Law Degree DistributionEdges >> Vertices

Graph Property 2Active Vertices
0 10 20 30 40 50 60 701
10
100
1000
10000
100000
1000000
10000000
100000000
Number of Updates
Nu
m-V
ert
ices
51% updated only once!PageRank on Web Graph

Graphs are Essential to Data Mining and Machine Learning
Identify influential people and information
Find communities
Understand people’s shared interests
Model complex data dependencies

Ratings Items
Recommending ProductsUsers

Low-Rank Matrix Factorization:
43
r13
r14
r24
r25
f(1)
f(2)
f(3)
f(4)
f(5)
Use
r Fa
ctors
(U
)
Movie
Facto
rs (M)
Use
rs
MoviesNetflix
Use
rs≈x
Movies
f(i)
f(j)
Iterate:
Recommending Products
LiberalConservati
ve
Post
Post
Post
Post
Post
Post
Post
Post
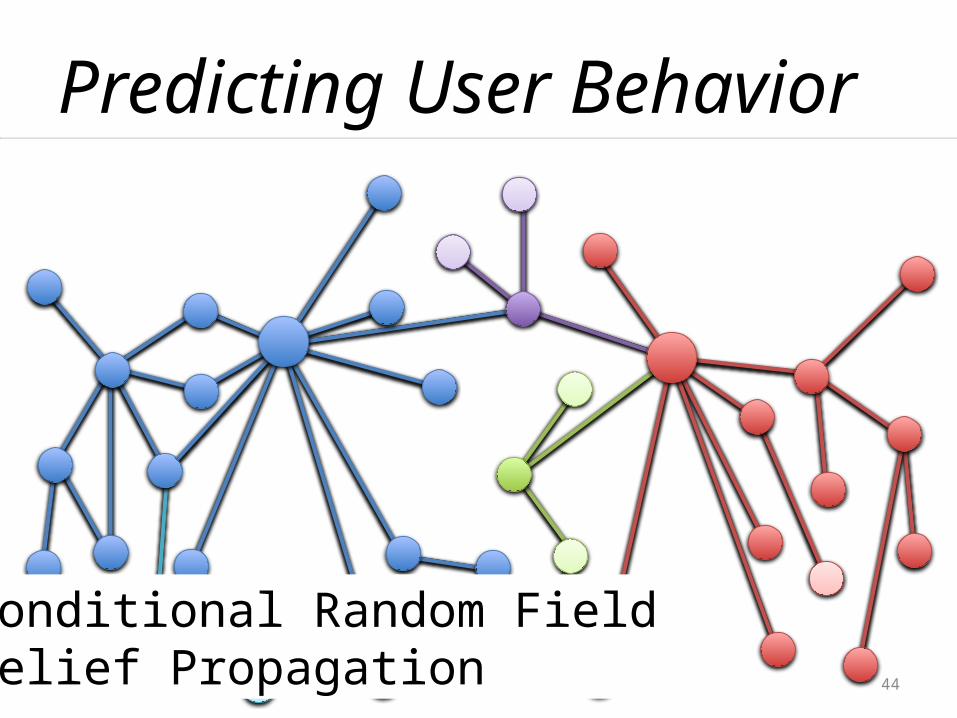
Predicting User Behavior
Post
Post
Post
Post
Post
Post
Post
Post
Post
Post
Post
Post
Post
Post
??
?
?
??
?
? ??
?
?
??
??
?
?
?
?
?
?
?
?
?
?
?
? ?
?
44
Conditional Random FieldBelief Propagation
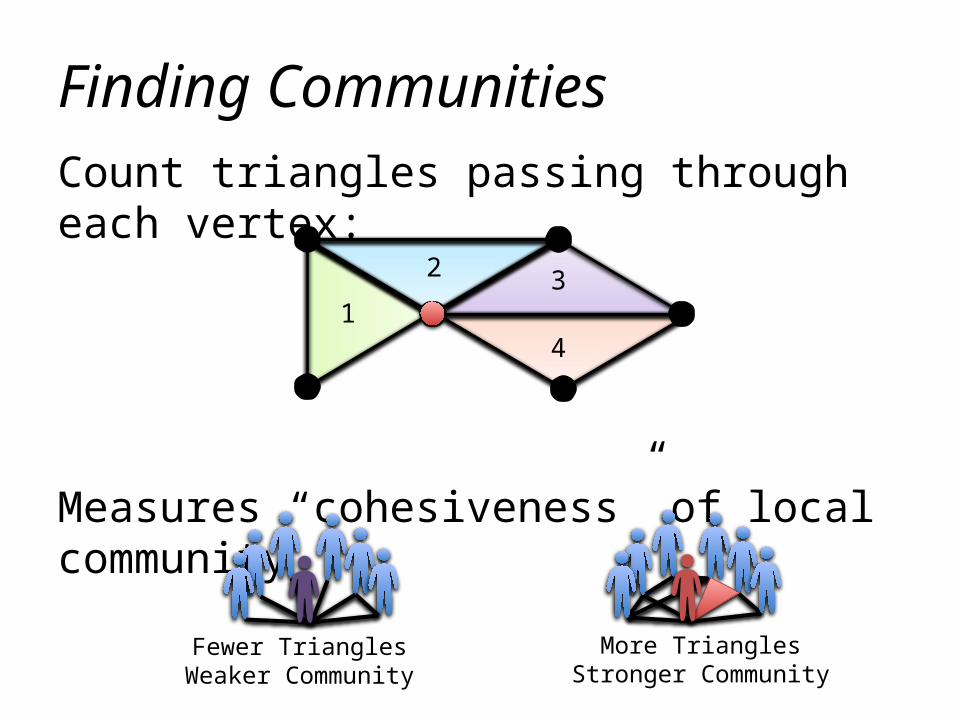
Count triangles passing through each vertex:
Measures “cohesiveness” of local community
More TrianglesStronger Community
Fewer TrianglesWeaker Community
1
2 3
4
Finding Communities
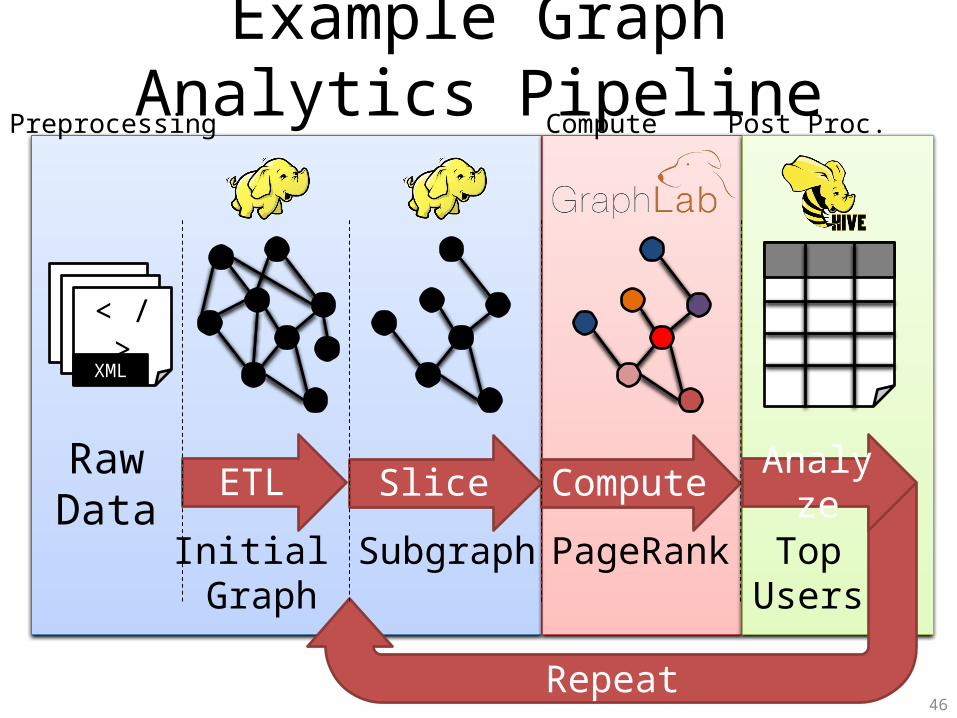
Preprocessing Compute Post Proc.
Example Graph Analytics Pipeline
46
< / >< / >< / >XML
RawData
ETL SliceComput
e
Repeat
Subgraph PageRankInitial Graph
Analyze
TopUsers

Thanks!
[email protected]@eecs.berkeley.edu
[email protected]@eecs.berkeley.edu
http://amplab.github.io/graphx/