GRAND TRAVERSE COUNTY, MICHIGAN (ALL JURISDICTIONS)
Community Community Name Number
ACME, TOWNSHIP OF 260749 BLAIR, TOWNSHIP OF 260780 EAST BAY, CHARTER 260746 TOWNSHIP OF *FIFE LAKE, TOWNSHIP OF 260405 *FIFE LAKE, VILLAGE OF 260406 GARFIELD, CHARTER 260753 TOWNSHIP OF *GRANT, TOWNSHIP OF 261802 GREEN LAKE, TOWNSHIP OF 261877
Community Community
Name Number KINGSLEY, VILLAGE OF 261878 LONG LAKE, TOWNSHIP OF 260782 *MAYFIELD, TOWNSHIP OF 261879 PARADISE, TOWNSHIP OF 260830 PENINSULA, TOWNSHIP OF 260747 TRAVERSE CITY, CITY OF 260082 UNION, TOWNSHIP OF 260805 WHITEWATER, TOWNSHIP OF 260794
*NO SPECIAL FLOOD HAZARD AREAS IDENTIFIED
Preliminary:
FLOOD INSURANCE STUDY NUMBER 26031CV000A
FLOOD INSURANCE STUDY NUMBER 26055CV000A
GRAND TRAVERSE COUNTY

NOTICE TO
FLOOD INSURANCE STUDY USERS
Communities participating in the National Flood Insurance Program have
established repositories of flood hazard data for floodplain management and flood
insurance purposes. This Flood Insurance Study (FIS) report may not contain all
data available within the Community Map Repository. Please contact the
Community Map Repository for any additional data.
The Federal Emergency Management Agency (FEMA) may revise and republish
part or all of this FIS report at any time. In addition, FEMA may revise part of
this FIS report by the Letter of Map Revision process, which does not involve
republication or redistribution of the FIS report. Therefore, users should consult
with community officials and check the Community Map Repository to obtain the
most current FIS report components.
Selected Flood Insurance Rate Map panels for this community contain
information that was previously shown separately on the corresponding Flood
Boundary and Floodway Map panels (e.g., floodways, cross sections). In
addition, former flood hazard zone designations have been changed as follows:
Old Zone(s) New Zone
Al through A30 AE
B X
C X
Initial Countywide FIS Effective Date: To Be Determined

i
TABLE OF CONTENTS
1.0 INTRODUCTION ................................................................................................................ 1
1.1 Purpose of Study ............................................................................................................. 1
1.2 Authority and Acknowledgments ................................................................................... 2
1.3 Coordination ................................................................................................................... 3
2.0 AREA STUDIED .................................................................................................................. 3
2.1 Scope of Study ................................................................................................................ 3
2.2 Community Description .................................................................................................. 5
2.3 Principal Flood Problems ................................................................................................ 6
2.4 Flood Protection Measures ............................................................................................. 7
3.0 ENGINEERING METHODS .............................................................................................. 7
3.1 Hydrologic Analyses ....................................................................................................... 7
3.2 Hydraulic Analyses ....................................................................................................... 11
3.3 Vertical Datum .............................................................................................................. 13
4.0 FLOODPLAIN MANAGEMENT APPLICATIONS ..................................................... 15
4.1 Floodplain Boundaries .................................................................................................. 15
4.2 Floodways ..................................................................................................................... 16
5.0 INSURANCE APPLICATIONS ....................................................................................... 21
6.0 FLOOD INSURANCE RATE MAP ................................................................................. 22
7.0 OTHER STUDIES .............................................................................................................. 22
8.0 LOCATION OF DATA ...................................................................................................... 25
9.0 BIBLIOGRAPHY AND REFERENCES ......................................................................... 25
TABLE OF CONTENTS (Continued)
ii
FIGURES
Figure 1 - Floodway Schematic ........................................................................................................ 21
TABLES
Table 1 - Summary of Discharges .................................................................................................... 10
Table 2 - Summary of Stillwater Elevations ..................................................................................... 11
Table 3 - Vertical Datum Conversion ............................................................................................... 14
Table 4 - Floodway Data................................................................................................................... 18
Table 5 - Community Map History ................................................................................................... 23
EXHIBITS
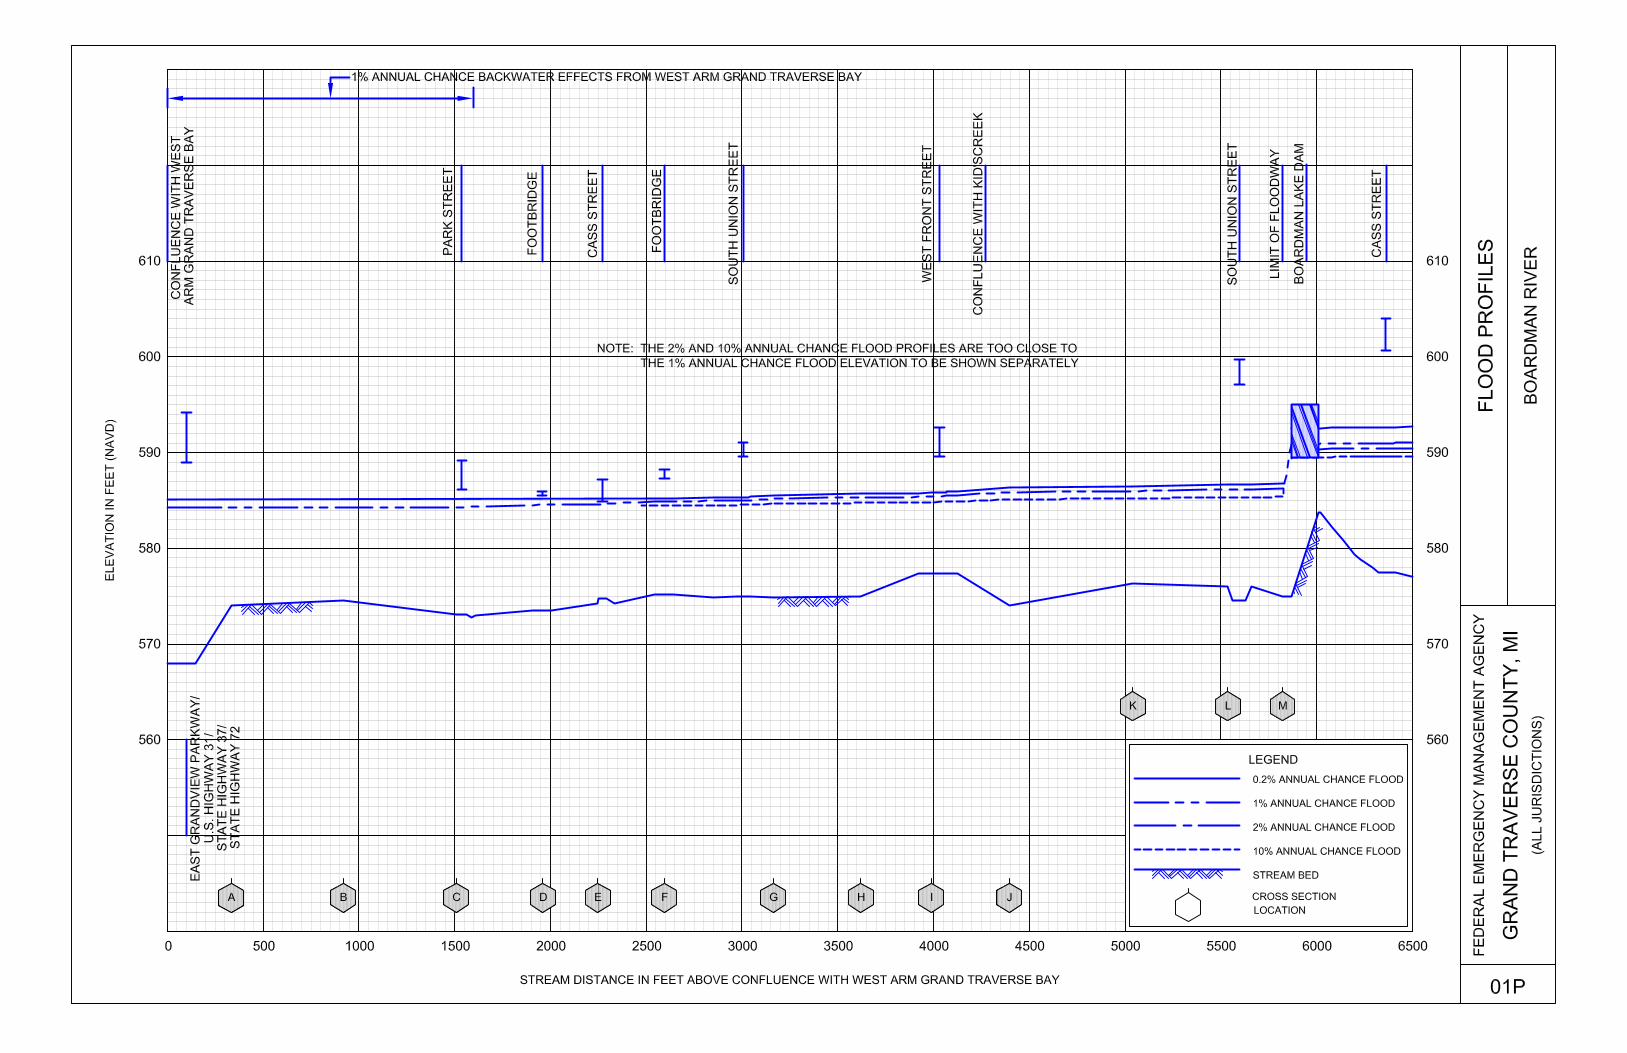
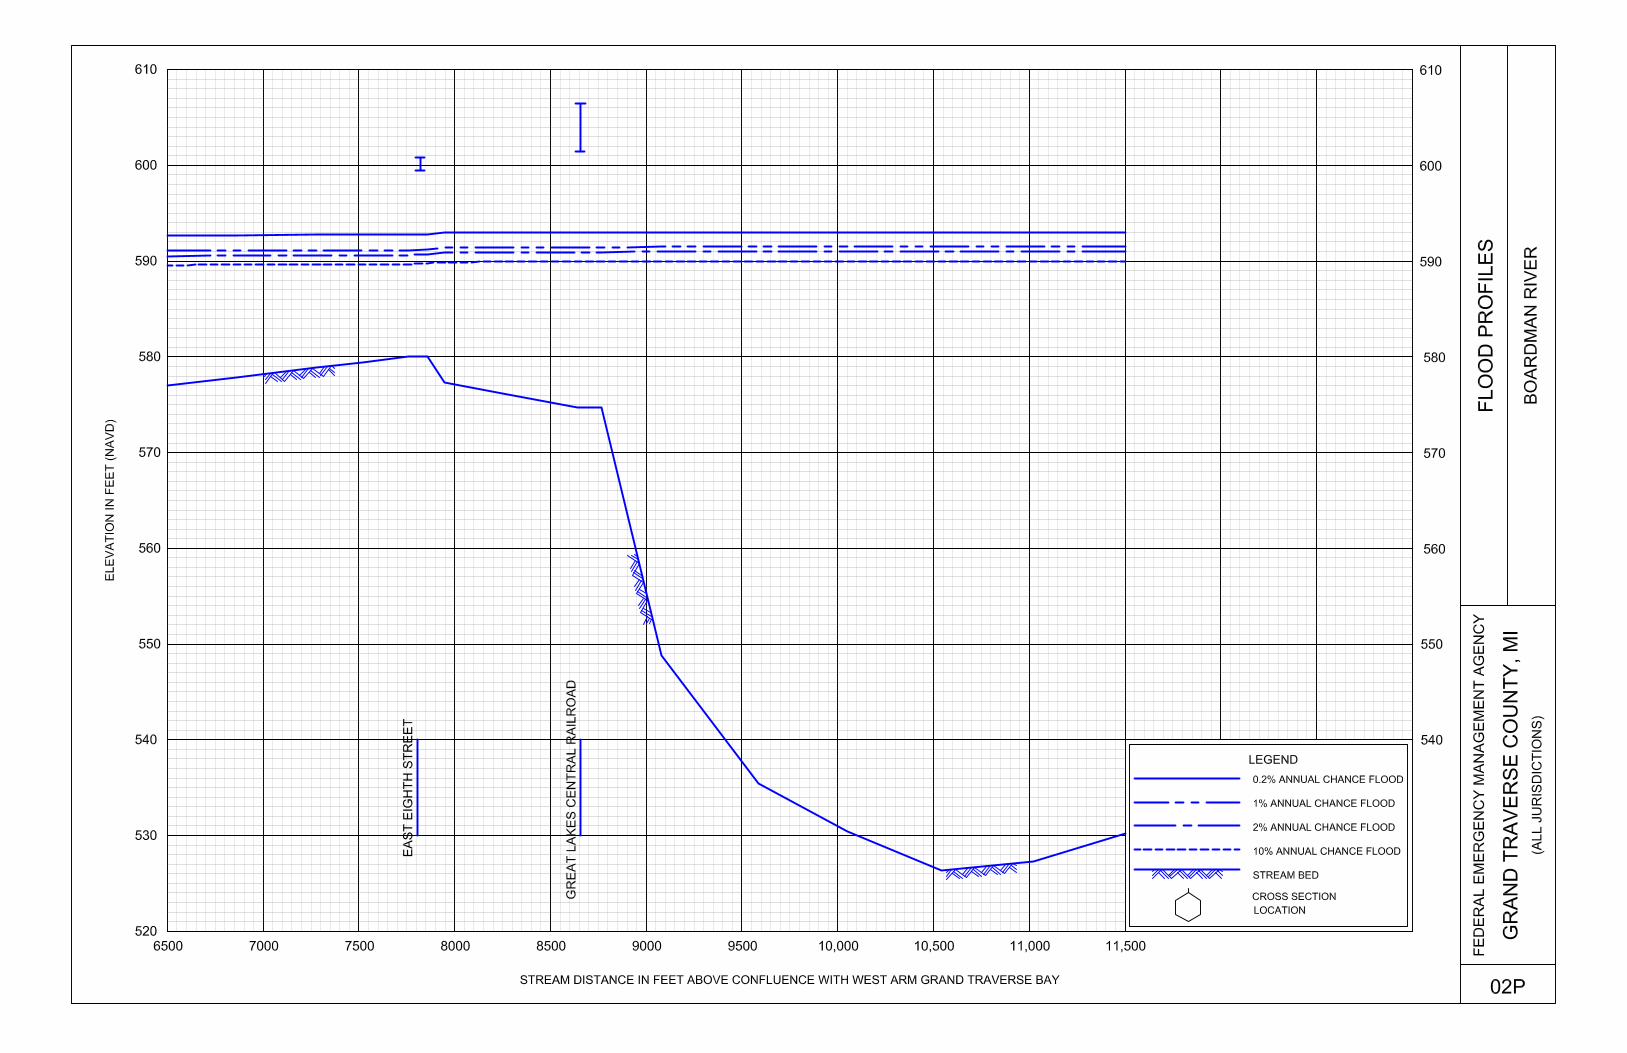
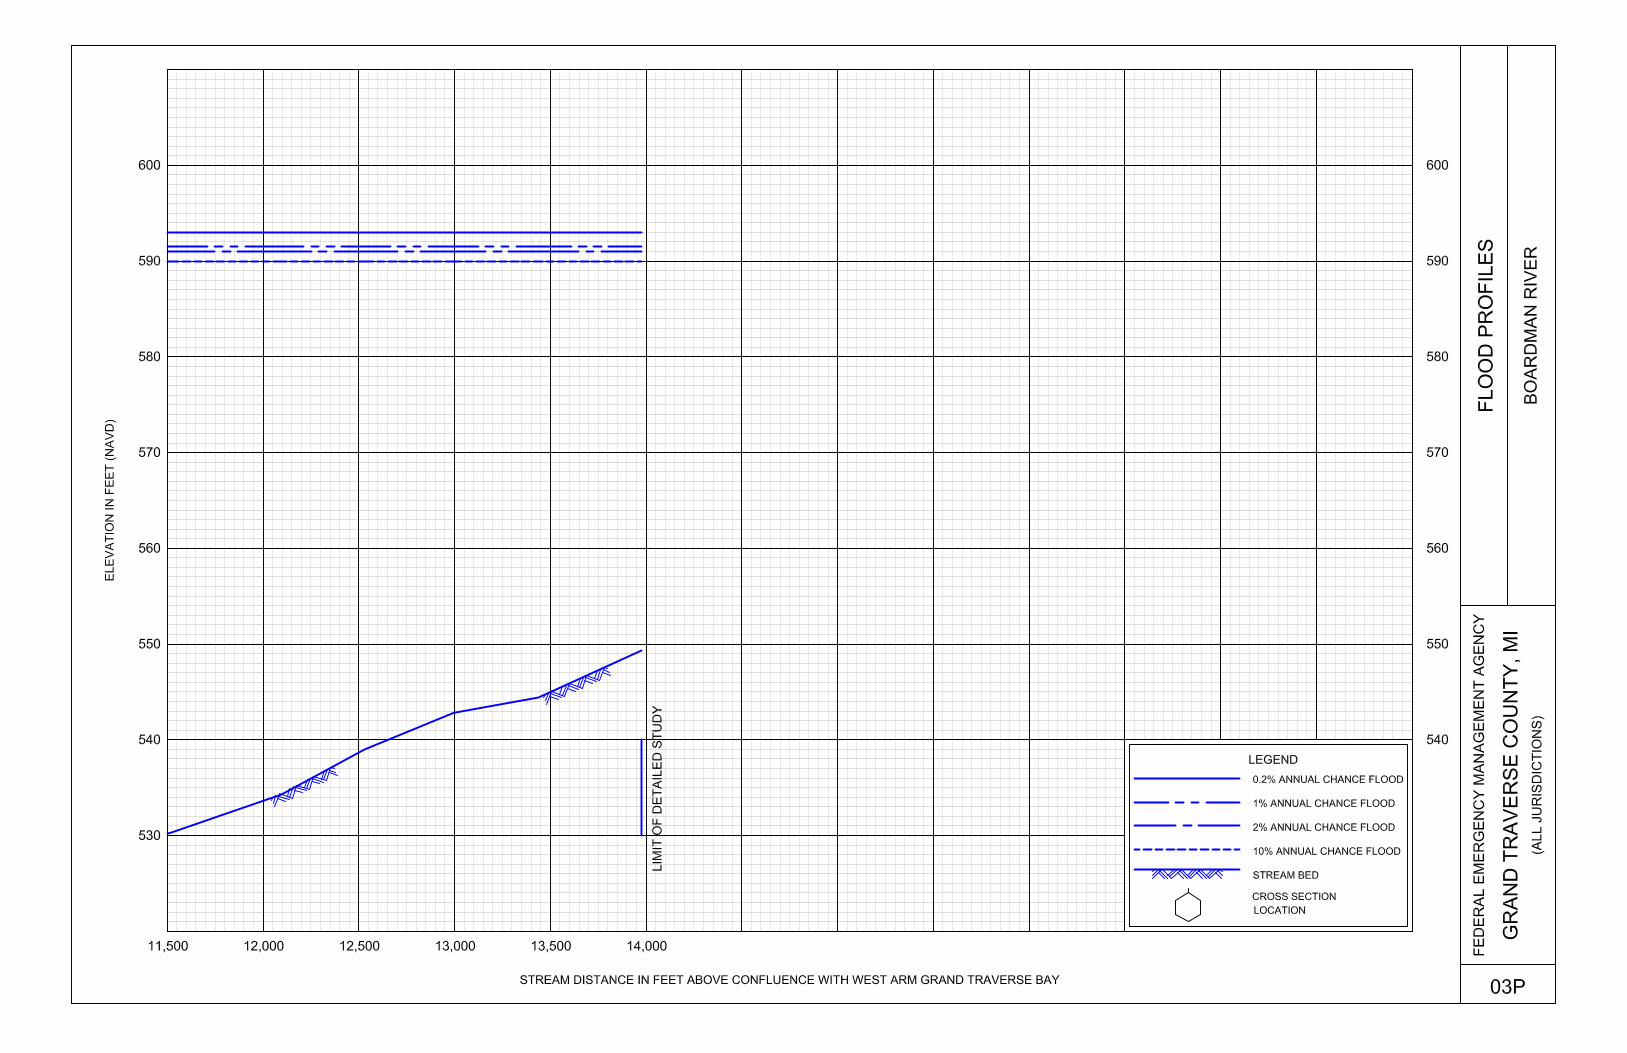
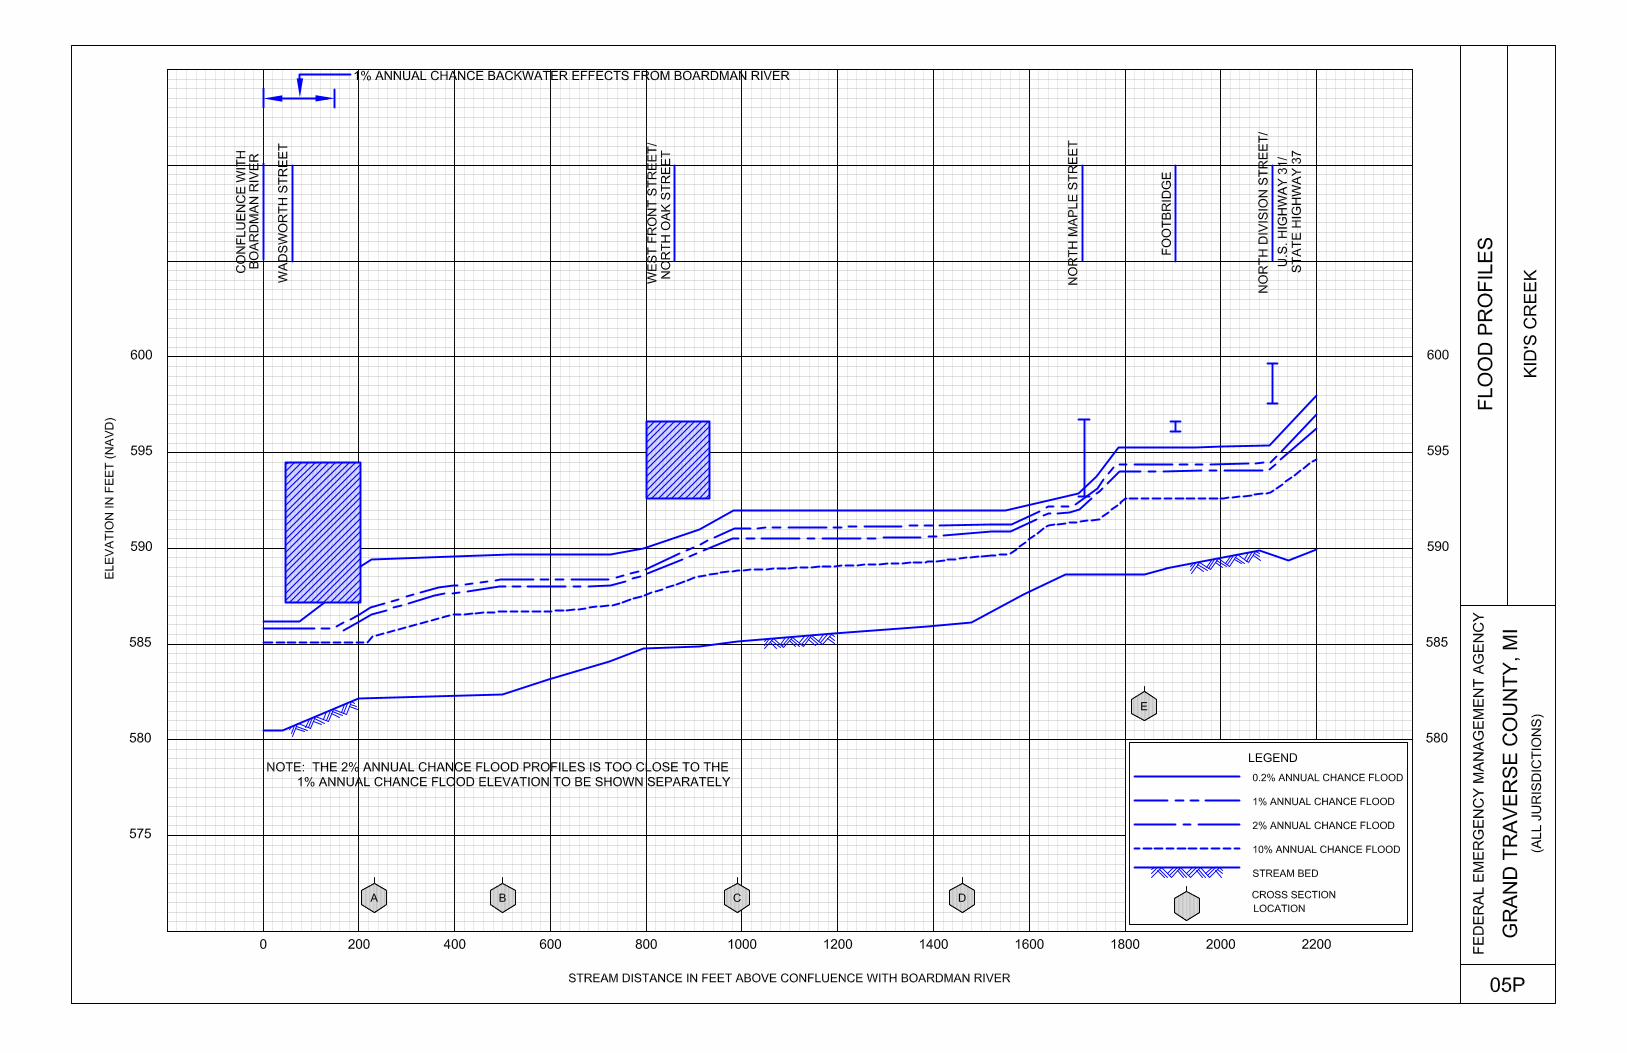
Exhibit 1 - Flood Profiles
Boardman River Panels 01P-03P
East Branch Mitchell Creek Panel 04P
Kid’s Creek Panels 05P-06P
Mitchell Creek Panel 07P
Tributary A Panels 08P-09P
Exhibit 2 - Flood Insurance Rate Map Index
Flood Insurance Rate Map
1
FLOOD INSURANCE STUDY
GRAND TRAVERSE COUNTY, MICHIGAN (ALL JURISDICTIONS)
1.0 INTRODUCTION
1.1 Purpose of Study
This Flood Insurance Study (FIS) revises and updates information on the
existence and severity of flood hazards in the geographic area of Grand Traverse
County, including the City of Traverse City; the Charter Townships of East Bay
and Garfield; the Townships of Acme, Blair, Fife Lake, Grant, Green Lake, Long
Lake, Mayfield, Paradise, Peninsula, Union, and Whitewater; and the Villages of
Fife Lake and Kingsley (referred to collectively herein as Grand Traverse
County), and aids in the administration of the National Flood Insurance Act of
1968 and the Flood Disaster Protection Act of 1973. This study has developed
flood-risk data for various areas of the community that will be used to establish
actuarial flood insurance rates and to assist the community in its efforts to
promote sound floodplain management. Minimum floodplain management
requirements for participation in the National Flood Insurance Program (NFIP)
are set forth in the Code of Federal Regulations at 44 CFR, 60.3.
Please note that the City of Traverse City is geographically located in Grand
Traverse and Leelanau Counties. Only the Grand Traverse portion of the City of
Traverse City is included in this FIS report. See the separately published FIS
report and Flood Insurance Rate Map (FIRM) for flood-hazard information.
Please note that the Townships of Fife Lake, Grant, and Mayfield; and the Village
of Fife Lake have no mapped special flood hazard areas.
In some states or communities, floodplain management criteria or regulations may
exist that are more restrictive or comprehensive than the minimum Federal
requirements. In such cases, the more restrictive criteria take precedence and the
State (or other jurisdictional agency) will be able to explain them.
The Digital Flood Insurance Rate Map (DFIRM) and FIS report for this
countywide study have been produced in digital format. Flood hazard
information was converted to meet the Federal Emergency Management Agency
(FEMA) DFIRM database specifications and Geographic Information System
(GIS) format requirements. The flood hazard information was created and is
provided in a digital format so that it can be incorporated into a local GIS and be
accessed more easily by the community.
2
1.2 Authority and Acknowledgments
The sources of authority for this FIS are the National Flood Insurance Act of 1968
and the Flood Disaster Protection Act of 1973.
Precountywide Analyses
Information on the authority and acknowledgements for each jurisdiction included
in this countywide FIS, as compiled from their previously printed FIS reports, is
shown below:
Traverse City, City of: The hydrologic and hydraulic analyses for
Boardman River, East Branch Mitchell Creek,
Kid’s Creek, Mitchell Creek, and Tributary A
for the June 15, 1982, FIS report were
performed by U.S. Army Corps of Engineers
(USACE), Detroit District, for FEMA, under
Interagency Agreement No. IAA-H-9-79,
Project Order No. 21 (FEMA, 1982). The
work was completed in March 1981.
The Charter Townships of East Bay and Garfield, the Townships of Acme, Blair,
Fife Lake, Grant, Green Lake, Long Lake, Mayfield, Paradise, Peninsula, Union,
and Whitewater; and the Villages of Fife Lake and Kingsley have no previously
printed FIS reports.
This Countywide FIS Report
The hydrologic and hydraulic analyses for all areas studied by approximate
methods, for this FIS Report, except the Boardman River, from approximately
5,200 feet upstream of Great Lakes Central Railroad to just upstream of Brown
Bridge Road, and coastal mapping for this study were performed by Atkins for
FEMA, under Contract No. HSFE05-05-D-0023, Project Order No. HSFE05-08-
J-0027. The work was completed in March 2011.
The Boardman River was analyzed in April 2008 as part of the USACE Section
506 Great Lakes Fishery and Ecosystem Restoration program (USACE, 2008).
Approximately 24 miles of the Boardman River, from its mouth at the West Arm
Grand Traverse Bay to just upstream of Brown Bridge Road, was restudied.
Base map information shown on this FIRM was provided in digital format by the
National Agricultural Imagery Program (NAIP). This information was
photogrammetrically compiled at a scale of 1:12,000 from aerial photography
dated 2007 or later. The projection used in the preparation of this map is
Universal Transverse Mercator (UTM) Zone 16, and the horizontal datum used is
3
the North American Datum of 1983 (NAD83), Geodetic Reference System 1980
(GRS80) spheroid.
1.3 Coordination
An initial meeting is held with representatives from FEMA, the community, and
the study contractor to explain the nature and purpose of a FIS, and to identify the
streams to be studied or restudied. A final meeting is held with representatives
from FEMA, the community, and the study contractor to review the results of the
study.
Precountywide Analyses
The initial and final meeting dates for previous FIS reports for Grand Traverse
County and its communities are listed in the following table:
Community FIS Date Initial Meeting Final Meeting
Traverse City, City of June 15, 1982 November 14, 1978 January 12, 1982
This Countywide FIS Report
The initial meeting was held on May 22, 2007, and attended by representatives of
FEMA, the communities, and Atkins.
The results of the study were reviewed at the final meeting held on [Month Day,
Year], and attended by representatives of [list all communities and parties that
were in attendance – typically list FEMA first, followed by any state
organizations, contractors, and communities]. All issues and/or concerns
raised at that meeting have been addressed.
2.0 AREA STUDIED
2.1 Scope of Study
This FIS covers the geographic area of Grand Traverse County, Michigan,
including the incorporated communities listed in Section 1.1. The areas studied
by detailed methods were selected with priority given to all known flood hazards
and areas of projected development or proposed construction through the time of
the study.
4
The following streams and lakes were studied by detailed methods in this FIS
report:
Boardman River Mitchell Creek
East Branch Mitchell Creek Tributary A
East Arm Grand Traverse Bay West Arm Grand Traverse Bay
Kid’s Creek
The limits of detailed study are indicated on the Flood Profiles (Exhibit 1) and on
the FIRM (Exhibit 2).
This Countywide FIS Report
The USACE study for the Boardman River was included as a detailed study, from
the confluence with the West Arm Grand Traverse Bay to approximately 5,200
feet upstream of Great Lakes Central Railroad, and as an approximate study from,
approximately 5,200 feet upstream of Great Lakes Central Railroad to just
upstream of Brown Bridge Road.
The East and West Arm Grand Traverse Bay were mapped using the stillwater
elevation of 584.3 feet, North American Vertical Datum of 1988 (NAVD), from
the USACE Flood Levels Report for Grand Traverse Bay and Little Traverse Bay
(USACE, 1990).
For Kid’s Creek, just upstream of the convergence of Tributary A to
approximately 1,900 feet upstream of Silver Lake Road, Bullhead Lake, Coffield
Lake, Fern Lake, North Twin Lake, Root Lake, the Sand Lakes, South Twin
Lake, and the Twin Lakes, the Special Flood Hazard Area (SFHA) floodplain
boundaries were digitally captured from the previous precountywide study.
Revised hydraulic and hydrologic analyses were preformed for all other
remaining streams and lakes studied by approximate methods.
Also for this countywide FIS, the FIS report and FIRM were converted to
countywide format, and the flooding information for the entire county, including
both incorporated and unincorporated areas, is shown. Also, the vertical datum
was converted from the National Geodetic Vertical Datum of 1929 (NGVD) to
the NAVD. In addition, the UTM coordinates, previously referenced to the North
American Datum of 1927 (NAD 27), are now referenced to the NAD83.
Approximate analyses were used to study those areas having low development
potential or minimal flood hazards. The scope and methods of study were
proposed to and agreed upon by FEMA and Grand Traverse County.
The following tabulation presents Letters of Map Change (LOMCs) incorporated
into this countywide study:
5
LOMC Case Number Date Issued Project Identifier LOMR* 04-05-1641P April 6, 2004 Elk Lake Project
*Letter of Map Revision (LOMR)
The following tabulation lists streams that have names in this countywide FIS
other than those used in the previously printed FIS reports for the communities in
which they are located.
Community Old Name New Name City of Traverse City Boardman Lake Boardman River
2.2 Community Description
Grand Traverse County is located in the northwestern part of the Lower Peninsula
of Michigan. The corporate boundaries are defined by Atrim County to the
northeast, Kalkaska County to the east, Wexford County to the south, Benzie
County to the west, and Leelanau County to the northwest. The total area of
Grand Traverse County is 465 square miles, and in 2009 the population of Grand
Traverse County was estimated to be 86,333 (U.S. Census Bureau, 2011).
The climate of the City of Traverse City is dependent upon wind direction. The
prevailing westerly winds passing over Lake Michigan create a moderation in
annual temperature variations. Cool lake water cools warm air reaching the area
in the fall. The climate during periods of prevailing westerly winds is quasi-
maritime. When the wind shifts to the south of southeast and passes over a large
land mass, the climate becomes modified continental with more abrupt variations
in temperature.
The average temperature in the City of Traverse City is 45 degrees Fahrenheit.
The average annual precipitation is 28.6 inches, and the average annual snowfall
is 77.5 inches (Weatherbase, 2011).
The topography in Grand Traverse County varies from rolling terrain with steep
slopes to level to gently sloping.
The geomorphic characteristics of the region are a result of several periods of
glaciations, with the most recent being the Wisconsin stage which receded about
10,000 to 12,000 years ago. Therefore geologically speaking, the formation of the
land in the region is very recent and correspondingly, the drainage patterns are in
the early stages of development. This resulted in branching or dendrites drainage
systems which drain slowly and have a high potential for flooding storage.
6
Grand Traverse Bay is a U-shaped extension of Lake Michigan. The principal
axis of the bay is in a north-south direction and 30 miles long. The East and West
Arms Grand Traverse Bay in the City of Traverse City are divided by the Old
Mission peninsula which extends northward from the City of Traverse City into
the bay.
Kid’s Creek is also known as Aslyum Creek and Hospital Creek. The Kid’s
Creek watershed drains 7.0 square miles and is approximately 2.7 miles wide and
4.5 miles long. About 14 percent of the watershed lies within the City of Traverse
City with the remainder lying in the Township of Garfield.
Tributary A is one of many small tributaries to Kid’s Creek. Its drainage area is
1.5 square miles at its confluence with Kid’s Creek and encompasses a portion of
the Kid’s Creek watershed.
Boardman Lake had a drainage area of 276 square miles at its upstream end where
Boardman River empties into it. The level of Boardman Lake and the outflow to
Boardman River is controlled by outlet works at the Boardman Lake Dam site
located between Cass and South Union Streets in the City of Traverse City. The
minimum top of the Boardman Lake Dam elevation is about 5.1 feet above the
normal upstream water-surface elevation (WSEL), and the Boardman Lake Dam
is 182 feet wide. Downstream of the Boardman Lake Dam, the Boardman River
flows to its confluence with the West Arm Grand Traverse Bay.
2.3 Principal Flood Problems
The history of flooding on the streams, lake, and bays within the community
indicates that flooding may occur during any season of the year, although the
worst flooding conditions are normally the result of spring rains combined with
snow melt.
The highest lake levels occur on Grand Traverse Bay during April to October,
although rises of a lesser magnitude can be expected to occur at various times
during the year.
Past floods on Kid’s Creek and Tributary A have damaged residential areas.
Large floods were documented on these streams in 1969, 1970, and 1972.
No flooding damage has been documented on Boardman Lake, Boardman River,
or the East and West Arms Grand Traverse Bay, although interviews with local
residents indicate that fluctuations in Grand Traverse Bay lake levels and beach
erosion cause minor problems along bay shoreline areas. Shoreline erosion is due
primarily to storm induced waves. High water levels can cause acceleration of
shore erosion by inundating beaches and allowing wave action to reach the bluffs.
High water levels occur over protracted periods of above-normal precipitation,

7
when drainage into Lake Michigan exceeds the flow out. High water levels can
also occur on the downwind shore of the lake during severe windstorms.
2.4 Flood Protection Measures
Concrete channel retaining walls exist along the Boardman River. The Boardman
Lake Dam is functional in maintaining a pool elevation upstream, but it was not
designed as a flood control structure. Other than these minimal structures, there
are no other known flood protection structures in Grand Traverse County.
3.0 ENGINEERING METHODS
For the flooding sources studied by detailed methods in the community, standard
hydrologic and hydraulic study methods were used to determine the flood hazard data
required for this study. Flood events of a magnitude that are expected to be equaled or
exceeded once on the average during any 10-, 50-, 100-, or 500-year period (recurrence
interval) have been selected as having special significance for floodplain management
and for flood insurance rates. These events, commonly termed the 10-, 50-, 100-, and
500-year floods, have a 10-, 2-, 1-, and 0.2-percent chance, respectively, of being equaled
or exceeded during any year. Although the recurrence interval represents the long-term,
average period between floods of a specific magnitude, rare floods could occur at short
intervals or even within the same year. The risk of experiencing a rare flood increases
when periods greater than 1 year are considered. For example, the risk of having a flood
that equals or exceeds the 1-percent-annual-chance (100-year) flood in any 50-year
period is approximately 40 percent (4 in 10); for any 90-year period, the risk increases to
approximately 60 percent (6 in 10). The analyses reported herein reflect flooding
potentials based on conditions existing in the community at the time of completion of this
study. Maps and flood elevations will be amended periodically to reflect future changes.
3.1 Hydrologic Analyses
Hydrologic analyses were carried out to establish peak discharge-frequency
relationships for each flooding source studied by detailed methods affecting the
community.
Precountywide Analyses
For the detailed study of Boardman Lake, recoded discharge data from the U.S.
Geological Survey (USGS) gaging station at Mayfield, Michigan was used. The
period of record used included water years 1953 through 1978, inclusive. A log-
Pearson Type III frequency analysis was performed on the data using a computed
station skew coefficient. A graphical analysis of maximum annual peak
discharges were plotted according to median plotting position values was used to
verify the results (USACE, 1962). The resulting peak discharges were transferred
downstream to Boardman Lake by means if a drainage area ratio exponent
(USGS, 1965).
8
The Michigan Department of Environmental Quality (MDEQ) coordinated the
elevation-frequency relationships on Boardman Lake and the discharge-frequency
relationships for the Boardman River. Synthetic inflow hydrographs into
Boardman Lake were developed and routed through the Boardman Lake Dam site
using the Soil Conservation Service (SCS), now the National Resources
Conservation Service (NRCS), TR-20 computer program (SCS, 1965); the peak
discharges of the inflow hydrographs were derived from USGS gage No.
04127000 frequency curve. In addition, the hydrograph of the flood of record at
the City of Traverse City, USGS gage No. 04127000 (September 1961) was
reviewed and the hydrologic model was adjusted to insure that the synthetic
inflow hydrograph into Boardman Lake reflects actual basin characteristics.
Field surveys were performed to ascertain outlet conditions and other physical
parameters of the Boardman Lake Dam site. USGS 7.5-minute series topographic
quadrangle maps (USGS, 1956) were used to compute elevation-storage
relationships.
For the detailed study of Boardman River, the four frequency discharges were
obtained from the outflows resulting from the routing procedure through the
Boardman Lake Dam.
For the detailed study of East Branch Mitchell Creek and Mitchell Creek, channel
flood routings to establish peak-discharge-frequency relationships were made
using the SCS, TR-20 computer program and SCS computer facilities (SCS 1965;
SCS, 1981). An important storage area exists just upstream of the Chessie System
fill on East Branch Mitchell Creek and this causes a reduction in the discharge
downstream of the fill.
The discharges for Kid’s Creek and Tributary A were based on the data presented
in the 1973 Kid’s Creek watershed study performed by the SCS (SCS, 1973). The
adjustments procedure assumes that within the boundaries of the original SCS
study, a linear relationship exists between percent development in the watershed
and discharge. The flood profiles presented in the SCS report were reviewed by
the Hydrologic Survey Division of MDEQ and recommended for use in
implementing flood plain ordinances.
Elevation-frequency relationships used in the detailed study of the East and West
Arms Grand Traverse Bay were provided by the USACE, Detroit District. The
flood elevations for the bay at the City of Traverse City were taken from “Report
on Great Lakes Open Coast Flood Levels” prepared by the USACE (USACE,
1977).
Due to the physical connection of Grand Traverse Bay to Lake Michigan, an
analysis was made to determine if further adjustment to open coast flood levels to
include wind setup in the bay was needed. Two methods were used. The first
9
method employed equation 3-97 of the U.S. Army Coastal Engineering Research
Center’s (USACERC) “Shore Protection Manual”, Volume I (USACERC, 1977).
The second method employed equation 5-12 from “Estuary and Coastline
Hydrodynamics” (Ippen, 1966).
The results of the analysis indicated that additional wind setup in Grand Traverse
Bay would be insignificant based on an evaluation of wind speed, wind direction,
length of fetch and depth of water. The analysis showed that the extreme depth of
Grand Traverse Bay moderates the effects of wind setup. In addition, the
orientations of the longer fetches of Lake Michigan to the mouth of the bay are
such that significant compounding of wind setup effects would not occur. The
open coast elevations presented in “Report on Great Lakes Open Coast Flood
Levels”, prepared by the USACE (USACE, 1977) were, therefore, adopted for
this study.
Flood discharges for the portion of Kid’s Creek studied by approximate methods
were based upon the discharges presented in the 1973 SCS report on the Kid’s
Creek watershed (SCS, 1973) for the reach within the City of Traverse City from
Eleventh Street upstream to approximately 1,900 feet upstream of Silver Lake
Road, with adjustments made to reflect current conditions in the watershed.
This Countywide Analysis
For the Boardman River, the flood-flow frequencies were based on the Drainage
Area Ratio Method (SCS, 1972), where the base flow (or “known” flow) was the
statistical analysis of discharge records covering a 37-year period at the gaging
station; Boardman River near Mayfield, Michigan (USGS gage No. 04127000)
period of record 1953-1989. This analysis followed the standard log-Pearson Type
III method as outlined in the U.S. Water Resources Council (WRC) Bulletin #17B
(WRC, 1982), using a regional skew coefficient determined specifically for
Michigan (Holtchlang and Croskey, 1983).
For stream locations on the Boardman River for which there is no gage present, the
WRC Bulletin #17B (WRC, 1982), annual flow estimates at the gaged site were
weighted based on the drainage area ratios of the gaged and ungaged sites. This
gage weighting is performed when the ratio of the drainage areas is between 0.5
and 1.5.
Flood elevations for Grand Traverse Bay in portions of Grand Traverse County
were taken from the “Flood Levels Report on Grand Traverse Bay and Little
Traverse Bay” prepared by the USACE, Detroit District (USACE, 1990). The
report lists different WSELs for sections of Grand Traverse Bay, which includes
Grand Traverse County. The different WSELs are a result of additional wave run-
up analyses that were completed for the report. As a result, the Township of
Peninsula has multiple WSELs within their community boundaries. Additional
10
information regarding the exact locations of these sections, and their corresponding
WSEL, can be found in the original report (USACE, 1990).
Peak discharges for the streams studied by approximate analyses for this
countywide revision except for the Boardman River, from approximately
5,200 feet upstream of Great Lakes Central Railroad to just upstream of Brown
Bridge Road, in Grand Traverse County were derived using either the USGS
regional regression equations, the MDEQ SCS procedures, or the SCS Technical
Release 55 methodology (SCS, 1986).
For the majority of the approximate analyses, peak discharges were estimated
using the published USGS regional regression equations (Holtchlang and Croskey,
1984). Regression equations estimate peak discharges for ungaged streams based
on characteristics of nearby gaged streams.
For streams in Grand Traverse County, studied by approximate methods, that have
drainage areas that fall outside the allowable range of the USGS regional
regression equations, the methodology presented in the MDEQ guidance
document, “Computing Flood Discharges for Small Ungaged Watersheds”, was
applied (Sorrell, 2008).
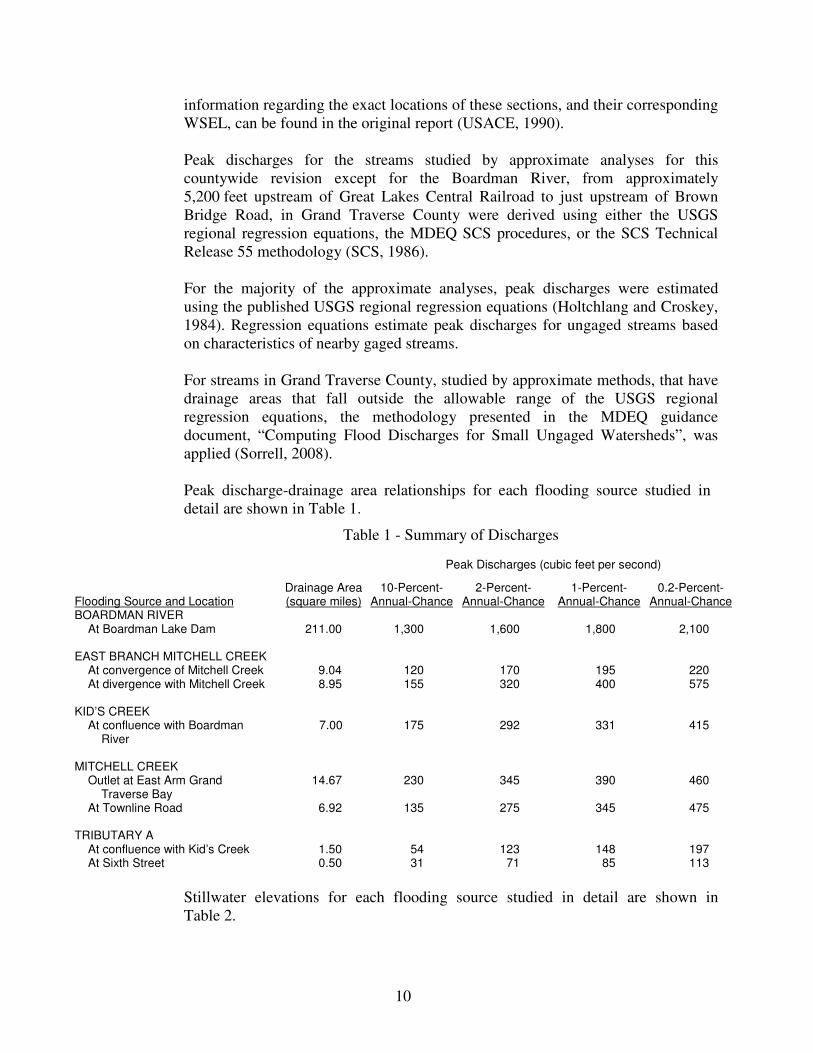
Peak discharge-drainage area relationships for each flooding source studied in
detail are shown in Table 1.
Table 1 - Summary of Discharges
Peak Discharges (cubic feet per second)
Flooding Source and Location Drainage Area (square miles)
10-Percent-Annual-Chance
2-Percent-Annual-Chance
1-Percent-Annual-Chance
0.2-Percent-Annual-Chance
BOARDMAN RIVER At Boardman Lake Dam 211.00 1,300 1,600 1,800 2,100 EAST BRANCH MITCHELL CREEK At convergence of Mitchell Creek 9.04 120 170 195 220 At divergence with Mitchell Creek 8.95 155 320 400 575 KID’S CREEK At confluence with Boardman River
7.00 175 292 331 415
MITCHELL CREEK Outlet at East Arm Grand Traverse Bay
14.67 230 345 390 460
At Townline Road 6.92 135 275 345 475 TRIBUTARY A At confluence with Kid’s Creek 1.50 54 123 148 197 At Sixth Street 0.50 31 71 85 113
Stillwater elevations for each flooding source studied in detail are shown in
Table 2.
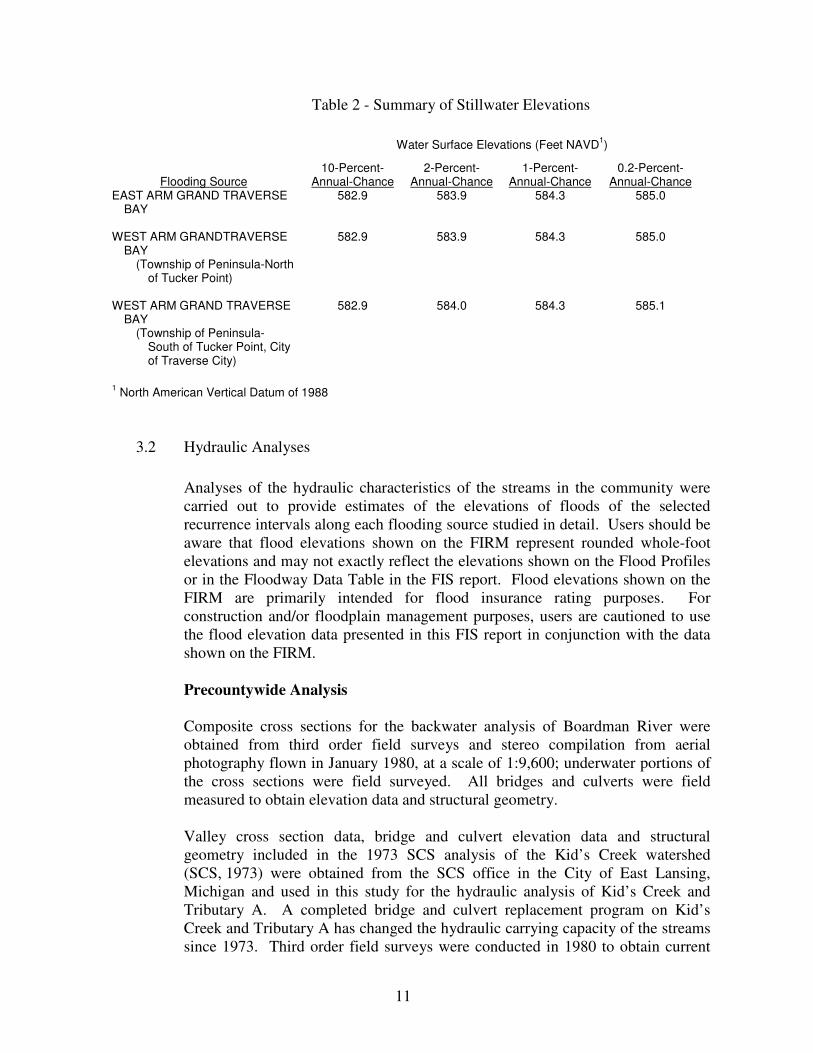
11
Table 2 - Summary of Stillwater Elevations
Water Surface Elevations (Feet NAVD1)
Flooding Source 10-Percent-
Annual-Chance 2-Percent-
Annual-Chance 1-Percent-
Annual-Chance 0.2-Percent-
Annual-Chance EAST ARM GRAND TRAVERSE
BAY 582.9 583.9 584.3 585.0
WEST ARM GRANDTRAVERSE
BAY (Township of Peninsula-North
of Tucker Point)
582.9 583.9 584.3 585.0
WEST ARM GRAND TRAVERSE
BAY (Township of Peninsula-
South of Tucker Point, City of Traverse City)
582.9 584.0 584.3 585.1
1 North American Vertical Datum of 1988
3.2 Hydraulic Analyses
Analyses of the hydraulic characteristics of the streams in the community were
carried out to provide estimates of the elevations of floods of the selected
recurrence intervals along each flooding source studied in detail. Users should be
aware that flood elevations shown on the FIRM represent rounded whole-foot
elevations and may not exactly reflect the elevations shown on the Flood Profiles
or in the Floodway Data Table in the FIS report. Flood elevations shown on the
FIRM are primarily intended for flood insurance rating purposes. For
construction and/or floodplain management purposes, users are cautioned to use
the flood elevation data presented in this FIS report in conjunction with the data
shown on the FIRM.
Precountywide Analysis
Composite cross sections for the backwater analysis of Boardman River were
obtained from third order field surveys and stereo compilation from aerial
photography flown in January 1980, at a scale of 1:9,600; underwater portions of
the cross sections were field surveyed. All bridges and culverts were field
measured to obtain elevation data and structural geometry.
Valley cross section data, bridge and culvert elevation data and structural
geometry included in the 1973 SCS analysis of the Kid’s Creek watershed
(SCS, 1973) were obtained from the SCS office in the City of East Lansing,
Michigan and used in this study for the hydraulic analysis of Kid’s Creek and
Tributary A. A completed bridge and culvert replacement program on Kid’s
Creek and Tributary A has changed the hydraulic carrying capacity of the streams
since 1973. Third order field surveys were conducted in 1980 to obtain current
12
bridge and culvert elevation data and structural geometry where replacement has
occurred, as determined through field reconnaissance.
For Mitchell Creek, the water-surface profiles were developed using the SCS
computer program, WSP2 (SCS, 1976).
For Boardman River, Kid’s Creek, and Tributary A, WSELs of the selected
recurrence intervals were computed through use of the USACE, Hydraulic
Engineering Center’s (HEC) computer program, HEC-2 (HEC, 1968).
Starting WSELs for the Boardman River were based on the West Arm Grand
Traverse Bay normal pool elevation. For Kid’s Creek and Tributary A, the
starting WSELs were calculated using the slope-area method.
For Kid’s Creek, studied by approximate methods, normal depth calculations and
two-foot contour interval mapping were used in the analysis.
This Countywide Analysis
The USACE Boardman River hydraulic analysis model was conducted using the
USACE, HEC computer program, HEC-RAS version, 3.1.3 (HEC, 2005). Bridge
data in the USACE Boardman River hydraulic model came from field survey
data. The channel of the Boardman River is well defined and during field
inspections typically ranged in depth from a few inches to five feet. The channel
is generally free of vegetation and has a combination of sand, gravel, and cobble.
The majority of the banks in the study area from the upstream limit through
Beitner Road have thick shrubs and woods. There are intermittent areas where
land has been cleared outside of the tree lined banks.
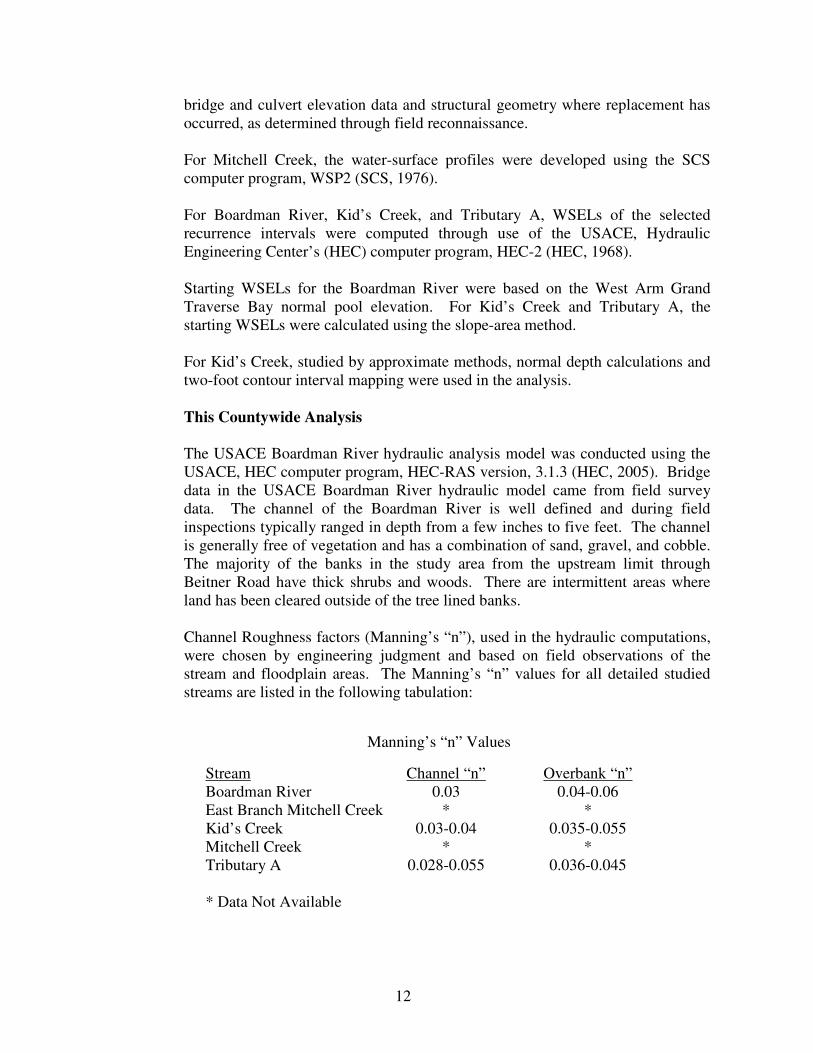
Channel Roughness factors (Manning’s “n”), used in the hydraulic computations,
were chosen by engineering judgment and based on field observations of the
stream and floodplain areas. The Manning’s “n” values for all detailed studied
streams are listed in the following tabulation:
Manning’s “n” Values
Stream Channel “n” Overbank “n”
Boardman River 0.03 0.04-0.06
East Branch Mitchell Creek * *
Kid’s Creek 0.03-0.04 0.035-0.055
Mitchell Creek * *
Tributary A 0.028-0.055 0.036-0.045
* Data Not Available
13
For the streams studied by approximate analyses for this countywide revision,
except for the Boardman River, from approximately 5,200 feet upstream of Great
Lakes Central Railroad to just upstream of Brown Bridge Road, cross section data
was obtained from the topography. Structures were modeled as bridge openings
with the open width and deck length values provided by the bridge inventory data,
or approximated from the aerial photos. Bridge elevations were derived from the
USGS 7.5-minute series topographic quadrangle maps.
In cases where minimal or no structure data was available, the structures were
modeled as weirs. The weir elevation was approximated from elevations found
on the USGS 7.5-minute topographic quadrangles if available. If no benchmark
was available, the weir elevation was approximated as one-half the contour
interval above the lowest contour at the structure.
In many cases, assuming the structure as a weir resulted in a floodplain that was
overly conservative. In these cases, the weir section was deleted and ineffective
flow was added to mimic the constricted flow through the structure.
The streams studied by approximate analyses for this countywide revision except
for the Boardman River, from approximately 5,200 feet upstream of Great Lakes
Central Railroad to just upstream of Brown Bridge Road, were modeled using the
USACE, HEC computer program, HEC-RAS, version 4.0 (HEC, 2008). Starting
elevations were calculated using normal depth calculations.
Locations of selected cross sections used in the hydraulic analyses are shown on
the Flood Profiles (Exhibit 1). For stream segments for which a floodway was
computed (Section 4.2), selected cross section locations are also shown on the
FIRM (Exhibit 2).
The profile baselines depicted on the FIRM represent the hydraulic modeling
baselines that match the flood profiles on this FIS report. As a result of
improved topographic data, the profile baseline, in some cases, may deviate
significantly from the channel centerline or appear outside the SFHA.
The hydraulic analyses for this study were based on unobstructed flow. The
flood elevations shown on the Flood Profiles (Exhibit 1) are thus considered
valid only if hydraulic structures remain unobstructed, operate properly, and do
not fail.
3.3 Vertical Datum
All FIS reports and FIRMs are referenced to a specific vertical datum. The
vertical datum provides a starting point against which flood, ground, and
structure elevations can be referenced and compared. Until recently, the
standard vertical datum in use for newly created or revised FIS reports and
14
FIRMs was NGVD. With the finalization of NAVD, many FIS reports and
FIRMs are being prepared using NAVD as the referenced vertical datum.
All flood elevations shown in this FIS report and on the FIRM are referenced to
NAVD. Structure and ground elevations in the community must, therefore, be
referenced to NAVD. It is important to note that adjacent communities may be
referenced to NGVD. This may result in differences in Base Flood Elevations
(BFEs) across the corporate limits between the communities. Some of the data
used in this study were taken from the prior effective FIS reports and adjusted to
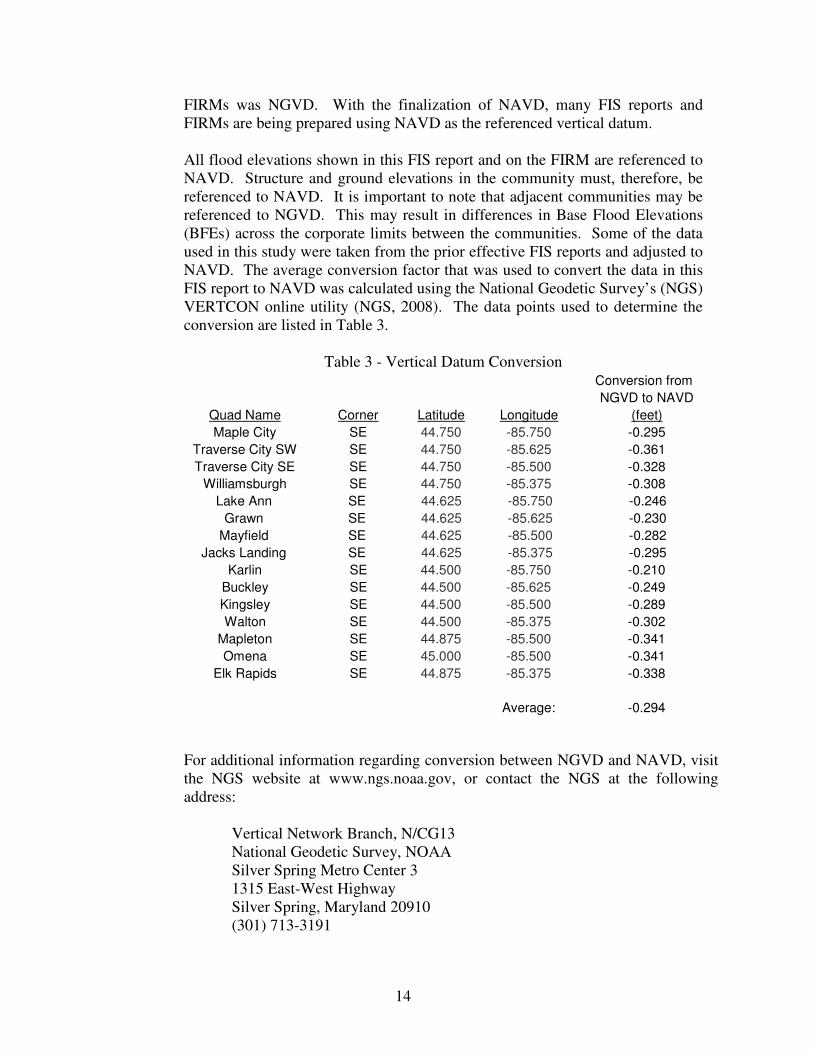
NAVD. The average conversion factor that was used to convert the data in this
FIS report to NAVD was calculated using the National Geodetic Survey’s (NGS)
VERTCON online utility (NGS, 2008). The data points used to determine the
conversion are listed in Table 3.
Table 3 - Vertical Datum Conversion
Conversion from
NGVD to NAVD
Quad Name Corner Latitude Longitude (feet)
Maple City SE 44.750 -85.750 -0.295
Traverse City SW SE 44.750 -85.625 -0.361
Traverse City SE SE 44.750 -85.500 -0.328
Williamsburgh SE 44.750 -85.375 -0.308
Lake Ann SE 44.625 -85.750 -0.246
Grawn SE 44.625 -85.625 -0.230
Mayfield SE 44.625 -85.500 -0.282
Jacks Landing SE 44.625 -85.375 -0.295
Karlin SE 44.500 -85.750 -0.210
Buckley SE 44.500 -85.625 -0.249
Kingsley SE 44.500 -85.500 -0.289
Walton SE 44.500 -85.375 -0.302
Mapleton SE 44.875 -85.500 -0.341
Omena SE 45.000 -85.500 -0.341
Elk Rapids SE 44.875 -85.375 -0.338
Average: -0.294
For additional information regarding conversion between NGVD and NAVD, visit
the NGS website at www.ngs.noaa.gov, or contact the NGS at the following
address:
Vertical Network Branch, N/CG13
National Geodetic Survey, NOAA
Silver Spring Metro Center 3
1315 East-West Highway
Silver Spring, Maryland 20910
(301) 713-3191

15
Temporary vertical monuments are often established during the preparation of a
flood hazard analysis for the purpose of establishing local vertical control.
Although these monuments are not shown on the FIRM, they may be found in the
Technical Support Data Notebook associated with the FIS report and FIRM for this
community. Interested individuals may contact FEMA to access these data.
To obtain current elevation, description, and/or location information for
benchmarks shown on this map, please contact the Information Services Branch of
the NGS at (301) 713-3242, or visit their website at www.ngs.noaa.gov.
4.0 FLOODPLAIN MANAGEMENT APPLICATIONS
The NFIP encourages State and local governments to adopt sound floodplain
management programs. Therefore, each FIS provides 1-percent-annual-chance (100-
year) flood elevations and delineations of the 1- and 0.2-percent-annual-chance (500-
year) floodplain boundaries and 1-percent-annual-chance floodway to assist
communities in developing floodplain management measures. This information is
presented on the FIRM and in many components of the FIS report, including Flood
Profiles, Floodway Data Table, and Summary of Stillwater Elevations Table. Users
should reference the data presented in the FIS report as well as additional information
that may be available at the local map repository before making flood elevation and/or
floodplain boundary determinations.
4.1 Floodplain Boundaries
To provide a national standard without regional discrimination, the 1-percent-
annual-chance flood has been adopted by FEMA as the base flood for floodplain
management purposes. The 0.2-percent-annual-chance flood is employed to
indicate additional areas of flood risk in the community.
For East Branch Mitchell Creek, Kid’s Creek, Mitchell Creek, and Tributary A,
which were studied by detailed methods, the 1- and 0.2-percent-annual-chance
floodplain boundaries have been delineated using the flood elevations
determined at each cross section. Between cross sections, the boundaries were
interpolated using topographic maps at scales of 1:1,200 and 1:2,400 with a
contour interval of two feet (Traverse Bay Regional Planning Commission,
1980).
For Kid’s Creek, just upstream of the convergence of Tributary A to
approximately 1,900 feet upstream of Silver Lake Road, Bullhead Lake, Coffield
Lake, Fern Lake, North Twin Lake, Root Lake, the Sand Lakes, South Twin
Lake, and the Twin Lakes, the 1-percent-annual-chance floodplain boundaries
were delineated using USGS 7.5-minute topographic quadrangle maps (USGS,
1956).
16
For approximate studied streams, with the exception of Boardman River, the
1-percent-annual-chance floodplain boundaries were delineated using USGS
7.5-minute topographic quadrangle maps (USGS, various; USGS, 1985).
For the portion of Kid’s Creek studied by approximate methods, the boundary of
the 1-percent-annual-chance flood was developed from normal depth
calculations based upon information obtained from field reconnaissance and
topographic maps referenced above.
Coastal Light Detection and Ranging (LiDAR) topography was developed and
managed by the Joint Airborne LiDAR Bathymetry Technical Center of
Expertise (JALBTCX) (JALBTCX, 2009). The data has a horizontal accuracy
of +/- 0.75 meters and a vertical accuracy of +/- 0.20 meters. The coastal
LiDAR data was used, where available, to map the East and West Arms Grand
Traverse Bay coastal floodplain boundaries. In areas where the coastal LiDAR
was not available, the USGS 7.5-minute series topographic quadrangle maps
were used (USGS, various).
For the Boardman River, floodplain boundaries were delineated using LiDAR
topography developed by the USACE (USACE, 2000). The topography has a
contour interval of two feet. Adjustments to the mapped floodplain were made
to encompass visible waters on the aerial imagery.
The 1- and 0.2-percent-annual-chance floodplain boundaries are shown on the
FIRM (Exhibit 2). On this map, the 1-percent-annual-chance floodplain
boundary corresponds to the boundary of the areas of special flood hazards
(Zones A and AE) and the 0.2-percent-annual-chance floodplain boundary
corresponds to the boundary of areas of moderate flood hazards. In cases where
the 1- and 0.2-percent-annual-chance floodplain boundaries are close together,
only the 1-percent-annual-chance floodplain boundary has been shown. Small
areas within the floodplain boundaries may lie above the flood elevations but
cannot be shown due to limitations of the map scale and/or lack of detailed
topographic data.
For the streams studied by approximate methods, only the 1-percent-annual-
chance floodplain boundary is shown on the FIRM (Exhibit 2).
4.2 Floodways
Encroachment on floodplains, such as structures and fill, reduces flood-carrying
capacity, increases flood heights and velocities, and increases flood hazards in
areas beyond the encroachment itself. One aspect of floodplain management
involves balancing the economic gain from floodplain development against the
resulting increase in flood hazard. For purposes of the NFIP, a floodway is used
as a tool to assist local communities in this aspect of floodplain management.
Under this concept, the area of the 1-percent-annual-chance floodplain is divided
17
into a floodway and a floodway fringe. The floodway is the channel of a stream,
plus any adjacent floodplain areas, that must be kept free of encroachment so
that the 1-percent-annual-chance flood can be carried without substantial
increases in flood heights. Minimum Federal standards limit such increases to 1
foot, provided that hazardous velocities are not produced. In Michigan,
however, under Michigan Act 245, Public Acts of 1929, as amended by Act 167,
Public Acts of 1968 (State of Michigan, 1968), encroachment in the floodplain is
limited to that which will cause only an insignificant increase in flood heights.
Thus, at the recommendation of the Bureau of the Water Management, a
floodway having no more than a 0.1 foot surcharge has been delineated for this
study. The floodways in this study are presented to local agencies as minimum
standards that can be adopted directly or that can be used as a basis for additional
floodway studies.
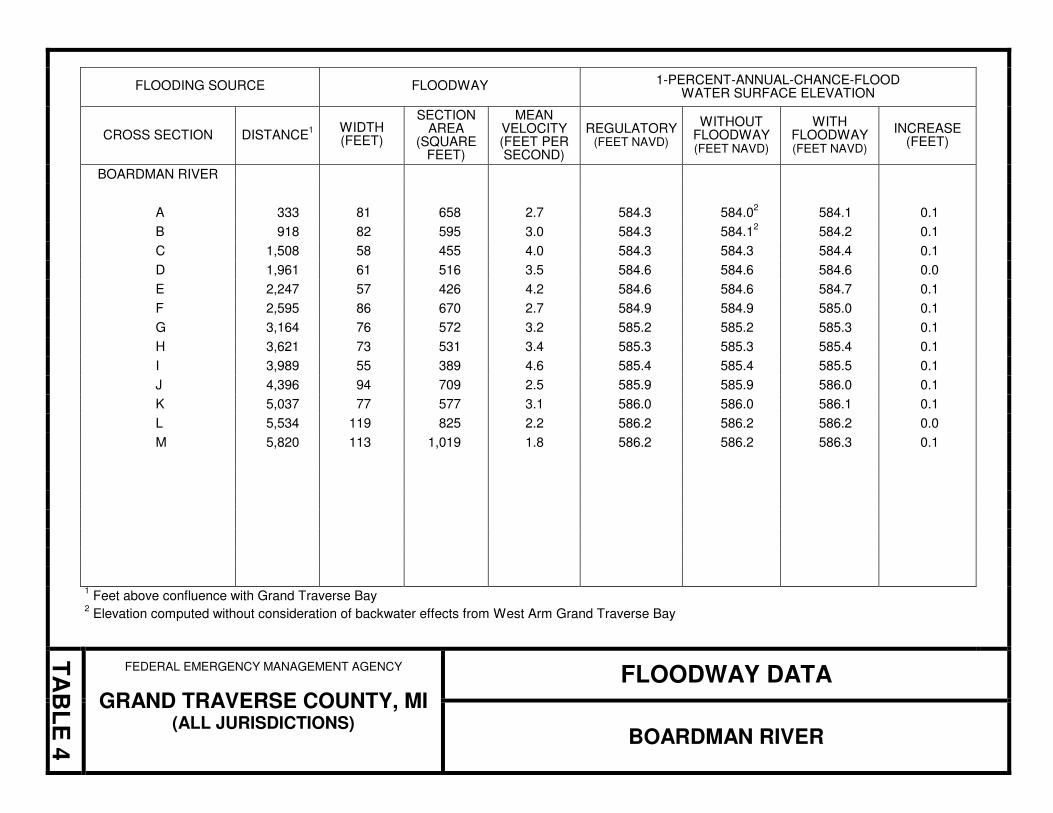
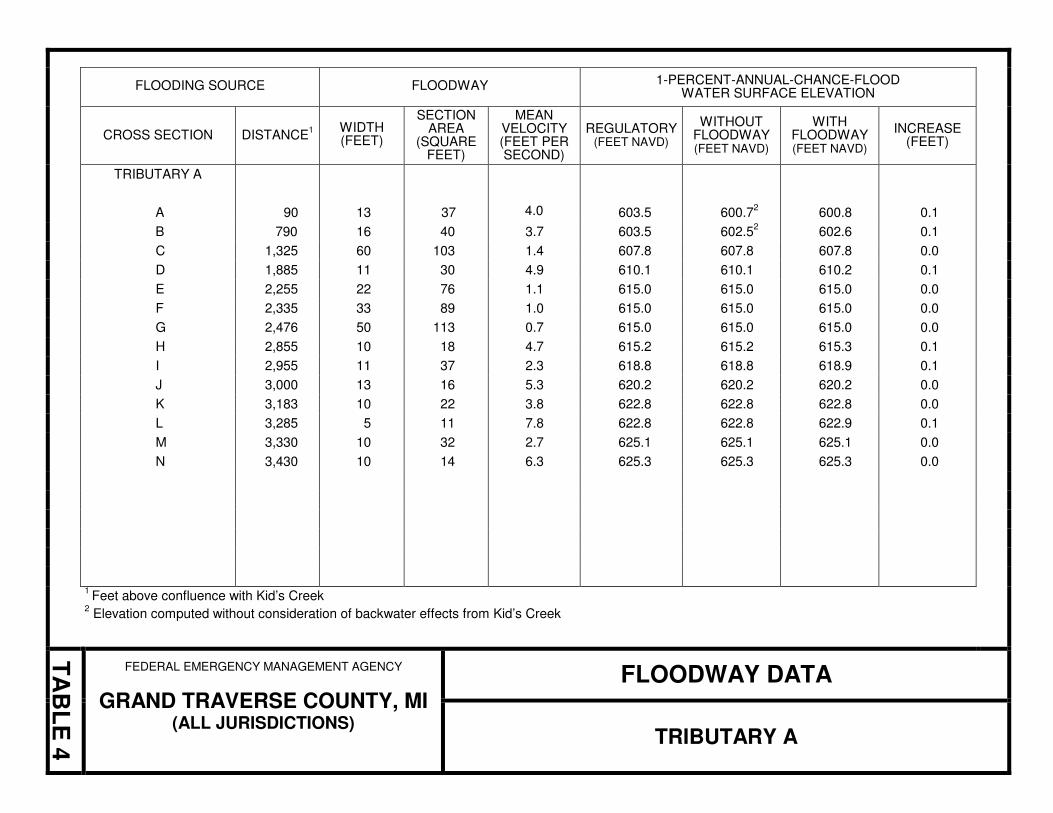
The floodways presented in this FIS report and on the FIRM were computed for
certain stream segments on the basis of equal-conveyance reduction from each
side of the floodplain. Floodway widths were computed at cross sections.
Between cross sections, the floodway boundaries were interpolated. The results
of the floodway computations have been tabulated for selected cross sections
(Table 4). In cases where the floodway and 1-percent-annual-chance floodplain
boundaries are either close together or collinear, only the floodway boundary has
been shown.
FLOODING SOURCE FLOODWAY 1-PERCENT-ANNUAL-CHANCE-FLOOD
WATER SURFACE ELEVATION
CROSS SECTION DISTANCE1 WIDTH
(FEET)
SECTION AREA
(SQUARE FEET)
MEAN VELOCITY (FEET PER SECOND)
REGULATORY (FEET NAVD)
WITHOUT FLOODWAY (FEET NAVD)
WITH FLOODWAY (FEET NAVD)
INCREASE (FEET)
BOARDMAN RIVER
A 333 81 658 2.7 584.3 584.02
584.1 0.1
B 918 82 595 3.0 584.3 584.12
584.2 0.1
C 1,508 58 455 4.0 584.3 584.3 584.4 0.1
D 1,961 61 516 3.5 584.6 584.6 584.6 0.0
E 2,247 57 426 4.2 584.6 584.6 584.7 0.1
F 2,595 86 670 2.7 584.9 584.9 585.0 0.1
G 3,164 76 572 3.2 585.2 585.2 585.3 0.1
H 3,621 73 531 3.4 585.3 585.3 585.4 0.1
I 3,989 55 389 4.6 585.4 585.4 585.5 0.1
J 4,396 94 709 2.5 585.9 585.9 586.0 0.1
K 5,037 77 577 3.1 586.0 586.0 586.1 0.1
L 5,534 119 825 2.2 586.2 586.2 586.2 0.0
M 5,820 113 1,019 1.8 586.2 586.2 586.3 0.1
1 Feet above confluence with Grand Traverse Bay
2 Elevation computed without consideration of backwater effects from West Arm Grand Traverse Bay
TA
BL
E 4
FEDERAL EMERGENCY MANAGEMENT AGENCY
GRAND TRAVERSE COUNTY, MI (ALL JURISDICTIONS)
FLOODWAY DATA
BOARDMAN RIVER

FLOODING SOURCE FLOODWAY 1-PERCENT-ANNUAL-CHANCE-FLOOD
WATER SURFACE ELEVATION
CROSS SECTION DISTANCE1
WIDTH (FEET)
SECTION AREA
(SQUARE FEET)
MEAN VELOCITY (FEET PER SECOND)
REGULATORY (FEET NAVD)
WITHOUT FLOODWAY (FEET NAVD)
WITH FLOODWAY (FEET NAVD)
INCREASE (FEET)
KID’S CREEK
A
225
13
49
6.7
586.9
586.9
586.9
0.0
B 500 64 229 1.4 588.4 588.4 588.5 0.1
C 990 55 177 1.9 591.1 591.1 591.1 0.0
D 1,460 95 229 1.4 591.3 591.3 591.3 0.0
E 1,840 55 165 2.0 594.4 594.4 594.4 0.0
F 2,330 50 141 2.3 597.2 597.2 597.2 0.0
G 2,620 39 92 3.6 597.4 597.4 597.4 0.0
H 2,875 100 212 1.6 598.1 598.1 598.2 0.1
I 3,119 120 279 1.2 598.3 598.3 598.4 0.1
J 3,370 100 354 0.9 598.5 598.5 598.6 0.1
K 3,686 80 134 2.5 598.8 598.8 598.8 0.0
L 3,885 50 77 4.3 599.9 599.9 599.9 0.0
M 4,160 60 251 1.3 601.6 601.6 601.6 0.0
N 4,530 60 278 1.2 603.5 603.5 603.5 0.0
1 Feet above confluence with Boardman River
TA
BL
E 4
FEDERAL EMERGENCY MANAGEMENT AGENCY
GRAND TRAVERSE COUNTY, MI (ALL JURISDICTIONS)
FLOODWAY DATA
KID’S CREEK
FLOODING SOURCE FLOODWAY 1-PERCENT-ANNUAL-CHANCE-FLOOD
WATER SURFACE ELEVATION
CROSS SECTION DISTANCE1
WIDTH (FEET)
SECTION AREA
(SQUARE FEET)
MEAN VELOCITY (FEET PER SECOND)
REGULATORY (FEET NAVD)
WITHOUT FLOODWAY (FEET NAVD)
WITH FLOODWAY (FEET NAVD)
INCREASE (FEET)
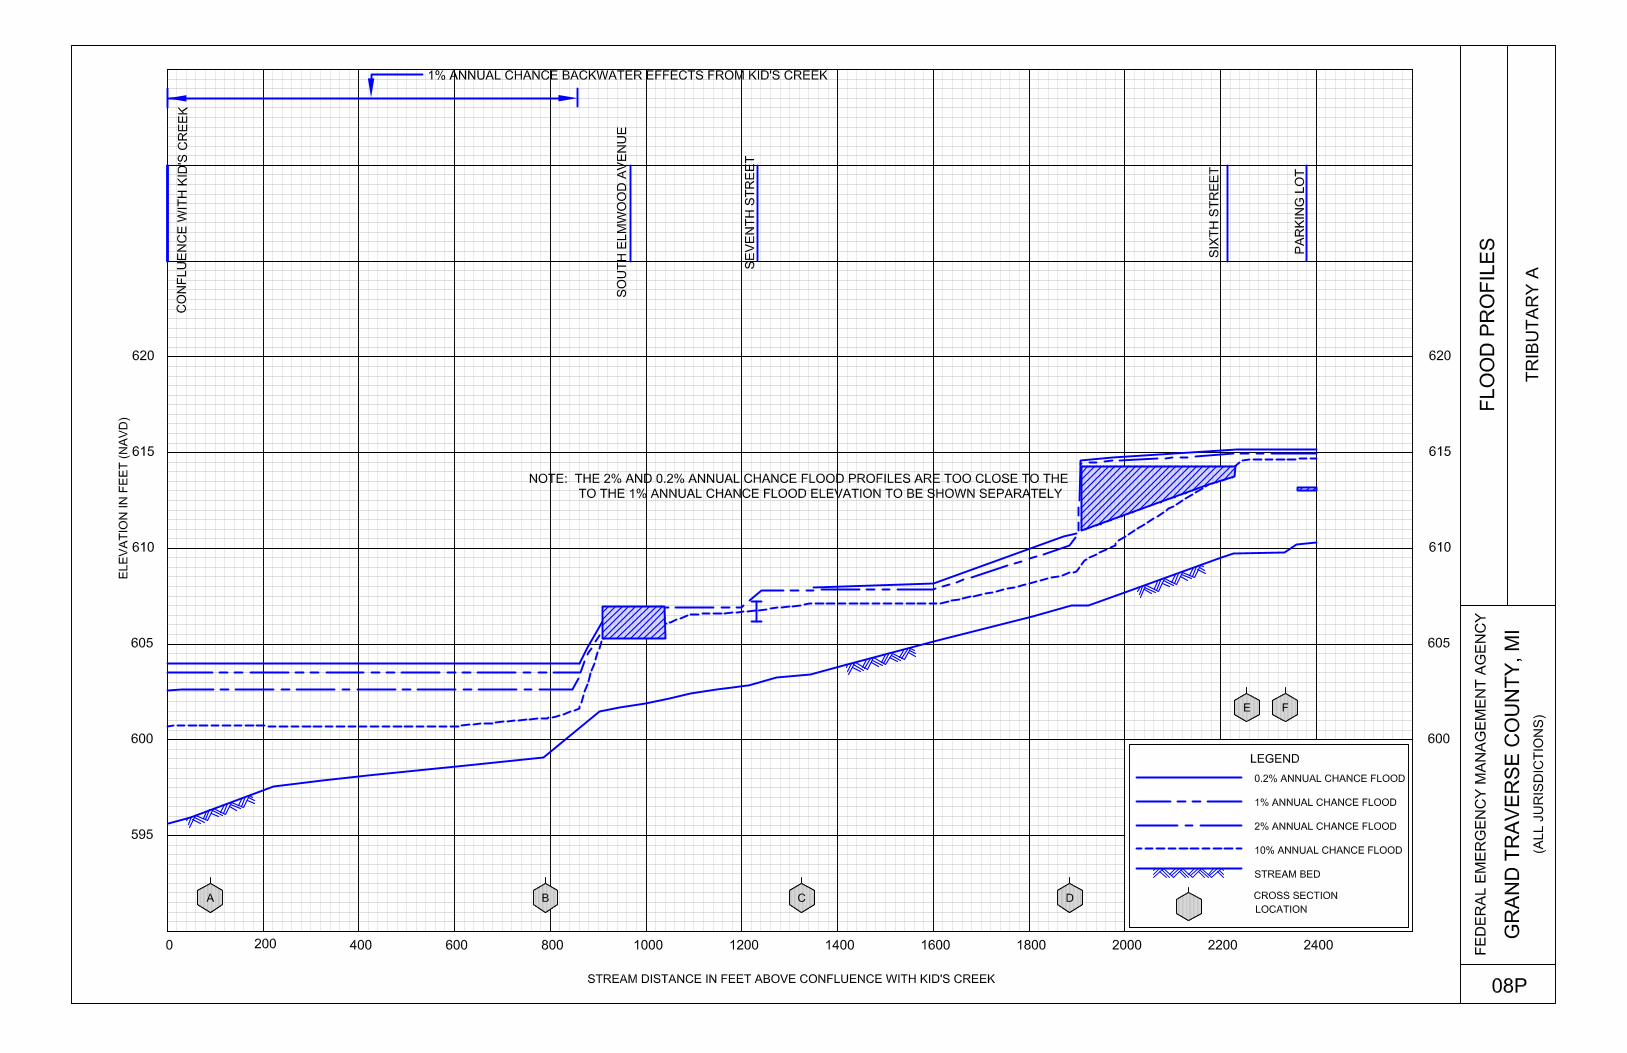
TRIBUTARY A
A
90
13
37
4.0
603.5
600.72
600.8
0.1
B 790 16 40 3.7 603.5 602.52
602.6 0.1
C 1,325 60 103 1.4 607.8 607.8 607.8 0.0
D 1,885 11 30 4.9 610.1 610.1 610.2 0.1
E 2,255 22 76 1.1 615.0 615.0 615.0 0.0
F 2,335 33 89 1.0 615.0 615.0 615.0 0.0
G 2,476 50 113 0.7 615.0 615.0 615.0 0.0
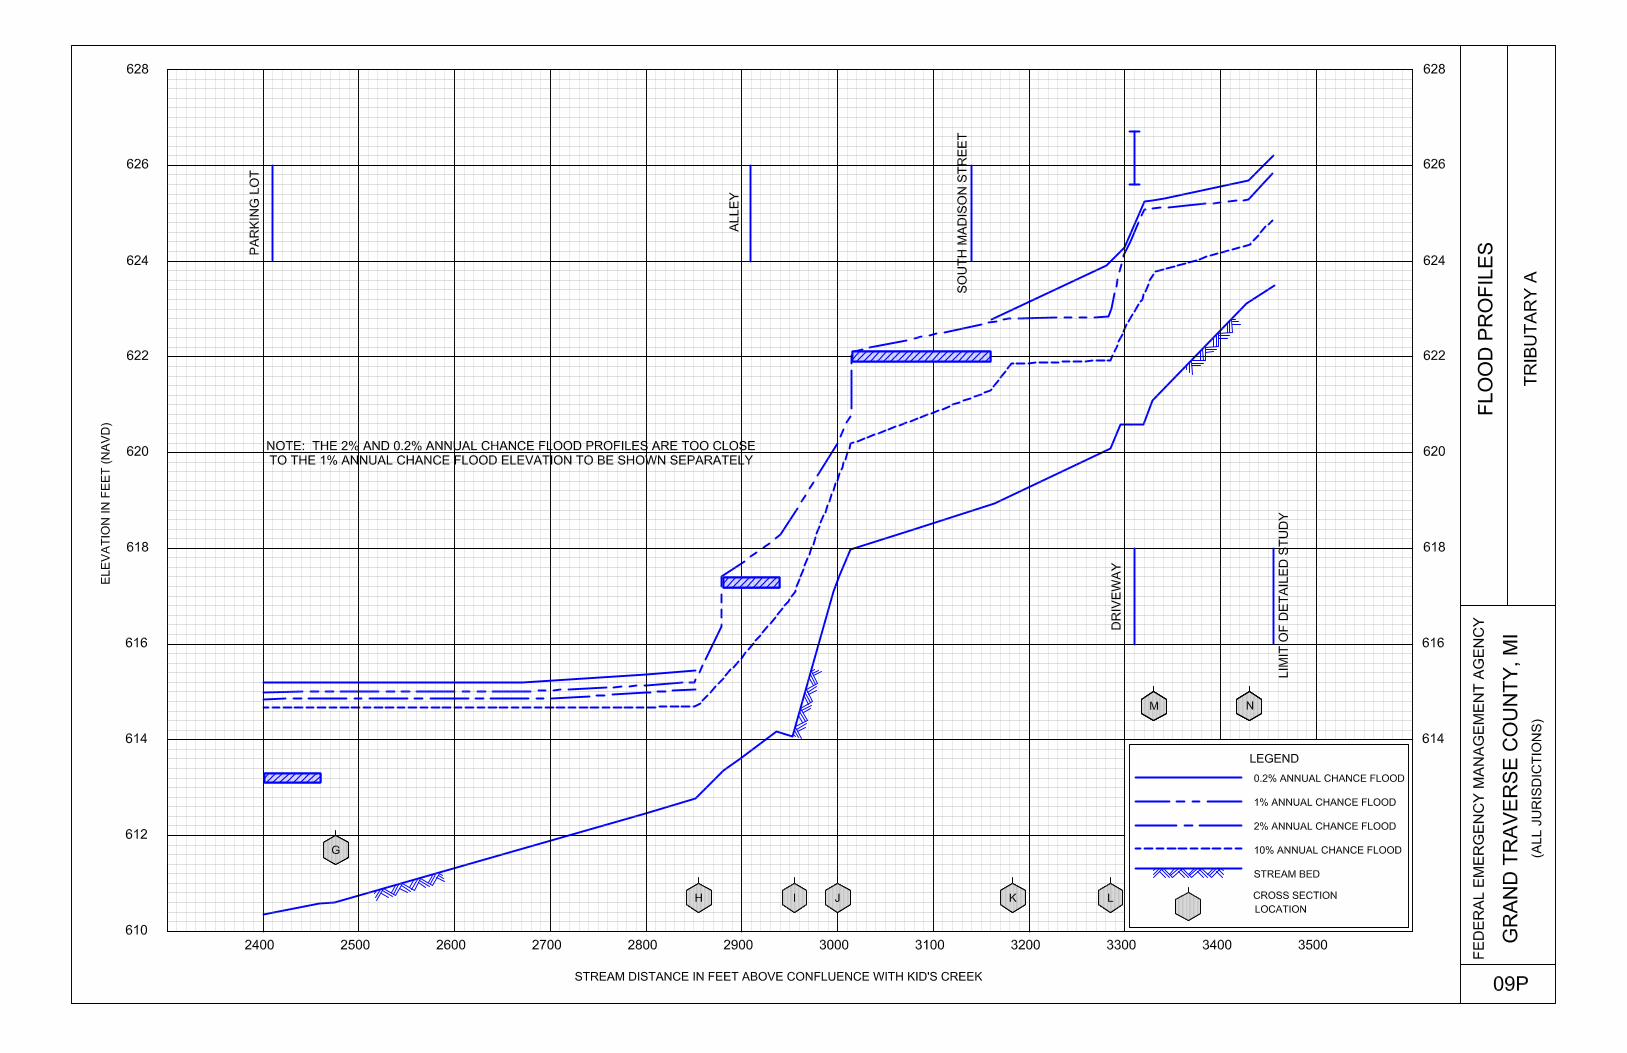
H 2,855 10 18 4.7 615.2 615.2 615.3 0.1
I 2,955 11 37 2.3 618.8 618.8 618.9 0.1
J 3,000 13 16 5.3 620.2 620.2 620.2 0.0
K 3,183 10 22 3.8 622.8 622.8 622.8 0.0
L 3,285 5 11 7.8 622.8 622.8 622.9 0.1
M 3,330 10 32 2.7 625.1 625.1 625.1 0.0
N 3,430 10 14 6.3 625.3 625.3 625.3 0.0
1 Feet above confluence with Kid’s Creek
2 Elevation computed without consideration of backwater effects from Kid’s Creek
TA
BL
E 4
FEDERAL EMERGENCY MANAGEMENT AGENCY
GRAND TRAVERSE COUNTY, MI (ALL JURISDICTIONS)
FLOODWAY DATA
TRIBUTARY A
21
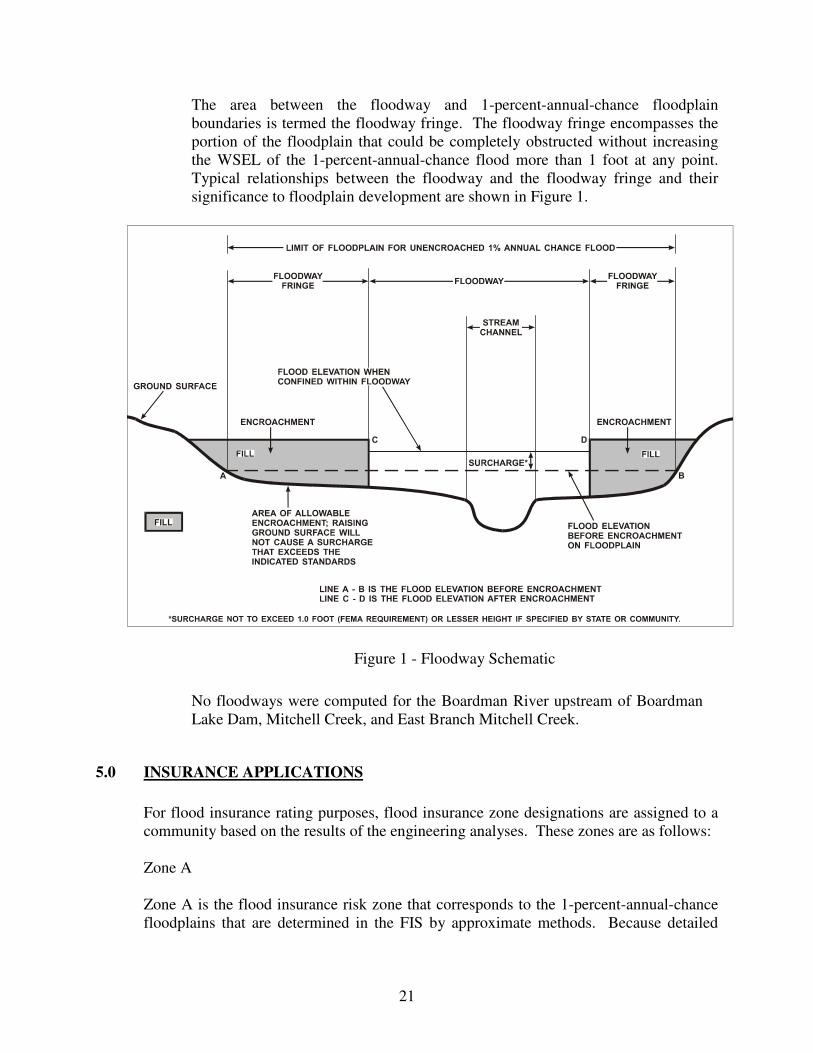
The area between the floodway and 1-percent-annual-chance floodplain
boundaries is termed the floodway fringe. The floodway fringe encompasses the
portion of the floodplain that could be completely obstructed without increasing
the WSEL of the 1-percent-annual-chance flood more than 1 foot at any point.
Typical relationships between the floodway and the floodway fringe and their
significance to floodplain development are shown in Figure 1.
Figure 1 - Floodway Schematic
No floodways were computed for the Boardman River upstream of Boardman
Lake Dam, Mitchell Creek, and East Branch Mitchell Creek.
5.0 INSURANCE APPLICATIONS
For flood insurance rating purposes, flood insurance zone designations are assigned to a
community based on the results of the engineering analyses. These zones are as follows:
Zone A
Zone A is the flood insurance risk zone that corresponds to the 1-percent-annual-chance
floodplains that are determined in the FIS by approximate methods. Because detailed
22
hydraulic analyses are not performed for such areas, no BFEs or base flood depths are
shown within this zone.
Zone AE
Zone AE is the flood insurance risk zone that corresponds to the 1-percent-annual-chance
floodplains that are determined in the FIS by detailed methods. In most instances, whole-
foot BFEs derived from the detailed hydraulic analyses are shown at selected intervals
within this zone.
Zone X
Zone X is the flood insurance risk zone that corresponds to areas outside the 0.2-percent-
annual-chance floodplain, areas within the 0.2-percent-annual-chance floodplain, areas of
1-percent-annual-chance flooding where average depths are less than 1 foot, areas of
1-percent-annual-chance flooding where the contributing drainage area is less than 1
square mile, and areas protected from the 1-percent-annual-chance flood by levees. No
BFEs or base flood depths are shown within this zone.
6.0 FLOOD INSURANCE RATE MAP
The FIRM is designed for flood insurance and floodplain management applications.
For flood insurance applications, the map designates flood insurance risk zones as
described in Section 5.0 and, in the 1-percent-annual-chance floodplains that were
studied by detailed methods, shows selected whole-foot BFEs or average depths.
Insurance agents use the zones and BFEs in conjunction with information on structures
and their contents to assign premium rates for flood insurance policies.
For floodplain management applications, the map shows by tints, screens, and symbols,
the 1- and 0.2-percent-annual-chance floodplains, floodways, and the locations of
selected cross sections used in the hydraulic analyses and floodway computations.
The countywide FIRM presents flooding information for the entire geographic area of
Grand Traverse County. Previously, FIRMs were prepared for each incorporated
community and the unincorporated areas of the County identified as flood-prone.
Historical data relating to the maps prepared for each community are presented in
Table 5.
7.0 OTHER STUDIES
This report either supersedes or is compatible with all previous studies on streams studied
in this report and should be considered authoritative for purposes of the NFIP.

COMMUNITY NAME
INITIAL IDENTIFICATION
FLOOD HAZARD BOUNDARY MAP REVISION DATE
FIRM EFFECTIVE DATE
FIRM REVISION DATE
Acme, Township of To Be Determined None To Be Determined None
Blair, Township of To Be Determined None To Be Determined None
East Bay, Charter Township of To Be Determined None To Be Determined None
*Fife Lake, Township of N/A None N/A None
*Fife Lake, Village of N/A None N/A None
Garfield, Charter Township of To Be Determined None To Be Determined None
*Grant, Township of N/A None N/A None
Green Lake, Township of To Be Determined None To Be Determined None
Kingsley, Township of To Be Determined None To Be Determined None
Long Lake, Township of September 30, 1988 None September 30, 1988 None
*Mayfield, Township of N/A None N/A None
Paradise, Township of May 4, 1992 None May 4, 1992 None
Peninsula, Township of To Be Determined None To Be Determined None
*No special flood hazard areas identified
TA
BL
E 5
FEDERAL EMERGENCY MANAGEMENT AGENCY
GRAND TRAVERSE COUNTY, MI
(ALL JURISDICTIONS)
COMMUNITY MAP HISTORY

23
Table 5 - Community Map History
COMMUNITY NAME
INITIAL IDENTIFICATION
FLOOD HAZARD BOUNDARY MAP REVISION DATE
FIRM EFFECTIVE DATE
FIRM REVISION DATE
Traverse City, City of May 24, 1974 November 14, 1975 December 15, 1982 None
Union, Township of September 30, 1988 None September 30, 1988 None
Whitewater, Township of September 30, 1988 None September 30, 1988 None
TA
BL
E 5
FEDERAL EMERGENCY MANAGEMENT AGENCY
GRAND TRAVERSE COUNTY, MI
(ALL JURISDICTIONS)
COMMUNITY MAP HISTORY
25
8.0 LOCATION OF DATA
Information concerning the pertinent data used in the preparation of this study can be
obtained by contacting FEMA, Federal Insurance and Mitigation Division, 536 South
Clark Street, Sixth Floor, Chicago, Illinois 60605.
9.0 BIBLIOGRAPHY AND REFERENCES
Federal Emergency Management Agency, Flood Insurance Study, City of Traverse
City, Grand Traverse County, Michigan, Flood Insurance Study Report, June 15, 1982;
Flood Insurance Rate Map, December 15, 1982.
Holtschlang, D.J., and Croskey, H.M., Water Resources Investigation Report 83-4194,
Estimating Generalized Flood Skew Coefficients for Michigan, U.S. Geological
Survey, U.S. Department of the Interior, prepared jointly with Michigan Department of
Natural Resources, Water Management Division, Lansing, Michigan, 1983.
Holtschlang, D.J., and Croskey, H.M., Water-Resources Investigation Report 84-4207,
Statistical Models for Estimating Flow Characteristics of Michigan Streams, U.S.
Geological Survey, U.S. Department of the Interior, 1984.
Hydrologic Engineering Center, HEC-2 Water Surface Profiles, U.S. Army Corps of
Engineers, Davis, California, December 1968.
Hydrologic Engineering Center, HEC-RAS River Analysis System, Version 3.1.3, U.S.
Army Corps of Engineers, Davis, California, May 2005.
Hydrologic Engineering Center, HEC-RAS River Analysis System, Version 4.0.0, U.S.
Army Corps of Engineers, Davis, California, March 2008.
Ippen, A.T., Estuary and Coastline Hydrodynamics, Engineering Societies
Nomographs Committee, New York, 1966.
Joint Airborne LiDAR Bathymetry Technical Center of Expertise, 2007 U.S. Army
Corps of Engineers National Coastal Mapping Program: Lake Michigan Topo/Bathy
LiDAR, Remote sensing image, June 17, 2009.
National Geodetic Survey, VERTCON-North America Vertical Datum Conversion
Utility, Retreived November 2008, from http://www.ngs.noaa.gov.
Soil Conservation Service, Technical Release No. 20, Computer Program for Project
Formulation-Hydrology, U.S. Department of Agriculture, May 1965.

26
Soil Conservation Service, National Engineering Handbook, Section 4, Hydrology,
U.S. Department of Agriculture, 1964. Revised 1972.
Soil Conservation Service, in cooperation with Grand Traverse Soil Conservation
District, Kid’s Creek Watershed Land and Water Resource Inventory Evaluation, U.S.
Department of Agriculture, 1973.
Soil Conservation Service, Technical Release No. 61, WSP2 Computer Program, U.S.
Department of Agriculture, May 1976.
Soil Conservation Service, Flood Hazard Study – Mitchell Creek, Grand Traverse
County, Michigan, U.S. Department of Agriculture, November 1981.
Soil Conservation Service, Technical Release 55, Urban Hydrology for Small
Watersheds, U.S. Department of Agriculture, June 1986.
Sorrell, Richard C., Computing Flood Discharges for Small Ungaged Watersheds,
Michigan Department of Environmental Quality, Land and Water Management
Division, June 2008.
State of Michigan, Act 25, Public Acts of 1929, as amended by Act 167, Public Acts of
1968.
Traverse Bay Regional Planning Commission, Topographic Mapping of Traverse City,
SW ¼ of Section 3, Township of Garfield; SW ¼ of Section 10, Township of Garfield;
NW ¼ of Section 10, Township of Garfield; Scale 1:1,200, Contour Interval two feet:
photography-November 1975, mapping-January 1980, prepared by Clyde E Williams
associates, South Bend, Indiana, supplied 1980.
U.S. Army Coastal Engineering Research Center, Shore Protection Manual, Volume I,
1977.
U.S. Army Corps of Engineers, Statistical Methods in Hydrology, Leo R. Beard,
revised edition, Sacramento, California, January 1962.
U.S. Army Corps of Engineers, Detroit District, Report on Great Lakes Open-Coast
Flood Levees, February 1977.
U.S. Army Corps of Engineers, Detroit District, Flood Levels Report on Grand
Traverse Bay and Little Traverse Bay, April 1990.
U.S. Army Corps of Engineers, Detroit District, Boardman River Hydraulic Model
Report, Detroit, Michigan, April 2008.
U.S. Army Corps of Engineers, Detroit District, Boardman River Watershed LiDAR,
EagleScan Remote Sensing, April 2000.
27
U.S. Census Bureau, American Fact Finder, Grand Traverse County, Michigan, 2009.
Retrieved March 4, 2011, from http://www.quickfacts.census.gov.
U.S. Department of Agriculture, Soil Conservation Service, Engineering Division,
Technical Release No. 20, Central Technical Unit, May 1965.
U.S. Geological Survey, 7.5-Minute Series Topographic Maps, Scale 1:62,500,
Contour Interval 20 feet: Traverse City, Michigan and Kingsley, Michigan, U.S.
Department of the Interior, 1956.
U.S. Geological Survey, Water Supply Paper 1677, Magnitude and Frequency of
Floods in the United States, Part 4, St. Lawrence River Basin, 1965.
U.S. Geological Survey, 7.5-Minute Series Topographic Maps, Scale 1:25,000,
Contour Interval 3 meters: Grawn, 1983; Kingsley, 1983; Mayfield, 1983; South
Boardman, 1985; Torch River, 1983; Walton, 1985; Williamsburg, 1983, Michigan,
U.S. Department of the Interior, various dates(a).
U.S. Geological Survey, 7.5-Minute Series Topographic Maps, Scale 1:25,000,
Contour Interval 5 meters: Lake Ann, Michigan, U.S. Department of the Interior,
1983.
Water Resources Council, Hydrology Committee, Guidelines for Determining Flood
Flow Frequencies, Bulletin #17B, U.S. Department of the Interior, September 1981,
Editorial Corrections March 1982.
Weatherbase, Historical Weather for Iron Mountain, Michigan. Retrieved March 4,
2011, from www.weatherbase.com.