ORIGINAL PAPER
An analysis of sequence variability in eight genes putativelyinvolved in drought response in sunflower (Helianthus annuus L.)
T. Giordani • M. Buti • L. Natali • C. Pugliesi •
F. Cattonaro • M. Morgante • A. Cavallini
Received: 1 July 2010 / Accepted: 29 November 2010 / Published online: 24 December 2010
� Springer-Verlag 2010
Abstract With the aim to study variability in genes
involved in ecological adaptations, we have analysed
sequence polymorphisms of eight unique genes putatively
involved in drought response by isolation and analysis
of allelic sequences in eight inbred lines of sunflower of
different origin and phenotypic characters and showing
different drought response in terms of leaf relative water
content (RWC). First, gene sequences were amplified by
PCR on genomic DNA from a highly inbred line and their
products were directly sequenced. In the absence of single
nucleotide polymorphisms, the gene was considered as
unique. Then, the same PCR reaction was performed on
genomic DNAs of eight inbred lines to isolate allelic
variants to be compared. The eight selected genes encode a
dehydrin, a heat shock protein, a non-specific lipid transfer
protein, a z-carotene desaturase, a drought-responsive-ele-
ment-binding protein, a NAC-domain transcription regu-
lator, an auxin-binding protein, and an ABA responsive-C5
protein. Nucleotide diversity per synonymous and non-
synonymous sites was calculated for each gene sequence.
The pa/ps ratio range was usually very low, indicating
strong purifying selection, though with locus-to-locus dif-
ferences. As far as non-coding regions, the intron showed a
larger variability than the other regions only in the case of
the dehydrin gene. In the other genes tested, in which one
or more introns occur, variability in the introns was similar
or even lower than in the other regions. On the contrary,
30-UTRs were usually more variable than the coding regions.
Linkage disequilibrium in the selected genes decayed on
average within 1,000 bp, with large variation among genes.
A pairwise comparison between genetic distances calculated
on the eight genes and the difference in RWC showed a
significant correlation in the first phases of drought stress.
The results are discussed in relation to the function of ana-
lysed genes, i.e. involved in gene regulation and signal
transduction, or encoding enzymes and defence proteins.
Introduction
A major goal of population and quantitative genetics is to
identify the polymorphisms underlying phenotypic varia-
tion, particularly in traits that are important for ecological
adaptations (Feder and Mitchell-Olds 2003; Stinchcombe
and Hoekstra 2008). While the accumulation of functional
genomics data over the last decades has provided detailed
information on the genetic basis of many of such traits in a
number of model organisms, genetic variation in non-
model species remains largely unknown.
Among traits that are important for ecological adapta-
tions, drought tolerance in plants is a multigenic trait, i.e.
many genes are involved in drought response (Shinozaki
and Yamaguchi-Shinozaki 2007). As for other stresses,
gene products involved in the response may be classified
into two groups: having a direct role in stress protection, or
regulating gene expression and signal transduction during
Communicated by A. Berville.
T. Giordani � M. Buti � L. Natali � C. Pugliesi �A. Cavallini (&)
Genetics Section, Department of Crop Plant Biology,
University of Pisa, Pisa, Italy
e-mail: [email protected]
F. Cattonaro � M. Morgante
Istituto di Genomica Applicata, Parco Scientifico
e Tecnologico Luigi Danieli, Udine, Italy
M. Morgante
Department of Crop and Environmental Sciences,
University of Udine, Udine, Italy
123
Theor Appl Genet (2011) 122:1039–1049
DOI 10.1007/s00122-010-1509-0

stress response (Kasuga et al. 1999). The former group
includes proteins that protect cellular structures during
dehydration, as dehydrins, chaperonins, enzymes for osm-
olites synthesis (sugars, proline, organic acids) and detox-
ifying enzymes; the latter includes transcription factors and
kinases (Shinozaki and Yamaguchi-Shinozaki 2007).
Genetic analyses of drought response are especially
referred to induced variation in the transcriptome. In the
sunflower (Helianthus annuus L.), a cDNA microarray
containing about 800 clones covering major metabolic and
signal transduction pathways allowed to identify many
differentially expressed genes in leaves and embryos of
drought-tolerant and -sensitive genotypes subjected to
water-deficit under field conditions (Roche et al. 2007).
The majority of the cDNA clones differentially expressed
under water stress was found to display opposite gene
expression profiles in a drought-tolerant genotype when
compared with a drought-sensitive one. These dissimilari-
ties suggest that the difference between tolerant and non-
tolerant plants is mainly associated with changes in mRNA
expression. However, it is to be recalled that phenotypic
variation resides also on changes in allelic sequences that
can affect the efficiency of the encoded proteins. Hence,
sequence variability of stress-related genes can modulate
the stress response within a species.
Despite the importance of genes related to abiotic stress
in environmental adaptation, studies on DNA sequence
polymorphism of such genes within a plant species are rare.
The most apparent difficulty in studying genetic variability
in stress-related genes is that most of such genes belong to
multigenic families and this can lead to errors in compar-
isons, for example, non-orthologous loci can be incorrectly
compared. This difficulty can be overcome if the gene is in
a unique copy in the genome, or, at least, if a gene-specific
primer pair used for PCR-amplification amplifies a unique
sequence. This can be determined by PCR-amplification on
genomic DNA from a completely homozygous plant (for
example an highly inbred line) and subsequent direct
sequencing of the amplicon: if no SNPs occur in the
ferogram, then the amplified product is unique and can be
compared to other allelic products from genomic DNAs of
other lines.
Some unique or low copies drought stress-related
genes have been described in the sunflower. In the group of
genes whose product is directly involved in the defence, a
dehydrin-encoding gene, HaDhn1 (Ouvrard et al. 1996), was
proved to be in a unique copy and its sequence variability
has been already analysed (Natali et al. 2003; Giordani
et al. 2003). Many studies indicate that dehydrins are
associated with macromolecules such as nucleoprotein and
endomembranes, suggesting that these proteins are sur-
factants that inhibit the coagulation of a range of macro-
molecules and preserve their structural integrity, stabilizing
proteins and membranes (Close 1996). Dehydrins are
usually produced following any environmental stimulus
involving dehydration, such as drought or cold stress and
salinity, as key components of dehydration tolerance (Zhu
et al. 2000).
Another sunflower putative single-copy gene, whose
product interacts with biological macromolecules during
stress response, encodes a heat shock protein (HSP). HSPs
are usually produced in response to heat stress, however,
they can also be induced by other stress and even consti-
tutively expressed (Carranco et al. 1997). The gene
HSP17.6 was isolated by Almoguera and Jordano (1992)
and was shown to be unique by Southern blot
hybridization.
Other genes whose product is involved directly in the
stress response encode enzymes and proteins related to
lipid metabolism. Lipid modifications are apparently
involved in the response to many stresses (Navari-Izzo
et al. 1993). Recently, the hypothesis that lipid transfer
proteins can have a role, or at least be involved, in plant
defence signalling emerged (De Oliveira Carvalho and
Moreira Gomes 2007). In the sunflower, a gene encoding a
lipid transfer protein (Ouvrard et al. 1996) and another
encoding a z-carotene desaturase (Conti et al. 2004) were
reported as single-copy genes.
Stress-related genes belonging to the class of genes
whose products are involved in gene regulation and hor-
monal signalling have been described in the sunflower. For
example the NAC-1 gene (Liu and Baird 2003) belongs to
the NAC family of transcription regulators involved in
morphogenesis and stress response (Ooka et al. 2003). Also
drought-responsive-element-binding (DREB) protein
encoding genes are transcription factors, which bind DRE
cis-elements on the proximal promoter of drought-respon-
sive genes (Shinozaki and Yamaguchi-Shinozaki 2007).
Though many genes encode DRE-binding proteins, in
sunflower the DREB2 gene was proved to be unique (Diaz-
Martin et al. 2005).
Also a gene encoding an auxin-binding protein (ABP1)
was suggested to be unique in the sunflower genome
(GenBank acc. number AF450281). ABP1 is involved in
the auxin transport within the cell and is considered to be a
candidate auxin receptor, triggering early modification of
ion fluxes across the plasma membrane in response to
auxin (David et al. 2007).
Finally, an ABA-responsive-C5 (ABAC5) encoding
gene was reported to be in two copies in the sunflower
genome (Liu and Baird 2004). ABAC5 is involved in
abscisic acid-mediated drought response and probably has
a nuclear localization (Liu and Baird 2004).
In the sunflower, intraspecific genetic polymorphism has
been studied by analyses of allozymes (Rieseberg and
Seiler 1990; Cronn et al. 1997), SSR (Tang and Knapp
1040 Theor Appl Genet (2011) 122:1039–1049
123

2003; Harter et al. 2004; Burke et al. 2005), retrotranspo-
son-based molecular markers (Vukich et al. 2009). In
recent years, a number of studies have reported on
sequence diversity of coding genes (Natali et al. 2003;
Kolkman et al. 2004; Hass et al. 2006; Schuppert et al.
2006; Tang et al. 2006; Liu and Burke 2006). While var-
iability in wild H. annuus is comparable to that of other
outcrossing species, gene diversity is strongly reduced (by
40–50%) in sunflower cultivars, that have lost the sporo-
phytic self-incompatibility typical of the genus Helianthus,
and are easily self-pollinated (Liu and Burke 2006).
In this paper, we report on the sequence variability of
eight genes, involved in drought response and described
above, in eight inbred lines of sunflower of different origin
and showing different drought response, by isolation and
analysis of allelic sequences.
Materials and methods
Plant materials and DNA isolation
The inbred lines used for this study were selfed for at least
12 generations and collected at the Department of Crop
Plant Biology. Inbred lines were selected showing vari-
ability for different morphological characters and origi-
nating from different countries (Table 1).
Seeds were germinated in Petri dishes on distilled water
and, after 3 days, were transferred to 8 cm diameter pots
(about 2.0 9 10-4 m3 volume) containing a mixture of
soil and sand plus an initial dose of complete fertilizer
(Osmocote 14-14-14, Sierra Ltd, UK). Leaflets were col-
lected from one plantlet for each genotype. DNA was
extracted from leaf tissues according to the method devised
by Doyle and Doyle (1989) with minor modifications
(Giordani et al. 1999).
For analyses of drought response, plantlets were grown
in a growth chamber at 23�C, 0.7 kPa vapour pressure
deficit (VPD). A 16-h photoperiod was provided by mer-
cury lamps (Osram HQI-TS 250W/NDN, Wembley, UK)
with intensity of 200 lmol m-2 s-1. Plants were watered
to pot capacity twice daily.
Leaf discs (1.5 diameter) punched from expanded leaves
(3rd node) of 4-week-old plants were used for relative
water content (RWC) measurements. Leaf discs were
placed on a bench at 23�C, 0.7 kPa VPD, under light
(200 lmol m-2 s-1), with the abaxial surfaces uppermost
and allowed to dehydrate for 2 h. Measurements were
performed every 30 min, using five leaf discs punched
from different plants for each genotype. RWC was calcu-
lated according to the equation RWC = 100 9 (FW -
DW)/(TW - DW), where FW is fresh weight, DW is dry
weight and TW is turgid weight. TW was determined after
floating discs on distilled water for 24 h at 4�C, in the dark;
DW was measured after oven-drying for 48 h at 75�C.
RWC measurements were subjected to one-way ANOVA.
Gene amplification and sequencing
DNA sequences allelic to eight genes of sunflower were
isolated by PCR on genomic DNAs obtained from the dif-
ferent genotypes. To verify that the genes are in single copy
in the sunflower genome, gene sequences were amplified by
PCR on genomic DNA from a highly (18 generation of sel-
fing) inbred line. PCR was performed using oligonucleotides
designed on the published DNA sequences of sunflower and
reported in Table 2. PCR products were directly sequenced.
In the absence of single nucleotide polymorphisms, the gene
was considered as unique. Then, sequences were amplified
from all inbred lines, using 100 ng of genomic DNA as a
template; thermocycling was performed at 94�C for 4 min
(denaturation), followed by 30 amplification cycles at 94�C
Table 1 Sunflower (Helianthus annuus L.) inbred lines used for analysis and their characteristics
Accession
name (and
code)
Country
of origin
Pigmentation
of achene
wall
Apical
branching
Corolla
colour of
disc and ray
flowers
Stem
height
(cm)
Onset of
flowering
(day)
Anther
colour
1,000 seed
weight (g)
RWC in punched leaf discs
0 (min) 30 (min) 60 (min) 120 (min)
R (R) Spain Black Yes Yellow 160 67 Black 66.60 87.4 69.6 56.1 43.5
R857 (R8) USA Black striate Yes Yellow 160 67 Black 78.91 78.7 63.8 53.4 43.6
C1 (C1) Romania Black striate No Yellow 100 60 Yellow 54.56 89.2 73.6 60.3 44.5
GB2112
(GB)
Russia White Yes Yellow 190 75 Black 53.88 91.8 70.6 57.8 37.2
EF2 (EF) France Black striate No Lemon 150 55 Black 54.49 84.7 65.4 58.2 43.0
D8 (D) Italy Black No Yellow 180 75 Black 92.31 85.3 68.8 61.5 44.6
L72 (L7) Serbia Black striate No Yellow 140 70 Black 85.54 88.3 71.6 61.9 46.9
GIOC
(GI)
Romania Black striate No Yellow 120 60 Yellow 83.53 92.5 70.6 62.7 49.0
Theor Appl Genet (2011) 122:1039–1049 1041
123
for 30 s, 60�C for 30 s and 72�C for 60 s, and a final
extension reaction at 72�C for 7 min, using Taq-DNA
polymerase (Promega, Madison, WI, USA). For each PCR-
amplified product, two independent DNA isolations from
each inbred line were used.
The amplified fragments were purified and directly
sequenced by the dideoxy chain termination method using the
PRISM dye terminator cycle sequencing kit (Perkin-Elmer,
Foster City, CA, USA) according to the manufacturer’s ins-
tructions; sequences were analysed using the SEQUENCING
ANALYSIS 2.1.2 (Perkin-Elmer) and SEQUENCHER 3.0
analysis programs (Gene Codes Corporation).
Sequence analysis
Whenever possible, the DNA sequences were subdivided
into exons, introns, and UTR. Intron delimitation within
genomic sequences was carried out by comparing the
genomic sequences with the published cDNAs and con-
firmed using the program FEX (Baylor College of Medi-
cine, Houston, TX, USA).
Sequences were aligned using CLUSTAL W (Thompson
et al. 1994). Some adjustments were made by eye. Statistics of
intraspecific polymorphism within H. annuus were performed
using the DnaSP program version 3.51 (Rozas and Rozas
1999). p, (nucleotide diversity, i.e. the average number of
nucleotide differences per site, Nei 1987) and h (the number of
segregating sites, Watterson 1975), and their sampling vari-
ances were calculated. Numbers of synonymous and non-
synonymous substitutions per site were estimated for coding
nucleotide sequences using the DnaSP program as above,
according to the method of Nei and Gojobori (1986). Align-
ment gaps were excluded from comparisons. The p and h
values were compared by the Tajima’s D test (Tajima 1989)
implemented in DnaSP to test the neutrality of molecular
polymorphisms. This test asks the question of whether h and pare significantly different. Under the assumption of a beta
distribution, D has a mean of 0 and variance of 1; whether D is
significantly different from zero (the expectation if h = p)
was determined from the confidence intervals given in
Table 2 of Tajima (1989). To analyse the pattern of diversity
we applied the sliding window method with a window size of
100 bp and a step size of 25 bp.
Linkage disequilibrium (LD) was estimated using
squared allele–frequency correlations, R2 (Hill and Robert-
son 1968), for pairs of polymorphic sites. The Chi-square and
the Fisher’s exact test were used to determine whether the
associations between polymorphisms were significant. The
analyses were performed by applying DnaSP.
Relationships among DNA sequences from different
genotypes were investigated by the neighbour-joining (NJ)
method (distance algorithm after Kimura), using the
PHYLIP program package version 3.572 (Felsenstein
1989): with the SEQBOOT program, 1,000 versions of the
original alignment were generated; then, trees were gen-
erated using the DNADIST and NEIGHBOR programs.
A strict consensus tree was obtained from the available
trees using the CONSENSE program.
Isoelectric points of the deduced proteins were calculated
using the program Compute pI/Mw at the ExPASy server of
the Swiss Institute of Bioinformatics (Switzerland),
according to Wilkins et al. (1998). Hydrophobicity profiles
were constructed by the program ProtScale, at the ExPASy
server, according to amino acid scale values by Kyte and
Doolittle (1982), using a window size of nine amino acids,
with a 100% relative weight of the window edges compared
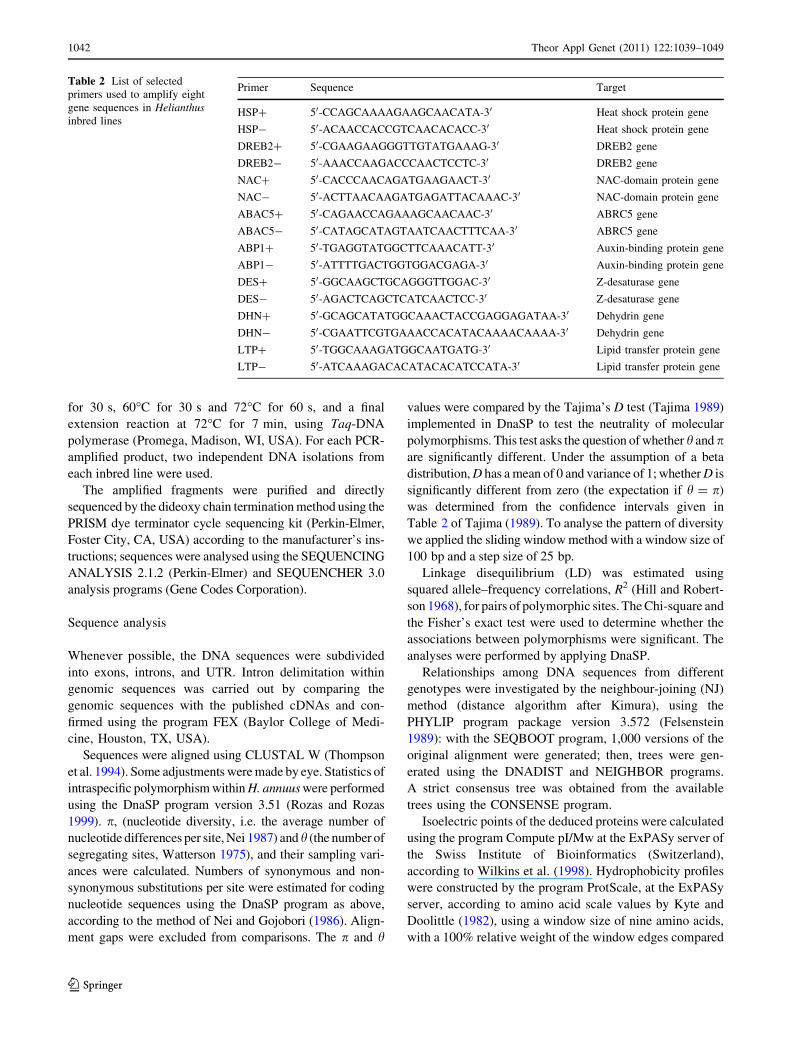
Table 2 List of selected
primers used to amplify eight
gene sequences in Helianthusinbred lines
Primer Sequence Target
HSP? 50-CCAGCAAAAGAAGCAACATA-30 Heat shock protein gene
HSP- 50-ACAACCACCGTCAACACACC-30 Heat shock protein gene
DREB2? 50-CGAAGAAGGGTTGTATGAAAG-30 DREB2 gene
DREB2- 50-AAACCAAGACCCAACTCCTC-30 DREB2 gene
NAC? 50-CACCCAACAGATGAAGAACT-30 NAC-domain protein gene
NAC- 50-ACTTAACAAGATGAGATTACAAAC-30 NAC-domain protein gene
ABAC5? 50-CAGAACCAGAAAGCAACAAC-30 ABRC5 gene
ABAC5- 50-CATAGCATAGTAATCAACTTTCAA-30 ABRC5 gene
ABP1? 50-TGAGGTATGGCTTCAAACATT-30 Auxin-binding protein gene
ABP1- 50-ATTTTGACTGGTGGACGAGA-30 Auxin-binding protein gene
DES? 50-GGCAAGCTGCAGGGTTGGAC-30 Z-desaturase gene
DES- 50-AGACTCAGCTCATCAACTCC-30 Z-desaturase gene
DHN? 50-GCAGCATATGGCAAACTACCGAGGAGATAA-30 Dehydrin gene
DHN- 50-CGAATTCGTGAAACCACATACAAAACAAAA-30 Dehydrin gene
LTP? 50-TGGCAAAGATGGCAATGATG-30 Lipid transfer protein gene
LTP- 50-ATCAAAGACACATACACATCCATA-30 Lipid transfer protein gene
1042 Theor Appl Genet (2011) 122:1039–1049
123
to the window centre. The predicted secondary structure of
deduced proteins (percentage of a-helix, extended strand and
random coil) was analysed using the program HNN at the
Pole BioInformatique Lyonnais server (Lyon, France).
Results
Drought response of inbred lines
Eight highly inbred lines of sunflower were chosen
according to the occurrence of phenotypic variability for
different characters (pigmentation of achene wall, presence
of apical branching, corolla colour, stem height, onset of
flowering, anther colour, seed weight) and to their geo-
graphical origin from different countries (in which the
sunflower is a major crop) (Table 1).
Drought response in the eight selected lines was evalu-
ated by measuring RWC in leaf discs punched from
expanded leaves of 4-week-old plants and analysed after 0,
30, 60, and 120 min (Table 1). ANOVA was then per-
formed for each treatment time and is reported in Table 3.
It is apparent that the selected inbred lines show different
RWC in both control and drought stress. Some RWC
variability is observed also within genotypes, especially in
the control and in the first 30 min of drought stress.
Gene amplification and sequencing
Sequences homologous to eight putative single-copy genes of
H. annuus were isolated by PCR from genomic DNA of eight
sunflower inbred homozygous lines. The primers used to
isolate the sequences in the present investigation were
designed to obtain one specific DNA fragment by PCR: after
amplification and direct sequencing of the PCR products,
analysis of the ferograms allowed to exclude the occurrence of
SNPs, showing that selected primers amplified from a single
locus and that the eight lines were homozygous at all selected
loci, i.e. no heterozygous plants were found. All isolated
sequences are deposited in the GenBank database (accession
numbers FR670619-26, FR671160-99, and FR671350-65).
Sequence lengths varied from 489 to 1,012 bp and 7 out of 8
gene regions included both coding and non-coding (intron
and/or UTR) domains. On the whole we were able to analyse
5,268 bp of aligned sequences per genotype.
DNA sequence diversity analysis
The nucleotide diversity (p), i.e. the average number of
nucleotide differences per site (Nei 1987) and Theta (h),
i.e. the number of segregating sites, for each gene are
reported in Table 4, calculated excluding sites subjected to
insertions or deletions.
Table 3 One-way ANOVA for leaf RWC in eight sunflower genotypes measured in punched leaf discs after 0 (control), 30, 60, and 120 min
Drought time (min) ANOVA
Source of variation SS DF MS F P
0 Between genotypes 680.8 7 97.26 20.74 \0.0001***
Within genotypes 110.5 4 27.62 5.89 0.0014**
Residual 131.3 28 4.69
Total 922.6 39
30 Between genotypes 365.7 7 52.24 6.61 0.0001***
Within genotypes 212.4 4 53.11 6.71 0.0006***
Residual 221.5 28 7.91
Total 799.6 39
60 Between genotypes 437.8 7 62.54 3.61 0.0067**
Within genotypes 22.29 4 5.57 0.32 0.8608 ns
Residual 484.6 28 17.31
Total 944.6 39
120 Between genotypes 624.3 7 89.18 3.55 0.0074**
Within genotypes 3.62 4 0.90 0.04 0.9974ns
Residual 703.6 28 25.13
Total 1,331.5 39
For each experimental point, five independent samples were used
ns Non significant
**Significant at P \ 0.01
***Significant at P \ 0.001
Theor Appl Genet (2011) 122:1039–1049 1043
123
Within the 8 sunflower lines studied, we detected 154
polymorphic sites (Table 4), excluding indels, and an
average polymorphism density of one polymorphic site per
34 bp. This value is very similar to that found for other
nine genes of sunflower (1 SNP/38.8 bp) (Liu and Burke
2006). Forty-four of the 154 single nucleotide polymor-
phisms (28.6%, Table 5) caused a change in the amino acid
composition.
In the sunflower genes tested, p and h values ranged
from 0.00268 and 0.00301 (for ABP1) to 0.03315 and
0.03247 (for LTP), respectively. These values were not
significantly different at Tajima’s D test (Table 4).
The results of Tajima’s tests for all genes suggest no
significant difference between p and h and thus, by this
criterion, the data are consistent with neutral theory
(Moriyama and Powell 1996; Haseneyer et al. 2008).
However, four out of eight genes (DREB, ABA-C5, DHN,
and DES) exhibit a h value larger than p, producing a
negative D. This is consistent with a pattern of there being
too many rare nucleotide polymorphisms with respect to
predictions of the neutral theory (Braverman et al. 1995).
Nucleotide diversity per synonymous and non-synony-
mous sites (ps and pa) were calculated for each gene
(Table 5). The pa/ps ratio range is very close to 0 for NAC,
ABA-C5, and HSP genes, indicating that diversity is lar-
gely governed by purifying selection, and close to 1 for
LTP. Surprisingly, the only two SNPs of ABP1 gene are
non-synonymous, suggesting that some portion of this gene
has been under positive selection, as already observed for a
sunflower glutathione peroxidase gene (Liu and Burke
2006).
Concerning insertions or deletions, single nucleotide
gaps in the coding regions were found only in the dehydrin
and the NAC-domain protein genes. In all cases, 3, 6, or 9
nucleotide insertions or deletions were observed, i.e. not
determining frame shifts. Larger frequencies of indels were
found in non-coding sequences.
Nucleotide diversity was also calculated along the DNA
sequences. Following alignment using the program
CLUSTAL W, a 50-bp window was moved along the
sequences in steps of 20 nucleotides. p was calculated in
each window, and the value was assigned to the nucleotide
at the midpoint of the window (Fig. 1); alignment gaps
were not considered in the length of the windows.
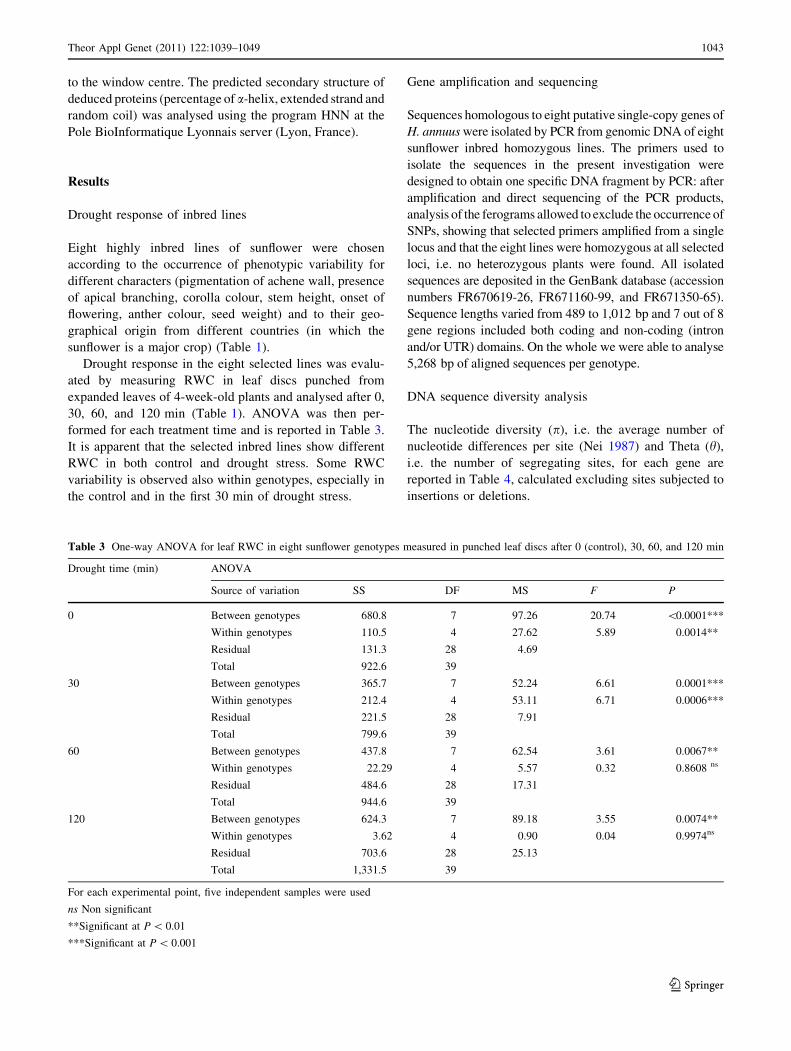
As far as non-coding regions, the intron showed larger
variability than the other regions only in the case of DHN,
Table 4 Summary of measures of nucleotide variability and Tajima’s D
Gene Nr. of
nucleotides
Nr. of sites
(excluding
sites
with gaps)
Nr. of
polymorphic
sites
Nucleotide diversity
(p) and sampling
SD (in brackets)
h and sampling
SD (in brackets)
Tajima’s D K (average
number
of nucleotide
differences)
NAC 632 598 12 0.00866 (0.00140) 0.00774 (0.00388) 0.59845 5.179
DREB 593 593 12 0.00596 (0.00245) 0.00780 (0.00391) -1.18759 3.536
ABA-C5 546 541 10 0.00647 (0.0000045) 0.00713 (0.00367) -0.45791 3.321
ABP1 640 640 4 0.00268 (0.0000005) 0.00241 (0.00150) 0.48523 1.714
DHN 1,012 982 39 0.01498 (0.00164) 0.01532 (0.00693) -0.11624 14.714
HSP 601 589 20 0.01498 (0.00248) 0.01310 (0.00620) 0.74780 8.821
LTP 489 487 38 0.03315 (0.00757) 0.03009 (0.01363) 0.54210 16.143
DES 755 749 19 0.00926 (0.00232) 0.00978 (0.00466) -0.28287 6.929
Table 5 Number of sites (excluding gaps and including stop codon), number of mutations, nucleotide diversity per site (p) from the total number
of mutations, for synonymous and non-synonymous sites, of eight gene sequences from eight inbred lines of H. annuus
Gene Number of sites
excluding gaps
Synonymous (and non-coding) sites Non-synonymous sites
Nr. of sites Nr. of mutations ps Nr. of sites Nr. of mutations pa
NAC 598 211.58 10 0.02060 383.42 1 0.00065
DREB 593 133.81 7 0.00735 457.19 6 0.00558
ABA-C5 541 323.67 10 0.01026 217.33 0 0.00000
ABP1 640 499.83 0 0.00000 137.17 2 0.00365
DHN 982 428.81 30 0.02615 552.19 9 0.00634
HSP 589 219.79 20 0.03510 367.21 2 0.00301
LTP 487 257.19 20 0.03499 229.81 18 0.03109
DES 749 427.98 13 0.01118 318.02 6 0.00596
1044 Theor Appl Genet (2011) 122:1039–1049
123
as already reported (Natali et al. 2003). In the other genes
in which one or more introns occur (NAC, ABP1, LTP, and
DES), variability in the introns is in the same range or even
lower than in the other regions. The other non-coding
regions analysed in this study, the 30-UTRs, are usually
more variable than the coding regions (Fig. 1). The only
exception was LTP, that revealed extremely variable in the
coding region.
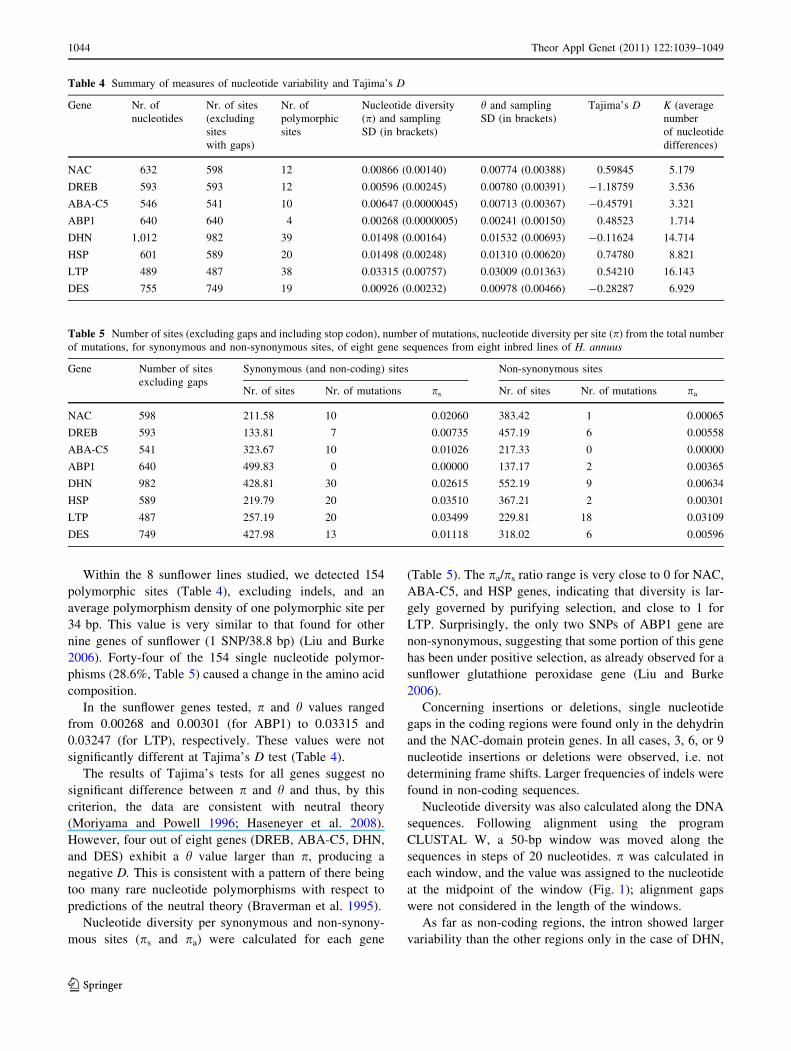
Overall genetic diversity of the eight genes tested is
reported in Fig. 2, keeping separated the four genes
encoding regulatory proteins (i.e. involved in expression
regulation or signalling cascade, NAC, ABA-C5, DREB,
ABP1) from the four genes encoding enzymes or defence
proteins: the latter group of genes shows a generally higher
diversity than the former.
Concerning LD, it was generally significant (mean
R2 [ 0.3) along all the sequenced genes of sunflower but
DHN (R2 = 0.204) (Table 6). A total of 266 and 471 pairs
of sites (among 1,820) revealed significant level of R2 with
Fisher’s exact test and Chi-square test, respectively
(Table 6). The remaining significant pairwise comparisons
yielded moderate LD values. Data from all the eight genes
Fig. 1 Graphic representation
of the pattern of change of
nucleotide diversity along eight
gene sequences from eight
inbred lines of sunflower.
Yellow boxes represent
30-UTRs, grey boxes represent
introns
Theor Appl Genet (2011) 122:1039–1049 1045
123
were pooled or distinguished between genes encoding
regulatory proteins and genes encoding proteins acting in
the cell metabolism. The plot of R2 values as a function of
the pairwise distance between polymorphic sites revealed
a decay of LD of the loci analysed within 1,000 bp (Fig. 3),
a value apparently lower than that observed analysing other
genes by Liu and Burke (2006). Such discrepancy can be
explained by large locus-to-locus variation occurring in the
genes examined in our experiments that ranges from 168 to
31,000 nucleotides (Table 6).
The observed nucleotide sequence variations determine
differences in biochemical and biophysical properties of
encoded proteins. Calculated isoelectric point, molecular
weight, and predicted secondary structure (percentage of
a-helix, extended strand and random coil) show differential
variability in different genes (data not shown) indicating
the occurrence of different evolutionary constraints on the
related proteins. It was observed that ‘‘regulatory’’ proteins
are generally less variable than ‘‘metabolism involved’’
ones, suggesting that the protein structure is especially
maintained in the former class.
Phylogenetic analysis and relationship between drought
response and sequence diversity
A NJ analysis of the eight inbred lines using the isolated
nucleotide sequences is reported in Fig. 4. All nodes are
strongly supported, confirming the occurrence of large
genetic variability among the selected lines. In other
analyses, phylogenetic relations were investigated for each
gene, and also using intron sequences, that are generally
considered as neutral. Large differences were observed
among dendrograms (data not shown) compared to the
dendrogram obtained combining all genes. These differ-
ences further suggest differential evolutionary constraints
among genes.
Pairwise comparisons between genetic distances calcu-
lated by NJ analyses and differences in RWC at different
times of drought stress are reported in Fig. 5. The corre-
lation resulted significant after 30 min of drought stress,
i.e. in the first phases of drought response.
Discussion
DNA sequences are usually distinguished into neutral
sequences (for example, non-coding, repeated DNA) and
showing evolutionary constraints. Changes in the latter
occur more rarely, with slower mutation rates, because
their function depends strictly on the protein (or the RNA)
that they encode. However, different mutation rates can be
found between different loci (Ogata et al. 1991) and even
within a locus (Ingvarsson et al. 2008).
Our data report on the occurrence of sequence vari-
ability among eight genes putatively involved in stress
response. Although differences among genes are in some
cases not statistically significant, many parameters, as
differences between p and h, LD values, putatively
Fig. 2 Overall nucleotide diversity of eight gene sequences from
eight inbred lines of sunflower. The four genes encoding regulatory
proteins (on the right) are separated from the four genes encoding
enzymes or defence proteins (on the left)
Table 6 Analysis of LD in eight gene sequences of H. annuus
Gene Nr. of sites Nr. of polymorphic
sites analysed
Nr. of pairwise
comparisons
Fa v2b Mean R2 ntc
NAC 632 12 66 11 25 0.387 31,000
DREB 593 11 55 0 29 0.556 710
ABA-C5 546 9 36 0 10 0.405 168
ABP1 640 3 3 0 1 0.391 694
DHN 1,012 39 741 37 88 0.204 1,911
HSP 601 19 171 28 60 0.386 1,010
LTP 489 35 595 153 212 0.451 556
DES 755 18 153 37 46 0.374 947
a Number of significant pairwise comparisons by Fisher’s exact testb Number of significant pairwise comparisons by Chi-square testc Number of nucleotides at which a complete decay of R2 is observed
1046 Theor Appl Genet (2011) 122:1039–1049
123

encoded protein sequences, phylogenetic analyses, show a
considerable locus-to-locus variation with estimates of
nucleotide diversity varying more than tenfold across
genes, strongly indicating the occurrence of different
evolutionary constraints.
Data on sequence polymorphism in plant genes are quite
rare. Concerning sequences involved in gene regulation,
data are reported for two MYB transcription factors of
barley and wheat (Haseneyer et al. 2008): p is 0.00223 in
barley and 0.00268 in wheat, comparable to our values. An
analysis of genes involved in the activation of defence
response in Arabidopsis thaliana shows that 8 sequences
related to gene regulation have an average ps of 0.00126
and pa of 0.00089 (Bakker et al. 2008).
As far as genes encoding enzymes and defence proteins,
p values reported for the overall sequence of Adh3 locus in
wild barley is 0.0219 (Lin et al. 2001); other Adh loci of
allogamous species show p values ranging from 0.00204 to
0.01742 (Cummings and Clegg 1998). A chitinase-encod-
ing gene (i.e. involved in fungal response) of A. thaliana
has p = 0.0104 (Kawabe et al. 1997). The above cited
study by Bakker et al. (2008) shows that seven genes
involved in the final phases of defence response, encoding
pathogen-related proteins, have ps = 0.00183 and
pa = 0.00126. NBS-LRR encoding genes of A. thaliana
show an even higher genetic diversity (Bakker et al. 2006).
On the whole, the values of genetic diversity observed in
our experiments are in the range of those reported in the
literature (Tables 4, 5; Fig. 2).
As far as non-coding regions, variability in the introns is
generally similar or even lower than in the other regions.
Other studies have demonstrated high levels of sequence
Fig. 3 Linkage disequilibrium (LD) structure in eight gene
sequences of eight inbred lines of sunflower. The plots shows the
pair-wise LD measurement R2 related to physical distance (in
nucleotides, nt) for all genes, for the four genes encoding regulatory
proteins (a), and for the four genes encoding enzymes or defence
proteins (b). The line on each graph depicts the expected decline in
LD
Fig. 4 Neighbour-joining analysis of eight inbred lines of sunflower
using the sequences of the eight selected genes. Inbred line
identification codes as in Table 1. Asterisks indicate significant
bootstrap values (**[80%; *[50%)
Fig. 5 Correlation between the pairwise differences in leaf RWC
after 0, 30, 60, and 120 min of drought stress and genetic distances
between the same inbred lines, calculated on sequence analysis of
eight genes
Theor Appl Genet (2011) 122:1039–1049 1047
123

conservation in non-coding DNA compared between
human and mouse, interpreting this conservation as evi-
dence for functional constraints (Hare and Palumbi 2003).
If this interpretation is correct, the hypothesis of the
occurrence of regulatory elements in the introns is sup-
ported. In human and mouse DNA, much of the non-coding
sequence conserved between these species may result from
chance or from small-scale heterogeneity in mutation rates.
However, the observed level of intron sequence conserva-
tion was higher than expected by chance and indicates that
intron sequences play a larger functional role in gene
regulation than previously realized (Hare and Palumbi
2003).
It has been hypothesized that categories of genes
involved in different stages of stress response pathways
are expected to experience different selective pressures
(Bakker et al. 2008). In cultivated sunflower, though their
analyses are not aimed to stress-related genes, Liu and
Burke (2006) reported p values slightly higher for genes
encoding enzymes (five genes, mean p = 0.0051) than for
sequences involved in gene regulation (three genes, mean
p = 0.0037).
Indeed, a tendency to increase sequence variability from
upstream to downstream stress response genes can be
inferred from our data. Comparisons between these two
gene categories in other species also confirm this tendency.
Though our analysis is limited to eight genes, our data
indicates that p values of the eight tested genes are lower in
the four genes encoding involved in expression regulation
or signalling cascade (NAC, ABA-C5, DREB, ABP1)
while higher diversity can be observed in genes encoding
enzymes and defence proteins.
Concerning the effect of sequence variability on drought
response, it is apparent that large variability in stress
response between genotypes is related to difference in
regulation of gene expression, as recently shown also for
sunflower (Roche et al. 2007). However, that changes in
DNA coding sequences, and consequently in the structure
of encoded proteins, may cause different efficiency of
metabolic processes (including those acting in stress tol-
erance) cannot be ruled out. Though genes analysed in our
study are few, the correlation between genetic distances
(calculated on gene sequences) and differences in drought
response is significant, at least in the first phases of the
stress (Fig. 5).
The analysis of many genes is required to establish
general rules concerning (1) the question if genes encoding
proteins involved in gene regulation and signal transduc-
tion are more conserved than those acting in the down-
stream metabolism, and (2) the relative importance of
variations in gene expression compared to sequence vari-
ability of stress defence genes in causing stress response
variability among genotypes. Using now available
resequencing techniques will conveniently allow analysing
a number of genes in a number of genotypes.
Acknowledgments This work was supported by PRIN-MIUR,
Project ‘‘Variabilita di sequenza ed eterosi in piante coltivate’’.
References
Almoguera C, Jordano J (1992) Developmental and environmental
concurrent expression of sunflower dry-seed-stored low-molec-
ular-weight heat-shock protein and Lea mRNAs. Plant Mol Biol
19:781–792
Bakker EG, Toomajian C, Kreitman M, Bergelson J (2006) A
genome-wide survey of R gene polymorphisms in Arabidopsisthaliana. Plant Cell 18:1803–1818
Bakker EG, Traw MB, Toomajian C, Kreitman M, Bergelson J (2008)
Low levels of polymorphism in genes that control the activation
of defence response in Arabidopsis thaliana. Genetics
178:2031–2043
Braverman JM, Hudson RR, Kaplan NL, Langley CH, Stephan W
(1995) The hitchhiking effect on the site frequency spectrum of
DNA polymorphisms. Genetics 140:783–796
Burke JM, Knapp SJ, Rieseberg LH (2005) Genetic consequences of
selection during the evolution of cultivated sunflower. Genetics
171:1933–1940
Carranco R, Almoguera C, Jordano J (1997) A plant small heat shock
protein gene expressed during zygotic embryogenesis but
noninducible by heat stress. J Biol Chem 272:27470–27475
Close TJ (1996) Dehydrins: emergence of a biochemical role of
a family of plant dehydration proteins. Physiol Plant 97:
795–803
Conti A, Pancaldi S, Fambrini M, Michelotti V, Bonora A, Salvini M,
Pugliesi C (2004) A deficiency at the gene coding for zeta-
carotene desaturase characterizes the sunflower non dormant-1mutant. Plant Cell Physiol 45:445–455
Cronn R, Brothers M, Klier K, Bretting PK, Wendel JF (1997)
Allozyme variation in domesticated annual sunflower and its
wild relatives. Theor Appl Genet 95:532–545
Cummings MP, Clegg MT (1998) Nucleotide sequence diversity at
the alcohol dehydrogenase 1 locus in wild barley (Hordeumvulgare ssp. spontaneum): an evaluation of the background
selection hypothesis. Proc Natl Acad Sci USA 95:5637–5642
David KM, Couch D, Braun N, Brown S, Grosclaude J, Perrot-
Rechenmann C (2007) The auxin-binding protein 1 is essential
for the control of cell cycle. Plant J 50:197–206
De Oliveira Carvalho A, Moreira Gomes V (2007) Role of plant lipid
transfer proteins in plant cell physiology—a concise review.
Peptides 28:1144–1153
Diaz-Martin J, Almoguera C, Prieto-Dapena P, Espinosa JM, Jordano
J (2005) Functional interaction between two transcription factors
involved in the developmental regulation of a small heat stress
protein gene promoter. Plant Physiol 139:1483–1494
Doyle JJ, Doyle JL (1989) Isolation of plant DNA from fresh tissue.
Focus 12:13–15
Feder ME, Mitchell-Olds T (2003) Evolutionary and ecological
functional genomics. Nat Rev Genet 4:649–655
Felsenstein J (1989) PHYLIP-phylogeny inference package (Version
3.2). Cladistics 5:164–166
Giordani T, Natali L, D’Ercole A, Pugliesi C, Fambrini M, Vernieri P,
Vitagliano C, Cavallini A (1999) Expression of a dehydrin gene
during embryo development and drought stress in ABA deficient
mutants of sunflower (Helianthus annuus L.). Plant Mol Biol
39:739–748
1048 Theor Appl Genet (2011) 122:1039–1049
123
Giordani T, Natali L, Cavallini A (2003) Analysis of a dehydrin
encoding gene and its phylogenetic utility in Helianthus. Theor
Appl Genet 107:316–325
Hare MP, Palumbi SR (2003) High intron sequence conservation
across three mammalian orders suggests functional constraints.
Mol Biol Evol 20:969–978
Harter AV, Gardner KA, Falush D, Lentz DL, Bye RA, Rieseberg LH
(2004) Origin of extant domesticated sunflowers in eastern North
America. Nature 430:201–205
Haseneyer G, Ravel C, Dardevet M, Balfourier F, Sourdille P,
Charmet G, Brunel D, Sauer S, Geiger HH, Graner A, Stracke S
(2008) High level of conservation between genes coding for the
GAMYB transcription factor in barley (Hordeum vulgare L.) and
bread wheat (Triticum aestivum L.) collections. Theor Appl
Genet 117:321–331
Hass CG, Tang S, Leonard S, Miller JF, Traber MG, Miller JF, Knapp
SJ (2006) Three non-allelic epistatically interacting methyltrans-
ferase mutations produce novel tocopherol (vitamin E) profiles
in sunflower. Theor Appl Genet 113:767–782
Hill WG, Robertson A (1968) Linkage disequilibrium in finite
populations. Theor Appl Genet 38:226–231
Ingvarsson PK, Garcia MV, Luquez V, Hall D, Jansson S (2008)
Nucleotide polymorphism and phenotypic associations within
and around the phytochrome B2 locus in European aspen
(Populus tremula, Salicaceae). Genetics 178:2217–2226
Kasuga M, Liu Q, Miura S, Yamaguchi-Shinozaki K, Shinozaki K
(1999) Improving plant drought, salt, and freezing tolerance by
gene transfer of a single stress-inducible transcription factor. Nat
Biotechnol 17:287–291
Kawabe A, Innan H, Terauchi R, Miyashita NT (1997) Nucleotide
polymorphism in the acidic chitinase locus (ChiA) region of the
wild plant Arabidopsis thaliana. Mol Biol Evol 14:1303–1315
Kolkman JM, Slabaugh MB, Bruniard JM, Berry ST, Bushman SB,
Olungu C, Maes N, Abratti G, Zambelli A, Miller JF, Leon A,
Knapp SJ (2004) Acetohydroxyacid synthase mutations confer-
ring resistance to imidazolinone or sulfonylurea herbicides in
sunflower. Theor Appl Genet 109:1147–1159
Kyte J, Doolittle RF (1982) A simple method for displaying the
hydropathic character of a protein. J Mol Biol 157:105–132
Lin J-Z, Brown AHD, Clegg MT (2001) Heterogeneous geographic
patterns of nucleotide sequence diversity between two alcohol
dehydrogenase genes in wild barley (Hordeum vulgare subspe-
cies spontaneum). Proc Natl Acad Sci USA 98:531–536
Liu X, Baird WV (2003) Differential expression of genes regulated in
response to drought or salinity stress in sunflower. Crop Sci
43:678–687
Liu X, Baird VW (2004) Identification of a novel gene, HaABRC5, from
Helianthus annuus (Asteraceae) that is upregulated in response to
drought, salinity, and abscisic acid. Am J Bot 91:184–191
Liu A, Burke JM (2006) Patterns of nucleotide diversity in wild and
cultivated sunflower. Genetics 173:321–330
Moriyama EN, Powell JR (1996) Intraspecific nuclear DNA variation
in Drosophila. Mol Biol Evol 13:261–277
Natali L, Giordani T, Cavallini A (2003) Sequence variability of a
dehydrin gene within Helianthus annuus. Theor Appl Genet
106:811–818
Navari-Izzo F, Quartacci MF, Melfi D, Izzo R (1993) Lipid
composition of plasma membrane isolated from sunflower
seedlings grown under water-stress. Physiol Plant 87:508–514
Nei M (1987) Molecular evolutionary genetics. Columbia University
Press, New York
Nei M, Gojobori T (1986) Simple methods for estimating the numbers
of synonymous and nonsynonymous nucleotide substitutions.
Mol Biol Evol 3:418–426
Ogata N, Alter HJ, Miller RH, Purcell RH (1991) Nucleotide
sequence and mutation rate of the H strain of hepatitis C virus.
Proc Natl Acad Sci USA 88:3392–3396
Ooka H, Satoh K, Doi K, Nagata T, Otomo Y, Murakami K,
Matsubara K, Osato N, Kawai J, Carninci P, Hayashizaki Y,
Suzuki K, Kojima K, Takahara Y, Yamamoto K, Kikuchi S
(2003) Comprehensive analysis of NAC family genes in Oryzasativa and Arabidopsis thaliana. DNA Res 10:239–247
Ouvrard O, Cellier F, Ferrare K, Tousch D, Lamaze T, Dupuis J-M,
Casse-Delbart F (1996) Identification and expression of water
stress- and abscisic acid-regulated genes in a drought-tolerant
sunflower genotype. Plant Mol Biol 31:819–829
Rieseberg LH, Seiler GJ (1990) Molecular evidence and the origin
and development of the domesticated sunflower (Helianthusannuus, Asteraceae). Econ Bot 44(Suppl):79–91
Roche J, Hewezi T, Bouniols A, Gentzbittel L (2007) Transcriptional
profiles of primary metabolism and signal transduction-related
genes in response to water stress in field-grown sunflower
genotypes using a thematic cDNA microarray. Planta
226:601–617
Rozas J, Rozas R (1999) DnaSP version 3: an integrated program for
molecular population genetics and molecular evolution analysis.
Bioinformatics 15:174–175
Schuppert GF, Tang S, Slabaugh MB, Knapp SJ (2006) The sunflower
high-oleic mutant Ol carries variable tandem repeats of FAD2-1,
a seed-specific oleoyl-phosphatidyl choline desaturase. Mol
Breed 17:241–256
Shinozaki K, Yamaguchi-Shinozaki K (2007) Gene networks
involved in drought stress response and tolerance. J Exp Bot
58:221–227
Stinchcombe JR, Hoekstra HE (2008) Combining population genom-
ics and quantitative genetics: finding the genes underlying
ecologically important traits. Heredity 100:158–170
Tajima F (1989) Statistical method for testing the neutral mutation
hypothesis by DNA polymorphism. Genetics 123:585–595
Tang S, Knapp SJ (2003) Microsatellites uncover extraordinary
diversity in native American land races and wild populations of
cultivated sunflower. Theor Appl Genet 106:990–1003
Tang S, Hass CG, Knapp SJ (2006) Ty3/gypsy-like retrotransposon
knockout of a 2-methyl-6-phytyl-1, 4-benzoquinone methyl-
transferase is non-lethal, uncovers a cryptic paralogous mutation,
and produces novel tocopherol (vitamin E) profiles in sunflower.
Theor Appl Genet 113:783–799
Thompson JD, Higgins DG, Gibson TJ (1994) CLUSTAL W:
improving the sensitivity of progressive multiple sequence
alignment through sequence weighting, position-specific gap
penalties and weight matrix choice. Nucleic Acids Res
22:4673–4680
Vukich M, Schulman AH, Giordani T, Natali L, Kalendar R,
Cavallini A (2009) Genetic variability in sunflower (Helianthusannuus L.) and in the Helianthus genus as assessed by
retrotransposon-based molecular markers. Theor Appl Genet
119:1027–1038
Watterson GA (1975) On the number of segregating sites in
genetical models without recombination. Theor Popul Biol
7:256–276
Wilkins MR, Gasteiger E, Bairoch A, Sanchez J-C, Williams KL,
Appel RD, Hochstrasser DF (1998) Protein identification and
analysis tools in the ExPASy server. In: Link AJ (ed) Methods in
molecular biology, 2-D proteome analysis protocols, vol 112.
Humana Press Inc., Totowa, pp 531–552
Zhu B, Choi D-W, Fenton R, Close TJ (2000) Expression of the
barley dehydrin multigene family and the development of
freezing tolerance. Mol Gen Genet 264:145–153
Theor Appl Genet (2011) 122:1039–1049 1049
123


![Item Ingredients - c2.mysalec.com · helianthus annuus seed oil [helianthus annuus (sunflower) seed oil], sodium hyaluronate, hydroxyethylcellulose, tocopherol, disodium edta, sodium](https://static.cupdf.com/doc/110x72/5fd90005704090003509a6c7/item-ingredients-c2-helianthus-annuus-seed-oil-helianthus-annuus-sunflower.jpg)