For Peer Review
Genome-wide association study identifies 25 known breast
cancer susceptibility loci as risk factors for triple negative breast cancer
Journal: Carcinogenesis
Manuscript ID: CARCIN-2013-00911.R1
Manuscript Type: Original Manuscript
Date Submitted by the Author: 04-Nov-2013
Complete List of Authors: Purrington, Kristen; Mayo Clinic, Department of Health Sciences Research
Konstanta, Irene; National Centre for Scientific Research "Demokritos", Molecular Diagnostics Laboratory INRASTES Slager, Susan; College of Medicine, Mayo Clinic, Health Sciences Research Eccles, Diana; University of Southampton, Faculty of Medicine Yannoukakos, Drakoulis; National Centre for Scientific Research "Demokritos", Molecular Diagnostics Laboratory INRASTES Fasching, Peter; University Breast Center Franconia, University Hospital Erlangen; Friedrich-Alexander University Erlangen-Nuremberg, Department of Gynecology and Obstetrics; University of California at Los Angeles, David Geffen School of Medicine, Department of Medicine, Division Hematology/Oncology Miron, Penelope; Dana Farber Cancer Institute, Cancer Biology
Carpenter, Jane; University of Sydney at the Westmead Millennium Institute, Australian Breast Cancer Tissue Bank Chang-Claude, Jenny; German Cancer Research Center, Division of Clinical Epidemiology Martin, Nicholas G Montgomery, Grant; 4Queensland Institute of Medical Research, 4Queensland Institute of Medical Research Kristensen, Vessela; Oslo University Hospital, Department of Genetics Anton-Culver, Hoda; University of California, Epidemiology Div. Goodfellow, Paul; Washington University School of Medicine, Barnes-Jewish Hospital, Siteman Cancer Center Tapper, William; University of Southampton, Faculty of Medicine
Rafiq, Sajjad; University of Southampton, Faculty of Medicine Gerty, Susan; University of Southampton, Faculty of Medicine Durcan, Lorraine; University of Southampton, Faculty of Medicine Konstantopoulou, Irene; National Centre for Scientific Research "Demokritos", Molecular Diagnostics Laboratory INRASTES Fostira, Florentia; National Centre for Scientific Research "Demokritos", Molecular Diagnostics Laboratory INRASTES Vratimos, Athanassios; National Centre for Scientific Research "Demokritos", Molecular Diagnostics Laboratory INRASTES Apostolou, Paraskevi; National Centre for Scientific Research "Demokritos", Molecular Diagnostics Laboratory INRASTES
Carcinogenesis Carcinogenesis Advance Access published December 9, 2013 at U
Q L
ibrary on Decem
ber 17, 2013http://carcin.oxfordjournals.org/
Dow
nloaded from

For Peer Review
Kotoula, Vassiliki; Aristotle University of Thessaloniki School of Medicine, "Laboratory of Molecular Oncology, Hellenic Foundation for Cancer Research and Department of Pathology " Lakis, Sotiris; Aristotle University of Thessaloniki School of Medicine, "Laboratory of Molecular Oncology, Hellenic Foundation for Cancer Research and Department of Pathology " DIMOPOULOS, MELETIOS; ATHENS UNIVERSITY, CLINICAL THERAPEUTICS Skarlos, Dimosthenis; “Metropolitan” Hospital, Second Department of Medical Oncology
Pectasides, Dimitrios; University of Athens School of Medicine, Oncology Section, Second Department of Internal Medicine, “Hippokration” Hospital Fountzilas, George; Aristotle University of Thessaloniki School of Medicine, Department of Medical Oncology, “Papageorgiou” Hospital Beckmann, Matthias; University Breast Center Franconia, University Hospital Erlangen; Friedrich-Alexander University Erlangen-Nuremberg, Department of Gynecology and Obstetrics Hein, Alexander; University Breast Center Franconia, University Hospital Erlangen; Friedrich-Alexander University Erlangen-Nuremberg, Department of Gynecology and Obstetrics Ruebner, Matthias; University Breast Center Franconia, University Hospital Erlangen; Friedrich-Alexander University Erlangen-Nuremberg, Department
of Gynecology and Obstetrics Ekici, Arif; University Hospital Erlangen; Friedrich-Alexander University Erlangen-Nuremberg, Institute of Human Genetics Hartmann, Arndt; University Hospital Erlangen; Friedrich-Alexander University Erlangen-Nuremberg, Institute of Pathology Schulz-Wendtland, Ruediger; University Hospital Erlangen; Friedrich-Alexander University Erlangen-Nuremberg, Institute of Diagnostic Radiology Renner, Stefan; University Breast Center Franconia, University Hospital Erlangen; Friedrich-Alexander University Erlangen-Nuremberg, Department of Gynecology and Obstetrics
Ranni, Wolfgang; University Hospital Ulm, Department of Gynecology and Obstetrics Rack, Brigitte; University Hospital Ludwig Maximilians University, Campus Innenstadt, Department of Gynecology and Obstetrics Scholz, Christoph; University Hospital Ulm, Department of Gynecology and Obstetrics Neugebauer, Julia; University Hospital Ludwig Maximilians University, Campus Innenstadt, Department of Gynecology and Obstetrics Andergassen, Ulrich; University Hospital Ludwig Maximilians University, Campus Innenstadt, Department of Gynecology and Obstetrics Lux, Michael; University Breast Center Franconia, University Hospital Erlangen; Friedrich-Alexander University Erlangen-Nuremberg, Department
of Gynecology and Obstetrics Haeberle, Lothar; University Breast Center Franconia, University Hospital Erlangen; Friedrich-Alexander University Erlangen-Nuremberg, Department of Gynecology and Obstetrics Clarke, Christine; Sydney Medical School Westmead, University of Sydney at the Westmead Millennium Institute, Westmead Institute for Cancer Research Pathmanathan, Nirmala; Westmead Hospital, Westmead Breast Cancer Institute Rudolph, Anja; German Cancer Research Center, Division of Cancer Epidemiology Flesch-Janys, Dieter; University Clinic Hamburg-Eppendorf, Institute for
Medical Biometrics and Epidemiology Nickels, Stefan; German Cancer Research Center, Division of Cancer Epidemiology Olson, Janet; Mayo Clinic, Health Sciences Research Ingle, James; Mayo Clinic, Department of Oncology
Page 1 of 70 Carcinogenesis
123456789101112131415161718192021222324252627282930313233343536373839404142434445464748495051525354555657585960
at UQ
Library on D
ecember 17, 2013
http://carcin.oxfordjournals.org/D
ownloaded from

For Peer Review
Cafourek, Vicki; Mayo Clinic, Health Sciences Research Olswold, Curtis; Mayo Clinic, Health Sciences Research Slettedahl, Seth; Mayo Clinic, Health Sciences Research Eckel-Passow, Jeanette; Mayo Clinic, Health Sciences Research Anderson, S.; Mayo Clinic, Department of Health Sciences Research Visscher, Daniel; Mayo Clinic, Department of Laboratory Medicine and Pathology Sicotte, Hugues; Mayo Clinic, Department of Health Sciences Research Prodduturi, Naresh; Mayo Clinic, Department of Health Sciences Research
Weiderpass, Elisabete; University of Tromsø, Department of Community Medicine Bernstein, Leslie; City of Hope Comprehensive Cancer Center, Beckman Research Institute Ziogas, Argyrios; University of California–Irvine, Department of Epidemiology Ivanovich, Jennifer; Washington University School of Medicine,, Barnes-Jewish Hospital and Siteman Cancer Center Giles, Graham Baglietto, Laura; The Cancer Council Victoria, Cancer Epidemiology Centre Southey, Melissa; The University of Melbourne, Department of Pathology Kosma, Veli-Matti; University of Eastern Finland, School of Medicine,
Institute of Clinical Medicine, Pathology and Forensic Medicine; Biocenter Kuopio, Cancer Center of Eastern Finland, University of Eastern Finland, Kuopio, Finland and Imaging Center, Department of Clinical Pathology, Kuopio University Hospital, Kuopio, Finland Fischer, Hans-Peter; Medical Faculty of the University of Bonn, Institute of Pathology Cai, Qiuyin; Vanderbilt University Medical Center, Medicine Shu, Xiao Ou; Vanderbilt University, Center for Health Services Research, Vanderbilt Ingram Cancer Center Daly, Mary; Fox Chase Cancer Center, Department of Clinical Genetics Weaver, JoEllen; University of Pennslyvania School of Medicine, PennMed
Biobank Ross, Eric; Fox Chase Cancer Center, Department of Biostatistics and Bioinformatics Sharma, Priyanka; University of Kansas Medical Center, Department of Oncology/Hematology Klemp, Jennifer; University of Kansas Medical Center, Department of Oncology/Hematology Torres, Diana; German Cancer Research Center (DKFZ), Molecular Genetics of Breast Cancer Rüdiger, Thomas; Städtisches Klinikum Karlsruhe, Institute of Pathology Wölfing, Heidrun; Städtisches Klinikum Karlsruhe, Institute of Pathology Ulmer, Hans-Ulrich; Frauenklinik der Stadtklinik Baden-Baden, University
of Jena Försti, Asta; German Cancer Research Center (DKFZ), Division of Molecular Genetic Epidemiology Khoury, Thaer; Roswell Park Cancer Institute, Department of Pathology Kumar, Shicha; Roswell Park Cancer Institute, Department of Surgical Oncology Pilarski, Robert; Comprehensive Cancer Center, The Ohio State University, Division of Human Genetics, Department of Internal Medicine Shapiro, Charles; Comprehensive Cancer Center, The Ohio State University, Division of Medical Oncology, Department of Internal Medicine Greco, Dario; University of Helsinki and Helsinki University Central Hospital, Department of Obstetrics and Gynecology
Heikkilä, Päivi; Helsinki University Central Hospital, Department of Pathology Aittomäki, Kristiina; Helsinki University Central Hospital, Department of Clinical Genetics Blomqvist, Carl; Helsinki University Central Hospital, Department of
Page 2 of 70Carcinogenesis
123456789101112131415161718192021222324252627282930313233343536373839404142434445464748495051525354555657585960
at UQ
Library on D
ecember 17, 2013
http://carcin.oxfordjournals.org/D
ownloaded from

For Peer Review
Oncology Irwanto, Astrid; Genome Institute of Singapore, Human Genetics Division Liu, Jianjun; Genome Institute of Singapore, Human Genetics Division Pankratz, Vernon; Mayo Clinic, Biostatistics Wang, Xianshu; Mayo Clinic, Experimental Pathology Severi, Gianluca; The Cancer Council of Victoria, Cancer Epidemiology Centre Mannermaa, Arto; University of Eastern Finland, School of Medicine, Institute of Clinical Medicine, Pathology and Forensic Medicine; Biocenter
Kuopio, Cancer Center of Eastern Finland, University of Eastern Finland, Kuopio, Finland and Imaging Center, Department of Clinical Pathology, Kuopio University Hospital, Kuopio, Finland Easton, Douglas; University of Cambridge, Centre for Cancer Genetic Epidemiology, Department of Public Health and Primary Care, Department of Oncology Hall, Per; University of Tuebingen, Dr. Margarete Fischer-Bosch-Institute of Clinical Pharmacology Ambrosone, Christine; Roswell Park Cancer Institute, Dept.of Epidemiology Toland, Amanda; The Ohio State University, Molecular Virology, Immunology and Medical Genetics Nevanlinna, Heli; Helsinki University Central Hospital, Obstetrics and
gynecology Vachon, Celine; Mayo Clinic, Department of Health Sciences Research Couch, Fergus; Mayo Clinic, Pathology
Keywords: genetic susceptibility, association study, subtypes, polygenic risk score, expression quantitative trait locus
Page 3 of 70 Carcinogenesis
123456789101112131415161718192021222324252627282930313233343536373839404142434445464748495051525354555657585960
at UQ
Library on D
ecember 17, 2013
http://carcin.oxfordjournals.org/D
ownloaded from

For Peer Review
1
Genome-wide association study identifies 25 known breast cancer susceptibility loci
as risk factors for triple negative breast cancer
Short title: GWAS and known breast cancer risk loci in TN breast cancer
Kristen S. Purrington1, Susan Slager
1, Diana Eccles
2, Drakoulis Yannoukakos
3, Peter A.
Fasching5,4
, Penelope Miron6, Jane Carpenter
7, Jenny Chang-Claude
8, Nicholas G.
Martin9, Grant W Montgomery
9, Vessela Kristensen
10,11, Hoda Anton-Culver
12, Paul
Goodfellow13
, William J. Tapper2, Sajjad Rafiq
2, Susan M. Gerty
2, Lorraine Durcan
2,
Irene Konstantopoulou3, Florentia Fostira
3, Athanassios Vratimos
3, Paraskevi
Apostolou3, Irene Konstanta
3, Vassiliki Kotoula
14, Sotiris Lakis
15, Meletios A.
Dimopoulos16
, Dimosthenis Skarlos17
, Dimitrios Pectasides18
, George Fountzilas19
,
Matthias W. Beckmann5, Alexander Hein
5, Matthias Ruebner
5, Arif B. Ekici
20, Arndt
Hartmann21
, Ruediger Schulz-Wendtland22
, Stefan P. Renner5, Wolfgang Janni
23, Brigitte
Rack24
, Christoph Scholz23
, Julia Neugebauer24
, Ulrich Andergassen24
, Michael P. Lux5,
Lothar Haeberle5, Christine Clarke
25, Nirmala Pathmanathan
26, Anja Rudolph
8, Dieter
Flesch-Janys27
, Stefan Nickels8, Janet E. Olson
1, James N. Ingle
28, Curtis Olswold
1, Seth
Slettedahl1, Jeanette E. Eckel-Passow
1, S. Keith Anderson
1, Daniel W. Visscher
29, Vicky
Cafourek1, Hugues Sicotte
1, Naresh Prodduturi
1, Elisabete Weiderpass
30,31,32, Leslie
Bernstein33
, Argyrios Ziogas12
, Jennifer Ivanovich13
, Graham G. Giles34
, Laura
Baglietto34
, Melissa Southey35
, Veli-Matti Kosma36
, Hans-Peter Fischer37
, The GENICA
Network38,.j2,40,41,42,43
, Malcom W.R. Reed44
, Simon S. Cross45
, Sandra Deming-
Halverson46
, Martha Shrubsole46
, Qiuyin Cai46
, Xiao-Ou Shu46
, Mary Daly47
, JoEllen
Weaver48
, Eric Ross49
, Jennifer Klemp50,51
, Priyanka Sharma50
, Diana Torres43
, Thomas
Rüdiger52
, Heidrun Wölfing52
, Hans-Ulrich Ulmer53
, Asta Försti55,54
, Thaer Khoury56
,
Shicha Kumar57
, Robert Pilarski58
, Charles L. Shapiro59
, Dario Greco60
, Päivi Heikkilä61
,
Kristiina Aittomäki61
, Carl Blomqvist61
, Astrid Irwanto62
, Jianjun Liu62
, V. Shane
Pankratz1, Xianshu Wang
29, Gianluca Severi
34, Arto Mannermaa
36, Douglas Easton
65, Per
Hall66
, Hiltrud Brauch38
, Angela Cox44
, Wei Zheng46
, Andrew K. Godwin67
, Ute
Hamann43
, Christine Ambrosone68
, Amanda Ewart Toland69
, Heli Nevanlinna60
, Celine
M. Vachon1, Fergus J. Couch
1,29*
1 Department of Health Sciences Research, Mayo Clinic, Rochester, MN, USA
2 Faculty of Medicine, University of Southampton, Southampton, UK
3 Molecular Diagnostics Laboratory INRASTES, National Centre for Scientific Research
"Demokritos", Athens, Greece
4 Department of Medicine, Division Hematology/Oncology, University of California at
Los Angeles, David Geffen School of Medicine, Los Angeles, CA, USA
5 Department of Gynecology and Obstetrics, University Breast Center Franconia,
University Hospital Erlangen; Friedrich-Alexander University Erlangen-Nuremberg,
Erlangen, Germany
6 Department of Cancer Biology, Dana-Farber Cancer Institute, Boston, MA, USA
7 Australian Breast Cancer Tissue Bank, University of Sydney at the Westmead
Millennium Institute, Westmead, New South Wales, Australia
8 Division of Cancer Epidemiology, German Cancer Research Center (DKFZ),
Heidelberg, Germany
Page 4 of 70Carcinogenesis
123456789101112131415161718192021222324252627282930313233343536373839404142434445464748495051525354555657585960
at UQ
Library on D
ecember 17, 2013
http://carcin.oxfordjournals.org/D
ownloaded from
For Peer Review
2
9 QIMR GWAS Collective, Queensland Institute of Medical Research, Brisbane,
Queensland, Australia
10 Department of Genetics, Institute for Cancer Research, Oslo University Hospital,
Radiumhospitalet, Oslo, Norway
11 Faculty of Medicine (Faculty Division Ahus), Universitetet i Oslo, Oslo, Norway
12 Department of Epidemiology, University of California–Irvine, Irvine, CA, USA
13 Washington University School of Medicine, Barnes-Jewish Hospital and Siteman
Cancer Center, St. Louis, MO, USA
14 Laboratory of Molecular Oncology, Hellenic Foundation for Cancer Research and
Department of Pathology, Aristotle University of Thessaloniki School of Medicine,
Thessaloniki, Greece
15 Laboratory of Molecular Oncology, Hellenic Foundation for Cancer Research,
Aristotle University of Thessaloniki School of Medicine, Thessaloniki, Greece
16 Department of Clinical Therapeutics, “Alexandra” Hospital, University of Athens
School of Medicine, Athens, Greece
17 Second Department of Medical Oncology , “Metropolitan” Hospital, Athens, Greece
18 Oncology Section, Second Department of Internal Medicine, “Hippokration” Hospital,
University of Athens School of Medicine, Athens, Greece
19 Department of Medical Oncology, “Papageorgiou” Hospital, Aristotle University of
Thessaloniki School of Medicine, Thessaloniki, Greece
20 Institute of Human Genetics, University Hospital Erlangen; Friedrich-Alexander
University Erlangen-Nuremberg, Erlangen, Germany
21 Institute of Pathology, University Hospital Erlangen; Friedrich-Alexander University
Erlangen-Nuremberg, Erlangen, Germany
22 Institute of Diagnostic Radiology, University Hospital Erlangen; Friedrich-Alexander
University Erlangen-Nuremberg, Erlangen, Germany
23 Department of Gynecology and Obstetrics, University Hospital Ulm, Ulm, Germany
24 Department of Gynecology and Obstetrics, University Hospital Ludwig Maximilians
University, Campus Innenstadt, Munich, Germany
25 Westmead Institute for Cancer Research, Sydney Medical School Westmead,
University of Sydney at the Westmead Millennium Institute, Westmead, New South
Wales, Australia
26 Westmead Breast Cancer Institute, Westmead Hospital, Westmead, New South Wales,
Australia
27 Institute for Medical Biometrics and Epidemiology, University Clinic Hamburg-
Eppendorf, Hamburg, Germany
28 Department of Oncology, Mayo Clinic, Rochester, MN, USA
29 Department of Laboratory Medicine and Pathology, Mayo Clinic, Rochester, MN,
USA
30 Department of Community Medicine, University of Tromsø, Tromsø, Norway
31 Folkhälsan Research Cancer Centre, Helsinki, Finland
32 Cancer Registry of Norway, Oslo, Norway
33 Division of Cancer Etiology, Department of Population Sciences, Beckman Research
Institute, City of Hope, Duarte, USA
34 Cancer Epidemiology Centre, The Cancer Council Victoria, Melbourne, Victoria,
Australia
Page 5 of 70 Carcinogenesis
123456789101112131415161718192021222324252627282930313233343536373839404142434445464748495051525354555657585960
at UQ
Library on D
ecember 17, 2013
http://carcin.oxfordjournals.org/D
ownloaded from

For Peer Review
3
35 Department of Pathology, The University of Melbourne, Melbourne, Victoria,
Australia
36 School of Medicine, Institute of Clinical Medicine, Pathology and Forensic Medicine;
Biocenter Kuopio, Cancer Center of Eastern Finland, University of Eastern Finland,
Kuopio, Finland and Imaging Center, Department of Clinical Pathology, Kuopio
University Hospital, Kuopio, Finland, University of Eastern Finland, Kuopio, Finland
37 Department of Pathology, Medical Faculty University Bonn, Bonn, Germany
38 Dr. Margarete Fischer-Bosch-Institute of Clinical Pharmacology, Stuttgart and
University of Tuebingen, Germany
39 Department of Internal Medicine, Evangelische Kliniken Bonn gGmbH, Johanniter
Krankenhaus, Bonn, Germany
40 Institute for Occupational Medicine and Maritime Medicine, University Medical
Center Hamburg-Eppendorf, Germany
41 Institute for Prevention and Occupational Medicine of the German Social Accident
Insurance, Institute of the Ruhr University Bochum (IPA), Bochum, Germany
42 Institute of Pathology, Medical Faculty of the University of Bonn, Bonn, Germany
43 Molecular Genetics of Breast Cancer, German Cancer Research Center (DKFZ),
Heidelberg, Germany
44 Department of Oncology, Cancer Research UK/Yorkshire Cancer Research Sheffield
Cancer Research Centre, University of Sheffield, Sheffield, UK
45 Department of Neuroscience, University of Sheffield, Sheffield, UK
46 Department of Medicine, Vanderbilt Epidemiology Center, Vanderbilt-Ingram Cancer
Center, Division of Epidemiology, Vanderbilt University School of Medicine, Nashville,
TN, USA
47 Department of Clinical Genetics, Fox Chase Cancer Center, Philadelphia, PA, USA
48 PennMed Biobank, University of Pennsylvania School of Medicine, Philadelphia, PA,
USA
49 Department of Biostatistics and Bioinformatics, Fox Chase Cancer Center,
Philadelphia, PA, USA
50 Department of Oncology/Hematology, University of Kansas Medical Center, Kansas
City, KS, USA
51 Institute of Human Genetics, Pontificia University Javeriana, Bogota, Colombia
52 Institute of Pathology, Städtisches Klinikum Karlsruhe, Karlsruhe, Germany
53 Frauenklinik der Stadtklinik Baden-Baden, Baden-Baden, Germany, , Baden-Baden,
Germany
54 Center for Primary Health Care Research, University of Lund, Malmö, Sweden
55 Division of Molecular Genetic Epidemiology, German Cancer Research Center
(DKFZ), Heidelberg, Germany
56 Department of Pathology, Roswell Park Cancer Institute, Buffalo, NY, USA
57 Department of Surgical Oncology, Roswell Park Cancer Institute, Buffalo, NY, USA
58 Division of Human Genetics, Department of Internal Medicine, Comprehensive
Cancer Center, The Ohio State University, Columbus, OH, USA
59 Division of Medical Oncology, Department of Internal Medicine, Comprehensive
Cancer Center, The Ohio State University , Columbus, OH, USA
60 Department of Obstetrics and Gynecology, University of Helsinki and Helsinki
University Central Hospital, Helsinki, Finland
Page 6 of 70Carcinogenesis
123456789101112131415161718192021222324252627282930313233343536373839404142434445464748495051525354555657585960
at UQ
Library on D
ecember 17, 2013
http://carcin.oxfordjournals.org/D
ownloaded from

For Peer Review
4
61 Department of Pathology, Helsinki University Central Hospital, Helsinki, Finland
62 Department of Clinical Genetics, Helsinki University Central Hospital, Helsinki,
Finland
63 Department of Oncology, Helsinki University Central Hospital, Helsinki, Finland
64 Human Genetics Division, Genome Institute of Singapore, Singapore
65 Centre for Cancer Genetic Epidemiology, Department of Public Health and Primary
Care, Department of Oncology, University of Cambridge, Cambridge, UK
66 Medical Epidemiology and Biostatistics, Karolinska Institutet, Stockholm, Sweden
67 Department of Pathology and Laboratory Medicine, University of Kansas Medical
Center, Kansas City, KS, USA
68 Department of Cancer Prevention and Control, Roswell Park Cancer Institute, Buffalo,
NY, USA
69 Division of Human Cancer Genetics, Departments of Internal Medicine and Molecular
Virology, Immunology and Medical Genetics, Comprehensive Cancer Center, The Ohio
State University, Columbus, OH, USA
*To whom correspondence should be addressed: Fergus J. Couch, Stabile 2-42, Mayo
Clinic, 200 First Street SW, Rochester, MN 55905, USA. Tel: (507) 284-3623; Fax:
(507) 538-1937; Email: [email protected]
Page 7 of 70 Carcinogenesis
123456789101112131415161718192021222324252627282930313233343536373839404142434445464748495051525354555657585960
at UQ
Library on D
ecember 17, 2013
http://carcin.oxfordjournals.org/D
ownloaded from
For Peer Review
5
Abstract
Triple negative (TN) breast cancer is an aggressive subtype of breast cancer associated
with a unique set of epidemiologic and genetic risk factors. We conducted a two-stage
genome-wide association study (GWAS) of TN breast cancer (stage 1: 1,529 TN cases,
3,399 controls; stage 2: 2,148 cases, 1,309 controls) to identify loci that influence TN
breast cancer risk. Variants in the 19p13.1 and PTHLH loci showed genome-wide
significant associations (p<5x10⁻⁸
) in stage 1 and 2 combined. Results also suggested a
substantial enrichment of significantly associated variants among the SNPs analyzed in
stage 2. Variants from 25 of 74 known breast cancer susceptibility loci were also
associated with risk of TN breast cancer (p<0.05). Associations with TN breast cancer
were confirmed for ten loci (LGR6, MDM4, CASP8, 2q35, 2p24.1, TERT-rs10069690,
ESR1, TOX3, 19p13.1, RALY), and we identified associations with TN breast cancer for
15 additional breast cancer loci (p<0.05: PEX14, 2q24.1, 2q31.1, ADAM29, EBF1,
TCF7L2, 11q13.1, 11q24.3, 12p13.1, PTHLH, NTN4, 12q24, BRCA2, RAD51L1-
rs2588809, MKL1). Further, two SNPs independent of previously reported signals in
ESR1 (rs12525163 Odds Ratio (OR)=1.15, p=4.9x10⁻⁴
) and 19p13.1 (rs1864112
OR=0.84, p=1.8x10⁻⁹
) were associated with TN breast cancer. A polygenic risk score
(PRS) for TN breast cancer based on known breast cancer risk variants showed a 4-fold
difference in risk between the highest and lowest PRS quintiles (OR=4.03, 95% CI 3.46-
4.70, p=4.8x10-69
). This translates to an absolute risk for TN breast cancer ranging from
0.8% to 3.4%, suggesting that genetic variation may be used for TN breast cancer risk
prediction.
Page 8 of 70Carcinogenesis
123456789101112131415161718192021222324252627282930313233343536373839404142434445464748495051525354555657585960
at UQ
Library on D
ecember 17, 2013
http://carcin.oxfordjournals.org/D
ownloaded from

For Peer Review
6
Summary
In a genome-wide scan, we show that 30 variants in 25 genomic regions are associated
with risk of triple negative breast cancer. Women carrying many of the risk variants may
have four-fold increased risk relative to women with few variants.
Page 9 of 70 Carcinogenesis
123456789101112131415161718192021222324252627282930313233343536373839404142434445464748495051525354555657585960
at UQ
Library on D
ecember 17, 2013
http://carcin.oxfordjournals.org/D
ownloaded from
For Peer Review
7
Introduction
Triple negative (TN) breast cancer is a distinct histopathological subtype of breast cancer
that accounts for approximately 15% of all invasive breast cancers (1,2). This disease
subtype is defined by low or no expression of estrogen receptor (ER), progesterone
receptor (PR) and human epidermal growth factor receptor-2 (HER2). In addition, TN
tumors tend to be of higher histologic grade, more proliferative, and have medullary and
metaplastic features (1,3). Women with TN tumors are more likely to be BRCA1
mutation carriers, young or premenopausal, and African American or Hispanic ethnicity,
and experience higher rates of disease recurrence and progression, especially within the
first three years following treatment, compared to other breast cancer subtypes (4). TN
breast cancer is also associated with low socioeconomic status, an earlier age at
menarche, higher body mass index (BMI) during premenopausal years, higher parity, and
lower lifetime duration of breast feeding (1,5).
In addition to these epidemiologic factors, several common genetic variants have been
established as risk factors for TN breast cancer (6). Among these, 19p13.1 (7), TERT-
rs10069690 (8), and MDM4 (9) are specific to TN breast cancer, such that these loci are
not associated with risk of ER-positive or ER-negative, HER2-positive breast cancer.
Four other loci (RALY/EIF2S2, LGR6, 2p24.1, FTO-rs11075995) associated with ER-
negative but not ER-positive breast cancer (9,10) may also influence TN breast cancer
risk. More recently, a large study by the Breast Cancer Association Consortium (BCAC)
identified 46 additional common breast cancer susceptibility loci (11-13). While 26 of
these loci were associated with ER-negative as well as ER-positive breast cancer, the
Page 10 of 70Carcinogenesis
123456789101112131415161718192021222324252627282930313233343536373839404142434445464748495051525354555657585960
at UQ
Library on D
ecember 17, 2013
http://carcin.oxfordjournals.org/D
ownloaded from

For Peer Review
8
influence of the loci on TN breast cancer and other histopathological subtypes of breast
cancer has not yet been assessed.
Given the substantial heterogeneity in genetic risk profiles for different breast cancer
subtypes that we and others have demonstrated (14-17), we hypothesized that additional
genetic variants for TN breast cancer remain to be identified. These may include variants
that could not be detected by previous breast cancer genome wide association studies
(GWAS) conducted predominantly with ER-positive breast cancer cases, and perhaps a
subset of the 42 breast cancer hits recently identified by BCAC. In addition, recent
evidence has shown that risk loci are often complex and may contain multiple
independent risk associated variants that influence different subtypes of breast cancer
(11-13). Here we presents results from a comprehensive analysis of genetic variants and
TN breast cancer within the Triple Negative Breast Cancer Consortium (TNBCC),
including a two-stage GWAS of TN breast cancer, examining the contributions of known
breast cancer risk loci to TN breast cancer in terms of overall associations, independent
signals, and expression quantitative loci (eQTLs), and estimating the cumulative effect of
all common genetic risk factors on TN breast cancer risk.
Materials and methods
Ethics statement
Study participants were recruited under protocols approved by the Institutional Review
Board at each institution and all subjects provided written informed consent.
Page 11 of 70 Carcinogenesis
123456789101112131415161718192021222324252627282930313233343536373839404142434445464748495051525354555657585960
at UQ
Library on D
ecember 17, 2013
http://carcin.oxfordjournals.org/D
ownloaded from

For Peer Review
9
Study participants: Triple Negative Breast Cancer Consortium (TNBCC)
TNBCC subjects included in this analysis were recruited by 22 studies in seven different
countries (Table S1). In addition, data from four publicly available control GWAS data
sets (Wellcome Trust Case Control Consortium UK 1958 Birth Cohort (WTCCC),
National Cancer Institute’s Cancer Genetic Markers of Susceptibility (CGEMS) project,
Cooperative Health Research in the Region of Augsburg (KORA) study, and the
Australian Twin Cohort study from the Queensland Institute of Medical Research
(QIMR)) (n=3,180) were utilized. These studies are described in more detail in
Supplementary Material and have been described in detail elsewhere (8,10,14).
Pathology and tumor markers
A TN breast cancer case was defined as an individual with an ER–negative, PR–negative
and HER2–negative (0 or 1 by immunohistochemical staining (IHC)) breast cancer
diagnosed after age 18. Criteria used for defining ER, PR, and HER2 status varied by
study and have been previously described (8,10,14).
Triple-negative breast cancer genome-wide association study (GWAS)
Stage 1 of the TNBCC GWAS has been previously described (8,10,14). Briefly, 1,529
TN breast cancer cases and 3,399 country-matched controls from 10 study sites were
genotyped using the Illumina 660-Quad SNP array, CNV370 SNP array, and 550-Duo
SNP array (10). GWAS data for public controls were generated using the Illumina 660-
Quad (QIMR), Illumina 550(v1) (CGEMS), Illumina 550 (KORA), and Illumina 1.2M
(WTCCC). Genotype data from the various GWAS were independently evaluated by an
Page 12 of 70Carcinogenesis
123456789101112131415161718192021222324252627282930313233343536373839404142434445464748495051525354555657585960
at UQ
Library on D
ecember 17, 2013
http://carcin.oxfordjournals.org/D
ownloaded from

For Peer Review
10
iterative QC process as previously described (10). Common SNP genotypes were
imputed to HapMap phase 2 (release 21). Quantile-quantile plots showed no substantial
evidence for cryptic population substructure or differential genotype calling between
cases and controls. We excluded all SNPs with a MAF <0.05, imputation quality score
<0.5, and effect size (beta) with absolute value <0.3.
Triple-negative breast cancer iCOGS (Stage 2) genotyping
The design of the iCOGS array (211,155 SNPs) and genotyping methods has been
previously described (11). Briefly, samples were genotyped as part of the COGS project
using a custom Illumina Infinium array (iCOGS) at two genotyping centers (Mayo Clinic,
Genome Quebec). In this analysis, 1,263 cases and 1,105 controls from the TNBCC were
genotyped on the iCOGS array at the Mayo Clinic, and 885 cases and 204 controls were
genotyped at Genome Quebec. A total of 4,628 from the 6,087 TNBCC GWAS SNPs
proposed for the iCOGS array yielded high-quality genotype data. A total of 147,762
SNPs from the iCOGS array overlapped with the TNBCC Stage 1 GWAS data.
DASL expression data
Expression profiles were generated for a total of 702 TN tumors (Table S2) using the
Illumina Whole Genome cDNA-mediated Annealing, Selection, extension, and Ligation
(DASL) v4.0 assay. Tumor samples were either whole 10 micron sections or 1 millimeter
(mm) cores from formalin-fixed paraffin embedded (FFPE) tumor blocks. Whole sections
were macrodissected to select the tumor region on the slide, guided by a pathologist-read
hematoxylin and eosin (H&E) stained slide from the same block. RNA was extracted
using the Roche High Pure RNA Isolation Kit (Indianapolis, USA). Samples were plated
Page 13 of 70 Carcinogenesis
123456789101112131415161718192021222324252627282930313233343536373839404142434445464748495051525354555657585960
at UQ
Library on D
ecember 17, 2013
http://carcin.oxfordjournals.org/D
ownloaded from

For Peer Review
11
randomly by study on 96-well plates with two universal human reference samples and
two duplicate tumor RNA samples. DASL expression profiling was performed by the
Mayo Clinic Medical Genome Facility Gene Expression Core (Rochester, MN).
Statistical analyses
SNP analyses: Estimated per-allele log (odds ratios) and standard errors were calculated
using unconditional logistic regression of the allele counts (dosage for imputed data).
Analyses were adjusted by country of origin and principal components as previously
described (10). Analyses assumed a log-additive genetic model and P-values were based
on the one degree-of-freedom Wald test.
Expression data: Raw intensity values for tumor samples were summarized using box-
plots. After log2-transformation of raw intensity values, a per-sample quality (stress)
measure was calculated (18). Samples with stress >0.5, denoting a 2-fold change in the
overall expression values after normalization, and replicates with the higher stress
measure, were excluded (n=34). Log2-transformed intensity values were median-quantile
normalized. Probes with a p-value of detection >0.05 in all samples were excluded
(n=713) for a total of 28,664 probes analyzed. Samples were median-centered by 96-well
plate to correct for batch effects. Tumors with ESR1 (ILMN_1678535) expression values
more than 1.5 standard deviations from the median were excluded (n=72). Of the 596
remaining TN tumors, 486 also had genotype data from the pooled GWAS and iCOGS
data and were used in subsequent analyses.
Page 14 of 70Carcinogenesis
123456789101112131415161718192021222324252627282930313233343536373839404142434445464748495051525354555657585960
at UQ
Library on D
ecember 17, 2013
http://carcin.oxfordjournals.org/D
ownloaded from

For Peer Review
12
Expression quantitative trait loci (eQTL) analyses: Cis associations between SNPs and
probe expression, defined as probes within 1Mb of the SNP of interest, were calculated
for the 24 loci of interest (Table 1). Associations were evaluated using a robust linear
model to appropriately account for outliers in the expression data. For the 30 TN-
associated SNPs reported in this study, cis-eQTL associations at p<0.05 were considered
significant. For all remaining SNPs, a false discovery rate (FDR) was generated using
100 permutations and cis-eQTLs were excluded at a 10% FDR threshold (equivalent to
p<1.0 x 10⁻³
).
Polygenic risk score: Polygenic risk scores (PRS) were calculated using a leave-one-out
cross validation approach. Two scores were calculated, one using all known breast cancer
risk SNPs and one using the 30 TN breast cancer-associated risk SNPs reported in this
study. For the first model, a total of 74 SNPs were used (Table S3), including proxy
SNPs (R2>0.8) from three of seven loci (1p13.2, RALY, MKL1) missing genotype data for
the original breast cancer risk SNPs. For the second model only the 30 SNPs associated
with TN risk were included. For each subject, TN odds ratios were estimated for each
SNP after dropping that subject from the data set. The log odds ratio for the tested allele
for each SNP was multiplied by the number of tested alleles (0, 1, or 2) for the subject.
The PRS for a subject was calculated as the sum across SNPs. Quintiles were determined
based on the distribution of the PRS in controls. Odds ratios for TN breast cancer were
calculated comparing each quintile to the median (3rd
) quintile or the lowest (1st) quintile
as the reference.
Page 15 of 70 Carcinogenesis
123456789101112131415161718192021222324252627282930313233343536373839404142434445464748495051525354555657585960
at UQ
Library on D
ecember 17, 2013
http://carcin.oxfordjournals.org/D
ownloaded from

For Peer Review
13
Cumulative risk estimates of TN breast cancer in US Caucasian women were calculated
using a multi-step approach. Both age-specific SEER breast cancer incidence rates
(http://seer.cancer.gov) and age-specific ratios of TN breast cancer to overall breast
cancer from the California Cancer Registry (CCR) were obtained (3). Age-specific
incidence rates for TN breast cancer were estimated by multiplying the overall age-
specific breast cancer incidence rates from SEER by the calculated proportion of TN
breast cancer among all breast cancers within age groups from the CCR. Finally, we
estimated the cumulative risk of TN breast cancer by integrating these age-specific
incidence rates for TN breast cancer. Changes in cumulative risk by PRS quintile were
calculated using the OR estimates obtained as described above. Quintile-specific
cumulative risk estimates were calculated by multiplying cumulative risk estimates by
both the OR for that quintile and the attributable risk (AR) for the PRS. Attributable risk
for the PRS was calculated using the following formula, where the OR for each case was
assigned according to the quintile to which that case belonged:
Discriminatory accuracy of the PRS was assessed using receiver operating characteristic
(ROC) curves and corresponding areas under the curve (AUC) and 95% confidence
intervals, generated using the fitted probabilities of TN cases status from a logistic
regression model using the PRS as a continuous predictor variable.
Results
TNBCC two-stage GWAS
Page 16 of 70Carcinogenesis
123456789101112131415161718192021222324252627282930313233343536373839404142434445464748495051525354555657585960
at UQ
Library on D
ecember 17, 2013
http://carcin.oxfordjournals.org/D
ownloaded from

For Peer Review
14
Stage 1 of the TN GWAS (8,10,14) was comprised of 1,529 TN cases and 3,399 country-
matched controls (Table S1). There was no evidence for genomic inflation (λ=1.04) (10),
and no SNPs achieved genome-wide significance (p < 5 x 10⁻⁸
). Candidate SNPs were
selected for Stage 2 replication based on a log-additive trend-test of directly genotyped
SNPs (p<0.01). A total of 4,785 SNPs were included in Stage 2 on the iCOGS
genotyping array (11) and genotyped on 2,148 TN cases and 1,309 country-matched
controls from the TNBCC (Table S1). In Stage 2 alone, no SNPs achieved significance
after Bonferroni correction for 4,785 tests. However, there was substantial enrichment
when comparing the observed with the expected number of SNPs at various levels of
significance. Specifically, there were 357 SNPs (7.4%) at p<0.05 compared to the
expected number of 240 SNPs (1.5-fold enrichment), 48 SNPs at p<5x10⁻³
compared to
24 expected (2-fold enrichment) and 9 SNPs compared to 2.4 expected (3.75-fold
enrichment) at p<5x10⁻⁴
.
A pooled analysis of the TNBCC GWAS and iCOGS data for a total of 3,677 TN cases
and 4,708 controls was performed. SNPs in the 19p13.1 (rs2363956 OR=0.82,
p=2.33x10⁻⁸
) and PTHLH (rs10771399 OR=0.72, p=1.55x10⁻⁸
) loci displayed genome-
wide significant associations with TN breast cancer (Table 1). SNPs in the 19p13.1 locus
have previously been specifically associated with both TN breast cancer and BRCA1-
related breast cancer. SNPs in the PTHLH locus have previously been associated with
breast cancer (9), but this is the first report of an association with TN breast cancer. After
Bonferroni correction for 4,785 tests, an additional five SNPs in MDM4, ESR1, PTHLH,
and 19p13.1 were significantly associated with risk of TN breast cancer (Table S4).
Page 17 of 70 Carcinogenesis
123456789101112131415161718192021222324252627282930313233343536373839404142434445464748495051525354555657585960
at UQ
Library on D
ecember 17, 2013
http://carcin.oxfordjournals.org/D
ownloaded from
For Peer Review
15
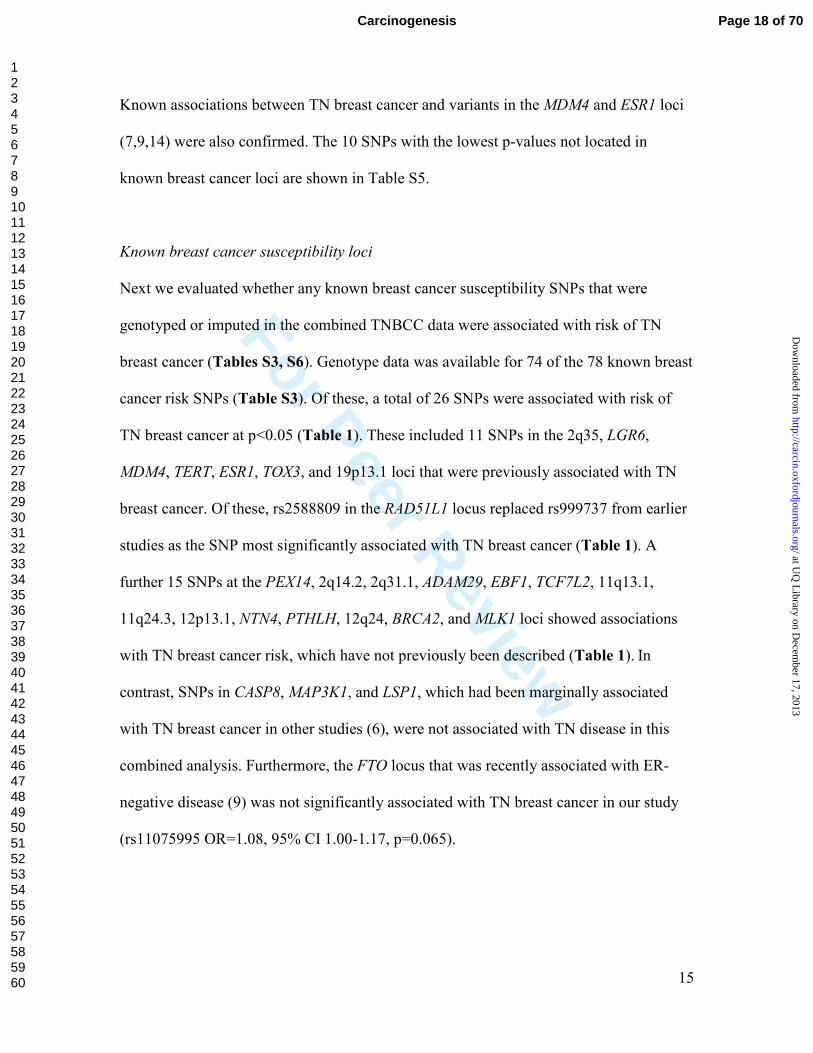
Known associations between TN breast cancer and variants in the MDM4 and ESR1 loci
(7,9,14) were also confirmed. The 10 SNPs with the lowest p-values not located in
known breast cancer loci are shown in Table S5.
Known breast cancer susceptibility loci
Next we evaluated whether any known breast cancer susceptibility SNPs that were
genotyped or imputed in the combined TNBCC data were associated with risk of TN
breast cancer (Tables S3, S6). Genotype data was available for 74 of the 78 known breast
cancer risk SNPs (Table S3). Of these, a total of 26 SNPs were associated with risk of
TN breast cancer at p<0.05 (Table 1). These included 11 SNPs in the 2q35, LGR6,
MDM4, TERT, ESR1, TOX3, and 19p13.1 loci that were previously associated with TN
breast cancer. Of these, rs2588809 in the RAD51L1 locus replaced rs999737 from earlier
studies as the SNP most significantly associated with TN breast cancer (Table 1). A
further 15 SNPs at the PEX14, 2q14.2, 2q31.1, ADAM29, EBF1, TCF7L2, 11q13.1,
11q24.3, 12p13.1, NTN4, PTHLH, 12q24, BRCA2, and MLK1 loci showed associations
with TN breast cancer risk, which have not previously been described (Table 1). In
contrast, SNPs in CASP8, MAP3K1, and LSP1, which had been marginally associated
with TN breast cancer in other studies (6), were not associated with TN disease in this
combined analysis. Furthermore, the FTO locus that was recently associated with ER-
negative disease (9) was not significantly associated with TN breast cancer in our study
(rs11075995 OR=1.08, 95% CI 1.00-1.17, p=0.065).
Page 18 of 70Carcinogenesis
123456789101112131415161718192021222324252627282930313233343536373839404142434445464748495051525354555657585960
at UQ
Library on D
ecember 17, 2013
http://carcin.oxfordjournals.org/D
ownloaded from

For Peer Review
16
Two of the TN breast cancer risk loci we identified contained additional SNPs with lower
p-values for TN breast cancer than the reported SNP (ESR1, PEX14) (Table S7a). In
1000 Genomes data from Caucasians (19) these new SNPs were in high linkage
disequilibrium (LD) with the originally reported SNPs suggesting that the additional
SNPs better capture the associations with TN breast cancer. Additionally, while the
reported SNP in the CASP8 locus was not associated with TN breast cancer risk, another
highly correlated SNP (rs3731711) (R2=0.93) was significantly associated with risk (p=1.0
x 10-4
) (Table S7b). Finally, a SNP in the RALY locus, for which the reported SNP was
not genotyped in our study, was significantly associated with TN risk (rs6142050 p=3.8 x
10-3
) (Table S7c). The RALY SNP was in high LD with the reported SNP in these
regions.
To better understand the patterns of risk associated with genetic variation in these TN-
associated loci, we looked for independent signals in each locus by adjusting each SNP in
a 250kb region for the SNP with the lowest p-value. We found evidence for additional
independent associations in the 19p13.1 locus (Figure S1) and the ESR1 locus (Figure
S2). In a multivariable model for 19p13.1, including rs8100241 and rs1864112, both
SNPs remained strongly associated with risk of TN breast cancer (Table 2). The newly
identified rs1864112 is not in LD with rs8100241 (R2= 0.025) or rs8170 (R
2= 0.093).
Using data from the ENCODE project (20), we found that rs1864112 is located in a
region overlapping a DNaseI hypersensitivity site and promoter-associated histone mark
(H3KMe1) site in primary human mammary epithelial cells (HMEC), indicating that this
SNP may a role in transcriptional regulation. In ESR1, both rs9397437 and rs12525163
Page 19 of 70 Carcinogenesis
123456789101112131415161718192021222324252627282930313233343536373839404142434445464748495051525354555657585960
at UQ
Library on D
ecember 17, 2013
http://carcin.oxfordjournals.org/D
ownloaded from

For Peer Review
17
were associated with TN risk, with the significance of the association for rs12525163
increasing in the multivariate model (Table 2). This SNP is not in LD with either of the
ESR1 SNPs previously associated with breast cancer risk (rs9397437, R2=0.005;
rs2046210, R2=0.021), and does not overlap with any DNaseI hypersensitivity,
H3K4Me1, or H3K4Me3 sites. These data provide evidence for two novel TN risk SNPs
in 19p13.1 and ESR1.
Expression quantitative trait loci for TN risk loci
To better understand the potential biological mechanisms that underlie the associations
between SNPs in the 25 loci (Tables 1-2, Table S7b-c) and risk of TN breast cancer, we
conducted an expression quantitative trait locus (eQTL) analysis. Genome-wide mRNA
expression data were available for 578 TN cases from corresponding clinically defined
TN breast tumors, of which 62 were excluded because of ESR1 expression in the tumors
(see methods), for a total of 516 TN cases included in the eQTL analysis (Table S2). We
then examined each of the 30 SNPs present in the 25 TN loci of interest (Tables 1-2,
Table S7b-c) for associations with gene expression. We found evidence for 51 cis-
associations with the 30 TN risk SNPs (p<0.05) (Table S8), involving 46 genes in the 25
loci. Functional annotation of the eQTL SNPs by HaploReg (21) showed that eQTL
SNPs were more likely located in normal mammary epithelial cell enhancer elements
(HMEC: 9 observed vs. 3.1 expected, p=3.6x10⁻³
) and DNase hypersensitivity sites
(HMEC: 7 observed vs. 1 expected, p=7.5x10⁻⁵
).
Page 20 of 70Carcinogenesis
123456789101112131415161718192021222324252627282930313233343536373839404142434445464748495051525354555657585960
at UQ
Library on D
ecember 17, 2013
http://carcin.oxfordjournals.org/D
ownloaded from
For Peer Review
18
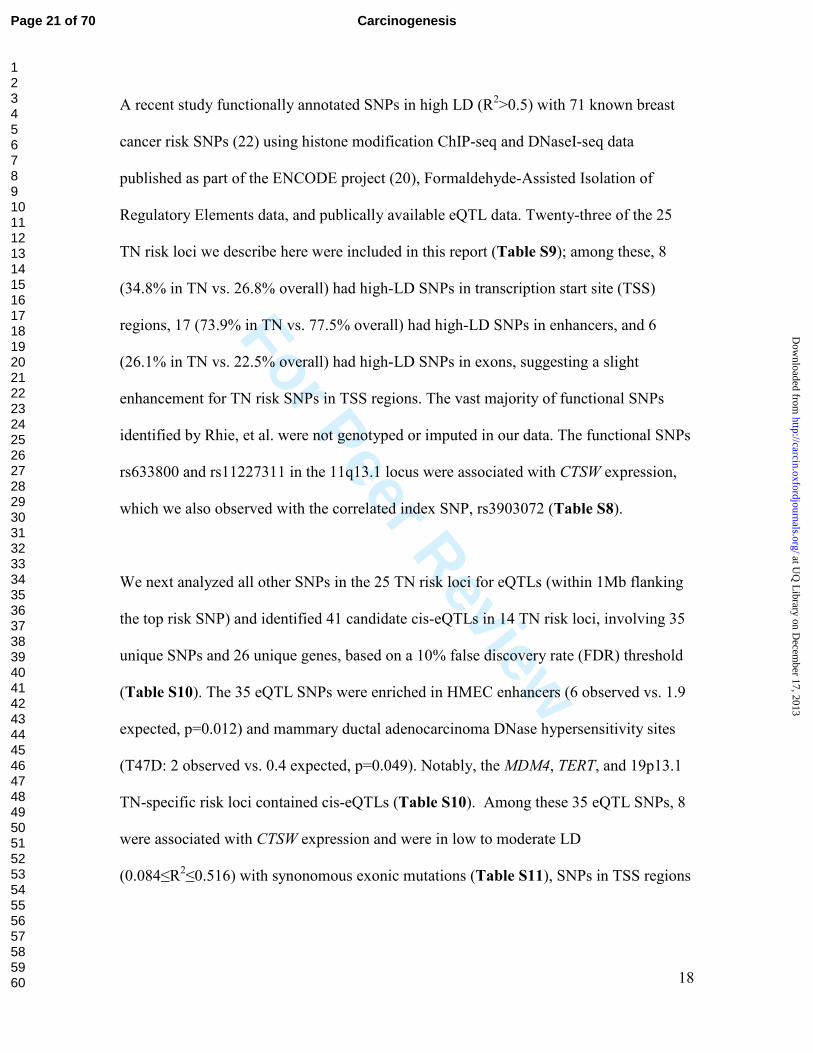
A recent study functionally annotated SNPs in high LD (R2>0.5) with 71 known breast
cancer risk SNPs (22) using histone modification ChIP-seq and DNaseI-seq data
published as part of the ENCODE project (20), Formaldehyde-Assisted Isolation of
Regulatory Elements data, and publically available eQTL data. Twenty-three of the 25
TN risk loci we describe here were included in this report (Table S9); among these, 8
(34.8% in TN vs. 26.8% overall) had high-LD SNPs in transcription start site (TSS)
regions, 17 (73.9% in TN vs. 77.5% overall) had high-LD SNPs in enhancers, and 6
(26.1% in TN vs. 22.5% overall) had high-LD SNPs in exons, suggesting a slight
enhancement for TN risk SNPs in TSS regions. The vast majority of functional SNPs
identified by Rhie, et al. were not genotyped or imputed in our data. The functional SNPs
rs633800 and rs11227311 in the 11q13.1 locus were associated with CTSW expression,
which we also observed with the correlated index SNP, rs3903072 (Table S8).
We next analyzed all other SNPs in the 25 TN risk loci for eQTLs (within 1Mb flanking
the top risk SNP) and identified 41 candidate cis-eQTLs in 14 TN risk loci, involving 35
unique SNPs and 26 unique genes, based on a 10% false discovery rate (FDR) threshold
(Table S10). The 35 eQTL SNPs were enriched in HMEC enhancers (6 observed vs. 1.9
expected, p=0.012) and mammary ductal adenocarcinoma DNase hypersensitivity sites
(T47D: 2 observed vs. 0.4 expected, p=0.049). Notably, the MDM4, TERT, and 19p13.1
TN-specific risk loci contained cis-eQTLs (Table S10). Among these 35 eQTL SNPs, 8
were associated with CTSW expression and were in low to moderate LD
(0.084≤R2≤0.516) with synonomous exonic mutations (Table S11), SNPs in TSS regions
Page 21 of 70 Carcinogenesis
123456789101112131415161718192021222324252627282930313233343536373839404142434445464748495051525354555657585960
at UQ
Library on D
ecember 17, 2013
http://carcin.oxfordjournals.org/D
ownloaded from

For Peer Review
19
(Table S12), and SNPs in enhancers (Table S13) identified by Rhie, et al. (22). No other
eQTL SNPs we identified were correlated with putative functional SNPs.
Sensitivity Analysis
We conducted a sensitivity analysis of all 30 TN risk SNPs identified in this study
(Tables 1-2, Table S7b-c) to evaluate the influence of potential misclassification with
respect to ER status. We first examined the 30 SNPs in 578 TN cases with expression
data and 4,638 country-matched controls. The ORs for these SNPs were very similar to
the ORs observed in the overall TN analysis (Table S14), although the reduction in
sample size produced some variability. We then repeated the analysis after excluding 62
TN cases because of ESR1 expression in the tumors. All ORs were in the same direction
and similar in magnitude for the majority of these SNPs, with the exception of 2q14.2
and ADAM29 moving slightly closer towards the null. While the numbers are low, the
results further strengthen the evidence that these 30 SNPs are associated with TN breast
cancer risk.
Polygenic risk score
These results provide strong evidence that at least 24 of the 74 known breast cancer
susceptibility SNPs are individually associated with risk of TN breast cancer (Table 1).
We implemented a polygenic risk score (PRS) to approximate the combined effect of
these SNPs on risk of TN disease. The PRS was calculated using all reported SNPs in
known breast cancer loci for which genotype data were available (n=74, Table S3), both
to avoid bias from data-driven SNP selection and to account for SNPs that may be
Page 22 of 70Carcinogenesis
123456789101112131415161718192021222324252627282930313233343536373839404142434445464748495051525354555657585960
at UQ
Library on D
ecember 17, 2013
http://carcin.oxfordjournals.org/D
ownloaded from

For Peer Review
20
associated with TN risk that did not achieve significance in our study due to limited study
size. Compared to the median quintile, an individual in the first or second quintile of the
PRS was 0.51-fold or 0.76-fold less likely to have TN breast cancer, respectively (Table
3). In contrast, an individual in the fourth or fifth quintile of the PRS was 1.29-fold or
2.05-fold more likely to have TN breast cancer compared to subjects in the median
quintile. Further, our data show that there is more than 4-fold difference in risk
comparing those in the highest versus lowest quintiles (Table S15). The ROC curves for
predicting TN breast cancer using the 74-SNP PRS produced an AUC of 0.64 (95% CI
0.63-0.65) (Figure S3). Applying the PRS to the population-based cumulative risk (up to
age 90 years) of TN breast cancer among Caucasian women, defined as approximately
1.8% (see methods), yielded an estimated cumulative risk of TN breast cancer of 3.4%
for women in the highest PRS quintile and 0.8% for women in the lowest PRS quintile
(Figure 1).
To better understand how the additional TN risk SNPs reported in this study contribute to
cumulative risk beyond the 74 overall breast cancer variants, the PRS was recalculated
using all 30 TN risk SNPs identified in this study (Tables 1-2, Table S7b-c). Estimates
were slightly stronger for each PRS quintile compared to the 74-SNP PRS (Table 3), and
the discriminatory accuracy of the 30-SNP PRS was comparable to the 74-SNP PRS
(Figure S3). This suggests that the identification of additional TN risk loci may improve
the stratification of cumulative risk estimates for TN breast cancer (Figure S4). These
findings also suggest that additional prospective studies are needed in order to understand
the implications of these genetic data for risk prediction of TN and other subtypes of
Page 23 of 70 Carcinogenesis
123456789101112131415161718192021222324252627282930313233343536373839404142434445464748495051525354555657585960
at UQ
Library on D
ecember 17, 2013
http://carcin.oxfordjournals.org/D
ownloaded from

For Peer Review
21
breast cancer. Considering all known TN risk variants simultaneously is a significant step
towards understanding how common genetic variants can be used for TN risk prediction,
which will be enhanced by the incorporation of traditional epidemiologic risk factors in
future studies.
Discussion
In this report, we present results from the first two-stage GWAS of TN breast cancer in
Caucasian women. Variants in the PTHLH and 19p13.1 loci showed genome wide
significant associations (p<5.0 x 10⁻⁸
) with TN disease (Tables 1 and 2). Ten SNPs with
near-genome associations with TN breast cancer (Table S5) warrant follow-up in larger
studies of TN breast cancer. In addition, 26 of 74 known overall breast cancer risk SNPs
were associated with TN breast cancer (Table1, Table S6). Specifically, this study
confirmed TN associations with SNPs in ten loci (LGR6, MDM4, CASP8, 2q35, 2p24.1,
TERT-rs10069690, ESR1, TOX3, 19p13.1, RALY) and identified TN associations with 15
other loci. Furthermore, two novel signals that are independent of previously known risk
associated SNPs were identified in the ESR1 and 19p13.1 loci (Table 2). Given the
complexity of known breast cancer risk loci such as CCND1 and TERT (12,13), further
studies involving extensive fine-mapping, haplotyping, and functional characterization
are needed for full understanding of the relationship between genetic variation in these
loci and risk of TN breast cancer.
Page 24 of 70Carcinogenesis
123456789101112131415161718192021222324252627282930313233343536373839404142434445464748495051525354555657585960
at UQ
Library on D
ecember 17, 2013
http://carcin.oxfordjournals.org/D
ownloaded from

For Peer Review
22
To gain some insight into whether the TN risk SNPs we identified have stronger effects
for TN breast cancer compared to ER-negative breast cancer, we compared 25 of the
SNPs in our combined analysis for which data were available from a recent ER-negative
meta-analysis (9). As expected, stronger ORs were observed in our TN study compared
to the ER-negative study for MDM4, TERT (rs10069690), and 19p13.1 (Table 1), which
have previously been shown to be TN-specific loci (7-9). In addition, stronger ORs were
observed in our TN study for 2q14.2, ESR1, TCF7L2, 11q13.1, 12p13.1, and PTHLH in
TN compared to the ER-negative study. Furthermore, four of the TN loci (2q31.1,
ADAM29, 12q24, and RAD51L1 rs2588809) had no reported association with ER-
negative breast cancer. Studies that directly compare ER-negative, non-TN to TN breast
cancer are required to determine whether any of these loci are TN-specific.
In addition, we have provided evidence for SNP-mediated regulation of gene expression
in these TN risk loci through cis-eQTL analyses involving over 500 TN breast tumors.
Many of the 27 TN risk SNPs (Table S8) and an additional 35 SNPs in the TN risk loci
(Table S10) that were associated with gene expression were located in transcriptional
enhancers and DNase hypersensitivity sites in normal mammary epithelial cell lines,
suggesting direct effects on gene transcription. Several interesting candidate genes were
identified as cis-eQTLs. PTHLH, which encodes parathyroid hormone-like hormone,
influences mammary gland development through regulation of epithelial to mesenchymal
cellular interactions, is involved in lactation, and is expressed in 60% of breast cancers
(23-25). IGFBP2 (insulin-like growth factor binding protein 2) in the 2q35 locus displays
elevated expression in breast tumors and promotes the growth and survival of breast
Page 25 of 70 Carcinogenesis
123456789101112131415161718192021222324252627282930313233343536373839404142434445464748495051525354555657585960
at UQ
Library on D
ecember 17, 2013
http://carcin.oxfordjournals.org/D
ownloaded from

For Peer Review
23
epithelial cells though regulation of the estrogen receptor ER-α (26,27). TBX3 in the
12q24 locus encodes T-box 3, a transcription factor involved in developmental
regulation. that is overexpressed in breast tumors (28) and can induce mammary stem-
like cells and mammary gland hyperplasia in mice (29). While the cis-eQTL results
suggest mechanisms by which certain loci influence TN breast cancer risk, additional
functional validation of these SNP-gene expression relationships in breast cancer cell
lines is needed.
Beyond etiology, the identification of 30 TN risk SNPs provides an opportunity to better
understand how genetic variation may inform TN breast cancer risk prediction. As we
have shown through our PRS, where we observed a 4-fold difference in risk between the
highest and lowest PRS quintiles of the TN breast cancer population, it may be possible
to identify women who are substantially above or below population-level risk of TN
breast cancer. Our PRS had better discriminatory accuracy (AUC=0.64) compared to that
of the Gail model applied in the Women’s Health Initiative (overall AUC=0.58, 95% CI
0.58-0.62; ER-negative AUC=0.50, 95% CI 0.45-0.54) (30). It is also likely that the
inclusion of additional TN breast cancer risk SNPs will further stratify these women with
respect to cumulative incidence of TN breast cancer. It will also be important to combine
these triple negative risk SNPs with known epidemiologic risk factors such as parity, age
at menarche, BMI during premenopausal years, and duration of breast feeding (1,5) to
understand the cumulative influence on TN breast cancer risk. An important limitation of
this study was that the PRS was applied to the study population from which the TN breast
cancer risk estimates were derived. While our cross-validation approach mitigates
Page 26 of 70Carcinogenesis
123456789101112131415161718192021222324252627282930313233343536373839404142434445464748495051525354555657585960
at UQ
Library on D
ecember 17, 2013
http://carcin.oxfordjournals.org/D
ownloaded from

For Peer Review
24
potential bias arising from this approach, it will be important to develop a risk model with
these SNPs and validate the model in an independent study population. Overall, the
findings provide strong evidence that integration of SNPs into predictive models will
have a substantial impact on our ability to identify women at elevated risk of TN breast
cancer.
Supplementary material
Supplementary Tables 1- 15 and Supplementary Figures 1-3 can be found at
http://carcin.oxfordjournals.org/
Funding
This work was supported by the Breast Cancer Research Foundation (BCRF), NIH R01
CA128978, NCI specialized program of research excellence (SPORE) in Breast Cancer
(P50 CA116201), and Mayo Cancer Genetic Epidemiology Training Grant, R25
CA092049. MCBCS was supported by the David and Margaret T. Grohne Family
Foundation and the Ting Tsung and Wei Fong Chao Foundation.
The GENICA was funded by the Federal Ministry of Education and Research (BMBF)
Germany grants 01KW9975/5, 01KW9976/8, 01KW9977/0 and 01KW0114, the Robert
Bosch Foundation, Stuttgart, Deutsches Krebsforschungszentrum (DKFZ), Heidelberg,
Institute for Prevention and Occupational Medicine of the German Social Accident
Insurance (IPA), Bochum, as well as the Department of Internal Medicine, Evangelische
Kliniken Bonn gGmbH, Johanniter Krankenhaus, Bonn, Germany.
Page 27 of 70 Carcinogenesis
123456789101112131415161718192021222324252627282930313233343536373839404142434445464748495051525354555657585960
at UQ
Library on D
ecember 17, 2013
http://carcin.oxfordjournals.org/D
ownloaded from

For Peer Review
25
OSU studies were supported by the OSU Comprehensive Cancer Center and the Stefanie
Spielman fund.
SBCS was supported by Yorkshire Cancer Research Programme S305PA.
SKKDKFZS is supported by the DKFZ.
Demokritos: This research has been co-financed by the European Union (European
Social Fund – ESF) and Greek national funds through the Operational Program
"Education and Lifelong Learning" of the National Strategic Reference Framework
(NSRF) - Research Funding Program: Thales. Investing in knowledge society through the
European Social Fund.
The authors acknowledge support from The University of Kansas Cancer Center’s (P30
CA168524) Biospecimen Repository Core Facility. A.K.G. was funded by NIH
5U01CA113916 and R01CA14032, a grant from the Kansas Bioscience Authority
Eminent Scholar Program and by the Chancellors Distinguished Chair in Biomedical
Sciences Professorship.
The Australian Twin Cohort Study was supported by National Health and Medical
Research Council of Australia.
The KBCP was financially supported by the special Government Funding (EVO) of
Kuopio University Hospital grants, Cancer Fund of North Savo, the Finnish Cancer
Page 28 of 70Carcinogenesis
123456789101112131415161718192021222324252627282930313233343536373839404142434445464748495051525354555657585960
at UQ
Library on D
ecember 17, 2013
http://carcin.oxfordjournals.org/D
ownloaded from
For Peer Review
26
Organizations, the Academy of Finland and by the strategic funding of the University of
Eastern Finland.
The HEBCS study has been financially supported by the Helsinki University Central
Hospital Research Fund, Academy of Finland (132473), the Finnish Cancer Society and
the Sigrid Juselius Foundation. The population allele and genotype frequencies were
obtained from the data source funded by the Nodic Center of Excellence in Disease
Genetics based on samples regionally selected from Finland, Sweden, and Denmark.
Acknowledgements
We acknowledge the support of the Mayo Clinic Genotyping Core and Mayo Clinic
Expression Core SKKDKFZS: We are grateful to all the patients for their participation.
We thank the physicians, other hospital staff and research assistants who contributed to
the patient recruitment, data collection and sample preparation. KBCP thanks Eija
Myöhänen and Helena Kemiläinen for technical assistance.HEBCS thanks research
nurses Hanna Jäntti and Irja Erkkilä for their help with the patient data and samples and
Drs. Ari Ristimäki, Tuomas Heikkinen, Mira Heinonen and Laura Hautala for their
help with the tumor marker and pathology information,and gratefully acknowledges the
Finnish Cancer Registry for the cancer data.
Conflict of Interest Statement: None declare
Page 29 of 70 Carcinogenesis
123456789101112131415161718192021222324252627282930313233343536373839404142434445464748495051525354555657585960
at UQ
Library on D
ecember 17, 2013
http://carcin.oxfordjournals.org/D
ownloaded from

For Peer Review
27
References 1. Foulkes, W.D., et al. (2010) Triple-negative breast cancer. N Engl J Med, 363,
1938-48.
2. (2012) American Cancer Society. Breast Cancer Facts & Figures, 2011-2012.
American Cancer Society, Atlanta, GA.
3. Bauer, K.R., et al. (2007) Descriptive analysis of estrogen receptor (ER)-negative,
progesterone receptor (PR)-negative, and HER2-negative invasive breast cancer,
the so-called triple-negative phenotype: a population-based study from the
California cancer Registry. Cancer, 109, 1721-8.
4. Nofech-Mozes, S., et al. (2009) Patterns of recurrence in the basal and non-basal
subtypes of triple-negative breast cancers. Breast Cancer Res Treat, 118, 131-7.
5. Millikan, R.C., et al. (2008) Epidemiology of basal-like breast cancer. Breast
Cancer Res Treat, 109, 123-39.
6. Stevens, K.N., et al. (2013) Genetic Susceptibility to Triple-Negative Breast
Cancer. Cancer research.
7. Stevens, K.N., et al. (2012) 19p13.1 is a triple negative-specific breast cancer
susceptibility locus. Cancer Res.
8. Haiman, C.A., et al. (2011) A common variant at the TERT-CLPTM1L locus is
associated with estrogen receptor-negative breast cancer. Nat Genet, 43, 1210-4.
9. Garcia-Closas, M., et al. (2013) Genome-wide association studies identify four
ER negative-specific breast cancer risk loci. Nature genetics, 45, 392-8.
10. Siddiq, A., et al. (2012) A meta-analysis of genome-wide association studies of
breast cancer identifies two novel susceptibility loci at 6q14 and 20q11. Hum Mol
Genet.
11. Michailidou, K., et al. (2013) Large-scale genotyping identifies 41 new loci
associated with breast cancer risk. Nature genetics, 45, 353-61.
12. Bojesen, S.E., et al. (2013) Multiple independent variants at the TERT locus are
associated with telomere length and risks of breast and ovarian cancer. Nature
genetics, 45, 371-84.
13. French, J.D., et al. (2013) Functional Variants at the 11q13 Risk Locus for Breast
Cancer Regulate Cyclin D1 Expression through Long-Range Enhancers.
American journal of human genetics.
14. Stevens, K.N., et al. (2011) Common breast cancer susceptibility loci are
associated with triple-negative breast cancer. Cancer Res, 71, 6240-9.
15. Figueroa, J.D., et al. (2011) Associations of common variants at 1p11.2 and
14q24.1 (RAD51L1) with breast cancer risk and heterogeneity by tumor subtype:
findings from the Breast Cancer Association Consortium. Hum Mol Genet, 20,
4693-706.
16. Broeks, A., et al. (2011) Low penetrance breast cancer susceptibility loci are
associated with specific breast tumor subtypes: findings from the Breast Cancer
Association Consortium. Hum Mol Genet, 20, 3289-303.
17. Milne, R.L., et al. (2011) Confirmation of 5p12 as a susceptibility locus for
progesterone-receptor-positive, lower grade breast cancer. Cancer Epidemiol
Biomarkers Prev, 20, 2222-31.
Page 30 of 70Carcinogenesis
123456789101112131415161718192021222324252627282930313233343536373839404142434445464748495051525354555657585960
at UQ
Library on D
ecember 17, 2013
http://carcin.oxfordjournals.org/D
ownloaded from

For Peer Review
28
18. Mahoney, D.W., et al. (2013) Quality assessment metrics for whole genome gene
expression profiling of paraffin embedded samples. BMC research notes, 6, 33.
19. Johnson, A.D., et al. (2008) SNAP: a web-based tool for identification and
annotation of proxy SNPs using HapMap. Bioinformatics, 24, 2938-9.
20. Consortium, E.P., et al. (2012) An integrated encyclopedia of DNA elements in
the human genome. Nature, 489, 57-74.
21. Ward, L.D., et al. (2012) HaploReg: a resource for exploring chromatin states,
conservation, and regulatory motif alterations within sets of genetically linked
variants. Nucleic acids research, 40, D930-4.
22. Rhie, S.K., et al. (2013) Comprehensive functional annotation of seventy-one
breast cancer risk Loci. PLoS One, 8, e63925.
23. Fleming, N.I., et al. (2009) Parathyroid hormone-related protein protects against
mammary tumor emergence and is associated with monocyte infiltration in ductal
carcinoma in situ. Cancer Res, 69, 7473-9.
24. Sowers, M.F., et al. (1996) Elevated parathyroid hormone-related peptide
associated with lactation and bone density loss. JAMA, 276, 549-54.
25. Southby, J., et al. (1990) Immunohistochemical localization of parathyroid
hormone-related protein in human breast cancer. Cancer Res, 50, 7710-6.
26. Foulstone, E.J., et al. (2013) Insulin-Like Growth Factor Binding Protein 2
(IGFBP-2) Promotes Growth and Survival of Breast Epithelial Cells: Novel
Regulation of the Estrogen Receptor. Endocrinology, 154, 1780-93.
27. Busund, L.T., et al. (2005) Significant expression of IGFBP2 in breast cancer
compared with benign lesions. Journal of clinical pathology, 58, 361-6.
28. Yarosh, W., et al. (2008) TBX3 is overexpressed in breast cancer and represses
p14 ARF by interacting with histone deacetylases. Cancer Res, 68, 693-9.
29. Liu, J., et al. (2011) TBX3 over-expression causes mammary gland hyperplasia
and increases mammary stem-like cells in an inducible transgenic mouse model.
BMC Dev Biol, 11, 65.
30. Chlebowski, R.T., et al. (2007) Predicting risk of breast cancer in postmenopausal
women by hormone receptor status. J Natl Cancer Inst, 99, 1695-705.
Page 31 of 70 Carcinogenesis
123456789101112131415161718192021222324252627282930313233343536373839404142434445464748495051525354555657585960
at UQ
Library on D
ecember 17, 2013
http://carcin.oxfordjournals.org/D
ownloaded from

For Peer Review
29
Table 1. Known breast cancer susceptibility SNPs associated with TN breast cancer TN ER-negative (9)
SNP G/I Chr Position Locus Allele OR 95% CI P-value OR 95% CI P-value
a) Previously reported TN associations
rs6678914 G 1 200453799 LGR6 A 0.90 (0.84-0.97) 3.31 x10⁻³ 0.91 (0.88-0.94) 1.4 x 10⁻⁸
rs4245739 I 1 202785465 MDM4 C 1.19 (1.11-1.29) 4.00 x10⁻⁶ 1.14 (1.10-1.18) 2.1 x 10⁻¹²
rs13387042 G 2 217614077 2q35 G 0.93 (0.87-1.00) 0.049 0.95 (0.92-0.98) 0.002
rs12710696 I 2 19184284 2p24.1 A 1.11 (1.04-1.19) 3.51 x10⁻³ 1.10 (1.06-1.13) 4.6 x 10⁻⁸
rs10069690 I 5 1332790 TERT A 1.24 (1.14-1.34) 1.43 x10⁻⁷ 1.15 (1.11-1.20) 4.5 x 10⁻¹²
rs2736108a G 5 1350488 TERT T 0.77 (0.69-0.87) 8.33x10⁻⁶ 0.89b (0.83-0.93) 1.41x10⁻⁸
rs3757318 G 6 151955806 ESR1 A 1.33 (1.17-1.51) 9.25 x10⁻⁶ 1.22 (1.15-1.30) 2.5 x 10⁻¹¹
rs2046210 I 6 151990059 ESR1 A 1.16 (1.08-1.24) 5.26 x10⁻⁵ 1.15 (1.11-1.19) 4.9 x 10⁻¹⁶
rs3803662 G 16 51143842 TOX3 A 1.09 (1.01-1.17) 0.022 1.14 (1.10-1.18) 5.5 x 10⁻¹³
rs8170 G 19 17250704 19p13.1 A 1.26 (1.16-1.37) 1.26 x10⁻⁷ 1.15 (1.11-1.20) 9.3 x 10⁻¹³
rs2363956 G 19 17255124 19p13.1 C 0.82 (0.77-0.88) 2.33 x10⁻⁸ NA NA NA
b) Newly identified TN associations
rs616488 G 1 10488802 PEX14 G 0.91 (0.85-0.98) 9.73x10⁻³ 0.91 (0.88-0.94) 1.0 x 10⁻⁸
rs4849887 G 2 120961592 2q14.2 A 0.89 (0.79-1.00) 0.041 0.93 (0.88-0.99) 0.013
rs2016394 G 2 172681217 2q31.1 A 1.10 (1.03-1.18) 6.90 x10⁻³ 1.00 (0.97-1.04) 0.85
rs6828523 I 4 176083001 ADAM29 A 0.84 (0.75-0.93) 1.33 x10⁻³ 0.99 (0.95-1.04) 0.77
rs1432679 G 5 158176661 EBF1 G 1.10 (1.02-1.17) 8.62 x10⁻³ 1.08 (1.04-1.11) 6.7 x 10⁻⁶
rs7904519 G 10 114763917 TCF7L2 G 1.12 (1.05-1.20) 9.95 x10⁻⁴ 1.06 (1.03-1.09) 2.9 x 10⁻⁴
rs3903072 I 11 65339642 11q13.1 A 0.92 (0.86-0.99) 0.024 0.97 (0.94-1.00) 0.027
rs11820646 I 11 128966381 11q24.3 A 0.92 (0.86-0.98) 0.016 0.94 (0.91-0.97) 2.3 x 10⁻⁴
rs12422552 I 12 14305198 12p13.1 C 1.13 (1.04-1.21) 2.70 x10⁻³ 1.05 (1.02-1.09) 0.005
rs10771399 I 12 28046347 PTHLH G 0.72 (0.64-0.80) 1.55 x10⁻⁸ 0.83 (0.79-0.87) 2.4 x 10⁻¹²
rs17356907 G 12 94551890 NTN4 G 0.90 (0.84-0.97) 7.55 x10⁻³ 0.92 (0.89-0.96) 9.3 x 10⁻⁶
rs1292011 G 12 114320905 12q24 G 1.08 (1.01-1.16) 0.035 0.99 (0.96-1.02) 0.44
rs11571833 I 13 31870626 BRCA2 T 1.44 (1.05-1.96) 0.023 1.52 (1.31-1.77) 6.0 x 10⁻⁶
rs2588809 I 14 67730181 RAD51L1 A 0.91 (0.83-1.00) 0.041 1.00 (0.96-1.05) 0.94
rs6001930a G 22 39206180 MLK1 C 1.21 (1.02-1.43) 0.025 1.14 (1.08-1.20) 1.6x10⁻⁶ a Genotyped in stage 2 only on the iCOGS platform (2,148 cases, 1,309 controls)
b ER-negative breast cancer risk results for rs2736108 from Bojesen, et al. (12)
Table 2. Multiple independent SNPs in 19p13.1 and ESR1
Single-SNP analysis Multiple SNP regression
Locus SNP Previously reported OR 95% CI p-value OR 95% CI p-value
Page 32 of 70Carcinogenesis
123456789101112131415161718192021222324252627282930313233343536373839404142434445464748495051525354555657585960
at UQ Library on December 17, 2013 http://carcin.oxfordjournals.org/ Downloaded from

For Peer Review
30
19p13.1 rs8100241 Yes 0.82 0.77-0.88 1.8x10⁻⁸
0.81 0.75-0.97 1.8x10⁻⁹
rs1864112 No 0.86 0.79-0.92 6.8x10⁻⁵
0.84 0.78-0.90 5.5x10⁻⁶
ESR1 rs9397437 Yes 1.42 1.25-1.61 8.9x10⁻⁸
1.15 1.27-1.65 1.6x10⁻⁸
rs12525163 No 1.12 1.04-1.21 3.0x10⁻³
1.15 1.06-1.24 4.9x10⁻⁴
Page 33 of 70 Carcinogenesis
123456789101112131415161718192021222324252627282930313233343536373839404142434445464748495051525354555657585960
at UQ Library on December 17, 2013 http://carcin.oxfordjournals.org/ Downloaded from

For Peer Review
31
Table 3. Polygenic risk score for TN breast cancer
74 SNPs 30 SNPs
PRS
Quintile
Quintile
definitions OR 95% CI p-value
Quintile
definitions OR 95% CI p-value
1 PRS≤0.24 0.51 0.43-0.60 9.9x10⁻¹⁶
PRS≤-0.57 0.52 0.45-0.62 3.9x10⁻¹⁵
2 0.24<PRS≤0.58 0.76 0.67-0.90 1.1x10⁻³
-0.57<PRS≤-0.26 0.75 0.65-0.87 1.6x10⁻⁴
3 0.58<PRS≤0.86 1.00 -- -- -0.26<PRS≤0.039 1.00 -- --
4 0.86<PRS≤1.24 1.29 1.12-1.48 4.6x10⁻⁴
0.039<PRS≤0.40 1.37 1.20-1.57 6.7x10⁻⁶
5 1.24<PRS 2.05 1.80-2.33 1.8x10⁻²⁵
0.40<PRS 2.13 1.87-2.43 1.1x10⁻²⁹
Page 34 of 70Carcinogenesis
123456789101112131415161718192021222324252627282930313233343536373839404142434445464748495051525354555657585960
at UQ Library on December 17, 2013 http://carcin.oxfordjournals.org/ Downloaded from

For Peer Review
32
Figure legends
Figure 1. Cumulative incidence of TN breast cancer stratified by 74-SNP polygenic
risk score.
The effect of the 74-SNP polygenic risk score (PRS) on cumulative risk of triple negative
breast cancer (TNBC) among Caucasian women, stratified by PRS quintile, is shown.
The population-based cumulative risk curve is shown as a solid black line, and the first
through fifth quintile-specific cumulative risk estimates are shown as indicated by labels
Page 35 of 70 Carcinogenesis
123456789101112131415161718192021222324252627282930313233343536373839404142434445464748495051525354555657585960
at UQ
Library on D
ecember 17, 2013
http://carcin.oxfordjournals.org/D
ownloaded from

For Peer Review
338x338mm (72 x 72 DPI)
Page 36 of 70Carcinogenesis
123456789101112131415161718192021222324252627282930313233343536373839404142434445464748495051525354555657585960
at UQ
Library on D
ecember 17, 2013
http://carcin.oxfordjournals.org/D
ownloaded from

For Peer Review
Table S1. Triple Negative Breast Cancer Consortium (TNBCC) studies Stage Study
Abbreviation
Full Name Platform Country Cases
Controls
Stage 1 ABCTB Australian Breast Cancer Tissue Bank Illumina 660-Quad Australia 144
BBCC Bavarian Breast Cancer Cases and Controls Illumina 660-Quad Germany 218
CGEMS Cancer Genetic Markers of Susceptibility Illumina 550 v.1 USA 947
DFCI Harvard Breast Cancer SPORE Blood Repository Illumina 660-Quad USA 246
FCCC Fox Chase Cancer Center Illumina 660-Quad USA 120
GENICA Gene Environment Interaction and Breast Cancer in Germany Illumina 660-Quad Germany 26
HEBCS Helsinki Breast Cancer Study Illumina HumanHap 550k
DUO/ Illumina CNV370-Duo
Finland 83 219
KORA Cooperative Health Research in the Region of Augsburg Illumina 550 Germany 215
MARIE Mammary Carcinoma Risk Factor Investigation Illumina 660-Quad/ Illumina
CNV370
Germany 148
MCBCS Mayo Clinic Breast Cancer Study Illumina 660-Quad USA 147
MCCS Melbourne Collaborative Cohort Study Illumina 660-Quad Australia 39
POSH Prospective Study of Outcomes in Sporadic Versus Hereditary Breast Cancer Illumina 660-Quad UK 266
QIMR Australian Twin Cohort study from the Queensland Institute of Medical Research Illumina 610-Quad Australia 650
SBCS Sheffield Breast Cancer Study Illumina 660-Quad UK 42
WTCCC Wellcome Trust Case Control Consortium Illumina 1.2M UK 1368
TOTAL 1529 3399
Stage 2 CTS California Teachers Study iCOGS USA 68 71
DEMOKRITOS Demokritos iCOGS Greece 526 304
FCCC Fox Chase Cancer Center iCOGS USA 4 137
GENICA Gene Environment Interaction and Breast Cancer in Germany iCOGS Germany 33 30
KUMC Kansas University Medical Center iCOGS USA 74
MCBCS Mayo Clinic Breast Cancer Study iCOGS USA 53
NBCS Norwegian Breast Cancer Study iCOGS Norway 22 70
NBHS The Nashville Breast Health Study iCOGS USA 125 118
OSU Ohio State University iCOGS USA 276 279
RPCI Roswell Park Cancer Institute iCOGS USA 136 132
SBCS Sheffield Breast Cancer Study iCOGS UK 3
SKKDKFZS Städtisches Klinikum Karlsruhe and Deutsches Krebsforschungszentrum Breast Cancer Study
iCOGS Germany 136 168
SUCCESS C Simultaneous Study of Docetaxel Based Anthracycline Free
Adjuvant Treatment Evaluation, as well as Life Style Intervention
Strategies
iCOGS Germany 605
WASHU Washington University iCOGS USA 87
TOTAL 2148 1309
Page 37 of 70 Carcinogenesis
123456789101112131415161718192021222324252627282930313233343536373839404142434445464748495051525354555657585960
at UQ Library on December 17, 2013 http://carcin.oxfordjournals.org/ Downloaded from

For Peer Review
Table S2. TN subjects with DASL and SNP data
Post-QC samples Excluding ER+ samples
Sample type Total All SNP data All SNP data
ABCTB 10 µm sections 101 97 86 95 84
Demokritos 10 µm sections 139 137 117 127 109
HEBCS 10 µm sections 92 89 48 79 43
KBCP* 1 mm cores 40 37 35 32 30
MCBCS 10 µm sections 31 30 28 29 27
MCCS 10 µm sections 23 23 16 22 15
NBHS 10 µm sections 18 16 15 16 15
POSH 1 mm cores 121 107 106 104 103
SBCS 10 µm sections 36 34 33 32 32
SKK 10 µm sections 101 98 94 60 58
702 668 578 596 516
Page 38 of 70Carcinogenesis
123456789101112131415161718192021222324252627282930313233343536373839404142434445464748495051525354555657585960
at UQ
Library on D
ecember 17, 2013
http://carcin.oxfordjournals.org/D
ownloaded from

For Peer Review
Table S3. 78 Known breast cancer susceptibility variants
Locus SNP Platform Proxy Chr. Postion36 Alleles AF2 Source
PEX14 rs616488 GWAS +iCOGS 1 10488802 A/G 0.33 (1)
1p13.2 rs11552449 N/A rs3761936 1 114249912 C/T 0.17 (1)
1p11.2 rs11249433 GWAS +iCOGS 1 120982136 A/G 0.41 (2)
LGR6 rs6678914 GWAS +iCOGS 1 200453799 G/A 0.41 (3)
MDM4 rs4245739 GWAS +iCOGS 1 202785465 A/C 0.26 (3)
2p24.1 rs12710696 GWAS +iCOGS 2 19184284 C/T 0.36 (3)
2q14.2 rs4849887 GWAS +iCOGS 2 120961592 C/T 0.098 (1)
2q31.1 rs2016394 GWAS +iCOGS 2 172681217 G/A 0.48 (1)
CDCA7 rs1550623 GWAS +iCOGS 2 173921140 A/G 0.16 (1)
CASP8 rs1045485 GWAS +iCOGS 2 201857834 C/G 0.13 (4)
2q35 rs13387042 GWAS +iCOGS 2 217614077 A/G 0.47 (5)
2q35 rs16857609 GWAS +iCOGS 2 218004753 C/T 0.26 (1)
3p26.2 rs6762644 GWAS +iCOGS 3 4717276 A/G 0.4 (1)
SLC4A7 rs4973768 GWAS +iCOGS 3 27391017 C/T 0.48 (6)
TGFBR2 rs12493607 GWAS +iCOGS 3 30657943 G/C 0.35 (1)
TET2 rs9790517 GWAS +iCOGS 4 106304227 C/T 0.23 (1)
ADAM29 rs6828523 GWAS +iCOGS 4 176083001 C/A 0.13 (1)
TERT rs10069690 GWAS +iCOGS 5 1332790 C/T 0.27 (7)
TERT rs7705526 N/A N/A 5 1338974 C/A 0.33 (8)
TERT rs2736108 iCOGS N/A 5 1350488 C/T 0.29 (8)
5p12 rs10941679 GWAS +iCOGS 5 44742255 A/G 0.27 (9)
MAP3K1 rs889312 GWAS +iCOGS 5 56067641 A/C 0.29 (10)
RAB3C rs10472076 GWAS +iCOGS 5 58219818 T/C 0.38 (1)
PDE4D rs1353747 GWAS +iCOGS 5 58373238 T/G 0.095 (1)
EBF1 rs1432679 GWAS +iCOGS 5 158176661 T/C 0.43 (1)
FOXQ1 rs11242675 GWAS +iCOGS 6 1263878 T/C 0.39 (1)
RANBP1 rs204247 GWAS +iCOGS 6 13830502 A/G 0.43 (1)
6q14.1 rs17529111 GWAS +iCOGS 6 82185105 T/C 0.22 (1)
ESR1 rs3757318 GWAS +iCOGS 6 151955806 G/A 0.07 (11)
ESR1 rs2046210 GWAS +iCOGS 6 151990059 G/A 0.35 (12)
7q35 rs720475 GWAS +iCOGS 7 143705862 G/A 0.25 (1)
8p21.1 rs9693444 GWAS +iCOGS 8 29565535 C/A 0.32 (1)
8q21.11 rs6472903 GWAS +iCOGS 8 76392856 T/G 0.18 (1)
HNF4G rs2943559 GWAS +iCOGS 8 76580492 A/G 0.07 (1)
8q24 rs13281615 GWAS +iCOGS 8 128424800 A/G 0.42 (10)
8q24.21 rs11780156 GWAS +iCOGS 8 129263823 C/T 0.16 (1)
CDKN2A/B rs1011970 GWAS +iCOGS 9 22052134 G/T 0.17 (11)
9q31.2 rs10759243 GWAS +iCOGS 9 109345936 C/A 0.39 (1)
9q31 rs865686 GWAS +iCOGS 9 109928299 T/G 0.37 (13)
ANKRD16 rs2380205 GWAS +iCOGS 10 5926740 C/T 0.44 (11)
DNAJC1 rs7072776 GWAS +iCOGS 10 22072948 G/A 0.29 (1)
DNAJC1 rs11814448 GWAS +iCOGS 10 22355849 A/C 0.02 (1)
ZNF365 rs10995190 GWAS +iCOGS 10 63948688 G/A 0.15 (11)
Page 39 of 70 Carcinogenesis
123456789101112131415161718192021222324252627282930313233343536373839404142434445464748495051525354555657585960
at UQ
Library on D
ecember 17, 2013
http://carcin.oxfordjournals.org/D
ownloaded from

For Peer Review
ZMIZ1 rs704010 GWAS +iCOGS 10 80511154 C/T 0.39 (11)
TCF7L2 rs7904519 GWAS +iCOGS 10 114763917 A/G 0.46 (1)
10q26.12 rs11199914 GWAS +iCOGS 10 123083891 C/T 0.32 (1)
FGFR2 rs2981579 GWAS +iCOGS 10 123327325 G/A 0.43 (11)
FGFR2 rs2981582 GWAS +iCOGS 10 123342307 G/A 0.41 (10)
LSP1 rs3817198 GWAS +iCOGS 11 1865582 T/C 0.32 (10)
11q13.1 rs3903072 GWAS +iCOGS 11 65339642 G/T 0.47 (1)
CCDN1 rs614367 GWAS +iCOGS 11 69037945 C/T 0.16 (11)
CCND1 rs554219 GWAS +iCOGS 11 69040823 C/G 0.14 (14)
11q24.3 rs11820646 GWAS +iCOGS 11 128966381 C/T 0.41 (1)
CCND1 rs75915166 N/A N/A 11 69379161 A/C 0.31 (14)
12p13.1 rs12422552 GWAS +iCOGS 12 14305198 G/C 0.26 (1)
PTHLH rs10771399 GWAS +iCOGS 12 28046347 A/G 0.11 (15)
NTN4 rs17356907 GWAS +iCOGS 12 94551890 A/G 0.3 (1)
12q24 rs1292011 GWAS +iCOGS 12 114320905 A/G 0.41 (15)
BRCA2 rs11571833 GWAS +iCOGS 13 31870626 A/T 0.008 (1)
PAX9 rs2236007 GWAS +iCOGS 14 36202520 G/A 0.21 (1)
RAD51L1 rs2588809 GWAS +iCOGS 14 67730181 C/T 0.16 (1)
RAD51L1 rs999737 GWAS +iCOGS 14 68104435 C/T 0.22 (2)
CCDC88C rs941764 GWAS +iCOGS 14 90910822 A/G 0.34 (1)
TOX3 rs3803662 GWAS +iCOGS 16 51143842 G/A 0.29 (10)
FTO rs17817449 GWAS +iCOGS 16 52370868 T/G 0.4 (1)
FTO rs11075995 GWAS +iCOGS 16 52412792 T/A 0.24 (3)
CDYL2 rs13329835 GWAS +iCOGS 16 79208306 A/G 0.22 (1)
COX11 rs6504950 GWAS +iCOGS 17 50411470 G/A 0.27 (6)
18q11.2 rs527616 GWAS +iCOGS 18 22591422 G/C 0.38 (1)
CHST9 rs1436904 GWAS +iCOGS 18 22824665 T/G 0.4 (1)
MERIT40 rs8170 GWAS +iCOGS 19 17250704 G/A 0.19 (16)
MERIT40 rs2363956 GWAS +iCOGS 19 17255124 G/T 0.49 (16)
SSBP4 rs4808801 GWAS +iCOGS 19 18432141 A/G 0.35 (1)
19q13.31 rs3760982 GWAS +iCOGS 19 48978353 G/A 0.46 (1)
RALY rs2284378 N/A rs9753679 20 32051756 C/T 0.28 (17)
NRIP1 rs2823093 GWAS +iCOGS 21 15442703 G/A 0.26 (15)
22q12.2 rs132390 iCOGS N/A 22 27951477 T/C 0.036 (1)
MKL1 rs6001930 iCOGS rs6001913 22 39206180 T/C 0.11 (1)
Page 40 of 70Carcinogenesis
123456789101112131415161718192021222324252627282930313233343536373839404142434445464748495051525354555657585960
at UQ
Library on D
ecember 17, 2013
http://carcin.oxfordjournals.org/D
ownloaded from

For Peer Review
Table S4. SNPs associated with TNBC in 2-stage GWAS
SNP G/I Chr. Position Locus Allele OR 95% CI P-value
rs4245739 I 1 202785465 MDM4 C 1.19 1.11-1.29 4.0 x 10-06
rs3757318 G 6 151955806 ESR1 A 1.33 1.17-1.51 9.2 x 10-06
rs10484919 G 6 152016115 ESR1 A 1.31 1.16-1.47 5.7 x 10-06
rs2619434 G 12 28056724 PTHLH A 0.84 0.77-0.91 1.0 x 10-05
rs8170 G 19 17250704 19p13.1 A 1.26 1.16-1.37 1.3 x 10-07
Page 41 of 70 Carcinogenesis
123456789101112131415161718192021222324252627282930313233343536373839404142434445464748495051525354555657585960
at UQ Library on December 17, 2013 http://carcin.oxfordjournals.org/ Downloaded from

For Peer Review
Table S5. SNPs associated with TNBC (p<1x10⁻³) in 2-stage GWAS, excluding known 78 loci
SNP G/I Chr. Position Genes Allele MAF OR 95% CI p-value
rs9761827 G 4 138635961 PCDH18 A 0.38 1.17 (1.09-1.26) 1.1x10⁻⁵
rs4425715 G 7 54233081 HPVC1 G 0.33 1.17 (1.09-1.26) 1.7 x10⁻⁵
rs1353868 G 3 174143933 SPATA16 A 0.36 1.17 (1.09-1.25) 2.6 x10⁻⁵
rs3855959 G 1 46406461 PIK3R3:TSPAN1:POMGNT1:C1orf190 A 0.40 0.86 (0.80-0.92) 3.0 x10⁻⁵
rs3810295 G 19 51830486 CALM3:PTGIR:GNG8:DACT3:PRKD2 A 0.13 1.24 (1.12-1.37) 4.3 x10⁻⁵
rs9257181 G 6 28862499
TRNAA-UGC:TRNAF-GAA:TRNAA-
AGC:NOL5BP A 0.28 1.17 (1.08-1.26) 4.9 x10⁻⁵
rs230310 G 1 40080306 TRIT1 A 0.23 1.18 (1.09-1.28) 6.0 x10⁻⁵
rs4717599 G 7 70607962 WBSCR17 G 0.27 0.85 (0.79-0.92) 6.6 x10⁻⁵
rs7020507 G 9 1705820 SMARCA2 G 0.14 0.81 (0.74-0.90) 6.9 x10⁻⁵
rs7790719 G 7 3684577 SDK1 A 0.28 0.86 (0.80-0.93) 8.0 x10⁻⁵
Page 42 of 70Carcinogenesis
123456789101112131415161718192021222324252627282930313233343536373839404142434445464748495051525354555657585960
at UQ Library on December 17, 2013 http://carcin.oxfordjournals.org/ Downloaded from

For Peer Review
Table S6. 74 known breast cancer susceptibility loci and risk of TNBC compared to ER-negative and overall breast cancer risk
estimates from BCAC TN ER-negative (1) Overall (1)
SNP
G
/I
Ch
r. Position Locus
A
ll
el
e OR 95% CI P-value OR 95% CI P-value OR 95% CI P-value
rs616488 G 1 10488802 PEX14 G 0.91 (0.85-0.98) 9.73x10-03 0.90 (0.87-0.94) 4.44 x 10-07 0.94 (0.92-0.96) 2.13 x 10-08
rs11249433 G 1 120982136 1p11.2 G 1.03 (0.96-1.10) 0.49 1.00 (0.96-1.04) 0.97 1.09 (1.07-1.11) 7.66 x 10⁻¹⁹
rs6678914 G 1 200453799 LGR6 A 0.90 (0.84-0.97) 3.31 x10-03 0.92 (0.89-0.96) 2.83 x 10-05 0.99 (0.97-1.01) 0.43
rs4245739 I 1 202785465 MDM4 C 1.19 (1.11-1.29) 4.00 x10-06 1.16 (1.11-1.20) 4.30 x 10⁻¹² 1.03 (1.01-1.05) 7.03 x 10-03
rs12710696 I 2 19184284 2p24.1 A 1.11 (1.04-1.19) 3.51 x10-03 1.10 (1.06-1.14) 8.56 x 10-07 1.04 (1.02-1.06) 1.08 x 10-04
rs4849887 G 2 120961592 2q14.2 A 0.89 (0.79-1.00) 0.041 0.91 (0.86-0.97) 5.94 x 10-03 0.91 (0.88-0.94) 8.23 x 10-09
rs2016394 G 2 172681217 2q31.1 A 1.10 (1.03-1.18) 6.90 x10-03 0.99 (0.96-1.03) 0.77 0.95 (0.93-0.97) 3.02 x 10-07
rs1550623 G 2 173921140 CDCA7 G 0.94 (0.85-1.03) 0.16 0.95 (0.90-1.00) 0.046 0.94 (0.92-0.97) 2.08 x 10-05
rs1045485 I 2 201857834 CASP8 C 1.00 (0.90-1.11) 0.99 0.97 (0.91-1.02) 0.22 0.97 (0.94-1.00) 0.037
rs13387042 G 2 217614077 2q35 G 0.93 (0.87-1.00) 0.049 0.96 (0.92-0.99) 0.021 0.88 (0.86-0.89) 3.04 x 10-41
rs16857609 I 2 218004753 2q35 A 1.08 (1.00-1.16) 0.060 1.08 (1.03-1.12) 3.36 x 10-04 1.08 (1.05-1.10) 7.23 x 10⁻¹²
rs6762644 G 3 4717276 3p26.2 G 0.97 (0.90-1.04) 0.38 1.02 (0.98-1.06) 0.32 1.07 (1.04-1.09) 1.83 x 10⁻¹⁰
rs4973768 G 3 27391017 SLC4A7 A 1.06 (0.99-1.14) 0.075 1.05 (1.01-1.09) 0.011 1.10 (1.08-1.12) 1.36 x 10⁻²¹
rs12493607 I 3 30657943 TGFBR2 C 1.00 (0.93-1.07) 0.89 1.01 (0.97-1.05) 0.52 1.06 (1.04-1.08) 6.86 x 10-08
rs9790517 I 4 106304227 TET2 A 1.00 (0.92-1.09) 0.94 1.03 (0.98-1.07) 0.22 1.05 (1.03-1.07) 2.71 x 10-05
rs6828523 I 4 176083001 ADAM29 A 0.84 (0.75-0.93) 1.33 x10-03 1.01 (0.96-1.07) 0.66 0.89 (0.87-0.92) 1.22 x 10⁻¹³
rs10069690 I 5 1332790 TERT A 1.24 (1.14-1.34) 1.43 x10-07 1.16 (1.11-1.21) 1.69 x 10⁻¹² 1.06 (1.04-1.09) 2.83 x 10-08
rs2736108a G 5 1350488 TERT T 0.77 (0.69-0.87) 8.33x10⁻⁶ 0.89b (0.83-0.93) 1.41x10⁻⁸ 0.94b (0.92-0.95) 6.73x10⁻⁹
rs10941679 I 5 44742255 5p12 G 1.02 (0.94-1.11) 0.59 1.04 (1.00-1.08) 0.080 1.13 (1.11-1.16) 3.57 x 10⁻²⁹
rs889312 G 5 56067641 MAP3K1 C 1.01 (0.94-1.09) 0.76 1.05 (1.01-1.10) 0.011 1.12 (1.10-1.15) 3.56 x 10⁻²⁷
rs10472076 I 5 58219818 RAB3C G 0.96 (0.89-1.03) 0.24 1.05 (1.02-1.10) 5.87 x 10-03 1.05 (1.03-1.07) 8.35 x 10-07
rs1353747 G 5 58373238 PDE4D C 1.01 (0.90-1.14) 0.89 0.91 (0.86-0.98) 6.65 x 10-03 0.92 (0.89-0.95) 1.29 x 10-06
rs1432679 G 5 158176661 EBF1 G 1.10 (1.02-1.17) 8.62 x10-03 1.08 (1.04-1.12) 2.36 x 10-05 1.07 (1.05-1.09) 3.29 x 10⁻¹²
rs11242675 G 6 1263878 FOXQ1 G 1.00 (0.93-1.07) 0.98 0.94 (0.90-0.98) 1.54 x 10-03 0.95 (0.93-0.97) 4.29 x 10-08
rs204247 G 6 13830502 RANBP1 G 1.03 (0.96-1.11) 0.36 1.01 (0.97-1.05) 0.58 1.05 (1.03-1.07) 2.67 x 10-07
rs17529111 I 6 82185105 6q14.1 G 1.04 (0.96-1.13) 0.31 1.04 (1.00-1.09) 0.054 1.06 (1.04-1.09) 3.19 x 10-07
rs17530068 G 6 82249828 6q14 G 1.07 (0.99-1.16) 0.093 1.05 (1.00-1.09) 0.034 1.06 (1.03-1.08) 1.97 x 10-06
rs3757318 G 6 151955806 ESR1 A 1.33 (1.17-1.51) 9.25 x10-06 1.22 (1.14-1.31) 3.95 x 10-09 1.16 (1.12-1.20) 1.09 x 10⁻¹⁵
rs2046210 I 6 151990059 ESR1 A 1.16 (1.08-1.24) 5.26 x10-05 1.16 (1.12-1.21) 2.36 x 10⁻¹⁴ 1.08 (1.06-1.10) 1.38 x 10⁻¹⁴
rs720475 G 7 143705862 7q35 A 1.02 (0.94-1.10) 0.62 0.99 (0.95-1.03) 0.58 0.94 (0.92-0.96) 2.49 x 10-08
rs9693444 G 8 29565535 8p21.1 A 1.07 (0.99-1.15) 0.087 1.09 (1.05-1.13) 2.25 x 10-05 1.07 (1.05-1.09) 4.61 x 10⁻¹¹
rs6472903 I 8 76392856 8q21.11 C 0.98 (0.90-1.08) 0.70 0.93 (0.89-0.98) 3.94 x 10-03 0.91 (0.89-0.93) 3.08 x 10⁻¹³
rs2943559 I 8 76580492 HNF4G G 1.10 (0.97-1.24) 0.13 1.08 (1.01-1.16) 0.030 1.13 (1.09-1.17) 3.31 x 10⁻¹¹
rs13281615 G 8 128424800 8q24 G 1.01 (0.95-1.09) 0.71 1.02 (0.98-1.06) 0.28 1.10 (1.08-1.12) 1.87 x 10⁻²⁰
Page 43 of 70 Carcinogenesis
123456789101112131415161718192021222324252627282930313233343536373839404142434445464748495051525354555657585960
at UQ Library on December 17, 2013 http://carcin.oxfordjournals.org/ Downloaded from

For Peer Review
rs11780156 G 8 129263823 8q24.21 A 1.03 (0.95-1.13) 0.47 1.06 (1.01-1.11) 0.024 1.07 (1.05-1.10) 3.06 x 10-08
rs1011970 G 9 22052134 CDKN2A/B A 1.08 (0.99-1.18) 0.075 1.12 (1.06-1.17) 6.58 x 10-06 1.05 (1.03-1.08) 4.04 x 10-05
rs10759243 I 9 109345936 9q31.2 A 1.00 (0.93-1.08) 0.97 1.01 (0.97-1.05) 0.70 1.05 (1.03-1.08) 1.02 x 10-06
rs865686 G 9 109928299 9q31 C 1.03 (0.96-1.11) 0.41 0.98 (0.95-1.02) 0.35 0.90 (0.88-0.91) 6.25 x 10⁻²⁸
rs2380205 G 10 5926740 ANKRD16 A 1.00 (0.94-1.07) 0.92 1.00 (0.96-1.04) 0.91 0.98 (0.96-1.00) 0.077
rs7072776 G 10 22072948 DNAJC1 A 0.96 (0.89-1.03) 0.24 0.94 (0.90-0.98) 3.94 x 10-03 1.07 (1.05-1.09) 8.98 x 10⁻¹⁰
rs10995190 G 10 63948688 ZNF365 A 0.93 (0.85-1.03) 0.16 0.87 (0.83-0.92) 2.52 x 10-07 0.86 (0.84-0.88) 6.15 x 10⁻²⁹
rs704010 G 10 80511154 ZMIZ1 A 1.04 (0.97-1.12) 0.27 1.03 (0.99-1.07) 0.092 1.08 (1.06-1.10) 2.96 x 10⁻¹⁵
rs7904519 G 10 114763917 TCF7L2 G 1.12 (1.05-1.20) 9.95 x10-04 1.06 (1.02-1.10) 3.18 x 10-03 1.06 (1.04-1.08) 1.25 x 10-09
rs11199914 G 10 123083891 10q26.12 A 1.04 (0.97-1.12) 0.28 1.02 (0.98-1.06) 0.35 0.95 (0.93-0.97) 1.44 x 10-06
rs2981579 G 10 123327325 FGFR2 A 0.99 (0.93-1.06) 0.81 1.03 (0.99-1.07) 0.12 1.27 (1.24-1.29) 5.90 x 10-129
rs2981582 I 10 123342307 FGFR2 A 0.98 (0.92-1.05) 0.61 1.02 (0.98-1.06) 0.27 1.26 (1.23-1.28) 1.71 x 10-117
rs3817198 G 11 1865582 LSP1 G 1.06 (0.99-1.14) 0.10 1.06 (1.02-1.10) 5.81 x 10-03 1.07 (1.05-1.09) 5.39 x 10⁻¹⁰
rs3903072 I 11 65339642 11q13.1 A 0.92 (0.86-0.99) 0.024 0.97 (0.93-1.01) 0.099 0.94 (0.93-0.96) 2.89 x 10-09
rs614367 G 11 69037945 CCDN1 A 1.02 (0.92-1.12) 0.75 1.02 (0.97-1.08) 0.41 1.21 (1.18-1.24) 5.21 x 10-48
rs554219 I 11 69040823 CCND1 G 0.94 (0.85-1.04) 0.20 1.02 (0.96-1.08) 0.49 1.27 (1.23-1.30) 3.72 x 10-62
rs11820646 I 11 128966381 11q24.3 A 0.92 (0.86-0.98) 0.016 0.96 (0.92-1.00) 0.028 0.95 (0.93-0.97) 2.44 x 10-07
rs12422552 I 12 14305198 12p13.1 C 1.13 (1.04-1.21) 2.70 x10-03 1.04 (1.00-1.08) 0.080 1.05 (1.03-1.07) 2.47 x 10-05
rs10771399 I 12 28046347 PTHLH G 0.72 (0.64-0.80) 1.55 x10-08 0.83 (0.78-0.89) 3.35 x 10-09 0.85 (0.83-0.88) 5.31 x 10⁻²⁵
rs17356907 G 12 94551890 NTN4 G 0.90 (0.84-0.97) 7.55 x10-03 0.94 (0.90-0.98) 2.27 x 10-03 0.91 (0.89-0.93) 1.20 x 10⁻¹⁸
rs1292011 G 12 114320905 12q24 G 1.08 (1.01-1.16) 0.035 0.98 (0.94-1.02) 0.31 0.92 (0.90-0.94) 6.19 x 10⁻¹⁷
rs11571833 I 13 31870626 BRCA2 T 1.44 (1.05-1.96) 0.023 1.44 (1.20-1.71) 5.88 x 10-05 1.26 (1.14-1.39) 5.36 x 10-06
rs2236007 I 14 36202520 PAX9 A 0.99 (0.91-1.07) 0.75 0.96 (0.92-1.01) 0.096 0.93 (0.90-0.95) 1.69 x 10⁻¹⁰
rs2588809 I 14 67730181 RAD51L1 A 0.91 (0.83-1.00) 0.041 1.01 (0.96-1.06) 0.78 1.08 (1.05-1.11) 4.71 x 10-09
rs999737 G 14 68104435 RAD51L1 A 0.95 (0.88-1.03) 0.22 0.95 (0.91-0.99) 0.015 0.92 (0.90-0.94) 3.73 x 10⁻¹³
rs941764 I 14 90910822 CCDC88C G 1.03 (0.95-1.10) 0.50 1.03 (0.99-1.07) 0.091 1.06 (1.04-1.09) 1.02 x 10-09
rs3803662 G 16 51143842 TOX3 A 1.09 (1.01-1.17) 0.022 1.14 (1.10-1.19) 1.16 x 10⁻¹⁰ 1.24 (1.21-1.27) 1.38 x 10-88
rs17817449 I 16 52370868 FTO C 0.99 (0.92-1.06) 0.68 0.91 (0.87-0.94) 5.07 x 10-07 0.93 (0.91-0.95) 1.41 x 10⁻¹²
rs11075995 I 16 52412792 FTO A 1.08 (1.00-1.17) 0.065 1.11 (1.06-1.16) 2.13 x 10-06 1.04 (1.02-1.07) 1.19 x 10-04
rs13329835 G 16 79208306 CDYL2 G 1.03 (0.95-1.11) 0.51 1.02 (0.98-1.07) 0.30 1.08 (1.06-1.11) 1.48 x 10⁻¹¹
rs6504950 I 17 50411470 COX11 A 0.96 (0.89-1.04) 0.33 0.97 (0.93-1.01) 0.16 0.94 (0.92-0.96) 2.27 x 10-09
rs527616 I 18 22591422 18q11.2 C 0.95 (0.88-1.02) 0.14 0.98 (0.94-1.02) 0.24 0.95 (0.93-0.97) 2.53 x 10-07
rs1436904 G 18 22824665 CHST9 C 0.99 (0.93-1.07) 0.84 1.00 (0.96-1.04) 0.86 0.95 (0.94-0.97) 3.27 x 10-06
rs8170 G 19 17250704 19p13.1 A 1.26 (1.16-1.37) 1.26 x10-07 1.14 (1.09-1.19) 1.26 x 10-08 1.04 (1.01-1.06) 2.74 x 10-03
rs2363956 G 19 17255124 19p13.1 C 0.82 (0.77-0.88) 2.33 x10-08 1.13 (1.09-1.17) 1.38 x 10⁻¹⁰ 1.03 (1.01-1.05) 1.86 x 10-03
rs4808801 G 19 18432141 SSBP4 G 1.03 (0.96-1.11) 0.40 0.92 (0.88-0.95) 1.88 x 10-05 0.93 (0.91-0.95) 4.70 x 10⁻¹³
rs3760982 G 19 48978353 19q13.31 A 0.99 (0.93-1.06) 0.85 1.04 (1.00-1.08) 0.026 1.06 (1.04-1.08) 1.68 x 10-08
rs2823093 G 21 15442703 NRIP1 A 1.04 (0.96-1.12) 0.35 0.97 (0.93-1.02) 0.21 0.92 (0.90-0.95) 1.57 x 10⁻¹²
rs132390a G 22 27951477 22q12.2 C 1.16 (0.89-1.52) 0.28 1.08 (0.98-1.19) 0.11 1.12 (1.07-1.18) 3.1x10⁻⁹
rs6001930a G 22 39206180 MLK1 C 1.21 (1.02-1.43) 0.025 1.10 (1.04-1.17) 1.1x10⁻³ 1.12 (1.09-1.16) 8.8x10⁻¹⁹ a Genotyped in stage 2 only on the iCOGS platform (2,148 cases, 1,309 controls)
b Overall and ER-negative breast cancer risk results for rs2736108 from Bojesen, et al. (8)
Page 44 of 70Carcinogenesis
123456789101112131415161718192021222324252627282930313233343536373839404142434445464748495051525354555657585960
at UQ Library on December 17, 2013 http://carcin.oxfordjournals.org/ Downloaded from

For Peer Review
Table S7. Additional significant SNPs in the known breast cancer susceptibility loci
Risk SNP
Reported
SNP
R2 with
reported
SNP G/I Locus Chr. Position Allele OR 95% CI P-value
a) SNPs in regions where reported SNP has p<0.05
rs9397437
rs2046210;
rs3757318
0.11;
0.38 I ESR1 6 151994025 A 1.42 (1.25-1.61) 8.9 x 10⁻⁸
rs620405 rs616488 0.73 G PEX14 1 10477381 A 0.86 (0.80-0.93) 1.0 x 10⁻⁴
b) SNPs in regions where reported SNP has p>0.05
rs3731711 rs1045485 0.93 I CASP8 2 201921306 G 0.84 (0.76-0.92) 1.4 x 10⁻⁴
c) SNPs in regions where reported SNP not genotyped
rs6142050 rs2284378 0.56 G RALY 20 31990789 G 1.11 (1.03-1.19) 3.8 x 10⁻³
Page 45 of 70 Carcinogenesis
123456789101112131415161718192021222324252627282930313233343536373839404142434445464748495051525354555657585960
at UQ Library on December 17, 2013 http://carcin.oxfordjournals.org/ Downloaded from

For Peer Review
Table S8. Cis-eQTL associations with known TN risk SNPs
eQTL SNP
eQTL
gene eQTL probe chr pos t.stat p.value
Risk
locus
rs620405 UBIAD1 ILMN_1651872 1 10477381 -3.13 1.85E-03 PEX14
rs620405 DFFA ILMN_2385220 1 10477381 -2.87 4.29E-03 PEX14
rs620405 PGD ILMN_1794165 1 10477381 2.39 1.70E-02 PEX14
rs620405 CASZ1 ILMN_2340202 1 10477381 -2.28 2.29E-02 PEX14
rs620405 CLSTN1 ILMN_1720181 1 10477381 -2.14 3.30E-02 PEX14
rs620405 C1orf200 ILMN_1703119 1 10477381 -1.98 4.80E-02 PEX14
rs616488 UBIAD1 ILMN_1651872 1 10488802 2.67 7.72E-03 PEX14
rs616488 CTNNBIP1 ILMN_1688103 1 10488802 -2.30 2.20E-02 PEX14
rs616488 CASZ1 ILMN_2340202 1 10488802 2.08 3.76E-02 PEX14
rs6678914 LGR6 ILMN_1662362 1 200453799 2.16 3.09E-02 LGR6
rs3795598 CHI3L1 ILMN_1772289 1 200463784 -2.25 2.48E-02 LGR6
rs4245739 LRRN2 ILMN_1781841 1 202785465 -2.46 1.41E-02 MDM4
rs4245739 NUAK2 ILMN_1789793 1 202785465 -2.35 1.93E-02 MDM4
rs4245739 REN ILMN_1742272 1 202785465 -2.06 3.99E-02 MDM4
rs4849887 SCTR ILMN_1772537 2 120961592 -1.96 5.00E-02 2q14.2
rs2016394 DYNC1I2 ILMN_1773847 2 172681217 -2.85 4.51E-03 2q31.1
rs2016394 ZAK ILMN_1698803 2 172681217 -2.46 1.40E-02 2q31.1
rs3731711 AOX2P ILMN_1789676 2 201921306 -2.12 3.41E-02 CASP8
rs13387042 TNS1 ILMN_1807919 2 217614077 2.60 9.59E-03 2q35
rs10069690 ZDHHC11 ILMN_1694514 5 1332790 1.98 4.77E-02 TERT
rs1432679 RNF145 ILMN_1710906 5 158176661 2.47 1.39E-02 EBF1
rs9397437 ZBTB2 ILMN_1766247 6 151994025 2.04 4.14E-02 ESR1
rs2807985 MLLT10 ILMN_1743538 10 22270480 2.01 4.47E-02 DNAJC1
rs7904519 ZDHHC6 ILMN_2046003 10 114763917 -1.97 4.99E-02 TCF7L2
rs3903072 CTSW ILMN_1794364 11 65339642 2.63 8.79E-03 11q13.1
rs3903072 SART1 ILMN_1680145 11 65339642 2.50 1.27E-02 11q13.1
rs3903072 ACTN3 ILMN_1665691 11 65339642 -2.32 2.09E-02 11q13.1
rs3903072 SCYL1 ILMN_1731991 11 65339642 -2.03 4.31E-02 11q13.1
rs3903072 EHD1 ILMN_1651832 11 65339642 2.00 4.65E-02 11q13.1
rs3903072 CCDC85B ILMN_1657332 11 65339642 -1.97 4.96E-02 11q13.1
rs3903072 C11orf85 ILMN_2182850 11 65339642 1.97 4.99E-02 11q13.1
rs11820646 ST14 ILMN_1699887 11 128966381 3.08 2.20E-03 11q24.3
rs11820646 APLP2 ILMN_2081465 11 128966381 2.91 3.76E-03 11q24.3
rs11820646 NFRKB ILMN_1718990 11 128966381 2.46 1.41E-02 11q24.3
rs11820646 APLP2 ILMN_1710482 11 128966381 2.43 1.56E-02 11q24.3
rs12422552 GRIN2B ILMN_3307714 12 14305198 2.83 4.88E-03 12p13.1
rs12422552 C12orf36 ILMN_1755414 12 14305198 2.10 3.58E-02 12p13.1
rs11055891 PDE6H ILMN_1702965 12 14312379 -2.58 1.00E-02 12p13.1
rs10771399 REP15 ILMN_1665884 12 28046347 -2.79 5.48E-03 PTHLH
rs17356907 VEZT ILMN_2141398 12 94551890 -2.32 2.05E-02 NTN4
rs10850494 TBX5 ILMN_2282379 12 114311094 2.02 4.44E-02 12q24
rs2588809 ZFYVE26 ILMN_1798061 14 67730181 -2.07 3.87E-02 RAD51L1
rs8170 PLVAP ILMN_2194577 19 17250704 -2.08 3.84E-02 19p13.1
rs2363956 IL12RB1 ILMN_1699908 19 17255124 -2.42 1.57E-02 19p13.1
rs2363956 GTPBP3 ILMN_1686587 19 17255124 -2.15 3.18E-02 19p13.1
rs1864112 CPAMD8 ILMN_1726250 19 17309960 2.38 1.78E-02 19p13.1
Page 46 of 70Carcinogenesis
123456789101112131415161718192021222324252627282930313233343536373839404142434445464748495051525354555657585960
at UQ
Library on D
ecember 17, 2013
http://carcin.oxfordjournals.org/D
ownloaded from

For Peer Review
rs6142050 PXMP4 ILMN_3249742 20 31990789 -2.65 8.28E-03 RALY
rs6142050 PXMP4 ILMN_1771728 20 31990789 -2.19 2.88E-02 RALY
rs6142050 PXMP4 ILMN_3250812 20 31990789 -2.18 3.01E-02 RALY
rs6001913 SLC25A17 ILMN_1737312 22 39166699 3.02 2.64E-03 MKL1
rs6001913 TNRC6B ILMN_1726786 22 39166699 2.98 3.00E-03 MKL1
Page 47 of 70 Carcinogenesis
123456789101112131415161718192021222324252627282930313233343536373839404142434445464748495051525354555657585960
at UQ
Library on D
ecember 17, 2013
http://carcin.oxfordjournals.org/D
ownloaded from

For Peer Review
Table S9. Functional annotation by Rhie, et al. (2013) in TN risk loci Number of SNPs in region (R2>0.5)
overlapping with feature (18)
SNP Chr. Positon Locus Allele Description Nearest gene TSS Enhancer Exon
rs2046210 6 151990059 ESR1 A intergenic C6orf97 1 4 1
rs10771399 12 28046347 PTHLH G intergenic PTHLH 1 62
rs3803662 16 51143842 TOX3 A intergenic TOX3 1
rs6678914 1 200453799 LGR6 A intron LGR6 2 10 1
rs2363956 19 17255124 19p13.1 C exon (missense) ANKLE1 2 2 2
rs3903072 11 65339642 11q13.1 A intergenic SNX32; OVOL1 2 11 3
rs2016394 2 172681217 2q31.1 A intergenic CDCA7 3
rs4245739 1 202785465 MDM4 C intron (3'utr) MDM4 8 21
rs616488 1 10488802 PEX14 G intron PEX14 16 1
rs1432679 5 158176661 EBF1 G intron EBF1 1
rs11571833 13 31870626 BRCA2 T exon (nonsense) BRCA2
rs11820646 11 128966381 11q24.3 A intergenic CCND1 1
rs17356907 12 94551890 NTN4 G intergenic NTN4 2
rs4849887 2 120961592 2q14.2 A intergenic INHBB
3
rs1292011 12 114320905 12q24 G intergenic MED13L 5
rs12422552 12 14305198 12p13.1 C intergenic ATF7IP 9
rs12710696 2 19184284 2p24.1 A intergenic OSR1
15
rs13387042 2 217614077 2q35 G intergenic TNP1
rs10069690 5 1332790 TERT A intron TERT
1
rs7904519 10 114763917 TCF7L2 G intron TCF7L2
36
rs2588809 14 67730181 RAD51L1 A intron RAD51B 39
rs6001930 22 39206180 MLK1 C intron MLK1 88
rs6828523 4 176083001 ADAM29 A intron ADAM29
Rs3757315 6 151955806 ESR1 A intron C6orf97
Page 48 of 70Carcinogenesis
123456789101112131415161718192021222324252627282930313233343536373839404142434445464748495051525354555657585960
at UQ Library on December 17, 2013 http://carcin.oxfordjournals.org/ Downloaded from

For Peer Review
Table S10. Cis-eQTL associations with SNPs in TN risk loci
Chr. eQTL SNP eQTL gene t-statistic eQTL p-value Locus
1 rs11586387 KLHDC8A -3.75 2.0E-04 MDM4
2 rs11892687 IGFBP2 -3.61 3.3E-04 2q35
2 rs7589722 IGFBP2 3.46 5.8E-04 2q35
2 rs10490444 IGFBP2 -3.48 5.5E-04 2q35
2 rs7579388 PECR 3.35 8.7E-04 2q35
2 rs6738142 HAT1 0.24 9.11 x10⁻⁶
2q31.1
2 rs2008518 ZAK -0.074 9.36 x10⁻⁵
2q31.1
2 rs13016963 ALS2CR12 3.39 7.5E-04 CASP8
2 rs9288316 ALS2CR12 -3.44 6.3E-04 CASP8
2 rs1035142 ALS2CR12 3.38 7.8E-04 CASP8
2 rs1045494 FZD7 3.34 9.0E-04 CASP8
5 rs4246742 SLC9A3 3.38 7.7E-04 TERT
5 rs4246742 SLC12A7 3.33 9.4E-04 TERT
5 rs4246742 SLC9A3 3.38 7.7E-04 TERT
5 rs4246742 SLC12A7 3.33 9.4E-04 TERT
6 rs1871859 AKAP12 -3.92 1.0E-04 ESR1
10 rs7085532 ACSL5 3.64 3.0E-04 TCF7L2
10 rs17746916 LOC143188 3.60 3.5E-04 TCF7L2
10 rs290488 ZDHHC6 3.64 3.0E-04 TCF7L2
11 rs10896050 SNX32 3.78 1.8E-04 11q13.1
11 rs630303 CTSW 3.55 4.3E-04 11q13.1
11 rs656040 CTSW -3.55 4.3E-04 11q13.1
11 rs11227332 CTSW 3.85 1.3E-04 11q13.1
11 rs665306 CTSW -3.49 5.2E-04 11q13.1
11 rs11227306 CTSW -3.45 6.1E-04 11q13.1
11 rs622614 CTSW -5.61 3.3E-08 11q13.1
11 rs13817 CTSW 3.57 3.9E-04 11q13.1
11 rs10896050 CTSW -3.90 1.1E-04 11q13.1
11 rs10896050 MRPL11 4.14 4.0E-05 11q13.1
12 rs11067547 TBX3 3.44 6.3E-04 12q24
12 rs2347230 PTHLH 0.47 5.67 x10⁻⁵
PTHLH
12 rs10843001 PTHLH 0.39 7.28 x10⁻⁵
PTHLH
12 rs16932270 PPFIBP1 -0.41 5.30 x10⁻⁶
PTHLH
12 rs10777711 VEZT -3.38 7.8E-04 NTN4
12 rs7963386 VEZT -3.60 3.5E-04 NTN4
13 rs206119 B3GALTL -3.53 4.6E-04 BRCA2
13 rs9567670 KL 3.40 7.3E-04 BRCA2
14 rs10137893 EXD2 3.63 3.2E-04 RAD51L1
19 rs17533903 NR2F6 -0.34 6.45 x10⁻⁵
19p13.1
19 rs17454516 FAM32A -0.16 6.51 x10⁻⁵
19p13.1
19 rs17533903 SLC35E1 -0.39 6.20 x10⁻⁵
19p13.1
Page 49 of 70 Carcinogenesis
123456789101112131415161718192021222324252627282930313233343536373839404142434445464748495051525354555657585960
at UQ
Library on D
ecember 17, 2013
http://carcin.oxfordjournals.org/D
ownloaded from

For Peer Review
Table S11. Linkage disequilibrium (R2 >0.1) between eQTL SNPs in TN risk loci and
candidate functional SNPs in exons identified by Rhie, et al.
Chr
.
eQTL
SNP eQTL gene Locus Exon SNP
R2 with
eQTL
SNP Gene (exon) Result
11 rs1089605
0
SNX32, CTSW,
MRPL11 11q13.1
rs637571 0.174 FOSL1 synonomous
rs1058068 0.124 FOSL1 synonomous
rs633800 0.137 EFEMP2 synonomous
11 rs1122730
6 CTSW 11q13.1
rs637571 0.272 FOSL1 synonomous
rs1058068 0.299 FOSL1 synonomous
rs633800 0.467 EFEMP2 synonomous
11 rs1122733
2 CTSW 11q13.1
rs637571 0.303 FOSL1 synonomous
rs1058068 0.236 FOSL1 synonomous
rs633800 0.241 EFEMP2 synonomous
11 rs13817 CTSW 11q13.1 rs637571 0.188 FOSL1 synonomous
rs1058068 0.278 FOSL1 synonomous
rs633800 0.458 EFEMP2 synonomous
11 rs622614 CTSW 11q13.1 rs633800 0.219 EFEMP2 synonomous
rs1058068 0.122 FOSL1 synonomous
11 rs630303 CTSW 11q13.1 rs637571 0.188 FOSL1 synonomous
rs1058068 0.278 FOSL1 synonomous
rs633800 0.458 EFEMP2 synonomous
11 rs656040 CTSW 11q13.1 rs637571 0.211 FOSL1 synonomous
rs1058068 0.254 FOSL1 synonomous
rs633800 0.422 EFEMP2 synonomous
11 rs665306 CTSW 11q13.1 rs637571 0.188 FOSL1 synonomous
rs1058068 0.278 FOSL1 synonomous
rs633800 0.458 EFEMP2 synonomous
Page 50 of 70Carcinogenesis
123456789101112131415161718192021222324252627282930313233343536373839404142434445464748495051525354555657585960
at UQ
Library on D
ecember 17, 2013
http://carcin.oxfordjournals.org/D
ownloaded from

For Peer Review
Table S12. Linkage disequilibrium (R2 >0.1) between eQTL SNPs in TN risk loci and
candidate functional SNPs in transcroiption start sites identified by Rhie, et al.
Chr. eQTL SNP eQTL gene Locus TSS snp
R2 with
eQTL
SNP
11 rs10896050 SNX32, CTSW, MRPL11 11q13.1 rs633800 0.137
rs10896064 0.2
11 rs11227306 CTSW 11q13.1 rs633800 0.467
rs10896064 0.317
11 rs11227332 CTSW 11q13.1 rs633800 0.241
rs10896064 0.256
11 rs13817 CTSW 11q13.1 rs633800 0.458
rs10896064 0.478
11 rs622614 CTSW 11q13.1 rs633800 0.219
rs10896064 0.228
11 rs630303 CTSW 11q13.1 rs633800 0.458
rs10896064 0.478
11 rs656040 CTSW 11q13.1 rs633800 0.422
rs10896064 0.516
11 rs665306 CTSW 11q13.1 rs633800 0.458
rs10896064 0.478
Page 51 of 70 Carcinogenesis
123456789101112131415161718192021222324252627282930313233343536373839404142434445464748495051525354555657585960
at UQ
Library on D
ecember 17, 2013
http://carcin.oxfordjournals.org/D
ownloaded from

For Peer Review
Table S13. Linkage disequilibrium (R2 >0.1) between eQTL SNPs in TN risk loci and
candidate functional SNPs in enhancers identified by Rhie, et al.
Chr. eQTL SNP eQTL gene Locus Enhancer SNP
R2 with
eQTL SNP
11 rs10896050 SNX32, CTSW, MRPL11 11q13.1 rs10160792 0.102
rs1058068 0.124
rs11227309 0.133
rs11227311 0.133
rs526631 0.105
rs637571 0.174
rs677029 0.124
rs689274 0.112
11 rs630303 CTSW 11q13.1 rs10160792 0.198
rs1058068 0.278
rs11227309 0.443
rs11227311 0.443
rs1151523 0.218
rs526631 0.244
rs634534 0.218
rs637571 0.188
rs677029 0.235
rs689274 0.248
11 rs656040 CTSW 11q13.1 rs10160792 0.175
rs1058068 0.254
rs11227309 0.427
rs11227311 0.427
rs1151523 0.198
rs526631 0.222
rs634534 0.198
rs637571 0.211
rs677029 0.212
rs689274 0.227
11 rs11227332 CTSW 11q13.1 rs10160792 0.218
rs1058068 0.236
rs11227309 0.233
rs11227311 0.233
rs1151523 0.197
rs526631 0.215
rs634534 0.197
rs637571 0.303
rs677029 0.239
rs689274 0.219
11 rs665306 CTSW 11q13.1 rs10160792 0.198
rs1058068 0.278
rs11227309 0.443
rs11227311 0.443
rs1151523 0.218
rs526631 0.244
rs634534 0.218
Page 52 of 70Carcinogenesis
123456789101112131415161718192021222324252627282930313233343536373839404142434445464748495051525354555657585960
at UQ
Library on D
ecember 17, 2013
http://carcin.oxfordjournals.org/D
ownloaded from

For Peer Review
rs637571 0.188
rs677029 0.235
rs689274 0.248
11 rs11227306 CTSW 11q13.1 rs10160792 0.275
rs1058068 0.299
rs11227309 0.45
rs11227311 0.45
rs1151523 0.268
rs526631 0.305
rs634534 0.268
rs637571 0.272
rs677029 0.35
rs689274 0.309
11 rs622614 CTSW 11q13.1 rs10160792 0.107
rs1058068 0.122
rs11227309 0.212
rs11227311 0.212
rs526631 0.105
rs677029 0.122
rs689274 0.111
11 rs13817 CTSW 11q13.1 rs10160792 0.198
rs1058068 0.278
rs11227309 0.443
rs11227311 0.443
rs1151523 0.218
rs526631 0.244
rs634534 0.218
rs637571 0.188
rs677029 0.235
rs689274 0.248
Page 53 of 70 Carcinogenesis
123456789101112131415161718192021222324252627282930313233343536373839404142434445464748495051525354555657585960
at UQ
Library on D
ecember 17, 2013
http://carcin.oxfordjournals.org/D
ownloaded from

For Peer Review
Table S14. Comparison of ORs for a subset of TNBCC subjects with expression data, stratified by DASL-defined ER status
Overall TN
3,677 cases
4,708 controls
TN with DASL
578 cases
4,638 controls
TN excluding ER+
516 cases
4,638 controls
DASL-defined ER+
62 cases
4,638 controls
SNP G/I Chr. Position Locus Allele OR P-value OR 95% CI P-value OR 95% CI P-value OR 95% CI P-value
rs616488 G 1 10488802 PEX14 G 0.91 9.7x10⁻³ 0.99 (0.86-1.13) 0.85 0.99 (0.85-1.14) 0.84 1.00 (0.67-1.49) 0.99
rs6678914 G 1 200453799 LGR6 A 0.90 3.3 x10⁻³ 0.97 (0.85-1.12) 0.7 0.96 (0.84-1.11) 0.62 1.07 (0.73-1.57) 0.74
rs4245739 I 1 202785465 MDM4 C 1.19 4.0 x10⁻⁶ 1.19 (1.03-1.38) 0.017 1.16 (0.99-1.35) 0.061 1.56 (1.05-2.33) 0.029
rs12710696 I 2 19184284 2p24.1 A 1.11 3.5 x10⁻³ 1.07 (0.93-1.23) 0.34 1.08 (0.94-1.25) 0.27 0.92 (0.62-1.36) 0.68
rs4849887 G 2 120961592 2q14.2 A 0.89 0.041 0.93 (0.75-1.15) 0.5 0.97 (0.78-1.22) 0.77 0.72 (0.42-1.27) 0.26
rs2016394 G 2 172681217 2q31.1 A 1.10 6.9x10⁻³ 1.13 (0.99-1.29) 0.074 1.12 (0.97-1.29) 0.11 1.21 (0.83-1.74) 0.32
rs3731711 I 2 201921306 CASP8 G 0.84 1.4x10⁻⁴ 0.94 (0.79-1.12) 0.51 0.92 (0.76-1.11) 0.38 1.02 (0.62-1.69) 0.93
rs13387042 G 2 217614077 2q35 G 0.93 0.049 0.92 (0.80-1.04) 0.19 0.93 (0.81-1.07) 0.29 0.85 (0.59-1.22) 0.38
rs6828523 I 4 176083001 ADAM29 A 0.84 1.3x10⁻³ 0.88 (0.71-1.08) 0.22 0.94 (0.75-1.17) 0.56 0.45 (0.20-1.00) 0.049
rs10069690 I 5 1332790 TERT A 1.24 1.4 x10⁻⁷ 1.27 (1.08-1.48) 3.1x10⁻³ 1.32 (1.12-1.56) 8.4x10⁻⁴ 0.91 (0.57-1.45) 0.69
rs2735845 I 5 1353584 TERT G 0.80 2.5x10⁻⁷ 0.93 (0.80-1.09) 0.39 0.95 (0.81-1.12) 0.54 0.71 (0.44-1.15) 0.16
rs1432679 G 5 158176661 EBF1 G 1.10 8.6x10⁻³ 1.06 (0.93-1.22) 0.36 1.05 (0.91-1.21) 0.51 1.30 (0.89-1.90) 0.17
rs3757318 G 6 151955806 ESR1 A 1.33 9.2 x10⁻⁶ 1.57 (1.25-1.98) 1.2x10⁻⁴ 1.58 (1.25-2.01) 1.5x10⁻⁴ 1.48 (0.75-2.92) 0.26
rs2046210 I 6 151990059 ESR1 A 1.16 5.3 x10⁻⁵ 1.25 (1.09-1.43) 1.5x10⁻³ 1.22 (1.06-1.41) 6.8x10⁻³ 1.54 (1.04-2.27) 0.031
rs12525163 I 6 152081984 ESR1 C 1.15 4.9x10⁻⁴ 1.08 (0.93-1.25) 0.31 1.1 (0.94-1.28) 0.24 0.94 (0.61-1.46) 0.78
rs7904519 G 10 114763917 TCF7L2 G 1.12 9.9x10⁻⁴ 1.10 (0.97-1.26) 0.15 1.09 (0.95-1.26) 0.2 1.17 (0.80-1.71) 0.43
rs3903072 I 11 65339642 11q13.1 A 0.92 0.024 0.95 (0.83-1.08) 0.42 0.95 (0.82-1.09) 0.43 0.97 (0.66-1.43) 0.88
rs11820646 I 11 128966381 11q24.3 A 0.92 0.016 0.91 (0.79-1.04) 0.17 0.88 (0.77-1.02) 0.084 1.17 (0.80-1.72) 0.42
rs12422552 I 12 14305198 12p13.1 C 1.13 2.7x10⁻³ 1.15 (0.99-1.34) 0.06 1.16 (0.99-1.36) 0.059 1.07 (0.70-1.64) 0.74
rs10771399 I 12 28046347 PTHLH G 0.72 1.5x10⁻⁸ 0.77 (0.61-0.96) 0.022 0.74 (0.58-0.94) 0.015 1.01 (0.57-1.80) 0.97
rs17356907 G 12 94551890 NTN4 G 0.90 7.5x10⁻³ 1.15 (0.93-1.22) 0.061 1.16 (0.99-1.35) 0.066 1.14 (0.74-1.75) 0.56
rs1292011 G 12 114320905 12q24 G 1.08 0.035 1.06 (0.93-1.22) 0.4 1.03 (0.90-1.19) 0.64 1.25 (0.84-1.89) 0.27
rs11571833 I 13 31870626 BRCA2 T 1.44 0.023 1.62 (0.92-2.86) 0.094 1.70 (0.96-3.03) 0.07 1.01 (0.15-6.72) 0.99
rs2588809 I 14 67730181 RAD51L1 A 0.91 0.041 0.87 (0.72-1.05) 0.14 0.85 (0.70-1.04) 0.11 1.00 (0.61-1.65) 1
rs3803662 G 16 51143842 TOX3 A 1.09 0.022 1.06 (0.91-1.22) 0.46 1.07 (0.92-1.25) 0.38 0.9 (0.59-1.37) 0.62
rs8170 G 19 17250704 19p13.1 A 1.26 1.3 x10⁻⁷ 1.22 (1.04-1.44) 0.017 1.26 (1.06-1.49) 7.3x10⁻³ 1.03 (0.62-1.71) 0.9
rs2363956 G 19 17255124 19p13.1 C 0.82 2.3 x10⁻⁸ 0.83 (0.72-0.94) 4.8x10⁻³ 0.82 (0.71-0.94) 5.4x10⁻³ 0.81 (0.56-1.17) 0.26
rs1864112 I 19 17309960 19p13.1 A 0.84 5.5x10⁻⁶ 0.81 (0.70-0.94) 7.1x10⁻³ 0.79 (0.67-0.93) 4.7x10⁻³ 0.9 (0.59-1.36) 0.61
rs6142050 G 20 31990789 RALY G 1.11 3.8x10⁻³ 1.11 (0.97-1.27) 0.14 1.11 (0.96-1.28) 0.14 1.07 (0.72-1.59) 0.73
rs6001913 G 22 39166699 MKL1 A 1.20 1.8x10⁻³ 1.46 (1.17-1.82) 6.6x10⁻⁴ 1.45 (1.16-1.82) 1.3x10⁻³ 1.5 (0.82-2.77) 0.19
Page 54 of 70Carcinogenesis
123456789101112131415161718192021222324252627282930313233343536373839404142434445464748495051525354555657585960
at UQ Library on December 17, 2013 http://carcin.oxfordjournals.org/ Downloaded from

For Peer Review
Table S15. Polygenic risk score and TNBC risk using the first quintile as the reference
74 SNPs 27 SNPs
PRS
Quintile
Quintile
definitions OR 95% CI p-value
Quintile
definitions OR 95% CI p-value
1 PRS≤0.24 1.00 -- -- PRS≤-0.57 1.00 -- --
2 0.24<PRS≤0.58 1.53 1.29-1.81 1.1x10⁻⁶
-0.57<PRS≤-0.26 1.43 1.21-1.69 2.8x10⁻⁵
3 0.58<PRS≤0.86 1.97 1.68-2.32 9.9x10⁻¹⁶
-0.26<PRS≤0.039 1.91 1.63-2.25 3.9x10⁻¹⁵
4 0.86<PRS≤1.24 2.54 2.17-2.97 1.3x10⁻²⁹
0.039<PRS≤0.40 2.62 2.24-3.06 1.4x10⁻³³
5 1.24<PRS 4.03 3.46-4.70 4.8x10-69
0.40<PRS 4.08 3.50-4.75 2.5x10-74
Page 55 of 70 Carcinogenesis
123456789101112131415161718192021222324252627282930313233343536373839404142434445464748495051525354555657585960
at UQ Library on December 17, 2013 http://carcin.oxfordjournals.org/ Downloaded from

For Peer Review
Figure S1. Association between 19p13.1 variants (n=170) and TN breast cancer risk
a) TNBC associations in a 250kb region
b) Adjusted for rs8100241
Page 56 of 70Carcinogenesis
123456789101112131415161718192021222324252627282930313233343536373839404142434445464748495051525354555657585960
at UQ
Library on D
ecember 17, 2013
http://carcin.oxfordjournals.org/D
ownloaded from

For Peer Review
Figure S2. Association between ESR1 variants (n=448) and TN breast cancer risk
a) TNBC associations in a 250kb region
b) Adjusted for rs9397437
Page 57 of 70 Carcinogenesis
123456789101112131415161718192021222324252627282930313233343536373839404142434445464748495051525354555657585960
at UQ
Library on D
ecember 17, 2013
http://carcin.oxfordjournals.org/D
ownloaded from

For Peer Review
Figure S3. ROC curves for TN breast cancer risk by 74-SNP and 30-SNP PRS
Page 58 of 70Carcinogenesis
123456789101112131415161718192021222324252627282930313233343536373839404142434445464748495051525354555657585960
at UQ
Library on D
ecember 17, 2013
http://carcin.oxfordjournals.org/D
ownloaded from

For Peer Review
Figure S4. Cumulative risk of TNBC stratified by a 30-SNP polygenic risk score
Page 59 of 70 Carcinogenesis
123456789101112131415161718192021222324252627282930313233343536373839404142434445464748495051525354555657585960
at UQ
Library on D
ecember 17, 2013
http://carcin.oxfordjournals.org/D
ownloaded from

For Peer Review
Figure legends
Figure S1. Association between 19p13.1 variants (n=170) and TN breast cancer risk
a) The association between 170 variants from the combined 19p13.1 analyses in stages 1 and 2 is
shown. The most significant SNP (rs8100241) is shown as the purple diamond (p=1.8 x 10⁻⁸
).
The remaining variants are shown as circles, colored by the degree of linkage disequilibrium (R2)
between each SNP and rs8100241. The continuous blue line represents the recombination rate
(cM/Mb). b) The association between 19p13.1 variants adjusted for rs8100241 is shown. The
most significant SNP after adjustment for rs8100241 (rs1864112) is shown as the purple
diamond (p=5.5 x 10⁻⁶
).
Figure S2. Association between ESR1 variants (n=448) and TN breast cancer risk
a) The association between 448 variants from the combined ESR1 analyses in stages 1 and 2 is
shown. The most significant SNP (rs9397437) is shown as the purple diamond (p=8.9 x 10⁻⁸
).
The remaining variants are shown as circles, colored by the degree of linkage disequilibrium (R2)
between each SNP and rs9397437. The continuous blue line represents the recombination rate
(cM/Mb). b) The association between ESR1 variants adjusted for rs9397437is shown. The most
significant SNP after adjustment for rs9397437 (rs12525163) is shown as the purple diamond
(p=4.9 x 10⁻⁴
).
Figure S3. ROC curves for TN breast cancer risk by 74-SNP and 30-SNP PRS
Receiver operating characteristic (ROC) curves are shown for the 74-SNP PRS (solid black line)
and the 30-SNP PRS (dashed black line). The area under the curve (AUC) for the 74-SNP PRS
Page 60 of 70Carcinogenesis
123456789101112131415161718192021222324252627282930313233343536373839404142434445464748495051525354555657585960
at UQ
Library on D
ecember 17, 2013
http://carcin.oxfordjournals.org/D
ownloaded from

For Peer Review
was 0.637 (95% CI 0.625-0.649) while the AUC for the 30-SNP PRS was 0.642 (95% CI 0.630-
0.654).
Figure S4. Cumulative risk of TNBC stratified by a 30-SNP polygenic risk score
The effect of the 30-SNP polygenic risk score (PRS) on cumulative risk of triple negative (TN)
breast cancer among Caucasian women, stratified by PRS quintile, is shown. The population-
based cumulative risk curve is shown as a solid black line, and the first through fifth quintile-
specific cumulative risk estimates are presented according to labels.
Page 61 of 70 Carcinogenesis
123456789101112131415161718192021222324252627282930313233343536373839404142434445464748495051525354555657585960
at UQ
Library on D
ecember 17, 2013
http://carcin.oxfordjournals.org/D
ownloaded from

For Peer Review
The Triple-Negative Breast Cancer Consortium (TNBCC)
Australia Breast Cancer Tissue Bank (ABCTB): Breast cancer cases were collected from six
hospitals in New South Wales, Australia: Royal Prince Alfred Hospital, Westmead Hospital,
Royal North Shore Hospital, St. Vincent’s Hospital, Hunter Area Hospitals, and Port Macquarie
beginning in 2006.
Bavarian Breast Cancer Cases and Controls (BBCC): This is a consecutive series of cases with
invasive breast cancer recruited at the University Breast Centre, Franconia in Northern Bavaria,
Germany from 2002-2006. Cases were between 22-96 years of age. Controls were population-
based unaffected women from the same geographical area.
California Teachers Study (CTS): Breast cancer cases from the CTS cohort, composed of women
who were active or retired California teachers or administrators at the time the cohort was
established in 1995. Cancer outcomes were identified through annual linkage with the California
Cancer Registry (CCR). Unaffected individuals from the CTS cohort were sampled for controls.
Cancer Genetic Markers of Susceptibility (CGEMS): The Nurses’ Health Study (NHS) is a
longitudinal study of 121,700 women enrolled in 1976. The CGEMS nested case-control study
is derived from 32,826 participants who provided a blood sample between 1989 and 1990 and
were free of diagnosed breast cancer at blood collection and followed for incident disease until
June 1, 2004. Controls were not diagnosed with breast cancer during follow-up, and were
matched to cases based on age at diagnosis, blood collection variables (time of day, season, and
Page 62 of 70Carcinogenesis
123456789101112131415161718192021222324252627282930313233343536373839404142434445464748495051525354555657585960
at UQ
Library on D
ecember 17, 2013
http://carcin.oxfordjournals.org/D
ownloaded from

For Peer Review
year of blood collection, as well as recent (<3 months) use of postmenopausal hormones),
ethnicity (all cases and controls are self-reported Caucasians), and menopausal status (all cases
were postmenopausal at diagnosis).
Dana Farber Cancer Institute (DFCI): Cases were obtained from an unselected series of breast
tumors patients from the Dana Farber Cancer Institute. DNA samples from residual bloods from
triple negative breast cancer patients were genotyped.
DEMOKRITOS: Cases were enrolled from 1997 until 2010 in several major hospitals covering
most geographical areas of Greece, such as Athens metropolitan area, Thessaloniki, Ioannina,
Patras, and Crete (Chania), in collaboration with the Hellenic Cooperative Oncology Group
(HECOG). Cases had an age range of 20-87 years. Controls were population-based unaffected
women of the same age range.
Fox Chase Cancer Center (FCCC): Cases were seen at FCCC and 28-80 years of age at
diagnosis. Comprehensive clinical data including histology, staging, treatment and outcomes was
provided for all cases. Controls were healthy females with no personal cancer history matched
geographically and by gender, race and age. DNA was obtained from peripheral blood samples.
Gene Environment Interaction and Breast Cancer in Germany (GENICA): This is a population-
based case-control study of breast cancer in the Greater Bonn area of Germany. Cases were
incident breast cancer cases enrolled between 2000 and 2004 (reported from 14 hospitals within
the study region), all of which were enrolled within 6 months of diagnosis. Cases were between
Page 63 of 70 Carcinogenesis
123456789101112131415161718192021222324252627282930313233343536373839404142434445464748495051525354555657585960
at UQ
Library on D
ecember 17, 2013
http://carcin.oxfordjournals.org/D
ownloaded from
For Peer Review
23-80 years of age. Controls were selected from population registries from 31 communities in
the greater Bonn area and matched to cases in 5-year age classes between 2001 and 2004.
University of Kansas Medical Center (KUMC): Cases were obtained from an unselected series of
breast tumors patients from the University of Kansas Medical Center. DNA samples from
residual bloods from triple negative breast cancer patients were genotyped.
Helsinki Breast Cancer Study (HEBCS): Cases from this hospital-based case-control study in
Southern Finland were consecutive breast cancer cases from the 1) Department of Oncology,
Helsinki University Central Hospital 1997-8 and 2000, 2) consecutive cases from the
Department of Surgery, Helsinki University Central Hospital 2001 – 2004, or 3) Familial breast
cancer patients from the Helsinki University Central Hospital, Departments of Oncology and
Clinical Genetics (from 1995). Cases were between 22 and 96 years of age. The population
allele and genotype frequencies were obtained from the Finnish Genome Centre on 221 healthy
population controls in the NordicDB, a Nordic pool and portal for genome-wide control data
(19).
Cooperative Health Research in the Region of Augsburg (KORA): In total, four population
based health surveys have been conducted between 1984 and 2000 with 18,000 participants
between the age of 25 to 74 years, and a biological specimen bank was established in order to
enable the researchers to perform epidemiologic research with respect to molecular and genetic
factors. The KORA study center conducts regular follow-up investigations and has collected a
Page 64 of 70Carcinogenesis
123456789101112131415161718192021222324252627282930313233343536373839404142434445464748495051525354555657585960
at UQ
Library on D
ecember 17, 2013
http://carcin.oxfordjournals.org/D
ownloaded from

For Peer Review
wealth of information on sociodemography, general medical history, environmental factors,
smoking, nutrition, alcohol consumption, and various laboratory parameters. Follow-up activities
include address inquiry for all participants (incl. assessment of vital status and cause of death),
postal questionnaires focusing on chronic diseases, and complete follow-up studies with
interviews and physical examination.
Mammary Carcinoma Risk Factor Investigation (MARIE): This is a population-based case-
control study of breast cancer in Northern and Southern Germany. Cases from this study were
incident and prevalent cases diagnosed from 2001-2005 in the study region of Hamburg in
Northern Germany and from 2002-2005 in the study region of Rhein-Neckar-Karlsruhe in
Southern Germany. Controls were randomly drawn from population registries and frequency
matched by birth year and study region to the case. Controls were recruited from 2002 to 2006.
Mayo Clinic Breast Cancer Study (MCBCS): This is a clinic-based breast cancer case-control
study at the Mayo Clinic. Subjects were enrolled between February 1, 2001 and June 30, 2005.
Cases were comprised of Caucasian women with primary invasive breast cancer ascertained with
6 months of diagnosis. Controls were comprised of Caucasian women visiting the Mayo Clinic
for general medical exams in the Department of Internal Medicine with no prior history of
cancer. Controls were frequency matched to cases on region of residence, race, and 5-year age
group.
Melbourne Collaborative Cohort Study (MCCS): Incident cases of breast cancer were diagnosed
within the Melbourne Collaborative Cohort Study in Melbourne, Australia during the follow-up
Page 65 of 70 Carcinogenesis
123456789101112131415161718192021222324252627282930313233343536373839404142434445464748495051525354555657585960
at UQ
Library on D
ecember 17, 2013
http://carcin.oxfordjournals.org/D
ownloaded from
For Peer Review
from baseline (1990-1994) to 2008 of the 24,469 participating women, and controls were
randomly sampled from the initial cohort among members not diagnosed with breast cancer at
the end of follow-up.
Norwegian Breast Cancer Study (NBCS): Cases were comprised of Incidence cases from three
different hospitals: 1) Cases (114) mean age 64 (28-92) at Ullevål Univ. Hospital 1990-94, 2)
cases (182) mean age 59 (26-75) referred to Norwegian Radium Hospital 1975-1986, 3) cases
(124), mean age 56 (29-82) ) with stage I or II disease, in the Oslo micro-metastases study at
Norwegian Radium Hospital between 1995-1998, 4) cases (71) mean age 67 (37–82) with
locally advanced disease at Haukeland University Hospital. Control subjects were healthy
women, age 55-71, residing in Tromsø (440), and Bergen (109) attending the Norwegian Breast
Cancer Screening Program.
The Nashville Breast Health Study (NBHS): The NBHS is a population‐based case‐control study
of breast cancer conducted in Tennessee. The study was initiated in 2001 to recruit patients with
invasive breast cancer or ductal carcinoma in situ between the ages of 25 and 75 years. Cases
were identified from participating hospitals in and around the Nashville Metropolitan area as
well as from the Tennessee Cancer Registry (TCR). Diagnosis and tumor pathology were
confirmed via medical record abstraction and ascertainment from the TCR. Controls were
recruited through random digit dialing.
Ohio State University (OSU): Cases were obtained from an unselected series of breast tumors
patients from the Ohio State University Stefanie Spielman Breast Bank. DNA samples isolated
Page 66 of 70Carcinogenesis
123456789101112131415161718192021222324252627282930313233343536373839404142434445464748495051525354555657585960
at UQ
Library on D
ecember 17, 2013
http://carcin.oxfordjournals.org/D
ownloaded from

For Peer Review
from blood of triple negative breast cancer patients were genotyped. Controls were selected from
the Columbus Area Control Sample Bank and were frequency matched for age and ethnicity to
the cases.
Prospective Study of Outcomes in Sporadic Versus Hereditary Breast Cancer (POSH): Cases
from this prospective cohort study in the United Kingdom were aged 40 or younger at breast
cancer diagnosis, recruited across the UK, and diagnosed between January 2000 and December
2007.
Australian Twin Cohort study from the Queensland Institute of Medical Research (QIMR): Two
cohorts of Australian twins and their families (parents, children, spouses and siblings), were
recruited to a Health and Lifestyle study in 1988 and 1990. The total number of participants was
over 27,000, with an age range of 17 to 96 (M = 39.7, SD = 15.3). Phenotypic data were
available for 20,464 individuals, of which 5117 (1727 males and 3390 females) from 2567
independent families were genotyped. Phenotypic and genotypic data collection was approved by
the Queensland Institute of Medical Research (QIMR) Ethics Committee and informed consent
was obtained from all participants.
Sheffield Breast Cancer Study (SBCS): This is a hospital-based case-control study of breast
cancer. The study consists of women with pathologically confirmed breast cancer recruited from
surgical outpatient clinics at the Royal Hallamshire Hospital, Sheffield, 1998 – 2005 and
unselected women attending the Sheffield Mammography Screening Service between Sep 2000 -
Page 67 of 70 Carcinogenesis
123456789101112131415161718192021222324252627282930313233343536373839404142434445464748495051525354555657585960
at UQ
Library on D
ecember 17, 2013
http://carcin.oxfordjournals.org/D
ownloaded from

For Peer Review
Aug 2004 if their mammograms showed no evidence of a breast lesion. Cases are a mixture of
prevalent and incident disease.
Städtisches Klinikum Karlsruhe and Deutsches Krebsforschungszentrum Breast Cancer Study
(SKKDKFZS): This breast cancer case cohort study consists of women with pathologically
confirmed breast cancer recruited at the Städtisches Klinikum Karlruhe, Karlsruhe, Germany
from 1993 - 2005. Cases were between 21-93 years of age. Controls for the subgroup of TN
breast cancer cases were from an unselected series of unaffected women from the same
geographical area.
Simultaneous Study of Docetaxel Based Anthracycline Free Adjuvant treatment Evaluation, as
well as Life Style Intervention Strategies (SUCCESS C): is a prospectively randomized trial for
high risk breast cancer patients without metastases. All patients had to be at least 18 years of age,
HER2 negative with an otherwise high risk of recurrence. A total of 3642 patients were recuited
from March 2009 to August 2011. Of 3256 patients whole blood samples could be collected, of
which 742 were from patients with triple negative tumors.
Washington University Young Women’s Breast Cancer Study (WASHU): This breast cancer case
cohort study consists of women with pathologically confirmed breast cancer identified through
the Young Women’s Breast Cancer Program at Washington University Siteman Cancer Center.
Wellcome Trust Case Control Consortium (WTCCC): The 1958 Birth Cohort (also known as the
National Child Development Study) includes all births in England, Wales and Scotland, during
Page 68 of 70Carcinogenesis
123456789101112131415161718192021222324252627282930313233343536373839404142434445464748495051525354555657585960
at UQ
Library on D
ecember 17, 2013
http://carcin.oxfordjournals.org/D
ownloaded from

For Peer Review
one week in 1958. From an original sample of over 17,000 births, survivors were followed up at
ages 7, 11, 16, 23, 33 and 42 yrs. In a biomedical examination at 44-45 yrs, 9,377 cohort
members were visited at home providing 7,692 blood samples with consent for future Epstein–
Barr virus (EBV)-transformed cell lines. DNA samples extracted from 1,500 cell lines of self-
reported white ethnicity and representative of gender and each geographical region were selected
for use as controls.
Page 69 of 70 Carcinogenesis
123456789101112131415161718192021222324252627282930313233343536373839404142434445464748495051525354555657585960
at UQ
Library on D
ecember 17, 2013
http://carcin.oxfordjournals.org/D
ownloaded from

For Peer Review
References
1. Michailidou, K., et al. (2013) Large-scale genotyping identifies 41 new loci associated
with breast cancer risk. Nature genetics, 45, 353-61.
2. Thomas, G., et al. (2009) A multistage genome-wide association study in breast cancer
identifies two new risk alleles at 1p11.2 and 14q24.1 (RAD51L1). Nat Genet, 41, 579-84.
3. Garcia-Closas, M., et al. (2013) Genome-wide association studies identify four ER
negative-specific breast cancer risk loci. Nature genetics, 45, 392-8.
4. Cox, A., et al. (2007) A common coding variant in CASP8 is associated with breast
cancer risk. Nat Genet, 39, 352-8.
5. Stacey, S.N., et al. (2007) Common variants on chromosomes 2q35 and 16q12 confer
susceptibility to estrogen receptor-positive breast cancer. Nat Genet, 39, 865-9.
6. Ahmed, S., et al. (2009) Newly discovered breast cancer susceptibility loci on 3p24 and
17q23.2. Nat Genet, 41, 585-90.
7. Haiman, C.A., et al. (2011) A common variant at the TERT-CLPTM1L locus is
associated with estrogen receptor-negative breast cancer. Nat Genet, 43, 1210-4.
8. Bojesen, S.E., et al. (2013) Multiple independent variants at the TERT locus are
associated with telomere length and risks of breast and ovarian cancer. Nature genetics,
45, 371-84.
9. Stacey, S.N., et al. (2008) Common variants on chromosome 5p12 confer susceptibility
to estrogen receptor-positive breast cancer. Nat Genet, 40, 703-6.
10. Easton, D.F., et al. (2007) Genome-wide association study identifies novel breast cancer
susceptibility loci. Nature, 447, 1087-93.
11. Turnbull, C., et al. (2010) Genome-wide association study identifies five new breast
cancer susceptibility loci. Nat Genet, 42, 504-7.
12. Zheng, W., et al. (2009) Genome-wide association study identifies a new breast cancer
susceptibility locus at 6q25.1. Nat Genet, 41, 324-8.
13. Fletcher, O., et al. (2011) Novel Breast Cancer Susceptibility Locus at 9q31.2: Results of
a Genome-Wide Association Study. J Natl Cancer Inst.
14. French, J.D., et al. (2013) Functional Variants at the 11q13 Risk Locus for Breast Cancer
Regulate Cyclin D1 Expression through Long-Range Enhancers. American journal of
human genetics.
15. Ghoussaini, M., et al. (2012) Genome-wide association analysis identifies three new
breast cancer susceptibility loci. Nat Genet, 44, 312-318.
16. Antoniou, A.C., et al. (2010) A locus on 19p13 modifies risk of breast cancer in BRCA1
mutation carriers and is associated with hormone receptor-negative breast cancer in the
general population. Nat Genet, 42, 885-92.
17. Siddiq, A., et al. (2012) A meta-analysis of genome-wide association studies of breast
cancer identifies two novel susceptibility loci at 6q14 and 20q11. Hum Mol Genet.
18. Rhie, S.K., et al. (2013) Comprehensive functional annotation of seventy-one breast
cancer risk Loci. PLoS One, 8, e63925.
19. Leu, M., et al. (2010) NordicDB: a Nordic pool and portal for genome-wide control data.
Eur J Hum Genet, 18, 1322-6.
Page 70 of 70Carcinogenesis
123456789101112131415161718192021222324252627282930313233343536373839404142434445464748495051525354555657585960
at UQ
Library on D
ecember 17, 2013
http://carcin.oxfordjournals.org/D
ownloaded from