Epidemiology 217 Molecular and Genetic Epidemiology I

Epidemiology 217 Molecular and Genetic Epidemiology I.
Dec 17, 2015
Welcome message from author
This document is posted to help you gain knowledge. Please leave a comment to let me know what you think about it! Share it to your friends and learn new things together.
Transcript
Epidemiology 217Molecular and Genetic Epidemiology I
Outline
● Course structure● Overview of genetics● Overview of genetic epidemiology
Course Goals• Develop a framework for interpreting and
incorporating genetic information in your research
• Learn: – Common genetic measures.– A bit of population genetics.– Approaches to search for disease-causing
genes:• Association (key aspect of course) • Linkage• Admixture

Course Details11 Tuesdays from 01/08/2013 – 03/19/2013, 1:10-3:00 pm, CB6702 (China Basin)
Course Director: Thomas Hoffmann, [email protected]
Lecturers:Joe Wiemels, [email protected] Jorgenson, [email protected] Risch, [email protected]
Teaching Assistant:Laura Fejerman, [email protected]
website:http://www.epibiostat.ucsf.edu/courses/schedule/mol_methodsi.html(Lectures, homework assignments, and answers)
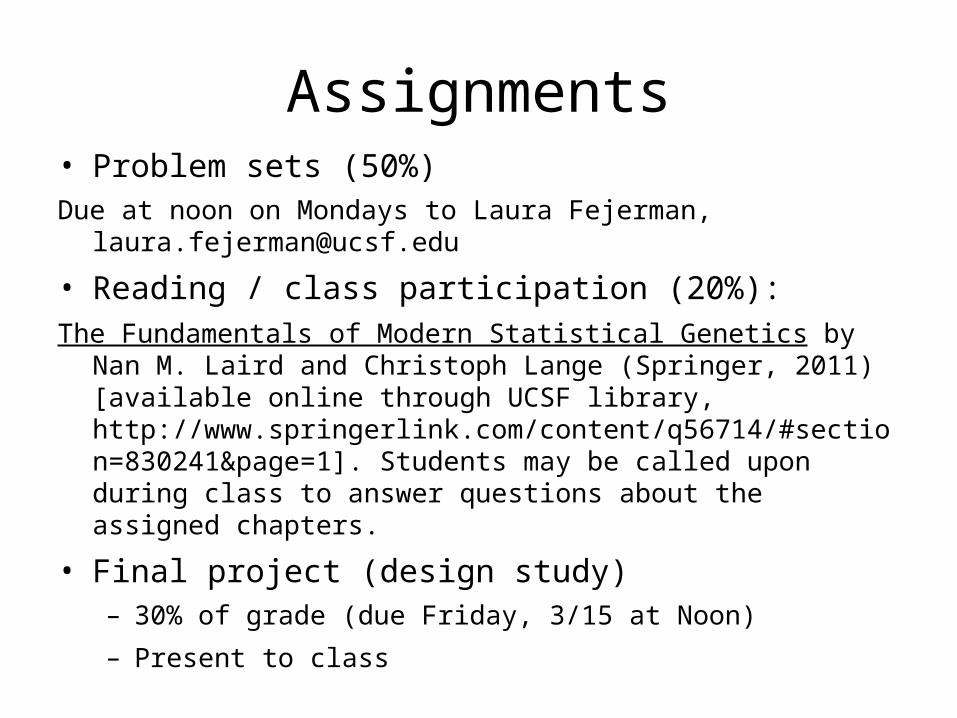
Assignments• Problem sets (50%)Due at noon on Mondays to Laura Fejerman,
• Reading / class participation (20%):The Fundamentals of Modern Statistical Genetics by Nan M. Laird and
Christoph Lange (Springer, 2011) [available online through UCSF library, http://www.springerlink.com/content/q56714/#section=830241&page=1]. Students may be called upon during class to answer questions about the assigned chapters.
• Final project (design study)– 30% of grade (due Friday, 3/15 at Noon)
– Present to class
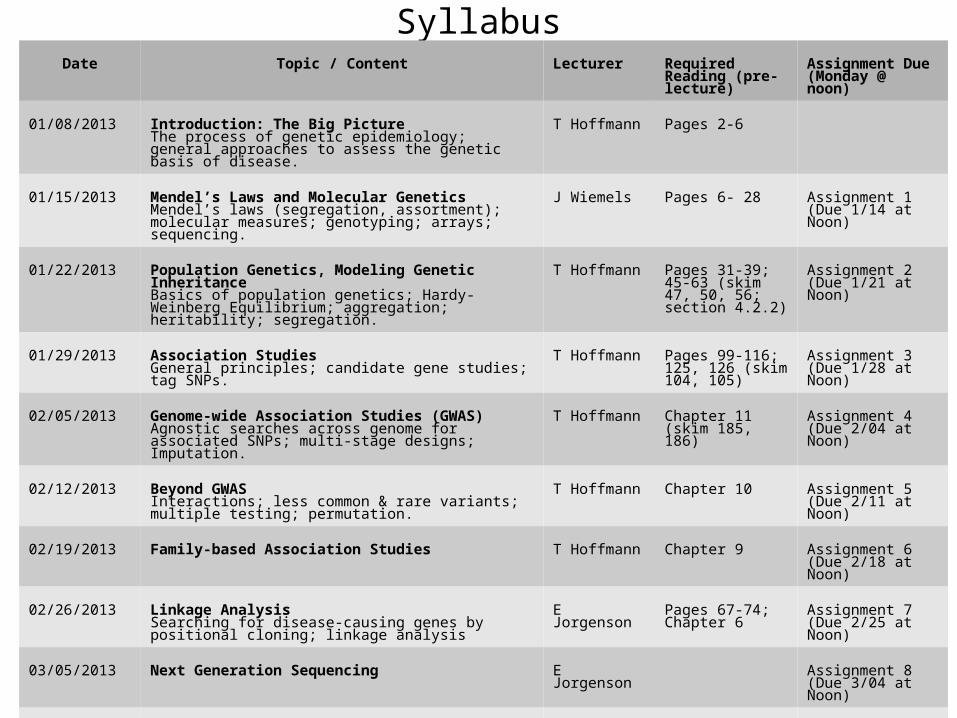
SyllabusDate Topic / Content Lecturer Required
Reading (pre-lecture)
Assignment Due(Monday @ noon)
01/08/2013 Introduction: The Big PictureThe process of genetic epidemiology; general approaches to assess the genetic basis of disease.
T Hoffmann Pages 2-6
01/15/2013 Mendel’s Laws and Molecular GeneticsMendel’s laws (segregation, assortment); molecular measures; genotyping; arrays; sequencing.
J Wiemels Pages 6- 28 Assignment 1(Due 1/14 at Noon)
01/22/2013 Population Genetics, Modeling Genetic InheritanceBasics of population genetics; Hardy-Weinberg Equilibrium; aggregation; heritability; segregation.
T Hoffmann Pages 31-39; 45-63 (skim 47, 50, 56; section 4.2.2)
Assignment 2(Due 1/21 at Noon)
01/29/2013 Association StudiesGeneral principles; candidate gene studies; tag SNPs.
T Hoffmann Pages 99-116; 125, 126 (skim 104, 105)
Assignment 3(Due 1/28 at Noon)
02/05/2013 Genome-wide Association Studies (GWAS)Agnostic searches across genome for associated SNPs; multi-stage designs; Imputation.
T Hoffmann Chapter 11 (skim 185, 186)
Assignment 4(Due 2/04 at Noon)
02/12/2013 Beyond GWAS Interactions; less common & rare variants; multiple testing; permutation.
T Hoffmann Chapter 10 Assignment 5(Due 2/11 at Noon)
02/19/2013 Family-based Association Studies T Hoffmann Chapter 9 Assignment 6(Due 2/18 at Noon)
02/26/2013 Linkage AnalysisSearching for disease-causing genes by positional cloning; linkage analysis
E Jorgenson Pages 67-74; Chapter 6
Assignment 7(Due 2/25 at Noon)
03/05/2013 Next Generation Sequencing E Jorgenson Assignment 8(Due 3/04 at Noon)
03/12/2013 Admixture AnalysisPopulation substructure, admixture mapping.
N Risch
03/19/2013 Putting it all Together: Incorporating Molecular and Genetic Measures into Your ResearchFinal Project presentations
T Hoffmann Final ProjectDue Friday 3/15 at noon
Professional Conduct Statement
• I will:– Maintain the highest standards of academic honesty.– Neither give nor receive extensive aid in assignments.– Not use answer keys from prior years.– Write in my own words.
– Conduct research in an unbiased manner, reports results truthfully, and credit ideas developed and work done by others.
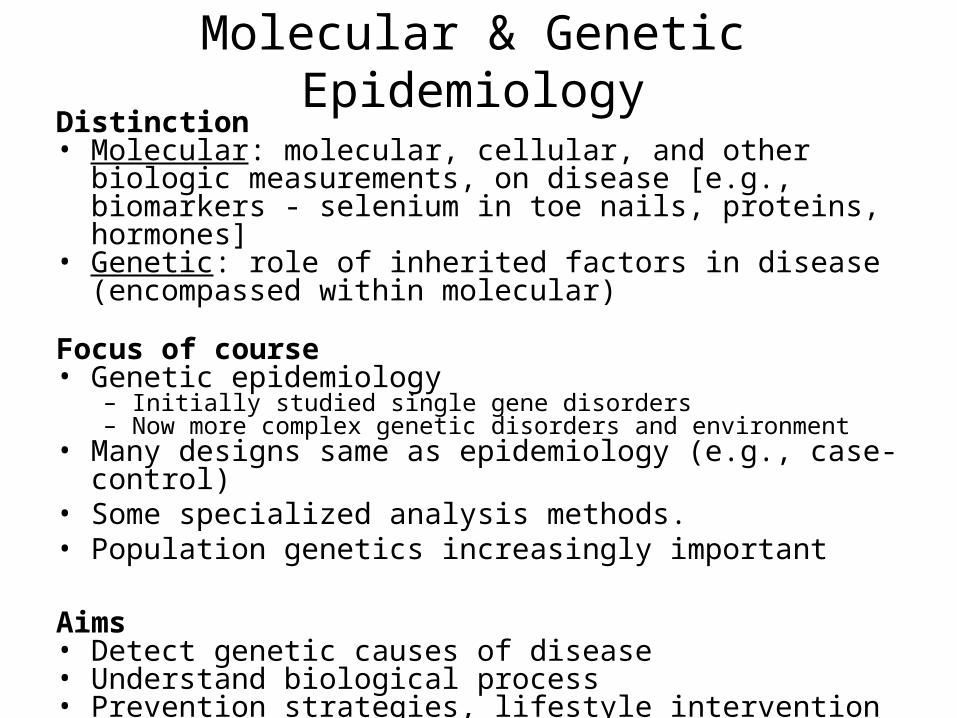
Molecular & Genetic EpidemiologyDistinction• Molecular: molecular, cellular, and other biologic measurements,
on disease [e.g., biomarkers - selenium in toe nails, proteins, hormones]
• Genetic: role of inherited factors in disease (encompassed within molecular)
Focus of course• Genetic epidemiology
– Initially studied single gene disorders– Now more complex genetic disorders and environment
• Many designs same as epidemiology (e.g., case-control) • Some specialized analysis methods.• Population genetics increasingly important
Aims• Detect genetic causes of disease• Understand biological process• Prevention strategies, lifestyle intervention • Improved therapeutic strategies, personalized medicine
Your Background in Genetics and Statistics?
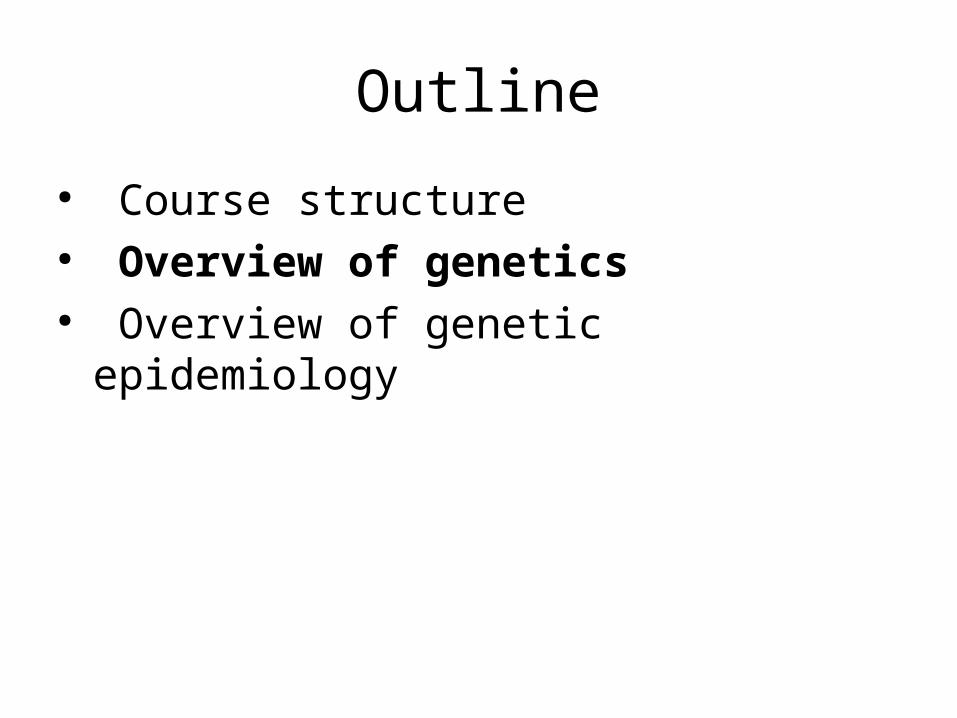
Outline
● Course structure● Overview of genetics● Overview of genetic epidemiology
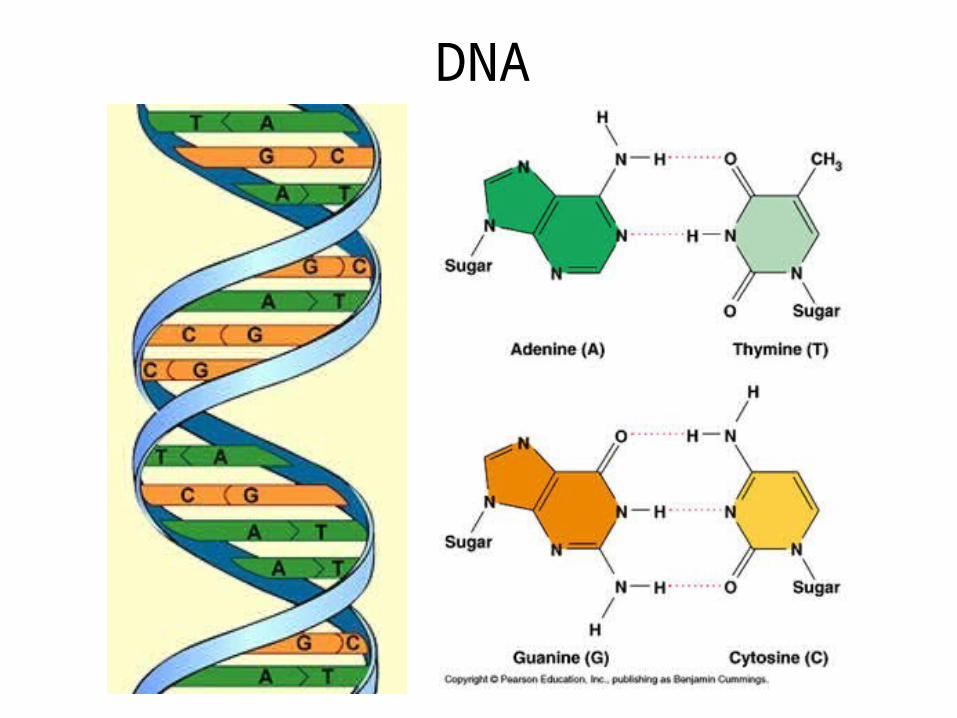
DNA
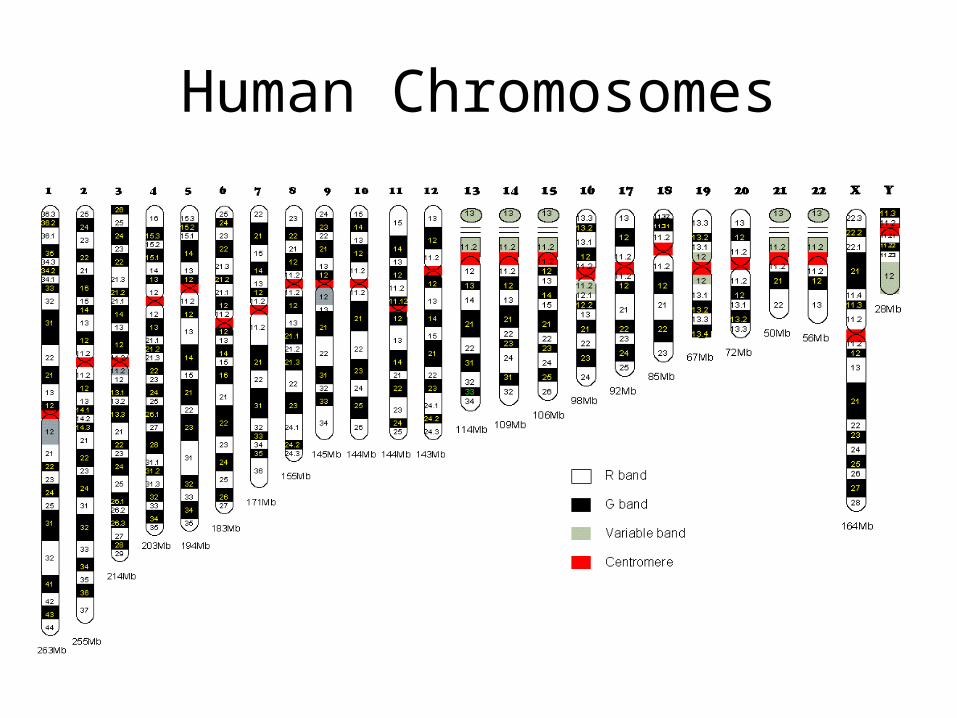
Human Chromosomes
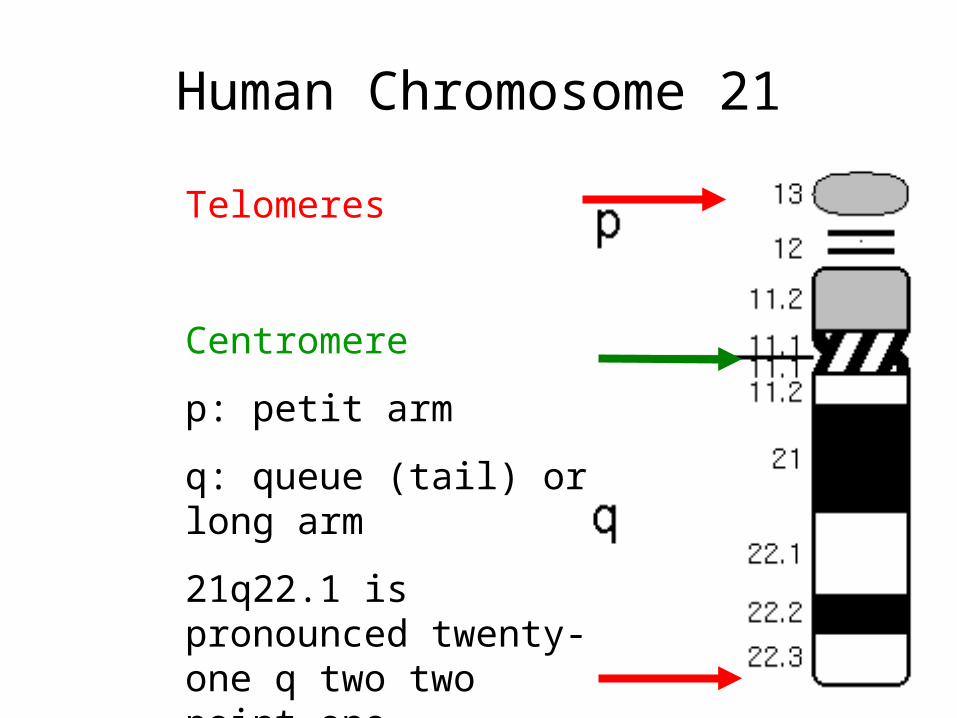
Human Chromosome 21
Telomeres
Centromere
p: petit arm
q: queue (tail) or long arm
21q22.1 is pronounced twenty-one q two two point one
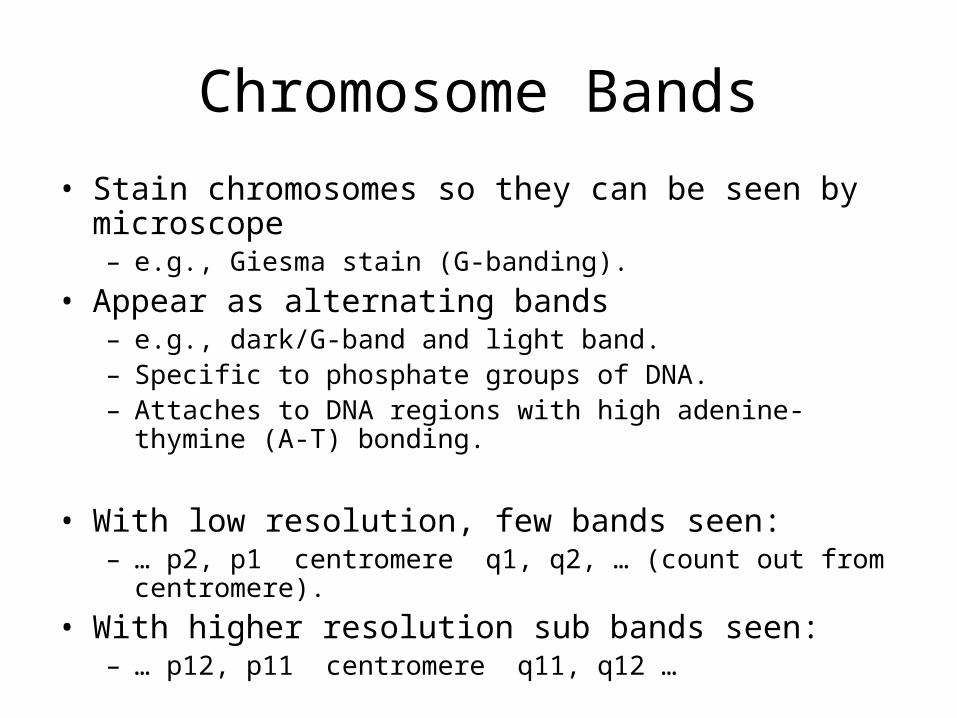
Chromosome Bands
• Stain chromosomes so they can be seen by microscope– e.g., Giesma stain (G-banding).
• Appear as alternating bands– e.g., dark/G-band and light band.– Specific to phosphate groups of DNA.– Attaches to DNA regions with high adenine-thymine (A-T)
bonding.
• With low resolution, few bands seen:– … p2, p1 centromere q1, q2, … (count out from centromere).
• With higher resolution sub bands seen:– … p12, p11 centromere q11, q12 …
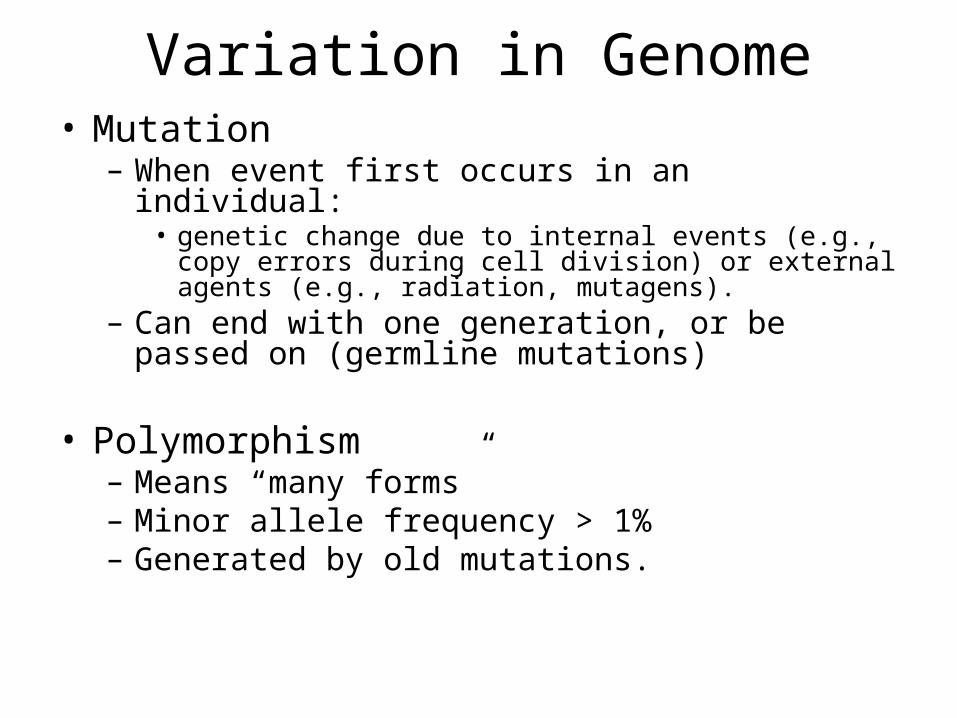
Variation in Genome• Mutation
– When event first occurs in an individual: • genetic change due to internal events (e.g., copy errors
during cell division) or external agents (e.g., radiation, mutagens).
– Can end with one generation, or be passed on (germline mutations)
• Polymorphism– Means “many forms”– Minor allele frequency > 1%– Generated by old mutations.
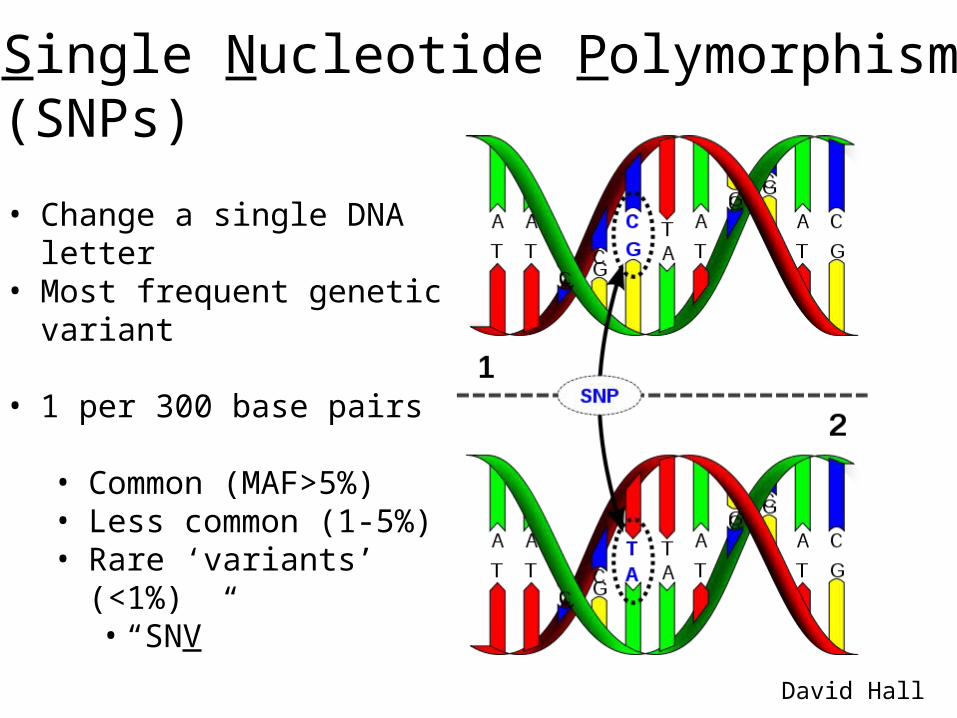
Single Nucleotide Polymorphism (SNPs)
• Change a single DNA letter• Most frequent genetic
variant
• 1 per 300 base pairs
• Common (MAF>5%)• Less common (1-5%)• Rare ‘variants’ (<1%)
• “SNV”
David Hall
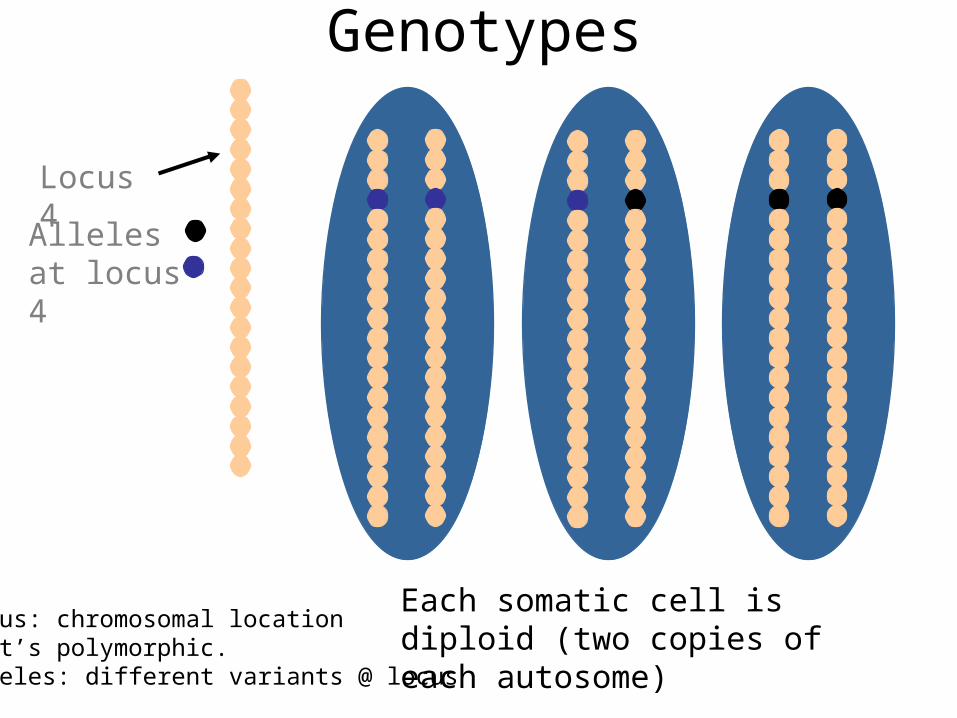
Locus 4
Alleles at locus 4
Each somatic cell is diploid (two copies of each autosome)
Thus, 3 genotypes at locus 4
Genotypes
Locus: chromosomal locationthat’s polymorphic.Alleles: different variants @ locus
Outline
● Course structure● Overview of genetics● Overview of genetic epidemiology
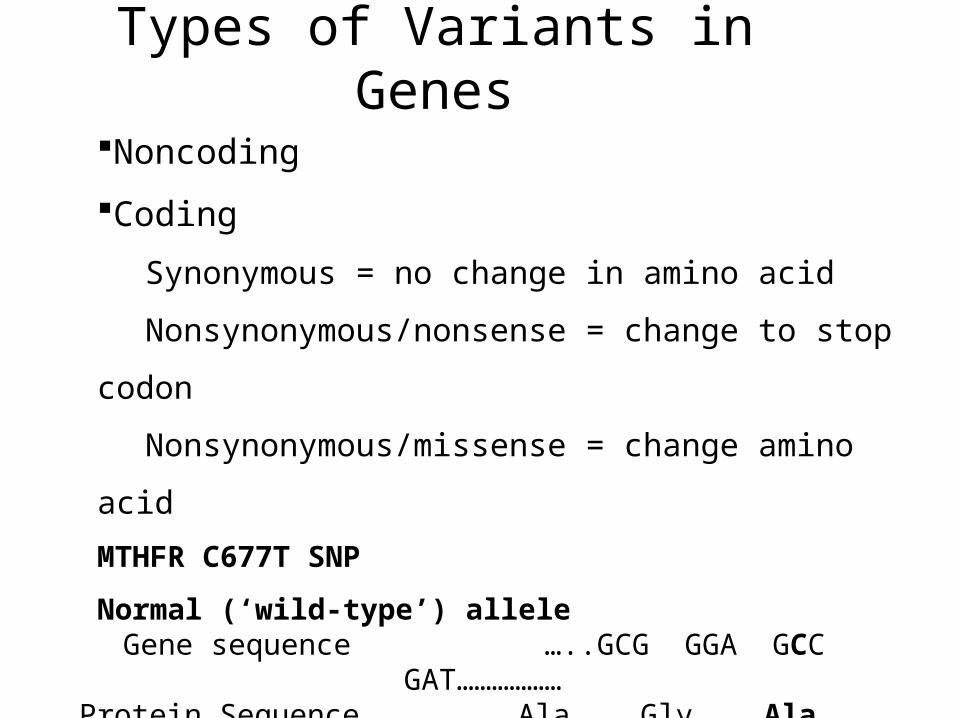
Types of Variants in Genes
Noncoding
Coding
Synonymous = no change in amino acid
Nonsynonymous/nonsense = change to stop
codon
Nonsynonymous/missense = change amino
acid
MTHFR C677T SNP
Normal (‘wild-type’) alleleGene sequence …..GCG GGA GCC GAT………………
Protein Sequence ……Ala Gly Ala Asp………………
Variant alleleGene Sequence …..GCG GGA GTC GAT……………….Protein Sequence ……Ala Gly Val Asp ..……………
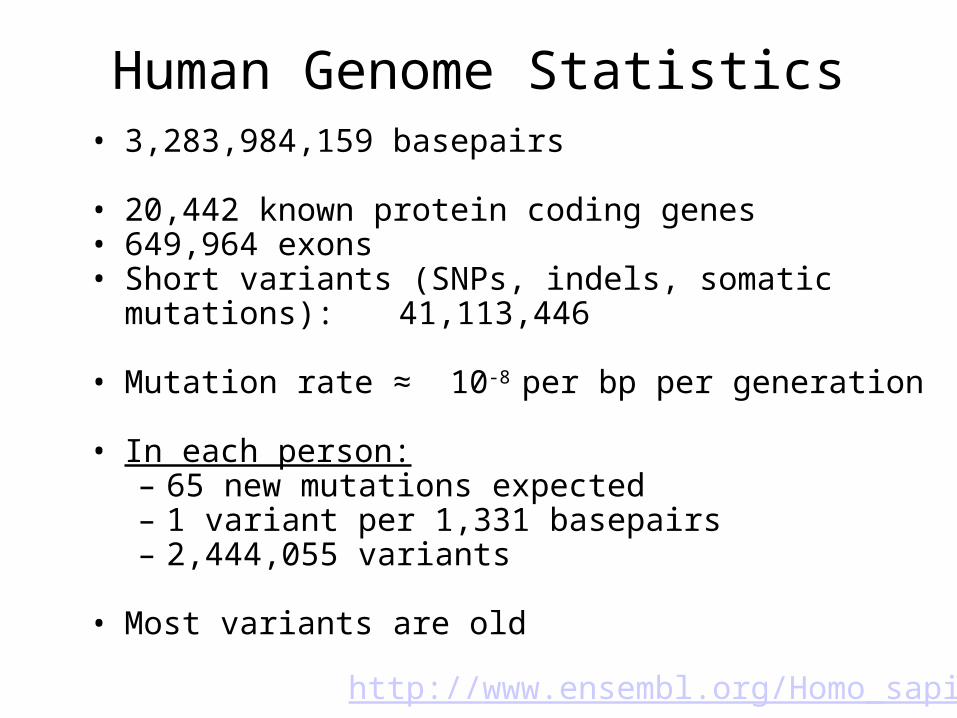
Human Genome Statistics• 3,283,984,159 basepairs
• 20,442 known protein coding genes• 649,964 exons• Short variants (SNPs, indels, somatic mutations):
41,113,446
• Mutation rate ≈ 10-8 per bp per generation
• In each person:– 65 new mutations expected– 1 variant per 1,331 basepairs– 2,444,055 variants
• Most variants are old
http://www.ensembl.org/Homo_sapiens
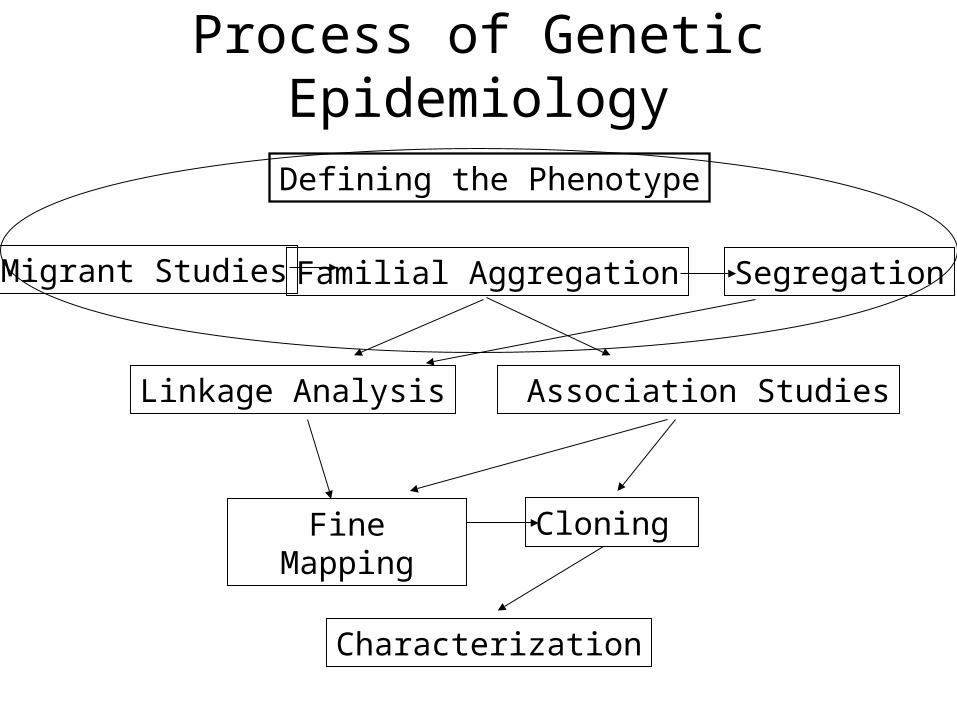
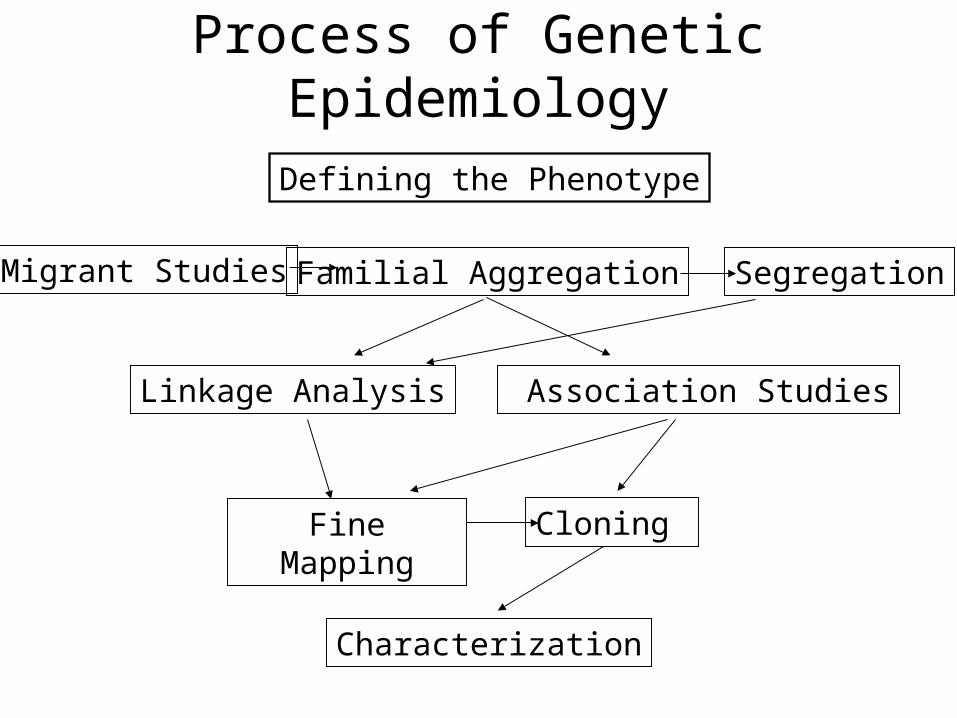
Process of Genetic Epidemiology
Migrant Studies Familial Aggregation Segregation
Association StudiesLinkage Analysis
Fine Mapping Cloning
Defining the Phenotype
Characterization
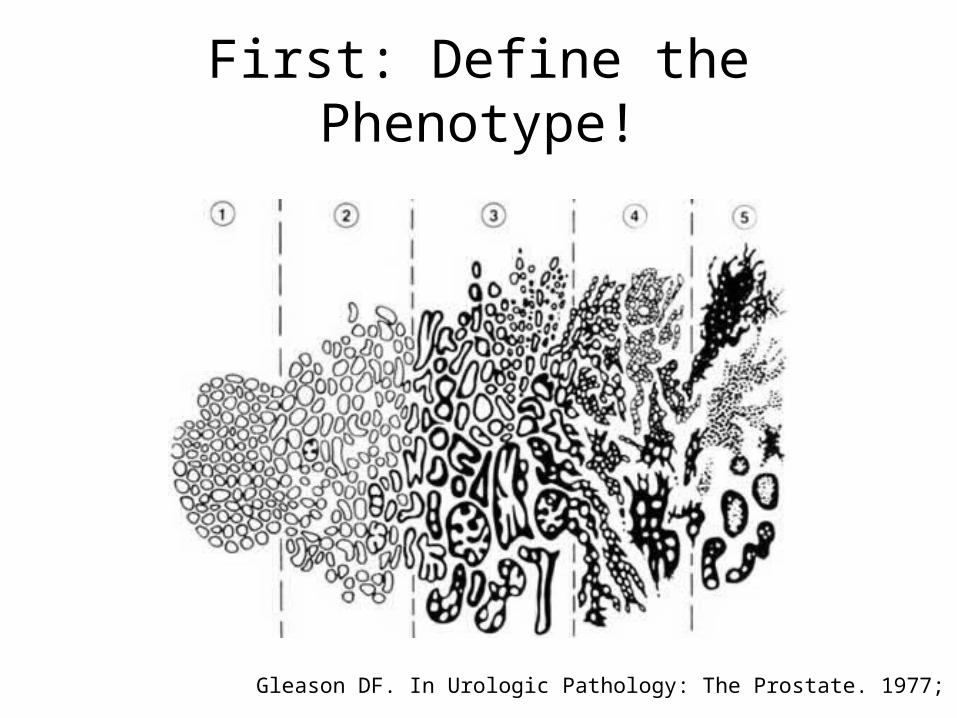
First: Define the Phenotype!
Gleason DF. In Urologic Pathology: The Prostate. 1977; 171-198.
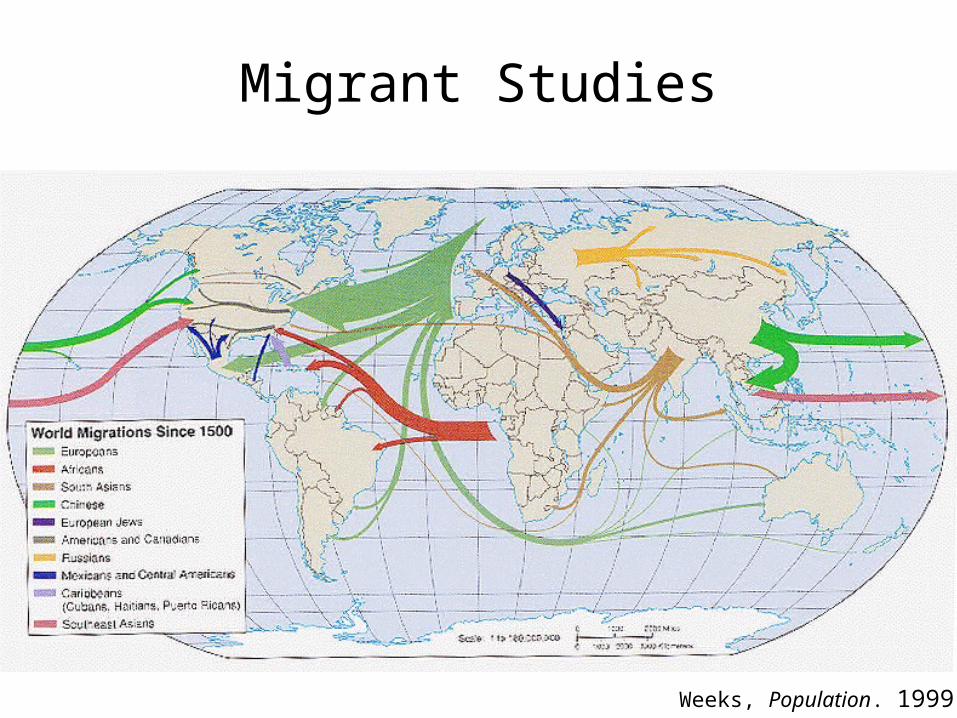
Migrant Studies
Weeks, Population. 1999
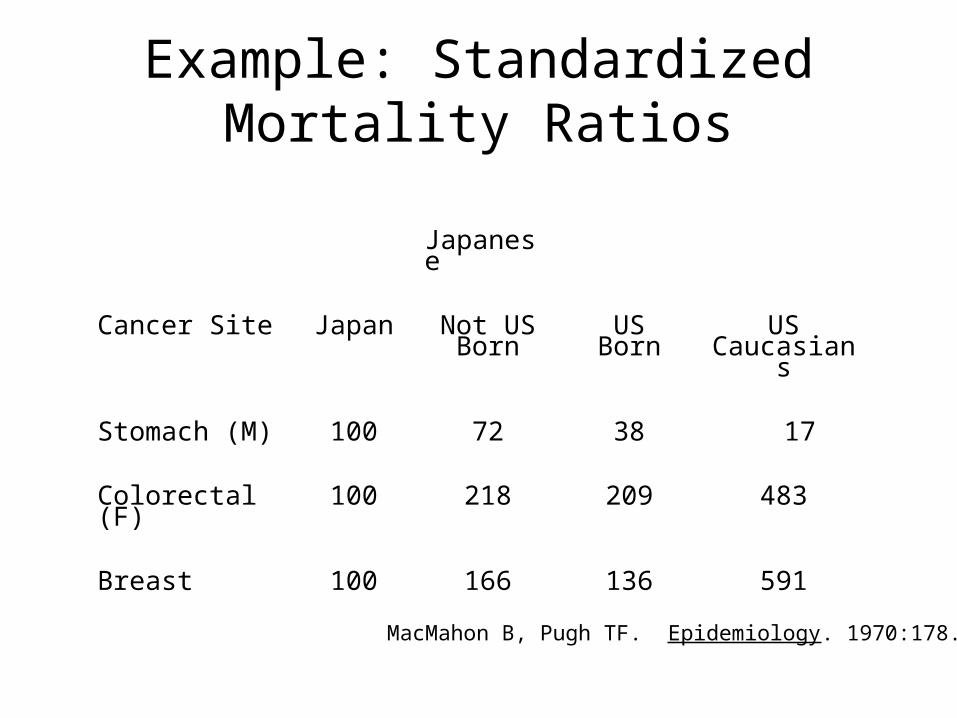
Example: Standardized Mortality Ratios
Japanese
Cancer Site Japan Not US Born
USBorn
USCaucasians
Stomach (M) 100 72 38 17
Colorectal (F) 100 218 209 483
Breast 100 166 136 591
MacMahon B, Pugh TF. Epidemiology. 1970:178.
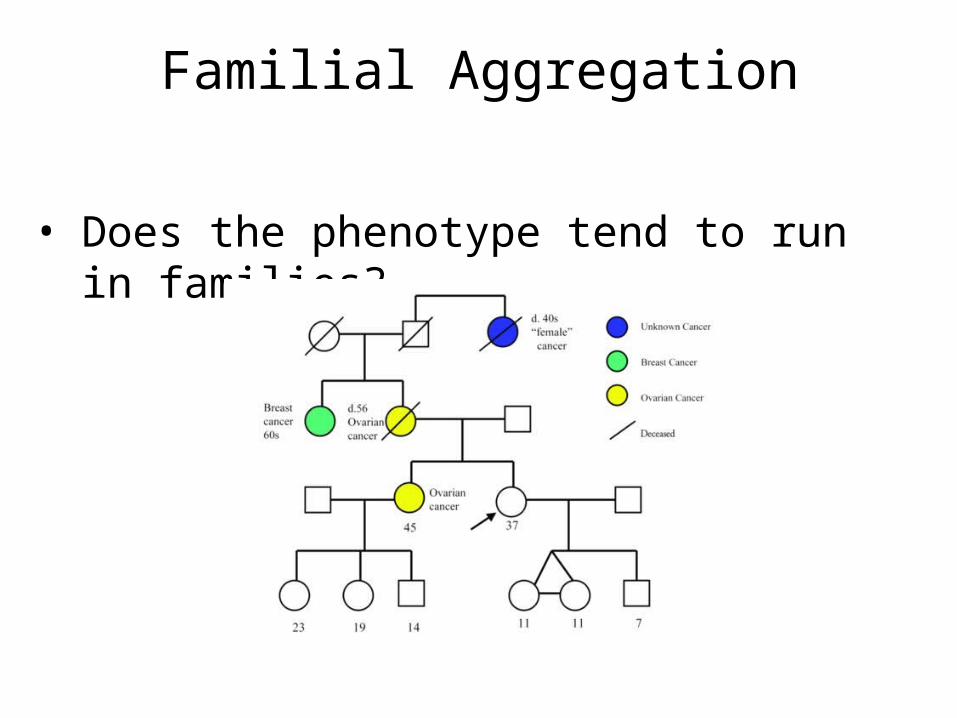
Familial Aggregation
• Does the phenotype tend to run in families?
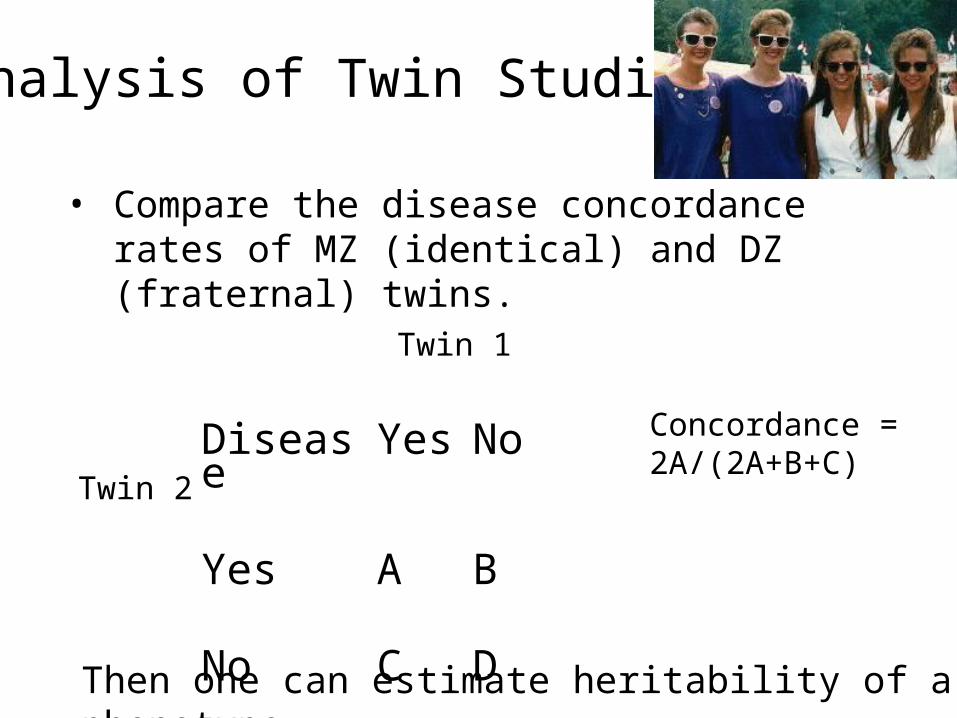
Analysis of Twin Studies
• Compare the disease concordance rates of MZ (identical) and DZ (fraternal) twins.
Disease Yes No
Yes A B
No C D
Twin 1
Twin 2
Then one can estimate heritability of a phenotype.
Concordance = 2A/(2A+B+C)
Models of Genetic Susceptibility
• Study families.• Estimate ‘mode of inheritance’ & what type
of genetic variant might be causal.• Determine whether the disease appears to
follow particular patterns across generations.
• Estimate whether variants are rare or common, etc.
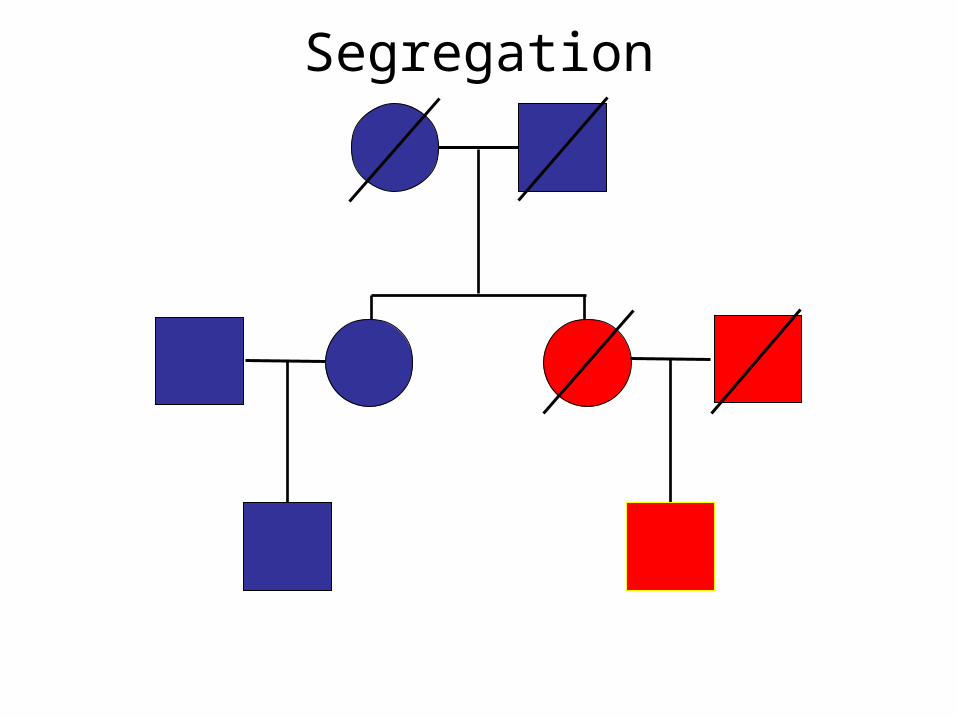
Segregation
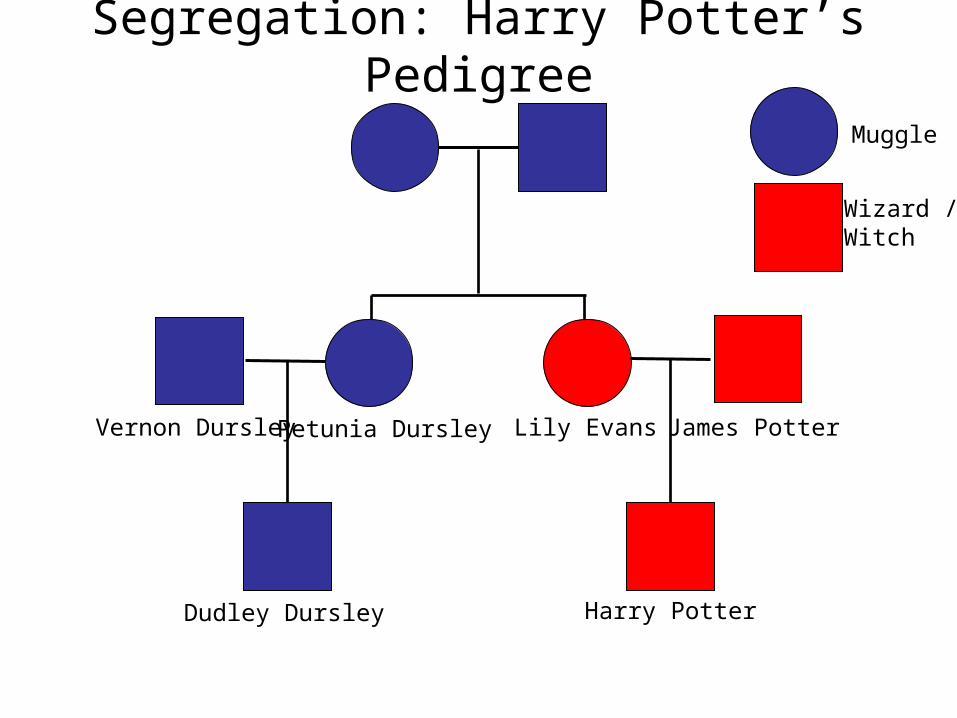
Segregation: Harry Potter’s Pedigree
Harry Potter
Lily Evans James PotterPetunia DursleyVernon Dursley
Dudley Dursley
Muggle
Wizard / Witch
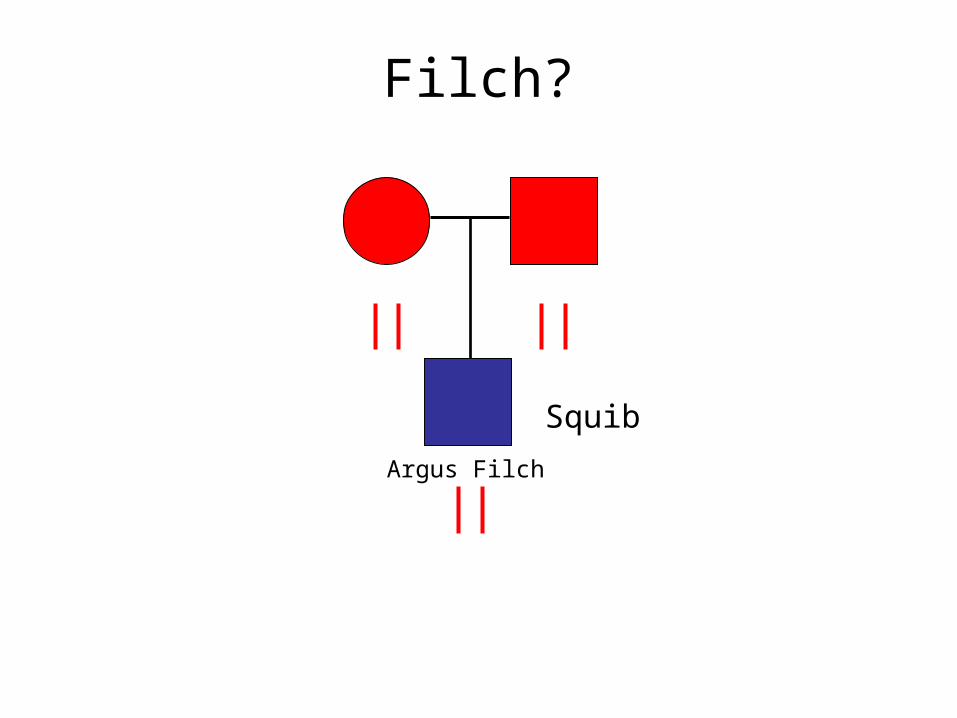
Filch?
Argus Filch
Squib
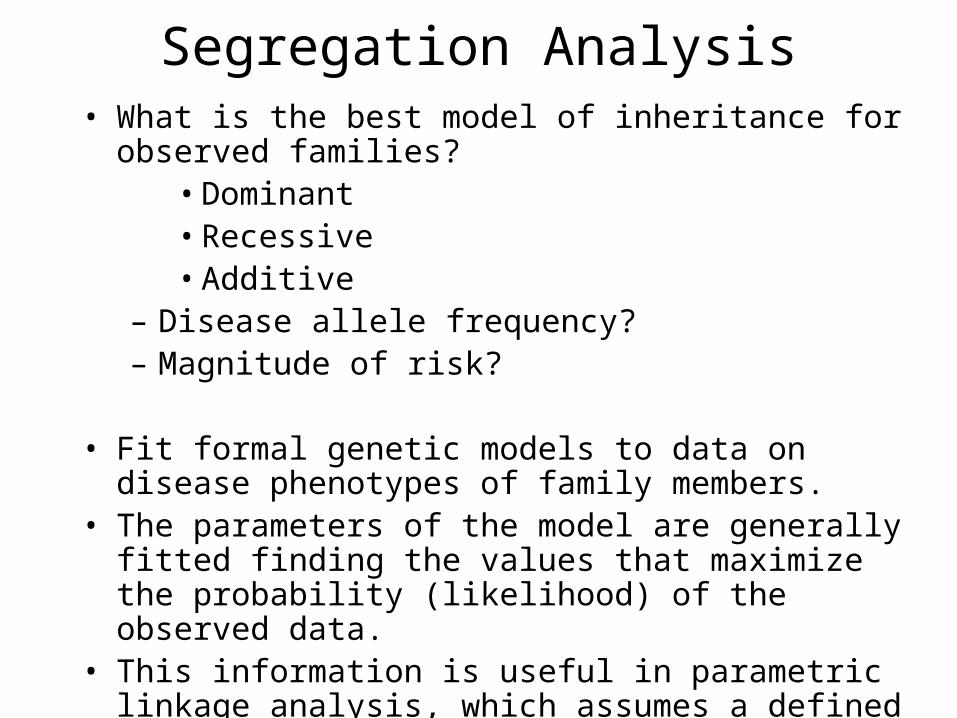
Segregation Analysis• What is the best model of inheritance for observed
families?• Dominant• Recessive• Additive
– Disease allele frequency?– Magnitude of risk?
• Fit formal genetic models to data on disease phenotypes of family members.
• The parameters of the model are generally fitted finding the values that maximize the probability (likelihood) of the observed data.
• This information is useful in parametric linkage analysis, which assumes a defined model of inheritance.
Process of Genetic Epidemiology
Migrant Studies Familial Aggregation Segregation
Association StudiesLinkage Analysis
Fine Mapping Cloning
Defining the Phenotype
Characterization
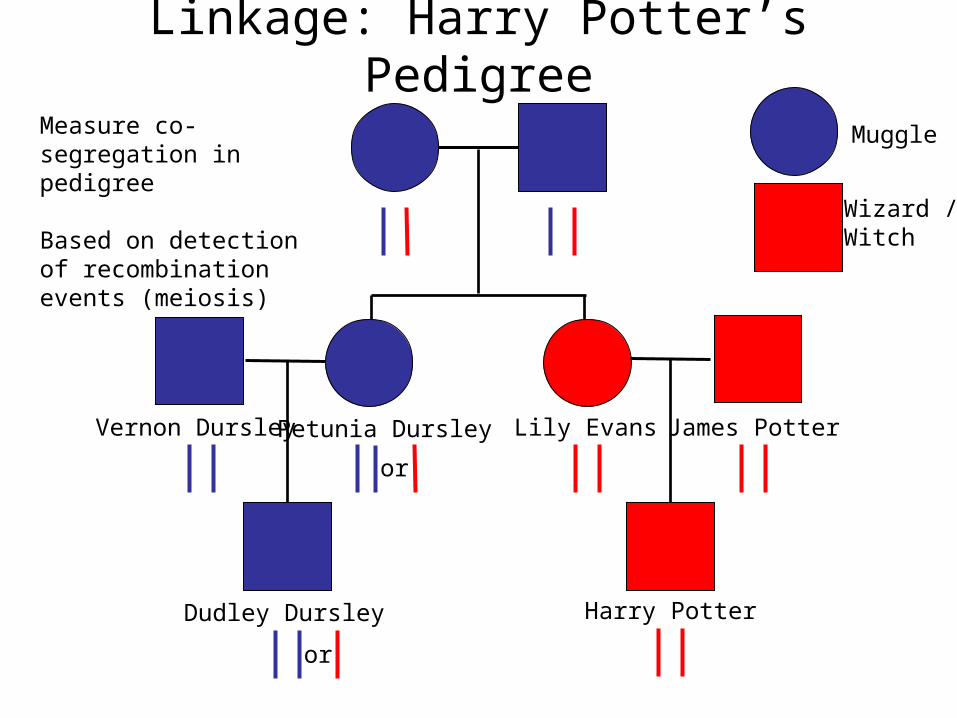
Linkage: Harry Potter’s Pedigree
Harry Potter
Lily Evans James PotterPetunia DursleyVernon Dursley
Dudley Dursley
Muggle
Wizard / Witch
or
or
Measure co-segregation in pedigree
Based on detection of recombination events (meiosis)
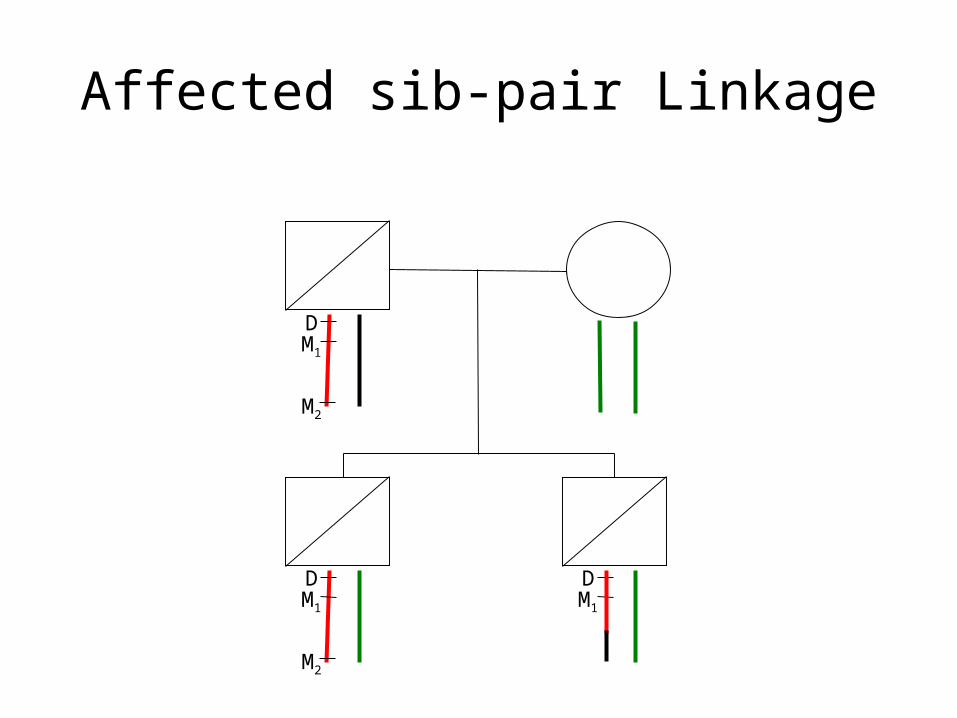
Affected sib-pair Linkage
DM1
M2
DM1
M2
DM1
ROCHE Genetic Education (www)
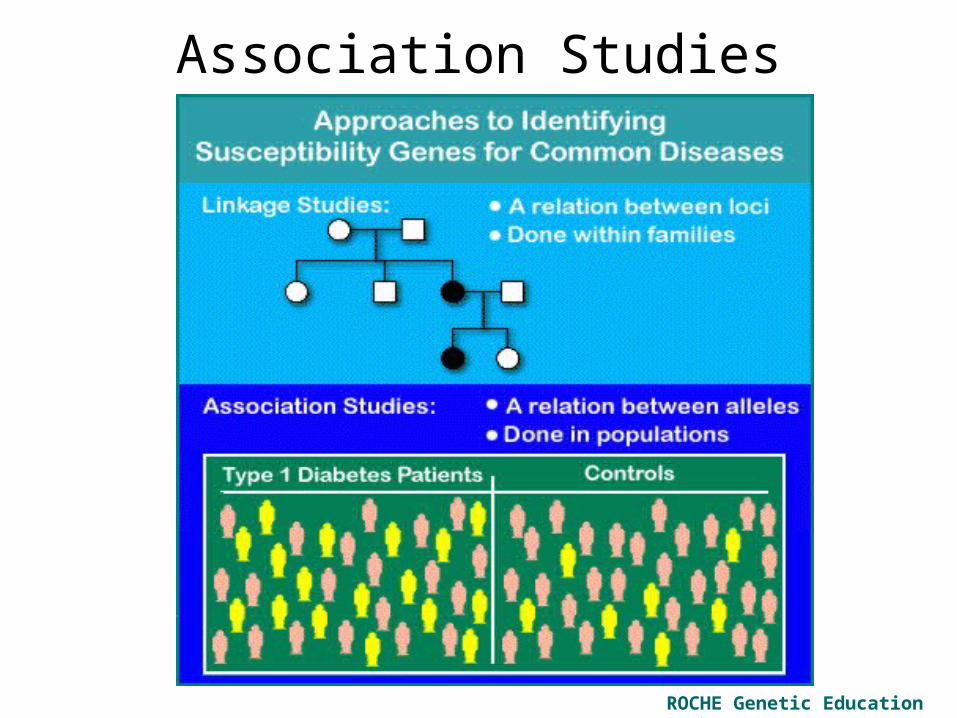
Association Studies
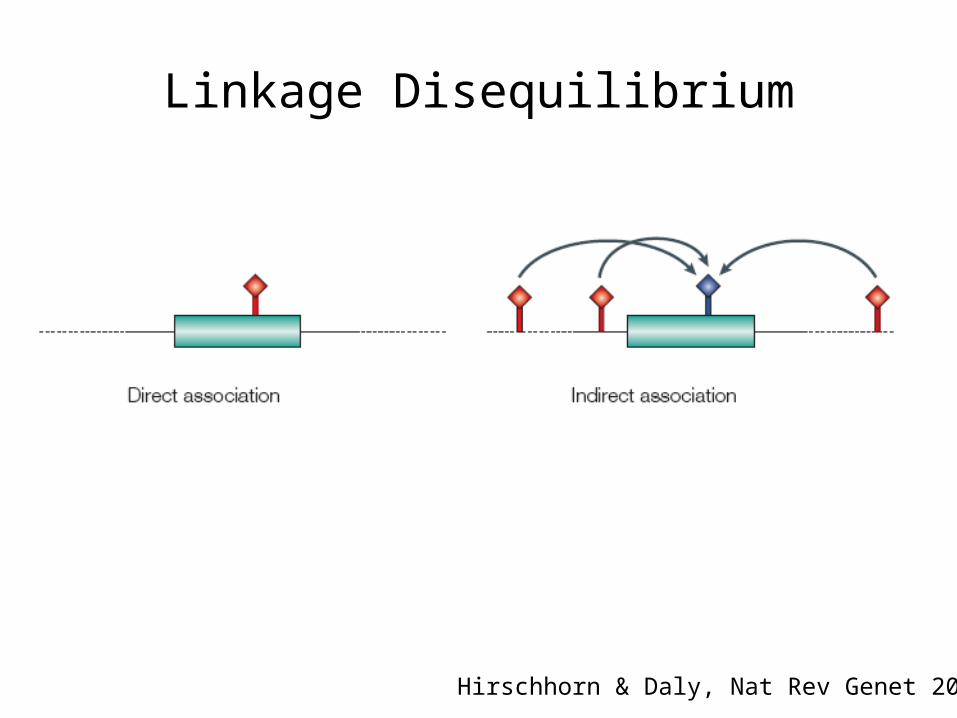
Linkage Disequilibrium
Hirschhorn & Daly, Nat Rev Genet 2005
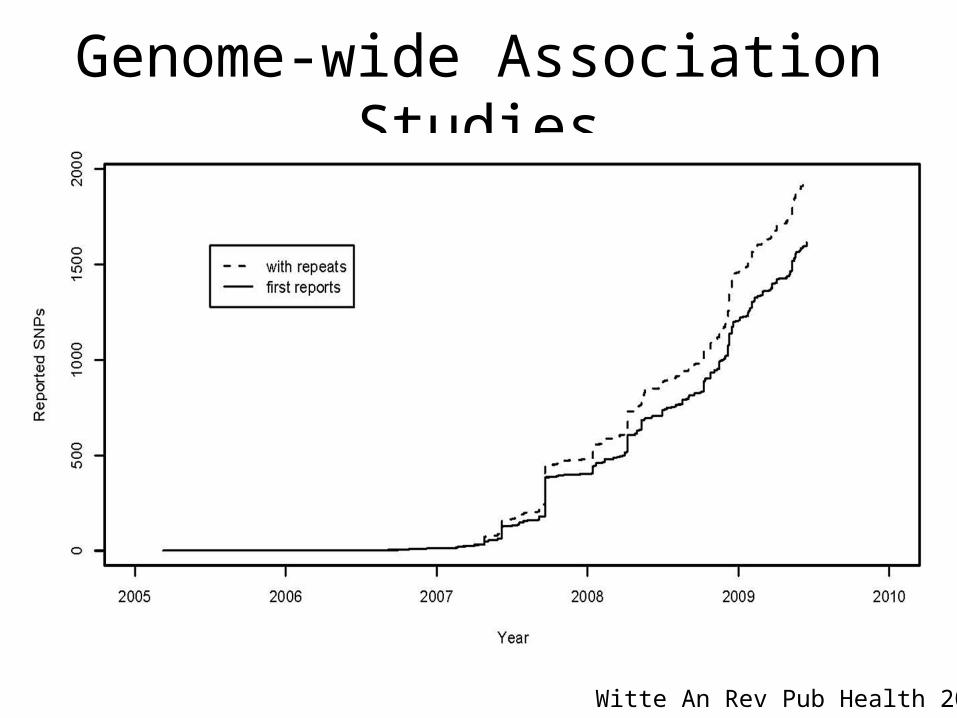
Genome-wide Association Studies
Witte An Rev Pub Health 2009
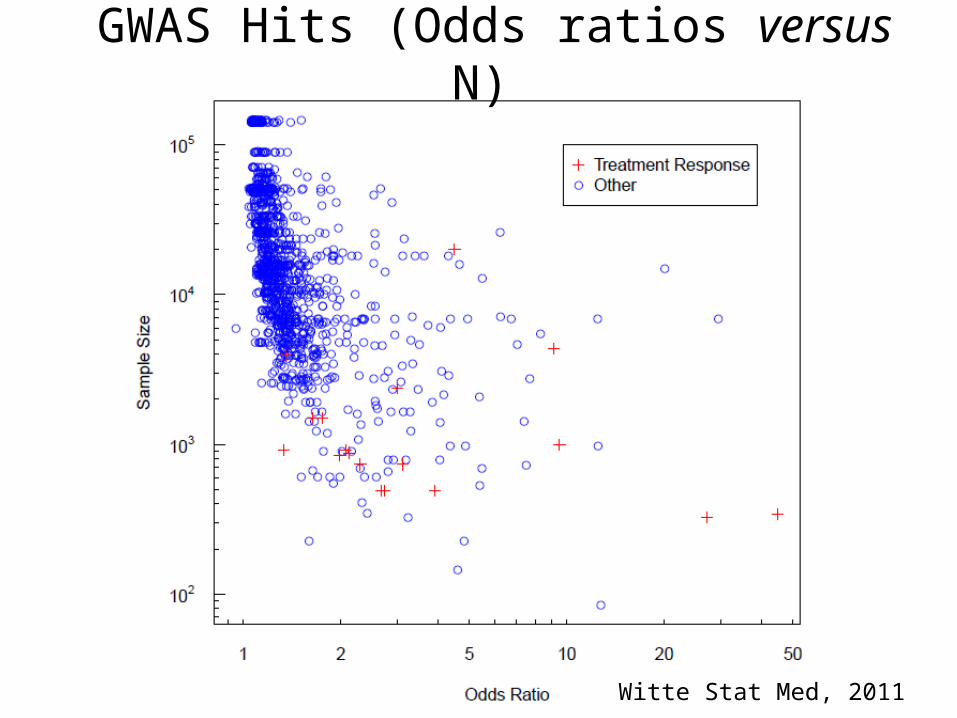
Witte Stat Med, 2011
GWAS Hits (Odds ratios versus N)
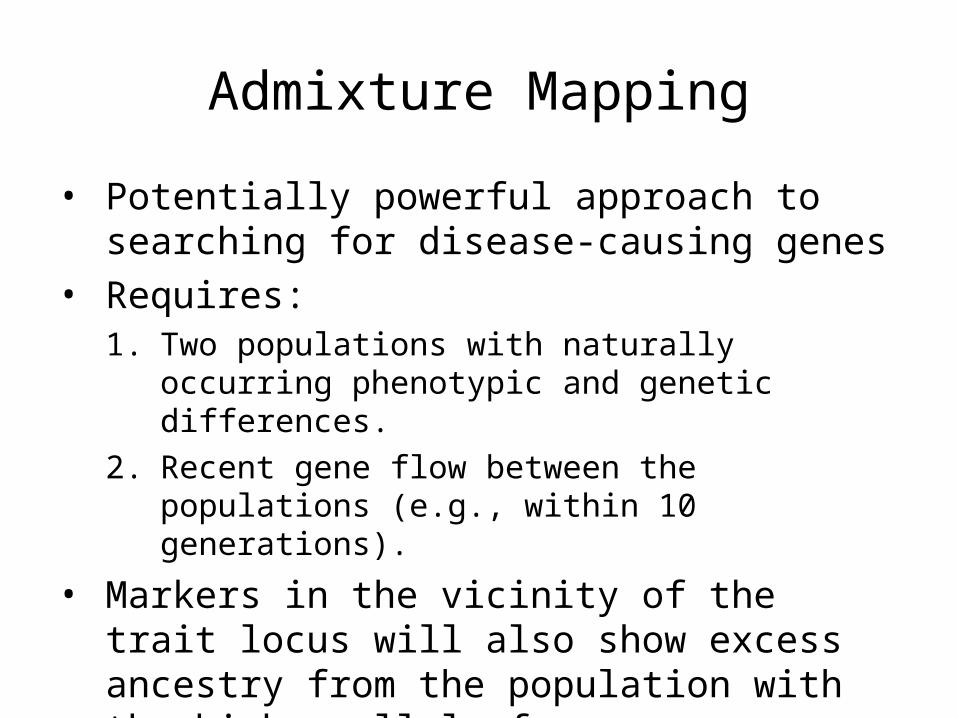
Admixture Mapping
• Potentially powerful approach to searching for disease-causing genes
• Requires:1. Two populations with naturally occurring phenotypic
and genetic differences.
2. Recent gene flow between the populations (e.g., within 10 generations).
• Markers in the vicinity of the trait locus will also show excess ancestry from the population with the higher allele frequency
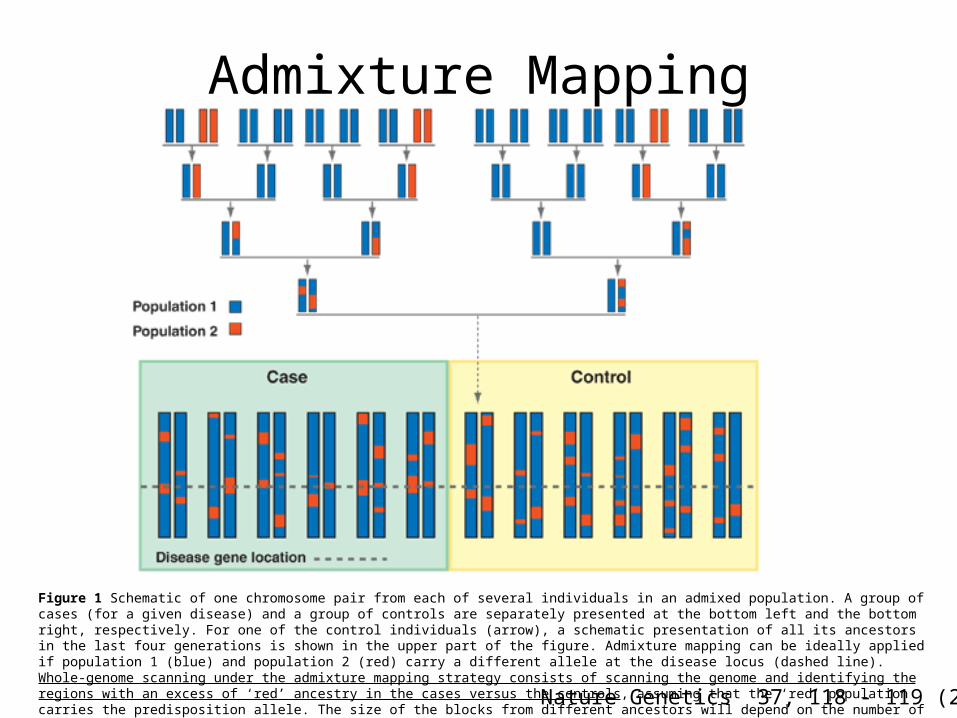
Nature Genetics 37, 118 - 119 (2005)
Figure 1 Schematic of one chromosome pair from each of several individuals in an admixed population. A group of cases (for a given disease) and a group of controls are separately presented at the bottom left and the bottom right, respectively. For one of the control individuals (arrow), a schematic presentation of all its ancestors in the last four generations is shown in the upper part of the figure. Admixture mapping can be ideally applied if population 1 (blue) and population 2 (red) carry a different allele at the disease locus (dashed line). Whole-genome scanning under the admixture mapping strategy consists of scanning the genome and identifying the regions with an excess of ‘red’ ancestry in the cases versus the controls, assuming that the ‘red’ population carries the predisposition allele. The size of the blocks from different ancestors will depend on the number of generations since the populations were mixed.
Admixture Mapping
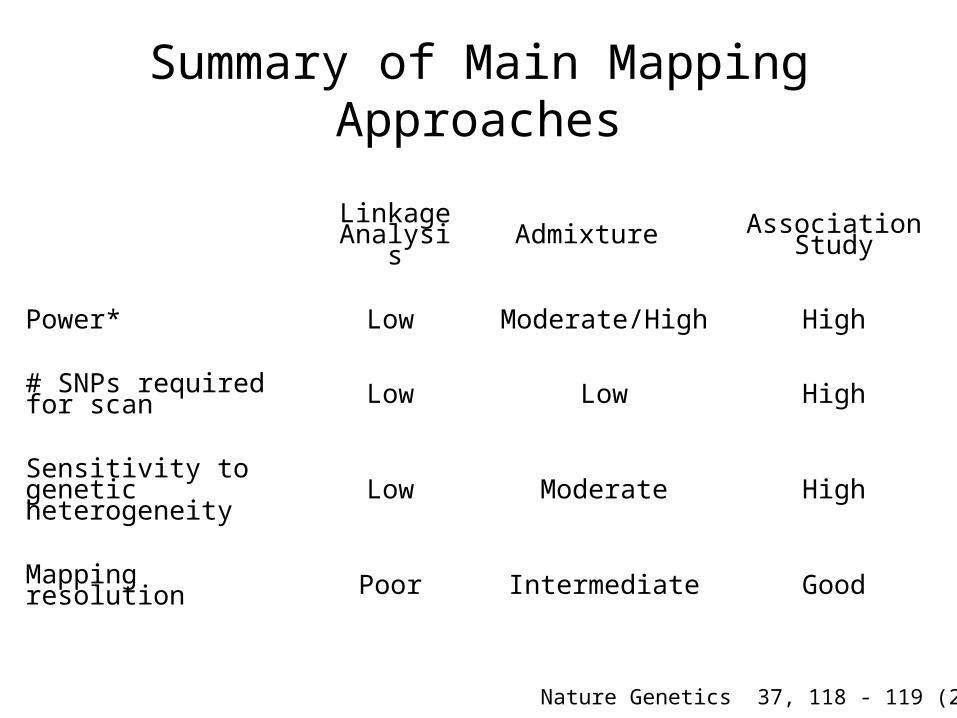
Summary of Main Mapping Approaches
Linkage Analysis Admixture Association
Study
Power* Low Moderate/High High
# SNPs required for scan Low Low High
Sensitivity to genetic heterogeneity Low Moderate High
Mapping resolution Poor Intermediate Good
Nature Genetics 37, 118 - 119 (2005)
Cloning a Gene
• Showing that it is clearly causal for disease.
• Generally requires experiments beyond those undertaken by a genetic epidemiologist.
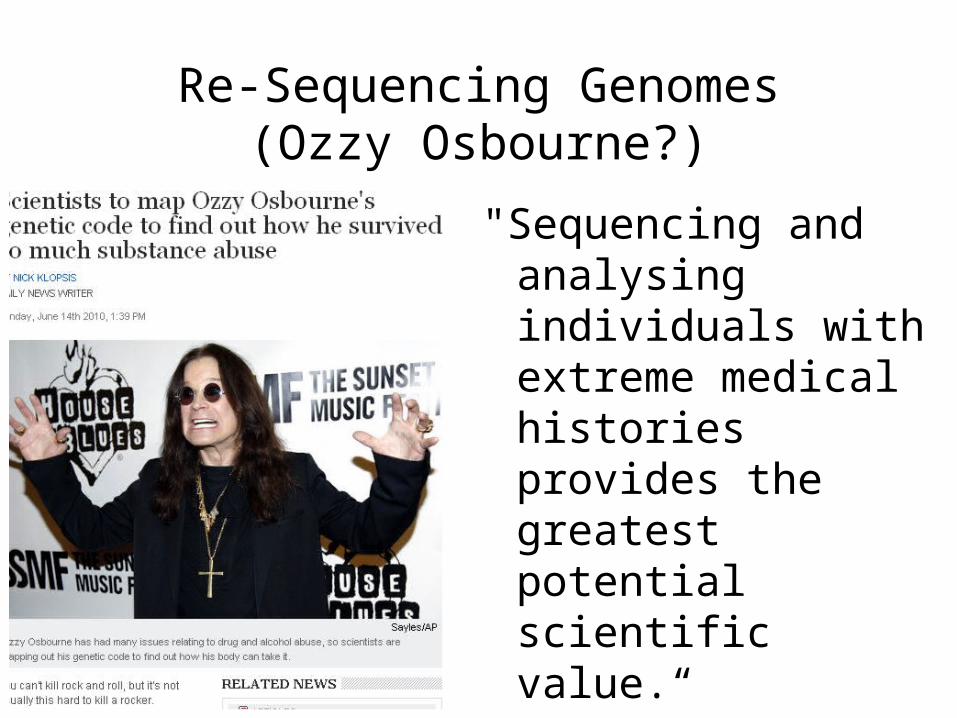
Re-Sequencing Genomes(Ozzy Osbourne?)
"Sequencing and analysing individuals with extreme medical histories provides the greatest potential scientific value.“Nathan Pearson, Director of Research Knome
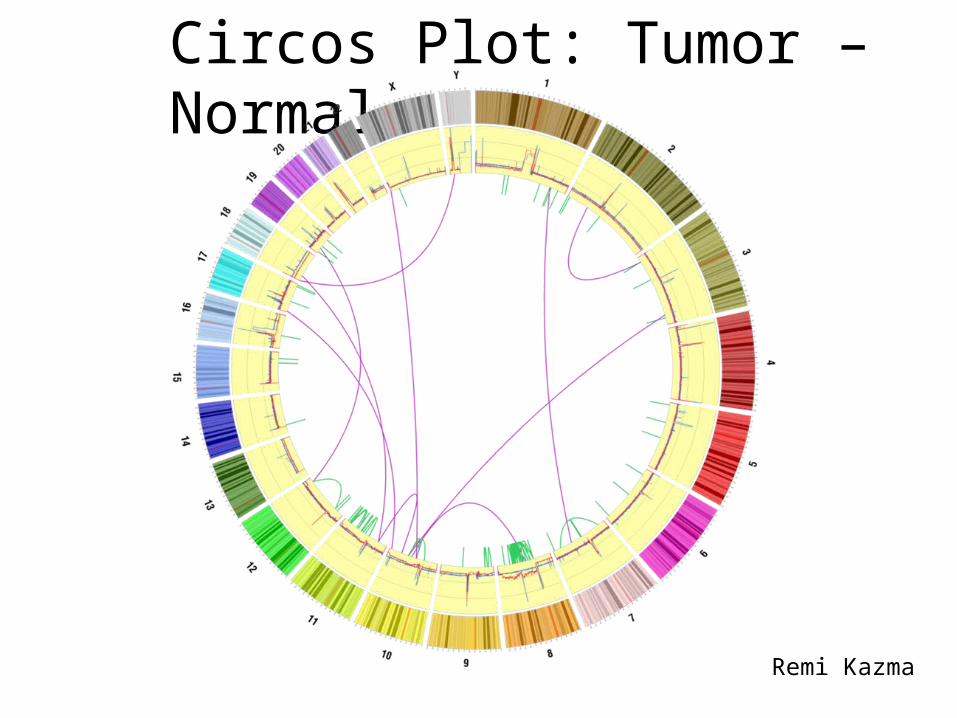
Remi Kazma
Circos Plot: Tumor – Normal
Characterization
• Once genes are identified, molecular methods are used to determine the structure of the gene, identification of regulatory elements, etc.
• Use epidemiologic studies to distinguish public health implications:1. Determine frequencies of causal alleles; and
2. Characterize their effects—and interacting environmental factors—on disease rates.
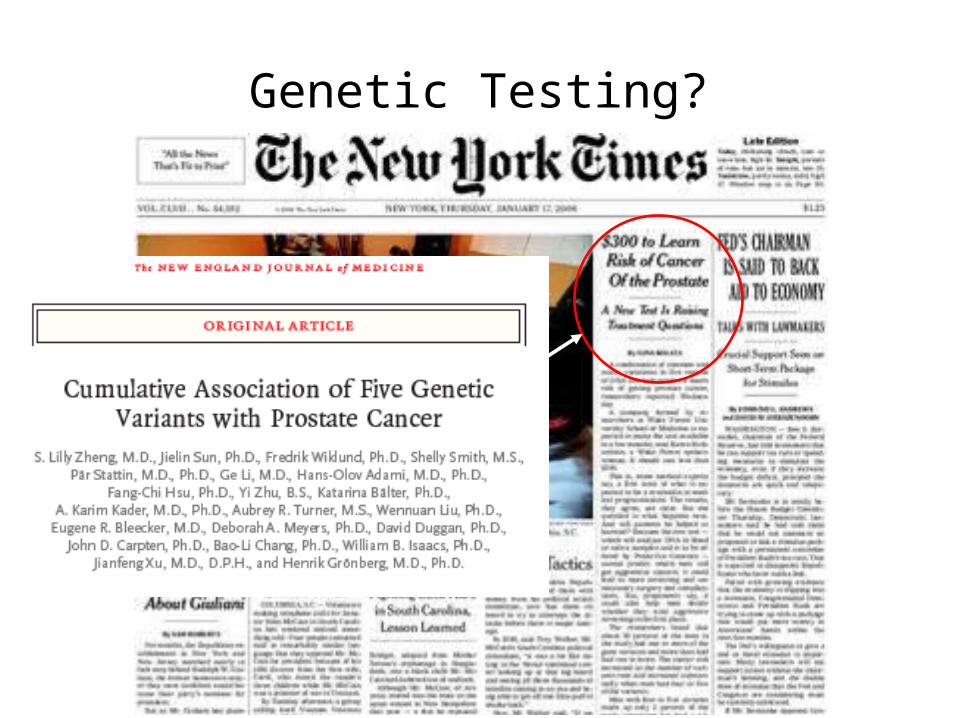
Genetic Testing?
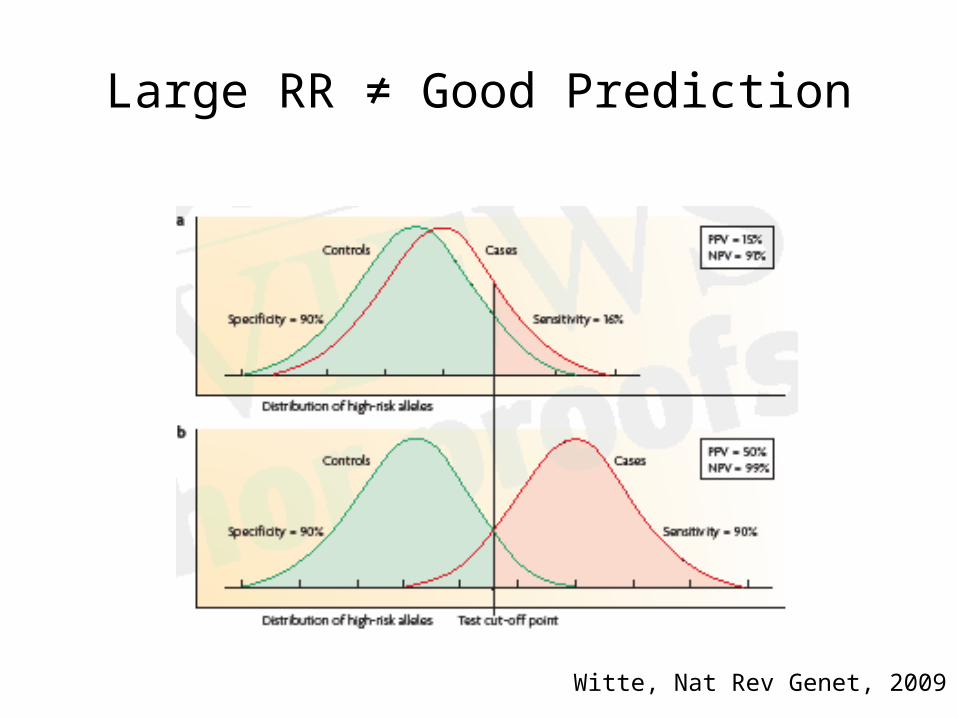
Large RR ≠ Good Prediction
Witte, Nat Rev Genet, 2009
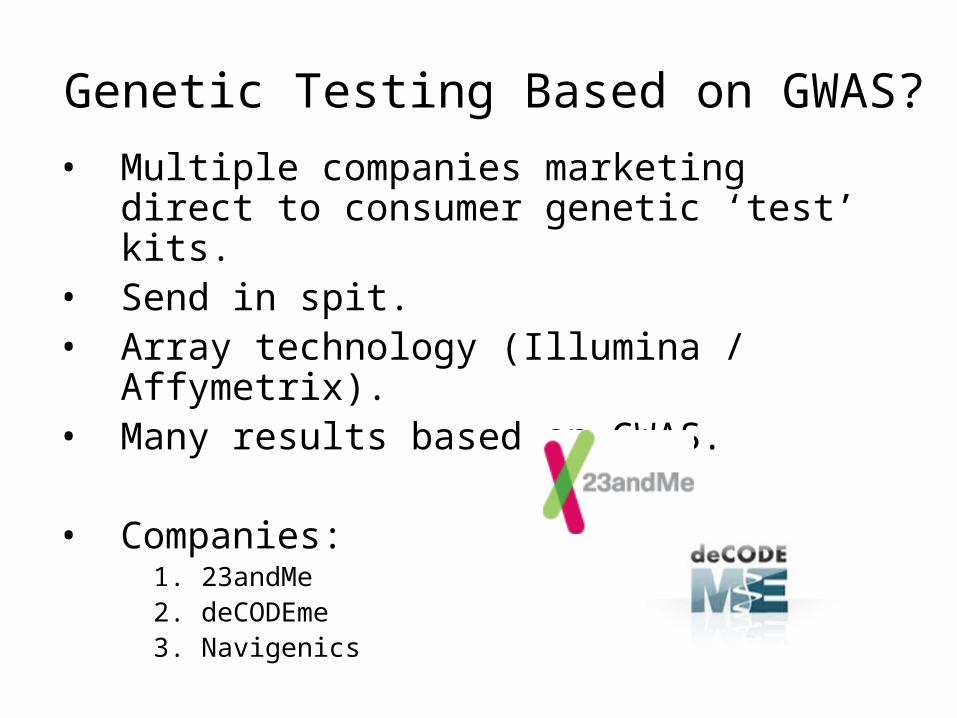
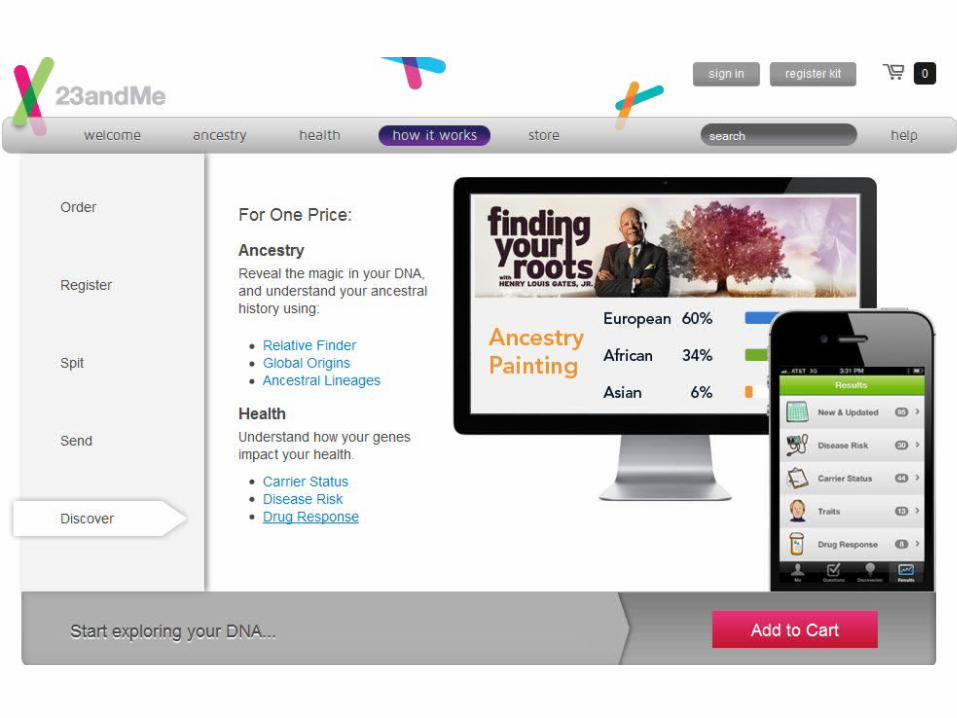
Genetic Testing Based on GWAS?
• Multiple companies marketing direct to consumer genetic ‘test’ kits.
• Send in spit.• Array technology (Illumina / Affymetrix).• Many results based on GWAS.
• Companies:1. 23andMe2. deCODEme3. Navigenics
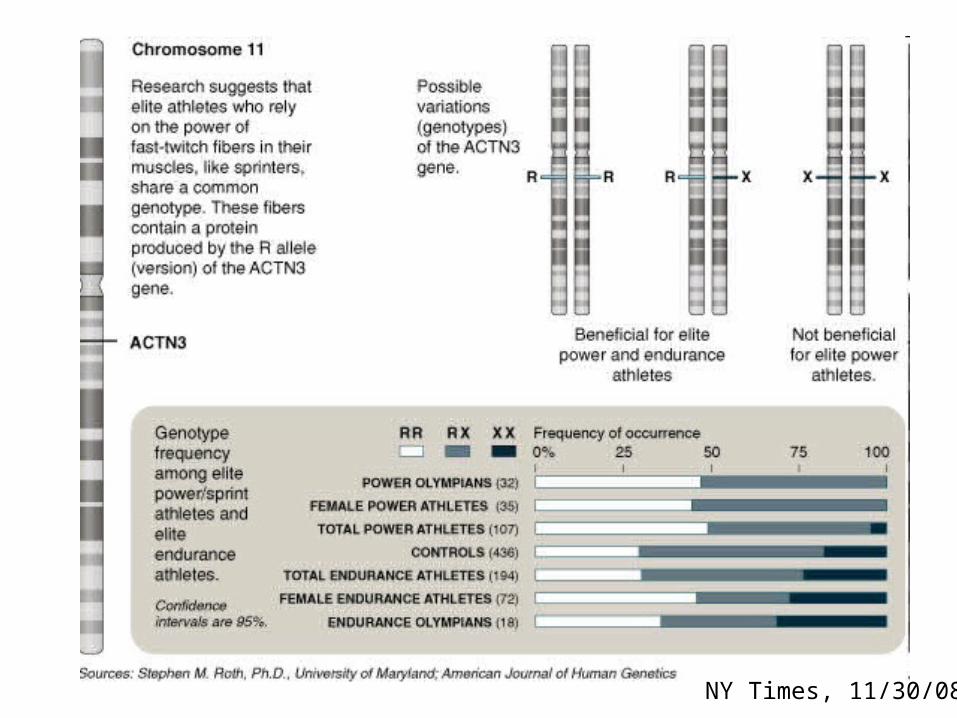
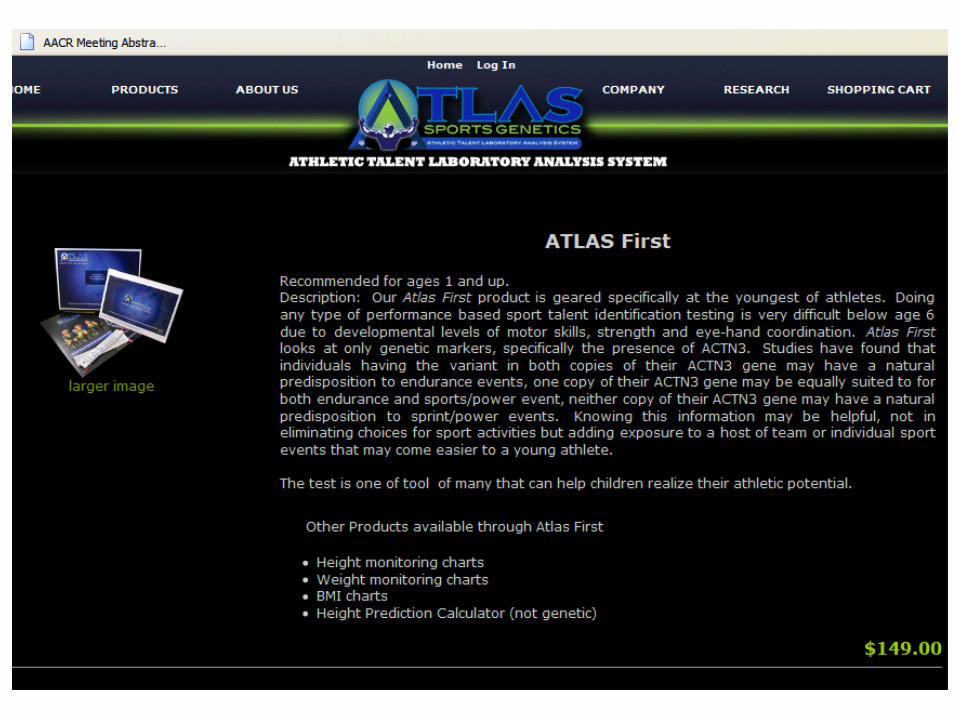
‘Test to Play’
NY Times, 11/30/08

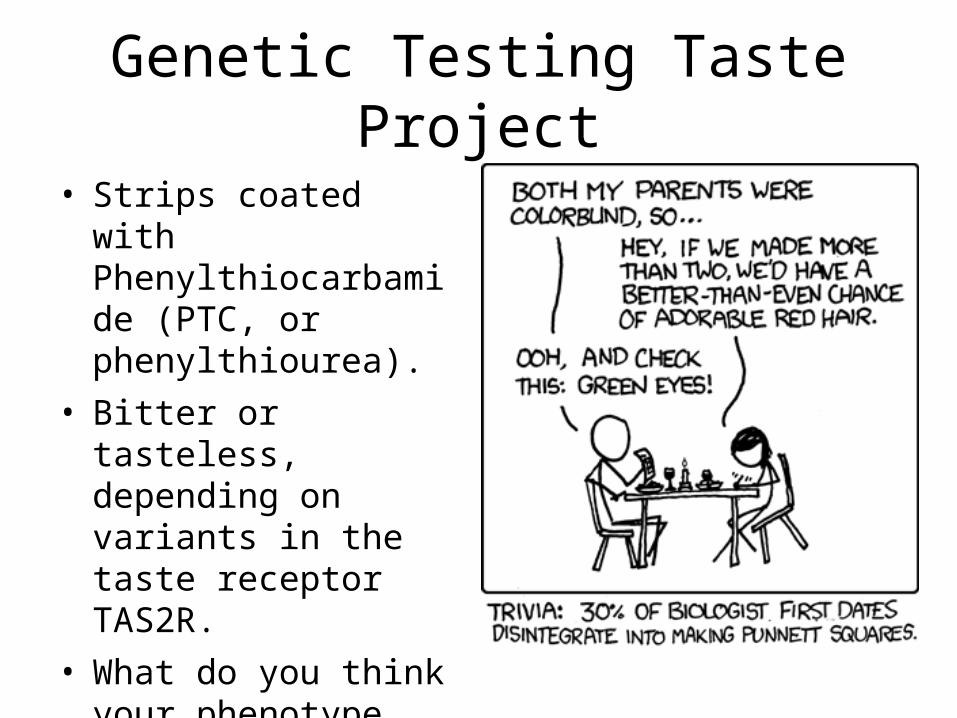
Genetic Testing Taste Project
• Strips coated with Phenylthiocarbamide (PTC, or phenylthiourea).
• Bitter or tasteless, depending on variants in the taste receptor TAS2R.
• What do you think your phenotype is?
Related Documents