MERIT-Infonomics Research Memorandum series Financial Systems, Innovation and
Economic Performance Thorsten Block 2002-011
MERIT – Maastricht Economic Research Institute on Innovation and Technology PO Box 616 6200 MD Maastricht The Netherlands T: +31 43 3883875 F: +31 43 3884905 http://meritbbs.unimaas.nl e-mail:[email protected]
International Institute of Infonomics PO Box 2606 6401 DC Heerlen The Netherlands T: +31 45 5707690 F: +31 45 5706262 http://www.infonomics.nl e-mail: [email protected]

FINANCIAL SYSTEMS, INNOVATION AND ECONOMIC PERFORMANCE
Thorsten H. Block March 2002 Keywords: Financial systems; technology regimes; innovation; economic growth JEL classification: G0; O3; O4; O57
Abstract: There is growing evidence of international divergence in the performance of new industries. While the United States is at the forefront of the recent revolution in information technologies, European economists and policy makers are concerned that Europe is falling behind with negative implications for long-term economic performance. This paper investigates the role of financial systems as a crucial determinant of apparent differences in national abilities to promote innovative activities in specific sectors. Firstly, a short overview of the relevant finance and innovation literature is provided, and a synthetic view of the finance-innovation link is sketched. It is argued that national financial systems have an impact on the structure of growth through their differing abilities to promote innovation in sector-specific technology regimes. Secondly, I apply a simple econometric model to a data set consisting of 17 OECD countries and 20 manufacturing industries to identify empirical patterns. The evidence suggests that sectors characterized by high technological opportunity and a focus on product innovation perform relatively better in financial systems with large stock markets, competitive banking sectors and good accounting standards. In contrast, the performance of sectors geared towards innovation in processes benefits from a more bank-oriented financial system and concentrated ownership structures.
Acknowledgements: This research was supported by a Marie Curie fellowship of the European Commission Programme Improving Human Research Potential and the Socio-economic Knowledge Base under contract No HPMF-CT-2000-00687. I would like to thank Ute Pieper, Keith Smith, and participants at MERIT and UNU/INTECH seminars for comments and discussion. Special thanks to Anthony Arundel for providing the PACE data set. Thorsten H. Block MERIT, Maastricht University, P.O. Box 616, 6200 MD Maastricht, The Netherlands, Email: [email protected]

1
1. Introduction
During the 1990s the United States economy has positioned itself at the forefront of recent
revolutions in information technologies. According to some observers, the USA is the
originating country of the �e-conomy,� an economy characterized by the rapid development and
diffusion of electronics-based information technologies (DeLong et al., 2000). In contrast, there
is a growing concern among European economists and policy makers that Europe is falling
behind in the development of these types of industries with negative implications for long-term
economic performance (Fagerberg et al., 1999). In spite of these apparent differences in national
abilities to support specific industries, economic theory lacks explanations for international
diversity. Differences in institutional infrastructure across countries can reasonably be expected
to affect national innovation capabilities. In one recent contribution, institutions are identified as
�standard social technologies� that complement physical technologies (Nelson and Sampat,
2001). In this view, diverging success in the innovation performance of particular countries
and/or sectors may result from varying degrees of compatibility between physical and social
technologies. One likely reason for the financial system to constitute a crucial element of
standard social technologies is that it funds innovative projects before they reach the stage of
generating products that can be evaluated and selected through competition in product markets.
American economist Hal Varian, for example, attributes United States success in new industries
to the unique ability to �finance crazy ideas� (New York Times, December 14, 2000). Similarly,
Schumpeter identifies finance and financial institutions as crucial determinants of the
entrepreneurial ability to develop new �combinations.�

2
What is required is an approach that incorporates differences in national financial institutions as
they affect countries� abilities to promote innovative activities and thus economic performance.
However, the New Growth Theory understands innovation merely as a function of capital, labor
and knowledge inputs while the institutional environment is assumed to be universal across
countries. While there is a growing literature on the relationship between finance and growth
(Levine, 1997; Tsuru, 2000), finance is modeled to promote growth essentially through an
efficient allocation of capital and no attempt is made to analyze how finance affects growth
through its impact on innovation. Finally, the national system of innovation approach (Nelson,
ed., 1993) though emphasizing differences in national institutional settings has little to say about
how a country�s financial system affects the speed and character of technical change.
Following a short overview of the relevant finance and innovation literature this paper will
provide a synthetic view of the finance-innovation link. It will be argued that national financial
systems have an impact on economic performance through their differing abilities to promote
sector-specific types of innovative activity. Financial institutions evolve predominantly at the
national level of the economy but innovation processes are firmly embedded in sectoral
technology regimes. The institutional framework might therefore be compatible with the
requirements of firms in some but not all industries. National financial institutions are thus
hypothesized to affect the structure of economic development. It will be argued that national
financial arrangements have an impact on sectoral innovation capabilities beyond the provision
of funds. A large and liquid stock market, for example, contributes little net financing to
industry, but instead constitutes a sophisticated device for flexibility in the allocation of
ownership and control. This in turn might greatly enhance companies� abilities to pursue

3
innovative ventures characterized by rapid change in technology and management practices. In
contrast, tight ownership structures characteristic of insider systems might be better at providing
the long-term horizon and stakeholder commitment required for innovation processes
distinguished by their organizational complexity and reliance on company-specific knowledge
inputs.
In order to identify empirical patterns in the relationship between financial system and
innovation, I apply a simple econometric model to a data set consisting of 17 OECD countries
and 20 manufacturing industries. Specifically, this study considers the role of complementarities
between sectoral technology regimes and national institutional frameworks in promoting industry
performance. It contributes to the literature by reformulating previous attempts to find empirical
links between financial systems and sectoral performance through specifically focusing on
innovation activities. It also allows for the exploration of financial system effects on
performance through channels other than financial allocation. The findings suggest that sectors
characterized by high technological opportunity and a focus on product innovation perform
relatively better in financial systems with large stock markets, competitive banking sectors and
good accounting standards. In contrast, the performance of sectors geared towards process
innovation benefits from insider systems characterized by bank orientation and concentrated
ownership structures.
2. Theory: Linking financial systems and innovation
The literature on the economics of innovation has made great progress in providing a
comprehensive analysis of the process of innovation and the conditions required for its success.

4
A host of theoretical and empirical contributions have described innovation as the result of a
complex organizational process of knowledge accumulation (Freeman and Soete, 1997;
Tushman and Rosenkopf, 1992). Firstly, innovation is inherently uncertain because hurdles have
to be constantly overcome along the way that cannot be known ex ante. For example,
uncertainty arises out of the irreversibility of invested resources while the level and timing of
future returns is unknown. Similarly, there is little information about the amount of resources
needed to successfully complete a project and the risks of failure. The ability to experiment in
trial-and-error processes is therefore an important element of a successful system of innovation.
Hence, the financial system must be setup as �to allow for the possibility of rather numerous
gambles on unexplored opportunities, about which little is known ex ante, but which can
reasonably expected to be, on average, failures� (Dosi, 1990).
Recent contributions to the financial systems literature are also compatible with the uncertainty
dimension of innovation. In general, a number of imperfections such as asymmetric information
or incomplete contracts are identified, which open up possibilities for different financial systems
incorporating markets and other institutions. This body of literature has convincingly shown that
financial systems including ownership structures and corporate governance systems differ
markedly across countries (Allen and Gale, 2000). With respect to the difference between bank-
based versus market-based financial systems, they argue that stock markets are superior to banks
in promoting sectors characterized by high technology and management risk. Innovative
industries are characterized by sparse information and high levels of uncertainty compared to
established sectors operating with known technologies. In this situation, �rational� disagreement
about what the best projects are with respect to technology and/or management strategy is likely

5
to be present. Market-based systems populated by a multitude of investors are good at handling
the resulting �diversity of opinion� and consequently, these sectors can grow faster by raising the
number of innovative projects financed. By keeping a larger number of projects afloat, liquid
stock markets thus raise the chances of the best (ex post) projects to survive.
In Huang and Xu�s (2000) model the focus is on the character of the banking system. Multi-
bank systems prefer to end projects that need additional financing due to conflicts over
information sharing. Such a system enforces a hard-budget constraint. In a sector with high
uncertainty about future earnings and therefore a high number of bad projects (ex post) this
commitment to terminate is valuable because it motivates investors to supply funds. In contrast,
in activities that are characterized by low uncertainty and imitative R&D projects, concentrated
banking systems are likely to have collected more project-specific information with which to
make ex ante investment decisions. Petersen and Rajan (1994) also investigate the effects of
banking sector concentration on innovative, entrepreneurial firms but arrive at opposite
conclusions. They provide a model and empirical evidence for the United States that a highly
concentrated banking sector allows for the inter-temporal sharing of surplus between firm and
creditor. Hence, in their model, concentrated banking sectors should enhance the growth of new
sectors because they guarantee low-cost funding in the early stages of a firm�s development.
The new finance view is an advance over traditional approaches because it assigns a role for both
markets and institutions and can therefore account for the persistence and success of different
national systems. Furthermore, it is able to link this more realistic view of financial structure to
economic activities that are characterized by uncertainty going beyond the assumption of perfect

6
foresight in traditional economic theory. One shortcoming of this literature is the implicit idea
that finance is allocated to specific projects, but in practice the majority of funds are given to
companies, which in turn allocate resources to specific projects or divisions internally. The
management literature therefore distinguishes between external and internal capital markets in
understanding different institutional arrangements across countries (Porter, 1992). Furthermore,
the exclusive focus on the different mechanisms to allocate financial resources for investment
might be misleading because empirically the financing of investment does not differ significantly
across national systems (Mayer, 1988). In fact, the major share of investment finance in
developed economies is generated by own funds rather than raised externally (Corbett and
Jenkinson, 1996). Similarly, Carpenter and Lazonick (2001) find that, even in such a rapidly
developing sector as the optical network industry, investment is rarely financed by funds raised
on the stock market.i Finally and most importantly, the process of innovation itself remains
largely a black box unaffected by the institutional framework. Innovation seems to result from
individual bursts of creativity, which are only subsequently evaluated and financed by the
financial system but not affected by it.
In contrast, the innovation literature has developed a more realistic analysis of the process of
innovation. Rather than being conducted by individuals acting in isolation most new
technologies are developed and applied by complex organizations involving different groups of
people (Tushman and Rosenkopf, 1992; Storper, 1996). Hence, innovation is best described as a
complex learning process, which is cumulative and collective. Understanding this complex
process requires a detailed knowledge of the business firm because it is the organization
undertaking the majority of innovations (Chandler, 1990). The way individuals or departments
7
within a firm interact determines the way knowledge is generated, transformed and diffused. A
number of tacit and changing organizational capabilities cannot be assigned to individual
contributors but are the result of collective procedures within the firm. The focus here is on the
process of learning and the behavior guiding participation in innovation rather than on allocating
scarce resources to a set of projects differentiated by their level of uncertainty.
Mayer�s (1996) work on the financial systems and corporate governance literature best highlights
the links between financial system and organizational processes within the firm. He focuses on
differences in ownership structures across countries, which are likely to provide incentives and
disincentives for stakeholders to participate and commit in complex production processes. His
model could thus be extended to include the organizational view of innovation, because he
implicitly assumes that the character of the financial system influences the incentives of
participants in work processes taking place within the firm. For example, production activities
that require a high company-specific level of irreversible investment by stakeholders, like
workers or specialized suppliers, benefit from concentrated ownership patterns in insider-
dominated financial systems because these encourage and reward long-term commitment.
Similarly, stakeholder commitment is also likely to be beneficial in collective learning processes
dependent on the accumulation of company-specific knowledge. Without this commitment the
efforts of groups of individuals jointly working on innovation projects can be disrupted.
However, in activities where rapid technological change necessarily imposes costs on
stakeholders, mutual commitments would slow down the necessary process of organizational
change. Hence, these activities are likely to benefit from liquid, dispersed ownership in markets
for corporate control found in outsider systems (see also Porter, 1992).

8
In addition to stakeholder commitment, financial systems are likely to affect patterns of
information allocation among organizational participants within the firm (Aoki, 1998; Aoki and
Dosi, 1992; Porter, 1992). Porter (1992) notes that American companies have increasingly
moved toward a form of decentralization involving highly autonomous business units and limited
information flows. Decision making by top managers is thus constrained to simple financial
indicators that are easily gathered, but more detailed information on production and
technological basis are isolated within the individual unit. He attributes this organizational setup
to the demands of stock markets and institutional investors in the United States for easily
identifiable financial returns and finance-based investment evaluations. In contrast, in the
insider-oriented systems of Japan and Germany, decisions are driven by the goal to secure and
advance the company�s long-term competitive position in the market. Information related to
overall performance flows freely between units and financial criteria are less important for
decision-making.
Furthermore, large stock markets represent a flexible re-organization tool through facilitating
corporate ownership changes and mergers, enabling companies in new industries to quickly
adjust to new market conditions or technological developments.ii In this view, the stock market
allocates ownership and control over technologies rather than investment funds. In addition,
stock markets might help to provide crucial incentives for investors or employees in new
companies to supply resources. Many employees of Internet startups, for example, accepted low
current salaries in return for company stock options because of the potentially large payoffs from
a successful IPO during the 1990s stock market boom.iii The potential magnitude of returns

9
through issuing stock is also a crucial motivation for the provision of venture capital. This might
help explain why market-oriented countries also feature high levels of venture capital (Black and
Gilson, 1998). These examples depict the financial sector as an integral part of a nation�s system
of innovation and not just a �detached� project evaluator and selector. Rather than focus solely
on the role of banks versus markets or the nature of the banking system, this view also
emphasizes the systemic, complementary nature of the institutional framework including the role
of corporate structure and governance.
In addition to uncertainty and organizational complexity, innovation has also been found to
develop along specific trajectories or technology regimes (Nelson and Winter, 1982; Winter,
1984; Dosi, 1982; Pavitt, 1984). In an early formulation, Nelson and Winter (1982) distinguish
between a science-based and a cumulative technology regime. The former is characterized by
intense, largely external, R&D activity resulting in a fairly broad and universal knowledge base.
The latter�s knowledge base, in contrast, is rather narrow and develops along a cumulative
trajectory within the firm. The character of the knowledge base has been used to analyze
differences in sectoral patterns of innovation and industrial competition. The science-based
regime is associated with a creative destruction or entrepreneurial pattern characterized by the
entry of new firms. In contrast, cumulativeness in the knowledge base is related to a sectoral
regime of creative accumulation that favors the accumulation of knowledge within established
firms that have innovated before. Similarly, Breschi, Malerba and Orsenigo (2000) propose that
the way innovative activities are organized can be explained as the outcome of different learning
regimes implied by the nature of technology in a specific sector of the economy. Specifically, a
technology regime is defined by the combination of technological opportunities, the
10
appropriability of innovations, the cumulativeness of knowledge and the character of the
knowledge base. The empirical evidence across countries shows that the organizational process
of innovation is largely determined by technology-related rather than by country-related
characteristics.
While the notion of technology regimes has been used frequently in empirical studies of industry
structure in the industrial organization literature, there is little focus on how national institutional
environments might affect the innovation performance of firms operating within specific
technology regimes. Related to the previous theoretical discussion, one might expect that
science-based, entrepreneurial regimes benefit from market-based financial systems which
provide venture capital and the ability to attract talent with lucrative stock options. Furthermore,
differences in financial systems could promote or constrain avenues of organizational learning.
Dosi (1990), for example, argues that bank-oriented systems encourage cumulative firm learning
within established paradigms. Process innovation, which requires tacit and company-specific
knowledge, falls into this category. In contrast, market-based systems are likely to be superior at
allowing highly uncertain experiments on new technological paradigms characterized by
pervasive innovative opportunities. Such an environment is likely to be found in emerging
sectors dominated by rapid advances in product innovation.
In conclusion, different financial and corporate governance systems can be hypothesized to
affect innovation by offering varying degrees of financial and organizational support to different
learning regimes that are inherent in the nature of sectoral technology. In addition to the
allocation of funds the �coherence of physical and social technologies�, to use Nelson and

11
Sampat�s (2001) terminology, is a major determinant of companies� organizational ability to
innovate and compete and thus affects the long-run rate of growth and export competitiveness of
individual sectors.
3. Methodology
In the literature we find a limited number of attempts to provide empirical evidence on the
relationship between financial systems, innovation and performance. For example, Allen (1993)
notes that a number of new industries such as railways, automobiles, aircraft, consumer durables,
computer, and biotechnology were developed in the stock market-based systems of the United
Kingdom and the United States. This lends casual empirical support to some of the above-
mentioned models in the new finance literature. But this simplistic correlation does neither take
into account the considerable historical changes in financial structures around the world nor does
it pay attention to the evolution of the nature of innovation from relatively simple textile
manufacturing to complex science-based biotechnology.
Another attempt is Guerrieri and Tylecote�s (1997) cross-country investigation, which is based
on the assumption that in order to succeed in innovation a particular sector requires a good match
of the sector�s organizational requirements with nation-wide institutional characteristics. The
financial system is identified as a crucial component of the national institutional infrastructure.
However, the authors only divide their country sample into bank-based and market-based system
of finance and subsequently analyze whether a particular country has a revealed comparative
advantage in those activities that are likely to benefit from its institutional infrastructure. While
12
similar in spirit to this paper their results might be driven by a number of other country-specific
factors that their empirical method used is not able to exclude.
Recently, Carlin and Mayer (1999) provided a systematic empirical test of the relationship
between financial system characteristics and sectoral growth patterns for 14 OECD countries,
extending an empirical methodology first introduced by Rajan and Zingales (1998). While not
investigating innovation per se, they find that country financial structures affect sectoral patterns
of R&D investment. In contrast, Beck and Levine (2001) applying a similar methodology to a
larger sample of countries conclude that financial system characteristics have no impact on
growth in sectors characterized by varying shares of R&D investment. Their findings indicate
that rather than financial structure, it is the overall level of development of the financial
system�markets and intermediaries�which is positively associated with growth in R&D
intensive activities. One reason for the apparently contradictory nature of these results is that
while Carlin and Mayer utilize R&D investment shares as the dependent variable, Beck and
Levine take U.S. data to compute sectoral R&D characteristics as part of the explanatory variable
set. In addition, both empirical methodologies focus solely on the allocative properties of
financial system. This study avoids this potential problem by using measures of sectoral
technology regimes instead of R&D investment shares to characterize the nature of innovative
activity in an industry.
In summary, while the theoretical literature on innovation and finance identifies a number of
different channels through which the financial system influences sector-specific innovation
thereby promoting growth, there is little systematic and often contradictory evidence to evaluate

13
the different analytical models proposed. This paper provides a systematic empirical
investigation for a broad number of industrialized economies. It attempts to answer the question
of what types of financial systems are better suited in promoting what types of technical change
at the sector level of the economy. Specifically, the paper develops an econometric model that
will allow us to identify empirical regularities on how countries� financial systems (FS) interact
with sectoral technology regimes (TR) in determining their prospects for growth and
competitiveness (P). The analysis will apply the following simple econometric specification to a
sample of 20 manufacturing sectors in 17 OECD countries (Rajan and Zingales, 1998):
(1) Pi,j = αi,j + βi,j (FSi * TRj ) + εi,j .
Specifically, I use two dependent performance variables (P): The demeaned average annual
growth rate of value added and an index of revealed comparative advantage. The former
measures growth in industry i in country j controlling for the average growth of industry i in all
OECD countries in the sample and the average growth of total manufacturing value added in
country j. Similarly, export performance is represented by the export share in sector i in country
j (controlling for the average export share of industry i in all OECD countries in the sample) and
the average export share of manufacturing in country j.
The financial structure variable (FS) quantifies the diversity in the size and character of national
financial systems. This includes indicators for the size of stock markets or banks, accounting
standards and ownership concentration. All of these measures are demeaned by their respective
OECD averages. Lastly, technology characteristics measure the type of innovation regime in the

14
20 manufacturing sectors included in the analysis (demeaned by the manufacturing average). To
find patterns of the interaction of national financial systems and industry characteristics for the
promotion of growth and competitiveness, it is crucial to identify industry characteristics
(assumed to be constant across countries) separately from the countries in which they are
located. This condition will be discussed in detail in section 4(c).
In order to focus solely on the interaction of industry and country characteristics in driving
economic performance, other determinants of sector performance need to be held constant. I
control for fixed industry and country effects by �demeaning� the dependent and independent
variables (instead of introducing country and industry dummies). While this procedure does not
completely eliminate the potential omitted variable bias, it allows me to have more confidence in
the results. Furthermore, the regressions using growth as the dependent variable also include the
sector�s output share in total manufacturing at the beginning of the period to account for the
convergence effect (Carlin and Mayer, 1999). The underlying hypothesis is therefore that the
long-run economic performance of the sector is determined by the ability to generate continuous
technical change (Nelson, 1998). In turn, this ability is a function of the coherence of the
national financial institutions (standard social technologies) and the technology regime in a
sector (physical technologies). Estimated β-coefficients give us an indication of the patterns of
interactions between financial structure measures and innovation characteristics in stimulating
growth and competitiveness.
While this methodology can be used to relate industry performance to the compatibility of
financial institutional structure and industry technology regime, the results do not lend

15
themselves to make statements about the overall performance of different countries. The
analysis provides an evaluation of whether the compatibility of country structure and industry
characteristics is associated with the performance of particular sectors in particular countries
relative to the average performance in those industries and countries. In other words, this paper
attempts to contribute to an explanation of the industrial composition of exports and growth
rather than their aggregate levels.
4. Data
Three types of data are needed to apply the previously developed model:
(a) Performance measures:
The data set includes sectoral growth rates of value added from the OECD STAN database for 20
manufacturing sectors at the three to four-digit ISIC level. The second dependent variable
measures the international competitiveness of a sector using an index of revealed comparative
advantage (RCA) also computed from the OECD STAN database for the same 20 manufacturing
sectors. Details on the data set are provided in the appendix.
(b) Financial structure:
Financial structure indicators are available for 17 OECD countries taken from several sources
(see appendix for details). Four variables measure the degree to which a country is market based
or bank based. First, the ratio of assets of deposit money bank over GDP is used as a proxy for
the role and influence of the banking sector (average for 1970-1997 in Beck et al., 2000).
Second, stock market capitalization, i.e. the combined value of listed shares, over total national

16
output (GDP) averaged for the period 1975-1997 provides an indicator of the role of stock
markets (Beck et al., 2000). Third, the relative dominance of markets vs. banks is represented by
a structure index derived by computing the ratio of the two size measures mentioned above
(Stock market capitalization/Bank assets). The higher the value of the index the greater the
degree of market orientation.iv Fourth, the availability of company information can also be
understood as an indicator of the role of financial markets in a national financial system. The
wide availability of company financial data allows market participants to make informed
decision and is, therefore, a crucial prerequisite for functioning stock markets.v It might also
serve as a proxy for the relative power of financial actors vis-à-vis company managers.vi
Following Rajan and Zingales (1998) I apply an index of accounting standards from a survey
conducted by the Center of International Financial Analysis and Research in 1990.
The ratio of the three largest banks� assets to total banking sector assets averaged for the period
1990-1997 (Levine et al., 2000) is used to account for the degree of competition among banks.
This indicator allows us to distinguish single-bank vs. multi-bank systems. A further dimension
emphazized in theoretical models is the nature of the corporate system. In this empirical analysis
the concentration of ownership serves as a measure of stability vs. flexibility in ownership
patterns. This indicator is computed as one minus the percentage of widely held of the largest 20
publicly traded companies in 1995 (La Porta et al., 1998). Note that all country structure
variables used in the econometric estimations are normalized relative to the OECD average.
A problem might arise because data for some of the indicators is only available for the latter half
of the period under investigation. Consistent data on accounting standards, for example, were

17
collected only since the early 1990s. However, accounting standards have been found to be
rather stable over time. Rajan and Zingales (1998) compare available data for the early 1980s
with 1990s survey results and find little difference, in particular when it comes to the quality of
accounting standards relative to other countries. Similarly, the measures for bank and ownership
concentration are also only available for the early 1990s, but it can be reasonably assumed that
these characteristics are relatively stable over the period under investigation.
Figure 1 provides a graphical representation of a number of country profiles. The country
profiles not only show that financial infrastructures differ markedly across countries, they also
reveal that these national differences go beyond the simple bank-based/market-based dichotomy,
which still dominates the literature. While Germany represents the typical bank-based system
compared to the market-based structure in the United States, countries like Sweden and the
Netherlands are not so easily classified. Sweden, for example, combines characteristics of a
market-based system (high accounting standards and stock market capitalization) with high
levels of bank and product market concentration usually associated with bank-based or insider
systems. Japan, which is traditionally grouped with the bank-based countries, features a large
stock market and levels of bank and ownership concentration more characteristic of a market-
oriented system.

18
Figure 1: Country profiles of financial systems (relative to OECD median country)
Source: see appendix
Germany
1.02
0.18
0.450.62
0.650.00
0.20
0.40
0.60
0.80
1.00
1.20bank assets
stock market capitalization
bank concentrationaccounting standards
ownership concentration
United States
0.73
0.60
0.19
0.71
0.200.00
0.20
0.40
0.60
0.80
1.00
1.20bank assets
stock market capitalization
bank concentrationaccounting standards
ownership concentration
Sweden
0.50
0.38
0.880.83
1.00
0.00
0.20
0.40
0.60
0.80
1.00
1.20bank assets
stock market capitalization
bank concentrationaccounting standards
ownership concentration
Japan
1.09
0.65
0.22
0.65
0.500.00
0.20
0.40
0.60
0.80
1.00
1.20bank assets
stock market capitalization
bank concentrationaccounting standards
ownership concentration
Italy
0.74
0.11
0.360.62
0.85
0.000.20
0.40
0.60
0.801.00
1.20bank assets
stock market capitalization
bank concentrationaccounting standards
ownership concentration
Netherlands
0.82
0.43
0.740.64
0.700.000.20
0.40
0.60
0.801.00
1.20bank assets
stock market capitalization
bank concentrationaccounting standards
ownership concentration

19
Finally, one strand of the finance and growth literature maintains that it is the development of the
financial sector per se that stimulates growth rather than its structure (Levine, 2000). The
relationship between borrower and lender is characterized by a host of imperfections, which can
be alleviated by sophisticated financial intermediaries as well as liquid stock markets. According
to this view, the differences between Germany and the United States are of minor significance
because both have a relatively high level of overall financial development; i.e. the combined
value of stock market capitalization and banks assets as a share of GDP is roughly the same
(120-130 percent of GDP). In contrast, a country like Italy has a relatively weak financial
system as the total value of stock capitalization and bank assets only adds up to 85 percent of
GDP. To control for this potential financial development effect, I compute an index consisting
of the sum of bank assets and stock market capitalization as a ratio of GDP.
(c) Technology characteristics:
The construction of a set of sectoral measures of technology characteristics is crucial to the
applicability of the empirical methodology suggested in this paper. In particular, in order for the
interactive terms in equation (1) to measure the compatibility of financial structure and sectoral
innovation requirements, the indicators for the nature of sectoral technology have to be
independent of the national institutional environment. Empirical studies utilizing the technology
regime framework found that the organization of innovative activities differs markedly across
sectors, but is relatively stable across countries, which indicates that the differences are related to
the inherent nature of technology but not country-specific factors. I therefore follow Breschi,
Malerba and Orsenigo (2000) who use the PACE data to construct measures of the sectoral
technology regime including technological opportunity and cumulativeness of technology.
20
Similarly, I construct four technology characteristics indicators for (i) technological opportunity,
(ii) cumulativeness of product innovation, (iii) cumulativeness of process innovation, and (iv)
degree to which a sector is based on scientific inputs. All four indicators are normalized relative
to the total manufacturing average when used in the econometric tests presented below. The
following provides a brief description of these four concepts (cf. the appendix for a more detailed
explanation of how they were constructed).
First, technological opportunity reflects the intensity of innovative activity in a sector for a given
level of resources invested. It is an indicator of the frequency and newness of potential
technological innovations. Hence, in sectors with high opportunities it is legitimate to assume a
high degree of diversity of opinion about what the best projects are. Following the model by
Allen and Gale (2000) this indicator will allow us to investigate the informational requirements
of sectoral environments. Second, the cumulativeness of technology refers to the fact that
today�s innovations are built upon the knowledge created by previous streams of innovations.
High levels of cumulativeness are features of sectoral environments characterized by strong
continuities in innovative activities. To measure cumulativeness I distinguish between product
and process innovations. On the one hand, product innovation is associated with high levels of
uncertainty and the accumulation of sector-specific rather than company-specific knowledge. On
the other hand, the knowledge generated and accumulated through process innovation is likely to
be of a more tacit, company-specific nature. Fourth, sectoral technology regimes are assumed to
be different in terms of their dependence on scientific knowledge inputs. Innovative projects in
science-based sectors can be assumed to be highly complex and have longer gestation periods.
They can be hypothesized to thrive in environments with highly developed financial
infrastructures, but the relation with the character of the financial system is less clear.

21
Figure 2: Sector profiles of technology regimes
Source: See appendix
Figure 2 depicts 8 manufacturing sectors based on these four dimensions and compares them
with the manufacturing average. The upper left hand graph exhibits a relatively high-tech sector,
motor vehicles, with a more low-tech sector, shipbuilding. Motor vehicles scores higher in all
categories except process innovation. It seems reasonable to assume motor vehicle
0.500.600.700.800.901.00
OPPORTUNITY
PRODUCTINNOV
PROCESSINNOV
SCIENCEBASE
Motor Vehicles Shipbuilding & Repairing
Manufacturing
0.500.600.700.800.901.00
OPPORTUNITY
PRODUCTINNOV
PROCESSINNOV
SCIENCEBASE
Professional Goods Non-Metallic Products
Manufacturing
0.500.600.700.800.901.00
OPPORTUNITY
PRODUCTINNOV
PROCESSINNOV
SCIENCEBASE
Rubber Products Metal Products
Manufacturing
0.500.600.700.800.901.00
OPPORTUNITY
PRODUCTINNOV
PROCESSINNOV
SCIENCEBASE
Machinery & Equipment, nec Paper & Products
Manufacturing

22
production to be characterized by higher levels of opportunity, a greater bias towards product
innovation and science-based inputs compared to shipbuilding. Comparing the professional
goods sector with non-metallic products (lower left graph) generates a similar high-tech/ low-
tech distinction. The lower right graph shows that rubber products and metal products are not
distinguished so much by intensity of innovative activity as by the difference between product
and process innovation. Table 1 summarizes some of the theoretical hypotheses that can be
derived from combining the four measures of technological characteristic with the previously
described indicators of financial structure.
5. Estimation results
I first report the estimation results relating the dependent variable growth or revealed
comparative advantage to a single independent variable capturing the interaction between
financial structure and technology characteristic. Table 2 shows the regression coefficients in
matrix form divided into two panels: (a) growth regressions and (b) export regressions. First,
there are more significant coefficients on the interactive terms when growth is the dependent
variable compared to the export equation in panel (b). In particular, the intensity of product
innovation in a sector interacts with a number of financial structure variables in determining
growth of value added. As hypothesized by some of the theoretical models presented in table 1,
all three stock market indicators interact positively with the measure of product innovation. In
contrast, the level of bank concentration as well as ownership concentration has a negative and
significant effect on growth in sectors characterized by higher levels of cumulativeness in new
product development. Developed stock markets also have positive effects on relative growth

23
Table 1: Financial systems and technology regimes--Hypotheses
TECHNOLOGY FINANCE STRUCTURE
Opportunity
Intensity of product
innovation
Intensity of process
innovation
Degree of science base
BANKS:
Bank assets
Bank concentration
(--) Huang/Xu (2000) multi-bank systems better at enforcing hard-budget constraints in sectors with high number of bad projects (ex post)
STOCK MARKETS:
Stock market capitalization
(+) Allen/Gale (2000) stock markets better at dealing with diversity of opinion
(+) Allen/Gale (2000) stock markets better at dealing with diversity of opinion
Accounting standards
(+) Allen/Gale (2000) stock markets better at dealing with diversity of opinion
(+) Allen/Gale (2000) stock markets better at dealing with diversity of opinion
(--) Porter (1992) disclosure requirements can lead to underproduction of company-specific knowledge�dominance of financial indicators
Market orientation (Stock market cap./ bank assets)
(+) Porter (1992) market-oriented systems can quickly reallocate resources in rapidly changing environments
CORPORATE SYSTEM:
Ownership concentration Insider/outsider system
(--) Mayer (1996) outsider systems better at reorganization even with costs for some stakeholders
(+) Mayer (1996) insider systems provide incentives for long-term commitment of stakeholders
DEVELOPMENT:
Financial development (bank assets + stock market cap.)
(+) Levine (1997) Banks and markets provide complementary services to overcome market imperfections�structure does not matter
(+) Levine (1997) Banks and markets provide complementary services to overcome market imperfections�structure does not matter
(+) Levine (1997) Banks and markets provide complementary services to overcome market imperfections�structure does not matter
(+) Levine (1997) Banks and markets provide complementary services to overcome market imperfections�structure does not matter
Notes: (--), (+) indicate hypothesized sign on β-coefficients

24
performance in high opportunity and science-based sectors although the size of the coefficient
and significance levels are smaller compared to the regressions using product innovation as
technology characteristic. There appears to be no interaction between financial system and
growth in process innovation-oriented sectors as stipulated by the innovation literature and
Mayer (1996).
In general, export competitiveness seems to be less affected by complementarities between
technology characteristic and financial institutions. As in the growth regressions accounting
standards again interact positively with technological opportunity in promoting export success.
In contrast, the product innovation variable has no significant interactions with measures of
corporate and financial structure. As hypothesized by Porter (1992) the negative and significant
coefficient on the interactive variable of accounting standards and process innovation indicates
that information availability is detrimental to the relative export performance of process-oriented
sectors. The last column shows a number of significant interactions of our institutional measures
with science-based sectors. Bank and ownership concentration are associated negatively with
export performance in sectors with high science inputs. The positive coefficients on bank assets
and stock capitalization in combination with a positive and significant coefficient on financial
development indicate that development of the financial sector might be more important than its
structure in supporting science-based production activities.
The findings of the multivariate growth regressions are presented in table 3. It reports results for
estimation results when different time periods and variable specifications are used.vii The
coefficients measuring the role of the banking sector�s interaction with technology characteristics

25
Table 2: Financial structure, sectoral innovation and performance�Simple regression results
(a) dependent variable is sectoral growth rate for the period 1970-1997SECTORAL INNOVATION CHARACTERISTICS
FINANCIAL STRUCTURE opportunity product innovation process innovation science basedBanksbank assets -0.005 (-0.77) 0.002 (0.13) -0.03 (-1.54) 0.002 (0.71)bank concentration -0.005 (-0.85) -0.28** (-2.47) 0.003 (0.2) 0.002 (0.94)
Stock marketstock market capitalization 0.008 (1.38) 0.032*** (2.74) 0.009 (0.52) 0.003 (1.15)accounting standards 0.021* (1.85) 0.07*** (2.97) 0.024 (0.71) 0.008* (1.7)
Financial structuresize index 0.007* (1.75) 0.021*** (2.73) 0.015 (1.23) 0.001 (0.79)
Corporate structureownership concentration -0.003 (-0.58) -0.17* (1.9) -0.008 (-0.57) -0.0007 (-0.43)
Financial developmentsize index 0.002 (0.42) 0.02** (1.95) -0.008 (-0.67) 0.002 (1.29)
regression includes constant term and initial sector share (not reported)
(b) dependent variable is Index of Revealed Comparative Advantage 1975-1997SECTORAL INNOVATION CHARACTERISTICS
FINANCIAL STRUCTURE opportunity product innovation process innovation science basedBanksbank assets 0.001 (0.074) 0.034 (1.28) 0.013 (0.31) 0.013** (2.49)bank concentration 0.007 (0.549) -0.039 (-1.6) -0.05 (-1.23) -0.016*** (-3.48)
Stock marketstock market capitalization 0.0095 (0.72) 0.02 (0.75) -0.031 (-0.79) 0.01** (2.1)accounting standards 0.05** (1.95) -0.02 (-0.44) -0.186** (-2.48) -0.00 (-0.001)
Financial structuresize index 0.008 (0.90) 0.006 (0.36) -0.032 (-1.20) 0.0036 (1.06)
Corporate structureownership concentration -0.0021 (-0.121) -0.023 (-1.17) 0.01 (0.35) -0.009** (-2.42)
Financial developmentsize index 0.005 (0.55) 0.024 (1.38) -0.009 (-0.33) 0.011*** (3.17)
regression includes constant term (not reported)financial structure variables are averages for 1970s-1997(*) indicates 10%-significance level(**) indicates 5%-significance level(***) indicates 1%-significance level17 OECD countries, 20 manufacturing sectors

26
are presented in the top section of the table. There appears to be a strong negative effect of
higher bank concentration on growth in sectors with emphasis on product innovation. This result
is robust across different time periods and alternative specifications. Interestingly, there is a
positive and significant sign on the interactive term (process innovation*bank concentration) for
the period of the 1970s.
The following section in the table looks at the role of the stock market using accounting
standards, market orientation index and stock market capitalization as financial systems
variables. Similar to the results of the bivariate correlations, accounting standards as a measure
of market orientation interact significantly with three of the four technology variables.
Specifically, high levels of accounting standards are positively associated with growth in product
innovation and science-based sectors. The coefficients in the high opportunity sectors though
always positive are only significant in the period of the 1980s. However, the interaction of
information availability and process innovation correlates negatively and significantly with
growth of value added. These results are robust across different time periods as well as when a
measure of overall financial development is included (columns 4 and 5). The structure index
measuring the degree of market orientation of the financial system is used as an alternative stock
market variable in two specifications (columns 6 and 7). Here the results indicate a positive
effect of more market orientation in promoting growth in sectors based on cumulativeness in
product innovations. In sum, our results indicate that the size and influence of the stock market
has a positive effect on the relative performance of sectors characterized by high opportunity,
product innovation and scientific base. In contrast, sectors in which technical change relies on
process innovation seem to fare better in more bank-oriented financial systems.

27
Table 3: Financial structure, sectoral innovation characteristics and growth�Multivariate regressions
growth (period) (1970-97) (1980-90) (1970-80) (1970-97) (1970-80) (1970-97) (1970-97) (1970-97)
Initial output share -0.174 -0.132 -0.253 -0.179 -0.257 -0.171 -0.168 -0.167-(3.86) -(2.11) -(3.42) -(3.97) -(3.48) -(3.78) -(3.71) -(3.66)
Banking sector Bank concentration Bank assets
* opportunity -0.004 -0.001 -0.029 -0.004 -0.025 -0.005 -0.004-(0.43) -(0.09) -(1.91) -(0.39) -(1.53) -(0.48) -(0.50)
* product innovation -0.070 -0.057 -0.083 -0.061 -0.091 -0.049 0.017-(3.63) -(2.18) -(2.61) -(3.02) -(2.73) -(2.37) (1.12)
* process innovation 0.042 0.020 0.103 0.023 0.085 0.006 -0.040(1.59) (0.56) (2.40) (0.85) (1.90) (0.21) -(1.95)
* science base -0.003 0.001 -0.009 0.000 -0.006 0.003 0.003-(0.83) (0.29) -(1.75) (0.10) -(1.01) (0.85) (1.31)
Stock market Accounting standards Structure index Capitalization
* opportunity 0.020 0.038 0.028 0.020 0.027 0.011 0.009 0.013(1.15) (1.64) (1.01) (1.15) (0.96) (1.31) (1.25) (0.98)
* product innovation 0.144 0.115 0.179 0.140 0.181 0.048 0.026 0.061(4.06) (2.40) (3.09) (3.99) (3.14) (2.83) (1.80) (2.28)
* process innovation -0.082 -0.107 -0.140 -0.076 -0.135 -0.010 -0.007 -0.053-(1.72) -(1.66) -(1.79) -(1.63) -(1.74) -(0.42) -(0.36) -(1.46)
* science base 0.016 0.016 0.020 0.015 0.019 0.003 0.005 0.012(2.66) (1.93) (2.07) (2.53) (1.98) (1.03) (1.91) (2.62)
Corporate structure Ownership concentration
* opportunity 0.006 0.007 0.016 0.006 0.022 0.013 0.010 0.009(0.78) (0.66) (1.26) (0.69) (1.53) (1.08) (0.97) (0.90)
* product innovation 0.031 0.009 0.063 0.041 0.050 0.057 0.025 0.020(1.92) (0.39) (2.36) (2.25) (1.69) (2.31) (1.20) (0.98)
* process innovation -0.027 -0.027 -0.064 -0.050 -0.087 -0.041 -0.038 -0.037-(1.23) -(0.89) -(1.77) -(2.02) -(2.14) -(1.22) -(1.33) -(1.32)
* science base 0.002 0.001 0.004 0.005 0.007 0.004 0.007 0.006(0.64) (0.27) (0.78) (1.72) (1.50) (1.06) (1.91) (1.79)
Financial development
* opportunity 0.006 0.011 0.001 0.002(0.02) (0.92) (0.16) (0.27)
* product innovation 0.041 -0.021 0.023 0.033(1.23) -(0.87) (1.59) (2.28)
* process innovation -0.050 -0.040 -0.043 -0.044-(2.06) -(1.24) -(2.17) -(2.30)
* science base 0.005 0.007 0.007 0.006(2.57) (1.81) (2.66) (2.54)
T-statistics in parenthesesCoeffcients with at least 10% significance are highlighted

28
Thirdly, I use ownership concentration to identify possible interactions between corporate
structure and technology regimes. The results are somewhat unexpected and contradictory.
While the interactive variable of ownership concentration and product innovation orientation was
significantly negatively correlated with growth in the bivariate regressions, the signs are now
positive and significant. This result is fairly robust when using different time periods and
specifications. The results further contradict theoretical stipulations of a positive interaction
between process innovation and tight ownership structures. All of the eight coefficients are
negative and three of them are significant at the 10 percent level.
Finally, I included a measure of financial development to investigate whether the results are
affected by the level of overall financial development as stipulated by Levine (1997), that were
confirmed empirically in some later studies (Beck and Levine, 2001). My earlier results are
unaffected when including the development effect. However, the overall level of financial
sophistication interacts positively with growth in science-based industries. It seems that in these
sectors the structure of the financial system matters less than its level of development.
The regression estimates using export competitiveness as the dependent variable show fewer
significant coefficients on the interactive terms (see Table 4). This confirms the results from the
bivariate regressions reported above. With respect to the role of the banking sector, there is a
robust significant negative correlation of bank concentration in science-based sectors. The
coefficient on bank assets interacting with science base is, however, positive and significant.
Among the stock market variables it is only accounting standards similar to the bivariate case,
which interacts negatively and significantly with process-innovative technology regimes in
promoting exports. There are no significant correlations for the interaction of ownership

29
Table 4: Financial structure, sectoral innovation characteristics and export performance�Multivariate regressions
Dependent variable Revealed comparative advantage (1975-1997)
Banking sector Bank concentration Bank assets
* opportunity -0.010 -0.003 0.017 -0.001-(0.47) -(0.14) (0.77) -(0.05)
* product innovation -0.049 -0.039 -0.057 0.053-(1.15) -(0.88) -(1.27) (1.61)
* process innovation 0.026 0.003 -0.048 -0.024(0.46) (0.05) -(0.78) -(0.53)
* science base -0.020 -0.016 -0.016 0.015-(2.79) -(2.09) -(2.04) (2.56)
Stock market Accounting standards Structure index Capitalization
* opportunity 0.107 0.106 0.021 0.029 0.044(2.87) (2.83) (1.15) (1.89) (1.54)
* product innovation -0.063 -0.065 -0.005 -0.031 -0.028-(0.82) -(0.85) -(0.13) -(1.01) -(0.48)
* process innovation -0.245 -0.240 -0.040 -0.062 -0.086-(2.35) -(2.30) -(0.78) -(1.45) -(1.09)
* science base 0.014 0.013 0.007 -0.001 0.008(1.11) (1.04) (1.02) -(0.24) (0.82)
Corporate structure Ownership concentration
* opportunity 0.021 0.030 0.024 0.035 0.028(1.22) (1.55) (0.90) (1.58) (1.27)
* product innovation -0.038 -0.026 -0.013 -0.051 -0.059-(1.06) -(0.64) -(0.23) -(1.11) -(1.31)
* process innovation -0.008 -0.040 -0.017 -0.048 -0.016-(0.17) -(0.73) -(0.22) -(0.77) -(0.27)
* science base -0.001 0.004 0.008 -0.003 -0.005-(0.19) (0.59) (0.82) -(0.43) -(0.64)
Financial development
* opportunity 0.016 0.018 0.015(1.00) (1.18) (1.01)
* product innovation 0.021 0.020 0.030(0.66) (0.61) (0.95)
* process innovation -0.054 -0.060 -0.052-(1.26) -(1.38) -(1.22)
* science base 0.009 0.009 0.013(1.67) (1.70) (2.41)
T-statistics in parenthesesCoeffcients with at least 10% significance are highlighted

30
Table 5: Summary of estimation results
Notes: B = bivariate regression results; M = multivariate regression results
concentration with any of the four technology regime measures. Finally, financial development
is positively associated with export success in science-based industries in all three specifications
that include this variable. This appears to indicate that financial structure, other than bank
concentration, plays a minor role in understanding innovation and export performance. Rather, it
is the ability of both banks and stock markets to provide information and funds that is required in
science-based sectors.
Table 5 summarizes the evidence for both the multivariate and bivariate growth and export
regressions. As theorized by a number of scholars large and well-functioning stock markets
complement innovative behavior in sectors with high opportunities and a focus on product
innovation. The complementarity between stock market orientation and the two technology
Opportunity Product innovation
Process innovation
Science base
growth exports growth exports growth exports growth exports B + Bank assets M B -- -- Bank
concentration M -- -- B + + Stock market
capitalization M + B + + + -- + Accounting
standards M + -- + B + + Market based M + B -- -- Ownership
concentration M + B + + Financial
development M + +
31
regime indicators works mainly through promoting growth. Furthermore, good accounting
standards have a positive effect on growth in science-based sectors. In contrast, stock markets
especially good accounting information appears to have a negative effect on countries� export
performance in sectors geared towards process innovation. Bank concentration has a negative
effect on growth when interacting with product innovation as the technology regime variable.
Similarly, limited competition in the banking sector plays a detrimental role in science-based
sectors through lowering export competitiveness. There are no robust results to report in terms
of the role of ownership concentration. On the other hand, financial development in interaction
with science-based technology regimes has a positive influence on both exports and growth.
The analysis so far has focused on individual variables to measure the character of the financial
system. But one single variable such as e.g. ownership concentration or bank assets cannot fully
capture the systemic nature of national financial infrastructures. I therefore further derive a
composite index incorporating four financial structure variables (bank concentration, the
financial structure index, accounting standards and ownership concentration) by using principle
components analysis. Outsider systems are characterized by lower bank and ownership
concentration as well as better accounting standards and greater stock market orientation relative
to insider systems. Figure 3 shows the values of the first principal component for the 17 OECD
countries.
Then I re-estimated the growth and export regressions using the insider/outsider indicator (first
principal component) as my structure variable interacting with the four technology regime
indicators. The results are largely consistent with my previous findings (Table 6). Outsider

32
Figure 3: Insider and outsider systems
systems (large stock markets, good accounting standards, low bank and ownership
concentration) are positively correlated with growth in product-oriented and science-based
sectors. There is a positive association of insider systems with export competitiveness in
process-oriented sectors. Outsider systems have a positive effect on growth and export success
of science-based industries, but overall development is still important.
6. Conclusions
The theoretical discussion and the empirical regularities provided in this paper suggest that
financial systems are an important factor in explaining innovation across sectors and countries.
Rather than having an impact on aggregate growth levels through investment funding, national
financial systems were found to play a role in giving various degrees of financial and
-2
-1.5
-1
-0.5
0
0.5
1
1.5
2
2.5
Portug
al
Austria
Greece
Belgium Ita
ly
Denmark
Spain
Norway
German
y
Finlan
d
France NL
Sweden
Japa
n
Canad
a US UK
INSIDER SYSTEM OUTSIDER SYSTEM

33
Table 6: Insider and outsider systems
organizational support to sector-specific technological learning regimes. In other words, the
results of this study indicate that complementarities between financial infrastructures and
complex organizational innovation processes best described at the sectoral level of the economy
can help to explain observable differences in national industrial structures. Specifically, market-
dominated outsider systems are relatively better at promoting industrial innovation activities
characterized by high technological opportunity and a focus on product innovation. Insider
systems in which market allocation of funds and ownership is limited are compatible with
Growth (1970-97) RCA (1975-97)
initial output share -0.175 -0.178-(3.87) -(3.90)
Insider/outsider system
* opportunity 0.001 0.001 0.004 0.005(0.41) (0.66) (1.16) (1.28)
* product innovation 0.009 0.006 0.008 -0.002(3.03) (1.71) (1.21) -(0.22)
* process innovation -0.002 0.003 -0.019 -0.017-(0.51) (0.65) -(2.19) -(1.59)
* science base 0.001 0.001 0.003 0.001(1.97) (0.79) (2.65) (0.40)
Financial development
* opportunity -0.003 -0.006-(0.55) -(0.43)
* product innovation 0.014 0.054(1.20) (2.04)
* process innovation -0.029 -0.012-(1.78) -(0.34)
* science base 0.003 0.013(1.32) (2.97)
T-statistics in parenthesesCoeffcients with at least 10% significance are highlighted

34
innovation regimes characterized by higher levels of cumulativeness of company-specific
knowledge.
The undeniable fact that the United States has been especially successful in promoting sectors
associated with the information revolution is therefore at least partly attributable to its market-
based financial and corporate governance system. However, the widespread concern among
European economists and policy makers that lackluster innovation performance in ICT is
associated with a growth slowdown might be premature. First, innovative learning takes place in
all sectors of the economy not just in high technology sectors. In fact, though growing in size
sectors like ICT or biotechnology contribute only a small percentage to total output. Second,
European institutions might be especially successful at promoting innovative activities in
industries operating more established technologies. Performance in today�s high-technology
sectors might therefore improve as the underlying innovation process changes its character and
becomes more mature.
35
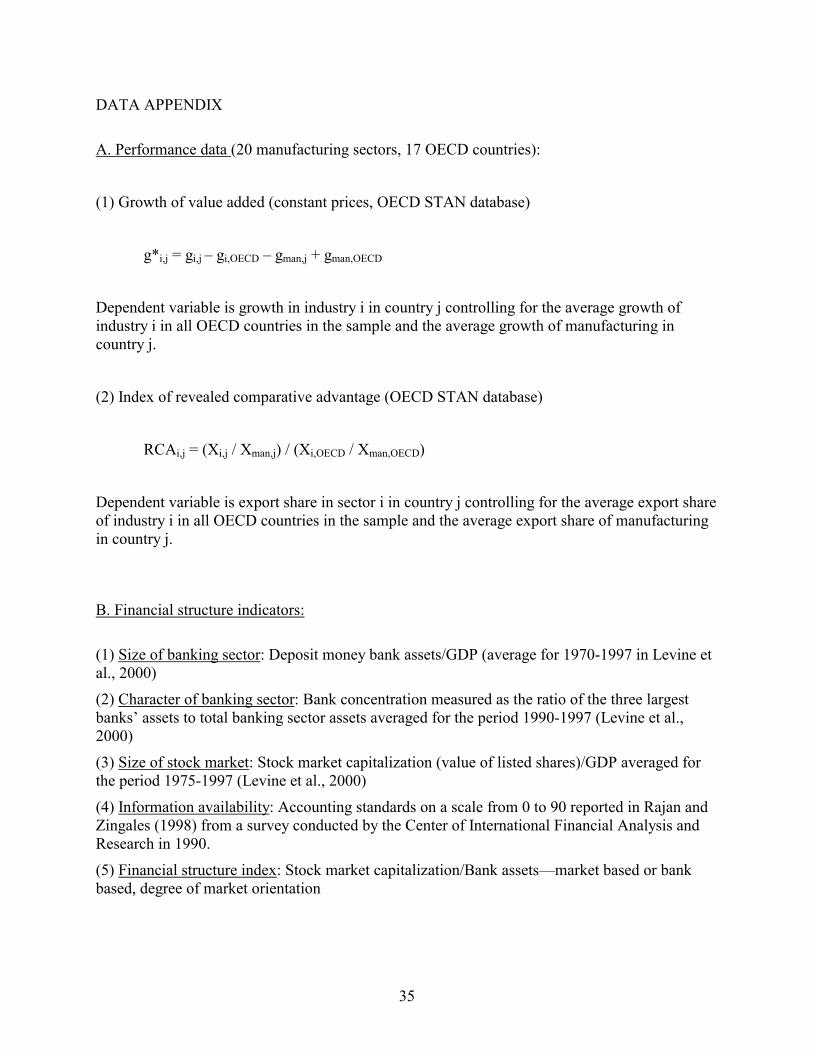
DATA APPENDIX
A. Performance data (20 manufacturing sectors, 17 OECD countries):
(1) Growth of value added (constant prices, OECD STAN database)
g*i,j = gi,j � gi,OECD � gman,j + gman,OECD
Dependent variable is growth in industry i in country j controlling for the average growth of industry i in all OECD countries in the sample and the average growth of manufacturing in country j.
(2) Index of revealed comparative advantage (OECD STAN database)
RCAi,j = (Xi,j / Xman,j) / (Xi,OECD / Xman,OECD)
Dependent variable is export share in sector i in country j controlling for the average export share of industry i in all OECD countries in the sample and the average export share of manufacturing in country j.
B. Financial structure indicators:
(1) Size of banking sector: Deposit money bank assets/GDP (average for 1970-1997 in Levine et al., 2000)
(2) Character of banking sector: Bank concentration measured as the ratio of the three largest banks� assets to total banking sector assets averaged for the period 1990-1997 (Levine et al., 2000)
(3) Size of stock market: Stock market capitalization (value of listed shares)/GDP averaged for the period 1975-1997 (Levine et al., 2000)
(4) Information availability: Accounting standards on a scale from 0 to 90 reported in Rajan and Zingales (1998) from a survey conducted by the Center of International Financial Analysis and Research in 1990.
(5) Financial structure index: Stock market capitalization/Bank assets�market based or bank based, degree of market orientation

36
(6) Ownership concentration: 1 minus the percentage of widely held of the largest 20 publicly traded corporations in 1995 (La Porta et al., 1998)�character of corporate system, insider vs. outsider system.
(7) Financial development index: (Stock market capitalization + bank assets) / GDP�degree of overall financial sophistication Table A.1: Financial system indicators
C. Industry characteristics: The industry structure variables are based on results from the PACE (Policies, Appropriability and Competitiveness for European Enterprises) survey of R&D managers in the 500 largest enterprises in Europe (UK, Germany, Italy, Benelux, Spain, Denmark, France) conducted in 1993-94. I matched individual responses to the 20 manufacturing sectors for which performance data were available from the OECD STAN database. I then computed sectoral averages based on responses (five-point Likert-scale ratings) to the following questions. Table A.2 presents normalized average values of sectoral technology regime indicators. (1) Technological opportunity:
PACE question: �How important to the innovative activities of your unit is technical knowledge obtained from the following sources: 1. Affiliated firms; 2. Joint or cooperative ventures; 3. Independent suppliers; 4. Independent clients or customers; 5. Public research institutes or universities.� Added scores (min. 5 - max. 25).
Bank Bank Stock market Accounting Financial Ownership Financial Insider/assets concentration capitalization standards structure concentration development Outsider
Austria 0.97 0.72 0.07 0.54 0.07 0.95 1.04 -1.20Belgium 0.65 0.65 0.24 0.61 0.37 1.00 0.89 -0.63Canada 0.49 0.58 0.46 0.74 0.93 0.50 0.95 1.24Denmark 0.50 0.74 0.22 0.62 0.44 0.90 0.72 -0.42Finland 0.59 0.88 0.23 0.77 0.39 0.85 0.81 -0.06France 0.77 0.41 0.20 0.69 0.25 0.70 0.97 0.02Germany 1.02 0.45 0.18 0.62 0.18 0.65 1.20 -0.22Greece 0.39 0.77 0.10 0.55 0.27 0.95 0.49 -0.94Italy 0.74 0.36 0.11 0.62 0.15 0.85 0.86 -0.49Japan 1.09 0.22 0.65 0.65 0.59 0.50 1.74 0.76Netherlands 0.82 0.74 0.43 0.64 0.52 0.70 1.25 0.03Norway 0.57 0.84 0.18 0.74 0.31 0.95 0.74 -0.37Portugal 0.79 0.46 0.07 0.36 0.09 1.00 0.86 -1.60Spain 0.84 0.47 0.20 0.64 0.24 0.85 1.04 -0.39Sweden 0.50 0.88 0.38 0.83 0.76 1.00 0.88 0.38United Kingdom 0.66 0.56 0.75 0.78 1.13 0.10 1.41 2.21United States 0.73 0.19 0.60 0.71 0.82 0.20 1.33 1.68
Average 0.71 0.58 0.30 0.65 0.44 0.74 1.01 N/A

37
(2) Cumulativeness product innovation:
PACE question: �How important are frequent technical product improvements in making your unit�s innovations difficult or commercially unprofitable to imitate?� Simple score (min. 1 - max. 5).
(3) Cumulativeness process innovation:
PACE question: �How important are frequent technical process improvements in making your unit�s innovations difficult or commercially unprofitable to imitate?� Simple score (min. 1 - max. 5).
(4) Science base:
PACE question: �How important to the progress of your unit�s technological base was publicly funded research, in any country, over the past ten years in: 1. Computing Science; 2. Materials Science; 3. Medical and Health Sciences; 4. Chemical Engineering; 5. Electrical Engineering; 6. Mechanical Engineering.� Added score (min. 6 - max. 30).
Table A.2: Technology regime indicators (normalized values)
ISIC (Rev. 2 Sector description Opportunity Product innovation Process innovation Science base3110 Food 0.89 0.79 1.00 0.783130 Beverages 0.88 0.73 0.88 0.663140 Tobacco 0.80 0.61 0.77 1.003210 Textiles 0.86 0.79 0.94 0.743410 Paper & Products 0.94 0.75 0.73 0.553510 Industrial Chemicals 0.85 0.83 0.98 0.783520 Chemical Products 0.90 0.79 0.92 0.743540 Petroleum & Coal 0.90 0.77 0.91 0.793550 Rubber Products 0.91 1.00 0.88 0.603560 Plastic Products 1.00 0.83 0.99 0.703620 Glass & Products 0.83 0.72 0.91 0.673690 Non-Metallic Produc 0.81 0.60 0.83 0.743710 Iron & Steel 0.94 0.71 0.98 0.873720 Non-Ferrous Metals 0.87 0.66 0.92 0.753810 Metal Products 0.89 0.82 1.00 0.743820 Machinery & Equipm 0.90 0.83 0.92 0.893830 Electrical Apparatus 0.88 0.79 0.82 0.773841 Shipbuilding 0.87 0.67 0.94 0.813843 Motor Vehicles 0.90 0.79 0.90 0.903850 Professional Goods 0.92 0.79 0.84 0.88
Manufacturing average 0.89 0.76 0.90 0.77Manufacturing median 0.89 0.79 0.92 0.76

38
i Additional evidence is provided in a panel study of small firms in high tech industries in the
United States. Himmelberg and Petersen (1994) find that the flow of internal finance is the
principal determinant of the rate at which small high-tech firms acquire technology through
R&D.
ii In their study of the optical network industry, Carpenter and Lazonick (2001), for example,
show that stock was the major �acquisition� currency in the late 1990s. According to their data,
Cisco, Nortel and Alcatel, the leading companies in that sector, acquired a number of mostly
small start-up companies between 1998-2000 and paid for them with company stock.
iii The magnitude of these stock options is by no means trivial. British economist Andrew
Smithers (cited in Krugman, New York Times, February 1, 2002) estimates that Cisco System�s
1998 profit of US $ 1.35 billion would have turned into a $ 4.9 billion loss had the company
counted the market value of stock options issued that year as a cost in its balance sheet.
iv I also used activity measures for banks (total private credit/GDP) and stock markets (total
stocks traded/GDP). These activity indicators are highly correlated with the size indicators used
in this study and therefore generated similar results in the regressions, but are not reported here.
v The use of accounting standards in empirical studies differs. Rajan and Zingales (1998) and
Beck and Levine (2000) use accounting standards as a measure of overall financial development
while Carlin and Mayer (1999) utilize accounting data as an indicator of the stock market
orientation of financial systems. This study will follow the latter interpretation because widely
available company information promotes the role of stock markets.
vi A dispute between German automaker Porsche and the German stock exchange is a good
example of the potentially contentious role of accounting information. The stock exchange

39
recently stopped including Porsche in a particular segment of the DAX (Deutscher AktienindeX)
because of its continued refusal to publish quarterly (instead of semi-annual) earnings reports.
Porsche�s CEO Friedekind defended his company�s position by arguing that publishing company
information in such frequency would divert attention to short-run performance measures rather
than to the long-run structural health of the company. The fact that Porsche could maintain this
position is an indicator of the continued weakness of the shareholder value movement in
Germany.
vii In addition to estimating different specifications and time periods all regressions reported in
this paper were also run including the raw variables that are used to compute the interactive
variables. In all cases the coefficients on the raw variables were insignificant. Since the
coefficients on the interactive variables were only marginally affected when compared to
estimates excluding the raw variables only the latter are reported here.

40
References Allen, F. (1993), “Stock markets and resource allocation,” in C. Mayer and X. Vives (eds.) Capital Markets and Financial Intermediation, Cambridge: Cambridge University Press. Allen, F., and D. Gale (2000), Comparing Financial Systems, Cambridge, MA: MIT Press. Aoki, M. (1998), “An information theoretic approach to comparative corporate governance,” unpublished manuscript, Stanford University. Aoki, M, and G. Dosi (1992), “Corporate organization, finance and innovation,” in G. Dosi (2000) Innovation, Organization and Economic Dynamics, Cheltenham: Edward Elgar. Originally published in Vera Zamagni (ed.) Finance and the Enterprise, Academic Press. Beck, T. and R. Levine (2001), “Industry growth and capital allocation: Does having a market- or bank-based system matter?” World Bank, Washington, DC. Beck, T., A. Demirgüc-Kunt, and R. Levine (1999), “A new database on financial development and structure,” World Bank, Washington, DC. Black, B. S. and R. J. Gilson (1998), “Venture capital and the structure of capital markets: Banks versus stock markets,” Journal of Financial Economics, 47, pp. 243-277. Breschi, S., F. Malerba and L. Orsenigo (2000), “Technological regimes and Schumpeterian patterns of innovation,” Economic Journal 110 (April), pp. 388-410. Bresnahan, T. and F. Malerba (1997) “Industrial dynamics and the evolution of firms’ and nations’ competitive capabilities in the world computer industry,” unpublished manuscript, Stanford University. Carlin, W., and C. Mayer (1999), “Finance, investment and growth,” Working Paper, Said Business School, Oxford University, Oxford. Carpenter. M. and W. Lazonick (2001), “The optical networking industry,” unpublished manuscript, INSEAD, Paris. Chandler, A. (1990), Scale and Scope: The Dynamics of Industrial Capitalism, The Belknap Press of Harvard University Press. Dosi, G. (1990), “Finance, innovation and industrial change,” Journal of Economic Behavior and Organization 13, pp. 299-319. Freeman, C. and L. Soete (1997), The Economics of Industrial Innovation, Pinter.

41
Guerrieri, P, and A. Tylecote (1997), “Interindustry differeneces in technical change and national patterns of technological accumulation,” in Edquist (ed.), Systems of Innovation: Technologies, Institutions and Organizations, Pinter. Huang, H., and C. Xu (2000), “Institutions, innovations and growth,” AER Papers and Proceedings. La Porta, R., Lopez-de-Silanes, F., and A. Shleifer (1998), “Corporate ownership around the world,” mimeo., Harvard University, Cambridge, MA. Lazonick, W. (2000), “Understanding innovative enterprise,” mimeo., INSEAD, Paris. Mayer, C. (1996), “Corporate governance, competition and performance,” OECD Economic Department, working paper No. 164, Paris. Nelson, R. 1994. The co-evolution of technology, industrial structure and supporting institutions, Industrial and Corporate Change, vol. 3, 47-63. Nelson, R. (ed.) (1993), National Innovation Systems, Oxford University Press. Nelson, R. R. and B. Sampat (2001), “Making sense of institutions as a factor shaping economic performance,” Journal of Economic Behavior and Organization, 44, pp. 31-54. O’Sullivan. M. (2000), “The innovative enterprise and corporate governance,” Cambridge Journal of Economics 24, pp. 393-416. Pavitt, K. (1984), “Sectoral patterns of technical change: toward a taxonomy and a theory,” Research Policy 13, pp. 343-373. Porter, M. (1992), “Capital disadvantage: America’s failing capital investment system,” Harvard Business Review, pp. 65-82. Rajan, R. and L. Zingales (1998), “Financial dependence and growth,” American Economic Review, 88, pp. 537-58. Storper, M. (1996), “Innovation as Collective Action: Conventions, Products and Technologies,” Industrial and Corporate Change, vol. 5, 761-790. Tsuru, K. (2000), “Finance and growth: Some theoretical considerations, and a review of the empirical literature,” Economics Department Working Papers No. 228, OECD, Paris. Tushman, M. L. and Rosenkopf, L. (1992), “Organizational Determinants of Technological Change: Towards a Sociology of Technical Evolution,” in Research in Organizational Behavior, Vol. 14, Staw, B. and Cummings, L. (eds) JAI Press, Greenwich CT, pp. 311-347.

42
Tylecote, A. (1994), “Financial systems and innovation,” in Dodgson and Rothwell (eds.), Handbook of Industrial Innovation, Edward Elgar. Winter, S. G. (1984), “Schumpeterian Competition in Alternative Technological Regimes,” Journal of Economic Behavior and Organization, vol. 5, 287-320.