Final Report - West Zone (Madhya Pradesh Circle)
Assessment of (i) implementation and effectiveness of various
regulations, directions and orders issued by TRAI in the interest of
consumers and (ii) Customer Perception of Telecom Service Through
Surveys
December 2014
Telecom Regulatory Authority of India (TRAI)
342852 MCB ISA AA 01
AMC/Projects/342852/Documents/Draft Report/West Zone - Gujarat
26 December 2014
Draft Report - West Zone (Gujarat)
d by TRAI in the interest ofconsumers and (ii) Customer Perception o
Final Report - West Zone (Madhya Pradesh Circle)
Assessment of (i) implementation and effectiveness of various regulations, directions and orders issued by TRAI in the interest of consumers and (ii) Customer Perception of Telecom Service Through Surveys
December 2014
Telecom Regulatory Authority of India (TRAI)
Mott MacDonald, 501 Sakar II, Ellisbridge, Ahmedabad 380 006, Gujarat, India
T +91 (0)79 2657 5550 F +91 (0)79 2657 5558 W www.mottmac.com
Mahanagar Doorsanchar Bhavan, Jawaharlal Nehru Marg (Old Minto Road), New Delhi - 110 002 India
Final Report – West Zone (Madhya Pradesh Circle) Assessment of (i) implementation and effectiveness of various regulations, directions and orders issued by TRAI in the interest of consumers and (ii) Customer Perception of Telecom Service Through Surveys
342852/MCB/ISA/AA/01 01 December 2014 AMC/Projects/342852/Documents/Final Report/West Zone - MP
Revision Date Originator Checker Approver Description Standard
01 Dec 2014 BD / RS PS AN Draft Report – West Zone (MP)
02 Dec 2014 BD / RS PS AN Final Report – West Zone (MP)
Issue and revision record
This document is issued for the party which commissioned it and for specific purposes connected with the above-captioned project only. It should not be relied upon by any other party or used for any other purpose.
We accept no responsibility for the consequences of this document being relied upon by any other party, or being used for any other purpose, or containing any error or omission which is due to an error or omission in data supplied to us by other parties.
This document contains confidential information and proprietary intellectual property. It should not be shown to other parties without consent from us and from the party which commissioned it.
Final Report – West Zone (Madhya Pradesh Circle) Assessment of (i) implementation and effectiveness of various regulations, directions and orders issued by TRAI in the interest of consumers and (ii) Customer Perception of Telecom Service Through Surveys
342852/MCB/ISA/AA/01 01 December 2014 AMC/Projects/342852/Documents/Final Report/West Zone - MP
Chapter Title Page
Preface i
Executive Summary ii
Madhya Pradesh: Circles & Coverage Areas _________________________________________________________ ii Sample Design _______________________________________________________________________________ ii Madhya Pradesh: Basic Wire-Line _________________________________________________________________ iii Madhya Pradesh: Cellular Mobile _________________________________________________________________ iv Madhya Pradesh: Broadband ____________________________________________________________________ v
Part – A: QoS Benchmark & Assessment of Regulations vii
1 Introduction 1
1.1 Circles & Coverage Areas ____________________________________________________________ 1 1.2 Sample Design _____________________________________________________________________ 2
2 Objective of the Study 3
2.1 Assessment of customer perception of telecom services _____________________________________ 3 2.2 Assessment of implementation and effectiveness of various regulations, directions and orders issued by
TRAI in the interest of consumers ______________________________________________________ 4
3 Methodology 5
3.1 Questionnaire Design Methodology _____________________________________________________ 5 3.1.1 Service Quality Model________________________________________________________________ 5 3.1.2 Questionnaire Design ________________________________________________________________ 7 3.2 Analysis Methodology________________________________________________________________ 8 3.3 Sampling Methodology _______________________________________________________________ 8 3.4 Mode of Conducting Survey ___________________________________________________________ 9 3.5 Sample Size _______________________________________________________________________ 9 3.6 Sample Characteristics _____________________________________________________________ 10 3.6.1 Gender __________________________________________________________________________ 10 3.6.2 Age _____________________________________________________________________________ 10 3.6.3 Occupation _______________________________________________________________________ 11 3.6.4 Income Group _____________________________________________________________________ 11 3.6.5 Usage Type ______________________________________________________________________ 12 3.6.6 Connection Type __________________________________________________________________ 13
4 Customer Perception of Telecom Service 14
4.1 Madhya Pradesh Circle - Performance Compliance ________________________________________ 14 4.1.1 Basic Wire-line Service ______________________________________________________________ 14 4.1.2 Cellular Service ___________________________________________________________________ 19 4.1.3 Broadband Service _________________________________________________________________ 25
Contents
Final Report – West Zone (Madhya Pradesh Circle) Assessment of (i) implementation and effectiveness of various regulations, directions and orders issued by TRAI in the interest of consumers and (ii) Customer Perception of Telecom Service Through Surveys
342852/MCB/ISA/AA/01 01 December 2014 AMC/Projects/342852/Documents/Final Report/West Zone - MP
5 Assessment of TRAI Regulations and Directions 31
5.1 Basic Wire Line Services ____________________________________________________________ 31 5.1.1 The Telecom Commercial Communications Customer Preference Regulations, 2010. _____________ 31 5.1.2 Telecom Consumers Complaint Redressal Regulations, 2012. _______________________________ 32 5.2 Cellular Service ___________________________________________________________________ 33 5.2.1 Telecom Consumers Complaint Redressal Regulations, 2012. _______________________________ 33 5.2.2 The Telecom Commercial Communications Customer Preference Regulations, 2010. _____________ 36 5.2.3 Telecom Consumers Protection Regulations, 2012. _______________________________________ 37 5.2.4 Telecommunication Mobile Number Portability Per Port Transaction Charge and Dipping Charge
Regulations, 2009. _________________________________________________________________ 39 5.3 Broadband Service _________________________________________________________________ 40 5.3.1 Telecom Consumers Complaint Redressal Regulations, 2012 _______________________________ 40 5.3.2 Directions Related To Fair Usage Policy and Measurement of Broadband Speed ________________ 42
6 Conclusions & Recommendations 43
6.1 Basic Wire-Line ___________________________________________________________________ 43 6.2 Cellular Mobile ____________________________________________________________________ 43 6.3 Broadband _______________________________________________________________________ 44
Part B: Statistical Analysis 45
7 Statistical Analysis – Methodology 46
7.1 Net Promoter Score ________________________________________________________________ 46 7.2 Service Provider Level: Analytics Comparison ____________________________________________ 46 7.3 Sequential Equation Modelling ________________________________________________________ 46
8 Detailed Analysis Report 47
8.1 Basic Wire-line Service ______________________________________________________________ 47 8.1.1 Net Promoter Score ________________________________________________________________ 47 8.1.2 Annova __________________________________________________________________________ 47 8.1.3 Sequential Equation Modelling ________________________________________________________ 49 8.2 Cellular Service ___________________________________________________________________ 52 8.2.1 Net Promoter Score ________________________________________________________________ 52 8.2.2 Annova __________________________________________________________________________ 52 8.2.3 Sequential Equation Modelling ________________________________________________________ 55 8.3 Broadband Service _________________________________________________________________ 58 8.3.1 Net Promoter Score ________________________________________________________________ 58 8.3.2 Annova __________________________________________________________________________ 58 8.3.3 Sequential Equation Modelling ________________________________________________________ 61
Appendices 64
Appendix A. Sequential Equation Modelling – Service Provider-Wise ____________________________________ 65 A.1 Madhya Pradesh Circle – Basic Wire-Line _______________________________________________ 65 A.1.1 BSNL ___________________________________________________________________________ 65
Final Report – West Zone (Madhya Pradesh Circle) Assessment of (i) implementation and effectiveness of various regulations, directions and orders issued by TRAI in the interest of consumers and (ii) Customer Perception of Telecom Service Through Surveys
342852/MCB/ISA/AA/01 01 December 2014 AMC/Projects/342852/Documents/Final Report/West Zone - MP
A.1.2 Reliance _________________________________________________________________________ 67 A.1.3 Airtel ____________________________________________________________________________ 69 A.1.4 Tata ____________________________________________________________________________ 71 A.2 Madhya Pradesh Circle – Cellular _____________________________________________________ 73 A.2.1 BSNL ___________________________________________________________________________ 73 A.2.2 Tata ____________________________________________________________________________ 75 A.2.3 Reliance _________________________________________________________________________ 77 A.2.4 Idea ____________________________________________________________________________ 79 A.2.5 Vodafone ________________________________________________________________________ 81 A.2.6 Airtel ____________________________________________________________________________ 83 A.2.7 Videocon ________________________________________________________________________ 85 A.3 Madhya Pradesh Circle – Broadband ___________________________________________________ 87 A.3.1 BSNL ___________________________________________________________________________ 87 A.3.2 Hathway _________________________________________________________________________ 89 A.3.3 Reliance _________________________________________________________________________ 91 A.3.4 Tata Communication _______________________________________________________________ 93 A.3.5 Airtel ____________________________________________________________________________ 95 A.3.6 Tata Teleservices __________________________________________________________________ 97 A.3.7 Broadband Pacenet ________________________________________________________________ 99 Appendix B. Questionnaires ___________________________________________________________________ 101 B.1 Basic Wireline Service _____________________________________________________________ 101 B.2 Cellular Service __________________________________________________________________ 104 B.3 Broadband Service ________________________________________________________________ 108 Appendix C. Output Tables – Madhya Pradesh Circle _______________________________________________ 111 C.1 Basic Wire-line Service _____________________________________________________________ 111 C.2 Cellular Service __________________________________________________________________ 122 C.3 Broadband Service ________________________________________________________________ 139 C.1 Comparison Tables (2013-14 & 2012-13) – Madhya Pradesh Circle __________________________ 153 C.2 Basic Wireline Service (Madhya Pradesh Circle) _________________________________________ 153 C.2.1 Performance Compliance-Basic-Wireline Service (Madhya Pradesh Circle) ____________________ 153 C.2.2 The Telecom Commercial Communications Customer Preference Regulations, 2010 ____________ 153 C.2.3 Telecom Consumers Complaint Redressal Regulations, 2012 ______________________________ 154 C.2.4 Telecom Consumers Complaint Redressal Regulations, 2012 ______________________________ 154 C.3 Cellular Service (Madhya Pradesh Circle) ______________________________________________ 155 C.3.1 Performance Compliance-Cellular Service (Madhya Pradesh Circle) _________________________ 155 C.3.2 Telecom Consumers Complaint Redressal Regulations, 2012 ______________________________ 155 C.3.3 Telecom Consumers Complaint Redressal Regulations, 2012 ______________________________ 156 C.3.4 The Telecom Commercial Communications Customer Preference Regulations, 2010 ____________ 156 C.3.5 Telecom Consumers Protection Regulations, 2012 _______________________________________ 157 C.3.6 Telecommunication Mobile Number Portability Per Port Transaction Charge and Dipping Charge
Regulations, 2009 ________________________________________________________________ 157 C.4 Broadband Service (Madhya Pradesh Circle) ___________________________________________ 158 C.4.1 Performance Compliance-Broadband Service (Madhya Pradesh Circle) _______________________ 158 C.4.2 Telecom Consumers Complaint Redressal Regulations, 2012 ______________________________ 158 C.4.3 Telecom Consumers Complaint Redressal Regulations, 2012 ______________________________ 159 C.4.4 Directions Related To Fair Usage Policy and Measurement of Broadband Speed _______________ 159 C.4.5 Net Promoter Score – Madhya Pradesh Circle ___________________________________________ 160
Final Report – West Zone (Madhya Pradesh Circle) Assessment of (i) implementation and effectiveness of various regulations, directions and orders issued by TRAI in the interest of consumers and (ii) Customer Perception of Telecom Service Through Surveys
342852/MCB/ISA/AA/01 01 December 2014 AMC/Projects/342852/Documents/Final Report/West Zone - MP
Tables
Table 0.1: Circles & Coverage Area _____________________________________________________________ ii Table 1.1: Circles & Coverage Area _____________________________________________________________ 2 Table 1.2: Sample Mix & Mode of Survey _________________________________________________________ 2 Table 2.1: Parameters and Benchmarks for Basic Telephone Service ___________________________________ 3 Table 2.2: Parameters and Benchmarks for Cellular Mobile Service ____________________________________ 3 Table 2.3: Parameters and Benchmarks for Broadband Service________________________________________ 4 Table 3.1: Dimensions and Variables Used in the Study ______________________________________________ 6 Table 3.2: Sample Size Distribution _____________________________________________________________ 9 Table 3.3: Basic Wire-Line Sample Size __________________________________________________________ 9 Table 3.4: Cellular Sample Size ________________________________________________________________ 9 Table 3.5: Broadband Services Sample Size _____________________________________________________ 10 Table 4.1: Performance Compliance-Basic-Wire line Service (Madhya Pradesh Circle) _____________________ 14 Table 4.2: Provision of Service ________________________________________________________________ 15 Table 4.3: Billing Performance: Post-Paid – Madhya Pradesh circle ____________________________________ 15 Table 4.4: Help Services – Madhya Pradesh circle _________________________________________________ 16 Table 4.5: Network Performance, Reliability and Availability – Madhya Pradesh circle _____________________ 17 Table 4.6: Maintainability – Madhya Pradesh circle ________________________________________________ 17 Table 4.7: Supplementary and Value Added Services – Madhya Pradesh circle __________________________ 18 Table 4.8: Overall Quality of Telephone Service – Madhya Pradesh circle _______________________________ 18 Table 4.9: Performance Compliance-Cellular Service (Madhya Pradesh Circle) __________________________ 19 Table 4.10: Provision of Service -Cellular Service (Madhya Pradesh Circle) ______________________________ 20 Table 4.11: Billing Performance – Pre-Paid -Cellular Service (Madhya Pradesh Circle) ______________________ 20 Table 4.12: Billing Performance – Post-Paid -Cellular Service (Madhya Pradesh Circle) _____________________ 21 Table 4.13: Help Services -Cellular Service (Madhya Pradesh Circle) ___________________________________ 21 Table 4.14: Network Performance, Reliability and Availability -Cellular Service (Madhya Pradesh Circle) ________ 22 Table 4.15: Maintainability -Cellular Service (Madhya Pradesh Circle) ___________________________________ 22 Table 4.16: Supplementary Services and Value Added Services -Cellular Service (Madhya Pradesh Circle) _____ 23 Table 4.17: Mobile Data/Internet Service -Cellular Service (Madhya Pradesh Circle) ________________________ 23 Table 4.18: Wireless / USB / Dongle Service -Cellular Service (Madhya Pradesh Circle) ____________________ 24 Table 4.19: Overall Quality of Telephone Service -Cellular Service (Madhya Pradesh Circle) _________________ 24 Table 4.20: Performance Compliance-Broadband Service (Madhya Pradesh Circle) ________________________ 25 Table 4.21: Provision of Service-Broadband Service (Madhya Pradesh Circle) ____________________________ 26 Table 4.22: Billing Performance: Pre-Paid -Broadband Service (Madhya Pradesh Circle) ____________________ 26 Table 4.23: Billing Performance: Post-Paid-Broadband Service (Madhya Pradesh Circle) ____________________ 27 Table 4.24: Help Services -Broadband Service (Madhya Pradesh Circle) ________________________________ 28 Table 4.25: Network performance, reliability and availability-Broadband Service (Madhya Pradesh Circle) _______ 28 Table 4.26: Maintainability -Broadband Service (Madhya Pradesh Circle) ________________________________ 29 Table 4.27: Supplementary Services -Broadband Service (Madhya Pradesh Circle) ________________________ 30 Table 4.28: Overall Customer Satisfaction -Broadband Service (Madhya Pradesh Circle) ____________________ 30 Table 5.1: Assessment of Telecom Commercial Communications Customer Preference Regulation___________ 31 Table 5.2: Assessment of Telecom Consumer Protection Regulation ___________________________________ 33 Table 5.3: Assessment of Telecom Consumers Complaint Redressal Regulations ________________________ 35 Table 5.4: Satisfaction level with the effectiveness of registration for not receiving/blocking unsolicited calls/SMSs 36
Final Report – West Zone (Madhya Pradesh Circle) Assessment of (i) implementation and effectiveness of various regulations, directions and orders issued by TRAI in the interest of consumers and (ii) Customer Perception of Telecom Service Through Surveys
342852/MCB/ISA/AA/01 01 December 2014 AMC/Projects/342852/Documents/Final Report/West Zone - MP
Table 5.5: Assessment of Telecom Commercial Communications Customer Preference Regulation___________ 37 Table 5.6: Assessment of Telecom Consumer Protection Regulation ___________________________________ 39 Table 5.7: Assessment of Telecommunication Mobile Number Portability Regulations _____________________ 40 Table 5.8: Assessment of Telecom Consumer Complaint Redressal Regulations _________________________ 41 Table 5.9: Assessment Directions Related to Fair Usage Policy and Measurement of Broadband Speed _______ 42 Table 8.1: NPS Output – Madhya Pradesh Basic Wire-Line __________________________________________ 47 Table 8.2: Annova - Overall Quality of Telephone Service ___________________________________________ 47 Table 8.3: Test of Homogeneity of Variances – Overall Quality of Telephone Service ______________________ 48 Table 8.4: Games Howell Multiple Comparisons ___________________________________________________ 48 Table 8.5: SEM Output – Madhya Pradesh Basic Wire-Line __________________________________________ 50 Table 8.6: NPS Output – Madhya Pradesh Cellular Service __________________________________________ 52 Table 8.7: Annova - Overall Quality of Telephone Service ___________________________________________ 53 Table 8.8: Test of Homogeneity of Variances – Overall Quality of Telephone Service ______________________ 53 Table 8.9: Games Howell Multiple Comparisons ___________________________________________________ 53 Table 8.10: SEM Output – Madhya Pradesh Cellular ________________________________________________ 56 Table 8.11: NPS Output – Madhya Pradesh Broadband Line __________________________________________ 58 Table 8.12: Annova - Overall Quality of Telephone Service ___________________________________________ 59 Table 8.13: Test of Homogeneity of Variances – Overall Quality of Telephone Service ______________________ 59 Table 8.14: Games Howell Multiple Comparisons ___________________________________________________ 59 Table 8.15: SEM Output – Madhya Pradesh Broadband _____________________________________________ 62 Table A.1: BSNL - SEM ______________________________________________________________________ 66 Table A.2: Reliance - SEM ___________________________________________________________________ 68 Table A.3: Airtel - SEM ______________________________________________________________________ 70 Table A.4: Tata - SEM _______________________________________________________________________ 72 Table A.5: BSNL - SEM ______________________________________________________________________ 74 Table A.6: Tata - SEM _______________________________________________________________________ 76 Table A.7: Reliance - SEM ___________________________________________________________________ 78 Table A.8: Idea - SEM _______________________________________________________________________ 80 Table A.9: Vodafone - SEM ___________________________________________________________________ 82 Table A.10: Airtel - SEM ______________________________________________________________________ 84 Table A.11: Uninor - SEM _____________________________________________________________________ 86 Table A.12: BSNL - SEM ______________________________________________________________________ 88 Table A.13: Hathway - SEM ___________________________________________________________________ 90 Table A.14: Reliance - SEM ___________________________________________________________________ 92 Table A.15: Tata Communication - SEM __________________________________________________________ 94 Table A.16: Airtel - SEM ______________________________________________________________________ 96 Table A.17: Tata Tele - SEM ___________________________________________________________________ 98 Table A.18: Broadband Pacenet - SEM __________________________________________________________ 100 Table C.1: How satisfied are you with the ease of taking a connection? (EM 3) ____________________________ 111 Table C.2: How satisfied are you with the provision and understanding of all relevant information related to tariff plans
& charges? (EM 1) ________________________________________________________________ 111 Table C.3: How satisfied are you with the availability of suitable plans/recharge vouchers as per your requirement?
(TA 1) __________________________________________________________________________ 111 Table C.4: How satisfied are you with ease of recharging process/activation of vouchers? (EM 4) _____________ 112 Table C.5: How satisfied are you with the availability of recharging cards/vouchers of various denominations?(EC 1)112 Table C.6: How satisfied are you with the transparency of recharge offer/voucher i.e. talk time available on the
recharge card/voucher? (RL 2) _______________________________________________________ 112 Table C.7: How satisfied are you with the charges deducted for every call i.e. amount deducted on every usage? (EC
2) _____________________________________________________________________________ 113
Final Report – West Zone (Madhya Pradesh Circle) Assessment of (i) implementation and effectiveness of various regulations, directions and orders issued by TRAI in the interest of consumers and (ii) Customer Perception of Telecom Service Through Surveys
342852/MCB/ISA/AA/01 01 December 2014 AMC/Projects/342852/Documents/Final Report/West Zone - MP
Table C.8: How satisfied are you with the charges levied per call? (EC2) _________________________________ 113 Table C.9: How satisfied are you with the overall accuracy & completeness of the bills? (RL 1) ________________ 114 Table C.10: How satisfied are you with the clarity of the bills in terms of transparency and understandability? (RL2) 114 Table C.11: How satisfied are you with the availability of customer care services (consumer care number and general
information number)? (EM 5) ________________________________________________________ 114 Table C.12: How satisfied are you with the ease of access to a customer care executive through the IVR menu? (CV1)115 Table C.13: How satisfied are you with the customer friendly approach of the customer care executive? (RL 3) ___ 115 Table C.14: How satisfied are you with the competency level/problem solving ability of the customer care executive?
(AS 1) __________________________________________________________________________ 115 Table C.15: How satisfied are you with the dial tone availability on your phone? (NT 1) ______________________ 116 Table C.16: How satisfied are you with the network of your service provider in terms of ability to make or receive calls
easily? (NT2) ____________________________________________________________________ 116 Table C.17: How satisfied are you with the voice quality on your phone during calls? (NT3) __________________ 117 Table C.18: How satisfied are you with the availability of fault free connection? (RS 2) ______________________ 117 Table C.19: How satisfied are you with the timely repair of faults of your phone connection? (RS 2) ____________ 117 Table C.20: Have you subscribed to any supplementary services like call waiting/forwarding, voice mail / Value added
services? _______________________________________________________________________ 118 Table C.21: If Yes, How satisfied are you with the supplementary services / value added service provided including
activation, deactivation, charges etc? (CV 2) ____________________________________________ 118 Table C.22: Overall Quality of the Telephone Service ________________________________________________ 118 Table C.23: Have you registered your number for not receiving/blocking unsolicited commercial calls / SMSs? ___ 119 Table C.24: If Yes, how satisfied are you with the effectiveness of blocking of unsolicited commercial calls on your
number? ________________________________________________________________________ 119 Table C.25: Have you ever registered a complaint, in case the unsolicited call/SMS have not had not stopped in spite
of registration for the same? _________________________________________________________ 119 Table C.26: If Yes, how satisfied are you with the ease of lodging the complaint? __________________________ 120 Table C.27: If Yes, how satisfied are you with the action taken on your complaint? _________________________ 120 Table C.28: Have you made any complaint to the toll free Consumer Care Number? ________________________ 120 Table C.29: If yes, how satisfied are you with the manner in which your complaint was addressed to such as intimation
of docket number and likely time for redressal of complaint, intimation of action taken on the complaint?121 Table C.30: Have you filed any appeal with the appellate authority? _____________________________________ 121 Table C.31: If yes, how satisfied are you with the manner in which your appeal was addressed to such as
acknowledgement of appeal, intimation of decision taken etc..? _____________________________ 122 Table C.32: How satisfied are you with the ease of taking a connection? (EM 3) ___________________________ 122 Table C.33: How satisfied are you with the provision and understanding of all relevant information related to tariff plans
& charges? (EM 1) ________________________________________________________________ 122 Table C.34: How satisfied are you with the availability of suitable plans/recharge vouchers as per your requirement?
(TA 1) __________________________________________________________________________ 123 Table C.35: How satisfied are you with ease of recharging process/activation of vouchers? (EM 4) ____________ 123 Table C.36:How satisfied are you with the availability of recharging cards/vouchers of various denominations?(EC 1)124 Table C.37: How satisfied are you with the transparency of recharge offer/voucher i.e. talk time available on the
recharge card/voucher? (RL 2) _______________________________________________________ 124 Table C.38: How satisfied are you with the charges deducted for every call i.e. amount deducted on every usage? (EC
2) _____________________________________________________________________________ 125 Table C.39: How satisfied are you with the charges levied per call? (EC2 ________________________________ 125 Table C.40: How satisfied are you with the overall accuracy & completeness of the bills? (RL 1) _______________ 126 Table C.41: How satisfied are you with the clarity of the bills in terms of transparency and understandability? (RL2) 126 Table C.42: How satisfied are you with the availability of customer care services (consumer care number and general
information number)? (EM 5) ________________________________________________________ 127 Table C.43: How satisfied are you with the ease of access to a customer care executive through the IVR menu? (CV1)127
Final Report – West Zone (Madhya Pradesh Circle) Assessment of (i) implementation and effectiveness of various regulations, directions and orders issued by TRAI in the interest of consumers and (ii) Customer Perception of Telecom Service Through Surveys
342852/MCB/ISA/AA/01 01 December 2014 AMC/Projects/342852/Documents/Final Report/West Zone - MP
Table C.44: How satisfied are you with the customer friendly approach of the customer care executive? (RL 3) ___ 128 Table C.45: How satisfied are you with the competency level/problem solving ability of the customer care executive?
(AS 1) __________________________________________________________________________ 128 Table C.46: How satisfied are you with the availability of signal of your service provider? (NT 1) _______________ 129 Table C.47: How satisfied are you with the network of your service provider in terms of ability to make or receive calls
easily? (NT2) ____________________________________________________________________ 129 Table C.48: How satisfied are you with the voice quality on your phone during calls? (NT3) __________________ 130 Table C.49: How satisfied are you with the availability of fault free connection? (RS 2) ______________________ 130 Table C.50: How satisfied are you with the timely repair of faults of your phone connection? (RS 2) ____________ 131 Table C.51: Have you subscribed to any supplementary services like call waiting/forwarding, voice mail / Value added
services? (CV 1) __________________________________________________________________ 131 Table C.52: If Yes, How satisfied are you with the supplementary services / value added service provided including
activation, deactivation, charges etc.? (CV 2) ___________________________________________ 132 Table C.53: Do you use Mobile data/internet services offered by your operator on your mobile device? (CV 3)____ 132 Table C.54: If Yes, How satisfied are you with speed of data connection? (CV 4) __________________________ 133 Table C.55: Do you use a wireless USB dongle device (For e.g. Tata Photon, etc.) for accessing internet? ______ 133 Table C.56: If Yes, How satisfied are you with coverage and availability of internet connection on your wireless USB
dongle device? ___________________________________________________________________ 134 Table C.57: Overall Quality of the Telephone Service ________________________________________________ 134 Table C.58: Have you registered your number for not receiving/blocking unsolicited commercial calls / SMSs? ___ 135 Table C.59: If Yes, how satisfied are you with the effectiveness of blocking of unsolicited commercial calls on your
number? ________________________________________________________________________ 135 Table C.60: Have you ever registered a complaint, in case the unsolicited call/SMS have not had not stopped in spite
of registration for the same? _________________________________________________________ 136 Table C.61: If Yes, how satisfied are you with the ease of lodging the complaint? __________________________ 136 Table C.62: If Yes, how satisfied are you with the action taken on your complaint? _________________________ 137 Table C.63: Have you made any complaint to the toll free Consumer Care Number? ________________________ 137 Table C.64: If yes, how satisfied are you with the manner in which your complaint was addressed to such as intimation
of docket number and likely time for redressal of complaint, intimation of action taken on the complaint?138 Table C.65: Have you filed any appeal with the appellate authority? _____________________________________ 138 Table C.66: If yes, how satisfied are you with the manner in which your appeal was addressed to such as
acknowledgement of appeal, intimation of decision taken etc..? _____________________________ 139 Table C.67: How satisfied are you with the ease of taking a connection? (EM 3) ___________________________ 139 Table C.68: How satisfied are you with the provision and understanding of all relevant information related to tariff plans
& charges? (EM 1) ________________________________________________________________ 140 Table C.69: How satisfied are you with the availability of suitable plans/recharge vouchers as per your requirement?
(TA 1) __________________________________________________________________________ 140 Table C.70: How satisfied are you with ease of recharging process/activation of vouchers? (EM 4) ____________ 141 Table C.71: How satisfied are you with the availability of recharging cards/vouchers of various denominations?(EC 1)141 Table C.72: How satisfied are you with the transparency of recharge offer/voucher i.e. internet usage available on the
recharge card? (RL 2) _____________________________________________________________ 142 Table C.73: How satisfied are you with the charges deducted for internet usage? (EC 2) ____________________ 142 Table C.74: How satisfied are you with the charges levied for every internet usage? (EC2) ___________________ 143 Table C.75: How satisfied are you with the overall accuracy & completeness of the bills? (RL 1) _______________ 143 Table C.76: How satisfied are you with the clarity of the bills in terms of transparency and understandability? (RL2) 144 Table C.77: How satisfied are you with the availability of customer care services (consumer care number and general
information number)? (EM 5) ________________________________________________________ 144 Table C.78: How satisfied are you with the ease of access to a customer care executive through the IVR menu? (CV1)145 Table C.79: How satisfied are you with the customer friendly approach of the customer care executive? (RL 3) ___ 145 Table C.80: How satisfied are you with the competency level/problem solving ability of the customer care executive?
Final Report – West Zone (Madhya Pradesh Circle) Assessment of (i) implementation and effectiveness of various regulations, directions and orders issued by TRAI in the interest of consumers and (ii) Customer Perception of Telecom Service Through Surveys
342852/MCB/ISA/AA/01 01 December 2014 AMC/Projects/342852/Documents/Final Report/West Zone - MP
(AS 1) __________________________________________________________________________ 146 Table C.81: How satisfied are you with the availability of signal of your service provider? (NT 1) _______________ 146 Table C.82: How satisfied are you with the network of your service provider in terms speed of broadband connection?
(NT2) __________________________________________________________________________ 147 Table C.83: How satisfied are you with the time for which service is up and working? (NT3) __________________ 147 Table C.84: How satisfied are you with the timely repair of faults of your phone connection? (RS 2) ____________ 148 Table C.85: Have you subscribed to any supplementary services such as Static/fixed IP addresses, e-mail id’s etc.?148 Table C.86: If Yes, How satisfied are you with the supplementary services / value added service provided including
activation, deactivation, charges etc? (CV 2) ____________________________________________ 149 Table C.87: Overall Quality of the Telephone Service ________________________________________________ 149 Table C.88: Have you made any complaint to the toll free Consumer Care Number? ________________________ 150 Table C.89: If yes, how satisfied are you with the manner in which your complaint was addressed to such as intimation
of docket number and likely time for redressal of complaint, intimation of action taken on the complaint?150 Table C.90: Have you filed any appeal with the appellate authority? _____________________________________ 151 Table C.91: If yes, how satisfied are you with the manner in which your appeal was addressed to such as
acknowledgement of appeal, intimation of decision taken etc..? _____________________________ 151 Table C.92: How satisfied are you with the information, provided by your service provider under the fair usage policy
(FUP) such as data usage limit with higher speed and speed of connection up to or beyond data usage limit? ___________________________________________________________________________ 152
Table C.93: How satisfied are you with the facility to measure the broadband connection speed provided by your service provider? _________________________________________________________________ 152
Figures
Figure 3.1: Gender Mix _______________________________________________________________________ 10 Figure 3.2: Age Group Mix ____________________________________________________________________ 10 Figure 3.3: Occupation & Sample size ___________________________________________________________ 11 Figure 3.4: Income Group & Sample size _________________________________________________________ 11 Figure 3.5: Usage Type & Sample size __________________________________________________________ 12 Figure 3.6: Connection Type & Sample size ______________________________________________________ 13 Figure 8.1: SEM Output – Madhya Pradesh Basic Wire-Line __________________________________________ 49 Figure 8.2: SEM Output – Madhya Pradesh Cellular ________________________________________________ 55 Figure 8.3: SEM Output – Madhya Pradesh Broadband _____________________________________________ 61 Figure A.1: BSNL - SEM ______________________________________________________________________ 65 Figure A.2: Reliance - SEM ___________________________________________________________________ 67 Figure A.3: Airtel - SEM ______________________________________________________________________ 69 Figure A.4: Tata - SEM _______________________________________________________________________ 71 Figure A.5: BSNL - SEM ______________________________________________________________________ 73 Figure A.6: Tata - SEM _______________________________________________________________________ 75 Figure A.7: Reliance - SEM ___________________________________________________________________ 77 Figure A.8: IDEA - SEM ______________________________________________________________________ 79 Figure A.9: Vodafone - SEM ___________________________________________________________________ 81 Figure A.10: Airtel - SEM ______________________________________________________________________ 83 Figure A.11: Videocon – SEM ___________________________________________________________________ 85 Figure A.12: BSNL - SEM ______________________________________________________________________ 87 Figure A.13: Hathway – SEM ___________________________________________________________________ 89 Figure A.14: Reliance – SEM ___________________________________________________________________ 91 Figure A.15: Tata Communication– SEM __________________________________________________________ 93 Figure A.16: Airtel – SEM ______________________________________________________________________ 95 Figure A.17: Tata Tele – SEM __________________________________________________________________ 97
Final Report – West Zone (Madhya Pradesh Circle) Assessment of (i) implementation and effectiveness of various regulations, directions and orders issued by TRAI in the interest of consumers and (ii) Customer Perception of Telecom Service Through Surveys
342852/MCB/ISA/AA/01 01 December 2014 AMC/Projects/342852/Documents/Final Report/West Zone - MP
Figure A.18: Broadband Pacenet – SEM __________________________________________________________ 99
Final Report – West Zone (Madhya Pradesh Circle) Assessment of (i) implementation and effectiveness of various regulations, directions and orders issued by TRAI in the interest of consumers and (ii) Customer Perception of Telecom Service Through Surveys
i 342852/MCB/ISA/AA/01 342852/MCB/ISA/AA/01 01 December 2014 AMC/Projects/342852/Documents/Final Report/West Zone - MP
Telecom Regulatory Authority of India, vide the Standards of Quality of Service of Basic Telephone Service
(Wireline) and Cellular Mobile Telephone Service Regulations, 2009 (7 of 2009) dated the 20th March,
2009, published in the Gazette of India Extraordinary Part-III Section 4 dated 23rd March, 2009, has laid
down the ‘Quality of Service' parameters applicable to the Basic telephone service (Wireline) and cellular
mobile telephone service. These regulations are applicable to all the Basic Service Operators/ Unified
Access Service Providers and Cellular Mobile Telephone Service providers, including BSNL and MTNL
Regulation No. 7 of the Standards of Quality of Service of Basic Telephone Service (Wireline) and Cellular
Mobile Telephone Service Regulations, 2009 (7 of 2009) dated 20th March, 2009 and Sl. No. (ix) under
regulation 3 of Quality of Service of Broadband Service Regulations, 2006 (11 of 2006) dated the 6th
October 2006, have laid down the benchmarks for the parameter on customer perception of service to be
achieved by service providers. The customer perception of service is to be assessed through customer
satisfaction survey.
Telecom Regulatory Authority of India (TRAI) vide letter 304-10/2014-QoS dated 28th May 2014 has given
a provisional extension to Mott MacDonald to carry out assessment of
implementation and effectiveness of various regulations, directions and orders issued by TRAI
Telecom Regulatory Authority of India had from time to time issued a number of regulations, directions and
orders in the interest of the consumers. The survey has assessed the implementation and effectiveness of
these regulations, directions and orders, the details of which are as under
– The Telecom Commercial Communications Customer Preference Regulations, 2010
– Quality Of Service Of Broadband Service Regulations, 2006
– Telecom Consumers Protection Regulations, 2012
– Telecom Consumers Complaint Redressal Regulations, 2012
– The Standards Of Quality Of Service Of Basic Telephone Service (Wire-line) And Cellular Mobile
Telephone Service Regulations, 2009
– Telecommunication Mobile Number Portability Per Port Transaction Charge And Dipping Charge
Regulations, 2009
Customer perception of service provider through surveys in West Zone. The West Zone comprises of 4
Circles – Gujarat, Madhya Pradesh / Chhattisgarh, Mumbai, Maharashtra / Goa (excluding Mumbai).
– The basic objective of the consumer perception survey was to gauge the subscriber feedback on
Quality of Services by way of primary survey and comparing them with quality of service
benchmarks stipulated by Telecom Regulatory Authority of India.
– The West Zone comprises of 4 Circles – Gujarat, Madhya Pradesh / Chhattisgarh, Mumbai,
Maharashtra / Goa (excluding Mumbai). This report presents the results of the survey conducted
for the Madhya Pradesh Circle.
Preface
Final Report – West Zone (Madhya Pradesh Circle) Assessment of (i) implementation and effectiveness of various regulations, directions and orders issued by TRAI in the interest of consumers and (ii) Customer Perception of Telecom Service Through Surveys
ii 342852/MCB/ISA/AA/01 342852/MCB/ISA/AA/01 01 December 2014 AMC/Projects/342852/Documents/Final Report/West Zone - MP
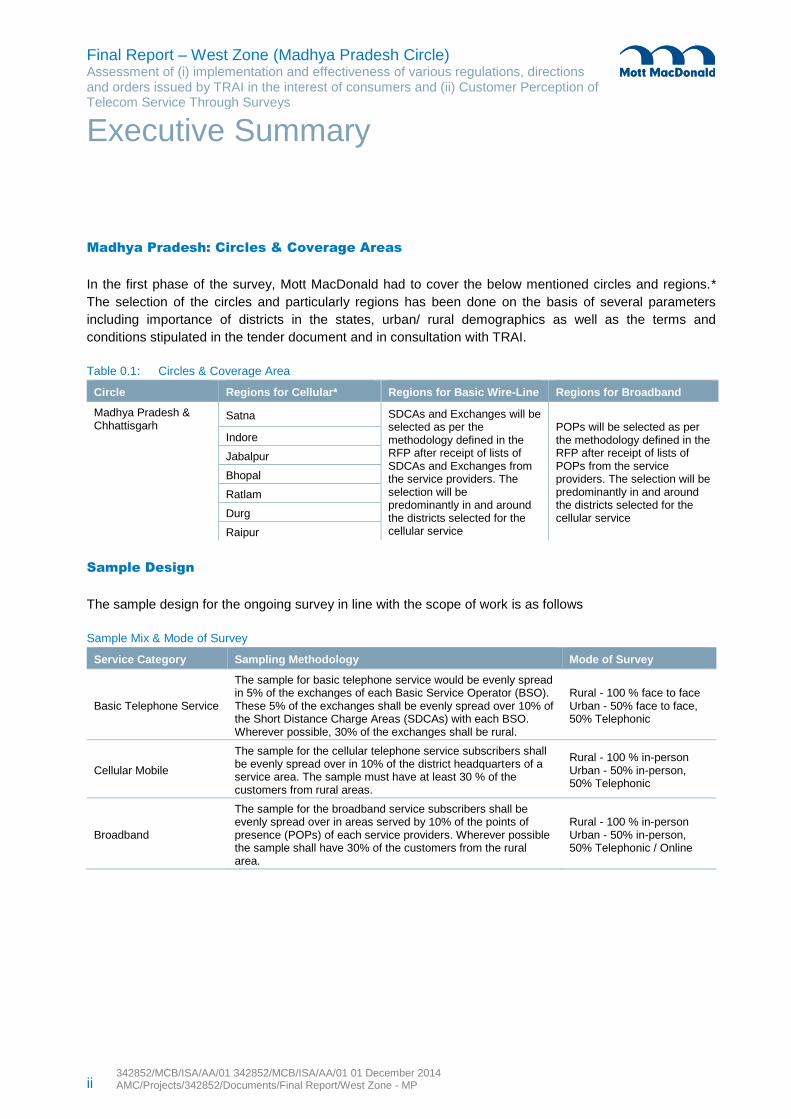
Madhya Pradesh: Circles & Coverage Areas
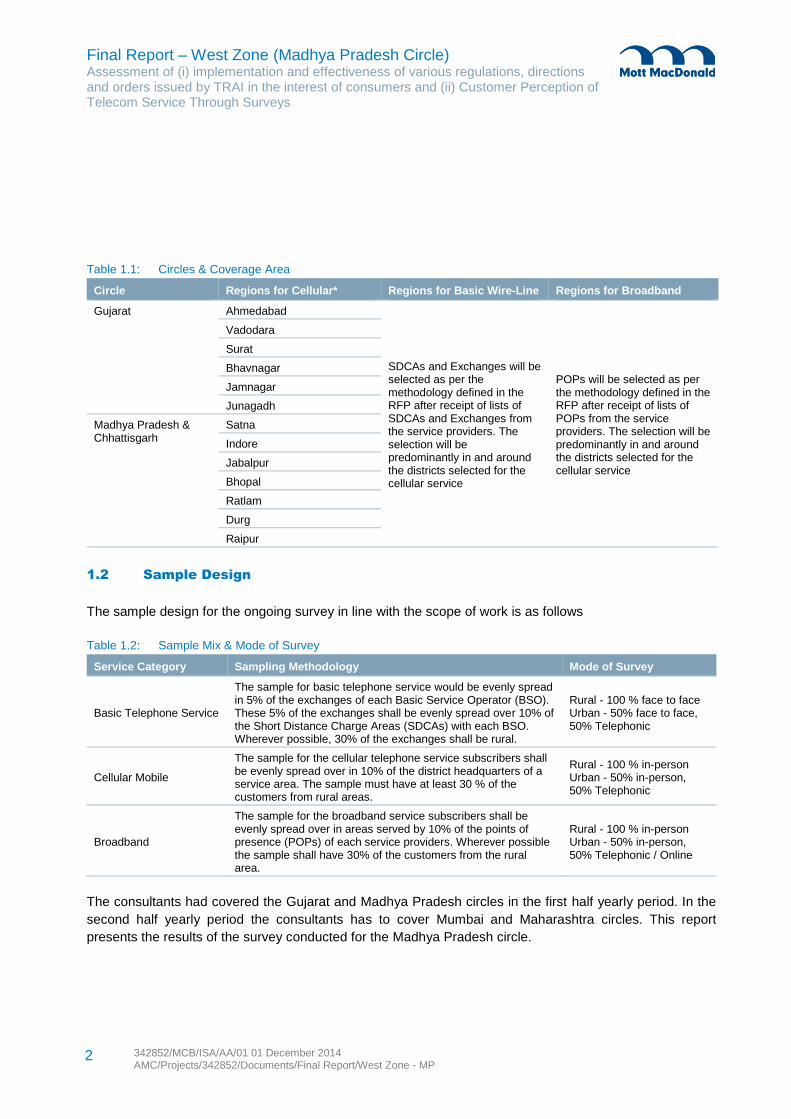
In the first phase of the survey, Mott MacDonald had to cover the below mentioned circles and regions.*
The selection of the circles and particularly regions has been done on the basis of several parameters
including importance of districts in the states, urban/ rural demographics as well as the terms and
conditions stipulated in the tender document and in consultation with TRAI.
Table 0.1: Circles & Coverage Area
Circle Regions for Cellular* Regions for Basic Wire-Line Regions for Broadband
Madhya Pradesh & Chhattisgarh
Satna SDCAs and Exchanges will be selected as per the methodology defined in the RFP after receipt of lists of SDCAs and Exchanges from the service providers. The selection will be predominantly in and around the districts selected for the cellular service
POPs will be selected as per the methodology defined in the RFP after receipt of lists of POPs from the service providers. The selection will be predominantly in and around the districts selected for the cellular service
Indore
Jabalpur
Bhopal
Ratlam
Durg
Raipur
Sample Design
The sample design for the ongoing survey in line with the scope of work is as follows
Sample Mix & Mode of Survey
Service Category Sampling Methodology Mode of Survey
Basic Telephone Service
The sample for basic telephone service would be evenly spread in 5% of the exchanges of each Basic Service Operator (BSO). These 5% of the exchanges shall be evenly spread over 10% of the Short Distance Charge Areas (SDCAs) with each BSO. Wherever possible, 30% of the exchanges shall be rural.
Rural - 100 % face to face Urban - 50% face to face, 50% Telephonic
Cellular Mobile
The sample for the cellular telephone service subscribers shall be evenly spread over in 10% of the district headquarters of a service area. The sample must have at least 30 % of the customers from rural areas.
Rural - 100 % in-person Urban - 50% in-person, 50% Telephonic
Broadband
The sample for the broadband service subscribers shall be evenly spread over in areas served by 10% of the points of presence (POPs) of each service providers. Wherever possible the sample shall have 30% of the customers from the rural area.
Rural - 100 % in-person Urban - 50% in-person, 50% Telephonic / Online
Executive Summary
Final Report – West Zone (Madhya Pradesh Circle) Assessment of (i) implementation and effectiveness of various regulations, directions and orders issued by TRAI in the interest of consumers and (ii) Customer Perception of Telecom Service Through Surveys
iii 342852/MCB/ISA/AA/01 342852/MCB/ISA/AA/01 01 December 2014 AMC/Projects/342852/Documents/Final Report/West Zone - MP
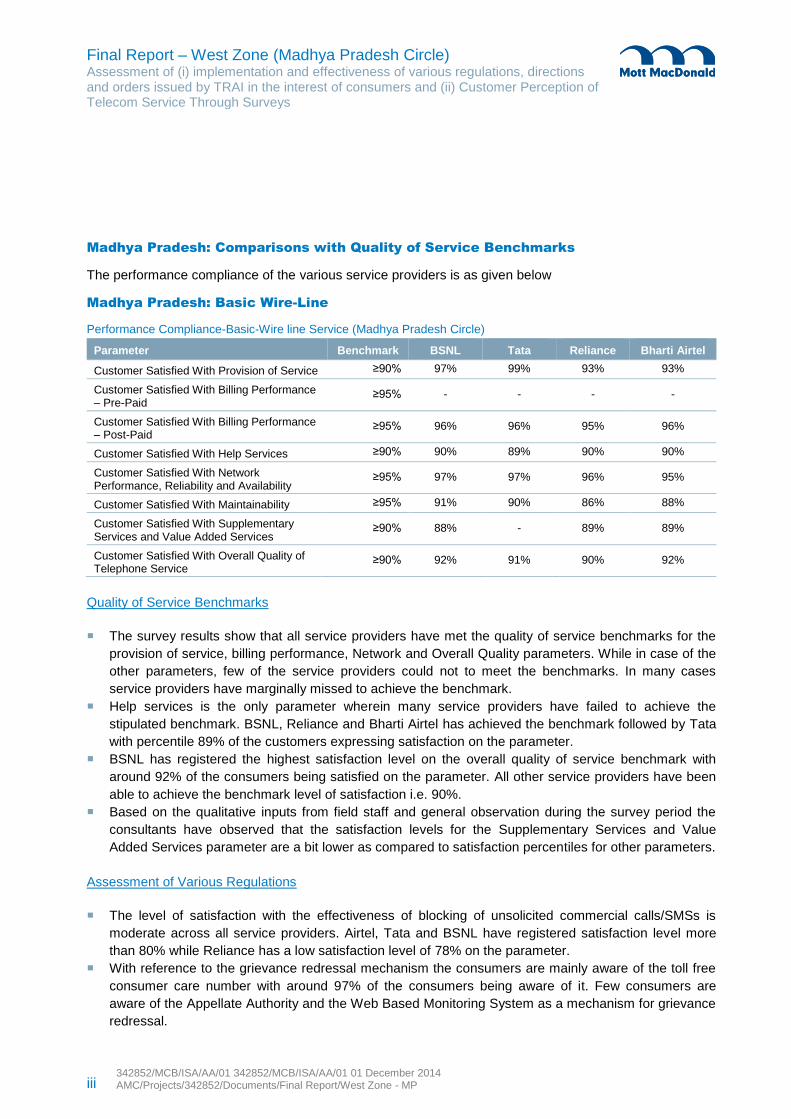
Madhya Pradesh: Comparisons with Quality of Service Benchmarks
The performance compliance of the various service providers is as given below
Madhya Pradesh: Basic Wire-Line
Performance Compliance-Basic-Wire line Service (Madhya Pradesh Circle)
Parameter Benchmark BSNL Tata Reliance Bharti Airtel
Customer Satisfied With Provision of Service ≥90% 97% 99% 93% 93%
Customer Satisfied With Billing Performance – Pre-Paid
≥95% - - - -
Customer Satisfied With Billing Performance – Post-Paid
≥95% 96% 96% 95% 96%
Customer Satisfied With Help Services ≥90% 90% 89% 90% 90%
Customer Satisfied With Network Performance, Reliability and Availability
≥95% 97% 97% 96% 95%
Customer Satisfied With Maintainability ≥95% 91% 90% 86% 88%
Customer Satisfied With Supplementary Services and Value Added Services
≥90% 88% - 89% 89%
Customer Satisfied With Overall Quality of Telephone Service
≥90% 92% 91% 90% 92%
Quality of Service Benchmarks
The survey results show that all service providers have met the quality of service benchmarks for the
provision of service, billing performance, Network and Overall Quality parameters. While in case of the
other parameters, few of the service providers could not to meet the benchmarks. In many cases
service providers have marginally missed to achieve the benchmark.
Help services is the only parameter wherein many service providers have failed to achieve the
stipulated benchmark. BSNL, Reliance and Bharti Airtel has achieved the benchmark followed by Tata
with percentile 89% of the customers expressing satisfaction on the parameter.
BSNL has registered the highest satisfaction level on the overall quality of service benchmark with
around 92% of the consumers being satisfied on the parameter. All other service providers have been
able to achieve the benchmark level of satisfaction i.e. 90%.
Based on the qualitative inputs from field staff and general observation during the survey period the
consultants have observed that the satisfaction levels for the Supplementary Services and Value
Added Services parameter are a bit lower as compared to satisfaction percentiles for other parameters.
Assessment of Various Regulations
The level of satisfaction with the effectiveness of blocking of unsolicited commercial calls/SMSs is
moderate across all service providers. Airtel, Tata and BSNL have registered satisfaction level more
than 80% while Reliance has a low satisfaction level of 78% on the parameter.
With reference to the grievance redressal mechanism the consumers are mainly aware of the toll free
consumer care number with around 97% of the consumers being aware of it. Few consumers are
aware of the Appellate Authority and the Web Based Monitoring System as a mechanism for grievance
redressal.
Final Report – West Zone (Madhya Pradesh Circle) Assessment of (i) implementation and effectiveness of various regulations, directions and orders issued by TRAI in the interest of consumers and (ii) Customer Perception of Telecom Service Through Surveys
iv 342852/MCB/ISA/AA/01 342852/MCB/ISA/AA/01 01 December 2014 AMC/Projects/342852/Documents/Final Report/West Zone - MP
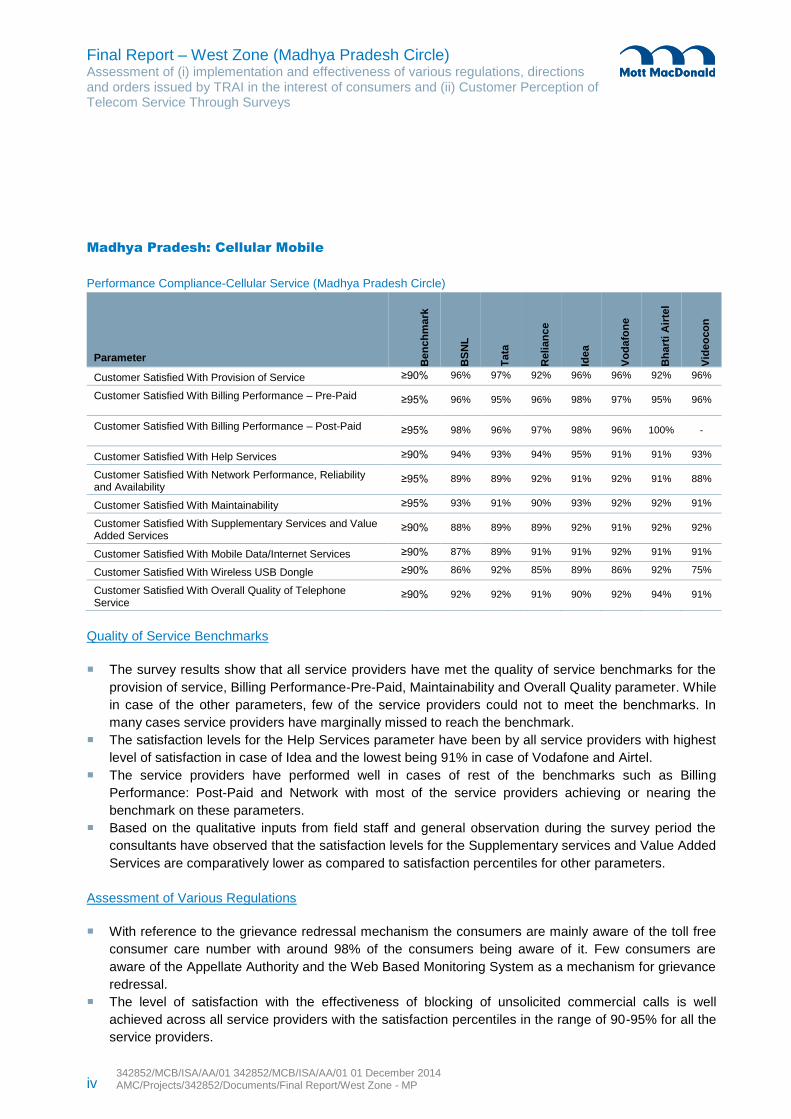
Madhya Pradesh: Cellular Mobile
Performance Compliance-Cellular Service (Madhya Pradesh Circle)
Parameter
Ben
ch
mark
BS
NL
Ta
ta
Reli
an
ce
Ide
a
Vo
da
fon
e
Bh
art
i A
irte
l
Vid
eo
co
n
Customer Satisfied With Provision of Service ≥90% 96% 97% 92% 96% 96% 92% 96%
Customer Satisfied With Billing Performance – Pre-Paid ≥95% 96% 95% 96% 98% 97% 95% 96%
Customer Satisfied With Billing Performance – Post-Paid ≥95% 98% 96% 97% 98% 96% 100% -
Customer Satisfied With Help Services ≥90% 94% 93% 94% 95% 91% 91% 93%
Customer Satisfied With Network Performance, Reliability and Availability
≥95% 89% 89% 92% 91% 92% 91% 88%
Customer Satisfied With Maintainability ≥95% 93% 91% 90% 93% 92% 92% 91%
Customer Satisfied With Supplementary Services and Value Added Services
≥90% 88% 89% 89% 92% 91% 92% 92%
Customer Satisfied With Mobile Data/Internet Services ≥90% 87% 89% 91% 91% 92% 91% 91%
Customer Satisfied With Wireless USB Dongle ≥90% 86% 92% 85% 89% 86% 92% 75%
Customer Satisfied With Overall Quality of Telephone Service
≥90% 92% 92% 91% 90% 92% 94% 91%
Quality of Service Benchmarks
The survey results show that all service providers have met the quality of service benchmarks for the
provision of service, Billing Performance-Pre-Paid, Maintainability and Overall Quality parameter. While
in case of the other parameters, few of the service providers could not to meet the benchmarks. In
many cases service providers have marginally missed to reach the benchmark.
The satisfaction levels for the Help Services parameter have been by all service providers with highest
level of satisfaction in case of Idea and the lowest being 91% in case of Vodafone and Airtel.
The service providers have performed well in cases of rest of the benchmarks such as Billing
Performance: Post-Paid and Network with most of the service providers achieving or nearing the
benchmark on these parameters.
Based on the qualitative inputs from field staff and general observation during the survey period the
consultants have observed that the satisfaction levels for the Supplementary services and Value Added
Services are comparatively lower as compared to satisfaction percentiles for other parameters.
Assessment of Various Regulations
With reference to the grievance redressal mechanism the consumers are mainly aware of the toll free
consumer care number with around 98% of the consumers being aware of it. Few consumers are
aware of the Appellate Authority and the Web Based Monitoring System as a mechanism for grievance
redressal.
The level of satisfaction with the effectiveness of blocking of unsolicited commercial calls is well
achieved across all service providers with the satisfaction percentiles in the range of 90-95% for all the
service providers.
Final Report – West Zone (Madhya Pradesh Circle) Assessment of (i) implementation and effectiveness of various regulations, directions and orders issued by TRAI in the interest of consumers and (ii) Customer Perception of Telecom Service Through Surveys
v 342852/MCB/ISA/AA/01 342852/MCB/ISA/AA/01 01 December 2014 AMC/Projects/342852/Documents/Final Report/West Zone - MP
Very few pre-paid customers (less than 5%) have requested for an item-wise usage bill for their
connection. Based on the qualitative inputs from field staff the consultants have observed that the
awareness amongst the pre-paid customer with reference to this option with them is quite low.
Number portability is observed highest in case of Vodafone followed by Idea and Reliance.
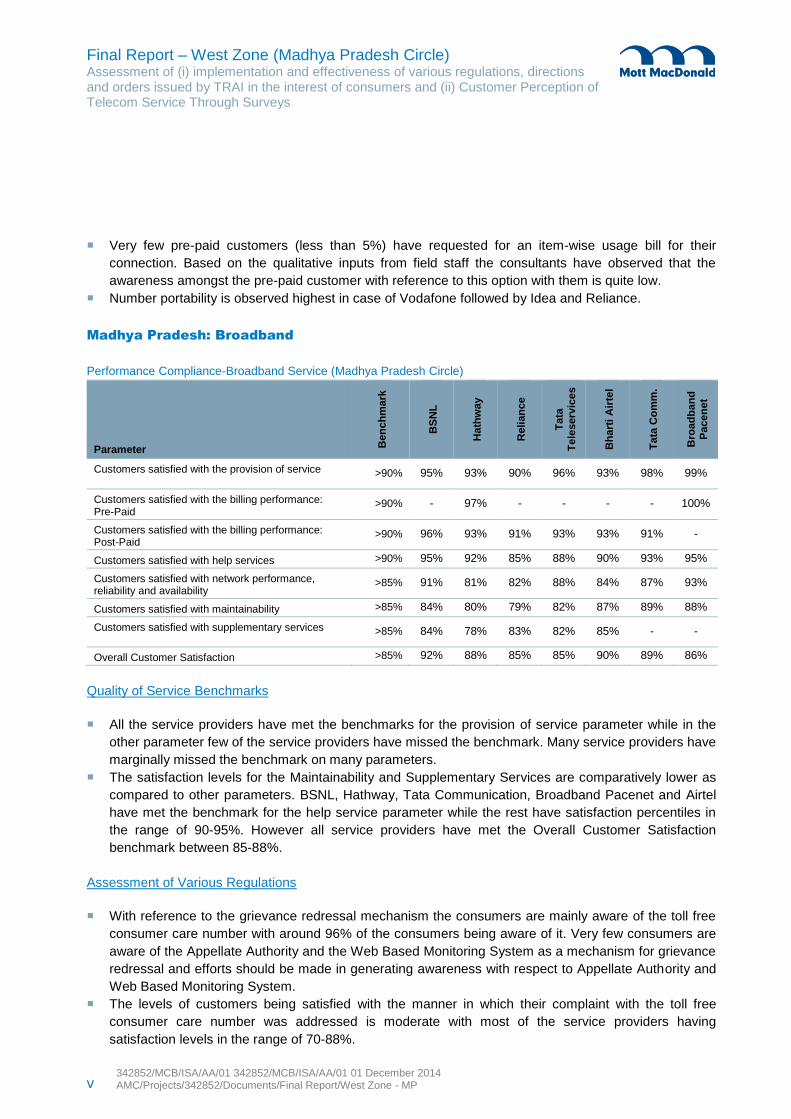
Madhya Pradesh: Broadband
Performance Compliance-Broadband Service (Madhya Pradesh Circle)
Parameter Ben
ch
mark
BS
NL
Hath
way
Reli
an
ce
Ta
ta
Te
leserv
ices
Bh
art
i A
irte
l
Ta
ta C
om
m.
Bro
ad
ban
d
Pacen
et
Customers satisfied with the provision of service >90% 95% 93% 90% 96% 93% 98% 99%
Customers satisfied with the billing performance: Pre-Paid
>90% - 97% - - - - 100%
Customers satisfied with the billing performance: Post-Paid
>90% 96% 93% 91% 93% 93% 91% -
Customers satisfied with help services >90% 95% 92% 85% 88% 90% 93% 95%
Customers satisfied with network performance, reliability and availability
>85% 91% 81% 82% 88% 84% 87% 93%
Customers satisfied with maintainability >85% 84% 80% 79% 82% 87% 89% 88%
Customers satisfied with supplementary services >85% 84% 78% 83% 82% 85% - -
Overall Customer Satisfaction >85% 92% 88% 85% 85% 90% 89% 86%
Quality of Service Benchmarks
All the service providers have met the benchmarks for the provision of service parameter while in the
other parameter few of the service providers have missed the benchmark. Many service providers have
marginally missed the benchmark on many parameters.
The satisfaction levels for the Maintainability and Supplementary Services are comparatively lower as
compared to other parameters. BSNL, Hathway, Tata Communication, Broadband Pacenet and Airtel
have met the benchmark for the help service parameter while the rest have satisfaction percentiles in
the range of 90-95%. However all service providers have met the Overall Customer Satisfaction
benchmark between 85-88%.
Assessment of Various Regulations
With reference to the grievance redressal mechanism the consumers are mainly aware of the toll free
consumer care number with around 96% of the consumers being aware of it. Very few consumers are
aware of the Appellate Authority and the Web Based Monitoring System as a mechanism for grievance
redressal and efforts should be made in generating awareness with respect to Appellate Authority and
Web Based Monitoring System.
The levels of customers being satisfied with the manner in which their complaint with the toll free
consumer care number was addressed is moderate with most of the service providers having
satisfaction levels in the range of 70-88%.
Final Report – West Zone (Madhya Pradesh Circle) Assessment of (i) implementation and effectiveness of various regulations, directions and orders issued by TRAI in the interest of consumers and (ii) Customer Perception of Telecom Service Through Surveys
vi 342852/MCB/ISA/AA/01 342852/MCB/ISA/AA/01 01 December 2014 AMC/Projects/342852/Documents/Final Report/West Zone - MP
Customer satisfaction levels with respect to the information provided by the service provider under the
fair usage policy (FUP) and the facility to measure the broadband connection speed provided by the
service provider is more than 80% in case of all the service providers.
The key conclusions and recommendations on the basis of the survey conducted across all service
categories and active service providers in the Madhya Pradesh circle in the West Zone are listed as under.
Final Report – West Zone (Madhya Pradesh Circle) Assessment of (i) implementation and effectiveness of various regulations, directions and orders issued by TRAI in the interest of consumers and (ii) Customer Perception of Telecom Service Through Surveys
vii 342852/MCB/ISA/AA/01 342852/MCB/ISA/AA/01 01 December 2014 AMC/Projects/342852/Documents/Final Report/West Zone - MP
Part – A: QoS Benchmark & Assessment of Regulations
Final Report – West Zone (Madhya Pradesh Circle) Assessment of (i) implementation and effectiveness of various regulations, directions and orders issued by TRAI in the interest of consumers and (ii) Customer Perception of Telecom Service Through Surveys
342852/MCB/ISA/AA/01 01 December 2014 AMC/Projects/342852/Documents/Final Report/West Zone - MP
1
Telecom Regulatory Authority of India, vide the Standards of Quality of Service of Basic Telephone Service
(Wireline) and Cellular Mobile Telephone Service Regulations, 2009 (7 of 2009) dated the 20th March,
2009, published in the Gazette of India Extraordinary Part-III Section 4 dated 23rd March, 2009, has laid
down the ‘Quality of Service' parameters applicable to the Basic telephone service (Wireline) and cellular
mobile telephone service. These regulations are applicable to all the Basic Service Operators/ Unified
Access Service Providers and Cellular Mobile Telephone Service providers, including BSNL and MTNL
Regulation No. 7 of the Standards of Quality of Service of Basic Telephone Service (Wireline) and Cellular
Mobile Telephone Service Regulations, 2009 (7 of 2009) dated 20th March, 2009 and Sl. No. (ix) under
regulation 3 of Quality of Service of Broadband Service Regulations, 2006 (11 of 2006) dated the 6th
October 2006, have laid down the benchmarks for the parameter on customer perception of service to be
achieved by service providers. The customer perception of service is to be assessed through customer
satisfaction survey.
Telecom Regulatory Authority of India (TRAI) vide letter 304-10/2014-QoS dated 28th May 2014 has given
a provisional extension to Mott MacDonald to carry out assessment of
implementation and effectiveness of various regulations, directions and orders issued by TRAI
Telecom Regulatory Authority of India had from time to time issued a number of regulations, directions and
orders in the interest of the consumers. The survey has assessed the implementation and effectiveness of
these regulations, directions and orders, the details of which are as under
– The Telecom Commercial Communications Customer Preference Regulations, 2010
– Quality Of Service Of Broadband Service Regulations, 2006
– Telecom Consumers Protection Regulations, 2012
– Telecom Consumers Complaint Redressal Regulations, 2012
– The Standards Of Quality Of Service Of Basic Telephone Service (Wire-line) And Cellular Mobile
Telephone Service Regulations, 2009
– Telecommunication Mobile Number Portability Per Port Transaction Charge And Dipping Charge
Regulations, 2009
Customer perception of service provider through surveys in West Zone. The West Zone comprises of 4
Circles – Gujarat, Madhya Pradesh / Chhattisgarh, Mumbai, Maharashtra / Goa (excluding Mumbai).
– The basic objective of the consumer perception survey was to gauge the subscriber feedback on
Quality of Services by way of primary survey and comparing them with quality of service
benchmarks stipulated by Telecom Regulatory Authority of India.
1.1 Circles & Coverage Areas
In the first phase of the survey, Mott MacDonald had to cover the below mentioned circles and regions.*
The selection of the circles and particularly regions has been done on the basis of several parameters
including importance of districts in the states, urban/ rural demographics as well as the terms and
conditions stipulated in the tender document and in consultation with TRAI.
1 Introduction
Final Report – West Zone (Madhya Pradesh Circle) Assessment of (i) implementation and effectiveness of various regulations, directions and orders issued by TRAI in the interest of consumers and (ii) Customer Perception of Telecom Service Through Surveys
342852/MCB/ISA/AA/01 01 December 2014 AMC/Projects/342852/Documents/Final Report/West Zone - MP
2
Table 1.1: Circles & Coverage Area
Circle Regions for Cellular* Regions for Basic Wire-Line Regions for Broadband
Gujarat Ahmedabad
SDCAs and Exchanges will be selected as per the methodology defined in the RFP after receipt of lists of SDCAs and Exchanges from the service providers. The selection will be predominantly in and around the districts selected for the cellular service
POPs will be selected as per the methodology defined in the RFP after receipt of lists of POPs from the service providers. The selection will be predominantly in and around the districts selected for the cellular service
Vadodara
Surat
Bhavnagar
Jamnagar
Junagadh
Madhya Pradesh & Chhattisgarh
Satna
Indore
Jabalpur
Bhopal
Ratlam
Durg
Raipur
1.2 Sample Design
The sample design for the ongoing survey in line with the scope of work is as follows
Table 1.2: Sample Mix & Mode of Survey
Service Category Sampling Methodology Mode of Survey
Basic Telephone Service
The sample for basic telephone service would be evenly spread in 5% of the exchanges of each Basic Service Operator (BSO). These 5% of the exchanges shall be evenly spread over 10% of the Short Distance Charge Areas (SDCAs) with each BSO. Wherever possible, 30% of the exchanges shall be rural.
Rural - 100 % face to face Urban - 50% face to face, 50% Telephonic
Cellular Mobile
The sample for the cellular telephone service subscribers shall be evenly spread over in 10% of the district headquarters of a service area. The sample must have at least 30 % of the customers from rural areas.
Rural - 100 % in-person Urban - 50% in-person, 50% Telephonic
Broadband
The sample for the broadband service subscribers shall be evenly spread over in areas served by 10% of the points of presence (POPs) of each service providers. Wherever possible the sample shall have 30% of the customers from the rural area.
Rural - 100 % in-person Urban - 50% in-person, 50% Telephonic / Online
The consultants had covered the Gujarat and Madhya Pradesh circles in the first half yearly period. In the
second half yearly period the consultants has to cover Mumbai and Maharashtra circles. This report
presents the results of the survey conducted for the Madhya Pradesh circle.
Final Report – West Zone (Madhya Pradesh Circle) Assessment of (i) implementation and effectiveness of various regulations, directions and orders issued by TRAI in the interest of consumers and (ii) Customer Perception of Telecom Service Through Surveys
342852/MCB/ISA/AA/01 01 December 2014 AMC/Projects/342852/Documents/Final Report/West Zone - MP
3
The basic objectives of the study as per the Terms of Reference are as follows
(i) Assess customer perception of telecom services
(ii) Assess implementation and effectiveness of various regulations, directions and orders issued
by TRAI in the interest of consumers
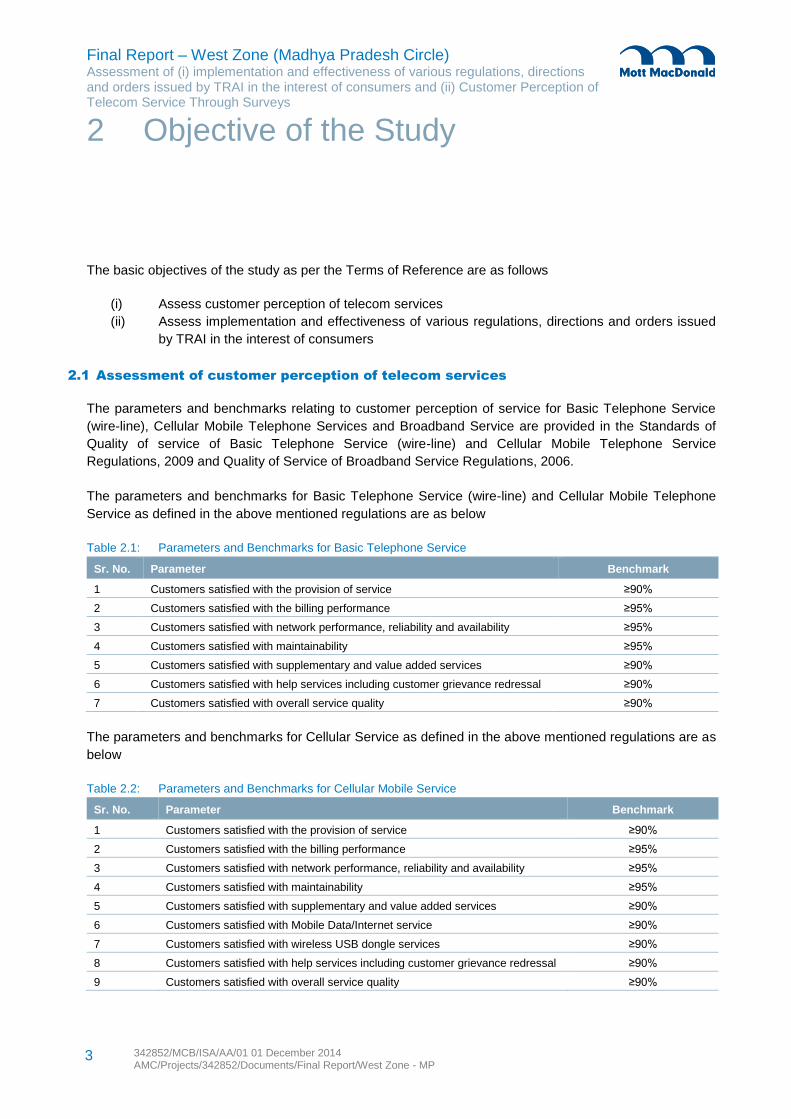
2.1 Assessment of customer perception of telecom services
The parameters and benchmarks relating to customer perception of service for Basic Telephone Service
(wire-line), Cellular Mobile Telephone Services and Broadband Service are provided in the Standards of
Quality of service of Basic Telephone Service (wire-line) and Cellular Mobile Telephone Service
Regulations, 2009 and Quality of Service of Broadband Service Regulations, 2006.
The parameters and benchmarks for Basic Telephone Service (wire-line) and Cellular Mobile Telephone
Service as defined in the above mentioned regulations are as below
Table 2.1: Parameters and Benchmarks for Basic Telephone Service
Sr. No. Parameter Benchmark
1 Customers satisfied with the provision of service ≥90%
2 Customers satisfied with the billing performance ≥95%
3 Customers satisfied with network performance, reliability and availability ≥95%
4 Customers satisfied with maintainability ≥95%
5 Customers satisfied with supplementary and value added services ≥90%
6 Customers satisfied with help services including customer grievance redressal ≥90%
7 Customers satisfied with overall service quality ≥90%
The parameters and benchmarks for Cellular Service as defined in the above mentioned regulations are as
below
Table 2.2: Parameters and Benchmarks for Cellular Mobile Service
Sr. No. Parameter Benchmark
1 Customers satisfied with the provision of service ≥90%
2 Customers satisfied with the billing performance ≥95%
3 Customers satisfied with network performance, reliability and availability ≥95%
4 Customers satisfied with maintainability ≥95%
5 Customers satisfied with supplementary and value added services ≥90%
6 Customers satisfied with Mobile Data/Internet service ≥90%
7 Customers satisfied with wireless USB dongle services ≥90%
8 Customers satisfied with help services including customer grievance redressal ≥90%
9 Customers satisfied with overall service quality ≥90%
2 Objective of the Study
Final Report – West Zone (Madhya Pradesh Circle) Assessment of (i) implementation and effectiveness of various regulations, directions and orders issued by TRAI in the interest of consumers and (ii) Customer Perception of Telecom Service Through Surveys
342852/MCB/ISA/AA/01 01 December 2014 AMC/Projects/342852/Documents/Final Report/West Zone - MP
4
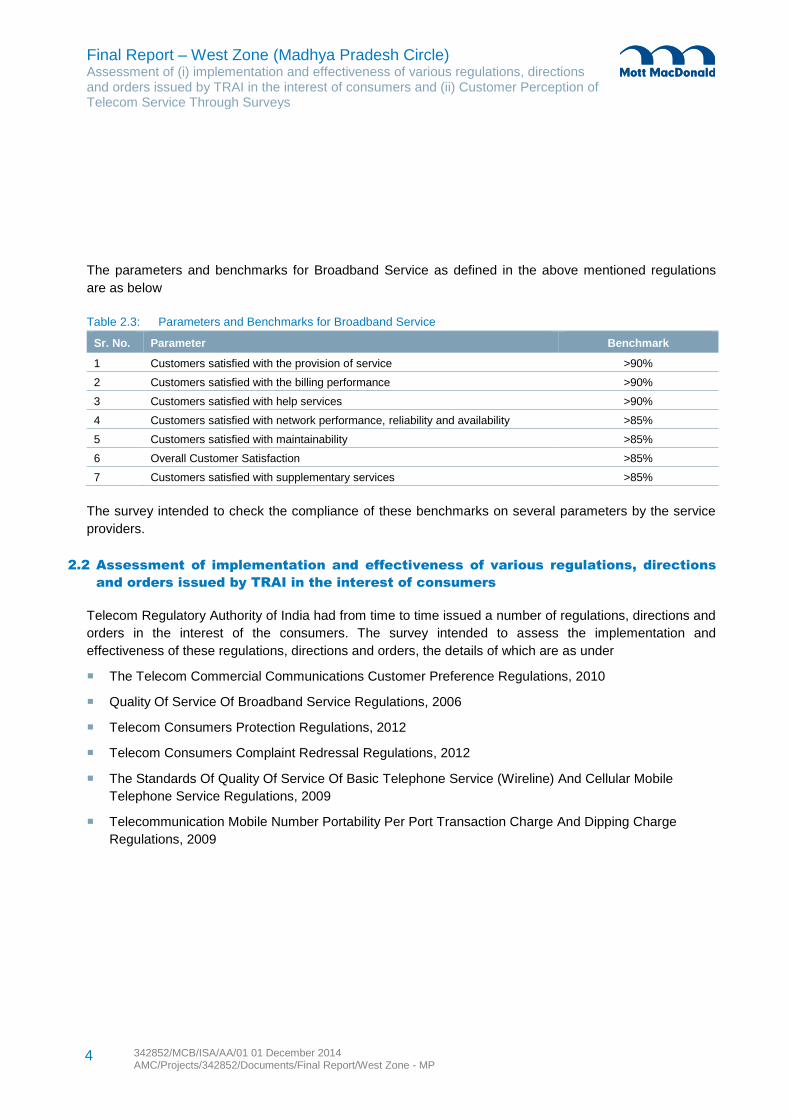
The parameters and benchmarks for Broadband Service as defined in the above mentioned regulations
are as below
Table 2.3: Parameters and Benchmarks for Broadband Service
Sr. No. Parameter Benchmark
1 Customers satisfied with the provision of service >90%
2 Customers satisfied with the billing performance >90%
3 Customers satisfied with help services >90%
4 Customers satisfied with network performance, reliability and availability >85%
5 Customers satisfied with maintainability >85%
6 Overall Customer Satisfaction >85%
7 Customers satisfied with supplementary services >85%
The survey intended to check the compliance of these benchmarks on several parameters by the service
providers.
2.2 Assessment of implementation and effectiveness of various regulations, directions
and orders issued by TRAI in the interest of consumers
Telecom Regulatory Authority of India had from time to time issued a number of regulations, directions and
orders in the interest of the consumers. The survey intended to assess the implementation and
effectiveness of these regulations, directions and orders, the details of which are as under
The Telecom Commercial Communications Customer Preference Regulations, 2010
Quality Of Service Of Broadband Service Regulations, 2006
Telecom Consumers Protection Regulations, 2012
Telecom Consumers Complaint Redressal Regulations, 2012
The Standards Of Quality Of Service Of Basic Telephone Service (Wireline) And Cellular Mobile
Telephone Service Regulations, 2009
Telecommunication Mobile Number Portability Per Port Transaction Charge And Dipping Charge
Regulations, 2009
Final Report – West Zone (Madhya Pradesh Circle) Assessment of (i) implementation and effectiveness of various regulations, directions and orders issued by TRAI in the interest of consumers and (ii) Customer Perception of Telecom Service Through Surveys
342852/MCB/ISA/AA/01 01 December 2014 AMC/Projects/342852/Documents/Final Report/West Zone - MP
5
3.1 Questionnaire Design Methodology
TRAI via its Terms of Reference as stated in the tender document had given basic guidelines for the
preparation of an appropriate research tool for the current study. Subsequently, the need for a scientific
service quality model as a basis for the proposed study was discussed at length. The questionnaire has
been designed on the basis of the objectives of the overall study and on the proposed service quality
model used for the current study
3.1.1 Service Quality Model
Parasuraman et al, (1988) had presented a model known as SERVQUAL to measure quality in the service
sector. They introduced two broad dimension assurance and empathy making a fivefold model (tangibles,
reliability, responsiveness, assurance and empathy) which they used as the basis for their service quality
measurement tool, SERVQUAL. These dimensions can be defined as:
Tangibility: Physical facilities, equipment and appearance of service firm’s employees.
Reliability: Performing the promised services at stated level.
Responsiveness: Providing prompt services and willingness to help customers.
Assurance: Knowledge and courtesy of employees and their ability to inspire trust and confidence in
the firm.
Empathy: Caring and personalized attention to its customers.
They suggested that the service quality should be measured as the difference or gap between consumer
expectations about the service and the actual perceived performance (i.e. the disconfirmation paradigm).
The concept of measuring level of service quality in terms of expectations and perceptions using
SERVQUAL gap score has been proved very useful. Parasuraman, argued that SERVQUAL can be used
in any kind of service industry after some industry specific modification.
After SERVQUAL, presented by Parasuraman, much of the criticism levied against it. For example,
Carman argued that the five dimensions of SERVQUAL could not be generic measure for every service
industry. He found that some of the items loaded differently when compared to cross industry analysis. As
mentioned earlier, Parasuraman combined understanding and access component into single component
i.e empathy due to high correlation count between them. Carman finds it inappropriate combination in his
research. Cronin and Taylor also criticized the SERVQUAL model due to its operational deficiencies. They
argued that only perception portion can best describe the satisfaction level of customers as compared to
difference score of perception minus expectations. As a result, they developed an alternative measurement
tool named ‘SERVPERF’ in which they nullify the expectation portion of the original SERVQUAL model.
They argued that only the performance dimension can better predict the behavioural intention of the
customers.
In the present study, 30% of the sample had to be covered from the rural area. The rural consumers are
not at the same level of awareness with the urban consumers. For them understanding of expectation with
3 Methodology
Final Report – West Zone (Madhya Pradesh Circle) Assessment of (i) implementation and effectiveness of various regulations, directions and orders issued by TRAI in the interest of consumers and (ii) Customer Perception of Telecom Service Through Surveys
342852/MCB/ISA/AA/01 01 December 2014 AMC/Projects/342852/Documents/Final Report/West Zone - MP
6
the service may not be at the same level as urban consumers. Secondly, in the urban area 50% of the
survey had to be administered through telephonic interviews. Administering of SERVQUAL instrument
would require a longer duration of time which might not have been feasible through telephonic interview.
Keeping these concerns in mind, SERVPERF model had been used, wherein only performance based
perception had to be taken in to account.
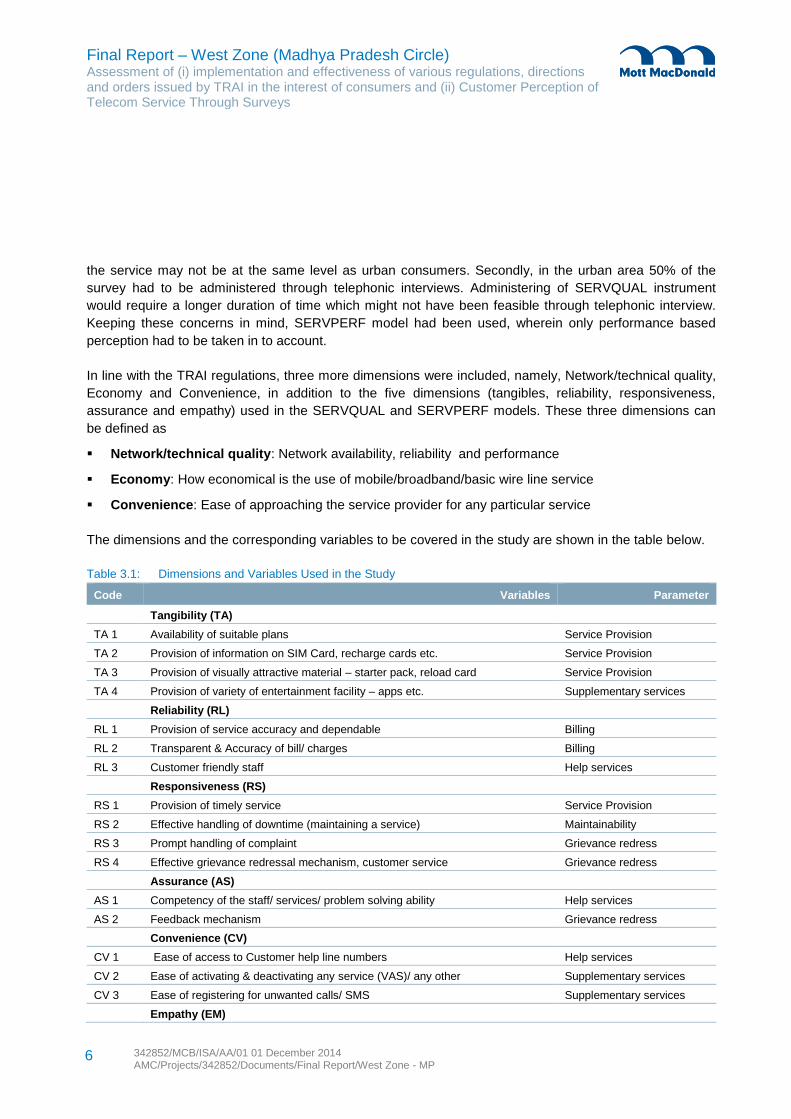
In line with the TRAI regulations, three more dimensions were included, namely, Network/technical quality,
Economy and Convenience, in addition to the five dimensions (tangibles, reliability, responsiveness,
assurance and empathy) used in the SERVQUAL and SERVPERF models. These three dimensions can
be defined as
Network/technical quality: Network availability, reliability and performance
Economy: How economical is the use of mobile/broadband/basic wire line service
Convenience: Ease of approaching the service provider for any particular service
The dimensions and the corresponding variables to be covered in the study are shown in the table below.
Table 3.1: Dimensions and Variables Used in the Study
Code Variables Parameter
Tangibility (TA)
TA 1 Availability of suitable plans Service Provision
TA 2 Provision of information on SIM Card, recharge cards etc. Service Provision
TA 3 Provision of visually attractive material – starter pack, reload card Service Provision
TA 4 Provision of variety of entertainment facility – apps etc. Supplementary services
Reliability (RL)
RL 1 Provision of service accuracy and dependable Billing
RL 2 Transparent & Accuracy of bill/ charges Billing
RL 3 Customer friendly staff Help services
Responsiveness (RS)
RS 1 Provision of timely service Service Provision
RS 2 Effective handling of downtime (maintaining a service) Maintainability
RS 3 Prompt handling of complaint Grievance redress
RS 4 Effective grievance redressal mechanism, customer service Grievance redress
Assurance (AS)
AS 1 Competency of the staff/ services/ problem solving ability Help services
AS 2 Feedback mechanism Grievance redress
Convenience (CV)
CV 1 Ease of access to Customer help line numbers Help services
CV 2 Ease of activating & deactivating any service (VAS)/ any other Supplementary services
CV 3 Ease of registering for unwanted calls/ SMS Supplementary services
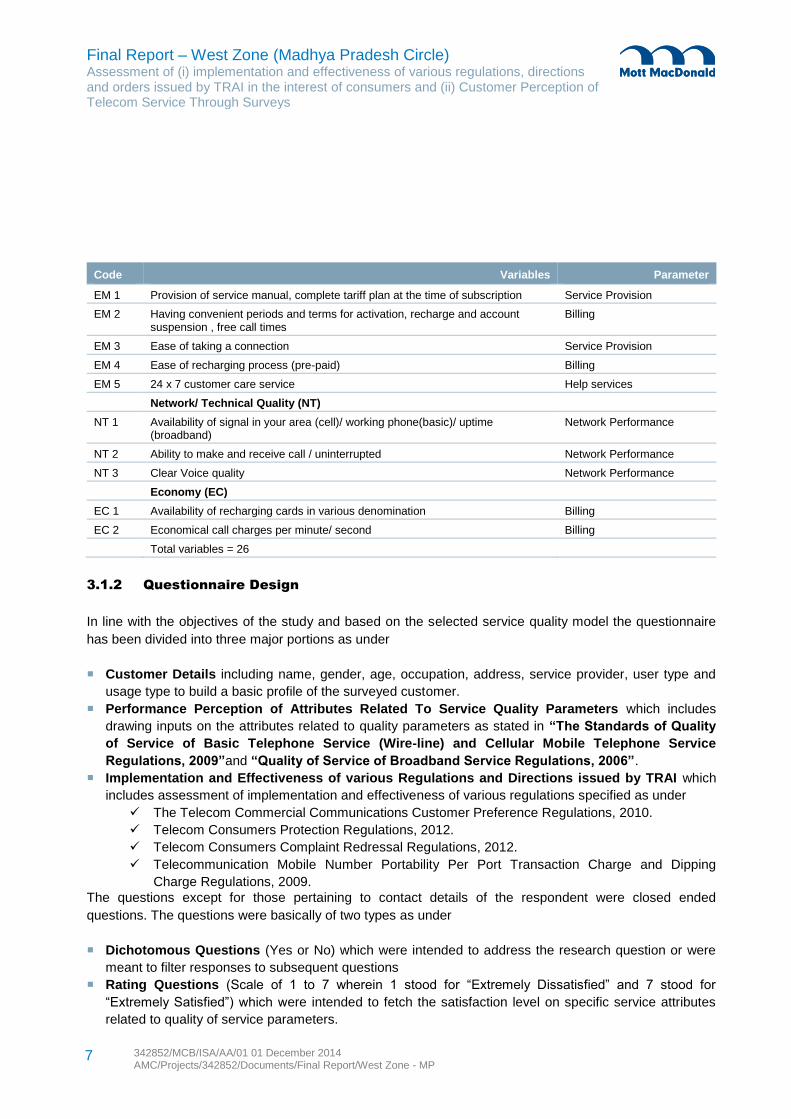
Empathy (EM)
Final Report – West Zone (Madhya Pradesh Circle) Assessment of (i) implementation and effectiveness of various regulations, directions and orders issued by TRAI in the interest of consumers and (ii) Customer Perception of Telecom Service Through Surveys
342852/MCB/ISA/AA/01 01 December 2014 AMC/Projects/342852/Documents/Final Report/West Zone - MP
7
Code Variables Parameter
EM 1 Provision of service manual, complete tariff plan at the time of subscription Service Provision
EM 2 Having convenient periods and terms for activation, recharge and account suspension , free call times
Billing
EM 3 Ease of taking a connection Service Provision
EM 4 Ease of recharging process (pre-paid) Billing
EM 5 24 x 7 customer care service Help services
Network/ Technical Quality (NT)
NT 1 Availability of signal in your area (cell)/ working phone(basic)/ uptime (broadband)
Network Performance
NT 2 Ability to make and receive call / uninterrupted Network Performance
NT 3 Clear Voice quality Network Performance
Economy (EC)
EC 1 Availability of recharging cards in various denomination Billing
EC 2 Economical call charges per minute/ second Billing
Total variables = 26
3.1.2 Questionnaire Design
In line with the objectives of the study and based on the selected service quality model the questionnaire
has been divided into three major portions as under
Customer Details including name, gender, age, occupation, address, service provider, user type and
usage type to build a basic profile of the surveyed customer.
Performance Perception of Attributes Related To Service Quality Parameters which includes
drawing inputs on the attributes related to quality parameters as stated in “The Standards of Quality
of Service of Basic Telephone Service (Wire-line) and Cellular Mobile Telephone Service
Regulations, 2009”and “Quality of Service of Broadband Service Regulations, 2006”.
Implementation and Effectiveness of various Regulations and Directions issued by TRAI which
includes assessment of implementation and effectiveness of various regulations specified as under
The Telecom Commercial Communications Customer Preference Regulations, 2010.
Telecom Consumers Protection Regulations, 2012.
Telecom Consumers Complaint Redressal Regulations, 2012.
Telecommunication Mobile Number Portability Per Port Transaction Charge and Dipping
Charge Regulations, 2009.
The questions except for those pertaining to contact details of the respondent were closed ended
questions. The questions were basically of two types as under
Dichotomous Questions (Yes or No) which were intended to address the research question or were
meant to filter responses to subsequent questions
Rating Questions (Scale of 1 to 7 wherein 1 stood for “Extremely Dissatisfied” and 7 stood for
“Extremely Satisfied”) which were intended to fetch the satisfaction level on specific service attributes
related to quality of service parameters.
Final Report – West Zone (Madhya Pradesh Circle) Assessment of (i) implementation and effectiveness of various regulations, directions and orders issued by TRAI in the interest of consumers and (ii) Customer Perception of Telecom Service Through Surveys
342852/MCB/ISA/AA/01 01 December 2014 AMC/Projects/342852/Documents/Final Report/West Zone - MP
8
3.2 Analysis Methodology
TRAI has clearly laid down its benchmarks on broad parameters for Basic Service (Wireline), Cellular
Mobile and Broadband services. In the case of Basic Service (Wireline) and Basic (Wireless) & Cellular
Mobile services, benchmark on satisfaction parameters such as provision of services, supplementary/
value added services, help services and overall service quality has been fixed at 90% and for other
parameters such as network performance, maintainability and billing at 95%. Whereas, in the case of
Broadband services, the benchmarks on three parameters – provision of services, billing performance and
help services – has been fixed at 90%. In the case of other four parameters – network performance,
maintainability, overall satisfaction and supplementary services – the benchmark has been set at 85%.
Therefore, comparisons with benchmark set up by the TRAI on various parameters for Basic, Cellular and
Broadband services has been contrasted with the achieved level of percentage of satisfied consumers by
various services providers of Basic, Cellular and Broadband services on the TRAI identified service
parameters.
The scale suggested measures the satisfaction and dissatisfaction level of consumers. Hence when
calculating the satisfaction scores; we consider the percentage of consumers actually satisfied with the
service providers. Either of the following 2 approaches was considered to measure the satisfaction scores-
Option 1: Computation based on Active Satisfaction: Score of Top 3 boxes in the 7 point scale (where
1 = “Extremely dissatisfied” and 7= “Extremely Satisfied”) are calculated to measure the satisfaction
score
Option 2: Computation based on Non- Active Dissatisfaction: Here, Top 4 box scores are taken into
account thereby not considering the respondents who are actively dissatisfied with the services. The
neutral score of 4 is therefore considered as not dissatisfied.
Option 1 i.e. ‘Computation based on Active Satisfaction’ has been used for the comparison with
benchmarks for the current study.
3.3 Sampling Methodology
As per the TOR the sample for Basic Telephone Service (wireline) subscribers had to be evenly spread
over in 5% (five per cent) of the exchanges of each BSOs in the circle. The above stated 5% (five per cent)
exchanges had to be evenly spread over 10% (ten per cent) of SDCAs with each BSO. The 5% (five per
cent) exchanges had to be covered both in urban and rural category. Wherever possible, at least 30% of
these exchanges had to be rural exchanges.
As per the TOR the sample for cellular mobile telephone service subscribers had to be evenly spread over
10% (ten per cent) of district headquarters of a service area where the services are commissioned. The
sample had to also cover surrounding areas of the district headquarters, including rural areas and at least
the sample size should have 30% customers from rural areas.
As per the TOR the sample for broadband service subscribers had to be evenly spread over the areas
served by 10% (ten per cent) of the Points of Presence (POPs) of each service provider in each service
area. Wherever possible, the sample size should have 30% customers from rural areas.
The consultants have conducted the survey in the below mentioned regions in the Madhya Pradesh circle
as per the sample design submitted by IMM and subsequently approved by TRAI.
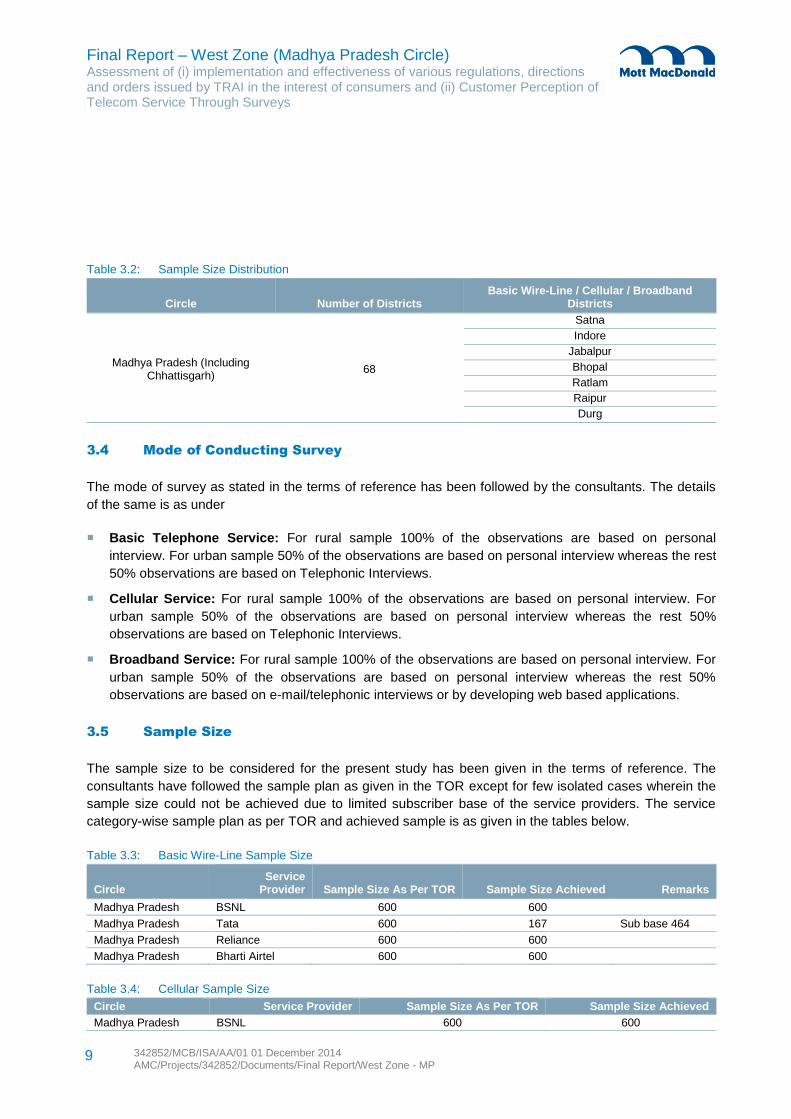
Final Report – West Zone (Madhya Pradesh Circle) Assessment of (i) implementation and effectiveness of various regulations, directions and orders issued by TRAI in the interest of consumers and (ii) Customer Perception of Telecom Service Through Surveys
342852/MCB/ISA/AA/01 01 December 2014 AMC/Projects/342852/Documents/Final Report/West Zone - MP
9
Table 3.2: Sample Size Distribution
Circle Number of Districts Basic Wire-Line / Cellular / Broadband
Districts
Madhya Pradesh (Including Chhattisgarh)
68
Satna
Indore
Jabalpur
Bhopal
Ratlam
Raipur
Durg
3.4 Mode of Conducting Survey
The mode of survey as stated in the terms of reference has been followed by the consultants. The details
of the same is as under
Basic Telephone Service: For rural sample 100% of the observations are based on personal
interview. For urban sample 50% of the observations are based on personal interview whereas the rest
50% observations are based on Telephonic Interviews.
Cellular Service: For rural sample 100% of the observations are based on personal interview. For
urban sample 50% of the observations are based on personal interview whereas the rest 50%
observations are based on Telephonic Interviews.
Broadband Service: For rural sample 100% of the observations are based on personal interview. For
urban sample 50% of the observations are based on personal interview whereas the rest 50%
observations are based on e-mail/telephonic interviews or by developing web based applications.
3.5 Sample Size
The sample size to be considered for the present study has been given in the terms of reference. The
consultants have followed the sample plan as given in the TOR except for few isolated cases wherein the
sample size could not be achieved due to limited subscriber base of the service providers. The service
category-wise sample plan as per TOR and achieved sample is as given in the tables below.
Table 3.3: Basic Wire-Line Sample Size
Circle Service
Provider Sample Size As Per TOR Sample Size Achieved Remarks
Madhya Pradesh BSNL 600 600
Madhya Pradesh Tata 600 167 Sub base 464
Madhya Pradesh Reliance 600 600
Madhya Pradesh Bharti Airtel 600 600
Table 3.4: Cellular Sample Size
Circle Service Provider Sample Size As Per TOR Sample Size Achieved
Madhya Pradesh BSNL 600 600
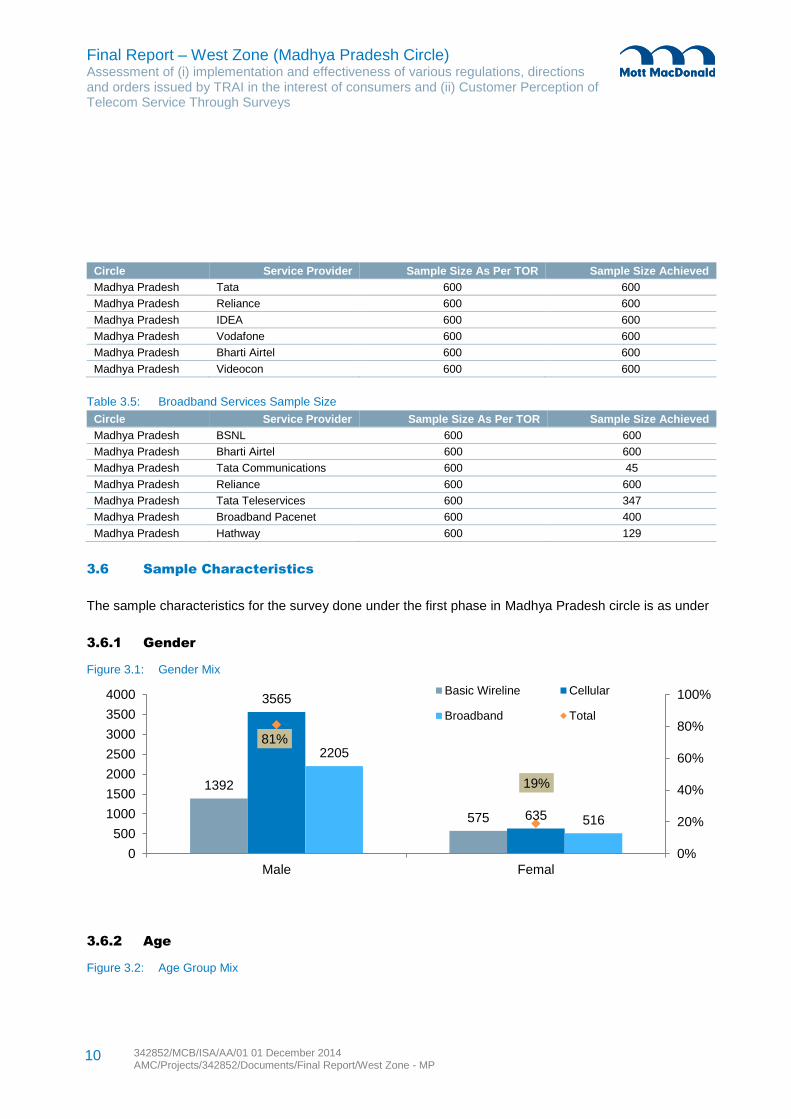
Final Report – West Zone (Madhya Pradesh Circle) Assessment of (i) implementation and effectiveness of various regulations, directions and orders issued by TRAI in the interest of consumers and (ii) Customer Perception of Telecom Service Through Surveys
342852/MCB/ISA/AA/01 01 December 2014 AMC/Projects/342852/Documents/Final Report/West Zone - MP
10
Circle Service Provider Sample Size As Per TOR Sample Size Achieved
Madhya Pradesh Tata 600 600
Madhya Pradesh Reliance 600 600
Madhya Pradesh IDEA 600 600
Madhya Pradesh Vodafone 600 600
Madhya Pradesh Bharti Airtel 600 600
Madhya Pradesh Videocon 600 600
Table 3.5: Broadband Services Sample Size
Circle Service Provider Sample Size As Per TOR Sample Size Achieved
Madhya Pradesh BSNL 600 600
Madhya Pradesh Bharti Airtel 600 600
Madhya Pradesh Tata Communications 600 45
Madhya Pradesh Reliance 600 600
Madhya Pradesh Tata Teleservices 600 347
Madhya Pradesh Broadband Pacenet 600 400
Madhya Pradesh Hathway 600 129
3.6 Sample Characteristics
The sample characteristics for the survey done under the first phase in Madhya Pradesh circle is as under
3.6.1 Gender
3.6.2 Age
Figure 3.1: Gender Mix
Figure 3.2: Age Group Mix
1392
575
3565
635
2205
516
81%
19%
0%
20%
40%
60%
80%
100%
0
500
1000
1500
2000
2500
3000
3500
4000
Male Femal
Basic Wireline Cellular
Broadband Total
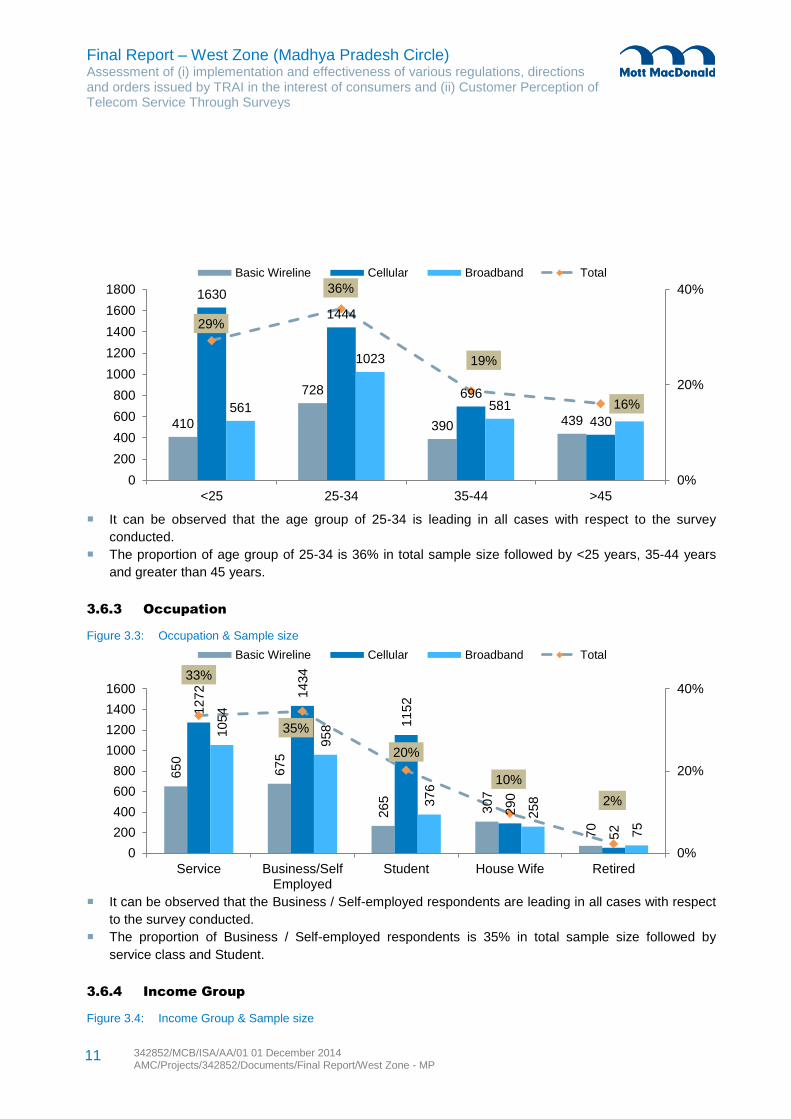
Final Report – West Zone (Madhya Pradesh Circle) Assessment of (i) implementation and effectiveness of various regulations, directions and orders issued by TRAI in the interest of consumers and (ii) Customer Perception of Telecom Service Through Surveys
342852/MCB/ISA/AA/01 01 December 2014 AMC/Projects/342852/Documents/Final Report/West Zone - MP
11
It can be observed that the age group of 25-34 is leading in all cases with respect to the survey
conducted.
The proportion of age group of 25-34 is 36% in total sample size followed by <25 years, 35-44 years
and greater than 45 years.
3.6.3 Occupation
It can be observed that the Business / Self-employed respondents are leading in all cases with respect
to the survey conducted.
The proportion of Business / Self-employed respondents is 35% in total sample size followed by
service class and Student.
3.6.4 Income Group
Figure 3.3: Occupation & Sample size
Figure 3.4: Income Group & Sample size
410
728
390 439
1630
1444
696
430 561
1023
581 556
29%
36%
19%
16%
0%
20%
40%
0
200
400
600
800
1000
1200
1400
1600
1800
<25 25-34 35-44 >45
Basic Wireline Cellular Broadband Total
650
675
265
307
70
1272
1434
1152
290
52
1054
958
376
258
75
33%
35%
20%
10%
2%
0%
20%
40%
0
200
400
600
800
1000
1200
1400
1600
Service Business/SelfEmployed
Student House Wife Retired
Basic Wireline Cellular Broadband Total
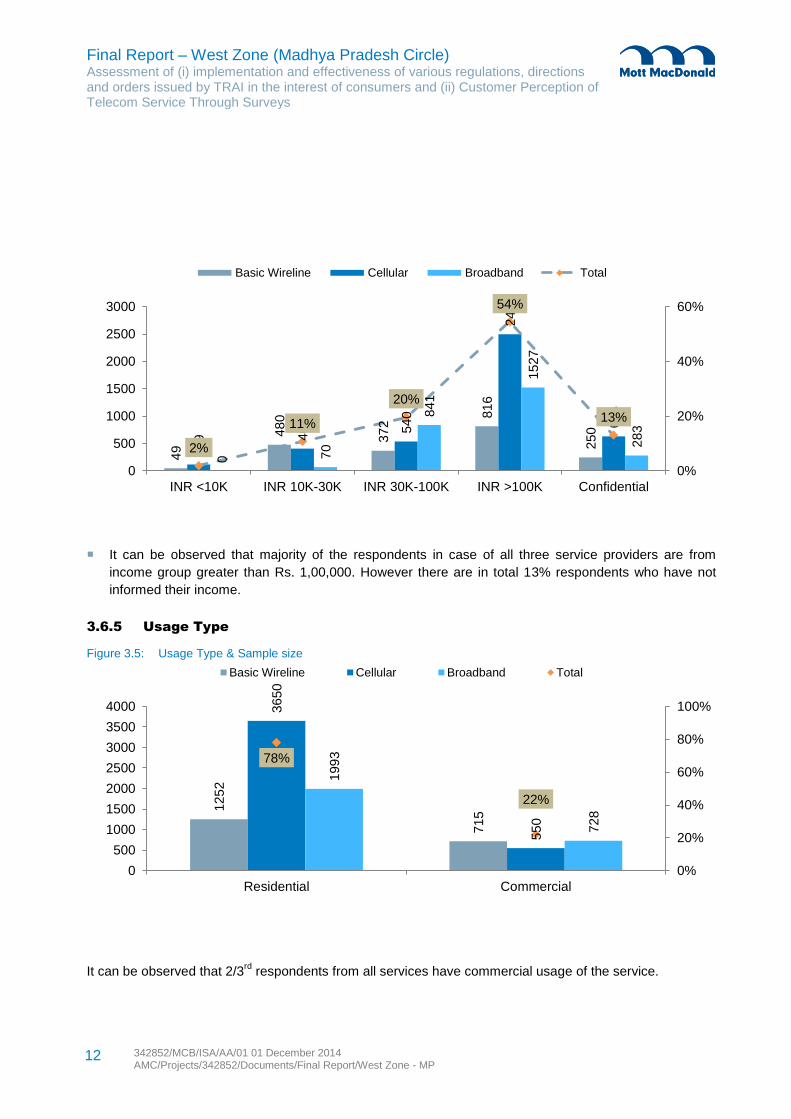
Final Report – West Zone (Madhya Pradesh Circle) Assessment of (i) implementation and effectiveness of various regulations, directions and orders issued by TRAI in the interest of consumers and (ii) Customer Perception of Telecom Service Through Surveys
342852/MCB/ISA/AA/01 01 December 2014 AMC/Projects/342852/Documents/Final Report/West Zone - MP
12
It can be observed that majority of the respondents in case of all three service providers are from
income group greater than Rs. 1,00,000. However there are in total 13% respondents who have not
informed their income.
3.6.5 Usage Type
It can be observed that 2/3rd
respondents from all services have commercial usage of the service.
Figure 3.5: Usage Type & Sample size
49
480
372 8
16
250
119
408
540
2499
634
0 70
841
1527
283
2%
11%
20%
54%
13%
0%
20%
40%
60%
0
500
1000
1500
2000
2500
3000
INR <10K INR 10K-30K INR 30K-100K INR >100K Confidential
Basic Wireline Cellular Broadband Total
1252
715
3650
550
1993
728
78%
22%
0%
20%
40%
60%
80%
100%
0
500
1000
1500
2000
2500
3000
3500
4000
Residential Commercial
Basic Wireline Cellular Broadband Total
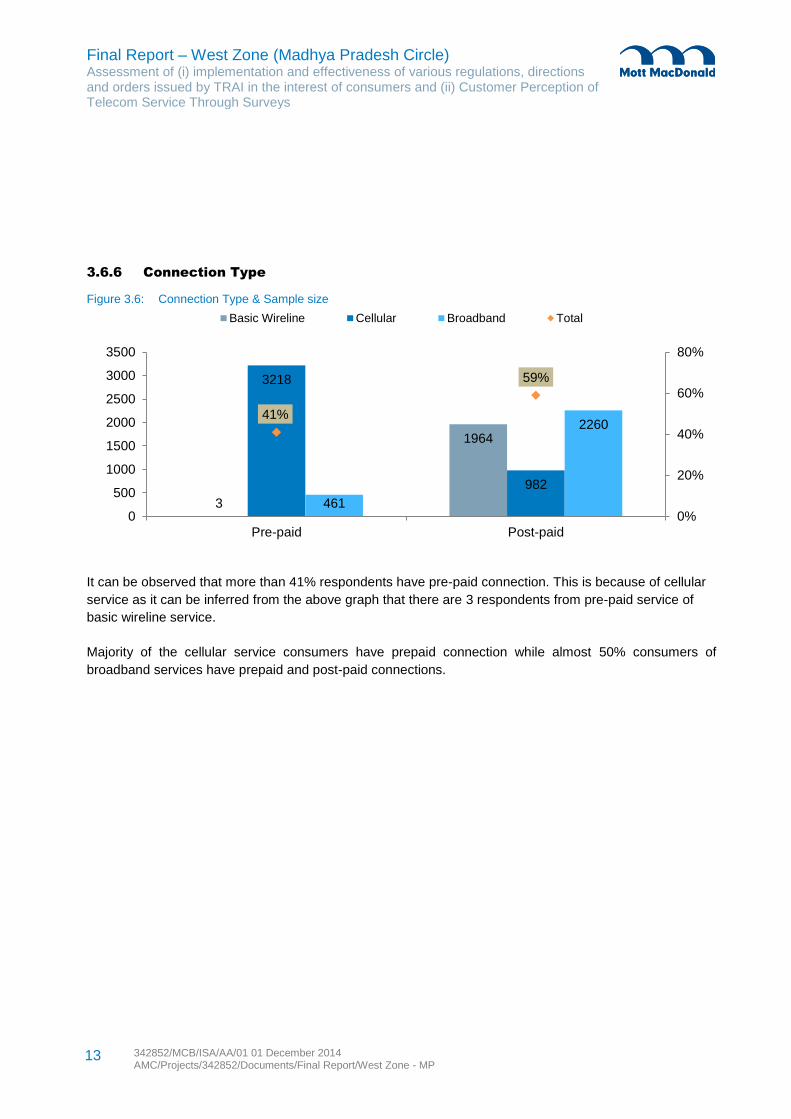
Final Report – West Zone (Madhya Pradesh Circle) Assessment of (i) implementation and effectiveness of various regulations, directions and orders issued by TRAI in the interest of consumers and (ii) Customer Perception of Telecom Service Through Surveys
342852/MCB/ISA/AA/01 01 December 2014 AMC/Projects/342852/Documents/Final Report/West Zone - MP
13
3.6.6 Connection Type
It can be observed that more than 41% respondents have pre-paid connection. This is because of cellular
service as it can be inferred from the above graph that there are 3 respondents from pre-paid service of
basic wireline service.
Majority of the cellular service consumers have prepaid connection while almost 50% consumers of
broadband services have prepaid and post-paid connections.
Figure 3.6: Connection Type & Sample size
3
1964
3218
982
461
2260 41%
59%
0%
20%
40%
60%
80%
0
500
1000
1500
2000
2500
3000
3500
Pre-paid Post-paid
Basic Wireline Cellular Broadband Total
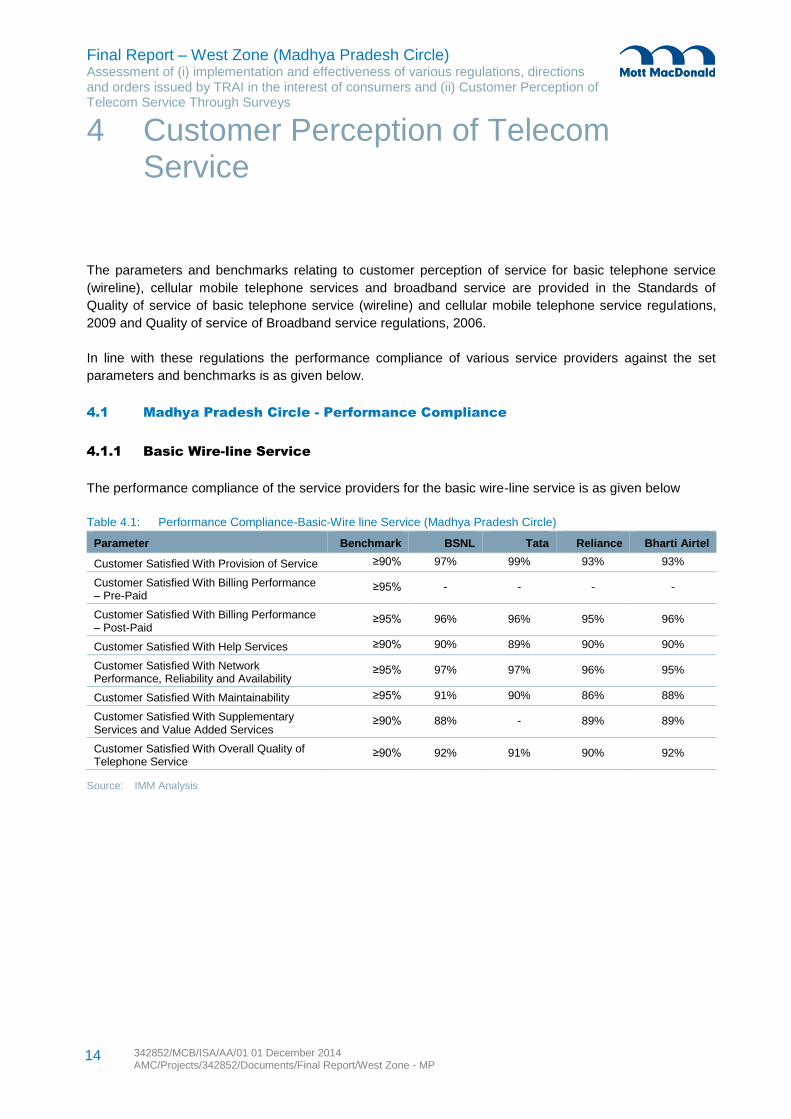
Final Report – West Zone (Madhya Pradesh Circle) Assessment of (i) implementation and effectiveness of various regulations, directions and orders issued by TRAI in the interest of consumers and (ii) Customer Perception of Telecom Service Through Surveys
342852/MCB/ISA/AA/01 01 December 2014 AMC/Projects/342852/Documents/Final Report/West Zone - MP
14
The parameters and benchmarks relating to customer perception of service for basic telephone service
(wireline), cellular mobile telephone services and broadband service are provided in the Standards of
Quality of service of basic telephone service (wireline) and cellular mobile telephone service regulations,
2009 and Quality of service of Broadband service regulations, 2006.
In line with these regulations the performance compliance of various service providers against the set
parameters and benchmarks is as given below.
4.1 Madhya Pradesh Circle - Performance Compliance
4.1.1 Basic Wire-line Service
The performance compliance of the service providers for the basic wire-line service is as given below
Table 4.1: Performance Compliance-Basic-Wire line Service (Madhya Pradesh Circle)
Parameter Benchmark BSNL Tata Reliance Bharti Airtel
Customer Satisfied With Provision of Service ≥90% 97% 99% 93% 93%
Customer Satisfied With Billing Performance – Pre-Paid
≥95% - - - -
Customer Satisfied With Billing Performance – Post-Paid
≥95% 96% 96% 95% 96%
Customer Satisfied With Help Services ≥90% 90% 89% 90% 90%
Customer Satisfied With Network Performance, Reliability and Availability
≥95% 97% 97% 96% 95%
Customer Satisfied With Maintainability ≥95% 91% 90% 86% 88%
Customer Satisfied With Supplementary Services and Value Added Services
≥90% 88% - 89% 89%
Customer Satisfied With Overall Quality of Telephone Service
≥90% 92% 91% 90% 92%
Source: IMM Analysis
4 Customer Perception of Telecom Service
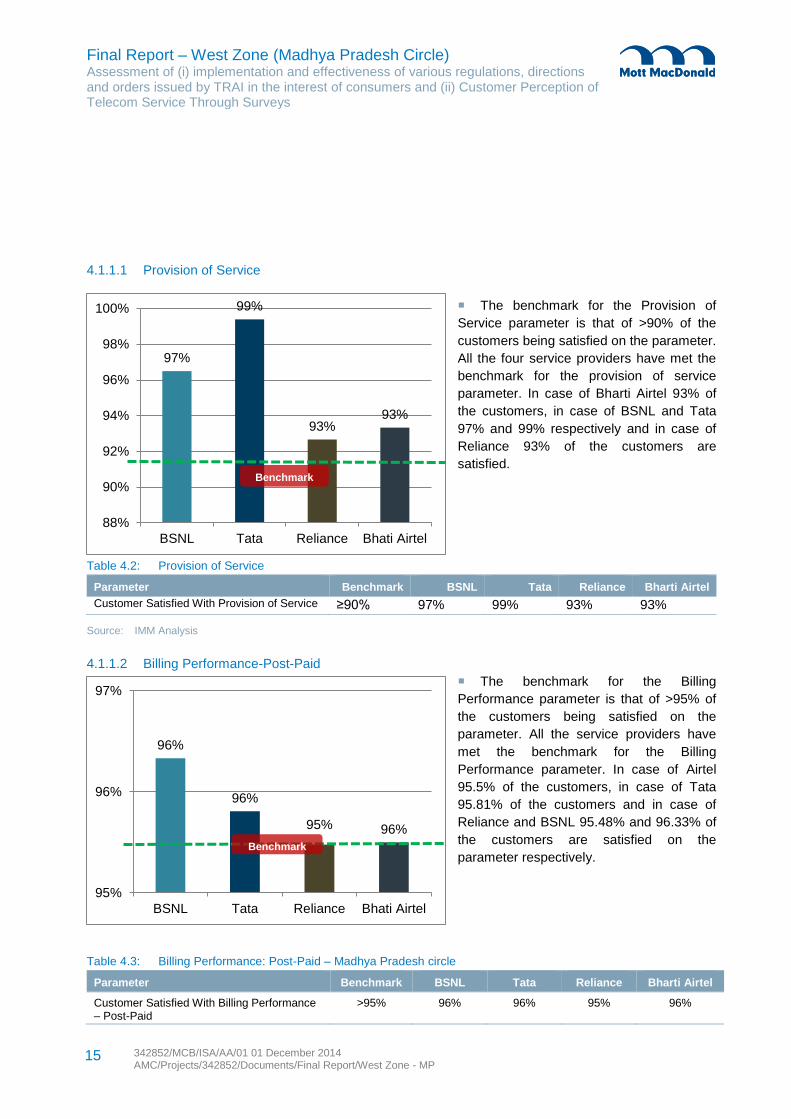
Final Report – West Zone (Madhya Pradesh Circle) Assessment of (i) implementation and effectiveness of various regulations, directions and orders issued by TRAI in the interest of consumers and (ii) Customer Perception of Telecom Service Through Surveys
342852/MCB/ISA/AA/01 01 December 2014 AMC/Projects/342852/Documents/Final Report/West Zone - MP
15
97%
99%
93% 93%
88%
90%
92%
94%
96%
98%
100%
BSNL Tata Reliance Bhati Airtel
Benchmark
96%
96%
95% 96%
95%
96%
97%
BSNL Tata Reliance Bhati Airtel
Benchmark
4.1.1.1 Provision of Service
The benchmark for the Provision of
Service parameter is that of >90% of the
customers being satisfied on the parameter.
All the four service providers have met the
benchmark for the provision of service
parameter. In case of Bharti Airtel 93% of
the customers, in case of BSNL and Tata
97% and 99% respectively and in case of
Reliance 93% of the customers are
satisfied.
Table 4.2: Provision of Service
Parameter Benchmark BSNL Tata Reliance Bharti Airtel
Customer Satisfied With Provision of Service ≥90% 97% 99% 93% 93%
Source: IMM Analysis
4.1.1.2 Billing Performance-Post-Paid
The benchmark for the Billing
Performance parameter is that of >95% of
the customers being satisfied on the
parameter. All the service providers have
met the benchmark for the Billing
Performance parameter. In case of Airtel
95.5% of the customers, in case of Tata
95.81% of the customers and in case of
Reliance and BSNL 95.48% and 96.33% of
the customers are satisfied on the
parameter respectively.
Table 4.3: Billing Performance: Post-Paid – Madhya Pradesh circle
Parameter Benchmark BSNL Tata Reliance Bharti Airtel
Customer Satisfied With Billing Performance – Post-Paid
>95% 96% 96% 95% 96%
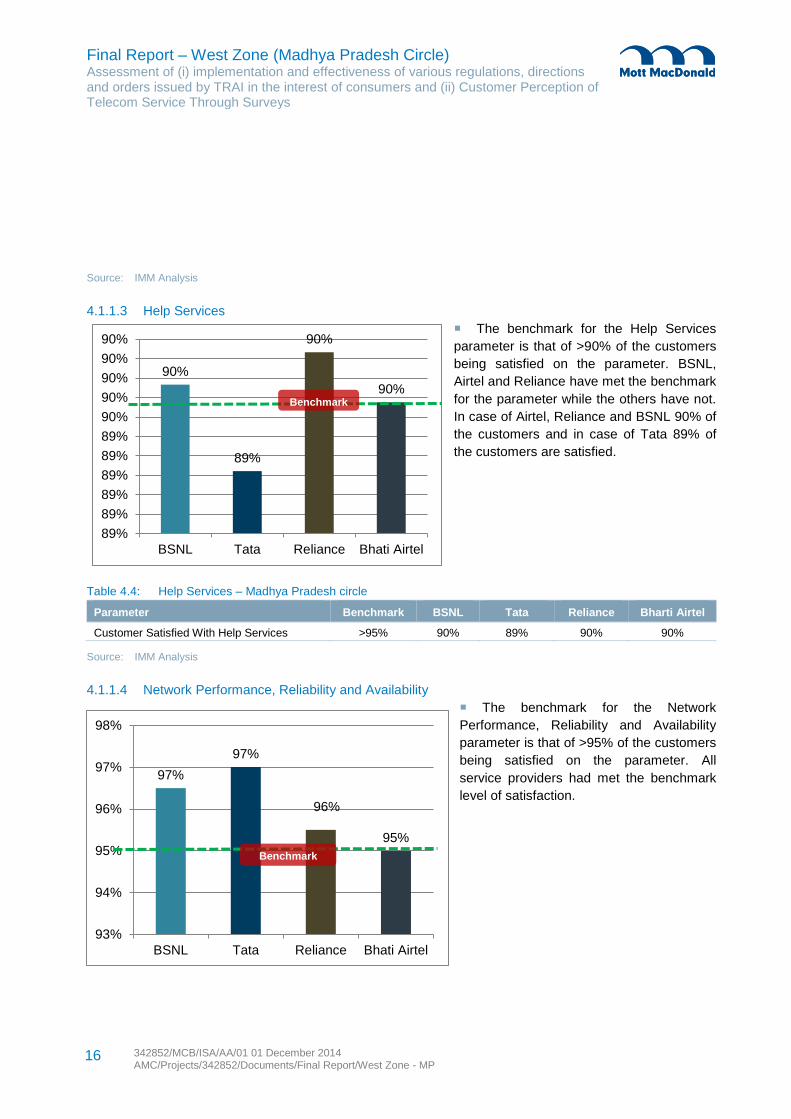
Final Report – West Zone (Madhya Pradesh Circle) Assessment of (i) implementation and effectiveness of various regulations, directions and orders issued by TRAI in the interest of consumers and (ii) Customer Perception of Telecom Service Through Surveys
342852/MCB/ISA/AA/01 01 December 2014 AMC/Projects/342852/Documents/Final Report/West Zone - MP
16
90%
89%
90%
90%
89%
89%
89%
89%
89%
89%
90%
90%
90%
90%
90%
BSNL Tata Reliance Bhati Airtel
Benchmark
97%
97%
96%
95%
93%
94%
95%
96%
97%
98%
BSNL Tata Reliance Bhati Airtel
Benchmark
Source: IMM Analysis
4.1.1.3 Help Services
The benchmark for the Help Services
parameter is that of >90% of the customers
being satisfied on the parameter. BSNL,
Airtel and Reliance have met the benchmark
for the parameter while the others have not.
In case of Airtel, Reliance and BSNL 90% of
the customers and in case of Tata 89% of
the customers are satisfied.
Table 4.4: Help Services – Madhya Pradesh circle
Parameter Benchmark BSNL Tata Reliance Bharti Airtel
Customer Satisfied With Help Services >95% 90% 89% 90% 90%
Source: IMM Analysis
4.1.1.4 Network Performance, Reliability and Availability
The benchmark for the Network
Performance, Reliability and Availability
parameter is that of >95% of the customers
being satisfied on the parameter. All
service providers had met the benchmark
level of satisfaction.
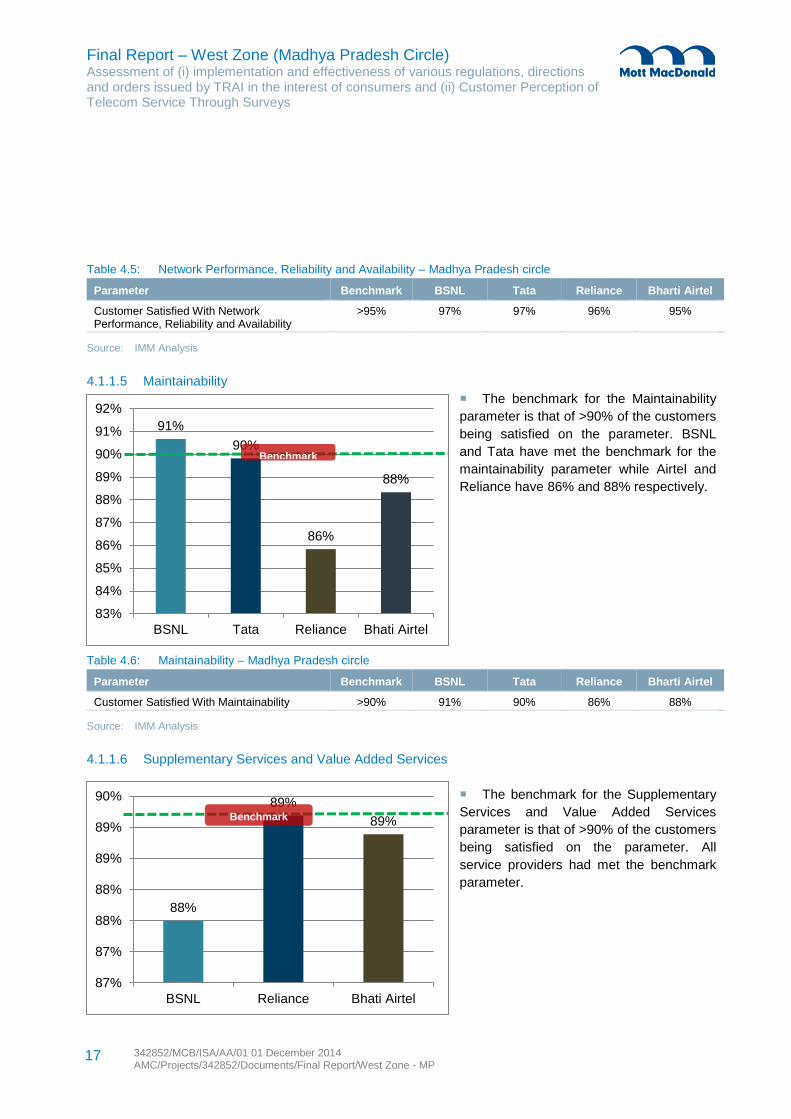
Final Report – West Zone (Madhya Pradesh Circle) Assessment of (i) implementation and effectiveness of various regulations, directions and orders issued by TRAI in the interest of consumers and (ii) Customer Perception of Telecom Service Through Surveys
342852/MCB/ISA/AA/01 01 December 2014 AMC/Projects/342852/Documents/Final Report/West Zone - MP
17
91%
90%
86%
88%
83%
84%
85%
86%
87%
88%
89%
90%
91%
92%
BSNL Tata Reliance Bhati Airtel
Benchmark
88%
89%
89%
87%
87%
88%
88%
89%
89%
90%
BSNL Reliance Bhati Airtel
Benchmark
Table 4.5: Network Performance, Reliability and Availability – Madhya Pradesh circle
Parameter Benchmark BSNL Tata Reliance Bharti Airtel
Customer Satisfied With Network Performance, Reliability and Availability
>95% 97% 97% 96% 95%
Source: IMM Analysis
4.1.1.5 Maintainability
The benchmark for the Maintainability
parameter is that of >90% of the customers
being satisfied on the parameter. BSNL
and Tata have met the benchmark for the
maintainability parameter while Airtel and
Reliance have 86% and 88% respectively.
Table 4.6: Maintainability – Madhya Pradesh circle
Parameter Benchmark BSNL Tata Reliance Bharti Airtel
Customer Satisfied With Maintainability >90% 91% 90% 86% 88%
Source: IMM Analysis
4.1.1.6 Supplementary Services and Value Added Services
The benchmark for the Supplementary
Services and Value Added Services
parameter is that of >90% of the customers
being satisfied on the parameter. All
service providers had met the benchmark
parameter.
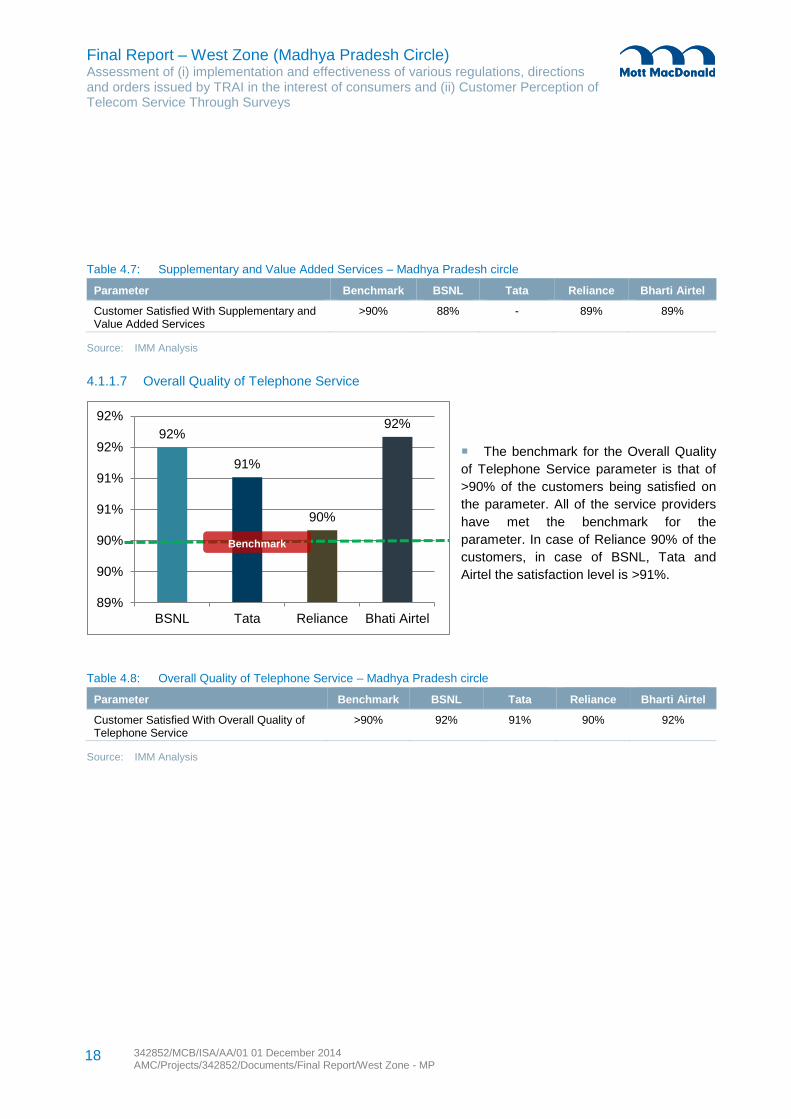
Final Report – West Zone (Madhya Pradesh Circle) Assessment of (i) implementation and effectiveness of various regulations, directions and orders issued by TRAI in the interest of consumers and (ii) Customer Perception of Telecom Service Through Surveys
342852/MCB/ISA/AA/01 01 December 2014 AMC/Projects/342852/Documents/Final Report/West Zone - MP
18
92%
91%
90%
92%
89%
90%
90%
91%
91%
92%
92%
BSNL Tata Reliance Bhati Airtel
Benchmark
Table 4.7: Supplementary and Value Added Services – Madhya Pradesh circle
Parameter Benchmark BSNL Tata Reliance Bharti Airtel
Customer Satisfied With Supplementary and Value Added Services
>90% 88% - 89% 89%
Source: IMM Analysis
4.1.1.7 Overall Quality of Telephone Service
The benchmark for the Overall Quality
of Telephone Service parameter is that of
>90% of the customers being satisfied on
the parameter. All of the service providers
have met the benchmark for the
parameter. In case of Reliance 90% of the
customers, in case of BSNL, Tata and
Airtel the satisfaction level is >91%.
Table 4.8: Overall Quality of Telephone Service – Madhya Pradesh circle
Parameter Benchmark BSNL Tata Reliance Bharti Airtel
Customer Satisfied With Overall Quality of Telephone Service
>90% 92% 91% 90% 92%
Source: IMM Analysis
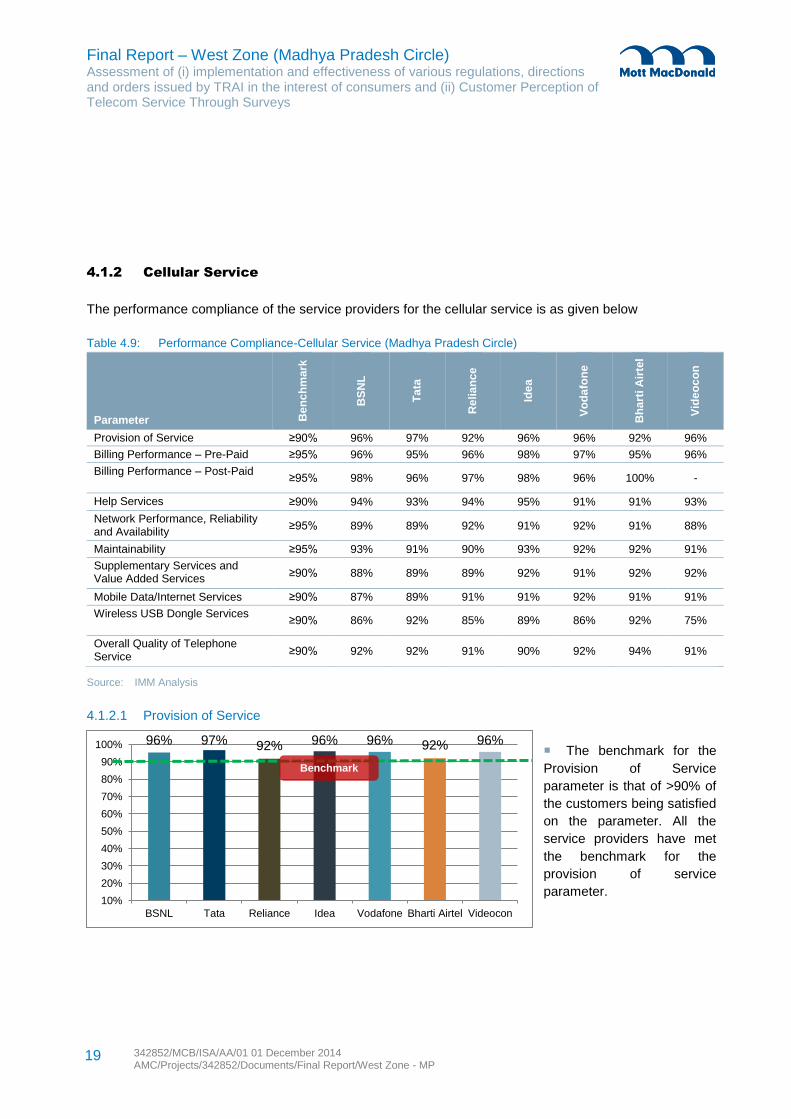
Final Report – West Zone (Madhya Pradesh Circle) Assessment of (i) implementation and effectiveness of various regulations, directions and orders issued by TRAI in the interest of consumers and (ii) Customer Perception of Telecom Service Through Surveys
342852/MCB/ISA/AA/01 01 December 2014 AMC/Projects/342852/Documents/Final Report/West Zone - MP
19
96% 97% 92% 96% 96% 92% 96%
10%
20%
30%
40%
50%
60%
70%
80%
90%
100%
BSNL Tata Reliance Idea Vodafone Bharti Airtel Videocon
Benchmark
4.1.2 Cellular Service
The performance compliance of the service providers for the cellular service is as given below
Table 4.9: Performance Compliance-Cellular Service (Madhya Pradesh Circle)
Parameter Be
nc
hm
ark
BS
NL
Ta
ta
Re
lia
nce
Ide
a
Vo
da
fon
e
Bh
art
i A
irte
l
Vid
eo
co
n
Provision of Service ≥90% 96% 97% 92% 96% 96% 92% 96%
Billing Performance – Pre-Paid ≥95% 96% 95% 96% 98% 97% 95% 96%
Billing Performance – Post-Paid ≥95% 98% 96% 97% 98% 96% 100% -
Help Services ≥90% 94% 93% 94% 95% 91% 91% 93%
Network Performance, Reliability and Availability
≥95% 89% 89% 92% 91% 92% 91% 88%
Maintainability ≥95% 93% 91% 90% 93% 92% 92% 91%
Supplementary Services and Value Added Services
≥90% 88% 89% 89% 92% 91% 92% 92%
Mobile Data/Internet Services ≥90% 87% 89% 91% 91% 92% 91% 91%
Wireless USB Dongle Services ≥90% 86% 92% 85% 89% 86% 92% 75%
Overall Quality of Telephone Service
≥90% 92% 92% 91% 90% 92% 94% 91%
Source: IMM Analysis
4.1.2.1 Provision of Service
The benchmark for the
Provision of Service
parameter is that of >90% of
the customers being satisfied
on the parameter. All the
service providers have met
the benchmark for the
provision of service
parameter.
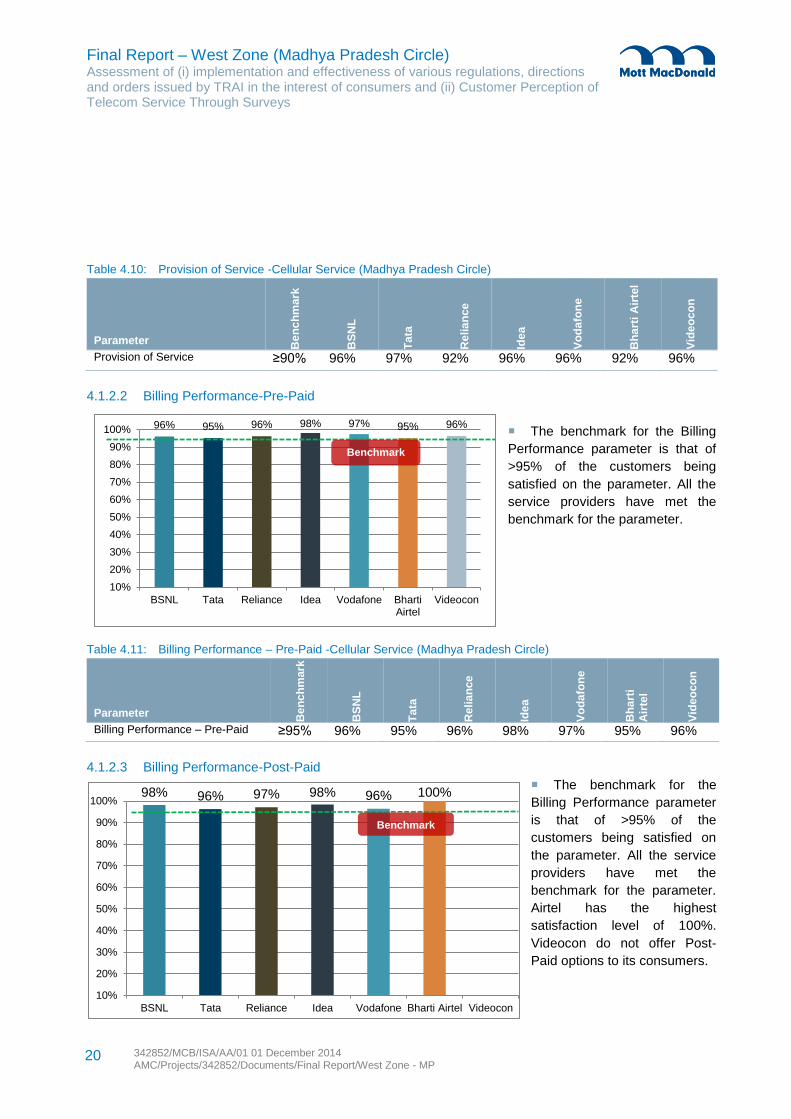
Final Report – West Zone (Madhya Pradesh Circle) Assessment of (i) implementation and effectiveness of various regulations, directions and orders issued by TRAI in the interest of consumers and (ii) Customer Perception of Telecom Service Through Surveys
342852/MCB/ISA/AA/01 01 December 2014 AMC/Projects/342852/Documents/Final Report/West Zone - MP
20
96% 95% 96% 98% 97% 95% 96%
10%
20%
30%
40%
50%
60%
70%
80%
90%
100%
BSNL Tata Reliance Idea Vodafone BhartiAirtel
Videocon
Benchmark
98% 96% 97% 98% 96% 100%
10%
20%
30%
40%
50%
60%
70%
80%
90%
100%
BSNL Tata Reliance Idea Vodafone Bharti Airtel Videocon
Benchmark
Table 4.10: Provision of Service -Cellular Service (Madhya Pradesh Circle)
Parameter
Be
nc
hm
ark
BS
NL
Ta
ta
Re
lia
nce
Ide
a
Vo
da
fon
e
Bh
art
i A
irte
l
Vid
eo
co
n
Provision of Service ≥90% 96% 97% 92% 96% 96% 92% 96%
4.1.2.2 Billing Performance-Pre-Paid
The benchmark for the Billing
Performance parameter is that of
>95% of the customers being
satisfied on the parameter. All the
service providers have met the
benchmark for the parameter.
Table 4.11: Billing Performance – Pre-Paid -Cellular Service (Madhya Pradesh Circle)
Parameter
Be
nc
hm
ark
BS
NL
Ta
ta
Re
lia
nce
Ide
a
Vo
da
fon
e
Bh
art
i
Air
tel
Vid
eo
co
n
Billing Performance – Pre-Paid ≥95% 96% 95% 96% 98% 97% 95% 96%
4.1.2.3 Billing Performance-Post-Paid
The benchmark for the
Billing Performance parameter
is that of >95% of the
customers being satisfied on
the parameter. All the service
providers have met the
benchmark for the parameter.
Airtel has the highest
satisfaction level of 100%.
Videocon do not offer Post-
Paid options to its consumers.
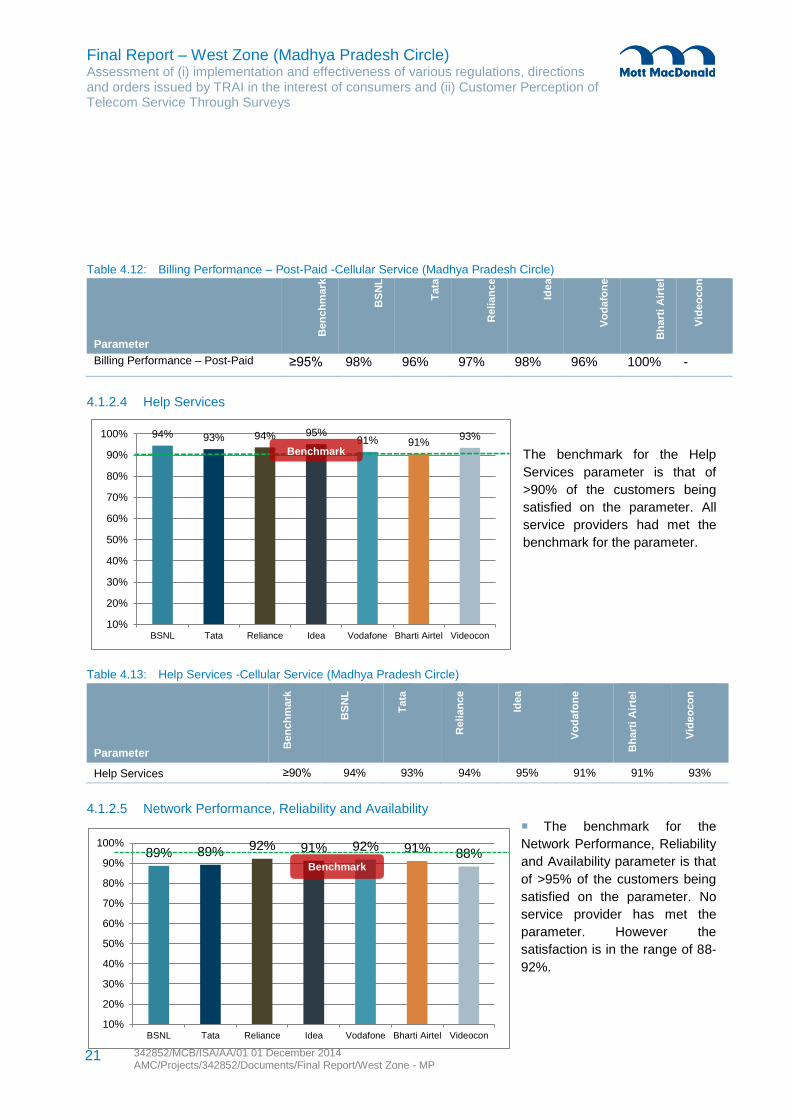
Final Report – West Zone (Madhya Pradesh Circle) Assessment of (i) implementation and effectiveness of various regulations, directions and orders issued by TRAI in the interest of consumers and (ii) Customer Perception of Telecom Service Through Surveys
342852/MCB/ISA/AA/01 01 December 2014 AMC/Projects/342852/Documents/Final Report/West Zone - MP
21
94% 93% 94% 95% 91% 91%
93%
10%
20%
30%
40%
50%
60%
70%
80%
90%
100%
BSNL Tata Reliance Idea Vodafone Bharti Airtel Videocon
Benchmark
89% 89% 92% 91% 92% 91% 88%
10%
20%
30%
40%
50%
60%
70%
80%
90%
100%
BSNL Tata Reliance Idea Vodafone Bharti Airtel Videocon
Benchmark
Table 4.12: Billing Performance – Post-Paid -Cellular Service (Madhya Pradesh Circle)
Parameter
Ben
ch
mark
BS
NL
Tata
Reli
an
ce
Ide
a
Vo
da
fon
e
Bh
art
i A
irte
l
Vid
eo
co
n
Billing Performance – Post-Paid ≥95% 98% 96% 97% 98% 96% 100% -
4.1.2.4 Help Services
The benchmark for the Help
Services parameter is that of
>90% of the customers being
satisfied on the parameter. All
service providers had met the
benchmark for the parameter.
Table 4.13: Help Services -Cellular Service (Madhya Pradesh Circle)
Parameter
Ben
ch
mark
BS
NL
Ta
ta
Reli
an
ce
Ide
a
Vo
da
fon
e
Bh
art
i A
irte
l
Vid
eo
co
n
Help Services ≥90% 94% 93% 94% 95% 91% 91% 93%
4.1.2.5 Network Performance, Reliability and Availability
The benchmark for the
Network Performance, Reliability
and Availability parameter is that
of >95% of the customers being
satisfied on the parameter. No
service provider has met the
parameter. However the
satisfaction is in the range of 88-
92%.
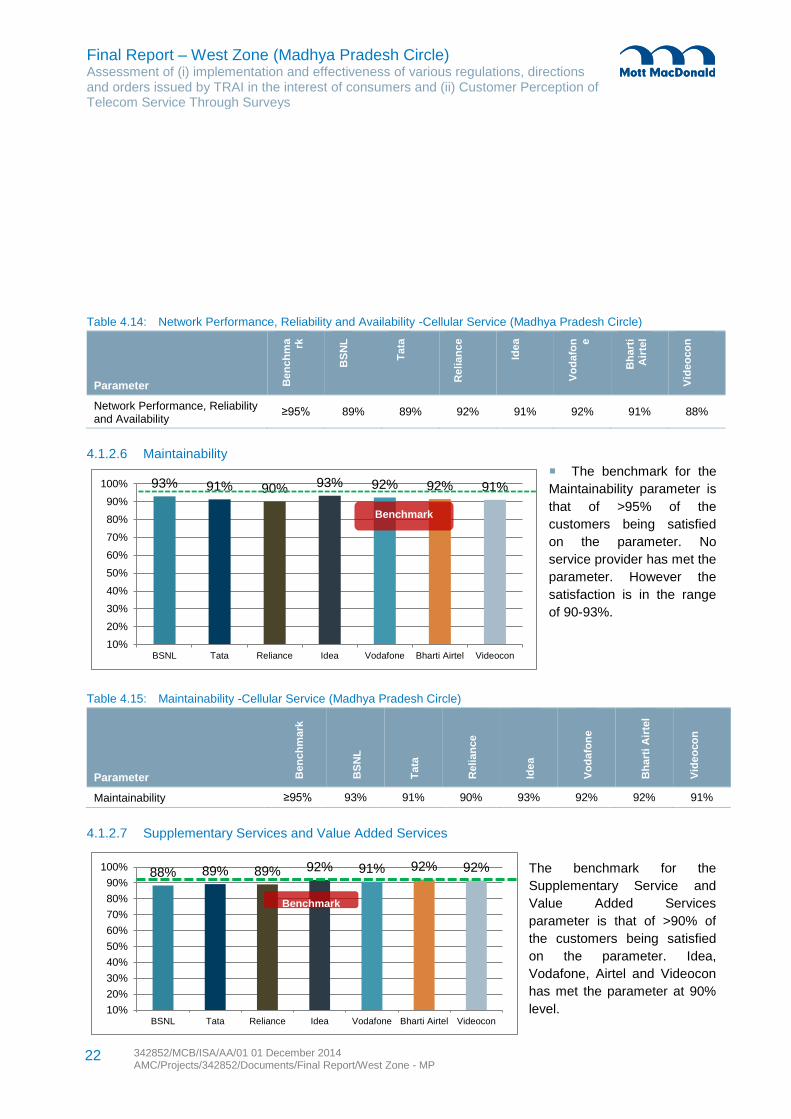
Final Report – West Zone (Madhya Pradesh Circle) Assessment of (i) implementation and effectiveness of various regulations, directions and orders issued by TRAI in the interest of consumers and (ii) Customer Perception of Telecom Service Through Surveys
342852/MCB/ISA/AA/01 01 December 2014 AMC/Projects/342852/Documents/Final Report/West Zone - MP
22
93% 91% 90% 93% 92% 92% 91%
10%
20%
30%
40%
50%
60%
70%
80%
90%
100%
BSNL Tata Reliance Idea Vodafone Bharti Airtel Videocon
Benchmark
88% 89% 89% 92% 91% 92% 92%
10%
20%
30%
40%
50%
60%
70%
80%
90%
100%
BSNL Tata Reliance Idea Vodafone Bharti Airtel Videocon
Benchmark
Table 4.14: Network Performance, Reliability and Availability -Cellular Service (Madhya Pradesh Circle)
Parameter Ben
ch
ma rk
BS
NL
Tata
Reli
an
ce
Ide
a
Vo
da
fon e
Bh
art
i A
irte
l
Vid
eo
co
n
Network Performance, Reliability and Availability
≥95% 89% 89% 92% 91% 92% 91% 88%
4.1.2.6 Maintainability
The benchmark for the
Maintainability parameter is
that of >95% of the
customers being satisfied
on the parameter. No
service provider has met the
parameter. However the
satisfaction is in the range
of 90-93%.
Table 4.15: Maintainability -Cellular Service (Madhya Pradesh Circle)
Parameter Ben
ch
mark
BS
NL
Ta
ta
Reli
an
ce
Ide
a
Vo
da
fon
e
Bh
art
i A
irte
l
Vid
eo
co
n
Maintainability ≥95% 93% 91% 90% 93% 92% 92% 91%
4.1.2.7 Supplementary Services and Value Added Services
The benchmark for the
Supplementary Service and
Value Added Services
parameter is that of >90% of
the customers being satisfied
on the parameter. Idea,
Vodafone, Airtel and Videocon
has met the parameter at 90%
level.
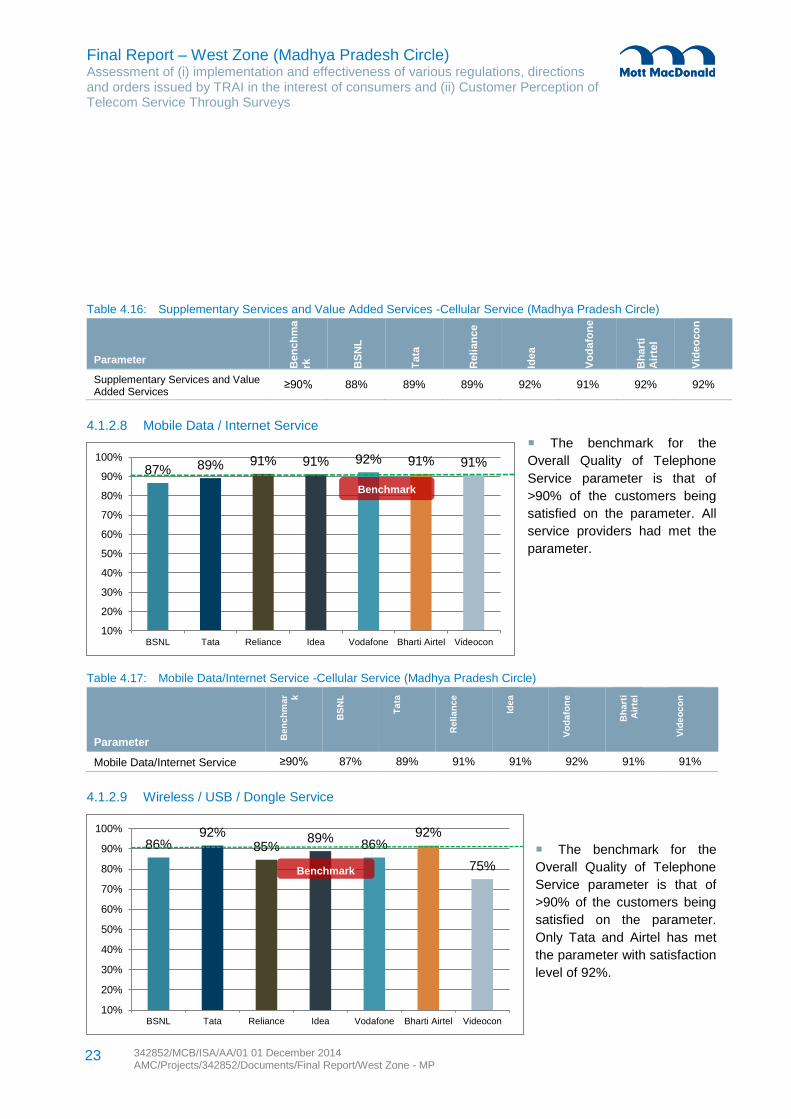
Final Report – West Zone (Madhya Pradesh Circle) Assessment of (i) implementation and effectiveness of various regulations, directions and orders issued by TRAI in the interest of consumers and (ii) Customer Perception of Telecom Service Through Surveys
342852/MCB/ISA/AA/01 01 December 2014 AMC/Projects/342852/Documents/Final Report/West Zone - MP
23
87% 89% 91% 91% 92% 91% 91%
10%
20%
30%
40%
50%
60%
70%
80%
90%
100%
BSNL Tata Reliance Idea Vodafone Bharti Airtel Videocon
Benchmark
86% 92%
85% 89%
86% 92%
75%
10%
20%
30%
40%
50%
60%
70%
80%
90%
100%
BSNL Tata Reliance Idea Vodafone Bharti Airtel Videocon
Benchmark
Table 4.16: Supplementary Services and Value Added Services -Cellular Service (Madhya Pradesh Circle)
Parameter
Ben
ch
ma
rk
BS
NL
Ta
ta
Reli
an
ce
Ide
a
Vo
da
fon
e
Bh
art
i A
irte
l
Vid
eo
co
n
Supplementary Services and Value Added Services
≥90% 88% 89% 89% 92% 91% 92% 92%
4.1.2.8 Mobile Data / Internet Service
The benchmark for the
Overall Quality of Telephone
Service parameter is that of
>90% of the customers being
satisfied on the parameter. All
service providers had met the
parameter.
Table 4.17: Mobile Data/Internet Service -Cellular Service (Madhya Pradesh Circle)
Parameter
Ben
ch
mar k
BS
NL
Ta
ta
Relia
nce
Ide
a
Vo
dafo
ne
Bh
art
i A
irte
l
Vid
eo
co
n
Mobile Data/Internet Service ≥90% 87% 89% 91% 91% 92% 91% 91%
4.1.2.9 Wireless / USB / Dongle Service
The benchmark for the
Overall Quality of Telephone
Service parameter is that of
>90% of the customers being
satisfied on the parameter.
Only Tata and Airtel has met
the parameter with satisfaction
level of 92%.
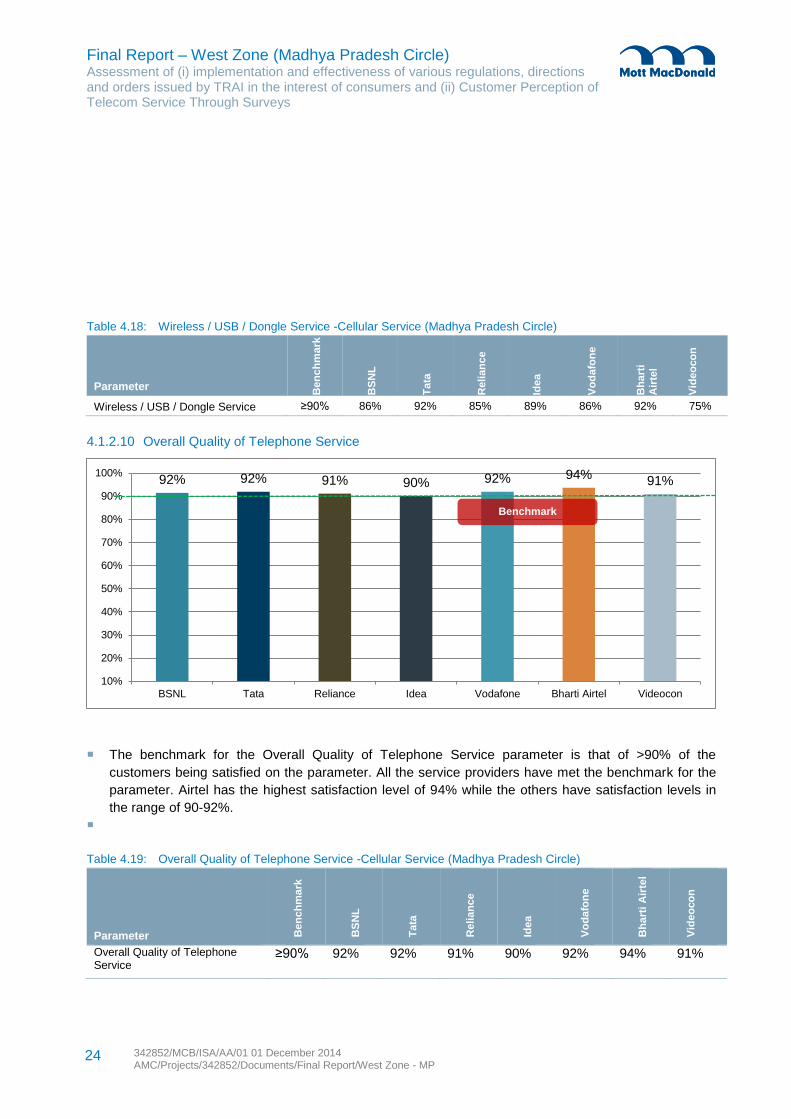
Final Report – West Zone (Madhya Pradesh Circle) Assessment of (i) implementation and effectiveness of various regulations, directions and orders issued by TRAI in the interest of consumers and (ii) Customer Perception of Telecom Service Through Surveys
342852/MCB/ISA/AA/01 01 December 2014 AMC/Projects/342852/Documents/Final Report/West Zone - MP
24
92% 92% 91% 90% 92% 94% 91%
10%
20%
30%
40%
50%
60%
70%
80%
90%
100%
BSNL Tata Reliance Idea Vodafone Bharti Airtel Videocon
Benchmark
Table 4.18: Wireless / USB / Dongle Service -Cellular Service (Madhya Pradesh Circle)
Parameter
Ben
ch
mark
BS
NL
Ta
ta
Reli
an
ce
Ide
a
Vo
da
fon
e
Bh
art
i A
irte
l
Vid
eo
co
n
Wireless / USB / Dongle Service ≥90% 86% 92% 85% 89% 86% 92% 75%
4.1.2.10 Overall Quality of Telephone Service
The benchmark for the Overall Quality of Telephone Service parameter is that of >90% of the
customers being satisfied on the parameter. All the service providers have met the benchmark for the
parameter. Airtel has the highest satisfaction level of 94% while the others have satisfaction levels in
the range of 90-92%.
Table 4.19: Overall Quality of Telephone Service -Cellular Service (Madhya Pradesh Circle)
Parameter Ben
ch
mark
BS
NL
Ta
ta
Reli
an
ce
Ide
a
Vo
da
fon
e
Bh
art
i A
irte
l
Vid
eo
co
n
Overall Quality of Telephone Service
≥90% 92% 92% 91% 90% 92% 94% 91%
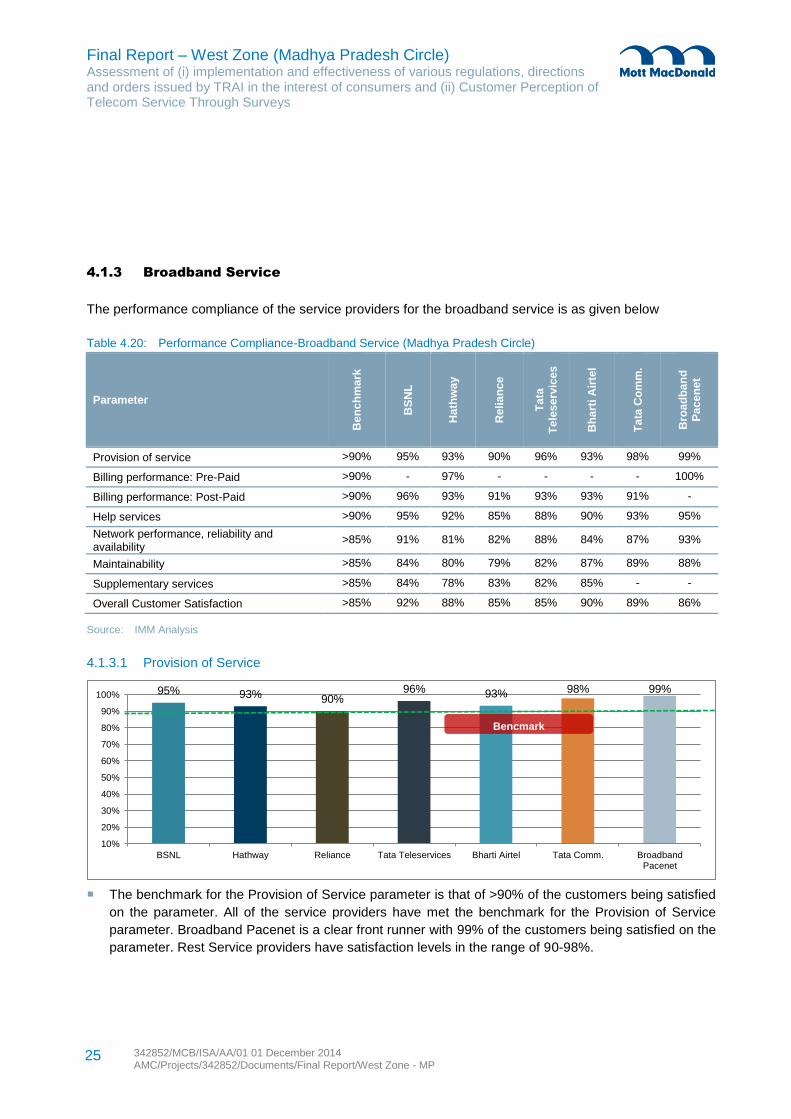
Final Report – West Zone (Madhya Pradesh Circle) Assessment of (i) implementation and effectiveness of various regulations, directions and orders issued by TRAI in the interest of consumers and (ii) Customer Perception of Telecom Service Through Surveys
342852/MCB/ISA/AA/01 01 December 2014 AMC/Projects/342852/Documents/Final Report/West Zone - MP
25
95% 93% 90% 96% 93% 98% 99%
10%
20%
30%
40%
50%
60%
70%
80%
90%
100%
BSNL Hathway Reliance Tata Teleservices Bharti Airtel Tata Comm. BroadbandPacenet
Bencmark
4.1.3 Broadband Service
The performance compliance of the service providers for the broadband service is as given below
Table 4.20: Performance Compliance-Broadband Service (Madhya Pradesh Circle)
Parameter
Be
nc
hm
ark
BS
NL
Ha
thw
ay
Re
lia
nce
Ta
ta
Te
les
erv
ices
Bh
art
i A
irte
l
Ta
ta C
om
m.
Bro
ad
ba
nd
P
ace
ne
t
Provision of service >90% 95% 93% 90% 96% 93% 98% 99%
Billing performance: Pre-Paid >90% - 97% - - - - 100%
Billing performance: Post-Paid >90% 96% 93% 91% 93% 93% 91% -
Help services >90% 95% 92% 85% 88% 90% 93% 95%
Network performance, reliability and availability
>85% 91% 81% 82% 88% 84% 87% 93%
Maintainability >85% 84% 80% 79% 82% 87% 89% 88%
Supplementary services >85% 84% 78% 83% 82% 85% - -
Overall Customer Satisfaction >85% 92% 88% 85% 85% 90% 89% 86%
Source: IMM Analysis
4.1.3.1 Provision of Service
The benchmark for the Provision of Service parameter is that of >90% of the customers being satisfied
on the parameter. All of the service providers have met the benchmark for the Provision of Service
parameter. Broadband Pacenet is a clear front runner with 99% of the customers being satisfied on the
parameter. Rest Service providers have satisfaction levels in the range of 90-98%.
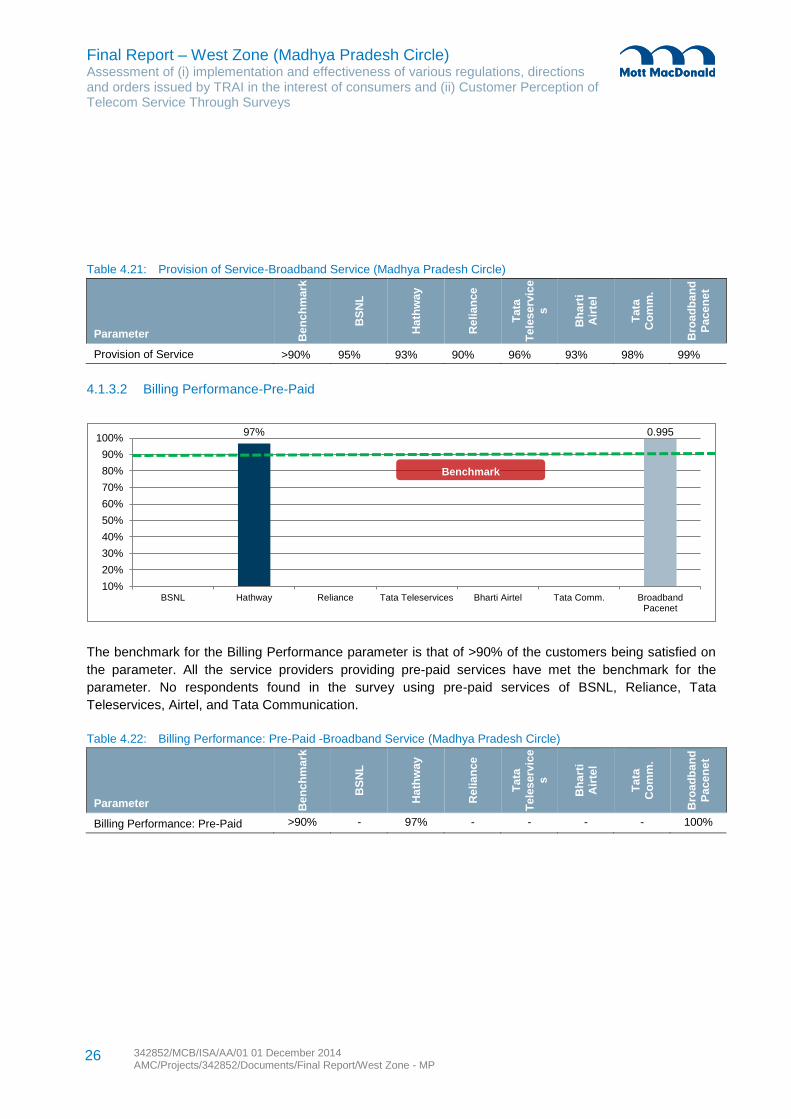
Final Report – West Zone (Madhya Pradesh Circle) Assessment of (i) implementation and effectiveness of various regulations, directions and orders issued by TRAI in the interest of consumers and (ii) Customer Perception of Telecom Service Through Surveys
342852/MCB/ISA/AA/01 01 December 2014 AMC/Projects/342852/Documents/Final Report/West Zone - MP
26
97% 0.995
10%
20%
30%
40%
50%
60%
70%
80%
90%
100%
BSNL Hathway Reliance Tata Teleservices Bharti Airtel Tata Comm. BroadbandPacenet
Benchmark
Table 4.21: Provision of Service-Broadband Service (Madhya Pradesh Circle)
Parameter Be
nc
hm
ark
BS
NL
Ha
thw
ay
Re
lia
nce
Ta
ta
Te
les
erv
ice
s
Bh
art
i
Air
tel
Ta
ta
Co
mm
.
Bro
ad
ba
nd
Pa
ce
ne
t
Provision of Service >90% 95% 93% 90% 96% 93% 98% 99%
4.1.3.2 Billing Performance-Pre-Paid
The benchmark for the Billing Performance parameter is that of >90% of the customers being satisfied on
the parameter. All the service providers providing pre-paid services have met the benchmark for the
parameter. No respondents found in the survey using pre-paid services of BSNL, Reliance, Tata
Teleservices, Airtel, and Tata Communication.
Table 4.22: Billing Performance: Pre-Paid -Broadband Service (Madhya Pradesh Circle)
Parameter Be
nc
hm
ark
BS
NL
Ha
thw
ay
Re
lia
nce
Ta
ta
Te
les
erv
ice
s
Bh
art
i
Air
tel
Ta
ta
Co
mm
.
Bro
ad
ba
nd
Pa
ce
ne
t
Billing Performance: Pre-Paid >90% - 97% - - - - 100%
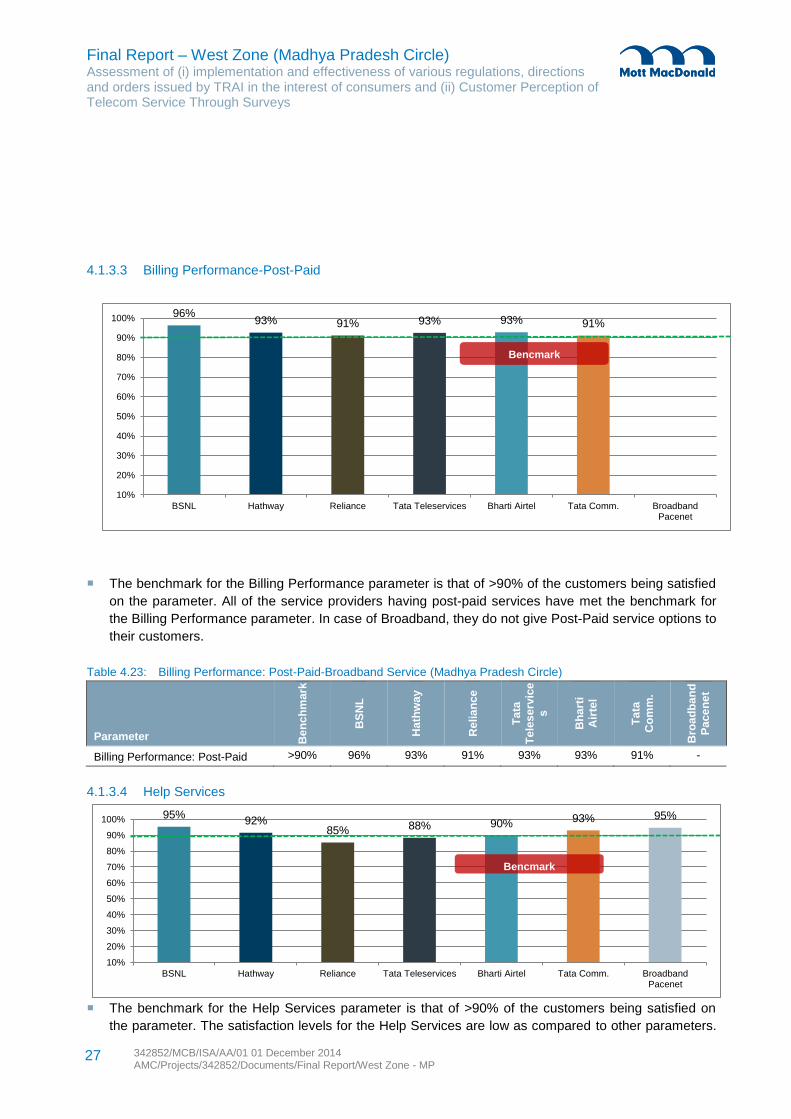
Final Report – West Zone (Madhya Pradesh Circle) Assessment of (i) implementation and effectiveness of various regulations, directions and orders issued by TRAI in the interest of consumers and (ii) Customer Perception of Telecom Service Through Surveys
342852/MCB/ISA/AA/01 01 December 2014 AMC/Projects/342852/Documents/Final Report/West Zone - MP
27
96% 93% 91% 93% 93% 91%
10%
20%
30%
40%
50%
60%
70%
80%
90%
100%
BSNL Hathway Reliance Tata Teleservices Bharti Airtel Tata Comm. BroadbandPacenet
Bencmark
95% 92%
85% 88% 90% 93% 95%
10%
20%
30%
40%
50%
60%
70%
80%
90%
100%
BSNL Hathway Reliance Tata Teleservices Bharti Airtel Tata Comm. BroadbandPacenet
Bencmark
4.1.3.3 Billing Performance-Post-Paid
The benchmark for the Billing Performance parameter is that of >90% of the customers being satisfied
on the parameter. All of the service providers having post-paid services have met the benchmark for
the Billing Performance parameter. In case of Broadband, they do not give Post-Paid service options to
their customers.
Table 4.23: Billing Performance: Post-Paid-Broadband Service (Madhya Pradesh Circle)
Parameter Be
nc
hm
ark
BS
NL
Ha
thw
ay
Re
lia
nce
Ta
ta
Te
les
erv
ice
s
Bh
art
i
Air
tel
Ta
ta
Co
mm
.
Bro
ad
ba
nd
Pa
ce
ne
t
Billing Performance: Post-Paid >90% 96% 93% 91% 93% 93% 91% -
4.1.3.4 Help Services
The benchmark for the Help Services parameter is that of >90% of the customers being satisfied on
the parameter. The satisfaction levels for the Help Services are low as compared to other parameters.
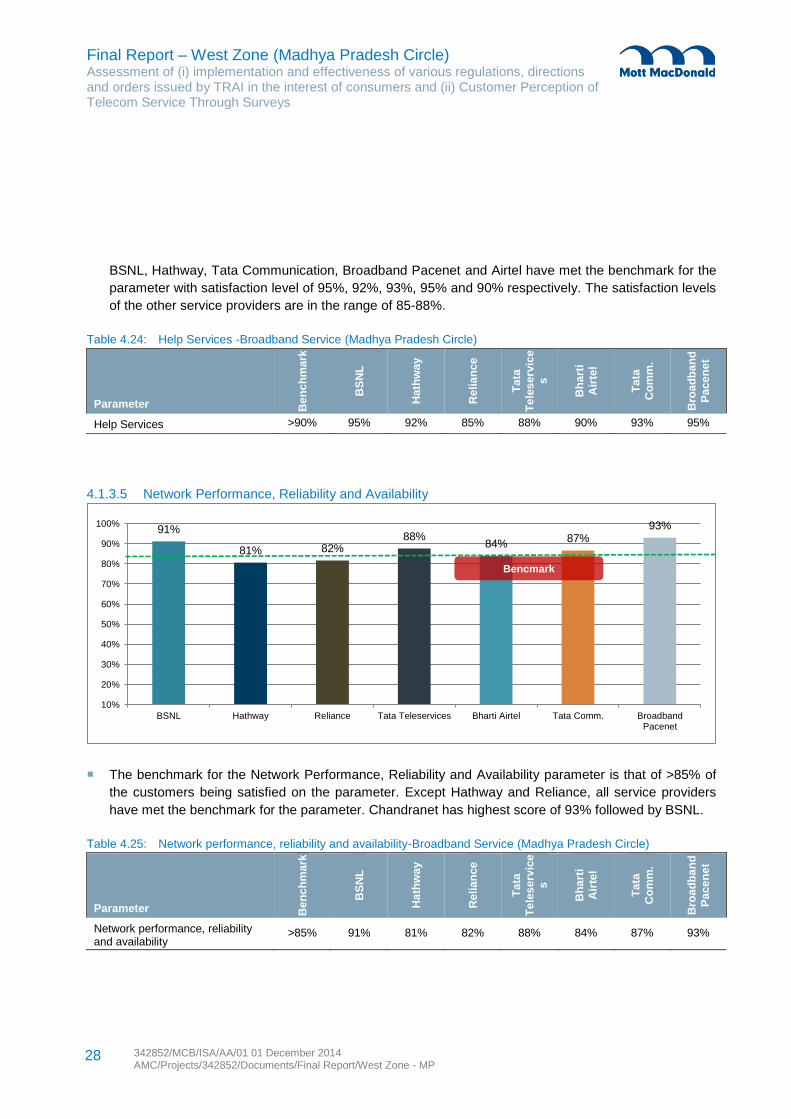
Final Report – West Zone (Madhya Pradesh Circle) Assessment of (i) implementation and effectiveness of various regulations, directions and orders issued by TRAI in the interest of consumers and (ii) Customer Perception of Telecom Service Through Surveys
342852/MCB/ISA/AA/01 01 December 2014 AMC/Projects/342852/Documents/Final Report/West Zone - MP
28
91%
81% 82% 88%
84% 87%
93%
10%
20%
30%
40%
50%
60%
70%
80%
90%
100%
BSNL Hathway Reliance Tata Teleservices Bharti Airtel Tata Comm. BroadbandPacenet
Bencmark
BSNL, Hathway, Tata Communication, Broadband Pacenet and Airtel have met the benchmark for the
parameter with satisfaction level of 95%, 92%, 93%, 95% and 90% respectively. The satisfaction levels
of the other service providers are in the range of 85-88%.
Table 4.24: Help Services -Broadband Service (Madhya Pradesh Circle)
Parameter Be
nc
hm
ark
BS
NL
Ha
thw
ay
Re
lia
nce
Ta
ta
Te
les
erv
ice
s
Bh
art
i
Air
tel
Ta
ta
Co
mm
.
Bro
ad
ba
nd
Pa
ce
ne
t
Help Services >90% 95% 92% 85% 88% 90% 93% 95%
4.1.3.5 Network Performance, Reliability and Availability
The benchmark for the Network Performance, Reliability and Availability parameter is that of >85% of
the customers being satisfied on the parameter. Except Hathway and Reliance, all service providers
have met the benchmark for the parameter. Chandranet has highest score of 93% followed by BSNL.
Table 4.25: Network performance, reliability and availability-Broadband Service (Madhya Pradesh Circle)
Parameter Be
nc
hm
ark
BS
NL
Ha
thw
ay
Re
lia
nce
Ta
ta
Te
les
erv
ice
s
Bh
art
i
Air
tel
Ta
ta
Co
mm
.
Bro
ad
ba
nd
Pa
ce
ne
t
Network performance, reliability and availability
>85% 91% 81% 82% 88% 84% 87% 93%
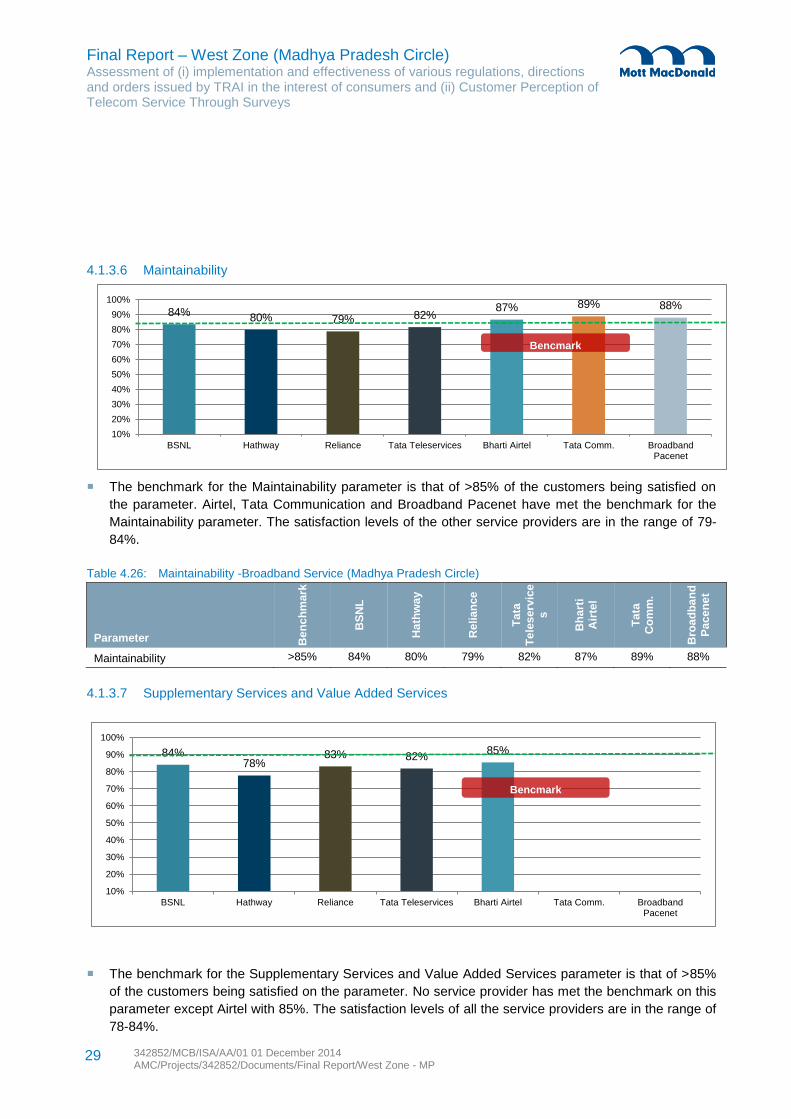
Final Report – West Zone (Madhya Pradesh Circle) Assessment of (i) implementation and effectiveness of various regulations, directions and orders issued by TRAI in the interest of consumers and (ii) Customer Perception of Telecom Service Through Surveys
342852/MCB/ISA/AA/01 01 December 2014 AMC/Projects/342852/Documents/Final Report/West Zone - MP
29
84% 80% 79% 82%
87% 89% 88%
10%
20%
30%
40%
50%
60%
70%
80%
90%
100%
BSNL Hathway Reliance Tata Teleservices Bharti Airtel Tata Comm. BroadbandPacenet
Bencmark
84% 78%
83% 82% 85%
10%
20%
30%
40%
50%
60%
70%
80%
90%
100%
BSNL Hathway Reliance Tata Teleservices Bharti Airtel Tata Comm. BroadbandPacenet
Bencmark
4.1.3.6 Maintainability
The benchmark for the Maintainability parameter is that of >85% of the customers being satisfied on
the parameter. Airtel, Tata Communication and Broadband Pacenet have met the benchmark for the
Maintainability parameter. The satisfaction levels of the other service providers are in the range of 79-
84%.
Table 4.26: Maintainability -Broadband Service (Madhya Pradesh Circle)
Parameter Be
nc
hm
ark
BS
NL
Ha
thw
ay
Re
lia
nce
Ta
ta
Te
les
erv
ice
s
Bh
art
i
Air
tel
Ta
ta
Co
mm
.
Bro
ad
ba
nd
Pa
ce
ne
t
Maintainability >85% 84% 80% 79% 82% 87% 89% 88%
4.1.3.7 Supplementary Services and Value Added Services
The benchmark for the Supplementary Services and Value Added Services parameter is that of >85%
of the customers being satisfied on the parameter. No service provider has met the benchmark on this
parameter except Airtel with 85%. The satisfaction levels of all the service providers are in the range of
78-84%.
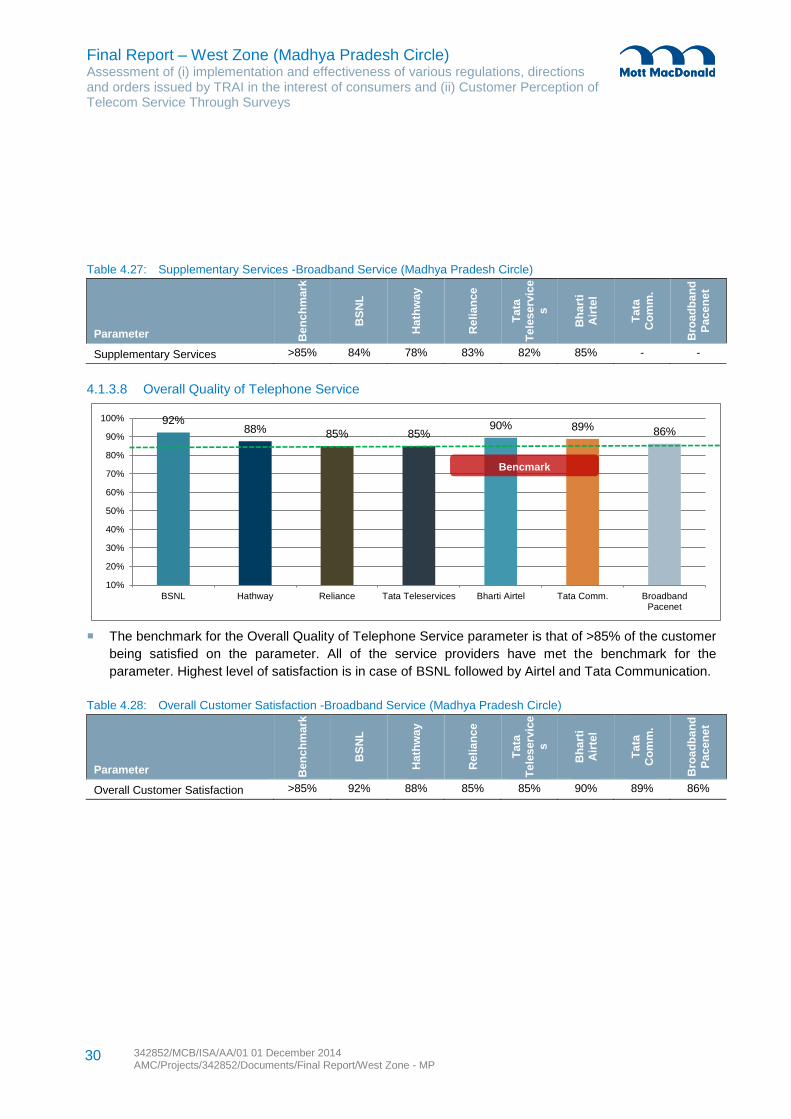
Final Report – West Zone (Madhya Pradesh Circle) Assessment of (i) implementation and effectiveness of various regulations, directions and orders issued by TRAI in the interest of consumers and (ii) Customer Perception of Telecom Service Through Surveys
342852/MCB/ISA/AA/01 01 December 2014 AMC/Projects/342852/Documents/Final Report/West Zone - MP
30
92% 88% 85% 85%
90% 89% 86%
10%
20%
30%
40%
50%
60%
70%
80%
90%
100%
BSNL Hathway Reliance Tata Teleservices Bharti Airtel Tata Comm. BroadbandPacenet
Bencmark
Table 4.27: Supplementary Services -Broadband Service (Madhya Pradesh Circle)
Parameter Be
nc
hm
ark
BS
NL
Ha
thw
ay
Re
lia
nce
Ta
ta
Te
les
erv
ice
s
Bh
art
i
Air
tel
Ta
ta
Co
mm
.
Bro
ad
ba
nd
Pa
ce
ne
t
Supplementary Services >85% 84% 78% 83% 82% 85% - -
4.1.3.8 Overall Quality of Telephone Service
The benchmark for the Overall Quality of Telephone Service parameter is that of >85% of the customer
being satisfied on the parameter. All of the service providers have met the benchmark for the
parameter. Highest level of satisfaction is in case of BSNL followed by Airtel and Tata Communication.
Table 4.28: Overall Customer Satisfaction -Broadband Service (Madhya Pradesh Circle)
Parameter Be
nc
hm
ark
BS
NL
Ha
thw
ay
Re
lia
nce
Ta
ta
Te
les
erv
ice
s
Bh
art
i
Air
tel
Ta
ta
Co
mm
.
Bro
ad
ba
nd
Pa
ce
ne
t
Overall Customer Satisfaction >85% 92% 88% 85% 85% 90% 89% 86%
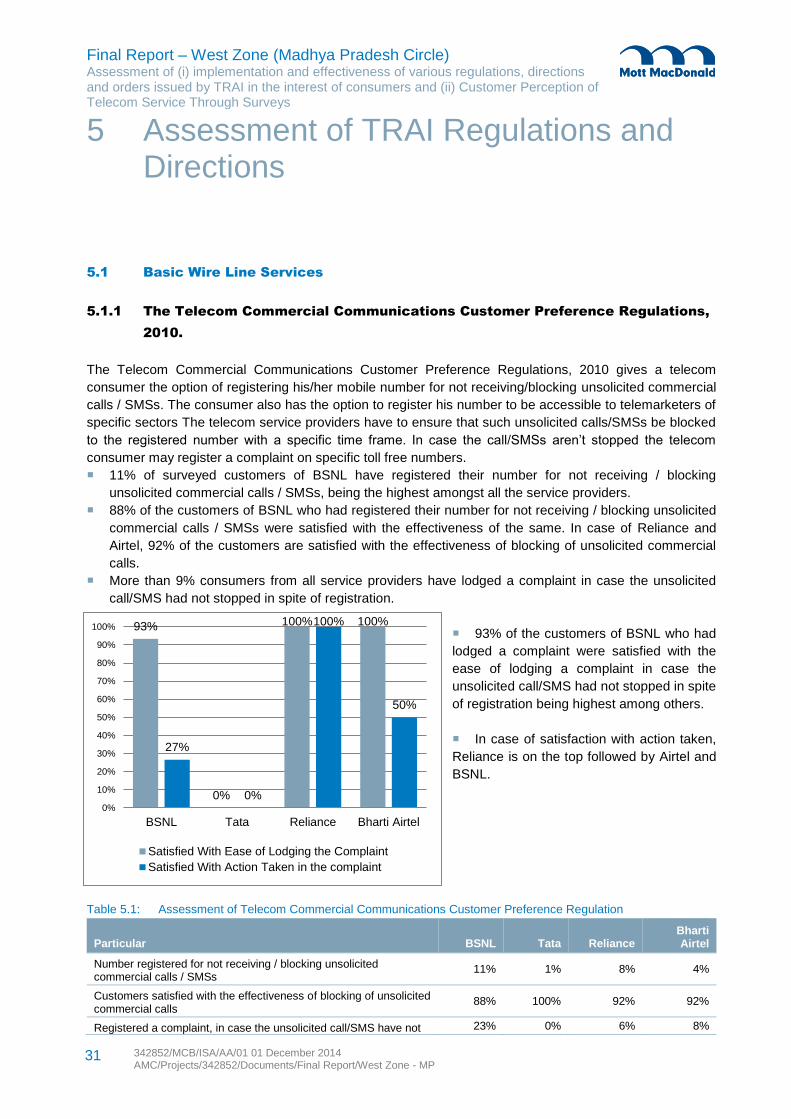
Final Report – West Zone (Madhya Pradesh Circle) Assessment of (i) implementation and effectiveness of various regulations, directions and orders issued by TRAI in the interest of consumers and (ii) Customer Perception of Telecom Service Through Surveys
342852/MCB/ISA/AA/01 01 December 2014 AMC/Projects/342852/Documents/Final Report/West Zone - MP
31
93%
0%
100% 100%
27%
0%
100%
50%
0%
10%
20%
30%
40%
50%
60%
70%
80%
90%
100%
BSNL Tata Reliance Bharti Airtel
Satisfied With Ease of Lodging the Complaint
Satisfied With Action Taken in the complaint
5.1 Basic Wire Line Services
5.1.1 The Telecom Commercial Communications Customer Preference Regulations,
2010.
The Telecom Commercial Communications Customer Preference Regulations, 2010 gives a telecom
consumer the option of registering his/her mobile number for not receiving/blocking unsolicited commercial
calls / SMSs. The consumer also has the option to register his number to be accessible to telemarketers of
specific sectors The telecom service providers have to ensure that such unsolicited calls/SMSs be blocked
to the registered number with a specific time frame. In case the call/SMSs aren’t stopped the telecom
consumer may register a complaint on specific toll free numbers.
11% of surveyed customers of BSNL have registered their number for not receiving / blocking
unsolicited commercial calls / SMSs, being the highest amongst all the service providers.
88% of the customers of BSNL who had registered their number for not receiving / blocking unsolicited
commercial calls / SMSs were satisfied with the effectiveness of the same. In case of Reliance and
Airtel, 92% of the customers are satisfied with the effectiveness of blocking of unsolicited commercial
calls.
More than 9% consumers from all service providers have lodged a complaint in case the unsolicited
call/SMS had not stopped in spite of registration.
93% of the customers of BSNL who had
lodged a complaint were satisfied with the
ease of lodging a complaint in case the
unsolicited call/SMS had not stopped in spite
of registration being highest among others.
In case of satisfaction with action taken,
Reliance is on the top followed by Airtel and
BSNL.
Table 5.1: Assessment of Telecom Commercial Communications Customer Preference Regulation
Particular BSNL Tata Reliance Bharti Airtel
Number registered for not receiving / blocking unsolicited commercial calls / SMSs
11% 1% 8% 4%
Customers satisfied with the effectiveness of blocking of unsolicited commercial calls
88% 100% 92% 92%
Registered a complaint, in case the unsolicited call/SMS have not 23% 0% 6% 8%
5 Assessment of TRAI Regulations and Directions
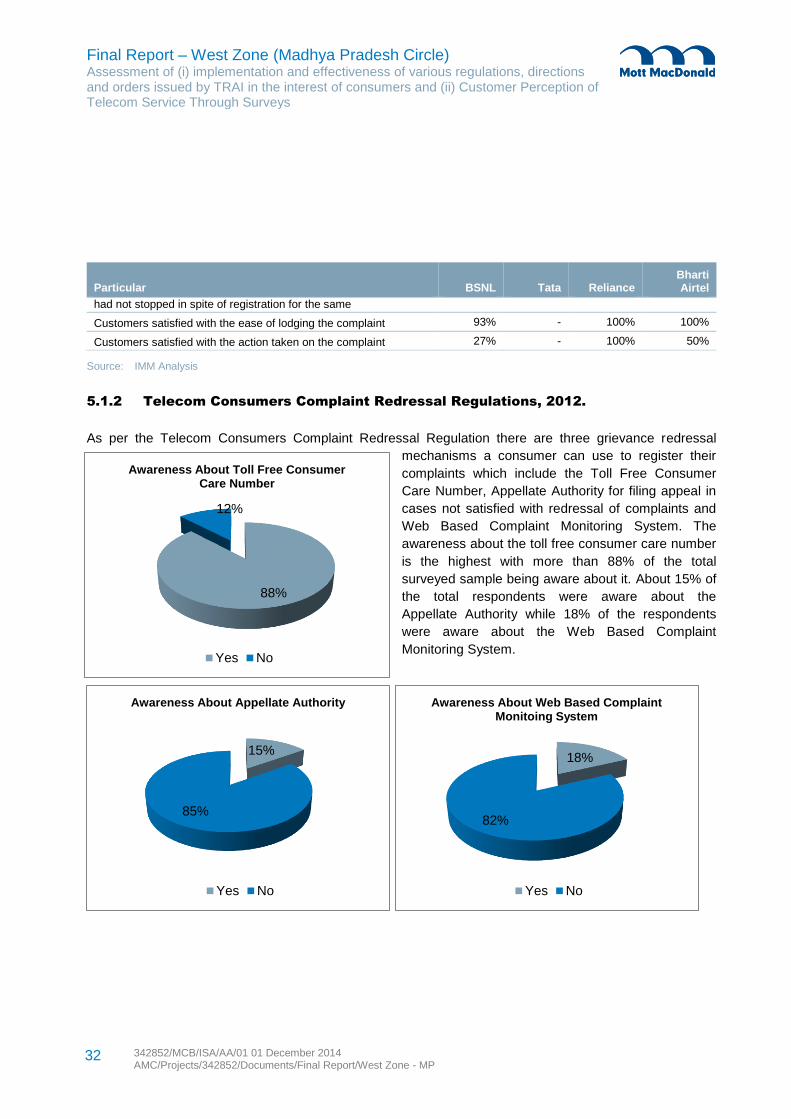
Final Report – West Zone (Madhya Pradesh Circle) Assessment of (i) implementation and effectiveness of various regulations, directions and orders issued by TRAI in the interest of consumers and (ii) Customer Perception of Telecom Service Through Surveys
342852/MCB/ISA/AA/01 01 December 2014 AMC/Projects/342852/Documents/Final Report/West Zone - MP
32
88%
12%
Awareness About Toll Free Consumer Care Number
Yes No
15%
85%
Awareness About Appellate Authority
Yes No
18%
82%
Awareness About Web Based Complaint Monitoing System
Yes No
Particular BSNL Tata Reliance Bharti Airtel
had not stopped in spite of registration for the same
Customers satisfied with the ease of lodging the complaint 93% - 100% 100%
Customers satisfied with the action taken on the complaint 27% - 100% 50%
Source: IMM Analysis
5.1.2 Telecom Consumers Complaint Redressal Regulations, 2012.
As per the Telecom Consumers Complaint Redressal Regulation there are three grievance redressal
mechanisms a consumer can use to register their
complaints which include the Toll Free Consumer
Care Number, Appellate Authority for filing appeal in
cases not satisfied with redressal of complaints and
Web Based Complaint Monitoring System. The
awareness about the toll free consumer care number
is the highest with more than 88% of the total
surveyed sample being aware about it. About 15% of
the total respondents were aware about the
Appellate Authority while 18% of the respondents
were aware about the Web Based Complaint
Monitoring System.
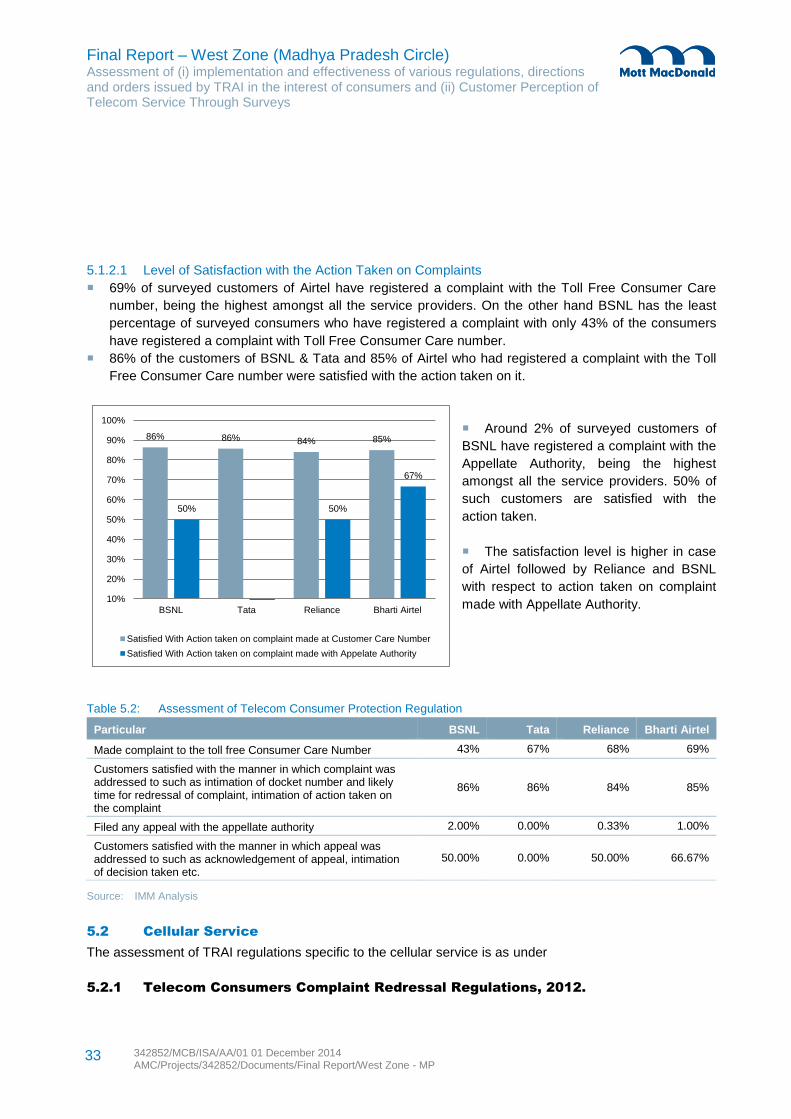
Final Report – West Zone (Madhya Pradesh Circle) Assessment of (i) implementation and effectiveness of various regulations, directions and orders issued by TRAI in the interest of consumers and (ii) Customer Perception of Telecom Service Through Surveys
342852/MCB/ISA/AA/01 01 December 2014 AMC/Projects/342852/Documents/Final Report/West Zone - MP
33
86% 86% 84% 85%
50% 50%
67%
10%
20%
30%
40%
50%
60%
70%
80%
90%
100%
BSNL Tata Reliance Bharti Airtel
Satisfied With Action taken on complaint made at Customer Care Number
Satisfied With Action taken on complaint made with Appelate Authority
5.1.2.1 Level of Satisfaction with the Action Taken on Complaints
69% of surveyed customers of Airtel have registered a complaint with the Toll Free Consumer Care
number, being the highest amongst all the service providers. On the other hand BSNL has the least
percentage of surveyed consumers who have registered a complaint with only 43% of the consumers
have registered a complaint with Toll Free Consumer Care number.
86% of the customers of BSNL & Tata and 85% of Airtel who had registered a complaint with the Toll
Free Consumer Care number were satisfied with the action taken on it.
Around 2% of surveyed customers of
BSNL have registered a complaint with the
Appellate Authority, being the highest
amongst all the service providers. 50% of
such customers are satisfied with the
action taken.
The satisfaction level is higher in case
of Airtel followed by Reliance and BSNL
with respect to action taken on complaint
made with Appellate Authority.
Table 5.2: Assessment of Telecom Consumer Protection Regulation
Particular BSNL Tata Reliance Bharti Airtel
Made complaint to the toll free Consumer Care Number 43% 67% 68% 69%
Customers satisfied with the manner in which complaint was addressed to such as intimation of docket number and likely time for redressal of complaint, intimation of action taken on the complaint
86% 86% 84% 85%
Filed any appeal with the appellate authority 2.00% 0.00% 0.33% 1.00%
Customers satisfied with the manner in which appeal was addressed to such as acknowledgement of appeal, intimation of decision taken etc.
50.00% 0.00% 50.00% 66.67%
Source: IMM Analysis
5.2 Cellular Service
The assessment of TRAI regulations specific to the cellular service is as under
5.2.1 Telecom Consumers Complaint Redressal Regulations, 2012.
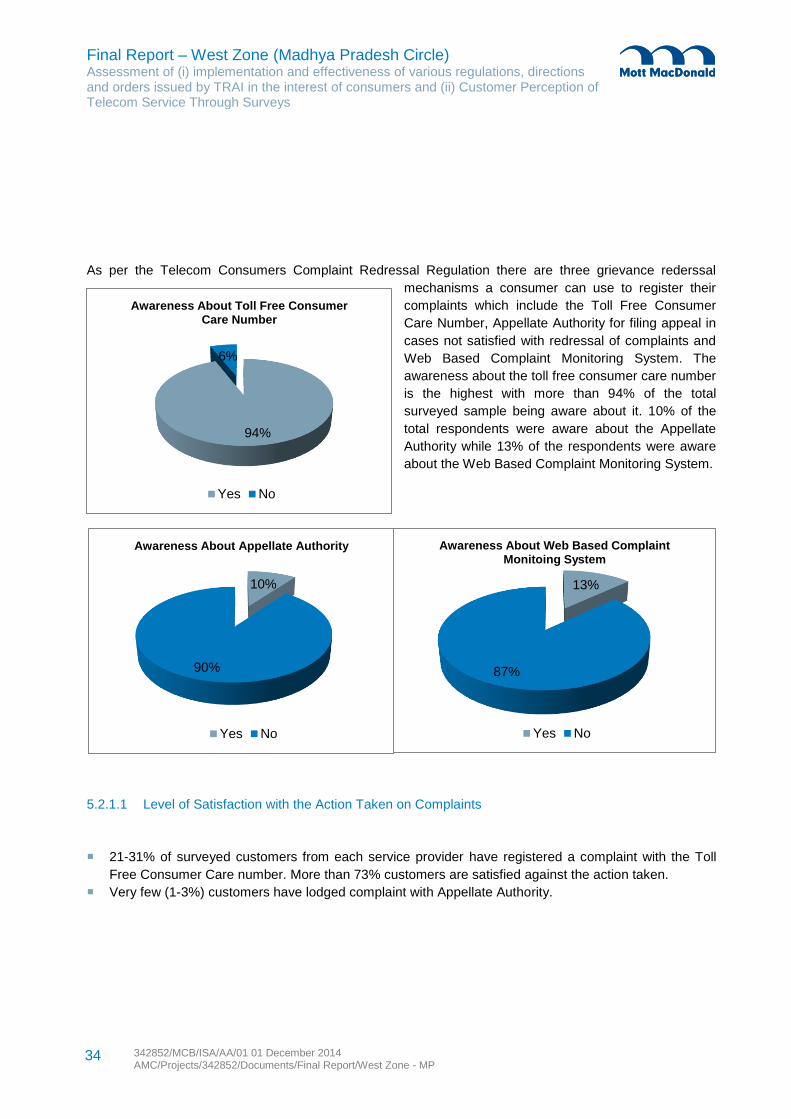
Final Report – West Zone (Madhya Pradesh Circle) Assessment of (i) implementation and effectiveness of various regulations, directions and orders issued by TRAI in the interest of consumers and (ii) Customer Perception of Telecom Service Through Surveys
342852/MCB/ISA/AA/01 01 December 2014 AMC/Projects/342852/Documents/Final Report/West Zone - MP
34
94%
6%
Awareness About Toll Free Consumer Care Number
Yes No
13%
87%
Awareness About Web Based Complaint Monitoing System
Yes No
10%
90%
Awareness About Appellate Authority
Yes No
As per the Telecom Consumers Complaint Redressal Regulation there are three grievance rederssal
mechanisms a consumer can use to register their
complaints which include the Toll Free Consumer
Care Number, Appellate Authority for filing appeal in
cases not satisfied with redressal of complaints and
Web Based Complaint Monitoring System. The
awareness about the toll free consumer care number
is the highest with more than 94% of the total
surveyed sample being aware about it. 10% of the
total respondents were aware about the Appellate
Authority while 13% of the respondents were aware
about the Web Based Complaint Monitoring System.
5.2.1.1 Level of Satisfaction with the Action Taken on Complaints
21-31% of surveyed customers from each service provider have registered a complaint with the Toll
Free Consumer Care number. More than 73% customers are satisfied against the action taken.
Very few (1-3%) customers have lodged complaint with Appellate Authority.
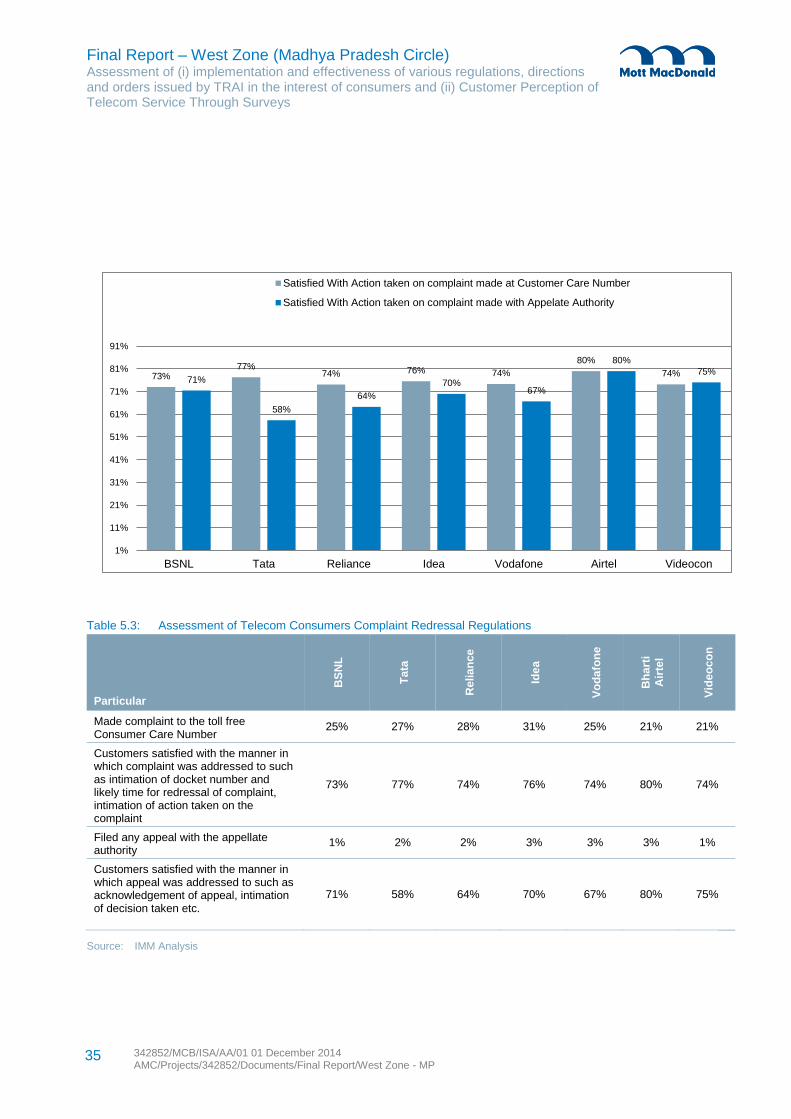
Final Report – West Zone (Madhya Pradesh Circle) Assessment of (i) implementation and effectiveness of various regulations, directions and orders issued by TRAI in the interest of consumers and (ii) Customer Perception of Telecom Service Through Surveys
342852/MCB/ISA/AA/01 01 December 2014 AMC/Projects/342852/Documents/Final Report/West Zone - MP
35
73% 77%
74% 76% 74%
80%
74% 71%
58%
64%
70% 67%
80%
75%
1%
11%
21%
31%
41%
51%
61%
71%
81%
91%
BSNL Tata Reliance Idea Vodafone Airtel Videocon
Satisfied With Action taken on complaint made at Customer Care Number
Satisfied With Action taken on complaint made with Appelate Authority
Table 5.3: Assessment of Telecom Consumers Complaint Redressal Regulations
Particular
BS
NL
Ta
ta
Re
lia
nce
Ide
a
Vo
da
fon
e
Bh
art
i
Air
tel
Vid
eo
co
n
Made complaint to the toll free Consumer Care Number
25% 27% 28% 31% 25% 21% 21%
Customers satisfied with the manner in which complaint was addressed to such as intimation of docket number and likely time for redressal of complaint, intimation of action taken on the complaint
73% 77% 74% 76% 74% 80% 74%
Filed any appeal with the appellate authority
1% 2% 2% 3% 3% 3% 1%
Customers satisfied with the manner in which appeal was addressed to such as acknowledgement of appeal, intimation of decision taken etc.
71% 58% 64% 70% 67% 80% 75%
Source: IMM Analysis
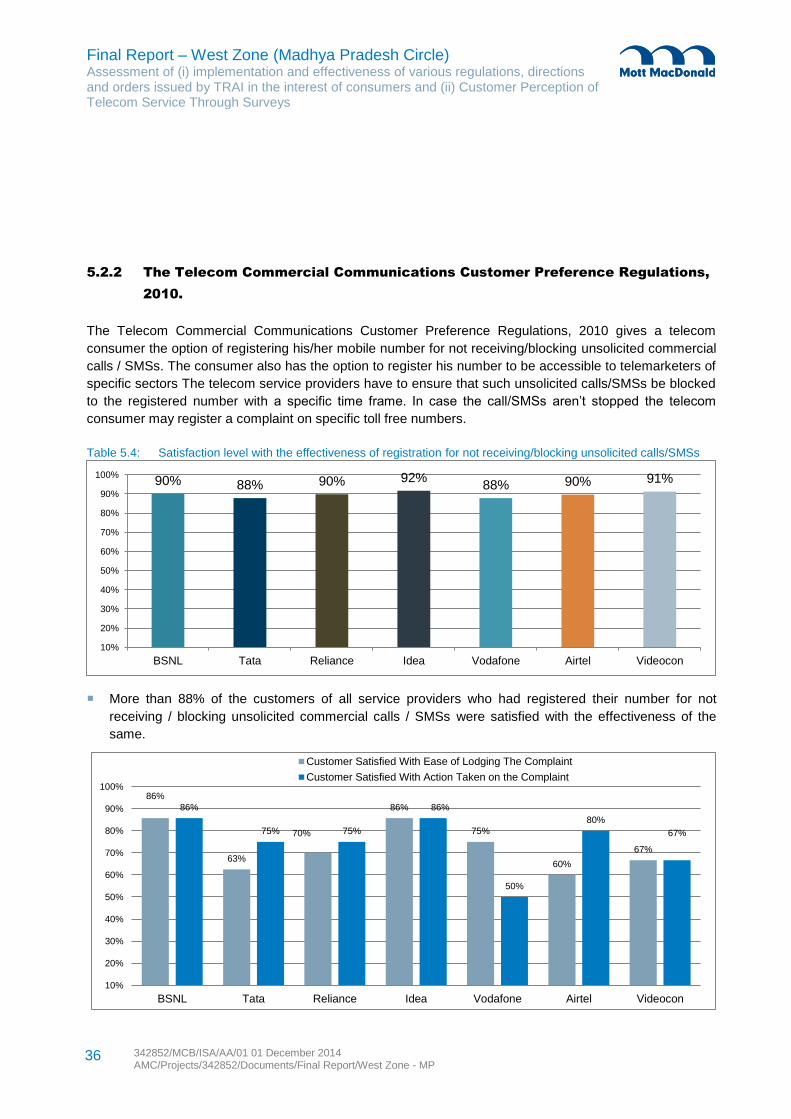
Final Report – West Zone (Madhya Pradesh Circle) Assessment of (i) implementation and effectiveness of various regulations, directions and orders issued by TRAI in the interest of consumers and (ii) Customer Perception of Telecom Service Through Surveys
342852/MCB/ISA/AA/01 01 December 2014 AMC/Projects/342852/Documents/Final Report/West Zone - MP
36
90% 88% 90% 92% 88% 90% 91%
10%
20%
30%
40%
50%
60%
70%
80%
90%
100%
BSNL Tata Reliance Idea Vodafone Airtel Videocon
86%
63%
70%
86%
75%
60%
67%
86%
75% 75%
86%
50%
80%
67%
10%
20%
30%
40%
50%
60%
70%
80%
90%
100%
BSNL Tata Reliance Idea Vodafone Airtel Videocon
Customer Satisfied With Ease of Lodging The Complaint
Customer Satisfied With Action Taken on the Complaint
5.2.2 The Telecom Commercial Communications Customer Preference Regulations,
2010.
The Telecom Commercial Communications Customer Preference Regulations, 2010 gives a telecom
consumer the option of registering his/her mobile number for not receiving/blocking unsolicited commercial
calls / SMSs. The consumer also has the option to register his number to be accessible to telemarketers of
specific sectors The telecom service providers have to ensure that such unsolicited calls/SMSs be blocked
to the registered number with a specific time frame. In case the call/SMSs aren’t stopped the telecom
consumer may register a complaint on specific toll free numbers.
Table 5.4: Satisfaction level with the effectiveness of registration for not receiving/blocking unsolicited calls/SMSs
More than 88% of the customers of all service providers who had registered their number for not
receiving / blocking unsolicited commercial calls / SMSs were satisfied with the effectiveness of the
same.
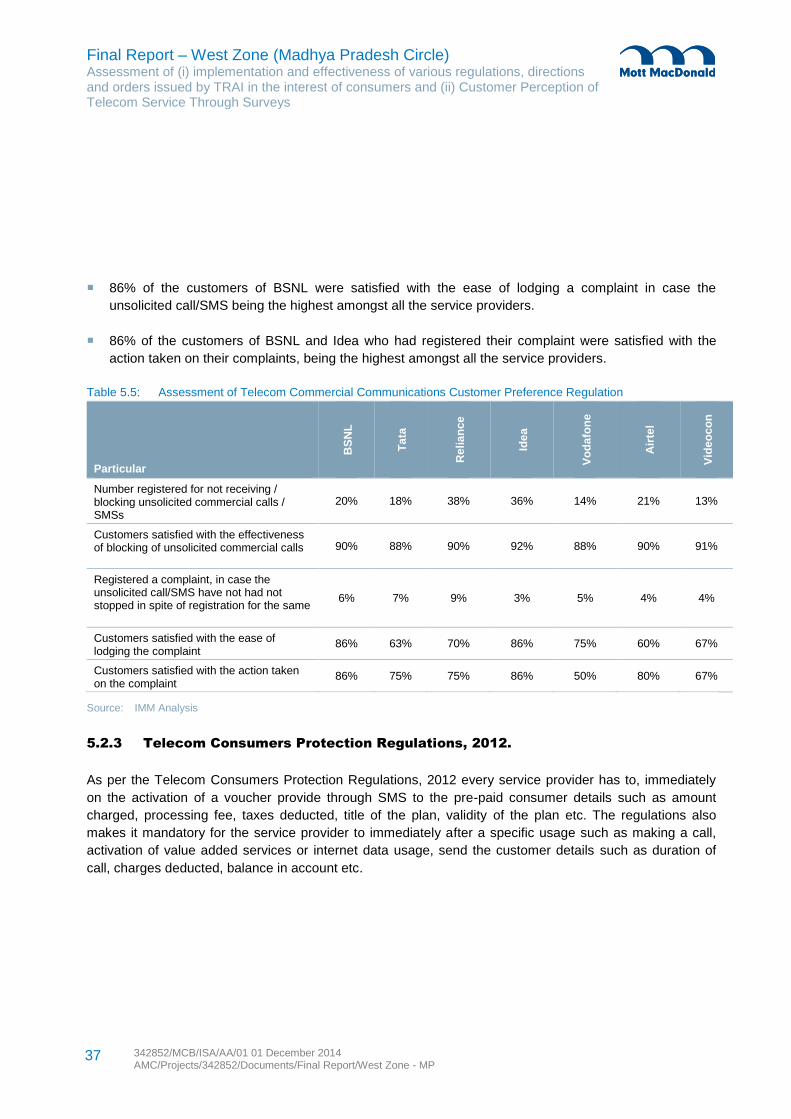
Final Report – West Zone (Madhya Pradesh Circle) Assessment of (i) implementation and effectiveness of various regulations, directions and orders issued by TRAI in the interest of consumers and (ii) Customer Perception of Telecom Service Through Surveys
342852/MCB/ISA/AA/01 01 December 2014 AMC/Projects/342852/Documents/Final Report/West Zone - MP
37
86% of the customers of BSNL were satisfied with the ease of lodging a complaint in case the
unsolicited call/SMS being the highest amongst all the service providers.
86% of the customers of BSNL and Idea who had registered their complaint were satisfied with the
action taken on their complaints, being the highest amongst all the service providers.
Table 5.5: Assessment of Telecom Commercial Communications Customer Preference Regulation
Particular
BS
NL
Ta
ta
Re
lia
nce
Ide
a
Vo
da
fon
e
Air
tel
Vid
eo
co
n
Number registered for not receiving / blocking unsolicited commercial calls / SMSs
20% 18% 38% 36% 14% 21% 13%
Customers satisfied with the effectiveness of blocking of unsolicited commercial calls 90% 88% 90% 92% 88% 90% 91%
Registered a complaint, in case the unsolicited call/SMS have not had not stopped in spite of registration for the same
6% 7% 9% 3% 5% 4% 4%
Customers satisfied with the ease of lodging the complaint
86% 63% 70% 86% 75% 60% 67%
Customers satisfied with the action taken on the complaint
86% 75% 75% 86% 50% 80% 67%
Source: IMM Analysis
5.2.3 Telecom Consumers Protection Regulations, 2012.
As per the Telecom Consumers Protection Regulations, 2012 every service provider has to, immediately
on the activation of a voucher provide through SMS to the pre-paid consumer details such as amount
charged, processing fee, taxes deducted, title of the plan, validity of the plan etc. The regulations also
makes it mandatory for the service provider to immediately after a specific usage such as making a call,
activation of value added services or internet data usage, send the customer details such as duration of
call, charges deducted, balance in account etc.
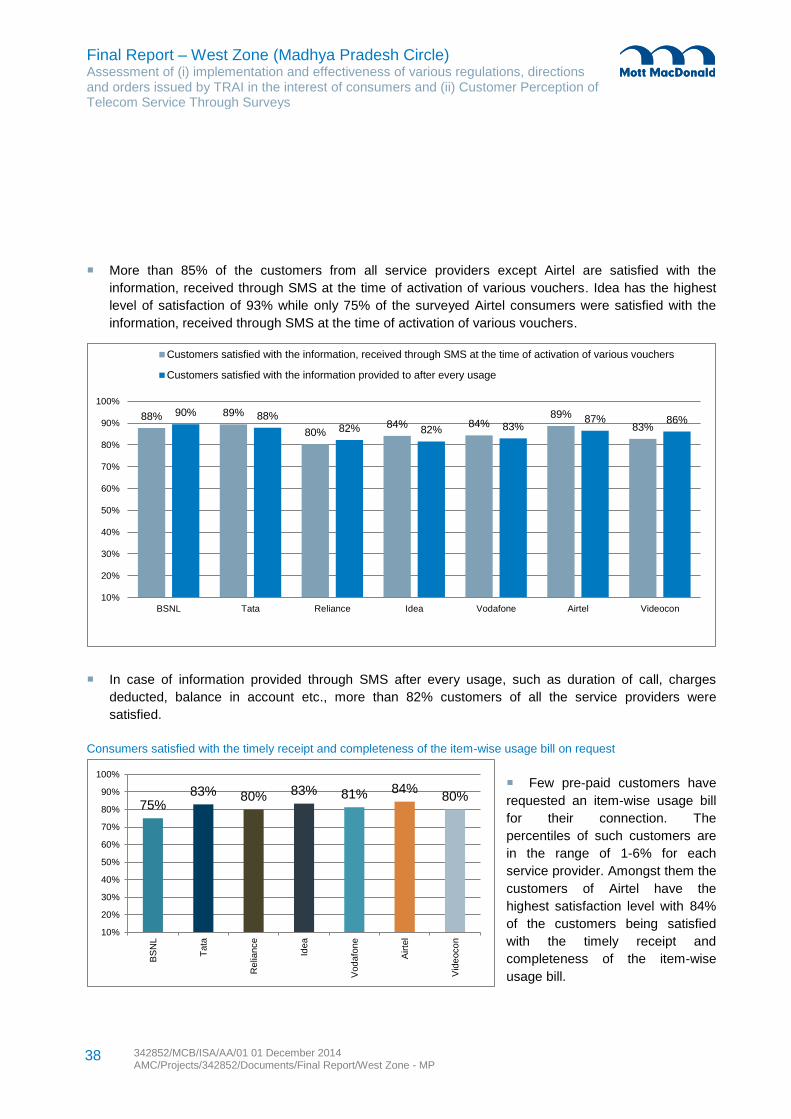
Final Report – West Zone (Madhya Pradesh Circle) Assessment of (i) implementation and effectiveness of various regulations, directions and orders issued by TRAI in the interest of consumers and (ii) Customer Perception of Telecom Service Through Surveys
342852/MCB/ISA/AA/01 01 December 2014 AMC/Projects/342852/Documents/Final Report/West Zone - MP
38
88% 89%
80% 84% 84%
89%
83%
90% 88% 82% 82% 83%
87% 86%
10%
20%
30%
40%
50%
60%
70%
80%
90%
100%
BSNL Tata Reliance Idea Vodafone Airtel Videocon
Customers satisfied with the information, received through SMS at the time of activation of various vouchers
Customers satisfied with the information provided to after every usage
75% 83% 80% 83% 81% 84%
80%
10%
20%
30%
40%
50%
60%
70%
80%
90%
100%
BS
NL
Tata
Re
liance
Idea
Vod
afo
ne
Airte
l
Vid
eoco
n
More than 85% of the customers from all service providers except Airtel are satisfied with the
information, received through SMS at the time of activation of various vouchers. Idea has the highest
level of satisfaction of 93% while only 75% of the surveyed Airtel consumers were satisfied with the
information, received through SMS at the time of activation of various vouchers.
In case of information provided through SMS after every usage, such as duration of call, charges
deducted, balance in account etc., more than 82% customers of all the service providers were
satisfied.
Consumers satisfied with the timely receipt and completeness of the item-wise usage bill on request
Few pre-paid customers have
requested an item-wise usage bill
for their connection. The
percentiles of such customers are
in the range of 1-6% for each
service provider. Amongst them the
customers of Airtel have the
highest satisfaction level with 84%
of the customers being satisfied
with the timely receipt and
completeness of the item-wise
usage bill.
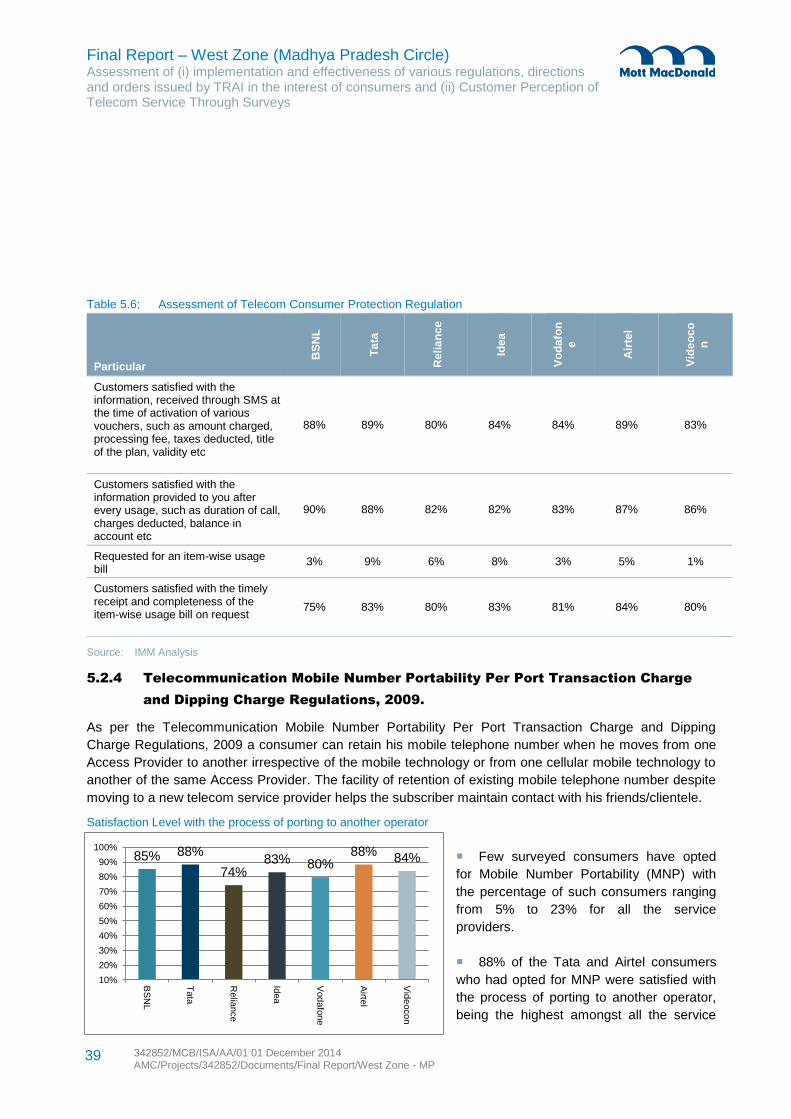
Final Report – West Zone (Madhya Pradesh Circle) Assessment of (i) implementation and effectiveness of various regulations, directions and orders issued by TRAI in the interest of consumers and (ii) Customer Perception of Telecom Service Through Surveys
342852/MCB/ISA/AA/01 01 December 2014 AMC/Projects/342852/Documents/Final Report/West Zone - MP
39
85% 88%
74% 83% 80%
88% 84%
10%
20%
30%
40%
50%
60%
70%
80%
90%
100%
BS
NL
Tata
Re
liance
Idea
Vod
afo
ne
Airte
l
Vid
eoco
n
Table 5.6: Assessment of Telecom Consumer Protection Regulation
Particular
BS
NL
Ta
ta
Re
lia
nce
Ide
a
Vo
da
fon
e
Air
tel
Vid
eo
co
n
Customers satisfied with the information, received through SMS at the time of activation of various vouchers, such as amount charged, processing fee, taxes deducted, title of the plan, validity etc
88% 89% 80% 84% 84% 89% 83%
Customers satisfied with the information provided to you after every usage, such as duration of call, charges deducted, balance in account etc
90% 88% 82% 82% 83% 87% 86%
Requested for an item-wise usage bill
3% 9% 6% 8% 3% 5% 1%
Customers satisfied with the timely receipt and completeness of the item-wise usage bill on request
75% 83% 80% 83% 81% 84% 80%
Source: IMM Analysis
5.2.4 Telecommunication Mobile Number Portability Per Port Transaction Charge
and Dipping Charge Regulations, 2009.
As per the Telecommunication Mobile Number Portability Per Port Transaction Charge and Dipping
Charge Regulations, 2009 a consumer can retain his mobile telephone number when he moves from one
Access Provider to another irrespective of the mobile technology or from one cellular mobile technology to
another of the same Access Provider. The facility of retention of existing mobile telephone number despite
moving to a new telecom service provider helps the subscriber maintain contact with his friends/clientele.
Satisfaction Level with the process of porting to another operator
Few surveyed consumers have opted
for Mobile Number Portability (MNP) with
the percentage of such consumers ranging
from 5% to 23% for all the service
providers.
88% of the Tata and Airtel consumers
who had opted for MNP were satisfied with
the process of porting to another operator,
being the highest amongst all the service
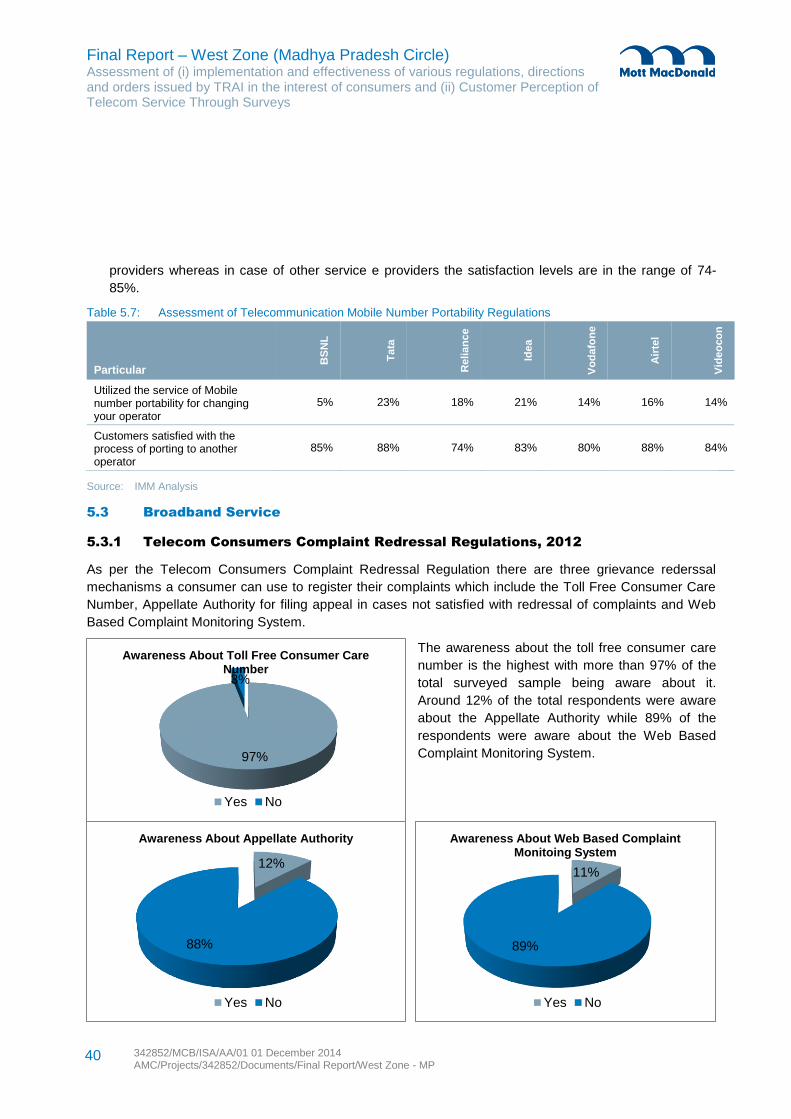
Final Report – West Zone (Madhya Pradesh Circle) Assessment of (i) implementation and effectiveness of various regulations, directions and orders issued by TRAI in the interest of consumers and (ii) Customer Perception of Telecom Service Through Surveys
342852/MCB/ISA/AA/01 01 December 2014 AMC/Projects/342852/Documents/Final Report/West Zone - MP
40
97%
3%
Awareness About Toll Free Consumer Care Number
Yes No
12%
88%
Awareness About Appellate Authority
Yes No
11%
89%
Awareness About Web Based Complaint Monitoing System
Yes No
providers whereas in case of other service e providers the satisfaction levels are in the range of 74-
85%.
Table 5.7: Assessment of Telecommunication Mobile Number Portability Regulations
Particular
BS
NL
Ta
ta
Reli
an
ce
Ide
a
Vo
da
fon
e
Air
tel
Vid
eo
co
n
Utilized the service of Mobile number portability for changing your operator
5% 23% 18% 21% 14% 16% 14%
Customers satisfied with the process of porting to another operator
85% 88% 74% 83% 80% 88% 84%
Source: IMM Analysis
5.3 Broadband Service
5.3.1 Telecom Consumers Complaint Redressal Regulations, 2012
As per the Telecom Consumers Complaint Redressal Regulation there are three grievance rederssal
mechanisms a consumer can use to register their complaints which include the Toll Free Consumer Care
Number, Appellate Authority for filing appeal in cases not satisfied with redressal of complaints and Web
Based Complaint Monitoring System.
The awareness about the toll free consumer care
number is the highest with more than 97% of the
total surveyed sample being aware about it.
Around 12% of the total respondents were aware
about the Appellate Authority while 89% of the
respondents were aware about the Web Based
Complaint Monitoring System.
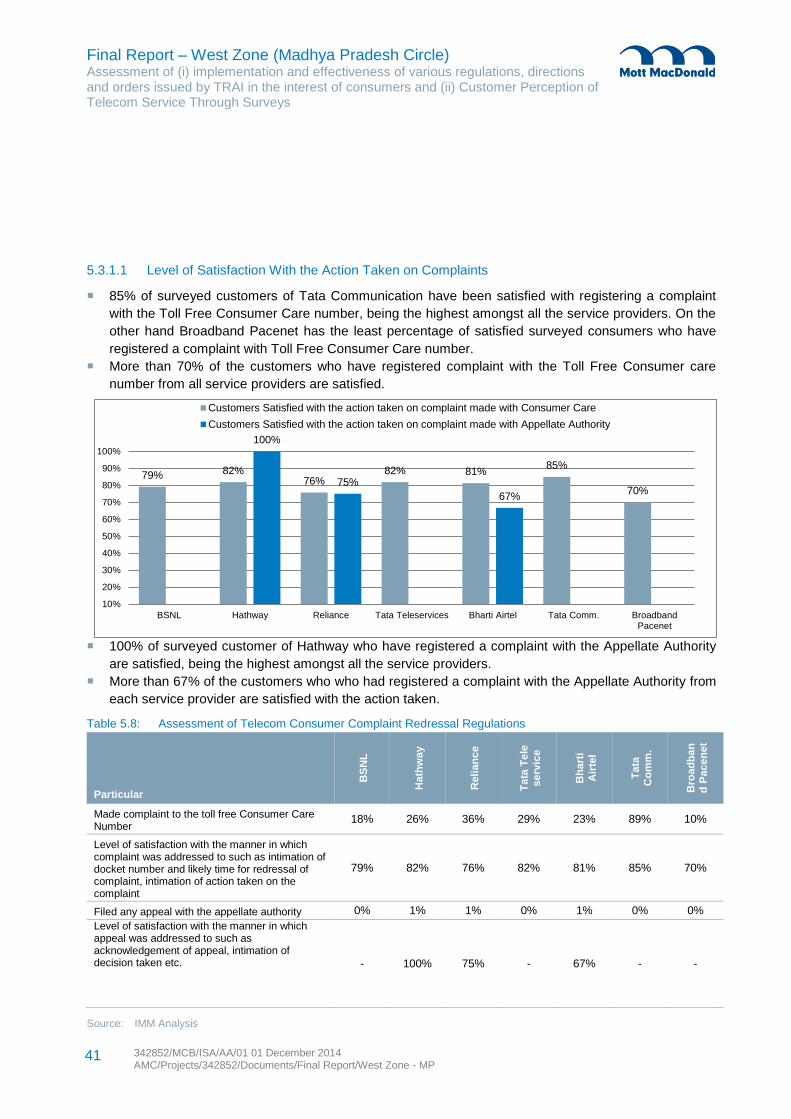
Final Report – West Zone (Madhya Pradesh Circle) Assessment of (i) implementation and effectiveness of various regulations, directions and orders issued by TRAI in the interest of consumers and (ii) Customer Perception of Telecom Service Through Surveys
342852/MCB/ISA/AA/01 01 December 2014 AMC/Projects/342852/Documents/Final Report/West Zone - MP
41
79% 82% 76%
82% 81% 85%
70%
100%
75%
67%
10%
20%
30%
40%
50%
60%
70%
80%
90%
100%
BSNL Hathway Reliance Tata Teleservices Bharti Airtel Tata Comm. BroadbandPacenet
Customers Satisfied with the action taken on complaint made with Consumer Care
Customers Satisfied with the action taken on complaint made with Appellate Authority
5.3.1.1 Level of Satisfaction With the Action Taken on Complaints
85% of surveyed customers of Tata Communication have been satisfied with registering a complaint
with the Toll Free Consumer Care number, being the highest amongst all the service providers. On the
other hand Broadband Pacenet has the least percentage of satisfied surveyed consumers who have
registered a complaint with Toll Free Consumer Care number.
More than 70% of the customers who have registered complaint with the Toll Free Consumer care
number from all service providers are satisfied.
100% of surveyed customer of Hathway who have registered a complaint with the Appellate Authority
are satisfied, being the highest amongst all the service providers.
More than 67% of the customers who who had registered a complaint with the Appellate Authority from
each service provider are satisfied with the action taken.
Table 5.8: Assessment of Telecom Consumer Complaint Redressal Regulations
Particular
BS
NL
Hath
way
Reli
an
ce
Ta
ta T
ele
serv
ice
Bh
art
i A
irte
l
Ta
ta
Co
mm
.
Bro
ad
ba
nd
Pacen
et
Made complaint to the toll free Consumer Care Number
18% 26% 36% 29% 23% 89% 10%
Level of satisfaction with the manner in which complaint was addressed to such as intimation of docket number and likely time for redressal of complaint, intimation of action taken on the complaint
79% 82% 76% 82% 81% 85% 70%
Filed any appeal with the appellate authority 0% 1% 1% 0% 1% 0% 0%
Level of satisfaction with the manner in which appeal was addressed to such as acknowledgement of appeal, intimation of decision taken etc. - 100% 75% - 67% - -
Source: IMM Analysis
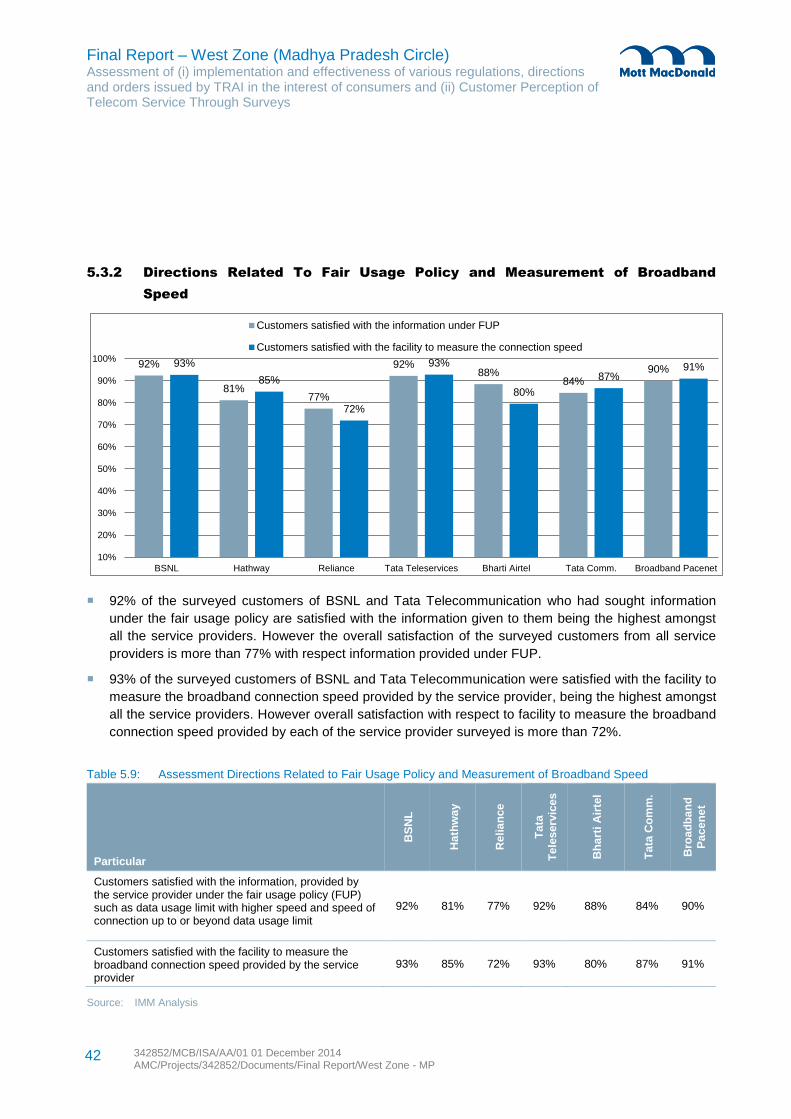
Final Report – West Zone (Madhya Pradesh Circle) Assessment of (i) implementation and effectiveness of various regulations, directions and orders issued by TRAI in the interest of consumers and (ii) Customer Perception of Telecom Service Through Surveys
342852/MCB/ISA/AA/01 01 December 2014 AMC/Projects/342852/Documents/Final Report/West Zone - MP
42
92%
81% 77%
92% 88%
84% 90%
93%
85%
72%
93%
80%
87% 91%
10%
20%
30%
40%
50%
60%
70%
80%
90%
100%
BSNL Hathway Reliance Tata Teleservices Bharti Airtel Tata Comm. Broadband Pacenet
Customers satisfied with the information under FUP
Customers satisfied with the facility to measure the connection speed
5.3.2 Directions Related To Fair Usage Policy and Measurement of Broadband
Speed
92% of the surveyed customers of BSNL and Tata Telecommunication who had sought information
under the fair usage policy are satisfied with the information given to them being the highest amongst
all the service providers. However the overall satisfaction of the surveyed customers from all service
providers is more than 77% with respect information provided under FUP.
93% of the surveyed customers of BSNL and Tata Telecommunication were satisfied with the facility to
measure the broadband connection speed provided by the service provider, being the highest amongst
all the service providers. However overall satisfaction with respect to facility to measure the broadband
connection speed provided by each of the service provider surveyed is more than 72%.
Table 5.9: Assessment Directions Related to Fair Usage Policy and Measurement of Broadband Speed
Particular
BS
NL
Ha
thw
ay
Re
lia
nce
Ta
ta
Te
les
erv
ices
Bh
art
i A
irte
l
Ta
ta C
om
m.
Bro
ad
ba
nd
Pa
ce
ne
t
Customers satisfied with the information, provided by the service provider under the fair usage policy (FUP) such as data usage limit with higher speed and speed of connection up to or beyond data usage limit
92% 81% 77% 92% 88% 84% 90%
Customers satisfied with the facility to measure the broadband connection speed provided by the service provider
93% 85% 72% 93% 80% 87% 91%
Source: IMM Analysis
Final Report – West Zone (Madhya Pradesh Circle) Assessment of (i) implementation and effectiveness of various regulations, directions and orders issued by TRAI in the interest of consumers and (ii) Customer Perception of Telecom Service Through Surveys
342852/MCB/ISA/AA/01 01 December 2014 AMC/Projects/342852/Documents/Final Report/West Zone - MP
43
The key conclusions and recommendations on the basis of the survey conducted across all service
categories and active service providers in the Madhya Pradesh circle in the West Zone are listed as under.
6.1 Basic Wire-Line
6.1.1.1 Quality of Service Benchmarks
The survey results show that all service providers have met the quality of service benchmarks for the
provision of service, billing performance, Network and Overall Quality parameters. While in case of the
other parameters, few of the service providers could not to meet the benchmarks. In many cases
service providers have marginally missed to reach the benchmark.
Help services is the only parameter wherein many service providers have failed to achieve the
stipulated benchmark.
Based on the qualitative inputs from field staff and general observation during the survey period the
consultants have observed that the satisfaction levels for the maintainability and help services
parameter are a bit lower as compared to satisfaction percentiles for other parameters.
6.1.1.2 Assessment of Various Regulations
The level of satisfaction with the effectiveness of blocking of unsolicited commercial calls/SMSs is
moderate across all service providers.
With reference to the grievance redressal mechanism the consumers are mainly aware of the toll free
consumer care number. Few consumers are aware of the Appellate Authority and the Web Based
Monitoring System as a mechanism for grievance redressal.
6.2 Cellular Mobile
6.2.1.1 Quality of Service Benchmarks
The survey results show that all service providers have met the quality of service benchmarks for the
provision of service, Billing Performance-Pre-Paid, Maintainability and Overall Quality parameter. While
in case of the other parameters, few of the service providers could not to meet the benchmarks. In
many cases service providers have marginally missed to reach the benchmark.
The satisfaction levels for the Help Services parameter are comparatively lower across all service
providers.
The service providers have performed well in cases of rest of the benchmarks such as Billing
Performance: Post-Paid and Network with most of the service providers meeting or nearing the
benchmark on these parameters.
Based on the qualitative inputs from field staff and general observation during the survey period the
consultants have observed that the satisfaction levels for the help services parameter is a bit lower as
compared to satisfaction percentiles for other parameters.
6 Conclusions & Recommendations
Final Report – West Zone (Madhya Pradesh Circle) Assessment of (i) implementation and effectiveness of various regulations, directions and orders issued by TRAI in the interest of consumers and (ii) Customer Perception of Telecom Service Through Surveys
342852/MCB/ISA/AA/01 01 December 2014 AMC/Projects/342852/Documents/Final Report/West Zone - MP
44
6.2.1.2 Assessment of Various Regulations
With reference to the grievance redressal mechanism the consumers are mainly aware of the toll free
consumer care number. Few consumers are aware of the Appellate Authority and the Web Based
Monitoring System as a mechanism for grievance redressal.
The level of satisfaction with the effectiveness of blocking of unsolicited commercial calls is well
achieved across all service providers with the satisfaction percentiles in the range of 80-95% for all the
service providers.
Very few pre-paid customers have requested for an item-wise usage bill for their connection. Based on
the qualitative inputs from field staff the consultants have observed that the awareness amongst the
pre-paid customer with reference to this option with them is quite low.
6.3 Broadband
6.3.1.1 Quality of Service Benchmarks
All the service providers have met the benchmarks for the provision of service parameter while in the
other parameter few of the service providers have missed the benchmark. Many service providers have
marginally missed the benchmark on many parameters.
The satisfaction levels for the Help Services and Network parameters are comparatively lower as
compared to other parameters.
6.3.1.2 Assessment of Various Regulations
With reference to the grievance redressal mechanism the consumers are mainly aware of the toll free
consumer care number. Very few consumers are aware of the Appellate Authority and the Web Based
Monitoring System as a mechanism for grievance redressal and efforts should be made in generating
awareness with respect to Appellate Authority and Web Based Monitoring System.
The level of customers being satisfied with the manner in which their complaint with the toll free
consumer care number was addressed is moderate.
Customer satisfaction levels with respect to the information provided by the service provider under the
fair usage policy (FUP) and the facility to measure the broadband connection speed provided by the
service provider are more than 80%.
Final Report – West Zone (Madhya Pradesh Circle) Assessment of (i) implementation and effectiveness of various regulations, directions and orders issued by TRAI in the interest of consumers and (ii) Customer Perception of Telecom Service Through Surveys
342852/MCB/ISA/AA/01 01 December 2014 AMC/Projects/342852/Documents/Final Report/West Zone - MP
45
Part B: Statistical Analysis
Final Report – West Zone (Madhya Pradesh Circle) Assessment of (i) implementation and effectiveness of various regulations, directions and orders issued by TRAI in the interest of consumers and (ii) Customer Perception of Telecom Service Through Surveys
342852/MCB/ISA/AA/01 01 December 2014 AMC/Projects/342852/Documents/Final Report/West Zone - MP
46
7.1 Net Promoter Score
One separate question has been added at the end of the questionnaires which takes into account the
likeliness of a consumer recommending his/her own service provider to relative or friends. The input has
been taken on a 0 to 10 scale where 10 means ‘Extremely Likely’ & 0 means ‘Not At All likely’.
The Net Promotion Score has been calculate for each service provider using the formula
NPS= (P %) - (D%)
Where NPS = Net Promotion Score
P% = Percentage of those who have ranked 9&10 for likelihood of recommending their service
provider and
D% = Percentage of those who have ranked 0-6 for likelihood of recommending their service
provider
Note: Those who ranked 7&8 are considered passive consumers.
7.2 Service Provider Level: Analytics Comparison
The results of the analysis allow for making qualitative comparisons between service providers. Results
mainly refer to satisfaction dimensions such as Tangibility, Reliability, Responsiveness, Assurance,
Assurance, Convenience, Empathy, Network/ Technical Quality, Economy and overall satisfaction and
these will be reported for the service providers at service area levels. Final provider level comparisons will
be made according to the following statistical procedures.
Overall analyses of variance.
Test on homogeneity of variances within subgroups.
Variance-sensitive multiple comparisons if Fp ≤ 0.05 and if sub-group variances are homogeneous.
Variance- sensitive multiple comparisons corrected by variance-robust multiple comparisons if Fp ≤
0.05 and if sub-group variances are unequal.
H0 hypothesis if Fp ≤ 0.05 and if sub-group variances are homogeneous.
H0 hypothesis if Fp ≤ 0.05 and if sub-group variances are unequal and if non-parametric confirmation
of H0.
7.3 Sequential Equation Modelling
A structural equation modelling has been run to elicit action points or points of greatest impact on customer
satisfaction. The general model of measurement is captured by the dimensions and the list of items under
each dimension mentioned in the specification of the SERVPERF scale. The SEM model allows us to
arrive at drivers of satisfaction on each dimension as well as on overall satisfaction. The path model
comprises causal paths from each Service quality performance dimension to Overall Satisfaction with
Performance. Attributes with significant impact on Overall Satisfaction will be rank ordered in terms of their
impact.
7 Statistical Analysis – Methodology
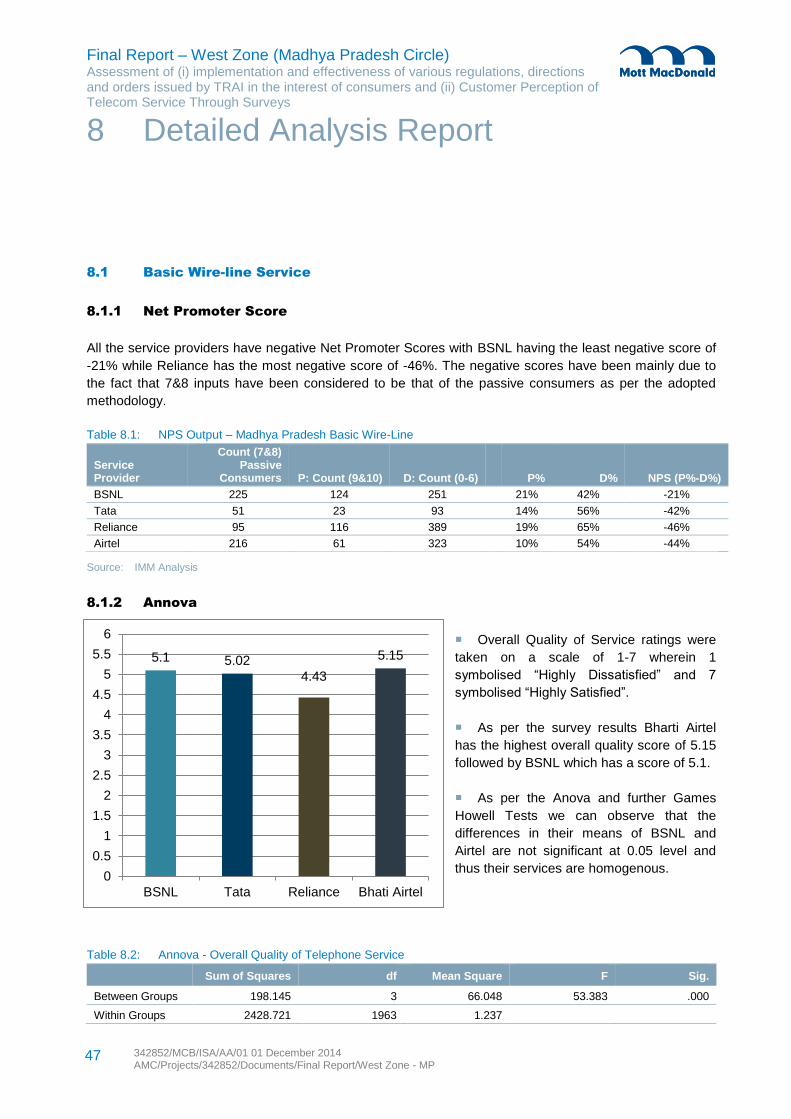
Final Report – West Zone (Madhya Pradesh Circle) Assessment of (i) implementation and effectiveness of various regulations, directions and orders issued by TRAI in the interest of consumers and (ii) Customer Perception of Telecom Service Through Surveys
342852/MCB/ISA/AA/01 01 December 2014 AMC/Projects/342852/Documents/Final Report/West Zone - MP
47
5.1 5.02
4.43
5.15
0
0.5
1
1.5
2
2.5
3
3.5
4
4.5
5
5.5
6
BSNL Tata Reliance Bhati Airtel
8.1 Basic Wire-line Service
8.1.1 Net Promoter Score
All the service providers have negative Net Promoter Scores with BSNL having the least negative score of
-21% while Reliance has the most negative score of -46%. The negative scores have been mainly due to
the fact that 7&8 inputs have been considered to be that of the passive consumers as per the adopted
methodology.
Table 8.1: NPS Output – Madhya Pradesh Basic Wire-Line
Service Provider
Count (7&8) Passive
Consumers P: Count (9&10) D: Count (0-6) P% D% NPS (P%-D%)
BSNL 225 124 251 21% 42% -21%
Tata 51 23 93 14% 56% -42%
Reliance 95 116 389 19% 65% -46%
Airtel 216 61 323 10% 54% -44%
Source: IMM Analysis
8.1.2 Annova
Overall Quality of Service ratings were
taken on a scale of 1-7 wherein 1
symbolised “Highly Dissatisfied” and 7
symbolised “Highly Satisfied”.
As per the survey results Bharti Airtel
has the highest overall quality score of 5.15
followed by BSNL which has a score of 5.1.
As per the Anova and further Games
Howell Tests we can observe that the
differences in their means of BSNL and
Airtel are not significant at 0.05 level and
thus their services are homogenous.
Table 8.2: Annova - Overall Quality of Telephone Service
Sum of Squares df Mean Square F Sig.
Between Groups 198.145 3 66.048 53.383 .000
Within Groups 2428.721 1963 1.237
8 Detailed Analysis Report
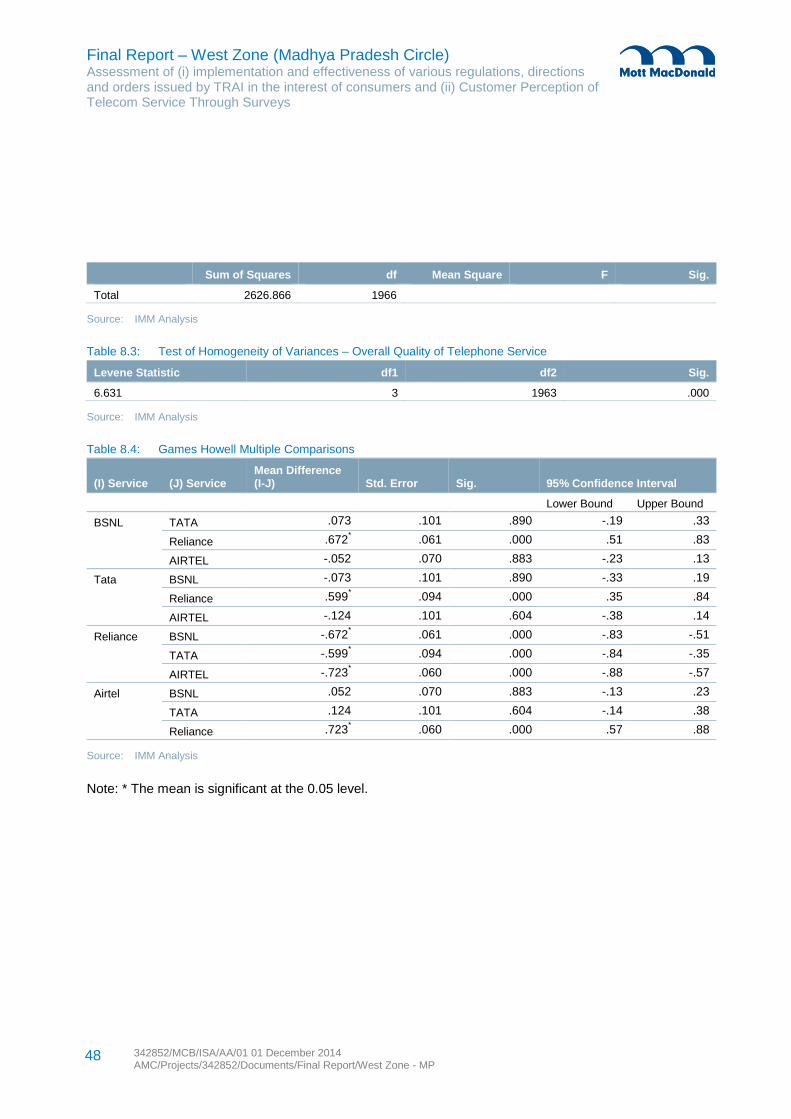
Final Report – West Zone (Madhya Pradesh Circle) Assessment of (i) implementation and effectiveness of various regulations, directions and orders issued by TRAI in the interest of consumers and (ii) Customer Perception of Telecom Service Through Surveys
342852/MCB/ISA/AA/01 01 December 2014 AMC/Projects/342852/Documents/Final Report/West Zone - MP
48
Sum of Squares df Mean Square F Sig.
Total 2626.866 1966
Source: IMM Analysis
Table 8.3: Test of Homogeneity of Variances – Overall Quality of Telephone Service
Levene Statistic df1 df2 Sig.
6.631 3 1963 .000
Source: IMM Analysis
Table 8.4: Games Howell Multiple Comparisons
(I) Service (J) Service Mean Difference (I-J) Std. Error Sig. 95% Confidence Interval
Lower Bound Upper Bound
BSNL TATA .073 .101 .890 -.19 .33
Reliance .672* .061 .000 .51 .83
AIRTEL -.052 .070 .883 -.23 .13
Tata BSNL -.073 .101 .890 -.33 .19
Reliance .599* .094 .000 .35 .84
AIRTEL -.124 .101 .604 -.38 .14
Reliance BSNL -.672* .061 .000 -.83 -.51
TATA -.599* .094 .000 -.84 -.35
AIRTEL -.723* .060 .000 -.88 -.57
Airtel BSNL .052 .070 .883 -.13 .23
TATA .124 .101 .604 -.14 .38
Reliance .723* .060 .000 .57 .88
Source: IMM Analysis
Note: * The mean is significant at the 0.05 level.
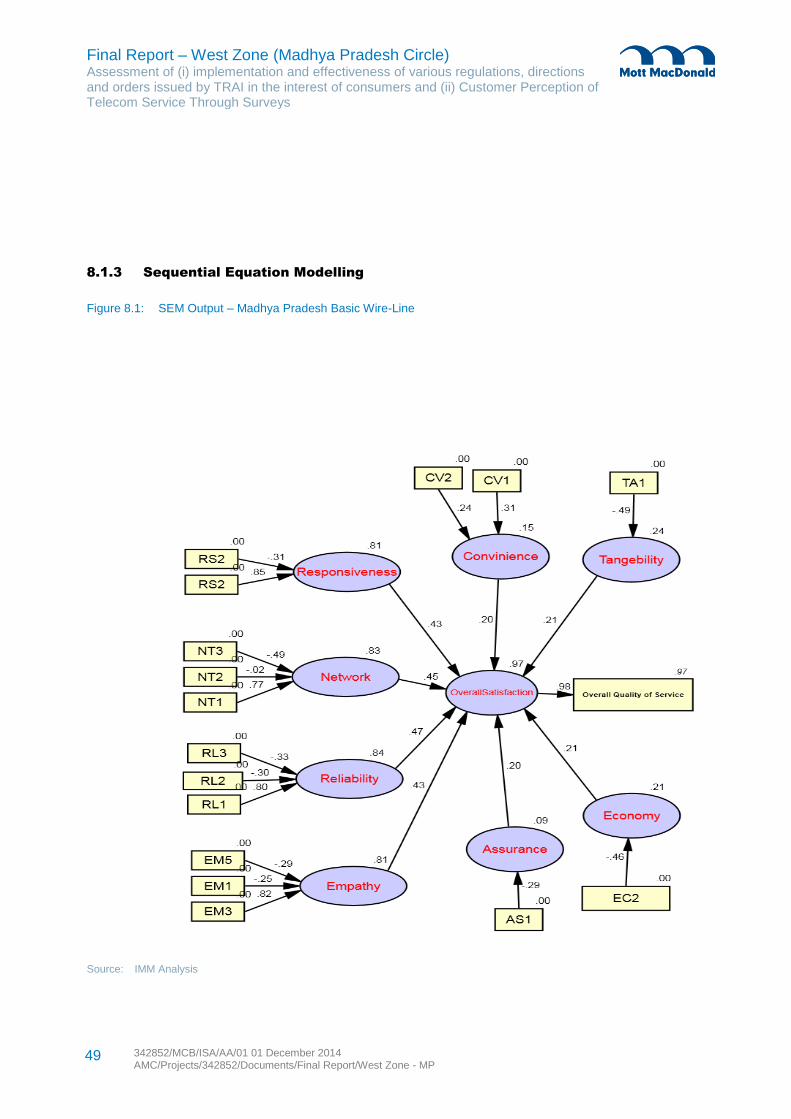
Final Report – West Zone (Madhya Pradesh Circle) Assessment of (i) implementation and effectiveness of various regulations, directions and orders issued by TRAI in the interest of consumers and (ii) Customer Perception of Telecom Service Through Surveys
342852/MCB/ISA/AA/01 01 December 2014 AMC/Projects/342852/Documents/Final Report/West Zone - MP
49
8.1.3 Sequential Equation Modelling
Figure 8.1: SEM Output – Madhya Pradesh Basic Wire-Line
Source: IMM Analysis
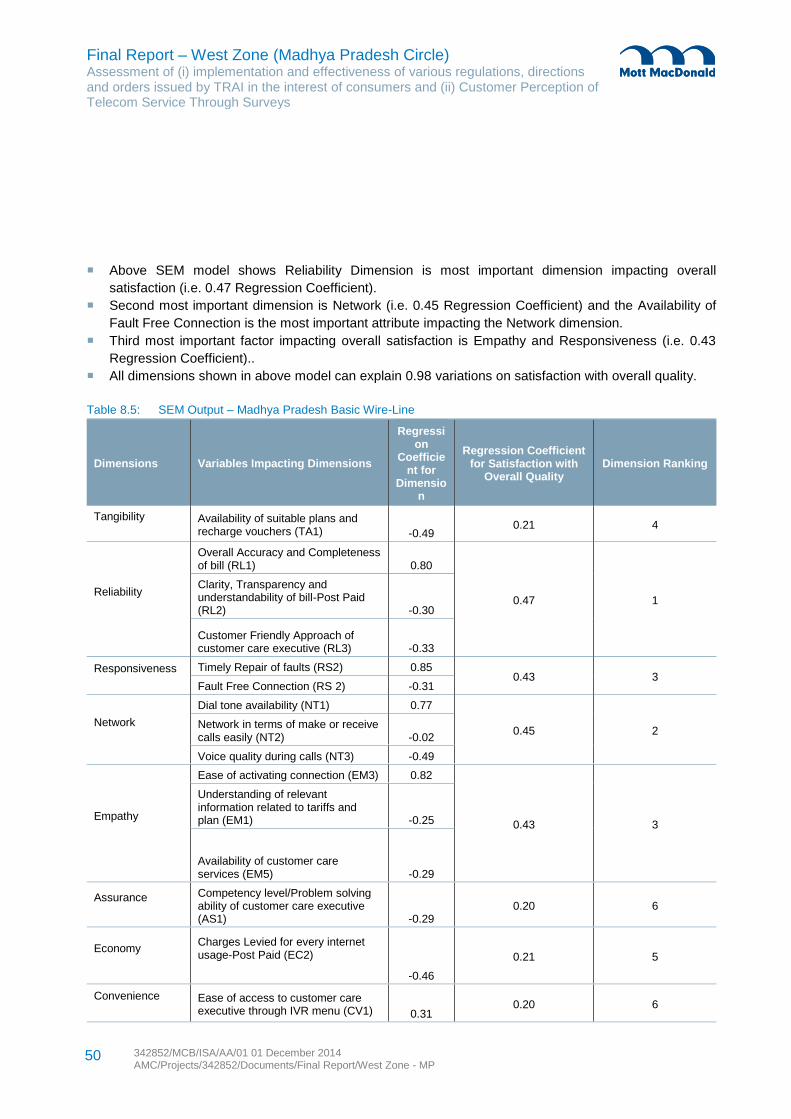
Final Report – West Zone (Madhya Pradesh Circle) Assessment of (i) implementation and effectiveness of various regulations, directions and orders issued by TRAI in the interest of consumers and (ii) Customer Perception of Telecom Service Through Surveys
342852/MCB/ISA/AA/01 01 December 2014 AMC/Projects/342852/Documents/Final Report/West Zone - MP
50
Above SEM model shows Reliability Dimension is most important dimension impacting overall
satisfaction (i.e. 0.47 Regression Coefficient).
Second most important dimension is Network (i.e. 0.45 Regression Coefficient) and the Availability of
Fault Free Connection is the most important attribute impacting the Network dimension.
Third most important factor impacting overall satisfaction is Empathy and Responsiveness (i.e. 0.43
Regression Coefficient)..
All dimensions shown in above model can explain 0.98 variations on satisfaction with overall quality.
Table 8.5: SEM Output – Madhya Pradesh Basic Wire-Line
Dimensions Variables Impacting Dimensions
Regression
Coefficient for
Dimension
Regression Coefficient for Satisfaction with
Overall Quality Dimension Ranking
Tangibility
Availability of suitable plans and recharge vouchers (TA1) -0.49
0.21 4
Reliability
Overall Accuracy and Completeness of bill (RL1) 0.80
0.47 1
Clarity, Transparency and understandability of bill-Post Paid (RL2) -0.30
Customer Friendly Approach of customer care executive (RL3) -0.33
Responsiveness
Timely Repair of faults (RS2) 0.85 0.43 3
Fault Free Connection (RS 2) -0.31
Network
Dial tone availability (NT1) 0.77
0.45 2 Network in terms of make or receive calls easily (NT2) -0.02
Voice quality during calls (NT3) -0.49
Empathy
Ease of activating connection (EM3) 0.82
0.43 3
Understanding of relevant information related to tariffs and plan (EM1) -0.25
Availability of customer care services (EM5) -0.29
Assurance
Competency level/Problem solving ability of customer care executive (AS1) -0.29
0.20 6
Economy
Charges Levied for every internet usage-Post Paid (EC2)
-0.46
0.21 5
Convenience
Ease of access to customer care executive through IVR menu (CV1) 0.31
0.20 6
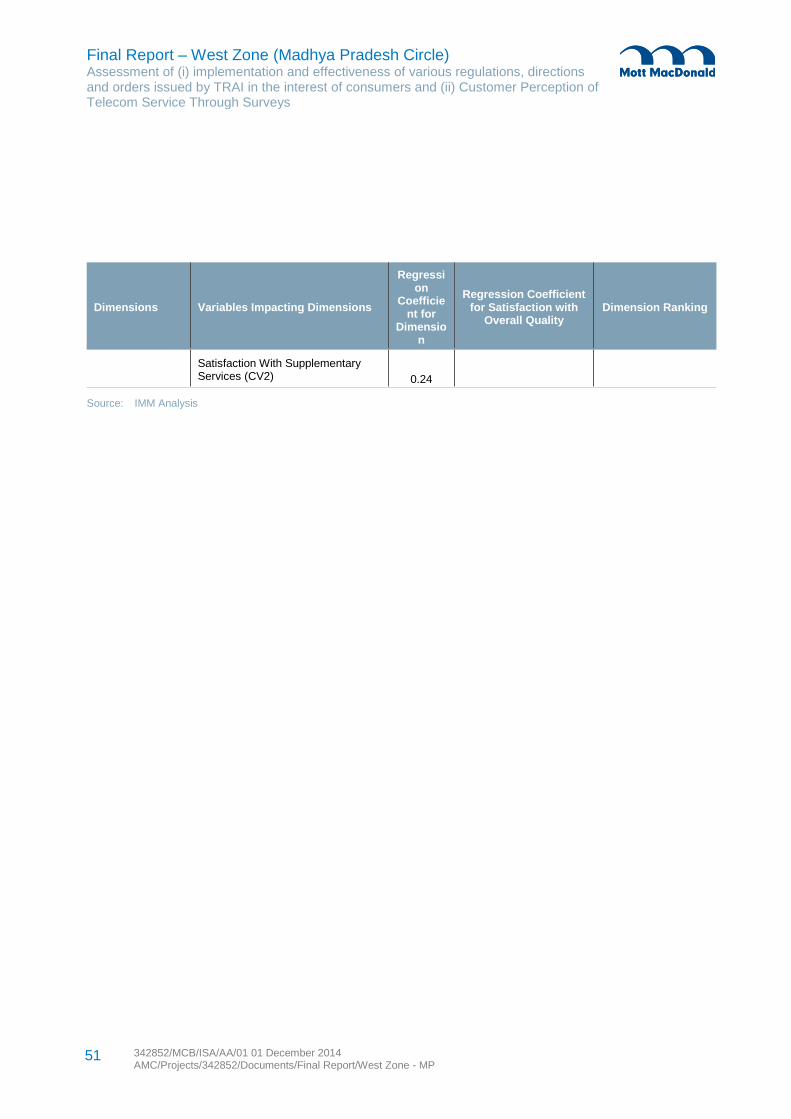
Final Report – West Zone (Madhya Pradesh Circle) Assessment of (i) implementation and effectiveness of various regulations, directions and orders issued by TRAI in the interest of consumers and (ii) Customer Perception of Telecom Service Through Surveys
342852/MCB/ISA/AA/01 01 December 2014 AMC/Projects/342852/Documents/Final Report/West Zone - MP
51
Dimensions Variables Impacting Dimensions
Regression
Coefficient for
Dimension
Regression Coefficient for Satisfaction with
Overall Quality Dimension Ranking
Satisfaction With Supplementary Services (CV2) 0.24
Source: IMM Analysis
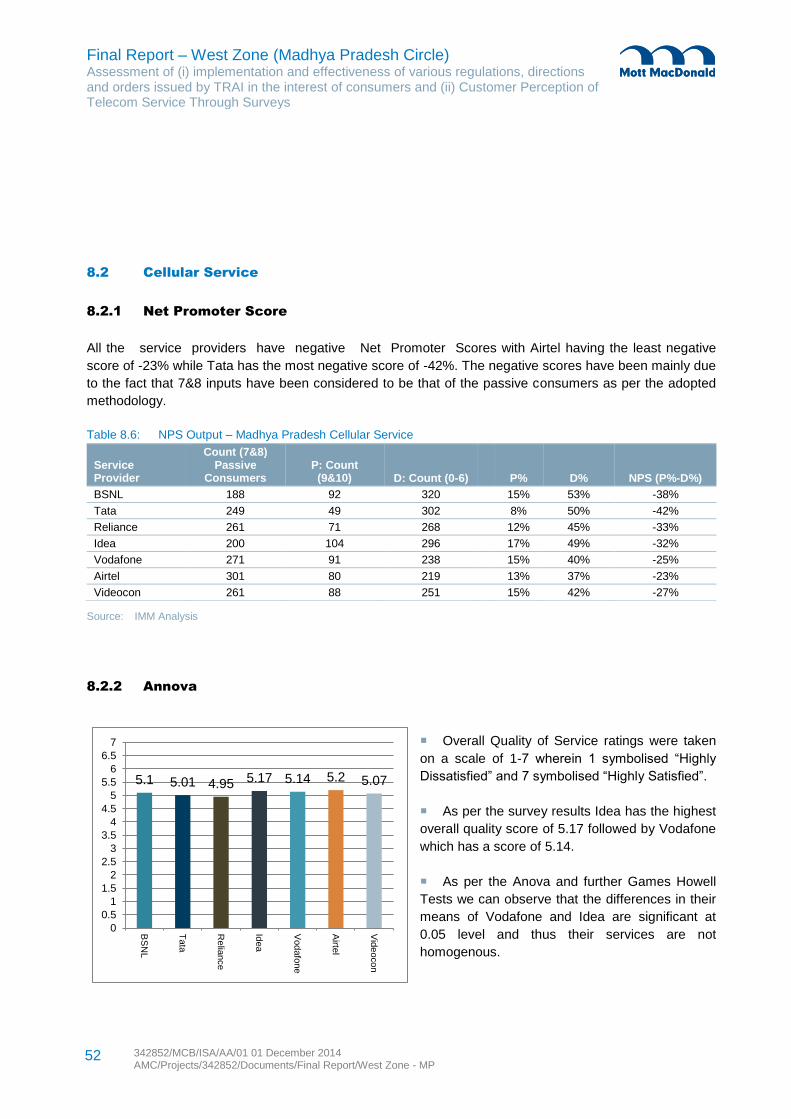
Final Report – West Zone (Madhya Pradesh Circle) Assessment of (i) implementation and effectiveness of various regulations, directions and orders issued by TRAI in the interest of consumers and (ii) Customer Perception of Telecom Service Through Surveys
342852/MCB/ISA/AA/01 01 December 2014 AMC/Projects/342852/Documents/Final Report/West Zone - MP
52
5.1 5.01 4.95 5.17 5.14 5.2 5.07
0
0.5
1
1.5
2
2.5
3
3.5
4
4.5
5
5.5
6
6.5
7
BS
NL
Tata
Re
liance
Idea
Vod
afo
ne
Airte
l
Vid
eoco
n
8.2 Cellular Service
8.2.1 Net Promoter Score
All the service providers have negative Net Promoter Scores with Airtel having the least negative
score of -23% while Tata has the most negative score of -42%. The negative scores have been mainly due
to the fact that 7&8 inputs have been considered to be that of the passive consumers as per the adopted
methodology.
Table 8.6: NPS Output – Madhya Pradesh Cellular Service
Service Provider
Count (7&8) Passive
Consumers P: Count (9&10) D: Count (0-6) P% D% NPS (P%-D%)
BSNL 188 92 320 15% 53% -38%
Tata 249 49 302 8% 50% -42%
Reliance 261 71 268 12% 45% -33%
Idea 200 104 296 17% 49% -32%
Vodafone 271 91 238 15% 40% -25%
Airtel 301 80 219 13% 37% -23%
Videocon 261 88 251 15% 42% -27%
Source: IMM Analysis
8.2.2 Annova
Overall Quality of Service ratings were taken
on a scale of 1-7 wherein 1 symbolised “Highly
Dissatisfied” and 7 symbolised “Highly Satisfied”.
As per the survey results Idea has the highest
overall quality score of 5.17 followed by Vodafone
which has a score of 5.14.
As per the Anova and further Games Howell
Tests we can observe that the differences in their
means of Vodafone and Idea are significant at
0.05 level and thus their services are not
homogenous.
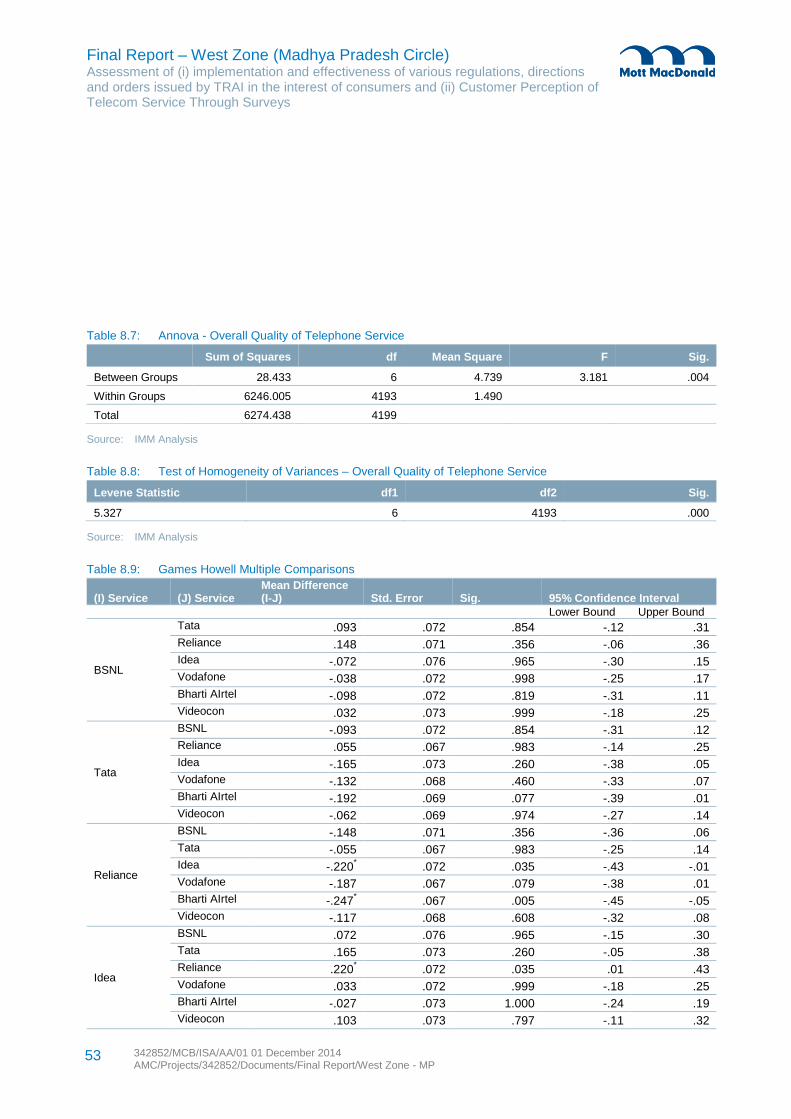
Final Report – West Zone (Madhya Pradesh Circle) Assessment of (i) implementation and effectiveness of various regulations, directions and orders issued by TRAI in the interest of consumers and (ii) Customer Perception of Telecom Service Through Surveys
342852/MCB/ISA/AA/01 01 December 2014 AMC/Projects/342852/Documents/Final Report/West Zone - MP
53
Table 8.7: Annova - Overall Quality of Telephone Service
Sum of Squares df Mean Square F Sig.
Between Groups 28.433 6 4.739 3.181 .004
Within Groups 6246.005 4193 1.490
Total 6274.438 4199
Source: IMM Analysis
Table 8.8: Test of Homogeneity of Variances – Overall Quality of Telephone Service
Levene Statistic df1 df2 Sig.
5.327 6 4193 .000
Source: IMM Analysis
Table 8.9: Games Howell Multiple Comparisons
(I) Service (J) Service Mean Difference (I-J) Std. Error Sig. 95% Confidence Interval
Lower Bound Upper Bound
BSNL
Tata .093 .072 .854 -.12 .31
Reliance .148 .071 .356 -.06 .36
Idea -.072 .076 .965 -.30 .15
Vodafone -.038 .072 .998 -.25 .17
Bharti AIrtel -.098 .072 .819 -.31 .11
Videocon .032 .073 .999 -.18 .25
Tata
BSNL -.093 .072 .854 -.31 .12
Reliance .055 .067 .983 -.14 .25
Idea -.165 .073 .260 -.38 .05
Vodafone -.132 .068 .460 -.33 .07
Bharti AIrtel -.192 .069 .077 -.39 .01
Videocon -.062 .069 .974 -.27 .14
Reliance
BSNL -.148 .071 .356 -.36 .06
Tata -.055 .067 .983 -.25 .14
Idea -.220* .072 .035 -.43 -.01
Vodafone -.187 .067 .079 -.38 .01
Bharti AIrtel -.247* .067 .005 -.45 -.05
Videocon -.117 .068 .608 -.32 .08
Idea
BSNL .072 .076 .965 -.15 .30
Tata .165 .073 .260 -.05 .38
Reliance .220* .072 .035 .01 .43
Vodafone .033 .072 .999 -.18 .25
Bharti AIrtel -.027 .073 1.000 -.24 .19
Videocon .103 .073 .797 -.11 .32
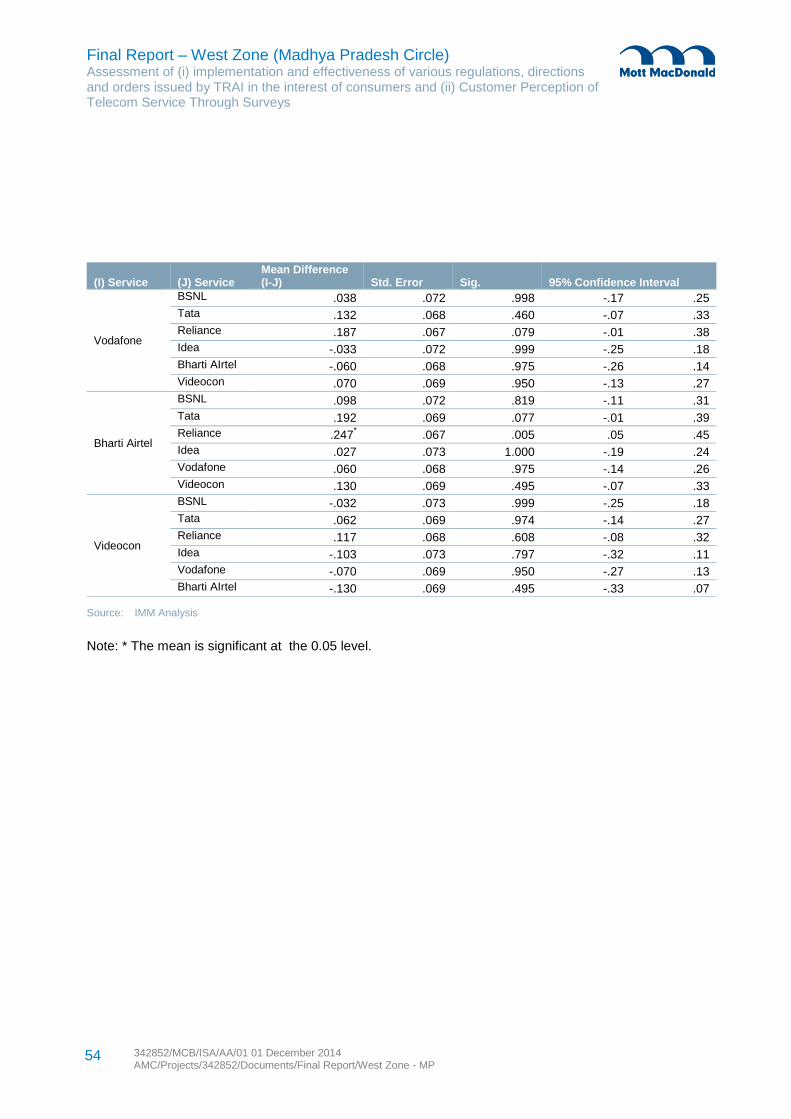
Final Report – West Zone (Madhya Pradesh Circle) Assessment of (i) implementation and effectiveness of various regulations, directions and orders issued by TRAI in the interest of consumers and (ii) Customer Perception of Telecom Service Through Surveys
342852/MCB/ISA/AA/01 01 December 2014 AMC/Projects/342852/Documents/Final Report/West Zone - MP
54
(I) Service (J) Service Mean Difference (I-J) Std. Error Sig. 95% Confidence Interval
Vodafone
BSNL .038 .072 .998 -.17 .25
Tata .132 .068 .460 -.07 .33
Reliance .187 .067 .079 -.01 .38
Idea -.033 .072 .999 -.25 .18
Bharti AIrtel -.060 .068 .975 -.26 .14
Videocon .070 .069 .950 -.13 .27
Bharti Airtel
BSNL .098 .072 .819 -.11 .31
Tata .192 .069 .077 -.01 .39
Reliance .247* .067 .005 .05 .45
Idea .027 .073 1.000 -.19 .24
Vodafone .060 .068 .975 -.14 .26
Videocon .130 .069 .495 -.07 .33
Videocon
BSNL -.032 .073 .999 -.25 .18
Tata .062 .069 .974 -.14 .27
Reliance .117 .068 .608 -.08 .32
Idea -.103 .073 .797 -.32 .11
Vodafone -.070 .069 .950 -.27 .13
Bharti AIrtel -.130 .069 .495 -.33 .07
Source: IMM Analysis
Note: * The mean is significant at the 0.05 level.
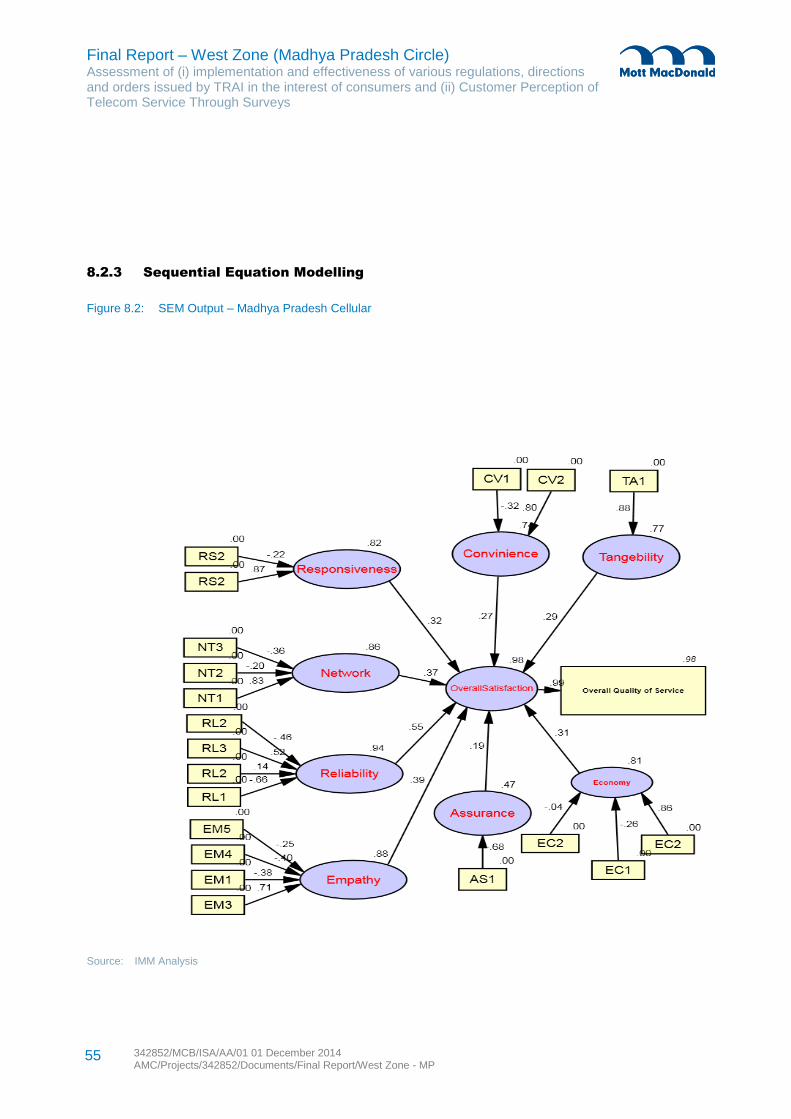
Final Report – West Zone (Madhya Pradesh Circle) Assessment of (i) implementation and effectiveness of various regulations, directions and orders issued by TRAI in the interest of consumers and (ii) Customer Perception of Telecom Service Through Surveys
342852/MCB/ISA/AA/01 01 December 2014 AMC/Projects/342852/Documents/Final Report/West Zone - MP
55
8.2.3 Sequential Equation Modelling
Figure 8.2: SEM Output – Madhya Pradesh Cellular
Source: IMM Analysis
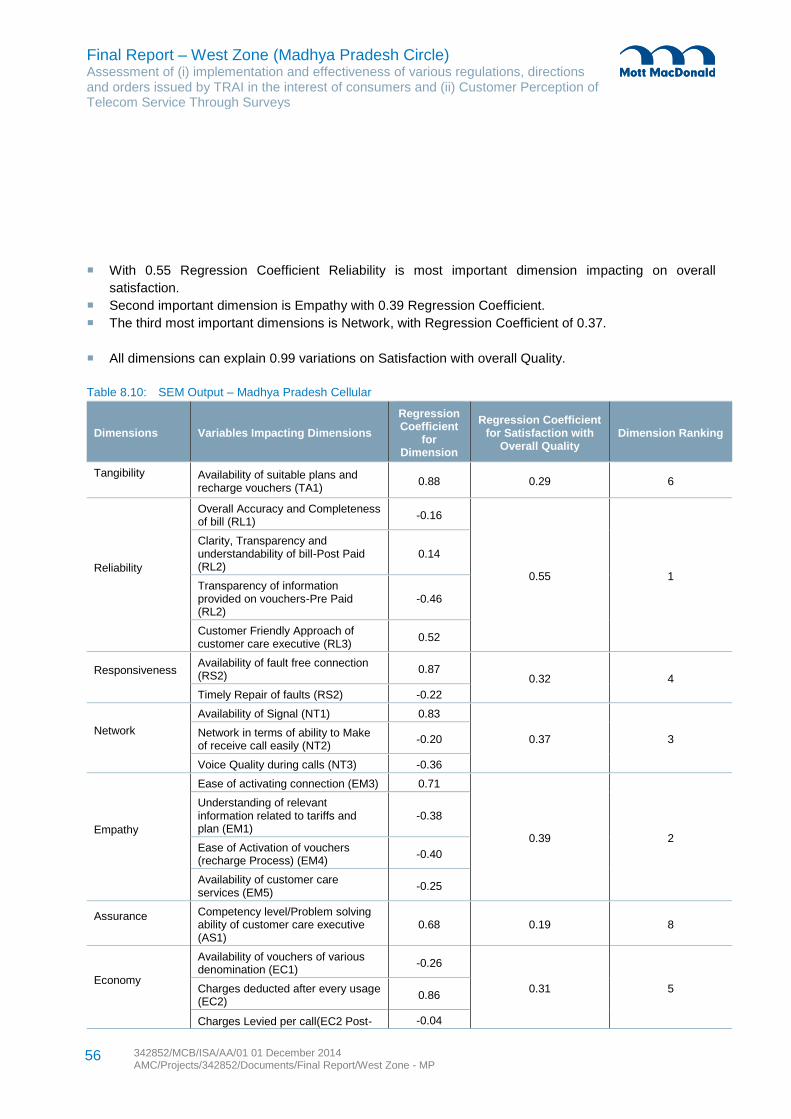
Final Report – West Zone (Madhya Pradesh Circle) Assessment of (i) implementation and effectiveness of various regulations, directions and orders issued by TRAI in the interest of consumers and (ii) Customer Perception of Telecom Service Through Surveys
342852/MCB/ISA/AA/01 01 December 2014 AMC/Projects/342852/Documents/Final Report/West Zone - MP
56
With 0.55 Regression Coefficient Reliability is most important dimension impacting on overall
satisfaction.
Second important dimension is Empathy with 0.39 Regression Coefficient.
The third most important dimensions is Network, with Regression Coefficient of 0.37.
All dimensions can explain 0.99 variations on Satisfaction with overall Quality.
Table 8.10: SEM Output – Madhya Pradesh Cellular
Dimensions Variables Impacting Dimensions
Regression Coefficient
for Dimension
Regression Coefficient for Satisfaction with
Overall Quality Dimension Ranking
Tangibility
Availability of suitable plans and recharge vouchers (TA1)
0.88 0.29 6
Reliability
Overall Accuracy and Completeness of bill (RL1)
-0.16
0.55 1
Clarity, Transparency and understandability of bill-Post Paid (RL2)
0.14
Transparency of information provided on vouchers-Pre Paid (RL2)
-0.46
Customer Friendly Approach of customer care executive (RL3)
0.52
Responsiveness
Availability of fault free connection (RS2)
0.87 0.32 4
Timely Repair of faults (RS2) -0.22
Network
Availability of Signal (NT1) 0.83
0.37 3 Network in terms of ability to Make of receive call easily (NT2)
-0.20
Voice Quality during calls (NT3) -0.36
Empathy
Ease of activating connection (EM3) 0.71
0.39 2
Understanding of relevant information related to tariffs and plan (EM1)
-0.38
Ease of Activation of vouchers (recharge Process) (EM4)
-0.40
Availability of customer care services (EM5)
-0.25
Assurance
Competency level/Problem solving ability of customer care executive (AS1)
0.68 0.19 8
Economy
Availability of vouchers of various denomination (EC1)
-0.26
0.31 5 Charges deducted after every usage (EC2)
0.86
Charges Levied per call(EC2 Post- -0.04
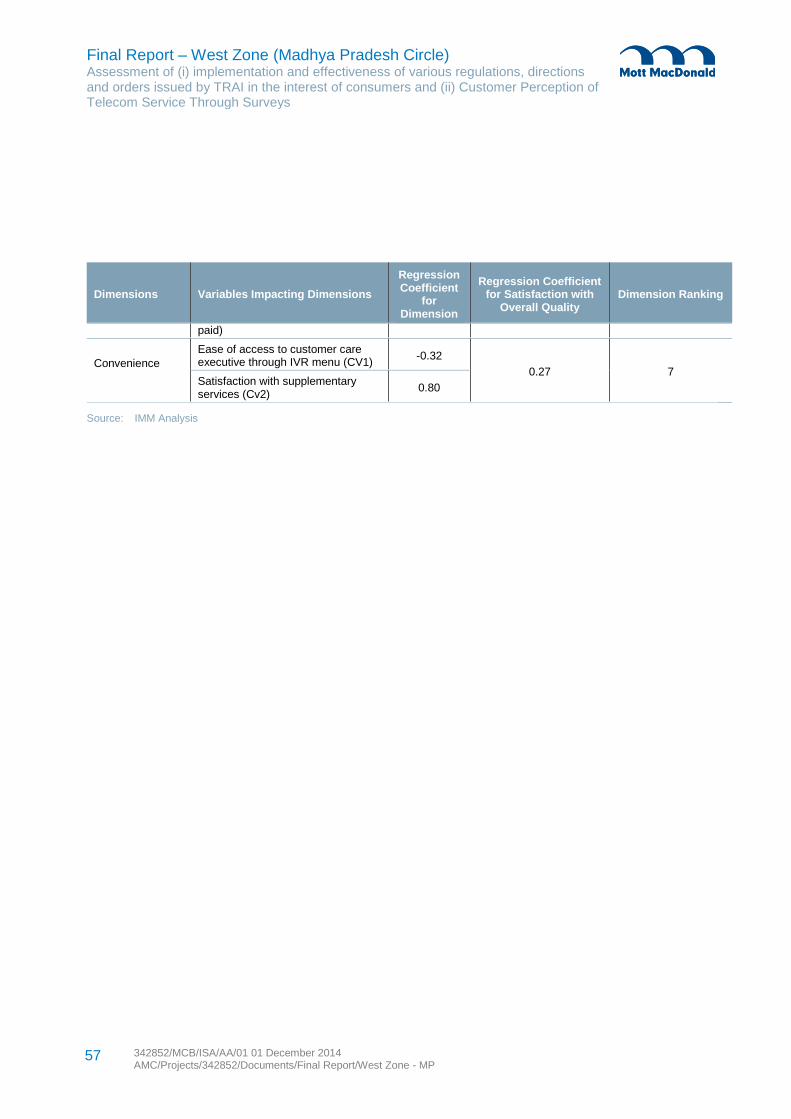
Final Report – West Zone (Madhya Pradesh Circle) Assessment of (i) implementation and effectiveness of various regulations, directions and orders issued by TRAI in the interest of consumers and (ii) Customer Perception of Telecom Service Through Surveys
342852/MCB/ISA/AA/01 01 December 2014 AMC/Projects/342852/Documents/Final Report/West Zone - MP
57
Dimensions Variables Impacting Dimensions
Regression Coefficient
for Dimension
Regression Coefficient for Satisfaction with
Overall Quality Dimension Ranking
paid)
Convenience
Ease of access to customer care executive through IVR menu (CV1)
-0.32
0.27 7 Satisfaction with supplementary services (Cv2)
0.80
Source: IMM Analysis
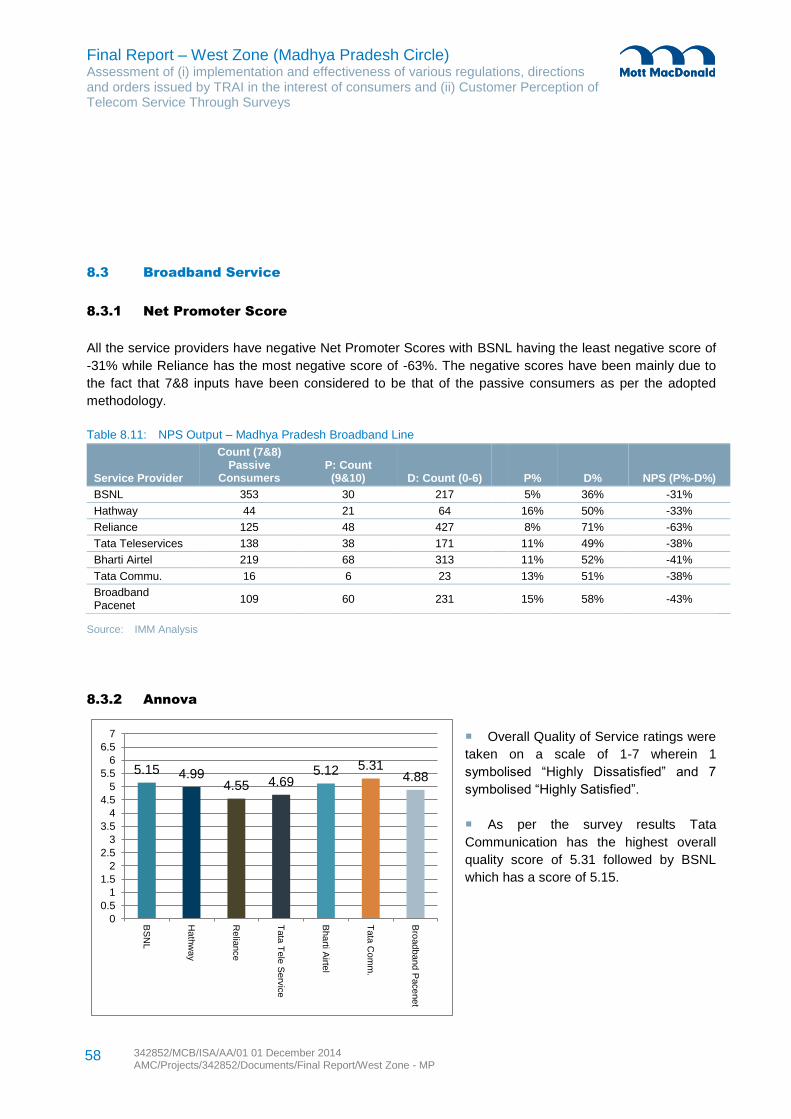
Final Report – West Zone (Madhya Pradesh Circle) Assessment of (i) implementation and effectiveness of various regulations, directions and orders issued by TRAI in the interest of consumers and (ii) Customer Perception of Telecom Service Through Surveys
342852/MCB/ISA/AA/01 01 December 2014 AMC/Projects/342852/Documents/Final Report/West Zone - MP
58
5.15 4.99 4.55 4.69
5.12 5.31 4.88
0
0.5
1
1.5
2
2.5
3
3.5
4
4.5
5
5.5
6
6.5
7
BS
NL
Ha
thw
ay
Re
liance
Tata
Tele
Serv
ice
Bha
rti Airte
l
Tata
Co
mm
.
Bro
ad
ba
nd
Pace
ne
t
8.3 Broadband Service
8.3.1 Net Promoter Score
All the service providers have negative Net Promoter Scores with BSNL having the least negative score of
-31% while Reliance has the most negative score of -63%. The negative scores have been mainly due to
the fact that 7&8 inputs have been considered to be that of the passive consumers as per the adopted
methodology.
Table 8.11: NPS Output – Madhya Pradesh Broadband Line
Service Provider
Count (7&8) Passive
Consumers P: Count (9&10) D: Count (0-6) P% D% NPS (P%-D%)
BSNL 353 30 217 5% 36% -31%
Hathway 44 21 64 16% 50% -33%
Reliance 125 48 427 8% 71% -63%
Tata Teleservices 138 38 171 11% 49% -38%
Bharti Airtel 219 68 313 11% 52% -41%
Tata Commu. 16 6 23 13% 51% -38%
Broadband Pacenet
109 60 231
15% 58% -43%
Source: IMM Analysis
8.3.2 Annova
Overall Quality of Service ratings were
taken on a scale of 1-7 wherein 1
symbolised “Highly Dissatisfied” and 7
symbolised “Highly Satisfied”.
As per the survey results Tata
Communication has the highest overall
quality score of 5.31 followed by BSNL
which has a score of 5.15.
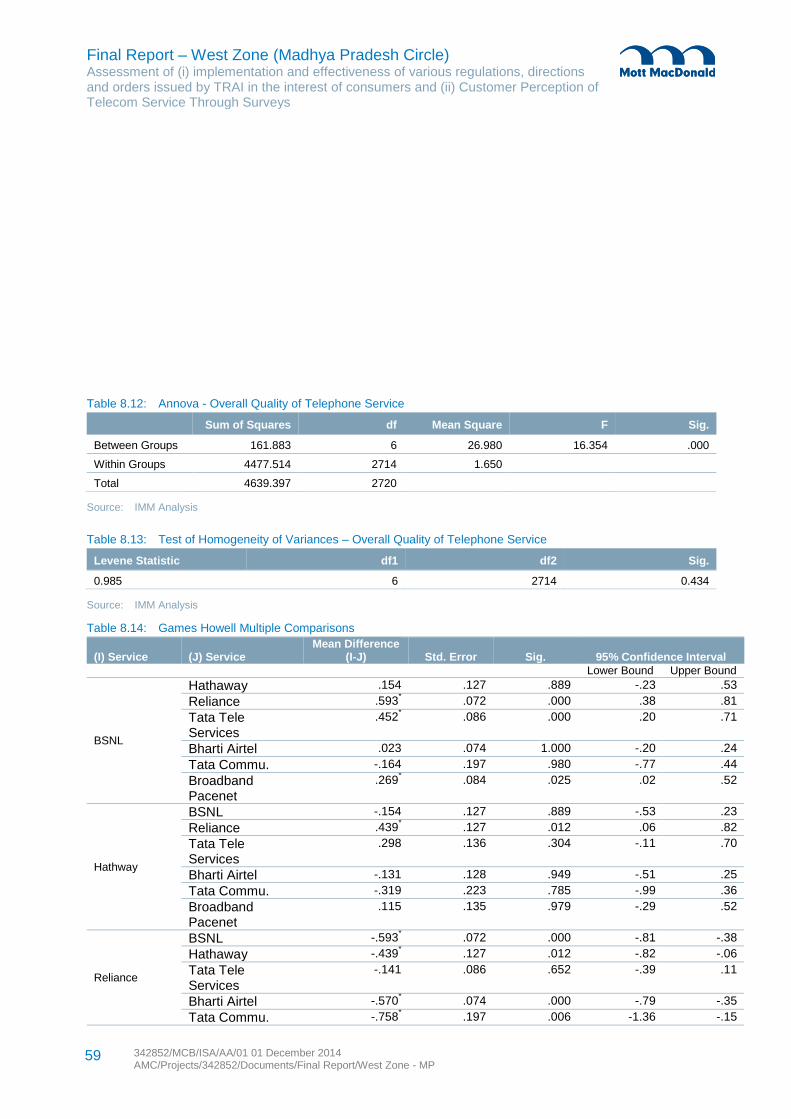
Final Report – West Zone (Madhya Pradesh Circle) Assessment of (i) implementation and effectiveness of various regulations, directions and orders issued by TRAI in the interest of consumers and (ii) Customer Perception of Telecom Service Through Surveys
342852/MCB/ISA/AA/01 01 December 2014 AMC/Projects/342852/Documents/Final Report/West Zone - MP
59
Table 8.12: Annova - Overall Quality of Telephone Service
Sum of Squares df Mean Square F Sig.
Between Groups 161.883 6 26.980 16.354 .000
Within Groups 4477.514 2714 1.650
Total 4639.397 2720
Source: IMM Analysis
Table 8.13: Test of Homogeneity of Variances – Overall Quality of Telephone Service
Levene Statistic df1 df2 Sig.
0.985 6 2714 0.434
Source: IMM Analysis
Table 8.14: Games Howell Multiple Comparisons
(I) Service (J) Service Mean Difference
(I-J) Std. Error Sig. 95% Confidence Interval
Lower Bound Upper Bound
BSNL
Hathaway .154 .127 .889 -.23 .53
Reliance .593* .072 .000 .38 .81
Tata Tele Services
.452* .086 .000 .20 .71
Bharti Airtel .023 .074 1.000 -.20 .24
Tata Commu. -.164 .197 .980 -.77 .44
Broadband Pacenet
.269* .084 .025 .02 .52
Hathway
BSNL -.154 .127 .889 -.53 .23
Reliance .439* .127 .012 .06 .82
Tata Tele Services
.298 .136 .304 -.11 .70
Bharti Airtel -.131 .128 .949 -.51 .25
Tata Commu. -.319 .223 .785 -.99 .36
Broadband Pacenet
.115 .135 .979 -.29 .52
Reliance
BSNL -.593* .072 .000 -.81 -.38
Hathaway -.439* .127 .012 -.82 -.06
Tata Tele Services
-.141 .086 .652 -.39 .11
Bharti Airtel -.570* .074 .000 -.79 -.35
Tata Commu. -.758* .197 .006 -1.36 -.15
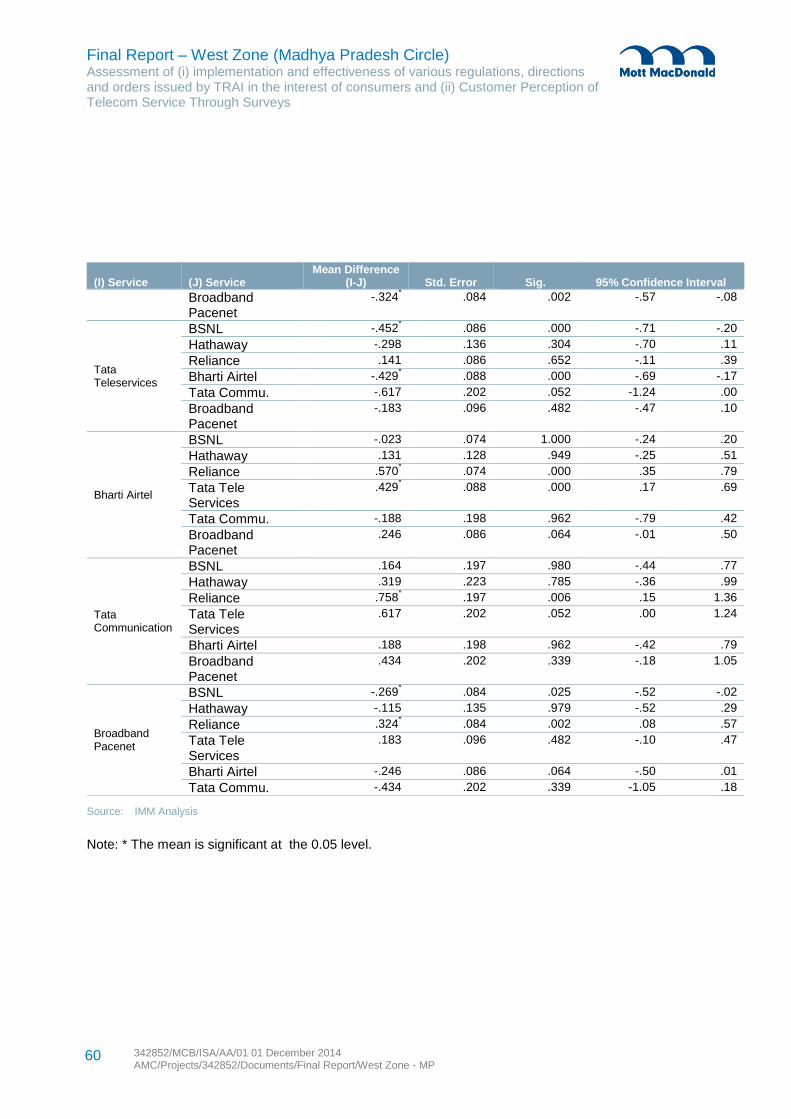
Final Report – West Zone (Madhya Pradesh Circle) Assessment of (i) implementation and effectiveness of various regulations, directions and orders issued by TRAI in the interest of consumers and (ii) Customer Perception of Telecom Service Through Surveys
342852/MCB/ISA/AA/01 01 December 2014 AMC/Projects/342852/Documents/Final Report/West Zone - MP
60
(I) Service (J) Service Mean Difference
(I-J) Std. Error Sig. 95% Confidence Interval
Broadband Pacenet
-.324* .084 .002 -.57 -.08
Tata Teleservices
BSNL -.452* .086 .000 -.71 -.20
Hathaway -.298 .136 .304 -.70 .11
Reliance .141 .086 .652 -.11 .39
Bharti Airtel -.429* .088 .000 -.69 -.17
Tata Commu. -.617 .202 .052 -1.24 .00
Broadband Pacenet
-.183 .096 .482 -.47 .10
Bharti Airtel
BSNL -.023 .074 1.000 -.24 .20
Hathaway .131 .128 .949 -.25 .51
Reliance .570* .074 .000 .35 .79
Tata Tele Services
.429* .088 .000 .17 .69
Tata Commu. -.188 .198 .962 -.79 .42
Broadband Pacenet
.246 .086 .064 -.01 .50
Tata Communication
BSNL .164 .197 .980 -.44 .77
Hathaway .319 .223 .785 -.36 .99
Reliance .758* .197 .006 .15 1.36
Tata Tele Services
.617 .202 .052 .00 1.24
Bharti Airtel .188 .198 .962 -.42 .79
Broadband Pacenet
.434 .202 .339 -.18 1.05
Broadband Pacenet
BSNL -.269* .084 .025 -.52 -.02
Hathaway -.115 .135 .979 -.52 .29
Reliance .324* .084 .002 .08 .57
Tata Tele Services
.183 .096 .482 -.10 .47
Bharti Airtel -.246 .086 .064 -.50 .01
Tata Commu. -.434 .202 .339 -1.05 .18
Source: IMM Analysis
Note: * The mean is significant at the 0.05 level.
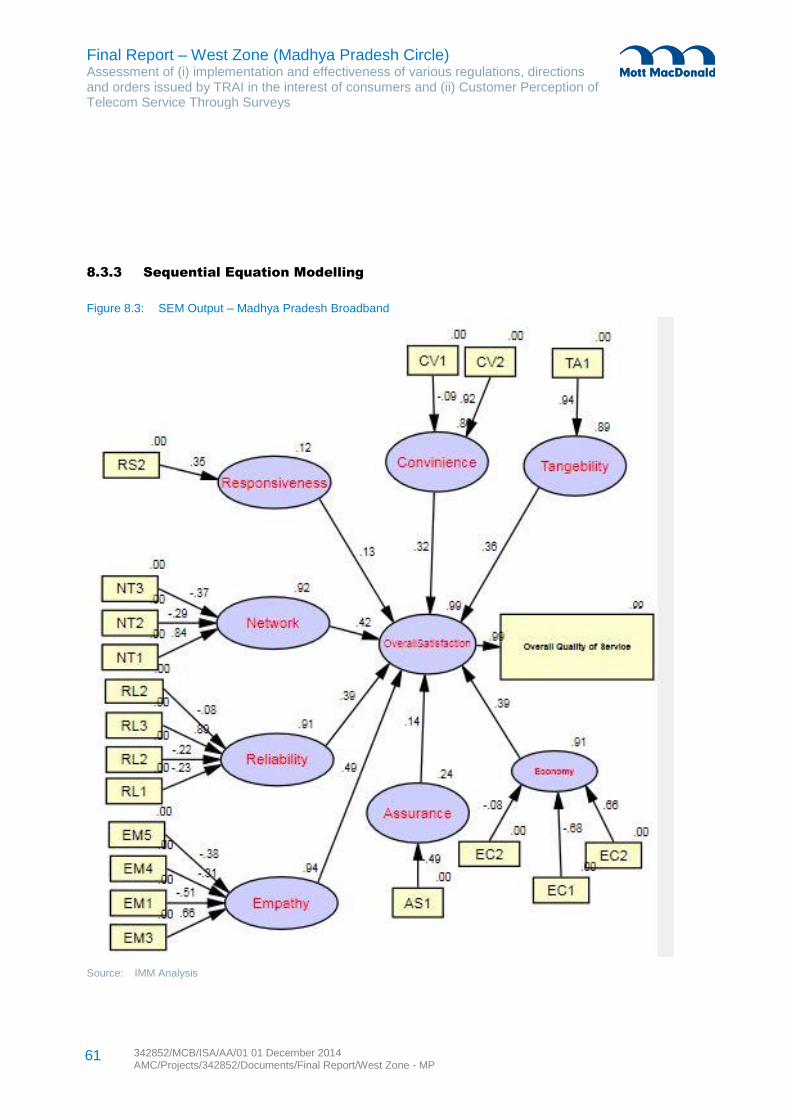
Final Report – West Zone (Madhya Pradesh Circle) Assessment of (i) implementation and effectiveness of various regulations, directions and orders issued by TRAI in the interest of consumers and (ii) Customer Perception of Telecom Service Through Surveys
342852/MCB/ISA/AA/01 01 December 2014 AMC/Projects/342852/Documents/Final Report/West Zone - MP
61
8.3.3 Sequential Equation Modelling
Figure 8.3: SEM Output – Madhya Pradesh Broadband
Source: IMM Analysis
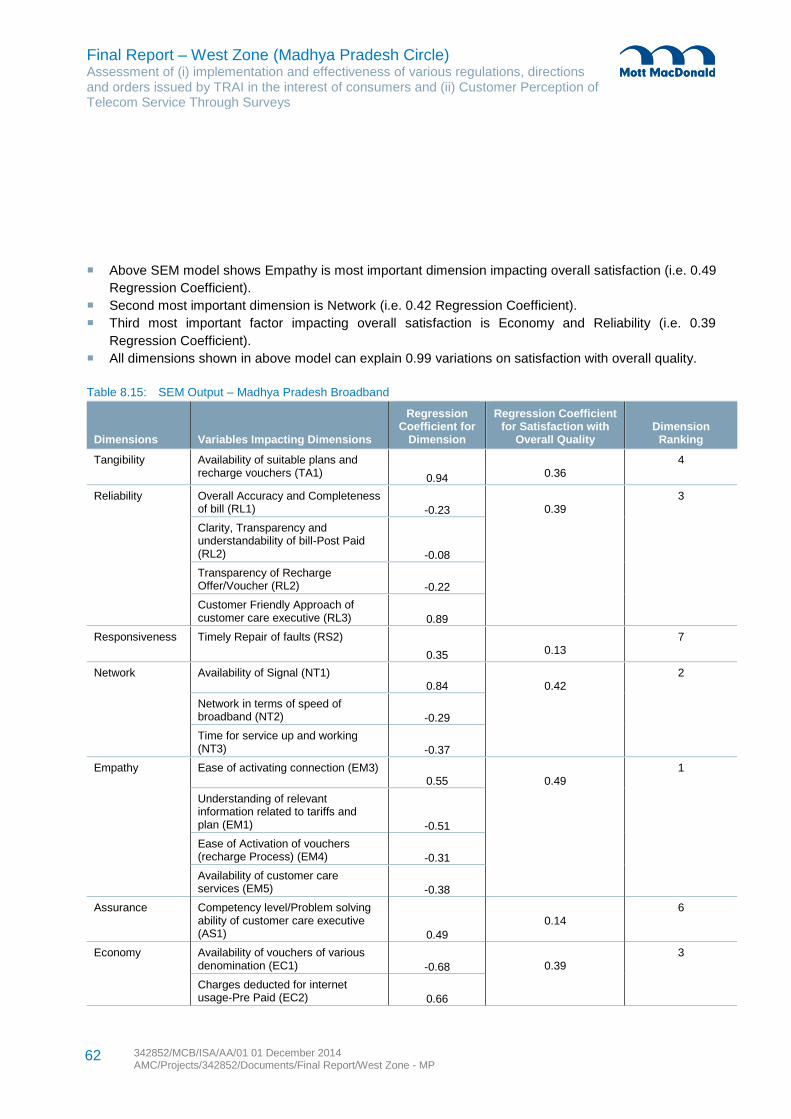
Final Report – West Zone (Madhya Pradesh Circle) Assessment of (i) implementation and effectiveness of various regulations, directions and orders issued by TRAI in the interest of consumers and (ii) Customer Perception of Telecom Service Through Surveys
342852/MCB/ISA/AA/01 01 December 2014 AMC/Projects/342852/Documents/Final Report/West Zone - MP
62
Above SEM model shows Empathy is most important dimension impacting overall satisfaction (i.e. 0.49
Regression Coefficient).
Second most important dimension is Network (i.e. 0.42 Regression Coefficient).
Third most important factor impacting overall satisfaction is Economy and Reliability (i.e. 0.39
Regression Coefficient).
All dimensions shown in above model can explain 0.99 variations on satisfaction with overall quality.
Table 8.15: SEM Output – Madhya Pradesh Broadband
Dimensions Variables Impacting Dimensions
Regression Coefficient for
Dimension
Regression Coefficient for Satisfaction with
Overall Quality Dimension
Ranking
Tangibility
Availability of suitable plans and recharge vouchers (TA1) 0.94 0.36
4
Reliability
Overall Accuracy and Completeness of bill (RL1) -0.23 0.39
3
Clarity, Transparency and understandability of bill-Post Paid (RL2) -0.08
Transparency of Recharge Offer/Voucher (RL2) -0.22
Customer Friendly Approach of customer care executive (RL3) 0.89
Responsiveness
Timely Repair of faults (RS2)
0.35 0.13 7
Network
Availability of Signal (NT1) 0.84 0.42
2
Network in terms of speed of broadband (NT2) -0.29
Time for service up and working (NT3) -0.37
Empathy
Ease of activating connection (EM3) 0.55 0.49
1
Understanding of relevant information related to tariffs and plan (EM1) -0.51
Ease of Activation of vouchers (recharge Process) (EM4) -0.31
Availability of customer care services (EM5) -0.38
Assurance
Competency level/Problem solving ability of customer care executive (AS1) 0.49
0.14 6
Economy
Availability of vouchers of various denomination (EC1) -0.68 0.39
3
Charges deducted for internet usage-Pre Paid (EC2) 0.66
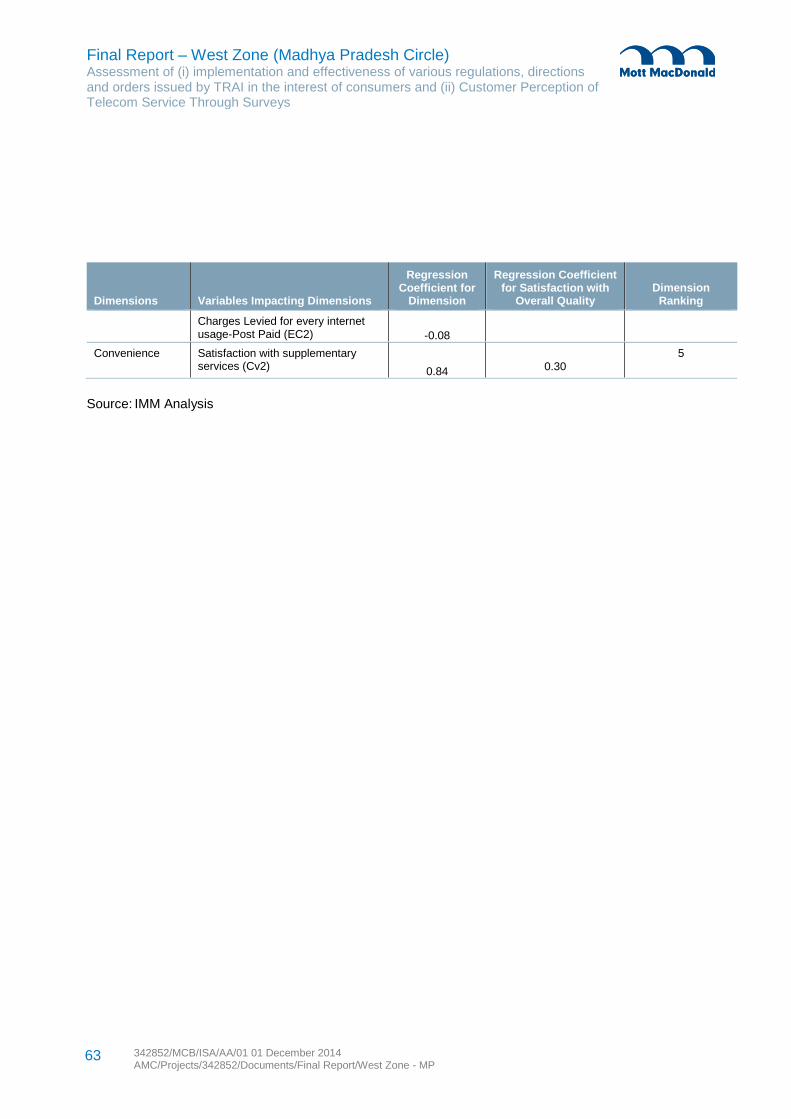
Final Report – West Zone (Madhya Pradesh Circle) Assessment of (i) implementation and effectiveness of various regulations, directions and orders issued by TRAI in the interest of consumers and (ii) Customer Perception of Telecom Service Through Surveys
342852/MCB/ISA/AA/01 01 December 2014 AMC/Projects/342852/Documents/Final Report/West Zone - MP
63
Dimensions Variables Impacting Dimensions
Regression Coefficient for
Dimension
Regression Coefficient for Satisfaction with
Overall Quality Dimension
Ranking
Charges Levied for every internet usage-Post Paid (EC2) -0.08
Convenience
Satisfaction with supplementary services (Cv2) 0.84 0.30
5
Source: IMM Analysis
Final Report – West Zone (Madhya Pradesh Circle) Assessment of (i) implementation and effectiveness of various regulations, directions and orders issued by TRAI in the interest of consumers and (ii) Customer Perception of Telecom Service Through Surveys
342852/MCB/ISA/AA/01 01 December 2014 AMC/Projects/342852/Documents/Final Report/West Zone - MP
64
Appendices
Appendix A. Output Tables - SEM _________________________________________________________________ Appendix B. Questionnaires ______________________________________________________________________
Appendix C. Output Tables – Madhya Pradesh Circle
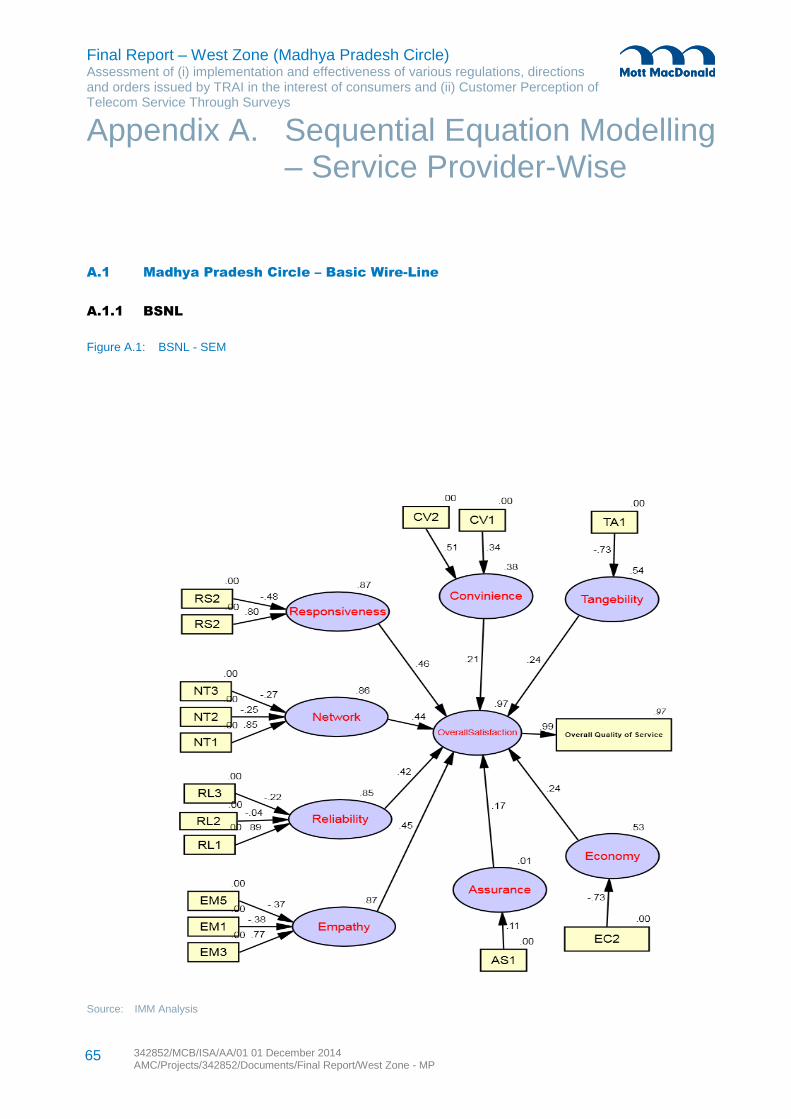
Final Report – West Zone (Madhya Pradesh Circle) Assessment of (i) implementation and effectiveness of various regulations, directions and orders issued by TRAI in the interest of consumers and (ii) Customer Perception of Telecom Service Through Surveys
342852/MCB/ISA/AA/01 01 December 2014 AMC/Projects/342852/Documents/Final Report/West Zone - MP
65
A.1 Madhya Pradesh Circle – Basic Wire-Line
A.1.1 BSNL
Figure A.1: BSNL - SEM
Source: IMM Analysis
Appendix A. Sequential Equation Modelling – Service Provider-Wise
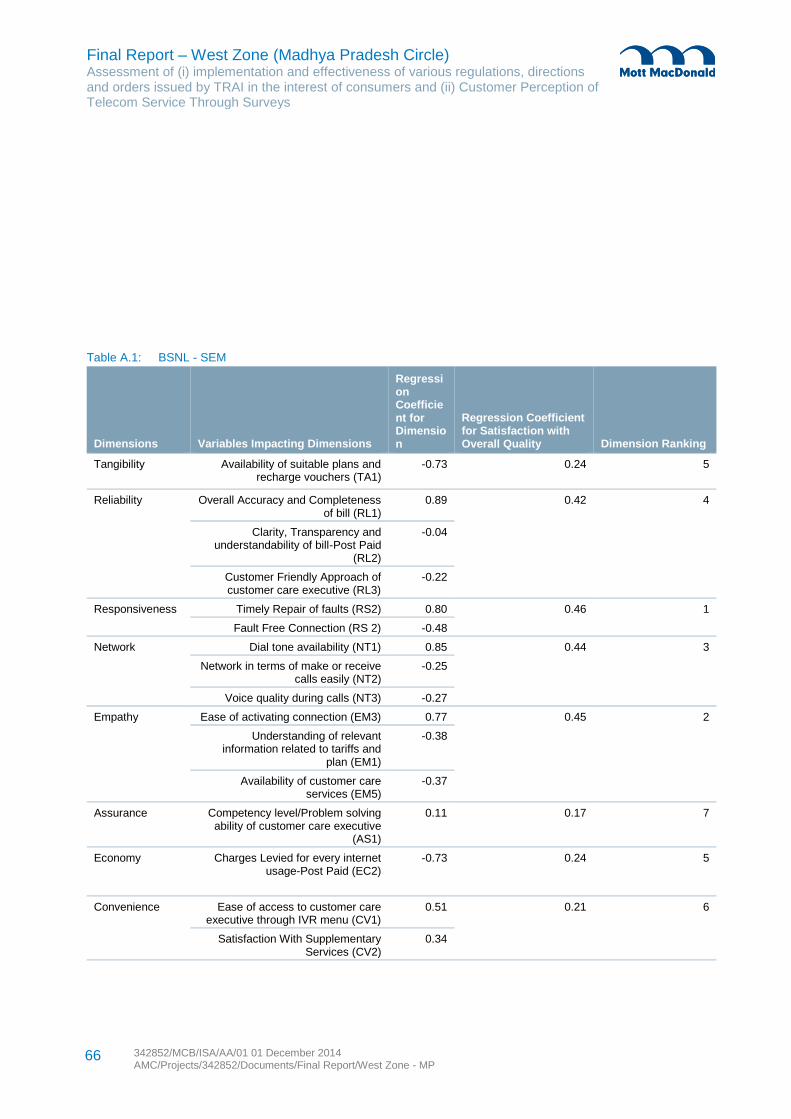
Final Report – West Zone (Madhya Pradesh Circle) Assessment of (i) implementation and effectiveness of various regulations, directions and orders issued by TRAI in the interest of consumers and (ii) Customer Perception of Telecom Service Through Surveys
342852/MCB/ISA/AA/01 01 December 2014 AMC/Projects/342852/Documents/Final Report/West Zone - MP
66
Table A.1: BSNL - SEM
Dimensions Variables Impacting Dimensions
Regression Coefficient for Dimension
Regression Coefficient for Satisfaction with Overall Quality Dimension Ranking
Tangibility
Availability of suitable plans and recharge vouchers (TA1)
-0.73 0.24 5
Reliability
Overall Accuracy and Completeness of bill (RL1)
0.89 0.42 4
Clarity, Transparency and understandability of bill-Post Paid
(RL2)
-0.04
Customer Friendly Approach of customer care executive (RL3)
-0.22
Responsiveness
Timely Repair of faults (RS2) 0.80 0.46 1
Fault Free Connection (RS 2) -0.48
Network
Dial tone availability (NT1) 0.85 0.44 3
Network in terms of make or receive calls easily (NT2)
-0.25
Voice quality during calls (NT3) -0.27
Empathy
Ease of activating connection (EM3) 0.77 0.45 2
Understanding of relevant information related to tariffs and
plan (EM1)
-0.38
Availability of customer care services (EM5)
-0.37
Assurance
Competency level/Problem solving ability of customer care executive
(AS1)
0.11 0.17 7
Economy
Charges Levied for every internet usage-Post Paid (EC2)
-0.73 0.24 5
Convenience
Ease of access to customer care executive through IVR menu (CV1)
0.51 0.21 6
Satisfaction With Supplementary Services (CV2)
0.34
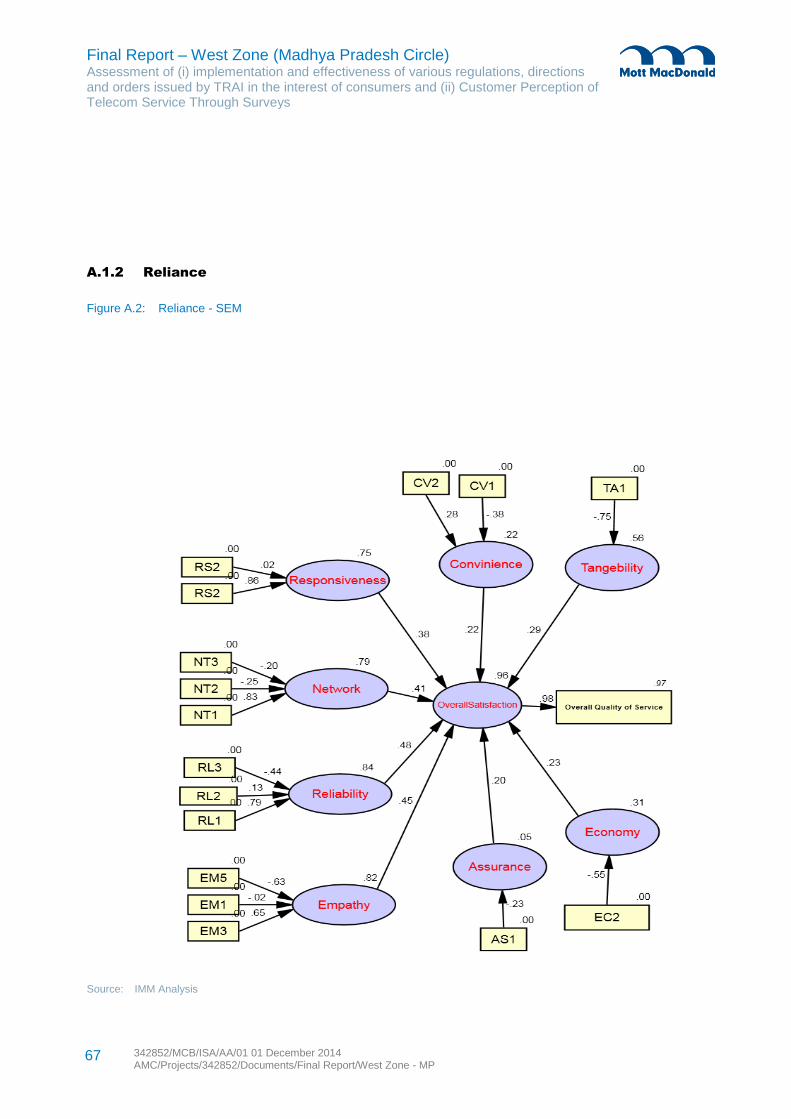
Final Report – West Zone (Madhya Pradesh Circle) Assessment of (i) implementation and effectiveness of various regulations, directions and orders issued by TRAI in the interest of consumers and (ii) Customer Perception of Telecom Service Through Surveys
342852/MCB/ISA/AA/01 01 December 2014 AMC/Projects/342852/Documents/Final Report/West Zone - MP
67
A.1.2 Reliance
Figure A.2: Reliance - SEM
Source: IMM Analysis
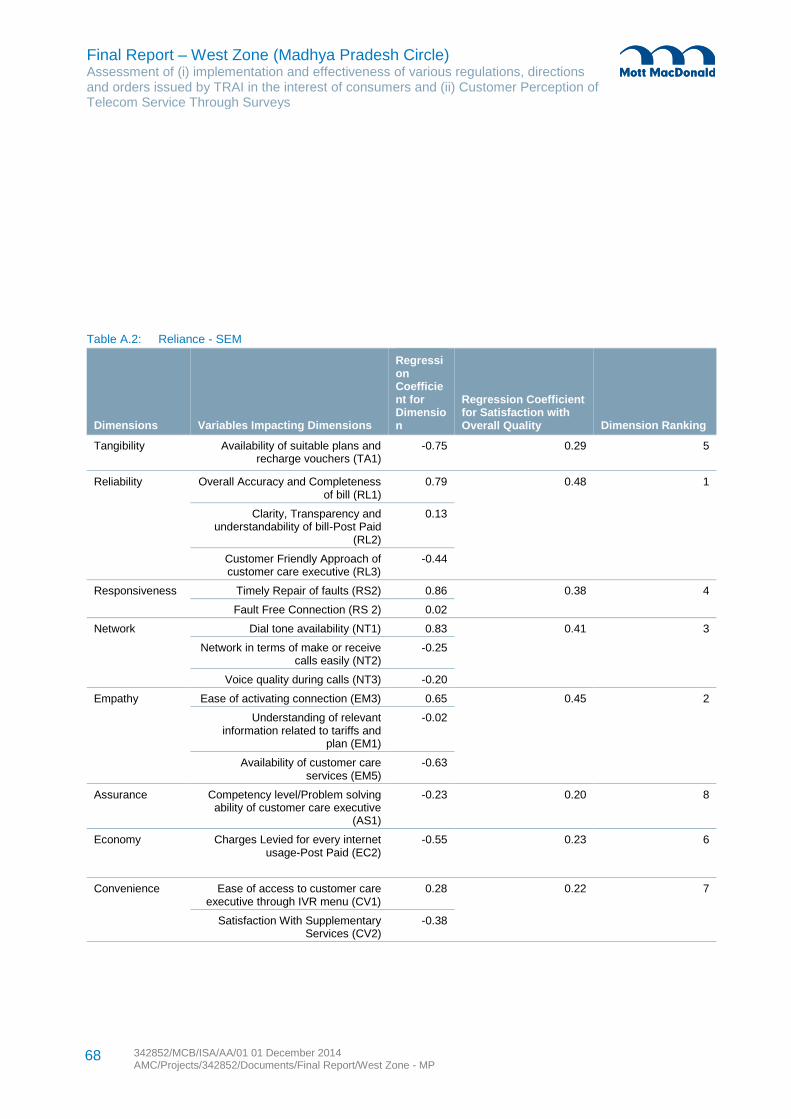
Final Report – West Zone (Madhya Pradesh Circle) Assessment of (i) implementation and effectiveness of various regulations, directions and orders issued by TRAI in the interest of consumers and (ii) Customer Perception of Telecom Service Through Surveys
342852/MCB/ISA/AA/01 01 December 2014 AMC/Projects/342852/Documents/Final Report/West Zone - MP
68
Table A.2: Reliance - SEM
Dimensions Variables Impacting Dimensions
Regression Coefficient for Dimension
Regression Coefficient for Satisfaction with Overall Quality Dimension Ranking
Tangibility
Availability of suitable plans and recharge vouchers (TA1)
-0.75 0.29 5
Reliability
Overall Accuracy and Completeness of bill (RL1)
0.79 0.48 1
Clarity, Transparency and understandability of bill-Post Paid
(RL2)
0.13
Customer Friendly Approach of customer care executive (RL3)
-0.44
Responsiveness
Timely Repair of faults (RS2) 0.86 0.38 4
Fault Free Connection (RS 2) 0.02
Network
Dial tone availability (NT1) 0.83 0.41 3
Network in terms of make or receive calls easily (NT2)
-0.25
Voice quality during calls (NT3) -0.20
Empathy
Ease of activating connection (EM3) 0.65 0.45 2
Understanding of relevant information related to tariffs and
plan (EM1)
-0.02
Availability of customer care services (EM5)
-0.63
Assurance
Competency level/Problem solving ability of customer care executive
(AS1)
-0.23 0.20 8
Economy
Charges Levied for every internet usage-Post Paid (EC2)
-0.55 0.23 6
Convenience
Ease of access to customer care executive through IVR menu (CV1)
0.28 0.22 7
Satisfaction With Supplementary Services (CV2)
-0.38
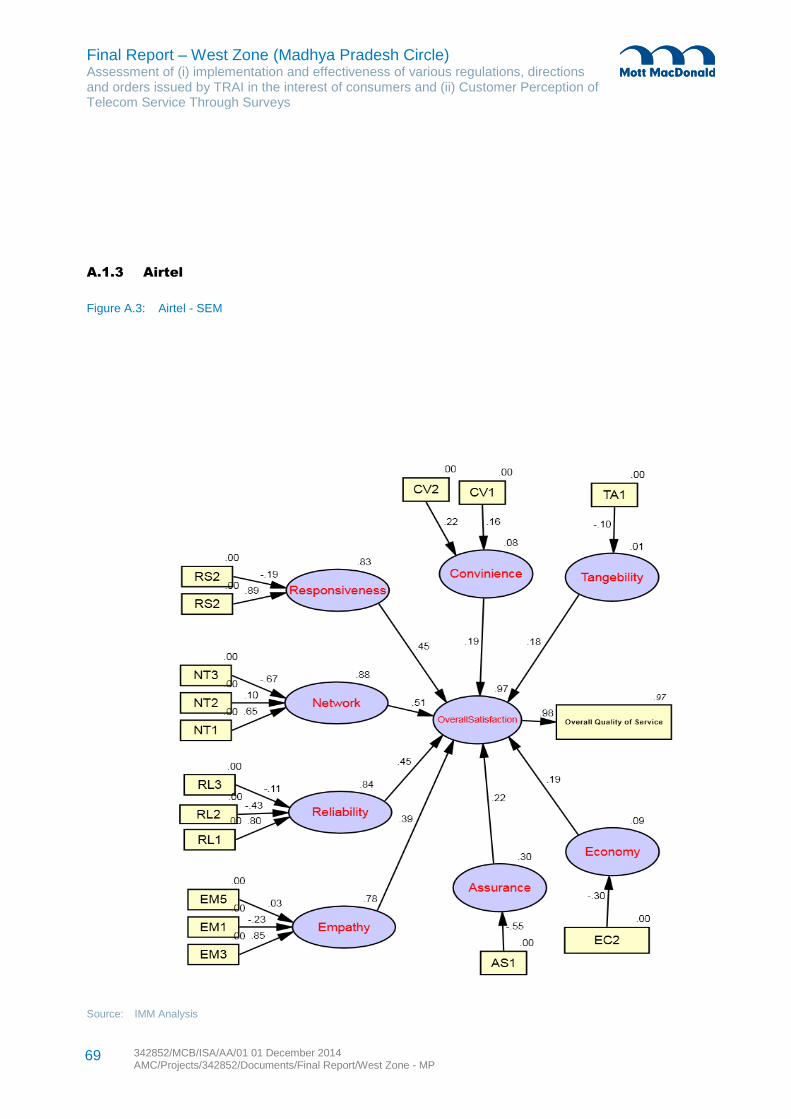
Final Report – West Zone (Madhya Pradesh Circle) Assessment of (i) implementation and effectiveness of various regulations, directions and orders issued by TRAI in the interest of consumers and (ii) Customer Perception of Telecom Service Through Surveys
342852/MCB/ISA/AA/01 01 December 2014 AMC/Projects/342852/Documents/Final Report/West Zone - MP
69
A.1.3 Airtel
Figure A.3: Airtel - SEM
Source: IMM Analysis
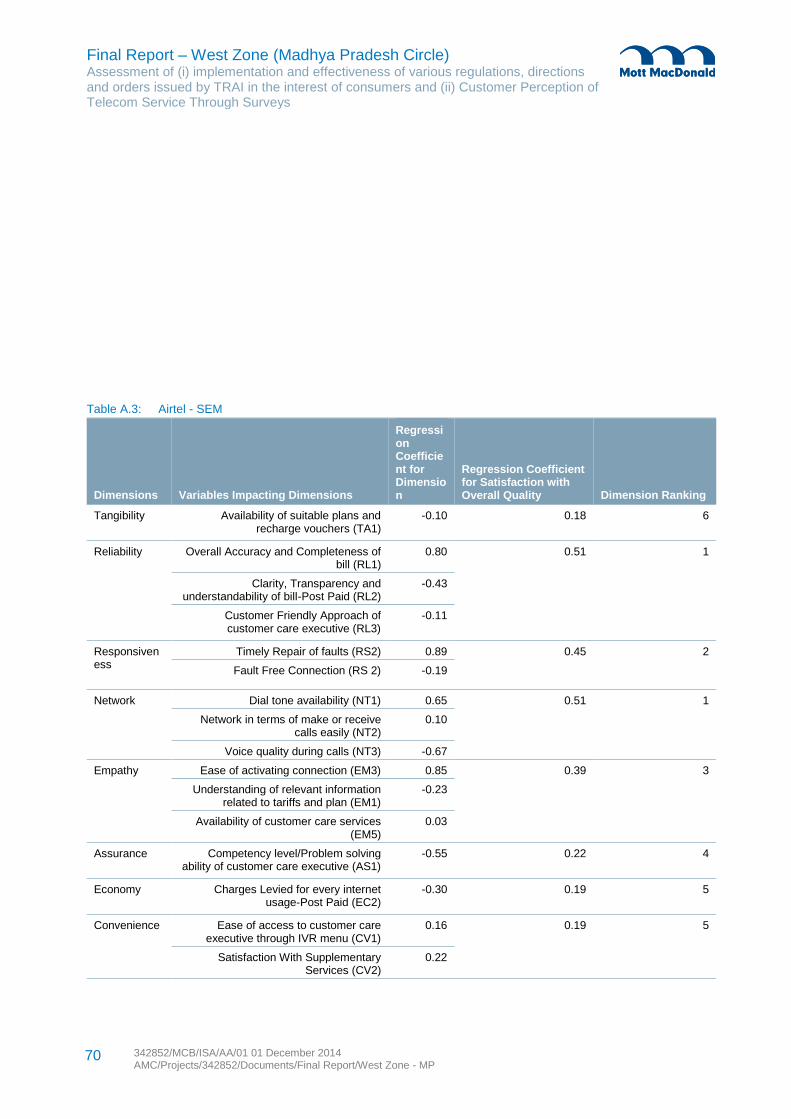
Final Report – West Zone (Madhya Pradesh Circle) Assessment of (i) implementation and effectiveness of various regulations, directions and orders issued by TRAI in the interest of consumers and (ii) Customer Perception of Telecom Service Through Surveys
342852/MCB/ISA/AA/01 01 December 2014 AMC/Projects/342852/Documents/Final Report/West Zone - MP
70
Table A.3: Airtel - SEM
Dimensions Variables Impacting Dimensions
Regression Coefficient for Dimension
Regression Coefficient for Satisfaction with Overall Quality Dimension Ranking
Tangibility
Availability of suitable plans and recharge vouchers (TA1)
-0.10 0.18 6
Reliability
Overall Accuracy and Completeness of bill (RL1)
0.80 0.51 1
Clarity, Transparency and understandability of bill-Post Paid (RL2)
-0.43
Customer Friendly Approach of customer care executive (RL3)
-0.11
Responsiveness
Timely Repair of faults (RS2) 0.89 0.45 2
Fault Free Connection (RS 2) -0.19
Network
Dial tone availability (NT1) 0.65 0.51 1
Network in terms of make or receive calls easily (NT2)
0.10
Voice quality during calls (NT3) -0.67
Empathy
Ease of activating connection (EM3) 0.85 0.39 3
Understanding of relevant information related to tariffs and plan (EM1)
-0.23
Availability of customer care services (EM5)
0.03
Assurance
Competency level/Problem solving ability of customer care executive (AS1)
-0.55 0.22 4
Economy
Charges Levied for every internet usage-Post Paid (EC2)
-0.30 0.19 5
Convenience
Ease of access to customer care executive through IVR menu (CV1)
0.16 0.19 5
Satisfaction With Supplementary Services (CV2)
0.22
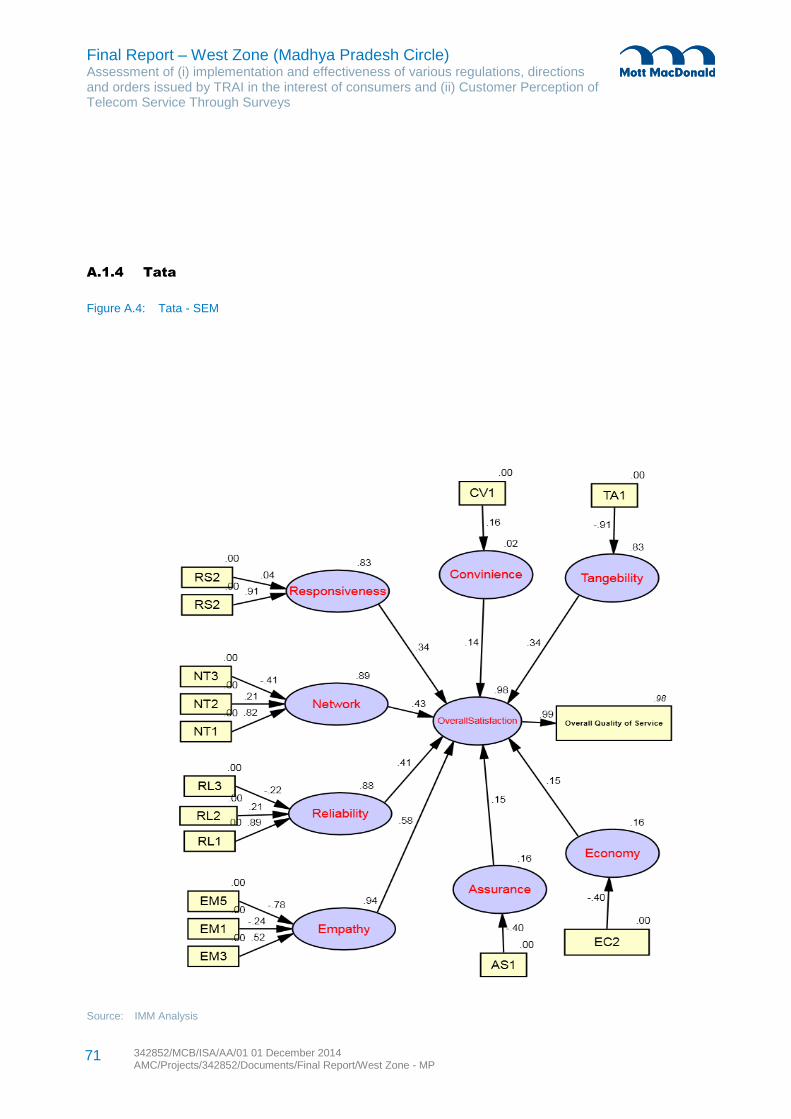
Final Report – West Zone (Madhya Pradesh Circle) Assessment of (i) implementation and effectiveness of various regulations, directions and orders issued by TRAI in the interest of consumers and (ii) Customer Perception of Telecom Service Through Surveys
342852/MCB/ISA/AA/01 01 December 2014 AMC/Projects/342852/Documents/Final Report/West Zone - MP
71
A.1.4 Tata
Figure A.4: Tata - SEM
Source: IMM Analysis
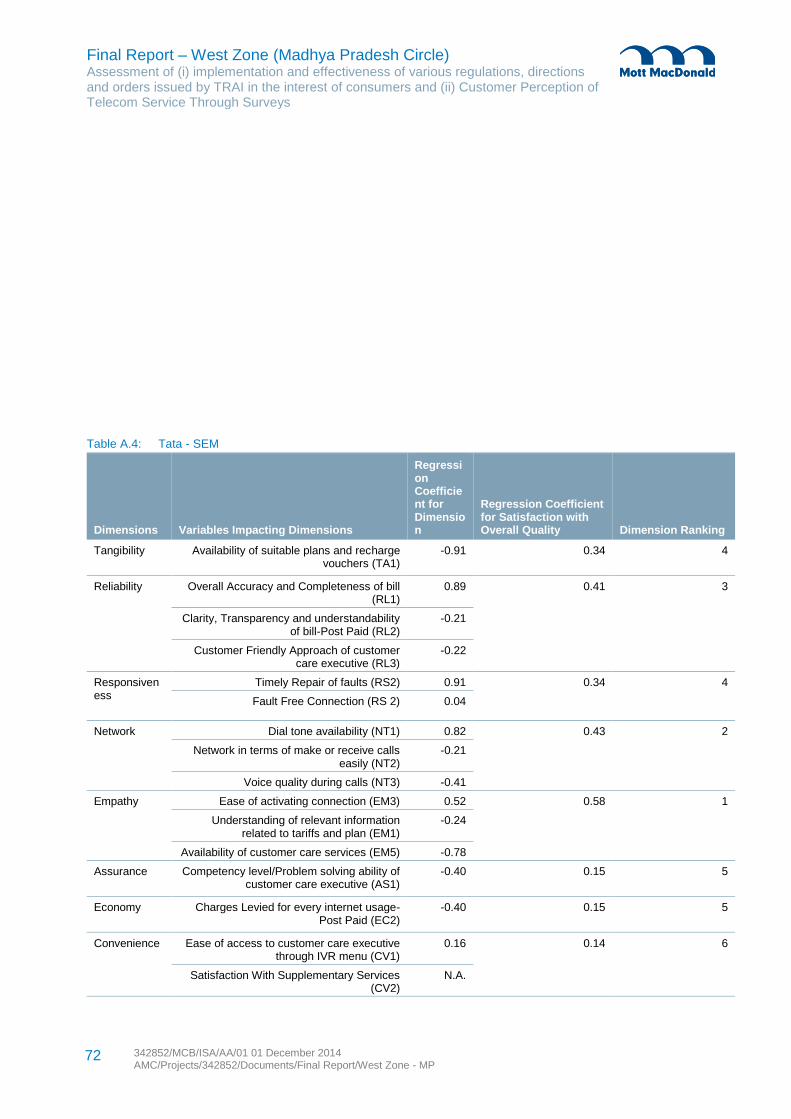
Final Report – West Zone (Madhya Pradesh Circle) Assessment of (i) implementation and effectiveness of various regulations, directions and orders issued by TRAI in the interest of consumers and (ii) Customer Perception of Telecom Service Through Surveys
342852/MCB/ISA/AA/01 01 December 2014 AMC/Projects/342852/Documents/Final Report/West Zone - MP
72
Table A.4: Tata - SEM
Dimensions Variables Impacting Dimensions
Regression Coefficient for Dimension
Regression Coefficient for Satisfaction with Overall Quality Dimension Ranking
Tangibility
Availability of suitable plans and recharge vouchers (TA1)
-0.91 0.34 4
Reliability
Overall Accuracy and Completeness of bill (RL1)
0.89 0.41 3
Clarity, Transparency and understandability of bill-Post Paid (RL2)
-0.21
Customer Friendly Approach of customer care executive (RL3)
-0.22
Responsiveness
Timely Repair of faults (RS2) 0.91 0.34 4
Fault Free Connection (RS 2) 0.04
Network
Dial tone availability (NT1) 0.82 0.43 2
Network in terms of make or receive calls easily (NT2)
-0.21
Voice quality during calls (NT3) -0.41
Empathy
Ease of activating connection (EM3) 0.52 0.58 1
Understanding of relevant information related to tariffs and plan (EM1)
-0.24
Availability of customer care services (EM5) -0.78
Assurance
Competency level/Problem solving ability of customer care executive (AS1)
-0.40 0.15 5
Economy
Charges Levied for every internet usage-Post Paid (EC2)
-0.40 0.15 5
Convenience
Ease of access to customer care executive through IVR menu (CV1)
0.16 0.14 6
Satisfaction With Supplementary Services (CV2)
N.A.
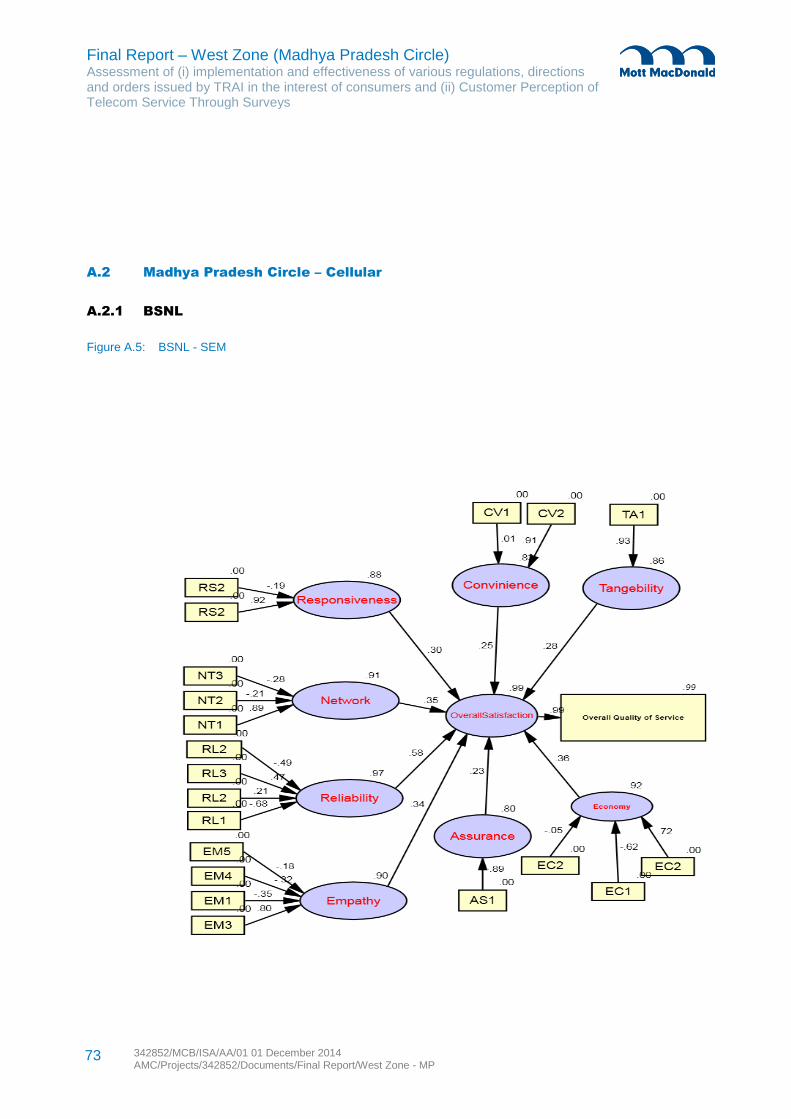
Final Report – West Zone (Madhya Pradesh Circle) Assessment of (i) implementation and effectiveness of various regulations, directions and orders issued by TRAI in the interest of consumers and (ii) Customer Perception of Telecom Service Through Surveys
342852/MCB/ISA/AA/01 01 December 2014 AMC/Projects/342852/Documents/Final Report/West Zone - MP
73
A.2 Madhya Pradesh Circle – Cellular
A.2.1 BSNL
Figure A.5: BSNL - SEM
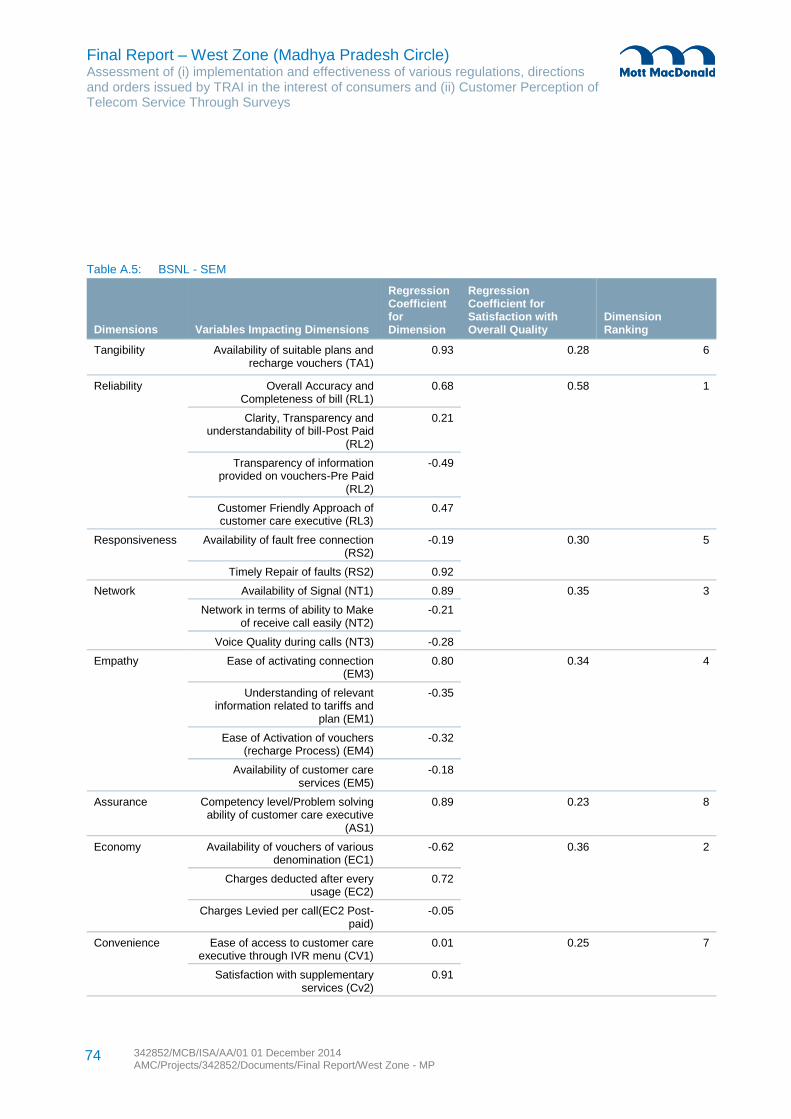
Final Report – West Zone (Madhya Pradesh Circle) Assessment of (i) implementation and effectiveness of various regulations, directions and orders issued by TRAI in the interest of consumers and (ii) Customer Perception of Telecom Service Through Surveys
342852/MCB/ISA/AA/01 01 December 2014 AMC/Projects/342852/Documents/Final Report/West Zone - MP
74
Table A.5: BSNL - SEM
Dimensions Variables Impacting Dimensions
Regression Coefficient for Dimension
Regression Coefficient for Satisfaction with Overall Quality
Dimension Ranking
Tangibility
Availability of suitable plans and recharge vouchers (TA1)
0.93 0.28 6
Reliability
Overall Accuracy and Completeness of bill (RL1)
0.68 0.58 1
Clarity, Transparency and understandability of bill-Post Paid
(RL2)
0.21
Transparency of information provided on vouchers-Pre Paid
(RL2)
-0.49
Customer Friendly Approach of customer care executive (RL3)
0.47
Responsiveness
Availability of fault free connection (RS2)
-0.19 0.30 5
Timely Repair of faults (RS2) 0.92
Network
Availability of Signal (NT1) 0.89 0.35 3
Network in terms of ability to Make of receive call easily (NT2)
-0.21
Voice Quality during calls (NT3) -0.28
Empathy
Ease of activating connection (EM3)
0.80 0.34 4
Understanding of relevant information related to tariffs and
plan (EM1)
-0.35
Ease of Activation of vouchers (recharge Process) (EM4)
-0.32
Availability of customer care services (EM5)
-0.18
Assurance
Competency level/Problem solving ability of customer care executive
(AS1)
0.89 0.23 8
Economy
Availability of vouchers of various denomination (EC1)
-0.62 0.36 2
Charges deducted after every usage (EC2)
0.72
Charges Levied per call(EC2 Post-paid)
-0.05
Convenience
Ease of access to customer care executive through IVR menu (CV1)
0.01 0.25 7
Satisfaction with supplementary services (Cv2)
0.91
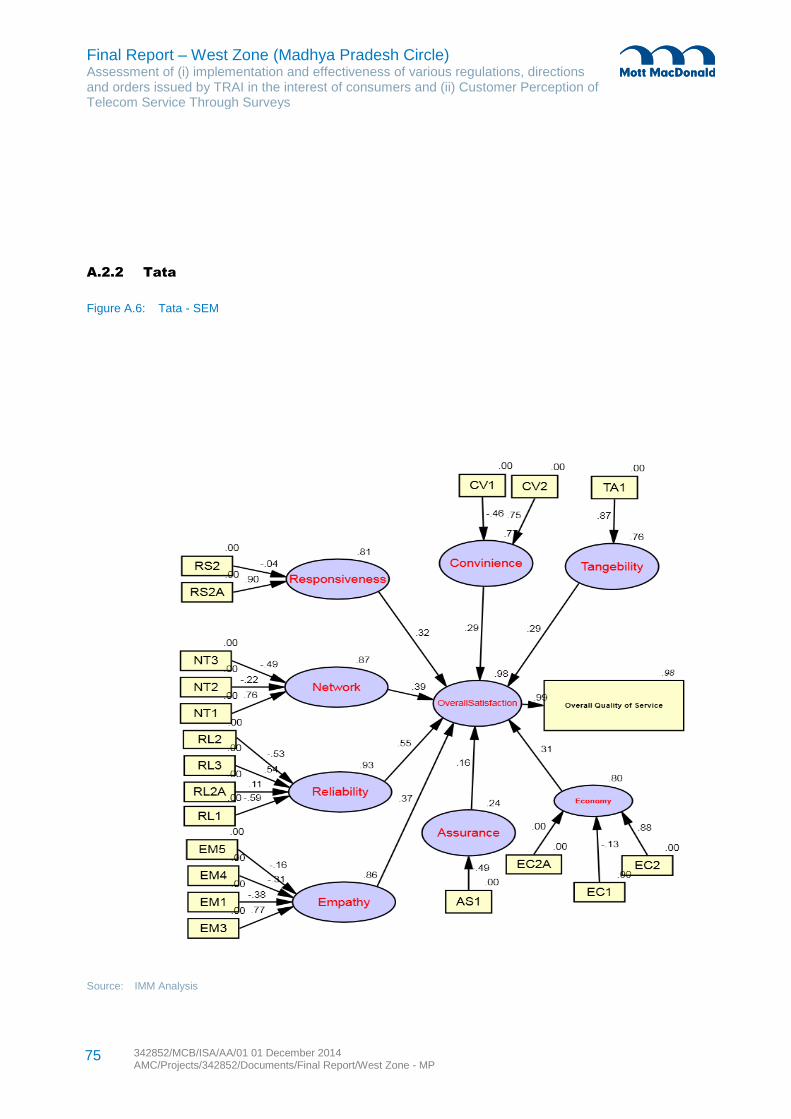
Final Report – West Zone (Madhya Pradesh Circle) Assessment of (i) implementation and effectiveness of various regulations, directions and orders issued by TRAI in the interest of consumers and (ii) Customer Perception of Telecom Service Through Surveys
342852/MCB/ISA/AA/01 01 December 2014 AMC/Projects/342852/Documents/Final Report/West Zone - MP
75
A.2.2 Tata
Figure A.6: Tata - SEM
Source: IMM Analysis
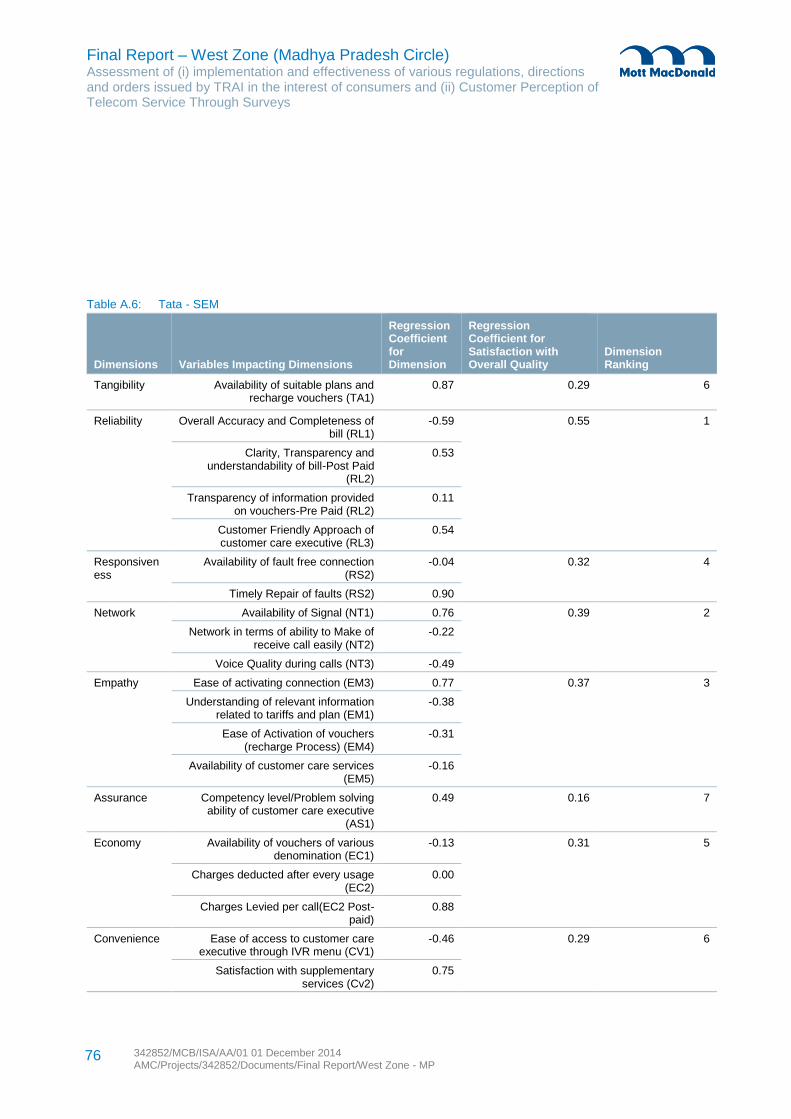
Final Report – West Zone (Madhya Pradesh Circle) Assessment of (i) implementation and effectiveness of various regulations, directions and orders issued by TRAI in the interest of consumers and (ii) Customer Perception of Telecom Service Through Surveys
342852/MCB/ISA/AA/01 01 December 2014 AMC/Projects/342852/Documents/Final Report/West Zone - MP
76
Table A.6: Tata - SEM
Dimensions Variables Impacting Dimensions
Regression Coefficient for Dimension
Regression Coefficient for Satisfaction with Overall Quality
Dimension Ranking
Tangibility
Availability of suitable plans and recharge vouchers (TA1)
0.87 0.29 6
Reliability
Overall Accuracy and Completeness of bill (RL1)
-0.59 0.55 1
Clarity, Transparency and understandability of bill-Post Paid
(RL2)
0.53
Transparency of information provided on vouchers-Pre Paid (RL2)
0.11
Customer Friendly Approach of customer care executive (RL3)
0.54
Responsiveness
Availability of fault free connection (RS2)
-0.04 0.32 4
Timely Repair of faults (RS2) 0.90
Network
Availability of Signal (NT1) 0.76 0.39 2
Network in terms of ability to Make of receive call easily (NT2)
-0.22
Voice Quality during calls (NT3) -0.49
Empathy
Ease of activating connection (EM3) 0.77 0.37 3
Understanding of relevant information related to tariffs and plan (EM1)
-0.38
Ease of Activation of vouchers (recharge Process) (EM4)
-0.31
Availability of customer care services (EM5)
-0.16
Assurance
Competency level/Problem solving ability of customer care executive
(AS1)
0.49 0.16 7
Economy
Availability of vouchers of various denomination (EC1)
-0.13 0.31 5
Charges deducted after every usage (EC2)
0.00
Charges Levied per call(EC2 Post-paid)
0.88
Convenience
Ease of access to customer care executive through IVR menu (CV1)
-0.46 0.29 6
Satisfaction with supplementary services (Cv2)
0.75
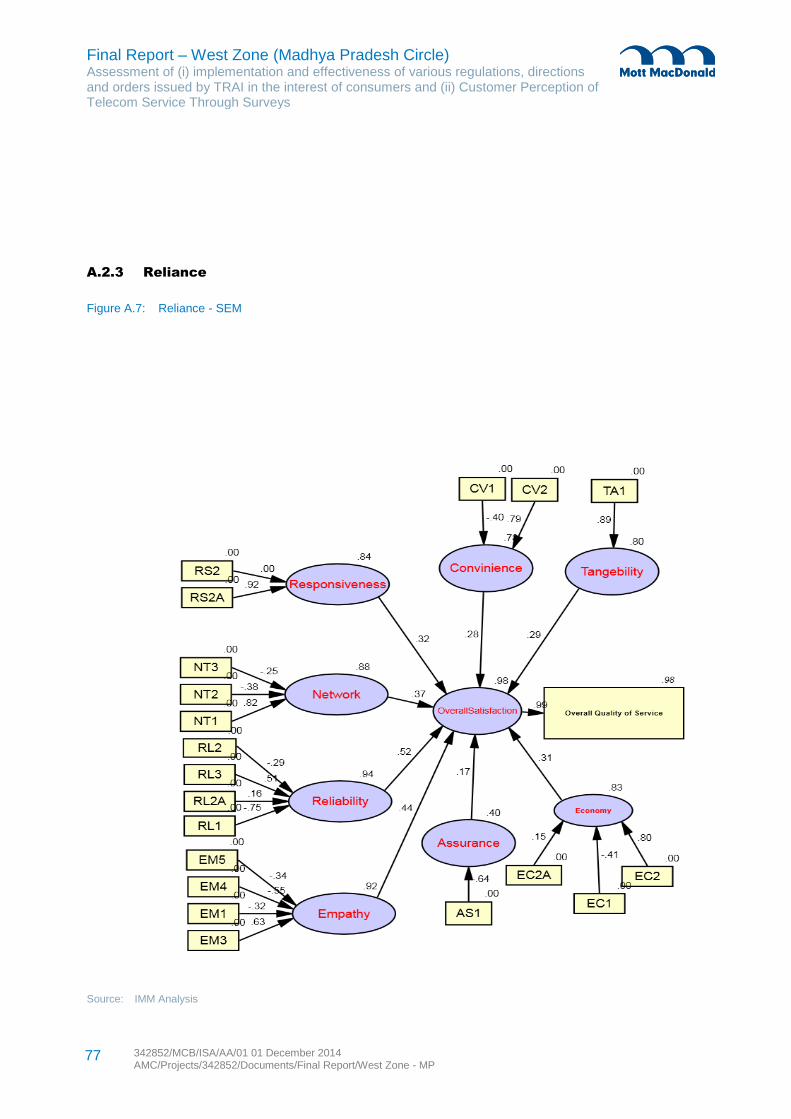
Final Report – West Zone (Madhya Pradesh Circle) Assessment of (i) implementation and effectiveness of various regulations, directions and orders issued by TRAI in the interest of consumers and (ii) Customer Perception of Telecom Service Through Surveys
342852/MCB/ISA/AA/01 01 December 2014 AMC/Projects/342852/Documents/Final Report/West Zone - MP
77
A.2.3 Reliance
Figure A.7: Reliance - SEM
Source: IMM Analysis
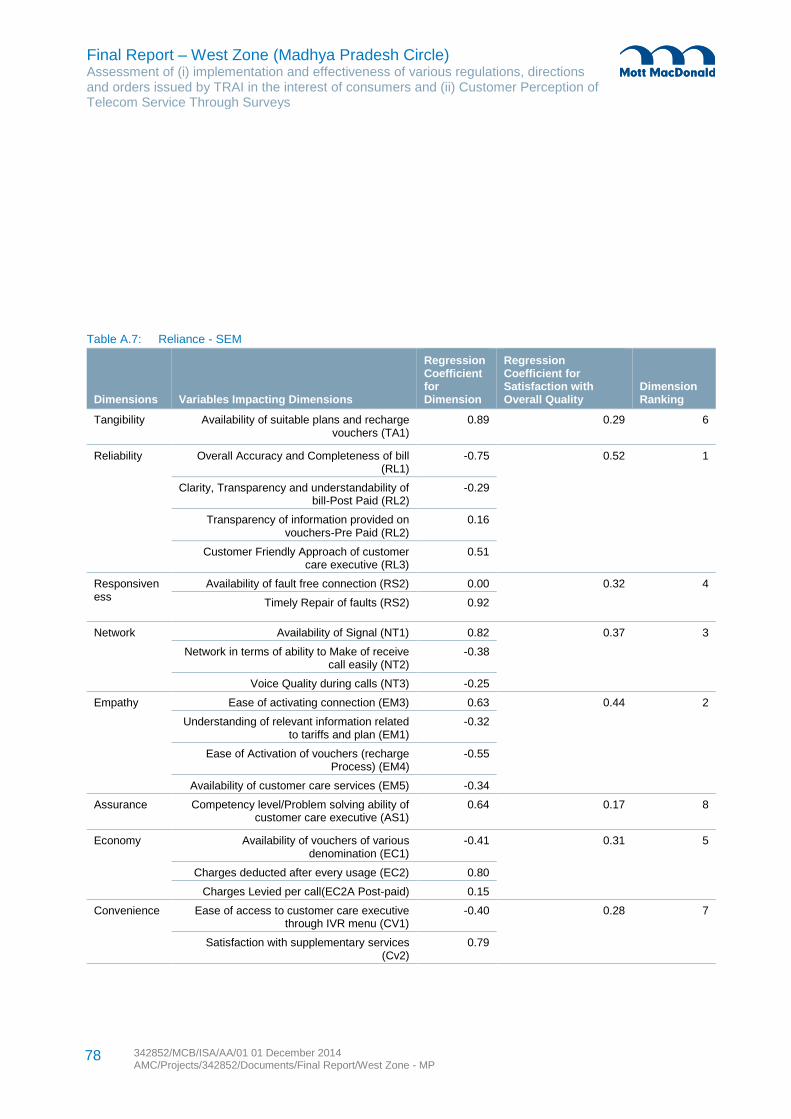
Final Report – West Zone (Madhya Pradesh Circle) Assessment of (i) implementation and effectiveness of various regulations, directions and orders issued by TRAI in the interest of consumers and (ii) Customer Perception of Telecom Service Through Surveys
342852/MCB/ISA/AA/01 01 December 2014 AMC/Projects/342852/Documents/Final Report/West Zone - MP
78
Table A.7: Reliance - SEM
Dimensions Variables Impacting Dimensions
Regression Coefficient for Dimension
Regression Coefficient for Satisfaction with Overall Quality
Dimension Ranking
Tangibility
Availability of suitable plans and recharge vouchers (TA1)
0.89 0.29 6
Reliability
Overall Accuracy and Completeness of bill (RL1)
-0.75 0.52 1
Clarity, Transparency and understandability of bill-Post Paid (RL2)
-0.29
Transparency of information provided on vouchers-Pre Paid (RL2)
0.16
Customer Friendly Approach of customer care executive (RL3)
0.51
Responsiveness
Availability of fault free connection (RS2) 0.00 0.32 4
Timely Repair of faults (RS2) 0.92
Network
Availability of Signal (NT1) 0.82 0.37 3
Network in terms of ability to Make of receive call easily (NT2)
-0.38
Voice Quality during calls (NT3) -0.25
Empathy
Ease of activating connection (EM3) 0.63 0.44 2
Understanding of relevant information related to tariffs and plan (EM1)
-0.32
Ease of Activation of vouchers (recharge Process) (EM4)
-0.55
Availability of customer care services (EM5) -0.34
Assurance
Competency level/Problem solving ability of customer care executive (AS1)
0.64 0.17 8
Economy
Availability of vouchers of various denomination (EC1)
-0.41 0.31 5
Charges deducted after every usage (EC2) 0.80
Charges Levied per call(EC2A Post-paid) 0.15
Convenience
Ease of access to customer care executive through IVR menu (CV1)
-0.40 0.28 7
Satisfaction with supplementary services (Cv2)
0.79

Final Report – West Zone (Madhya Pradesh Circle) Assessment of (i) implementation and effectiveness of various regulations, directions and orders issued by TRAI in the interest of consumers and (ii) Customer Perception of Telecom Service Through Surveys
342852/MCB/ISA/AA/01 01 December 2014 AMC/Projects/342852/Documents/Final Report/West Zone - MP
79
A.2.4 Idea
Figure A.8: IDEA - SEM
Source: IMM Analysis
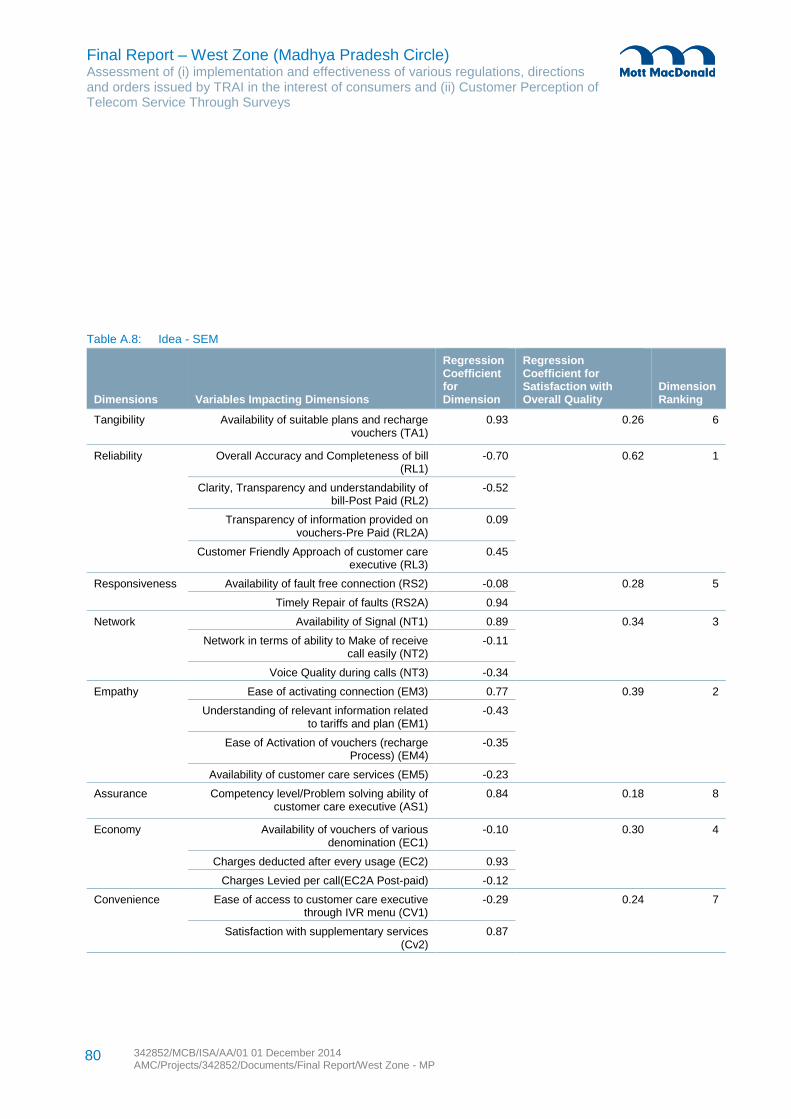
Final Report – West Zone (Madhya Pradesh Circle) Assessment of (i) implementation and effectiveness of various regulations, directions and orders issued by TRAI in the interest of consumers and (ii) Customer Perception of Telecom Service Through Surveys
342852/MCB/ISA/AA/01 01 December 2014 AMC/Projects/342852/Documents/Final Report/West Zone - MP
80
Table A.8: Idea - SEM
Dimensions Variables Impacting Dimensions
Regression Coefficient for Dimension
Regression Coefficient for Satisfaction with Overall Quality
Dimension Ranking
Tangibility
Availability of suitable plans and recharge vouchers (TA1)
0.93 0.26 6
Reliability
Overall Accuracy and Completeness of bill (RL1)
-0.70 0.62 1
Clarity, Transparency and understandability of bill-Post Paid (RL2)
-0.52
Transparency of information provided on vouchers-Pre Paid (RL2A)
0.09
Customer Friendly Approach of customer care executive (RL3)
0.45
Responsiveness
Availability of fault free connection (RS2) -0.08 0.28 5
Timely Repair of faults (RS2A) 0.94
Network
Availability of Signal (NT1) 0.89 0.34 3
Network in terms of ability to Make of receive call easily (NT2)
-0.11
Voice Quality during calls (NT3) -0.34
Empathy
Ease of activating connection (EM3) 0.77 0.39 2
Understanding of relevant information related to tariffs and plan (EM1)
-0.43
Ease of Activation of vouchers (recharge Process) (EM4)
-0.35
Availability of customer care services (EM5) -0.23
Assurance
Competency level/Problem solving ability of customer care executive (AS1)
0.84 0.18 8
Economy
Availability of vouchers of various denomination (EC1)
-0.10 0.30 4
Charges deducted after every usage (EC2) 0.93
Charges Levied per call(EC2A Post-paid) -0.12
Convenience
Ease of access to customer care executive through IVR menu (CV1)
-0.29 0.24 7
Satisfaction with supplementary services (Cv2)
0.87
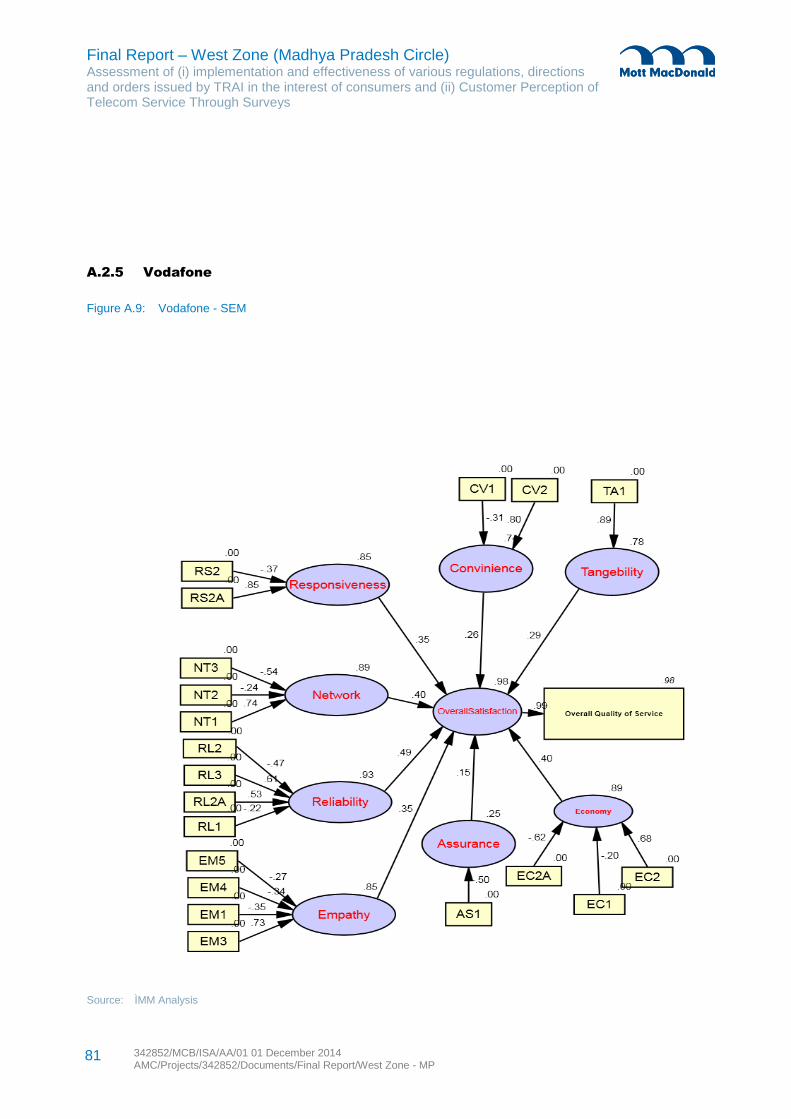
Final Report – West Zone (Madhya Pradesh Circle) Assessment of (i) implementation and effectiveness of various regulations, directions and orders issued by TRAI in the interest of consumers and (ii) Customer Perception of Telecom Service Through Surveys
342852/MCB/ISA/AA/01 01 December 2014 AMC/Projects/342852/Documents/Final Report/West Zone - MP
81
A.2.5 Vodafone
Figure A.9: Vodafone - SEM
Source: ÌMM Analysis
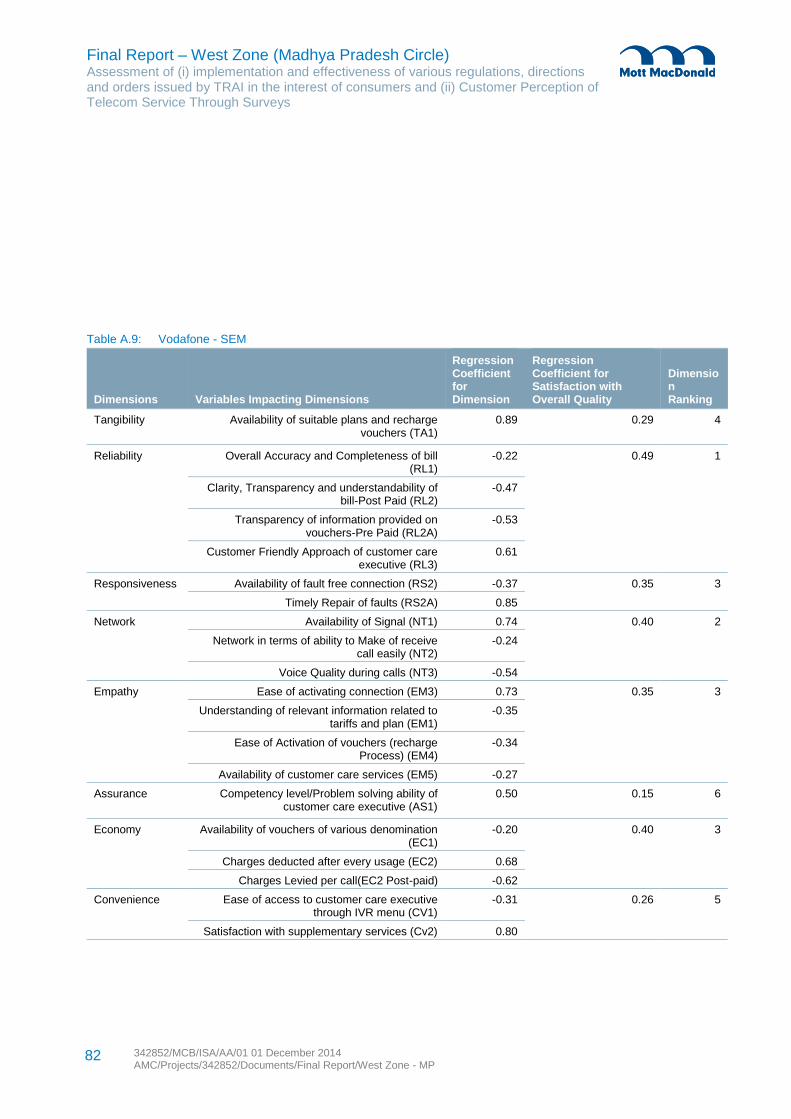
Final Report – West Zone (Madhya Pradesh Circle) Assessment of (i) implementation and effectiveness of various regulations, directions and orders issued by TRAI in the interest of consumers and (ii) Customer Perception of Telecom Service Through Surveys
342852/MCB/ISA/AA/01 01 December 2014 AMC/Projects/342852/Documents/Final Report/West Zone - MP
82
Table A.9: Vodafone - SEM
Dimensions Variables Impacting Dimensions
Regression Coefficient for Dimension
Regression Coefficient for Satisfaction with Overall Quality
Dimension Ranking
Tangibility
Availability of suitable plans and recharge vouchers (TA1)
0.89 0.29 4
Reliability
Overall Accuracy and Completeness of bill (RL1)
-0.22 0.49 1
Clarity, Transparency and understandability of bill-Post Paid (RL2)
-0.47
Transparency of information provided on vouchers-Pre Paid (RL2A)
-0.53
Customer Friendly Approach of customer care executive (RL3)
0.61
Responsiveness
Availability of fault free connection (RS2) -0.37 0.35 3
Timely Repair of faults (RS2A) 0.85
Network
Availability of Signal (NT1) 0.74 0.40 2
Network in terms of ability to Make of receive call easily (NT2)
-0.24
Voice Quality during calls (NT3) -0.54
Empathy
Ease of activating connection (EM3) 0.73 0.35 3
Understanding of relevant information related to tariffs and plan (EM1)
-0.35
Ease of Activation of vouchers (recharge Process) (EM4)
-0.34
Availability of customer care services (EM5) -0.27
Assurance
Competency level/Problem solving ability of customer care executive (AS1)
0.50 0.15 6
Economy
Availability of vouchers of various denomination (EC1)
-0.20 0.40 3
Charges deducted after every usage (EC2) 0.68
Charges Levied per call(EC2 Post-paid) -0.62
Convenience
Ease of access to customer care executive through IVR menu (CV1)
-0.31 0.26 5
Satisfaction with supplementary services (Cv2) 0.80

Final Report – West Zone (Madhya Pradesh Circle) Assessment of (i) implementation and effectiveness of various regulations, directions and orders issued by TRAI in the interest of consumers and (ii) Customer Perception of Telecom Service Through Surveys
342852/MCB/ISA/AA/01 01 December 2014 AMC/Projects/342852/Documents/Final Report/West Zone - MP
83
A.2.6 Airtel
Figure A.10: Airtel - SEM
Source: IMM Analysis
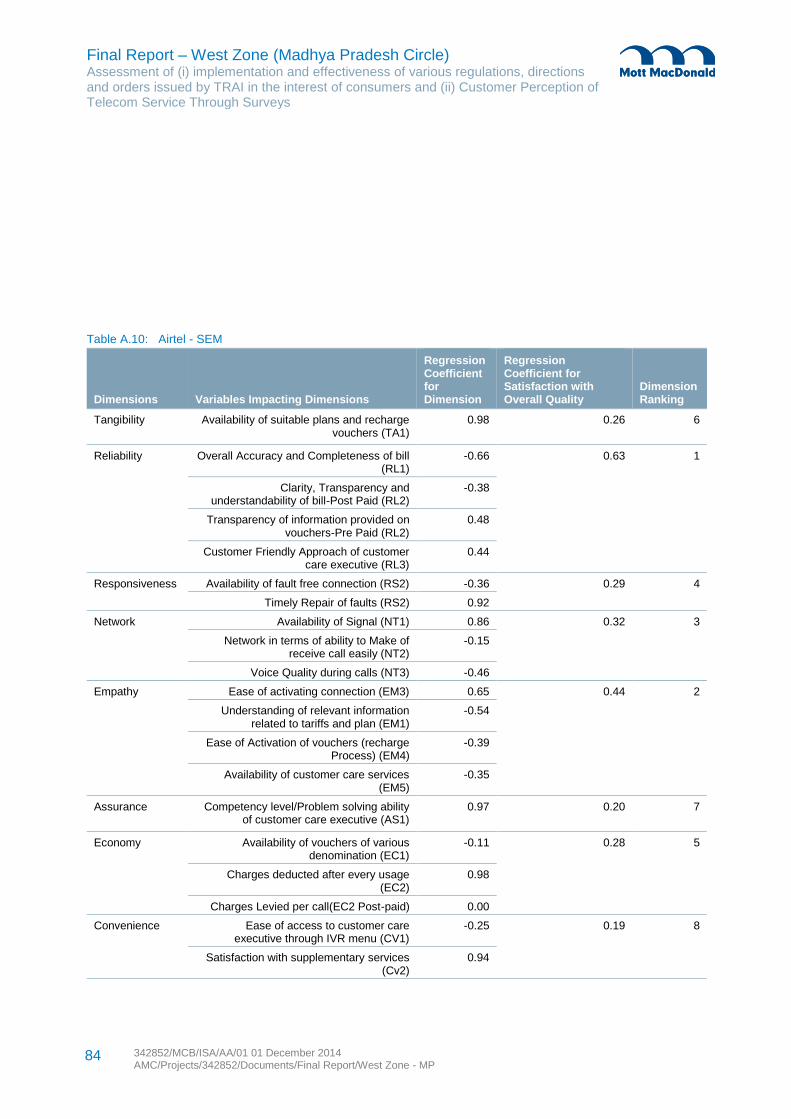
Final Report – West Zone (Madhya Pradesh Circle) Assessment of (i) implementation and effectiveness of various regulations, directions and orders issued by TRAI in the interest of consumers and (ii) Customer Perception of Telecom Service Through Surveys
342852/MCB/ISA/AA/01 01 December 2014 AMC/Projects/342852/Documents/Final Report/West Zone - MP
84
Table A.10: Airtel - SEM
Dimensions Variables Impacting Dimensions
Regression Coefficient for Dimension
Regression Coefficient for Satisfaction with Overall Quality
Dimension Ranking
Tangibility
Availability of suitable plans and recharge vouchers (TA1)
0.98 0.26 6
Reliability
Overall Accuracy and Completeness of bill (RL1)
-0.66 0.63 1
Clarity, Transparency and understandability of bill-Post Paid (RL2)
-0.38
Transparency of information provided on vouchers-Pre Paid (RL2)
0.48
Customer Friendly Approach of customer care executive (RL3)
0.44
Responsiveness
Availability of fault free connection (RS2) -0.36 0.29 4
Timely Repair of faults (RS2) 0.92
Network
Availability of Signal (NT1) 0.86 0.32 3
Network in terms of ability to Make of receive call easily (NT2)
-0.15
Voice Quality during calls (NT3) -0.46
Empathy
Ease of activating connection (EM3) 0.65 0.44 2
Understanding of relevant information related to tariffs and plan (EM1)
-0.54
Ease of Activation of vouchers (recharge Process) (EM4)
-0.39
Availability of customer care services (EM5)
-0.35
Assurance
Competency level/Problem solving ability of customer care executive (AS1)
0.97 0.20 7
Economy
Availability of vouchers of various denomination (EC1)
-0.11 0.28 5
Charges deducted after every usage (EC2)
0.98
Charges Levied per call(EC2 Post-paid) 0.00
Convenience
Ease of access to customer care executive through IVR menu (CV1)
-0.25 0.19 8
Satisfaction with supplementary services (Cv2)
0.94
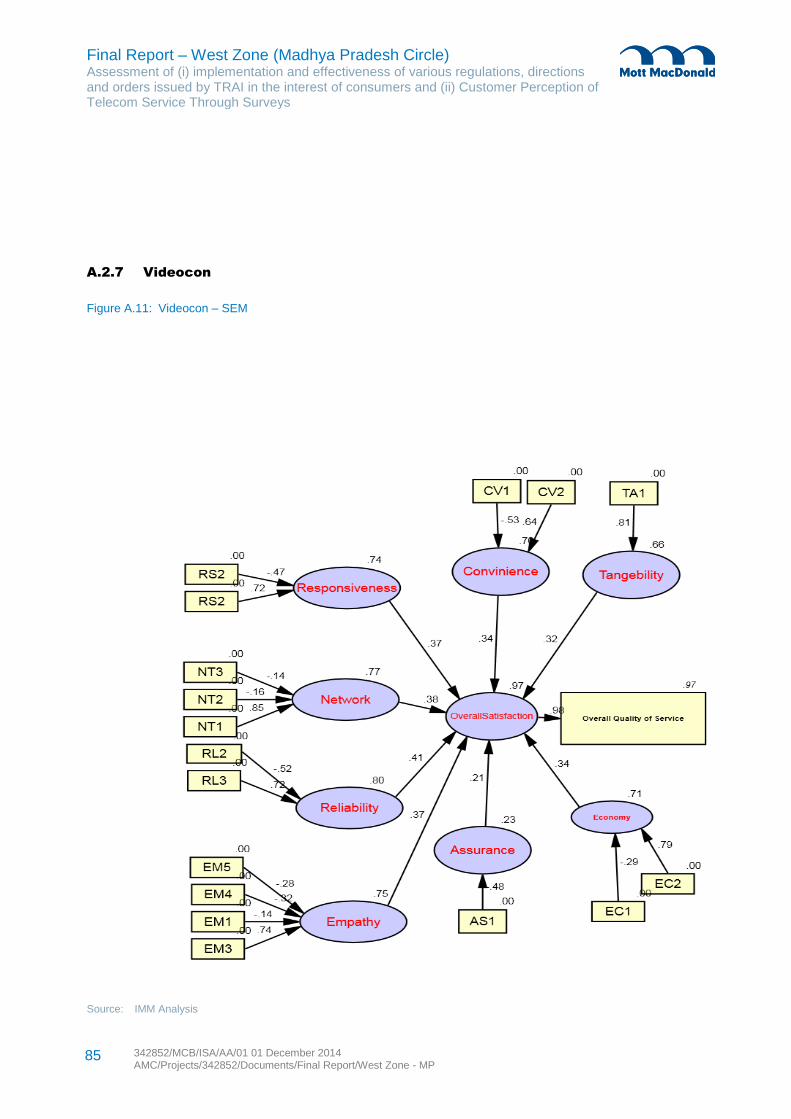
Final Report – West Zone (Madhya Pradesh Circle) Assessment of (i) implementation and effectiveness of various regulations, directions and orders issued by TRAI in the interest of consumers and (ii) Customer Perception of Telecom Service Through Surveys
342852/MCB/ISA/AA/01 01 December 2014 AMC/Projects/342852/Documents/Final Report/West Zone - MP
85
A.2.7 Videocon
Figure A.11: Videocon – SEM
Source: IMM Analysis
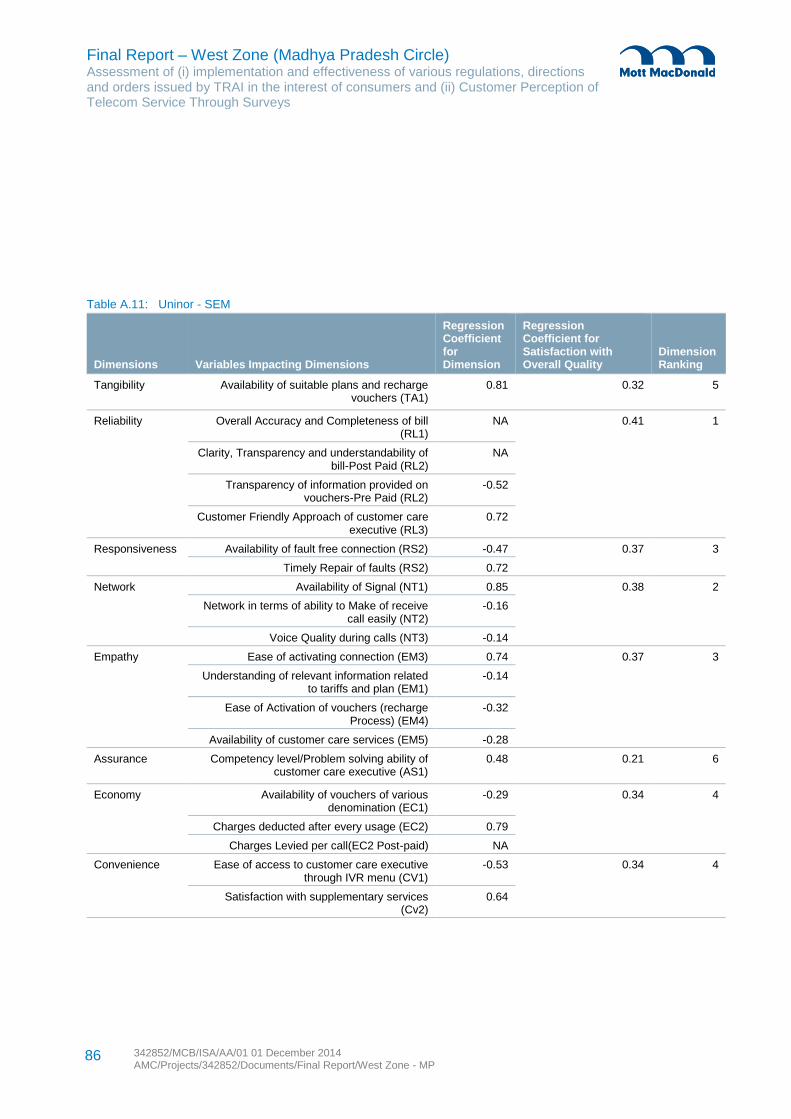
Final Report – West Zone (Madhya Pradesh Circle) Assessment of (i) implementation and effectiveness of various regulations, directions and orders issued by TRAI in the interest of consumers and (ii) Customer Perception of Telecom Service Through Surveys
342852/MCB/ISA/AA/01 01 December 2014 AMC/Projects/342852/Documents/Final Report/West Zone - MP
86
Table A.11: Uninor - SEM
Dimensions Variables Impacting Dimensions
Regression Coefficient for Dimension
Regression Coefficient for Satisfaction with Overall Quality
Dimension Ranking
Tangibility
Availability of suitable plans and recharge vouchers (TA1)
0.81 0.32 5
Reliability
Overall Accuracy and Completeness of bill (RL1)
NA 0.41 1
Clarity, Transparency and understandability of bill-Post Paid (RL2)
NA
Transparency of information provided on vouchers-Pre Paid (RL2)
-0.52
Customer Friendly Approach of customer care executive (RL3)
0.72
Responsiveness
Availability of fault free connection (RS2) -0.47 0.37 3
Timely Repair of faults (RS2) 0.72
Network
Availability of Signal (NT1) 0.85 0.38 2
Network in terms of ability to Make of receive call easily (NT2)
-0.16
Voice Quality during calls (NT3) -0.14
Empathy
Ease of activating connection (EM3) 0.74 0.37 3
Understanding of relevant information related to tariffs and plan (EM1)
-0.14
Ease of Activation of vouchers (recharge Process) (EM4)
-0.32
Availability of customer care services (EM5) -0.28
Assurance
Competency level/Problem solving ability of customer care executive (AS1)
0.48 0.21 6
Economy
Availability of vouchers of various denomination (EC1)
-0.29 0.34 4
Charges deducted after every usage (EC2) 0.79
Charges Levied per call(EC2 Post-paid) NA
Convenience
Ease of access to customer care executive through IVR menu (CV1)
-0.53 0.34 4
Satisfaction with supplementary services (Cv2)
0.64
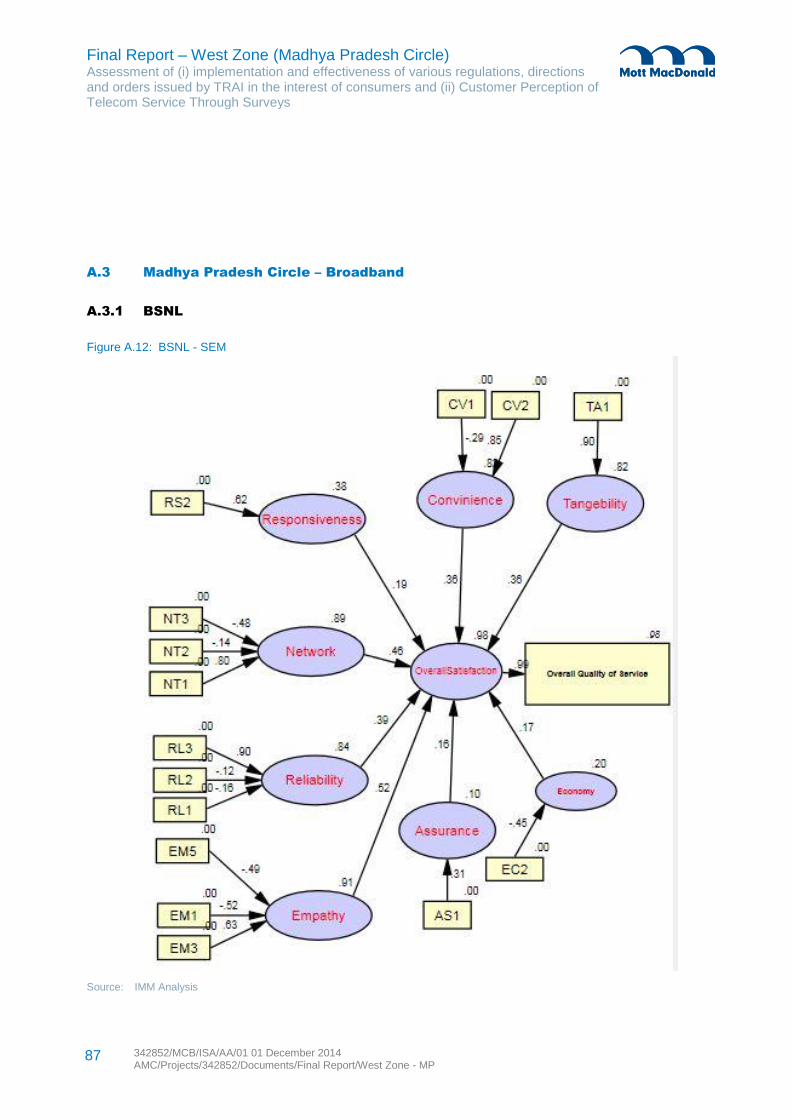
Final Report – West Zone (Madhya Pradesh Circle) Assessment of (i) implementation and effectiveness of various regulations, directions and orders issued by TRAI in the interest of consumers and (ii) Customer Perception of Telecom Service Through Surveys
342852/MCB/ISA/AA/01 01 December 2014 AMC/Projects/342852/Documents/Final Report/West Zone - MP
87
A.3 Madhya Pradesh Circle – Broadband
A.3.1 BSNL
Figure A.12: BSNL - SEM
Source: IMM Analysis
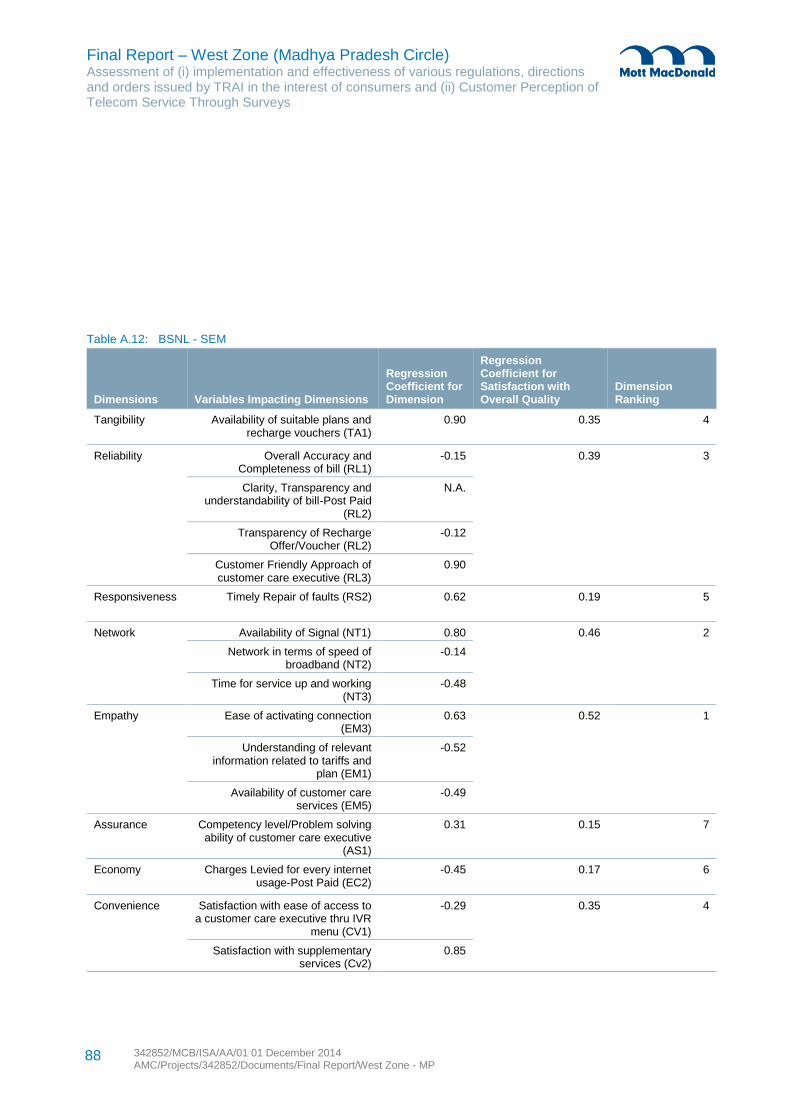
Final Report – West Zone (Madhya Pradesh Circle) Assessment of (i) implementation and effectiveness of various regulations, directions and orders issued by TRAI in the interest of consumers and (ii) Customer Perception of Telecom Service Through Surveys
342852/MCB/ISA/AA/01 01 December 2014 AMC/Projects/342852/Documents/Final Report/West Zone - MP
88
Table A.12: BSNL - SEM
Dimensions Variables Impacting Dimensions
Regression Coefficient for Dimension
Regression Coefficient for Satisfaction with Overall Quality
Dimension Ranking
Tangibility
Availability of suitable plans and recharge vouchers (TA1)
0.90 0.35 4
Reliability
Overall Accuracy and Completeness of bill (RL1)
-0.15 0.39 3
Clarity, Transparency and understandability of bill-Post Paid
(RL2)
N.A.
Transparency of Recharge Offer/Voucher (RL2)
-0.12
Customer Friendly Approach of customer care executive (RL3)
0.90
Responsiveness
Timely Repair of faults (RS2) 0.62 0.19 5
Network
Availability of Signal (NT1) 0.80 0.46 2
Network in terms of speed of broadband (NT2)
-0.14
Time for service up and working (NT3)
-0.48
Empathy
Ease of activating connection (EM3)
0.63 0.52 1
Understanding of relevant information related to tariffs and
plan (EM1)
-0.52
Availability of customer care services (EM5)
-0.49
Assurance
Competency level/Problem solving ability of customer care executive
(AS1)
0.31 0.15 7
Economy
Charges Levied for every internet usage-Post Paid (EC2)
-0.45 0.17 6
Convenience
Satisfaction with ease of access to a customer care executive thru IVR
menu (CV1)
-0.29 0.35 4
Satisfaction with supplementary services (Cv2)
0.85
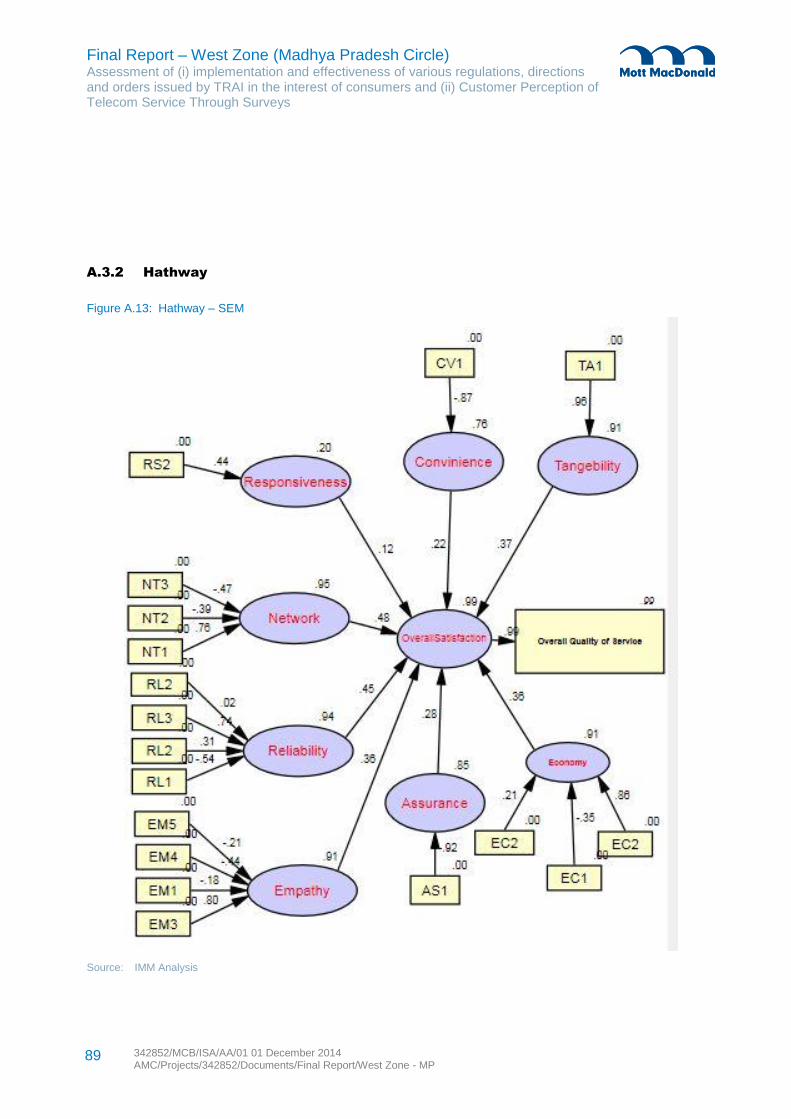
Final Report – West Zone (Madhya Pradesh Circle) Assessment of (i) implementation and effectiveness of various regulations, directions and orders issued by TRAI in the interest of consumers and (ii) Customer Perception of Telecom Service Through Surveys
342852/MCB/ISA/AA/01 01 December 2014 AMC/Projects/342852/Documents/Final Report/West Zone - MP
89
A.3.2 Hathway
Figure A.13: Hathway – SEM
Source: IMM Analysis
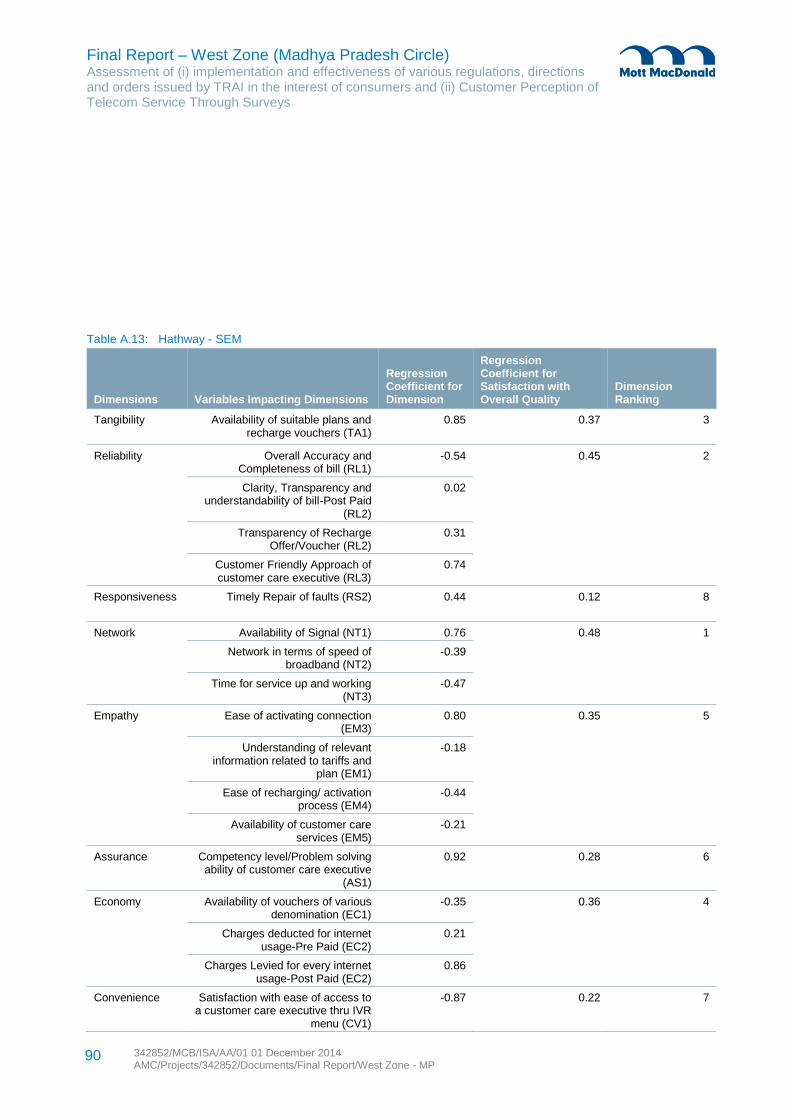
Final Report – West Zone (Madhya Pradesh Circle) Assessment of (i) implementation and effectiveness of various regulations, directions and orders issued by TRAI in the interest of consumers and (ii) Customer Perception of Telecom Service Through Surveys
342852/MCB/ISA/AA/01 01 December 2014 AMC/Projects/342852/Documents/Final Report/West Zone - MP
90
Table A.13: Hathway - SEM
Dimensions Variables Impacting Dimensions
Regression Coefficient for Dimension
Regression Coefficient for Satisfaction with Overall Quality
Dimension Ranking
Tangibility
Availability of suitable plans and recharge vouchers (TA1)
0.85 0.37 3
Reliability
Overall Accuracy and Completeness of bill (RL1)
-0.54 0.45 2
Clarity, Transparency and understandability of bill-Post Paid
(RL2)
0.02
Transparency of Recharge Offer/Voucher (RL2)
0.31
Customer Friendly Approach of customer care executive (RL3)
0.74
Responsiveness
Timely Repair of faults (RS2) 0.44 0.12 8
Network
Availability of Signal (NT1) 0.76 0.48 1
Network in terms of speed of broadband (NT2)
-0.39
Time for service up and working (NT3)
-0.47
Empathy
Ease of activating connection (EM3)
0.80 0.35 5
Understanding of relevant information related to tariffs and
plan (EM1)
-0.18
Ease of recharging/ activation process (EM4)
-0.44
Availability of customer care services (EM5)
-0.21
Assurance
Competency level/Problem solving ability of customer care executive
(AS1)
0.92 0.28 6
Economy
Availability of vouchers of various denomination (EC1)
-0.35 0.36 4
Charges deducted for internet usage-Pre Paid (EC2)
0.21
Charges Levied for every internet usage-Post Paid (EC2)
0.86
Convenience
Satisfaction with ease of access to a customer care executive thru IVR
menu (CV1)
-0.87 0.22 7
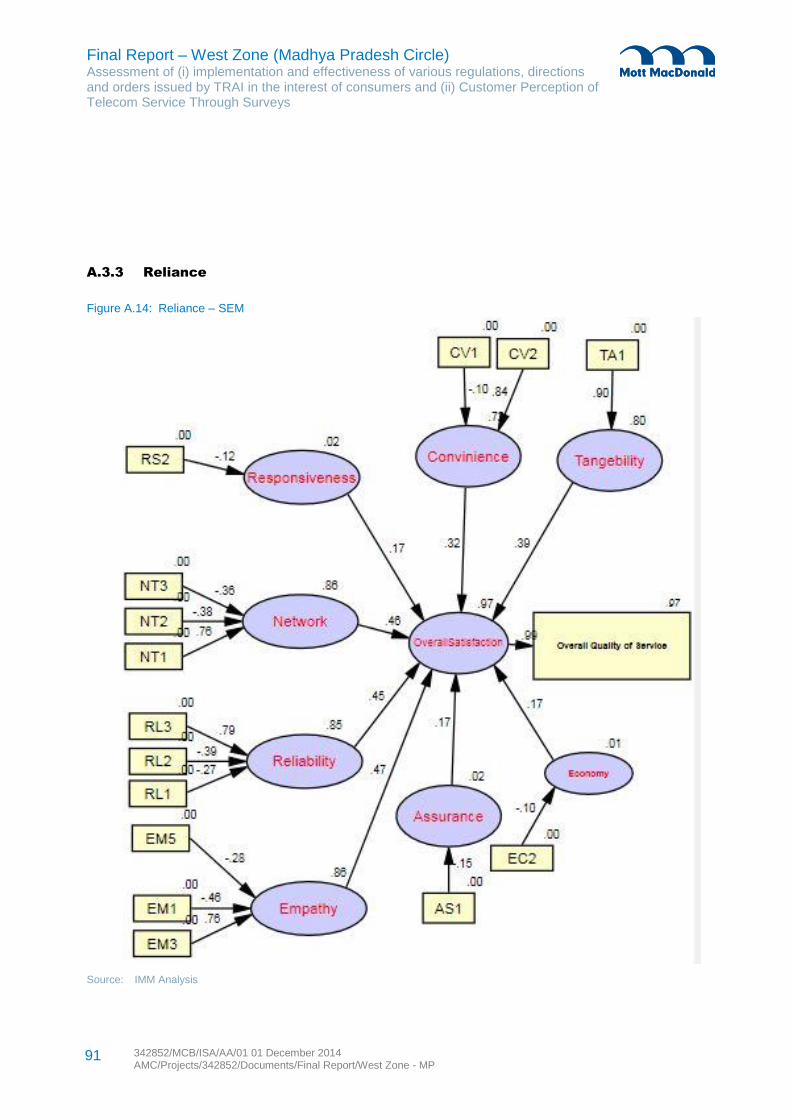
Final Report – West Zone (Madhya Pradesh Circle) Assessment of (i) implementation and effectiveness of various regulations, directions and orders issued by TRAI in the interest of consumers and (ii) Customer Perception of Telecom Service Through Surveys
342852/MCB/ISA/AA/01 01 December 2014 AMC/Projects/342852/Documents/Final Report/West Zone - MP
91
A.3.3 Reliance
Figure A.14: Reliance – SEM
Source: IMM Analysis
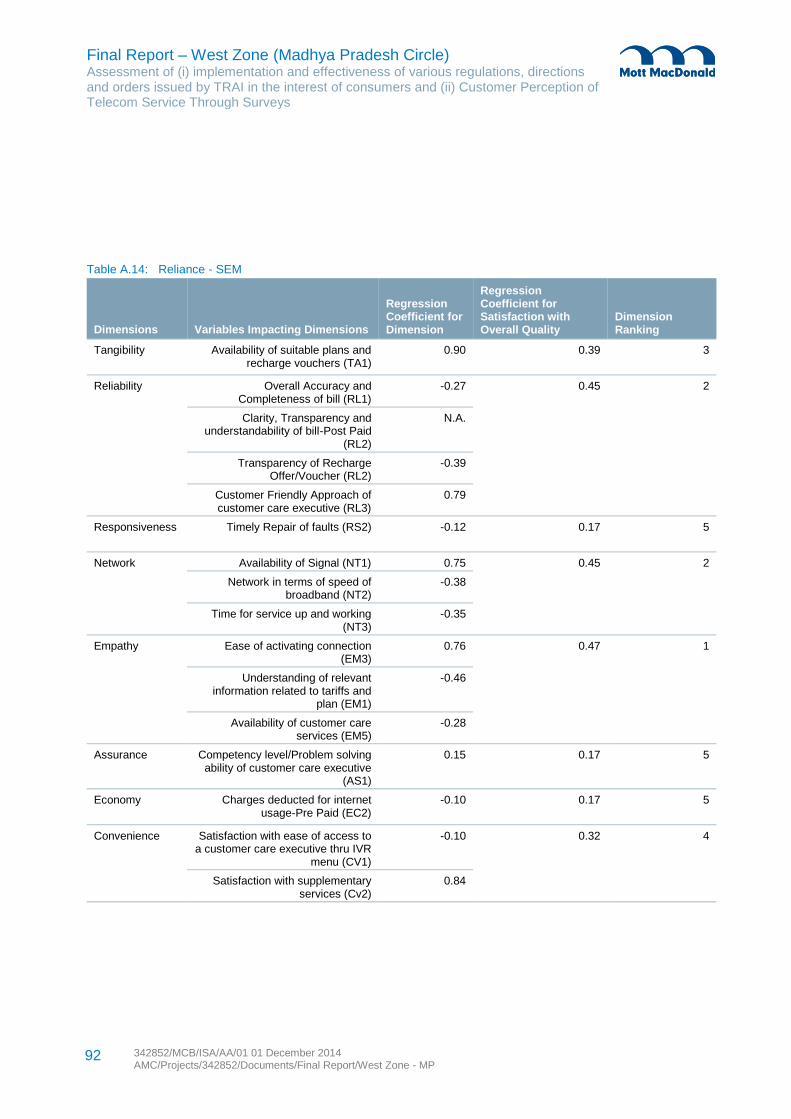
Final Report – West Zone (Madhya Pradesh Circle) Assessment of (i) implementation and effectiveness of various regulations, directions and orders issued by TRAI in the interest of consumers and (ii) Customer Perception of Telecom Service Through Surveys
342852/MCB/ISA/AA/01 01 December 2014 AMC/Projects/342852/Documents/Final Report/West Zone - MP
92
Table A.14: Reliance - SEM
Dimensions Variables Impacting Dimensions
Regression Coefficient for Dimension
Regression Coefficient for Satisfaction with Overall Quality
Dimension Ranking
Tangibility
Availability of suitable plans and recharge vouchers (TA1)
0.90 0.39 3
Reliability
Overall Accuracy and Completeness of bill (RL1)
-0.27 0.45 2
Clarity, Transparency and understandability of bill-Post Paid
(RL2)
N.A.
Transparency of Recharge Offer/Voucher (RL2)
-0.39
Customer Friendly Approach of customer care executive (RL3)
0.79
Responsiveness
Timely Repair of faults (RS2) -0.12 0.17 5
Network
Availability of Signal (NT1) 0.75 0.45 2
Network in terms of speed of broadband (NT2)
-0.38
Time for service up and working (NT3)
-0.35
Empathy
Ease of activating connection (EM3)
0.76 0.47 1
Understanding of relevant information related to tariffs and
plan (EM1)
-0.46
Availability of customer care services (EM5)
-0.28
Assurance
Competency level/Problem solving ability of customer care executive
(AS1)
0.15 0.17 5
Economy
Charges deducted for internet usage-Pre Paid (EC2)
-0.10 0.17 5
Convenience
Satisfaction with ease of access to a customer care executive thru IVR
menu (CV1)
-0.10 0.32 4
Satisfaction with supplementary services (Cv2)
0.84
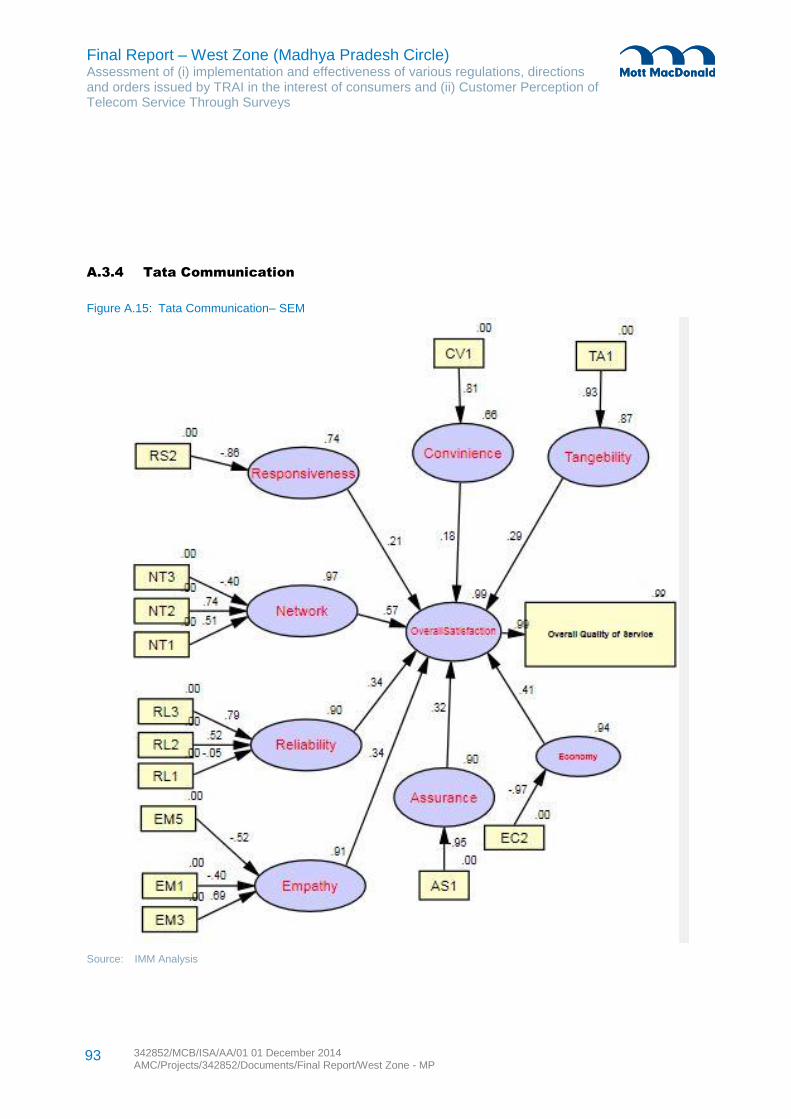
Final Report – West Zone (Madhya Pradesh Circle) Assessment of (i) implementation and effectiveness of various regulations, directions and orders issued by TRAI in the interest of consumers and (ii) Customer Perception of Telecom Service Through Surveys
342852/MCB/ISA/AA/01 01 December 2014 AMC/Projects/342852/Documents/Final Report/West Zone - MP
93
A.3.4 Tata Communication
Figure A.15: Tata Communication– SEM
Source: IMM Analysis
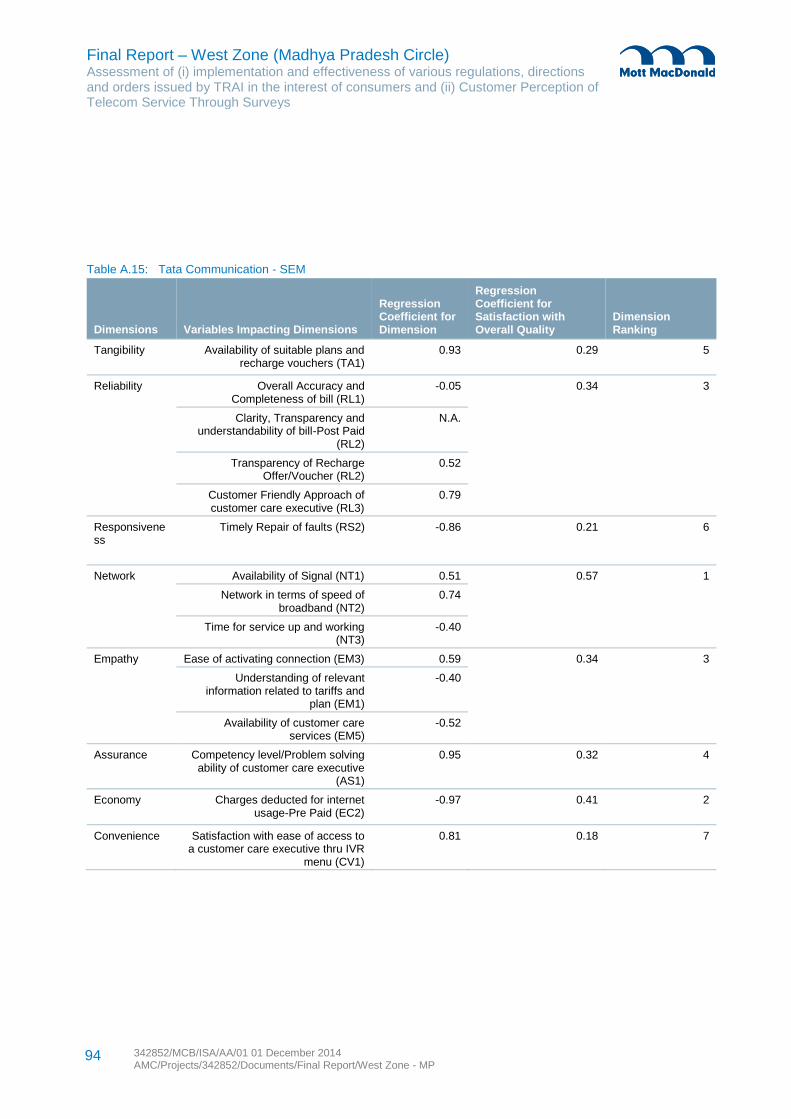
Final Report – West Zone (Madhya Pradesh Circle) Assessment of (i) implementation and effectiveness of various regulations, directions and orders issued by TRAI in the interest of consumers and (ii) Customer Perception of Telecom Service Through Surveys
342852/MCB/ISA/AA/01 01 December 2014 AMC/Projects/342852/Documents/Final Report/West Zone - MP
94
Table A.15: Tata Communication - SEM
Dimensions Variables Impacting Dimensions
Regression Coefficient for Dimension
Regression Coefficient for Satisfaction with Overall Quality
Dimension Ranking
Tangibility
Availability of suitable plans and recharge vouchers (TA1)
0.93 0.29 5
Reliability
Overall Accuracy and Completeness of bill (RL1)
-0.05 0.34 3
Clarity, Transparency and understandability of bill-Post Paid
(RL2)
N.A.
Transparency of Recharge Offer/Voucher (RL2)
0.52
Customer Friendly Approach of customer care executive (RL3)
0.79
Responsiveness
Timely Repair of faults (RS2) -0.86 0.21 6
Network
Availability of Signal (NT1) 0.51 0.57 1
Network in terms of speed of broadband (NT2)
0.74
Time for service up and working (NT3)
-0.40
Empathy
Ease of activating connection (EM3) 0.59 0.34 3
Understanding of relevant information related to tariffs and
plan (EM1)
-0.40
Availability of customer care services (EM5)
-0.52
Assurance
Competency level/Problem solving ability of customer care executive
(AS1)
0.95 0.32 4
Economy
Charges deducted for internet usage-Pre Paid (EC2)
-0.97 0.41 2
Convenience
Satisfaction with ease of access to a customer care executive thru IVR
menu (CV1)
0.81 0.18 7
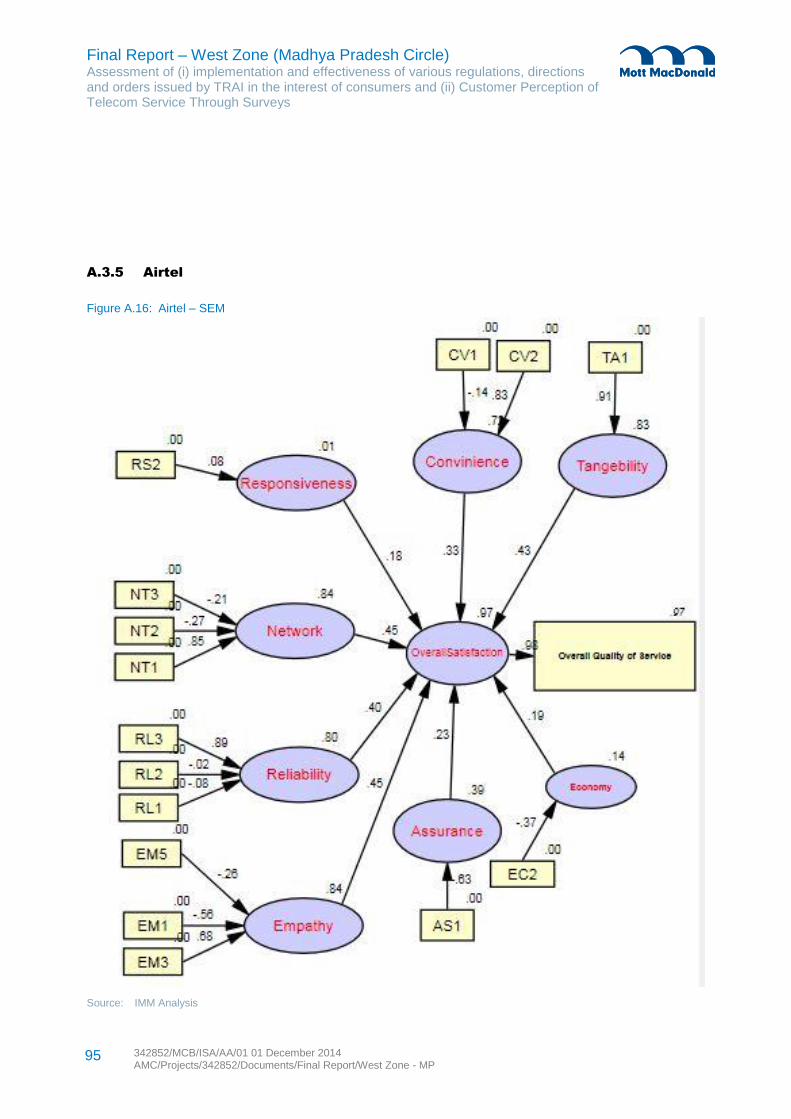
Final Report – West Zone (Madhya Pradesh Circle) Assessment of (i) implementation and effectiveness of various regulations, directions and orders issued by TRAI in the interest of consumers and (ii) Customer Perception of Telecom Service Through Surveys
342852/MCB/ISA/AA/01 01 December 2014 AMC/Projects/342852/Documents/Final Report/West Zone - MP
95
A.3.5 Airtel
Figure A.16: Airtel – SEM
Source: IMM Analysis
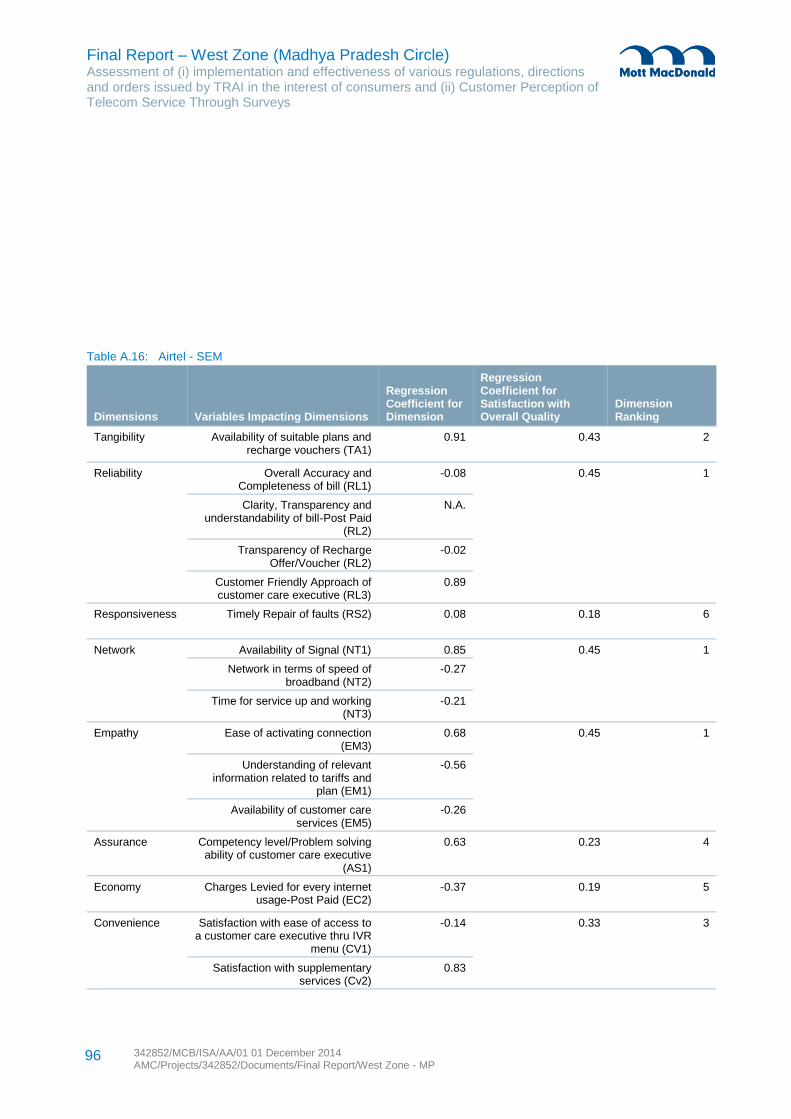
Final Report – West Zone (Madhya Pradesh Circle) Assessment of (i) implementation and effectiveness of various regulations, directions and orders issued by TRAI in the interest of consumers and (ii) Customer Perception of Telecom Service Through Surveys
342852/MCB/ISA/AA/01 01 December 2014 AMC/Projects/342852/Documents/Final Report/West Zone - MP
96
Table A.16: Airtel - SEM
Dimensions Variables Impacting Dimensions
Regression Coefficient for Dimension
Regression Coefficient for Satisfaction with Overall Quality
Dimension Ranking
Tangibility
Availability of suitable plans and recharge vouchers (TA1)
0.91 0.43 2
Reliability
Overall Accuracy and Completeness of bill (RL1)
-0.08 0.45 1
Clarity, Transparency and understandability of bill-Post Paid
(RL2)
N.A.
Transparency of Recharge Offer/Voucher (RL2)
-0.02
Customer Friendly Approach of customer care executive (RL3)
0.89
Responsiveness
Timely Repair of faults (RS2) 0.08 0.18 6
Network
Availability of Signal (NT1) 0.85 0.45 1
Network in terms of speed of broadband (NT2)
-0.27
Time for service up and working (NT3)
-0.21
Empathy
Ease of activating connection (EM3)
0.68 0.45 1
Understanding of relevant information related to tariffs and
plan (EM1)
-0.56
Availability of customer care services (EM5)
-0.26
Assurance
Competency level/Problem solving ability of customer care executive
(AS1)
0.63 0.23 4
Economy
Charges Levied for every internet usage-Post Paid (EC2)
-0.37 0.19 5
Convenience
Satisfaction with ease of access to a customer care executive thru IVR
menu (CV1)
-0.14 0.33 3
Satisfaction with supplementary services (Cv2)
0.83
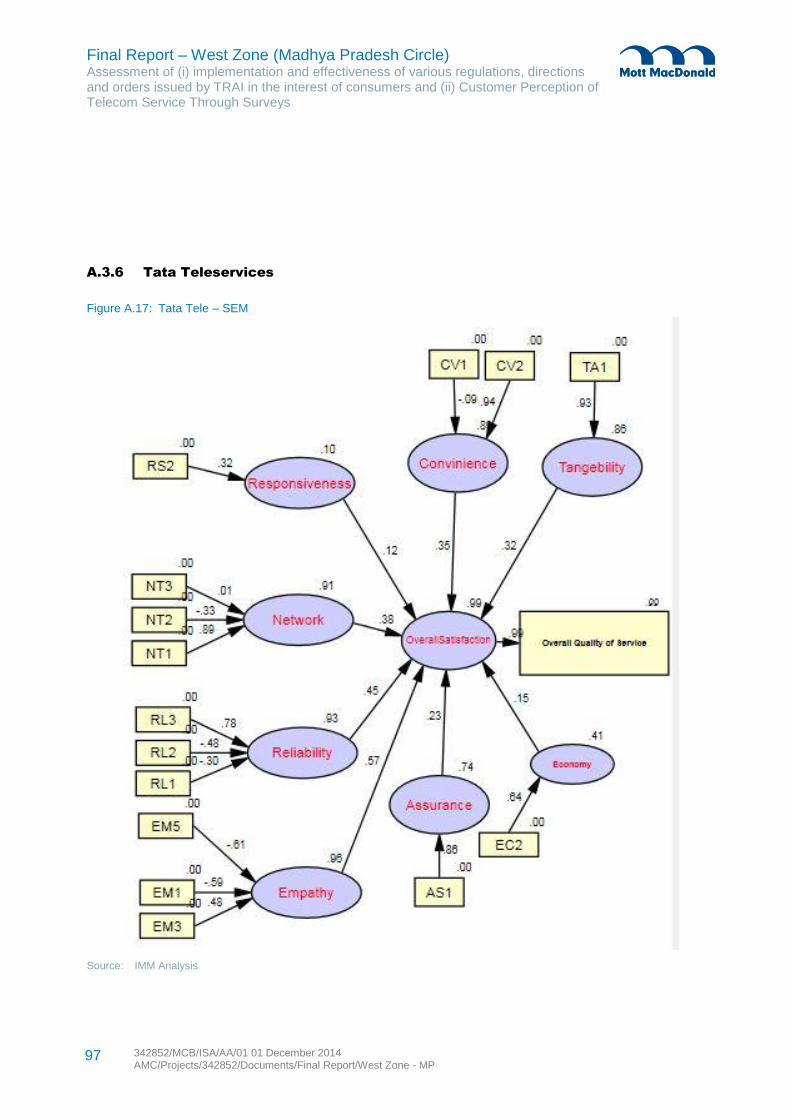
Final Report – West Zone (Madhya Pradesh Circle) Assessment of (i) implementation and effectiveness of various regulations, directions and orders issued by TRAI in the interest of consumers and (ii) Customer Perception of Telecom Service Through Surveys
342852/MCB/ISA/AA/01 01 December 2014 AMC/Projects/342852/Documents/Final Report/West Zone - MP
97
A.3.6 Tata Teleservices
Figure A.17: Tata Tele – SEM
Source: IMM Analysis
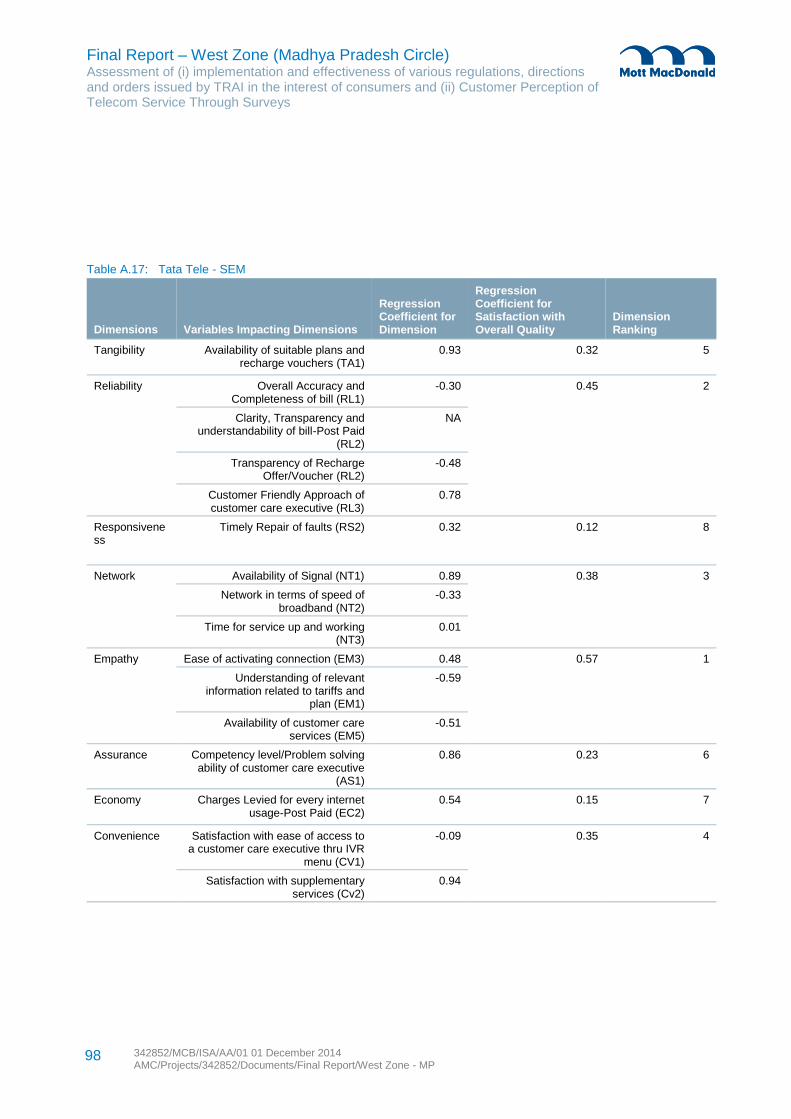
Final Report – West Zone (Madhya Pradesh Circle) Assessment of (i) implementation and effectiveness of various regulations, directions and orders issued by TRAI in the interest of consumers and (ii) Customer Perception of Telecom Service Through Surveys
342852/MCB/ISA/AA/01 01 December 2014 AMC/Projects/342852/Documents/Final Report/West Zone - MP
98
Table A.17: Tata Tele - SEM
Dimensions Variables Impacting Dimensions
Regression Coefficient for Dimension
Regression Coefficient for Satisfaction with Overall Quality
Dimension Ranking
Tangibility
Availability of suitable plans and recharge vouchers (TA1)
0.93 0.32 5
Reliability
Overall Accuracy and Completeness of bill (RL1)
-0.30 0.45 2
Clarity, Transparency and understandability of bill-Post Paid
(RL2)
NA
Transparency of Recharge Offer/Voucher (RL2)
-0.48
Customer Friendly Approach of customer care executive (RL3)
0.78
Responsiveness
Timely Repair of faults (RS2) 0.32 0.12 8
Network
Availability of Signal (NT1) 0.89 0.38 3
Network in terms of speed of broadband (NT2)
-0.33
Time for service up and working (NT3)
0.01
Empathy
Ease of activating connection (EM3) 0.48 0.57 1
Understanding of relevant information related to tariffs and
plan (EM1)
-0.59
Availability of customer care services (EM5)
-0.51
Assurance
Competency level/Problem solving ability of customer care executive
(AS1)
0.86 0.23 6
Economy
Charges Levied for every internet usage-Post Paid (EC2)
0.54 0.15 7
Convenience
Satisfaction with ease of access to a customer care executive thru IVR
menu (CV1)
-0.09 0.35 4
Satisfaction with supplementary services (Cv2)
0.94
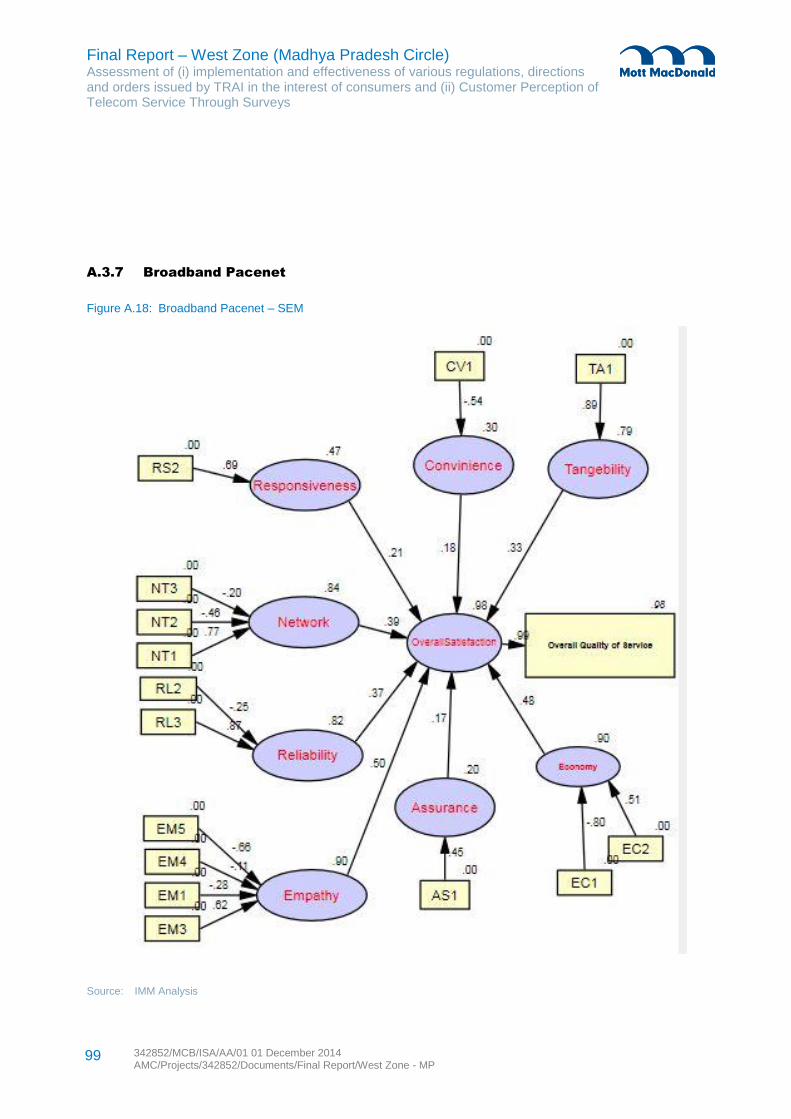
Final Report – West Zone (Madhya Pradesh Circle) Assessment of (i) implementation and effectiveness of various regulations, directions and orders issued by TRAI in the interest of consumers and (ii) Customer Perception of Telecom Service Through Surveys
342852/MCB/ISA/AA/01 01 December 2014 AMC/Projects/342852/Documents/Final Report/West Zone - MP
99
A.3.7 Broadband Pacenet
Figure A.18: Broadband Pacenet – SEM
Source: IMM Analysis
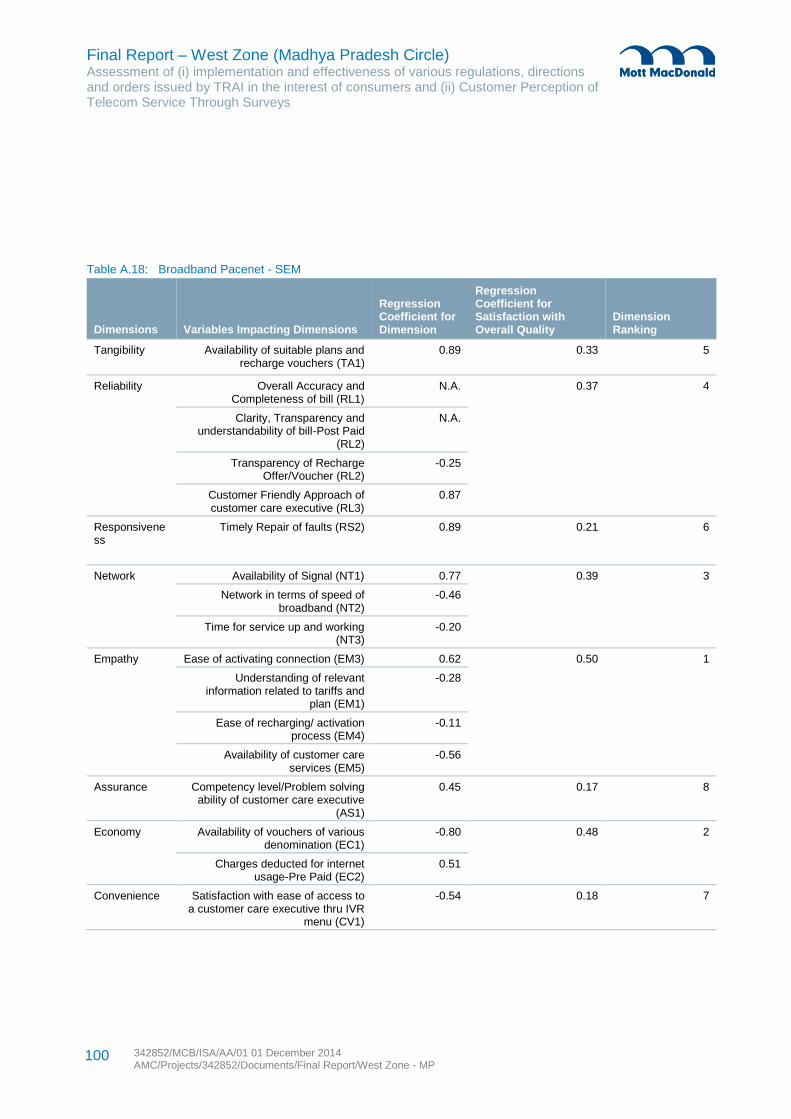
Final Report – West Zone (Madhya Pradesh Circle) Assessment of (i) implementation and effectiveness of various regulations, directions and orders issued by TRAI in the interest of consumers and (ii) Customer Perception of Telecom Service Through Surveys
342852/MCB/ISA/AA/01 01 December 2014 AMC/Projects/342852/Documents/Final Report/West Zone - MP
100
Table A.18: Broadband Pacenet - SEM
Dimensions Variables Impacting Dimensions
Regression Coefficient for Dimension
Regression Coefficient for Satisfaction with Overall Quality
Dimension Ranking
Tangibility
Availability of suitable plans and recharge vouchers (TA1)
0.89 0.33 5
Reliability
Overall Accuracy and Completeness of bill (RL1)
N.A. 0.37 4
Clarity, Transparency and understandability of bill-Post Paid
(RL2)
N.A.
Transparency of Recharge Offer/Voucher (RL2)
-0.25
Customer Friendly Approach of customer care executive (RL3)
0.87
Responsiveness
Timely Repair of faults (RS2) 0.89 0.21 6
Network
Availability of Signal (NT1) 0.77 0.39 3
Network in terms of speed of broadband (NT2)
-0.46
Time for service up and working (NT3)
-0.20
Empathy
Ease of activating connection (EM3) 0.62 0.50 1
Understanding of relevant information related to tariffs and
plan (EM1)
-0.28
Ease of recharging/ activation process (EM4)
-0.11
Availability of customer care services (EM5)
-0.56
Assurance
Competency level/Problem solving ability of customer care executive
(AS1)
0.45 0.17 8
Economy
Availability of vouchers of various denomination (EC1)
-0.80 0.48 2
Charges deducted for internet usage-Pre Paid (EC2)
0.51
Convenience
Satisfaction with ease of access to a customer care executive thru IVR
menu (CV1)
-0.54 0.18 7
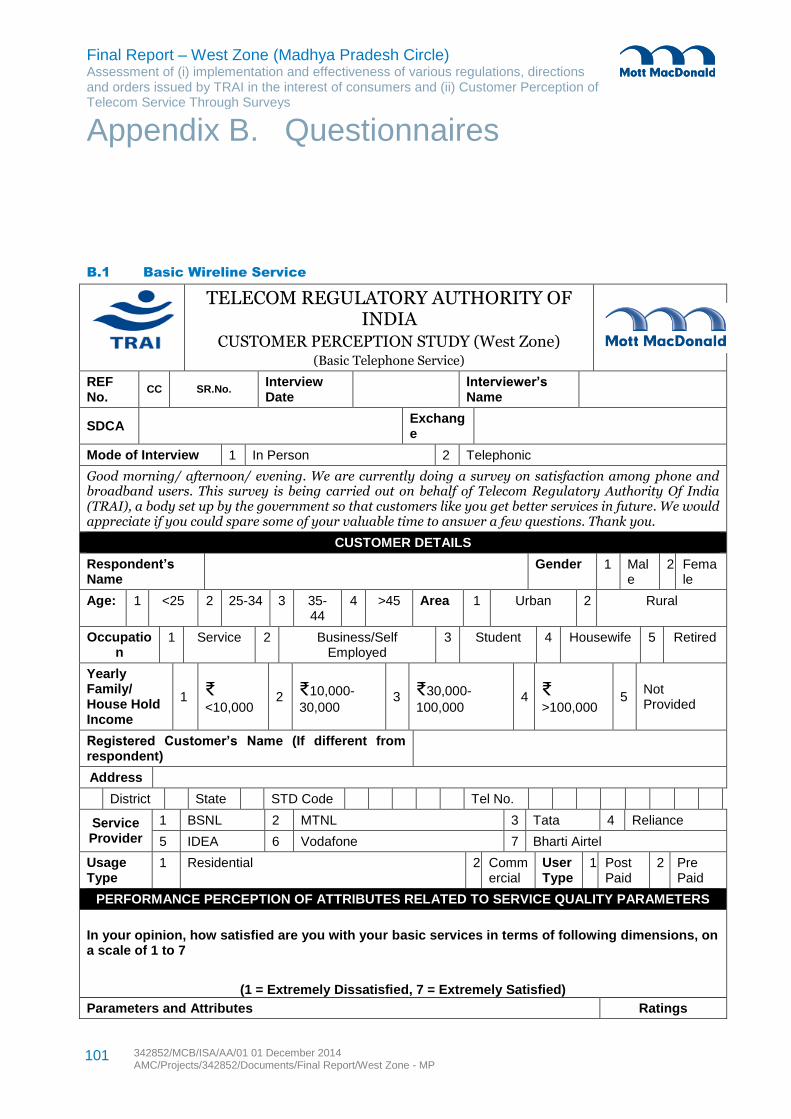
Final Report – West Zone (Madhya Pradesh Circle) Assessment of (i) implementation and effectiveness of various regulations, directions and orders issued by TRAI in the interest of consumers and (ii) Customer Perception of Telecom Service Through Surveys
342852/MCB/ISA/AA/01 01 December 2014 AMC/Projects/342852/Documents/Final Report/West Zone - MP
101
B.1 Basic Wireline Service
TELECOM REGULATORY AUTHORITY OF INDIA
CUSTOMER PERCEPTION STUDY (West Zone) (Basic Telephone Service)
REF No.
CC SR.No. Interview Date
Interviewer’s Name
SDCA Exchange
Mode of Interview 1 In Person 2 Telephonic
Good morning/ afternoon/ evening. We are currently doing a survey on satisfaction among phone and broadband users. This survey is being carried out on behalf of Telecom Regulatory Authority Of India (TRAI), a body set up by the government so that customers like you get better services in future. We would appreciate if you could spare some of your valuable time to answer a few questions. Thank you.
CUSTOMER DETAILS
Respondent’s Name
Gender 1 Male
2 Female
Age: 1 <25 2 25-34 3 35-44
4 >45 Area 1 Urban 2 Rural
Occupation
1 Service 2 Business/Self Employed
3 Student 4 Housewife 5 Retired
Yearly Family/ House Hold Income
1 ₹ <10,000
2 ₹10,000-
30,000 3 ₹30,000-
100,000 4 ₹
>100,000 5
Not Provided
Registered Customer’s Name (If different from respondent)
Address
District State STD Code Tel No.
Service Provider
1 BSNL 2 MTNL 3 Tata 4 Reliance
5 IDEA 6 Vodafone 7 Bharti Airtel
Usage Type
1 Residential 2 Commercial
User Type
1 Post Paid
2 Pre Paid
PERFORMANCE PERCEPTION OF ATTRIBUTES RELATED TO SERVICE QUALITY PARAMETERS
In your opinion, how satisfied are you with your basic services in terms of following dimensions, on a scale of 1 to 7
(1 = Extremely Dissatisfied, 7 = Extremely Satisfied)
Parameters and Attributes Ratings
Appendix B. Questionnaires
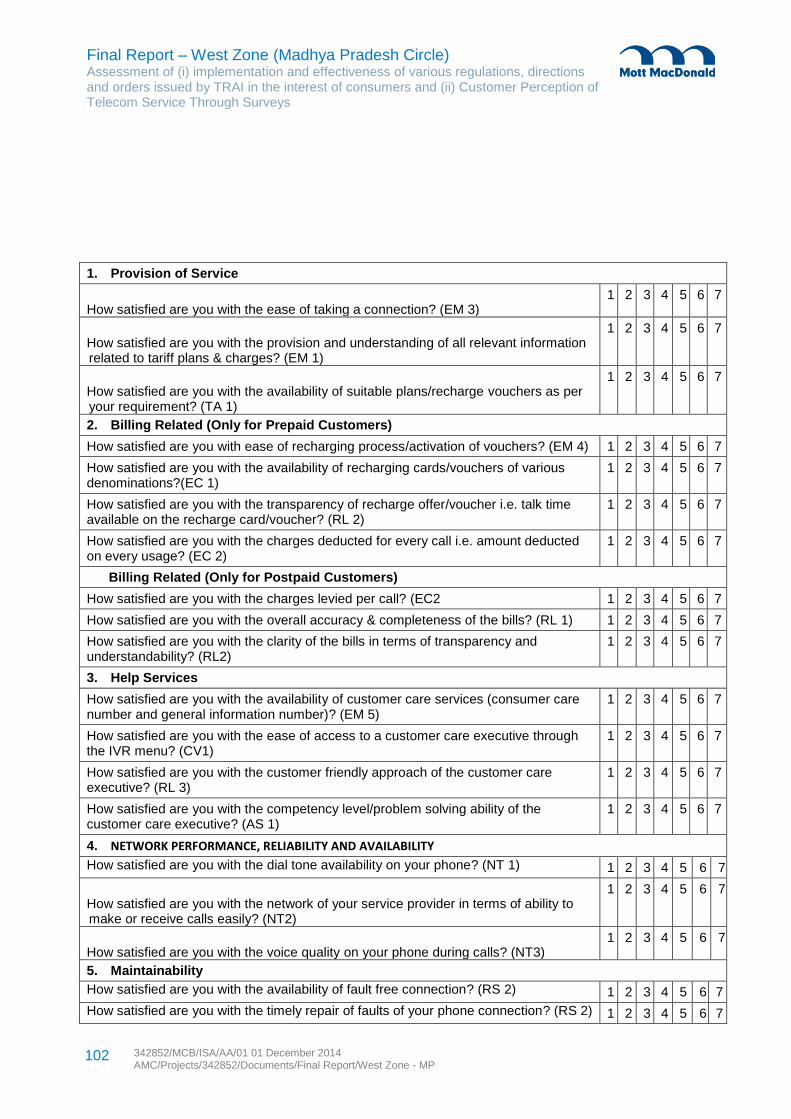
Final Report – West Zone (Madhya Pradesh Circle) Assessment of (i) implementation and effectiveness of various regulations, directions and orders issued by TRAI in the interest of consumers and (ii) Customer Perception of Telecom Service Through Surveys
342852/MCB/ISA/AA/01 01 December 2014 AMC/Projects/342852/Documents/Final Report/West Zone - MP
102
1. Provision of Service
How satisfied are you with the ease of taking a connection? (EM 3) 1 2 3 4 5 6 7
How satisfied are you with the provision and understanding of all relevant information related to tariff plans & charges? (EM 1)
1 2 3 4 5 6 7
How satisfied are you with the availability of suitable plans/recharge vouchers as per your requirement? (TA 1)
1 2 3 4 5 6 7
2. Billing Related (Only for Prepaid Customers)
How satisfied are you with ease of recharging process/activation of vouchers? (EM 4) 1 2 3 4 5 6 7
How satisfied are you with the availability of recharging cards/vouchers of various denominations?(EC 1)
1 2 3 4 5 6 7
How satisfied are you with the transparency of recharge offer/voucher i.e. talk time available on the recharge card/voucher? (RL 2)
1 2 3 4 5 6 7
How satisfied are you with the charges deducted for every call i.e. amount deducted on every usage? (EC 2)
1 2 3 4 5 6 7
Billing Related (Only for Postpaid Customers)
How satisfied are you with the charges levied per call? (EC2 1 2 3 4 5 6 7
How satisfied are you with the overall accuracy & completeness of the bills? (RL 1) 1 2 3 4 5 6 7
How satisfied are you with the clarity of the bills in terms of transparency and understandability? (RL2)
1 2 3 4 5 6 7
3. Help Services
How satisfied are you with the availability of customer care services (consumer care number and general information number)? (EM 5)
1 2 3 4 5 6 7
How satisfied are you with the ease of access to a customer care executive through the IVR menu? (CV1)
1 2 3 4 5 6 7
How satisfied are you with the customer friendly approach of the customer care executive? (RL 3)
1 2 3 4 5 6 7
How satisfied are you with the competency level/problem solving ability of the customer care executive? (AS 1)
1 2 3 4 5 6 7
4. NETWORK PERFORMANCE, RELIABILITY AND AVAILABILITY
How satisfied are you with the dial tone availability on your phone? (NT 1) 1 2 3 4 5 6 7
How satisfied are you with the network of your service provider in terms of ability to make or receive calls easily? (NT2)
1 2 3 4 5 6 7
How satisfied are you with the voice quality on your phone during calls? (NT3) 1 2 3 4 5 6 7
5. Maintainability
How satisfied are you with the availability of fault free connection? (RS 2) 1 2 3 4 5 6 7
How satisfied are you with the timely repair of faults of your phone connection? (RS 2) 1 2 3 4 5 6 7
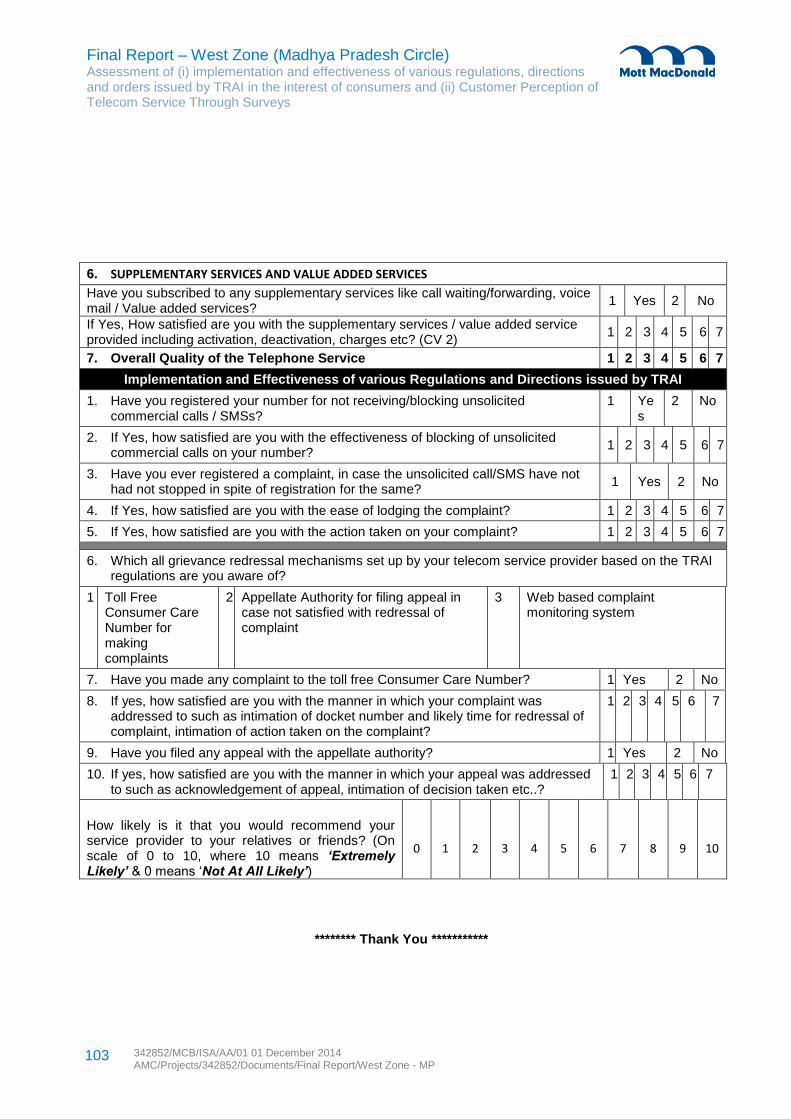
Final Report – West Zone (Madhya Pradesh Circle) Assessment of (i) implementation and effectiveness of various regulations, directions and orders issued by TRAI in the interest of consumers and (ii) Customer Perception of Telecom Service Through Surveys
342852/MCB/ISA/AA/01 01 December 2014 AMC/Projects/342852/Documents/Final Report/West Zone - MP
103
6. SUPPLEMENTARY SERVICES AND VALUE ADDED SERVICES
Have you subscribed to any supplementary services like call waiting/forwarding, voice mail / Value added services?
1 Yes 2 No
If Yes, How satisfied are you with the supplementary services / value added service provided including activation, deactivation, charges etc? (CV 2)
1 2 3 4 5 6 7
7. Overall Quality of the Telephone Service 1 2 3 4 5 6 7
Implementation and Effectiveness of various Regulations and Directions issued by TRAI
1. Have you registered your number for not receiving/blocking unsolicited commercial calls / SMSs?
1 Yes
2 No
2. If Yes, how satisfied are you with the effectiveness of blocking of unsolicited commercial calls on your number?
1 2 3 4 5 6 7
3. Have you ever registered a complaint, in case the unsolicited call/SMS have not had not stopped in spite of registration for the same?
1 Yes 2 No
4. If Yes, how satisfied are you with the ease of lodging the complaint? 1 2 3 4 5 6 7
5. If Yes, how satisfied are you with the action taken on your complaint? 1 2 3 4 5 6 7
6. Which all grievance redressal mechanisms set up by your telecom service provider based on the TRAI regulations are you aware of?
1 Toll Free Consumer Care Number for making complaints
2 Appellate Authority for filing appeal in case not satisfied with redressal of complaint
3 Web based complaint monitoring system
7. Have you made any complaint to the toll free Consumer Care Number? 1 Yes 2 No
8. If yes, how satisfied are you with the manner in which your complaint was addressed to such as intimation of docket number and likely time for redressal of complaint, intimation of action taken on the complaint?
1 2 3 4 5 6 7
9. Have you filed any appeal with the appellate authority? 1 Yes 2 No
10. If yes, how satisfied are you with the manner in which your appeal was addressed to such as acknowledgement of appeal, intimation of decision taken etc..?
1 2 3 4 5 6 7
How likely is it that you would recommend your service provider to your relatives or friends? (On scale of 0 to 10, where 10 means ‘Extremely Likely’ & 0 means ‘Not At All Likely’)
0 1 2 3 4 5 6 7 8 9 10
******** Thank You ***********
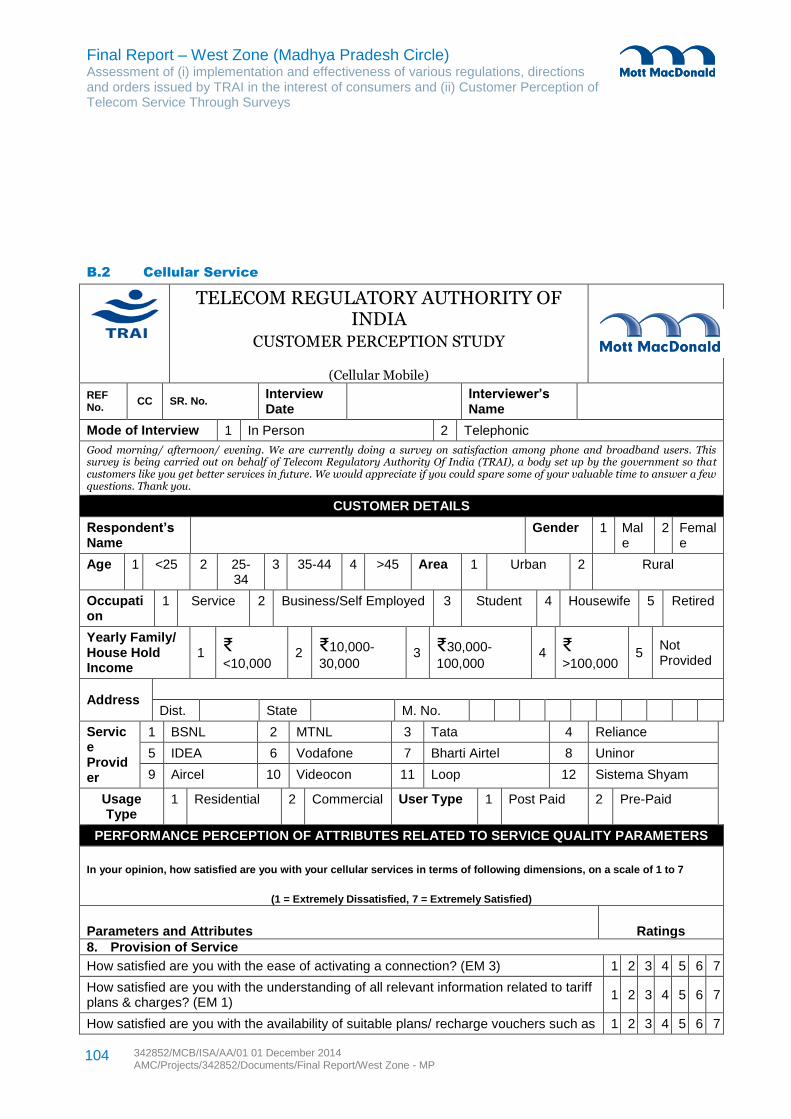
Final Report – West Zone (Madhya Pradesh Circle) Assessment of (i) implementation and effectiveness of various regulations, directions and orders issued by TRAI in the interest of consumers and (ii) Customer Perception of Telecom Service Through Surveys
342852/MCB/ISA/AA/01 01 December 2014 AMC/Projects/342852/Documents/Final Report/West Zone - MP
104
B.2 Cellular Service
TELECOM REGULATORY AUTHORITY OF INDIA
CUSTOMER PERCEPTION STUDY
(Cellular Mobile)
REF No.
CC SR. No. Interview Date
Interviewer’s Name
Mode of Interview 1 In Person 2 Telephonic
Good morning/ afternoon/ evening. We are currently doing a survey on satisfaction among phone and broadband users. This survey is being carried out on behalf of Telecom Regulatory Authority Of India (TRAI), a body set up by the government so that customers like you get better services in future. We would appreciate if you could spare some of your valuable time to answer a few questions. Thank you.
CUSTOMER DETAILS
Respondent’s Name
Gender 1 Male
2 Female
Age 1 <25 2 25-34
3 35-44 4 >45 Area 1 Urban 2 Rural
Occupation
1 Service 2 Business/Self Employed 3 Student 4 Housewife 5 Retired
Yearly Family/ House Hold Income
1 ₹
<10,000 2 ₹10,000-
30,000 3 ₹30,000-
100,000 4 ₹
>100,000 5
Not Provided
Address
Dist. State M. No.
Service Provider
1 BSNL 2 MTNL 3 Tata 4 Reliance
5 IDEA 6 Vodafone 7 Bharti Airtel 8 Uninor
9 Aircel 10 Videocon 11 Loop 12 Sistema Shyam
Usage Type
1 Residential 2 Commercial User Type 1 Post Paid 2 Pre-Paid
PERFORMANCE PERCEPTION OF ATTRIBUTES RELATED TO SERVICE QUALITY PARAMETERS
In your opinion, how satisfied are you with your cellular services in terms of following dimensions, on a scale of 1 to 7
(1 = Extremely Dissatisfied, 7 = Extremely Satisfied)
Parameters and Attributes Ratings
8. Provision of Service
How satisfied are you with the ease of activating a connection? (EM 3) 1 2 3 4 5 6 7
How satisfied are you with the understanding of all relevant information related to tariff plans & charges? (EM 1)
1 2 3 4 5 6 7
How satisfied are you with the availability of suitable plans/ recharge vouchers such as 1 2 3 4 5 6 7
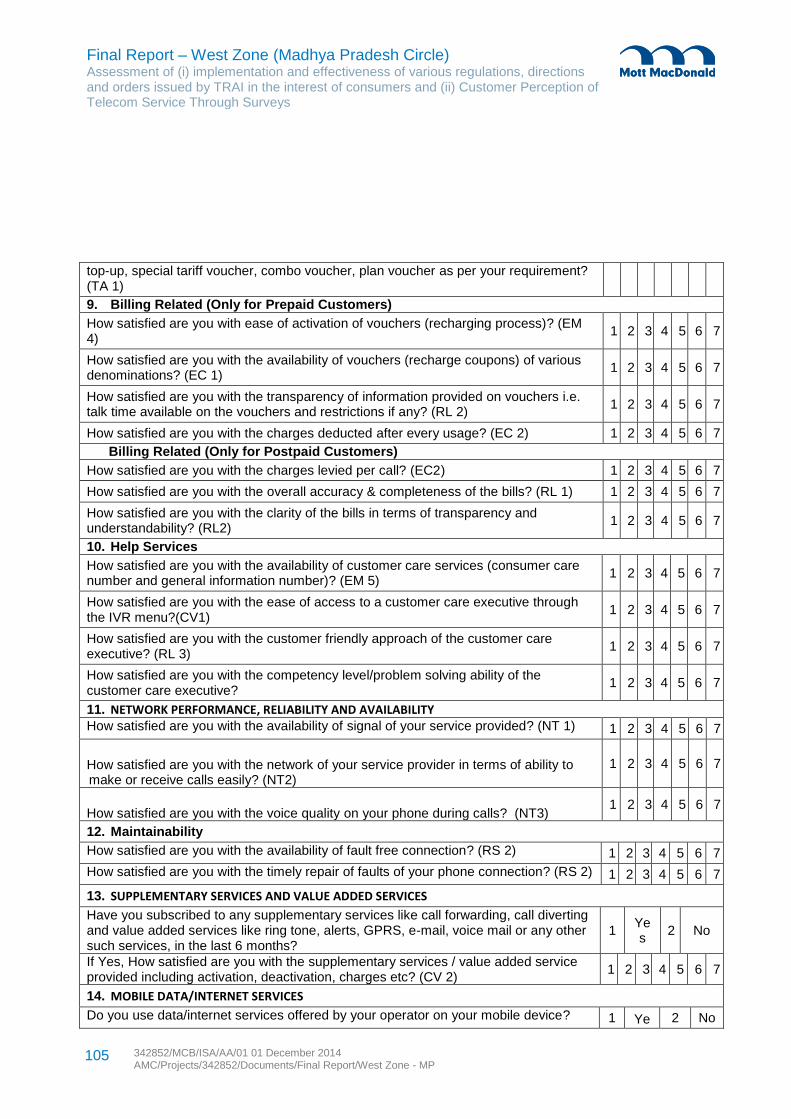
Final Report – West Zone (Madhya Pradesh Circle) Assessment of (i) implementation and effectiveness of various regulations, directions and orders issued by TRAI in the interest of consumers and (ii) Customer Perception of Telecom Service Through Surveys
342852/MCB/ISA/AA/01 01 December 2014 AMC/Projects/342852/Documents/Final Report/West Zone - MP
105
top-up, special tariff voucher, combo voucher, plan voucher as per your requirement? (TA 1)
9. Billing Related (Only for Prepaid Customers)
How satisfied are you with ease of activation of vouchers (recharging process)? (EM 4)
1 2 3 4 5 6 7
How satisfied are you with the availability of vouchers (recharge coupons) of various denominations? (EC 1)
1 2 3 4 5 6 7
How satisfied are you with the transparency of information provided on vouchers i.e. talk time available on the vouchers and restrictions if any? (RL 2)
1 2 3 4 5 6 7
How satisfied are you with the charges deducted after every usage? (EC 2) 1 2 3 4 5 6 7
Billing Related (Only for Postpaid Customers)
How satisfied are you with the charges levied per call? (EC2) 1 2 3 4 5 6 7
How satisfied are you with the overall accuracy & completeness of the bills? (RL 1) 1 2 3 4 5 6 7
How satisfied are you with the clarity of the bills in terms of transparency and understandability? (RL2)
1 2 3 4 5 6 7
10. Help Services
How satisfied are you with the availability of customer care services (consumer care number and general information number)? (EM 5)
1 2 3 4 5 6 7
How satisfied are you with the ease of access to a customer care executive through the IVR menu?(CV1)
1 2 3 4 5 6 7
How satisfied are you with the customer friendly approach of the customer care executive? (RL 3)
1 2 3 4 5 6 7
How satisfied are you with the competency level/problem solving ability of the customer care executive?
1 2 3 4 5 6 7
11. NETWORK PERFORMANCE, RELIABILITY AND AVAILABILITY
How satisfied are you with the availability of signal of your service provided? (NT 1) 1 2 3 4 5 6 7
How satisfied are you with the network of your service provider in terms of ability to make or receive calls easily? (NT2)
1 2 3 4 5 6 7
How satisfied are you with the voice quality on your phone during calls? (NT3) 1 2 3 4 5 6 7
12. Maintainability
How satisfied are you with the availability of fault free connection? (RS 2) 1 2 3 4 5 6 7
How satisfied are you with the timely repair of faults of your phone connection? (RS 2) 1 2 3 4 5 6 7
13. SUPPLEMENTARY SERVICES AND VALUE ADDED SERVICES
Have you subscribed to any supplementary services like call forwarding, call diverting and value added services like ring tone, alerts, GPRS, e-mail, voice mail or any other such services, in the last 6 months?
1 Yes
2 No
If Yes, How satisfied are you with the supplementary services / value added service provided including activation, deactivation, charges etc? (CV 2)
1 2 3 4 5 6 7
14. MOBILE DATA/INTERNET SERVICES
Do you use data/internet services offered by your operator on your mobile device? 1 Ye 2 No
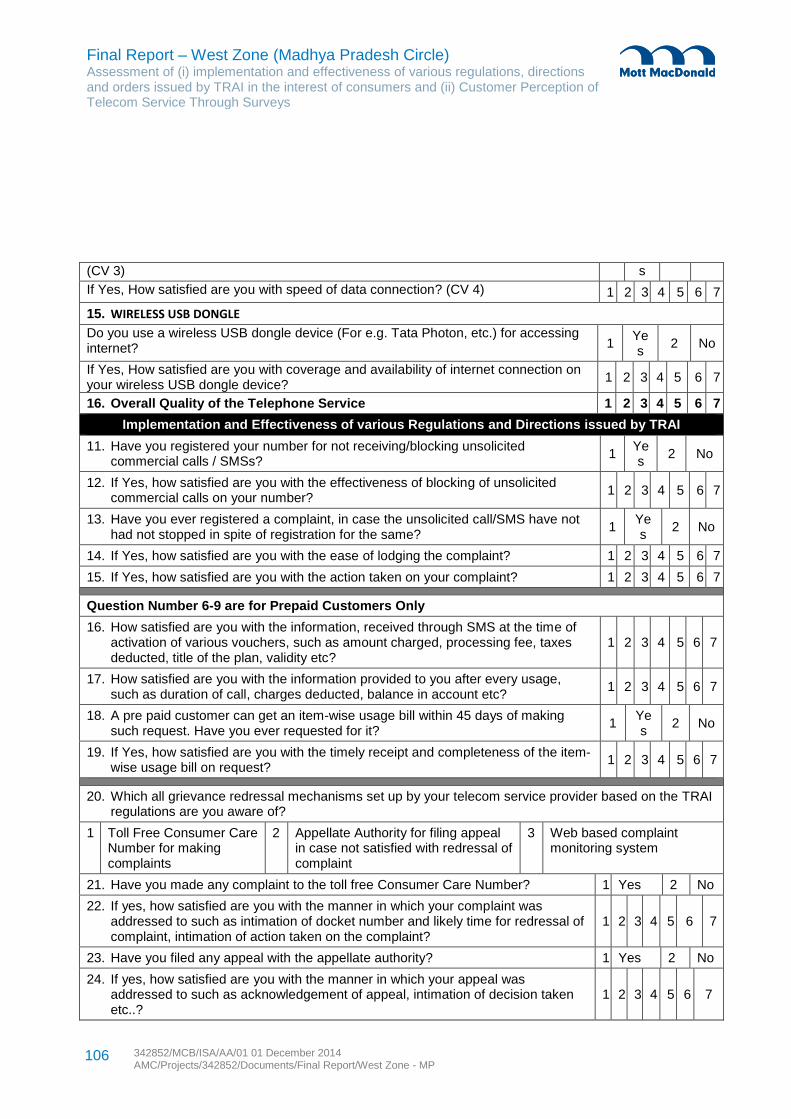
Final Report – West Zone (Madhya Pradesh Circle) Assessment of (i) implementation and effectiveness of various regulations, directions and orders issued by TRAI in the interest of consumers and (ii) Customer Perception of Telecom Service Through Surveys
342852/MCB/ISA/AA/01 01 December 2014 AMC/Projects/342852/Documents/Final Report/West Zone - MP
106
(CV 3) s
If Yes, How satisfied are you with speed of data connection? (CV 4) 1 2 3 4 5 6 7
15. WIRELESS USB DONGLE
Do you use a wireless USB dongle device (For e.g. Tata Photon, etc.) for accessing internet? 1
Yes
2 No
If Yes, How satisfied are you with coverage and availability of internet connection on your wireless USB dongle device?
1 2 3 4 5 6 7
16. Overall Quality of the Telephone Service 1 2 3 4 5 6 7
Implementation and Effectiveness of various Regulations and Directions issued by TRAI
11. Have you registered your number for not receiving/blocking unsolicited commercial calls / SMSs?
1 Yes
2 No
12. If Yes, how satisfied are you with the effectiveness of blocking of unsolicited commercial calls on your number?
1 2 3 4 5 6 7
13. Have you ever registered a complaint, in case the unsolicited call/SMS have not had not stopped in spite of registration for the same?
1 Yes
2 No
14. If Yes, how satisfied are you with the ease of lodging the complaint? 1 2 3 4 5 6 7
15. If Yes, how satisfied are you with the action taken on your complaint? 1 2 3 4 5 6 7
Question Number 6-9 are for Prepaid Customers Only
16. How satisfied are you with the information, received through SMS at the time of activation of various vouchers, such as amount charged, processing fee, taxes deducted, title of the plan, validity etc?
1 2 3 4 5 6 7
17. How satisfied are you with the information provided to you after every usage, such as duration of call, charges deducted, balance in account etc?
1 2 3 4 5 6 7
18. A pre paid customer can get an item-wise usage bill within 45 days of making such request. Have you ever requested for it?
1 Yes
2 No
19. If Yes, how satisfied are you with the timely receipt and completeness of the item-wise usage bill on request?
1 2 3 4 5 6 7
20. Which all grievance redressal mechanisms set up by your telecom service provider based on the TRAI regulations are you aware of?
1 Toll Free Consumer Care Number for making complaints
2 Appellate Authority for filing appeal in case not satisfied with redressal of complaint
3 Web based complaint monitoring system
21. Have you made any complaint to the toll free Consumer Care Number? 1 Yes 2 No
22. If yes, how satisfied are you with the manner in which your complaint was addressed to such as intimation of docket number and likely time for redressal of complaint, intimation of action taken on the complaint?
1 2 3 4 5 6 7
23. Have you filed any appeal with the appellate authority? 1 Yes 2 No
24. If yes, how satisfied are you with the manner in which your appeal was addressed to such as acknowledgement of appeal, intimation of decision taken etc..?
1 2 3 4 5 6 7
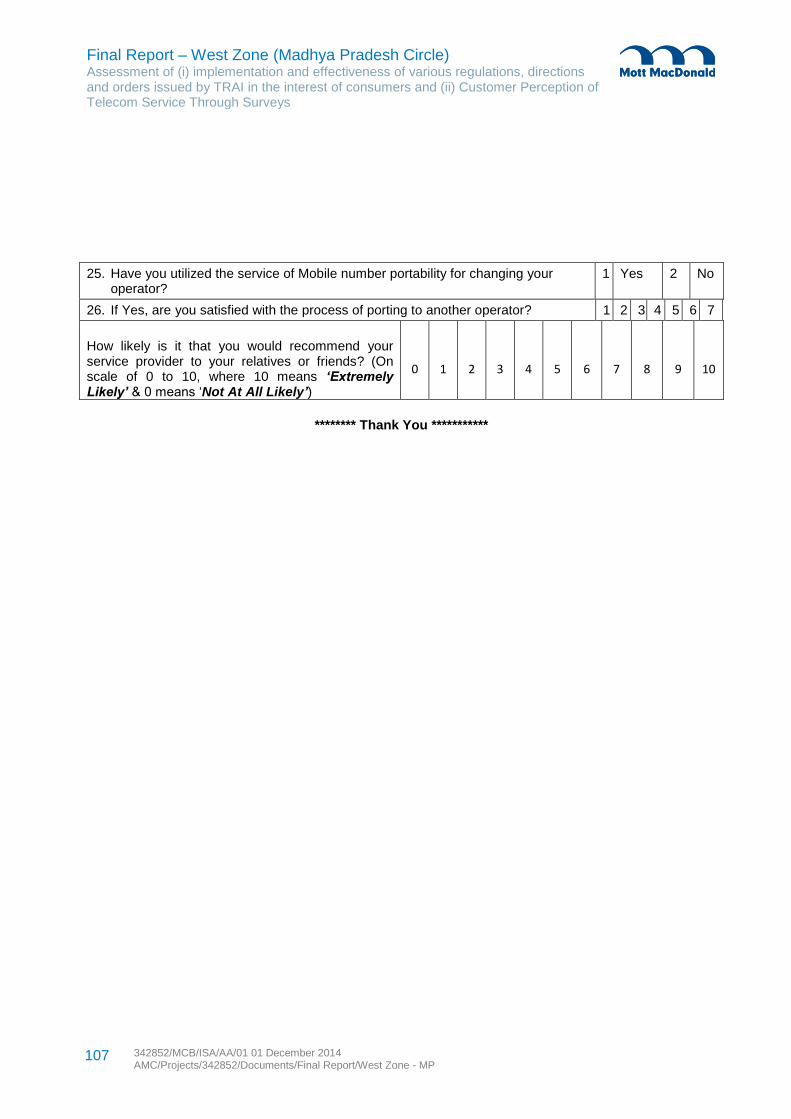
Final Report – West Zone (Madhya Pradesh Circle) Assessment of (i) implementation and effectiveness of various regulations, directions and orders issued by TRAI in the interest of consumers and (ii) Customer Perception of Telecom Service Through Surveys
342852/MCB/ISA/AA/01 01 December 2014 AMC/Projects/342852/Documents/Final Report/West Zone - MP
107
25. Have you utilized the service of Mobile number portability for changing your operator?
1 Yes 2 No
26. If Yes, are you satisfied with the process of porting to another operator? 1 2 3 4 5 6 7
How likely is it that you would recommend your service provider to your relatives or friends? (On scale of 0 to 10, where 10 means ‘Extremely Likely’ & 0 means ‘Not At All Likely’)
0 1 2 3 4 5 6 7 8 9 10
******** Thank You ***********
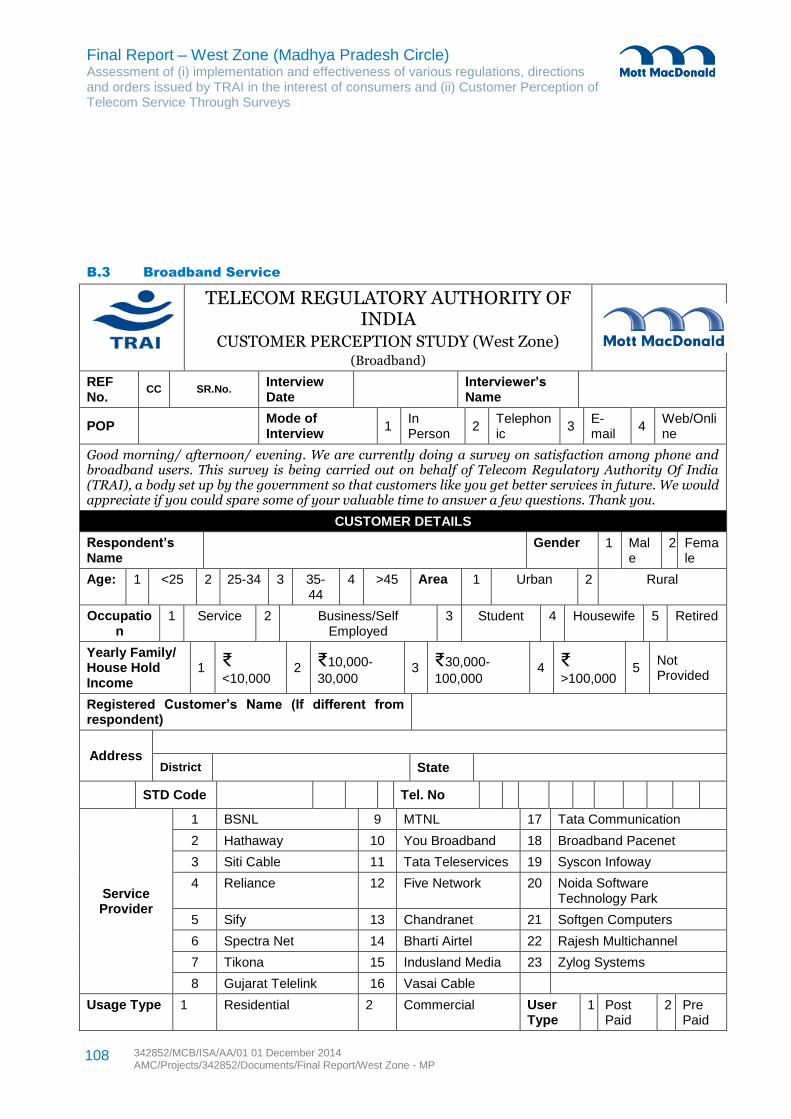
Final Report – West Zone (Madhya Pradesh Circle) Assessment of (i) implementation and effectiveness of various regulations, directions and orders issued by TRAI in the interest of consumers and (ii) Customer Perception of Telecom Service Through Surveys
342852/MCB/ISA/AA/01 01 December 2014 AMC/Projects/342852/Documents/Final Report/West Zone - MP
108
B.3 Broadband Service
TELECOM REGULATORY AUTHORITY OF INDIA
CUSTOMER PERCEPTION STUDY (West Zone) (Broadband)
REF No.
CC SR.No. Interview Date
Interviewer’s Name
POP Mode of Interview
1 In Person
2 Telephonic
3 E-mail
4 Web/Online
Good morning/ afternoon/ evening. We are currently doing a survey on satisfaction among phone and broadband users. This survey is being carried out on behalf of Telecom Regulatory Authority Of India (TRAI), a body set up by the government so that customers like you get better services in future. We would appreciate if you could spare some of your valuable time to answer a few questions. Thank you.
CUSTOMER DETAILS
Respondent’s Name
Gender 1 Male
2 Female
Age: 1 <25 2 25-34 3 35-44
4 >45 Area 1 Urban 2 Rural
Occupation
1 Service 2 Business/Self Employed
3 Student 4 Housewife 5 Retired
Yearly Family/ House Hold Income
1 ₹
<10,000 2 ₹10,000-
30,000 3 ₹30,000-
100,000 4 ₹
>100,000 5
Not Provided
Registered Customer’s Name (If different from respondent)
Address
District State
STD Code Tel. No
Service Provider
1 BSNL 9 MTNL 17 Tata Communication
2 Hathaway 10 You Broadband 18 Broadband Pacenet
3 Siti Cable 11 Tata Teleservices 19 Syscon Infoway
4 Reliance 12 Five Network 20 Noida Software Technology Park
5 Sify 13 Chandranet 21 Softgen Computers
6 Spectra Net 14 Bharti Airtel 22 Rajesh Multichannel
7 Tikona 15 Indusland Media 23 Zylog Systems
8 Gujarat Telelink 16 Vasai Cable
Usage Type 1 Residential 2 Commercial User Type
1 Post Paid
2 Pre Paid
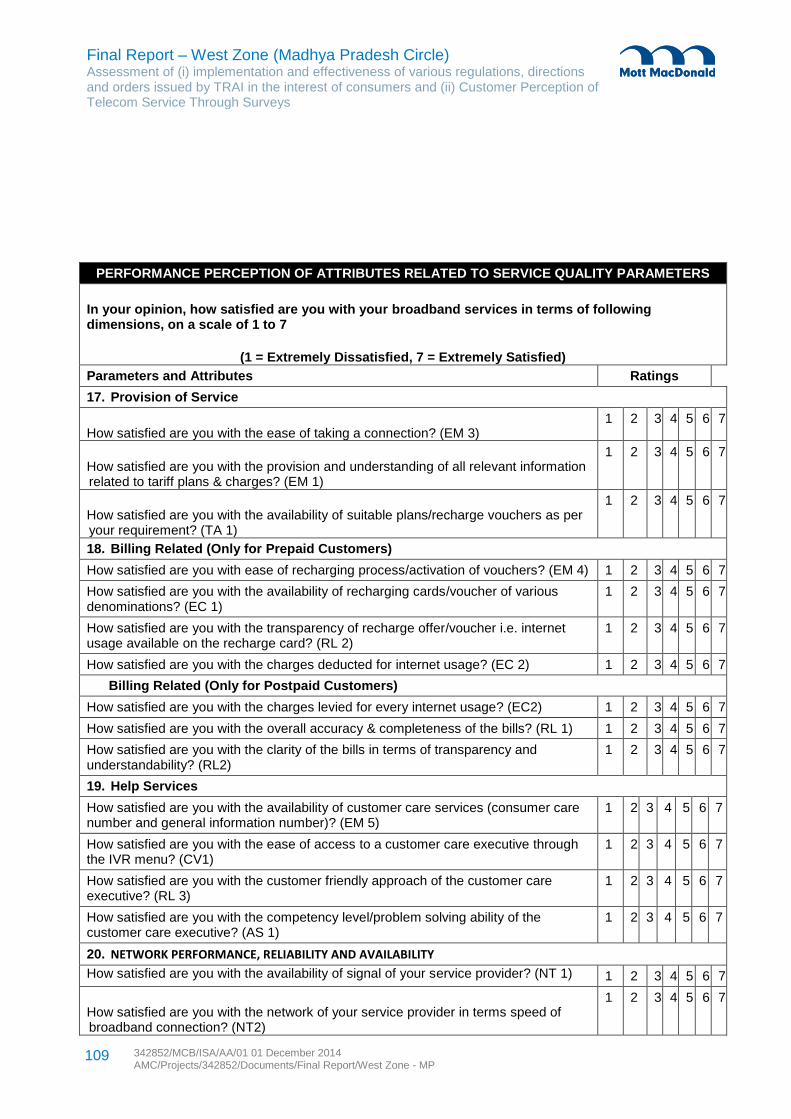
Final Report – West Zone (Madhya Pradesh Circle) Assessment of (i) implementation and effectiveness of various regulations, directions and orders issued by TRAI in the interest of consumers and (ii) Customer Perception of Telecom Service Through Surveys
342852/MCB/ISA/AA/01 01 December 2014 AMC/Projects/342852/Documents/Final Report/West Zone - MP
109
PERFORMANCE PERCEPTION OF ATTRIBUTES RELATED TO SERVICE QUALITY PARAMETERS
In your opinion, how satisfied are you with your broadband services in terms of following dimensions, on a scale of 1 to 7
(1 = Extremely Dissatisfied, 7 = Extremely Satisfied)
Parameters and Attributes Ratings
17. Provision of Service
How satisfied are you with the ease of taking a connection? (EM 3) 1 2 3 4 5 6 7
How satisfied are you with the provision and understanding of all relevant information related to tariff plans & charges? (EM 1)
1 2 3 4 5 6 7
How satisfied are you with the availability of suitable plans/recharge vouchers as per your requirement? (TA 1)
1 2 3 4 5 6 7
18. Billing Related (Only for Prepaid Customers)
How satisfied are you with ease of recharging process/activation of vouchers? (EM 4) 1 2 3 4 5 6 7
How satisfied are you with the availability of recharging cards/voucher of various denominations? (EC 1)
1 2 3 4 5 6 7
How satisfied are you with the transparency of recharge offer/voucher i.e. internet usage available on the recharge card? (RL 2)
1 2 3 4 5 6 7
How satisfied are you with the charges deducted for internet usage? (EC 2) 1 2 3 4 5 6 7
Billing Related (Only for Postpaid Customers)
How satisfied are you with the charges levied for every internet usage? (EC2) 1 2 3 4 5 6 7
How satisfied are you with the overall accuracy & completeness of the bills? (RL 1) 1 2 3 4 5 6 7
How satisfied are you with the clarity of the bills in terms of transparency and understandability? (RL2)
1 2 3 4 5 6 7
19. Help Services
How satisfied are you with the availability of customer care services (consumer care number and general information number)? (EM 5)
1 2 3 4 5 6 7
How satisfied are you with the ease of access to a customer care executive through the IVR menu? (CV1)
1 2 3 4 5 6 7
How satisfied are you with the customer friendly approach of the customer care executive? (RL 3)
1 2 3 4 5 6 7
How satisfied are you with the competency level/problem solving ability of the customer care executive? (AS 1)
1 2 3 4 5 6 7
20. NETWORK PERFORMANCE, RELIABILITY AND AVAILABILITY
How satisfied are you with the availability of signal of your service provider? (NT 1) 1 2 3 4 5 6 7
How satisfied are you with the network of your service provider in terms speed of broadband connection? (NT2)
1 2 3 4 5 6 7
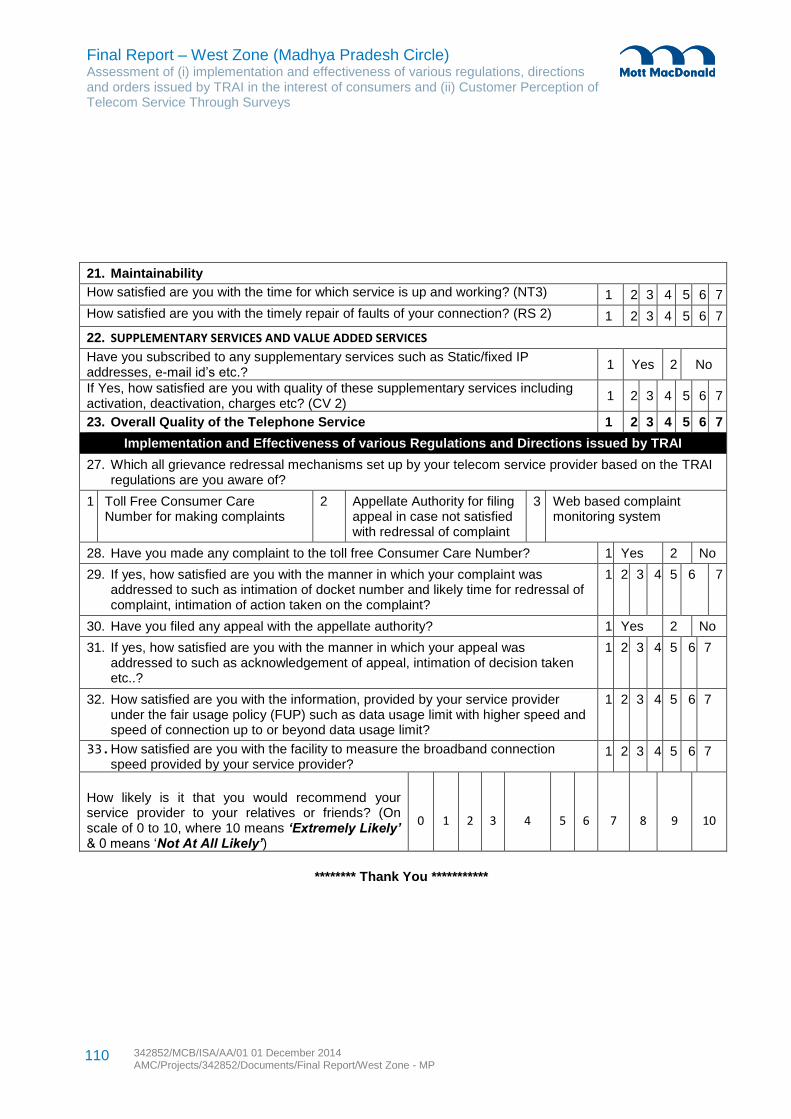
Final Report – West Zone (Madhya Pradesh Circle) Assessment of (i) implementation and effectiveness of various regulations, directions and orders issued by TRAI in the interest of consumers and (ii) Customer Perception of Telecom Service Through Surveys
342852/MCB/ISA/AA/01 01 December 2014 AMC/Projects/342852/Documents/Final Report/West Zone - MP
110
21. Maintainability
How satisfied are you with the time for which service is up and working? (NT3) 1 2 3 4 5 6 7
How satisfied are you with the timely repair of faults of your connection? (RS 2) 1 2 3 4 5 6 7
22. SUPPLEMENTARY SERVICES AND VALUE ADDED SERVICES
Have you subscribed to any supplementary services such as Static/fixed IP addresses, e-mail id’s etc.?
1 Yes 2 No
If Yes, how satisfied are you with quality of these supplementary services including activation, deactivation, charges etc? (CV 2)
1 2 3 4 5 6 7
23. Overall Quality of the Telephone Service 1 2 3 4 5 6 7
Implementation and Effectiveness of various Regulations and Directions issued by TRAI
27. Which all grievance redressal mechanisms set up by your telecom service provider based on the TRAI regulations are you aware of?
1 Toll Free Consumer Care Number for making complaints
2 Appellate Authority for filing appeal in case not satisfied with redressal of complaint
3 Web based complaint monitoring system
28. Have you made any complaint to the toll free Consumer Care Number? 1 Yes 2 No
29. If yes, how satisfied are you with the manner in which your complaint was addressed to such as intimation of docket number and likely time for redressal of complaint, intimation of action taken on the complaint?
1 2 3 4 5 6 7
30. Have you filed any appeal with the appellate authority? 1 Yes 2 No
31. If yes, how satisfied are you with the manner in which your appeal was addressed to such as acknowledgement of appeal, intimation of decision taken etc..?
1 2 3 4 5 6 7
32. How satisfied are you with the information, provided by your service provider under the fair usage policy (FUP) such as data usage limit with higher speed and speed of connection up to or beyond data usage limit?
1 2 3 4 5 6 7
33. How satisfied are you with the facility to measure the broadband connection speed provided by your service provider?
1 2 3 4 5 6 7
How likely is it that you would recommend your service provider to your relatives or friends? (On scale of 0 to 10, where 10 means ‘Extremely Likely’ & 0 means ‘Not At All Likely’)
0 1 2 3 4 5 6 7 8 9 10
******** Thank You ***********
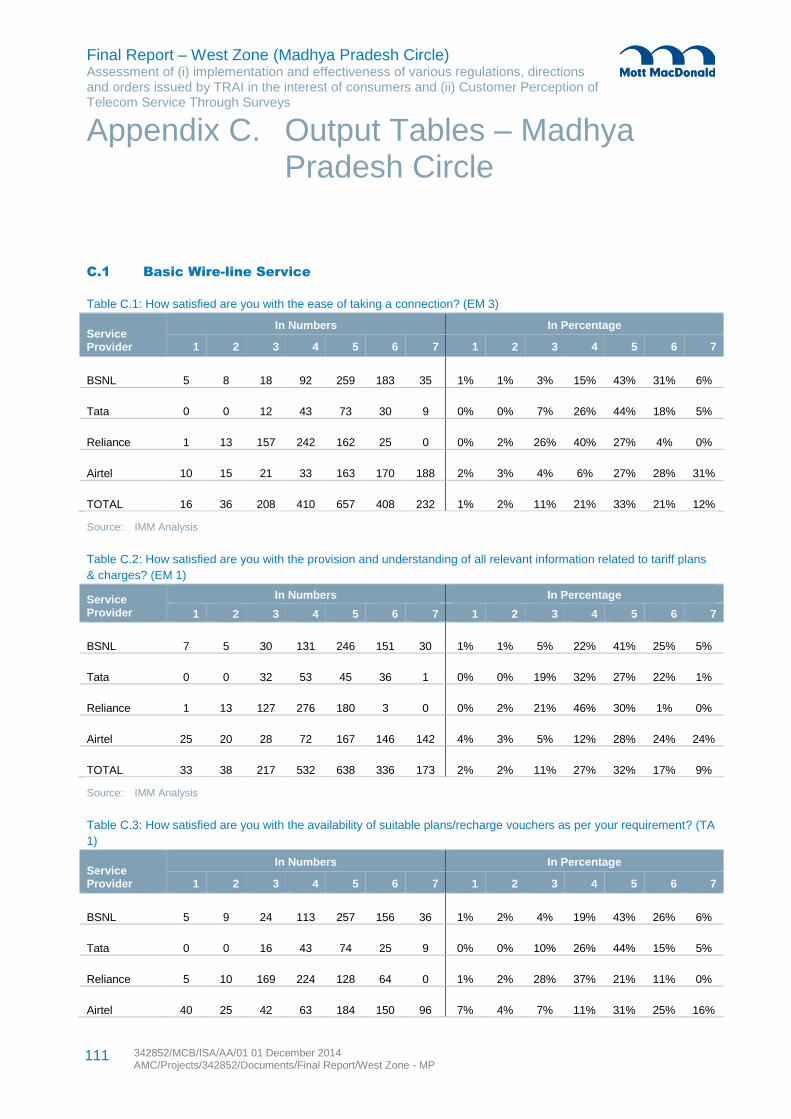
Final Report – West Zone (Madhya Pradesh Circle) Assessment of (i) implementation and effectiveness of various regulations, directions and orders issued by TRAI in the interest of consumers and (ii) Customer Perception of Telecom Service Through Surveys
342852/MCB/ISA/AA/01 01 December 2014 AMC/Projects/342852/Documents/Final Report/West Zone - MP
111
C.1 Basic Wire-line Service
Table C.1: How satisfied are you with the ease of taking a connection? (EM 3)
Service Provider
In Numbers In Percentage
1 2 3 4 5 6 7 1 2 3 4 5 6 7
BSNL 5 8 18 92 259 183 35 1% 1% 3% 15% 43% 31% 6%
Tata 0 0 12 43 73 30 9 0% 0% 7% 26% 44% 18% 5%
Reliance 1 13 157 242 162 25 0 0% 2% 26% 40% 27% 4% 0%
Airtel 10 15 21 33 163 170 188 2% 3% 4% 6% 27% 28% 31%
TOTAL 16 36 208 410 657 408 232 1% 2% 11% 21% 33% 21% 12%
Source: IMM Analysis
Table C.2: How satisfied are you with the provision and understanding of all relevant information related to tariff plans
& charges? (EM 1)
Service Provider
In Numbers In Percentage
1 2 3 4 5 6 7 1 2 3 4 5 6 7
BSNL 7 5 30 131 246 151 30 1% 1% 5% 22% 41% 25% 5%
Tata 0 0 32 53 45 36 1 0% 0% 19% 32% 27% 22% 1%
Reliance 1 13 127 276 180 3 0 0% 2% 21% 46% 30% 1% 0%
Airtel 25 20 28 72 167 146 142 4% 3% 5% 12% 28% 24% 24%
TOTAL 33 38 217 532 638 336 173 2% 2% 11% 27% 32% 17% 9%
Source: IMM Analysis
Table C.3: How satisfied are you with the availability of suitable plans/recharge vouchers as per your requirement? (TA
1)
Service Provider
In Numbers In Percentage
1 2 3 4 5 6 7 1 2 3 4 5 6 7
BSNL 5 9 24 113 257 156 36 1% 2% 4% 19% 43% 26% 6%
Tata 0 0 16 43 74 25 9 0% 0% 10% 26% 44% 15% 5%
Reliance 5 10 169 224 128 64 0 1% 2% 28% 37% 21% 11% 0%
Airtel 40 25 42 63 184 150 96 7% 4% 7% 11% 31% 25% 16%
Appendix C. Output Tables – Madhya Pradesh Circle
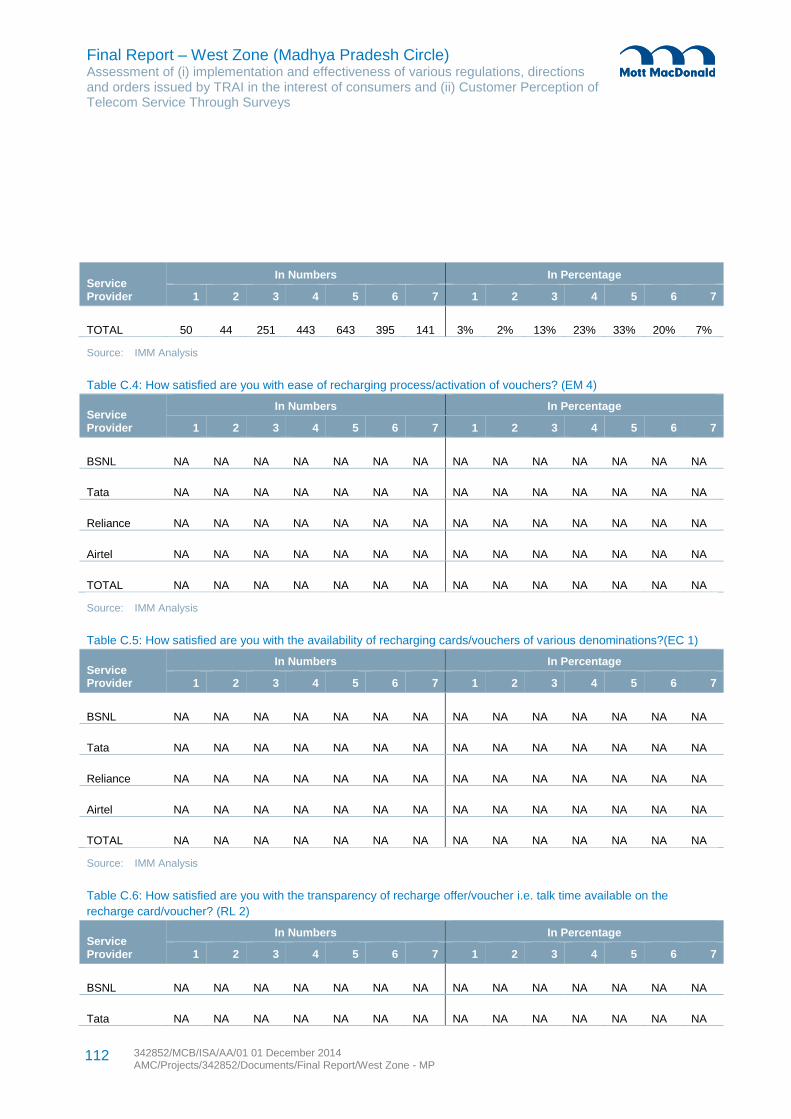
Final Report – West Zone (Madhya Pradesh Circle) Assessment of (i) implementation and effectiveness of various regulations, directions and orders issued by TRAI in the interest of consumers and (ii) Customer Perception of Telecom Service Through Surveys
342852/MCB/ISA/AA/01 01 December 2014 AMC/Projects/342852/Documents/Final Report/West Zone - MP
112
Service Provider
In Numbers In Percentage
1 2 3 4 5 6 7 1 2 3 4 5 6 7
TOTAL 50 44 251 443 643 395 141 3% 2% 13% 23% 33% 20% 7%
Source: IMM Analysis
Table C.4: How satisfied are you with ease of recharging process/activation of vouchers? (EM 4)
Service Provider
In Numbers In Percentage
1 2 3 4 5 6 7 1 2 3 4 5 6 7
BSNL NA NA NA NA NA NA NA NA NA NA NA NA NA NA
Tata NA NA NA NA NA NA NA NA NA NA NA NA NA NA
Reliance NA NA NA NA NA NA NA NA NA NA NA NA NA NA
Airtel NA NA NA NA NA NA NA NA NA NA NA NA NA NA
TOTAL NA NA NA NA NA NA NA NA NA NA NA NA NA NA
Source: IMM Analysis
Table C.5: How satisfied are you with the availability of recharging cards/vouchers of various denominations?(EC 1)
Service Provider
In Numbers In Percentage
1 2 3 4 5 6 7 1 2 3 4 5 6 7
BSNL NA NA NA NA NA NA NA NA NA NA NA NA NA NA
Tata NA NA NA NA NA NA NA NA NA NA NA NA NA NA
Reliance NA NA NA NA NA NA NA NA NA NA NA NA NA NA
Airtel NA NA NA NA NA NA NA NA NA NA NA NA NA NA
TOTAL NA NA NA NA NA NA NA NA NA NA NA NA NA NA
Source: IMM Analysis
Table C.6: How satisfied are you with the transparency of recharge offer/voucher i.e. talk time available on the
recharge card/voucher? (RL 2)
Service Provider
In Numbers In Percentage
1 2 3 4 5 6 7 1 2 3 4 5 6 7
BSNL NA NA NA NA NA NA NA NA NA NA NA NA NA NA
Tata NA NA NA NA NA NA NA NA NA NA NA NA NA NA
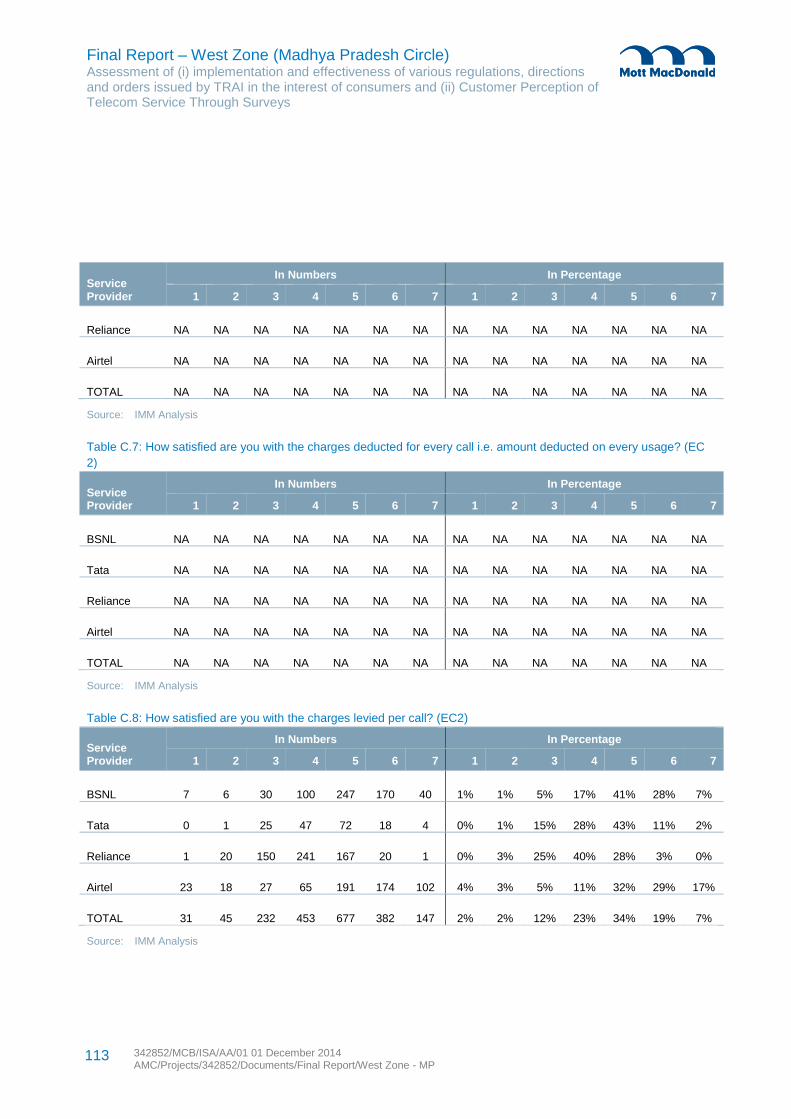
Final Report – West Zone (Madhya Pradesh Circle) Assessment of (i) implementation and effectiveness of various regulations, directions and orders issued by TRAI in the interest of consumers and (ii) Customer Perception of Telecom Service Through Surveys
342852/MCB/ISA/AA/01 01 December 2014 AMC/Projects/342852/Documents/Final Report/West Zone - MP
113
Service Provider
In Numbers In Percentage
1 2 3 4 5 6 7 1 2 3 4 5 6 7
Reliance NA NA NA NA NA NA NA NA NA NA NA NA NA NA
Airtel NA NA NA NA NA NA NA NA NA NA NA NA NA NA
TOTAL NA NA NA NA NA NA NA NA NA NA NA NA NA NA
Source: IMM Analysis
Table C.7: How satisfied are you with the charges deducted for every call i.e. amount deducted on every usage? (EC
2)
Service Provider
In Numbers In Percentage
1 2 3 4 5 6 7 1 2 3 4 5 6 7
BSNL NA NA NA NA NA NA NA NA NA NA NA NA NA NA
Tata NA NA NA NA NA NA NA NA NA NA NA NA NA NA
Reliance NA NA NA NA NA NA NA NA NA NA NA NA NA NA
Airtel NA NA NA NA NA NA NA NA NA NA NA NA NA NA
TOTAL NA NA NA NA NA NA NA NA NA NA NA NA NA NA
Source: IMM Analysis
Table C.8: How satisfied are you with the charges levied per call? (EC2)
Service Provider
In Numbers In Percentage
1 2 3 4 5 6 7 1 2 3 4 5 6 7
BSNL 7 6 30 100 247 170 40 1% 1% 5% 17% 41% 28% 7%
Tata 0 1 25 47 72 18 4 0% 1% 15% 28% 43% 11% 2%
Reliance 1 20 150 241 167 20 1 0% 3% 25% 40% 28% 3% 0%
Airtel 23 18 27 65 191 174 102 4% 3% 5% 11% 32% 29% 17%
TOTAL 31 45 232 453 677 382 147 2% 2% 12% 23% 34% 19% 7%
Source: IMM Analysis
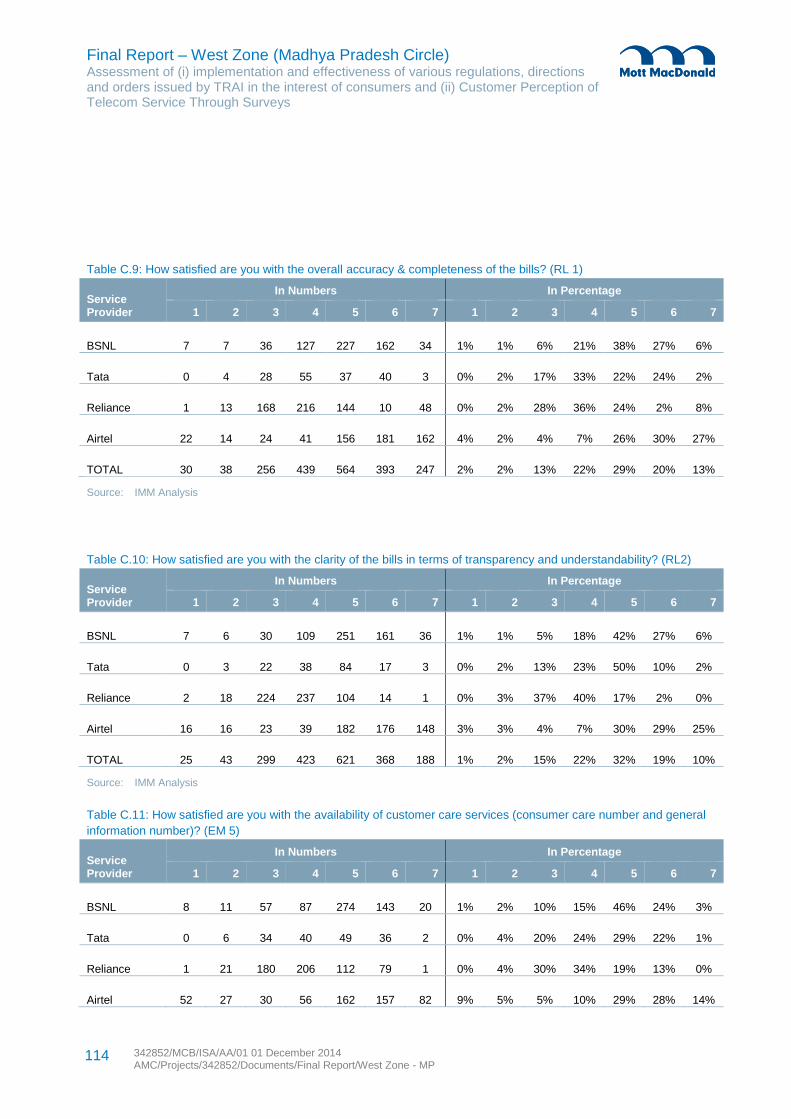
Final Report – West Zone (Madhya Pradesh Circle) Assessment of (i) implementation and effectiveness of various regulations, directions and orders issued by TRAI in the interest of consumers and (ii) Customer Perception of Telecom Service Through Surveys
342852/MCB/ISA/AA/01 01 December 2014 AMC/Projects/342852/Documents/Final Report/West Zone - MP
114
Table C.9: How satisfied are you with the overall accuracy & completeness of the bills? (RL 1)
Service Provider
In Numbers In Percentage
1 2 3 4 5 6 7 1 2 3 4 5 6 7
BSNL 7 7 36 127 227 162 34 1% 1% 6% 21% 38% 27% 6%
Tata 0 4 28 55 37 40 3 0% 2% 17% 33% 22% 24% 2%
Reliance 1 13 168 216 144 10 48 0% 2% 28% 36% 24% 2% 8%
Airtel 22 14 24 41 156 181 162 4% 2% 4% 7% 26% 30% 27%
TOTAL 30 38 256 439 564 393 247 2% 2% 13% 22% 29% 20% 13%
Source: IMM Analysis
Table C.10: How satisfied are you with the clarity of the bills in terms of transparency and understandability? (RL2)
Service Provider
In Numbers In Percentage
1 2 3 4 5 6 7 1 2 3 4 5 6 7
BSNL 7 6 30 109 251 161 36 1% 1% 5% 18% 42% 27% 6%
Tata 0 3 22 38 84 17 3 0% 2% 13% 23% 50% 10% 2%
Reliance 2 18 224 237 104 14 1 0% 3% 37% 40% 17% 2% 0%
Airtel 16 16 23 39 182 176 148 3% 3% 4% 7% 30% 29% 25%
TOTAL 25 43 299 423 621 368 188 1% 2% 15% 22% 32% 19% 10%
Source: IMM Analysis
Table C.11: How satisfied are you with the availability of customer care services (consumer care number and general
information number)? (EM 5)
Service Provider
In Numbers In Percentage
1 2 3 4 5 6 7 1 2 3 4 5 6 7
BSNL 8 11 57 87 274 143 20 1% 2% 10% 15% 46% 24% 3%
Tata 0 6 34 40 49 36 2 0% 4% 20% 24% 29% 22% 1%
Reliance 1 21 180 206 112 79 1 0% 4% 30% 34% 19% 13% 0%
Airtel 52 27 30 56 162 157 82 9% 5% 5% 10% 29% 28% 14%
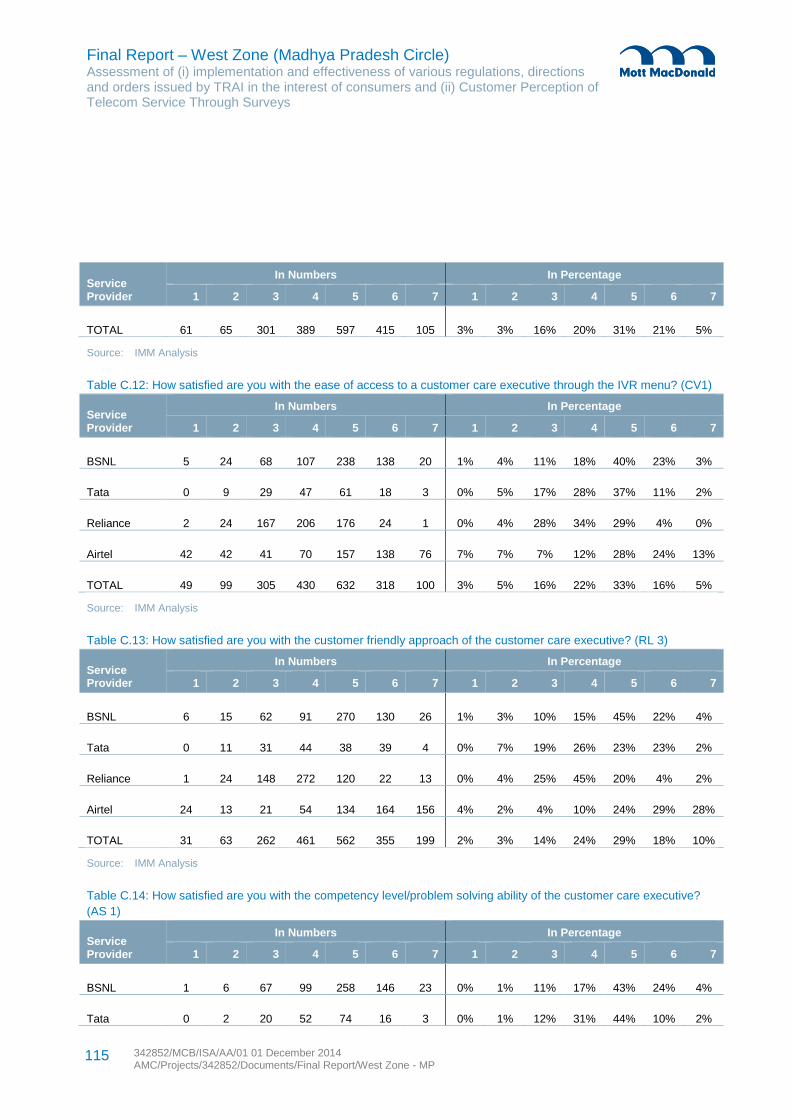
Final Report – West Zone (Madhya Pradesh Circle) Assessment of (i) implementation and effectiveness of various regulations, directions and orders issued by TRAI in the interest of consumers and (ii) Customer Perception of Telecom Service Through Surveys
342852/MCB/ISA/AA/01 01 December 2014 AMC/Projects/342852/Documents/Final Report/West Zone - MP
115
Service Provider
In Numbers In Percentage
1 2 3 4 5 6 7 1 2 3 4 5 6 7
TOTAL 61 65 301 389 597 415 105 3% 3% 16% 20% 31% 21% 5%
Source: IMM Analysis
Table C.12: How satisfied are you with the ease of access to a customer care executive through the IVR menu? (CV1)
Service Provider
In Numbers In Percentage
1 2 3 4 5 6 7 1 2 3 4 5 6 7
BSNL 5 24 68 107 238 138 20 1% 4% 11% 18% 40% 23% 3%
Tata 0 9 29 47 61 18 3 0% 5% 17% 28% 37% 11% 2%
Reliance 2 24 167 206 176 24 1 0% 4% 28% 34% 29% 4% 0%
Airtel 42 42 41 70 157 138 76 7% 7% 7% 12% 28% 24% 13%
TOTAL 49 99 305 430 632 318 100 3% 5% 16% 22% 33% 16% 5%
Source: IMM Analysis
Table C.13: How satisfied are you with the customer friendly approach of the customer care executive? (RL 3)
Service Provider
In Numbers In Percentage
1 2 3 4 5 6 7 1 2 3 4 5 6 7
BSNL 6 15 62 91 270 130 26 1% 3% 10% 15% 45% 22% 4%
Tata 0 11 31 44 38 39 4 0% 7% 19% 26% 23% 23% 2%
Reliance 1 24 148 272 120 22 13 0% 4% 25% 45% 20% 4% 2%
Airtel 24 13 21 54 134 164 156 4% 2% 4% 10% 24% 29% 28%
TOTAL 31 63 262 461 562 355 199 2% 3% 14% 24% 29% 18% 10%
Source: IMM Analysis
Table C.14: How satisfied are you with the competency level/problem solving ability of the customer care executive?
(AS 1)
Service Provider
In Numbers In Percentage
1 2 3 4 5 6 7 1 2 3 4 5 6 7
BSNL 1 6 67 99 258 146 23 0% 1% 11% 17% 43% 24% 4%
Tata 0 2 20 52 74 16 3 0% 1% 12% 31% 44% 10% 2%
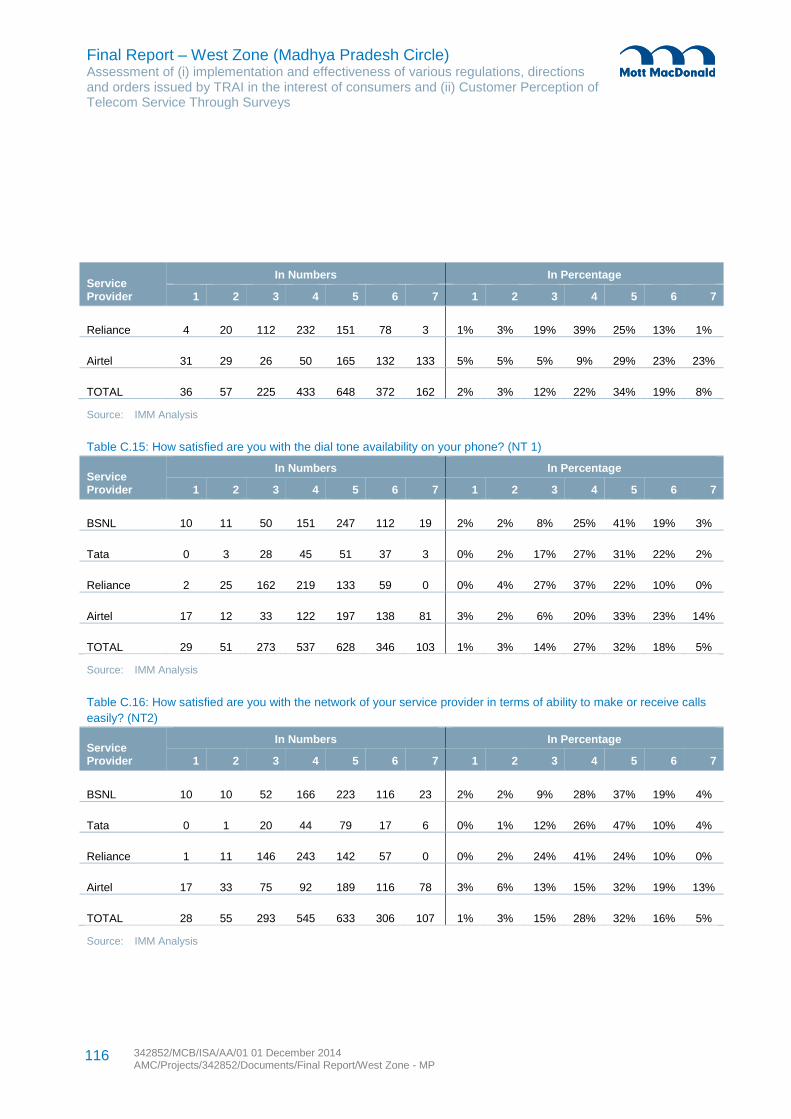
Final Report – West Zone (Madhya Pradesh Circle) Assessment of (i) implementation and effectiveness of various regulations, directions and orders issued by TRAI in the interest of consumers and (ii) Customer Perception of Telecom Service Through Surveys
342852/MCB/ISA/AA/01 01 December 2014 AMC/Projects/342852/Documents/Final Report/West Zone - MP
116
Service Provider
In Numbers In Percentage
1 2 3 4 5 6 7 1 2 3 4 5 6 7
Reliance 4 20 112 232 151 78 3 1% 3% 19% 39% 25% 13% 1%
Airtel 31 29 26 50 165 132 133 5% 5% 5% 9% 29% 23% 23%
TOTAL 36 57 225 433 648 372 162 2% 3% 12% 22% 34% 19% 8%
Source: IMM Analysis
Table C.15: How satisfied are you with the dial tone availability on your phone? (NT 1)
Service Provider
In Numbers In Percentage
1 2 3 4 5 6 7 1 2 3 4 5 6 7
BSNL 10 11 50 151 247 112 19 2% 2% 8% 25% 41% 19% 3%
Tata 0 3 28 45 51 37 3 0% 2% 17% 27% 31% 22% 2%
Reliance 2 25 162 219 133 59 0 0% 4% 27% 37% 22% 10% 0%
Airtel 17 12 33 122 197 138 81 3% 2% 6% 20% 33% 23% 14%
TOTAL 29 51 273 537 628 346 103 1% 3% 14% 27% 32% 18% 5%
Source: IMM Analysis
Table C.16: How satisfied are you with the network of your service provider in terms of ability to make or receive calls
easily? (NT2)
Service Provider
In Numbers In Percentage
1 2 3 4 5 6 7 1 2 3 4 5 6 7
BSNL 10 10 52 166 223 116 23 2% 2% 9% 28% 37% 19% 4%
Tata 0 1 20 44 79 17 6 0% 1% 12% 26% 47% 10% 4%
Reliance 1 11 146 243 142 57 0 0% 2% 24% 41% 24% 10% 0%
Airtel 17 33 75 92 189 116 78 3% 6% 13% 15% 32% 19% 13%
TOTAL 28 55 293 545 633 306 107 1% 3% 15% 28% 32% 16% 5%
Source: IMM Analysis
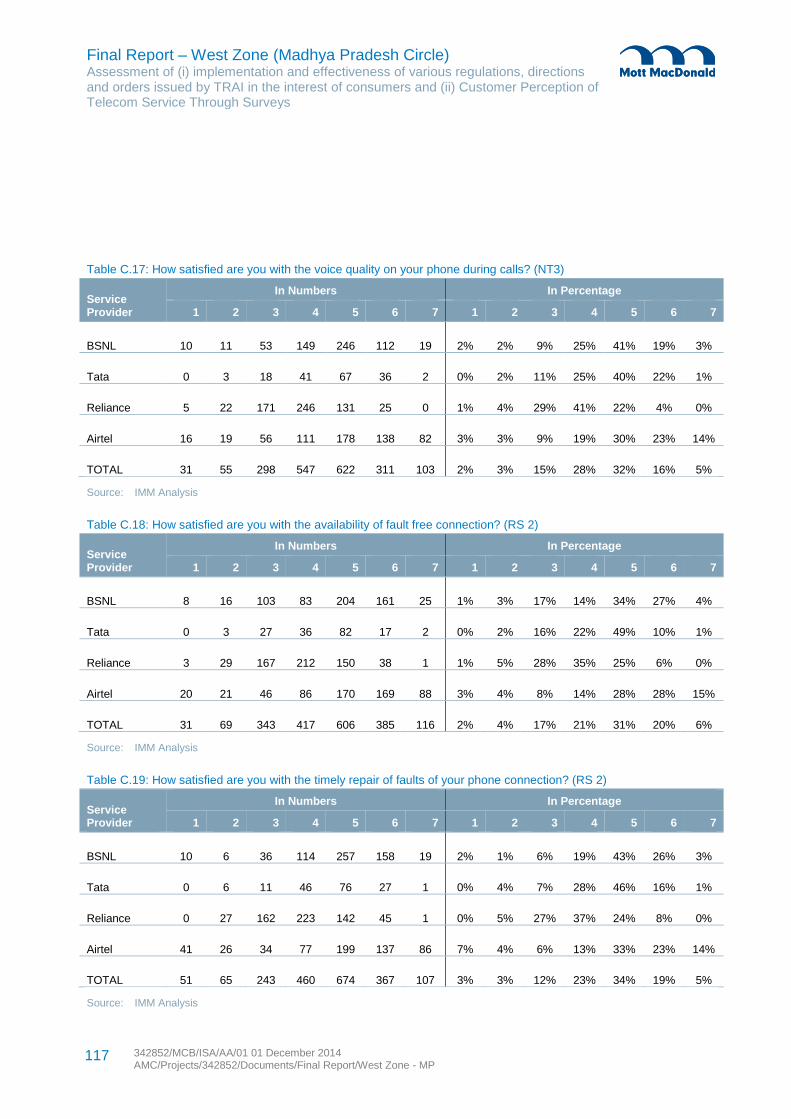
Final Report – West Zone (Madhya Pradesh Circle) Assessment of (i) implementation and effectiveness of various regulations, directions and orders issued by TRAI in the interest of consumers and (ii) Customer Perception of Telecom Service Through Surveys
342852/MCB/ISA/AA/01 01 December 2014 AMC/Projects/342852/Documents/Final Report/West Zone - MP
117
Table C.17: How satisfied are you with the voice quality on your phone during calls? (NT3)
Service Provider
In Numbers In Percentage
1 2 3 4 5 6 7 1 2 3 4 5 6 7
BSNL 10 11 53 149 246 112 19 2% 2% 9% 25% 41% 19% 3%
Tata 0 3 18 41 67 36 2 0% 2% 11% 25% 40% 22% 1%
Reliance 5 22 171 246 131 25 0 1% 4% 29% 41% 22% 4% 0%
Airtel 16 19 56 111 178 138 82 3% 3% 9% 19% 30% 23% 14%
TOTAL 31 55 298 547 622 311 103 2% 3% 15% 28% 32% 16% 5%
Source: IMM Analysis
Table C.18: How satisfied are you with the availability of fault free connection? (RS 2)
Service Provider
In Numbers In Percentage
1 2 3 4 5 6 7 1 2 3 4 5 6 7
BSNL 8 16 103 83 204 161 25 1% 3% 17% 14% 34% 27% 4%
Tata 0 3 27 36 82 17 2 0% 2% 16% 22% 49% 10% 1%
Reliance 3 29 167 212 150 38 1 1% 5% 28% 35% 25% 6% 0%
Airtel 20 21 46 86 170 169 88 3% 4% 8% 14% 28% 28% 15%
TOTAL 31 69 343 417 606 385 116 2% 4% 17% 21% 31% 20% 6%
Source: IMM Analysis
Table C.19: How satisfied are you with the timely repair of faults of your phone connection? (RS 2)
Service Provider
In Numbers In Percentage
1 2 3 4 5 6 7 1 2 3 4 5 6 7
BSNL 10 6 36 114 257 158 19 2% 1% 6% 19% 43% 26% 3%
Tata 0 6 11 46 76 27 1 0% 4% 7% 28% 46% 16% 1%
Reliance 0 27 162 223 142 45 1 0% 5% 27% 37% 24% 8% 0%
Airtel 41 26 34 77 199 137 86 7% 4% 6% 13% 33% 23% 14%
TOTAL 51 65 243 460 674 367 107 3% 3% 12% 23% 34% 19% 5%
Source: IMM Analysis
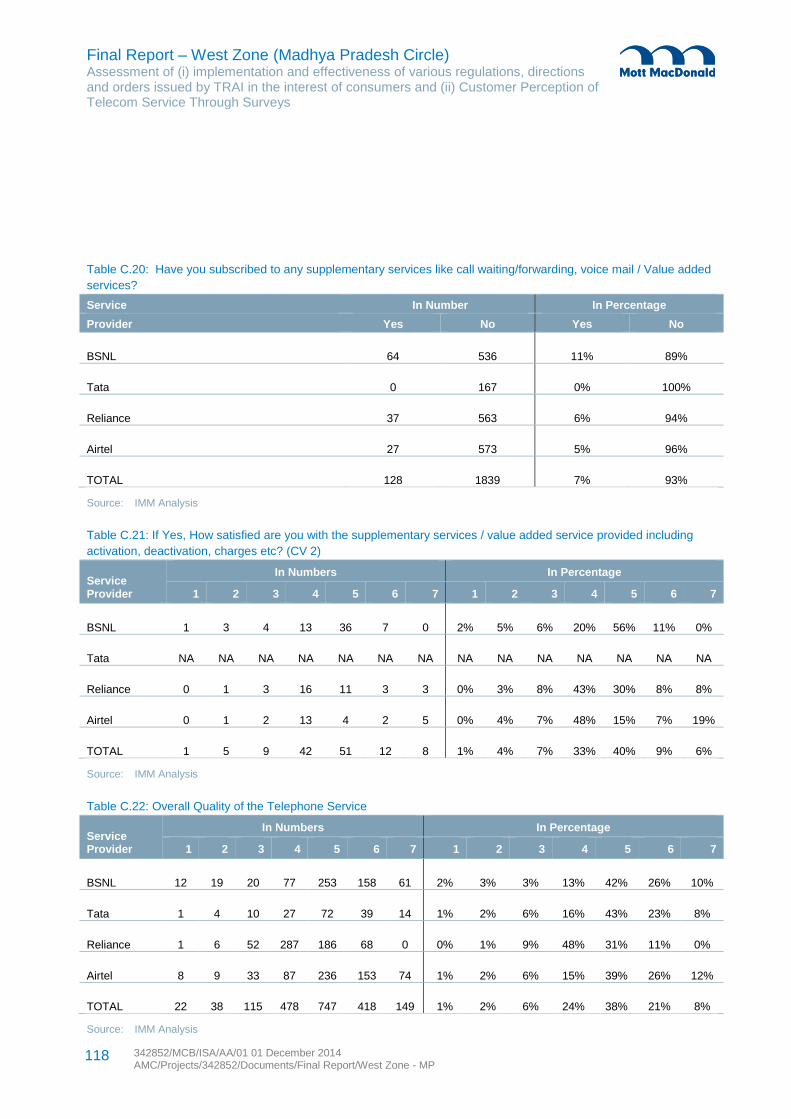
Final Report – West Zone (Madhya Pradesh Circle) Assessment of (i) implementation and effectiveness of various regulations, directions and orders issued by TRAI in the interest of consumers and (ii) Customer Perception of Telecom Service Through Surveys
342852/MCB/ISA/AA/01 01 December 2014 AMC/Projects/342852/Documents/Final Report/West Zone - MP
118
Table C.20: Have you subscribed to any supplementary services like call waiting/forwarding, voice mail / Value added
services?
Service In Number In Percentage
Provider Yes No Yes No
BSNL 64 536 11% 89%
Tata 0 167 0% 100%
Reliance 37 563 6% 94%
Airtel 27 573 5% 96%
TOTAL 128 1839 7% 93%
Source: IMM Analysis
Table C.21: If Yes, How satisfied are you with the supplementary services / value added service provided including
activation, deactivation, charges etc? (CV 2)
Service Provider
In Numbers In Percentage
1 2 3 4 5 6 7 1 2 3 4 5 6 7
BSNL 1 3 4 13 36 7 0 2% 5% 6% 20% 56% 11% 0%
Tata NA NA NA NA NA NA NA NA NA NA NA NA NA NA
Reliance 0 1 3 16 11 3 3 0% 3% 8% 43% 30% 8% 8%
Airtel 0 1 2 13 4 2 5 0% 4% 7% 48% 15% 7% 19%
TOTAL 1 5 9 42 51 12 8 1% 4% 7% 33% 40% 9% 6%
Source: IMM Analysis
Table C.22: Overall Quality of the Telephone Service
Service Provider
In Numbers In Percentage
1 2 3 4 5 6 7 1 2 3 4 5 6 7
BSNL 12 19 20 77 253 158 61 2% 3% 3% 13% 42% 26% 10%
Tata 1 4 10 27 72 39 14 1% 2% 6% 16% 43% 23% 8%
Reliance 1 6 52 287 186 68 0 0% 1% 9% 48% 31% 11% 0%
Airtel 8 9 33 87 236 153 74 1% 2% 6% 15% 39% 26% 12%
TOTAL 22 38 115 478 747 418 149 1% 2% 6% 24% 38% 21% 8%
Source: IMM Analysis
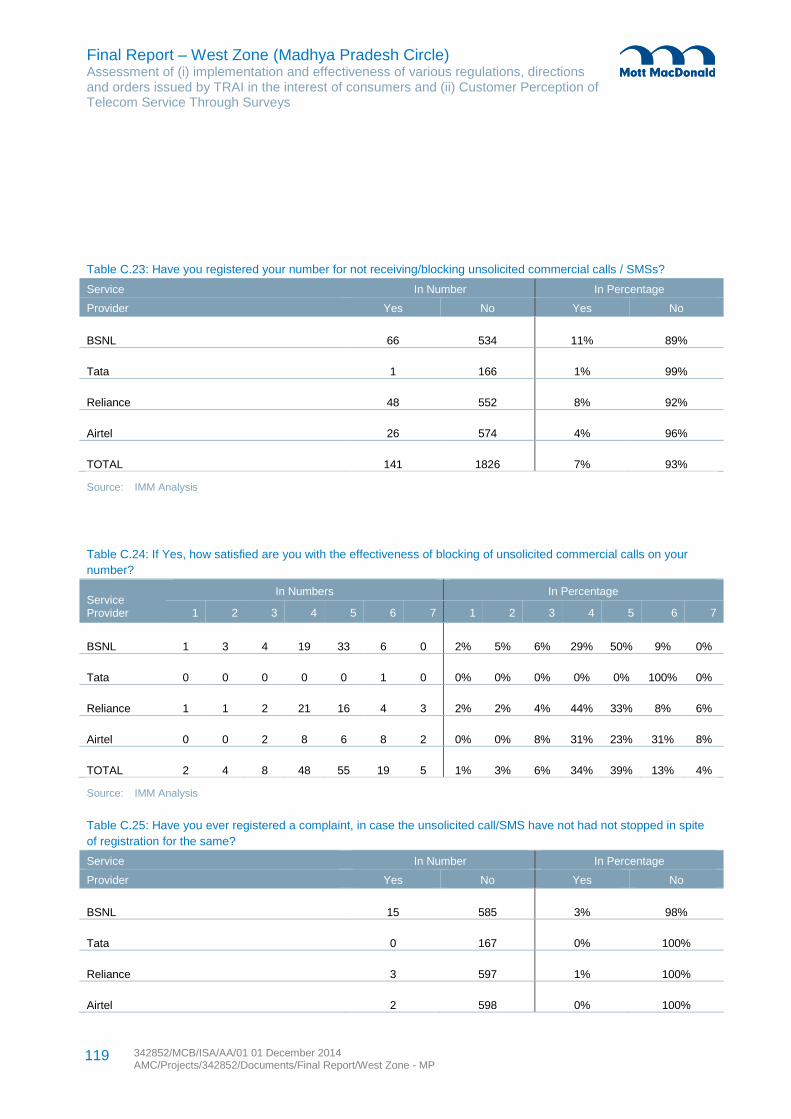
Final Report – West Zone (Madhya Pradesh Circle) Assessment of (i) implementation and effectiveness of various regulations, directions and orders issued by TRAI in the interest of consumers and (ii) Customer Perception of Telecom Service Through Surveys
342852/MCB/ISA/AA/01 01 December 2014 AMC/Projects/342852/Documents/Final Report/West Zone - MP
119
Table C.23: Have you registered your number for not receiving/blocking unsolicited commercial calls / SMSs?
Service In Number In Percentage
Provider Yes No Yes No
BSNL 66 534 11% 89%
Tata 1 166 1% 99%
Reliance 48 552 8% 92%
Airtel 26 574 4% 96%
TOTAL 141 1826 7% 93%
Source: IMM Analysis
Table C.24: If Yes, how satisfied are you with the effectiveness of blocking of unsolicited commercial calls on your
number?
Service Provider
In Numbers In Percentage
1 2 3 4 5 6 7 1 2 3 4 5 6 7
BSNL 1 3 4 19 33 6 0 2% 5% 6% 29% 50% 9% 0%
Tata 0 0 0 0 0 1 0 0% 0% 0% 0% 0% 100% 0%
Reliance 1 1 2 21 16 4 3 2% 2% 4% 44% 33% 8% 6%
Airtel 0 0 2 8 6 8 2 0% 0% 8% 31% 23% 31% 8%
TOTAL 2 4 8 48 55 19 5 1% 3% 6% 34% 39% 13% 4%
Source: IMM Analysis
Table C.25: Have you ever registered a complaint, in case the unsolicited call/SMS have not had not stopped in spite
of registration for the same?
Service In Number In Percentage
Provider Yes No Yes No
BSNL 15 585 3% 98%
Tata 0 167 0% 100%
Reliance 3 597 1% 100%
Airtel 2 598 0% 100%
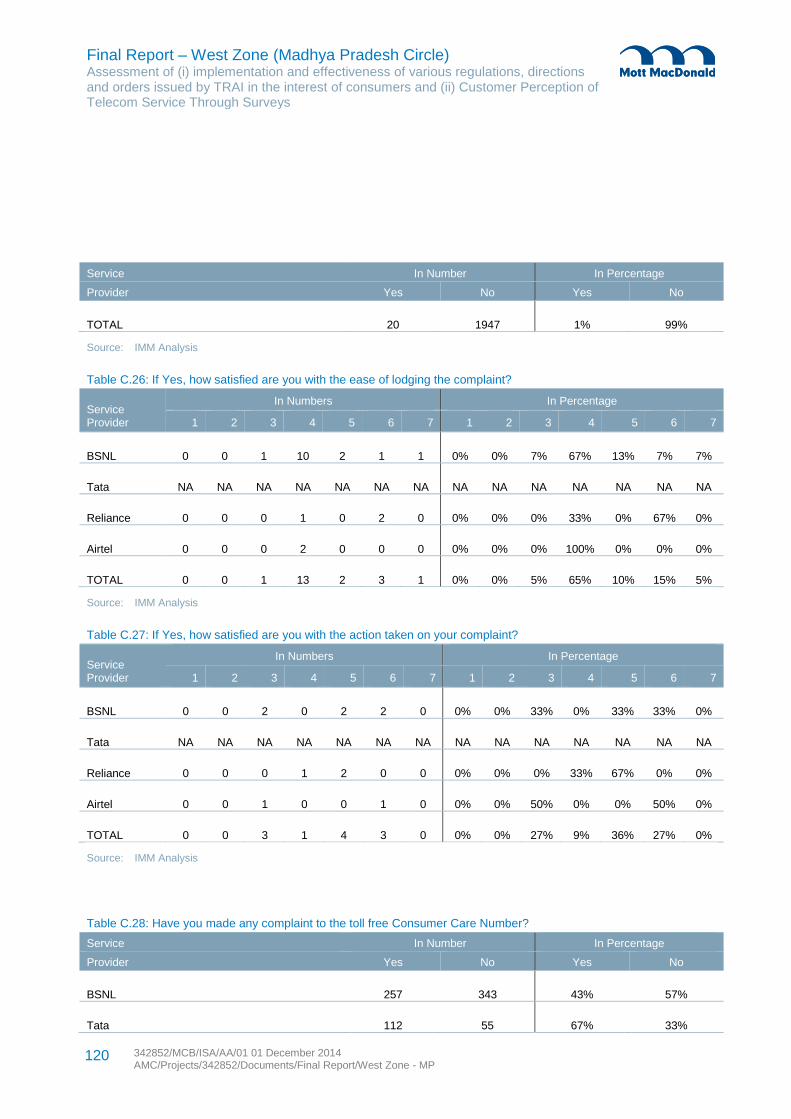
Final Report – West Zone (Madhya Pradesh Circle) Assessment of (i) implementation and effectiveness of various regulations, directions and orders issued by TRAI in the interest of consumers and (ii) Customer Perception of Telecom Service Through Surveys
342852/MCB/ISA/AA/01 01 December 2014 AMC/Projects/342852/Documents/Final Report/West Zone - MP
120
Service In Number In Percentage
Provider Yes No Yes No
TOTAL 20 1947 1% 99%
Source: IMM Analysis
Table C.26: If Yes, how satisfied are you with the ease of lodging the complaint?
Service Provider
In Numbers In Percentage
1 2 3 4 5 6 7 1 2 3 4 5 6 7
BSNL 0 0 1 10 2 1 1 0% 0% 7% 67% 13% 7% 7%
Tata NA NA NA NA NA NA NA NA NA NA NA NA NA NA
Reliance 0 0 0 1 0 2 0 0% 0% 0% 33% 0% 67% 0%
Airtel 0 0 0 2 0 0 0 0% 0% 0% 100% 0% 0% 0%
TOTAL 0 0 1 13 2 3 1 0% 0% 5% 65% 10% 15% 5%
Source: IMM Analysis
Table C.27: If Yes, how satisfied are you with the action taken on your complaint?
Service Provider
In Numbers In Percentage
1 2 3 4 5 6 7 1 2 3 4 5 6 7
BSNL 0 0 2 0 2 2 0 0% 0% 33% 0% 33% 33% 0%
Tata NA NA NA NA NA NA NA NA NA NA NA NA NA NA
Reliance 0 0 0 1 2 0 0 0% 0% 0% 33% 67% 0% 0%
Airtel 0 0 1 0 0 1 0 0% 0% 50% 0% 0% 50% 0%
TOTAL 0 0 3 1 4 3 0 0% 0% 27% 9% 36% 27% 0%
Source: IMM Analysis
Table C.28: Have you made any complaint to the toll free Consumer Care Number?
Service In Number In Percentage
Provider Yes No Yes No
BSNL 257 343 43% 57%
Tata 112 55 67% 33%
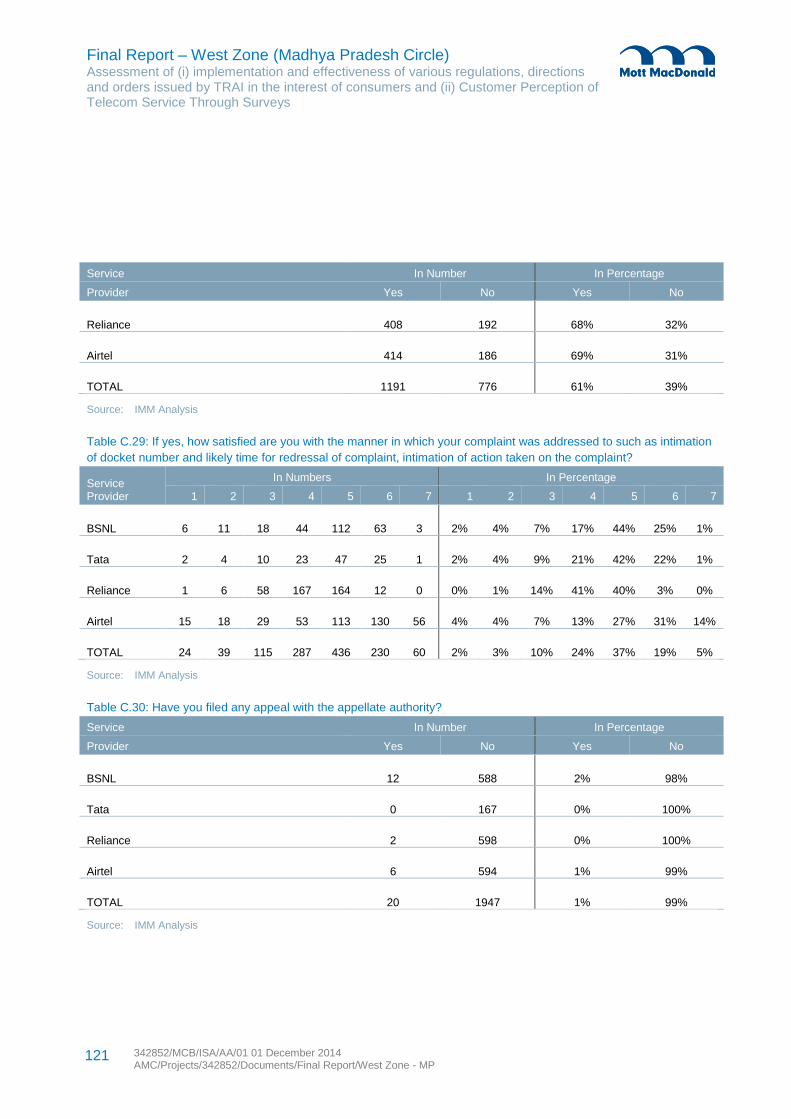
Final Report – West Zone (Madhya Pradesh Circle) Assessment of (i) implementation and effectiveness of various regulations, directions and orders issued by TRAI in the interest of consumers and (ii) Customer Perception of Telecom Service Through Surveys
342852/MCB/ISA/AA/01 01 December 2014 AMC/Projects/342852/Documents/Final Report/West Zone - MP
121
Service In Number In Percentage
Provider Yes No Yes No
Reliance 408 192 68% 32%
Airtel 414 186 69% 31%
TOTAL 1191 776 61% 39%
Source: IMM Analysis
Table C.29: If yes, how satisfied are you with the manner in which your complaint was addressed to such as intimation
of docket number and likely time for redressal of complaint, intimation of action taken on the complaint?
Service Provider
In Numbers In Percentage
1 2 3 4 5 6 7 1 2 3 4 5 6 7
BSNL 6 11 18 44 112 63 3 2% 4% 7% 17% 44% 25% 1%
Tata 2 4 10 23 47 25 1 2% 4% 9% 21% 42% 22% 1%
Reliance 1 6 58 167 164 12 0 0% 1% 14% 41% 40% 3% 0%
Airtel 15 18 29 53 113 130 56 4% 4% 7% 13% 27% 31% 14%
TOTAL 24 39 115 287 436 230 60 2% 3% 10% 24% 37% 19% 5%
Source: IMM Analysis
Table C.30: Have you filed any appeal with the appellate authority?
Service In Number In Percentage
Provider Yes No Yes No
BSNL 12 588 2% 98%
Tata 0 167 0% 100%
Reliance 2 598 0% 100%
Airtel 6 594 1% 99%
TOTAL 20 1947 1% 99%
Source: IMM Analysis
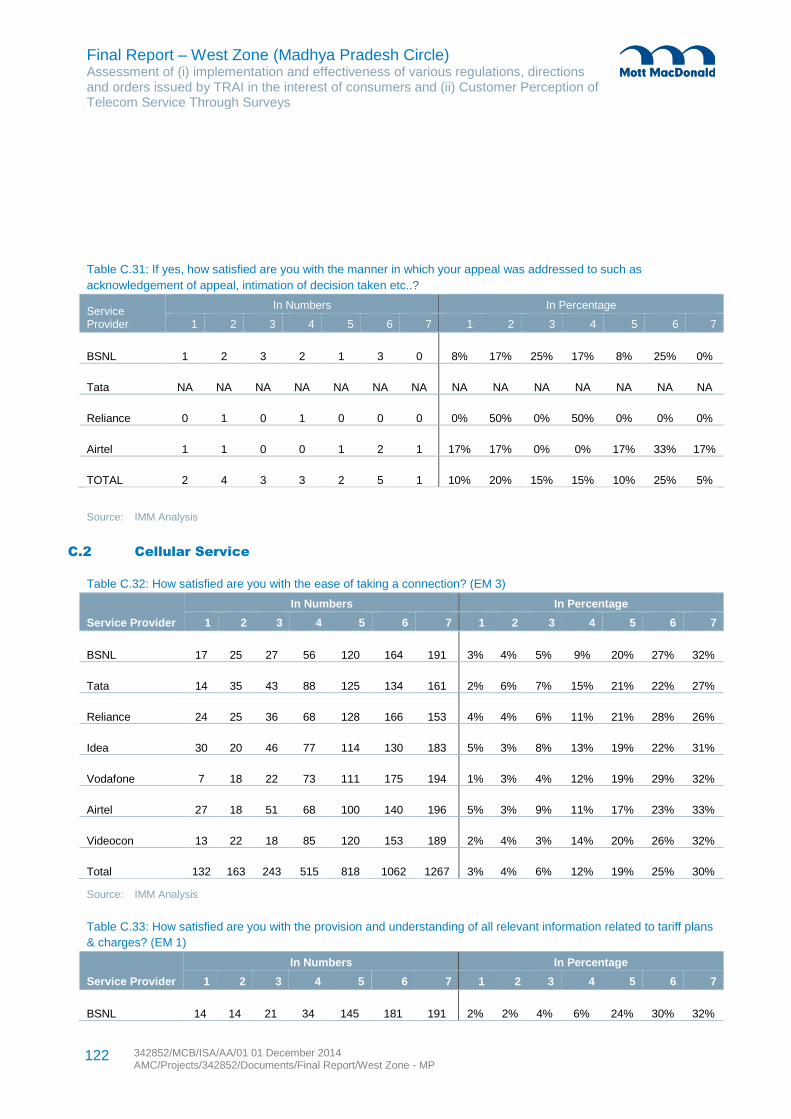
Final Report – West Zone (Madhya Pradesh Circle) Assessment of (i) implementation and effectiveness of various regulations, directions and orders issued by TRAI in the interest of consumers and (ii) Customer Perception of Telecom Service Through Surveys
342852/MCB/ISA/AA/01 01 December 2014 AMC/Projects/342852/Documents/Final Report/West Zone - MP
122
Table C.31: If yes, how satisfied are you with the manner in which your appeal was addressed to such as
acknowledgement of appeal, intimation of decision taken etc..?
Service Provider
In Numbers In Percentage
1 2 3 4 5 6 7 1 2 3 4 5 6 7
BSNL 1 2 3 2 1 3 0 8% 17% 25% 17% 8% 25% 0%
Tata NA NA NA NA NA NA NA NA NA NA NA NA NA NA
Reliance 0 1 0 1 0 0 0 0% 50% 0% 50% 0% 0% 0%
Airtel 1 1 0 0 1 2 1 17% 17% 0% 0% 17% 33% 17%
TOTAL 2 4 3 3 2 5 1 10% 20% 15% 15% 10% 25% 5%
Source: IMM Analysis
C.2 Cellular Service
Table C.32: How satisfied are you with the ease of taking a connection? (EM 3)
Service Provider
In Numbers In Percentage
1 2 3 4 5 6 7 1 2 3 4 5 6 7
BSNL 17 25 27 56 120 164 191 3% 4% 5% 9% 20% 27% 32%
Tata 14 35 43 88 125 134 161 2% 6% 7% 15% 21% 22% 27%
Reliance 24 25 36 68 128 166 153 4% 4% 6% 11% 21% 28% 26%
Idea 30 20 46 77 114 130 183 5% 3% 8% 13% 19% 22% 31%
Vodafone 7 18 22 73 111 175 194 1% 3% 4% 12% 19% 29% 32%
Airtel 27 18 51 68 100 140 196 5% 3% 9% 11% 17% 23% 33%
Videocon 13 22 18 85 120 153 189 2% 4% 3% 14% 20% 26% 32%
Total 132 163 243 515 818 1062 1267 3% 4% 6% 12% 19% 25% 30%
Source: IMM Analysis
Table C.33: How satisfied are you with the provision and understanding of all relevant information related to tariff plans
& charges? (EM 1)
Service Provider
In Numbers In Percentage
1 2 3 4 5 6 7 1 2 3 4 5 6 7
BSNL 14 14 21 34 145 181 191 2% 2% 4% 6% 24% 30% 32%
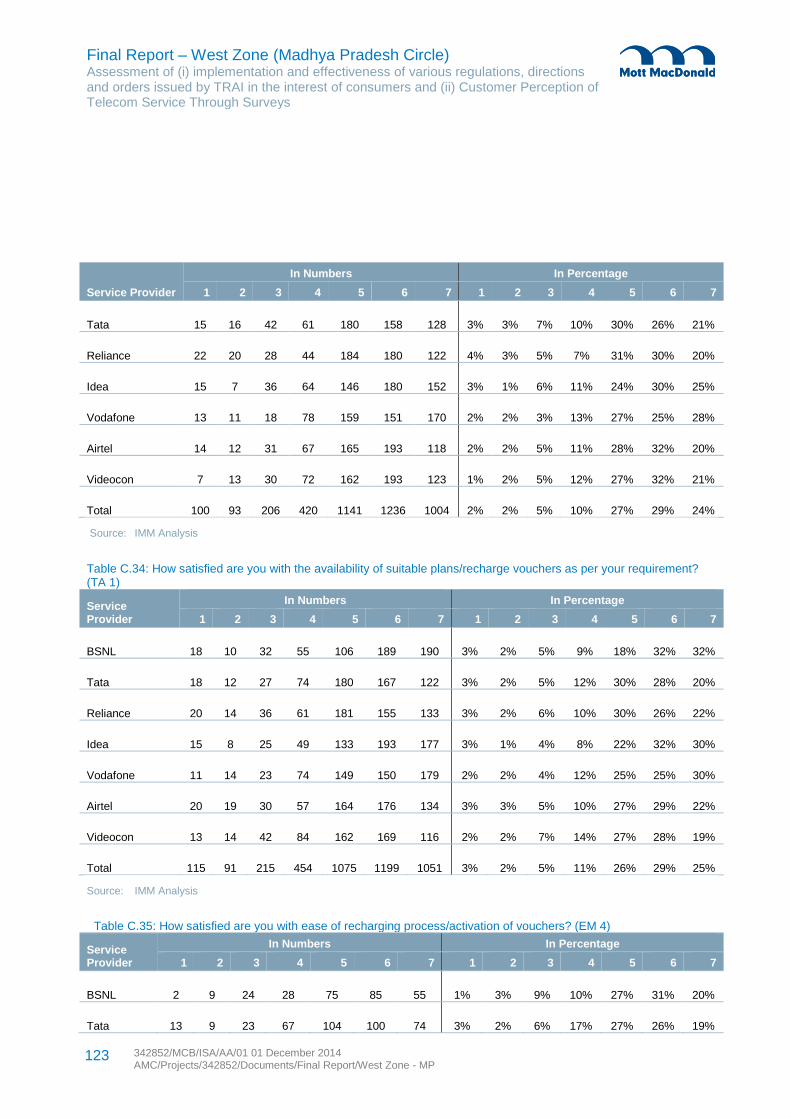
Final Report – West Zone (Madhya Pradesh Circle) Assessment of (i) implementation and effectiveness of various regulations, directions and orders issued by TRAI in the interest of consumers and (ii) Customer Perception of Telecom Service Through Surveys
342852/MCB/ISA/AA/01 01 December 2014 AMC/Projects/342852/Documents/Final Report/West Zone - MP
123
Service Provider
In Numbers In Percentage
1 2 3 4 5 6 7 1 2 3 4 5 6 7
Tata 15 16 42 61 180 158 128 3% 3% 7% 10% 30% 26% 21%
Reliance 22 20 28 44 184 180 122 4% 3% 5% 7% 31% 30% 20%
Idea 15 7 36 64 146 180 152 3% 1% 6% 11% 24% 30% 25%
Vodafone 13 11 18 78 159 151 170 2% 2% 3% 13% 27% 25% 28%
Airtel 14 12 31 67 165 193 118 2% 2% 5% 11% 28% 32% 20%
Videocon 7 13 30 72 162 193 123 1% 2% 5% 12% 27% 32% 21%
Total 100 93 206 420 1141 1236 1004 2% 2% 5% 10% 27% 29% 24%
Source: IMM Analysis
Table C.34: How satisfied are you with the availability of suitable plans/recharge vouchers as per your requirement? (TA 1)
Service Provider
In Numbers In Percentage
1 2 3 4 5 6 7 1 2 3 4 5 6 7
BSNL 18 10 32 55 106 189 190 3% 2% 5% 9% 18% 32% 32%
Tata 18 12 27 74 180 167 122 3% 2% 5% 12% 30% 28% 20%
Reliance 20 14 36 61 181 155 133 3% 2% 6% 10% 30% 26% 22%
Idea 15 8 25 49 133 193 177 3% 1% 4% 8% 22% 32% 30%
Vodafone 11 14 23 74 149 150 179 2% 2% 4% 12% 25% 25% 30%
Airtel 20 19 30 57 164 176 134 3% 3% 5% 10% 27% 29% 22%
Videocon 13 14 42 84 162 169 116 2% 2% 7% 14% 27% 28% 19%
Total 115 91 215 454 1075 1199 1051 3% 2% 5% 11% 26% 29% 25%
Source: IMM Analysis
Table C.35: How satisfied are you with ease of recharging process/activation of vouchers? (EM 4)
Service Provider
In Numbers In Percentage
1 2 3 4 5 6 7 1 2 3 4 5 6 7
BSNL 2 9 24 28 75 85 55 1% 3% 9% 10% 27% 31% 20%
Tata 13 9 23 67 104 100 74 3% 2% 6% 17% 27% 26% 19%
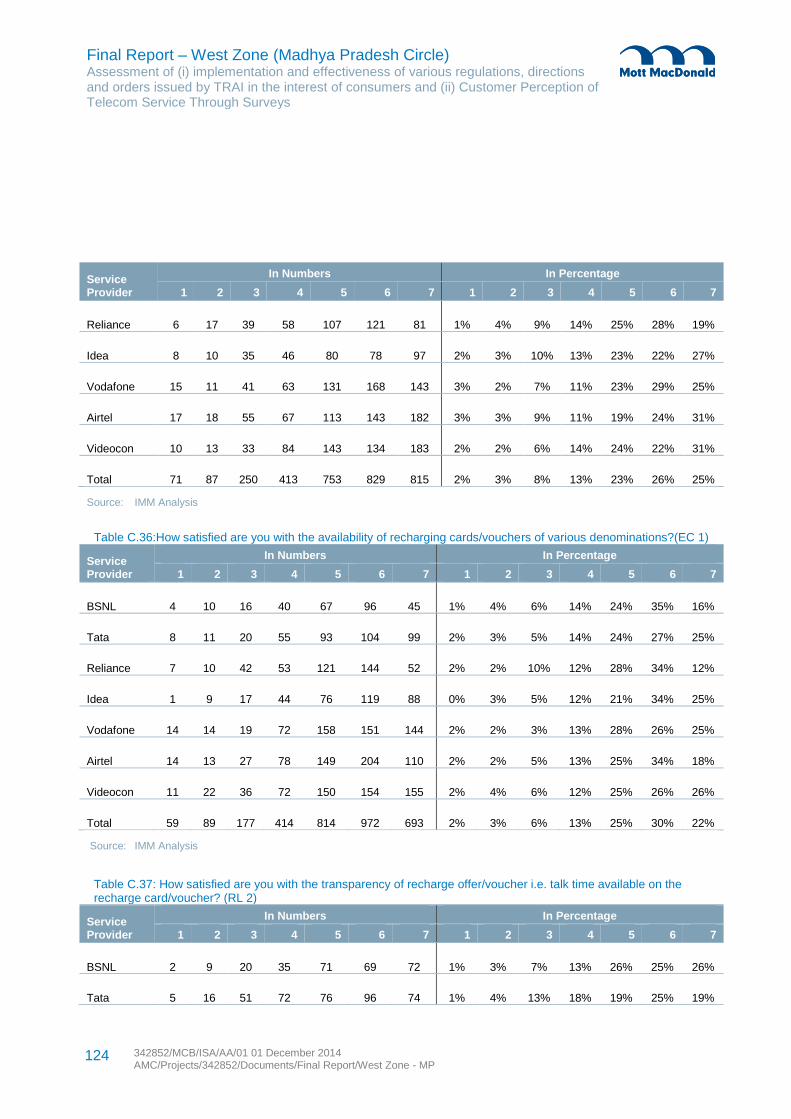
Final Report – West Zone (Madhya Pradesh Circle) Assessment of (i) implementation and effectiveness of various regulations, directions and orders issued by TRAI in the interest of consumers and (ii) Customer Perception of Telecom Service Through Surveys
342852/MCB/ISA/AA/01 01 December 2014 AMC/Projects/342852/Documents/Final Report/West Zone - MP
124
Service Provider
In Numbers In Percentage
1 2 3 4 5 6 7 1 2 3 4 5 6 7
Reliance 6 17 39 58 107 121 81 1% 4% 9% 14% 25% 28% 19%
Idea 8 10 35 46 80 78 97 2% 3% 10% 13% 23% 22% 27%
Vodafone 15 11 41 63 131 168 143 3% 2% 7% 11% 23% 29% 25%
Airtel 17 18 55 67 113 143 182 3% 3% 9% 11% 19% 24% 31%
Videocon 10 13 33 84 143 134 183 2% 2% 6% 14% 24% 22% 31%
Total 71 87 250 413 753 829 815 2% 3% 8% 13% 23% 26% 25%
Source: IMM Analysis
Table C.36:How satisfied are you with the availability of recharging cards/vouchers of various denominations?(EC 1)
Service Provider
In Numbers In Percentage
1 2 3 4 5 6 7 1 2 3 4 5 6 7
BSNL 4 10 16 40 67 96 45 1% 4% 6% 14% 24% 35% 16%
Tata 8 11 20 55 93 104 99 2% 3% 5% 14% 24% 27% 25%
Reliance 7 10 42 53 121 144 52 2% 2% 10% 12% 28% 34% 12%
Idea 1 9 17 44 76 119 88 0% 3% 5% 12% 21% 34% 25%
Vodafone 14 14 19 72 158 151 144 2% 2% 3% 13% 28% 26% 25%
Airtel 14 13 27 78 149 204 110 2% 2% 5% 13% 25% 34% 18%
Videocon 11 22 36 72 150 154 155 2% 4% 6% 12% 25% 26% 26%
Total 59 89 177 414 814 972 693 2% 3% 6% 13% 25% 30% 22%
Source: IMM Analysis
Table C.37: How satisfied are you with the transparency of recharge offer/voucher i.e. talk time available on the recharge card/voucher? (RL 2)
Service Provider
In Numbers In Percentage
1 2 3 4 5 6 7 1 2 3 4 5 6 7
BSNL 2 9 20 35 71 69 72 1% 3% 7% 13% 26% 25% 26%
Tata 5 16 51 72 76 96 74 1% 4% 13% 18% 19% 25% 19%
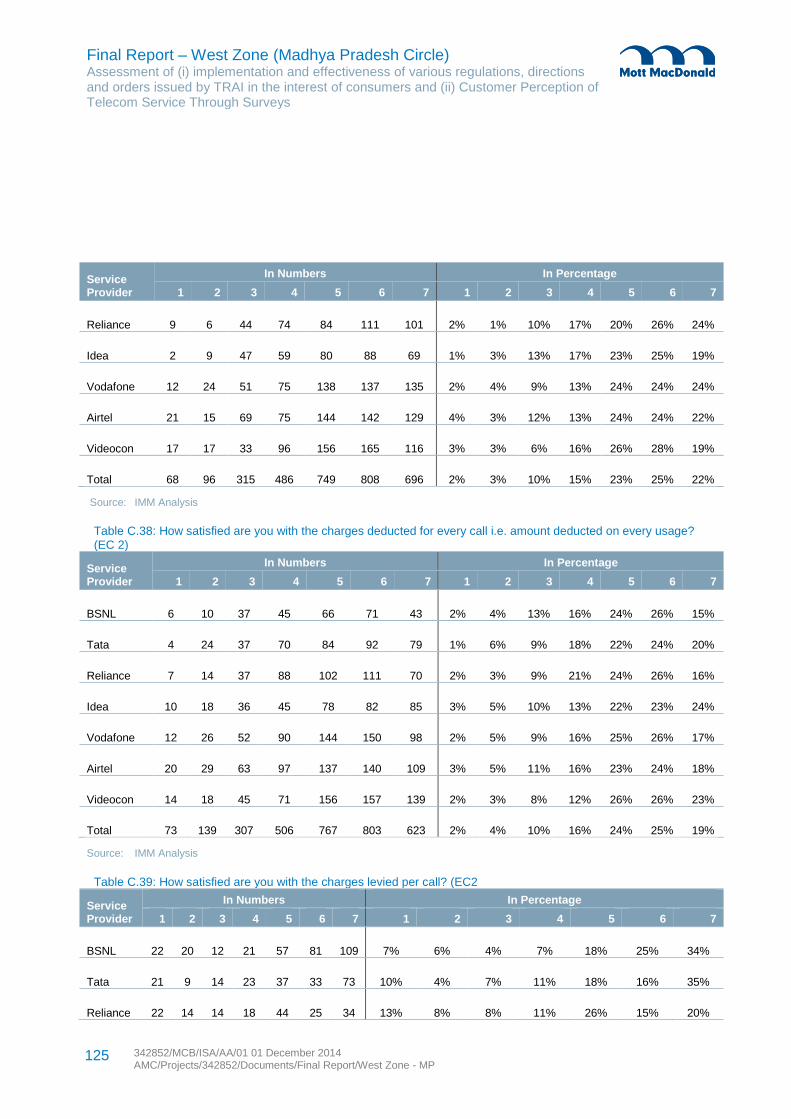
Final Report – West Zone (Madhya Pradesh Circle) Assessment of (i) implementation and effectiveness of various regulations, directions and orders issued by TRAI in the interest of consumers and (ii) Customer Perception of Telecom Service Through Surveys
342852/MCB/ISA/AA/01 01 December 2014 AMC/Projects/342852/Documents/Final Report/West Zone - MP
125
Service Provider
In Numbers In Percentage
1 2 3 4 5 6 7 1 2 3 4 5 6 7
Reliance 9 6 44 74 84 111 101 2% 1% 10% 17% 20% 26% 24%
Idea 2 9 47 59 80 88 69 1% 3% 13% 17% 23% 25% 19%
Vodafone 12 24 51 75 138 137 135 2% 4% 9% 13% 24% 24% 24%
Airtel 21 15 69 75 144 142 129 4% 3% 12% 13% 24% 24% 22%
Videocon 17 17 33 96 156 165 116 3% 3% 6% 16% 26% 28% 19%
Total 68 96 315 486 749 808 696 2% 3% 10% 15% 23% 25% 22%
Source: IMM Analysis
Table C.38: How satisfied are you with the charges deducted for every call i.e. amount deducted on every usage? (EC 2)
Service Provider
In Numbers In Percentage
1 2 3 4 5 6 7 1 2 3 4 5 6 7
BSNL 6 10 37 45 66 71 43 2% 4% 13% 16% 24% 26% 15%
Tata 4 24 37 70 84 92 79 1% 6% 9% 18% 22% 24% 20%
Reliance 7 14 37 88 102 111 70 2% 3% 9% 21% 24% 26% 16%
Idea 10 18 36 45 78 82 85 3% 5% 10% 13% 22% 23% 24%
Vodafone 12 26 52 90 144 150 98 2% 5% 9% 16% 25% 26% 17%
Airtel 20 29 63 97 137 140 109 3% 5% 11% 16% 23% 24% 18%
Videocon 14 18 45 71 156 157 139 2% 3% 8% 12% 26% 26% 23%
Total 73 139 307 506 767 803 623 2% 4% 10% 16% 24% 25% 19%
Source: IMM Analysis
Table C.39: How satisfied are you with the charges levied per call? (EC2
Service Provider
In Numbers In Percentage
1 2 3 4 5 6 7 1 2 3 4 5 6 7
BSNL 22 20 12 21 57 81 109 7% 6% 4% 7% 18% 25% 34%
Tata 21 9 14 23 37 33 73 10% 4% 7% 11% 18% 16% 35%
Reliance 22 14 14 18 44 25 34 13% 8% 8% 11% 26% 15% 20%
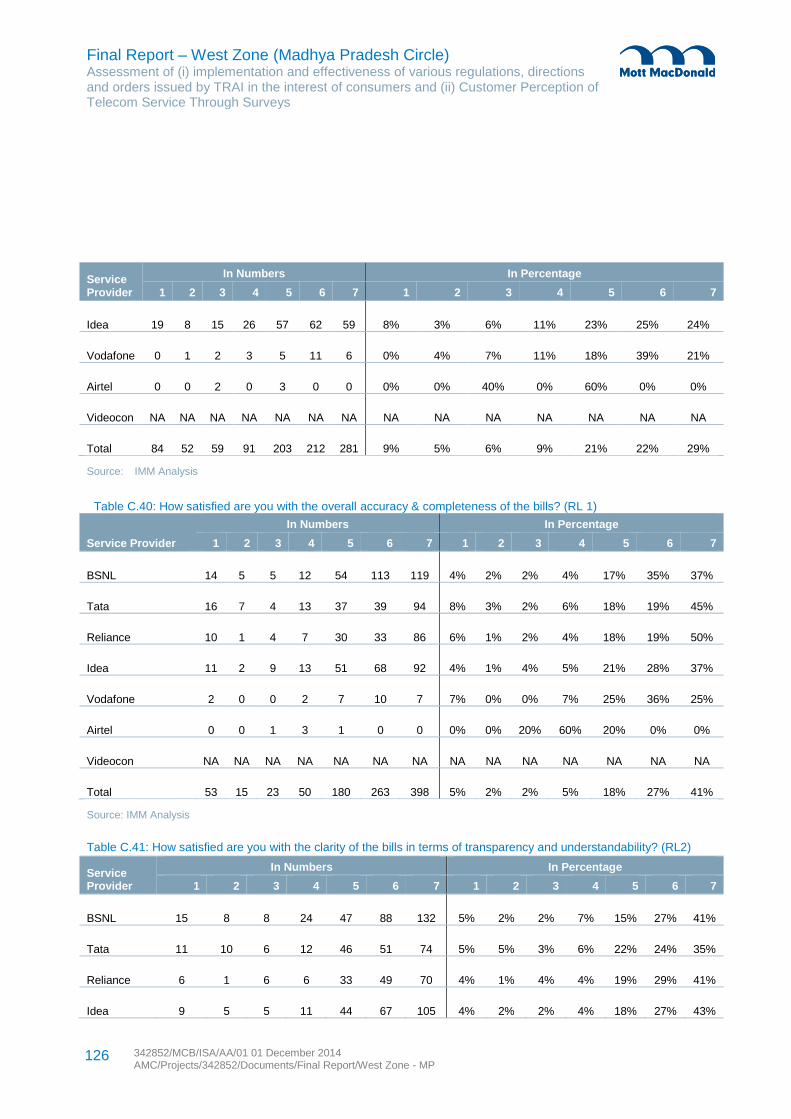
Final Report – West Zone (Madhya Pradesh Circle) Assessment of (i) implementation and effectiveness of various regulations, directions and orders issued by TRAI in the interest of consumers and (ii) Customer Perception of Telecom Service Through Surveys
342852/MCB/ISA/AA/01 01 December 2014 AMC/Projects/342852/Documents/Final Report/West Zone - MP
126
Service Provider
In Numbers In Percentage
1 2 3 4 5 6 7 1 2 3 4 5 6 7
Idea 19 8 15 26 57 62 59 8% 3% 6% 11% 23% 25% 24%
Vodafone 0 1 2 3 5 11 6 0% 4% 7% 11% 18% 39% 21%
Airtel 0 0 2 0 3 0 0 0% 0% 40% 0% 60% 0% 0%
Videocon NA NA NA NA NA NA NA NA NA NA NA NA NA NA
Total 84 52 59 91 203 212 281 9% 5% 6% 9% 21% 22% 29%
Source: IMM Analysis
Table C.40: How satisfied are you with the overall accuracy & completeness of the bills? (RL 1)
Service Provider
In Numbers In Percentage
1 2 3 4 5 6 7 1 2 3 4 5 6 7
BSNL 14 5 5 12 54 113 119 4% 2% 2% 4% 17% 35% 37%
Tata 16 7 4 13 37 39 94 8% 3% 2% 6% 18% 19% 45%
Reliance 10 1 4 7 30 33 86 6% 1% 2% 4% 18% 19% 50%
Idea 11 2 9 13 51 68 92 4% 1% 4% 5% 21% 28% 37%
Vodafone 2 0 0 2 7 10 7 7% 0% 0% 7% 25% 36% 25%
Airtel 0 0 1 3 1 0 0 0% 0% 20% 60% 20% 0% 0%
Videocon NA NA NA NA NA NA NA NA NA NA NA NA NA NA
Total 53 15 23 50 180 263 398 5% 2% 2% 5% 18% 27% 41%
Source: IMM Analysis
Table C.41: How satisfied are you with the clarity of the bills in terms of transparency and understandability? (RL2)
Service Provider
In Numbers In Percentage
1 2 3 4 5 6 7 1 2 3 4 5 6 7
BSNL 15 8 8 24 47 88 132 5% 2% 2% 7% 15% 27% 41%
Tata 11 10 6 12 46 51 74 5% 5% 3% 6% 22% 24% 35%
Reliance 6 1 6 6 33 49 70 4% 1% 4% 4% 19% 29% 41%
Idea 9 5 5 11 44 67 105 4% 2% 2% 4% 18% 27% 43%
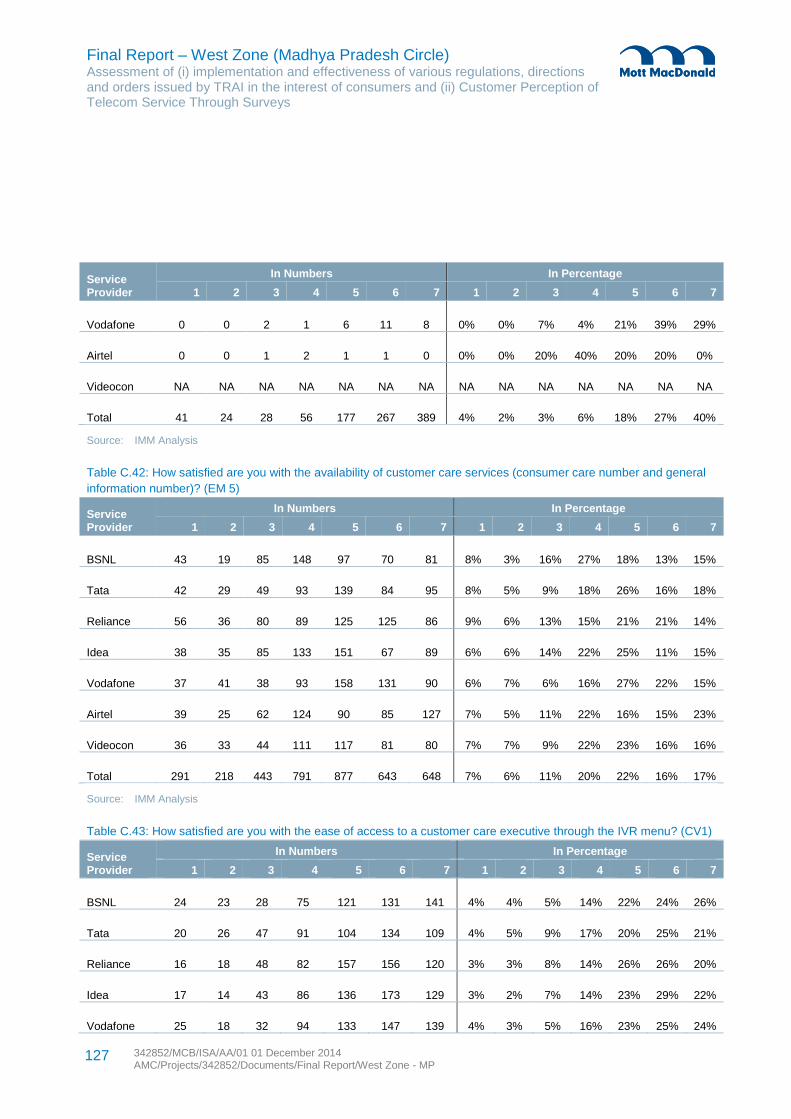
Final Report – West Zone (Madhya Pradesh Circle) Assessment of (i) implementation and effectiveness of various regulations, directions and orders issued by TRAI in the interest of consumers and (ii) Customer Perception of Telecom Service Through Surveys
342852/MCB/ISA/AA/01 01 December 2014 AMC/Projects/342852/Documents/Final Report/West Zone - MP
127
Service Provider
In Numbers In Percentage
1 2 3 4 5 6 7 1 2 3 4 5 6 7
Vodafone 0 0 2 1 6 11 8 0% 0% 7% 4% 21% 39% 29%
Airtel 0 0 1 2 1 1 0 0% 0% 20% 40% 20% 20% 0%
Videocon NA NA NA NA NA NA NA NA NA NA NA NA NA NA
Total 41 24 28 56 177 267 389 4% 2% 3% 6% 18% 27% 40%
Source: IMM Analysis
Table C.42: How satisfied are you with the availability of customer care services (consumer care number and general
information number)? (EM 5)
Service Provider
In Numbers In Percentage
1 2 3 4 5 6 7 1 2 3 4 5 6 7
BSNL 43 19 85 148 97 70 81 8% 3% 16% 27% 18% 13% 15%
Tata 42 29 49 93 139 84 95 8% 5% 9% 18% 26% 16% 18%
Reliance 56 36 80 89 125 125 86 9% 6% 13% 15% 21% 21% 14%
Idea 38 35 85 133 151 67 89 6% 6% 14% 22% 25% 11% 15%
Vodafone 37 41 38 93 158 131 90 6% 7% 6% 16% 27% 22% 15%
Airtel 39 25 62 124 90 85 127 7% 5% 11% 22% 16% 15% 23%
Videocon 36 33 44 111 117 81 80 7% 7% 9% 22% 23% 16% 16%
Total 291 218 443 791 877 643 648 7% 6% 11% 20% 22% 16% 17%
Source: IMM Analysis
Table C.43: How satisfied are you with the ease of access to a customer care executive through the IVR menu? (CV1)
Service Provider
In Numbers In Percentage
1 2 3 4 5 6 7 1 2 3 4 5 6 7
BSNL 24 23 28 75 121 131 141 4% 4% 5% 14% 22% 24% 26%
Tata 20 26 47 91 104 134 109 4% 5% 9% 17% 20% 25% 21%
Reliance 16 18 48 82 157 156 120 3% 3% 8% 14% 26% 26% 20%
Idea 17 14 43 86 136 173 129 3% 2% 7% 14% 23% 29% 22%
Vodafone 25 18 32 94 133 147 139 4% 3% 5% 16% 23% 25% 24%
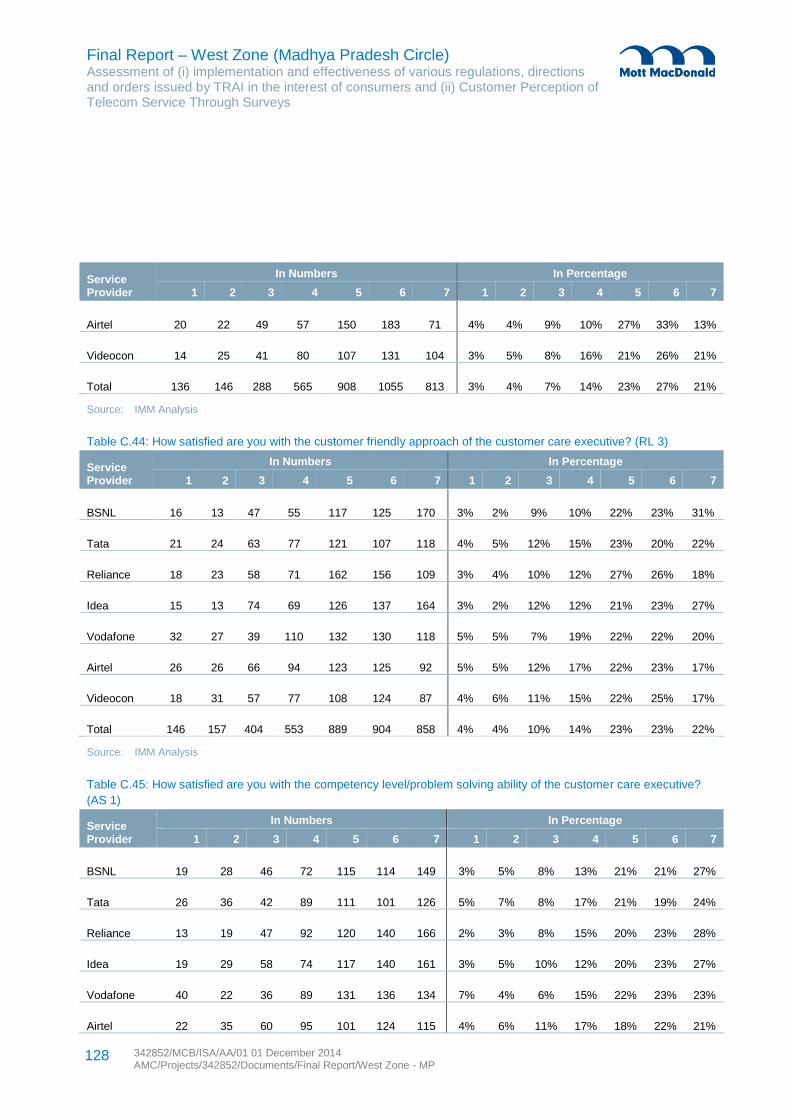
Final Report – West Zone (Madhya Pradesh Circle) Assessment of (i) implementation and effectiveness of various regulations, directions and orders issued by TRAI in the interest of consumers and (ii) Customer Perception of Telecom Service Through Surveys
342852/MCB/ISA/AA/01 01 December 2014 AMC/Projects/342852/Documents/Final Report/West Zone - MP
128
Service Provider
In Numbers In Percentage
1 2 3 4 5 6 7 1 2 3 4 5 6 7
Airtel 20 22 49 57 150 183 71 4% 4% 9% 10% 27% 33% 13%
Videocon 14 25 41 80 107 131 104 3% 5% 8% 16% 21% 26% 21%
Total 136 146 288 565 908 1055 813 3% 4% 7% 14% 23% 27% 21%
Source: IMM Analysis
Table C.44: How satisfied are you with the customer friendly approach of the customer care executive? (RL 3)
Service Provider
In Numbers In Percentage
1 2 3 4 5 6 7 1 2 3 4 5 6 7
BSNL 16 13 47 55 117 125 170 3% 2% 9% 10% 22% 23% 31%
Tata 21 24 63 77 121 107 118 4% 5% 12% 15% 23% 20% 22%
Reliance 18 23 58 71 162 156 109 3% 4% 10% 12% 27% 26% 18%
Idea 15 13 74 69 126 137 164 3% 2% 12% 12% 21% 23% 27%
Vodafone 32 27 39 110 132 130 118 5% 5% 7% 19% 22% 22% 20%
Airtel 26 26 66 94 123 125 92 5% 5% 12% 17% 22% 23% 17%
Videocon 18 31 57 77 108 124 87 4% 6% 11% 15% 22% 25% 17%
Total 146 157 404 553 889 904 858 4% 4% 10% 14% 23% 23% 22%
Source: IMM Analysis
Table C.45: How satisfied are you with the competency level/problem solving ability of the customer care executive?
(AS 1)
Service Provider
In Numbers In Percentage
1 2 3 4 5 6 7 1 2 3 4 5 6 7
BSNL 19 28 46 72 115 114 149 3% 5% 8% 13% 21% 21% 27%
Tata 26 36 42 89 111 101 126 5% 7% 8% 17% 21% 19% 24%
Reliance 13 19 47 92 120 140 166 2% 3% 8% 15% 20% 23% 28%
Idea 19 29 58 74 117 140 161 3% 5% 10% 12% 20% 23% 27%
Vodafone 40 22 36 89 131 136 134 7% 4% 6% 15% 22% 23% 23%
Airtel 22 35 60 95 101 124 115 4% 6% 11% 17% 18% 22% 21%
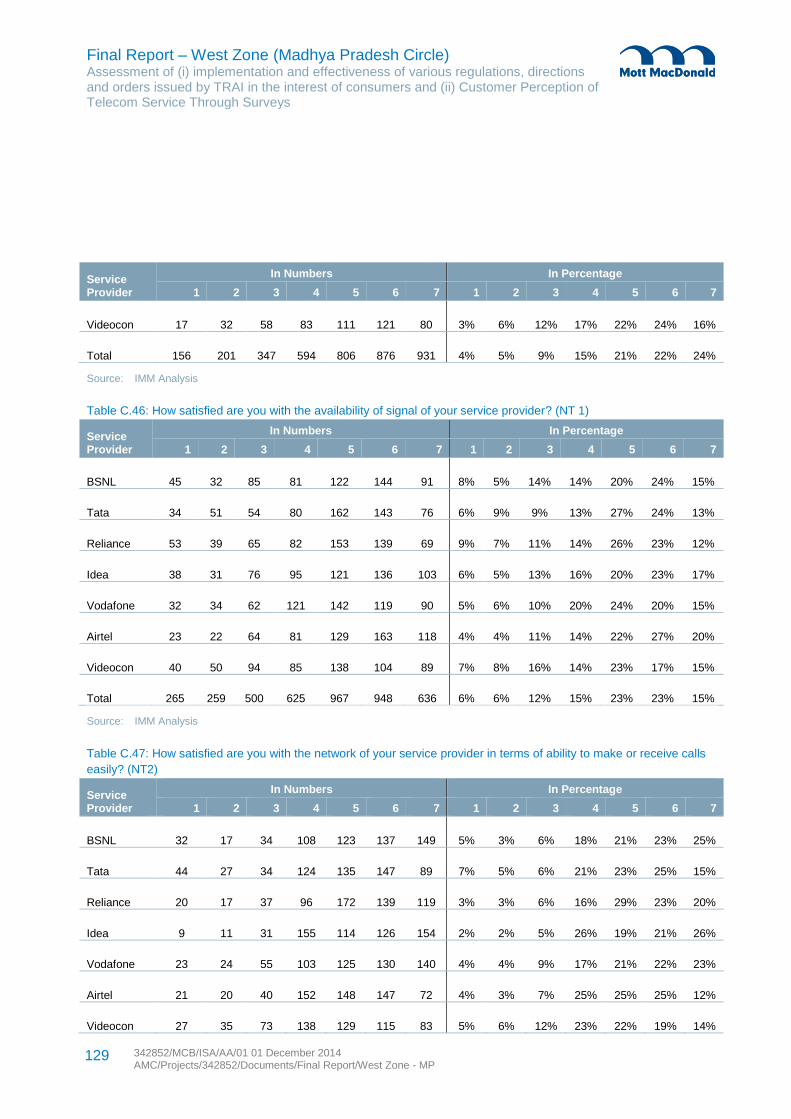
Final Report – West Zone (Madhya Pradesh Circle) Assessment of (i) implementation and effectiveness of various regulations, directions and orders issued by TRAI in the interest of consumers and (ii) Customer Perception of Telecom Service Through Surveys
342852/MCB/ISA/AA/01 01 December 2014 AMC/Projects/342852/Documents/Final Report/West Zone - MP
129
Service Provider
In Numbers In Percentage
1 2 3 4 5 6 7 1 2 3 4 5 6 7
Videocon 17 32 58 83 111 121 80 3% 6% 12% 17% 22% 24% 16%
Total 156 201 347 594 806 876 931 4% 5% 9% 15% 21% 22% 24%
Source: IMM Analysis
Table C.46: How satisfied are you with the availability of signal of your service provider? (NT 1)
Service Provider
In Numbers In Percentage
1 2 3 4 5 6 7 1 2 3 4 5 6 7
BSNL 45 32 85 81 122 144 91 8% 5% 14% 14% 20% 24% 15%
Tata 34 51 54 80 162 143 76 6% 9% 9% 13% 27% 24% 13%
Reliance 53 39 65 82 153 139 69 9% 7% 11% 14% 26% 23% 12%
Idea 38 31 76 95 121 136 103 6% 5% 13% 16% 20% 23% 17%
Vodafone 32 34 62 121 142 119 90 5% 6% 10% 20% 24% 20% 15%
Airtel 23 22 64 81 129 163 118 4% 4% 11% 14% 22% 27% 20%
Videocon 40 50 94 85 138 104 89 7% 8% 16% 14% 23% 17% 15%
Total 265 259 500 625 967 948 636 6% 6% 12% 15% 23% 23% 15%
Source: IMM Analysis
Table C.47: How satisfied are you with the network of your service provider in terms of ability to make or receive calls
easily? (NT2)
Service Provider
In Numbers In Percentage
1 2 3 4 5 6 7 1 2 3 4 5 6 7
BSNL 32 17 34 108 123 137 149 5% 3% 6% 18% 21% 23% 25%
Tata 44 27 34 124 135 147 89 7% 5% 6% 21% 23% 25% 15%
Reliance 20 17 37 96 172 139 119 3% 3% 6% 16% 29% 23% 20%
Idea 9 11 31 155 114 126 154 2% 2% 5% 26% 19% 21% 26%
Vodafone 23 24 55 103 125 130 140 4% 4% 9% 17% 21% 22% 23%
Airtel 21 20 40 152 148 147 72 4% 3% 7% 25% 25% 25% 12%
Videocon 27 35 73 138 129 115 83 5% 6% 12% 23% 22% 19% 14%
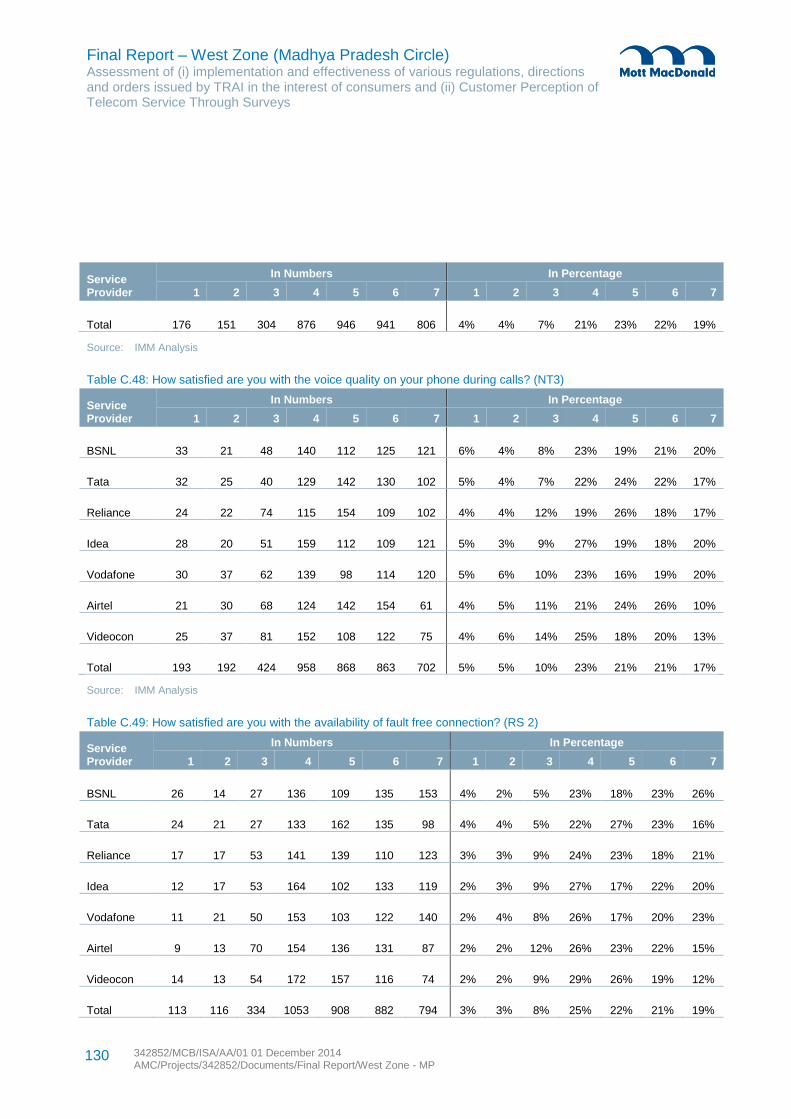
Final Report – West Zone (Madhya Pradesh Circle) Assessment of (i) implementation and effectiveness of various regulations, directions and orders issued by TRAI in the interest of consumers and (ii) Customer Perception of Telecom Service Through Surveys
342852/MCB/ISA/AA/01 01 December 2014 AMC/Projects/342852/Documents/Final Report/West Zone - MP
130
Service Provider
In Numbers In Percentage
1 2 3 4 5 6 7 1 2 3 4 5 6 7
Total 176 151 304 876 946 941 806 4% 4% 7% 21% 23% 22% 19%
Source: IMM Analysis
Table C.48: How satisfied are you with the voice quality on your phone during calls? (NT3)
Service Provider
In Numbers In Percentage
1 2 3 4 5 6 7 1 2 3 4 5 6 7
BSNL 33 21 48 140 112 125 121 6% 4% 8% 23% 19% 21% 20%
Tata 32 25 40 129 142 130 102 5% 4% 7% 22% 24% 22% 17%
Reliance 24 22 74 115 154 109 102 4% 4% 12% 19% 26% 18% 17%
Idea 28 20 51 159 112 109 121 5% 3% 9% 27% 19% 18% 20%
Vodafone 30 37 62 139 98 114 120 5% 6% 10% 23% 16% 19% 20%
Airtel 21 30 68 124 142 154 61 4% 5% 11% 21% 24% 26% 10%
Videocon 25 37 81 152 108 122 75 4% 6% 14% 25% 18% 20% 13%
Total 193 192 424 958 868 863 702 5% 5% 10% 23% 21% 21% 17%
Source: IMM Analysis
Table C.49: How satisfied are you with the availability of fault free connection? (RS 2)
Service Provider
In Numbers In Percentage
1 2 3 4 5 6 7 1 2 3 4 5 6 7
BSNL 26 14 27 136 109 135 153 4% 2% 5% 23% 18% 23% 26%
Tata 24 21 27 133 162 135 98 4% 4% 5% 22% 27% 23% 16%
Reliance 17 17 53 141 139 110 123 3% 3% 9% 24% 23% 18% 21%
Idea 12 17 53 164 102 133 119 2% 3% 9% 27% 17% 22% 20%
Vodafone 11 21 50 153 103 122 140 2% 4% 8% 26% 17% 20% 23%
Airtel 9 13 70 154 136 131 87 2% 2% 12% 26% 23% 22% 15%
Videocon 14 13 54 172 157 116 74 2% 2% 9% 29% 26% 19% 12%
Total 113 116 334 1053 908 882 794 3% 3% 8% 25% 22% 21% 19%
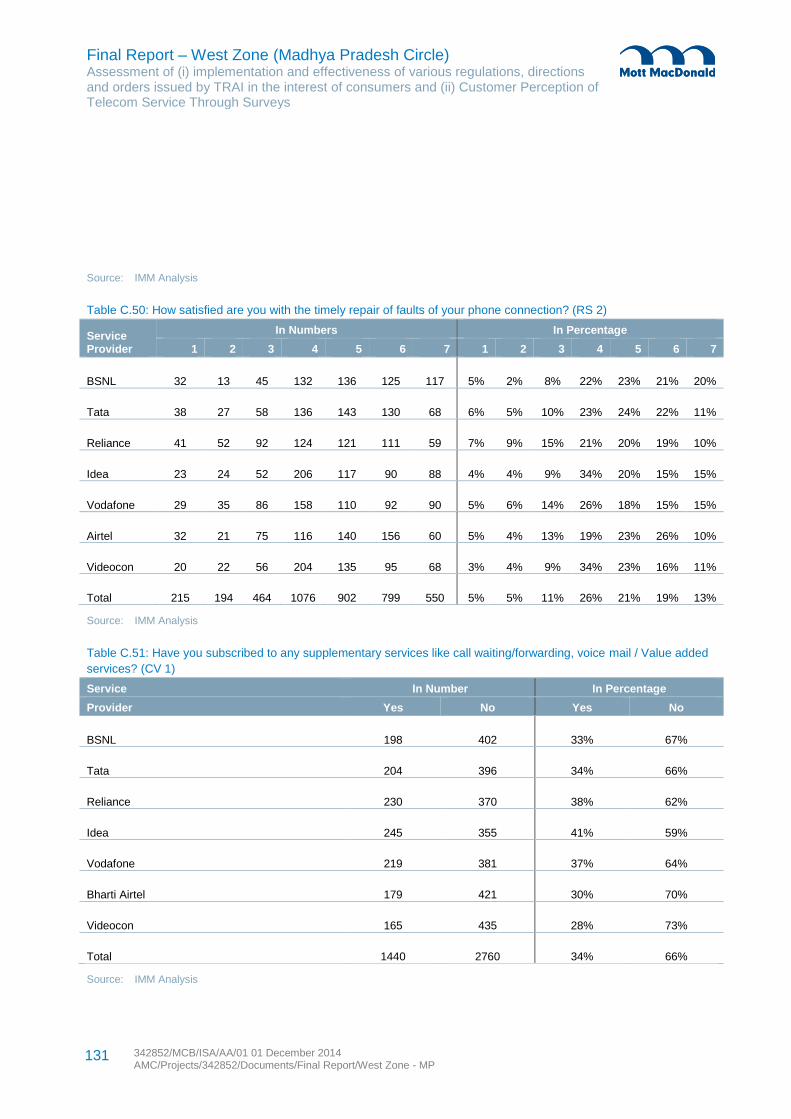
Final Report – West Zone (Madhya Pradesh Circle) Assessment of (i) implementation and effectiveness of various regulations, directions and orders issued by TRAI in the interest of consumers and (ii) Customer Perception of Telecom Service Through Surveys
342852/MCB/ISA/AA/01 01 December 2014 AMC/Projects/342852/Documents/Final Report/West Zone - MP
131
Source: IMM Analysis
Table C.50: How satisfied are you with the timely repair of faults of your phone connection? (RS 2)
Service Provider
In Numbers In Percentage
1 2 3 4 5 6 7 1 2 3 4 5 6 7
BSNL 32 13 45 132 136 125 117 5% 2% 8% 22% 23% 21% 20%
Tata 38 27 58 136 143 130 68 6% 5% 10% 23% 24% 22% 11%
Reliance 41 52 92 124 121 111 59 7% 9% 15% 21% 20% 19% 10%
Idea 23 24 52 206 117 90 88 4% 4% 9% 34% 20% 15% 15%
Vodafone 29 35 86 158 110 92 90 5% 6% 14% 26% 18% 15% 15%
Airtel 32 21 75 116 140 156 60 5% 4% 13% 19% 23% 26% 10%
Videocon 20 22 56 204 135 95 68 3% 4% 9% 34% 23% 16% 11%
Total 215 194 464 1076 902 799 550 5% 5% 11% 26% 21% 19% 13%
Source: IMM Analysis
Table C.51: Have you subscribed to any supplementary services like call waiting/forwarding, voice mail / Value added
services? (CV 1)
Service In Number In Percentage
Provider Yes No Yes No
BSNL 198 402 33% 67%
Tata 204 396 34% 66%
Reliance 230 370 38% 62%
Idea 245 355 41% 59%
Vodafone 219 381 37% 64%
Bharti Airtel 179 421 30% 70%
Videocon 165 435 28% 73%
Total 1440 2760 34% 66%
Source: IMM Analysis
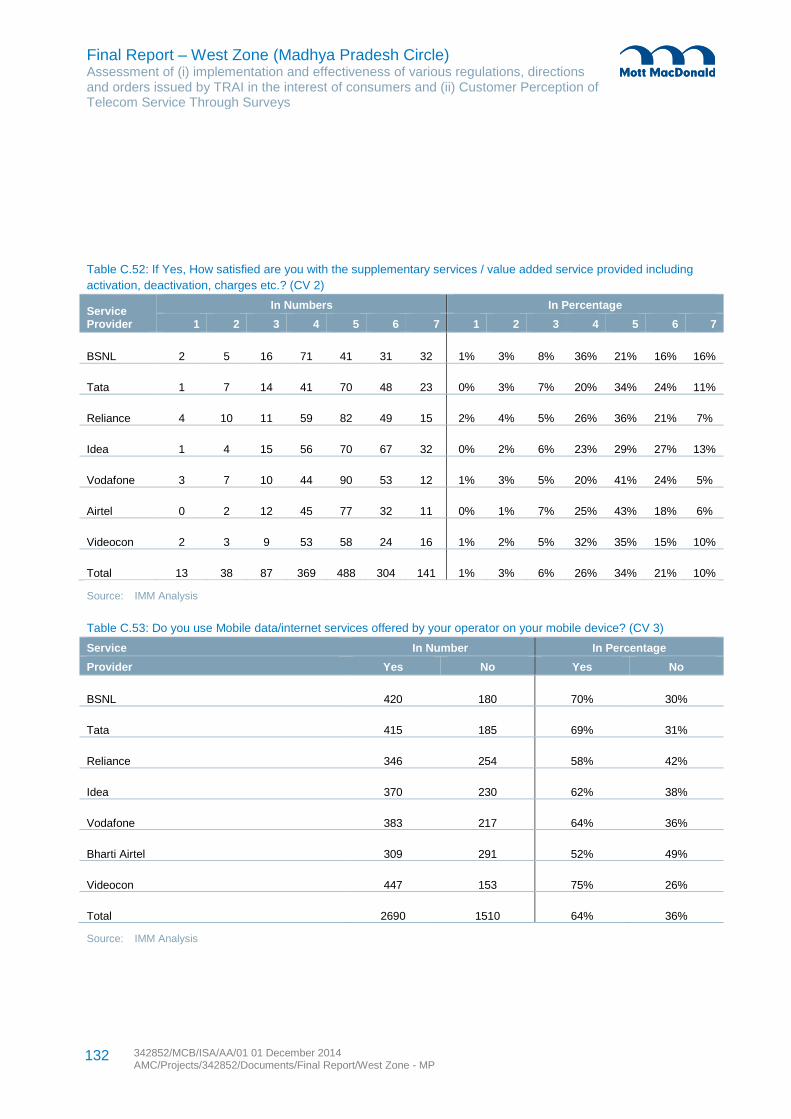
Final Report – West Zone (Madhya Pradesh Circle) Assessment of (i) implementation and effectiveness of various regulations, directions and orders issued by TRAI in the interest of consumers and (ii) Customer Perception of Telecom Service Through Surveys
342852/MCB/ISA/AA/01 01 December 2014 AMC/Projects/342852/Documents/Final Report/West Zone - MP
132
Table C.52: If Yes, How satisfied are you with the supplementary services / value added service provided including
activation, deactivation, charges etc.? (CV 2)
Service Provider
In Numbers In Percentage
1 2 3 4 5 6 7 1 2 3 4 5 6 7
BSNL 2 5 16 71 41 31 32 1% 3% 8% 36% 21% 16% 16%
Tata 1 7 14 41 70 48 23 0% 3% 7% 20% 34% 24% 11%
Reliance 4 10 11 59 82 49 15 2% 4% 5% 26% 36% 21% 7%
Idea 1 4 15 56 70 67 32 0% 2% 6% 23% 29% 27% 13%
Vodafone 3 7 10 44 90 53 12 1% 3% 5% 20% 41% 24% 5%
Airtel 0 2 12 45 77 32 11 0% 1% 7% 25% 43% 18% 6%
Videocon 2 3 9 53 58 24 16 1% 2% 5% 32% 35% 15% 10%
Total 13 38 87 369 488 304 141 1% 3% 6% 26% 34% 21% 10%
Source: IMM Analysis
Table C.53: Do you use Mobile data/internet services offered by your operator on your mobile device? (CV 3)
Service In Number In Percentage
Provider Yes No Yes No
BSNL 420 180 70% 30%
Tata 415 185 69% 31%
Reliance 346 254 58% 42%
Idea 370 230 62% 38%
Vodafone 383 217 64% 36%
Bharti Airtel 309 291 52% 49%
Videocon 447 153 75% 26%
Total 2690 1510 64% 36%
Source: IMM Analysis
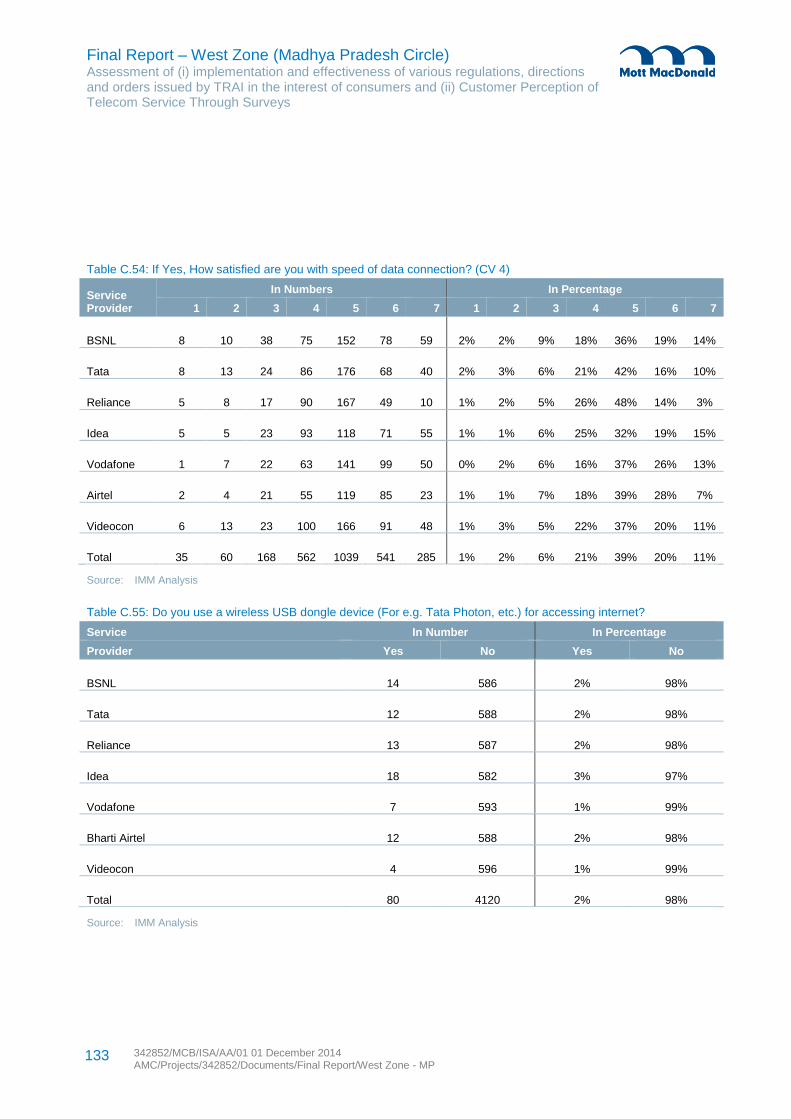
Final Report – West Zone (Madhya Pradesh Circle) Assessment of (i) implementation and effectiveness of various regulations, directions and orders issued by TRAI in the interest of consumers and (ii) Customer Perception of Telecom Service Through Surveys
342852/MCB/ISA/AA/01 01 December 2014 AMC/Projects/342852/Documents/Final Report/West Zone - MP
133
Table C.54: If Yes, How satisfied are you with speed of data connection? (CV 4)
Service Provider
In Numbers In Percentage
1 2 3 4 5 6 7 1 2 3 4 5 6 7
BSNL 8 10 38 75 152 78 59 2% 2% 9% 18% 36% 19% 14%
Tata 8 13 24 86 176 68 40 2% 3% 6% 21% 42% 16% 10%
Reliance 5 8 17 90 167 49 10 1% 2% 5% 26% 48% 14% 3%
Idea 5 5 23 93 118 71 55 1% 1% 6% 25% 32% 19% 15%
Vodafone 1 7 22 63 141 99 50 0% 2% 6% 16% 37% 26% 13%
Airtel 2 4 21 55 119 85 23 1% 1% 7% 18% 39% 28% 7%
Videocon 6 13 23 100 166 91 48 1% 3% 5% 22% 37% 20% 11%
Total 35 60 168 562 1039 541 285 1% 2% 6% 21% 39% 20% 11%
Source: IMM Analysis
Table C.55: Do you use a wireless USB dongle device (For e.g. Tata Photon, etc.) for accessing internet?
Service In Number In Percentage
Provider Yes No Yes No
BSNL 14 586 2% 98%
Tata 12 588 2% 98%
Reliance 13 587 2% 98%
Idea 18 582 3% 97%
Vodafone 7 593 1% 99%
Bharti Airtel 12 588 2% 98%
Videocon 4 596 1% 99%
Total 80 4120 2% 98%
Source: IMM Analysis
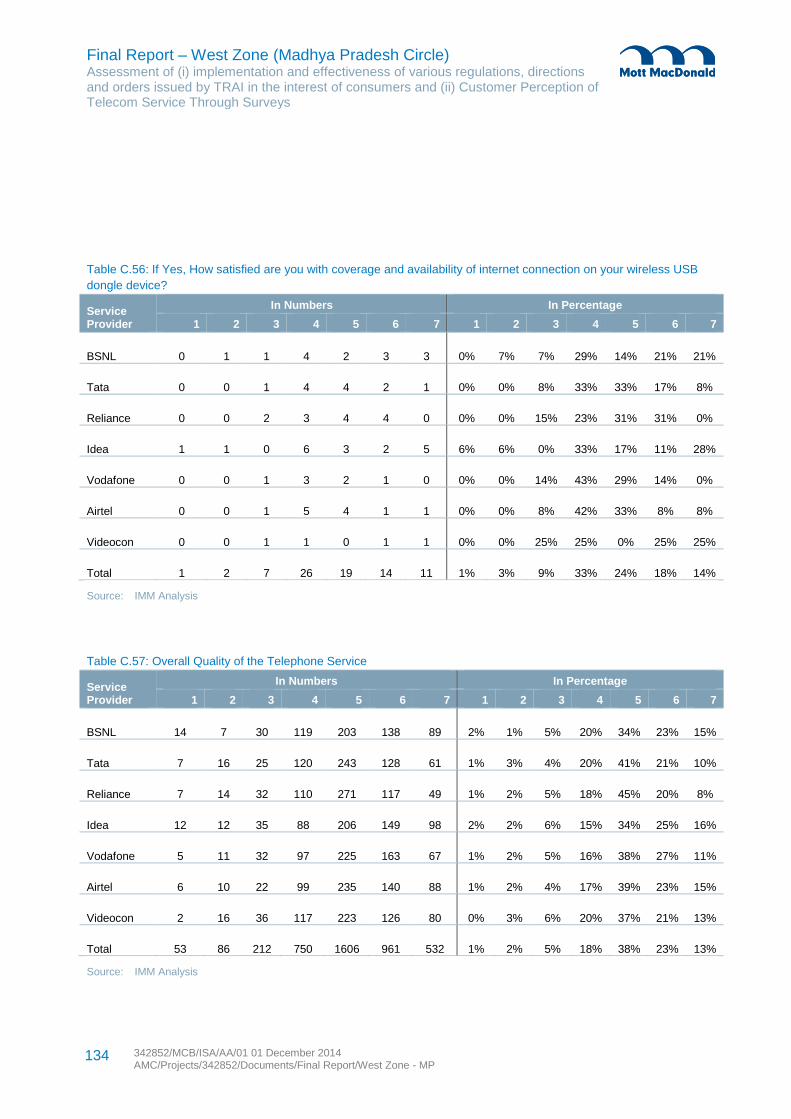
Final Report – West Zone (Madhya Pradesh Circle) Assessment of (i) implementation and effectiveness of various regulations, directions and orders issued by TRAI in the interest of consumers and (ii) Customer Perception of Telecom Service Through Surveys
342852/MCB/ISA/AA/01 01 December 2014 AMC/Projects/342852/Documents/Final Report/West Zone - MP
134
Table C.56: If Yes, How satisfied are you with coverage and availability of internet connection on your wireless USB
dongle device?
Service Provider
In Numbers In Percentage
1 2 3 4 5 6 7 1 2 3 4 5 6 7
BSNL 0 1 1 4 2 3 3 0% 7% 7% 29% 14% 21% 21%
Tata 0 0 1 4 4 2 1 0% 0% 8% 33% 33% 17% 8%
Reliance 0 0 2 3 4 4 0 0% 0% 15% 23% 31% 31% 0%
Idea 1 1 0 6 3 2 5 6% 6% 0% 33% 17% 11% 28%
Vodafone 0 0 1 3 2 1 0 0% 0% 14% 43% 29% 14% 0%
Airtel 0 0 1 5 4 1 1 0% 0% 8% 42% 33% 8% 8%
Videocon 0 0 1 1 0 1 1 0% 0% 25% 25% 0% 25% 25%
Total 1 2 7 26 19 14 11 1% 3% 9% 33% 24% 18% 14%
Source: IMM Analysis
Table C.57: Overall Quality of the Telephone Service
Service Provider
In Numbers In Percentage
1 2 3 4 5 6 7 1 2 3 4 5 6 7
BSNL 14 7 30 119 203 138 89 2% 1% 5% 20% 34% 23% 15%
Tata 7 16 25 120 243 128 61 1% 3% 4% 20% 41% 21% 10%
Reliance 7 14 32 110 271 117 49 1% 2% 5% 18% 45% 20% 8%
Idea 12 12 35 88 206 149 98 2% 2% 6% 15% 34% 25% 16%
Vodafone 5 11 32 97 225 163 67 1% 2% 5% 16% 38% 27% 11%
Airtel 6 10 22 99 235 140 88 1% 2% 4% 17% 39% 23% 15%
Videocon 2 16 36 117 223 126 80 0% 3% 6% 20% 37% 21% 13%
Total 53 86 212 750 1606 961 532 1% 2% 5% 18% 38% 23% 13%
Source: IMM Analysis
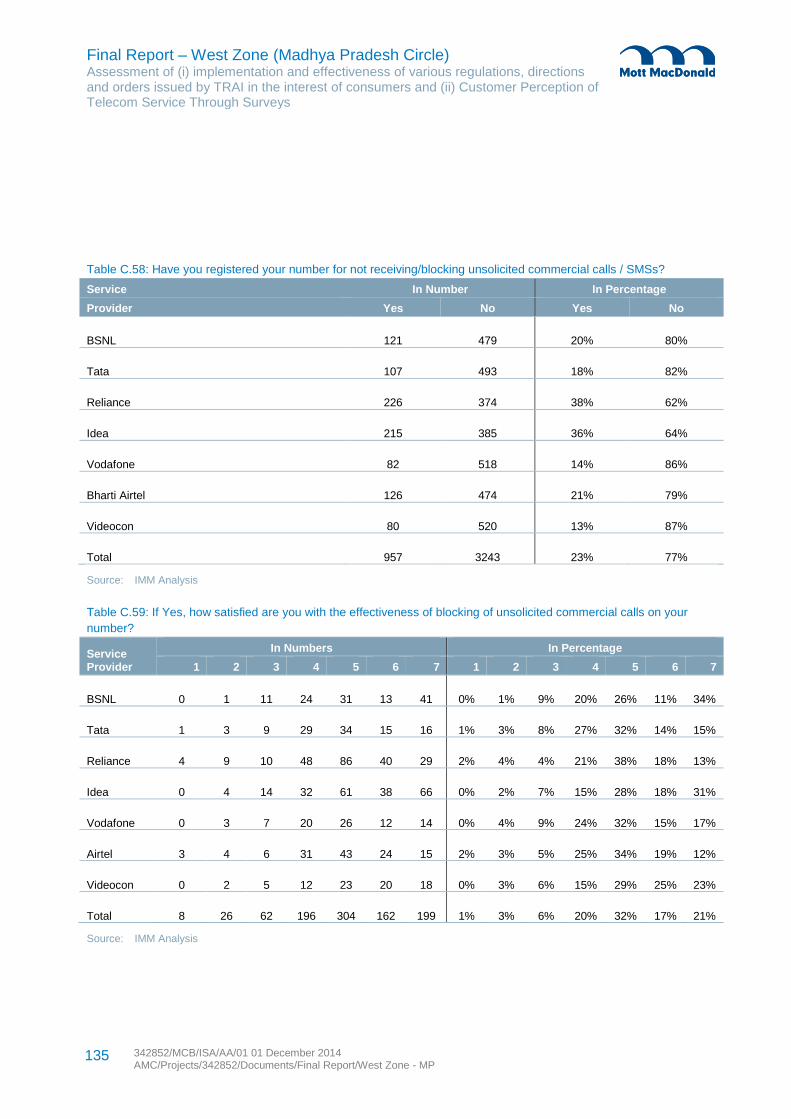
Final Report – West Zone (Madhya Pradesh Circle) Assessment of (i) implementation and effectiveness of various regulations, directions and orders issued by TRAI in the interest of consumers and (ii) Customer Perception of Telecom Service Through Surveys
342852/MCB/ISA/AA/01 01 December 2014 AMC/Projects/342852/Documents/Final Report/West Zone - MP
135
Table C.58: Have you registered your number for not receiving/blocking unsolicited commercial calls / SMSs?
Service In Number In Percentage
Provider Yes No Yes No
BSNL 121 479 20% 80%
Tata 107 493 18% 82%
Reliance 226 374 38% 62%
Idea 215 385 36% 64%
Vodafone 82 518 14% 86%
Bharti Airtel 126 474 21% 79%
Videocon 80 520 13% 87%
Total 957 3243 23% 77%
Source: IMM Analysis
Table C.59: If Yes, how satisfied are you with the effectiveness of blocking of unsolicited commercial calls on your
number?
Service Provider
In Numbers In Percentage
1 2 3 4 5 6 7 1 2 3 4 5 6 7
BSNL 0 1 11 24 31 13 41 0% 1% 9% 20% 26% 11% 34%
Tata 1 3 9 29 34 15 16 1% 3% 8% 27% 32% 14% 15%
Reliance 4 9 10 48 86 40 29 2% 4% 4% 21% 38% 18% 13%
Idea 0 4 14 32 61 38 66 0% 2% 7% 15% 28% 18% 31%
Vodafone 0 3 7 20 26 12 14 0% 4% 9% 24% 32% 15% 17%
Airtel 3 4 6 31 43 24 15 2% 3% 5% 25% 34% 19% 12%
Videocon 0 2 5 12 23 20 18 0% 3% 6% 15% 29% 25% 23%
Total 8 26 62 196 304 162 199 1% 3% 6% 20% 32% 17% 21%
Source: IMM Analysis
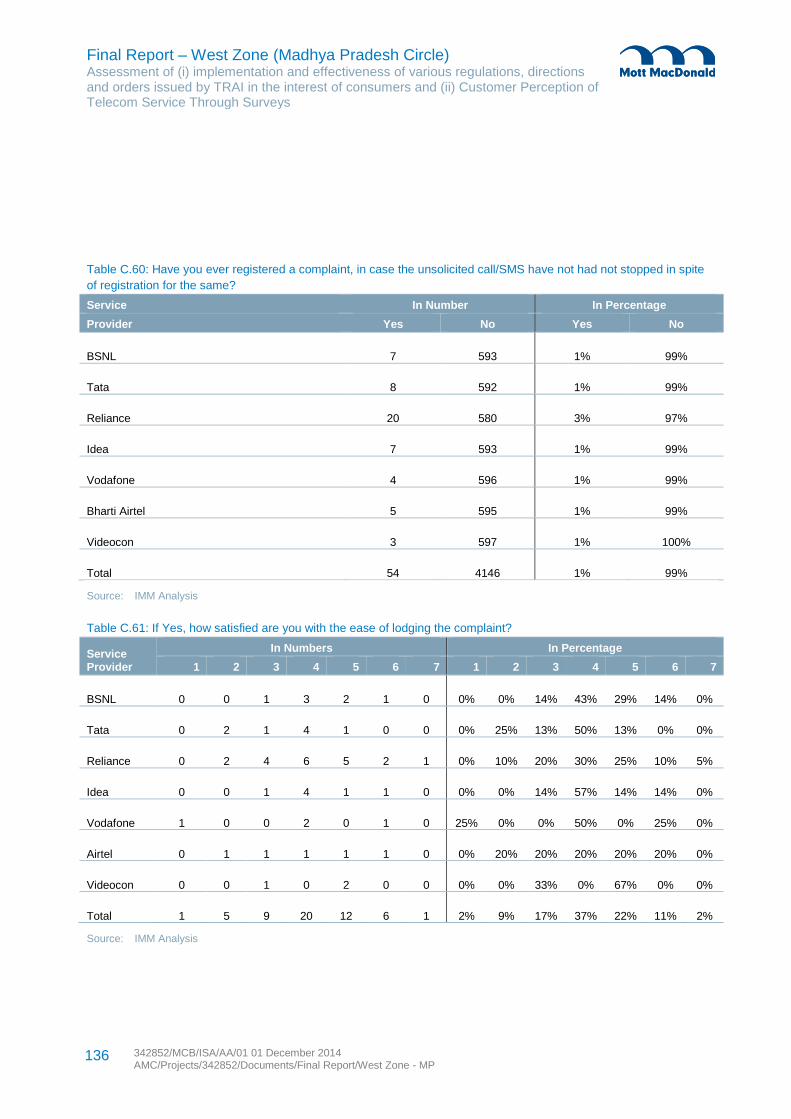
Final Report – West Zone (Madhya Pradesh Circle) Assessment of (i) implementation and effectiveness of various regulations, directions and orders issued by TRAI in the interest of consumers and (ii) Customer Perception of Telecom Service Through Surveys
342852/MCB/ISA/AA/01 01 December 2014 AMC/Projects/342852/Documents/Final Report/West Zone - MP
136
Table C.60: Have you ever registered a complaint, in case the unsolicited call/SMS have not had not stopped in spite
of registration for the same?
Service In Number In Percentage
Provider Yes No Yes No
BSNL 7 593 1% 99%
Tata 8 592 1% 99%
Reliance 20 580 3% 97%
Idea 7 593 1% 99%
Vodafone 4 596 1% 99%
Bharti Airtel 5 595 1% 99%
Videocon 3 597 1% 100%
Total 54 4146 1% 99%
Source: IMM Analysis
Table C.61: If Yes, how satisfied are you with the ease of lodging the complaint?
Service Provider
In Numbers In Percentage
1 2 3 4 5 6 7 1 2 3 4 5 6 7
BSNL 0 0 1 3 2 1 0 0% 0% 14% 43% 29% 14% 0%
Tata 0 2 1 4 1 0 0 0% 25% 13% 50% 13% 0% 0%
Reliance 0 2 4 6 5 2 1 0% 10% 20% 30% 25% 10% 5%
Idea 0 0 1 4 1 1 0 0% 0% 14% 57% 14% 14% 0%
Vodafone 1 0 0 2 0 1 0 25% 0% 0% 50% 0% 25% 0%
Airtel 0 1 1 1 1 1 0 0% 20% 20% 20% 20% 20% 0%
Videocon 0 0 1 0 2 0 0 0% 0% 33% 0% 67% 0% 0%
Total 1 5 9 20 12 6 1 2% 9% 17% 37% 22% 11% 2%
Source: IMM Analysis
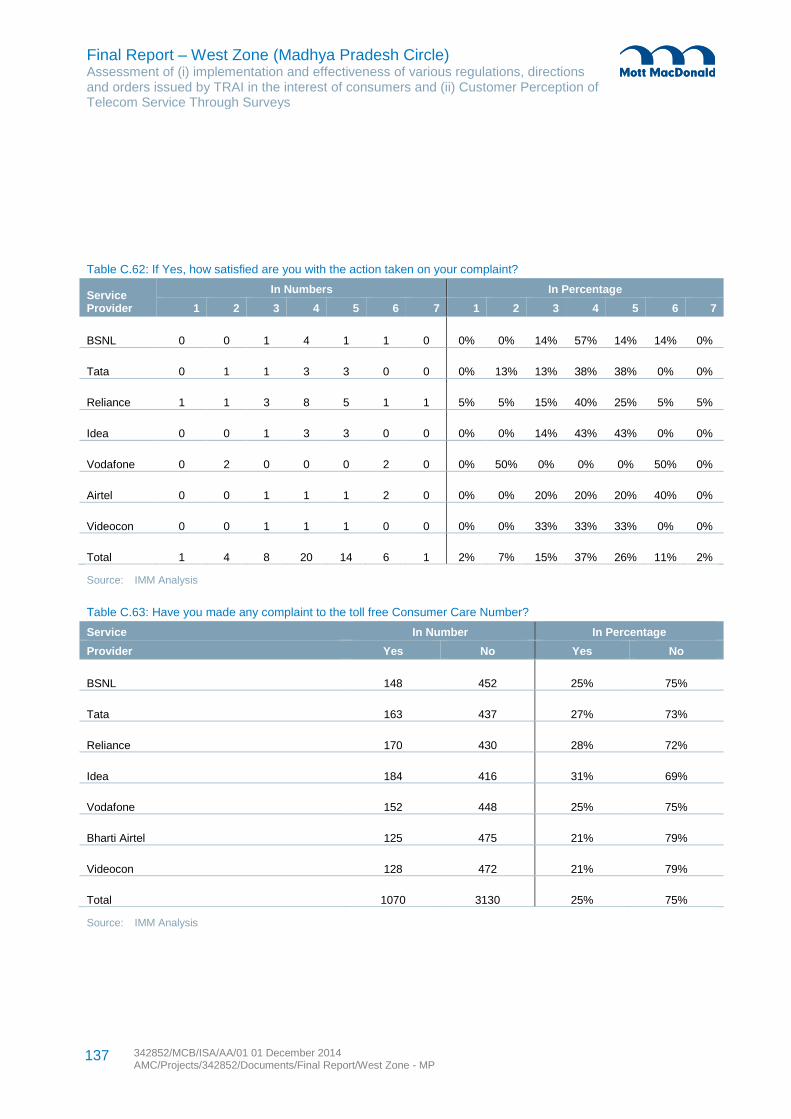
Final Report – West Zone (Madhya Pradesh Circle) Assessment of (i) implementation and effectiveness of various regulations, directions and orders issued by TRAI in the interest of consumers and (ii) Customer Perception of Telecom Service Through Surveys
342852/MCB/ISA/AA/01 01 December 2014 AMC/Projects/342852/Documents/Final Report/West Zone - MP
137
Table C.62: If Yes, how satisfied are you with the action taken on your complaint?
Service Provider
In Numbers In Percentage
1 2 3 4 5 6 7 1 2 3 4 5 6 7
BSNL 0 0 1 4 1 1 0 0% 0% 14% 57% 14% 14% 0%
Tata 0 1 1 3 3 0 0 0% 13% 13% 38% 38% 0% 0%
Reliance 1 1 3 8 5 1 1 5% 5% 15% 40% 25% 5% 5%
Idea 0 0 1 3 3 0 0 0% 0% 14% 43% 43% 0% 0%
Vodafone 0 2 0 0 0 2 0 0% 50% 0% 0% 0% 50% 0%
Airtel 0 0 1 1 1 2 0 0% 0% 20% 20% 20% 40% 0%
Videocon 0 0 1 1 1 0 0 0% 0% 33% 33% 33% 0% 0%
Total 1 4 8 20 14 6 1 2% 7% 15% 37% 26% 11% 2%
Source: IMM Analysis
Table C.63: Have you made any complaint to the toll free Consumer Care Number?
Service In Number In Percentage
Provider Yes No Yes No
BSNL 148 452 25% 75%
Tata 163 437 27% 73%
Reliance 170 430 28% 72%
Idea 184 416 31% 69%
Vodafone 152 448 25% 75%
Bharti Airtel 125 475 21% 79%
Videocon 128 472 21% 79%
Total 1070 3130 25% 75%
Source: IMM Analysis
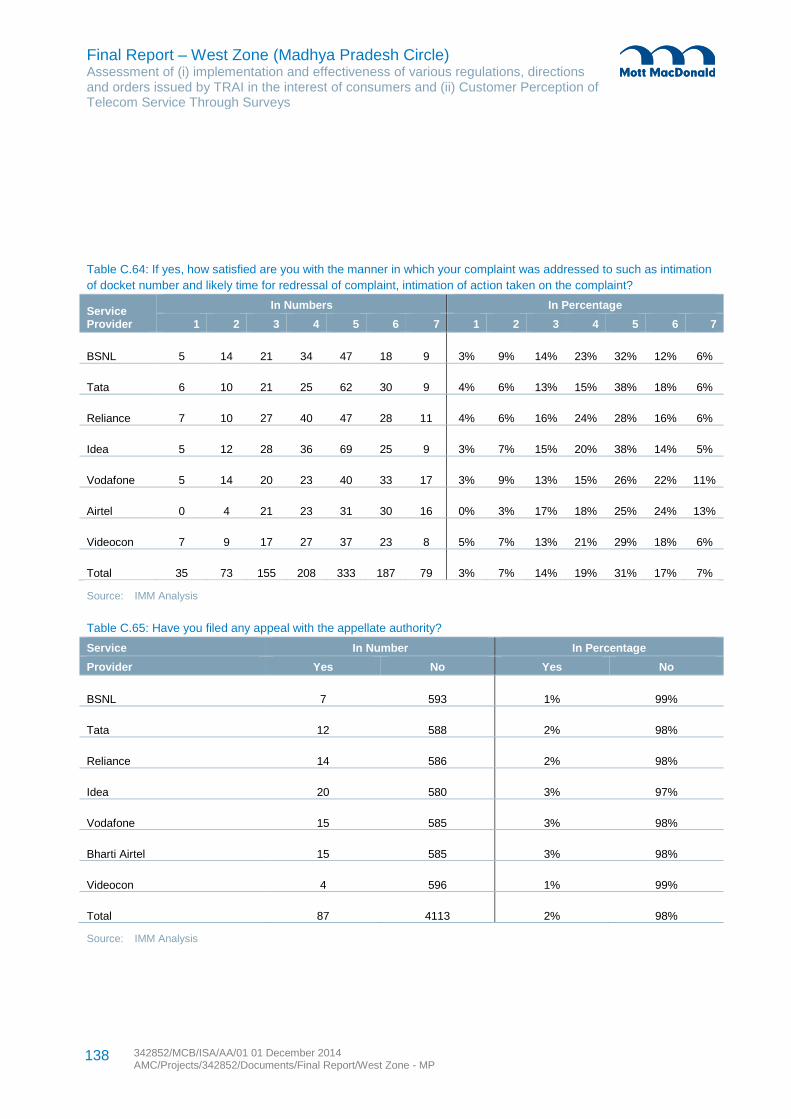
Final Report – West Zone (Madhya Pradesh Circle) Assessment of (i) implementation and effectiveness of various regulations, directions and orders issued by TRAI in the interest of consumers and (ii) Customer Perception of Telecom Service Through Surveys
342852/MCB/ISA/AA/01 01 December 2014 AMC/Projects/342852/Documents/Final Report/West Zone - MP
138
Table C.64: If yes, how satisfied are you with the manner in which your complaint was addressed to such as intimation
of docket number and likely time for redressal of complaint, intimation of action taken on the complaint?
Service Provider
In Numbers In Percentage
1 2 3 4 5 6 7 1 2 3 4 5 6 7
BSNL 5 14 21 34 47 18 9 3% 9% 14% 23% 32% 12% 6%
Tata 6 10 21 25 62 30 9 4% 6% 13% 15% 38% 18% 6%
Reliance 7 10 27 40 47 28 11 4% 6% 16% 24% 28% 16% 6%
Idea 5 12 28 36 69 25 9 3% 7% 15% 20% 38% 14% 5%
Vodafone 5 14 20 23 40 33 17 3% 9% 13% 15% 26% 22% 11%
Airtel 0 4 21 23 31 30 16 0% 3% 17% 18% 25% 24% 13%
Videocon 7 9 17 27 37 23 8 5% 7% 13% 21% 29% 18% 6%
Total 35 73 155 208 333 187 79 3% 7% 14% 19% 31% 17% 7%
Source: IMM Analysis
Table C.65: Have you filed any appeal with the appellate authority?
Service In Number In Percentage
Provider Yes No Yes No
BSNL 7 593 1% 99%
Tata 12 588 2% 98%
Reliance 14 586 2% 98%
Idea 20 580 3% 97%
Vodafone 15 585 3% 98%
Bharti Airtel 15 585 3% 98%
Videocon 4 596 1% 99%
Total 87 4113 2% 98%
Source: IMM Analysis
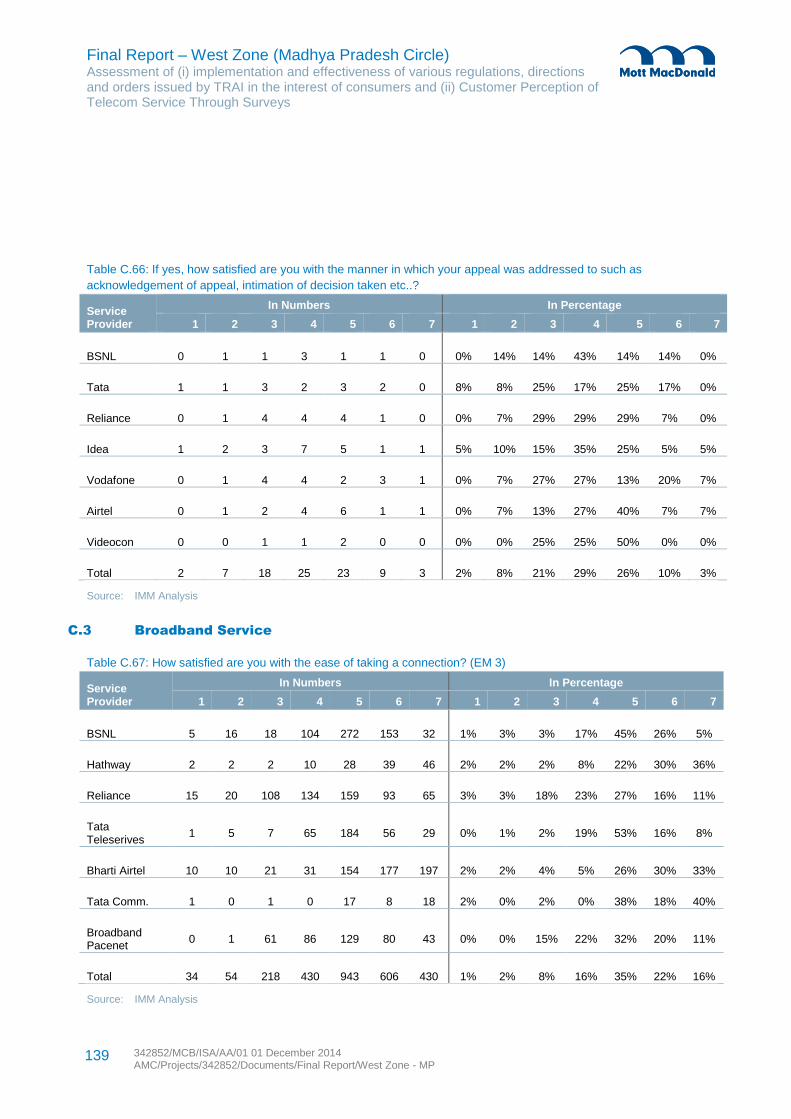
Final Report – West Zone (Madhya Pradesh Circle) Assessment of (i) implementation and effectiveness of various regulations, directions and orders issued by TRAI in the interest of consumers and (ii) Customer Perception of Telecom Service Through Surveys
342852/MCB/ISA/AA/01 01 December 2014 AMC/Projects/342852/Documents/Final Report/West Zone - MP
139
Table C.66: If yes, how satisfied are you with the manner in which your appeal was addressed to such as
acknowledgement of appeal, intimation of decision taken etc..?
Service Provider
In Numbers In Percentage
1 2 3 4 5 6 7 1 2 3 4 5 6 7
BSNL 0 1 1 3 1 1 0 0% 14% 14% 43% 14% 14% 0%
Tata 1 1 3 2 3 2 0 8% 8% 25% 17% 25% 17% 0%
Reliance 0 1 4 4 4 1 0 0% 7% 29% 29% 29% 7% 0%
Idea 1 2 3 7 5 1 1 5% 10% 15% 35% 25% 5% 5%
Vodafone 0 1 4 4 2 3 1 0% 7% 27% 27% 13% 20% 7%
Airtel 0 1 2 4 6 1 1 0% 7% 13% 27% 40% 7% 7%
Videocon 0 0 1 1 2 0 0 0% 0% 25% 25% 50% 0% 0%
Total 2 7 18 25 23 9 3 2% 8% 21% 29% 26% 10% 3%
Source: IMM Analysis
C.3 Broadband Service
Table C.67: How satisfied are you with the ease of taking a connection? (EM 3)
Service Provider
In Numbers In Percentage
1 2 3 4 5 6 7 1 2 3 4 5 6 7
BSNL 5 16 18 104 272 153 32 1% 3% 3% 17% 45% 26% 5%
Hathway 2 2 2 10 28 39 46 2% 2% 2% 8% 22% 30% 36%
Reliance 15 20 108 134 159 93 65 3% 3% 18% 23% 27% 16% 11%
Tata Teleserives
1 5 7 65 184 56 29 0% 1% 2% 19% 53% 16% 8%
Bharti Airtel 10 10 21 31 154 177 197 2% 2% 4% 5% 26% 30% 33%
Tata Comm. 1 0 1 0 17 8 18 2% 0% 2% 0% 38% 18% 40%
Broadband Pacenet
0 1 61 86 129 80 43 0% 0% 15% 22% 32% 20% 11%
Total 34 54 218 430 943 606 430 1% 2% 8% 16% 35% 22% 16%
Source: IMM Analysis
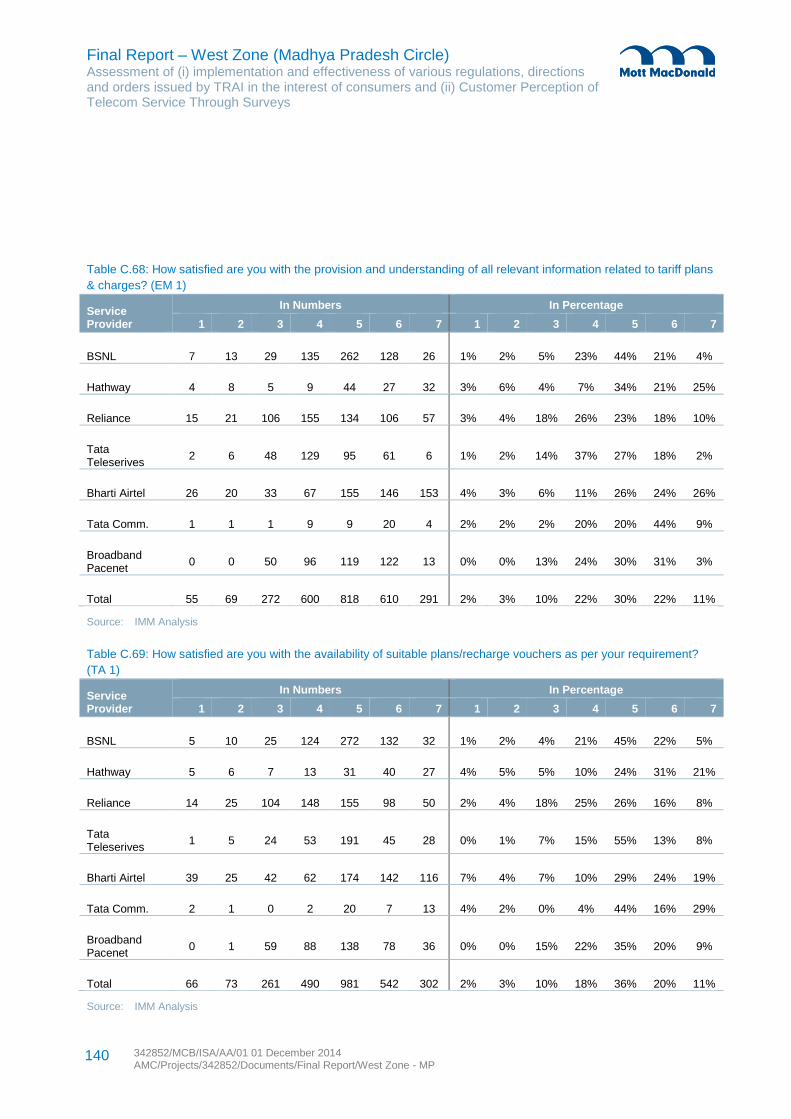
Final Report – West Zone (Madhya Pradesh Circle) Assessment of (i) implementation and effectiveness of various regulations, directions and orders issued by TRAI in the interest of consumers and (ii) Customer Perception of Telecom Service Through Surveys
342852/MCB/ISA/AA/01 01 December 2014 AMC/Projects/342852/Documents/Final Report/West Zone - MP
140
Table C.68: How satisfied are you with the provision and understanding of all relevant information related to tariff plans
& charges? (EM 1)
Service Provider
In Numbers In Percentage
1 2 3 4 5 6 7 1 2 3 4 5 6 7
BSNL 7 13 29 135 262 128 26 1% 2% 5% 23% 44% 21% 4%
Hathway 4 8 5 9 44 27 32 3% 6% 4% 7% 34% 21% 25%
Reliance 15 21 106 155 134 106 57 3% 4% 18% 26% 23% 18% 10%
Tata Teleserives
2 6 48 129 95 61 6 1% 2% 14% 37% 27% 18% 2%
Bharti Airtel 26 20 33 67 155 146 153 4% 3% 6% 11% 26% 24% 26%
Tata Comm. 1 1 1 9 9 20 4 2% 2% 2% 20% 20% 44% 9%
Broadband Pacenet
0 0 50 96 119 122 13 0% 0% 13% 24% 30% 31% 3%
Total 55 69 272 600 818 610 291 2% 3% 10% 22% 30% 22% 11%
Source: IMM Analysis
Table C.69: How satisfied are you with the availability of suitable plans/recharge vouchers as per your requirement?
(TA 1)
Service Provider
In Numbers In Percentage
1 2 3 4 5 6 7 1 2 3 4 5 6 7
BSNL 5 10 25 124 272 132 32 1% 2% 4% 21% 45% 22% 5%
Hathway 5 6 7 13 31 40 27 4% 5% 5% 10% 24% 31% 21%
Reliance 14 25 104 148 155 98 50 2% 4% 18% 25% 26% 16% 8%
Tata Teleserives
1 5 24 53 191 45 28 0% 1% 7% 15% 55% 13% 8%
Bharti Airtel 39 25 42 62 174 142 116 7% 4% 7% 10% 29% 24% 19%
Tata Comm. 2 1 0 2 20 7 13 4% 2% 0% 4% 44% 16% 29%
Broadband Pacenet
0 1 59 88 138 78 36 0% 0% 15% 22% 35% 20% 9%
Total 66 73 261 490 981 542 302 2% 3% 10% 18% 36% 20% 11%
Source: IMM Analysis
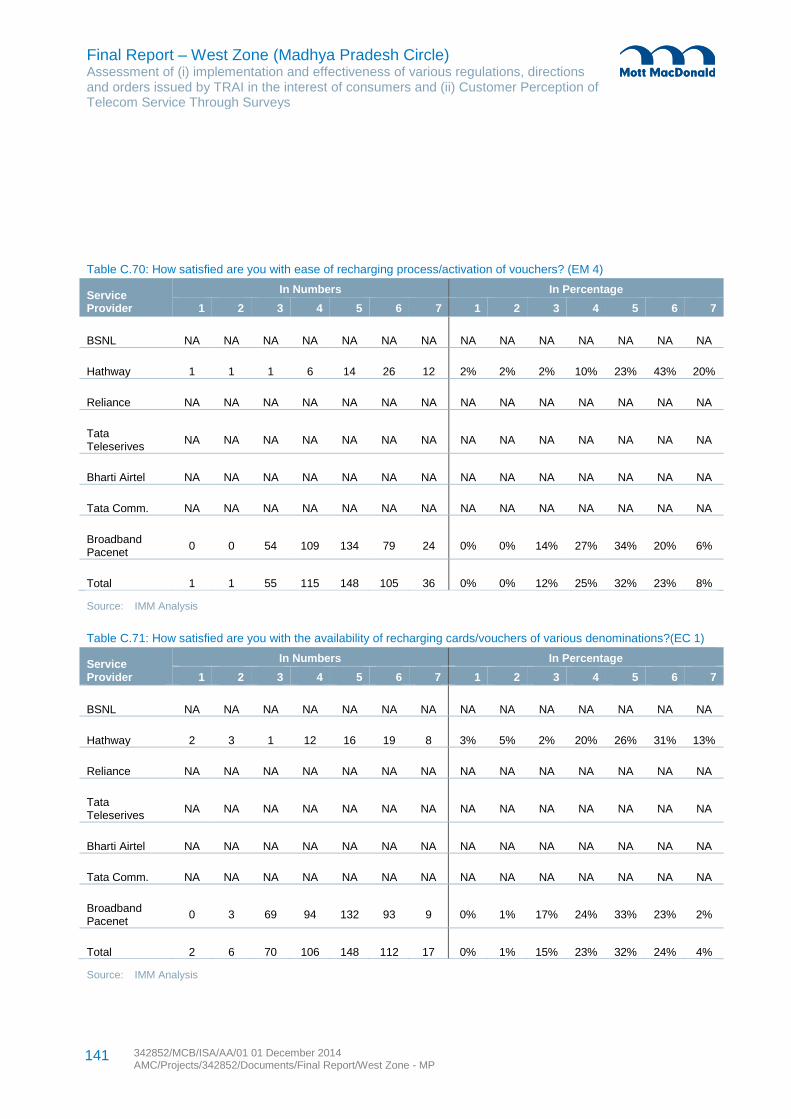
Final Report – West Zone (Madhya Pradesh Circle) Assessment of (i) implementation and effectiveness of various regulations, directions and orders issued by TRAI in the interest of consumers and (ii) Customer Perception of Telecom Service Through Surveys
342852/MCB/ISA/AA/01 01 December 2014 AMC/Projects/342852/Documents/Final Report/West Zone - MP
141
Table C.70: How satisfied are you with ease of recharging process/activation of vouchers? (EM 4)
Service Provider
In Numbers In Percentage
1 2 3 4 5 6 7 1 2 3 4 5 6 7
BSNL NA NA NA NA NA NA NA NA NA NA NA NA NA NA
Hathway 1 1 1 6 14 26 12 2% 2% 2% 10% 23% 43% 20%
Reliance NA NA NA NA NA NA NA NA NA NA NA NA NA NA
Tata Teleserives
NA NA NA NA NA NA NA NA NA NA NA NA NA NA
Bharti Airtel NA NA NA NA NA NA NA NA NA NA NA NA NA NA
Tata Comm. NA NA NA NA NA NA NA NA NA NA NA NA NA NA
Broadband Pacenet
0 0 54 109 134 79 24 0% 0% 14% 27% 34% 20% 6%
Total 1 1 55 115 148 105 36 0% 0% 12% 25% 32% 23% 8%
Source: IMM Analysis
Table C.71: How satisfied are you with the availability of recharging cards/vouchers of various denominations?(EC 1)
Service Provider
In Numbers In Percentage
1 2 3 4 5 6 7 1 2 3 4 5 6 7
BSNL NA NA NA NA NA NA NA NA NA NA NA NA NA NA
Hathway 2 3 1 12 16 19 8 3% 5% 2% 20% 26% 31% 13%
Reliance NA NA NA NA NA NA NA NA NA NA NA NA NA NA
Tata Teleserives
NA NA NA NA NA NA NA NA NA NA NA NA NA NA
Bharti Airtel NA NA NA NA NA NA NA NA NA NA NA NA NA NA
Tata Comm. NA NA NA NA NA NA NA NA NA NA NA NA NA NA
Broadband Pacenet
0 3 69 94 132 93 9 0% 1% 17% 24% 33% 23% 2%
Total 2 6 70 106 148 112 17 0% 1% 15% 23% 32% 24% 4%
Source: IMM Analysis
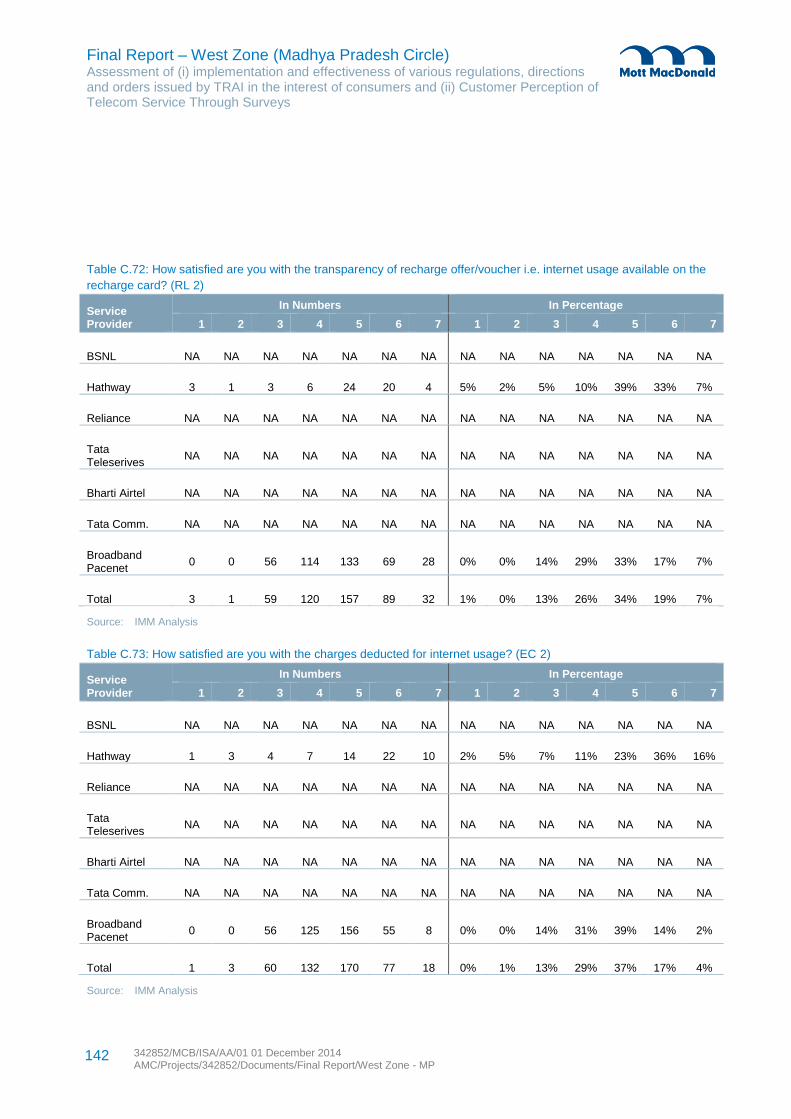
Final Report – West Zone (Madhya Pradesh Circle) Assessment of (i) implementation and effectiveness of various regulations, directions and orders issued by TRAI in the interest of consumers and (ii) Customer Perception of Telecom Service Through Surveys
342852/MCB/ISA/AA/01 01 December 2014 AMC/Projects/342852/Documents/Final Report/West Zone - MP
142
Table C.72: How satisfied are you with the transparency of recharge offer/voucher i.e. internet usage available on the
recharge card? (RL 2)
Service Provider
In Numbers In Percentage
1 2 3 4 5 6 7 1 2 3 4 5 6 7
BSNL NA NA NA NA NA NA NA NA NA NA NA NA NA NA
Hathway 3 1 3 6 24 20 4 5% 2% 5% 10% 39% 33% 7%
Reliance NA NA NA NA NA NA NA NA NA NA NA NA NA NA
Tata Teleserives
NA NA NA NA NA NA NA NA NA NA NA NA NA NA
Bharti Airtel NA NA NA NA NA NA NA NA NA NA NA NA NA NA
Tata Comm. NA NA NA NA NA NA NA NA NA NA NA NA NA NA
Broadband Pacenet
0 0 56 114 133 69 28 0% 0% 14% 29% 33% 17% 7%
Total 3 1 59 120 157 89 32 1% 0% 13% 26% 34% 19% 7%
Source: IMM Analysis
Table C.73: How satisfied are you with the charges deducted for internet usage? (EC 2)
Service Provider
In Numbers In Percentage
1 2 3 4 5 6 7 1 2 3 4 5 6 7
BSNL NA NA NA NA NA NA NA NA NA NA NA NA NA NA
Hathway 1 3 4 7 14 22 10 2% 5% 7% 11% 23% 36% 16%
Reliance NA NA NA NA NA NA NA NA NA NA NA NA NA NA
Tata Teleserives
NA NA NA NA NA NA NA NA NA NA NA NA NA NA
Bharti Airtel NA NA NA NA NA NA NA NA NA NA NA NA NA NA
Tata Comm. NA NA NA NA NA NA NA NA NA NA NA NA NA NA
Broadband Pacenet
0 0 56 125 156 55 8 0% 0% 14% 31% 39% 14% 2%
Total 1 3 60 132 170 77 18 0% 1% 13% 29% 37% 17% 4%
Source: IMM Analysis
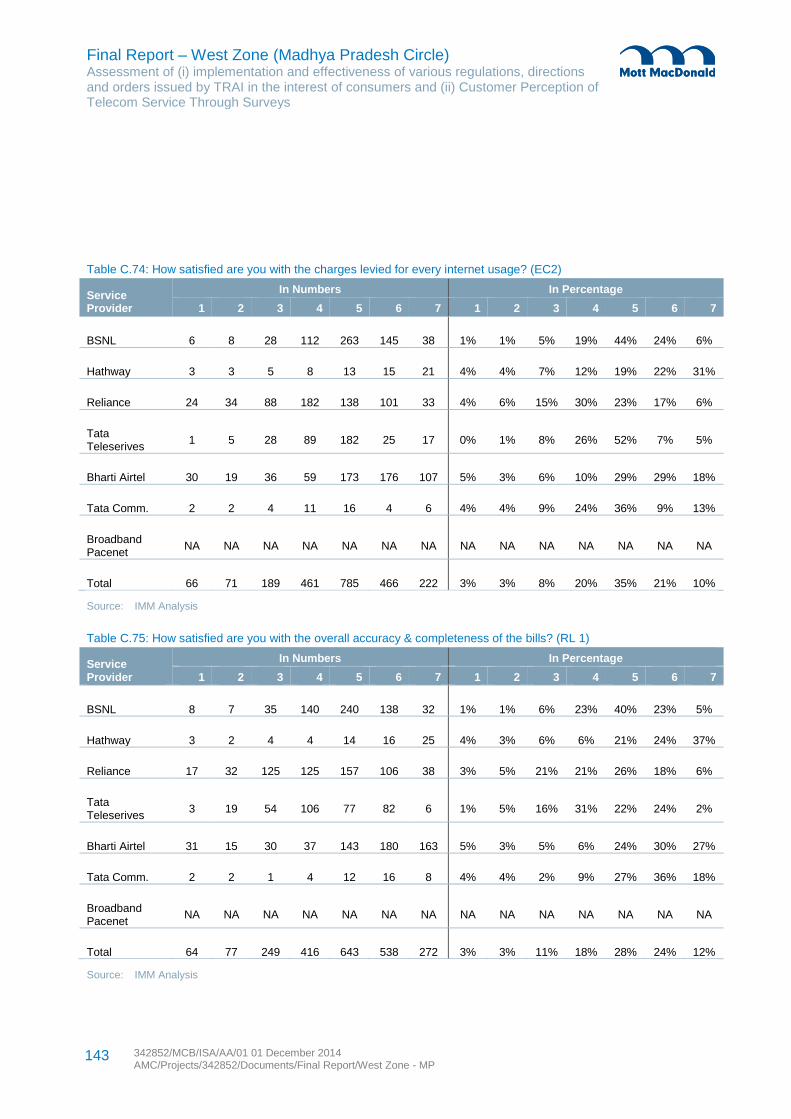
Final Report – West Zone (Madhya Pradesh Circle) Assessment of (i) implementation and effectiveness of various regulations, directions and orders issued by TRAI in the interest of consumers and (ii) Customer Perception of Telecom Service Through Surveys
342852/MCB/ISA/AA/01 01 December 2014 AMC/Projects/342852/Documents/Final Report/West Zone - MP
143
Table C.74: How satisfied are you with the charges levied for every internet usage? (EC2)
Service Provider
In Numbers In Percentage
1 2 3 4 5 6 7 1 2 3 4 5 6 7
BSNL 6 8 28 112 263 145 38 1% 1% 5% 19% 44% 24% 6%
Hathway 3 3 5 8 13 15 21 4% 4% 7% 12% 19% 22% 31%
Reliance 24 34 88 182 138 101 33 4% 6% 15% 30% 23% 17% 6%
Tata Teleserives
1 5 28 89 182 25 17 0% 1% 8% 26% 52% 7% 5%
Bharti Airtel 30 19 36 59 173 176 107 5% 3% 6% 10% 29% 29% 18%
Tata Comm. 2 2 4 11 16 4 6 4% 4% 9% 24% 36% 9% 13%
Broadband Pacenet
NA NA NA NA NA NA NA NA NA NA NA NA NA NA
Total 66 71 189 461 785 466 222 3% 3% 8% 20% 35% 21% 10%
Source: IMM Analysis
Table C.75: How satisfied are you with the overall accuracy & completeness of the bills? (RL 1)
Service Provider
In Numbers In Percentage
1 2 3 4 5 6 7 1 2 3 4 5 6 7
BSNL 8 7 35 140 240 138 32 1% 1% 6% 23% 40% 23% 5%
Hathway 3 2 4 4 14 16 25 4% 3% 6% 6% 21% 24% 37%
Reliance 17 32 125 125 157 106 38 3% 5% 21% 21% 26% 18% 6%
Tata Teleserives
3 19 54 106 77 82 6 1% 5% 16% 31% 22% 24% 2%
Bharti Airtel 31 15 30 37 143 180 163 5% 3% 5% 6% 24% 30% 27%
Tata Comm. 2 2 1 4 12 16 8 4% 4% 2% 9% 27% 36% 18%
Broadband Pacenet
NA NA NA NA NA NA NA NA NA NA NA NA NA NA
Total 64 77 249 416 643 538 272 3% 3% 11% 18% 28% 24% 12%
Source: IMM Analysis
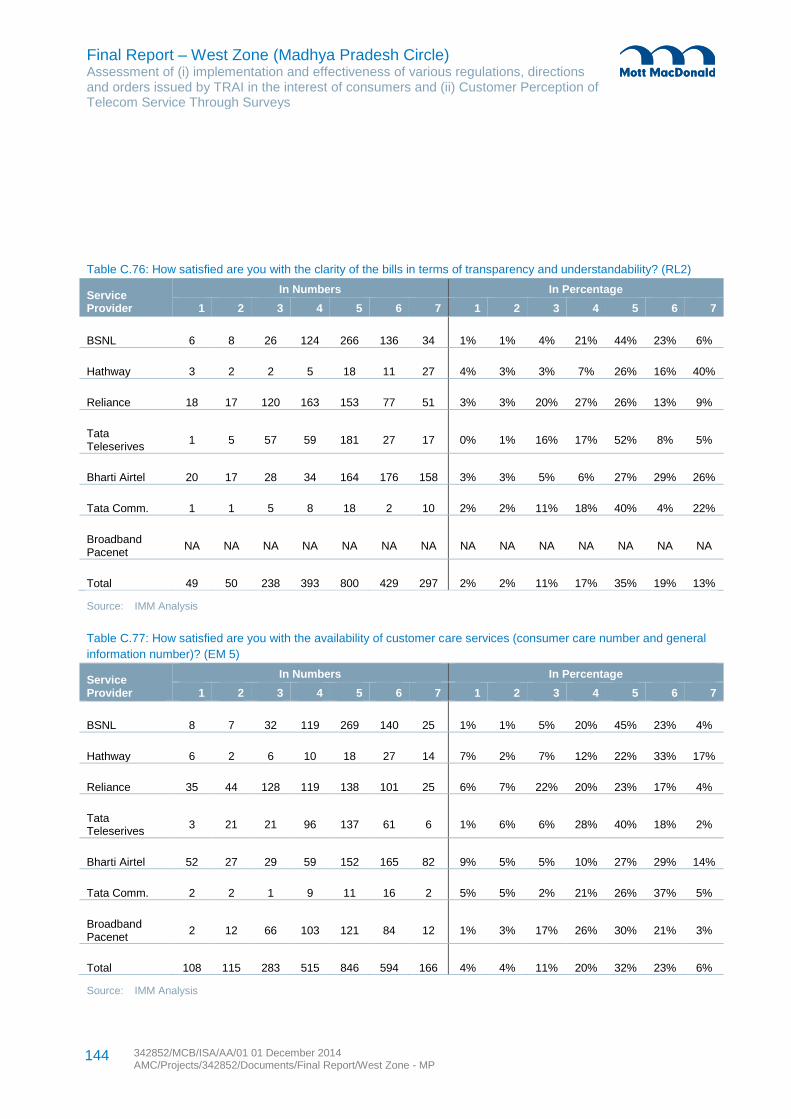
Final Report – West Zone (Madhya Pradesh Circle) Assessment of (i) implementation and effectiveness of various regulations, directions and orders issued by TRAI in the interest of consumers and (ii) Customer Perception of Telecom Service Through Surveys
342852/MCB/ISA/AA/01 01 December 2014 AMC/Projects/342852/Documents/Final Report/West Zone - MP
144
Table C.76: How satisfied are you with the clarity of the bills in terms of transparency and understandability? (RL2)
Service Provider
In Numbers In Percentage
1 2 3 4 5 6 7 1 2 3 4 5 6 7
BSNL 6 8 26 124 266 136 34 1% 1% 4% 21% 44% 23% 6%
Hathway 3 2 2 5 18 11 27 4% 3% 3% 7% 26% 16% 40%
Reliance 18 17 120 163 153 77 51 3% 3% 20% 27% 26% 13% 9%
Tata Teleserives
1 5 57 59 181 27 17 0% 1% 16% 17% 52% 8% 5%
Bharti Airtel 20 17 28 34 164 176 158 3% 3% 5% 6% 27% 29% 26%
Tata Comm. 1 1 5 8 18 2 10 2% 2% 11% 18% 40% 4% 22%
Broadband Pacenet
NA NA NA NA NA NA NA NA NA NA NA NA NA NA
Total 49 50 238 393 800 429 297 2% 2% 11% 17% 35% 19% 13%
Source: IMM Analysis
Table C.77: How satisfied are you with the availability of customer care services (consumer care number and general
information number)? (EM 5)
Service Provider
In Numbers In Percentage
1 2 3 4 5 6 7 1 2 3 4 5 6 7
BSNL 8 7 32 119 269 140 25 1% 1% 5% 20% 45% 23% 4%
Hathway 6 2 6 10 18 27 14 7% 2% 7% 12% 22% 33% 17%
Reliance 35 44 128 119 138 101 25 6% 7% 22% 20% 23% 17% 4%
Tata Teleserives
3 21 21 96 137 61 6 1% 6% 6% 28% 40% 18% 2%
Bharti Airtel 52 27 29 59 152 165 82 9% 5% 5% 10% 27% 29% 14%
Tata Comm. 2 2 1 9 11 16 2 5% 5% 2% 21% 26% 37% 5%
Broadband Pacenet
2 12 66 103 121 84 12 1% 3% 17% 26% 30% 21% 3%
Total 108 115 283 515 846 594 166 4% 4% 11% 20% 32% 23% 6%
Source: IMM Analysis
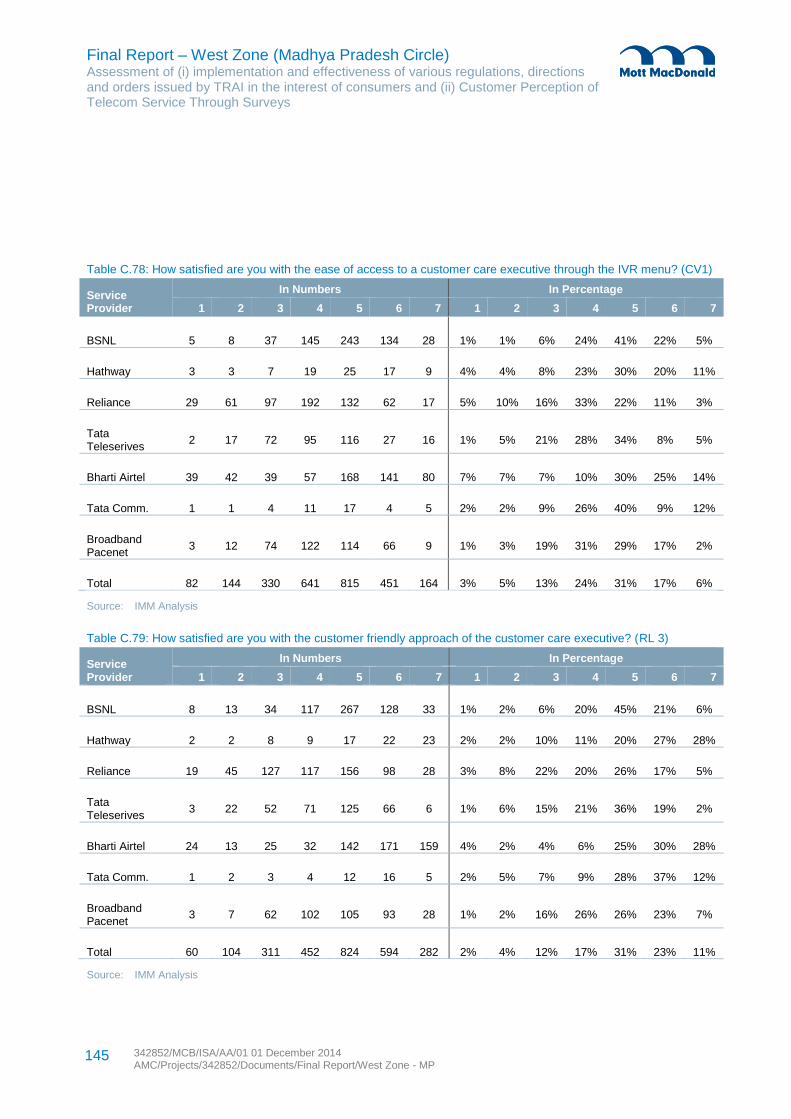
Final Report – West Zone (Madhya Pradesh Circle) Assessment of (i) implementation and effectiveness of various regulations, directions and orders issued by TRAI in the interest of consumers and (ii) Customer Perception of Telecom Service Through Surveys
342852/MCB/ISA/AA/01 01 December 2014 AMC/Projects/342852/Documents/Final Report/West Zone - MP
145
Table C.78: How satisfied are you with the ease of access to a customer care executive through the IVR menu? (CV1)
Service Provider
In Numbers In Percentage
1 2 3 4 5 6 7 1 2 3 4 5 6 7
BSNL 5 8 37 145 243 134 28 1% 1% 6% 24% 41% 22% 5%
Hathway 3 3 7 19 25 17 9 4% 4% 8% 23% 30% 20% 11%
Reliance 29 61 97 192 132 62 17 5% 10% 16% 33% 22% 11% 3%
Tata Teleserives
2 17 72 95 116 27 16 1% 5% 21% 28% 34% 8% 5%
Bharti Airtel 39 42 39 57 168 141 80 7% 7% 7% 10% 30% 25% 14%
Tata Comm. 1 1 4 11 17 4 5 2% 2% 9% 26% 40% 9% 12%
Broadband Pacenet
3 12 74 122 114 66 9 1% 3% 19% 31% 29% 17% 2%
Total 82 144 330 641 815 451 164 3% 5% 13% 24% 31% 17% 6%
Source: IMM Analysis
Table C.79: How satisfied are you with the customer friendly approach of the customer care executive? (RL 3)
Service Provider
In Numbers In Percentage
1 2 3 4 5 6 7 1 2 3 4 5 6 7
BSNL 8 13 34 117 267 128 33 1% 2% 6% 20% 45% 21% 6%
Hathway 2 2 8 9 17 22 23 2% 2% 10% 11% 20% 27% 28%
Reliance 19 45 127 117 156 98 28 3% 8% 22% 20% 26% 17% 5%
Tata Teleserives
3 22 52 71 125 66 6 1% 6% 15% 21% 36% 19% 2%
Bharti Airtel 24 13 25 32 142 171 159 4% 2% 4% 6% 25% 30% 28%
Tata Comm. 1 2 3 4 12 16 5 2% 5% 7% 9% 28% 37% 12%
Broadband Pacenet
3 7 62 102 105 93 28 1% 2% 16% 26% 26% 23% 7%
Total 60 104 311 452 824 594 282 2% 4% 12% 17% 31% 23% 11%
Source: IMM Analysis
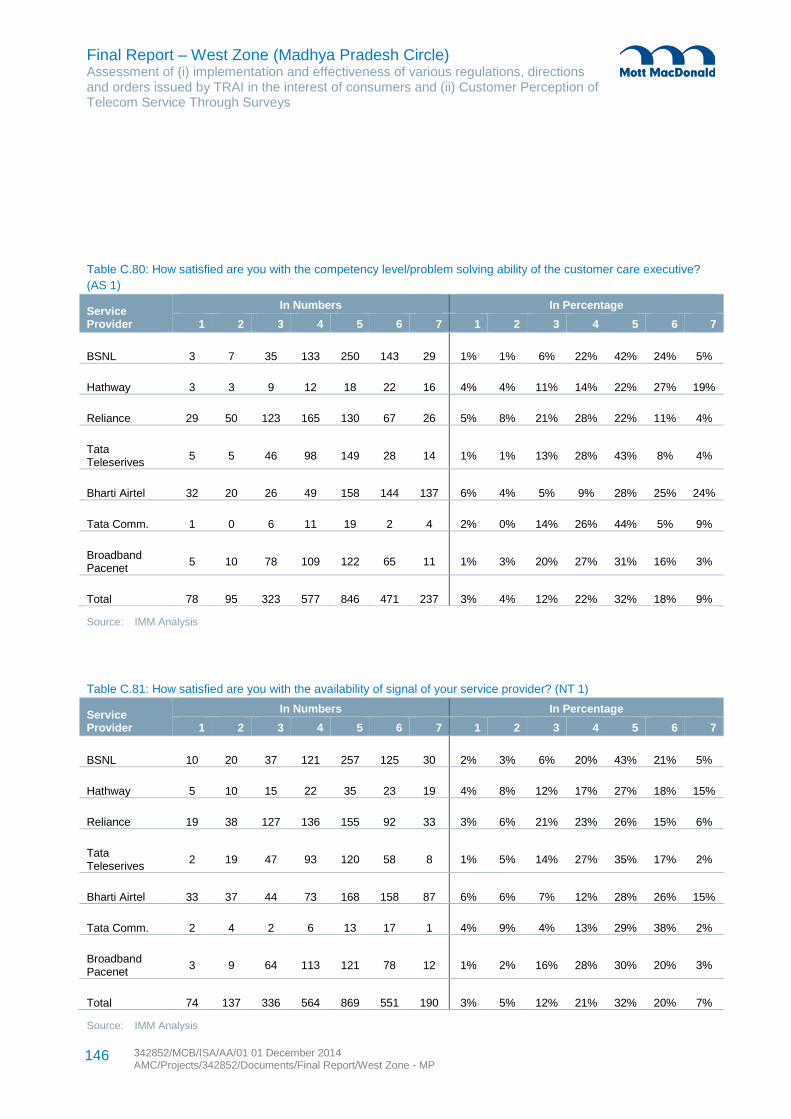
Final Report – West Zone (Madhya Pradesh Circle) Assessment of (i) implementation and effectiveness of various regulations, directions and orders issued by TRAI in the interest of consumers and (ii) Customer Perception of Telecom Service Through Surveys
342852/MCB/ISA/AA/01 01 December 2014 AMC/Projects/342852/Documents/Final Report/West Zone - MP
146
Table C.80: How satisfied are you with the competency level/problem solving ability of the customer care executive?
(AS 1)
Service Provider
In Numbers In Percentage
1 2 3 4 5 6 7 1 2 3 4 5 6 7
BSNL 3 7 35 133 250 143 29 1% 1% 6% 22% 42% 24% 5%
Hathway 3 3 9 12 18 22 16 4% 4% 11% 14% 22% 27% 19%
Reliance 29 50 123 165 130 67 26 5% 8% 21% 28% 22% 11% 4%
Tata Teleserives
5 5 46 98 149 28 14 1% 1% 13% 28% 43% 8% 4%
Bharti Airtel 32 20 26 49 158 144 137 6% 4% 5% 9% 28% 25% 24%
Tata Comm. 1 0 6 11 19 2 4 2% 0% 14% 26% 44% 5% 9%
Broadband Pacenet
5 10 78 109 122 65 11 1% 3% 20% 27% 31% 16% 3%
Total 78 95 323 577 846 471 237 3% 4% 12% 22% 32% 18% 9%
Source: IMM Analysis
Table C.81: How satisfied are you with the availability of signal of your service provider? (NT 1)
Service Provider
In Numbers In Percentage
1 2 3 4 5 6 7 1 2 3 4 5 6 7
BSNL 10 20 37 121 257 125 30 2% 3% 6% 20% 43% 21% 5%
Hathway 5 10 15 22 35 23 19 4% 8% 12% 17% 27% 18% 15%
Reliance 19 38 127 136 155 92 33 3% 6% 21% 23% 26% 15% 6%
Tata Teleserives
2 19 47 93 120 58 8 1% 5% 14% 27% 35% 17% 2%
Bharti Airtel 33 37 44 73 168 158 87 6% 6% 7% 12% 28% 26% 15%
Tata Comm. 2 4 2 6 13 17 1 4% 9% 4% 13% 29% 38% 2%
Broadband Pacenet
3 9 64 113 121 78 12 1% 2% 16% 28% 30% 20% 3%
Total 74 137 336 564 869 551 190 3% 5% 12% 21% 32% 20% 7%
Source: IMM Analysis
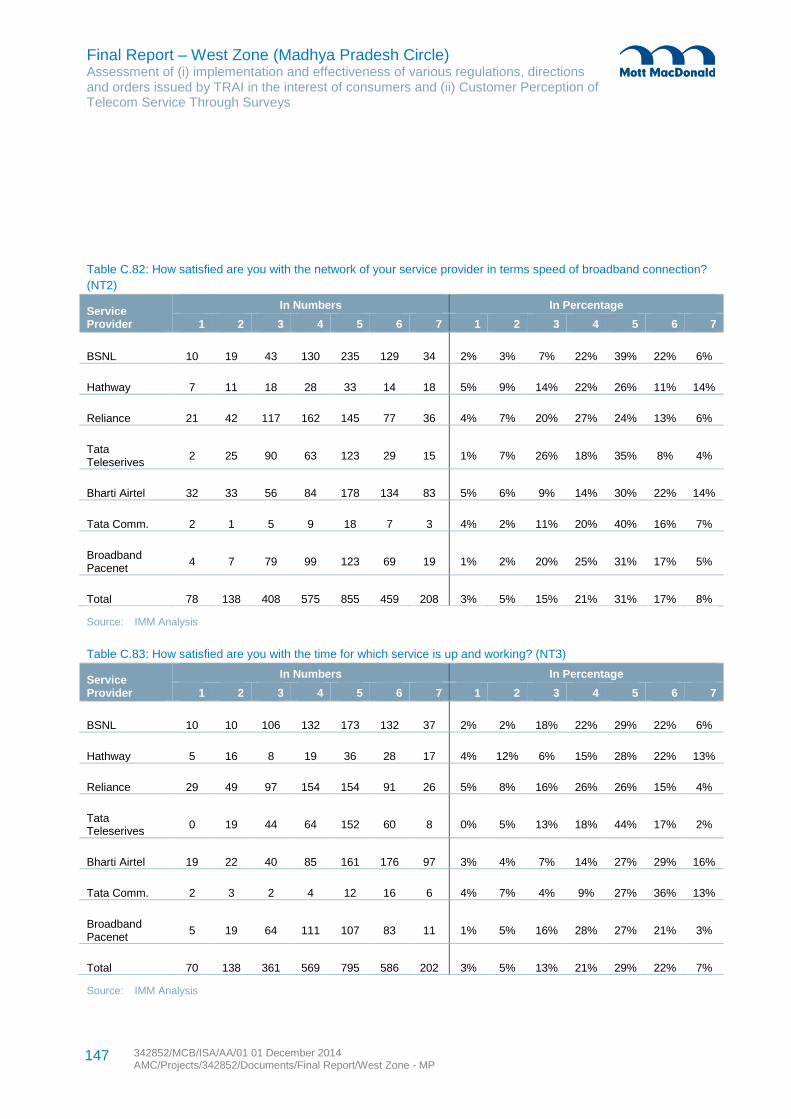
Final Report – West Zone (Madhya Pradesh Circle) Assessment of (i) implementation and effectiveness of various regulations, directions and orders issued by TRAI in the interest of consumers and (ii) Customer Perception of Telecom Service Through Surveys
342852/MCB/ISA/AA/01 01 December 2014 AMC/Projects/342852/Documents/Final Report/West Zone - MP
147
Table C.82: How satisfied are you with the network of your service provider in terms speed of broadband connection?
(NT2)
Service Provider
In Numbers In Percentage
1 2 3 4 5 6 7 1 2 3 4 5 6 7
BSNL 10 19 43 130 235 129 34 2% 3% 7% 22% 39% 22% 6%
Hathway 7 11 18 28 33 14 18 5% 9% 14% 22% 26% 11% 14%
Reliance 21 42 117 162 145 77 36 4% 7% 20% 27% 24% 13% 6%
Tata Teleserives
2 25 90 63 123 29 15 1% 7% 26% 18% 35% 8% 4%
Bharti Airtel 32 33 56 84 178 134 83 5% 6% 9% 14% 30% 22% 14%
Tata Comm. 2 1 5 9 18 7 3 4% 2% 11% 20% 40% 16% 7%
Broadband Pacenet
4 7 79 99 123 69 19 1% 2% 20% 25% 31% 17% 5%
Total 78 138 408 575 855 459 208 3% 5% 15% 21% 31% 17% 8%
Source: IMM Analysis
Table C.83: How satisfied are you with the time for which service is up and working? (NT3)
Service Provider
In Numbers In Percentage
1 2 3 4 5 6 7 1 2 3 4 5 6 7
BSNL 10 10 106 132 173 132 37 2% 2% 18% 22% 29% 22% 6%
Hathway 5 16 8 19 36 28 17 4% 12% 6% 15% 28% 22% 13%
Reliance 29 49 97 154 154 91 26 5% 8% 16% 26% 26% 15% 4%
Tata Teleserives
0 19 44 64 152 60 8 0% 5% 13% 18% 44% 17% 2%
Bharti Airtel 19 22 40 85 161 176 97 3% 4% 7% 14% 27% 29% 16%
Tata Comm. 2 3 2 4 12 16 6 4% 7% 4% 9% 27% 36% 13%
Broadband Pacenet
5 19 64 111 107 83 11 1% 5% 16% 28% 27% 21% 3%
Total 70 138 361 569 795 586 202 3% 5% 13% 21% 29% 22% 7%
Source: IMM Analysis
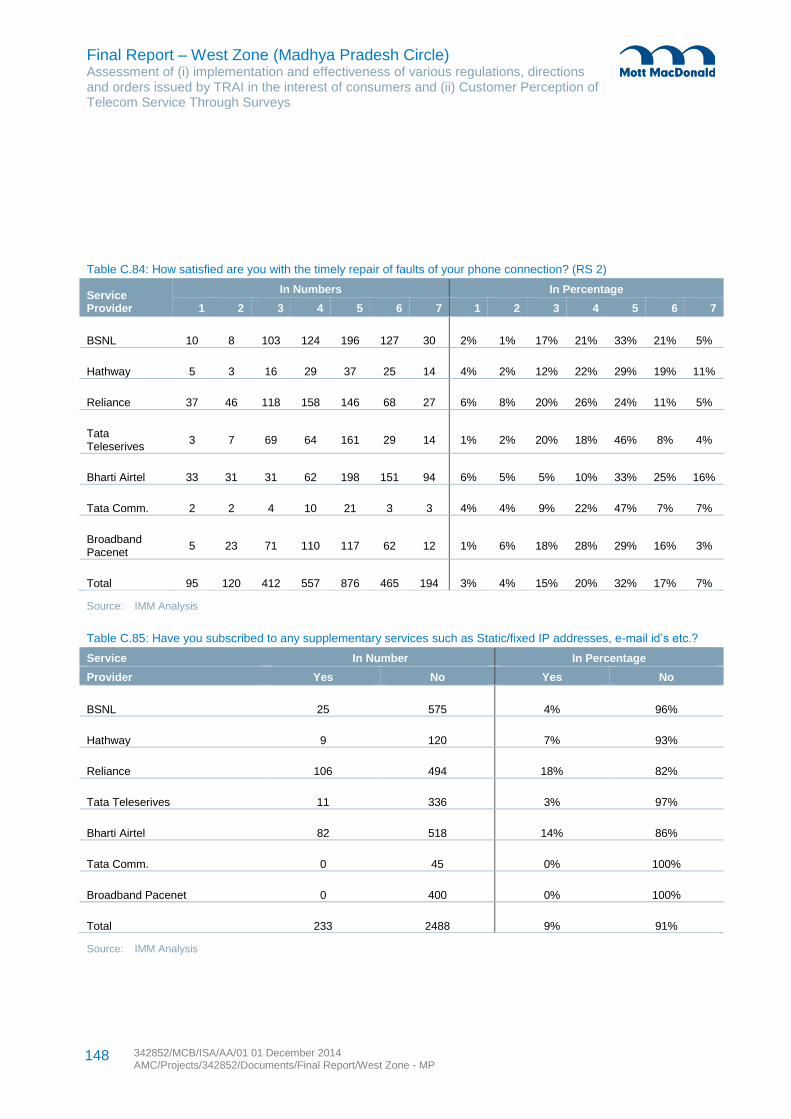
Final Report – West Zone (Madhya Pradesh Circle) Assessment of (i) implementation and effectiveness of various regulations, directions and orders issued by TRAI in the interest of consumers and (ii) Customer Perception of Telecom Service Through Surveys
342852/MCB/ISA/AA/01 01 December 2014 AMC/Projects/342852/Documents/Final Report/West Zone - MP
148
Table C.84: How satisfied are you with the timely repair of faults of your phone connection? (RS 2)
Service Provider
In Numbers In Percentage
1 2 3 4 5 6 7 1 2 3 4 5 6 7
BSNL 10 8 103 124 196 127 30 2% 1% 17% 21% 33% 21% 5%
Hathway 5 3 16 29 37 25 14 4% 2% 12% 22% 29% 19% 11%
Reliance 37 46 118 158 146 68 27 6% 8% 20% 26% 24% 11% 5%
Tata Teleserives
3 7 69 64 161 29 14 1% 2% 20% 18% 46% 8% 4%
Bharti Airtel 33 31 31 62 198 151 94 6% 5% 5% 10% 33% 25% 16%
Tata Comm. 2 2 4 10 21 3 3 4% 4% 9% 22% 47% 7% 7%
Broadband Pacenet
5 23 71 110 117 62 12 1% 6% 18% 28% 29% 16% 3%
Total 95 120 412 557 876 465 194 3% 4% 15% 20% 32% 17% 7%
Source: IMM Analysis
Table C.85: Have you subscribed to any supplementary services such as Static/fixed IP addresses, e-mail id’s etc.?
Service In Number In Percentage
Provider Yes No Yes No
BSNL 25 575 4% 96%
Hathway 9 120 7% 93%
Reliance 106 494 18% 82%
Tata Teleserives 11 336 3% 97%
Bharti Airtel 82 518 14% 86%
Tata Comm. 0 45 0% 100%
Broadband Pacenet 0 400 0% 100%
Total 233 2488 9% 91%
Source: IMM Analysis
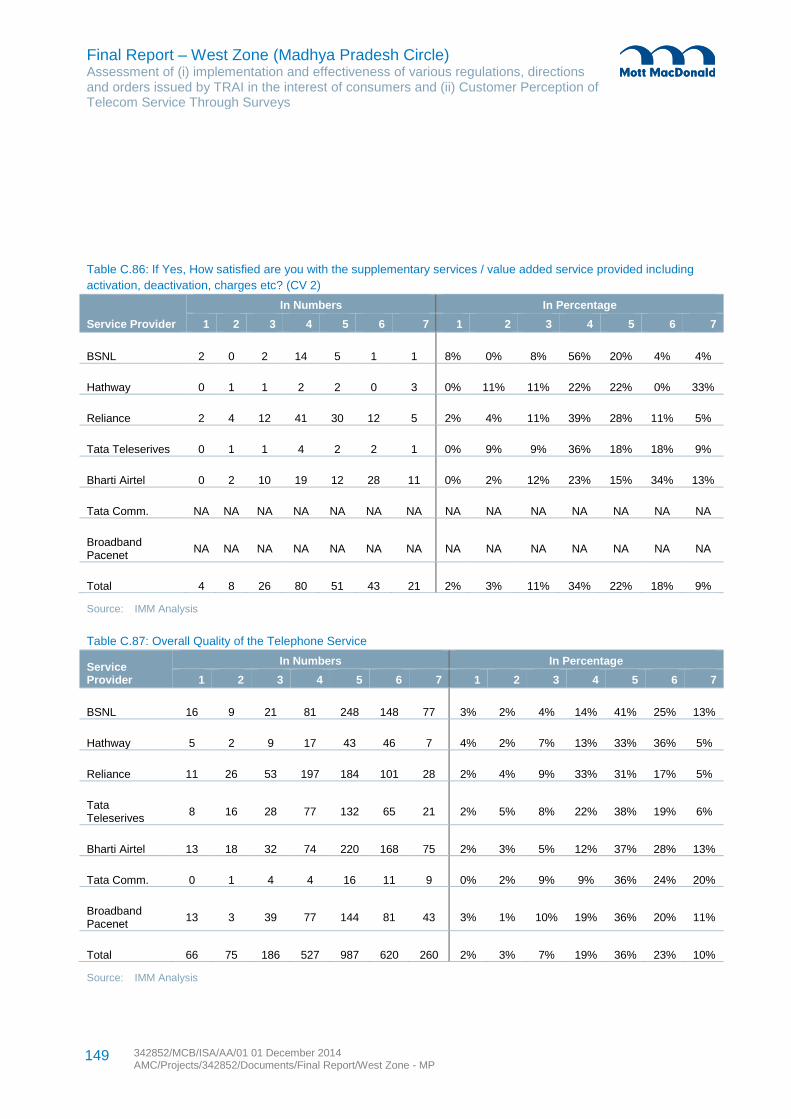
Final Report – West Zone (Madhya Pradesh Circle) Assessment of (i) implementation and effectiveness of various regulations, directions and orders issued by TRAI in the interest of consumers and (ii) Customer Perception of Telecom Service Through Surveys
342852/MCB/ISA/AA/01 01 December 2014 AMC/Projects/342852/Documents/Final Report/West Zone - MP
149
Table C.86: If Yes, How satisfied are you with the supplementary services / value added service provided including
activation, deactivation, charges etc? (CV 2)
Service Provider
In Numbers In Percentage
1 2 3 4 5 6 7 1 2 3 4 5 6 7
BSNL 2 0 2 14 5 1 1 8% 0% 8% 56% 20% 4% 4%
Hathway 0 1 1 2 2 0 3 0% 11% 11% 22% 22% 0% 33%
Reliance 2 4 12 41 30 12 5 2% 4% 11% 39% 28% 11% 5%
Tata Teleserives 0 1 1 4 2 2 1 0% 9% 9% 36% 18% 18% 9%
Bharti Airtel 0 2 10 19 12 28 11 0% 2% 12% 23% 15% 34% 13%
Tata Comm. NA NA NA NA NA NA NA NA NA NA NA NA NA NA
Broadband Pacenet
NA NA NA NA NA NA NA NA NA NA NA NA NA NA
Total 4 8 26 80 51 43 21 2% 3% 11% 34% 22% 18% 9%
Source: IMM Analysis
Table C.87: Overall Quality of the Telephone Service
Service Provider
In Numbers In Percentage
1 2 3 4 5 6 7 1 2 3 4 5 6 7
BSNL 16 9 21 81 248 148 77 3% 2% 4% 14% 41% 25% 13%
Hathway 5 2 9 17 43 46 7 4% 2% 7% 13% 33% 36% 5%
Reliance 11 26 53 197 184 101 28 2% 4% 9% 33% 31% 17% 5%
Tata Teleserives
8 16 28 77 132 65 21 2% 5% 8% 22% 38% 19% 6%
Bharti Airtel 13 18 32 74 220 168 75 2% 3% 5% 12% 37% 28% 13%
Tata Comm. 0 1 4 4 16 11 9 0% 2% 9% 9% 36% 24% 20%
Broadband Pacenet
13 3 39 77 144 81 43 3% 1% 10% 19% 36% 20% 11%
Total 66 75 186 527 987 620 260 2% 3% 7% 19% 36% 23% 10%
Source: IMM Analysis
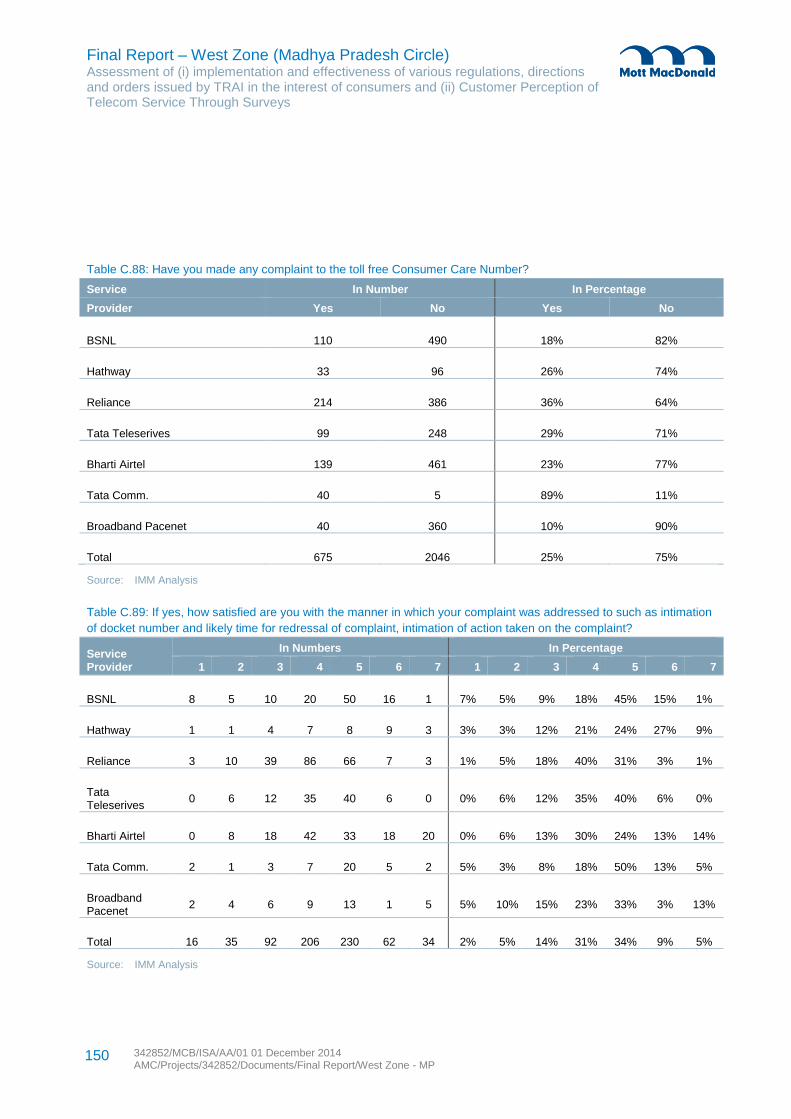
Final Report – West Zone (Madhya Pradesh Circle) Assessment of (i) implementation and effectiveness of various regulations, directions and orders issued by TRAI in the interest of consumers and (ii) Customer Perception of Telecom Service Through Surveys
342852/MCB/ISA/AA/01 01 December 2014 AMC/Projects/342852/Documents/Final Report/West Zone - MP
150
Table C.88: Have you made any complaint to the toll free Consumer Care Number?
Service In Number In Percentage
Provider Yes No Yes No
BSNL 110 490 18% 82%
Hathway 33 96 26% 74%
Reliance 214 386 36% 64%
Tata Teleserives 99 248 29% 71%
Bharti Airtel 139 461 23% 77%
Tata Comm. 40 5 89% 11%
Broadband Pacenet 40 360 10% 90%
Total 675 2046 25% 75%
Source: IMM Analysis
Table C.89: If yes, how satisfied are you with the manner in which your complaint was addressed to such as intimation
of docket number and likely time for redressal of complaint, intimation of action taken on the complaint?
Service Provider
In Numbers In Percentage
1 2 3 4 5 6 7 1 2 3 4 5 6 7
BSNL 8 5 10 20 50 16 1 7% 5% 9% 18% 45% 15% 1%
Hathway 1 1 4 7 8 9 3 3% 3% 12% 21% 24% 27% 9%
Reliance 3 10 39 86 66 7 3 1% 5% 18% 40% 31% 3% 1%
Tata Teleserives
0 6 12 35 40 6 0 0% 6% 12% 35% 40% 6% 0%
Bharti Airtel 0 8 18 42 33 18 20 0% 6% 13% 30% 24% 13% 14%
Tata Comm. 2 1 3 7 20 5 2 5% 3% 8% 18% 50% 13% 5%
Broadband Pacenet
2 4 6 9 13 1 5 5% 10% 15% 23% 33% 3% 13%
Total 16 35 92 206 230 62 34 2% 5% 14% 31% 34% 9% 5%
Source: IMM Analysis
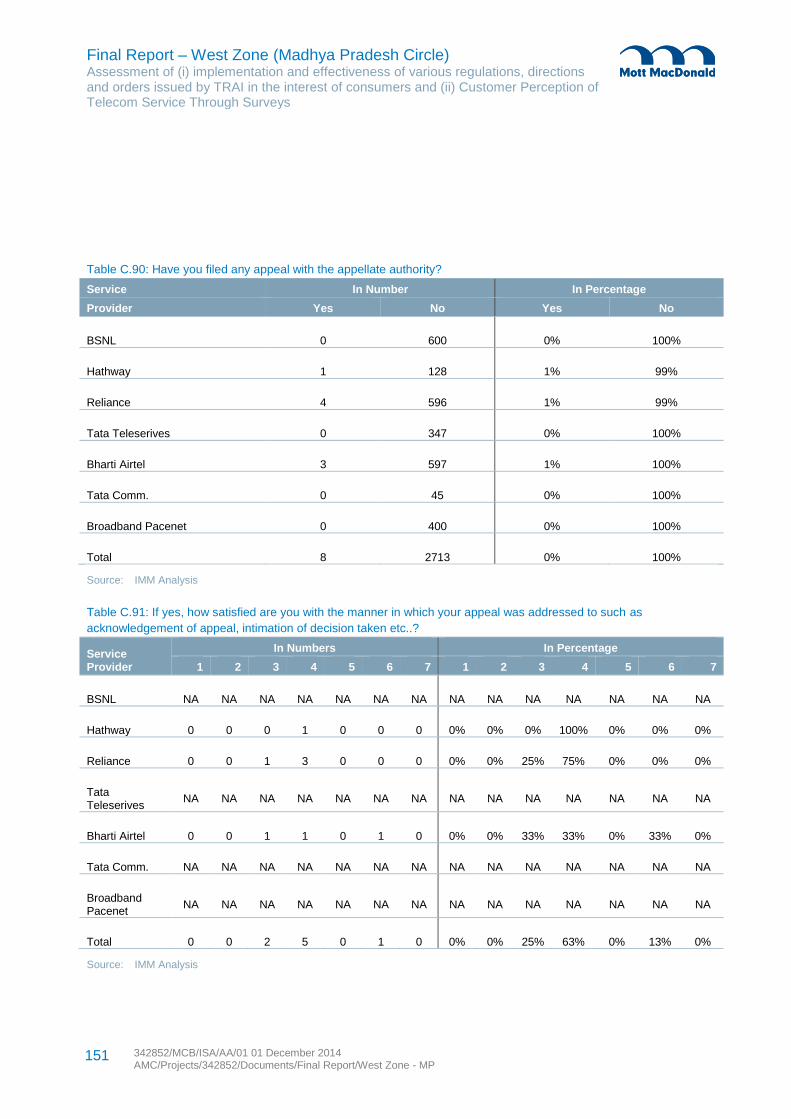
Final Report – West Zone (Madhya Pradesh Circle) Assessment of (i) implementation and effectiveness of various regulations, directions and orders issued by TRAI in the interest of consumers and (ii) Customer Perception of Telecom Service Through Surveys
342852/MCB/ISA/AA/01 01 December 2014 AMC/Projects/342852/Documents/Final Report/West Zone - MP
151
Table C.90: Have you filed any appeal with the appellate authority?
Service In Number In Percentage
Provider Yes No Yes No
BSNL 0 600 0% 100%
Hathway 1 128 1% 99%
Reliance 4 596 1% 99%
Tata Teleserives 0 347 0% 100%
Bharti Airtel 3 597 1% 100%
Tata Comm. 0 45 0% 100%
Broadband Pacenet 0 400 0% 100%
Total 8 2713 0% 100%
Source: IMM Analysis
Table C.91: If yes, how satisfied are you with the manner in which your appeal was addressed to such as
acknowledgement of appeal, intimation of decision taken etc..?
Service Provider
In Numbers In Percentage
1 2 3 4 5 6 7 1 2 3 4 5 6 7
BSNL NA NA NA NA NA NA NA NA NA NA NA NA NA NA
Hathway 0 0 0 1 0 0 0 0% 0% 0% 100% 0% 0% 0%
Reliance 0 0 1 3 0 0 0 0% 0% 25% 75% 0% 0% 0%
Tata Teleserives
NA NA NA NA NA NA NA NA NA NA NA NA NA NA
Bharti Airtel 0 0 1 1 0 1 0 0% 0% 33% 33% 0% 33% 0%
Tata Comm. NA NA NA NA NA NA NA NA NA NA NA NA NA NA
Broadband Pacenet
NA NA NA NA NA NA NA NA NA NA NA NA NA NA
Total 0 0 2 5 0 1 0 0% 0% 25% 63% 0% 13% 0%
Source: IMM Analysis
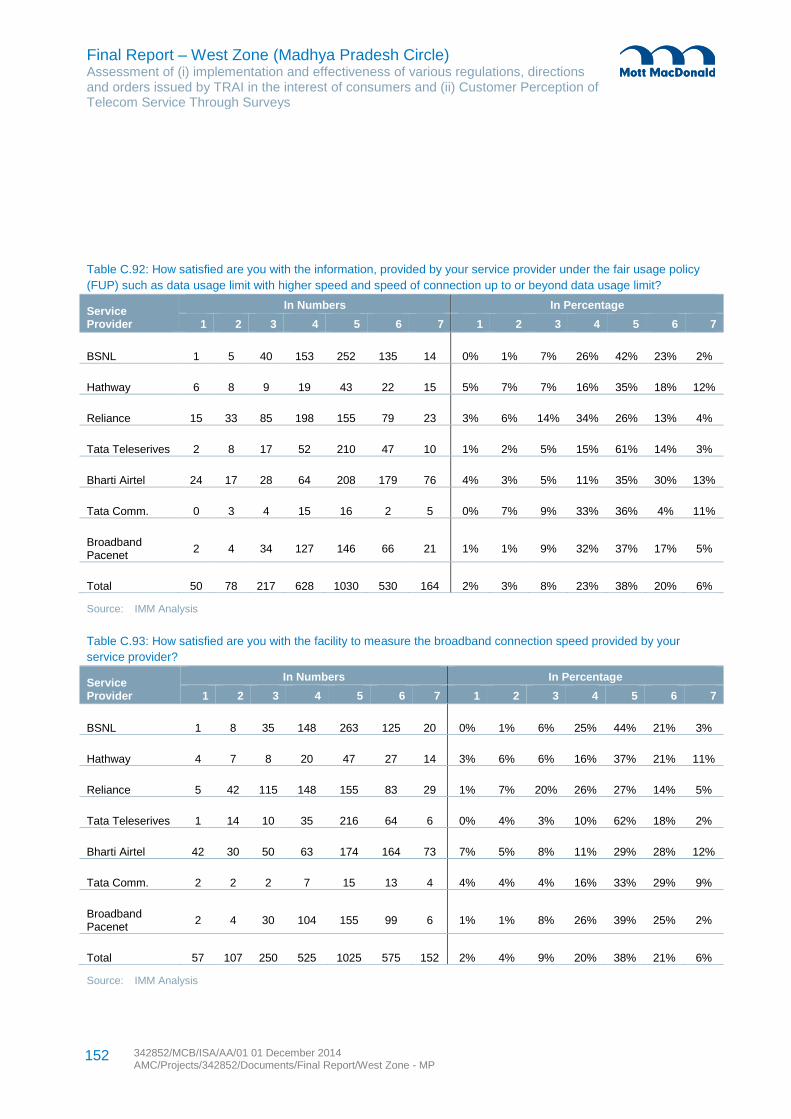
Final Report – West Zone (Madhya Pradesh Circle) Assessment of (i) implementation and effectiveness of various regulations, directions and orders issued by TRAI in the interest of consumers and (ii) Customer Perception of Telecom Service Through Surveys
342852/MCB/ISA/AA/01 01 December 2014 AMC/Projects/342852/Documents/Final Report/West Zone - MP
152
Table C.92: How satisfied are you with the information, provided by your service provider under the fair usage policy
(FUP) such as data usage limit with higher speed and speed of connection up to or beyond data usage limit?
Service Provider
In Numbers In Percentage
1 2 3 4 5 6 7 1 2 3 4 5 6 7
BSNL 1 5 40 153 252 135 14 0% 1% 7% 26% 42% 23% 2%
Hathway 6 8 9 19 43 22 15 5% 7% 7% 16% 35% 18% 12%
Reliance 15 33 85 198 155 79 23 3% 6% 14% 34% 26% 13% 4%
Tata Teleserives 2 8 17 52 210 47 10 1% 2% 5% 15% 61% 14% 3%
Bharti Airtel 24 17 28 64 208 179 76 4% 3% 5% 11% 35% 30% 13%
Tata Comm. 0 3 4 15 16 2 5 0% 7% 9% 33% 36% 4% 11%
Broadband Pacenet
2 4 34 127 146 66 21 1% 1% 9% 32% 37% 17% 5%
Total 50 78 217 628 1030 530 164 2% 3% 8% 23% 38% 20% 6%
Source: IMM Analysis
Table C.93: How satisfied are you with the facility to measure the broadband connection speed provided by your
service provider?
Service Provider
In Numbers In Percentage
1 2 3 4 5 6 7 1 2 3 4 5 6 7
BSNL 1 8 35 148 263 125 20 0% 1% 6% 25% 44% 21% 3%
Hathway 4 7 8 20 47 27 14 3% 6% 6% 16% 37% 21% 11%
Reliance 5 42 115 148 155 83 29 1% 7% 20% 26% 27% 14% 5%
Tata Teleserives 1 14 10 35 216 64 6 0% 4% 3% 10% 62% 18% 2%
Bharti Airtel 42 30 50 63 174 164 73 7% 5% 8% 11% 29% 28% 12%
Tata Comm. 2 2 2 7 15 13 4 4% 4% 4% 16% 33% 29% 9%
Broadband Pacenet
2 4 30 104 155 99 6 1% 1% 8% 26% 39% 25% 2%
Total 57 107 250 525 1025 575 152 2% 4% 9% 20% 38% 21% 6%
Source: IMM Analysis
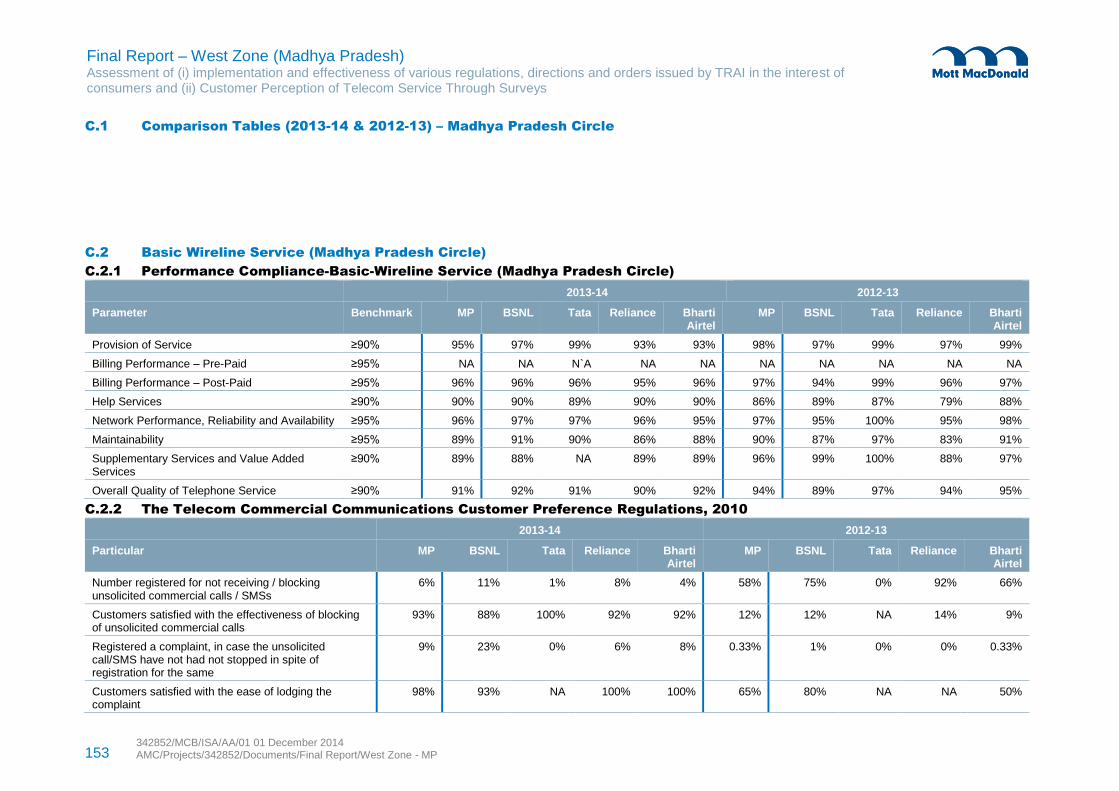
153 342852/MCB/ISA/AA/01 01 December 2014 AMC/Projects/342852/Documents/Final Report/West Zone - MP
Final Report – West Zone (Madhya Pradesh) Assessment of (i) implementation and effectiveness of various regulations, directions and orders issued by TRAI in the interest of consumers and (ii) Customer Perception of Telecom Service Through Surveys
C.1 Comparison Tables (2013-14 & 2012-13) – Madhya Pradesh Circle
C.2 Basic Wireline Service (Madhya Pradesh Circle)
C.2.1 Performance Compliance-Basic-Wireline Service (Madhya Pradesh Circle)
2013-14 2012-13
Parameter Benchmark MP BSNL Tata Reliance Bharti Airtel
MP BSNL Tata Reliance Bharti Airtel
Provision of Service ≥90% 95% 97% 99% 93% 93% 98% 97% 99% 97% 99%
Billing Performance – Pre-Paid ≥95% NA NA N`A NA NA NA NA NA NA NA
Billing Performance – Post-Paid ≥95% 96% 96% 96% 95% 96% 97% 94% 99% 96% 97%
Help Services ≥90% 90% 90% 89% 90% 90% 86% 89% 87% 79% 88%
Network Performance, Reliability and Availability ≥95% 96% 97% 97% 96% 95% 97% 95% 100% 95% 98%
Maintainability ≥95% 89% 91% 90% 86% 88% 90% 87% 97% 83% 91%
Supplementary Services and Value Added Services
≥90% 89% 88% NA 89% 89% 96% 99% 100% 88% 97%
Overall Quality of Telephone Service ≥90% 91% 92% 91% 90% 92% 94% 89% 97% 94% 95%
C.2.2 The Telecom Commercial Communications Customer Preference Regulations, 2010
2013-14 2012-13
Particular MP BSNL Tata Reliance Bharti Airtel
MP BSNL Tata Reliance Bharti Airtel
Number registered for not receiving / blocking unsolicited commercial calls / SMSs
6% 11% 1% 8% 4% 58% 75% 0% 92% 66%
Customers satisfied with the effectiveness of blocking of unsolicited commercial calls
93% 88% 100% 92% 92% 12% 12% NA 14% 9%
Registered a complaint, in case the unsolicited call/SMS have not had not stopped in spite of registration for the same
9% 23% 0% 6% 8% 0.33% 1% 0% 0% 0.33%
Customers satisfied with the ease of lodging the complaint
98% 93% NA 100% 100% 65% 80% NA NA 50%
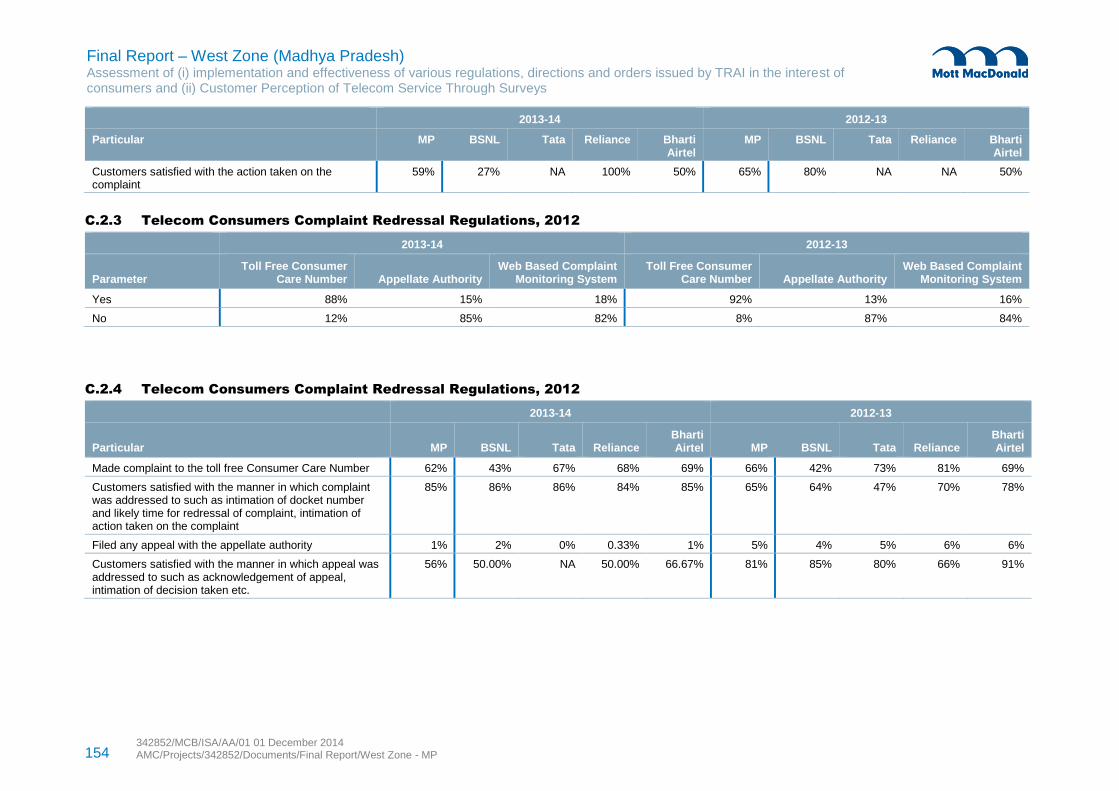
154 342852/MCB/ISA/AA/01 01 December 2014 AMC/Projects/342852/Documents/Final Report/West Zone - MP
Final Report – West Zone (Madhya Pradesh) Assessment of (i) implementation and effectiveness of various regulations, directions and orders issued by TRAI in the interest of consumers and (ii) Customer Perception of Telecom Service Through Surveys
2013-14 2012-13
Particular MP BSNL Tata Reliance Bharti Airtel
MP BSNL Tata Reliance Bharti Airtel
Customers satisfied with the action taken on the complaint
59% 27% NA 100% 50% 65% 80% NA NA 50%
C.2.3 Telecom Consumers Complaint Redressal Regulations, 2012
2013-14 2012-13
Parameter Toll Free Consumer
Care Number Appellate Authority Web Based Complaint
Monitoring System Toll Free Consumer
Care Number Appellate Authority Web Based Complaint
Monitoring System
Yes 88% 15% 18% 92% 13% 16%
No 12% 85% 82% 8% 87% 84%
C.2.4 Telecom Consumers Complaint Redressal Regulations, 2012
2013-14 2012-13
Particular MP BSNL Tata Reliance Bharti Airtel MP BSNL Tata Reliance
Bharti Airtel
Made complaint to the toll free Consumer Care Number 62% 43% 67% 68% 69% 66% 42% 73% 81% 69%
Customers satisfied with the manner in which complaint was addressed to such as intimation of docket number and likely time for redressal of complaint, intimation of action taken on the complaint
85% 86% 86% 84% 85% 65% 64% 47% 70% 78%
Filed any appeal with the appellate authority 1% 2% 0% 0.33% 1% 5% 4% 5% 6% 6%
Customers satisfied with the manner in which appeal was addressed to such as acknowledgement of appeal, intimation of decision taken etc.
56% 50.00% NA 50.00% 66.67% 81% 85% 80% 66% 91%
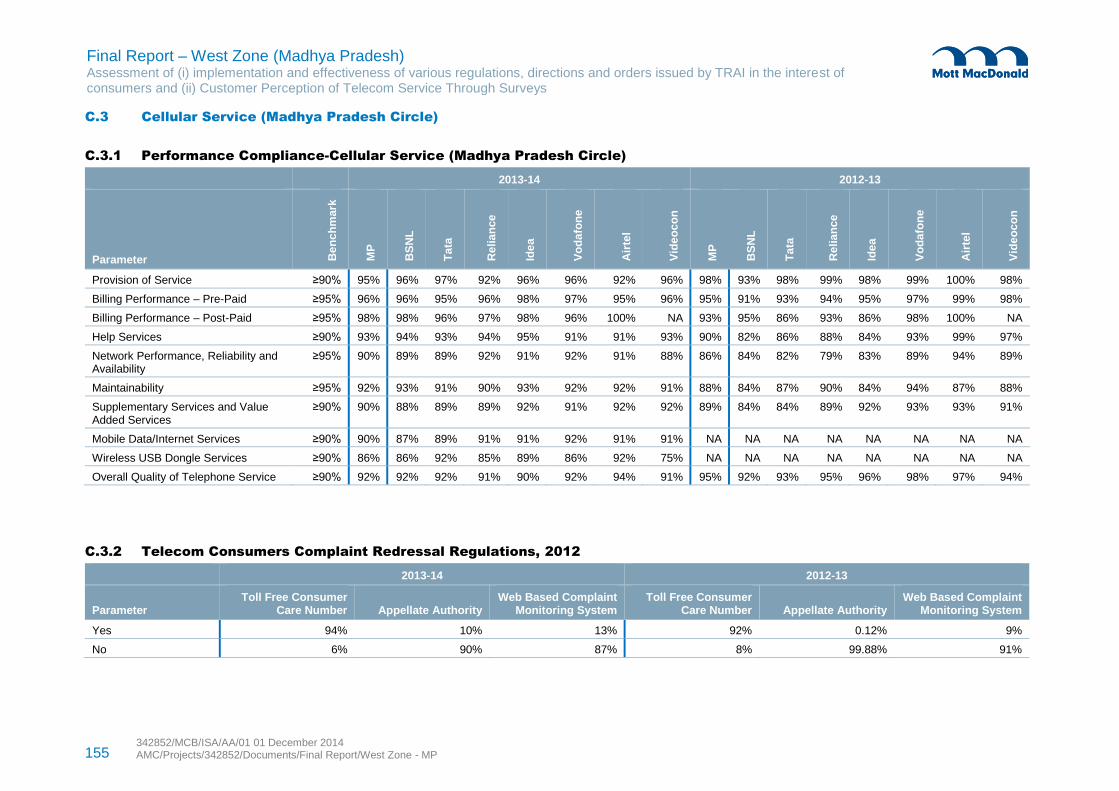
155 342852/MCB/ISA/AA/01 01 December 2014 AMC/Projects/342852/Documents/Final Report/West Zone - MP
Final Report – West Zone (Madhya Pradesh) Assessment of (i) implementation and effectiveness of various regulations, directions and orders issued by TRAI in the interest of consumers and (ii) Customer Perception of Telecom Service Through Surveys
C.3 Cellular Service (Madhya Pradesh Circle)
C.3.1 Performance Compliance-Cellular Service (Madhya Pradesh Circle)
2013-14 2012-13
Parameter Be
nc
hm
ark
MP
BS
NL
Ta
ta
Re
lia
nce
Ide
a
Vo
da
fon
e
Air
tel
Vid
eo
co
n
MP
BS
NL
Ta
ta
Re
lia
nce
Ide
a
Vo
da
fon
e
Air
tel
Vid
eo
co
n
Provision of Service ≥90% 95% 96% 97% 92% 96% 96% 92% 96% 98% 93% 98% 99% 98% 99% 100% 98%
Billing Performance – Pre-Paid ≥95% 96% 96% 95% 96% 98% 97% 95% 96% 95% 91% 93% 94% 95% 97% 99% 98%
Billing Performance – Post-Paid ≥95% 98% 98% 96% 97% 98% 96% 100% NA 93% 95% 86% 93% 86% 98% 100% NA
Help Services ≥90% 93% 94% 93% 94% 95% 91% 91% 93% 90% 82% 86% 88% 84% 93% 99% 97%
Network Performance, Reliability and Availability
≥95% 90% 89% 89% 92% 91% 92% 91% 88% 86% 84% 82% 79% 83% 89% 94% 89%
Maintainability ≥95% 92% 93% 91% 90% 93% 92% 92% 91% 88% 84% 87% 90% 84% 94% 87% 88%
Supplementary Services and Value Added Services
≥90% 90% 88% 89% 89% 92% 91% 92% 92% 89% 84% 84% 89% 92% 93% 93% 91%
Mobile Data/Internet Services ≥90% 90% 87% 89% 91% 91% 92% 91% 91% NA NA NA NA NA NA NA NA
Wireless USB Dongle Services ≥90% 86% 86% 92% 85% 89% 86% 92% 75% NA NA NA NA NA NA NA NA
Overall Quality of Telephone Service ≥90% 92% 92% 92% 91% 90% 92% 94% 91% 95% 92% 93% 95% 96% 98% 97% 94%
C.3.2 Telecom Consumers Complaint Redressal Regulations, 2012
2013-14 2012-13
Parameter Toll Free Consumer
Care Number Appellate Authority Web Based Complaint
Monitoring System Toll Free Consumer
Care Number Appellate Authority Web Based Complaint
Monitoring System
Yes 94% 10% 13% 92% 0.12% 9%
No 6% 90% 87% 8% 99.88% 91%
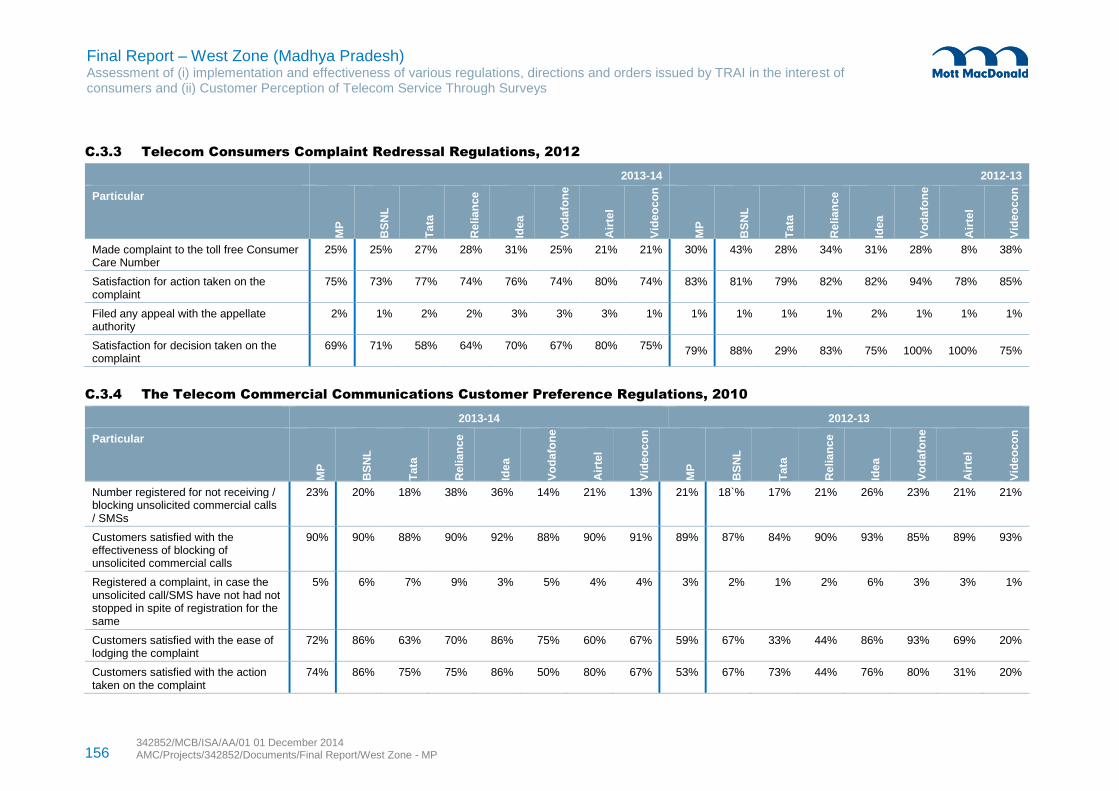
156 342852/MCB/ISA/AA/01 01 December 2014 AMC/Projects/342852/Documents/Final Report/West Zone - MP
Final Report – West Zone (Madhya Pradesh) Assessment of (i) implementation and effectiveness of various regulations, directions and orders issued by TRAI in the interest of consumers and (ii) Customer Perception of Telecom Service Through Surveys
C.3.3 Telecom Consumers Complaint Redressal Regulations, 2012
2013-14 2012-13
Particular
MP
BS
NL
Ta
ta
Re
lia
nce
Ide
a
Vo
da
fon
e
Air
tel
Vid
eo
co
n
MP
BS
NL
Ta
ta
Re
lia
nce
Ide
a
Vo
da
fon
e
Air
tel
Vid
eo
co
n
Made complaint to the toll free Consumer Care Number
25% 25% 27% 28% 31% 25% 21% 21% 30% 43% 28% 34% 31% 28% 8% 38%
Satisfaction for action taken on the complaint
75% 73% 77% 74% 76% 74% 80% 74% 83% 81% 79% 82% 82% 94% 78% 85%
Filed any appeal with the appellate authority
2% 1% 2% 2% 3% 3% 3% 1% 1% 1% 1% 1% 2% 1% 1% 1%
Satisfaction for decision taken on the complaint
69% 71% 58% 64% 70% 67% 80% 75% 79% 88% 29% 83% 75% 100% 100% 75%
C.3.4 The Telecom Commercial Communications Customer Preference Regulations, 2010
2013-14 2012-13
Particular
MP
BS
NL
Ta
ta
Re
lia
nce
Ide
a
Vo
da
fon
e
Air
tel
Vid
eo
co
n
MP
BS
NL
Ta
ta
Re
lia
nce
Ide
a
Vo
da
fon
e
Air
tel
Vid
eo
co
n
Number registered for not receiving / blocking unsolicited commercial calls / SMSs
23% 20% 18% 38% 36% 14% 21% 13% 21% 18`% 17% 21% 26% 23% 21% 21%
Customers satisfied with the effectiveness of blocking of unsolicited commercial calls
90% 90% 88% 90% 92% 88% 90% 91% 89% 87% 84% 90% 93% 85% 89% 93%
Registered a complaint, in case the unsolicited call/SMS have not had not stopped in spite of registration for the same
5% 6% 7% 9% 3% 5% 4% 4% 3% 2% 1% 2% 6% 3% 3% 1%
Customers satisfied with the ease of lodging the complaint
72% 86% 63% 70% 86% 75% 60% 67% 59% 67% 33% 44% 86% 93% 69% 20%
Customers satisfied with the action taken on the complaint
74% 86% 75% 75% 86% 50% 80% 67% 53% 67% 73% 44% 76% 80% 31% 20%
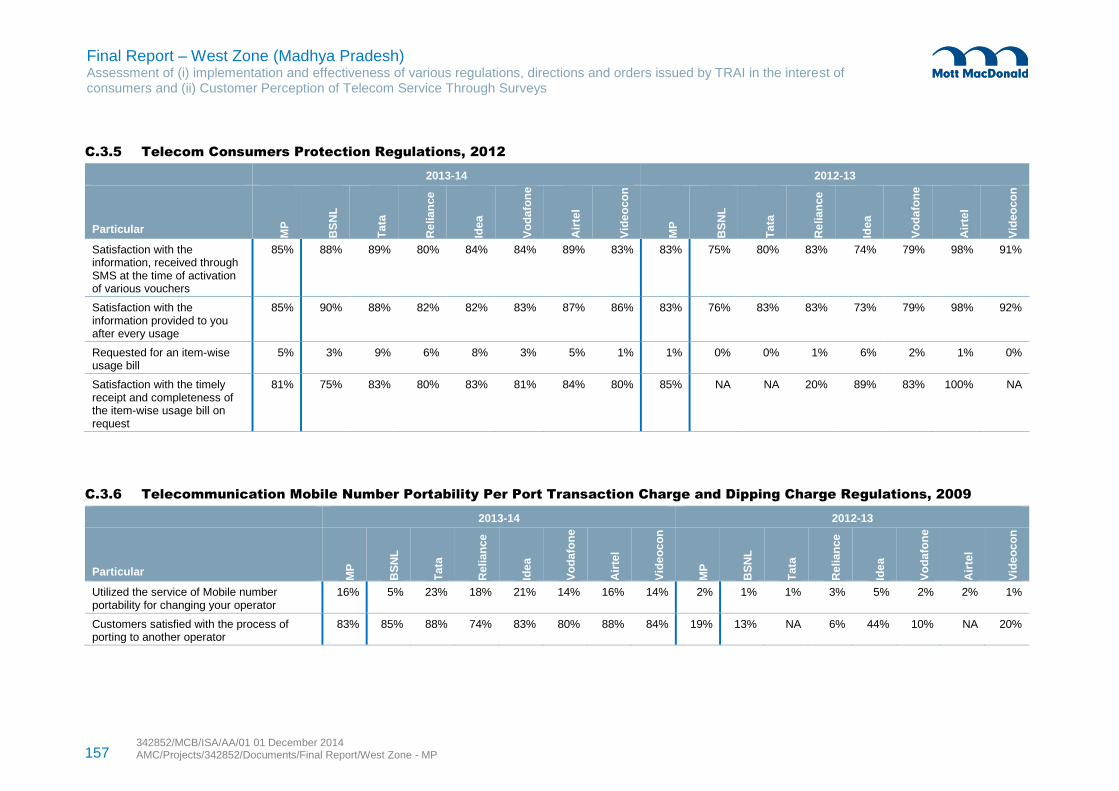
157 342852/MCB/ISA/AA/01 01 December 2014 AMC/Projects/342852/Documents/Final Report/West Zone - MP
Final Report – West Zone (Madhya Pradesh) Assessment of (i) implementation and effectiveness of various regulations, directions and orders issued by TRAI in the interest of consumers and (ii) Customer Perception of Telecom Service Through Surveys
C.3.5 Telecom Consumers Protection Regulations, 2012
2013-14 2012-13
Particular
MP
BS
NL
Ta
ta
Re
lia
nce
Ide
a
Vo
da
fon
e
Air
tel
Vid
eo
co
n
MP
BS
NL
Ta
ta
Re
lia
nce
Ide
a
Vo
da
fon
e
Air
tel
Vid
eo
co
n
Satisfaction with the information, received through SMS at the time of activation of various vouchers
85% 88% 89% 80% 84% 84% 89% 83% 83% 75% 80% 83% 74% 79% 98% 91%
Satisfaction with the information provided to you after every usage
85% 90% 88% 82% 82% 83% 87% 86% 83% 76% 83% 83% 73% 79% 98% 92%
Requested for an item-wise usage bill
5% 3% 9% 6% 8% 3% 5% 1% 1% 0% 0% 1% 6% 2% 1% 0%
Satisfaction with the timely receipt and completeness of the item-wise usage bill on request
81% 75% 83% 80% 83% 81% 84% 80% 85% NA NA 20% 89% 83% 100% NA
C.3.6 Telecommunication Mobile Number Portability Per Port Transaction Charge and Dipping Charge Regulations, 2009
2013-14 2012-13
Particular MP
BS
NL
Ta
ta
Re
lia
nce
Ide
a
Vo
da
fon
e
Air
tel
Vid
eo
co
n
MP
BS
NL
Ta
ta
Re
lia
nce
Ide
a
Vo
da
fon
e
Air
tel
Vid
eo
co
n
Utilized the service of Mobile number portability for changing your operator
16% 5% 23% 18% 21% 14% 16% 14% 2% 1% 1% 3% 5% 2% 2% 1%
Customers satisfied with the process of porting to another operator
83% 85% 88% 74% 83% 80% 88% 84% 19% 13% NA 6% 44% 10% NA 20%
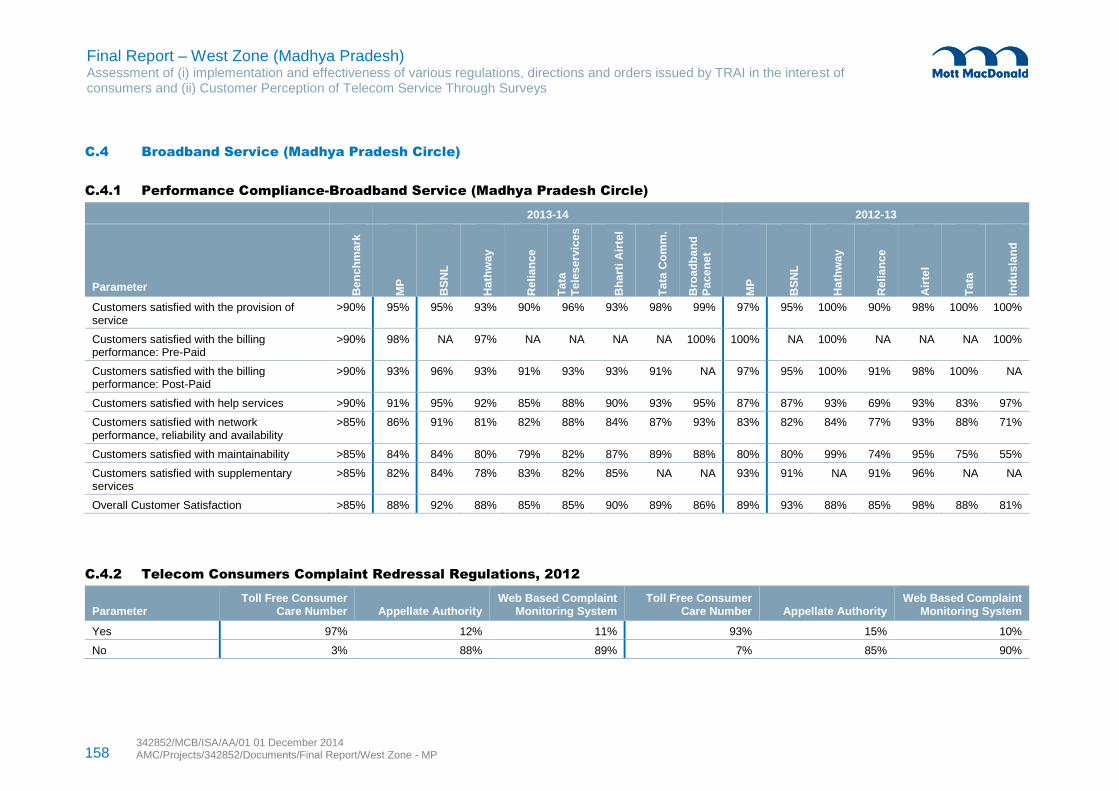
158 342852/MCB/ISA/AA/01 01 December 2014 AMC/Projects/342852/Documents/Final Report/West Zone - MP
Final Report – West Zone (Madhya Pradesh) Assessment of (i) implementation and effectiveness of various regulations, directions and orders issued by TRAI in the interest of consumers and (ii) Customer Perception of Telecom Service Through Surveys
C.4 Broadband Service (Madhya Pradesh Circle)
C.4.1 Performance Compliance-Broadband Service (Madhya Pradesh Circle)
2013-14 2012-13
Parameter Be
nc
hm
ark
MP
BS
NL
Ha
thw
ay
Re
lia
nce
Ta
ta
Te
les
erv
ices
Bh
art
i A
irte
l
Ta
ta C
om
m.
Bro
ad
ba
nd
Pa
ce
ne
t
MP
BS
NL
Ha
thw
ay
Re
lia
nce
Air
tel
Ta
ta
Ind
us
lan
d
Customers satisfied with the provision of service
>90% 95% 95% 93% 90% 96% 93% 98% 99% 97% 95% 100% 90% 98% 100% 100%
Customers satisfied with the billing performance: Pre-Paid
>90% 98% NA 97% NA NA NA NA 100% 100% NA 100% NA NA NA 100%
Customers satisfied with the billing performance: Post-Paid
>90% 93% 96% 93% 91% 93% 93% 91% NA 97% 95% 100% 91% 98% 100% NA
Customers satisfied with help services >90% 91% 95% 92% 85% 88% 90% 93% 95% 87% 87% 93% 69% 93% 83% 97%
Customers satisfied with network performance, reliability and availability
>85% 86% 91% 81% 82% 88% 84% 87% 93% 83% 82% 84% 77% 93% 88% 71%
Customers satisfied with maintainability >85% 84% 84% 80% 79% 82% 87% 89% 88% 80% 80% 99% 74% 95% 75% 55%
Customers satisfied with supplementary services
>85% 82% 84% 78% 83% 82% 85% NA NA 93% 91% NA 91% 96% NA NA
Overall Customer Satisfaction >85% 88% 92% 88% 85% 85% 90% 89% 86% 89% 93% 88% 85% 98% 88% 81%
C.4.2 Telecom Consumers Complaint Redressal Regulations, 2012
Parameter Toll Free Consumer
Care Number Appellate Authority Web Based Complaint
Monitoring System Toll Free Consumer
Care Number Appellate Authority Web Based Complaint
Monitoring System
Yes 97% 12% 11% 93% 15% 10%
No 3% 88% 89% 7% 85% 90%
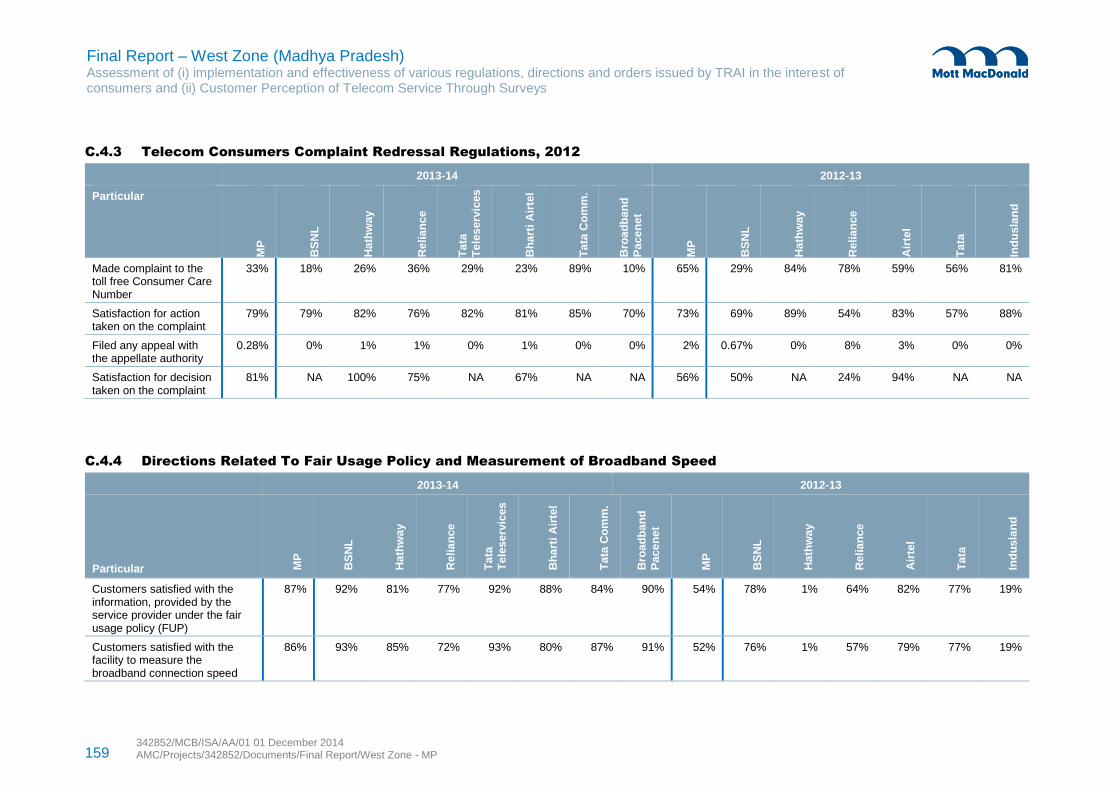
159 342852/MCB/ISA/AA/01 01 December 2014 AMC/Projects/342852/Documents/Final Report/West Zone - MP
Final Report – West Zone (Madhya Pradesh) Assessment of (i) implementation and effectiveness of various regulations, directions and orders issued by TRAI in the interest of consumers and (ii) Customer Perception of Telecom Service Through Surveys
C.4.3 Telecom Consumers Complaint Redressal Regulations, 2012
2013-14 2012-13
Particular
MP
BS
NL
Ha
thw
ay
Re
lia
nce
Ta
ta
Te
les
erv
ices
Bh
art
i A
irte
l
Ta
ta C
om
m.
Bro
ad
ba
nd
Pa
ce
ne
t
MP
BS
NL
Ha
thw
ay
Re
lia
nce
Air
tel
Ta
ta
Ind
us
lan
d
Made complaint to the toll free Consumer Care Number
33% 18% 26% 36% 29% 23% 89% 10% 65% 29% 84% 78% 59% 56% 81%
Satisfaction for action taken on the complaint
79% 79% 82% 76% 82% 81% 85% 70% 73% 69% 89% 54% 83% 57% 88%
Filed any appeal with the appellate authority
0.28% 0% 1% 1% 0% 1% 0% 0% 2% 0.67% 0% 8% 3% 0% 0%
Satisfaction for decision taken on the complaint
81% NA 100% 75% NA 67% NA NA 56% 50% NA 24% 94% NA NA
C.4.4 Directions Related To Fair Usage Policy and Measurement of Broadband Speed
2013-14 2012-13
Particular MP
BS
NL
Ha
thw
ay
Re
lia
nce
Ta
ta
Te
les
erv
ices
Bh
art
i A
irte
l
Ta
ta C
om
m.
Bro
ad
ba
nd
Pa
ce
ne
t
MP
BS
NL
Ha
thw
ay
Re
lia
nce
Air
tel
Ta
ta
Ind
us
lan
d
Customers satisfied with the information, provided by the service provider under the fair usage policy (FUP)
87% 92% 81% 77% 92% 88% 84% 90% 54% 78% 1% 64% 82% 77% 19%
Customers satisfied with the facility to measure the broadband connection speed
86% 93% 85% 72% 93% 80% 87% 91% 52% 76% 1% 57% 79% 77% 19%
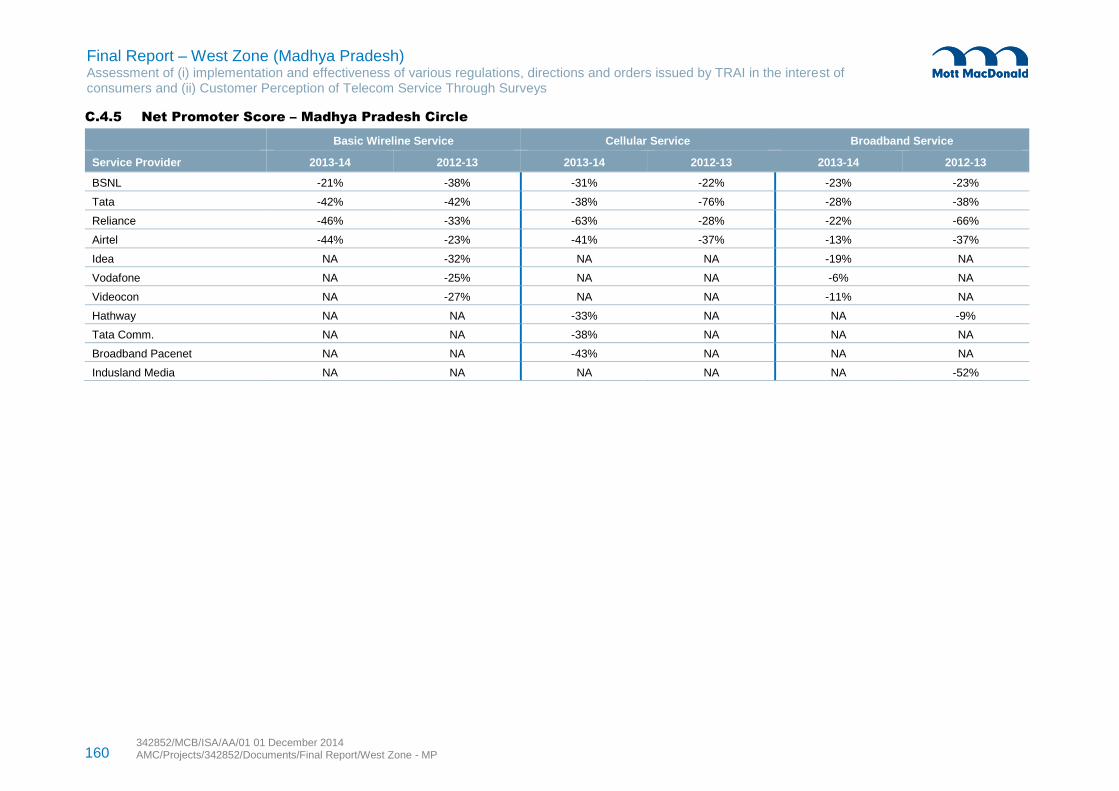
160 342852/MCB/ISA/AA/01 01 December 2014 AMC/Projects/342852/Documents/Final Report/West Zone - MP
Final Report – West Zone (Madhya Pradesh) Assessment of (i) implementation and effectiveness of various regulations, directions and orders issued by TRAI in the interest of consumers and (ii) Customer Perception of Telecom Service Through Surveys
C.4.5 Net Promoter Score – Madhya Pradesh Circle
Basic Wireline Service Cellular Service Broadband Service
Service Provider 2013-14 2012-13 2013-14 2012-13 2013-14 2012-13
BSNL -21% -38% -31% -22% -23% -23%
Tata -42% -42% -38% -76% -28% -38%
Reliance -46% -33% -63% -28% -22% -66%
Airtel -44% -23% -41% -37% -13% -37%
Idea NA -32% NA NA -19% NA
Vodafone NA -25% NA NA -6% NA
Videocon NA -27% NA NA -11% NA
Hathway NA NA -33% NA NA -9%
Tata Comm. NA NA -38% NA NA NA
Broadband Pacenet NA NA -43% NA NA NA
Indusland Media NA NA NA NA NA -52%
Final Report – West Zone (Madhya Pradesh) Assessment of (i) implementation and effectiveness of various regulations, directions and orders issued by TRAI in the interest of consumers and (ii) Customer Perception of Telecom Service Through Surveys
342852/MCB/ISA/AA/01 01 December 2014 AMC/Projects/342852/Documents/Final Report/West Zone - MP
161