Copyright is owned by the Author of the thesis. Permission is given for a copy to be downloaded by an individual for the purpose of research and private study only. The thesis may not be reproduced elsewhere without the permission of the Author.

FFeeeeddiinngg eeccoollooggyy ooff tthhee NNeeww ZZeeaallaanndd sseeaa ll iioonn
((PPhhooccaarrccttooss hhooookkeerrii))
A thesis presented in partial fulfilment of
the requirements for the degree of
Doctor of Philosophy
in
Zoology
At Massey University,
Palmerston North, New Zealand
Laureline Meynier
2009

ii

iii
Abstract
Feeding ecology of the New Zealand sea lion
(Phocarctos hookeri)
The New Zealand (NZ) sea lion Phocarctos hookeri is the only pinniped endemic to NZ
with a population of approximately 12,000 individuals. Its breeding range is currently
restricted to NZ sub-Antarctic islands, and it has failed to recolonise its pristine
distribution around the NZ main islands despite its protection since 1881. The current
hypothesis is that the population growth of this pinniped is limited by the distribution of
suitable prey on the Auckland Islands (50°30'S, 166°E) shelf, and by the direct and
indirect pressure exerted by the arrow squid Nototodarus sloani fishery. However, this
hypothesis has not been fully tested to date as there has been limited information on the
diet of the NZ sea lion and their potential prey. The objective of this thesis is to analyse
the diet of NZ sea lions over several years with particular emphasis on the most
reproductively important segment of the population: lactating females.
This thesis provides the first quantification by percentage mass of the diet of NZ sea
lion using a combination of stomach content analysis, qualitative fatty acid (FA)
analysis, and quantitative FA signature analysis (QFASA). Stomach contents and
blubber FAs were analysed from 121 individuals incidentally caught (by-caught) in the
southern arrow squid fishery from the years 1997 to 2006. The blubber FAs of 78 free-
ranging lactating females captured at Enderby Island, Auckland Islands, were also
examined during January and February of 2000 to 2005.
Data obtained from both stomach analysis and QFASA indicate that arrow squid,
rattails Macrouridae, hoki Macruronus novaezelandiae and red cod Pseudophycis
bachus are key prey species for NZ sea lions in the Auckland Islands region. Because
these prey species live mostly at depths greater than 200 m, lactating females must
undertake long foraging trips and dive regularly to greater depths than other sea lion
species. Data from QFASA indicates that this foraging pattern is conducted over an
extended period through the summer and autumn. The daily food requirement of a
lactating female was estimated by a simple energetic model to be greater than 20% of its
body mass. During years of low arrow squid recruitment such as 1999 and 2001, the

iv
amounts of squid required by the NZ sea lion population may have been similar to the
amount harvested by the fishery, suggesting that resource competition is likely to occur
between the arrow squid fishery and NZ sea lions in years of low squid abundance.
Half of the fishing activity of the southern squid fishery occurs in the north of the
Auckland Islands shelf where NZ sea lions forage, leading to incidental captures every
year. This research emphasises that management of the NZ sea lion must not only
consider the direct interactions with the arrow squid fishery, but also the likelihood of
food resource competition between the fishery and NZ sea lions.

v
Acknowledgements
First of all, I would like to thank Dr Pádraig Duignan, my main supervisor from 2004 to
2006, for giving me the opportunity to conduct a PhD on the New Zealand sea lion at
the Institute of Veterinary, Animal, and Biomedical Sciences (IVABS), and A/Prof.
Patrick Morel for accepting the main supervision of my project since 2006. I also
address my thanks to my co-supervisors Dr. Louise Chilvers (Department of
Conservation), A/Prof. Duncan Mackenzie (Institute of Food, Nutrition, and Human
Health IFNHH, Massey University) and Dr. Alastair MacGibbon (Fonterra Research
Centre, Palmerston North) for all the time and effort they put into this project and the
feedback they provided on the numerous drafts. I am especially grateful to Louise
Chilvers for her strong support and motivation, and for giving me the opportunity to go
to the Auckland Islands. Big thanks to Patrick Morel who was able to adapt his
expertise from pigs to New Zealand sea lions with great enthusiasm. I reserve a special
gratitude to Dr. Wendi Roe who provided strong support morally and financially in the
second half of my PhD. Thanks to my three examiners Dr. Murray Potter, Dr. Simon
Childerhouse and Prof. Mark Hindell, for reviewing my PhD thesis.
This project was sponsored by the Massey University Research Fund, the Lewis Fitch
Research Fund, the Postgraduate Research Fund of the IVABS, the Whale and Dolphin
Adoption Project, and the Conservation Services Programme of the Department of
Conservation through levies on the commercial Fishing Industry. I am grateful to the
graduate research school which funded me personally through the Massey University
Doctoral scholarship for three years. My travel expenses to international conferences
were partly funded by the IVABS.
Stomach contents, blubber samples, fish, cephalopods and crustaceans analysed in this
project were collected with the help of many people. I have included an
acknowledgement paragraph at the end of all research chapters which recognises
specific contributions. I wish to thank Pádraig Duignan who supervised most of the
necropsies until 2006, and the people who assisted with the necropsies over the past ten
years including Mana Stratton, Nadine Gibbs, Monica Bando, Federico Riet-Sapriza

vi
and Gareth Jones. Blubber biopsies at Enderby Island were under the supervision of Ian
Wilkinson and Louise Chilvers.
Fish, cephalopods and crustaceans were collected by the National Institute of Water and
Atmospheric research (NIWA) during the Tangaroa sub-Antarctic survey, and by the
Ministry of Fisheries observers on the arrow squid and scampi fisheries. Special thanks
to Nigel Hollands (MFish observer programme), Darren Stevens (NIWA) and Neil
Bagley (NIWA) for providing the specimens. I am grateful to Gavin James (NIWA)
who lent me some of his reference material at the beginning of my project, and to Matt
Dunn (NIWA) who provided some fish from the Chatham Rise for my reference
collection.
The development of my laboratory protocol for fatty acid analysis would not have been
possible without the help and advice from numerous people. I wish to thank Robert
Galois (Ifremer, France), Jennifer Learmonth (University of Aberdeen, UK), Mike
Walton (SMRU, UK), Maggie Zou (IFNHH, Massey University), and Mark Reynolds
(Fonterra Research Centre) for sharing their laboratory protocol and for their advice
concerning the lipid extraction from adipose tissue. For their guidance on how to use the
gas chromatograph, I am grateful to Mike Walton, Maggie Zou, Mark Reynolds and
Bruce Fraser (chromatography adviser at Shimadzu Corporation). Concerning
quantitative fatty acid signature analysis, I address my special thanks to Mike Walton
who provided the programme Fascalc, and to Dom Tollit (UBC, Canada) who provided
the calibration coefficients calculated from Steller sea lions. Ryan Sherriff (Brimble
Sherriff Young Limited, NZ) programmed the optimisation model for Massey
University.
I appreciated the assistance of Lynn Rogers, Julianna Sebestyen, Junying Ye, and Laura
Donaldson in the FA analysis of blubber and fish samples at the IVABS. Thanks to
Fliss Jackson and Leiza Turnbull who were responsible for the lyophilisation of tissues,
the protein content analysis and the energy content analysis processed at the IFNHH.
My acknowledgements to Jeff Forman, Matt Dunn, Mike Williams, Neil Bagley and
Darren Stevens at NIWA who provided valuable inputs to my discussion concerning
fish distribution and oceanographic variables in the NZ waters. I also express my

vii
sincere gratitude to Karen Stockin for reviewing my entire thesis and providing helpful
corrections, and to Dom Tollit and Mike Walton for providing wise comments on my
Chapter 4.
During my four years as a PhD student, I appreciated the kindness and friendship of the
people working at the IVABS. I wish to thank particularly Allain Scott and Kevin
Stafford for their strong academic support. Allain, you were very helpful at the first
stages of my enrolment at Massey University, and in providing a positive and
welcoming work environment. The kindness of my office mates has been very
important to me morally. Big thanks to Megan and Troy for their welcome when I
arrived, Jo for her friendship, and Amanda and Zoe who had to support the last stressful
months of my PhD. My gratitude to Karen Stockin who found me a nice office at
Albany campus, and to my “temporary” office mates: Sara Whitwells, Shauna Baillie,
Gabriel Machovsky Capuska and Manue Martinez. Gabriel and Manue, thanks for the
essential training of table football in the necessary breaks of my final writing stage.
I wish to thank my former supervisors Vincent Ridoux and Graham Pierce, who taught
me the “art” of stomach analysis on marine mammals, and guided me through my
studies before this PhD. Your advice on writing turned out to be very helpful during my
PhD.
I am grateful to a remarkable and inspiring man Jacques-Yves Cousteau, who showed
millions of children the beauties of the “silent world”. His life has certainly inspired my
vocation of becoming a marine biologist.
Last, I shall dedicate this work to my parents who gave me their support to follow my
dreams since my childhood, and to my fabulous knight for his encouragement,
understanding, and affection.

viii

ix
List of Abbreviations
CC Calibration coefficient
FA Fatty acid
FAMES Fatty acid methyl esters
Im Immature
K-W Kruskall Wallis (test)
LF Lactating female
Ma Male
MUFA Monounsaturated fatty acid
M-W Mann Whitney (test)
NLF Non-lactating female
NZ New Zealand
PUFA Polyunsaturated fatty acid
QFASA Quantitative fatty acid signature analysis
SAFA Saturated fatty acid
TAG Triacylglycerol


xi
Table of Contents
1 Chapter 1 .................................................................................................................1
General introduction and literature review..................................................................1
1.1 General introduction..........................................................................................2
1.2 NZ sea lion biology...........................................................................................3
1.2.1 Distribution ...............................................................................................3
1.2.2 Abundance and trends ...............................................................................5
1.2.3 Breeding biology and lactation .................................................................6
1.2.4 Management of the squid fishery at the Auckland Islands .......................7
1.2.5 Foraging and feeding behaviour................................................................8
1.2.6 Summary of NZ sea lion biology..............................................................9
1.3 Methods for dietary studies on marine mammals ...........................................10
1.3.1 “Traditional” diet methods: faeces and stomach analyses ......................12
1.3.2 DNA extraction from scat samples .........................................................14
1.3.3 Stable isotopes.........................................................................................16
1.3.4 FA signature analysis ..............................................................................20
1.3.5 Summary of dietary methods ..................................................................27
1.4 Outline of the thesis ........................................................................................27
2 Chapter 2 ...............................................................................................................29
Variability in the diet of New Zealand sea lion at the Auckland Islands, New
Zealand...........................................................................................................................29
2.1 Introduction.....................................................................................................31
2.2 Materials and methods ....................................................................................32
2.2.1 Sample collection....................................................................................32
2.2.2 Stomach analysis.....................................................................................33
2.2.3 Statistical analysis ...................................................................................35
2.3 Results.............................................................................................................39
2.3.1 Overall diet..............................................................................................39
2.3.2 Dietary variation (digested fraction) .......................................................42
2.4 Discussion .......................................................................................................43
2.4.1 Limitations of the study ..........................................................................45
2.4.2 Feeding ecology of the NZ sea lion ........................................................46
2.4.3 Ontogenic variation in diet......................................................................47

xii
2.4.4 Geographical variation in diet.................................................................48
2.4.5 Interactions with fisheries .......................................................................49
2.5 Conclusion ......................................................................................................50
3 Chapter 3 ...............................................................................................................51
Temporal and sex differences in the blubber fatty acid profiles of the New Zealand
sea lion............................................................................................................................51
3.1 Introduction.....................................................................................................53
3.2 Materials and methods ....................................................................................55
3.2.1 Tissue collection .....................................................................................55
3.2.2 Laboratory methods ................................................................................55
3.2.3 Statistical methods ..................................................................................56
3.3 Results.............................................................................................................57
3.3.1 Composition of the sample set ................................................................57
3.3.2 Overall blubber FA composition.............................................................58
3.3.3 Temporal and sex differences in FA profiles..........................................62
3.4 Discussion .......................................................................................................63
3.4.1 Limitations of the study ..........................................................................64
3.4.2 Variation in FA profiles among sex categories.......................................65
3.4.3 Year variation in FA profiles ..................................................................67
3.5 Conclusion ......................................................................................................68
4 Chapter 4 ...............................................................................................................69
Proximate composition, energy content, and fatty acid composition of marine
species from the Campbell plateau, New Zealand.....................................................69
4.1 Introduction.....................................................................................................71
4.2 Materials and methods ....................................................................................73
4.2.1 Sample collection....................................................................................73
4.2.2 Proximate analysis ..................................................................................74
4.2.3 FA analysis..............................................................................................74
4.2.4 Statistical methods ..................................................................................75
4.3 Results.............................................................................................................76
4.3.1 Proximate composition ...........................................................................76
4.3.2 FA composition.......................................................................................78
4.4 Discussion .......................................................................................................82
4.4.1 Proximate composition and energy density ............................................82
xiii
4.4.2 FA composition in relation to diet ..........................................................83
4.5 Conclusion ......................................................................................................85
5 Chapter 5 ...............................................................................................................87
Quantitative fatty acid signature analysis on New Zealand sea lions: sensitivity
analysis & diet estimates...............................................................................................87
5.1 Introduction.....................................................................................................89
5.2 Materials and methods ....................................................................................91
5.2.1 Sample collection....................................................................................91
5.2.2 Lipid analysis ..........................................................................................91
5.2.3 QFASA model.........................................................................................91
5.2.4 Sensitivity analysis of QFASA ...............................................................93
5.3 Results.............................................................................................................95
5.3.1 Sensitivity analysis of QFASA ...............................................................95
5.3.2 Diet estimates of by-caught NZ sea lions using QFASA......................100
5.4 Discussion .....................................................................................................102
5.4.1 Sensitivity of QFASA ...........................................................................104
5.4.2 Overall diet estimate and feeding ecology............................................106
5.4.3 Diet estimates of males and females .....................................................107
5.4.4 Between-year variation in the diet estimates ........................................108
5.5 Conclusion ....................................................................................................109
6 Chapter 6 .............................................................................................................111
Foraging diversity in lactating New Zealand sea lions: insight from qualitative and
quantitative fatty acid signature analysis.................................................................111
6.1 Introduction...................................................................................................113
6.2 Materials and methods ..................................................................................115
6.2.1 Sample collection..................................................................................115
6.2.2 Lipid analysis ........................................................................................116
6.2.3 Statistical analysis .................................................................................117
6.2.4 QFASA model.......................................................................................118
6.3 Results...........................................................................................................118
6.3.1 FA composition of biopsied lactating sea lions and variation ..............120
6.3.2 Biopsied lactating sea lions versus by-caught female sea lions............123
6.3.3 Diet estimates of NZ sea lions using QFASA.......................................123
6.4 Discussion .....................................................................................................126

xiv
6.4.1 Limits encountered with FA analysis and QFASA...............................126
6.4.2 Foraging diversity are not reflected in FA profiles...............................127
6.4.3 Differences between biopsied and by-caught females..........................129
6.4.4 Between-year variation in FA profiles and long-term diet ...................130
6.5 Conclusion ....................................................................................................131
7 Chapter 7 .............................................................................................................133
Feeding ecology of the New Zealand sea lion: General discussion.........................133
Limits of the dietary methods ...............................................................................135
Feeding ecology ....................................................................................................137
Importance of the edges of the Auckland Islands shelf ........................................139
Nutritional stress hypothesis and energetics .........................................................139
Interactions with the arrow squid fishery and potential resource competition .....142
Future research on NZ sea lions............................................................................143
General conclusions ..............................................................................................145
Appendix 1...................................................................................................................147
Analysis of fatty acids and gas chromatography: development of the laboratory
protocol ........................................................................................................................147
Development of a protocol........................................................................................147
Lipid extraction .....................................................................................................147
Fatty acid methylation...........................................................................................149
Gas chromatograph analysis .................................................................................151
Protocol adopted .......................................................................................................157
Lipid extraction .....................................................................................................157
Fatty acid methylation...........................................................................................158
Gas chromatograph analysis .................................................................................159
Appendix 2....................................................................................................................161
REFERENCES..............................................................................................................163

xv
List of Tables
(the first number refers to the chapter’s number)
Table 1-1. Pros and cons of the main methods used to examine the diet of marine
mammals ............................................................................................................ 11
Table 2-1. Regression equations ................................................................................... 36
Table 2-2. Number of stomachs of New Zealand sea lions analysed............................ 39
Table 2-3. Composition of the New Zealand sea lion’s diet ......................................... 40
Table 2-4. Length and mass of New Zealand sea lion’s prey ....................................... 42
Table 3-1. Number of New Zealand sea lions analysed by year and sex...................... 58
Table 3-2. Fatty acid composition of New Zealand sea lion’s blubber......................... 59
Table 3-3. General linear model on the principal components ..................................... 63
Table 4-1. Morphometric data and ecology of marine species analysed ...................... 77
Table 4-2. Proximate composition and energy content of marine species analysed ..... 78
Table 4-3a. Fatty acid composition of marine fish species from the Auckland Islands
Rise..................................................................................................................... 79
Table 4-3b. Fatty acid composition of cephalopod and crustacean species from the
Auckland Islands Rise........................................................................................ 80
Table 5-1. Number of New Zealand sea lions analysed by year and sex...................... 95
Table 5-2. Kullback-Liebler values for different simulations with quantitative fatty acid
signature analysis ............................................................................................... 98
Table 5-3. Predicted proportions by mass of prey species by quantitative fatty acid
signature analysis ............................................................................................. 101
Table 6-1. Number of lactating New Zealand sea lions analysed per year ................. 118
Table 6-2. By-year fatty acid composition.................................................................. 119
Table 6-3. Predicted proportions by mass of prey species by quantitative fatty acid
signature analysis ............................................................................................. 125
xvi
List of Figures
(the first number refers to the chapter’s number)
Fig. 1-1. Auckland Islands showing the main breeding areas of New Zealand sea lions 4
Fig. 1-2. Annual pup production of New Zealand sea lions ............................................ 5
Fig. 1-3. Life cycle of the New Zealand sea lion............................................................. 7
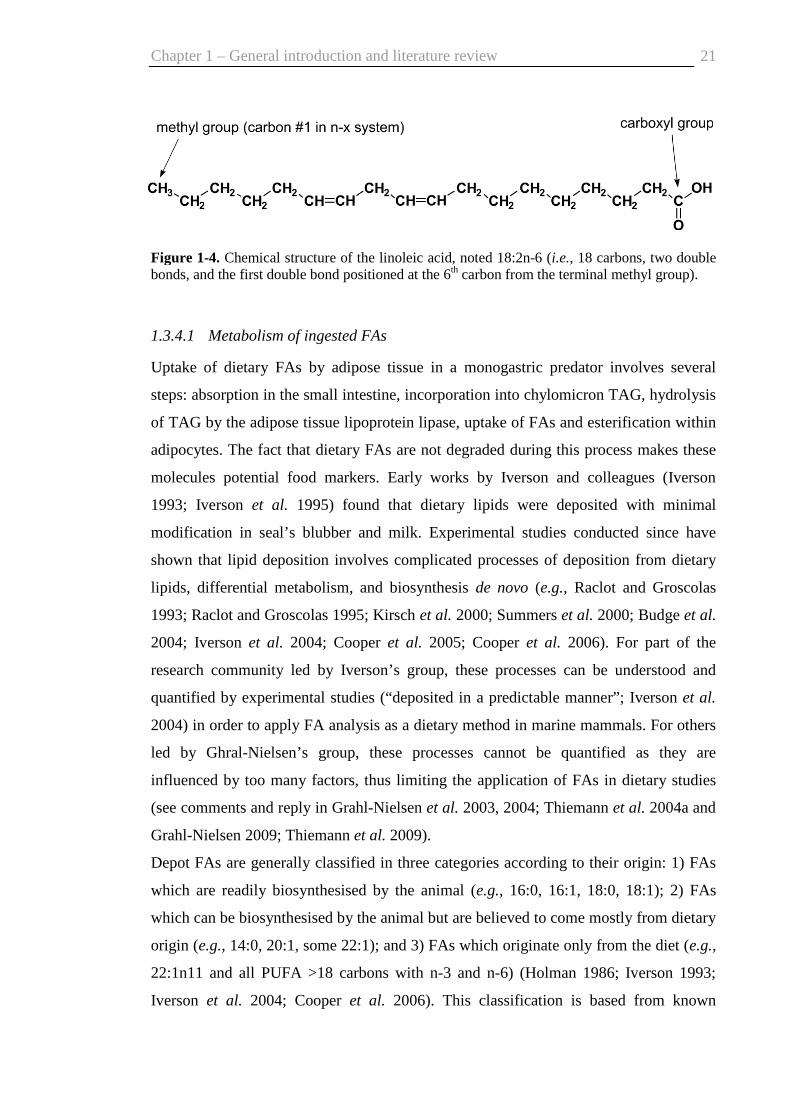
Fig. 1-4. Chemical structure of the linoleic acid............................................................ 21
Fig. 2-1. Location of the captures of New Zealand sea lions ........................................ 33
Fig. 2-2. Length distributions of prey found in the stomach contents ........................... 44
Fig. 3-1. Plot of canonical discriminant functions......................................................... 64
Fig. 4-1. Map of the Campbell plateau .......................................................................... 73
Fig. 4-2. Plot of the first three principal components .................................................... 82
Fig. 5-1. Mean predicted proportions of prey species by quantitative fatty acid signature
analysis............................................................................................................... 96
Fig. 5-2. Examples of predicted versus true fatty acid profiles ..................................... 99
Fig. 5-3. Predicted proportions by mass of prey species of the New Zealand sea lion
with different calibration coefficients .............................................................. 100
Fig. 5-4. Mean percentage of prey estimated by quantitative fatty acid signature
analysis by sex ................................................................................................. 101
Fig. 5-5. Between-year percentages of prey estimated by quantitative fatty acid
signature analysis ............................................................................................. 103
Fig. 5-6. Diet estimates of New Zealand sea lions by quantitative fatty acid signature
analysis............................................................................................................. 104
Fig. 5-7. Estimated commercial catches of hoki, arrow squid and red cod ................. 109
Fig. 6-1. Foraging locations of lactating New Zealand sea lions ................................ 114
Fig. 6-2. Plot of the first two canonical discriminant functions .................................. 121
Fig. 6-3. Comparison between FA profiles of benthic divers and those of mesopelagic
divers................................................................................................................ 122
Fig. 6-4. Plot of the first two principal components .................................................... 124
Fig. 6-5. Mean estimated percentages of prey species by year from quantitative fatty
acid signature analysis ..................................................................................... 125

1 CHAPTER 1
GENERAL INTRODUCTION AND LITERATURE REVIEW
Photo: Female New Zealand sea lions Phocarctos hookeri sleeping at Sandy Bay, Enderby Island, Auckland Islands
Chapter 1 – General introduction and literature review
2
1.1 GENERAL INTRODUCTION
Understanding the feeding ecology of apex predators within marine ecosystems is
crucial to measure their impact on lower trophic levels, i.e., top-down control effects
(Bowen 1997; e.g., Boveng et al. 1998; Estes et al. 1998). Of particular interest to
managers are the trophic interactions between protected apex predators such as marine
mammals, and commercially exploited food resources. Information on such interactions
requires research on marine mammals’ diet and foraging energetics (e.g., Furness 2002;
Santos et al. 2004b; Butler et al. 2006; Cornick et al. 2006). Furthermore, the
availability of prey and their quality will influence the foraging distribution of marine
mammals and can affect their fitness (i.e., bottom-up control effects). Thus studying the
diet and subsequently the energetics of marine mammal populations that are declining
can give a better understanding of the mechanisms causing negative effects on
population growth and individual fitness (e.g., Trites and Donnelly 2003; Winship and
Trites 2003; Trites et al. 2007b).
The New Zealand (NZ) sea lion Phocarctos hookeri has a breeding range restricted to
the NZ sub-Antarctic islands (Chilvers et al. 2007b). Despite its protection since 1881,
this species has failed to recolonise its pristine distribution around the NZ main islands
(Childerhouse and Gales 1998). To date, the causes impeding the growth of the NZ sea
lion population remain unclear (e.g., Chilvers et al. 2006; Chilvers 2008b). The current
hypothesis is that the population growth is limited in part by bottom-up forces (i.e., prey
distribution and quality) and in another part by top-down effects (i.e., accidental capture
by fisheries). The main objective of this thesis was to investigate the role of bottom-up
forces by studying the diet of NZ sea lions.
The aim of this chapter is to introduce the thesis in a broader context, by 1) reviewing
the biology and ecology of the NZ sea lion, and 2) reviewing the current methods used
to study the diet of marine mammals. An outline of the thesis is presented at the end of
this chapter.
Chapter 1 – General introduction and literature review
3
1.2 NZ SEA LION BIOLOGY
1.2.1 Distribution
The NZ sea lion is endemic to NZ, with the present distribution of breeding sites limited
to the NZ sub-Antarctic Islands (Gales and Fletcher 1999; Chilvers et al. 2007b). Prior
to human colonisation, this species was distributed along the coasts of NZ main islands
(Worthy 1994; Gill 1998), and had been significantly reduced in numbers and in range
by subsistence and commercial sealing (Childerhouse and Gales 1998). Despite full
protection in 1881, the NZ sea lions have failed to recolonise their former breeding
range (Childerhouse and Gales 1998). More than 99% of the current breeding range is
restricted to the Auckland Islands (50°30'S, 166°E) and Campbell Island (52°30'S,
169°E) (Fig. 1-1) (Chilvers et al. 2007b). The Auckland Islands alone host 86% of the
annual pup production, distributed on three islands: Enderby (19%), Dundas (64%) and
Figure of Eight (3%) (Fig. 1-1) (Chilvers et al. 2007b). Several females have been
observed giving birth in the south east of the South Island of NZ each year, which is
considered as a sign of re-colonisation of the species’ former range (Childerhouse and
Gales 1998; Gales and Fletcher 1999; McConkey et al. 2002). Female NZ sea lions
display a high site fidelity and philopatry, while males breed in different locations and
tend to disperse in areas distant from the Auckland Islands after the breeding season
(Robertson et al. 2006; Chilvers and Wilkinson 2008). The highly restricted distribution
of the NZ sea lion has led to the classification of the species as “vulnerable in decline”
by the International Union for the Conservation of Nature (Gales 2008) and as
“threatened” under the NZ Threat Classification System (Hitchmough et al. 2007).

Chapter 1 – General introduction and literature review
4
Figure 1-1. Auckland Islands showing the main breeding areas of New Zealand sea lions: Enderby Island, Dundas Island, and Figure of Eight Island. Inset: New Zealand’s subantarctic. Map originally created by the Department of Conservation, Wellington.
Chapter 1 – General introduction and literature review
5
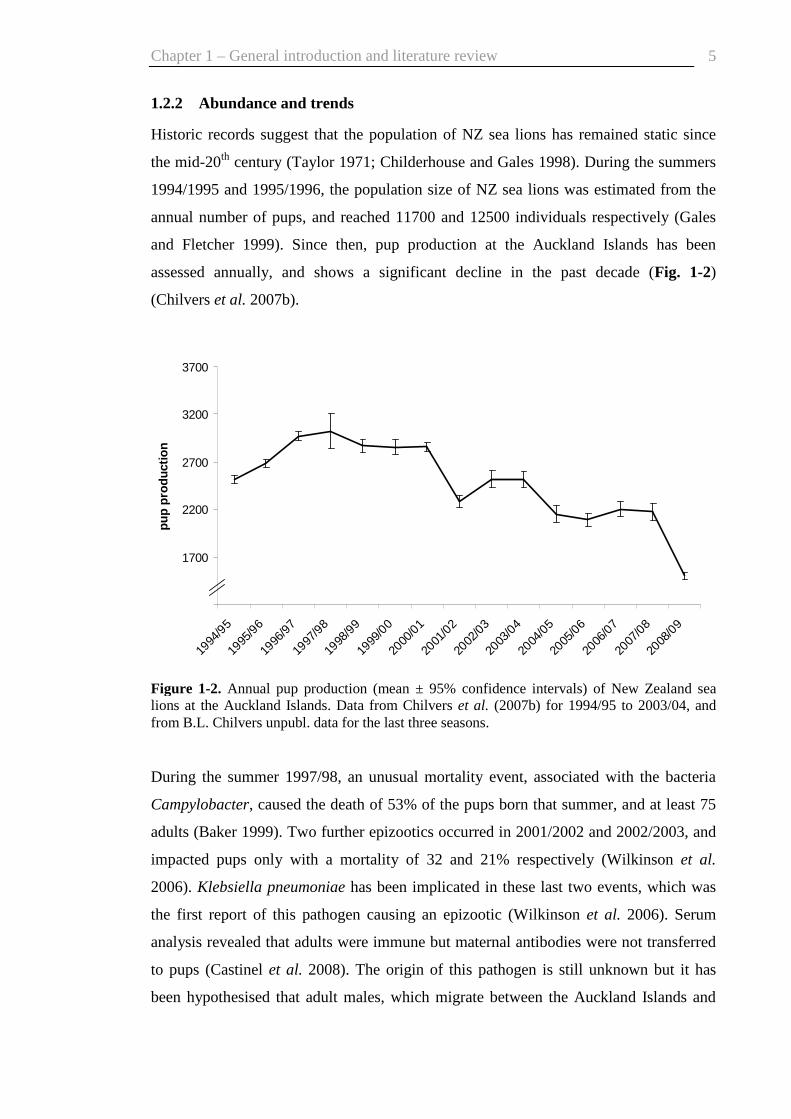
1.2.2 Abundance and trends
Historic records suggest that the population of NZ sea lions has remained static since
the mid-20th century (Taylor 1971; Childerhouse and Gales 1998). During the summers
1994/1995 and 1995/1996, the population size of NZ sea lions was estimated from the
annual number of pups, and reached 11700 and 12500 individuals respectively (Gales
and Fletcher 1999). Since then, pup production at the Auckland Islands has been
assessed annually, and shows a significant decline in the past decade (Fig. 1-2)
(Chilvers et al. 2007b).
During the summer 1997/98, an unusual mortality event, associated with the bacteria
Campylobacter, caused the death of 53% of the pups born that summer, and at least 75
adults (Baker 1999). Two further epizootics occurred in 2001/2002 and 2002/2003, and
impacted pups only with a mortality of 32 and 21% respectively (Wilkinson et al.
2006). Klebsiella pneumoniae has been implicated in these last two events, which was
the first report of this pathogen causing an epizootic (Wilkinson et al. 2006). Serum
analysis revealed that adults were immune but maternal antibodies were not transferred
to pups (Castinel et al. 2008). The origin of this pathogen is still unknown but it has
been hypothesised that adult males, which migrate between the Auckland Islands and
Figure 1-2. Annual pup production (mean ± 95% confidence intervals) of New Zealand sea lions at the Auckland Islands. Data from Chilvers et al. (2007b) for 1994/95 to 2003/04, and from B.L. Chilvers unpubl. data for the last three seasons.
1200
1700
2200
2700
3200
3700
1994
/95
1995
/96
1996
/97
1997
/98
1998
/99
1999
/00
2000
/01
2001
/02
2002
/03
2003
/04
2004
/05
2005
/06
2006
/07
2007
/08
2008
/09
pu
p p
rod
ucti
on

Chapter 1 – General introduction and literature review
6
South Island (Robertson et al. 2006), could have been the vectors of Klebsiella from
mainland into the population at the Auckland Islands (Wilkinson et al. 2006; Castinel et
al. 2007b). These epizootics have reduced the number of adults being recruited in the
breeding pool during the following years, and contributed to the decline of the pup
production observed in the last decade (Wilkinson et al. 2006; Chilvers et al. 2007b).
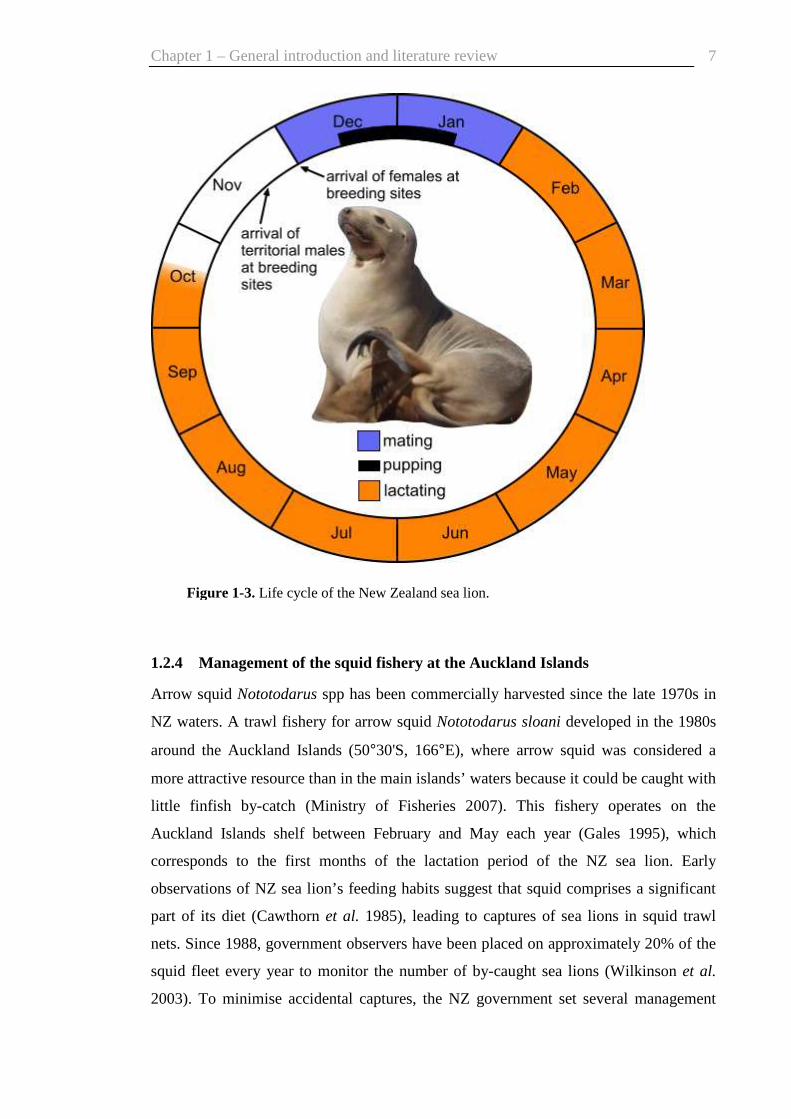
1.2.3 Breeding biology and lactation
The breeding season of NZ sea lions starts in December each year when most of the
pregnant females arrive at the rookeries already occupied by males (Fig. 1-3) (Gales and
Fletcher 1999). Females form harems, attended by a dominant bull which can fast for
several weeks until the end of the oestrous period (end of January). Pupping occurs soon
after the arrival of females between mid-December and mid-January (Fig. 1-3) (Gales
and Fletcher 1999; Chilvers et al. 2007b). The females make their first post-partum
foraging trip to sea within two weeks of giving birth (Gales and Fletcher 1999; Chilvers
et al. 2007a). During lactation (which lasts approximately 9 months), females alternate
between feeding trips at sea for two to three days and nursing their pup ashore for one to
two days (Cawthorn et al. 1985; Chilvers et al. 2005).
Although the breeding behaviour detailed above is relatively common among sea lions
and fur seals, NZ sea lions show low reproduction and lactation performance compared
to other otariid species. Indeed, it is estimated that only 67% of mature female NZ sea
lions (> 3-4 years of age; Cawthorn et al. 1985; Duignan et al. 2003) have pups
(Childerhouse 2008), whereas the reproductive rate is > 70% for Australian sea lions
Neophoca cinerea (Higgins and Gass 1993) and California sea lions Zalophus
californianus (Melin 2002), and between 60 and 75% for Steller sea lions Eumetopias
jubatus (Pitcher and Calkins 1981; York 1994). Moreover, the milk is of low lipid
content, with a mean of 19.9% recorded between 1997 and 2005 (Riet-Sapriza 2007).
The lipid concentration in the milk of other otariid species was reported to be ≥ 25%
(Higgins et al. 1988; Gales et al. 1996; Werner et al. 1996; Arnould and Hindell 1999).
Chapter 1 – General introduction and literature review
7
1.2.4 Management of the squid fishery at the Auckland Islands
Arrow squid Nototodarus spp has been commercially harvested since the late 1970s in
NZ waters. A trawl fishery for arrow squid Nototodarus sloani developed in the 1980s
around the Auckland Islands (50°30'S, 166°E), where arrow squid was considered a
more attractive resource than in the main islands’ waters because it could be caught with
little finfish by-catch (Ministry of Fisheries 2007). This fishery operates on the
Auckland Islands shelf between February and May each year (Gales 1995), which
corresponds to the first months of the lactation period of the NZ sea lion. Early
observations of NZ sea lion’s feeding habits suggest that squid comprises a significant
part of its diet (Cawthorn et al. 1985), leading to captures of sea lions in squid trawl
nets. Since 1988, government observers have been placed on approximately 20% of the
squid fleet every year to monitor the number of by-caught sea lions (Wilkinson et al.
2003). To minimise accidental captures, the NZ government set several management
Figure 1-3. Life cycle of the New Zealand sea lion.
Chapter 1 – General introduction and literature review
8
controls on the southern squid fishery. A zone of no fishing was established in 1982
around the Auckland Islands out to 12 nautical miles, which became a marine mammal
sanctuary in 1993 and a marine reserve in 2003 (Wilkinson et al. 2003; Chilvers
2008b). Despite the protected areas around the Auckland Islands, by-catch of NZ sea
lions continued. This led the NZ government to impose a Fishing Related Mortality
Limit (FRML) in 1993, providing a management tool to close the area to further fishing
activity once this level of sea lion by-catch is reached (Wilkinson et al. 2003). In 1997,
trawling nets were modified by installing a sea lion exclusion device (SLED) allowing
sea lions to escape the net. Nonetheless, up to 118 sea lions a year were estimated to be
caught by the southern arrow squid fishery since (Wilkinson et al. 2003; Baird 2005a,
b). The main limitations of the current management of NZ sea lion by-catch are that the
current marine reserve around the Auckland Islands does not protect the key foraging
areas of NZ sea lions (Chilvers 2008b), and that SLEDs do not currently prevent sea
lions from getting trapped in trawling nets (Baird 2005a, b; Smith and Baird 2007).
1.2.5 Foraging and feeding behaviour
During lactation, females alternate foraging at sea and nursing their pups on land. A
foraging trip generally lasts two to three days during which females from Enderby
Island forage in areas north of the colony to the edges of the Auckland Islands shelf
(Chilvers et al. 2005). Lactating NZ sea lions have been reported to be the deepest- and
longest-diving otariid (maximum of 597 m and 14.5 min) (Gales and Mattlin 1997;
Chilvers et al. 2006). They dive continuously while at sea with a mean depth of 130 m
during their foraging trips, and exhibit different diving patterns (benthic versus
mesopelagic) depending on the region of the Auckland Islands shelf they exploit
(Chilvers et al. 2006; Chilvers and Wilkinson 2009). Fidelity to a particular foraging
location is high for females as they display the same foraging pattern within and
between years (Chilvers et al. 2005; Chilvers 2008a).
When diving, lactating NZ sea lions exceed their calculated aerobic dive limits (cADL)
in 68% of all dives (Chilvers et al. 2006), which is higher than reported in other otariids
except in the Australian sea lion (Feldkamp et al. 1989; Boyd and Croxall 1996; Costa
and Gales 2003). Despite a large oxygen storage capacity (Costa and Gales 2000), NZ
sea lions operate at their physiological limits, and it has been hypothesised that the

Chapter 1 – General introduction and literature review
9
Auckland Islands shelf represents a marginal foraging environment (Gales and Mattlin
1997; Costa and Gales 2000; Chilvers et al. 2006).
It must be stressed that all the previous studies on the foraging and diving behaviours of
NZ sea lions were conducted on lactating females in the first weeks of the lactation
period (austral summer), and it is currently not known if the results presented above are
valid in winter or are shared by the other members of the population (i.e., adult males,
non-lactating females, juveniles).
The only information on the diet of NZ sea lions at the Auckland Islands to date is the
work published by Childerhouse et al. (2001) who analysed faeces and regurgitates
collected at Enderby Island (Fig. 1-1) between 1994 and 1997. They reported a variety
of benthic, demersal and pelagic species known to inhabit waters > 300 m deep, which
is consistent with the reported deep diving of NZ sea lions (Gales and Mattlin 1997;
Chilvers et al. 2006).
1.2.6 Summary of NZ sea lion biology
Despite a distribution limited to remote locations, the NZ sea lion has been the subject
of numerous studies this last decade (reviewed above), which permits a better
understanding of the potential mechanisms impeding the growth of the population. The
growth rate of pups, the milk fat content delivered to pups and the reproductive rate of
females are lower than those reported in other otariids (Chilvers et al. 2007a; Riet-
Sapriza 2007; Childerhouse 2008), while foraging and diving studies showed that
lactating females dive beyond their aerobic dive limit at a higher rate than recorded in
other species (Gales and Mattlin 1997; Chilvers et al. 2006). Furthermore, the breeding
sites at the Auckland Islands have been affected by three epizootics during the last
decade, which are still impacting the number of adults being recruited in the breeding
population, and contribute to the decline of the pup production (Baker 1999; Wilkinson
et al. 2006; Chilvers et al. 2007b).
It has been hypothesised that the low and declining number of the NZ sea lion
population and its low reproductive success are due to the Auckland Islands shelf being
a marginal environment (Gales and Mattlin 1997; Costa and Gales 2000; Chilvers et al.
2005, 2006), where the rookeries are far from the abundant and predictable resources
that are deep off the shelf. Therefore, a detailed study of the diet of the NZ sea lion

Chapter 1 – General introduction and literature review
10
would help to test this hypothesis. To date, only a qualitative estimate of the NZ sea
lion’s diet is available from the analyses of faeces and regurgitates collected between
1995 and 1997 (Childerhouse et al. 2001).
1.3 METHODS FOR DIETARY STUDIES ON MARINE
MAMMALS
Studying the diet of marine mammals is particularly challenging as they spend part, if
not their entire life, in the marine environment with most of the feeding events occuring
below the surface. Therefore, researchers rely on indirect methods to study the diet of
marine mammals, such as the analyses of stomach contents, faeces and regurgitates.
These methods are named “traditional”, in contrast to “new” methods such as DNA
extraction from faeces, FA signatures of body lipids, or stable isotopes in various
tissues, which have been increasingly used in the last two decades. None of these
methods are perfect, and each has advantages and disadvantages which are discussed in
the following sections. Table 1-1 summarises the main characteristics for each method.
Other methods occasionally used in diet studies include the fitting of video cameras on
animals or the direct observation of surface feeding. They are not detailed here as they
give limited information on the diet.
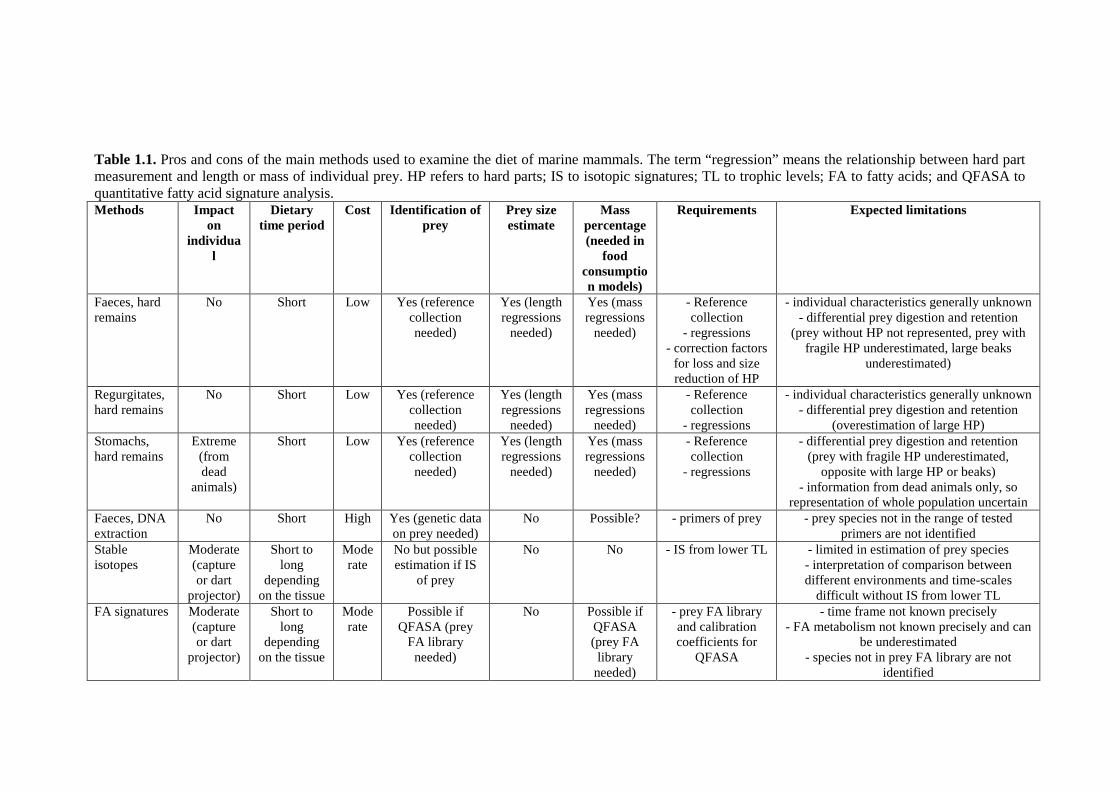
Table 1.1. Pros and cons of the main methods used to examine the diet of marine mammals. The term “regression” means the relationship between hard part measurement and length or mass of individual prey. HP refers to hard parts; IS to isotopic signatures; TL to trophic levels; FA to fatty acids; and QFASA to quantitative fatty acid signature analysis. Methods Impact
on individua
l
Dietary time period
Cost Identification of prey
Prey size estimate
Mass percentage (needed in
food consumption models)
Requirements Expected limitations
Faeces, hard remains
No Short Low Yes (reference collection needed)
Yes (length regressions
needed)
Yes (mass regressions
needed)
- Reference collection
- regressions - correction factors
for loss and size reduction of HP
- individual characteristics generally unknown - differential prey digestion and retention
(prey without HP not represented, prey with fragile HP underestimated, large beaks
underestimated)
Regurgitates, hard remains
No Short Low Yes (reference collection needed)
Yes (length regressions
needed)
Yes (mass regressions
needed)
- Reference collection
- regressions
- individual characteristics generally unknown - differential prey digestion and retention
(overestimation of large HP) Stomachs, hard remains
Extreme (from dead
animals)
Short Low Yes (reference collection needed)
Yes (length regressions
needed)
Yes (mass regressions
needed)
- Reference collection
- regressions
- differential prey digestion and retention (prey with fragile HP underestimated,
opposite with large HP or beaks) - information from dead animals only, so
representation of whole population uncertain Faeces, DNA extraction
No Short High Yes (genetic data on prey needed)
No Possible? - primers of prey - prey species not in the range of tested primers are not identified
Stable isotopes
Moderate (capture or dart
projector)
Short to long
depending on the tissue
Moderate
No but possible estimation if IS
of prey
No No - IS from lower TL - limited in estimation of prey species - interpretation of comparison between different environments and time-scales
difficult without IS from lower TL FA signatures Moderate
(capture or dart
projector)
Short to long
depending on the tissue
Moderate
Possible if QFASA (prey
FA library needed)
No Possible if QFASA (prey FA library needed)
- prey FA library and calibration coefficients for
QFASA
- time frame not known precisely - FA metabolism not known precisely and can
be underestimated - species not in prey FA library are not
identified

Chapter 1 – General introduction and literature review
12
1.3.1 “Traditional” diet methods: faeces and stomach analyses
Analysis of prey hard parts from faecal samples is a common technique for estimating
the diet of pinnipeds (e.g., Prime and Hammond 1990; Thompson et al. 1991; Cherel et
al. 1997; Casaux et al. 2003; Pierce and Santos 2003; Hume et al. 2004; Page et al.
2005a; Littnan et al. 2007; Trites et al. 2007a) since faeces are easy to collect on haul
out sites, can be collected without disturbance on animals, and their analysis is
inexpensive (Tollit et al. 2006). However, estimating the proportion and the size of prey
from hard part remains is not straightforward, and includes well recognised biases such
as differential rates of food passage and digestion (see earlier reviews, Pierce and Boyle
1991; Bowen 2000). Sagittal otoliths of fish and lower beaks of cephalopods are the
most commonly used structures to identify such prey (Pierce and Boyle 1991).
However, otoliths are subject to erosion by digestive juices and can be completely
digested (Jobling and Breiby 1986; Murie and Lavigne 1986; Jobling 1987; Dellinger
and Trillmich 1988). Thus fish consumed would not necessarily be recovered in faeces,
especially if it is a species with small otoliths which digest faster than large ones (Pierce
and Boyle 1991; Christiansen et al. 2005). In contrast, beaks are not affected by
digestion (Harvey 1989; Gales and Cheal 1992; Tollit et al. 1997), but large beaks tend
to accumulate in stomachs, as they do not pass through the pylorus (Bigg and Fawcett
1985; Yonezaki et al. 2003). Therefore, the proportion of fish with fragile otoliths and
the proportion of cephalopods with large beaks are underestimated in scat analysis.
Moreover, since mass quantification involves the back-calculation of prey size from
measurements of otoliths and beaks, the partial digestion of otoliths prevents accurate
estimation of the original fish size. Experimental feeding studies on captive seals (eared
and true seals) aimed at reducing the biases from otolith loss and size reduction by the
calculation of numerical correction factors and digestion rates (da Silva and Neilson
1985; Prime and Hammond 1987; Dellinger and Trillmich 1988; Harvey 1989; Gales
and Cheal 1992; Cottrell et al. 1996; Fea and Harcourt 1997; Tollit et al. 1997; Bowen
2000; Orr and Harvey 2001; Cottrell and Trites 2002; Staniland 2002; Tollit et al. 2003;
Tollit et al. 2004; Casper et al. 2006; Grellier and Hammond 2006; Tollit et al. 2007).
In addition to the use of otoliths to identify and quantify fish intake, four feeding
experiments on harbor seals (Cottrell et al. 1996) and on Steller sea lions (Cottrell and
Trites 2002; Tollit et al. 2003; Tollit et al. 2004) considered a series of fish bones as
diagnostic structures which reduced the probability of missing a fish species, and

Chapter 1 – General introduction and literature review
13
improved fish recovery rates (Tollit et al. 2003) and size estimates (Tollit et al. 2004).
A common finding over all the feeding studies is the high variability in otolith and bone
recovery rates between individuals, even from the same species feeding on the same
diet. Recovery rates vary with the size and shape of otoliths (Harvey 1989; Pierce et al.
1993; Tollit et al. 1997; Staniland 2002), whether or not they are encapsulated in skulls
(Murie and Lavigne 1986), with the meal size (Marcus 1998) and composition
(Dellinger and Trillmich 1988; Tollit et al. 2004), the seal activity (Helm 1984; Tollit et
al. 2003), and the seal species (Helm 1984; Gales and Cheal 1992). Thus it is difficult to
apply correction factors derived from captive experiments to wild species, which are
more active and eat a more diverse food than captive animals.
There is still debate over how effectively scat samples can give a good estimation of
prey proportions (see Casper et al. 2006), especially in otariids which tend to have
lower recovery rates than phocids due to a longer digestive tract (Helm 1979). Several
authors state that the analysis of faecal samples can properly estimate the occurrence
and numerical proportion of prey providing large numbers of scats (generally > 100) are
analysed (Dellinger and Trillmich 1988; Hammond and Rothery 1996; Sinclair and
Zeppelin 2002; Trites and Joy 2005; Tollit et al. 2007). Nonetheless, Gales and Cheal
(1992) and Casper et al. (2006) found very low fish recovery rates (< 10%) in feeding
experiments with otariids. They questioned the validity of scat analysis in wild animals
at least for the species studied (Arctocephalus forsteri, A. tropicalus, Neophoca
cinerea), and stressed the need for using complementary diet methods.
Stomach analysis is hampered by biases similar to scat analysis (Pierce and Boyle 1991;
Pierce et al. 2004a), and is widely used to study the diet of cetaceans, as the collection
of faeces in the marine environment is difficult and logistically demanding. The
majority of the studies on stomach contents of cetaceans rely on opportunistic sampling
of dead animals from stranding or by-catch (accidentally captured in nets) events (e.g.,
Ford et al. 1998; Pierce et al. 2004b; Santos et al. 2004b; De Pierrepont et al. 2005;
Spitz et al. 2006; Pusineri et al. 2007; Meynier et al. 2008a; Meynier et al. 2008b;
Mintzer et al. 2008). However, the diet of dead animals is not necessarily representative
of the feeding of the population (Pierce and Boyle 1991; Pierce et al. 2004a). Strandings
can be biased towards sick animals, whose diet is likely to be different from healthy
individuals. Furthermore, the recent diet of animals incidentally captured in commercial

Chapter 1 – General introduction and literature review
14
fisheries can be biased towards the targeted species of that fishery (Pierce and Boyle
1991; Pierce et al. 2004a). If an animal ingested food just before death, fresh material
(named the fresh fraction) will be found in the stomachs among digested prey from
previous feeding events (named digested fraction) (e.g., Pusineri et al. 2007). If the
fresh fraction is analysed alone, it can provide an unbiased estimate of actual intake
because all items are ingested over a restricted period and are not subject to digestion.
However, the fresh fraction from by-caught animals tends to be biased towards the
targeted species of the fishery. In the digested fraction, beaks tend to accumulate (Bigg
and Fawcett 1985; Yonezaki et al. 2003), although some are regurgitated as seen in
pinnipeds (Fea and Harcourt 1997; Lalas 1997; Childerhouse et al. 2001; Hume et al.
2004) and dolphins (Silva-Jr. et al. 2004).
Due to the numerous biases associated with faeces and stomach analyses, there is a
general consensus that these methods should be applied together with other methods,
such as genetic analysis on scat material, stable isotope analysis or FA analysis (e.g.,
Casper et al. 2006; Tollit et al. 2007), which overcome some of the problems
encountered in hard part analysis (developed in next sections). Nonetheless, traditional
techniques from stomachs and faeces are the only diet methods that provide an estimate
of the prey size (Table 1-1). Although they do not require specialised equipment and
are inexpensive, they require a strong experience and rigor from the analyst and an
access to a comprehensive reference collection of diagnostic hard parts.
1.3.2 DNA extraction from scat samples
The application of DNA-based techniques to identify prey species from pinniped scat
samples was initiated by the need to accurately assess the impact of pacific harbor seals
(Phoca vitulina richardsi) on endangered salmonid populations in the north-east Pacific
(Orr et al. 2004; Purcell et al. 2004; Kvitrud et al. 2005). Identification of salmonid
species using conventional hard part analysis from scat samples is limited as salmonid
otoliths are fragile, and salmonid bones cannot be differentiated between species
(Purcell et al. 2004). Alternatively, genetic tools were successfully used to identify
different salmonid species from bone remains in scats of pacific harbor seals (Orr et al.
2004; Purcell et al. 2004; Kvitrud et al. 2005). These DNA methods rely on the
recognition of DNA sequences unique to prey, and requires the design of specific

Chapter 1 – General introduction and literature review
15
markers (e.g., Jarman et al. 2004). Parsons et al. (2005) and Matejusová et al. (2008)
went further in the identification of salmonid species from phocid faeces by analysing
the soft material of scat. These two studies not only showed that DNA techniques can
help the identification of remains from prey with no species-specific structures (e.g.,
salmonid bones), but also that these techniques can detect prey for which remains are
soft and completely digested in the gut (e.g., crustaceans, zooplankton) or can detect
prey for which remains are retained in the stomach (squid beaks).
The identification of prey from the soft material of scat was further developed for
otariids by feeding experiments with captive Steller sea lions Eumetopias jubatus
(Deagle et al. 2005; Deagle and Tollit 2007) and captive fur seals Arctocephalus
forsteri and A. tropicalis (Casper et al. 2007). The diet fed to captive animals comprised
several species of fish and squid in different amounts, and the results based on hard part
analysis and DNA-based analysis were compared (Deagle et al. 2005; Casper et al.
2007). The probability of detecting a prey was always higher with the DNA method
(Deagle et al. 2005; Casper et al. 2007). Recently, Deagle and colleagues (2005, 2007)
investigated the potential of DNA analysis in faeces to estimate the diet quantitatively
by comparing proportions of prey species in the diet, and proportions of prey species
DNA in faeces. DNA analysis identified the dominant species in the diet, but other fish
species were not well quantified. The authors conclude that the denaturation of DNA
varies according to the prey species, limiting the possibility of quantification without
the application of correction factors. However, obtaining such factors will require
extensive feeding experiments (Casper et al. 2007; Deagle and Tollit 2007).
The methods used in the identification of DNA from scat material are multiple, from the
application of conventional polymerase chain reaction (PCR) amplifications followed
by restriction fragment length polymorphism (RFLP) (Purcell et al. 2004; Parsons et al.
2005) or denaturing gradient gel electrophoresis (DGGE) (Deagle et al. 2005), to the
application of real-time PCRs (Casper et al. 2007; Deagle and Tollit 2007; Matejusová
et al. 2008), which offer a greater potential in prey quantification. To date, the
methodology is still in development.
Chapter 1 – General introduction and literature review
16
1.3.3 Stable isotopes
Diet information provided from faeces and stomach contents is limited to what the
animal ate in the days preceding sampling. Biochemical methods such as stable isotopes
and fatty acid (FA) analyses allow the inference of a broader diet picture by analysing
tissues which retain assimilated nutrients for up to years (e.g., stable isotopes in bones)
and overcome the biases related to hard part recovery and digestion. Stable isotope
analysis can give an insight into the trophic relations and sources of feeding of
consumers since there is a predictable relationship between the isotopic composition of
a predator and its prey. The isotopes generally used are those of nitrogen (14N and 15N)
and carbon (12C and 13C), and they are expressed as δ values, i.e., parts per thousand
differences from a standard. δ15N and δ13C refer to the ratio of the heavy isotope to the
more abundant light one, i.e., 15N/14N and 13C/12C, compared to the same ratio in the
standard. The reference ratios (standards) used are calibrated to PeeDee belemnite
(PDB) for 13C and atmospheric nitrogen for 15N (Ehleringer and Rundel 1989). Samples
containing more of the heavier isotope compared to the standard are enriched, whereas
those with more of the lighter isotope are depleted. Marine organisms are generally
depleted in 13C relative to PDB and thus have negative δ13C values, whereas they have
positive δ15N values owing to a relative enrichment in 15N in marine organisms
compared to the atmospheric nitrogen.
δ15N of a consumer is typically enriched by 3-4‰ relative to its diet (DeNiro and
Epstein 1981; Minagawa and Wada 1984; Peterson and Fry 1987; Hobson et al. 1996),
hence δ15N serves as an indicator of the trophic level. In contrast, δ13C varies little along
the food chain, and is mainly used to determine the sources of primary productivity at
the base of the trophic web (Fry and Sherr 1984; Peterson and Fry 1987). However,
δ13C varies between benthic and pelagic ecosystems (more enriched in benthic prey;
Hobson et al. 1996; Hobson et al. 1997), and with latitude (more depleted towards
higher latitude; Rau et al. 1982). Therefore, δ15N and δ13C provide a two-dimensional
estimate of the dietary niche occupied by a consumer relative to other consumers in an
ecosystem. Stable isotopes have been widely used in marine mammals to infer dietary
variation between different species sharing the same habitat (e.g., Hobson et al. 1997;
Lesage et al. 2001; Das et al. 2003; Zhao et al. 2004; Dehn et al. 2007), different
environments (e.g., Kurle and Worthy 2002; Lewis et al. 2006; Niño-Torres et al. 2006;
Chapter 1 – General introduction and literature review
17
Mendes et al. 2007), sexes (e.g., Niño-Torres et al. 2006; Tucker et al. 2007), stages of
development (e.g., Hobson and Sease 1998; Knoff et al. 2008; York et al. 2008) and
different time scales (season, year, decades) (e.g., Walker et al. 1999; Kurle and Worthy
2001; Hobson et al. 2004; Hall-Aspland et al. 2005; Cherel et al. 2007; Newsome et al.
2007; Sinisalo et al. 2008).
Tissues used in stable isotope studies are diverse and their choice will depend on the
time-scale studied. Indeed, the turnover of each tissue varies widely from several days
to the entire lifetime of the animal, thus integrating isotopic signatures over different
time periods (Dalerum and Angerbjörn 2005). Tissues generally used include plasma
and serum (turnover of days), skin, red blood cells and muscle (turnover of months),
hair and vibrissae (turnover of a year to several years) and teeth and bones (turnover of
years to the entire life) (Welle 1999). Technically, all types of tissues are suitable for
stable isotope analysis, but samples such as hair, skin, blood or vibrissae which require
minimal impact on the animal, are preferred in studies of wild marine mammals
(Hobson et al. 1997; Kurle and Worthy 2001; Lesage et al. 2001; Zhao et al. 2004;
Hall-Aspland et al. 2005; Cherel et al. 2007). Research on stable isotopes from
cetaceans mainly involves dead carcasses from stranding or by-catch in which skin,
muscle, teeth, or internal organs have been analysed (Das et al. 2003; Niño-Torres et al.
2006; Mendes et al. 2007; Knoff et al. 2008).
The use of multiple tissues of different turnovers in stable isotope studies has proven to
be useful to infer the trophic position over multiple temporal scales (review in Dalerum
and Angerbjörn 2005; Hobson et al. 1997; Kurle and Worthy 2002; Das et al. 2003;
Sinisalo et al. 2008). However, one must take into account that the tissues have a
specific fractionation relative to the diet (Hobson et al. 1996; Kurle 2002), and it is
important to assess the isotopic variation between the tissues of the same animal before
the inference of trophic ecology can be made. Such isotopic variation between tissues
has been assessed in a captive experiment on several species of phocids (Hobson et al.
1996). Hobson et al. (1996) found δ15N fractionation factors between phocid tissues and
diet of +1.7‰ (blood), +2.3‰ (skin, nail), +2.8‰ (whiskers), and +3.0‰ (hair), and
δ13C fractionation factors of +1.7‰ (whole blood), +2.8‰ (skin, nail, hair) and +3.2‰
(whiskers). The difference in 15N enrichment is attributed to the different types of
protein and amino acid composition among tissues, since amino acids show a large

Chapter 1 – General introduction and literature review
18
variation in their δ15N isotopic signature (Macko et al. 1987; Fantle et al. 1999; Welle
1999). Similarly, variation in 13C enrichment is due to the differential amount of
proteins and lipids among tissues, as lipids are depleted in 13C by 6‰ compared to
proteins (Tieszen et al. 1983). To reduce δ13C variability between tissues due to the
lipid amount, several studies strongly advise to extract lipids before isotope analyses
(Hobson et al. 1996; Kurle 2002; Zhao et al. 2006). Hobson et al. (1996) not only
showed a differential fractionation between tissues in pinnipeds with metabolically
active tissues (whole blood) having lower fractionations than inactive tissues (hair,
whiskers), but also that δ15N and δ13C fractionations were consistent among phocid
species, age groups and sex. However, it is not clear if these fractionation factors can be
accurately applied on wild marine mammals other than phocids, as a captive study on
northern fur seals Callorhinus ursinus (Kurle 2002) showed higher δ15N fractionations
between blood components and diet (+4.1‰ to +5.2‰) than reported in phocids.
Nonetheless, the isotopic variation between tissues is lower than the primary
fractionation between diet and tissues, thus analysing a suite of tissues is still useful for
studying the feeding pattern of wild animals over different time periods (Kurle and
Worthy 2002; Dalerum and Angerbjörn 2005)
Another means of examining temporal variation in trophic position using stable isotopes
is to compare successive sections of a tissue with a progressive growth pattern such as
teeth in pinnipeds and odontocetes (toothed cetaceans) or baleen plates in mysticetes
(baleen cetaceans) (review in Dalerum and Angerbjörn 2005; e.g., Schell et al. 1989;
Hobson and Sease 1998; Walker and Macko 1999; Mendes et al. 2007). The use of
chronological sections of dentine allows the investigation of the dietary history of an
animal, that be related to its age. Marine mammals are generally accessible to research
during a particular time of their life cycle (e.g., during breeding and molting for
pinnipeds, or during migration to coastal areas for cetaceans), thus the investigation of
dietary history can provide a better understanding of the ecology of marine mammals in
periods when they are difficult to access. For instance, Schell et al. (1989) and Mendes
et al. (2007) used carbon isotopic signatures from the baleen of bowhead whales
Balaena mysticetus and from teeth of sperm whales Physeter macrocephalus
respectively, to confirm the latitudinal migration of these cetaceans during certain
periods of their life.

Chapter 1 – General introduction and literature review
19
Furthermore, examination of teeth has proven to be informative of the length of the
lactation period in marine mammals (Hobson and Sease 1998; Newsome et al. 2006;
Knoff et al. 2008; York et al. 2008). Hobson and Sease (1998) found higher δ15N and
lower δ13C in the first annulus of Steller sea lions Eumetopias jubatus tooth dentine
relative to the dentine deposited after the first year, associating this isotopic variation to
the weaning of young sea lions. Indeed, nursing neonates are feeding at higher trophic
level than their mothers since they are consuming proteins from the mother’s tissues,
resulting in higher δ15N than the post-weaning period. Low values of δ13C in tissues of
nursing young are associated with the composition of milk, which is depleted in δ13C
due to its high fat content (Tieszen et al. 1983). Recent studies have used this technique
to detect the weaning period of California sea lions Zalophus californianus and northern
fur seals (Newsome et al. 2006), bottlenose dolphins Tursiops truncatus (Knoff et al.
2008) and Steller sea lions throughout the last decades (York et al. 2008).
Variation in isotopic signatures through time does not mean necessarily a different diet,
as variation can arise from a baseline change in isotopic ratios of the primary production
(e.g., seasonal upwelling) (Newsome et al. 2007). Thus it is important to understand the
isotopic fluctuations in lower trophic levels before comparing isotopic levels of tissues
sampled at different time periods and locations (Post 2002). For a similar trophic level,
benthic organisms have generally higher δ15N values than that of pelagic prey
(Davenport and Bax 2002; Tucker et al. 2007). Thus, information on isotopic levels of
potential prey may help the interpretation of comparative studies, and give a qualitative
indication of the diet (Kurle and Worthy 2001; Lesage et al. 2001; Lewis et al. 2006;
Niño-Torres et al. 2006; Dehn et al. 2007; Newsome et al. 2007; Tucker et al. 2007).
δ15N does not only vary with areas and seasons (Post 2002), but is also influenced by
the feeding level, the diet quality and the physiological state of the animal (Hobson et
al. 1993; Kurle and Worthy 2001, 2002; Gaye-Siessegger et al. 2003; Fuller et al. 2005;
Zhao et al. 2006). For instance, in nutritionally stressed animals, proteins are broken
down in the muscle and 14N is mobilised. Since it is not replaced by dietary 14N, there is
an increase of δ15N in tissues (Hobson et al. 1993; Kurle and Worthy 2001; Fuller et al.
2005; Zhao et al. 2006). Pregnancy may have the opposite effect by lowering levels of
δ15N in tissues, although the mechanisms behind this decrease are not fully understood
(Fuller et al. 2004). In view of the different factors affecting the levels of δ15N in animal

Chapter 1 – General introduction and literature review
20
tissues, the application of other dietary methods to complement isotopic results are
necessary.
1.3.4 FA signature analysis
Although FA analysis is categorised as a “new method” to infer the diet, the first
attempt at comparing FAs from the blubber of a marine mammal and its prey occurred
in the 1960s. Ackman et al. (1963) compared FAs in seal blubber oil with FAs in
menhaden and herring oils, and found some similarities between FA compositions.
Since, several experimental studies showed that the FA composition of depot fat is
influenced by dietary FA composition (Xu et al. 1993; Cha and Jones 1996; Kirsch et
al. 1998; Kirsch et al. 2000). Consequently, FA analysis has been increasingly popular
in dietary studies on marine mammals in the last twenty years, as it can overcome biases
related to hard part analysis (e.g., Iverson et al. 1997a; Iverson et al. 1997b; Brown et
al. 1999; Dahl et al. 2000; Walton et al. 2000; Lea et al. 2002a; Bradshaw et al. 2003;
Olsen and Grahl-Nielsen 2003; Grahl-Nielsen et al. 2005; Staniland and Pond 2005;
Thiemann and Iverson 2007; Budge et al. 2008; Tucker et al. 2008). The underlying
principle of this method is the assumption that long-chain FAs in prey species are
conservatively deposited into the adipose tissue of a monogastric predator, thus
providing an integrated record of dietary intake over time.
FAs consist mostly of an even-numbered chain of carbons with a carboxyl terminus at
one end, and a methyl terminus at the other (Fig. 1-4). The number of carbons in the
marine environment ranges from 12 to 24 carbons. The common forms of FAs are the
triacylglycerols (TAGs), the wax esters (WEs) and the phospholipids (PLs) (Ackman et
al. 1968). TAGs consist of three FAs esterified to a glycerol backbone and represent the
main form of energy storage in adipose tissue (Patton 1975). WEs consist of a FA
esterified to a fatty alcohol, and are also related to energy storage for some marine
species (e.g., copepods, orange roughy Haplostethus atlanticus, myctophids, beaked
whales and sperm whales) (Grigor et al. 1990; Phleger et al. 1997; Dalsgaard et al.
2003; Koopman 2007). PLs consist of two FAs esterified to a glycerol which also
contain a polar derivative of phosphatidic acid, and compose the structure of all cell
membranes (Sargent 1976). They are less influenced by the diet than TAGs and Wes
(Dalsgaard et al. 2003).
Chapter 1 – General introduction and literature review
21
1.3.4.1 Metabolism of ingested FAs
Uptake of dietary FAs by adipose tissue in a monogastric predator involves several
steps: absorption in the small intestine, incorporation into chylomicron TAG, hydrolysis
of TAG by the adipose tissue lipoprotein lipase, uptake of FAs and esterification within
adipocytes. The fact that dietary FAs are not degraded during this process makes these
molecules potential food markers. Early works by Iverson and colleagues (Iverson
1993; Iverson et al. 1995) found that dietary lipids were deposited with minimal
modification in seal’s blubber and milk. Experimental studies conducted since have
shown that lipid deposition involves complicated processes of deposition from dietary
lipids, differential metabolism, and biosynthesis de novo (e.g., Raclot and Groscolas
1993; Raclot and Groscolas 1995; Kirsch et al. 2000; Summers et al. 2000; Budge et al.
2004; Iverson et al. 2004; Cooper et al. 2005; Cooper et al. 2006). For part of the
research community led by Iverson’s group, these processes can be understood and
quantified by experimental studies (“deposited in a predictable manner”; Iverson et al.
2004) in order to apply FA analysis as a dietary method in marine mammals. For others
led by Ghral-Nielsen’s group, these processes cannot be quantified as they are
influenced by too many factors, thus limiting the application of FAs in dietary studies
(see comments and reply in Grahl-Nielsen et al. 2003, 2004; Thiemann et al. 2004a and
Grahl-Nielsen 2009; Thiemann et al. 2009).
Depot FAs are generally classified in three categories according to their origin: 1) FAs
which are readily biosynthesised by the animal (e.g., 16:0, 16:1, 18:0, 18:1); 2) FAs
which can be biosynthesised by the animal but are believed to come mostly from dietary
origin (e.g., 14:0, 20:1, some 22:1); and 3) FAs which originate only from the diet (e.g.,
22:1n11 and all PUFA >18 carbons with n-3 and n-6) (Holman 1986; Iverson 1993;
Iverson et al. 2004; Cooper et al. 2006). This classification is based from known
Figure 1-4. Chemical structure of the linoleic acid, noted 18:2n-6 (i.e., 18 carbons, two double bonds, and the first double bond positioned at the 6th carbon from the terminal methyl group).

Chapter 1 – General introduction and literature review
22
metabolism of FAs in vertebrate endotherms, which is believed to be similar between
species (Nelson 1992; e.g., Linares and Henderson 1991; Nilsson et al. 1996). Recently,
there has been an effort to understand FA metabolism in pinnipeds by radio-labeling
techniques on captive animals (Budge et al. 2004; Cooper et al. 2006).
Most of the energy storage in marine mammals is situated in the subcutaneous fat (i.e.,
blubber) (Iverson 2002), and can be biopsied in free-ranging marine mammals after
capture or dart projectile sampling. Therefore, it is the tissue of choice for most dietary
studies using FA analysis (e.g., Iverson et al. 2004; Beck et al. 2005; Herman et al.
2005; Ruchonnet et al. 2006; Beck et al. 2007b). The potential of blubber FAs to
investigate a change in the diet has been recognised in wild marine mammals by
comparing similar species in different environments (e.g., marine versus freshwater
seals; Käkelä et al. 1993; Smith et al. 1996; Grahl-Nielsen et al. 2005) and by captive
feeding studies (Kirsch et al. 2000; Iverson et al. 2004; Cooper et al. 2005). For
example, Kirsch et al. (2000) investigated the blubber FA composition of captive
juvenile harp seals Phoca groenlandica after a diet switch from herring Clupea
harengus to pollock Pollachius virens (sampling at day 0 when switch occurred, at day
14 and day 30). The blubber FAs changed significantly and gradually over weeks
reflecting the change in diet from herring to pollock. The authors also highlighted the
fact that despite a noticeable diet change in blubber FAs, blubber FAs did not match
that of the prey due to metabolic changes in the predator tissue. The degree of metabolic
changes occurring in the blubber of marine mammals was investigated by comparing
the FA composition of milk and of nursing young (hooded seals Cystophora cristata,
Iverson et al. 1995; grey seals Halichoerus grypus, Grahl-Nielsen et al. 2000; white
whales Delphinapterus leucas, Birkeland et al. 2005). Nursing young were chosen as an
ideal model to investigate the transfer of dietary FAs to the blubber as the FA
composition of their diet (i.e., milk) can be easily sampled. Iverson et al. (1995) found
that the FA composition of hooded seal pups resemble that of the milk ingested,
concluding that there was little modification of FAs when deposited in the blubber.
These results were challenged by two studies on grey seals (Grahl-Nielsen et al. 2000)
and on white whales (Birkeland et al. 2005) that showed different compositions
between milk and pup blubber, highlighting the importance of differential metabolism
of FAs in depot lipids.

Chapter 1 – General introduction and literature review
23
Blubber is not a uniform tissue along the body and vertically. Stratification of blubber
has been reported in cetaceans (Lockyer et al. 1984; Koopman et al. 1996; Koopman
1998; Hooker et al. 2001; Olsen and Grahl-Nielsen 2003; Samuel and Worthy 2004;
Ruchonnet et al. 2006; Smith and Worthy 2006; Koopman 2007; Budge et al. 2008;
Montie et al. 2008), phocids (Käkelä and Hyvärinen 1996; Best et al. 2003; Andersen et
al. 2004; Grahl-Nielsen et al. 2005; Wheatley et al. 2007), and otariids (Arnould et al.
2005). Despite different FA patterns of stratification among species, there is a common
feature shared by all species studied, with lower levels of monounsaturated FAs and
higher levels of saturated FAs in the inner layer of the blubber (close to the muscle)
relative to that in the outer layer (close to the skin). The inner layer has been shown to
be metabolically more active than the outer layer (e.g., Lockyer et al. 1984; Montie et
al. 2008), and to have a FA composition closest to that of the diet (e.g., Olsen and
Grahl-Nielsen 2003; Andersen et al. 2004; Grahl-Nielsen et al. 2005). Therefore,
sampling the whole blubber core is crucial in species for which stratification exists, and
can be challenging when dart techniques are used in large whales (Koopman 2007).
Moreover, lipids are not deposited in the blubber and metabolised uniformly along the
body, as some body regions are more metabolically active than others (Koopman et al.
1996; Koopman 1998; Arnould et al. 2005; Mellish et al. 2007). For instance, Koopman
(2001) distinguished the fat depot sites in the body trunk from the structural lipids in the
caudal peduncle in harbour porpoises Phocoena phocoena. In otariids, differential
deposition along the body occurs, but metabolic body sites are not well defined (Mellish
(Arnould et al. 2005; Mellish et al. 2007), whereas phocids seem to present a more
uniform fat distribution (Ryg et al. 1988; Mellish et al. 2007). Thus, it is critical to
sample blubber tissue at a depot body site to be able to trace dietary records from
blubber FAs.
Finally, rates of FA mobilisation can vary according to the nutritional and reproductive
states of the animal (Käkelä et al. 1993; Raclot and Groscolas 1995; Kirsch et al. 2000;
Andersen et al. 2004; Wheatley et al. 2007; Montie et al. 2008). Deposition of dietary
FAs in adipose tissue occurs when the animal is in positive energy balance, whereas this
process is limited when animals are in poor body condition (Kirsch et al. 2000).
Furthermore, lactation can readily affect the FA composition of blubber independently
of the diet, and this has been shown in phocids which fast generally during the entire
Chapter 1 – General introduction and literature review
24
lactation period (Ackman and Jangaard 1964; Bryden and Stokes 1969; Iverson et al.
1995; Wheatley et al. 2007). FAs such as 20:5n-3 are selectively mobilised from
blubber for the production of milk in the mammary gland. Thus, blubber FAs from
lactating females encountering a long period of fasting may not be appropriate for diet
inference (Wheatley et al. 2007). To my knowledge, the degree of FA mobilisation for
milk production has not been investigated in otariids, but it is probably of less
importance than in phocids since lactating otariids feed regularly through lactation (i.e.,
income breeders) and fasting is limited to the perinatal period (period between
parturition and first foraging trip).
Since pinnipeds lactate on land, milk is also a common “tissue” sampled for FA studies
on this taxon (e.g., Iverson 1993; Iverson et al. 1997a; Brown et al. 1999; Lang et al.
2005; Staniland and Pond 2005). It has the advantage over blubber of being less
invasive during sampling, but its FA composition involves biochemical processes more
complex than that of blubber. Indeed, milk fat in marine mammals originates from
dietary FAs and blubber FAs selectively mobilised (Iverson 1993), and the role played
by each FA source is not known. In a captive feeding study on grey seals, Grahl-Nielsen
(2000) found that milk was enriched in saturated FAs, n-3 polyunsaturated FAs, and
20:1, and depleted in 14:1, 16:1 and 18:1 relative to the blubber FAs of the mothers. In
another captive feeding study on Antarctic fur seals, Staniland and Pond (2004)
investigated the suitability of milk to detect a dietary change. The authors found that
milk could reflect a radical change in diet (fish-dominated diet in captive seals versus
krill-dominated diet in wild seals) despite the presence of FAs selectively mobilised
from blubber into the milk. However, the same authors in a study on free-ranging
Antarctic fur seals (Staniland and Pond 2005) found no correlation between the dietary
predictions from faecal samples and from milk FAs, and concluded that more feeding
experiments were needed to understand the factors influencing milk production before
the full potential of this technique can be used.
1.3.4.2 Application of FA method
There are two main ways to use FAs in dietary studies. The first and most common is to
simply compare FA signatures over different time scales, locations or groups of
individuals to investigate diet variation. The second is to infer the proportions of prey

Chapter 1 – General introduction and literature review
25
by mass by comparing FA signatures of the predator and of the potential prey. Another
technique reported by Budge et al. (2006) in their review is to infer qualitatively the diet
or part of the diet by the presence in the predator’s tissue of FA markers specific to a
prey or prey taxon. The use of FA markers has been used mostly in fish studies (review
in Dalsgaard et al. 2003), but their use in marine mammals is limited as no FA is
specific to a particular marine mammal prey (Budge et al. 2006). Therefore, the use of
FA markers has not been developed in my review.
The assumption behind the comparison of individual FA signatures is that different FA
signatures mean different diets. FA analysis has been used this way to assess
geographical (e.g., Walton et al. 2000; Thiemann and Iverson 2007), temporal (e.g.,
Iverson et al. 1997a; Lea et al. 2002a; Walton and Pomeroy 2003; Samuel and Worthy
2004; Beck et al. 2007b), sex (e.g., Samuel and Worthy 2004; Beck et al. 2005; Smith
and Worthy 2006) and ontogenetic (Beck et al. 2007b) variation in the diet of marine
mammals. However, the influence of differential lipid metabolism on FA variation
among individuals is often overlooked in the discussions of scientific papers. FA
differences between individuals sampled at different locations or at different seasons
will be mostly driven by differences in the diet if individuals have the same body
condition and reproductive status (see metabolism of FAs in the above section). In
contrast, lipid metabolism is likely to play a significant role in FA variation between
females and males, or juveniles and adults because of their different energetic
requirements. For instance, Beck et al. (2005) attributed FA variation between grey
seals of different sex and age solely to diet. In a previous study, the same authors
highlighted the difference of energy storage and expenditure between male and female
grey seals (Beck et al. 2003). This difference in reproductive strategy between sexes can
cause variation in diet but also variation in lipid metabolism, a last option not mentioned
by Beck et al. (2005).
Due to the uncertainty of the importance of differential lipid metabolism in predator’s
FAs, and in order to ease the interpretation of dietary patterns, it is good practice to use
this method in combination with other dietary techniques (e.g., Iverson et al. 1997a;
Brown et al. 1999; Lea et al. 2002a; Bradshaw et al. 2003; Grahl-Nielsen et al. 2005;
Hall-Aspland et al. 2005; Herman et al. 2005; Staniland and Pond 2005; Dehn et al.
2007; Tucker et al. 2008).

Chapter 1 – General introduction and literature review
26
The most ambitious way to use FA analysis is to estimate proportions of prey by the
comparison of prey and predator FAs via a mathematical model. This method is named
quantitative FA signature analysis (QFASA), and was initiated by Iverson et al. (2004).
QFASA requires a FA profile library of all potential prey, and calibration coefficients
for individual FAs to account for predator lipid metabolism. The model takes the mean
FA profiles of each prey species in the prey library, and estimates the mixture of prey
FA profiles that comes the closest to match the FA profile of the predator’s adipose
tissue. Then, the best mixture is weighted by the fat content of each prey species, and
translated into a diet estimate (percentage mass).
Before the application of QFASA, one must understand the variation in FA profiles
within a potential prey species (e.g., Budge et al. 2002; Iverson et al. 2002), and
investigate the variation in FA profiles among the prey species in the library. If there is
an overlap between two species, it is advised to group them to avoid misclassification
by the model. Sampling all potential prey for a given predator means a preliminary
understanding of key species in an ecosystem, and of the predator’s foraging habit.
Therefore, the potential prey library is generally built from diet information provided by
traditional methods.
Another prerequisite of QFASA is the account of lipid metabolism and deposition in the
predator’s adipose tissue, which is expressed by the calibration coefficients in the
model. Calibration coefficients are certainly the most challenging parameter to obtain
for QFASA, as they are calculated from captive animals fed on a controlled diet for
several months. Even if the pattern of deposition is similar among marine species for
which long-term diet studies were carried out (Iverson et al. 2004; Tollit et al. 2006;
Iverson et al. 2007; Nordstrom et al. 2008), the calibration coefficient for a particular
FA seems to depend on the predator’s taxum (i.e., otariidae, phocidae) or species
considered (Iverson et al. 2004; Tollit et al. 2006), or even on the meals eaten by the
same predator (D. Tollit, unpubl. data). This is an important drawback limiting the use
of QFASA to species or gender for which calibration coefficients are available. QFASA
is at its early stages of development, and a better understanding of the factors affecting
lipid metabolism is clearly necessary before the full potential of this method can be
applied. Since the first presentation of the model in 2004, QFASA has been used to
estimate the prey proportions of free-ranging marine predators such as seabirds (Iverson
et al. 2007), polar bears Ursus maritimus (Iverson et al. 2006) and grey seals (Beck et
al. 2007a).

Chapter 1 – General introduction and literature review
27
1.3.5 Summary of dietary methods
Pros and cons of each method are summarised in Table 1-1. None of these methods are
ideal, and a combination of several methods must be encouraged. Although traditional
techniques such as hard part analysis from stomachs and faeces are often regarded as
strongly biased, they are the only methods to provide a size estimate of the prey, and are
often needed by biochemical methods to help choose the potential prey to sample and/or
to help the interpretation of isotopic and FA patterns in the predator’s tissues. In fact,
most of the studies on stable isotopes and FAs are compared with hard part analyses to
support their conclusions. Within the new methods, DNA extraction from scat samples
provides a diet picture limited to several days, whereas stable isotopes and FAs can
reflect diet over long time scales, which are more relevant in terms of ecological feeding
behaviour. In contrast to stable isotopes, FA analysis has the potential to qualitatively
and “quantitatively” (proportions by mass) estimate the diet. Therefore, I chose FA
analysis to analyse the long-term diet of NZ sea lions. Stomach samples were available
from animals captured accidentally by fisheries, and were analysed to complement the
results of the FA analysis. Whole prey were obtained to create a library of prey FAs,
and QFASA was tested on NZ sea lions to estimate the importance of prey species in
the long-term diet. The laboratory techniques used to analyse FAs vary and were
reviewed in Appendix 1 along with the difficulties encountered during the laboratory
analyses, how they were dealt with, and the details of the protocol I used.
1.4 OUTLINE OF THE THESIS
This thesis is composed of seven chapters: Chapter 1 is the general introduction and
literature review, chapters 2 to 6 are the research chapters, and Chapter 7 is the general
discussion. Each research chapter is independent and written in a publication format.
Chapters 2, 3 and 4 are published; Chapter 5 is in review and Chapter 6 is to be
submitted. The reference with authorship is given in the front page of each chapter.
Although I was assisted by my co-authors (supervisors), I designed the research,
analysed the data and wrote the chapters. Since Chapters 3 to 6 are using FA analysis,
there is some inevitable repetition in the introduction and method sections of these
chapters.
Chapter 1 – General introduction and literature review
28
In Chapter 2, I investigate the short-term diet of by-caught (incidentally captured) NZ
sea lions by analysing their stomach contents. Diet variation between sex, maturity and
locations were also assessed. Published as Meynier, L., Mackenzie, D.D.S., Duignan,
P.J., Chilvers, B.L., and Morel, P.C.H. 2009. Variability in the diet of New Zealand sea
lion (Phocarctos hookeri) at the Auckland Islands. Marine Mammal Science, in press
In Chapter 3, I investigate the long-term diet variability between by-caught female and
male NZ sea lions and between years of capture, by using FA analysis on blubber tissue.
Published as Meynier, L., Morel, P.C.H., Chilvers, B.L., Mackenzie, D.D.S.,
MacGibbon, A., Duignan, P.J. 2008. Temporal and sex differences in the blubber fatty
acid profiles of the New Zealand sea lion Phocarctos hookeri. Marine Ecology Progress
Series, 366:271-279.
In Chapter 4, I analyse the proximate composition (water, lipid and protein contents),
energy content, and FA profiles of potential prey of NZ sea lions, and investigate the
FA variation between prey species. This will allow the creation of a FA prey library
necessary for QFASA on NZ sea lions. Published as Meynier, L., Morel, P.C.H.,
Mackenzie, D.D.S., MacGibbon, A., Chilvers, B.L., Duignan, P.J. 2008. Proximate
composition, energy content, and fatty acid composition of marine species from the
Campbell plateau, New Zealand. New Zealand Journal of Marine and Freshwater
Research, 42:425-437.
In Chapter 5, I test the QFASA on by-caught NZ sea lions by performing a sensitivity
analysis on several parameters needed for this method. After the identification of
optimal parameters for NZ sea lions, the mass proportions of prey were calculated for
by-caught animals.
In Chapter 6, I investigate the long-term diet of free-ranging lactating NZ sea lions by
analysing the FAs from biopsied blubber. QFASA was also used and diet estimations
were compared with results from by-caught NZ sea lions.
In Chapter 7, I summarise the results of the research chapters and the main
interpretations in terms of the feeding behaviour and the management of NZ sea lions. I
also discuss future research that should be considered for the NZ sea lion.

2 CHAPTER 2
VARIABILITY IN THE DIET OF NEW ZEALAND SEA LION
AT THE AUCKLAND ISLANDS, NEW ZEALAND
Photo: whole arrow squids (Nototodarus sloani) retrieved from a single stomach of a by-caught New Zealand sea lion (Phocarctos hookeri).
Chapter reference:
Meynier, L., Mackenzie, D.D.S., Duignan, P.J., Chilvers, B.L., and Morel, P.C.H. 2009.
Variability in the diet of New Zealand sea lion (Phocarctos hookeri) at the Auckland
Islands. Marine Mammal Science, in press

Chapter 2 – Stomach contents of by-caught NZ sea lions
30
Abstract
Stomach contents of 121 New Zealand (NZ) sea lions (Phocarctos hookeri) caught by
the arrow squid Nototodarus sloani fishery were examined during the summer/autumn
1997-2006 around the Auckland Islands (50°30'S, 166°E). Dietary variation was
assessed among juveniles, lactating females, non-lactating females and males, and
between areas on the Auckland Islands shelf. The digested fraction of the contents
consisted mostly of opalfish Hemerocoetes spp (50.1% by number [N], 4.7% by mass
[M]), rattail Coelorinchus spp (12.0%N, 2.4%M), arrow squid (14.1%N, 17.9%M),
octopus Enteroctopus zealandicus (2.1%N, 27.8%M) and red cod Pseudophycis bachus
(3.8%N, 4.3%M). Opalfish was found in greater proportions in the stomachs of females
(lactating: 58.1%N; non-lactating: 62.4%N) and juveniles (56.9%N) than males
(14.5%N). Juveniles caught smaller opalfish and rattail than adults did. Over all classes,
sea lions ate larger prey in the East than in the North of the Auckland Islands shelf. The
common prey –arrow squid and rattail– constitute an abundant resource at the edges of
the Auckland Islands shelf, where lactating NZ sea lions forage. Although these key
areas are far from the rookeries and impacted by the squid fishery, they may provide the
only reliable resource able to support the cost of benthic foraging behaviour in the
deepest diver of all otariids.

Chapter 2 – Stomach contents of by-caught NZ sea lions
31
2.1 INTRODUCTION
The New Zealand (NZ) sea lion (Phocarctos hookeri) is one of the world’s rarest and
most highly localised pinnipeds, classified as “Threatened” under the NZ threatened
classification system, and the NZ Marine Mammals Protection Act 1978 (Hitchmough
et al. 2007). The population size is estimated to be between 10,000 to 13,000 animals
(Campbell et al. 2006) and has undergone a decline in pup production in recent years
(Chilvers et al. 2007b). In addition to its low abundance, NZ sea lions have a restricted
breeding range with 86% of the pup production at the Auckland Islands (50°30'S
166°E) (Campbell et al. 2006; Chilvers et al. 2007b). In the past eight years, this species
has been affected by three disease epidemics, which resulted in the mortality of half the
pups born in 1998, and about a third of the pups in both 2002 and 2003 (Wilkinson et
al. 2006). These events highlight the vulnerability of this restricted population, and they
are still impacting on the recruitment of mature females (Chilvers et al. 2007b).
Concern has arisen during the past decade over the interactions between NZ sea lions
and the arrow squid (Nototodarus sloani) trawl fishery. This fishery operates on the
Auckland Islands shelf between February and May each year (Gales 1995), which
corresponds to the first months of the sea lion lactation period. Early observations of the
NZ sea lion’s feeding habits suggested that squid comprised a significant part of its diet
(Cawthorn et al. 1985), leading to potential captures (by-catch) of sea lions in squid
trawl nets. Since 1988, government observers have been placed on approximately 20%
of the squid fleet every year (Wilkinson et al. 2003). The total number of by-caught sea
lions is estimated by extrapolation of the number reported by the observers up to the
entire fleet. It was calculated that up to 140 NZ sea lions were caught each year in
fishing nets (Wilkinson et al. 2003; Baird 2005a, b).
Management efforts to date have focused on direct interactions, i.e., by-catch, but not on
the possible resource competition between the fishery and NZ sea lions. Knowledge of
feeding habits of the NZ sea lion is essential to determine its trophic interaction with
fisheries, and its role in the Auckland Islands ecosystem. To date, only Childerhouse et
al. (2001) have investigated the diet of sea lions at the Auckland Islands from the
analyses of faeces and regurgitates between 1994 and 1997. Two other diet studies from
scat samples were carried out at sites visited by male NZ sea lions, Macquarie Island
(54.5°S 159°E) (McMahon et al. 1999) and Otago Peninsula (South Island NZ) (Lalas
1997). In these three locations, sea lions fed on a wide variety of prey, mainly fish

Chapter 2 – Stomach contents of by-caught NZ sea lions
32
species. Scat analyses are, however, known to be subject to biases such as differential
retention/erosion rates of hard remains (Jobling and Breiby 1986; Jobling 1987; Harvey
1989; Tollit et al. 1997; Bowen 2000; Staniland 2002). Stomach analyses are hampered
by biases similar to scat analyses, but to a lesser extent, as hard remains do not pass
through the whole intestine. Moreover, the contents of each stomach can be directly
related to the sex, age and reproductive status of the animal.
In this study, the diet of the NZ sea lion was assessed by analysing the stomach contents
of animals by-caught between 1997 and 2006 in the squid trawl fishery. The data
collected provided the first quantification by percentage mass of the diet of NZ sea
lions. I also provide information on variation in diet among age and sex classes and
between different locations on the Auckland Islands shelf was investigated.
2.2 MATERIALS AND METHODS
2.2.1 Sample collection
Since 1997, NZ sea lions incidentally captured by the squid fishery operating off the
Auckland Islands (Fig. 2-1) have been frozen and sent to Massey University for
necropsy. The whole stomach was removed and stored in a freezer at –20°C until
further analysis. The sex/maturity status (immature [Im], lactating female [LF], non-
lactating female [NLF] and male [Ma]) was recorded for each individual. Females
without development of the mammary gland, and in the absence of corpus luteum or
corpus albicans in the ovaries, were categorised as immature (Duignan et al. 2003). The
maturity of the males was determined by histological examination of the testes:
Immature males had a lack of lumen in their seminiferous tubules, a high proportion of
interstitial cells, and no spermatids or spermatozoa (Duignan et al. 2003). Immature
females and males were pooled. Age of the animals was estimated using incremental
growth layers in the dentine of canine teeth (Duignan et al. 2003). The average body
mass of Im LF, NLF and Ma was calculated since it is known to influence dive duration
(Costa 1993), and thus may assist the understanding of the feeding behaviour.
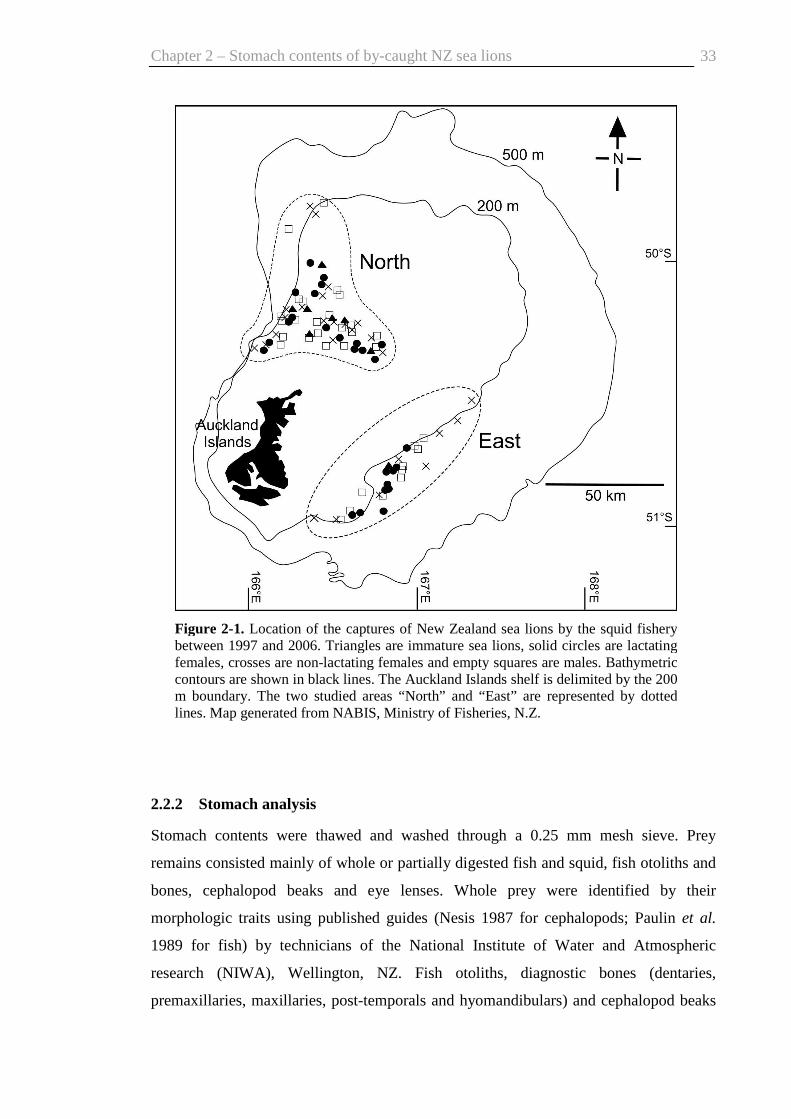
Chapter 2 – Stomach contents of by-caught NZ sea lions
33
2.2.2 Stomach analysis
Stomach contents were thawed and washed through a 0.25 mm mesh sieve. Prey
remains consisted mainly of whole or partially digested fish and squid, fish otoliths and
bones, cephalopod beaks and eye lenses. Whole prey were identified by their
morphologic traits using published guides (Nesis 1987 for cephalopods; Paulin et al.
1989 for fish) by technicians of the National Institute of Water and Atmospheric
research (NIWA), Wellington, NZ. Fish otoliths, diagnostic bones (dentaries,
premaxillaries, maxillaries, post-temporals and hyomandibulars) and cephalopod beaks
Figure 2-1. Location of the captures of New Zealand sea lions by the squid fishery between 1997 and 2006. Triangles are immature sea lions, solid circles are lactating females, crosses are non-lactating females and empty squares are males. Bathymetric contours are shown in black lines. The Auckland Islands shelf is delimited by the 200 m boundary. The two studied areas “North” and “East” are represented by dotted lines. Map generated from NABIS, Ministry of Fisheries, N.Z.

Chapter 2 – Stomach contents of by-caught NZ sea lions
34
were identified using a reference collection of fish otoliths, fish bones and cephalopod
beaks held at Massey University and published guides (Clarke 1986; Smale et al. 1995).
Within the same genus, some otoliths and beaks show no or little specific difference. In
such cases, the hard parts were attributed to the most abundant species occurring in the
studied area. If more than one species belonging to the same genus was present in the
area, the genus was noted ‘spp’. This is the case for jack mackerels Trachurus spp (T.
declivis or murphyi), warehous Seriolella spp (S. brama, caerulea or punctata), rattails
Coelorinchus spp (C. aspercephalus, bollonsi or fasciatus), lanternfish Diaphus spp
(danae, hudsoni or meadi) and opalfish Hemerocoetes spp (monopterygius, artus or
morelandi). The sieved remains were stored in 70% ethanol except for bones and
otoliths, which were kept dry.
All the animals sampled were by-caught from the arrow squid fishery and hence from a
region characterised by abundant squid. This may lead to an overestimation of the squid
contribution to the diet. Indeed, almost all stomachs contained fresh squid, which were
ingested just before death. To minimise the overestimation of the squid contribution in
the content, I distinguished a fresh and a digested fraction (Pusineri et al. 2007). The
fresh fraction included whole prey and hard remains with some flesh attached (e.g.,
skulls and vertebral columns) that were ingested shortly prior to death of the animal.
The digested fraction consisted of remains without associated flesh (e.g., free otoliths,
bones and beaks), which were most likely part of meals ingested from one to several
days before death (based on gut passage times estimated from feeding experiments with
otariids; Bigg and Fawcett 1985; Dellinger and Trillmich 1988; Staniland 2002; Tollit et
al. 2003). The digested fraction was assumed to be a better representation of the
background diet of sea lions before they fed on squid in or close to the nets. Only this
fraction was considered in the statistical analyses.
All diagnostic hard parts (otoliths, some bones, and beaks) were counted for each
content, and the number of a taxon was determined as follows: The number of fish was
estimated by the number of otoliths. If less than ten per taxon were present, left and
right otoliths were sorted, and the highest number was taken. If more than ten, the total
number was simply divided by two. The number of cephalopods was estimated by the
number of upper or lower beaks, whichever was higher (Pierce and Boyle 1991).
Prey sizes and masses were estimated by measuring otolith length, or otolith width
when the tip was broken, lower beak rostral length (LRL for squid) or lower beak hood
length (LHL for octopods and sepiolids), and by using regressions from the literature or

Chapter 2 – Stomach contents of by-caught NZ sea lions
35
my own reference collection (Table 2-1). When a species was represented by > 30
otoliths or beaks in a stomach, 30 to 40 were randomly picked and measured. In this
case, a weighting factor (ratio of the total prey to the measured prey) was multiplied
with each measure (Santos et al. 2004a). Only otoliths with no sign of erosion were
measured in order to minimise the underestimation of size and mass.
The relative importance of each prey was estimated as the percentage of occurrence
(number of stomachs in which the taxon was observed), the proportion of the total prey
number in the sample set, and the proportion of the total reconstructed mass (product of
the number of prey and the average body mass).
2.2.3 Statistical analysis
Variation among areas (North and East, Fig. 2-1), and sex classes (combined
sex/maturity factor: LF, NLF, Im and Ma) was investigated on the number and median
length of the common prey from the digested fraction. Prey were considered common
when the occurrence was > 30%, and occasional when the occurrence was < 10% in the
sample set.
Data in a stomach analysis consist of many zero values for each prey distribution, which
makes the application of parametric tests such as ANOVA difficult. The Scheirer-Ray-
Hare (SHR) test is a non-parametric equivalent of a two-way ANOVA (Dytham 1999),
and was used to reveal significant differences on the number of common prey within
areas and sex classes. Post-hoc comparisons were performed using Tukey tests. The
median lengths of common prey were tested using a Kruskal-Wallis and post-hoc
Mann-Whitney tests for sex classes, and using a Mann-Whitney test for areas. I set the
statistical significance α at 0.10 to take into account the low statistical power of my
analyses (low sample size). Tests were performed with the MINITAB package
(MINITAB Release 14.1, MINITAB Inc. 2003), and all arithmetic means are followed
by the standard deviation (SD).

36
Table 2-1. Regression equations used to estimate the length and mass of prey from otolith/beak measurements. HL is the hood length in mm, LRL is the lower rostral length in mm, DML is the dorsal mantle length in mm, M is the reconstructed biomass in g, OL is the otolith length in mm, OD is the longest otolith diameter in mm, SL is the standard length and TL is the total length. For these last two measurements, the unit is specified in the equations. n is the number of measurements used to construct the equations, r is the correlation coefficient. * No regression was available within the same family and a regression of a species from a related family has been used.
Prey species species used for length estimate
Estimated Length n r Source species used for mass estimate
Estimated Mass n r Source
FISH Argentina elongata A. silus TLcm = 3.87 OL 15 0.95 (Leopold et al.
2002) A. silus M = (0.16 TLcm)3.46 7 0.99 (Leopold et al.
2002) Brama brama same ln TLmm = 5.2987 +
0.5586 ln OD 43 0.787 (Smale et al.
1995) same ln M = 3.5947 + 2.1934
ln OD 43 0.772 (Smale et al.
1995) Trachurus spp same TLmm = 17.82 OL1.325 65 (Fea et al.
1999) same M = 0.034 OL4.285 44 (Fea et al.
1999) Seriolella brama Seriolella spp TLmm = 40.475
OL1.043 10 0.79 L. Meynier,
unpubl. data Seriolella punctata
M = 0.0193 TLcm3 (Froese and
Pauly 2007) Seriolella caerulea Seriolella spp TLmm = 40.475
OL1.043 10 0.79 L. Meynier,
unpubl. data Seriolella punctata
M = 0.0193 TLcm3 (Froese and
Pauly 2007) Seriolella punctata Seriolella spp TLmm = 40.475
OL1.043 10 0.79 L. Meynier,
unpubl. data same M = 0.0193 TLcm
3 (Froese and Pauly 2007)
Seriolella spp same TLmm = 40.475 OL1.043
10 0.79 L. Meynier, unpubl. data
Seriolella punctata
M = 0.0193 TLcm3 (Froese and
Pauly 2007) Congiopodus coriaceus
C. spinifer ln TLmm = 3.799 + 1.1698 ln OD
46 0.923 (Smale et al. 1995)
C. spinifer ln M = -0.0974 + 3.5938 ln OD
45 0.919 (Smale et al. 1995)
Gnathophis habenatus Bassanago albescens
ln TLmm = 4.1576 + 1.0912 ln OD
43 0.919 (Smale et al. 1995)
Bassanago albescens
ln M = -2.1867 + 3.9603 ln OD
43 0.916 (Smale et al. 1995)
Emmelichthys nitidus same ln TLmm = 3.2242 + 1.2005 ln OD
40 0.983 (Smale et al. 1995)
same ln M = -2.4456 + 3.8311 ln OD
42 0.983 (Smale et al. 1995)
Micromesistius australis
M. poutassou TLcm = 5.65 + 2.66 OL
101 0.99 (Leopold et al. 2002)
same M = 0.004688 TLcm3.0931 441 0.98 (O'Driscoll and
Bagley 2001) Thyrsites atun same ln SLmm = 3.9602 +
1.1198 ln OD 53 0.98 (Smale et al.
1995) same ln M = -1.7389 + 3.9189
ln OD 61 0.994 (Smale et al.
1995)

37
Gonorynchus gonorynchus
same ln TLmm = 4.4773 + 1.0094 ln OD
25 0.988 (Smale et al. 1995)
same ln M = 0.7456 + 3.3375 ln OD
25 0.988 (Smale et al. 1995)
Coelorinchus spp C. aspercephalus TLcm = 1.488 OL1.271 (Holborow 1999)
C. aspercephalus
M = 0.011 OL3.946 (Holborow 1999)
Lepidorhynchus denticulatus
same TLcm = 2.216 OL1.153 (Holborow 1999)
same M = 0.01 OL3.697 (Holborow 1999)
Macruronus novaezelandiae
same TLmm = 16.31 OL1.238 (Fea et al. 1999)
same M = 0.004771 TLcm2.8796 (O'Driscoll and
Bagley 2001) Merluccius australis Macruronus
novaezelandiae TLmm = 16.31 OL1.238 (Fea et al.
1999) same M = 0.004771 TLcm
2.8796 (O'Driscoll and Bagley 2001)
Austrophycis marginata
Pseudophycis bachus
TLmm = 7.267 OL1.625 (Fea et al. 1999)
Pseudophycis bachus
M = 0.003 OL4.979 (Fea et al. 1999)
Pseudophycis bachus same TLmm = 7.267 OL1.625 (Fea et al. 1999)
same M = 0.003 OL4.979 (Fea et al. 1999)
Parapercis colias Halidesmus scapularis*
ln TLmm = 4.2174 + 1.3009 ln OD
93 0.883 (Smale et al. 1995)
same M = 0.01 TLcm 3.1 93 0.875 (Froese and Pauly 2007)
Diaphus danae/hudsoni/meadi
D. hudsoni ln SLmm = 2.7179 + 1.0077 ln OD
24 0.959 (Smale et al. 1995)
D. hudsoni ln M = -2.1402 + 2.487 ln OD
23 0.937 (Smale et al. 1995)
Lampanyctodes hectori same SLmm = 21.88 OL1.239 (Fea et al. 1999)
same M = 0.123 OL3.838 (Fea et al. 1999)
Myctophum/hygophum Lampanyctodes hectori
SLmm = 21.88 OL1.239 (Fea et al. 1999)
Lampanyctodes hectori
M = 0.123 OL3.838 (Fea et al. 1999)
Scopelosaurus spp Saurida undosquamis*
ln TLmm = 3.0124 + 1.1711 ln OD
18 0.969 (Smale et al. 1995)
S. adleri M = 0.0009 TLcm 3.4867 19 0.964 (Froese and Pauly 2007)
Genypterus blacodes G. capensis ln TLmm = 2.393 + 1.563 ln OD
67 0.984 (Smale et al. 1995)
G. capensis ln M = -6.4094 + 5.2076 ln OD
65 0.984 (Smale et al. 1995)
Hemerocoetes artus Hemerocoetes spp
SLmm = 34.297 + 32.553 OL
20 0.46 L. Meynier, unpubl. data
Hemerocoetes spp
M = 3 10-8 SLmm 3.9565 20 0.9 L. Meynier, unpubl. data
Hemerocoetes monopterygius
Hemerocoetes spp
SLmm = 34.297 + 32.553 OL
20 0.46 L. Meynier, unpubl. data
Hemerocoetes spp
M = 3 10-8 SLmm 3.9565 20 0.9 L. Meynier, unpubl. data
Hemerocoetes spp same SLmm = 34.297 + 32.553 OL
20 0.46 L. Meynier, unpubl. data
same M = 3 10-8 SLmm 3.9565 20 0.9 L. Meynier, unpubl. data

38
Table 2-1. Continued
Prey species species used for length estimate
Estimated Length n r Source species used for mass estimate
Estimated Mass n r Source
FISH (continued) Neophrynichthys latus same TLmm = -73.201 +
81.024 OL S.
Childerhouse, unpubl. data
Helicolenus dactylopterus*
ln M = -3.2748 + 3.8463 ln OD
171 0.982 (Smale et al. 1995)
Helicolenus percoides H. dactylopterus ln SLmm = 2.6947 + 1.2357 ln OD
195 0.977 (Smale et al. 1995)
H. dactylopterus ln M = -3.2748 + 3.8463 ln OD
171 0.982 (Smale et al. 1995)
SpA Scorpaenidae H. dactylopterus ln SLmm = 2.6947 + 1.2357 ln OD
195 0.977 (Smale et al. 1995)
H. dactylopterus ln M = -3.2748 + 3.8463 ln OD
171 0.982 (Smale et al. 1995)
CEPHALOPODS Enteroctopus zealandicus
Octopus vulgaris DML = 5.39 + 24.9 HL
(Clarke 1986) Octopus vulgaris
ln M = 1.82 + 3.03 ln HL
(Clarke 1986)
Octopoteuthidae Octopoteuthis sp DML = -0.4 + 17.33 LRL
(Clarke 1986) Octopoteuthis sp ln M = 0.166 + 2.31 ln LRL
(Clarke 1986)
Nototodarus sloani Nototodarus spp (east coast)
ln DML = 4.18 + 0.788 ln LRL
(Clarke 1986) Nototodarus spp (east coast)
ln M = 1.79 + 2.41 ln LRL
(Clarke 1986)
Moroteuthis ingens same DML = 39.61 LRL – 13.58
137 0.92 (Jackson 1995)
same ln M = -0.068 + 3.5 ln LRL
(Clarke 1986)
Sepiolidae Sepiolla spp DML = 5.39 + 24.9 HL
(Clarke 1986) Sepiolla spp ln M = 0.4 + 0.35 ln HL (Clarke 1986)

Chapter 2 – Stomach contents of by-caught NZ sea lions
39
2.3 RESULTS
2.3.1 Overall diet
A total of 121 stomach contents of NZ sea lions by-caught between February and May
from 1997 to 2006 were examined. Mature sea lions of both sexes were well
represented in each area (Table 2-2). In total, mature males represented a third of the
sample set, and mature females were more numerous with half of them lactating.
Table 2-2. Distribution of the number of stomachs of New Zealand sea lions analysed according to the by-catch location and whether they were immature (Im), lactating females (LF), non-lactating females (NLF), or males (Ma) together with their average body mass (BM ± SD). The first number in each category represents the total number of stomachs analyzed. The second number in parentheses is the number of stomachs containing some digested material (digested fraction). The difference between the two numbers is the number of stomachs containing fresh prey only.
Category North East Unknown location Total BM (kg)
Im 8 (7) 3 (1) 1 (1) 12 (9) 91 ± 13
LF 21 (20) 12 (12) 1 (1) 34 (33) 108 ± 14
NLF 23 (23) 8 (8) 4 (3) 35 (34) 104 ± 16
Ma 22 (20) 11 (9) 7 (7) 40 (36) 167 ± 60
Total 74 (70) 34 (30) 13 (12) 121 (112)
Overall, 35 different prey taxa were found with fish comprising the bulk of the diet
(Table 2-3). Cephalopods ranked second and crustaceans occurred only sporadically. In
total, 6004 diagnostic hard remains were recovered from stomach contents, which
corresponded to an estimated 3627 individual prey of which 2309 were fish, 1311 squid,
six crustaceans and one bird. Only nine out of 35 taxa had a frequency of occurrence >
10%. The common prey species were arrow squid (86.9% by Occurrence [O], 33.4% by
Number [N], 43.0% by Mass [M]), rattail Coelorinchus spp (55.7%O, 10.0%N,
1.8%M), opalfish Hemerocoetes spp (48.4%O, 35.5%N, 2.4%M), octopus Enteroctopus
zealandicus (38.5%O, 3.1%N, 14.4%M) and red cod Pseudophycis bachus (32.0%O,
3.1%N, 3.2%M). Hoki Macruronus novaezealandiae and hake Merluccius australis
contributed significantly to the total mass (17.8%M) but they were present in only 16%
of the stomachs.

Chapter 2 – Stomach contents of by-caught NZ sea lions
40
Table 2-3. Composition of the New Zealand sea lion’s diet expressed as: % occurrence (%O; percentage of stomachs in which the taxon was observed), % number (%N; percentage of the total prey number across all samples) and % reconstructed mass (%M; percentage of the number of prey times the average body mass) of the total content, the digested fraction only and the fresh fraction only. Bold numbers represent the principal contributions. Common and occasional prey have an occurrence > 30% and < 10% respectively.
FRACTION (nb of stomachs) TOTAL (121) DIGESTED (112) FRESH (101)
Diet picture 1 to 2+ days before death Just before death
FISH %O %N %M %O %N %M %O %N %M Argentinidae Argentina elongata (silverside) 3.3 0.3 0.1 2.7 0.3 0.2 1.0 0.3 0.1 Bramidae Brama brama (sea bream) 0.8 < 0.05 0.2 0.9 < 0.05 0.4 Carangidae Trachurus spp. (jack mackerels) 8.2 0.7 3.0 7.1 0.7 2.6 5.9 0.6 1.6 Centrolophidae Seriolella spp. (warehou) 4.1 0.2 1.0 2.7 0.1 1.2 2.0 0.3 1.1 Congiopodidae Congiopodus coriaceus (pigfish) 11.5 0.7 0.1 9.7 0.6 0.1 4.0 0.8 0.1 Congridae Gnatophis habenatus (silver conger) 1.6 0.1 0.1 1.8 0.1 < 0.05 Emmelichthydae Emmelichthys nitidus (redbait) 0.8 < 0.05 < 0.05 0.9 < 0.05 < 0.05 Gadidae Micromesistius australis (St
blue whiting) 2.5 0.1 < 0.05 1.8 0.1 < 0.05 1.0 0.1 < 0.05 Gempilidae Thyrsites atun (barracouta) 7.4 0.5 4.6 5.3 0.5 5.8 5.0 0.4 3.0 Gonorynchidae Gonorynchus gonorynchus (sand fish) 0.8 < 0.05 < 0.05 1.0 0.1 0.1 Macrouridae Coelorinchus spp (rattails) 55.7 10.0 1.8 54.0 12.0 2.4 10.9 4.3 0.7 Lepidorhynchus denticulatus (javelin fish) 9.0 3.3 0.4 7.1 4.3 0.7 4.0 1.8 0.1 Unidentified Macrouridae 1.6 0.3 0.6 1.8 0.1 0.9 Total Macrouridae 59.0 13.6 2.8 57.5 16.4 4.0 11.9 6.1 1.0 Merlucciidae Macruronus novaezelandiae (hoki) 11.5 2.2 9.6 12.4 3.1 15.5 1.0 0.5 2.4 Merluccius australis (hake) 4.1 0.3 7.4 3.5 0.3 3.7 2.0 0.2 4.0 Unidentified Merlucciidae 1.6 < 0.05 0.8 1.8 0.1 2.6 Total Merlucciidae 16.4 2.5 17.8 15.9 3.5 21.8 3.0 0.7 6.4 Moridae Austrophycis marginata (dwarf cod) 6.6 0.9 < 0.05 7.1 1.1 0.1 Pseudophycis bachus (red cod) 32.0 3.1 3.2 30.1 3.8 4.3 5.9 0.7 0.9 Total Moridae 36.1 4.0 3.2 36.3 4.9 4.4 5.9 0.7 0.9 Mugiloididae Parapercis colias (blue cod) 0.8 < 0.05 < 0.05 0.9 < 0.05 < 0.05 Myctophidae Diaphus spp 0.8 < 0.05 < 0.05 1.0 0.1 < 0.05

Chapter 2 – Stomach contents of by-caught NZ sea lions
41
Lampanyctodes hectori 4.1 0.7 < 0.05 4.4 0.9 < 0.05 Myctophum sp 0.8 0.1 < 0.05 0.9 0.1 < 0.05 Total Myctophidae (lanternfish) 5.7 0.8 < 0.05 5.3 1.0 < 0.05 1.0 0.1 < 0.05 Notosudidae Scopelusaurus sp 0.8 < 0.05 < 0.05 0.9 < 0.05 < 0.05 Ophidiidae Genypterus blacodes (ling) 13.1 0.9 4.4 14.2 1.5 8.8 Percophidae Hemerocoetes spp (opalfish) 48.4 35.5 2.4 50.4 50.1 4.7 5.0 5.2 0.3 Psychrolutidae Neophrynichthys latus (dark toadfish) 10.7 1.0 < 0.05 9.7 1.2 < 0.05 3.0 0.4 < 0.05 Scorpaenidae Helicolenus percoides (scarpee) 0.8 < 0.05 0.1 1.0 0.1 0.2 Unknown species A 7.4 0.7 < 0.05 8.0 1.0 < 0.05 Total Scorpaenidae 8.2 0.7 0.1 8.0 1.0 < 0.05 1.0 0.1 0.2 Rajidae Raja nasuta 3.3 0.3 0.2 2.0 0.2 0.3 Unidentified fish 10.7 0.5 0.2 6.2 0.4 - 5.0 0.5 - CEPHALOPODS Octopodidae Enteroctopus zealandicus (Octopus) 38.5 3.1 14.4 28.3 2.1 27.8 15.8 4.5 6.0 Octopoteuthidae? Unknown species 0.8 < 0.05 < 0.05 0.9 < 0.05 < 0.05 Ommastrephidae Nototodarus sloani (arrow squid) 86.9 33.4 43.0 33.6 14.1 17.9 82.2 78.1 78.5 Onychoteuthidae Moroteuthis ingens (Wary squid) 3.3 0.9 1.9 3.5 1.1 2.9 Sepiolidae Unknown species 2.5 0.1 < 0.05 1.0 0.1 < 0.05 Unidentified squid 0.8 < 0.05 - 0.9 < 0.05 - CRUSTACEANS (swimming crabs) unknown genus 4.9 0.2 - 0.9 < 0.05 - 5.9 0.5 - Palinuridae Jasus sp (crayfish) 2.5 0.1 - 0.9 < 0.05 - 2.0 0.2 - BIRD Procellariidae Pachyptila sp (prion) 0.8 < 0.05 < 0.05 1.0 0.1 0.1 Total number of taxa/species 35 29 23 Total of prey 3627 2732 895
The same prey species were common in both the total content and the digested fraction,
however they were not in the same order of importance (Table 2-3). In the analysis of
the digested fraction, rattail was the most commonly eaten (54.0%O), followed by
opalfish (50.4%O) and arrow squid (33.6%O). Opalfish represented half of the diet by

Chapter 2 – Stomach contents of by-caught NZ sea lions
42
number but was still low based on mass (4.7%M) due to a small individual mass (Table
2-4, 20 ± 13 g). In contrast, octopus was the first prey by mass (27.8%M) due to a high
individual mass (1788 ± 2322 g). Red cod, hoki and hake occurred in the same
proportions in the digested fraction as in the total content (Table 2-3). The majority of
the fresh fraction was composed of arrow squid (82.2%O, 78.1%N, 78.5%M).
The estimated prey lengths from hard remains found in the stomach contents ranged
from 1.6 cm (Sepiolids) to 119.5 cm (hake), but common prey were less than 30 cm
long (Table 2-4). The intraspecific length variation was also important with coefficients
of variation higher than 20% for all common prey but opalfish. The largest prey were
fish that made a minor contribution to the diet such as hake, hoki, barracouta and ling.
Table 2-4. Length and mass (x ± SD) of New Zealand sea lion’s common prey (in bold) and minor prey species with a commercial value. CV is the coefficient of variation. Length is the total length for fish and dorsal mantle length for cephalopods, except for barracouta and opalfish for which standard length was calculated. Lengths and masses were back-calculated from measurements of specific hard parts using regressions in Table 2-1.
--------------- Length (cm) -------------- Mass (g)
Prey species n x ± SD CV (%) Range x ± SD FISH Trachurus spp (jack mackerels) 27 40.9 ± 3.9 10 31.9-50.8 991 ± 307 Micromesistius australis (Sth blue whiting) 40 30.7 ± 5.9 19 17.0-41.2 116 ± 98 Thyrsites atun (barracouta) 22 75.1 ± 10.4 14 41.2-84.8 2070 ± 1005 Coelorinchus spp (rattails) 520 19.4 ± 6.2 32 5.1-43.8 48 ± 52 Macruronus novaezelandiae (hoki) 97 71.9 ± 11.2 16 50.2-97.4 1034 ± 460 Merluccius australis (hake) 17 92.3 ± 11.2 12 77.7-119.5 6117 ± 1275 Pseudophycis bachus (red cod) 195 25.0 ± 10.4 42 4.9-54.7 263 ± 306 Genypterus blacodes (ling) 57 61.2 ± 19.3 32 23.0-95.2 1193 ± 1040 Hemerocoetes spp (opalfish) 1027 12.4 ± 1.6 13 9.3-25.0 20 ± 13 CEPHALOPODS Enteroctopus zealandicus (Octopus) 110 13.5 ± 9.0 67 2.5-37.1 1788 ± 2322 Nototodarus sloani (arrow squid) 963 23.0 ± 5.4 24 6.6-36.5 347 ± 189 Smallest prey = Sepiolids 3 1.7 ± 0.1 1 1.6-1.7 2 Largest prey = Hake 17 92.3 ± 11.2 12 77.7-119.5 6117 ± 1275
2.3.2 Dietary variation (digested fraction)
SHR tests on the numbers of common prey did not reveal any significant interactions
between the factors sex/maturity and area, thus these factors can be treated
independently. No significant difference existed between the North and the East of the
shelf (SHR test, P values > 0.10). Opalfish was the only common prey showing a
significant difference between sex classes (SHR test, F3, 99 = 2.33, P = 0.10), though this
Chapter 2 – Stomach contents of by-caught NZ sea lions
43
was at the limit of the statistical significance. Tukey tests revealed that fewer opalfish
were retrieved from the stomachs of males (14.5%N) than those of lactating (58.1%N)
and non-lactating females (62.4%N) and immatures (56.9%N). The number of different
taxa eaten by an individual sea lion was similar among sex classes and averaged 3 ± 2.
The median length of rattail was significantly smaller in the stomachs of immature sea
lions (14.2 ± 3.1 cm) than in the stomachs of lactating females (18.8 ± 5.3 cm) and adult
males (21.0 ± 6.1 cm) (Kruskal-Wallis test; H3,55 = 9.54, P = 0.023; Mann-Whitney
tests, P < 0.10). Similarly, immature sea lions fed on opalfish of smaller size (11.7 ± 0.6
cm) than did lactating females (13.0 ± 1.3 cm) and males (13.4 ± 1.6 cm) (Kruskal-
Wallis test; H3,54 = 8.49, P = 0.041; Mann-Whitney tests, P < 0.10). The median
lengths of rattail, red cod and arrow squid were significantly larger in the eastern area
than in the northern area (Mann-Whitney tests; P = 0.001 for rattail; P = 0.032 for red
cod; P = 0.009 for arrow squid). Indeed, the length distributions of rattail and red cod
(Fig. 2-2a and b) showed that most of the largest fish eaten were from the East. This
difference in size distribution between the two areas was well marked for the arrow
squid (Fig. 2-2 c) with a peak at 29-30 cm in the East and a peak at 20-21 cm in the
North.
2.4 DISCUSSION
Common prey of by-caught sea lions during the early lactation period were opalfish,
rattail, arrow squid, octopus and red cod, which are benthic species, or living at depth >
200 m. Diet variation between by-caught males and females concerned only opalfish,
whereas lactating and non-lactating females showed no difference in their diet. By-
caught immatures of 3-4 years old fed on the same diet as adults, but targeted smaller
opalfish and rattail. These results are consistent with the benthic foraging behaviour
described previously in diving studies (Gales and Mattlin 1997; Chilvers et al. 2006).
Nonetheless, ontogenic variation in this study may have been underestimated due to the
nature of the sample set (by-catch) and the small number of individuals analysed in each
sex class.
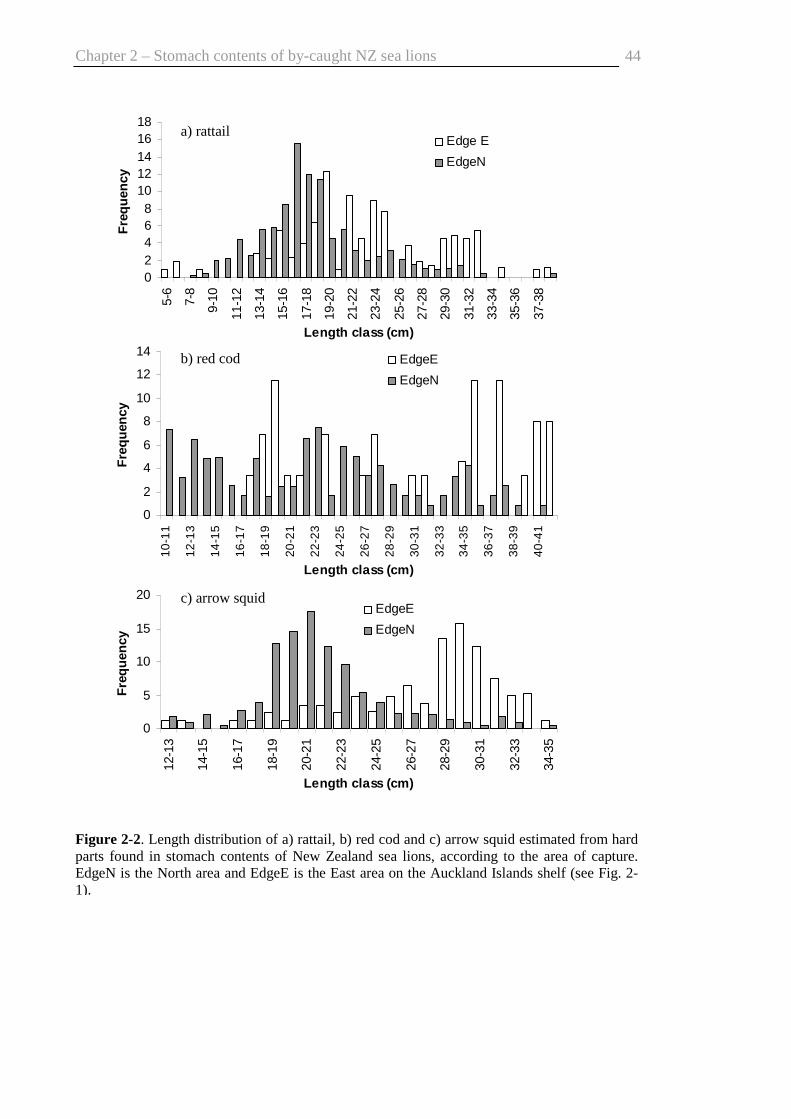
Chapter 2 – Stomach contents of by-caught NZ sea lions
44
0
2
4
6
8
10
12
14
10-1
1
12-1
3
14-1
5
16-1
7
18-1
9
20-2
1
22-2
3
24-2
5
26-2
7
28-2
9
30-3
1
32-3
3
34-3
5
36-3
7
38-3
9
40-4
1
Length class (cm)
Fre
qu
ency
EdgeE
EdgeN
02468
1012141618
5-6
7-8
9-10
11-1
2
13-1
4
15-1
6
17-1
8
19-2
0
21-2
2
23-2
4
25-2
6
27-2
8
29-3
0
31-3
2
33-3
4
35-3
6
37-3
8
Length class (cm)
Fre
qu
ency
Edge E
EdgeN
0
5
10
15
20
12-1
3
14-1
5
16-1
7
18-1
9
20-2
1
22-2
3
24-2
5
26-2
7
28-2
9
30-3
1
32-3
3
34-3
5
Length class (cm)
Fre
qu
ency
EdgeE
EdgeN
a) rattail
b) red cod
c) arrow squid
Figure 2-2. Length distribution of a) rattail, b) red cod and c) arrow squid estimated from hard parts found in stomach contents of New Zealand sea lions, according to the area of capture. EdgeN is the North area and EdgeE is the East area on the Auckland Islands shelf (see Fig. 2-1).

Chapter 2 – Stomach contents of by-caught NZ sea lions
45
2.4.1 Limitations of the study
Total stomach contents were divided into fresh and digested fractions. The fresh
fraction includes all items ingested over a similar period, and probably during the same
“meal”. It provides an unbiased estimate of actual intake although over a restricted
period (Pierce et al. 2004a; e.g., Pusineri et al. 2007). However, in the present study, the
composition of the fresh fraction is obviously biased in that the individuals sampled
were caught in fishing nets targeting squid. The comparison between the fresh (78.1%N,
78.5%M) and the digested fraction (14.1%N, 17.9%M) confirmed that total stomach
contents overestimated the percentage of arrow squid in the diet (Table 2-3). The
digested fraction is also subject to biases, related to differential digestion rates and hard
part accumulation. Firstly, fish otoliths may be partially or completely digested in
stomachs of pinnipeds (Murie and Lavigne 1985; Dellinger and Trillmich 1988) and
fish with small otoliths tend to be underestimated. To reduce this bias, an “all-structure”
approach was used (Tollit et al. 2003), in which both otoliths and diagnostic bones were
identified. Secondly, cephalopod beaks are not affected by digestion and tend to
accumulate in the stomach (Bigg and Fawcett 1985). Individuals of all classes have
been seen regurgitating beaks on rookeries (B. L. Chilvers, unpubl. data), which may
reduce the accumulation of cephalopod beaks. Consequently, I believe that the biases
encountered in the digested fraction were minimised in this study, and that this fraction
better represented the diet of NZ sea lions than the whole stomach content or the fresh
fraction.
Estimates of fish length and mass are based on otolith measurements. Thus, the
measurement of eroded otoliths leads to an underestimation of these parameters.
Correction factors were derived from scat analysis of captive grey seals (Halichoerus
grypus, Tollit et al. 1997) and Steller sea lions (Eumetopias jubatus, Tollit et al. 2004)
during feeding trials, but involve different prey than in this study. Instead, I minimised
the bias due to erosion by measuring only otoliths that didn’t show any sign of erosion.
Also, some species-specific regressions were applied on other species in a related
family (Table 2-1). Therefore, length and mass reconstructions should be interpreted
with caution.
Chapter 2 – Stomach contents of by-caught NZ sea lions
46
2.4.2 Feeding ecology of the NZ sea lion
Although the diet of by-caught NZ sea lions during the early lactation period of 1997 to
2006 was diverse, only five prey –opalfish, rattail, arrow squid, octopus and red cod–
were considered common (Table 2-3). These prey also comprised a significant part of
the diet estimated from scats and regurgitates between 1994 and 1997 (Childerhouse et
al. 2001). Both opalfish and octopus are benthic species occurring on the shelf, living
on sandy beds and in rock holes respectively (Paul 2000). Arrow squid occurs in the
water column over the shelf but also at the edge of the plateau and offshore, where they
form large aggregations down to 300 m (Jackson et al. 2000). The edge is also the
habitat of rattails which live near the bottom at depths > 200 m (Paul 2000). Benthic
foraging is consistent with previous studies on the diving behaviour of female NZ sea
lions (Gales and Mattlin 1997; Chilvers et al. 2006), where most of the dives were in
waters > 150 m, consecutively at similar depths, and with a U-shaped dive, which is
typical of diving to the sea bottom. Most of the uncommon prey are demersal or benthic
species, although some are from the pelagic region such as barracouta and jack
mackerel. NZ sea lions may opportunistically catch these prey at the beginning or the
end of a dive. This is consistent with the conclusions of a study conducted at Otago
(South Island, NZ) on male NZ sea lions (Lalas 1997), where the diet consisted of a
wide range of benthic species with several pelagic species. The examination of prey
sizes (Table 2-4) emphasises this opportunistic behaviour: All but one of the common
prey displayed a coefficient of variation higher than 20%, showing that NZ sea lions
don’t target a particular length of prey, but instead are likely to eat what is available.
During summer, lactating female NZ sea lions forage over and at the edge of the shelf
(Chilvers et al. 2005), where they dive continuously to depths > 150 m (Chilvers et al.
2006). The energy cost of deep diving is greater than transiting between locations
(Costa and Gales 2000). Consequently, these benthic divers need a sufficient energetic
income at each dive to balance their energetic budget, and are likely to forage on areas
with predictable and concentrated resources. The edges of the Auckland Islands shelf
appears to be a preferred foraging region for lactating females where they concentrate
most of their time during a foraging trip (Chilvers et al. 2005). Although it is far from
the rookeries (> 50 km), it may represent an energetic risk worth taking based on
foraging returns from greater density of prey than would be available on the shelf.
Indeed, arrow squid and rattails, two of the common prey, are schooling species
forming large aggregations at depths > 200 m (Jackson et al. 2000; Paul 2000). In
Chapter 2 – Stomach contents of by-caught NZ sea lions
47
contrast, opalfish and octopus live at the bottom of the shelf (Paul 2000) and are not in
schools. Therefore, it appears that by foraging at the edge of the Auckland Islands shelf
in depths > 200 m, NZ sea lions have access to concentrated food resources where great
quantities can be consumed in a short time period, increasing their energetic investment
per dive.
2.4.3 Ontogenic variation in diet
Dietary differences between adult females and males are most likely to be driven by
different physiological constraints, metabolic requirements and reproductive strategies
(Costa 1993). In this study, though body mass variation of males was important (Table
2-2), the average mass was a third heavier than that of females. Body mass influences
dive capability in such a way that heavier animals are able to dive longer than lighter
ones (Costa 1993). Furthermore, foraging trips of males are not constrained in duration
by pup nursing, thus they may undertake trips of longer-duration than females and
access different resources. The only difference found in this study between the diet of
males and females was the amount of opalfish (demersal species occurring on the shelf,
Paul 2000), which was significantly greater in the diet of females (approximately 60%N
vs. 14.5%N for males). Males are able to dive deeper because of their greater body size,
and may focus their food search in waters > 200 m, where opalfish are less abundant.
This hypothesis could only be validated by the comparison of satellite-TDR data on
males and females, but to date foraging studies have focused on lactating individuals
only (Gales and Mattlin 1997; Chilvers et al. 2005, 2006). The lack of strong difference
between the diet of female and male sea lions in this study may originate from the
method used and the sample set: First, stomach contents give a diet picture over a
foraging trip only, and may not be representative of the “routine” diet of females and
males during the early lactation period. Second, most of the males in the present sample
set were non-territorial animals during the breeding season. Territorial bulls are likely to
show more dietary differences with females than the non-territorial animals, because
they tend to disperse further than the study area after the breeding season (Robertson et
al. 2006).
By-caught lactating and non-lactating females did not show any difference in their diet.
Non-lactating females are not constrained to return to the breeding site to nurse when
foraging, thus they can increase their time at sea and forage on a different resource.

Chapter 2 – Stomach contents of by-caught NZ sea lions
48
However, lactating females are seen to have high site fidelity to certain foraging zones,
which is though to represent long-term learnt foraging behaviour (Chilvers 2008a).
Therefore it is expected that these foraging habits would be similar whether they were
rearing a pup or not.
The by-catch location and the present dietary results indicated that by-caught immature
NZ sea lions are able to feed on the same prey and at the same locations as mature
animals. Their diet consists of bottom-dwelling (octopus, opalfish) and deepwater
species (arrow squid, rattail), implying that they are able to forage on the bottom of the
shelf and at depths > 200 m. Similarly to females, immature sea lions fed on a greater
percentage of opalfish than did adult males. Moreover, the length of opalfish and rattail
were significantly smaller than that of adults. The predation of smaller prey by juvenile
otariids compared to adults has been reported before (e.g., Page et al. 2005a), and is an
expected result given their lower mass (Table 2-2). Nevertheless, it must be stressed
that the class “immatures” in this study comprises animals from three to four year old,
which have a mass close to that of females (Table 2-2), being able to forage on deep
prey at depths > 200 m. This may explain their capacity of capturing red cod, arrow
squid and octopus of the same size as adults. Yearlings or two year old juveniles, not
represented here, are likely to forage in shallower areas closer to the rookeries. This
hypothesis would be consistent with studies conducted on the diving patterns of other
similar aged otariid species (e.g., Baylis et al. 2005, Arctocephalus forsteri; Fowler et
al. 2007, Neophoca cinerea; Spence-Bailey et al. 2007, Arctocephalus pusillus
doriferus).
2.4.4 Geographical variation in diet
Individuals were grouped according to their by-catch location, either North or East of
the Auckland Islands (Fig. 2-1). The foraging trips of lactating females are consistent
within a year. One individual travels to the same location at the edge of the shelf and
come back to the rookeries after several days (Chilvers et al. 2005). Therefore, if I
extrapolate this behaviour to the other classes of the population, stomach contents of
animals caught in each location represented the prey encountered on the way and/or
return between the colony and either the North or the East. The diet from stomach
analyses showed no difference between the two locations, suggesting no difference in
prey distribution between the North and East of the Auckland Islands shelf. However,

Chapter 2 – Stomach contents of by-caught NZ sea lions
49
sea lions caught in the East ate larger rattails, red cod and arrow squid than those caught
in the North (Fig. 2-2). It is difficult to verify if these prey stocks in the Auckland
Islands show size differences between areas as their biology is poorly known. The only
length distribution available in the region is from the arrow squid fishery, which catches
larger squid in the southern than in the northern part of the Auckland Islands shelf
(Gibson 1995). This is consistent with my results showing that squid eaten by sea lions
in the eastern zone, which is also the south of the shelf (Fig. 2-1), were 10 cm larger
than those from the North (Fig. 2-2). The East and the North of the shelf are exploited
by sea lions from different breeding colonies of the Auckland Islands (B.L. Chilvers,
unpubl. data), and a stock of larger prey may be energetically advantageous for animals
foraging in the eastern area.
2.4.5 Interactions with fisheries
Of the common prey species found in the stomachs of by-caught NZ sea lions, only
arrow squid and red cod have commercial value. Some of the minor prey are also
harvested by fisheries, such as hoki, hake, barracouta, ling, southern blue whiting and
jack mackerel (Table 2-3) (Ministry of Fisheries 2007). These fish along with red cod
and arrow squid accounted for 24.1%N and 58.6%M of the total prey in the digested
fraction of the stomach’s contents (Table 2-3), although arrow squid is the only prey
with a commercial exploitation in the region of the Auckland Islands (51°S, 166°E).
These islands are the southern limit of the NZ sea lion’s historical breeding range
(Childerhouse and Gales 1998), yet host 86% of the pup production (Chilvers et al.
2007b). This environment has been considered a marginal habitat for NZ sea lion
females, which dive deeper than any other otariid, and operate at their physiological
limits when foraging (Gales and Mattlin 1997; Costa and Gales 2000; Chilvers et al.
2005, 2006). Therefore, the recovery of this species depends on the development of new
colonies around NZ main islands. A fragile recolonisation is visible in the South Island
of NZ (Childerhouse and Gales 1998; Wilkinson et al. 2003), but this region is also an
important ground for deepwater fisheries (hoki, hake, barracouta; Ministry of Fisheries
2007). The hoki fishery, which is the most important fishery in NZ, target fish of a size
> 60 cm (Ministry of Fisheries 2007), similar to the size range exploited by NZ sea lions
(Table 2-4). Moreover, the NZ sea lion appears to eat what is the most available in the
benthos or deep waters, and is capable of eating a wide size range (Table 2-4). This
Chapter 2 – Stomach contents of by-caught NZ sea lions
50
opportunistic behaviour, also reported in non by-caught animals (Lalas 1997; McMahon
et al. 1999), may lead to direct and indirect interactions with fisheries occurring around
the developing colonies in the future.
2.5 CONCLUSION
I investigated the diet of NZ sea lions and its variation from stomach contents of by-
caught animals. The main prey species are benthic dwelling or deepwater fish and
squid, which is consistent with the results of diving studies showing benthic foraging.
Lactating, non-lactating females, males and juveniles of 3-4 years old commonly
foraged on the same prey but the lack of differences in prey numbers in the diet between
the different categories may be an effect of the small sample set. Future studies using
techniques relying on biopsies and not on dead animals, such as fatty acid analysis, are
needed to further investigate the dietary differences between classes of the population.
However, the present study highlights the importance of the edges of the Auckland
Islands shelf, where common prey of NZ sea lions such as schooling fish and squid
aggregate. Though these key areas are far from the rookeries and are impacted by the
squid fishery, they may provide the only predictable and abundant resource needed to
cover the cost of benthic foraging for the deepest diver of all otariids.
Acknowledgements
Massey University has been contracted by the Conservation Service Levies Programme,
administered by the Department of Conservation and the Ministry of Fisheries, New
Zealand, to necropsy by-caught NZ sea lions. I thank observers who collected the
carcasses as well as people who have assisted with the necropsies over the past ten
years. Special thanks to Gavin James (NIWA) for providing some otoliths and bones of
his collection, and to Darren Stevens and Neil Bagley (NIWA) for providing fish
material for the reference collection held at Massey University. I was grateful to three
anonymous reviewers who provided helpful comments on earlier drafts of this
manuscript. This project was sponsored by Massey University Research Fund, Lewis
Fitch Research Fund, the Department of Conservation and the Ministry of Fisheries.

3 CHAPTER 3
TEMPORAL AND SEX DIFFERENCES IN THE BLUBBER
FATTY ACID PROFILES OF THE NEW ZEALAND SEA LION
Photo on right: whole blubber core sampled from a by-caught New Zealand sea lion (Phocarctos hookeri)
Chapter reference:
Meynier, L., Morel, P.C.H., Chilvers, B.L., Mackenzie, D.D.S., MacGibbon, A.,
Duignan, P.J. 2008. Temporal and sex differences in the blubber fatty acid profiles of
the New Zealand sea lion Phocarctos hookeri. Marine Ecology Progress Series,
366:271-279.

Chapter 3 – Blubber FA profiles of by-caught NZ sea lions
52
Abstract
The fatty acid (FA) composition of the blubber of 82 New Zealand (NZ) sea lions
caught as squid fishery by-catch was determined between the years 2000 and 2006 on
the Auckland Islands (50°30'S, 166°E) shelf. A combination of univariate and
multivariate analyses showed significant variation in the FA composition between sexes
and years. Blubber FA compositions of some males differed significantly from that of
females, whereas blubber FA compositions of lactating (LF) and non-lactating females
(NLF) were similar. Significant annual FA variation was revealed between the pooled
years 2005/2006 and the previous years and between 2000 and 2004. Part of these
differences can be attributed to different diets. Indeed, FA variation between the sexes
suggests that males feed on deeper species than females, which is consistent with the
current knowledge on the different diving behaviours between male and female otariids.
Concerning annual variation, NZ sea lions are generalist predators, thus their diet is
expected to follow the trends of prey stock availability. Nonetheless, FA metabolism is
likely to cause some of the FA variation observed between sexes and years, since the
deposition and mobilisation of FAs would vary according to the nutritional and
reproductive states of the individuals.
Chapter 3 – Blubber FA profiles of by-caught NZ sea lions
53
3.1 INTRODUCTION
Pinnipeds are amphibious mammals balancing their time between land, for breeding,
nursing, resting and moulting, and sea, where they forage. However, different species
use different strategies for breeding and foraging. Otariids are ‘income breeders’, with
lactation periods of several months to several years during which lactating females
(LFs) alternate between nursing pups on land and foraging at sea (Costa 1991). They are
considered ‘central place foragers’, optimising the time and energy costs of foraging
with the need to return frequently to the colony to feed their dependent pups (Orians and
Pearson 1979). Thus, LFs would be expected to forage as close to the rookery as
possible provided that enough energy can be obtained from prey to compensate for the
energetic cost of the round trip (Orians and Pearson 1979). In contrast, male otariids and
non-lactating females (NLFs), without the constraints of a dependent offspring, would
be expected to forage in the most productive regions, which may be further from the
colonies than the foraging grounds of LFs. Furthermore, male otariids are often twice
the mass of females, giving them the ability to dive longer (Costa 1991), but have
higher metabolic requirements, which they may satisfy by consuming more of the same
food eaten by females or eating a different diet with a higher calorific content. It is
possible that these differences in reproduction investment and body size between sexes
could give rise to sex-specific foraging strategies and consequently differences in the
composition of the diet between the sexes and between females of different reproductive
status.
Little is known about how gender influences foraging behaviour or diet of otariids.
Indeed, most foraging studies on otariids focused on LFs because they are a critical
component of the population and easily accessible while lactating. For six species where
male foraging patterns have been studied, they tend to have longer foraging trips and
deeper dives than the female counterparts (Arctocephalus gazella, Green et al. 1997;
Boyd et al. 1998; Staniland and Robinson 2008; Otaria flavescens, Campagna et al.
2001; Eumetopias jubatus, Raum-Suryan et al. 2004; Arctocephalus forsteri, Page et al.
2005b; Arctocephalus pusillus doriferus, Kirkwood et al. 2006; Zalophus californianus,
Weise et al. 2006). Dietary studies comparing gender are even more scarce (Koen
Alonso et al. 2000; Page et al. 2005a; Beck et al. 2007b), probably because the most
common method for studying the diet of pinnipeds is the analysis of faeces collected on

Chapter 3 – Blubber FA profiles of by-caught NZ sea lions
54
haul-outs or rookeries, where the identity of the animal or its gender are generally
unknown.
New Zealand (NZ) sea lions Phocarctos hookeri have a restricted breeding range, with
86% of the pups being born at the Auckland Islands (50°30'S, 166°E) (Chilvers et al.
2007b). To date, LF are the only segment of the population for which foraging and
diving behaviours are known and this only over the summer (Chilvers et al. 2005,
2006). Stomach contents of NZ sea lions by-caught by the squid fishery at the edge of
the Auckland Islands shelf indicate that females and males feed on the same prey with
minor differences in the proportions (Chapter 2), but stomach data provides only a
snapshot of the most recent meals, which may underestimate sex differences in the diet,
if they exist.
In contrast to analyses of stomach contents and faeces, fatty acids (FAs) of adipose
tissue have the potential to reflect the dietary intake over ecologically significant
periods, i.e., several weeks to months depending on the tissue turnover (e.g., Kirsch et
al. 1998; Kirsch et al. 2000). The underlying principle is the assumption that long-chain
FAs in prey species are conservatively deposited into the adipose tissue of the predator,
thereby providing biochemical signatures with which prey species can be identified.
Although advantages over traditional methods have been pointed out, the inference of
diet from FA profiles of an animal is not straightforward. Indeed, the FA composition in
the blubber is the result of complicated processes of deposition from dietary lipids,
differential metabolism and biosynthesis de novo. Moreover, stratification of FAs along
blubber cores has been observed (e.g., Arnould et al. 2005; Montie et al. 2008), and
rates of mobilisation can vary according to the nutritional and reproductive states of the
animal (e.g., Andersen et al. 2004; Wheatley et al. 2007; Montie et al. 2008). However,
despite the multiple origins of FA variation in adipose tissue, FA analysis has been used
extensively to investigate the diets of pinniped species (e.g., Käkelä and Hyvärinen
1998; Brown et al. 1999; Walton et al. 2000; Lea et al. 2002a; Staniland and Pond
2005; Beck et al. 2007b).
The aim of the present study was to investigate the potential of analysing the blubber
FA profiles of NZ sea lions by-caught by the squid fishery during the beginning of the
lactation period (February to May) as a means of assessing dietary differences between
sexes and years. It was hypothesised that the post-breeding diet of LFs would differ
from the other groups, given that foraging trips of LFs are restricted in time and
distance by the need to nurse their pups.

Chapter 3 – Blubber FA profiles of by-caught NZ sea lions
55
3.2 MATERIALS AND METHODS
3.2.1 Tissue collection
Since 1997, NZ sea lions captured accidentally in the squid fishery (operating from
February to May each year) have been frozen onboard and sent frozen to Massey
University, NZ, for necropsy. During each necropsy, a full-depth 60 mm2 piece of
blubber (including skin and some muscle) is cut from the pectoral area and stored in a
plastic bag in a freezer at –20°C. All blubber samples in the present study were taken
from the mid-sternal region to be comparable, as FA profiles can vary with the location
around the body (Arnould et al. 2005). Moreover, stratification of FAs can occur in the
blubber of pinnipeds (e.g., Best et al. 2003; Arnould et al. 2005; Wheatley et al. 2007),
thus the complete blubber core was analysed. During necropsy, females were
categorised as either NLF or LF by the examination of the mammary gland for
development and presence of secretion. The individuals included in this study were all
sexually mature as determined by visual examination of the ovaries and histological
examination of the testes (details in Duignan et al. 2003).
3.2.2 Laboratory methods
Lipids from blubber were extracted following Folch et al. (1957), using a
chloroform:methanol:water mixture. Approximately 0.5 g of blubber (whole core) was
sub-sampled from the bulk sample and homogenised in 15 ml of chloroform:methanol
(2:1, vol:vol) containing 0.01% butylated hydroxytoluene (BHT) as an antioxidant. The
extract was filtered and washed with 1% sodium chloride (saline) to a final ratio of
8:4:3 chloroform:methanol:saline (v:v:v). The organic phase was then dehydrated over
anhydrous sodium sulphate. Finally, the lipid extract was dried in a rotary evaporator at
38°C and weighed.
FA methyl esters (FAMEs) were prepared directly from 30 mg of the pure extracted
lipid using 1.5 ml of toluene and 1.5 ml of 10% boron trifluoride in methanol
(methylating reagent). Each extract was capped under nitrogen and heated at 50°C for

Chapter 3 – Blubber FA profiles of by-caught NZ sea lions
56
14 to 19 h (overnight). Esters were then extracted into hexane and stored over
anhydrous sodium sulphate at –20°C before chromatographic analysis.
Analysis of FAMEs was carried out using temperature-programmed gas–liquid
chromatography performed with a Shimadzu Gas Chromatograph GC-17A (Shimadzu
Scientific Instruments) equipped with a flame ionisation detector and fitted with a 30 m
× 0.25 mm i.d. column (50% cyanopropyl polysiloxane, 0.25 µm film thickness; J&W
DB-23). Helium was the carrier gas. FAMEs (1 µl) were injected manually in split
mode (1:50) at an injection port temperature of 250°C. The detector temperature was set
at 270°C. The temperature of the oven was programmed to stay at 140°C for 4 min, rise
to 190°C at 25°C min–1, held for 5 min, then to 236°C at 2°C min–1.
FA components were identified by comparison of retention time data to authentic (Nu-
Chek GLC standard 68D, Supelco 37 FAME mix, Matreya menhaden oil) and
laboratory standards (cod liver oil). Cod liver oil was used in every series of runs to
determine accurate retention times. Nu-Check 68D was injected regularly to check the
quantitation of each FA. Peak areas were measured by a computerised integration
system attached to the gas chromatograph (CLASS-VP version 7.3, Shimadzu Scientific
Instruments). Each chromatogram was checked to ensure correct identification. The
identification of some minor peaks was uncertain, and these were not included in the
final normalisation. FAs were designated by the shorthand notation of carbon chain
length:number of double bonds and location (n-x) of the double bond nearest to the
terminal methyl group. Theoretical response factors calculated according to Ackman
and Sipos (1964) were used for the quantitation of FAs expressed in mass percentages.
3.2.3 Statistical methods
FAs were expressed as a percentage mass of total FAs and they were ln-transformed as
advised by Budge et al. (2006) for parametric statistical analyses. A transformed FA i
equalled ln (xi 18:0–1) where xi is the FA, i expressed as percent of total FAs, and 18:0
is the percentage of stearic acid of total FAs, used as a reference FA. A combination of
principal component analysis (PCA), discriminant function analysis (DFA) and general
linear model (GLM) was used to examine inter-annual and sex differences in the FA
profiles of NZ sea lions (MINITAB Release 14.1, MINITAB 2003 and SPSS for
Windows Release 15.0, SPSS 2006). These multivariate methods have been commonly
used in numerous studies on FA analysis (e.g., Grahl-Nielsen and Mjaavatten 1991;
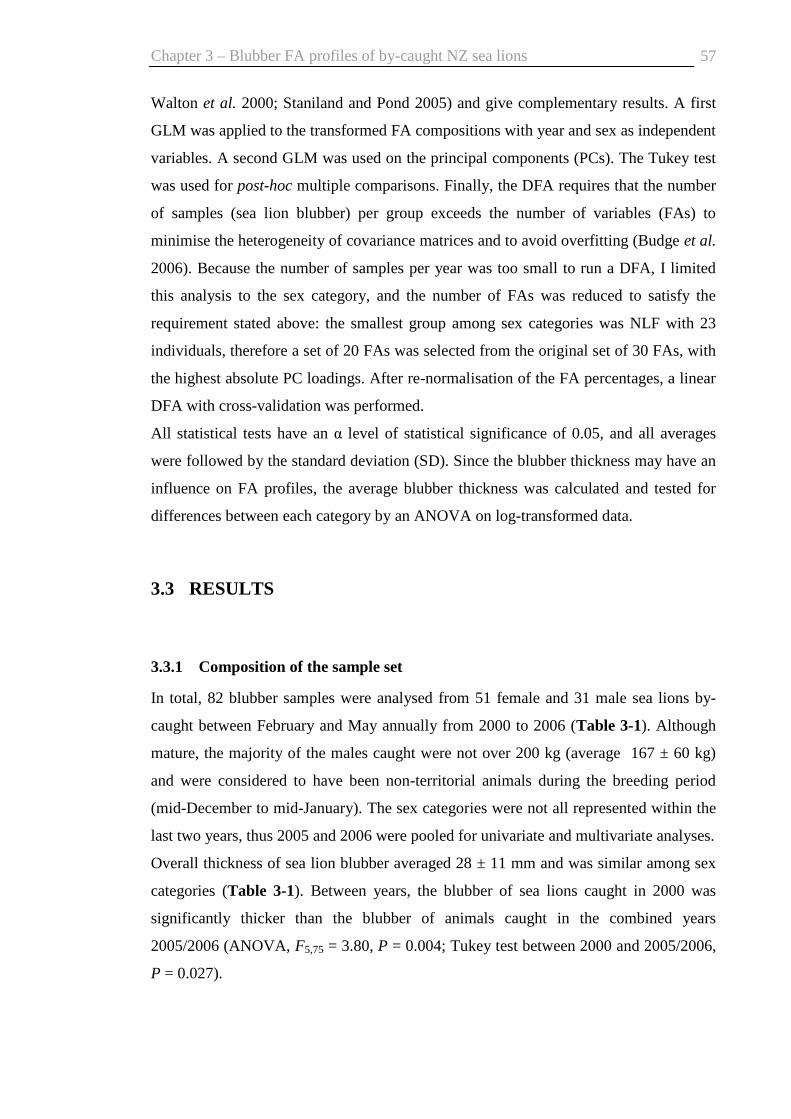
Chapter 3 – Blubber FA profiles of by-caught NZ sea lions
57
Walton et al. 2000; Staniland and Pond 2005) and give complementary results. A first
GLM was applied to the transformed FA compositions with year and sex as independent
variables. A second GLM was used on the principal components (PCs). The Tukey test
was used for post-hoc multiple comparisons. Finally, the DFA requires that the number
of samples (sea lion blubber) per group exceeds the number of variables (FAs) to
minimise the heterogeneity of covariance matrices and to avoid overfitting (Budge et al.
2006). Because the number of samples per year was too small to run a DFA, I limited
this analysis to the sex category, and the number of FAs was reduced to satisfy the
requirement stated above: the smallest group among sex categories was NLF with 23
individuals, therefore a set of 20 FAs was selected from the original set of 30 FAs, with
the highest absolute PC loadings. After re-normalisation of the FA percentages, a linear
DFA with cross-validation was performed.
All statistical tests have an α level of statistical significance of 0.05, and all averages
were followed by the standard deviation (SD). Since the blubber thickness may have an
influence on FA profiles, the average blubber thickness was calculated and tested for
differences between each category by an ANOVA on log-transformed data.
3.3 RESULTS
3.3.1 Composition of the sample set
In total, 82 blubber samples were analysed from 51 female and 31 male sea lions by-
caught between February and May annually from 2000 to 2006 (Table 3-1). Although
mature, the majority of the males caught were not over 200 kg (average 167 ± 60 kg)
and were considered to have been non-territorial animals during the breeding period
(mid-December to mid-January). The sex categories were not all represented within the
last two years, thus 2005 and 2006 were pooled for univariate and multivariate analyses.
Overall thickness of sea lion blubber averaged 28 ± 11 mm and was similar among sex
categories (Table 3-1). Between years, the blubber of sea lions caught in 2000 was
significantly thicker than the blubber of animals caught in the combined years
2005/2006 (ANOVA, F5,75 = 3.80, P = 0.004; Tukey test between 2000 and 2005/2006,
P = 0.027).

Chapter 3 – Blubber FA profiles of by-caught NZ sea lions
58
Table 3-1. Number of lactating female (LF), non-lactating female (NLF) and male (M) New Zealand sea lions analysed per year. The blubber thickness (mm) is expressed as the mean ± SD. Significant differences between categories were ANOVA-tested on log-transformed data (log values ± SD in parentheses). The years 2005 and 2006 were pooled for the ANOVA because of the limited number of individuals. * shows a significant difference between some years at α = 0.05.
Year LF NLF M Total Blubber thickness x
(log x) 2000 6 2 8 16 32 ± 5
(1.50 ± 0.07)*
2001 6 2 8 16 24 ± 5 (1.37 ± 0.10)
2002 8 1 5 14 32 ± 10 (1.49 ± 0.14)
2003 2 4 5 11 34 ± 20 (1.47 ± 0.28)
2004 2 6 4 12 24 ± 6 (1.37 ± 0.10)
2005 3 1 4 2006 1 8 9
22 ± 6 (1.33 ± 0.10)*
Total 28 23 31 82 28 ± 11 (1.42 ± 0.15)
Blubber thickness x (log x)
29 ± 11 (1.43 ± 0.17)
25 ± 12 (1.37 ± 0.15)
30 ± 10 (1.45 ± 0.13)
28 ± 11 (1.42 ± 0.15)
3.3.2 Overall blubber FA composition
Although 38 FAs were originally identified, only 30 FAs ranging from 14:0 to 22:6n-3
were used (Table 3-2), representing 99.4 ± 0.2% of the total. The 8 FAs removed were
either short-chain FAs (<14 carbons), known to come primarily from endogenous
biosynthesis (Budge et al. 2006), or FAs for which the identification was not certain.
Average FA composition of sea lion blubber is shown in Table 3-2. The FAs in greatest
concentration in order of importance were 18:1n-9, 16:0, 22:6n-3, 20:1n-9, 16:1n-7,
14:0, 18:1n-7, 22:5n-3 and 20:5n-3, accounting for approximately 85% of the total FAs
in the blubber. Monounsaturated and polyunsaturated FAs accounted for approximately
50% and 25% of the total, respectively.
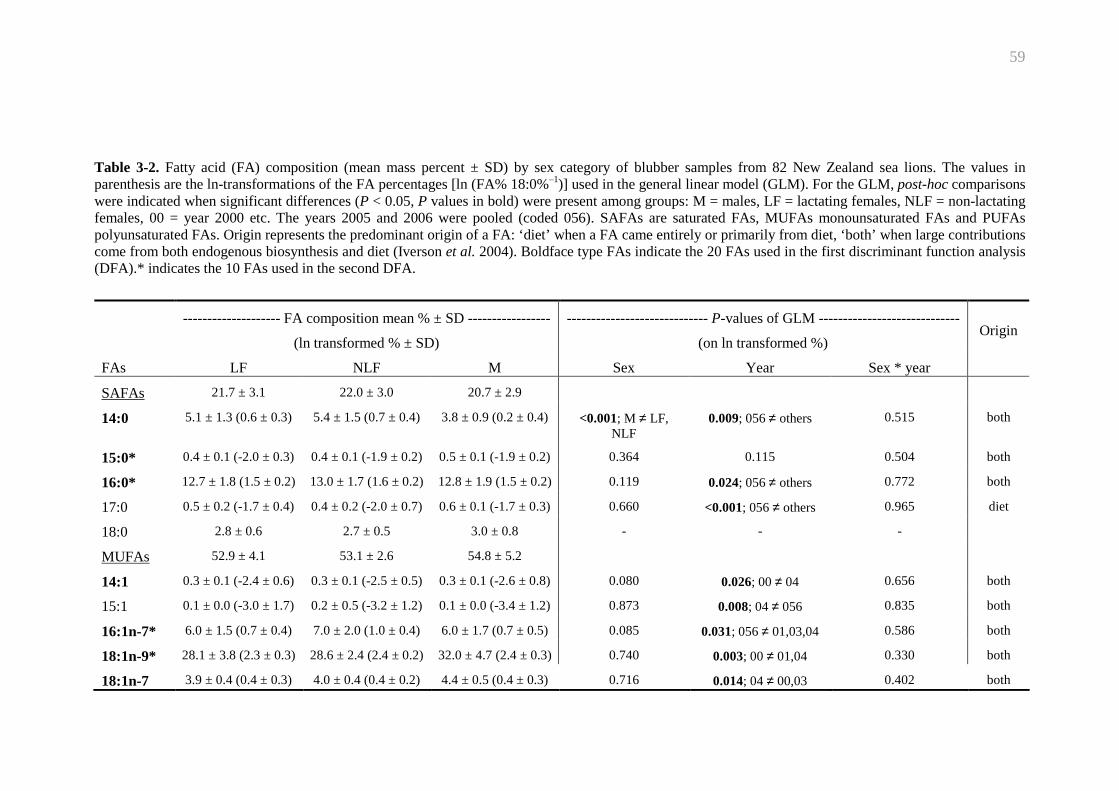
59
Table 3-2. Fatty acid (FA) composition (mean mass percent ± SD) by sex category of blubber samples from 82 New Zealand sea lions. The values in parenthesis are the ln-transformations of the FA percentages [ln (FA% 18:0%–1)] used in the general linear model (GLM). For the GLM, post-hoc comparisons were indicated when significant differences (P < 0.05, P values in bold) were present among groups: M = males, LF = lactating females, NLF = non-lactating females, 00 = year 2000 etc. The years 2005 and 2006 were pooled (coded 056). SAFAs are saturated FAs, MUFAs monounsaturated FAs and PUFAs polyunsaturated FAs. Origin represents the predominant origin of a FA: ‘diet’ when a FA came entirely or primarily from diet, ‘both’ when large contributions come from both endogenous biosynthesis and diet (Iverson et al. 2004). Boldface type FAs indicate the 20 FAs used in the first discriminant function analysis (DFA).* indicates the 10 FAs used in the second DFA.
-------------------- FA composition mean % ± SD -----------------
(ln transformed % ± SD)
----------------------------- P-values of GLM -----------------------------
(on ln transformed %) Origin
FAs LF NLF M Sex Year Sex * year
SAFAs 21.7 ± 3.1 22.0 ± 3.0 20.7 ± 2.9
14:0 5.1 ± 1.3 (0.6 ± 0.3) 5.4 ± 1.5 (0.7 ± 0.4) 3.8 ± 0.9 (0.2 ± 0.4) <0.001; M ≠ LF, NLF
0.009; 056 ≠ others 0.515 both
15:0* 0.4 ± 0.1 (-2.0 ± 0.3) 0.4 ± 0.1 (-1.9 ± 0.2) 0.5 ± 0.1 (-1.9 ± 0.2) 0.364 0.115 0.504 both
16:0* 12.7 ± 1.8 (1.5 ± 0.2) 13.0 ± 1.7 (1.6 ± 0.2) 12.8 ± 1.9 (1.5 ± 0.2) 0.119 0.024; 056 ≠ others 0.772 both
17:0 0.5 ± 0.2 (-1.7 ± 0.4) 0.4 ± 0.2 (-2.0 ± 0.7) 0.6 ± 0.1 (-1.7 ± 0.3) 0.660 <0.001; 056 ≠ others 0.965 diet
18:0 2.8 ± 0.6 2.7 ± 0.5 3.0 ± 0.8 - - -
MUFAs 52.9 ± 4.1 53.1 ± 2.6 54.8 ± 5.2
14:1 0.3 ± 0.1 (-2.4 ± 0.6) 0.3 ± 0.1 (-2.5 ± 0.5) 0.3 ± 0.1 (-2.6 ± 0.8) 0.080 0.026; 00 ≠ 04 0.656 both
15:1 0.1 ± 0.0 (-3.0 ± 1.7) 0.2 ± 0.5 (-3.2 ± 1.2) 0.1 ± 0.0 (-3.4 ± 1.2) 0.873 0.008; 04 ≠ 056 0.835 both
16:1n-7* 6.0 ± 1.5 (0.7 ± 0.4) 7.0 ± 2.0 (1.0 ± 0.4) 6.0 ± 1.7 (0.7 ± 0.5) 0.085 0.031; 056 ≠ 01,03,04 0.586 both
18:1n-9* 28.1 ± 3.8 (2.3 ± 0.3) 28.6 ± 2.4 (2.4 ± 0.2) 32.0 ± 4.7 (2.4 ± 0.3) 0.740 0.003; 00 ≠ 01,04 0.330 both
18:1n-7 3.9 ± 0.4 (0.4 ± 0.3) 4.0 ± 0.4 (0.4 ± 0.2) 4.4 ± 0.5 (0.4 ± 0.3) 0.716 0.014; 04 ≠ 00,03 0.402 both
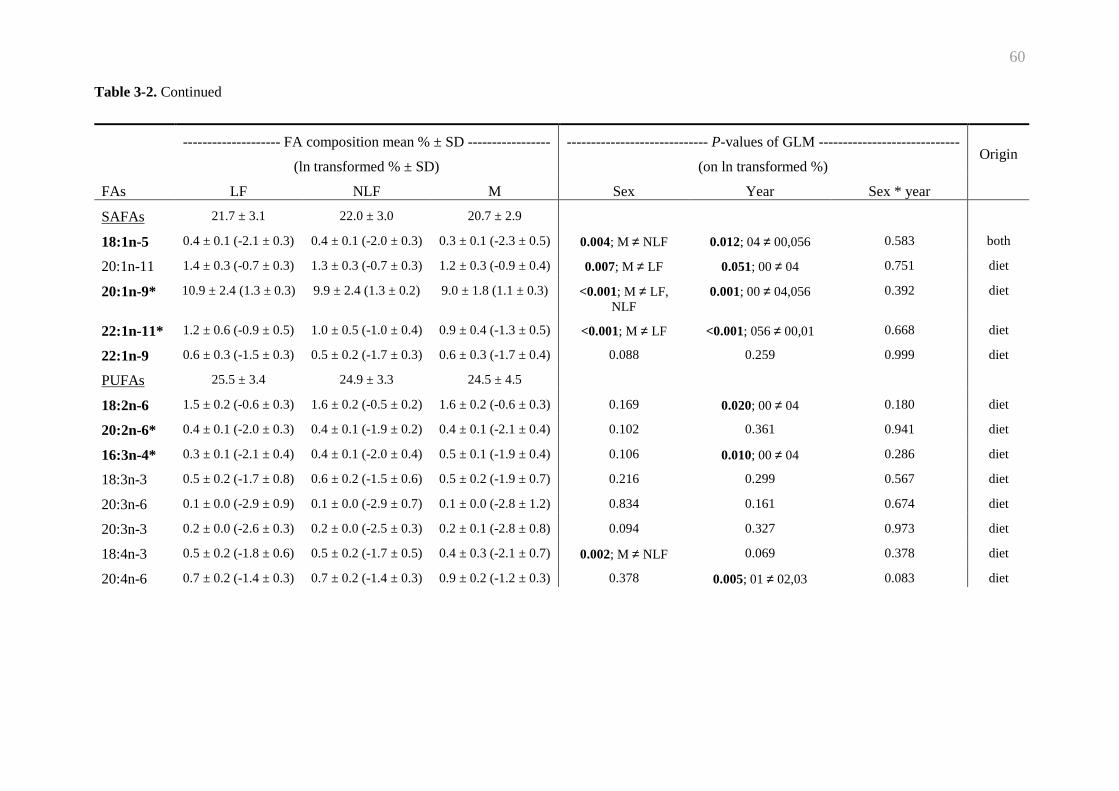
60
Table 3-2. Continued
-------------------- FA composition mean % ± SD -----------------
(ln transformed % ± SD)
----------------------------- P-values of GLM -----------------------------
(on ln transformed %) Origin
FAs LF NLF M Sex Year Sex * year
SAFAs 21.7 ± 3.1 22.0 ± 3.0 20.7 ± 2.9
18:1n-5 0.4 ± 0.1 (-2.1 ± 0.3) 0.4 ± 0.1 (-2.0 ± 0.3) 0.3 ± 0.1 (-2.3 ± 0.5) 0.004; M ≠ NLF 0.012; 04 ≠ 00,056 0.583 both
20:1n-11 1.4 ± 0.3 (-0.7 ± 0.3) 1.3 ± 0.3 (-0.7 ± 0.3) 1.2 ± 0.3 (-0.9 ± 0.4) 0.007; M ≠ LF 0.051; 00 ≠ 04 0.751 diet
20:1n-9* 10.9 ± 2.4 (1.3 ± 0.3) 9.9 ± 2.4 (1.3 ± 0.2) 9.0 ± 1.8 (1.1 ± 0.3) <0.001; M ≠ LF, NLF
0.001; 00 ≠ 04,056 0.392 diet
22:1n-11* 1.2 ± 0.6 (-0.9 ± 0.5) 1.0 ± 0.5 (-1.0 ± 0.4) 0.9 ± 0.4 (-1.3 ± 0.5) <0.001; M ≠ LF <0.001; 056 ≠ 00,01 0.668 diet
22:1n-9 0.6 ± 0.3 (-1.5 ± 0.3) 0.5 ± 0.2 (-1.7 ± 0.3) 0.6 ± 0.3 (-1.7 ± 0.4) 0.088 0.259 0.999 diet
PUFAs 25.5 ± 3.4 24.9 ± 3.3 24.5 ± 4.5
18:2n-6 1.5 ± 0.2 (-0.6 ± 0.3) 1.6 ± 0.2 (-0.5 ± 0.2) 1.6 ± 0.2 (-0.6 ± 0.3) 0.169 0.020; 00 ≠ 04 0.180 diet
20:2n-6* 0.4 ± 0.1 (-2.0 ± 0.3) 0.4 ± 0.1 (-1.9 ± 0.2) 0.4 ± 0.1 (-2.1 ± 0.4) 0.102 0.361 0.941 diet
16:3n-4* 0.3 ± 0.1 (-2.1 ± 0.4) 0.4 ± 0.1 (-2.0 ± 0.4) 0.5 ± 0.1 (-1.9 ± 0.4) 0.106 0.010; 00 ≠ 04 0.286 diet
18:3n-3 0.5 ± 0.2 (-1.7 ± 0.8) 0.6 ± 0.2 (-1.5 ± 0.6) 0.5 ± 0.2 (-1.9 ± 0.7) 0.216 0.299 0.567 diet
20:3n-6 0.1 ± 0.0 (-2.9 ± 0.9) 0.1 ± 0.0 (-2.9 ± 0.7) 0.1 ± 0.0 (-2.8 ± 1.2) 0.834 0.161 0.674 diet
20:3n-3 0.2 ± 0.0 (-2.6 ± 0.3) 0.2 ± 0.0 (-2.5 ± 0.3) 0.2 ± 0.1 (-2.8 ± 0.8) 0.094 0.327 0.973 diet
18:4n-3 0.5 ± 0.2 (-1.8 ± 0.6) 0.5 ± 0.2 (-1.7 ± 0.5) 0.4 ± 0.3 (-2.1 ± 0.7) 0.002; M ≠ NLF 0.069 0.378 diet
20:4n-6 0.7 ± 0.2 (-1.4 ± 0.3) 0.7 ± 0.2 (-1.4 ± 0.3) 0.9 ± 0.2 (-1.2 ± 0.3) 0.378 0.005; 01 ≠ 02,03 0.083 diet

61
20:4n-3 1.2 ± 0.2 (-0.8 ± 0.3) 1.3 ± 0.2 (-0.7 ± 0.3) 1.0 ± 0.3 (-1.1 ± 0.5) <0.001; M ≠ LF, NLF
0.012; 00 ≠ 04,056 0.083 diet
22:4n-6 0.1 ± 0.1 (-2.6 ± 1.0) 0.1 ± 0.1 (-2.8 ± 0.7) 0.2 ± 0.1 (-2.4 ± 0.9)
diet
20:5n-3 3.2 ± 1.0 (0.1 ± 0.4) 3.3 ± 0.6 (0.2 ± 0.4) 2.8 ± 1.4 (-0.2 ± 0.6) <0.001; M ≠ LF, NLF
0.084 0.013; M056 ≠ others diet
21:5n-3 0.3 ± 0.1 (-2.3 ± 0.4) 0.3 ± 0.1 (-2.2 ± 0.4) 0.2 ± 0.1 (-2.6 ± 0.6) 0.002; M ≠ LF, NLF 0.312 0.690 diet
22:5n-6 0.2 ± 0.1 (-2.5 ± 0.4) 0.2 ± 0.1 (-2.7 ± 0.6) 0.2 ± 0.1 (-2.6 ± 0.7) <0.001; M ≠ LF, NLF
<0.001; 056 ≠ others 0.001; M056 ≠ others diet
22:5n-3* 3.7 ± 0.7 (0.3 ± 0.3) 3.3 ± 0.8 (0.2 ± 0.3) 3.2 ± 0.6 (0.1 ± 0.4) 0.014; M ≠ LF 0.204 0.452 both
22:6n-3* 12.3 ± 2.0 (1.5 ± 0.3) 11.9 ± 2.3 (1.5 ± 0.3) 12.3 ± 2.5 (1.4 ± 0.3) 0.121 0.115 0.199 diet
n-3 22.0 ± 3.4 21.5 ± 3.2 20.6 ± 4.4
n-6 3.1 ± 0.4 3.1 ± 0.3 3.4 ± 0.4

Chapter 3 – Blubber FA profiles of by-caught NZ sea lions
62
A PCA using a correlation matrix was run on ln-transformed data to assess the most
important FAs explaining the variance between FA profiles. The first three PCs
accounted for 65% of the total variation in blubber FAs. The FAs with the greatest
influence on PC1 were 18:1n-5, 16:1n-7, 20:4n-3, 18:2n-6 and 22:6n3, with the last
three coming primarily from the diet. High loadings in the other PCs were attributed to
22:1n-9, 22:1n-11, 15:0, 22:5n-6 and 16:3n-4 on PC2 and 18:4n-3, 14:0, 20:4n-6,
22:5n-6 and 17:0 on PC3, all of which are derived primarily from the diet with the
exception of the three saturated FAs.
3.3.3 Temporal and sex differences in FA profiles
The GLM on FA percentages showed significant differences in the percentages of 11
FAs between sex categories and 17 FAs between years (P < 0.05, Table 3-2). There
was an interaction between the two factors for only two FAs, 20:5n-3 and 22:5n-6,
which involved the only male in years 2005/2006 being segregated from the other
groups. The percentages of 14:0, 18:1n-5, 20:1s, 22:1n-11, 18:4n-3, 20:4n-3, 20:5n-3,
21:5n-3 and 22:5s in males differed significantly from those of LFs and NLFs. Most of
the significant inter-annual variation involved a difference between the combined years
2005/2006 and some or all of the previous years (nine FAs) and a difference between
the years 2000 and 2004 (nine FAs).
The GLM on PCs confirmed these results on a general scale (FA profile instead of
individual FA, Table 3-3): Year and sex had a significant effect on each of the first
three components and on the overall model, but the interactions between the two factors
were not significant. Post-hoc Tukey tests on PCs showed that the combined years
2005/2006 were significantly different from the other years on PC2 and PC3 (P < 0.05),
and the year 2000 was different from 2004 on PC1. Furthermore, males were different
from all females for each PC.
A DFA was run on the 20 FAs with the highest PC loadings (noted in bold in Table 3-
2). The classic analysis gave an overall percentage of correct classifications of 76%,
while with cross-validation this result was lowered to 54%. This sizeable difference
between the percentages was interpreted as too many predictors (FAs) in the analysis
(Walton et al. 2000). Thus, I lowered the number of variables for a second DFA by
choosing 10 FAs only (noted by an asterisk in Table 3-2), with the highest absolute
coefficients on the discriminant functions generated by the first DFA. The new DFA

Chapter 3 – Blubber FA profiles of by-caught NZ sea lions
63
gave an overall percentage of correct classification of 66% with the classification matrix
and 55% with cross-validation. The discriminant function plot showed that some male
FA profiles differed from female profiles along the first discriminant function (Fig. 3-1)
mainly because of differences in the proportions of 20:1n-9, 22:1n-11 and 16:3n-4. The
percentage of correct classification for males was 68%. No difference was apparent
between the two groups of females.
Table 3-3. General linear model (GLM) testing the influence of Year and Sex on the first three principal components (PC) representing the fatty acid (FA) composition of New Zealand sea lion blubber. Significant values are in bold for each component and the overall model.
Factor df -------------- Principal components ---------------- Overall model PC1 (42%) PC2 (14%) PC3 (9%) MANOVA (Pillai’s
trace) F P F P F P df F P
Year 5 2.71 0.028 3.91 0.004 7.15 <0.001 15/192 4.52 <0.001
Sex 2 4.63 0.013 7.90 0.001 6.28 0.003 6/126 7.14 <0.001
Year*sex 10 1.28 0.261 0.19 0.997 0.90 0.539 30/192 1.17 0.884
3.4 DISCUSSION
The diet of the NZ sea lion and its variation has been studied through the analysis of
stomach contents and faeces (Lalas 1997; McMahon et al. 1999; Childerhouse et al.
2001; Chapter 2), but these methods are subject to biases encountered with the recovery
of prey hard parts. Since the 1960s, FAs have been used as food tracers in marine
trophic webs, allowing dietary variation to be examined among marine individuals (e.g.,
Ackman and Eaton 1966; Kirsch et al. 1998; Staniland and Pond 2005; Beck et al.
2007b). The present study is the first report of the FA composition of the NZ sea lion’s
blubber. FA compositions revealed some significant differences between females and
males, and from the years 2000 to 2006, which may be attributed, at least in part, to
differences in their diets. However, FA deposition and mobilisation in the blubber, and
hence its FA composition, can vary according to the nutritional and reproductive states
of the animal (Andersen et al. 2004; Wheatley et al. 2007; Montie et al. 2008). Thus,
part of the FA differences between the sex categories is likely to be the result of
differential metabolism.

Chapter 3 – Blubber FA profiles of by-caught NZ sea lions
64
3.4.1 Limitations of the study
Blubber samples were stored at –20°C tightly wrapped but nonetheless under air for up
to five years, which may have resulted in some oxidation of unsaturated FAs on the
outside of the sample (Whiteley et al. 1992). Consequently lipids for analyses were
extracted from a core taken from the centre of the original sample as outlined by
Learmonth (2006) who reported no evidence of FA oxidation in the core of blubber of
harbour porpoises stored at –20°C for 566 days.
Deposition of dietary lipids in the blubber will depend on the nutritional status of the
animal: it is expected that a substantial amount of the FAs ingested above the metabolic
requirements will be deposited in the blubber, whereas the extent to which deposition of
Figure 3-1. Plot of canonical discriminant functions. LF: lactating females; NLF: non-lactating females; M: males. This analysis included 10 FAs only (see details in ‘Results’). The first and the second functions explained 93.8% and 6.2% of the variation among samples, respectively. The FAs with the most important positive or negative loadings on functions 1 and 2 are displayed along the axes

Chapter 3 – Blubber FA profiles of by-caught NZ sea lions
65
dietary FAs occurs during periods of negative energy balance is unclear. Thus, the
blubber FA signatures are more likely to reflect dietary FAs in animals in positive
energy balance (e.g., Kirsch et al. 2000). LFs are thought to be the segment of the
population with the highest metabolic constraints, and the lactating NZ sea lions,
captured and weighed on land, had stabilised or were gaining mass at one month
interval during the first months of the lactation period (B.L. Chilvers unpubl. data).
Furthermore, the blubber thickness of the by-caught sea lions studied (Table 3-1) was
comparable to captive adult female Steller sea lions Eumetopias jubatus kept on a
maintenance diet (Mellish et al. 2007). Thus, I believed that sea lions caught were in
positive energy balance and depositing dietary FAs.
Moreover, deposition and mobilisation of blubber lipids have been shown to vary with
the body region in otariid seals (Arnould et al. 2005; Mellish et al. 2007), while phocids
present a more uniform fat distribution (e.g., Ryg et al. 1988; Mellish et al. 2007). The
uniformity of fat distribution is believed to minimise heat loss to the environment by
optimising insulation efficiency (Ryg et al. 1988). Otariids do not have extended
periods of fasting like phocids, thus blubber fat may have a less important role in term
of insulation (Mellish et al. 2007), resulting in heterogeneity of fat distribution with
preferred depot sites along the body. Blubber samples were taken from the sternum
region because the thickness of the blubber over the sternum is positively correlated
with body mass (Massey University unpubl. data), suggesting that this region is a fat
depot when sea lions are in positive energy balance.
3.4.2 Variation in FA profiles among sex categories
The interactions between sex and year were limited to two dietary FAs (20:5n-3 and
22:5n-6). Thus, the variation in FA profiles between the sex categories was consistent
within each year, and each factor has been interpreted separately. LFs and NLFs did not
show any significant difference in their FA composition (Table 3-2, Fig. 3-1).
However, lactation is the most energetically demanding period of mammalian
reproduction (Oftedal 1984), and marine mammals are no exception (Costa et al. 1986;
Williams et al. 2007). Lactating marine mammals are thought to mobilise substantial
quantities of lipids into milk, affecting their blubber FA profiles (e.g., Wheatley et al.
2007, Montie et al. 2008). Similar FA profiles between LFs and NLFs show that
blubber FAs in the sternum region were not mobilised to produce milk. Instead, sternal
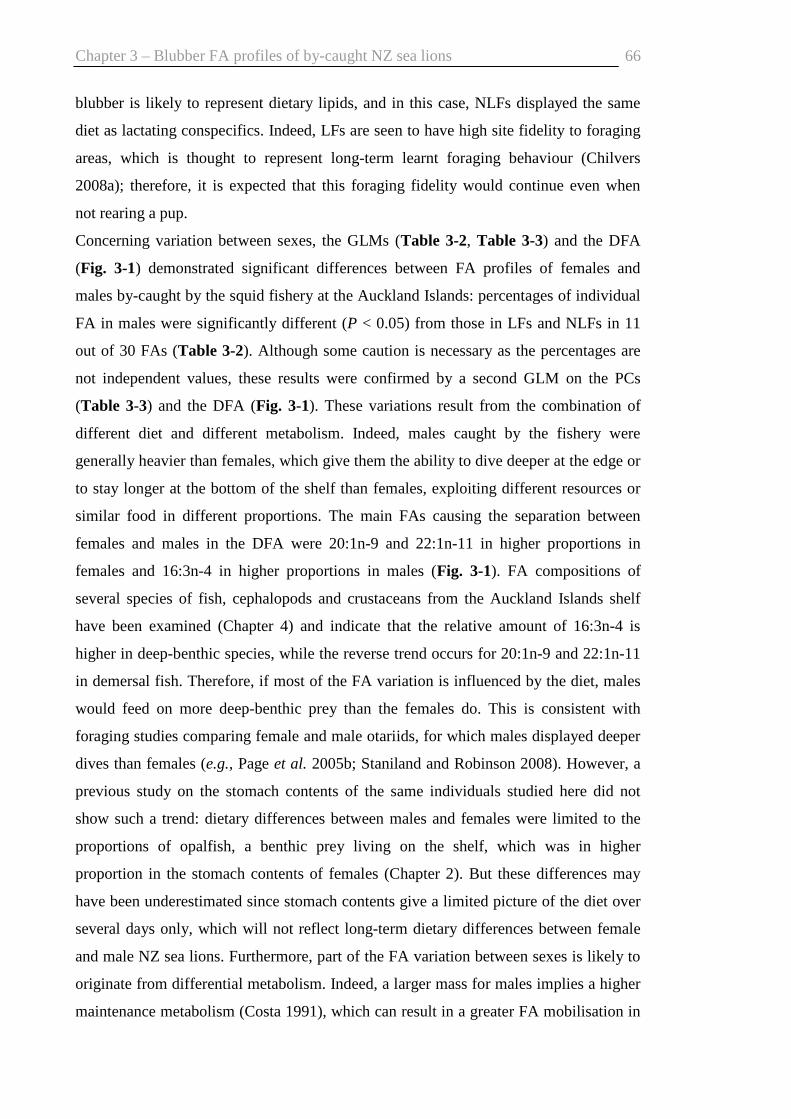
Chapter 3 – Blubber FA profiles of by-caught NZ sea lions
66
blubber is likely to represent dietary lipids, and in this case, NLFs displayed the same
diet as lactating conspecifics. Indeed, LFs are seen to have high site fidelity to foraging
areas, which is thought to represent long-term learnt foraging behaviour (Chilvers
2008a); therefore, it is expected that this foraging fidelity would continue even when
not rearing a pup.
Concerning variation between sexes, the GLMs (Table 3-2, Table 3-3) and the DFA
(Fig. 3-1) demonstrated significant differences between FA profiles of females and
males by-caught by the squid fishery at the Auckland Islands: percentages of individual
FA in males were significantly different (P < 0.05) from those in LFs and NLFs in 11
out of 30 FAs (Table 3-2). Although some caution is necessary as the percentages are
not independent values, these results were confirmed by a second GLM on the PCs
(Table 3-3) and the DFA (Fig. 3-1). These variations result from the combination of
different diet and different metabolism. Indeed, males caught by the fishery were
generally heavier than females, which give them the ability to dive deeper at the edge or
to stay longer at the bottom of the shelf than females, exploiting different resources or
similar food in different proportions. The main FAs causing the separation between
females and males in the DFA were 20:1n-9 and 22:1n-11 in higher proportions in
females and 16:3n-4 in higher proportions in males (Fig. 3-1). FA compositions of
several species of fish, cephalopods and crustaceans from the Auckland Islands shelf
have been examined (Chapter 4) and indicate that the relative amount of 16:3n-4 is
higher in deep-benthic species, while the reverse trend occurs for 20:1n-9 and 22:1n-11
in demersal fish. Therefore, if most of the FA variation is influenced by the diet, males
would feed on more deep-benthic prey than the females do. This is consistent with
foraging studies comparing female and male otariids, for which males displayed deeper
dives than females (e.g., Page et al. 2005b; Staniland and Robinson 2008). However, a
previous study on the stomach contents of the same individuals studied here did not
show such a trend: dietary differences between males and females were limited to the
proportions of opalfish, a benthic prey living on the shelf, which was in higher
proportion in the stomach contents of females (Chapter 2). But these differences may
have been underestimated since stomach contents give a limited picture of the diet over
several days only, which will not reflect long-term dietary differences between female
and male NZ sea lions. Furthermore, part of the FA variation between sexes is likely to
originate from differential metabolism. Indeed, a larger mass for males implies a higher
maintenance metabolism (Costa 1991), which can result in a greater FA mobilisation in

Chapter 3 – Blubber FA profiles of by-caught NZ sea lions
67
the sternal blubber than in females. To date, there is no information on the differential
use of fat depots between male and female otariids. Thus, it is difficult to draw any
conclusion on the dietary differences between NZ sea lion males and females inferred
from blubber FA profiles as long as no foraging and diving data are available for males.
So far, LF are the only segment of the population for which foraging and diving
behaviours are known (Chilvers et al. 2005, 2006). It must be stressed that males
analysed here were mainly non-territorial during breeding and were caught in the same
area as females, thus they were not representative of territorial males. Territorial males
tend to disperse to distant regions after breeding (Robertson et al. 2006) and are rarely
caught by the squid fishery around the Auckland Islands.
3.4.3 Year variation in FA profiles
Although the DFA was not performed on years due to a small sample size, both GLMs
showed differences in the FA profiles of by-caught sea lions between years (Tables 3-2
and 3-3), especially between 2005/2006 and the previous years and between 2000 and
2004. Individual FA variation concerned 17 out of 30 FAs (Table 3-2). As discussed
previously, the variation in blubber FA profiles between years may be caused by both
differential metabolism and different diet. Differential FA metabolism between years
could arise from animals in different body condition. The blubber thickness was
significantly lower in the combined years 2005/2006 than in 2000 (Table 3-1); thus, the
differences in FA profiles noticed between these years can be the result of different FA
mobilization in the sternal blubber. However, significant variation in FA profiles was
not limited to the differences between 2000 and the years 2005/2006; therefore, diet
must play a significant role in the FA variation reported between 2005/2006 and the
previous years and between 2000 and 2004. Inter-annual and seasonal variation in the
diet of the NZ sea lion males has already been investigated through the analysis of
faeces (Lalas 1997, McMahon et al. 1999, Childerhouse et al. 2001). Seasonal
differences in the diet were found only at Otago Peninsula, South Island, NZ (Lalas
1997), and were attributed to changes in prey availability. Indeed, NZ sea lions are
considered generalist predators, and the changes noticed in the present study between
the combined years 2005/2006 and the previous years, and also between 2000 and 2004,
may be interpreted by a variation in prey stocks availability on the Auckland Islands
shelf. However, information on fish and squid populations and their variation around

Chapter 3 – Blubber FA profiles of by-caught NZ sea lions
68
the Auckland Islands are non-existent. Therefore, it is currently not possible to validate
the hypothesis of a change in prey availability between 2000 and 2006.
3.5 CONCLUSION
In the present study, significant differences in the blubber FA compositions between
male and female NZ sea lions, and between years from 2000 to 2006, were detected.
These differences are likely to be the result of both metabolism and diet. Due to
different metabolic requirements, an ability to dive deeper and a lack of investment in
pup rearing, male NZ sea lions would utilise food resources differently, explaining
some of the differences in FA profiles between the sexes. However, these differences
were probably underestimated, as territorial males, with a significant higher mass than
females, were not represented in the present study. FA metabolism in the blubber is still
poorly understood, thus limiting the potential of FA signature analysis to infer diets of
animals in different nutritional or reproductive states (e.g., females versus males, LFs
versus NLFs). However, this method can overcome some biases encountered in
traditional dietary techniques. Thus, FA analysis must be considered as a
complementary tool to stomach and faeces analyses, along with foraging telemetry
studies to assess the feeding ecology of marine mammals.
Acknowledgements
NZ sea lions were necropsied at Massey University under contracts with the
Conservation Service Levies Providers, administrated by the Department of
Conservation and the Ministry of Fisheries, NZ. I thank observers who collected the
carcasses as well as people who assisted with the necropsies including M. Stratton, N.
Gibbs, M. Bando, F. Riet-Sapriza and G. Jones. Thanks to R. Galois, M. Walton and M.
Reynolds for their advice on fatty acid analysis and to three anonymous reviewers who
provided comments. This project was sponsored by Lewis Fitch Research Fund, Massey
University Research Fund, the Whale and Dolphin Adoption Project, the Department of
Conservation and the NZ Ministry of Fisheries.

4 CHAPTER 4
PROXIMATE COMPOSITION, ENERGY CONTENT, AND
FATTY ACID COMPOSITION OF MARINE SPECIES FROM
THE CAMPBELL PLATEAU, NEW ZEALAND
Photos from left to right and top to bottom: hoki (Macruronus novaezelandiae), arrow squid (Nototodarus sloani), rattail (Coelorhynchus arspercephalus), red cod (Pseudophycis bachus). Copyright is owned by the New Zealand Seafood Industry which gives its agreement to copy the photos from Paul (2000).
Chapter reference:
Meynier L., Morel P.C.H., Mackenzie D.D.S., MacGibbon A., Chilvers, L., Duignan
P.J. 2008. Proximate composition, energy content, and fatty acid composition of marine
species from the Campbell plateau, New Zealand. New Zealand Journal of Marine and
Freshwater Research, 42: 425-437.

Chapter 4 – FA profiles of potential prey
70
Abstract
The Campbell plateau is an important fishing ground for the major commercial New
Zealand species. Yet, studies on trophic interactions between species and their
nutritional values are limited. The objectives of this study were (1) to determine the
proximate composition and energy contents of selected commercial and non-
commercial marine species from the Campbell plateau, (2) to determine their fatty acid
(FA) composition, and (3) to evaluate the degree to which species can be differentiated
by their FA compositions. I analysed 10 Macruronus novaezelandiae, 11
Lepidorhynchus denticulatus, 10 Pseudophycis bachus, 10 Hemerocoetes spp., 2
Squalus acanthias, 10 Nototodarus sloani, 7 Enteroctopus zealandicus, and 6
Metanephrops challengeri. The variation of energy contents between fish species was
not significant, but their lipid and protein contents varied significantly. FA signatures
could distinguish the species analysed, and at a broader scale, the type of habitat.
However, within-species variability is important among benthic species. In general, the
diet inference from FA trophic markers was consistent with reported diets from stomach
contents or reported FA compositions from related species analysed elsewhere.

Chapter 4 – FA profiles of potential prey
71
4.1 INTRODUCTION
The Campbell plateau is an extensive submarine platform, in the subantarctic region
south of New Zealand, with water depths ranging from 0-500 m on the rises to 1000 m
at the plateau edge (Fig. 4-1). This region is an important fishing ground for the major
commercial marine species in New Zealand, hoki (Macruronus novaezelandiae), arrow
squid (Nototodarus spp.) and ling (Genypterus blacodes), but also for secondary
harvested species such as hake (Merluccius australis), southern blue whiting
(Micromesistius australis) and scampi (Metanephrops challengeri): In the fishing
season 2005/2006, catches of hoki, arrow squid, ling, hake, southern blue whiting and
scampi from the Campbell plateau were approximately 7000 t, 17000 t, 5000 t, 2500 t,
26000 t and 300 t respectively (Ministry of Fisheries 2007), leading to a total of 58000 t
for these target species alone. This area is also of special interest to conservationists as it
hosts large populations of resident seabirds and marine mammals, such as albatrosses
(Gales 1998), penguins (Heather and Robertson 2005), fur seals (Crawley and Warneke
1979), and the New Zealand sea lion (Chilvers et al. 2007b).
Despite its commercial and ecological importance, the Campbell plateau has received
limited attention in the literature in terms of ecosystem structure and interactions
between marine species. Jacob et al. (1998) identified demersal species assemblages off
southern New Zealand including the Campbell plateau, and Bradford-Grieve et al.
(2003) described the functioning of this ecosystem through an ECOPATH model, but
most of the data used to build the model were from other systems. With the exception of
one study on the diet of the squid Moroteuthis ingens (Phillips et al. 2003), dietary
studies in the region have been limited to important commercial fish: hoki, southern
blue whiting and ling (Inada and Nakamura 1975; Mitchell 1984; Clark 1985).
Traditionally, examination of the stomach contents has been used to examine the diet of
marine specimens, but it only provides information on last meals, and differential prey
digestion and erosion of hard parts can introduce biases (e.g., Jobling and Breiby 1986;
Pierce and Boyle 1991). Since the 1960s, fatty acid (FA) analysis has been developed as
a complementary diet method to traditional analyses (e.g., Sargent et al. 1987;
Dalsgaard et al. 2003). The principle is that many dietary lipids are incorporated into the
adipose tissue of the predator with little or no modification of their original structure
(Sargent et al. 1987; Dalsgaard and St John 2004). Thus, the FA composition of the
predator reflects the accumulation of dietary lipids over several weeks (Kirsch et al.
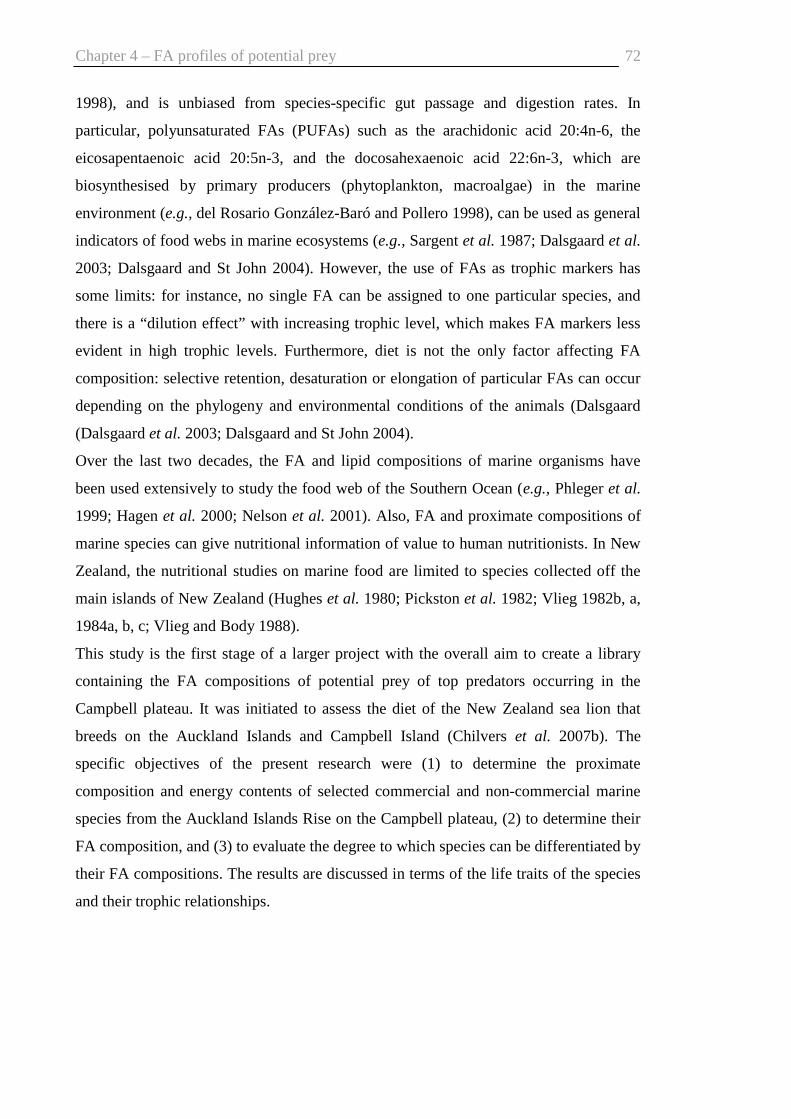
Chapter 4 – FA profiles of potential prey
72
1998), and is unbiased from species-specific gut passage and digestion rates. In
particular, polyunsaturated FAs (PUFAs) such as the arachidonic acid 20:4n-6, the
eicosapentaenoic acid 20:5n-3, and the docosahexaenoic acid 22:6n-3, which are
biosynthesised by primary producers (phytoplankton, macroalgae) in the marine
environment (e.g., del Rosario González-Baró and Pollero 1998), can be used as general
indicators of food webs in marine ecosystems (e.g., Sargent et al. 1987; Dalsgaard et al.
2003; Dalsgaard and St John 2004). However, the use of FAs as trophic markers has
some limits: for instance, no single FA can be assigned to one particular species, and
there is a “dilution effect” with increasing trophic level, which makes FA markers less
evident in high trophic levels. Furthermore, diet is not the only factor affecting FA
composition: selective retention, desaturation or elongation of particular FAs can occur
depending on the phylogeny and environmental conditions of the animals (Dalsgaard
(Dalsgaard et al. 2003; Dalsgaard and St John 2004).
Over the last two decades, the FA and lipid compositions of marine organisms have
been used extensively to study the food web of the Southern Ocean (e.g., Phleger et al.
1999; Hagen et al. 2000; Nelson et al. 2001). Also, FA and proximate compositions of
marine species can give nutritional information of value to human nutritionists. In New
Zealand, the nutritional studies on marine food are limited to species collected off the
main islands of New Zealand (Hughes et al. 1980; Pickston et al. 1982; Vlieg 1982b, a,
1984a, b, c; Vlieg and Body 1988).
This study is the first stage of a larger project with the overall aim to create a library
containing the FA compositions of potential prey of top predators occurring in the
Campbell plateau. It was initiated to assess the diet of the New Zealand sea lion that
breeds on the Auckland Islands and Campbell Island (Chilvers et al. 2007b). The
specific objectives of the present research were (1) to determine the proximate
composition and energy contents of selected commercial and non-commercial marine
species from the Auckland Islands Rise on the Campbell plateau, (2) to determine their
FA composition, and (3) to evaluate the degree to which species can be differentiated by
their FA compositions. The results are discussed in terms of the life traits of the species
and their trophic relationships.
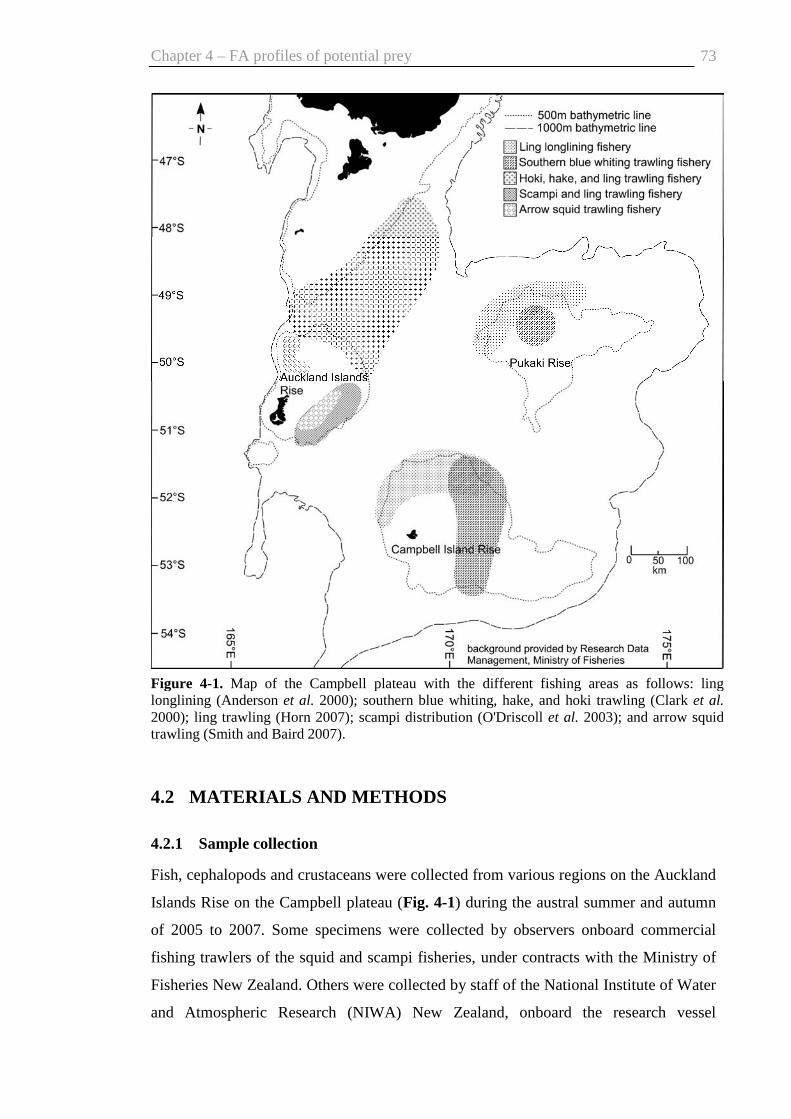
Chapter 4 – FA profiles of potential prey
73
4.2 MATERIALS AND METHODS
4.2.1 Sample collection
Fish, cephalopods and crustaceans were collected from various regions on the Auckland
Islands Rise on the Campbell plateau (Fig. 4-1) during the austral summer and autumn
of 2005 to 2007. Some specimens were collected by observers onboard commercial
fishing trawlers of the squid and scampi fisheries, under contracts with the Ministry of
Fisheries New Zealand. Others were collected by staff of the National Institute of Water
and Atmospheric Research (NIWA) New Zealand, onboard the research vessel
Figure 4-1. Map of the Campbell plateau with the different fishing areas as follows: ling longlining (Anderson et al. 2000); southern blue whiting, hake, and hoki trawling (Clark et al. 2000); ling trawling (Horn 2007); scampi distribution (O'Driscoll et al. 2003); and arrow squid trawling (Smith and Baird 2007).

Chapter 4 – FA profiles of potential prey
74
Tangaroa in December 2005. At collection, specimens were sorted according to species,
and stored frozen at –20°C in airtight plastic bags until analysed (within one year).
Fish, cephalopods and crustaceans were thawed, weighed and measured. Then each
individual was cut into several pieces and ground using a kitchen blender until
completely homogenised. For large fish, such as hoki, javelin fish and spiny dogfish,
head bones, too hard to be ground, were removed. An aliquot of a third of the mixture
was freeze-dried to a constant dry mass. Freeze-dried portions were stored at –20°C in
sealed plastic bags pending proximate composition and FA analyses.
4.2.2 Proximate analysis
Duplicates of 1.5 g (or 3 g for scampi) were sampled from the freeze-dried portions for
lipid and FA analysis. Fat content was expressed as an average of the duplicates. For
some small prey such as scampi and opalfish, there was not enough material for two
aliquots, thus only one sample per individual prey was analysed. Lipids were extracted
following Folch et al. (1957): samples of 1.5 g (or 3 g) were homogenised in 30 mL (or
60 mL) respectively of 2:1 chloroform:methanol (v:v) containing 0.01% butylated
hydroxytoluene (BHT) as an antioxidant. The extract was filtered and washed with 1%
sodium chloride in water (saline) to a final ratio of 8:4:3 chloroform:methanol:saline
(v:v:v). The organic phase was then dehydrated over anhydrous sodium sulphate
powder. Finally, the lipid extract was dried in a rotary evaporator at 38°C to a constant
mass. The crude protein content in the dried samples was estimated by multiplying the
amount of nitrogen measured with a Leco nitrometer by 6.25 (AOAC Official Method
968.06; AOAC 2005). Energy values (kJ g-1) of the dried sample were determined by
adiabatic bomb calorimetry.
4.2.3 FA analysis
FA methyl esters were prepared directly from 30 mg of the extracted lipid using 1.5 mL
of toluene and 1.5 mL of 10% boron trifluoride in methanol as the methylating reagent.
Each extract was capped under nitrogen, and heated at 50°C overnight. FA methyl
esters were then extracted into hexane and stored over anhydrous sodium sulphate at –
20°C before chromatographic analysis.

Chapter 4 – FA profiles of potential prey
75
Analysis of FA methyl esters was carried out using a temperature-programmed gas–
liquid chromatography (Shimadzu Gas Chromatograph GC-17A, Shimadzu
Corporation, Kyoto, Japan) equipped with a flame ionisation detector, and fitted with a
30 m × 0.25 mm i.d. column (50% cyanopropyl polysiloxane, 0.25 µm film thickness,
DB-23, J&W, U.S.A.; or 70% cyanopropyl polysilphenylene-siloxane column, 0.25 µm
film thickness, BPX70, SGE Analytical Science, Australia). Helium was the carrier gas.
FA methyl esters (2 µL) were injected manually in split mode (1:50) at an injection port
temperature of 250°C. The detector temperature was set at 270°C. The temperature of
the oven was programmed to stay at 50°C for 2 min, rose to 180°C at 25°C min–1, held
for 5 min, rose again to 200°C at 2°C min–1, then to 240°C at 2.1°C min–1 (total of 42.2
min).
FA components were identified by comparison of retention time data to authentic (Nu-
Chek GLC standard 68D, Supelco 37 FAME mix, Matreya menhaden oil) and
laboratory standards (cod liver oil). Cod liver oil was used in every series of runs to
determine accurate retention times. Nu-Check 68D standard was injected regularly to
check the quantitation of each FA. Peak areas were measured by a computerised
integration system attached to the gas chromatograph (CLASS-VP version 7.3,
Shimadzu Scientific Instruments, Inc., Columbia, MD). Each chromatogram was
checked to ensure correct identification. The identification of some minor peaks was
uncertain and these were not included in the final normalisation. FAs were designated
by the shorthand notation of carbon chain length:number of double bonds and location
(n-x) of the double bond nearest to the terminal methyl group. I used theoretical
response factors calculated according to Ackman and Sipos (1964) for the quantitation
of FAs.
4.2.4 Statistical methods
Lipid, protein, and energy contents were originally estimated from lyophilised samples.
They were transformed to wet mass values by considering the amount of water in the
samples. Thus, lipid and protein contents refer to percentage wet mass, and energy
content refers to kJ g-1 wet mass. All statistical analyses were conducted using
MINITAB package (MINITAB Release 14.1, MINITAB Inc. 2003) and SPSS package
(SPSS for windows® Release 15.0, SPSS Inc. 2006). Kruskal-Wallis tests (K-W tests)

Chapter 4 – FA profiles of potential prey
76
and post hoc Mann-Whitney tests (M-W tests) were performed to assess differences in
the lipid, protein and energy values between species.
FAs were expressed as an average of the lipid duplicates, in percentage mass of total
FAs. A principal component (PC) analysis based on a correlation matrix of the arcsine
square root-transformed FA percentages was run to visualise the distribution of
individual FA compositions, and to determine which FAs were most influential. In the
PC plot, species were classified according to their pelagic or benthic habitat. Moreover,
ANOVAs were run on the transformed percentages of each FA to assess significant FA
differences among species. All statistical tests have an α level of statistical significance
of 0.05 and all means are followed by standard deviations (SD).
4.3 RESULTS
In total, 43 fish from five species (bony fish hoki Macruronus novaezelandiae, javelin
Lepidorhynchus denticulatus, red cod Pseudophycis bachus, opalfish Hemerocoetes
spp, and the cartilaginous fish spiny dogfish Squalus acanthias), 17 cephalopods from
two species (arrow squid Nototodarus sloani and octopus Enteroctopus zealandicus),
and six scampi (Metanephrops challengeri) were analysed. Morphometric data and
ecological characteristics are summarised in Table 4-1.
4.3.1 Proximate composition
The lipid content ranged from 1.1 ± 0.4% (scampi) to 12.2 ± 2.4% (spiny dogfish)
(Table 4-2). Spiny dogfish had a significantly higher lipid content than the other species
studied (K-W test, H(7, 60) = 34.89, P = 0.000; M-W tests, P < 0.05) except hoki (M-W
test, P = 0.093). Bony fish and arrow squid displayed similar lipid content (M-W tests,
P > 0.05) with means from 4.0 ± 1.4% (red cod collected in April) to 6.8 ± 2.9% (hoki)
(Table 4-2). Lipid values of octopus and scampi were less than 2.5% and significantly
lower than those of the other species (M-W tests, P < 0.05).
The protein contents of octopus (13.6 ± 1.3%) and scampi (15.2 ± 1.7%) were also
significantly lower (K-W test, H(7, 60) = 37.57, P = 0.000; M-W tests, P < 0.05) than the
bulk of the specimens (18.0 – 19.5%) (Table 4-2), and opalfish displayed the highest
protein content (30.3 ± 6.3%).

77
Table 4-1. Morphometric data and ecological characteristics of marine species analysed from the region of the Auckland Islands Rise on the Campbell plateau (n = 66). The age was based on the length of the specimens. The length corresponds to the total length for fish and the dorsal mantle length for cephalopods. Age class, depth range, habitat and diet were from the literature: a (Ministry of Fisheries 2007); b (Kawakami 1976); c (Beentjes et al. 2002); d (Ayling and Cox 1982); e (O'Shea 1999); f (Blaber and Bulman 1987); g (Clark 1985); h Jeff Forman, pers. comm.; i (Coleman and Mobley 1984); j (Saito et al. 1974); k (Hanchet 1991). Name Species Date n Length
(cm) Mass (g)
Age class Depth range (preferred depth)
Habitat Diet
Hoki Macruronus novaezelandiae
Dec-05 11 68.6 ± 8.8 1091 ± 383 3+ (not mature) a
200-400+ (300) c pelagic f, g Pasiphea, amphipods, myctophidae f, g
Javelin Lepidorhynchus denticulatus
Dec-05 10 46.4 ± 3.6 224 ± 63 - 200-400+ (300) c pelagic f, g Pasiphea, amphipods, cephalopods, euphausiids,
myctophidae f, g
Red cod Pseudophycis bachus
Apr-06 5 34.5 ± 3.1 476 ± 154 1+ (not mature) a
50-300+ (120) c benthic h Galatheid, crangonid, crabs, flatfish, eels,
dwarf cod h
Dec-05 5 data lost data lost Opalfish Hemerocoetes
spp Apr-06 10 16.8 ± 1.2 23 ± 6 - over shelf d benthic d -
Spiny dogfish
Squalus acanthias
Dec-05 2 61.2 ± 1.0 811 ± 11 6+ (mature if male, not if female) a
50-300+ (100) c pelagic i Octopus, opalfish, crabs, galatheid,
euphausiids, myctophids, squid i, k
Arrow squid Nototodarus sloani
Mar-04 10 27.1 ± 4.4 466 ± 294 0+ b 100-350+ (200) c pelagic j euphausiids, amphipods, crabs,
myctophidae, saury, squid j
Octopus Enteroctopus zealandicus
Apr-06 6 17.7 ± 3.5 2529 ± 1392 - littoral to 530m e benthic e -
Feb-07 1 20.5 3809 Scampi Metanephrops
challengeri Jan-07 6 23 ± 9 - 200-500 a benthic a -

Chapter 4 – FA profiles of potential prey
78
The lowest energy contents were obtained for octopus and scampi (approximately 3.8 kJ
g-1), which were significantly different from the other species (K-W test, H(7, 60) = 34.89,
P = 0.000; M-W tests, P < 0.05). Fish and arrow squid had similar energy contents (M-
W tests, P > 0.05) with means ranging from 6.3 ± 0.6 kJ g-1 (arrow squid) to 8.5 ± 1.9 kJ
g-1 (opalfish) (Table 4-2).
Table 4-2. Mean ± SD of the proximate composition (% wet mass) and energy content (kJ g-1 wet mass) of marine species from the region of the Auckland Islands Rise on the Campbell plateau. The scientific names and number analysed are given in Table 4-1.
---------- Lipid -------- --------- Protein -------- ------ Moisture ------ ------- Energy ------ Species % wet
mass Range % wet
mass Range % Range kJ g-1
wet mass Range
Hoki 6.8 ± 2.9 2.8-10.6 19.5 ± 1.0 17.8-20.3 71.2 ± 2.9 67.8-75.6 7.1 ± 1.0 6.0-8.3
Javelin 6.1 ± 2.2 2.2-9.0 18.2 ± 1.7 15.0-21.6 71.7 ± 2.2 67.9-74.8 6.7 ± 0.8 5.3-7.8
Red cod (April)
4.0 ± 1.4 2.8-6.0 18.0 ± 1.0 17.3-19.3 69.1 ± 1.0 67.7-69.9 7.3 ± 0.5 6.9-7.5
Opalfish 4.2 ± 1.5 2.1-6.0 30.3 ± 6.3 19.8-37.1 53.3 ± 9.0 37.5-72.2 8.5 ± 1.9 5.2-10.6
Spiny dogfish
12.2 ± 2.4 10.4-13.9 19.3 ± 0.2 19.2-19.4 67.1 ± 2.3 65.5-68.7 8.3 ± 0.7 7.8-8.8
Arrow squid
5.6 ± 1.9 2.2-9.0 18.9 ± 1.2 16.7-20.1 72.7 ± 2.3 69.6-76.0 6.3 ± 0.6 5.3-7.0
Octopus (April)
1.8 ± 0.6 0.8-2.4 13.6 ± 1.3 12.2-15.3 80.2 ± 1.3 78.1-82.0 3.8 ± 0.4 3.2-4.4
Scampi 1.1 ± 0.4 0.6-2.0 15.2 ± 1.7 14.5-17.1 66.4 ± 4.4 60.8-73.4 3.8 ± 0.6 3.1-4.4
4.3.2 FA composition
Although 37 FAs were originally identified, only 30 ranging from 14:0 to 22:6n-3 were
used (Table 4-3). The eight FAs removed were either short chain FAs (<14 carbons),
known to come primarily from endogenous biosynthesis (Dalsgaard et al. 2003), or FAs
(18:4n-3, 20:4n-3 and 22:2n-6) for which the identification was not certain. Some FA
methyl esters tended to co-elute when injected through the BPX70 column. This is the
case for 16:3n-4 with 17:1 and 21:5n-3 with 24:0, for which percentages were grouped
for all samples.

Chapter 4 – FA profiles of potential prey
79
Table 4-3a. FA composition (mean % mass of total FA ± SD) of fish species collected in the region of the Auckland Islands Rise on the Campbell plateau. n is the number of specimens analysed per species. SAFA is for saturated fatty acids, MUFA for monounsaturated fatty acids, PUFA for polyunsaturated fatty acids, ARA for arachidonic acid, EPA for eicosapentaenoic acid, and DHA for docosahexaenoic acid.
──────────────────── Fish ────────────────────
Hoki Javelin Red cod Opalfish Dogfish
n 11 10 10 10 2
SAFA 14:0 5.73 ± 0.90 4.64 ± 1.07 9.04 ± 2.96 8.14 ± 2.50 4.12 ± 0.20 15:0 0.60 ± 0.08 0.64 ± 0.10 1.41 ± 0.49 0.95 ± 0.37 1.41 ± 0.03 16:0 24.53 ± 2.10 23.77 ± 2.18 31.83 ± 2.63 30.34 ± 4.49 28.23 ± 1.31 17:0 0.95 ± 0.22 0.58 ± 0.11 1.71 ± 0.64 0.96 ± 0.28 1.27 ± 0.40 18:0 3.34 ± 0.47 2.51 ± 0.39 6.14 ± 0.82 6.87 ± 1.18 5.23 ± 1.01 24:0 & 21:5n-3 0.20 ± 0.06 0.18 ± 0.05 0.18 ± 0.08 0.12 ± 0.15 0.18 ± 0.02 MUFA 14:1n5 0.27 ± 0.07 0.22 ± 0.06 0.24 ± 0.06 0.27 ± 0.09 0.18 ± 0.11 15:1 0.11 ± 0.05 0.21 ± 0.06 0.22 ± 0.07 0.22 ± 0.09 0.33 ± 0.24 16:1n-7 5.87 ± 0.64 7.25 ± 0.80 4.96 ± 0.63 7.58 ± 1.35 5.59 ± 0.26 17:1 & 16:3n-4 0.42 ± 0.05 0.66 ± 0.17 0.47 ± 0.13 0.78 ± 0.31 1.05 ± 0.03 18:1n-9 19.34 ± 1.07 23.30 ± 4.20 13.40 ± 1.45 18.19 ± 1.24 18.97 ± 0.67 18:1n-7 3.64 ± 0.14 3.91 ± 0.68 3.27 ± 0.85 3.82 ± 0.61 4.18 ± 0.34 18:1n-5 0.22 ± 0.05 0.45 ± 0.06 0.38 ± 0.20 0.36 ± 0.08 0.31 ± 0.01 20:1n-11 0.38 ± 0.08 1.19 ± 0.36 0.45 ± 0.08 0.51 ± 0.17 1.56 ± 0.24 20:1n-9 9.37 ± 0.90 10.03 ± 1.52 5.41 ± 1.65 7.10 ± 2.10 5.92 ± 1.96 22:1n-11 2.70 ± 0.32 1.91 ± 0.58 1.16 ± 0.27 1.30 ± 0.34 2.60 ± 1.39 22:1n-9 0.88 ± 0.17 0.74 ± 0.29 0.51 ± 0.21 0.53 ± 0.12 2.98 ± 0.63 PUFA 16:4n-1 0.08 ± 0.06 0.08 ± 0.03 0.07 ± 0.03 0.10 ± 0.08 0.10 ± 0.04 18:2n-6 1.32 ± 0.11 1.15 ± 0.10 1.08 ± 0.19 0.58 ± 0.32 1.10 ± 0.27 18:3 0.74 ± 0.05 0.70 ± 0.10 0.58 ± 0.10 0.39 ± 0.24 0.80 ± 0.06 20:2n-6 0.22 ± 0.04 0.21 ± 0.04 0.31 ± 0.06 0.14 ± 0.09 0.23 ± 0.02 20:3n-6 0.05 ± 0.04 0.07 ± 0.02 0.04 ± 0.00 0.03 ± 0.04 0.02 ± 0.02 20:3n-3 0.16 ± 0.03 0.20 ± 0.05 0.11 ± 0.03 0.05 ± 0.07 0.04 ± 0.00 20:4n-6 (ARA) 0.49 ± 0.12 0.53 ± 0.09 0.73 ± 0.61 0.61 ± 0.92 1.03 ± 0.15 20:5n-3 (EPA) 6.76 ± 1.16 6.36 ± 0.96 5.13 ± 1.27 3.73 ± 3.36 3.97 ± 0.08 22:5n-6 0.04 ± 0.03 0.08 ± 0.03 0.08 ± 0.09 0.05 ± 0.13 0.24 ± 0.06 22:5n-3 1.50 ± 0.30 0.93 ± 0.28 1.11 ± 0.63 0.43 ± 0.50 1.26 ± 0.34 22:6n-3 (DHA) 10.08 ± 1.80 7.49 ± 1.67 9.98 ± 3.85 5.87 ± 5.17 7.11 ± 0.27 Total SAFA 35.33 ± 3.83 32.33 ± 3.90 50.32 ± 7.62 47.38 ± 8.97 40.44 ± 2.97 Total MUFA 43.21 ± 3.53 49.87 ± 8.77 30.47 ± 5.60 40.65 ± 6.51 43.66 ± 5.88 Total PUFA 21.45 ± 3.75 17.80 ± 3.38 19.22 ± 6.87 11.97 ± 10.93 15.90 ± 1.30
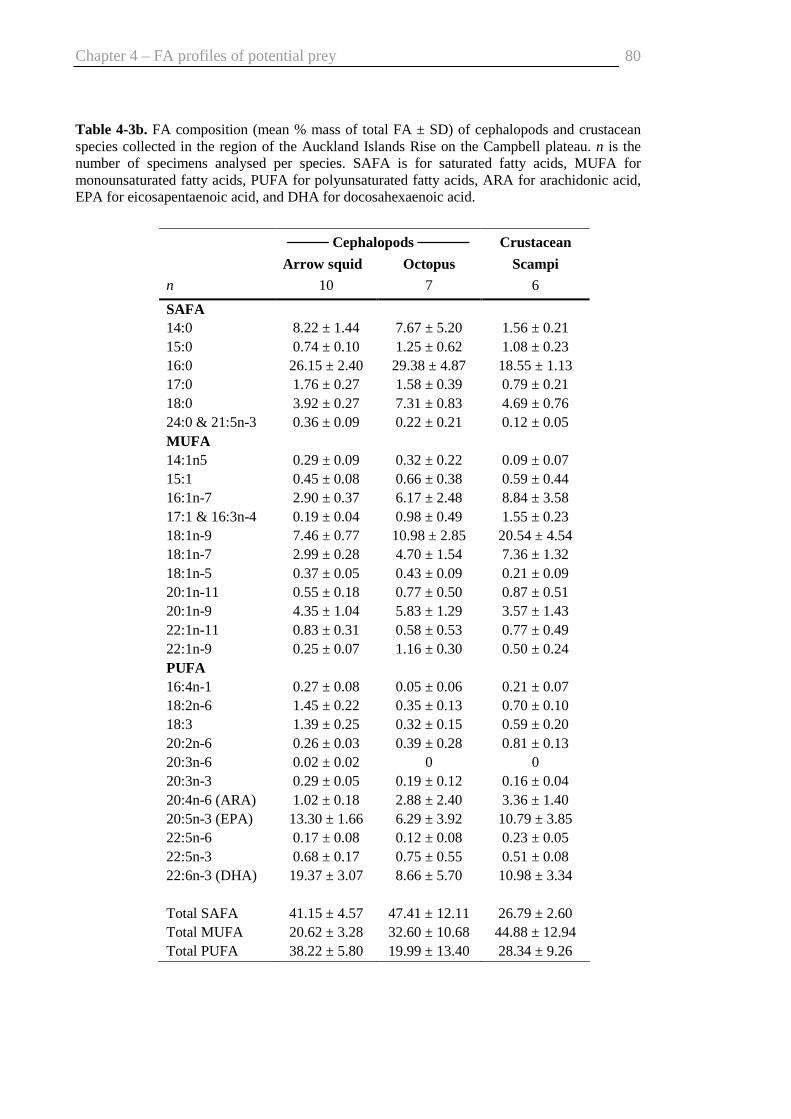
Chapter 4 – FA profiles of potential prey
80
Table 4-3b. FA composition (mean % mass of total FA ± SD) of cephalopods and crustacean species collected in the region of the Auckland Islands Rise on the Campbell plateau. n is the number of specimens analysed per species. SAFA is for saturated fatty acids, MUFA for monounsaturated fatty acids, PUFA for polyunsaturated fatty acids, ARA for arachidonic acid, EPA for eicosapentaenoic acid, and DHA for docosahexaenoic acid.
──── Cephalopods ───── Crustacean
Arrow squid Octopus Scampi
n 10 7 6
SAFA 14:0 8.22 ± 1.44 7.67 ± 5.20 1.56 ± 0.21 15:0 0.74 ± 0.10 1.25 ± 0.62 1.08 ± 0.23 16:0 26.15 ± 2.40 29.38 ± 4.87 18.55 ± 1.13 17:0 1.76 ± 0.27 1.58 ± 0.39 0.79 ± 0.21 18:0 3.92 ± 0.27 7.31 ± 0.83 4.69 ± 0.76 24:0 & 21:5n-3 0.36 ± 0.09 0.22 ± 0.21 0.12 ± 0.05 MUFA 14:1n5 0.29 ± 0.09 0.32 ± 0.22 0.09 ± 0.07 15:1 0.45 ± 0.08 0.66 ± 0.38 0.59 ± 0.44 16:1n-7 2.90 ± 0.37 6.17 ± 2.48 8.84 ± 3.58 17:1 & 16:3n-4 0.19 ± 0.04 0.98 ± 0.49 1.55 ± 0.23 18:1n-9 7.46 ± 0.77 10.98 ± 2.85 20.54 ± 4.54 18:1n-7 2.99 ± 0.28 4.70 ± 1.54 7.36 ± 1.32 18:1n-5 0.37 ± 0.05 0.43 ± 0.09 0.21 ± 0.09 20:1n-11 0.55 ± 0.18 0.77 ± 0.50 0.87 ± 0.51 20:1n-9 4.35 ± 1.04 5.83 ± 1.29 3.57 ± 1.43 22:1n-11 0.83 ± 0.31 0.58 ± 0.53 0.77 ± 0.49 22:1n-9 0.25 ± 0.07 1.16 ± 0.30 0.50 ± 0.24 PUFA 16:4n-1 0.27 ± 0.08 0.05 ± 0.06 0.21 ± 0.07 18:2n-6 1.45 ± 0.22 0.35 ± 0.13 0.70 ± 0.10 18:3 1.39 ± 0.25 0.32 ± 0.15 0.59 ± 0.20 20:2n-6 0.26 ± 0.03 0.39 ± 0.28 0.81 ± 0.13 20:3n-6 0.02 ± 0.02 0 0 20:3n-3 0.29 ± 0.05 0.19 ± 0.12 0.16 ± 0.04 20:4n-6 (ARA) 1.02 ± 0.18 2.88 ± 2.40 3.36 ± 1.40 20:5n-3 (EPA) 13.30 ± 1.66 6.29 ± 3.92 10.79 ± 3.85 22:5n-6 0.17 ± 0.08 0.12 ± 0.08 0.23 ± 0.05 22:5n-3 0.68 ± 0.17 0.75 ± 0.55 0.51 ± 0.08 22:6n-3 (DHA) 19.37 ± 3.07 8.66 ± 5.70 10.98 ± 3.34 Total SAFA 41.15 ± 4.57 47.41 ± 12.11 26.79 ± 2.60 Total MUFA 20.62 ± 3.28 32.60 ± 10.68 44.88 ± 12.94 Total PUFA 38.22 ± 5.80 19.99 ± 13.40 28.34 ± 9.26

Chapter 4 – FA profiles of potential prey
81
Overall, the FAs in greatest percentages were 14:0, 16:0, 16:1n-7, 18:0, 18:1n-9, 18:1n-
7, 20:1n-9, 20:5n-3 and 22:6n-3, accounting for approximately 88% of the total FAs
(Table 4-3). Saturated FAs (SFAs) varied from 26.79 ± 2.60% (scampi) to 50.32 ±
7.62% (red cod), monounsaturated FAs (MUFAs) from 20.62 ± 3.28% (arrow squid) to
49.87 ± 8.77% (javelin fish), and PUFAs from 11.97 ± 10.93% (opalfish) to 38.22 ±
5.80% (arrow squid). A plot of the first three PCs representing 68% of the total variance
was created from the PC analysis run on transformed percentages (Fig. 4-2). Overall,
species were well distinguished from each other by their FA profiles, except the seven
octopi which did not show any grouping. Individual FA percentages were all
significantly different between species (ANOVAs, DF = 7 between groups and 65 in
total, P < 0.05). FA compositions of pelagic (arrow squid, spiny dogfish, hoki and
javelin fish) and benthic living species (octopus, opalfish, red cod and scampi) were
well separated along PC1 (28% of total variance) and PC2 (21% of total variance) (Fig.
4-2). Pelagic species were mainly confined in the lower front region of the plot driven
by high positive loadings of 20:5n-3, 22:6n-3 and 20:3n-3 on PC1, and high negative
loadings of 14:0, 18:2n-6 and 22:1n-11 on PC2 (Fig. 4-2). FA profiles of arrow squid
were distinguished from the other pelagic species on PC3 (19% of total variance), and
displayed the highest levels of some of the main FAs 20:5n-3 and 22:6n-3 (Table 4-3b).
Hoki and javelin fish were distributed closely (Fig. 4-2), both with high levels of 18:1n-
9, 22:1n-11 and 20:1n-9 (Table 4-3a). The intra-specific variability among pelagic
species was smaller than among benthic species, the latter showing a high dispersal of
FA compositions (Fig. 4-2). Within the benthic species, only scampi individuals were
well grouped on PC1 and PC2 at the top of the plot, and displayed high values of 20:5n-
3, 22:6n-3, 20:4n-6, 18:1n-9 and 18:1n-7 (Table 4-3b). In contrast, benthic-living
opalfish had the lowest levels of 20:5n-3 and 22:6n-3 recorded. The amount of 20:4n-6
is unique to scampi, being three times greater than in other species, except for some
octopus (Table 4-3b). Finally, red cod caught in April showed distinct FA profiles from
those caught in December (Fig. 4-2).
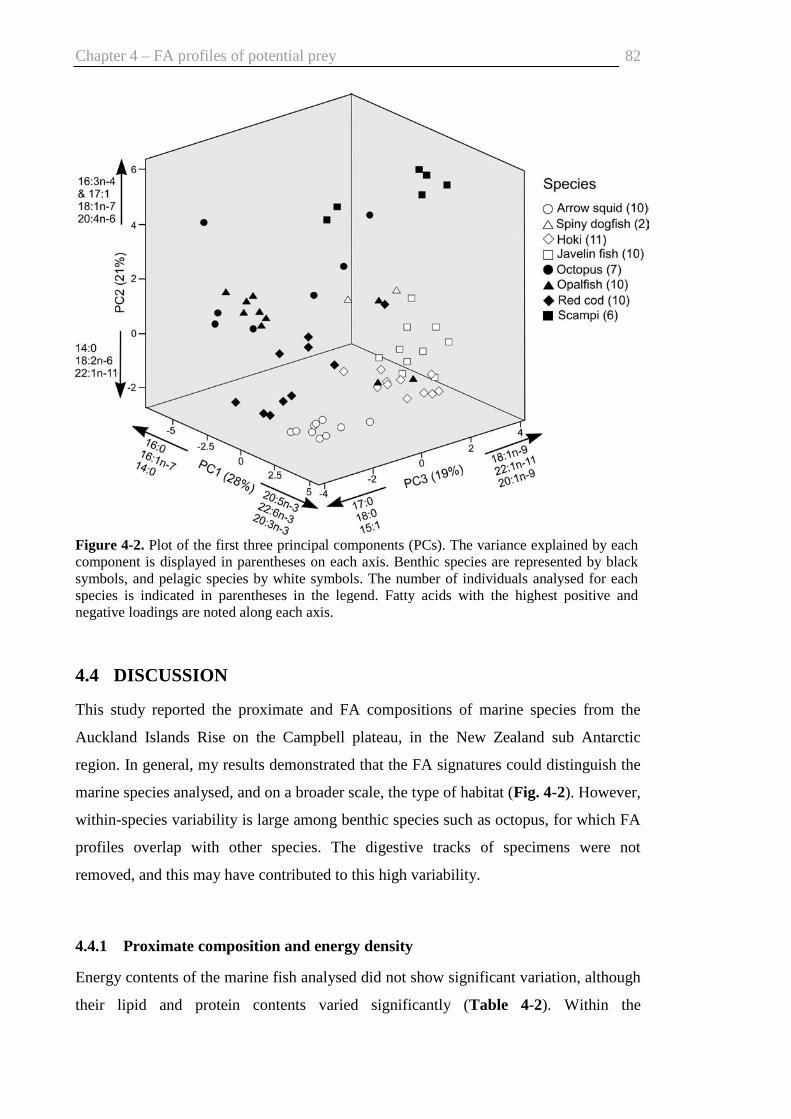
Chapter 4 – FA profiles of potential prey
82
4.4 DISCUSSION
This study reported the proximate and FA compositions of marine species from the
Auckland Islands Rise on the Campbell plateau, in the New Zealand sub Antarctic
region. In general, my results demonstrated that the FA signatures could distinguish the
marine species analysed, and on a broader scale, the type of habitat (Fig. 4-2). However,
within-species variability is large among benthic species such as octopus, for which FA
profiles overlap with other species. The digestive tracks of specimens were not
removed, and this may have contributed to this high variability.
4.4.1 Proximate composition and energy density
Energy contents of the marine fish analysed did not show significant variation, although
their lipid and protein contents varied significantly (Table 4-2). Within the
Figure 4-2. Plot of the first three principal components (PCs). The variance explained by each component is displayed in parentheses on each axis. Benthic species are represented by black symbols, and pelagic species by white symbols. The number of individuals analysed for each species is indicated in parentheses in the legend. Fatty acids with the highest positive and negative loadings are noted along each axis.

Chapter 4 – FA profiles of potential prey
83
invertebrates, arrow squid had comparable proximate composition and energy content to
most fish, whereas the lowest values were recorded in octopus and scampi individuals.
My results are consistent with the only other data recorded for the lipid and protein
contents of arrow squid and red cod (Vlieg 1984a, c), although these specimens were
collected further north in waters around the main islands of New Zealand. However, the
present values for hoki were higher than previously reported for fish of similar lengths
caught around the main islands of New Zealand (Vlieg 1984a), but comparable to those
for hoki from waters off eastern Tasmania, Australia (Blaber and Bulman 1987). No
comparable data are available in the literature for the invertebrates scampi and octopus,
although similar results, including low content of lipid, have been reported for other
species of octopus and benthic crustaceans (Gökodlu and Yerlikaya 2003; Rosa and
Nunes 2003; Rosa et al. 2005; Pilar Sieiro et al. 2006; Ozogul et al. 2008). Graeve et al.
(1997) explained the lower lipid values of benthic invertebrates in comparison with
pelagic species by their “sluggish life” (wait for prey) that requires minimum energetic
expenditure. In contrast, pelagic species accumulate lipids for energy reserve and for
buoyancy (Sargent 1976). Red cod and opalfish, although considered benthic species,
showed similar lipid levels to the pelagic species. This could be explained by a more
dynamic feeding strategy than scampi and octopus.
Lipid content, and thus energy content and FA composition, are known to vary greatly
according to prey size, season, and maturity stage (e.g., Anthony et al. 2000; Budge et
al. 2002; Iverson et al. 2002). Only few individuals per species were analysed here,
therefore it must be kept in mind that these results represent individuals of a certain size
and time of the year before making comparative studies.
4.4.2 FA composition in relation to diet
In marine ecosystems, PUFAs 20:4, 20:5, 22:5, and 22:6 originate in phytoplankton,
and are conserved with little catabolism through the food chain (Sargent et al. 1987),
and therefore are potential biomarkers for marine food webs. The relative conservation
of FAs from one trophic level to another has been validated by experimental studies
(e.g., Fraser and Sargent 1989; Graeve et al. 1994b; Kirsch et al. 1998; Dalsgaard and
St John 2004), and demonstrated the relevance of dietary FAs as qualitative markers of
trophic interactions. FA profiles among individuals of the same species analysed herein
were generally grouped together, and species distinguished from each other in the PC

Chapter 4 – FA profiles of potential prey
84
plot (Fig. 4-2). The exception is the octopus showing a great variability in FA
composition between specimens (Fig. 4-2).
Among the benthic species studied (red cod, opalfish, octopus and scampi), red cod is
the only species for which diet information is available (J. Forman pers. comm.). Thus it
is presently difficult to link the present results on FA composition with the feeding
biology of the benthic species. However, it is known that opalfish and octopus are
species which do not live in schools (Ayling and Cox 1982; O'Shea 1999), thus
individuals are more likely to encounter different prey than schooling species, resulting
in a higher variability in FA profiles. This is consistent with the high variation of the FA
composition of octopi and some opalfish (Fig. 4-2). FA profiles of individual red cod
showed variation with the time of capture (December vs. April; Fig. 4-2). Temporal
variation in FA composition may be related to a different diet and/or rate of metabolism
between seasons. Change in metabolism through time is generally due to different
maturity stages or sizes (e.g., Anthony et al. 2000; Budge et al. 2002; Iverson et al.
2002). Nevertheless, red cods analysed in this study were juvenile fish of similar sizes,
thus changes in FA profiles between December and April must be mainly influenced by
diet variation. This hypothesis cannot be validated to date as the only red cod specimens
with diet information were collected in December-January only (Table 4-1, J. Forman
pers. comm.). Among pelagic species, the two spiny dogfish displayed intermediate FA
signatures between benthic individuals and other pelagic species (Fig. 4-2). Although
these two specimens may not be representative of the species, these results are
consistent with the reported diet of spiny dogfish in New Zealand waters, feeding on
both benthic (octopus, opalfish, crabs) and pelagic species (galatheid, euphausiids,
myctophids, and squids) (Table 4-1) (Hanchet 1991). There was a high degree of
overlap in the FA profiles of hoki and javelin fish (Fig. 4-2), which is in agreement with
previous data that these species have a similar diet (Table 4-1) (Clark 1985; Blaber and
Bulman 1987). The average values of 20:1n-9 and 22:1n-11 were generally higher than
in the other fish species studied (Table 4-3a). These FAs are the trophic markers of
calanoid copepods (Sargent and Falk-Petersen 1988; Graeve et al. 1994a; Hagen et al.
1996), which are foraged by other zooplankton such as amphipods and euphausiids
(Auel et al. 2002; Dalsgaard et al. 2003). Hoki and javelin fish eat amphipods and
euphausiids (Table 4-1) (Clark 1985; Blaber and Bulman 1987), explaining the high
values of 20:1n-9 and 22:1n-11 comparing to other species. However, arrow squid is
also a known predator of zooplankton, yet did not show high values of these FAs.

Chapter 4 – FA profiles of potential prey
85
Furthermore, FA profiles of arrow squid were well separated from those of javelin fish
and hoki, with high concentrations of 20:5n-3 and 22:6n-3 (Table 4-3b, Fig. 4-2). This
unexpected profile compared to other species sharing the same trophic niche, would
suggest that factors other than diet influence the FA composition of the marine species
studied, at least for the squid. 20:5n-3 and 22:6n-3 originate from phytoplankton
(Sargent et al. 1987), and are generally found in important amounts in cephalopod
species (Phillips et al. 2001; Rosa et al. 2005; Ozogul et al. 2008). Phillips et al. (2001)
hypothesised that squid either selectively retains these FAs from the diet, or that this
taxum is able to elongate n-3 precursors. Similarly, the benthic species scampi showed
high levels of 20:5n-3 and 22:6n-3. Scampi has however a unique FA signature with a
high proportion of 20:4n-6 (Fig. 4-2, Table 4-3b), which is consistent with reported
levels of this FA in some other benthic invertebrates (Graeve et al. 1997; Hagen et al.
2000). Nonetheless, 20:4n-6 is only abundant in macro-algae (Graeve et al. 2002),
whereas deep-systems, such as the scampi habitat, receive low quantities of 20:4n-6
from phytoplankton sedimentation (Ackman et al. 1968). Thus, for both arrow squid
and scampi, diet alone does not explain the levels of some FAs, and it is suggested that
these species may either selectively retain certain long-chain PUFAs, or elongate
unsaturated 18-carbon FAs. To investigate this possibility, a further step would be to
analyse the lipid classes of arrow squid and scampi. Indeed, triacylglycerols (TAGs),
phospholipids (PLs), wax esters, and free FAs have different chemical properties, and
their compositions are not influenced to the same degree by dietary FAs (Sargent 1976;
Dalsgaard et al. 2003). TAGs, which are the main lipid class in most fish species
(Clarke et al. 1984), are the common form of energy storage (Patton 1975), whereas
PLs have a structural role in biomembranes (Sargent 1976). PLs were found to be the
major lipid class in some species of cephalopods and crustaceans in which 20:5n-3,
22:6n-3 and 20:4n-6 were in high concentrations (Phillips et al. 2001; Rosa and Nunes
2003; Pilar Sieiro et al. 2006).
4.5 CONCLUSION
This chapter reports the proximate and FA compositions of marine species from the
Auckland Islands Rise on the Campbell plateau, in the New Zealand sub Antarctic
region. Despite the limitation of FA trophic markers for arrow squid and scampi, these
findings provide a basis for greater understanding of trophic links between species of
Chapter 4 – FA profiles of potential prey
86
great commercial importance (hoki) and of less value (javelin fish, spiny dogfish, red
cod, octopus and opalfish). Moreover, this study can have several applications at higher
trophic levels. The proximate composition and energy contents of the marine species
studied gives an insight into their nutritional values in terms of food, and may be
included in bioenergetics models of higher trophic predators. Also, the FA compositions
reported here can be used to estimate the prey composition in the diet of predators such
as marine mammals in a quantitative model (Iverson et al. 2004). Due to some overlap
between the FA profiles of different species, the grouping of several species or splitting
of one species in several groups may be necessary before the application of such a
model. Further analyses on marine individuals from the Campbell plateau are required
to understand the intraspecific variability of the FA composition.
Acknowledgments
The marine specimens were collected by the National Institute of Water and
Atmospheric research (NIWA) during the Tangaroa survey TAN 0515 in December
2005, and by the Ministry of Fisheries (MFish) observers on the arrow squid fishery in
autumn 2005 and 2006, and on the scampi fishery in summer 2007. I am grateful to the
MFish observers, in particular M. Cawthorn and N. Hollands (MFish observer
programme), and to D. Stevens and N. Bagley (NIWA) for providing the specimens.
Thanks to Jeff Forman (NIWA) who provided diet information on red cod. Thanks to F.
Jackson and L. Turnbull, who were responsible of the lyophilisation of tissues, the
protein content analysis and the energy content analysis processed at the Institute of
Food, Nutrition, and Human Health, Massey University. Special thanks to R. Galois
(IFREMER), M. Walton (SMRU) and Mark Reynolds (Fonterra) for their advice on
fatty acid analysis. This project was sponsored by Lewis Fitch Research Fund, the
Whale and Dolphin Adoption Project, the Department of Conservation and the NZ
Ministry of Fisheries.

5 CHAPTER 5
QUANTITATIVE FATTY ACID SIGNATURE ANALYSIS ON
NEW ZEALAND SEA LIONS: SENSITIVITY ANALYSIS &
DIET ESTIMATES
Photo: by-caught sub-adult male New Zealand sea lion (Phocarctos hookeri) before necropsy
Meynier, L., Morel, P.C.H., Chilvers, B.L., Mackenzie, D.D.S. and Duignan, P.J.
Quantitative fatty acid signature analysis on New Zealand sea lions: sensitivity analysis
and diet estimates. Marine Ecology Progress Series, in review

Chapter 5 – QFASA on by-caught NZ sea lions
88
Abstract
Quantitative fatty acid signature analysis (QFASA) was tested on New Zealand (NZ)
sea lions (Phocarctos hookeri) incidentally caught in the NZ squid fishery to determine
their long-term diet during the first half of the lactation period. The QFASA model used
fatty acid (FA) profiles based on 82 blubber samples of sea lions (51 females and 31
males) by-caught between 2000 and 2006. First, QFASA was optimised by a series of
simulations for which one model parameter (the set of calibration coefficients (CCs),
the set of FAs and the consideration of prey individuals or groups) varied each time.
Second, the diet of NZ sea lions was estimated using the optimal parameters and
variation between sexes and years assessed. QFASA was highly sensitive to the set of
CCs applied. The most important prey estimated using the optimal parameters (CCs
from Steller sea lions Eumetopias jubatus fed on herring, 23 FAs, prey individuals)
were arrow squid Nototodarus sloani (28% median mass), rattails Macrouridae (27%
median mass), hoki Macruronus novaezelandiae (10% median mass), and red cod
Pseudophycis bachus (4% median mass). The contribution of each prey in the diet was
comparable to what was previously determined by stomach analysis with the exception
of rattails which were found in low percentages by mass in the stomach contents.
QFASA and stomach analysis represent different time frames of diet inference, which
may explain the difference in the rattail contribution between the methods. Despite the
uncertainty on the accuracy of the match between the optimal CCs used and the true FA
metabolism of NZ sea lions, the consistency of the main prey estimated between
QFASA and stomach analysis gave strength to the QFASA predictions. The most
important estimated prey were demersal species living mainly at depths > 200 m that
sea lions encounter on the slopes of the Auckland Islands shelf. The present study
emphasised the importance of these areas for by-caught NZ sea lions over the first half
of the lactation period.
Chapter 5 – QFASA on by-caught NZ sea lions
89
5.1 INTRODUCTION
The New Zealand (NZ) sea lion (Phocarctos hookeri) has been classified as “vulnerable
in decline” by the International Union for Conservation of Nature (IUCN) (Gales 2008)
and “threatened” under the NZ Threat Classification System (Hitchmough et al. 2007).
The population is limited to approximately 12000 individuals (Campbell et al. 2006),
and it is one of the most localised pinniped with 86% of the entire pup production born
at the Auckland Islands (50°30'S, 166°E) (Chilvers et al. 2007b). The stable or even
decreasing population of the NZ sea lion (Chilvers et al. 2007b) is in marked contrast
with the large growing population of the sympatric NZ fur seal (Harcourt 2001). The
“success” of NZ fur seals Arctocephalus forsteri has been attributed to their epipelagic
foraging strategy (Harcourt et al. 1995; Mattlin et al. 1998; Harcourt et al. 2001) shared
with other otariids with large populations (e.g., Boyd et al. 1994; Horning and Trillmich
1997; Georges et al. 2000; Weise 2006), whereas benthic feeders such as the NZ sea
lion tend to have smaller or stable populations (e.g., Thompson et al. 1998; Costa and
Gales 2003; Chilvers et al. 2006). Female NZ sea lions make deep and long dives at
depths averaging 130 m, and maximise their time at the benthos when diving (Costa and
Gales 2000; Chilvers et al. 2006). This strategy is advantageous if the food resource on
the seabed is predictable (Costa 1991). Therefore, data on the composition of the diet
and prey availability are essential to better understand the energetics of the NZ sea lion,
and may explain part of the low reproductive success of this marine mammal (Chilvers
2008b).
The diet of NZ sea lions at the Auckland Islands has been investigated through the
analyses of scat samples, regurgitates and stomach contents (Childerhouse et al. 2001;
Chapter 2). These methods rely on the recovery of prey hard parts, and are subject to
biases, as prey may not have any hard part resistant to digestion (e.g., crustaceans), and
prey structures have species-specific digestion rates leading to the underestimation of
fragile parts (e.g., small otoliths) or the overestimation of non digestible parts (e.g.,
squid beaks) (e.g., Bigg and Fawcett 1985; Dellinger and Trillmich 1988; Bowen 2000;
Staniland 2002; Tollit et al. 2007). Thus, dietary studies of marine mammals more and
more include the combination of traditional techniques with biochemical ones such as
fatty acid (FA) and stable isotope analyses, which overcome biases related to
differential gut digestion (e.g., Iverson et al. 1997a; Brown et al. 1999; Lea et al. 2002a;
Bradshaw et al. 2003; Grahl-Nielsen et al. 2005; Hall-Aspland et al. 2005; Herman et

Chapter 5 – QFASA on by-caught NZ sea lions
90
al. 2005; Staniland and Pond 2005; Dehn et al. 2007; Tucker et al. 2008). FAs are the
main constituents of most lipids, and provide energy storage mainly situated in the
subcutaneous fat (blubber) in marine mammals (Iverson 2002). Uptake of dietary FAs
by adipose tissue involves several steps: absorption in the small intestine, incorporation
into chylomicron triacylglycerol (TAG), hydrolysis of this TAG by the adipose tissue
lipoprotein lipase, uptake of FAs and esterification within adipocytes. FA molecules are
not degraded during this process, and the long-chain FAs are thought to be deposited in
the adipose tissue with minimal modification and/or in a predictable manner (Summers
et al. 2000; Iverson et al. 2004), potentially reflecting the diet over weeks to months
(Kirsch et al. 2000; Iverson et al. 2004; Cooper et al. 2005; D. Tollit unpubl. data).
FA analysis has been extensively used to assess geographical, temporal, and ontogenetic
variation in the diet of a variety of marine mammals (e.g., Iverson et al. 1997a; Walton
et al. 2000; Lea et al. 2002a; Walton and Pomeroy 2003; Samuel and Worthy 2004;
Staniland and Pond 2004; Herman et al. 2005; Smith and Worthy 2006; Beck et al.
2007b; Thiemann and Iverson 2007; Walton et al. 2007). Inference of prey species
ingested by the comparison of the raw FA profiles of prey and predator alone is not
adequate, as the FA array is large and generally a FA is not specific to a particular prey.
Furthermore, there is variation in the metabolism of individual FAs by the predator so
that the proportion of FAs deposited in the adipose tissue of the predator will differ
from that occurring in the prey. However, by using FA profiles in conjunction with a
model taking into account FA metabolism (by including calibration coefficients (CCs)),
it is believed possible to estimate the species composition. This method, named
quantitative FA signature analysis (QFASA), was developed by Iverson et al. (2004)
and since, has been used to infer the diet of several marine predators (Iverson et al.
2006; Beck et al. 2007a; Iverson et al. 2007). The CCs are determined empirically with
captive animals fed on controlled long-term monotypic diets (e.g., Iverson et al. 2004),
and are unlikely to be determined specifically for NZ sea lions in the near future. Thus,
CCs determined in other species of pinnipeds (Iverson et al. 2004; D. Tollit unpubl.
data) are presently the only available CCs that can be used for the application of
QFASA on NZ sea lions.
Given this limitation, the present study investigated whether QFASA was sufficiently
robust to provide useful insights in the long-term diet of the NZ sea lion. My specific
aims were (1) to evaluate the sensitivity of the QFASA model on blubber of by-caught
NZ sea lions by using different CC sets available in the literature; (2) to optimise
Chapter 5 – QFASA on by-caught NZ sea lions
91
QFASA parameters, and finally; (3) to estimate the diet of NZ sea lions. QFASA
estimates by year and by sex are discussed in term of feeding ecology and biases related
to differential FA metabolism between groups. Overall estimates are compared with
stomach contents from the same individuals (Chapter 2).
5.2 MATERIALS AND METHODS
5.2.1 Sample collection
NZ sea lions captured accidentally in the NZ sub-Antarctic arrow squid (Nototodarus
sloani) fishery (operating annually from February to May) were frozen onboard, and
sent frozen to Massey University, NZ, for necropsy. During necropsy, a full-depth 60
mm2 piece of blubber (including skin and some muscle) was cut from the mid-sternal
region, stored in a plastic bag from which air was expelled, and placed at -20°C.
Females were categorised as either non-lactating (NLF) or lactating (LF) by the
examination of the mammary gland for development and presence of secretion. The
individuals included in this study were all mature as determined by visual examination
of the ovaries and histological examination of the testes (details in Duignan et al. 2003).
5.2.2 Lipid analysis
Lipids from blubber were extracted following Folch et al. (1957). Briefly, lipids were
extracted in a mixture of 8:4:3 chloroform:methanol:saline water (v:v:v) containing
0.01% butylated hydroxytoluene (BHT) as an antioxidant. FA methyl esters were
prepared using 10% boron trifluoride in methanol, and extracted into hexane. They were
analysed by gas chromatography using a polar capillary column coated with 50%
cyanopropyl polysiloxane (0.25 µm film thickness; J&W DB-23, Folsom, California).
Further details of the laboratory protocol are given in Chapter 3.
5.2.3 QFASA model
The diets of individual sea lions were estimated using the model described by Iverson et
al. (2004), and the FA library of prey from the Auckland Islands region (Chapter 4).
The model takes the mean FA profiles of each prey species in the prey library, and
estimates the mixture of prey FA profiles that comes the closest to match the FA profile

Chapter 5 – QFASA on by-caught NZ sea lions
92
of the predator’s adipose tissue. Then, the best mixture is weighted by the fat content of
each prey species, and translated into a diet estimate (percentage mass).
Therefore, in addition to the FA profile of the predator’s adipose tissue, QFASA
requires:
1. An optimisation model
2. CCs to take into account lipid metabolism occurring in the predator
and 3. A FA library of potential prey and their lipid content
to estimate the diet of a predator.
5.2.3.1 Optimisation model
The predicted FA profile Ŝy of the predator’s adipose tissue y is calculated as:
= ∑
=
n
iiiy Sp
1
S (from Iverson et al. 2004) [Eq. 1]
With pi, proportion of prey i; Si, FA profile of prey i; n, number of prey. The
optimisation process chooses p such as Ŝy is the closest solution to Sy (true FA profile of
y). The distance minimised between Sy and Ŝy is the Kullback-Liebler (KL) distance
calculated over all FAs as:
−=∑
= jy
jym
jjyjy
S
SSSKL
ˆlog)ˆ(
1
(from Iverson et al. 2004) [Eq. 2]
With Sy j, true value of FA j of predator y; Ŝy j, predicted value of FA j of predator y; m,
number of FAs. KL values given in the outputs are an indication of fit as the
optimisation minimises this value. The optimisation uses a quasi-Newton algorithm
with a BFGS (Broyden-Fletcher-Goldfarb-Shanno) formula, and was carried out with a
package developed at Massey University (Fatty acid solution, R. Sherriff & P.C.H.
Morel). Results given by this package were verified with the package Fascalc (Fascalc v
1.11, M.J.Walton, SMRU, University of St Andrews, UK).
5.2.3.2 Calibration coefficients CCs
CCs account for the differential deposition and synthesis of FA during lipid metabolism
occurring in the predator’s adipose tissue. CCs were determined from experiments in
Chapter 5 – QFASA on by-caught NZ sea lions
93
which captive seals were fed on diets of know FA compositions. To date, they are
available for several pinniped species (Iverson et al. 2004; Cooper et al. 2005; Tollit et
al. 2006; D.Tollit unpubl. data), mink Mustela vison (Iverson et al. 2006) and common
murre Uria aalge (Iverson et al. 2007). Before the optimisation starts, Sy is divided by
CCs for each FA j and renormalised to sum 100%.
5.2.3.3 FA library of potential prey
The prey library is composed of fish and cephalopods known to be significant prey of
NZ sea lions in the Auckland Islands region by previous stomach content and faeces
analyses (Childerhouse et al. 2001; Chapter 2). They include hoki Macruronus
novaezelandiae (n = 11), javelin fish Lepidorhynchus denticulatus (n = 10, representing
the rattail group, i.e., Macrouridae), opalfish Hemerocoetes spp (n = 10), red cod
Pseudophycis bachus (n = 10), arrow squid (n = 10) and octopus Enteroctopus
zealandicus (n = 7). Scampi Metanephrops challengeri (a crustacean, n = 6) and spiny
dogfish Squalus acanthias (a cartilaginous fish, n = 2) were added as potential prey,
since they are abundant in the area where sea lions forage (Jacob et al. 1998; O'Driscoll
et al. 2003). They were not reported as prey from traditional methods, probably because
they are likely to digest quickly in the gut after ingestion, due to the absence of parts
hard enough to resist digestive juices. All specimens were collected around the
Auckland Islands from December to April between 2004 and 2007, and their FA
profiles and fat contents were previously analysed (Chapter 4).
5.2.4 Sensitivity analysis of QFASA
5.2.4.1 Redefinition of prey groups
The first part of the validation procedure for QFASA is to check that the model can
correctly identify individual prey. For this, FA profiles of individual prey (Chapter 4)
were entered as predators in the model, and were compared to mixtures of prey FA
profiles computed by the model. Opalfish and octopus displayed a high diversity of FA
profiles (Chapter 4), thus I expected some misclassification for these species by the
QFASA model. Groups of prey were redefined by splitting octopus (seven individuals
in total) into two groups, and by deleting three individuals in the opalfish group (ten in
total) for which FA profiles were greatly different from that of the seven remaining

Chapter 5 – QFASA on by-caught NZ sea lions
94
opalfish (Chapter 4). Proportions of prey species were predicted in a new model
simulation with the mean of redefined prey groups.
5.2.4.2 Optimisation of model parameters
The optimisation involved the variation of three parameters: the FA set (1), the CC set
(2), and the account of prey individual variability or not (3). (1) Two sets of FAs were
used: The first set of 27 FAs includes all FAs in common between prey and blubber
samples (list of FAs in Table 3-2 of Chapter 3 minus 18:4n-3, 20:4n-3 and 22:4n-6).
FAs 15:0, 14:1, 15:1 and 18:1n-5 had a minor contribution to the total mass, and were
removed to create a second set of 23 FAs. Deletion of these FAs generally improves the
results obtained from the QFASA model (Iverson et al. 2004; Nordstrom et al. 2008).
(2) For each FA set, QFASA was tested with different CCs available in the literature for
the blubber of pinnipeds. Six “scenarios” were applied for this study: no CCs, CCs from
grey seals Halichoerus grypus fed on herring Clupea harengus (Iverson et al. 2004;
named CCs-GS/her), CCs from harp seals Phoca groenlandica fed on herring (Iverson
et al. 2004; named CCs-HS/her), CCs from Steller sea lions Eumetopias jubatus fed on
pacific herring Clupea pallasii pallasii (D. Tollit, unpubl. data; named CCs-SSL/her),
CCs from Steller sea lions fed on eulachon Thaleichthys pacificus (D. Tollit, unpubl.
data; named CCs-SSL/eul), and CCs from Steller sea lions fed on a mixed diet (D.
Tollit, unpubl. data; named CCs-SSL/mix). The mixed diet consisted of 64% mass
herring, 15% eulachon, 14% squid and 7% rockfish (D. Tollit, unpubl. data). (3) For
each set of FAs and CCs applied, prey individual variability was considered by taking
each prey individual as a prey group to compute the different mixtures of prey FA
profiles. Thus, instead of computing FA profiles from nine prey groups (eight different
prey with octopus divided into two groups), the model computed FA profiles from 63
“groups” (total of individuals in the prey library).
The distributions of KL values for each simulation were compared (Wilcoxon signed
ranks tests between two simulations, Friedman tests between three and more
simulations). Since KL is the distance minimised by the model, the parameters with the
lowest distribution of KL values were considered optimal and were kept to estimate the
diet of NZ sea lions from blubber FA profiles.

Chapter 5 – QFASA on by-caught NZ sea lions
95
5.2.4.3 Diet estimates of by-caught NZ sea lions using QFASA
From the sensitivity analysis carried out previously, the optimal scenario was used to
determine diet estimates of NZ sea lions from QFASA on blubber FA profiles. Diet
estimates were compared between LFs, NLFs and males (M), and between years. These
groups were tested for significant variation of mass percentage by Kruskall-Wallis (K-
W) tests. The QFASA estimate for all combined sea lions was compared with the mass
percentages of the digested fraction of the stomachs (data in Chapter 2), believed to be a
better representation of the short-term diet of by-caught NZ sea lions (Chapter 2).
All statistical tests have an α level of statistical significance of 0.05.
5.3 RESULTS
Eighty two whole blubber cores were analysed from 51 female and 31 male sea lions
by-caught annually between February and May from 2000 to 2006 (Table 5-1). The sex
categories were not all represented within the last two years, thus 2005 and 2006 were
pooled for K-W tests.
Table 5-1. Number of lactating female (LF), non-lactating female (NLF), and male (M) New Zealand sea lions analysed per year. Year Lactating
females Non-lactating
females Males
Total
2000 6 2 8 16 2001 6 2 8 16 2002 8 1 5 14 2003 2 4 5 11 2004 2 6 4 12 2005 3 1 4 2006 1 8 9 Total 28 23 31 82
5.3.1 Sensitivity analysis of QFASA
5.3.1.1 Redefinition of prey groups
Most individual prey were correctly classified to the prey species they belong to: FA
profiles of arrow squid, hoki, javelin fish, scampi and dogfish were well identified at >
90% (Fig. 5-1a). Red cod, opalfish and octopus had a correct classification percentage

Chapter 5 – QFASA on by-caught NZ sea lions
96
of 85%, 74% and 51% respectively. After redefinition of groups of opalfish and
octopus, only octopus and red cod fell into < 90% of correct classification: 11% of
octopus 1 were misclassified as opalfish, and the same amount of red cod were
misclassified as octopus 2 (Fig. 5-1b). Although the correct classification of red cod
0%
20%
40%
60%
80%
100%
arrowsquid
hoki javelinfish
red cod opalfish octopus scampi dogfish
hoki
scampi scampi
opalfish
(a)
(b)
0%
20%
40%
60%
80%
100%
arrowsquid
hoki javelinfish
red cod opalfish octopus1 octopus2 scampi dogfish
octopus 2
opalfish
octopus
Figure 5-1. Mean predicted proportions of prey species by quantitative fatty acid signature analysis. Fatty acid profiles of prey individuals were entered as predators in the model and were compared to different mixtures of fatty acid profiles of (a) original mean prey species and (b) of redefined mean prey species (see results). The correct mean classification percentage is in grey. White parts represent the percentage of misclassification, with the prey species leading to the main misclassifications in bold. For instance, in histogram (a), approximately 20% of opalfish were misclassified as scampi and hoki.

Chapter 5 – QFASA on by-caught NZ sea lions
97
was only 71% with the redefined prey groups instead of 85% with the original groups
(Fig. 5-1), the overall correct classification had improved, therefore redefined prey
groups were kept for the next steps of the sensitivity analysis when mean prey is
applied.
5.3.1.2 Optimisation of model parameters
The distribution of KL values varied greatly between simulations with a minimal value
of 0.8 (23 FAs, individual prey, CCs-SSL/her) and a maximal value of 53.7 (27 FAs,
mean prey, CCs-GS/her) (Table 5-2). To visualise the meaning of these values,
predicted and true FA profiles of some individual sea lions were represented in Fig. 5-2
with different KL values. The predicted FA profile of the sea lion with a KL value of
0.8 matched closely with the true FA profile, whereas large differences are visible
between the predicted and true percentages of FAs for the sea lion with a KL value of
53.7 (Fig. 5-2). Simulations using 23 FAs gave median KL values that were up to 15%
lower than those with 27 FAs (Table 5-2; Wilcoxon signed ranks tests, P < 0.01).
Likewise, simulations using FA profiles of individual prey showed lower KL values
than with those using mean profiles (Wilcoxon signed ranks tests, P < 0.01). KL values
calculated using CCs-SSL/her were significantly lower than those using other CC
scenarios, irrespective of the other parameters chosen (Friedman tests, P < 0.01; post-
hoc Wilcoxon signed ranks tests, P < 0.01) (Table 5-2). The variation of KL values
between the CCs scenarios was important, with a factor of four to five times between
values (Table 5-2).
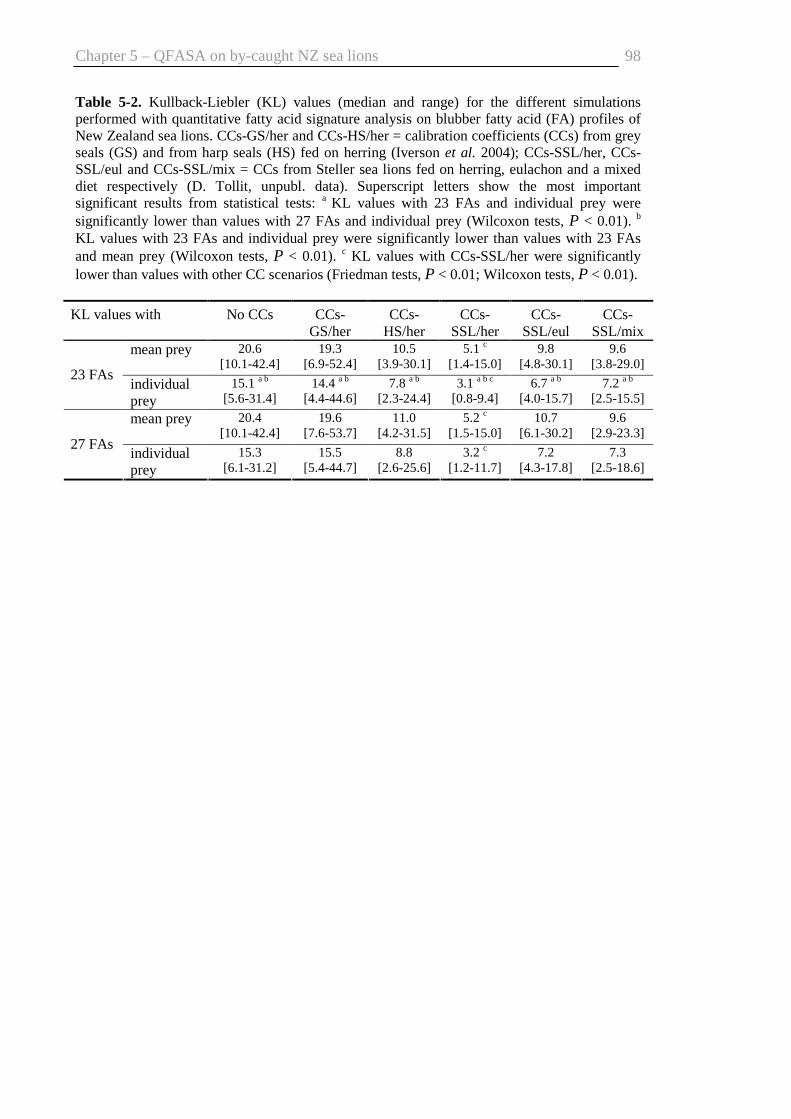
Chapter 5 – QFASA on by-caught NZ sea lions
98
Table 5-2. Kullback-Liebler (KL) values (median and range) for the different simulations performed with quantitative fatty acid signature analysis on blubber fatty acid (FA) profiles of New Zealand sea lions. CCs-GS/her and CCs-HS/her = calibration coefficients (CCs) from grey seals (GS) and from harp seals (HS) fed on herring (Iverson et al. 2004); CCs-SSL/her, CCs-SSL/eul and CCs-SSL/mix = CCs from Steller sea lions fed on herring, eulachon and a mixed diet respectively (D. Tollit, unpubl. data). Superscript letters show the most important significant results from statistical tests: a KL values with 23 FAs and individual prey were significantly lower than values with 27 FAs and individual prey (Wilcoxon tests, P < 0.01). b
KL values with 23 FAs and individual prey were significantly lower than values with 23 FAs and mean prey (Wilcoxon tests, P < 0.01). c KL values with CCs-SSL/her were significantly lower than values with other CC scenarios (Friedman tests, P < 0.01; Wilcoxon tests, P < 0.01).
KL values with No CCs CCs-GS/her
CCs-HS/her
CCs-SSL/her
CCs-SSL/eul
CCs-SSL/mix
mean prey 20.6 [10.1-42.4]
19.3 [6.9-52.4]
10.5 [3.9-30.1]
5.1 c [1.4-15.0]
9.8 [4.8-30.1]
9.6 [3.8-29.0]
23 FAs individual prey
15.1 a b
[5.6-31.4] 14.4 a b
[4.4-44.6] 7.8 a b
[2.3-24.4] 3.1 a b c
[0.8-9.4] 6.7 a b
[4.0-15.7] 7.2 a b
[2.5-15.5]
mean prey 20.4 [10.1-42.4]
19.6 [7.6-53.7]
11.0 [4.2-31.5]
5.2 c
[1.5-15.0] 10.7
[6.1-30.2] 9.6
[2.9-23.3] 27 FAs
individual prey
15.3 [6.1-31.2]
15.5 [5.4-44.7]
8.8 [2.6-25.6]
3.2 c [1.2-11.7]
7.2 [4.3-17.8]
7.3 [2.5-18.6]

Chapter 5 – QFASA on by-caught NZ sea lions
99
To observe the consequences of different CCs on diet estimated by QFASA, the
percentages of prey from the simulations with 23 FAs, individual prey, and the different
CC scenarios were presented in Fig. 5-3. When no lipid metabolism is taking into
account (no CCs), the model predicted 70% by mass of rattails in the diet with a median
KL value of 15.1 (Fig. 5-3, Table 5-2). The high dominance of rattails (> 70% by mass)
was also found with the CCs from Steller sea lions fed on eulachon and mixed diet (Fig.
5-3), whereas the model estimated a diet with several major prey species when the CCs
from Steller sea lions fed on herring (CCs-SSL/her) and the CCs from phocids (grey
and harp seals) were applied.
In summary, the simulation showing the lowest KL values was with 23 FAs, individual
prey and CCs-SSL/her. These parameters were considered optimal and were used in
further simulations to estimate the diet of NZ sea lions by QFASA.
Figure 5-2. Examples of predicted fatty acid profiles (in dotted line) by quantitative fatty acid signature analysis versus true fatty acid profiles (in solid line) of New Zealand sea lions, with different Kullback-Liebler (KL) values. Kullback-Liebler is the mathematical distance minimised by the model

Chapter 5 – QFASA on by-caught NZ sea lions
100
5.3.2 Diet estimates of by-caught NZ sea lions using QFASA
Overall, arrow squid, hoki, rattails and red cod made up the bulk of the diet estimated
by QFASA, with > 80% mean mass, and were present in more than half the samples
(Table 5-3). Arrow squid was the most important prey (median of 28% mass) followed
by rattails and hoki (median of 27 and 10% mass respectively). Scampi, octopus and
spiny dogfish were considered minor prey by the model with mean mass < 10%, while
opalfish was quasi-absent with a mass estimate for only four samples (Table 5-3).
The estimated diet of males was significantly different from that of females with a lower
contribution of hoki in their estimated diet (K-W test, H2, 82 = 7.96, P = 0.019; M-W
tests, P < 0.05), and a higher contribution of red cod (K-W test, H2, 82 = 7.81, P = 0.020;
M-W tests, P < 0.05) (Fig. 5-4). Estimated diets of by-caught lactating and non-
lactating females did not show any significant difference in their estimated diet (M-W
test, P > 0.05) (Fig. 5-4). Consequently, all females were grouped together to look at
diet differences between years.
0
10
20
30
40
50
60
70
80
90
no CCs CCs-GS/her CCs-HS/her CCs-SSL/her CCs-SSL/eul CCs-SSL/mix
per
cent
pre
y sp
ecie
s
arrow squid
hoki
rattails
red cod
octopus
Figure 5-3. Predicted proportions by mass (median) of prey species by quantitative fatty acid signature analysis on 82 blubbers of New Zealand sea lions using the parameters “23 FAs” and “individual prey” (see text) with different calibration coefficients (CCs): CCs-GS/her and CCs-HS/her = CCs from grey seals (GS) and from harp seals (HS) fed on herring (Iverson et al. 2004); CCs-SSL/her, CCs-SSL/eul and CCs-SSL/mix = CCs from Steller sea lions fed on herring, eulachon and a mixed diet respectively (D. Tollit, unpubl. data). The prey opalfish, scampi and spiny dogfish were deleted because their estimated proportions were nil or only in low percentage.
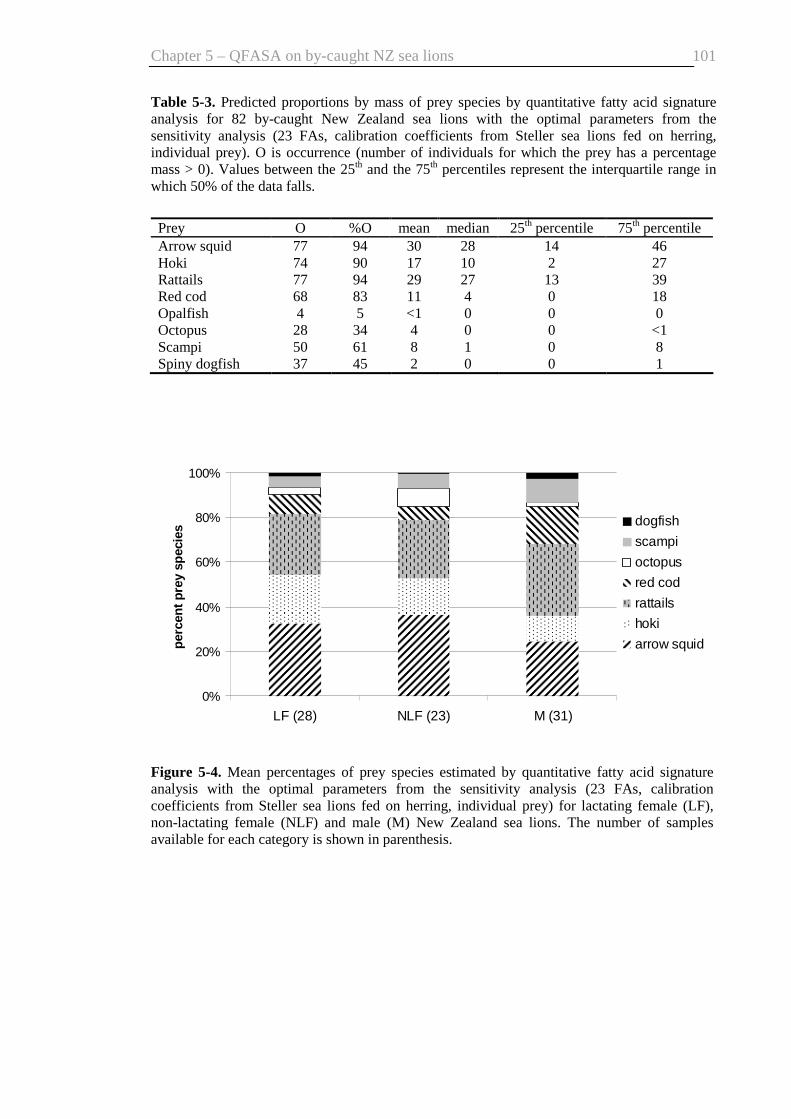
Chapter 5 – QFASA on by-caught NZ sea lions
101
Table 5-3. Predicted proportions by mass of prey species by quantitative fatty acid signature analysis for 82 by-caught New Zealand sea lions with the optimal parameters from the sensitivity analysis (23 FAs, calibration coefficients from Steller sea lions fed on herring, individual prey). O is occurrence (number of individuals for which the prey has a percentage mass > 0). Values between the 25th and the 75th percentiles represent the interquartile range in which 50% of the data falls.
Prey O %O mean median 25th percentile 75th percentile Arrow squid 77 94 30 28 14 46 Hoki 74 90 17 10 2 27 Rattails 77 94 29 27 13 39 Red cod 68 83 11 4 0 18 Opalfish 4 5 <1 0 0 0 Octopus 28 34 4 0 0 <1 Scampi 50 61 8 1 0 8 Spiny dogfish 37 45 2 0 0 1
0%
20%
40%
60%
80%
100%
LF (28) NLF (23) M (31)
per
cen
t p
rey
spec
ies dogfish
scampi
octopus
red cod
rattails
hoki
arrow squid
Figure 5-4. Mean percentages of prey species estimated by quantitative fatty acid signature analysis with the optimal parameters from the sensitivity analysis (23 FAs, calibration coefficients from Steller sea lions fed on herring, individual prey) for lactating female (LF), non-lactating female (NLF) and male (M) New Zealand sea lions. The number of samples available for each category is shown in parenthesis.
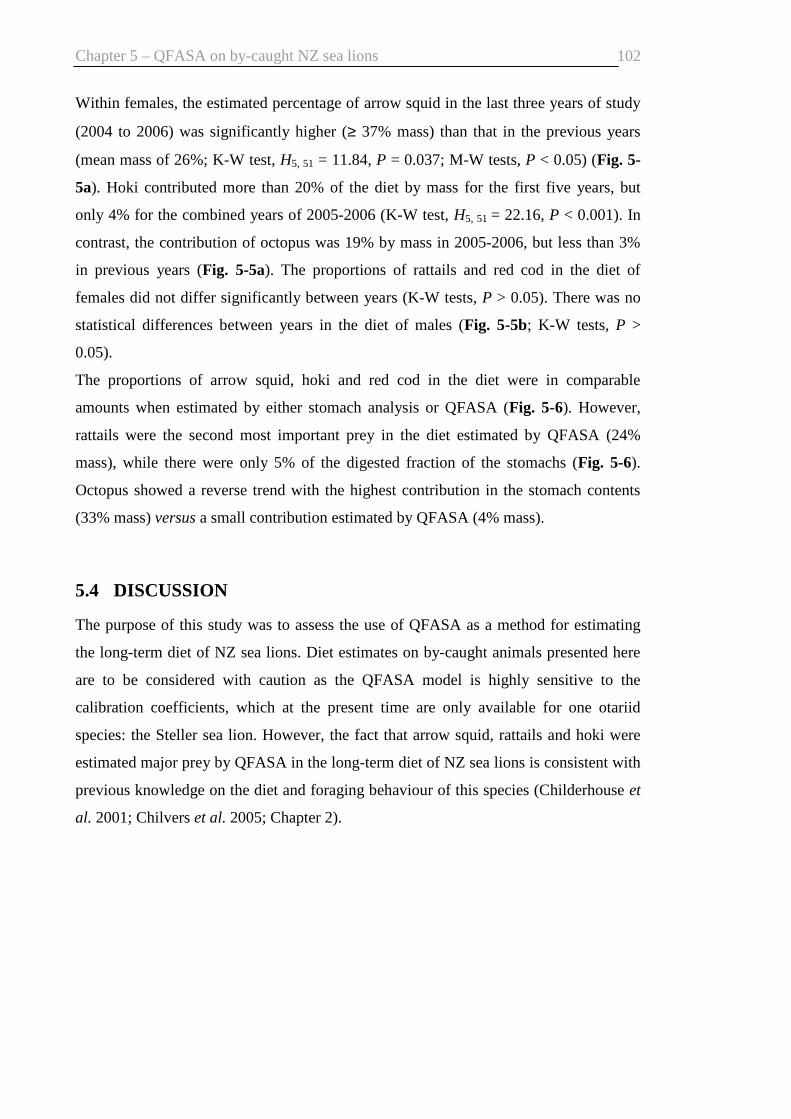
Chapter 5 – QFASA on by-caught NZ sea lions
102
Within females, the estimated percentage of arrow squid in the last three years of study
(2004 to 2006) was significantly higher (≥ 37% mass) than that in the previous years
(mean mass of 26%; K-W test, H5, 51 = 11.84, P = 0.037; M-W tests, P < 0.05) (Fig. 5-
5a). Hoki contributed more than 20% of the diet by mass for the first five years, but
only 4% for the combined years of 2005-2006 (K-W test, H5, 51 = 22.16, P < 0.001). In
contrast, the contribution of octopus was 19% by mass in 2005-2006, but less than 3%
in previous years (Fig. 5-5a). The proportions of rattails and red cod in the diet of
females did not differ significantly between years (K-W tests, P > 0.05). There was no
statistical differences between years in the diet of males (Fig. 5-5b; K-W tests, P >
0.05).
The proportions of arrow squid, hoki and red cod in the diet were in comparable
amounts when estimated by either stomach analysis or QFASA (Fig. 5-6). However,
rattails were the second most important prey in the diet estimated by QFASA (24%
mass), while there were only 5% of the digested fraction of the stomachs (Fig. 5-6).
Octopus showed a reverse trend with the highest contribution in the stomach contents
(33% mass) versus a small contribution estimated by QFASA (4% mass).
5.4 DISCUSSION
The purpose of this study was to assess the use of QFASA as a method for estimating
the long-term diet of NZ sea lions. Diet estimates on by-caught animals presented here
are to be considered with caution as the QFASA model is highly sensitive to the
calibration coefficients, which at the present time are only available for one otariid
species: the Steller sea lion. However, the fact that arrow squid, rattails and hoki were
estimated major prey by QFASA in the long-term diet of NZ sea lions is consistent with
previous knowledge on the diet and foraging behaviour of this species (Childerhouse et
al. 2001; Chilvers et al. 2005; Chapter 2).
Chapter 5 – QFASA on by-caught NZ sea lions
103
0%
20%
40%
60%
80%
100%
Y00 (8) Y01 (8) Y02 (9) Y03 (6) Y04 (8) Y056 (12)
per
cen
t p
rey
spec
ies
b) Males
a) Females
0%
20%
40%
60%
80%
100%
Y00 (8) Y01 (8) Y02 (5) Y03 (5) Y04 (4)
per
cen
t p
rey
spec
ies dogfish
scampi
octopus
red cod
rattails
hoki
arrow squid
Figure 5-5. Between-year percentages of prey species estimated by quantitative fatty acidsignature analysis with the optimal parameters from the sensitivity analysis (23 FAs, calibration coefficients from Steller sea lions fed on herring, individual prey) for female and male New Zealand sea lions. Years are noted Y00 for 2000, Y01 for 2001 etc…Years 2005 and 2006 were pooled (noted Y056). The number of samples available for each category is shown in parentheses.

Chapter 5 – QFASA on by-caught NZ sea lions
104
5.4.1 Sensitivity of QFASA
The reliability of QFASA lies in the quality and accuracy of the data that are entered in
the model. QFASA requires information on the FA profiles of the predator studied, the
FA profiles and fat contents of all potential prey (prey FA library), and an
understanding on the differential deposition of FAs in the predator’s adipose tissue
(expressed as CCs) (Iverson et al. 2004).
Blubber FA signatures will reflect dietary FAs if the adipose tissue sampled is actively
metabolising (Budge et al. 2006). The blubber analysed in this study, collected from the
sternum region, is thought to be a fat depot because its thickness in this area is
positively correlated with body mass (Massey University, unpubl. data).
The prey FA library is comprised of six species identified as common in the diet of NZ
sea lions from stomach analysis (arrow squid, hoki, javelin fish, red cod, opalfish and
octopus) (Chapter 2), and two species that are abundant in the Auckland Islands region
(scampi and spiny dogfish) (Jacob et al. 1998; O'Driscoll et al. 2003). However, it does
not include all potential prey of the NZ sea lions: barracouta Thyrsites atun, ling
Genypterus blacodes, jack mackerel Trachurus spp., warehou Seriolella spp., and the
wary squid Moroteuthis ingens are minor prey in the stomach contents (Chapter 2) and
were not included in the prey FA library due to a lack of material available for analysis.
0
5
10
15
20
25
30
35
arrowsquid
hoki rattails red cod opalfish octopus scampi spinydogfish
per
cen
t pre
y sp
ecie
s
QFASA
digested fraction of stomach
Figure 5-6. Diet estimates by percent mass of 82 by-caught New Zealand sea lions from quantitative fatty acid signature analysis (this study) and stomach analysis (digested fraction; Chapter 2).

Chapter 5 – QFASA on by-caught NZ sea lions
105
Nonetheless, they might be significant prey by mass in the long-term diet of sea lions
because they are common species in the waters of the Auckland Islands region (Jacob et
al. 1998; O'Driscoll et al. 2003). Thus, the addition of the species cited above in the
prey FA library will significantly improve the accuracy of the diet estimation of NZ sea
lions.
Once a prey library is acquired, a prerequisite of QFASA is the assessment of overlap
between FA profiles of prey species, and of FA variability within the same prey. The
regrouping of prey such as octopus (subdivision into two groups) and opalfish (removal
of some individuals) was necessary in this study as these benthic species showed a great
variation in their FA profiles (Chapter 4). This diminished the overall misclassification
of prey species (Fig. 5-1) with all prey groups except red cod at a correct classification
percentage of > 80%. However, the FA profiles of the individual prey gave better
optimisations (smaller KL medians) than the mean profiles of prey groups and were
preferred in this study for the estimation of the diet of NZ sea lions. Other studies using
QFASA included the prey species variability by resampling the prey library using a
bootstrap procedure (Iverson et al. 2004; Beck et al. 2007a). Yet, resampling mean FA
profiles of prey did not give any significant differences in KL values with no
resampling (L. Meynier unpubl. data), probably because the number of individual prey
available in each group was small.
Another prerequisite of QFASA is the accounting of lipid metabolism and deposition in
the predator’s adipose tissue, which is expressed by the CCs in the model. CCs are
certainly the most challenging parameter to obtain for QFASA, because they are
calculated from captive animals fed on a controlled diet for several months. Even if the
pattern of deposition is similar among marine species for which long-term diet studies
were carried out (Iverson et al. 2004; Iverson et al. 2006; Iverson et al. 2007;
Nordstrom et al. 2008), the CC for a particular FA seems to depend on the predator’s
taxum (i.e., otariidae, phocidae) or species considered (Iverson et al. 2004; Tollit et al.
2006), or even on the meals eaten by the same predator (D. Tollit, unpubl. data). This
study showed that the model was very sensitive to different sets of CCs, with diet
estimates switching from a high dominant species (> 70% mass) to several major
species depending on the CCs used (Fig. 5-3). I did not expect to see such strong
variation among CC sets from the Steller sea lion (herring, eulachon and mixed diet):
Indeed, while CCs from Steller sea lions fed on herring showed the best simulations,
diet estimates using CCs based on eulachon or mixed diets were comparable to the
Chapter 5 – QFASA on by-caught NZ sea lions
106
simulation without any consideration of lipid metabolism (no CCs). The better
performance of CCs on herring is perhaps due to the fact that this fish has a FA profile
closer to the mean FA profile of NZ sea lion prey than eulachon (Appendix 2) or a
mixed diet does (for which a single FA profile is hard to estimate). The lipid content of
herring (9.9 ± 2.8%) is however higher than the common prey of the NZ sea lions
(overall mean of 4.2 ± 2.5%; Chapter 4). Besides FA composition, the lipid content of
food plays a role in the metabolism and deposition of FAs (e.g., Summers et al. 2000;
Cooper et al. 2005). One may expect that CCs calculated from sea lions fed on a species
with a close FA composition, and also a lipid content similar to that of NZ sea lion prey,
would give better diet estimates. Such feeding experiments in the future would greatly
improve the QFASA application on NZ sea lions.
5.4.2 Overall diet estimate and feeding ecology
Among the eight potential prey species that QFASA computed, arrow squid, rattails,
hoki, and red cod were estimated to be the major prey in the diet of by-caught NZ sea
lions during the first half of the lactating period (January to May) (Table 5-3).
Significant variation in diet estimates was found between sexes (Fig. 5-4) and between
years (Fig. 5-5). The diet estimate of all sea lions was compared with the stomach
contents of the same animals analysed previously (Chapter 2). Since stomach analysis
and QFASA are associated with different time frames of diet inference (several months
versus several days), individual diet estimates from both methods were not compared,
and variation between overall diet estimates was not tested statistically. Both methods
estimated that arrow squid and hoki are major prey in the diet (Fig. 5-6), but gave
different proportions of rattails (more with QFASA) and octopus (less with QFASA).
An overestimation of the cephalopod contribution by the stomach analysis is expected
because beaks tend to accumulate in the stomach (Bigg and Fawcett 1985; Yonezaki et
al. 2003). This is consistent with the large contribution of octopus in stomach contents
in comparison to the small amount estimated by QFASA (Fig. 5-6). Yet, this pattern
does not appear for arrow squid, and this is probably due to the fact that arrow squid
found in stomachs were mostly fresh (Chapter 2), thus not contributing to the digested
fraction, which is used here for comparison. QFASA also considered as prey some taxa
not present in the stomachs (scampi and spiny dogfish) although their contribution was
low (Fig. 5-6).

Chapter 5 – QFASA on by-caught NZ sea lions
107
Rattail fishes (Macrouridae) and hoki are demersal species, living in abundance on the
shelf slope from 200 m deep to > 1000 m (Beentjes et al. 2002; MinistryFisheries
2007). Arrow squid is present from the surface to 500 m, but large amounts occur at
depths > 250 m (Jackson et al. 2000). In Chapter 2, I suggested the importance of the
edge of the Auckland Islands shelf as a feeding ground where arrow squid and rattails
are found in abundance. The fact that arrow squid, rattails and hoki were estimated to be
major prey by QFASA emphasises this previous result over a longer time frame, and are
in agreement with the known foraging behaviour of lactating females at the beginning
of the lactation period (Chilvers et al. 2005). Thus, the slopes of the Auckland Islands
shelf are key foraging areas for NZ sea lions, not only after the breeding season
(Chilvers et al. 2005), but probably for the first half of the nursing period. This area is
likely to provide concentrated food where animals can optimise their energy investment
per foraging trip.
5.4.3 Diet estimates of males and females
In Chapter 3, FA profiles of NZ sea lions were differentiated between sexes, while they
were similar between LFs and NLFs. As QFASA used these FA profiles to compute diet
estimates, it is logical to find similar trends in this study (Fig. 5-4). Also in Chapter 3, I
found that the most important FAs driving the segregation between sexes were 20:1n-9
and 22:1n-11 in higher proportions in females, and 16:3n-4 in higher proportions in
males. The monounsaturated 20 and 22 carbon-FAs are biomarkers of zooplankton, and
were found in relative high amounts in hoki and javelin (a rattail species) (Chapter 4).
Accordingly, the QFASA model estimated more hoki in the diet of by-caught females
(Fig. 5-4). However, 16:3n-4 is correlated with the deep bottom-living scampi and some
octopus (Chapter 4). I did not test statistically the variation of these species between the
genders as their estimated occurrence was weak, but the expected trend of more scampi
and octopus in the diet of males is not visible in Fig. 5-4. Besides, red cod is a benthic
prey occurring both in shallow and deep areas and was found in higher contribution in
the diet of males. Therefore, from the QFASA results, I could not conclude that male
NZ sea lions forage preferentially in deeper areas than females do, as it has been
hypothesised in Chapter 3.
The higher contribution of hoki in the diet of by-caught females could be energetically
advantageous, since hoki available at the Auckland Islands during summer are large fish

Chapter 5 – QFASA on by-caught NZ sea lions
108
of > 1kg with moderate energy content (6.0 to 8.3 kJ g-1; Chapter 4). The other prey
with a greater mass is the octopus but its lipid, protein, and energy contents are low
(Chapter 4). I must stress that these gender differences prevail if most of the FA
variation comes from diet. Part of the FA variation between sexes is likely to originate
from differential metabolism and deposition of ingested FAs into adipose tissue. This
was not considered in the QFASA model because the same CCs were applied to all
individuals. Hence, it is difficult to conclude on the long-term diet of male and females
NZ sea lions without foraging and diving data from males. To date, these data are only
available for lactating NZ sea lions foraging around the Auckland Islands (Chilvers et
al. 2005, 2006).
5.4.4 Between-year variation in the diet estimates
Within females, diet variation involved mostly differences between the combined years
2005-2006 and the previous years (Fig. 5-5a). Only one male was available in 2005-
2006, thus it is not possible to check if this trend was shared by males. QFASA
indicated a greater contribution of arrow squid and a lesser contribution of hoki in 2005-
2006 (Fig. 5-5a). Differential metabolism between years, arising from animals in
different body condition, might play a role in the temporal variation of FA profiles.
However in Chapter 3, I remarked that the difference in body condition between
individuals from different years was not enough to explain the FA variation, and
concluded that diet must play a significant role. NZ sea lions are considered generalist
predators (Lalas 1997; McMahon et al. 1999; Childerhouse et al. 2001; Chapter 2), and
temporal variation in the diet is generally attributed to a change in prey availability.
Abundance of marine species in the NZ subantarctic is not available, but reported
commercial catches of hoki and arrow squid can be used as a proxi of variation in
abundance. Estimated catches of hoki in 2005 and 2006 in the subantarctics were the
lowest reported since 1989, whereas the amount of arrow squid harvested each year in
2004 to 2006 from the Auckland Islands region (named SQU6T) was higher than the
amount harvested in the previous three years (Ministry of Fisheries 2007). These
reported catches correlate well with the trends of mass percentages estimated by the
QFASA model (Fig. 5-7), suggesting that diet plays a significant role in the FA
variation between years.

Chapter 5 – QFASA on by-caught NZ sea lions
109
5.5 CONCLUSION
QFASA has been used to provide long-term estimates of diet on several marine species
(Iverson et al. 2006; Beck et al. 2007a; Iverson et al. 2007). Nevertheless, the necessity
for CCs which take into account FA metabolism in the predator, presently limits the use
of this method to a narrow range of species. This study tested QFASA on by-caught NZ
sea lions, and showed the importance of suitable CCs in the estimation of the diet by
QFASA. The predicted diets of males and females should be taken with care as QFASA
did not take into account the possible differential FA metabolism between sexes.
However, the overall predictions were partly in agreement with stomach contents, and
the variation estimated between years was highly correlated with the trends of
commercial catches, giving some confidence in the present QFASA predictions.
Arrow squid, hoki and rattails were estimated to have large contributions by mass in the
long-term diet of NZ sea lions. They are all demersal species found mainly at depths >
200m, being harvested by sea lions on the slopes of the Auckland Islands shelf. This
area was shown to be a foraging ground for lactating sea lions just after the breeding
season (Chilvers et al. 2005). This study suggests that the slopes are visited regularly
during the first half of the lactating period. Future studies with a better understanding of
0
5000
10000
15000
20000
25000
30000
35000
Y00 Y01 Y02 Y03 Y04 Y05 Y06
Est
imat
ed c
om
mer
cial
cat
ches
(t)
0
10
20
30
40
50
60 prey co
ntrib
utio
n in
the d
iet (% m
ass)
H catches
H % mass
AS catches
AS % mass
RC % massRC catches
Figure 5-7. Estimated commercial catches of hoki Macruronus novaezelandiae (H), arrow squid Nototodarus sloani (AS), and red cod Pseudophycis bacchus (RC) per year in comparison with the estimated proportions of these species in the diet of New Zealand sea lions. Catches of hoki were for the region “HOK1 subantarctics”, catches of arrow squid for the region “SQU6T” (Auckland Islands), and catches of red cod for “RCO3” (east of NZ south island and subantarctics).
Chapter 5 – QFASA on by-caught NZ sea lions
110
FA metabolism on otariids and a greater prey library will improve the reliability of
QFASA on sea lions.
Acknowledgements
NZ sea lions were necropsied at Massey University under contracts with the
Conservation Service Levies Providers, administrated by the Department of
Conservation and the Ministry of Fisheries, NZ. I thank observers who collected the
carcasses as well as people who have assisted with the necropsies over the past ten
years. Special thanks to R. Galois (Ifremer, France), M. Walton (SMRU, UK) and M.
Reynolds (Fonterra, NZ) for their advice on fatty acid analysis. Thanks to L. Donaldson
who extracted the lipids of the samples collected in 2005 and 2006. For the QFASA
model, I am grateful to M. Walton who provided the programme Fascalc, and to D.
Tollit (UBC, Canada) who provided the calibration coefficients calculated for Steller
sea lions. R. Sherriff (Brimble Sherriff Young Limited, NZ) programmed the
optimisation model for Massey University. This project was sponsored by Lewis Fitch
Research Fund, Massey University Research Fund, the Whale and Dolphin Adoption
Project, the Department of Conservation and the NZ Ministry of Fisheries.

6 CHAPTER 6
FORAGING DIVERSITY IN LACTATING NEW ZEALAND
SEA LIONS: INSIGHT FROM QUALITATIVE AND
QUANTITATIVE FATTY ACID SIGNATURE ANALYSIS
Photo: the “New Zealand sea lion team” weighing a female sea lion under anaesthesia at Sandy Bay, Enderby Island, Auckland Islands

Chapter 6 – QFASA on biopsied NZ sea lions
112
Abstract
Lactating NZ sea lions Phocarctos hookeri exhibit different foraging strategies at the
Auckland Islands (50°41'S, 166°E) shelf, which may be the result of niche
specialisation. The purpose of this study was to examine the fatty acid (FA)
composition of lactating NZ sea lions, to estimate their diet by quantitative FA signature
analysis (QFASA), and to determine if variation in FAs exists between foraging
strategies and years. FAs were analysed from the blubber of 78 lactating NZ sea lions
captured at Enderby Island, Auckland Islands, between 2000 and 2003 and in 2005,
during the first month of the lactation period. FA profiles revealed distinct separation
between years (ANOVAs on principal components, P < 0.05), but not between foraging
patterns, thus this study does not support the hypothesis of a niche specialisation
between the different foraging strategies displayed by lactating NZ sea lions. The long-
term diet estimated by QFASA mainly consisted of rattails Macrouridae (30% median
mass) and hoki Macruronus novaezelandiae (26% median mass), followed by red cod
Pseudophycis bachus (11% median mass) and arrow squid Nototodarus sloani (49%
median mass). My findings suggest that most of the energy intake during a foraging trip
take place on the slopes where large fish gather in abundance at depths > 200m.
Comparison of diet estimates from QFASA between the females studied herein and
females by-caught by the squid fishery later in the lactation period suggest that females
change their fish diet to a more squid-based diet in autumn when arrow squid gather in
the area to spawn. Although QFASA is at its early development and uncertainties
remain on the reliability of calibration coefficients (CCs) used, estimates of arrow squid
proportions in the diet followed the same trend as the reported arrow squid catches since
2000.

Chapter 6 – QFASA on biopsied NZ sea lions
113
6.1 INTRODUCTION
Female New Zealand (NZ) sea lions (Phocarctos hookeri) display a “central place
foraging” strategy during lactation because they are restrained in foraging range by the
need to regularly nurse their pup on land (Orians and Pearson 1979). If resources are
limited or unpredictable in the foraging range of female otariids, individuals may
develop feeding specialisations to reduce intra-specific competition for food and
maximise energy intake (Polis 1984; Schoener 1986). NZ sea lions have a restricted
breeding range with 86% of the pups being born at the Auckland Islands (50°41'S,
166°E) (Chilvers et al. 2007b). During the beginning of the lactation period (austral
summer), lactating NZ sea lions exhibit different diving patterns (Chilvers et al. 2006)
depending on the region of the Auckland Islands shelf they exploit during their foraging
trips, which may be the consequence of feeding specializations (Chilvers and Wilkinson
2009). Chilvers and Wilkinson (2009) classified females as benthic divers and
mesopelagic divers. Benthic divers travel northeast from the breeding site, and make
consecutive dives at similar depths on the Auckland Islands shelf, while mesopelagic
divers travel north/northwest from the breeding site and make most of their dives at
deeper and variable depths at the edges of the shelf (Fig. 6-1). Since the shelf and the
shelf edges host different prey communities, it is expected that benthic divers and
mesopelagic divers would forage on different prey. Previous diet studies using stomach
contents and scat samples showed that NZ sea lions feed on benthic neritic prey such as
octopus (Enteroctopus zealandicus) and opalfish (Hemerocoetes spp.), and on deep-
living oceanic species such as rattail (Macrouridae) and hoki (Macruronus
novaezelandiae) (Childerhouse et al. 2001; Chapter 2). Therefore, I would expect that
the benthic prey octopus and opalfish would contribute in higher proportions to the diet
of benthic divers than to that of mesopelagic divers, while the demersal prey rattail and
hoki would be in greater proportions in the diet of mesopelagic divers. In the present
study, I propose to test this hypothesis by fatty acid (FA) analysis on females for which
the foraging area on the Auckland Islands shelf and/or the diving pattern is known.
Furthermore, the long-term diet of female NZ sea lions has already been investigated
with quantitative fatty acid signature analysis (QFASA) on blubber from animals by-
caught in the sub-Antarctic arrow squid (Nototodarus sloani) fishery (Chapter 5), but it
is not known if the diet of by-caught lactating females is representative of the diet of
lactating females at the population level, or if these by-caught individuals developed a
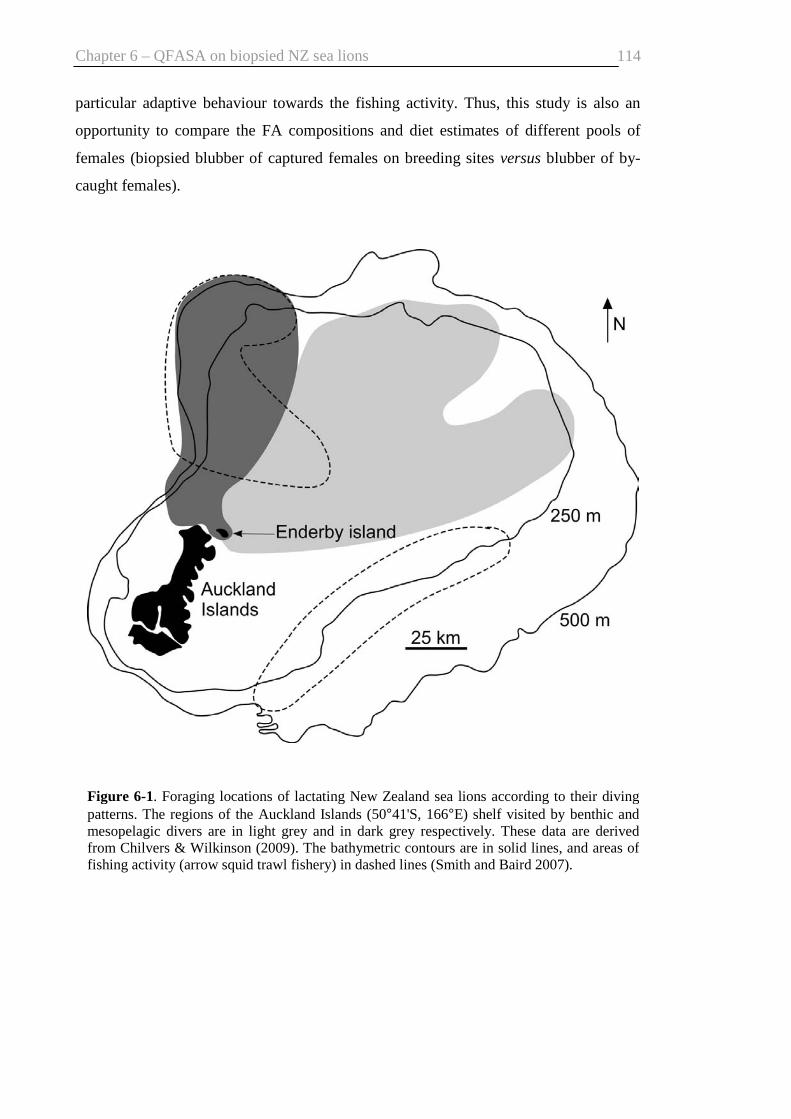
Chapter 6 – QFASA on biopsied NZ sea lions
114
particular adaptive behaviour towards the fishing activity. Thus, this study is also an
opportunity to compare the FA compositions and diet estimates of different pools of
females (biopsied blubber of captured females on breeding sites versus blubber of by-
caught females).
Figure 6-1. Foraging locations of lactating New Zealand sea lions according to their diving patterns. The regions of the Auckland Islands (50°41'S, 166°E) shelf visited by benthic and mesopelagic divers are in light grey and in dark grey respectively. These data are derived from Chilvers & Wilkinson (2009). The bathymetric contours are in solid lines, and areas of fishing activity (arrow squid trawl fishery) in dashed lines (Smith and Baird 2007).

Chapter 6 – QFASA on biopsied NZ sea lions
115
FA analysis has been used extensively to assess diet variation between groups of
individuals in various species of pinnipeds (e.g., Iverson et al. 1997a; Brown and Pierce
1998; Käkelä and Hyvärinen 1998; Walton et al. 2000; Lea et al. 2002a; Bradshaw et
al. 2003; Grahl-Nielsen et al. 2005; Staniland and Pond 2005; Beck et al. 2007b). FAs
undergo predictable biochemical change when deposited in the predator’s adipose tissue
(e.g., Summers et al. 2000; Iverson et al. 2004), and have the potential to reflect dietary
intake over several weeks to months depending on the tissue turnover (e.g., Kirsch et al.
1998; Kirsch et al. 2000; Iverson et al. 2004; Cooper et al. 2005). QFASA allows the
estimation of the contribution by mass of potential prey in the diet of the predator by
applying a model minimising a mathematical distance between the FA profiles of the
predator and potential prey (Iverson et al. 2004; Iverson et al. 2006; Beck et al. 2007a;
Iverson et al. 2007; Chapter 5).
In the present study, I first investigate the FA composition of the blubber of lactating
NZ sea lions captured at the Auckland Islands, and assess the FA variation between
years and between females displaying different diving patterns. Second, the overall diet
and the diet between groups are estimated by QFASA. Third, the overall FA
composition and diet estimates of females are compared with the FA profiles and diet
estimates of by-caught females analysed previously (Chapter 3, Chapter 5).
6.2 MATERIALS AND METHODS
6.2.1 Sample collection
Lactating NZ sea lions were captured at Sandy Bay, Enderby Island, Auckland Islands
(50°30’S, 166°17’E) (Fig. 6-1) in January of 2000 to 2003 and 2005. The Sandy Bay
colony is the second largest breeding colony for NZ sea lions, with approximately 400
pups born per year (Chilvers et al. 2007b). Females were anaesthetised following
standard procedures detailed in previous studies (Gales and Mattlin 1997; Costa and
Gales 2000; Chilvers et al. 2005, 2006). Blubber was biopsied from females by
scrubbing the posterior flank (dorso-lateral lumbar region) with surgical disinfectant
and making a 10 mm incision in the skin using a sterile scalpel. A core was sampled
through the full depth of the blubber layer excluding the skin, wrapped in aluminium
foil, transferred into a 2 mL cryovial and stored at –196°C in liquid nitrogen. On return
from the field, blubber samples were stored at –80°C until analysed.
Chapter 6 – QFASA on biopsied NZ sea lions
116
Stratification has been shown to occur in the blubber of NZ sea lions (Donaldson et al.
unpubl. data). Inner blubber is believed to be more metabolically active than the outer
blubber, reflecting recent dietary FA intake (Olsen and Grahl-Nielsen 2003; Grahl-
Nielsen et al. 2005). I chose to analyse the full blubber core in this study because it
provides the long-term integration of dietary FAs (Iverson et al. 2004).
Previous studies assessed the foraging and diving behaviours of some of the females
from which blubber samples were collected: Satellite tags and time-depth recorders
were fitted to captured lactating females during the summers of 2003 and 2004, while
satellite tags only were attached during the summers of 2001, 2002 and 2005 (Chilvers
et al. 2005, 2006). Depending on the foraging location used, females exhibited different
diving patterns and were categorised benthic divers or mesopelagic divers (Chilvers and
Wilkinson 2009) (Fig. 6-1). For females tagged only with satellite devices, the diving
pattern was deduced from the foraging location used. Moreover, the blubber samples
analysed in a particular year could have been collected from a female which was fitted
with satellite and/or depth devices in a different year. Because females are returning to
the same foraging location from year to year (Chilvers 2008a), the diving pattern
observed during a particular summer would be representative of the diving patterns
displayed in the other years. For instance, some lactating females for which blubber was
analysed in 2000 were attributed a diving pattern from the satellite and/or depth
recorder information collected on these animals in 2001 and subsequent years.
6.2.2 Lipid analysis
Lipids from blubber were extracted following Folch et al. (1957). Briefly, lipids were
extracted in a mixture of 8:4:3 chloroform:methanol:saline water (v:v:v) containing
0.01% butylated hydroxytoluene (BHT) as an antioxidant. FA methyl esters were
prepared using 10% boron trifluoride in methanol, and extracted into hexane. They were
analysed by gas chromatography using a polar capillary column coated with 50%
cyanopropyl polysiloxane (0.25 µm film thickness; J&W DB-23, Folsom, California).
Further details of the laboratory protocol are given in Chapter 3.
Chapter 6 – QFASA on biopsied NZ sea lions
117
6.2.3 Statistical analysis
FAs were expressed as a percentage mass of total FAs. A combination of principal
component analysis (PCA) and discriminant function analysis (DFA) was used on
arcsine square-root transformed data to examine inter-annual differences in the FA
profiles of lactating NZ sea lions (MINITAB Release 15.1, MINITAB Inc. 2007 and
SPSS for windows® Release 16.0, SPSS Inc. 2007). An ANOVA was performed on the
principal components (PCs) to assess the effect of year. DFA requires that the number
of blubber samples per group of individuals exceeds the number of variables (FAs) to
minimise the heterogeneity of covariance matrices and to avoid overfitting (Budge et al.
2006). Therefore, the number of FAs was reduced by deleting the ones with the lowest
absolute loadings on the first three PCs. After re-normalisation of the FA percentages, a
linear DFA with cross validation was performed for the factor “year”. To avoid any
confounding effect between factors “year” and “diving pattern”, the FA differences
between diving patterns were explored only within each year for which both diving
profiles (benthic versus mesopelagic divers) were available. The small number of
females of known diving pattern per year (Table 6-1) precludes the use of multivariate
analyses or statistical tests. Last, FA profiles of biopsied females (this chapter) and of
by-caught females analysed previously (Chapter 3) were compared on a PCA plot. Only
females by-caught in the north area of the Auckland Islands shelf were included. Some
by-caught females were not lactating but were grouped with the by-caught lactating
females for the comparison with biopsied females, since it was found that the FA
composition between by-caught females did not vary with the lactation state (Chapter
3).
Differences in FA profiles between different groups of individuals may be caused by a
different diet, but also by different rates of metabolism due to different energy
requirements. To explore this last possibility, I calculated a body condition index for
each group (different years, benthic divers, mesopelagic divers, all biopsied females,
by-caught lactating females and by-caught non-lactating females) by dividing the mass
(kg) by the nose-tail length (cm) (Lunn and Boyd 1993; Arnould 1995), and tested for
any difference using a Kruskal-Wallis (K-W) test with post-hoc Mann-Whitney (M-W)
tests. The index was calculated for the 43 of the females biopsied in 2002, 2003 and
2005 (morphometric measurements are not available before 2002; B.L. Chilvers unpubl.
data) and for the 73 NZ sea lions by-caught between 2000 and 2005 and measured
during necropsy (Massey University unpubl. data).

Chapter 6 – QFASA on biopsied NZ sea lions
118
Table 6-1. Number of biopsied lactating New Zealand sea lions analysed each year, including the number of females classified as benthic or mesopelagic divers (Chilvers and Wilkinson 2009) from information on foraging location (satellite tag ST; Chilvers et al. 2005) and/or on dive pattern (time-depth recorder TDR; Chilvers et al. 2006) Years 2000 2001 2002 2003 2005 Total Females analysed 20 12 15 20 11 78 Including benthic divers 4 2 3 0 7 16 mesopelagic divers 0 3 2 5 2 12
6.2.4 QFASA model
The diets of individual sea lions were estimated using QFASA described by Iverson et
al. (2004), and a prey FA library from the Auckland Islands region (Chapter 4). The
model takes the mean FA profiles of each prey species in the prey library, and estimates
the mixture of prey FA profiles that comes the closest to match the FA profile of the
predator’s adipose tissue. Then, the best mixture is weighted by the fat content of each
prey species, and translated into a diet estimate (percentage mass). Details of the
QFASA model and the prey FA library are given in Chapter 5.
Optimal QFASA parameters determined earlier for by-caught NZ sea lions (Chapter 5)
were used in this chapter: They were CCs calculated from experiments on Steller sea
lions (Eumetopias jubatus) fed on pacific herring (Clupea pallasii pallasii) (D. Tollit
unpubl. data), a set of 23 FAs (14:1, 15:0, 15:1, 18:1n-5, and 22:4n-6 were deleted from
the original set; Table 6-2), and the account of prey individual variability (see Chapter 5
for details). Diet estimates were tested for significant variation between groups by K-W
and post-hoc M-W tests. All statistical tests have an α level of statistical significance of
0.05.
6.3 RESULTS
Blubber samples were analysed from 78 lactating NZ sea lions captured in January of
the years 2000 to 2003 and 2005 (Table 6-1). The blubber biopsied in 2004 was not
analysed because of an accidental liquid nitrogen leak from the storage bottle that year,
which left the samples at ambient temperature for an unknown period of time. Data on
diving patterns were available either directly from diving studies or deduced from
satellite telemetry (see methods) for four females in 2000, five in 2001, five in 2002,
five in 2003, and nine in 2005 (Table 6-1).

Chapter 6 – QFASA on biopsied NZ sea lions
119
Table 6-2. By-year fatty acid composition from 78 biopsied lactating New Zealand sea lions in mean mass percent ± SD. Fatty acids noted with a star are the ones selected for the discriminant function analysis. Fatty acids noted with a cross were deleted for quantitative fatty acid signature analysis.
Fatty acid composition (mean mass % ± SD)
Fatty acids 2000
n = 20 2001
n = 12 2002
n = 15 2003
n = 20 2005
n = 11
SFA 22.08 ± 2.47 25.95 ± 2.78 23.15 ± 2.55 21.91 ± 2.86 25.71 ± 3.72 14:0* 5.99 ± 1.40 8.29 ± 1.86 5.92 ± 1.83 5.29 ± 0.97 8.14 ± 2.47 15:0† 0.50 ± 0.09 0.59 ± 0.12 0.51 ± 0.08 0.54 ± 0.12 0.59 ± 0.09 16:0 13.02 ± 1.29 14.46 ± 1.78 13.87 ± 1.06 13.34 ± 1.69 14.36 ± 2.13 17:0 0.36 ± 0.05 0.37 ± 0.08 0.36 ± 0.06 0.39 ± 0.08 0.37 ± 0.07 18:0 2.22 ± 0.32 2.25 ± 0.47 2.49 ± 0.49 2.43 ± 0.35 2.25 ± 0.43 MUFA 59.58 ± 2.67 56.91 ± 2.88 60.36 ± 3.59 59.22 ± 4.35 55.57 ± 2.61 14:1*† 0.59 ± 0.19 0.72 ± 0.27 0.45 ± 0.19 0.43 ± 0.10 0.65 ± 0.23 15:1† 0.17 ± 0.03 0.15 ± 0.05 0.13 ± 0.03 0.15 ± 0.05 0.17 ± 0.05 16:1n-7* 8.48 ± 1.63 8.45 ± 1.53 7.27 ± 1.14 7.89 ± 0.90 9.22 ± 1.39 18:1n-9* 33.79 ± 2.94 30.44 ± 3.80 33.38 ± 4.17 33.76 ± 3.57 29.43 ± 3.06 18:1n-7* 4.34 ± 0.39 3.93 ± 0.43 4.33 ± 0.23 4.65 ± 0.31 3.98 ± 0.43 18:1n-5*† 0.41 ± 0.08 0.42 ± 0.10 0.32 ± 0.07 0.30 ± 0.05 0.41 ± 0.05 20:1n-11 1.80 ± 0.31 1.73 ± 0.28 1.92 ± 0.29 1.67 ± 0.22 1.87 ± 0.30 20:1n-9 8.07 ± 2.11 9.01 ± 1.95 10.42 ± 1.49 8.61 ± 1.66 7.83 ± 1.38 22:1n-11 1.64 ± 0.34 1.77 ± 0.45 1.77 ± 0.29 1.44 ± 0.22 1.73 ± 0.28 22:1n-9 0.27 ± 0.11 0.29 ± 0.08 0.38 ± 0.10 0.32 ± 0.09 0.28 ± 0.10 PUFA 18.38 ± 2.25 17.14 ± 2.23 16.49 ± 2.07 18.78 ± 3.78 18.73 ± 2.56 16:3n-4* 0.14 ± 0.05 0.19 ± 0.07 0.15 ± 0.05 0.15 ± 0.05 0.24 ± 0.05 18:2n-6 1.92 ± 0.19 1.62 ± 0.16 1.66 ± 0.23 1.68 ± 0.31 1.82 ± 0.18 18:3* 0.89 ± 0.14 0.78 ± 0.14 0.70 ± 0.12 0.74 ± 0.15 0.93 ± 0.10 20:2n-6 0.38 ± 0.07 0.33 ± 0.06 0.33 ± 0.09 0.35 ± 0.08 0.36 ± 0.06 20:3n-6 0.11 ± 0.02 0.08 ± 0.03 0.10 ± 0.02 0.1 ± 0.02 0.10 ± 0.02 20:3n-3 0.18 ± 0.03 0.17 ± 0.04 0.16 ± 0.04 0.16 ± 0.03 0.17 ± 0.06 20:4n-6† 0.69 ± 0.19 0.50 ± 0.10 0.56 ± 0.07 0.81 ± 0.26 0.59 ± 0.19 20:5n-3* 1.86 ± 0.56 1.71 ± 0.46 1.48 ± 0.33 1.78 ± 0.60 2.17 ± 0.57 21:5n-3* 0.21 ± 0.07 0.18 ± 0.07 0.14 ± 0.04 0.17 ± 0.06 0.25 ± 0.05 22:4n-6 0.15 ± 0.06 0.11 ± 0.05 0.11 ± 0.05 0.17 ± 0.10 0.11 ± 0.06 22:5n-6 0.22 ± 0.04 0.18 ± 0.05 0.17 ± 0.04 0.19 ± 0.03 0.19 ± 0.05 22:5n-3 2.73 ± 0.43 2.65 ± 0.50 2.71 ± 0.46 3.00 ± 0.84 2.84 ± 0.70 22:6n-3 8.87 ± 1.29 8.65 ± 1.25 8.23 ± 1.23 9.48 ± 2.22 8.96 ± 1.66
Chapter 6 – QFASA on biopsied NZ sea lions
120
6.3.1 FA composition of biopsied lactating sea lions and variation
Although 38 FAs were originally identified, only 28 FAs were used ranging from 14:0
to 22:6n-3 (Table 6-2). The 10 FAs removed were either short chain FAs (<14
carbons), known to come primarily from endogenous biosynthesis (Budge et al. 2006),
or FAs for which the identification was not certain. Together the FAs in greatest
concentration were 14:0, 16:0, 16:1n-7, 18:1n-9, 18:1n-7, 20:1n-9 and 22:6n-3, which
accounted for approximately 83% of the total FAs in the blubber (Table 6-2).
Monounsaturated FAs accounted for more than half of the total mass. Saturated FAs
ranked second in importance with approximately 24%, and polyunsaturated FAs were
the least represented group with approximately 18% (Table 6-2).
A PCA using a correlation matrix was run on arcsine square-root transformed data to
identify the FAs that were the most important in explaining the variance between FA
profiles. The factor year was not presented on a PC plot, because the number of years
(5) would make the graphic interpretation difficult. However, an ANOVA revealed that
year had a significant effect on all three PCs (PC1: F4, 77 = 8.83, P < 0.001; PC2: F4, 77 =
3.36, P = 0.014; PC3: F4,77 = 2.67, P = 0.038). Females captured in 2002 and 2003
displayed different FA profiles from the females captured in other years on PC1 (Tukey
tests, P < 0.05). This result was confirmed by a canonical discriminant plot (Fig. 6-2) on
the 10 FAs with the highest PC loadings (noted by a star in Table 6-2). The years 2002
and 2003 were segregated from the other years along the first discriminant function by
high loadings of 18-carbon MUFAs and 18:3 (Fig. 6-2). DF2 separated the year 2005,
mainly due to a higher concentration of 16:3n-4 in 2005 than in the other years (Fig. 6-
2, Table 6-2). There was no apparent difference in the FA profiles of benthic and
mesopelagic divers when they were compared visually within the years 2001, 2002 and
2005 (Fig. 6-3). Body condition indices were similar between years (K-W test, H2,42 =
3.75, P = 0.153) and diving types (M-W test, W = 72, P = 1.000).

Chapter 6 – QFASA on biopsied NZ sea lions
121
16:3n-4 14:0
18:1n-9 18:1n-7
18:1n-5 18:3
18:1n-7 18:1n-9
Figure 6-2. Plot of the first two canonical discriminant functions of fatty acid (FA) profiles from biopsied lactating New Zealand sea lions. This analysis included 10 FAs only (see details in Results section). The FAs with the most important positive or negative loadings on function 1 and function 2 are displayed along the axes.
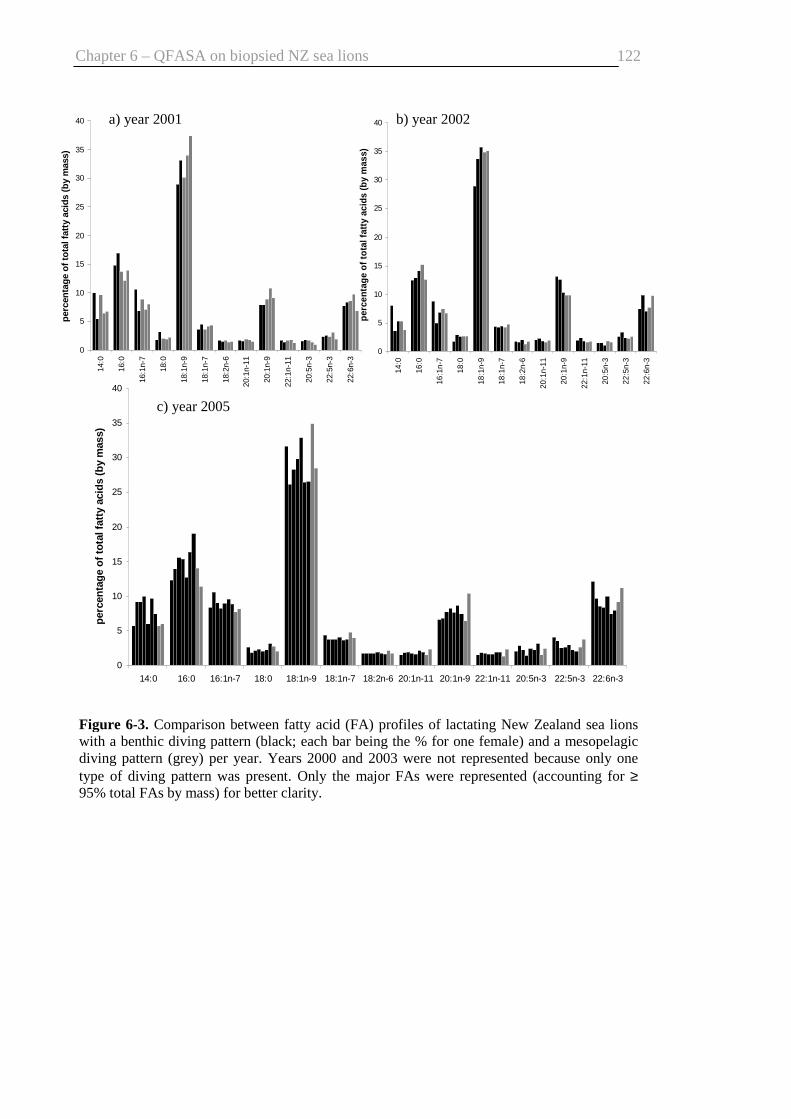
Chapter 6 – QFASA on biopsied NZ sea lions
122
0
5
10
15
20
25
30
35
40
14:0 16:0 16:1n-7 18:0 18:1n-9 18:1n-7 18:2n-6 20:1n-11 20:1n-9 22:1n-11 20:5n-3 22:5n-3 22:6n-3
per
cen
tag
e o
f to
tal f
atty
aci
ds
(by
mas
s)
0
5
10
15
20
25
30
35
40
14:0
16:0
16:1
n-7
18:0
18:1
n-9
18:1
n-7
18:2
n-6
20:1
n-11
20:1
n-9
22:1
n-11
20:5
n-3
22:5
n-3
22:6
n-3
per
cen
tag
e o
f to
tal f
atty
aci
ds (
by
mas
s)
0
5
10
15
20
25
30
35
40
14:0
16:0
16:1
n-7
18:0
18:1
n-9
18:1
n-7
18:2
n-6
20:1
n-11
20:1
n-9
22:1
n-11
20:5
n-3
22:5
n-3
22:6
n-3
per
cent
age
of
tota
l fat
ty a
cids
(by
mas
s)
a) year 2001
c) year 2005
b) year 2002
Figure 6-3. Comparison between fatty acid (FA) profiles of lactating New Zealand sea lions with a benthic diving pattern (black; each bar being the % for one female) and a mesopelagic diving pattern (grey) per year. Years 2000 and 2003 were not represented because only one type of diving pattern was present. Only the major FAs were represented (accounting for ≥95% total FAs by mass) for better clarity.

Chapter 6 – QFASA on biopsied NZ sea lions
123
6.3.2 Biopsied lactating sea lions versus by-caught female sea lions
FA profiles from biopsied females were clearly segregated from that of by-caught
female sea lions along PC1 explaining 27% of the variance (Fig. 6-4). They were
attributed negative values on PC1 and were positively correlated with the FAs 16:1n-7,
14:1 and 15:0, and negatively correlated with 22:6n-3, 22:1n-9 and 22:5n-3. Although
PC2 and PC3 explained similar amounts of variation, PC3 was not displayed because it
was not informative on the separation of the groups of females.
Body condition indices were significantly different between the biopsied lactating
females and the by-caught females (K-W test, H2, 115 = 11.61, P = 0.003). The median
index was 0.64 for both biopsied and by-caught lactating females (M-W test, P =
0.715), while the median index of by-caught non-lactating females was slightly lower
(0.59) but nonetheless significantly different (M-W test, P = 0.002).
6.3.3 Diet estimates of NZ sea lions using QFASA
Overall, rattails, hoki, red cod and arrow squid contributed > 80% mass of the diet as
estimated by QFASA, and were considered prey in more than half the samples (Table
6-3). Rattails and hoki were the most important prey estimated (median mass of 30%
and 26% respectively), and were represented in all but one individual. Opalfish, octopus
and scampi were considered minor prey with an occurrence < 50%. Spiny dogfish was
considered present in few percentages for only seven sea lions (Table 6-3).
QFASA results are derived from the FA profiles of sea lions, so that dietary estimates
will be similar for individuals with similar FA profiles. FA profiles of biopsied lactating
females displayed some variation between years but not between diving profiles, thus
only the diet estimates between years have been investigated. The estimated percentage
of rattails in the diet of females captured in 2005 was lower than in the diet of females
captured in the other years (K-W test, H4,77 = 10.12, P = 0.038; M-W tests, P < 0.05;
Fig. 6-5) except in 2001 (M-W test, W = 188.0, P = 0.148). In contrast, the estimated
contribution of arrow squid in the diet in 2005 was significantly higher than in the
previous years (K-W test, H4,77 = 17.76, P = 0.001; M-W tests, P < 0.05; Fig. 6-5) but
not in 2000 (M-W test, W = 287.0, P = 0.179). The lowest contribution of arrow squid
in the diet was estimated for females captured in 2002 (only 1%), which was lower than
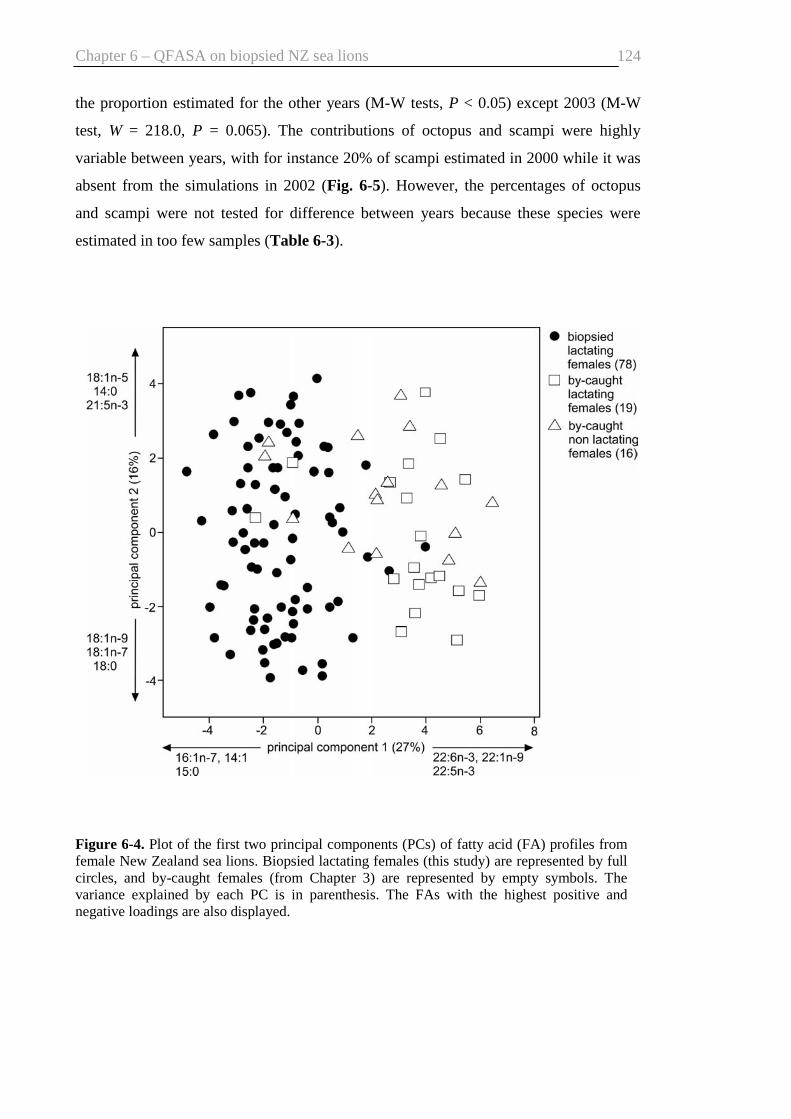
Chapter 6 – QFASA on biopsied NZ sea lions
124
the proportion estimated for the other years (M-W tests, P < 0.05) except 2003 (M-W
test, W = 218.0, P = 0.065). The contributions of octopus and scampi were highly
variable between years, with for instance 20% of scampi estimated in 2000 while it was
absent from the simulations in 2002 (Fig. 6-5). However, the percentages of octopus
and scampi were not tested for difference between years because these species were
estimated in too few samples (Table 6-3).
Figure 6-4. Plot of the first two principal components (PCs) of fatty acid (FA) profiles from female New Zealand sea lions. Biopsied lactating females (this study) are represented by full circles, and by-caught females (from Chapter 3) are represented by empty symbols. The variance explained by each PC is in parenthesis. The FAs with the highest positive and negative loadings are also displayed.

Chapter 6 – QFASA on biopsied NZ sea lions
125
Table 6-3. Predicted proportions (mean and median % mass) of prey species by quantitative fatty acid signature analysis for 78 biopsied lactating New Zealand sea lions. O is occurrence (number of individuals for which the prey has a percentage mass > 0); values between the 25th percentile and the 75th percentile represent the interquartile range in which 50% of the data are.
Prey O %O mean median 25th percentile 75th percentile Arrow squid 52 67 8 4 0 12 Hoki 78 100 28 26 16 36 Rattails 77 99 32 30 16 44 Red cod 68 87 16 11 2 27 Opalfish 28 37 2 0 0 0 Octopus 17 23 5 0 0 0 Scampi 34 44 10 0 0 12 Spiny dogfish 7 10 <1 0 0 0
0%
20%
40%
60%
80%
100%
2000 (20) 2001 (12) 2002 (15) 2003 (20) 2005 (11)
per
cen
t in
th
e es
tim
ated
die
t
scampi
octopus
opalfish
red cod
rattail
hoki
arrow squid
Figure 6-5. Mean estimated percentages of prey species by year from the quantitative fatty acid signature analysis for biopsied lactating New Zealand sea lions. The number of samples available for each category is displayed in parentheses.

Chapter 6 – QFASA on biopsied NZ sea lions
126
6.4 DISCUSSION
In this study, the blubber samples from 78 lactating NZ sea lions captured in January of
each year from 2000 to 2003 and 2005 have been analysed for FAs. The long-term diet
estimated by QFASA mainly consisted of rattails and hoki followed by red cod and
arrow squid. This is somewhat in contrast with the QFASA results from by-caught
females (Chapter 5) for which arrow squid and rattails were considered the most
important prey. Given that lactating females have been shown to display different
diving strategies depending on the area of the Auckland Islands shelf exploited
(Chilvers and Wilkinson 2009), it has been hypothesised that benthic and mesopelagic
divers would have different diets that can be revealed in different FA profiles. This
study did not show any variation in FA profiles between females with different diving
strategies, however patterns of FAs did vary between years of capture.
6.4.1 Limits encountered with FA analysis and QFASA
Deposition of dietary lipids in the blubber will depend on the nutritional status of the
animal. It is expected that a substantial amount of the FAs ingested above the metabolic
requirements will be deposited in the blubber, but the extent to which dietary FAs are
deposited during periods of negative energy balance is unclear. Thus, the blubber FA
signatures are more likely to reflect dietary FAs in animals in positive energy balance
(Kirsch et al. 2000). Lactating NZ sea lions, captured and weighed on land, had a stable
body mass or were gaining mass during the one-month interval between January and
February (first months of lactation period) (B.L. Chilvers, unpubl. data). Thus, I
believed that lactating sea lions were in positive energy balance and depositing dietary
FAs at the time of capture (January).
Blubber FA profiles have been shown to vary with the body region for Cape fur seals
Arctocephalus pusillus pusillus (Arnould et al. 2005) suggesting preferred depot sites
along the body of otariids. The dorso-lateral lumbar region for which blubber was
sampled in this study is a common region for biopsying blubber in free-ranging
pinnipeds (e.g., Best et al. 2003; Andersen et al. 2004; Beck et al. 2007b; Wheatley et
al. 2007). There is no particular reason for choosing this area in otariids other than
practical access when the animal is restrained and sedated. Indeed, the only study on fat
Chapter 6 – QFASA on biopsied NZ sea lions
127
depots in otariids concerns the assessment of variation in blubber thickness for only two
captive Steller sea lions throughout the year (Mellish et al. 2007) for which the dorsal
hip region (named D4 and D5 in the study) did not parallel the changes of mass.
Needless to say, more data are necessary before conclusion can be drawn on the
deposition of dietary FAs in this body region. Nevertheless, the FA signature of the
whole blubber core at the dorso-lateral lumbar region has been shown to be similar to
the FA signature of the whole blubber core at the ventral thoracic region (considered a
fat depot, see Chapter 5) for 18 by-caught NZ sea lions (Donaldson et al. unpubl. data).
Therefore, part of dietary FAs must be deposited in the dorso-lateral lumbar region
when the animal is in positive energy balance.
QFASA requires information on the FA profiles and fat content of all potential prey and
an understanding on the differential deposition of FAs in the predator’s adipose tissue
(Iverson et al. 2004). The list of species present in the prey library is not fully inclusive
of all potential prey that sea lions can eat but covers the most common and important
prey found in stomach contents of NZ sea lions (Chapter 4), and the most abundant
species in the Auckland Islands area (Jacob et al. 1998; O'Driscoll et al. 2003).
Concerning the lipid metabolism and deposition in the predator’s tissue, the QFASA
model takes into account that prey FA profiles do not match perfectly that of the
predator by applying CCs for each FA (Iverson et al. 2004). Although having similar
trends, CCs calculated from feeding experiments on captive animals vary with the
animal taxon or species, and the diet they are fed (Iverson et al. 2004; Iverson et al.
2006; Tollit et al. 2006; Iverson et al. 2007; D. Tollit unpubl. data). The CC set chosen
for this study (Steller sea lions fed on pacific herring; D. Tollit unpubl. data) gave the
best goodness of fit for the model among the CC sets available (Chapter 5), but it is not
known how close this optimal CC set accounts for the metabolism occurring in adult
NZ sea lions. However, the diet of by-caught NZ sea lions as estimated by QFASA was
comparable with data from stomach contents (Chapter 5), suggesting that the CCs do
give appropriate estimates.
6.4.2 Foraging diversity are not reflected in FA profiles
Foraging diversity within a species is generally driven by factors such as sex and size
dimorphism, body development, breeding behaviour, energy requirements, foraging
experience, and reduction of resource competition (Schoener 1986; Bolnick et al. 2003).
Chapter 6 – QFASA on biopsied NZ sea lions
128
Numerous examples are documented in the literature for pinniped species (e.g.,
variation between sexes: Campagna et al. 2001; Raum-Suryan et al. 2004; Sterling and
Ream 2004; Page et al. 2005; Kirkwood et al. 2006; Staniland and Robinson 2008;
variation between age groups: Baylis et al. 2005; Field et al. 2005; Field et al. 2007;
Fowler et al. 2007; Spence-Bailey et al. 2007).
Niche specialisation can also occur at a narrower scale within the same sex or age
group, and has been shown to take place among otariids for lactating Antarctic fur seals
(Lea et al. 2002b; Staniland et al. 2007), female Northern fur seals (Goebel et al. 1991;
Zeppelin and Ream 2006), and recently for lactating NZ sea lions (Chilvers and
Wilkinson 2009). Lactating NZ sea lions exploit diverse areas of the Auckland Islands
shelf by taking different directions from the colony during their foraging trips (Chilvers
and Wilkinson 2009). Some females forage northeast from the colony and dive at
regular depths on the Auckland Islands shelf, mostly at 100-150 m (benthic divers).
Others forage north/northwest from the colony and dive at variable depths on the edge
of the shelf, mostly at depths > 200 m followed by dives at 50 m (mesopelagic divers;
Fig. 6-1). The diet between the types of divers was expected to be different because the
communities of prey found on the shelf and at the shelf edge would vary, but this
hypothesis was not supported in this study. Indeed, no difference was noted between the
blubber FA profiles of benthic and mesopelagic divers (Fig. 6-3) and the diet estimated
by QFASA for both diving types was dominated by rattail and hoki, two species
abundant at depths > 200 m. Several reasons can lead to this result. First, the number of
benthic and mesopelagic divers per year is limited to few individuals, which may not be
enough to detect differences in FA profiles. Second, some individuals may have been
misclassified in the wrong type of diver if they don’t show the same dive pattern every
year. Indeed, blubber FAs were not analysed necessarily the same year as the diving
study for an animal. Hence, it was hypothesised that the diving pattern of a female for a
particular year was consistent during its whole life based on the high land-site and
foraging-site fidelity displayed by lactating NZ sea lions (Chilvers et al. 2005; Chilvers
2008a). Third, lactating females make most of their diving efforts in different habitats
(shelf versus shelf edge) but most of the energy required during a foraging trip may be
provided at the shelf edge whatever the diving types. Indeed, if benthic divers harvest
more prey per dive, larger prey and/or prey with a higher lipid content at the edge than
they do on the shelf, the FAs of prey found at the edge will mainly contribute to the FA
pool of sea lion blubber. This is likely to be true as the diet estimated by QFASA
Chapter 6 – QFASA on biopsied NZ sea lions
129
consisted mainly of rattail, hoki, arrow squid and red cod (Table 6-3), the first three
species being found in greater abundance at the edge than on the shelf (Jackson et al.
2000; Beentjes et al. 2002; MinistryFisheries 2007) and at a larger size than shelf
species (Chapter 2). Furthermore, Chilvers & Wilkinson (2009) showed that benthic
divers have more energy-demanding and longer foraging trips than mesopelagic divers
do, whereas the present results suggest that benthic and mesopelagic divers have similar
long-term energy intakes. Therefore, the foraging strategy displayed by benthic divers
does not seem compensated by greater energy income. It might have been an
advantageous strategy in the past, which persists across generations because of a strong
site fidelity and philopatry in females and a possible vertical transmission of foraging
tactics from NZ sea lion mother to pups (Chilvers 2008a; Chilvers and Wilkinson
2009). However, no historical records on prey availability exist to support this
hypothesis.
6.4.3 Differences between biopsied and by-caught females
There were significant differences between the FA profiles of samples analysed in this
study (biopsied blubber) and blubber from by-caught female NZ sea lions analysed
previously (Chapter 5). These differences consisted mainly of lower proportions by
mass of the 22 carbon-chain FAs 22:1n-9, 22:5n-3 and 22:6n-3 (Fig. 6-4) in the
biopsied samples. QFASA on by-caught females estimated that arrow squid was the
most important prey (median % mass of 28, Chapter 5), whereas the median % mass of
arrow squid in this study was only 4% (Table 6-3). Before the results can be interpreted
as a variation in diet, one must investigate whether these differences may be due to
variation in FA metabolism and deposition between the sample sets. First, the blubber
from by-caught animals was sampled from the thorax whereas biopsied samples were
from the dorso-lateral lumbar region, but FA profiles of blubber cores sampled at these
two sites do not differ significantly (from 18 individuals; Donaldson et al. unpubl. data).
Second, females from the two sample sets may be in different body condition thus not
depositing FAs at the same rate. This hypothesis is also rejected as the body condition
calculated for lactating females in both sample sets is similar. Hence, diet must play a
significant role in the differences in FA profiles between the two sample sets. To fully
interpret these diet variations, one must understand the dietary time frame represented
by the blubber of each sample set. Female NZ sea lions arrive at the breeding sites in

Chapter 6 – QFASA on biopsied NZ sea lions
130
December, and pup soon after their arrival (Chilvers et al. 2007b). The peak of
parturition for female NZ sea lions is at the end of December after which females fast,
nursing their pup for approximately 9 days (perinatal period) before going at sea for
their first foraging trip of the lactation period (Chilvers et al. 2007a). Energetic studies
on Galapagos fur seals Arctocephalus galapagoensis and Antarctic fur seals A. gazella
during the perinatal period revealed that females lost only 1.68% and 3.15%
respectively of their initial mass after a seven day fast (Costa and Trillmich 1988).
Although similar studies are not available for the NZ sea lion, it is likely that lactating
NZ sea lions do not deplete all their energy stores during their perinatal fast of nine
days; therefore the blubber collected at the end of January in this study would not
represent only dietary FAs stored from the first foraging trip to the time of sampling,
but also dietary FAs from the foraging period before parturition. The squid fishery starts
in February of each year. By-caught females for which blubber was analysed were
retrieved from squid nets between end of February and May (Chapters 3), thus blubber
FAs from by-caught females would reflect the diet over a period slightly later in the
lactation period. Therefore, the comparison between the blubber analysed in this study
and the blubber from by-caught females suggests that LFs rely primarily on deep sea
fish before the breeding season and during the first weeks of the lactation period, and
switch to a mixed diet of squid and fish later in the lactation period, probably taking
advantage of a greater abundance of arrow squid on the slope at the end of the summer
(February; M. Cawthorn pers. comm.).
6.4.4 Between-year variation in FA profiles and long-term diet
Females captured in January 2002 and 2003 showed differences in their FA profiles
with the other years of capture, mostly due to a greater proportion of monounsaturated
18 carbon chain FAs (Fig. 6-2, Table 6-2). The year 2005 also displayed some variation
with the other years, mostly driven by a higher percentage of 16:3n-4 (Fig. 6-2, Table
6-2). Body condition of females was similar between the years 2002, 2003 and 2005 (K-
W test, P > 0.05). Although the body condition in the years 2000 and 2001 is not
known, the fact that FA differences exist between females with similar body condition
(years 2002 and 2003 different from year 2005) suggest that differential metabolism
have little influence relative to diet on the FA variation observed between years.
Differences in FA profiles resulted in different diet estimates by QFASA (Fig. 6-5),
Chapter 6 – QFASA on biopsied NZ sea lions
131
with a greater proportion of arrow squid and a smaller proportion of rattails for 2005,
and a smaller proportion of arrow squid for 2002 and 2003. Temporal variation in the
diet of NZ sea lions has been generally attributed to a change in prey availability (Lalas
1997; McMahon et al. 1999; Childerhouse et al. 2001; Chapter 2). The only information
on the abundance of marine species in the NZ sub-Antarctics is from commercial
catches of arrow squid and hoki (Ministry of Fisheries 2007). The year 2005 was
considered a good harvest by the squid fishery in the Auckland Islands area whereas
low catches were recorded in the years before 2004 (Ministry of Fisheries 2007).
Despite the fact that blubber analysed reflect the diet over a period prior to the start of
the fishery, the present diet estimates (greater proportion of arrow squid in the diet of
the year 2005) are consistent with the main trends of arrow squid catches.
6.5 CONCLUSION
In this study, QFASA has been used to assess the diet of lactating NZ sea lions captured
in the first week of the lactation period between 2000 and 2003 and in the year 2005.
Lactating NZ sea lions seem to rely primarily on deep-sea fish such as rattails and hoki
before parturition and during the first weeks of lactation, whatever the area of the
Auckland Islands shelf they exploit. Females displaying a benthic diving pattern go
further from the colony when foraging, and spend more energy per foraging trip than do
females displaying a mesopelagic pattern (Chilvers and Wilkinson 2009). The present
study did not support the hypothesis of feeding specialisations, and benthic divers do
not appear to benefit from a more energy-rich diet. Previous foraging studies have
identified the slopes of the Auckland Islands shelf as important foraging areas for
lactating NZ sea lions (Chilvers et al. 2005; Chilvers and Wilkinson 2009). The present
study suggests that most of the energy intake during a foraging trip occurs on the slopes
where large fish gather in abundance at depths > 200 m (Beentjes et al. 2002; Ministry
of Fisheries 2007). Comparison of diet estimates from QFASA between the females
studied herein and females by-caught in the squid fishery later in the lactation period
(autumn, Chapter 5) suggest that females change their fish diet to a more squid-based
diet in austral autumn when arrow squids gather in the area (M. Cawthorn pers. comm.).
This study also showed a variation in FA profiles between years, due mostly to a
variation in arrow squid contribution to the diet estimated by QFASA. Although
QFASA is at its early development and uncertainties remain on the reliability of CCs

Chapter 6 – QFASA on biopsied NZ sea lions
132
used, estimates of arrow squid proportions in the diet followed the same trend as the
reported arrow squid catches since 2000 (Ministry of Fisheries 2007).
Acknowledgements
Captures of females were conducted under permit from the NZ Department of
Conservation (DOC), and were funded by DOC, RD&I Division (Investigation no.
1638). Approval for capture and blubber sampling was obtained from DOC Animal
Ethics Committee (Approval AEC86, 1 July 1999). I thank Ian Wilkinson and the NZ
sea lion teams from 2000 to 2005 for assistance with captures in the field. Special
thanks to R. Galois (Ifremer, France), M. Walton (SMRU, UK) and M. Reynolds
(Fonterra, NZ) for their advice on fatty acid analysis. For the QFASA model, I am
grateful to D. Tollit (UBC, Canada) who provided the calibration coefficients calculated
for Steller sea lions. R. Sherriff (Brimble Sherriff Young Limited, NZ) programmed the
optimisation model for Massey University. This project was sponsored by Lewis Fitch
Research Fund, Massey University Research Fund, the Whale and Dolphin Adoption
Project, the Department of Conservation and the NZ Ministry of Fisheries.

7 CHAPTER 7
FEEDING ECOLOGY OF THE NEW ZEALAND SEA LION:
GENERAL DISCUSSION
Photo: Group of New Zealand sea lions (Phocarctos hookeri) at Sandy Bay, Enderby Island, Auckland Islands. In front, a young male.

Chapter 7 – General discussion
134
Adequate nutrition is essential to the sustainability of any species as it underpins key
elements of population ecology such as reproductive success and recruitment. For those
species that have evolved to live in marginal habitats, or now find themselves in such
habitat due to environmental degradation, range restriction, or competition, diet is even
more critical. The New Zealand (NZ) sea lion is one such species, with its breeding
range restricted to the NZ sub-Antarctic. Knowledge of its feeding behaviour and
nutritional requirements were, until now, poorly understood. This thesis makes a
significant advance on the understanding of NZ sea lion feeding ecology, particularly
for adult females in the critical early lactation period.
The diet of this species was investigated using stomach content analysis, qualitative
fatty acid (FA) signature analysis, and quantitative FA signature analysis (QFASA)
from the years 1997 to 2006. In Chapters 2, 3 and 5, I examined the short-term diet
(stomach contents) and the long-term diet (FAs from blubber) of NZ sea lions
incidentally caught in the southern arrow squid fishery around the Auckland Islands
(50°30'S, 169°E). In Chapter 6, the blubber FAs of free-ranging lactating NZ sea lions
captured at Enderby Island, Auckland Islands, were examined. The purpose of this
general discussion is to integrate the main research outcomes of my dissertation, and
place them in the context of the conservation management of the NZ sea lion.

Chapter 7 – General discussion
135
Limits of the dietary methods
The literature review on dietary methods in Chapter 1 highlighted the advantages and
disadvantages of the stomach content and FA analyses, which were the methods used in
this study. Stomachs were collected from NZ sea lions caught incidentally in squid
trawl nets (Chapter 2), therefore the arrow squid targeted by the fishery was believed to
be over-represented in the stomach contents. To minimise the overestimation of arrow
squid, I distinguished the fresh fraction (ingested shortly prior the death; 79% by mass
of arrow squid) from the digested fraction (ingested from one to several days before the
death; 18% by mass of arrow squid) in the stomach contents, and I considered only the
digested fraction in the interpretation of the results. Although this fraction is likely to
better represent the “background” diet of NZ sea lions over a foraging trip than the total
stomach content, there is still a possible overestimation of the cephalopod component of
the diet due to the accumulation of cephalopod beaks in the stomachs (Bigg and Fawcett
1985; Yonezaki et al. 2003), and a possible underestimation of species with fragile hard
parts (Dellinger and Trillmich 1988; Pierce and Boyle 1991).
A significant advance in research on diets of free living marine mammals over the past
decade was the development of techniques to estimate the proportions of ingested prey
from FAs in adipose tissue (Iverson et al. 2004). I adopted this methodology to the
analysis of NZ sea lion blubber in order to overcome the biases related to differential
prey retention and digestion rates encountered in stomach analysis. Another advantage
of FA analysis over traditional methods is that FAs in blubber have the potential to
reflect the diet over ecologically significant periods (i.e., weeks to months) (e.g., Kirsch
et al. 1998; Kirsch et al. 2000). Nevertheless, inferring diet variation between
individuals from FA analysis is limited when individuals vary in body conditions and/or
energetic expenditure, leading to differential rates of metabolism of ingested FAs and
deposition into the adipose tissue. For instance, the FA variation observed between
sexes in Chapter 3 is likely to originate from a combination of different diets and/or
from different rates of FA metabolism. Therefore, at present, it is difficult to draw any
conclusion on the dietary differences between male and female sea lions based on
blubber FA profiles alone as long as foraging and diving data are not available for both
sexes. To date, lactating females are the only segment of the population for which
Chapter 7 – General discussion
136
foraging and diving behaviours are known (Gales and Mattlin 1997; Costa and Gales
2000; Chilvers et al. 2005, 2006).
QFASA requires the application of calibration coefficients (CCs) to account for the FA
metabolism in the blubber of the predator. Yet, these coefficients are not available for
the NZ sea lions as they require controlled feeding trails on captive animals and no NZ
sea lions are in captivity. To date, the Steller sea lion Eumetopias jubatus is the only
otariid species for which CCs have been calculated from feeding experiments (D.Tollit,
unpubl. data). In Chapter 5, QFASA was tested on by-caught NZ sea lions using
different CCs from Steller sea lions (D.Tollit, unpubl. data), and from phocid species
(Iverson et al. 2004). This study showed the high sensitivity of QFASA for CCs and
highlighted the importance of suitable CCs in the estimation of the diet. This was also
stressed in a study on harbour seals, during feeding experiments in which the authors
compared QFASA diet estimates produced with CCs from different species of phocids
(Nordstrom et al. 2008). Despite the uncertainty of the accuracy of the match between
the optimal CCs I used (from Steller sea lions fed on herring) and the true FA
metabolism of NZ sea lions, the diet estimations by QFASA (mainly arrow squid,
rattails and hoki; Chapter 5) are consistent with previous knowledge on the diet
estimated from scat and stomach methods (Childerhouse et al. 2001; Chapter 2),
foraging behaviour (Chilvers et al. 2005) and diving pattern (Chilvers et al. 2006) of
this species. Moreover, the diet variation estimated by QFASA between years was
consistent with the trends of the commercial catches of hoki and arrow squid since 2000
(Chapters 5 and 6), giving greater confidence in the diet predictions presented in this
thesis.
QFASA is at its early stages of development and a better understanding of the factors
affecting lipid metabolism for otariids is clearly necessary in the future. To my
knowledge, published CCs on pinnipeds are restricted to two species of phocids and one
species of otariid feeding on a pure herring diet (Iverson et al. 2004; Tollit et al. 2006).
It is only recently that the effect of different meals on the blubber FA composition has
been studied (D. Tollit, unpubl. data). The different sets of CCs calculated on Steller sea
lions feeding different meals gave drastic differences in diet estimates (Chapter 5),
highlighting the importance of CCs in the reliability of QFASA. Moreover, before
applying QFASA on blubber FA profiles, one must consider that variation in FA

Chapter 7 – General discussion
137
profiles between individuals of different sex, age or nutritional status may come from
both different diets and different rates of FA metabolism. Therefore, at the present state
of knowledge, I believe that the reliability of “qualitative” and “quantitative” FA
analyses to detect dietary differences between groups of individuals (“qualitative”), or
to estimate prey contributions in the diet (“quantitative”), must be tested by the
comparison with diet estimates from other dietary methods.
Feeding ecology
Data obtained from both stomach analysis and QFASA indicate that arrow squid,
rattails, hoki and red cod are key prey species for both by-caught NZ sea lions (Chapters
2 and 5), and biopsied NZ sea lions (Chapter 6). However, the order of prey
contribution by mass varied according to the method used and the origin of the samples.
For the by-caught sea lions, the most common prey found in stomach contents were
arrow squid (17.9% by mass M), rattail (2.4%M), red cod (4.3%M), opalfish (4.7%M)
and octopus (27.8%M) (Chapter 2). This method showed only a weak variation between
sexes and maturity stages, with the only significant difference being a greater
contribution of opalfish in the stomach contents of females. The ontogenetic diet
variation is probably underestimated due to the nature of the sample set (absence of
territorial males and juveniles < 3 years of age) and the fact that stomach contents give a
diet picture limited to the last foraging trip (Chapter 2). An important finding in Chapter
2 is that by-caught juveniles of 3-4 years old feed on similar prey to adults, implying
that they are able to forage at the slopes of the shelf and at depths >200 m, despite their
diving capacity not being fully developed.
I applied QFASA to the blubber samples from the same by-caught individuals, and
estimated that arrow squid (28%M) and rattails (27%M) were the most important prey
over the months prior to their death (i.e., first half of the lactation period, Chapter 5).
Females and males showed different FA profiles (Chapter 3), which resulted in different
diets predicted by QFASA (higher contribution of hoki in females than in males, higher
contribution of red cod in males than in females; Chapter 5). However, these predictions
prevail only if most of the variation in FA profiles between sexes comes from a
different diet, and not from differential rates of FA metabolism and deposition (see

Chapter 7 – General discussion
138
limits of the methods above). Lactating and non-lactating females showed similar
stomach contents (Chapter 2) and FA profiles (Chapter 3), suggesting a fidelity to
foraging habits displayed by females from a year to the next regardless of whether they
were rearing a pup or not.
Rattails (30%M) and hoki (26%M) were the most important prey estimated by QFASA
for biopsied lactating females during the pre-breeding period and the first month of
lactation (30%M and 26%M respectively, Chapter 6). The comparison of diet estimates
between by-caught and biopsied females (Chapter 6) suggests that females change their
deep sea fish-based diet to a more squid-based diet at the end of summer when arrow
squid gather in the area (M. Cawthorn pers. comm.). Alternatively, another possibility is
that female sea lions are still depending on a fish diet in autumn and some individuals
specialise in pursuing squid in trawling nets.
FA profiles of by-caught and biopsied NZ sea lions showed some variation between the
years from 2000 to 2006 (Chapters 3 and 6). Because sea lions had similar body
condition between most of the years, I attributed the FA variation to annual variation in
diet. NZ sea lions are generalist predators (Lalas 1997; McMahon et al. 1999;
Childerhouse et al. 2001; Chapter 2), thus their diet is expected to follow the trends of
prey stock availability. The similar dietary pattern between the two types of sampling
(by-caught versus biopsied) was the higher contribution of arrow squid estimated in the
diet of animals sampled in 2005 (or pooled years 2005-2006) relative to the previous
years (Chapters 5 and 6). These findings are consistent with the trend shown by reported
commercial catches of arrow squid from the Auckland Islands region (Ministry of
Fisheries). A parallel study on the milk composition of the same NZ sea lion population
between the years 1997 and 2005 reported high lipid and low protein contents of the
milk sampled in 2002 and 2003 relative to the other years, and explained this pattern by
an underfeeding of females with good initial body condition during the first month of
lactation (Riet-Sapriza 2007). Furthermore, low lipid and protein contents of the milk
collected in 2001 were attributed to underfeeding of females in poor body condition
during the first month of lactation. Therefore, it is possible that a low biomass of arrow
squid around the Auckland Islands in the years previous to 2004 has limited the
production of a milk of good quality. It is worth mentioning that arrow squid contains
the highest values of eicosapentaenoic acid (EPA) and docosahexaenoic acid (DHA)
among the common prey of the NZ sea lion (> 20% of total FAs; Chapter 4), and that
Chapter 7 – General discussion
139
these FAs are associated with health benefits such as the prevention of autoimmune
diseases (Sidhu 2003). Milk with high concentrations of EPA and DHA would likely
benefit the pup and may increase its chance of survival in the face of infectious diseases
such as the ones occurring in the population in 2002 and 2003 (Castinel et al. 2007a;
Castinel et al. 2007b).
Importance of the edges of the Auckland Islands shelf
It has been suggested that the low population number of the NZ sea lion (approximately
12000; Campbell et al. 2006) and its low reproductive performance originate from
unfavourable foraging conditions occurring on the Auckland Islands shelf, where
abundant and/or predictable resources would be far from the rookeries and deep (Gales
and Mattlin 1997; Costa and Gales 2000; Chilvers et al. 2005, 2006). My principal
findings on the short-term and long-term diet of NZ sea lions during the first months of
the lactation period (Chapters 2 and 5) appear to support this hypothesis. I have shown
that the NZ sea lions predominatly feed on arrow squid and deep-sea living fish such as
rattails and hoki. The later are found at depths >200 m, thus are accessible only at the
edges of the shelf (Beentjes et al. 2002; Ministry of Fisheries 2007). A previous
foraging study on lactating NZ sea lions highlighted the importance of the edges of the
Auckland Islands shelf during foraging trips of females during the first month of
lactation (Chilvers et al. 2005). My results suggest that the slopes are visited regularly
not only during the first month of lactation (Chapter 6), but later in the lactating period
(Chapter 5). Given the high fidelity for foraging grounds displayed by female NZ sea
lions (Chilvers 2008a), it is likely that the edges of the Auckland Islands shelf remain
key foraging locations until the end of the lactation period. Though these key areas are
far from the rookeries and impacted by the squid fishery, they may provide the only
predictable and abundant food resource required to cover the cost of lactation.
Nutritional stress hypothesis and energetics
In addition to the costs of exploiting a resource far from the colony and deep, the
energetic income from the prey must be considered. Indeed, a low energetic diet might
cause a nutritional stress, potentially causing an adverse impact on the reproductive
performance of sea lions (Trites and Donnelly 2003). A similar hypothesis has been

Chapter 7 – General discussion
140
proposed to explain the decline of the western stock of Steller sea lions, which feeds
primarily on gadids, a group of prey considered to be of low energy density (Rosen and
Trites 1999; Rosen and Trites 2000; Donnelly et al. 2003; Trites and Donnelly 2003;
Winship and Trites 2003; Rosen and Trites 2005). The calorific values of gadids (3 to 8
kJ g-1, Fritz and Hinckley 2005) are in the same range as those of NZ sea lions’ main
prey (5 to 8 kJ g-1, Chapter 4). Therefore it is quite possible that the energy obtained
through prey consumption does not meet the energetic demands of reproduction and
lactation in NZ sea lions, causing a low reproductive rate and a low fat content in the
milk relative to other otariid species (Riet-Sapriza 2007; Chilvers 2008b). However, the
nutritional stress hypothesis has been criticised (see critical review in Fritz and
Hinckley 2005; Atkinson et al. 2008) as it is difficult to make a direct link between
energy of prey and the well-being of a population, without better knowledge of the
physiological processes governing the assimilation of nutrients into marine mammal
tissues. Furthermore, low prey energy density alone is not sufficient to cause nutritional
stress if total prey intake is adequate to meet energetic needs (Donnelly et al. 2003;
Rosen and Trites 2005). In fact, otariid populations relying on low energy prey can do
fine. For instance, the population of southern sea lions Otaria flavescens in Patagonia is
increasing (Dans et al. 2004) but the females prey on the lean prey octopus
Enteroctopus magalocyathus and squid Illex argentinus (Werner and Campagna 1995;
Koen Alonso et al. 2000), and the sea lion population in this area is increasing (Dans et
al. 2004). In contrast to NZ sea lions however, the costs of foraging are lower for
southern sea lions which dive to maximum depths of 30 m on the shallow Patagonian
shelf (Werner and Campagna 1995; Campagna et al. 2001). Among the otariids
displaying a benthic foraging behaviour such as Australian sea lion Neophoca cinerea
(Costa and Gales 2003), Australian fur seal Arctocephalus pusillus doriferus (Arnould
and Hindell 2001), southern sea lion (Werner and Campagna 1995), northern fur seal
Callorhinus ursinus (Goebel et al. 1991) and NZ sea lion (Gales and Mattlin 1997;
Chilvers et al. 2006), the NZ sea lion is the only species for which regular dives deeper
than 100 m have been recorded during the foraging trips of lactating females on the
shelf (Gales and Mattlin 1997; Chilvers et al. 2006). A preliminary study on the diving
physiology of the NZ sea lion showed that despite their deep and long-duration diving
ability, they do not have a greater diving capacity than other otariids thus are
presumably foraging near their physiological maximum (Costa and Gales 2000).
Therefore, it is probable that the reliance on low energy prey distributed in deep waters
Chapter 7 – General discussion
141
adversely affects the reproductive performance of lactating NZ sea lions. More detailed
studies on nutrient quality and sea lion physiology will be required to test this
hypothesis further.
To test the hypothesis that the total prey intake during a foraging trip may not be
sufficient to cover energetic needs due to the low energy contents of the prey, I
calculated the daily food requirement of a lactating sea lion by using a simple
bioenergetic model derived from Kleiber’s predictive equation of energy requirements
(Kleiber 1975), where the basal metabolism BM (kg d-1) is defined as:
75.088.292 MBM ×=
with 292.88 in kJ d-1; and M, mass of the animal in kg. Here, I took an average mass of
110 kg which represent the most common mass class of lactating NZ sea lions
(Childerhouse 2008). By accounting for the different energy contents of the prey and
their proportions in the diet, the daily food requirement FR (kg d-1) of a lactating NZ sea
lion is as follows:
( )∑ ×××=
ii EP
BMFR
95.0
8.5
With 5.8 × BM, activity metabolic rate calculated as 5.8 times the basal metabolism for
lactating NZ sea lions (Costa and Gales 2000); 0.95, mean assimilation efficiency from
feeding experiments on monk seals Monachus schauinslandi and harp seals Phoca
groenlandica (Lawson et al. 1997; Goodman-Lowe et al. 1999); Pi, proportion by mass
of prey i in the diet; and Ei, energy content of prey i (kJ kg-1 wet mass). The daily food
requirement of a lactating female was estimated to be 25 kg d-1 or 23% of its body mass
with the prey proportions predicted by the stomach analysis, 24 kg d-1 or 21% of its
body mass with the prey proportions predicted by QFASA on by-caught lactating
females, and 23 kg d-1 or 21% of its body mass with the prey proportions predicted by
QFASA on biopsied lactating females. These values are likely to be underestimated
since females need to obtain more energy than required to sustain the fast on land when
nursing their pup (1-2 days, Chilvers et al. 2005). Fiscus and Baines (1966) suggested
that the maximum stomach capacity of a two-year old Steller sea lion was
approximately 10% of its body mass. Therefore, a lactating NZ sea lion would
theoretically need to fill its stomach three times daily to meet its food requirement.
Based on the passage times of prey items through the gut of Steller sea lions (e.g., Tollit
Chapter 7 – General discussion
142
et al. 2003), it is likely that most of the prey are digested or passed through the intestine
within 6 hours. Thus, lactating females would theoretically “have time” to meet their
food requirements. However, the food requirements of lactating NZ sea lions calculated
herein are well above the estimations for other sea lion species (approximately 10-11%
body mass for Australian and California sea lions Zalophus californianus; Costa 1991;
Winship et al. 2006), and are at the higher limit of the estimated food requirements for
the declining population of Steller sea lions in western Alaska (Winship and Trites
2003). Consequently, the food requirements from low energy prey such as the ones
available around the Auckland Islands may be at such a level that lactating females have
to strike a delicate balance between meeting their energetic needs and returning to the
rookery on time to nurse their pup. Nevertheless, lactating NZ sea lions captured twice
in a month interval during the first months of the lactation period, had stabilised or were
gaining mass (B.L. Chilvers unpubl. data), hence were in positive energy balance. If the
energy of prey does not appear to be the cause of the low reproductive performance of
female NZ sea lions, the quality of prey might be a factor. It has been mentioned earlier
in this discussion that arrow squid has high levels of FAs necessary for important health
functions. It is now necessary to assess other nutrients such as amino acids and minerals
in order to further investigate the nutritional stress hypothesis in this species.
Interactions with the arrow squid fishery and potential resource competition
The aim of the conservation management strategy for the NZ sea lion is the reduction of
fisheries by-catch, and is currently undertaken in three ways: maintaining the no-fishing
zone of 12 mile surrounding the Auckland Islands, the setting of an annual by-catch
limit, and the use of sea lion exclusion devices (SLEDs) in trawling nets (Wilkinson et
al. 2003; Chilvers 2008b). Despite these management controls, the number of sea lions
estimated to be caught varied from 14 to 118 every year (Chilvers 2008b). Lactating
females from Enderby Island (Auckland Islands) travel north or north east to the edge of
the shelf, where part of the fishery occurs (see Fig 6-1, Chilvers et al. 2005; Chilvers
2008b). Therefore, there is a high overlap in the regions harvested by sea lions and the
fishery, which can lead to potential competition for arrow squid. To assess the resource
competition, one must know the abundance of arrow squid available in the area.
Unfortunately, no biomass estimate is available for arrow squid (Ministry of Fisheries
2007). However, a comparison of the quantity harvested by the lactating NZ sea lions

Chapter 7 – General discussion
143
and the quantity fished at the Auckland Islands can give an indication of the impact of
NZ sea lions on the squid stock. I re-used the bioenergetic equation presented earlier to
estimate the daily requirement of arrow squid by lactating females by-caught in the
squid fishery. I found a daily requirement of 7 kg d-1 based on diet predictions from
stomach contents, or 8 kg d-1 based on diet predictions from QFASA. The arrow squid
requirement RAS (kg per season) of all lactating females during a fishing season was
calculated as:
daysnbindsnbFRR ASAS ××=
with FRAS, the daily requirement of arrow squid AS; nb inds, the number of individuals;
and nb days, the number of days during which sea lions are foraging. The number of
adult NZ sea lions was estimated at 7000 (Wilkinson et al. 2003). Approximately 67%
of females are lactating (Childerhouse 2008), and assuming a sex ratio of 1:1, the
number of lactating NZ sea lions is 2345. The fishing season is approximately 120 days
(from the 1st of February to the 1st of June). Lactating females spend approximately two
thirds of their time foraging at sea during lactation, thus the number of foraging days
was set at 80. This gives an estimation of 1300 t to 1500 t of arrow squid required by
lactating NZ sea lions during a fishing season, and equals 10 to 22% of the annual
catches of arrow squid in the sub-Antarctic in 2002 and 2003, and up to 46% of the
annual catches of arrow squid in the sub-Antarctic in 2001. Based on a study of milk
quality in these sea lions, it was hypothesised that the population faced a food shortage
in the summers 2001 and 2002. To the substantial amount of arrow squid required by
lactating females, one must add the food requirements of males and juveniles of 3-4
years old, which also forage at the edges (Chapter 2). Therefore, the entire NZ sea lion
population may require similar amounts of arrow squid as the amount harvested by the
fishery in some years, suggesting that resource competition exists during years of low
arrow squid recruitment.
Future research on NZ sea lions
• The food requirement equations used in this chapter were made simplistic
because my aim was to estimate the approximate food requirements of sea lions.
A more complicated energetic model has been developed for Steller sea lions
(Winship et al. 2002) and could be adapted to NZ sea lions. Mass distribution of
the population instead of an average mass, activity metabolic rates for males and
Chapter 7 – General discussion
144
juveniles, and variable assimilation efficiencies depending on the lipid content
of prey are examples of factors which could be added in the model.
• The examination of the nutritional quality of the main prey species (i.e., amino
acids, minerals, vitamins) will allow further insight on the nutritional stress
hypothesis on NZ sea lions.
• Most of the research on the NZ sea lions at the Auckland Islands has focused on
lactating females in summer (Gales and Mattlin 1997; Costa and Gales 2000;
Chilvers et al. 2005, 2006) because females are the most critical component in
the population and because of logistic restrictions (i.e., remote locations difficult
to access in winter). However, in terms of species management, it becomes
crucial to understand the foraging and feeding behaviour of other components of
the population (males and juveniles), and of lactating females in winter and
spring at the end of the lactation period. Males and juveniles are the focus of a
current foraging study at the Auckland Islands (B.L. Chilvers, pers. comm.). I
strongly recommend sampling blubber from males and juveniles in the future in
order to use QFASA on these animals.
• The collection of feeding information in winter and spring seems limited in the
near future due to the high cost of sending a team to the Auckland Islands in
winter. Nevertheless, stable isotope analysis can provide a means of inferring
historic diets over months or years (Dalerum and Angerbjörn 2005) thus it may
be possible to use this method to obtain diet information in winter. For instance,
stable isotopes of hair collected from females captured in January would give an
isotopic signature since the previous moult at the end of summer. The
comparison of isotopic signatures between hair and another tissue with a
turnover of several weeks only (e.g., red blood cells) will allow any dietary
changes between the summer (breeding season) and the months preceding the
breeding season to be assessed.
• QFASA used a limited prey FA library (Chapter 4) and CCs from Steller sea
lions. First, the prey FA library needs to be expanded to other potential prey
species which are abundant in the Auckland Islands shelf, and the number of
individuals within each prey species needs to be increased especially for species
with a high FA variability such as opalfish and octopus. Secondly, better CCs
for NZ sea lions could be obtained by carrying out feeding experiments on
Chapter 7 – General discussion
145
otariids fed on species similar to NZ sea lions’ prey in their lipid and FA
compositions. Since it is unrealistic to keep a NZ sea lion in captivity due to the
current critical status of the population, it is possible to use another species of
sea lion, such as California sea lions held captive in several zoos in NZ.
General conclusions
• The diet of NZ sea lions was investigated using stomach content analysis,
qualitative FA analysis, and quantitative FA signature analysis (QFASA) from
the years 1997 to 2006. Stomach and FA analysis are complementary methods,
both with advantages and disadvantages, and gave comparable results even if
they infer the diet of NZ sea lions over different temporal scales.
• Data obtained from both stomach analysis and QFASA indicate that arrow
squid, rattails, hoki and red cod are key prey species for NZ sea lions. My results
suggest that the slopes of the Auckland Islands shelf are visited regularly not
only during the first month of lactation, but later in the lactating period. Given
the high fidelity for foraging grounds displayed by female NZ sea lions, it is
likely that the edges of the Auckland Islands shelf will remain key foraging
locations until the end of the lactation period.
• Variation in diet between sexes is likely to occur but the degree of segregation
could not be assessed in my study due to the unknown role of different rates of
metabolism in the FA variation between males and females. By-caught juveniles
of 3-4 years old feed on similar prey as adults, implying that they are able to
forage at the slopes of the shelf and at depths >200 m, despite having a diving
capacity not fully developed. Lactating and non-lactating females showed
similar stomach contents and FA profiles, suggesting a fidelity to foraging habits
displayed by females from a year to the next whether they rear a pup or not.
Finally, the comparison of diet estimates between by-caught and biopsied
females suggests that females change from a deep sea fish-based to a more
squid-based diet at the end of summer when arrow squid gather in the area.
• FA profiles of NZ sea lions showed some variation between the years from 2000
to 2006, with mostly a higher proportion of arrow squid in the diet of sea lions
sampled in 2005 and 2006. The daily food requirement of a lactating female was
estimated to be > 20% of its body mass. During years of low arrow squid

Chapter 7 – General discussion
146
recruitment such as 1999 and 2001, the amounts of arrow squid required by the
NZ sea lion population may have been similar to the amount harvested by the
fishery, suggesting that resource competition occur between the arrow squid
fishery and NZ sea lions in years of low arrow squid recruitment.

Appendix 1
147
APPENDIX 1
Analysis of fatty acids and gas chromatography: development
of the laboratory protocol
A recent review on the analysis of fatty acids (FAs) in marine ecosystems (Budge et al.
2006) stated that analysis of FA methyl esters (FAMEs) by gas chromatography is the
most reliable and accessible method for routine quantification of FA composition. Gas
chromatography allows the identification of a wide range of FAs (Christie 1989), which
need to be converted first into a volatile derivative, usually methyl esters. Therefore, FA
analysis commonly requires the following steps: (1) lipid extraction, (2) derivatisation
(methylation), and (3) gas chromatography, which are developed in details in the
following sections.
This appendix aims at describing and justifying the methodology chosen to analyse FAs
in the “development of a protocol”. The second section is the description of the protocol
used during this project. Samples analysed here were either blubber from sea lions or
prey (fish, cephalopod or crustacean). While the review on the methods involves
different disciplines beyond the marine environment, the references generally referred
to marine mammal tissues.
DEVELOPMENT OF A PROTOCOL
Lipid extraction
Which method to choose?
The first laboratory step in FA analysis is the extraction of lipids from animal tissue. By
using a bipolar solvent system such as methanol:chloroform mixture, lipids are
separated from other compounds. The most common extraction procedures are the
Folch et al. (1957) technique and its simplified version, the Bligh and Dyer (1959)
technique. Modified versions of these techniques were applied in numerous studies on
marine mammals (e.g., "Folch": Walton et al. 2000; Hooker et al. 2001; Staniland and
Appendix 1
148
Pond 2004; Käkelä et al. 2005; "Bligh and Dyer": Iverson et al. 1997b; Brown et al.
1999; Lea et al. 2002a; Best et al. 2003).
Folch et al. (1957) first developed the chloroform:methanol:water phase system (8:4:3
v/v/v), which mixes polar (methanol) and non-polar (chloroform) solvents necessary to
dissolve a wide range of lipids (and all the marine ones). First, lipids are extracted by
homogenising the tissue with 2:1 chloroform:methanol (v:v) for a final dilution of 20-
fold the volume of the tissue sample (e.g., 1g of tissue diluted in 20 mL). Second, saline
water is added to the system for a final ratio of 8:4:3 chloroform:methanol:water
(v:v:v). A biphasic system is obtained with the lower phase containing most of the
tissue lipids. Bligh and Dyer (1959) based their method on Folch et al. (1957) but used
less solvent (1 part sample to 3 parts solvent instead of 20 for the Folch method).
However, this method underestimates the lipid content of samples containing more than
2% of lipids and should not be used without modification for the quantification of lipids
in marine animals (Iverson et al. 2001). In the present project, a modified version of the
Folch method was used to analyse the samples.
Oxidation of samples
Lipids can oxidize in contact with air before storage and when frozen. Indeed,
peroxidation of lipids occurred in some tissues at temperatures lower than –20ºC
(Pizzocaro et al. 1980; Whiteley et al. 1992). Some of the blubber samples used in the
present project were stored at –20ºC for up to 5 years before being processed. In
addition, fish and squid specimens were homogenised at room temperature and freeze-
dried before storage at –20ºC. Thus, the potential for oxidation occurring in these
samples before analysis must be considered. To my knowledge, only one study on the
effect of the blubber decomposition on FA composition has been reported (Learmonth
2006), in which there was little evidence of lipid oxidation after 566 days at –20ºC. It
was hypothesised that this lack of oxidation was due to the presence of natural tissue
antioxidants (Christie 2003). Also, the outer surface of the blubber samples, which
oxidise more rapidly than the inside tissue, were removed before analysis in Learmonth
(2006). Similarly in the present project, the tissue at the surface of the blubber sample
was removed. However, the effect of long-term storage at –20ºC on FA composition of
blubber and prey type tissues was not specifically tested here.

Appendix 1
149
During the lipid analysis, butylated hydroxy toluene (BHT) was added to the
chloroform:methanol 2:1 mixture to a percentage of 0.01% of the total solvent
system. BHT acts as an antioxidant, does not interfere with the extraction process,
and allows a safe storage of lipid extracts at –20ºC (Wren and Szczepanowska
1964; Christie 1989), before the FA methylation.
Fatty acid methylation
Which method to choose?
FAs are difficult to analyse by gas chromatography because of their poor peak shape
and quantification. Their conversion to volatile derivatives is necessary to improve their
solubility and thus ensuring better gas chromatographic peak shape and quantification
(Christie 1989). Methyl esters are by far the favourite derivatives for gas chromatograph
(GC) analysis of FAs (Christie 1993). The most common methylating catalysts are
boron trifluoride (BF3) and sulphuric acid (H2SO4). Heating is required for completion
of the esterification reaction and FA methyl esters (FAMEs) are extracted with alkanes
such as hexane, following by the injection into a GC. Although BF3 and H2SO4 produce
equivalent results (e.g., Iverson et al. 1997a; Thiemann et al. 2004b), some laboratories
experienced problems with the use of BF3, such as moisture in the reagent avoiding
complete esterification (Budge et al. 2006), and damage to the GC column (e.g., Lepage
and Roy 1984). Several precautions need to be applied with this reagent i.e., the use of
refrigerated fresh reagents only, and a low concentration in methanol to avoid its
degradation (apparition of flakes, personal observation). Although it is now
recommended to use its equivalent H2SO4 (Budge et al. 2006), BF3 is still highly
popular probably because it can be purchased from commercial suppliers and have a
shelf life time of several months (Christie 1993), whereas H2SO4 needs to be prepared
weekly (Budge et al. 2006). Another advantage of BF3 is that it methylates both TAG
and free FAs, these last ones resulting from the oxidation of the sample.
An alternative procedure for the formation of methyl esters is the direct
transesterification, in which lipid extraction and methylation are done in one step. It is
simpler and faster analysis, using less organic solvents, and showed to have comparable
results to the traditional two-step procedure (Lepage and Roy 1984; Grahl-Nielsen and

Appendix 1
150
Barnung 1985; Lui 1994; Guillou et al. 1996; Cantellops et al. 1999; Thiemann et al.
2004b; Indarti et al. 2005). It involves the treatment of a small tissue sample (< 25 mg)
with generally a solution of HCl in methanol. Despite these advantages, its use in
marine lipid studies is still limited. In marine mammal studies, only Grahl-Nielsen’s
group is using this technique routinely (e.g., Andersen et al. 2004; Birkeland et al.
2005; Grahl-Nielsen et al. 2005). The fact that only a small sample of tissue can be used
may be a problem for blubber, in which FA composition varies within the depth
(Iverson 2002). Thus, a little sample cannot provide an accurate representation of the
FA composition of the full depth or even a selected depth of the blubber core
(Thiemann et al. 2004b). Direct esterification can still be appropriate for homogeneous
samples such as milk and homogenised fish. However, it cannot give accurate estimates
of the fat content of the prey types (Budge et al. 2006), which is needed in quantitative
models of FA analysis (Iverson et al. 2004) and in nutritional studies of marine
resources (e.g., Nichols et al. 1994; Lea et al. 2002c; Phillips et al. 2002; Kitts et al.
2004)
The use of picolinyl derivatives, instead of methyl ester derivatives, has been used
extensively to study the lipids of plants and marine invertebrates (e.g., Plants: Van
Boven et al. 2000; Wolff and Christie 2002; Tsydendambaev et al. 2004; marine
invertebrates: Nechev et al. 2004; Kawashima 2005). However, their use in upper
marine taxa is limited. They were recently subject to a discussion in Marine Mammal
Science (Budge et al. 2007; Wetzel et al. 2007), following the review of Budge et al.
(2006) on FA methods. Although this technique coupled with the use of a GC-MS has
been shown to produce more accurate results than the more common methyl esters with
a GC-FID (Wetzel and Reynolds III 2004), the separation of some monounsaturated FA
isomers, important dietary tracers, is not easy, and not all laboratories have access to a
GC-MS, which is more expensive than a GC-FID (Wetzel and Reynolds III 2004;
Budge et al. 2007).
For this project, direct esterification was not suitable because 1) stratification occurs
within the blubber of New Zealand sea lions (L. Donaldson et al., unpubl. data) thus a
full blubber core needed to be analysed to study the long-term diet; 2) the fat content of
the prey types needed to be accurately estimated for the application of quantitative

Appendix 1
151
models. Moreover, the use of picolinyl esters was not considered, as there was no access
to a GC-MS. Thus, FAs were methylated from a lipid extract and analysed through a
GC-FID. BF3 was the methylating reagent. It was purchased in small volumes at a time
(100 mL) to use only a fresh reagent (less than one year old), and in low concentration
(10% in methanol) to avoid degradation.
Loss of fatty acids during methylation?
Lipids are stored in the adipose tissues of marine mammals in different forms, the most
common ones being triacylglycerols (TAGs) and wax esters (WEs) (Iverson 2002;
Christie 2003). TAGs consist of three FAs esterified to a glycerol backbone. In the
intestine of the predator, the FAs and the monoglycerol are released by the digestive
enzymes, absorbed by the epithelial cells of the mucosa, and are re-formed into TAG
(with the exception of carbon chain < 14). WEs consist of a FA esterified to a fatty
alcohol and when digested, the FA is separated from the fatty alcohol. Then the fatty
alcohol is oxidised to its corresponding FA (same number of carbons with same double
bond positions). The resulting two FAs from the WE molecule are absorbed and formed
into TAG (Budge et al. 2006). Thus, when analysing a prey containing a large amount
of WEs, both the FAs and the fatty alcohols must be analysed to determine the FA
composition of all the lipids ingested (Budge et al. 2006). However, the types of
samples analysed in this project were blubber and prey type (fish, cephalopod or
crustacean). TAGs make up the majority of the lipids in blubber (Iverson 2002; Christie
2003) and in the studied prey species (Vlieg and Body 1988). Consequently, the
samples were not analysed for the fatty alcohols in WEs, believed to be in minor
proportion in the lipid extracts analysed.
Gas chromatograph analysis
Methyl esters were analysed on a gas chromatograph GC-17A (Shimadzu Corporation,
Kyoto, Japan) equipped with a flame ionisation detector (FID). It was connected to
computerized integration system (CLASS-VP version 7.3, Shimadzu Scientific
Instruments, Inc., Columbia, MD) to identify and quantify the FAMEs present in the
samples. Samples were injected into two highly polar columns: a 50% cyanopropyl
polysiloxane column (30 m × 0.25 mm i.d., 0.25 µm film thickness; DB-23 from J&W
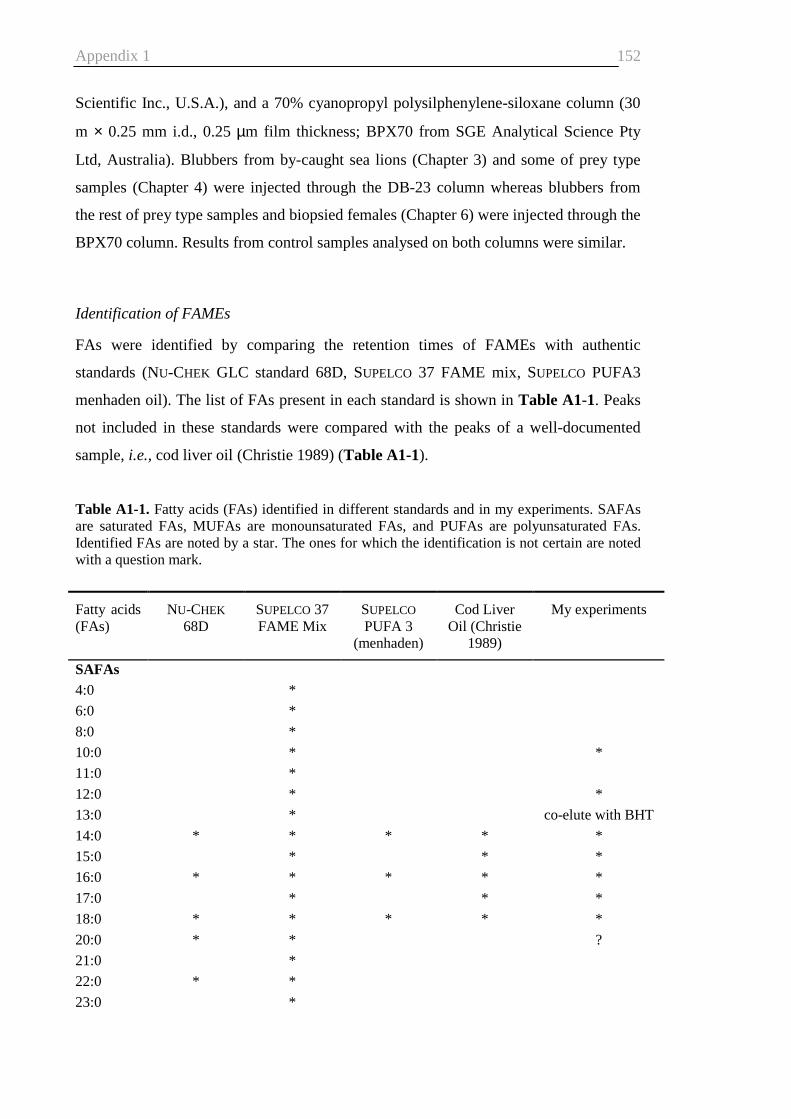
Appendix 1
152
Scientific Inc., U.S.A.), and a 70% cyanopropyl polysilphenylene-siloxane column (30
m × 0.25 mm i.d., 0.25 µm film thickness; BPX70 from SGE Analytical Science Pty
Ltd, Australia). Blubbers from by-caught sea lions (Chapter 3) and some of prey type
samples (Chapter 4) were injected through the DB-23 column whereas blubbers from
the rest of prey type samples and biopsied females (Chapter 6) were injected through the
BPX70 column. Results from control samples analysed on both columns were similar.
Identification of FAMEs
FAs were identified by comparing the retention times of FAMEs with authentic
standards (NU-CHEK GLC standard 68D, SUPELCO 37 FAME mix, SUPELCO PUFA3
menhaden oil). The list of FAs present in each standard is shown in Table A1-1. Peaks
not included in these standards were compared with the peaks of a well-documented
sample, i.e., cod liver oil (Christie 1989) (Table A1-1).
Table A1-1. Fatty acids (FAs) identified in different standards and in my experiments. SAFAs are saturated FAs, MUFAs are monounsaturated FAs, and PUFAs are polyunsaturated FAs. Identified FAs are noted by a star. The ones for which the identification is not certain are noted with a question mark.
Fatty acids (FAs)
NU-CHEK 68D
SUPELCO 37 FAME Mix
SUPELCO
PUFA 3 (menhaden)
Cod Liver Oil (Christie
1989)
My experiments
SAFAs
4:0 *
6:0 *
8:0 *
10:0 * *
11:0 *
12:0 * *
13:0 * co-elute with BHT
14:0 * * * * *
15:0 * * *
16:0 * * * * *
17:0 * * *
18:0 * * * * *
20:0 * * ?
21:0 *
22:0 * *
23:0 *
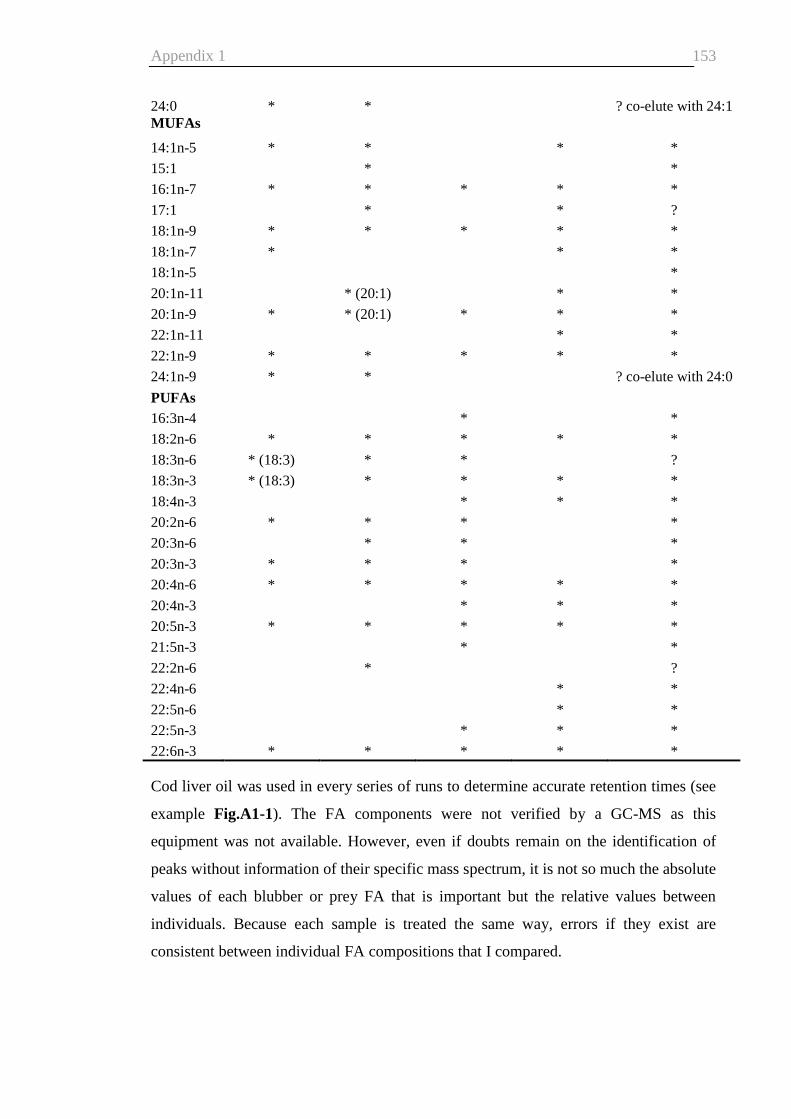
Appendix 1
153
24:0 * * ? co-elute with 24:1 MUFAs
14:1n-5 * * * *
15:1 * *
16:1n-7 * * * * *
17:1 * * ?
18:1n-9 * * * * *
18:1n-7 * * *
18:1n-5 *
20:1n-11 * (20:1) * *
20:1n-9 * * (20:1) * * *
22:1n-11 * *
22:1n-9 * * * * *
24:1n-9 * * ? co-elute with 24:0
PUFAs
16:3n-4 * *
18:2n-6 * * * * *
18:3n-6 * (18:3) * * ?
18:3n-3 * (18:3) * * * *
18:4n-3 * * *
20:2n-6 * * * *
20:3n-6 * * *
20:3n-3 * * * *
20:4n-6 * * * * *
20:4n-3 * * *
20:5n-3 * * * * *
21:5n-3 * *
22:2n-6 * ?
22:4n-6 * *
22:5n-6 * *
22:5n-3 * * *
22:6n-3 * * * * * Cod liver oil was used in every series of runs to determine accurate retention times (see
example Fig.A1-1). The FA components were not verified by a GC-MS as this
equipment was not available. However, even if doubts remain on the identification of
peaks without information of their specific mass spectrum, it is not so much the absolute
values of each blubber or prey FA that is important but the relative values between
individuals. Because each sample is treated the same way, errors if they exist are
consistent between individual FA compositions that I compared.

Minutes0 2 4 6 8 10 12 14 16 18 20 22 24 26 28 30 32 34
uVol
ts
-500
0
500
1000
1500
2000
2500
3000
3500
4000
4500
C1
0:0
C1
2:0
BH
T
C1
4:0
C1
4:1
C
15
:0
C1
5:1
C1
6:0
C1
6:1
n-7
C
17
:0
C1
6:3
n-4
C1
6:4
n-1
C1
8:0
C1
8:1
n-9
tC
18
:1n
-9c
C1
8:1
n-7
C1
8:1
n-5
C1
8:2
n-6
C1
8:3
n-6
?C
18
:3n
-3
C1
8:4
n-3
C2
0:0
? C2
0:1
n-1
1C
20
:1n
-9 C
20
:2n
-6
C2
0:3
n-6
C2
0:4
n-6
C2
0:3
n-3 C
20
:4n
-3
C2
0:5
n-3
C2
2:1
n-1
1C
22
:1n
-9
C2
1:5
n-3
C2
2:4
n-6
C2
4:0
& C
24
:1
C2
2:5
n-6
C2
2:5
n-3
C2
2:6
n-3
FIDCLO2-1 new7
Name
Figure A1-1. Chromatograph of cod liver oil FAMEs separated on a 50% cyanopropyl polysiloxane column (30 m × 0.25 mm; J&W DB-23, Folsom, California). The oven was maintained at 140ºC for 4min, then was raised at 25ºC/min to 190ºC, held for 5min, and was raised at 2ºC/min to 240ºC, where it remains for a further 4min (Total run = 40min). Helium was the carrier gas at a velocity of 20cm/s. The split ratio was 83:1.
Appendix 1
155
Validation of GC results
Standard Nu-Chek 68D (Nu-Chek, U.S.A.) was run to validate the GC equipment and
the conditions of injection such as the quality of the column, the quality of the manual
injection, the oven’s temperature programme and the interpretation of the
chromatograph, before running the first samples. Nu-Chek provided the weight of each
FA in percentage contribution of the total FA content (Table A1-2), which was
compared to the % weight obtained with the GC, after taking into account FID
correction factors (Ackman and Sipos 1964): Initially, Nu-Chek 68D was injected 10
times and the average FA composition was compared with actual values obtained by the
manufacturer to calculate the calibration coefficients (CC, Table A1-2). Most of them
equal one, i.e., there was a good match between the actual % and what I found. The GC
overestimated slightly the weight of the lightest FAs 14:0 and 16:0 (CC of 0.9) and
underestimated slightly the weight of the heaviest FA 22:6n-3 (CC of 1.1). The
variations to the actual values were reduced by changing the conditions of the injection
(e.g., way of injecting, volume injected, oven’s temperature programme, carrier gas
velocity), and the results shown in Table A1-2 were with the optimum conditions. CCs
were extrapolated to FAs not present in the standard but considered in my experiments:
0.9 was applied to all FAs that eluted between 14:0 and 16:0 (Fig. A1-1, Table A1-2),
1.1 was applied to FAs that eluted after 20:5n-3.
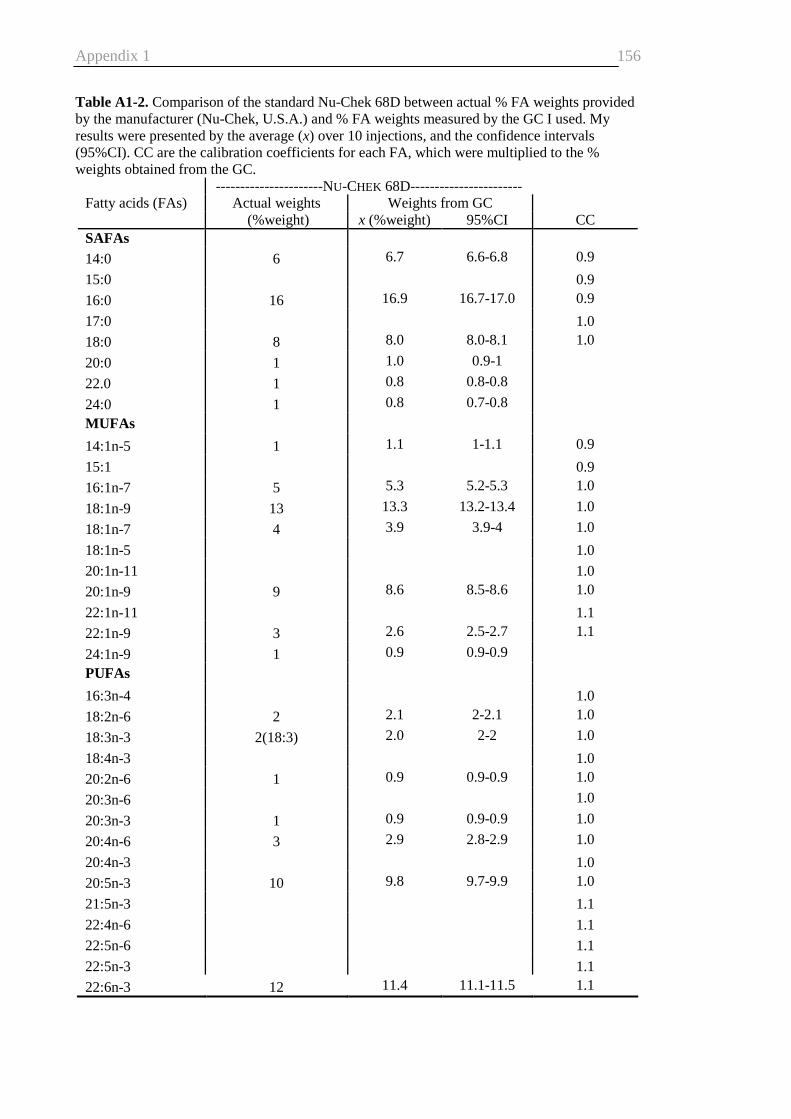
Appendix 1
156
Table A1-2. Comparison of the standard Nu-Chek 68D between actual % FA weights provided by the manufacturer (Nu-Chek, U.S.A.) and % FA weights measured by the GC I used. My results were presented by the average (x) over 10 injections, and the confidence intervals (95%CI). CC are the calibration coefficients for each FA, which were multiplied to the % weights obtained from the GC.
----------------------NU-CHEK 68D----------------------- Fatty acids (FAs) Actual weights Weights from GC (%weight) x (%weight) 95%CI CC SAFAs
14:0 6 6.7 6.6-6.8 0.9
15:0 0.9
16:0 16 16.9 16.7-17.0 0.9
17:0 1.0
18:0 8 8.0 8.0-8.1 1.0
20:0 1 1.0 0.9-1
22.0 1 0.8 0.8-0.8
24:0 1 0.8 0.7-0.8
MUFAs
14:1n-5 1 1.1 1-1.1 0.9
15:1 0.9
16:1n-7 5 5.3 5.2-5.3 1.0
18:1n-9 13 13.3 13.2-13.4 1.0
18:1n-7 4 3.9 3.9-4 1.0
18:1n-5 1.0
20:1n-11 1.0
20:1n-9 9 8.6 8.5-8.6 1.0
22:1n-11 1.1
22:1n-9 3 2.6 2.5-2.7 1.1
24:1n-9 1 0.9 0.9-0.9
PUFAs
16:3n-4 1.0
18:2n-6 2 2.1 2-2.1 1.0
18:3n-3 2(18:3) 2.0 2-2 1.0
18:4n-3 1.0
20:2n-6 1 0.9 0.9-0.9 1.0
20:3n-6 1.0
20:3n-3 1 0.9 0.9-0.9 1.0
20:4n-6 3 2.9 2.8-2.9 1.0
20:4n-3 1.0
20:5n-3 10 9.8 9.7-9.9 1.0
21:5n-3 1.1
22:4n-6 1.1
22:5n-6 1.1
22:5n-3 1.1
22:6n-3 12 11.4 11.1-11.5 1.1

Appendix 1
157
Degradation of FAME extracts over time?
FAMEs are volatile compounds. The degree of volatility depends on the number of
carbons, the number of bonds and the location of the bond. In general, the less carbons
and the more bonds a FA has, the more volatile it is. Because of this property, FAMEs
could evaporate each time the tube containing them was open, affecting the composition
of the sample. I tested the effect of time on the composition of the FAME extracts, by
injecting the same extract (cod liver oil) at different intervals over time (Fig. A1-2). The
sample was kept at –20ºC between injections. Fig. A1-2 showed that the proportions of
FAs of the same sample varied slightly over time with no apparent trend. However, the
FAME extracts were injected regularly within two weeks of their preparation.
PROTOCOL ADOPTED
Lipid extraction
Lipids from blubber were extracted following the Folch method (Folch et al. 1957),
using a chloroform:methanol:water (CHCl3:MeOH:H2O) mixture. Approximately 0.5 g
0
2
4
6
8
10
12
14
16
18
20
22
0 10 20 30 40 50 60 70
Time between preparation of FAMEs and GC injection (days)
% m
ass
of
tota
l F
A
C14:0
C16:0
C16:1n-7
C18:0
C18:1n-9
C18:1n-7
C18:2n-6
C20:5n-3
C22:5n-3
C22:6n-3
Figure A1-2. % mass of the main FAs from the same sample (cod liver oil) injected over time

Appendix 1
158
of blubber (whole core) was sub-sampled from the bulk sample. The sample was then
cut in small pieces to assist homogenisation. The pieces were accurately weighed,
placed in a glass homogeniser (15 mL, Wheaton, U.S.A), and homogenised in 15 mL of
chloroform:methanol (2:1, v:v) containing 0.01% butylated hydroxytoluene (BHT) as
an antioxidant. The homogeniser was left for 10 min in ice to avoid evaporation of the
solvents. The extract was filtered through a glass microfibre filter (GC/C, Whatman,
U.K.), transferred to a glass centrifuge screw top tube (50 mL Pyrex, Cole-Parmer
International, U.S.A), and washed with 1% sodium chloride (NaCl) to a final ratio of
chloroform:methanol:water 8:4:3 (v/v/v). Centrifugation (5808R centrifuge, Eppendorf)
was for 10 min at 1000G at 10ºC. The upper methanol:water layer was removed with a
water suction pump. The lower chloroform layer was then dehydrated with anhydrous
sodium sulphate (Na2SO4). The lipid extract with chloroform was transferred to a pre-
weighed round bottom flask and the solvent was removed by rotary evaporation (Büchi
rotovapor, Switzerland) using a water bath at approximately 38°C. The vacuum in the
rotary evaporator prevents any oxidation of the lipid while in the water bath. The rotary
evaporation was stopped when a constant weight was obtained (no solvent left). The
weight of the lipid extracted from the sample was calculated by subtracting the weight
of the empty flask from the final weight of the flask and lipids. After weighing, 3 mL of
chloroform was added to the flask, and the content transferred to a glass screw top tube
(13 mL Kimax tube, Kimble Glass, U.S.A). An aliquot of 30 mg was taken to dryness
by rotary evaporation for methylation process. The remaining lipids were kept in
chloroform and the tube was capped under nitrogen before storage at –20°C.
Fatty acid methylation
FA methyl esters (FAMEs) were prepared directly from 30 mg of the pure extracted
lipid following Morrison & Smith (1964). The extracted lipid was dissolved in toluene
(1.5 mL) and transferred into a glass centrifuge screw top tube (50 mL Pyrex, Cole-
Parmer International, U.S.A), where 1.5 mL of 10% boron trifluoride in methanol
(methylating reagent) was added. The tube was capped under nitrogen, and heated at
50°C in a water bath for 14 to 19 h (overnight).
At this point, the protocol detailed in Learmonth (2006) was followed: After heating,
the extract was cooled to room temperature. Water (5 mL) containing 5% sodium
chloride was added, and the extract was shaken and then left to settle until the layers

Appendix 1
159
were separated. The FAMEs were then extracted into 5 mL of hexane, which was again
shaken and left to settle. Once separated, the upper organic layer was removed by
pipette into a glass screw top tube (24 mL Kimax tube, Kimble Glass, U.S.A). The
process was then repeated. The organic layers were combined and washed with 4 mL of
water containing 2% potassium bicarbonate (NaHCO3) to stop potential saponification.
Once the layers had clearly separated, the upper organic layer was transferred to a glass
screw top tube (13 mL Kimax tube, Kimble Glass, U.S.A) containing approximately
one-third anhydrous sodium sulphate to remove traces of water. The tube was stored at
– 20°C prior to chromatographic analysis (no more than two weeks).
Gas chromatograph analysis
Analysis of FAMEs was carried out using temperature-programmed gas–liquid
chromatography performed with a Shimadzu Gas Chromatograph GC-17A (Shimadzu
Corporation, Kyoto, Japan) equipped with a flame ionisation detector (FID), and fitted
with a 30 m × 0.25 mm i.d. column (50% cyanopropyl polysiloxane, 0.25 µm film
thickness, DB-23, J&W, U.S.A.; or 70% cyanopropyl polysilphenylene-siloxane
column, 0.25 µm film thickness, BPX70, SGE Analytical Science, Australia). Helium
was the carrier gas with a flow rate of 1.3 mL/min. FAMEs (1 to 2 µL) were injected
manually (5 µL fixed needle syringe, Hamilton Company, U.S.A.) in split mode (50:1)
at an injection port temperature of 250°C. The detector temperature was set at 270°C.
Two oven temperatures programmes were used depending of the sample. The first one
started at 140°C for 4 min, rose to 190°C at 25°C min–1, held for 5 min, then to 240°C at
2°C min–1, and held for another 4 min (total of 40 min), and was preferred for blubber
samples. The second one started at 50°C for 2 min, rose to 180°C at 25°C min–1, held
for 5 min, rose again to 200°C at 2°C min–1, then to 240°C at 2.1°C min–1 (total of 42.2
min), and was preferred for prey type samples.
FA components were identified by comparison of retention time data to authentic (Nu-
Chek 68D, Supelco 37 FAME mix, Matreya menhaden oil) and laboratory standards
(cod liver oil). Cod liver oil was used at every series of runs to determine accurate
retention times. Nu-Chek 68D was injected every month to check the quantitation of
each FA. Peak areas were measured by a computerised integration system attached to
the GC (CLASS-VP version 7.3, Shimadzu Scientific Instruments, Inc., Columbia,
MD). Each chromatogram was checked to ensure correct identification. Some minor
Appendix 1
160
peaks were identified with uncertainty and were thus not included in the final
normalisation. FAs were designated by the shorthand notation of carbon chain
length:number of double bonds and location (n-x) of the double bond nearest to the
terminal methyl group. Quantitation of FA was done using theoretical response factors
calculated according to Ackman & Sipos (1964).
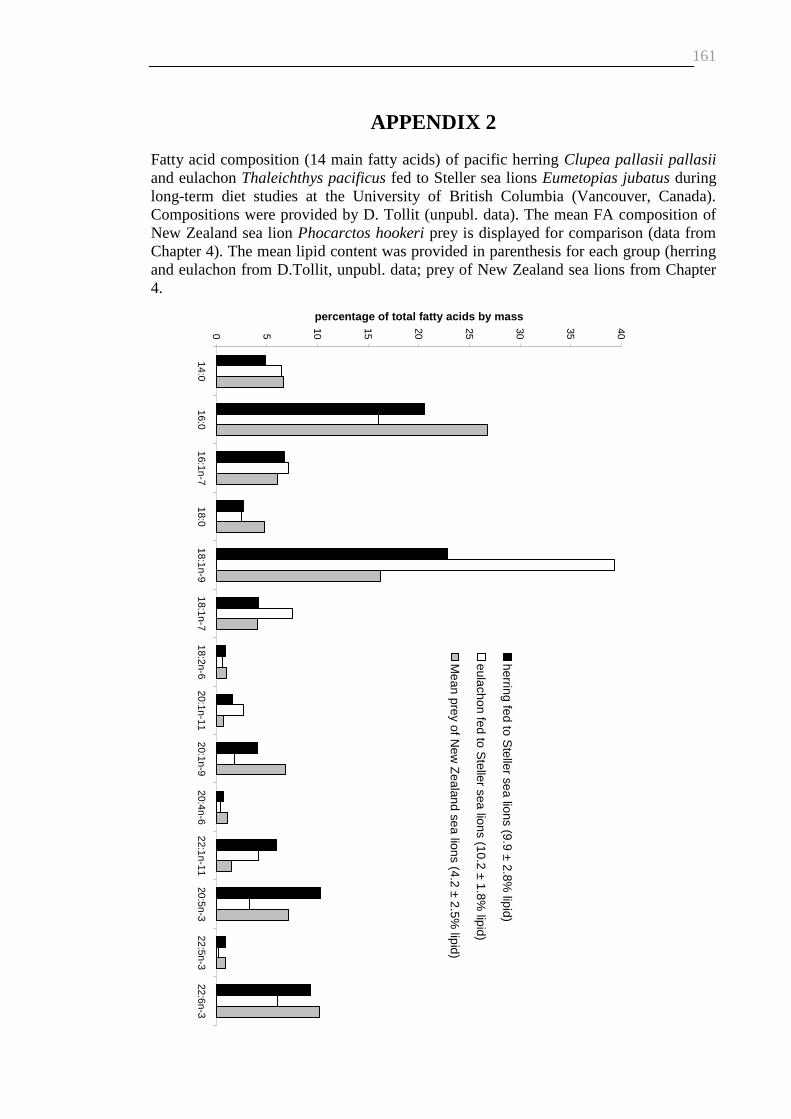
161
APPENDIX 2
Fatty acid composition (14 main fatty acids) of pacific herring Clupea pallasii pallasii and eulachon Thaleichthys pacificus fed to Steller sea lions Eumetopias jubatus during long-term diet studies at the University of British Columbia (Vancouver, Canada). Compositions were provided by D. Tollit (unpubl. data). The mean FA composition of New Zealand sea lion Phocarctos hookeri prey is displayed for comparison (data from Chapter 4). The mean lipid content was provided in parenthesis for each group (herring and eulachon from D.Tollit, unpubl. data; prey of New Zealand sea lions from Chapter 4.
0 5 10 15 20 25 30 35 40
14:016:0
16:1n-718:0
18:1n-918:1n-7
18:2n-620:1n-11
20:1n-920:4n-6
22:1n-1120:5n-3
22:5n-322:6n-3
percentage of total fatty acids by mass
herring fed to Steller sea lions (9.9 ± 2.8%
lipid)
eulachon fed to Steller sea lions (10.2 ± 1.8%
lipid)
Mean prey of N
ew Z
ealand sea lions (4.2 ± 2.5% lipid)

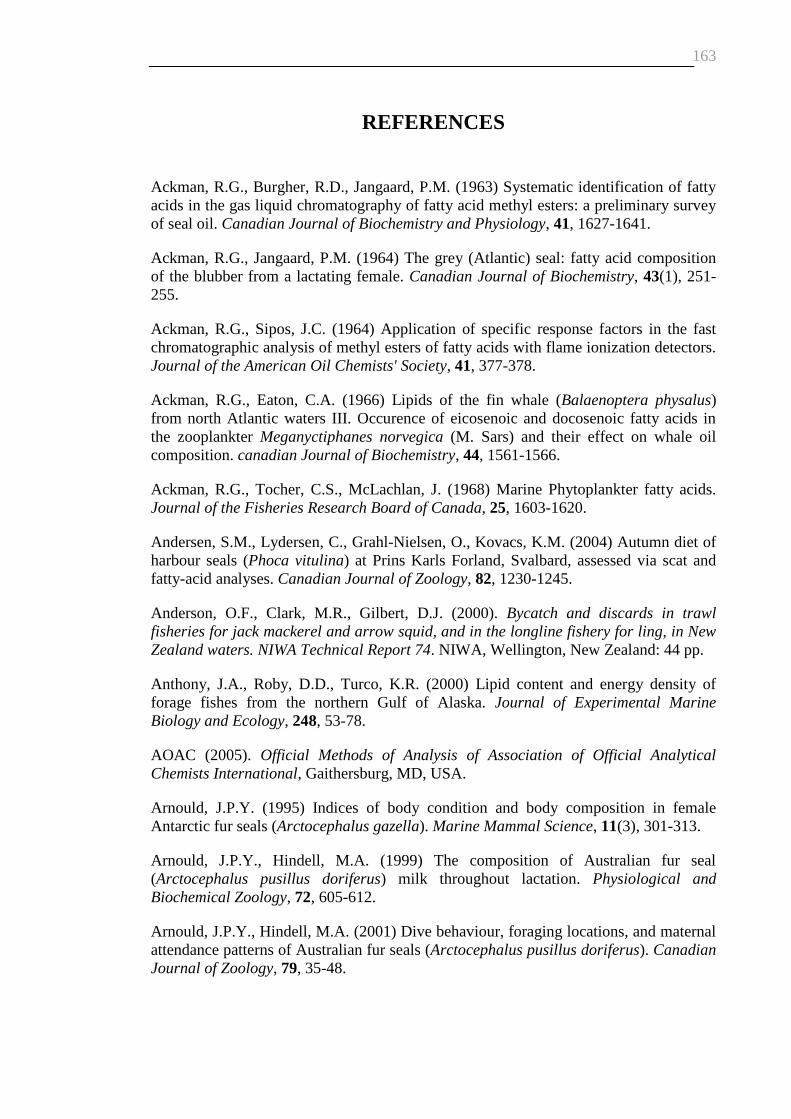
163
REFERENCES
Ackman, R.G., Burgher, R.D., Jangaard, P.M. (1963) Systematic identification of fatty acids in the gas liquid chromatography of fatty acid methyl esters: a preliminary survey of seal oil. Canadian Journal of Biochemistry and Physiology, 41, 1627-1641.
Ackman, R.G., Jangaard, P.M. (1964) The grey (Atlantic) seal: fatty acid composition of the blubber from a lactating female. Canadian Journal of Biochemistry, 43(1), 251-255.
Ackman, R.G., Sipos, J.C. (1964) Application of specific response factors in the fast chromatographic analysis of methyl esters of fatty acids with flame ionization detectors. Journal of the American Oil Chemists' Society, 41, 377-378.
Ackman, R.G., Eaton, C.A. (1966) Lipids of the fin whale (Balaenoptera physalus) from north Atlantic waters III. Occurence of eicosenoic and docosenoic fatty acids in the zooplankter Meganyctiphanes norvegica (M. Sars) and their effect on whale oil composition. canadian Journal of Biochemistry, 44, 1561-1566.
Ackman, R.G., Tocher, C.S., McLachlan, J. (1968) Marine Phytoplankter fatty acids. Journal of the Fisheries Research Board of Canada, 25, 1603-1620.
Andersen, S.M., Lydersen, C., Grahl-Nielsen, O., Kovacs, K.M. (2004) Autumn diet of harbour seals (Phoca vitulina) at Prins Karls Forland, Svalbard, assessed via scat and fatty-acid analyses. Canadian Journal of Zoology, 82, 1230-1245.
Anderson, O.F., Clark, M.R., Gilbert, D.J. (2000). Bycatch and discards in trawl fisheries for jack mackerel and arrow squid, and in the longline fishery for ling, in New Zealand waters. NIWA Technical Report 74. NIWA, Wellington, New Zealand: 44 pp.
Anthony, J.A., Roby, D.D., Turco, K.R. (2000) Lipid content and energy density of forage fishes from the northern Gulf of Alaska. Journal of Experimental Marine Biology and Ecology, 248, 53-78.
AOAC (2005). Official Methods of Analysis of Association of Official Analytical Chemists International, Gaithersburg, MD, USA.
Arnould, J.P.Y. (1995) Indices of body condition and body composition in female Antarctic fur seals (Arctocephalus gazella). Marine Mammal Science, 11(3), 301-313.
Arnould, J.P.Y., Hindell, M.A. (1999) The composition of Australian fur seal (Arctocephalus pusillus doriferus) milk throughout lactation. Physiological and Biochemical Zoology, 72, 605-612.
Arnould, J.P.Y., Hindell, M.A. (2001) Dive behaviour, foraging locations, and maternal attendance patterns of Australian fur seals (Arctocephalus pusillus doriferus). Canadian Journal of Zoology, 79, 35-48.

164
Arnould, J.P.Y., Nelson, M.M., Nichols, P.D., Oosthuizen, W.H. (2005) Variation in the fatty acid composition of blubber in Cape fur seals (Arctocephalus pusillus pusillus) and the implications for dietary interpretation. Journal of Comparative Physiology B, 175, 285-295.
Atkinson, S.K., Calkins, D.G., Burkanov, V., Castellini, M.A., Hennen, D., Inglis, S.D. (2008) Impact of changing diet regimes on Steller sea lion body condition. Marine Mammal Science, 24(2), 276-289.
Auel, H., Harjes, M., da Rocha, R., Stübing, D., Hagen, W. (2002) Lipid biomarkers indicate different ecological niches and trophic relationships of the Arctic hyperiid amphipods Themisto abyssorum and T. libellula. Polar Biology, 25, 374-383.
Ayling, T., Cox, G.J. (1982). Collins Guide to the Sea Fishes of New Zealand. Collins, Auckland, New Zealand: 343 pp.
Baird, S.J. (2005a) Incidental capture of Phocarctos hookeri (New Zealand sea lions) in New Zealand commercial fisheries, 2001-02. New Zealand Fisheries Assessment Report, 2005/8, 17.
Baird, S.J. (2005b) Incidental capture of Phocarctos hookeri (New Zealand sea lions) in New Zealand commercial fisheries, 2002-03. New Zealand Fisheries Assessment Report, 2005/9, 13.
Baker, A.N. (1999) Unusual mortality of the New Zealand sea lion, Phocarctos hookeri, Auckland Islands, January-February 1998. Department of Conservation, Wellington, N.Z. : 84p.
Baylis, A.M.M., Page, B., Peters, K., McIntosh, R., McKenzie, J., Goldsworthy, S.D. (2005) The ontogeny of diving behaviour in New Zealand fur seal pups (Arctocephalus forsteri). Canadian Journal of Zoology, 83, 1149-1161.
Beck, C.A., Bowen, W.D., Iverson, S.J. (2003) Sex differences in the seasonal patterns of energy storage and expenditure in a phocid seal. Journal of Animal Ecology, 72, 280-291.
Beck, C.A., Iverson, S.J., Bowen, W.D. (2005) Blubber fatty acids of gray seals reveal sex differences in the diet of a size-dimorphic marine carnivore. Canadian Journal of Zoology, 83, 377-388.
Beck, C.A., Iverson, S.J., Bowen, W.D., Blanchard, W. (2007a) Sex differences in grey seal diet reflect seasonal variation in foraging behaviour and reproductive expenditure: evidence from quantitative fatty acid signature analysis. Journal of animal ecology, 76, 490-502.
Beck, C.A., Rea, L.D., Iverson, S.J., Kennish, J.M., Pitcher, K.W., Fadely, B.S. (2007b) Blubber fatty acid profiles reveal regional, seasonal, age-class and sex differences in the diet of young Steller sea lions in Alaska. Marine Ecology Progress Series, 338, 269-280.

165
Beentjes, M.P., Bull, B., Hurst, R.J., Bagley, N.W. (2002) Demersal fish assemblages along the continental shelf and upper slope of the east coast of the South Island, New Zealand. New Zealand Journal of Marine and Freshwater Research, 36, 197-223.
Best, N.J., Bradshaw, C.J.A., Hindell, M.A., Nichols, P.D. (2003) Vertical stratification of fatty acids in the blubber of southern elephant seals (Mirounga leonina): implications for diet analysis. Comparative Biochemistry and Physiology part B, 134, 253-263.
Bigg, M.A., Fawcett, I. (1985) Two biases in diet determination of northern fur seals (Callorhinus ursinus). In: Beddington, J.R., Beverton, R.J.H. & Lavigne, D.M. (Eds). Marine Mammals and Fisheries. George Allen & Unwin, London: 284-291.
Birkeland, A., Kovacs, K.M., Lydersen, C., Grahl-Nielsen, O. (2005) Transfer of fatty acids from mother to their calves during lactation in white whales Delphinapterus leucas. Marine Ecology Progress Series, 298, 287-294.
Blaber, S.J.M., Bulman, C.M. (1987) Diets of fishes of the upper continental slope of eastern Tasmania: content, calorific values, dietary overlap and trophic relationships. Marine Biology, 95, 345-356.
Bligh, E.G., Dyer, W.J. (1959) A rapid method of total lipid extraction and purification. Canadian Journal of Biochemistry and Physiology, 37, 911-917.
Bolnick, D.I., Svanbäck, R., Fordyce, J.A., Yang, L.H., Davis, J.M., Hulsey, C.D., Forister, M.L. (2003) The ecology of individuals: incidence and implications of individual specialization. The American Naturalist, 161(1), 1-28.
Boveng, P.L., Hiruki, L.M., Schwartz, M.K., Bengtson, J.L. (1998) Population growth of Antarctic fur seals: Limitation by a top predator, the leopard seal? Ecology, 79, 2863-2877.
Bowen, W.D. (1997) Role of marine mammals in aquatic ecosystems. Marine Ecology Progress Series, 158, 267-274.
Bowen, W.D. (2000) Reconstruction of pinniped diets: accounting for complete digestion of otoliths and cephalopod beaks. Canadian Journal of Fisheries and Aquatic Sciences, 57, 898-905.
Boyd, I.L., Arnould, J.P.Y., Barton, T., Croxall, J.P. (1994) Foraging behaviour of Antarctic fur seals during periods of contrasting prey abundance. Journal of Animal Ecology, 63, 703-713.
Boyd, I.L., Croxall, J.P. (1996) Dive durations in pinnipeds and sea birds. Canadian Journal of Zoology, 74, 1696-1705.
Boyd, I.L., McCafferty, D.J., Reid, K., Taylor, R., Walker, T.R. (1998) Dispersal of male and female Antarctic fur seals (Arctocephalus gazella). Canadian Journal of Fisheries and Aquatic Sciences, 55, 845-852.
Bradford-Grieve, J.M., Probert, P.K., Nodder, S.D., Thompson, D., Hall, J., Hanchet, S., Boyd, P., Zeldis, J., Baker, A.N., Best, H.A., Broekhuizen, N., Childerhouse, S.J., Clark, M., Hadfield, M., Safi, K., Wilkinson, I.S. (2003) Pilot trophic model for

166
subantarctic water over the Southern Plateau, New Zealand: a low biomass, high transfer efficiency system. Journal of Experimental Marine Biology and Ecology, 289, 223-262.
Bradshaw, C.J.A., Hindell, M.A., Best, N.J., Phillips, K.L., Wilson, G., Nichols, P.D. (2003) You are what you eat: describing the foraging ecology of southern elephant seals (Mirounga leonina) using blubber fatty acids. Proceedings of the Royal Society of London B, 270, 1283-1292.
Brown, E.G., Pierce, G.J. (1998) Monthly variation in the diet of harbour seals in inshore waters along the southeast Shetland (UK) coastline. Marine Ecology Progress Series, 167, 275-289.
Brown, D.J., Boyd, I.L., Cripps, G.C., Butler, P.J. (1999) Fatty acid signature analysis from the milk of Antarctic fur seals and southern elephant seals from South georgia: implications for diet determination. Marine Ecology Progress Series, 187, 251-263.
Bryden, M.M., Stokes, G.B. (1969) Metabolism of fatty acids in the southern elephant seal Mirounga leonina. Canadian Journal of Biochemistry, 47(8), 757-760.
Budge, S.M., Iverson, S.J., Bowen, W.D., Ackman, R.G. (2002) Among- and within-species variability in fatty acid signatures of marine fish and invertebrates on the Scotian Shelf, Georges Bank, and southern Gulf of St. Lawrence. Canadian Journal of Fisheries and Aquatic Sciences, 59, 886-898.
Budge, S.M., Cooper, M.H., Iverson, S.J. (2004) Demonstration of the deposition and modification of dietary fatty acids in pinniped blubber using radiolabelled precursors. Physiological and Biochemical Zoology, 77(4), 682-687.
Budge, S.M., Iverson, S.J., Koopman, H.N. (2006) Studying trophic ecology in marine ecosystems using fatty acids: a primer on analysis and interpretation. Marine Mammal Science, 22(4), 759-801.
Budge, S.M., Iverson, S.J., Koopman, H. (2007) Reply to Wetzel et al.'s Comment: "Identification of fatty acids by picolinyl ester derivatives". Marine Mammal Science, 23(4), 991-992.
Budge, S.M., Springer, A.M., Iverson, S.J., Sheffield, G., Rosa, R. (2008) Blubber fatty acid composition of bowhead whales, Balaena mysticetus, Implications for diet assessment and ecosystem monitoring. Journal of Experimental Marine Biology and Ecology, 359, 40-46.
Butler, J.R.A., Middlemas, S.J., Graham, I.M. (2006) Modelling the impacts of removing seal predation from Atlantic salmon, Salmo salar, rivers in Scotland: a tool for targeting conflict resolution. Fisheries Management and Ecology, 13, 285-291.
Campagna, C., Werner, R., Karesh, W., Marín, M.R., Koontz, F., Cook, R., Koontz, C. (2001) Movements and location at sea of South American sea lions (Otaria flavescens). Journal of Zoology, London, 257, 205-220.
Campbell, R.A., Chilvers, B.L., Childerhouse, S.J., Gales, N.J. (2006) Conservation management issues and status of the New Zealand (Phocarctos hookeri) and Australian

167
(Neophoca cinerea) sea lions. In: Trites, A.W., Atkinson, S., DeMaster, D.P., Fritz, L.W., Gelatt, T.S., Rea, L.D. & Wynne, K.M. (Eds). Sea Lions of the World. Alaska Sea Grant College Program, University of Fairbanks, Alaska, USA: 455-469.
Cantellops, D., Reid, A.P., Eitenmiller, R.R., Long, A.R. (1999) Determination of lipids in infant formula powder by direct extraction methylation of lipids and fatty acid methyl esters (FAME) analysis by gas chromatography. Journal of the AOAC International, 82, 1128-1139.
Casaux, R., Baroni, A., Arrighetti, F., Ramón, A. (2003) Geographical variation in the diet of the Antarctic fur seal Arctocephalus gazella. Polar Biology, 26, 753-758.
Casper, R.M., Gales, N.J., Hindell, M.A., Robinson, S.M. (2006) Diet estimation based on an integrated mixed prey feeding experiment using Arctocephalus seals. Journal of Experimental Marine Biology and Ecology, 328, 228-239.
Casper, R.M., Jarman, S.N., Deagle, B.E., Gales, N.J., Hindell, M.A. (2007) Detecting prey from DNA in predator scats: A comparison with morphological analysis, using Arctocephalus seals fed a known diet. Journal of Experimental Marine Biology and Ecology, 347, 144-154.
Castinel, A., Duignan, P.J., Pomroy, W.E., López-Villalobos, N., Gibbs, N.J., Chilvers, B.L., Wilkinson, I.S. (2007a) Neonatal mortality in New Zealand sea lions (Phocarctos hookeri) at Sandy Bay, Enderby Island, Auckland Islands from 1998 to 2005. Journal of Wildlife Diseases, 43(3), 461-474.
Castinel, A., Grinberg, A., Pattison, R., Duignan, P.J., Pomroy, B., Rogers, L., Wilkinson, I.S. (2007b) Characterization of Klebsiella pneumoniae isolates from New Zealand sea lion (Phocarctos hookeri) pups during and after the epidemics on Enderby Island, Auckland Islands. Veterinary Microbiology, 122, 178-184.
Castinel, A., Kittelberger, R., Pomroy, W.E., Duignan, P.J., Chilvers, B.L., Wilkinson, I.S. (2008) Humoral immune response to Klebsiella spp. in New Zealand sea lions (Phocarctos hookeri) and the passive transfer of immunity to pups. Journal of Wildlife Diseases, 44(1), 8-15.
Cawthorn, M.W., Crawley, M., Mattlin, R.H., Wilson, G. (1985) Research on pinnipeds in New Zealand. Wildlife Research Review No. 7. Wildlife Research Liaison Group, Wellington, N.Z.
Cha, M.C., Jones, P.J.H. (1996) Tissue fatty acid deposition is influenced by an interaction of dietary oil source and energy intake level in rats. Journal of Nutritional Biochemistry, 7, 650-658.
Cherel, Y., Guinet, C., Tremblay, Y. (1997) Fish prey of Antarctic fur seals Arctocephalus gazella at Ile de Croy, Kerguelen. Polar Biology, 17, 87-90.
Cherel, Y., Hobson, K.A., Guinet, C., Vanpe, C. (2007) Stable isotopes document seasonal changes in trophic niches and winter foraging individual specialization in diving predators from the Southern Ocean. Journal of Animal Ecology, 76, 826-836.
168
Childerhouse, S.J., Gales, N.J. (1998) Historical and modern distribution and abundance of the New Zealand sea lion Phocarctos hookeri. New Zealand Journal of Zoology, 25, 1-16.
Childerhouse, S.J., Dix, B., Gales, N.J. (2001) Diet of New Zealand sea lions (Phocarctos hookeri) at the Auckland Islands. Wildlife Research, 28, 291-298.
Childerhouse, S.J. (2008). Conservation biology of New Zealand sea lions (Phocarctos hookeri). PhD thesis, University of Otago, Dunedin, New Zealand: 197 pp.
Chilvers, B.L., Wilkinson, I.S., Duignan, P.J., Gemmell, N.J. (2005) Summer foraging areas for lactating New Zealand sea lions Phocarctos hookeri. Marine Ecology Progress Series, 304, 235-247.
Chilvers, B.L., Wilkinson, I.S., Duignan, P.J., Gemmell, N.J. (2006) Diving to extremes: are New Zealand sea lions (Phocarctos hookeri) pushing their limits in a marginal habitat? Journal of Zoology, London, 269, 233-240.
Chilvers, B.L., Robertson, B.C., Wilkinson, I.S., Duignan, P.J. (2007a) Growth and survival of New Zealand sea lions, Phocarctos hookeri: birth to 3 months. Polar Biology, 30(4), 459-469.
Chilvers, B.L., Wilkinson, I.S., Childerhouse, S.J. (2007b) New Zealand sea lion, Phocarctos hookeri, pup production-1995 to 2006. New Zealand Journal of Marine and Freshwater Research, 41, 205-213.
Chilvers, B.L. (2008a) Foraging site fidelity of lactating New Zealand sea lions. Journal of Zoology, London, 276, 28-36.
Chilvers, B.L. (2008b) New Zealand sea lions Phocarctos hookeri and squid trawl fisheries:bycatch problems and management options. Endangered Species Research.
Chilvers, B.L., Wilkinson, I.S. (2008) Philopatry and site fidelity of New Zealand sea lions. Wildlife Research, 35, 463-470.
Chilvers, B.L., Wilkinson, I.S. (2009) Diverse foraging strategies in lactating New Zealand sea lions. Marine Ecology Progress Series, 378, 299-308.
Christiansen, J.S., Gamst Moen, A.-G., Hansen, T.H., Nilssen, K.T. (2005) Digestion of capelin, Mallotus villosus (Muller), herring, Clupea harengus L., and polar cod, Boreogadus saida (Lepechin), otoliths in a simulated seal stomach. ICES Journal of Marine Science, 62(1), 86-92.
Christie, W.W. (1989). Gas chromatography and lipids: a practical guide. The Oily Press, Ayr, U.K.
Christie, W.W. (1993). Advances in Lipid Methodology - two. The Oily Press, Dundee, U.K.
Christie, W.W. (2003). Lipid analysis: isolation, separation, identification and structural analysis of lipids. The Oily Press, Bridgewater, U.K.

169
Clark, M.R. (1985) The food and feeding of seven fish species from the Campbell Plateau, New Zealand. New Zealand Journal of Marine and Freshwater Research, 19, 339-363.
Clark, M.R., Anderson, O.F., Gilbert, D.J. (2000). Discards in trawl fisheries for southern blue whiting, orange roughy, hoki, and oreos in New Zealand waters. NIWA Technical Report 71. NIWA, Wellington, New Zealand: 73 pp.
Clarke, A., Doherty, N., A.L., D., Eastman, J.T. (1984) Lipid content and composition of three species of Antarctic fish in relation to buoyancy. Polar Biology, 3, 77-83.
Clarke, M.R. (1986). A handbook for the identification of cephalopod beaks. Clarendon Press, Oxford, U.K.
Coleman, N., Mobley, M. (1984) Diets of Commercially Exploited Fish from Bass Strait and Adjacent Victorian Waters, Sotuh-eastern Australia. Australian Journal of Marine and Freshwater Research, 35, 549-560.
Cooper, M.H., Iverson, S.J., Heras, H. (2005) Dynamics of blood chylomicron fatty acids in a marine carnivore: implications for lipid metabolism and quantitative estimation of predator diets. Journal of Comparative Physiology B, 175, 133-145.
Cooper, Margaret H.M., Iverson, Sara J.S., Rouvinen-Watt, K.K. (2006) Metabolism of Dietary Cetoleic Acid (22:1n-11) in Mink (Mustela vison) and Gray Seals (Halichoerus grypus) Studied Using Radiolabeled Fatty Acids. Physiological and Biochemical Zoology, 79(4), 820-829.
Cornick, L.A., Neill, W., Grant, W.E. (2006) Assessing competition between Steller sea lions and the commercial groundfishery in Alaska: A bioenergetics modelling approach. Ecological Modelling, 199, 107-114.
Costa, D.P., Le Boeuf, B.J., Huntley, A.C., Ortiz, C.L. (1986) The energetics of lactation in the Northern elephant seal, Mirounga angustirostris. Journal of Zoology, London, 209, 21-33.
Costa, D.P., Trillmich, F. (1988) Mass changes and metabolism during the perinatal fast: a comparison between Antarctic (Arctocephalus gazella) and Galapagos fur seals (Arctocephalus galapagoensis). Physiological Zoology, 61(2), 160-169.
Costa, D.P. (1991) Reproductive and foraging energetics of pinnipeds: Implications for life history patterns. In: Renouf, D. (Ed). Behavior of pinnipeds. Chapman & Hall, London, UK: 300-344.
Costa, D.P. (1993) The relationship between reproductive and foraging energetics and the evolution of the Pinnipedia. In: Boyd, I.L. (Ed). Marine Mammals: Advances in Behavioural and Population Biology. Symposium of the Zoological Society of London, Oxford University Press, Oxford, UK: 293-314.
Costa, D.P., Gales, N.J. (2000) Foraging energetics and diving behavior of lactating New Zealand sea lions, Phocarctos hookeri. Journal of Experimental Biology, 203, 3655-3665.

170
Costa, D.P., Gales, N.J. (2003) Energetics of a benthic diver: seasonal foraging ecology of the Australian sea lion, Neophoca cinerea. Ecological Monographs, 73(1), 27-43.
Cottrell, P.E., Trites, A.W., Miller, E.H. (1996) Assessing the use of hard parts in faeces to identify harbour seal prey: results of captive-feeding trials. Canadian Journal of Zoology, 74, 875-880.
Cottrell, P.E., Trites, A.W. (2002) Classifying prey hard part structures recovered from fecal remains of captive Steller sea lions (Eumetopias jubatus). Marine Mammal Science, 18(2).
Crawley, M.C., Warneke, R. (1979). Pinniped species summaries: New Zealand fur seal. Mammals in the Seas-FAO Fisheries Series 5, vol II. Food and Agriculture Organisation of the United Nations, Rome, p 45-48: 45-48 pp.
da Silva, J., Neilson, J.D. (1985) Limitations of using otoliths recovered in scats to estimate prey consumption in seals. Canadian Journal of Fisheries and Aquatic Sciences, 42.
Dahl, T.M., Lydersen, C., Kovacs, K.M., Falk-Petersen, S., Sargent, J., Gjertz, I., Gulliksen, B. (2000) Fatty acid composition of the blubber in white whales (Delphinapterus leucas). Polar Biology, 23, 401-409.
Dalerum, F., Angerbjörn, A. (2005) Resolving temporal variation in vertebrate diets using naturally occurring stable isotopes. Oecologia, 144, 647-658.
Dalsgaard, J., St John, M., Kattner, G., Müller-Navarra, D., Hagen, W. (2003) Fatty acid trophic markers in the pelagic marine environment. Advances in Marine Biology, 46, 225-340.
Dalsgaard, J., St John, M. (2004) Fatty acid biomarkers: validation of food web and trophic markers using 13C-labelled fatty acids in juvenile sandeel (Ammodytes tobianus). Canadian Journal of Fisheries and Aquatic Sciences, 61, 1671-1680.
Dans, S.L., Crespo, E.A., Pedraza, S.N., Koen Alonso, M. (2004) Recovery of the South American sea lion (Otaria flavescens) population in northern Patagonia. Canadian Journal of Fisheries and Aquatic Sciences, 61, 1681-1690.
Das, K., Beans, C., Holsbeek, L., Mauger, G., Berrow, S.D., Rogan, E., Bouquegneau, J.M. (2003) Marine mammals from northeast Atlantic: relationship between their trophic status as determined by δ13C and δ15N measurements and their trace metal concentrations. Marine Environmental Research, 56, 349-365.
Davenport, S.R., Bax, N.J. (2002) A trophic study of a marine ecosystem off southeastern Australia using stable isotopes of carbon and nitrogen. Canadian Journal of Fisheries and Aquatic Sciences, 59, 514-530.
De Pierrepont, J.F., Dubois, B., Desormonts, S., Santos, M.B., Robin, J.P. (2005) Stomach contents of English Channel cetaceans stranded on the coast of Normandy. Journal of Marine Biology Association of U.K., 85, 1539-1546.

171
Deagle, B.E., Tollit, D.J., Jarman, S.N., Hindell, M.A., Trites, A.W., Gales, N.J. (2005) Molecular scatology as a tool to study diet: analysis of prey DNA in scats from captive Steller sea lions. Molecular Ecology, 14, 1831-1842.
Deagle, B.E., Tollit, D.J. (2007) Quantitative analysis of prey DNA in pinniped faeces: potential to estimate diet composition? Conservation Genetics, 8, 743-747.
Dehn, L.-A., Sheffield, G.G., Follmann, E.H., Duffy, L.K., Thomas, D.L., O'Hara, T.M. (2007) Feeding ecology of phocid seals and some walrus in the Alaskan and Canadian Arctic as determined by stomach contents and stable isotope analysis. Polar Biology, 30, 167-181.
del Rosario González-Baró, M., Pollero, R.J. (1998) Fatty acid metabolism of Macrobrachium borellii: dietary origin of arachidonic and eicosapentaenoic acids. Comparative Biochemistry and Physiology part A, 119(3), 747-752.
Dellinger, T., Trillmich, F. (1988) Estimating diet composition from scat analysis in otariid seals (Otariidae): is it reliable? Canadian Journal of Zoology, 66, 1865-1870.
DeNiro, M.J., Epstein, S. (1981) Influence of diet on the distribution of nitrogen isotopes in animals. Geochimica et Cosmochimica Acta, 45, 341-351.
Donnelly, C.P., Trites, A.W., Kitts, D.D. (2003) Possible effects of pollock and herring on the growth and reproductive success of Steller sea lions (Eumetopias jubatus): insights from feeding experiments using an alternative animal model, Rattus norvegicus. British Journal of Nutrition, 89, 71-82.
Duignan, P.J., Gibbs, N.J., Jones, G.W. (2003) Autopsy of pinnipeds incidentally caught in fishing operations 1997/98, 1999/2000, and 2000/01. DOC Science Internal Series 118, Department of Conservation, Te Papa Atawhai, Wellington, N.Z.
Dytham, C. (1999). Choosing and Using Statistics: A Biologist's Guide. Blackwell Science, Oxford, U.K.
Ehleringer, J.R., Rundel, P.W. (1989) Stable isotopes: history, units and instrumentation. In: Rundel, P.W., Ehleringer, J.R. & Nagy, K.A. (Eds). Stable isotopes in ecology research. Springer-Verlag, New York, U.S.A.: 2-15.
Estes, J.A., Tinker, M.T., Williams, T.M., Doak, D.F. (1998) Killer whale predation on sea otters linking coastal with oceanic ecosystems. Science, 282, 473-476.
Fantle, M.S., Dittel, A.I., Schwalm, S.M., Epifanio, C.E., Fogel, M.L. (1999) A food web analysis of the juvenile blue crab, Callinectes sapidus, using stable isotopes in whole animals and individual amino acids. Oecologia, 120, 416-426.
Fea, N., Harcourt, R. (1997) Assessing the use of faecal and regurgitates analysis as a means of determining the diet of New Zealand fur seals. In: Hindell, M.A. & Kemper, C. (Eds). Marine Mammal Research in the Southern Hemisphere Volume 1: Status, Ecology and Medecine. Surrey Beatty & Sons, Sydney, Australia: 143-150.

172
Fea, N.I., Harcourt, R.G., Lalas, C. (1999) Seasonal variation in the diet of New Zealand fur seals (Arctocephalus forsteri) at Otago Peninsula, New Zealand. Wildlife Research, 26, 147-160.
Feldkamp, S.D., Long, R.L., Antonelis, G.A. (1989) Diving patterns of California sea lions, Zalophus californianus. Canadian Journal of Zoology, 67, 872-883. Fiscus, C.H., Baines, G.A. (1966) Food and feeding behaviour of Steller and California sea lions. journal of Mammalogy, 47, 195-200.
Folch, J., Lees, M., Sloane Stanley, G.H. (1957) A simple method for the isolation and purification of total lipids from animal tissues. Journal of Biological Chemistry, 226, 497-509.
Ford, J.K.B., Ellis, G.M., Barrett-Lennard, L.G., Morton, A.B., Palm, R.S., Balcomb III, K.C. (1998) Dietary specialization in two sympatric populations of killer whales (Orcinus orca) in coastal British Columbia and adjacent waters. Canadian Journal of Zoology, 76, 1456-1471.
Fowler, S.L., Costa, D.P., Arnould, J.P.Y. (2007) Ontogeny of movements and foraging ranges in the Australian sea lion. Marine Mammal Science, 23(3), 598-614.
Fraser, A.J., Sargent, J.R. (1989) Formation and transfer of fatty acids in an enclosed marine food chain comprising phytoplankton, zooplankton and herring (Clupea harengus L.) larvae. Marine Chemistry, 27, 1-18.
Fritz, L.W., Hinckley, S. (2005) A critical review of the regime shift-"junk food"-nutritional stress hypothesis for the decline of the western stock of steller sea lion. Marine Mammal Science, 21(3), 476-518.
Froese, R., Pauly, D. (2007) Fishbase. World Wide Web electronic publication version 10/2007. www.fishbase.org.
Fry, B., Sherr, E.B. (1984) δ13C measurements as indicators of carbon flow in marine and freshwater ecosystems. Contributions to the Marine Science, 27, 13-47.
Fuller, B.T., Fuller, J.L., Sage, N.E., Harris, D.A., O'Connell, T.C., Hedges, R.E.M. (2004) Nitrogen balance and δ15N: why you’re not what you eat during pregnancy. Rapid Communications in Mass Spectrometry, 18, 2889-2896.
Fuller, B.T., Fuller, J.L., Sage, N.E., Harris, D.A., O'Connell, T.C., Hedges, R.E.M. (2005) Nitrogen balance and δ15N: why you’re not what you eat during nutritional stress. Rapid Communications in Mass Spectrometry, 19, 2497-2506.
Furness, R.W. (2002) Management implications of interactions between fisheries and sandeel-dependent seabirds and seals in the North Sea. ICES Journal of Marine Science, 59(2), 261-269.
Gales, N.J., Cheal, A.J. (1992) Estimating diet composition of the australian sea-lion (Neophoca cinerea) from scat analysis: an unreliable technique. Wildlife Research, 19, 447-456.

173
Gales, N.J. (1995) New Zealand (Hooker's) sea lion Recovery Plan. Threatened Species Recovery Plan Series 17. Department of Conservation, Wellington, N.Z.: 28p.
Gales, N.J., Costa, D.P., Kretzmann, M. (1996) Proximate composition of Australian sea lion milk throughout the entire supra-annual lactation period. Australian Journal of Zoology, 44, 651-657.
Gales, N.J., Mattlin, R.H. (1997) Summer diving behaviour of lactating New Zealand sea lions, Phocarctos hookeri. Canadian Journal of Zoology, 75, 1695-1706.
Gales, N.J. (1998) Albatross populations: status and threats. In: Roberston, G. & Gales, N.J. (Eds). Albatross Biology and Conservation. Surrey Beatty and Sons, Chipping Norton: 20-45.
Gales, N.J., Fletcher, D. (1999) Abundance, distribution and status of the New Zealand sea lion, Phocarctos hookeri. Wildlife Research, 26, 35-52.
Gales, N.J. (2008) Phocarctos hookeri. In: IUCN 2008. 2008 IUCN Red List of threatened species. www.iucnredlist.org. Downloaded the 2 March 2009.
Gaye-Siessegger, J., Focken, U., Abel, H.J., Becker, K. (2003) Feeding level and diet quality influence trophic shift of C and N isotopes in Nile tilapia [Oreochromis niloticus (L.)]. Isotopes Environmental Health Studies, 39(2), 125-134.
Georges, J.-Y., Tremblay, Y., Guinet, C. (2000) Seasonal diving behaviour in lactating subantarctic fur seals on Amsterdam Island. Polar Biology, 23, 59-69.
Gibson, D.J.M. (1995) The New Zealand squid fishery, 1979-1993. N.Z. Fisheries Technical Report No. 42. Ministry of Fisheries, Wellington, N.Z.: 43p.
Gill, B.J. (1998) Prehistoric breeding sites of New Zealand sea lions (Phocarctos hookeri, Carnivora, Otariidae) at North Cape. Records of the Auckland Museum, 35, 55-64.
Goebel, M.E., Bengston, J.L., DeLong, R.L., Gentry, R.L., Loughlin, T.R. (1991) Diving patterns and foraging locations of female Northern fur seals. Fishery Bulletin, 89, 171-179.
Gökodlu, N., Yerlikaya, P. (2003) Determination of proximate composition and mineral contents of blue crab (Callinectes sapidus) and swim crab (Portunus pelagicus) caught off the Gulf of Antalya. Food Chemistry, 80, 495-498.
Goodman-Lowe, G.D., Carpenter, J.R., Atkinson, S. (1999) Assimilation efficiency of prey in the hawaiian monk seal (Monachus schauinslandi). Canadian Journal of Zoology, 77, 653-660.
Graeve, M., Hagen, W., Kattner, G. (1994a) Herbivorous or omnivorous? On the significance of lipid compositions as trophic markers in Antarctic copepods. Deep-sea Research I, 41, 915-924.
174
Graeve, M., Kattner, G., Hagen, W. (1994b) Diet-induced changes in the fatty acid composition of Arctic herbivorous copepods: experimental evidence of trophic markers. Journal of Experimental Marine Biology and Ecology, 182, 97-110.
Graeve, M., Kattner, G., Piepenburg, D. (1997) Lipids in Arctic benthos: does the fatty acid and alcohol composition reflect feeding and trophic interactions? Polar Biology, 18, 53-61.
Graeve, M., Kattner, G., Wiencke, C., Karsten, U. (2002) Fatty acid composition of Arctic and Antarctic macroalgae: indicator of phylogenetic and trophic relationships. Marine Ecology Progress Series, 231, 67-74.
Grahl-Nielsen, O., Barnung, T. (1985) Variation in the fatty acid profiles of marine animals caused by environmental and developmental changes. Marine Environmental Research, 17, 218-222.
Grahl-Nielsen, O., Mjaavatten, O. (1991) Dietary influence on fatty acid composition of blubber fat of seals as determined by biopsy: a multivariate approach. Marine Ecology, 110, 59-64.
Grahl-Nielsen, O., Hammill, M.O., Lydersen, C., Wahlstrøm, S. (2000) Transfer of fatty acids from female seal blubber via milk to pup blubber. Journal of Comparative Physiology B, 170, 277-283.
Grahl-Nielsen, O., Andersen, M., Derocher, A.E., Lydersen, C., Wiig, Ø., Kovacs, K.M. (2003) Fatty acid composition of the adipose tissue of polar bears and of their prey: ringed seals, bearded seals and harp seals. Marine Ecology Progress Series, 265(275-282).
Grahl-Nielsen, O., Andersen, M., Derocher, A.E., Lydersen, C., Wiig, Ø., Kovacs, K.M. (2004) Reply to Comment on Grahl-Nielsen et al. (2003): sampling, data treatment and predictions in investigations on fatty acids in marine mammals. Marine Ecology Progress Series, 281, 303-306.
Grahl-Nielsen, O., Halvorsen, A.-K., Bodoev, N., Averina, L., Radnaeva, L., Pronin, N., Käkelä, R., Petrov, E. (2005) Fatty acid composition of blubber of the Baikal seal Phoca sibirica and its marine relative, the ringed seal P. hipida. Marine Ecology Progress Series, 305, 261-274.
Green, K., Williams, R., Burton, H.R. (1997) Foraging ecology of Antarctic fur seals Arctocephalus gazella around Heard Island. In: Hindell, M.A. & Kemper, C. (Eds). Marine Mammal Research in the Southern Hemisphere Volume 1: Status, Ecology and Medecine. Surrey Beatty & Sons, Sydney, Australia: 105-113.
Grellier, K., Hammond, P.S. (2006) Robust digestion and passage rate estimates for hard parts of grey seal (Halichoerus grypus) prey. Canadian Journal of Fisheries and Aquatic Sciences, 63, 1982-1998.
Grigor, M.R., Sutherland, W.H., Phleger, C.F. (1990) Wax-ester metabolism in the orange roughy Hoplostethus atlanticus (Beryciformes: Trachichthyidae). Marine Biology, 105(2), 223-227.
175
Guillou, A., Soucy, P., Kralil, M. (1996) Preparation of fatty acid methyl esters from brook charr tissues: Comparison of a classical and a direct method. Fett Lipid, 98, 18-21.
Hagen, W., Van Vleet, E.S., Kattner, G. (1996) Seasonal lipid storage as overwintering strategy of Antarctic krill. Marine Ecology Progress Series, 134, 85-89.
Hagen, W., Kattner, G., Friedrich, C. (2000) The lipid compositions of high-Antarctic notothenioid fish species with different life strategies. Polar Biology, 23, 785-791.
Hall-Aspland, S.A., Rogers, T.L., Canfield, R.B. (2005) Stable carbon and nitrogen isotope analysis reveals seasonal variation in the diet of leopard seals. Marine Ecology Progress Series, 305, 249-259.
Hammond, P.S., Rothery, P. (1996) Application of computer sampling in the estimation of seal diet. Journal of Applied Statistics, 23(5), 525-534.
Hanchet, S. (1991) Diet of spiny dogfish, Squalus acanthias Linnaeus, on the east coast, South Island, New Zealand. Journal of Fish Biology, 39, 313-323.
Harcourt, R.G., Schulman, A.M., Davis, L.S., Trillmich, F. (1995) Summer foraging by lactating female New Zealand fur seals (Arctocephalus forsteri) off Otago Peninsula, New Zealand. Canadian Journal of Zoology, 73, 678-690.
Harcourt, R.G. (2001) Advances in New Zealand mammalogy 1990-2000: Pinnipeds. Journal of the Royal Society of New Zealand, 31(1), 135-160.
Harcourt, R.G., Bradshaw, C.J.A., David, L.S. (2001) Summer foraging behaviour of a generalist predator, the New Zealand fur seal (Arctocephalus forsteri). Wildlife Research, 28, 599-606.
Harvey, J.J. (1989) Assessment of errors associated with harbor seal (Phoca vitulina) faecal sampling. journal of Zoology, London, 219, 101-111.
Heather, B.D., Robertson, H.A. (2005). The field guide to the birds of New Zealand. Revised Edition. Viking, Auckland, New Zealand.
Helm, R.C. (1979) Initial defecation time and intestinal length of three species of pinnipeds: Phoca vitulina, Zalophus californianus, and Mirounga angustirostris. M.A. thesis. California State University, California, U.S.A.: 89p.
Helm, R.C. (1984) Rate of digestion in three species of pinnipeds. Canadian Journal of Zoology, 62, 1751-1756.
Herman, D.P., Burrows, D.G., Wade, P.R., Durban, J.W., Matkin, C.O., LeDuc, R.G., Barrett-Lennard, L.G., Krahn, M.M. (2005) Feeding ecology of eastern North Pacific killer whales Orcinus orca from fatty acid, stable isotope, and organochlorine analyses of blubber biopsies. Marine Ecology Progress Series, 302, 275-291.
Higgins, L.V., Costa, D.P., Huntley, A.C., Le Boeuf, B.J. (1988) Behavioral and physiological measurements of maternal investment in the Steller sea lion Eumetopias jubatus. Marine Mammal Science, 4, 44-58.
176
Higgins, L.V., Gass, L. (1993) Birth to weaning: parturition, duration of lactation, and attendance cycles of Australian sea lions (Neophoca cinerea). Canadian Journal of Zoology, 71, 2047-2055.
Hitchmough, R.A., Bull, L., Cromarty, P. (2007) New Zealand threat classification system list - 2007. Threatened species occasional publication 23. Department of Conservation, Wellington, New Zealand.
Hobson, K.A., Alisauskas, R.T., Clark, R.G. (1993) Stable nitrogen isotope enrichment in avian tissues due to fasting and nutritional stress: implications for isotopic analyses of diet. Condor, 95, 388-394.
Hobson, K.A., Schell, D.M., Renouf, D., Noseworthy, E. (1996) Stable carbon and nitrogen isotopic fractionation between diet and tissues of captive seals: implications for dietary reconstructions involving marine mammals. Canadian Journal of Fisheries and Aquatic Sciences, 53, 528-533.
Hobson, K.A., Sease, J.L., Merrick, R.L., Piatt, J.F. (1997) Investigating trophic relationships of pinnipeds in Alaska and Washington using stable isotope ratios of nitrogen and carbon. Marine Mammal Science, 13(1), 114-132.
Hobson, K.A., Sease, J.L. (1998) Stalbe isotope analyses of tooth annuli reveal temporary dietary records: an example using Steller sea lions. Marine Mammal Science, 14(1), 116-129.
Hobson, K.A., Sinclair, E.H., York, A.E., Thomason, J.R., Merrick, R.E. (2004) Retrospective isotopic analyses of Steller sea lion tooth annuli and sea-bird feathers: a cross-taxa approach to investigating regime and dietary shifts in the Gulf of Alaska. Marine Mammal Science, 20(3), 621-638.
Holborow, J. (1999) The diet of New Zealand fur seals in Southern New Zealand, Master thesis. University of Otago, Dunedin, N.Z.
Holman, R.T. (1986) Control of polyunsaturated acids in tissue lipids. Journal of the American College of Nutrition, 5, 183-211.
Hooker, S.K., Iverson, S.J., Ostrom, P., Smith, S.C. (2001) Diet of northern bottlenose whales inferred from fatty-acid and stable-isotope analyses of biopsy samples. Canadian Journal of Zoology, 79, 1442-1454.
Horn, P.L. (2007). A descriptive analysis of commercial catch and effort data for ling from New Zealand waters in Fishstocks LIN 2, 3, 4, 5, 6, and 7. New Zealand Fisheries Assessment Report 2007/22. Ministry of Fisheries, Wellington, New Zealand: 71p pp.
Horning, M., Trillmich, F. (1997) Ontogeny of diving behaviour in the Galápagos fur seal. Behaviour, 134, 1211-1257.
Hughes, J.T., Czochanska, Z., Pickston, L., Hove, E.L. (1980) The nutritional composition of some New Zealand marine fish and shellfish. New Zealand Journal of Science, 23, 43-51.

177
Hume, F., Hindell, M.A., Pemberton, D., Gales, R. (2004) Spatial and temporal variation in the diet of a high trohpic level predator, the Australian fur seal (Arctocephalus pusillus doriferus). Marine Biology, 144, 407-415.
Inada, T., Nakamura, I. (1975) A comparative study of two populations of the gadoid fish Micromesistius australis from the New Zealand and Patagonian-Falkland regions. Bulletin of the Far Seas Fisheries Research Laboratory, 13, 1-26.
Indarti, E., Majid, M.I.A., Hashim, R., Chong, A. (2005) Direct FAME synthesis for rapid total lipid analysis from fish oil and cod liver oil. Journal of Food Composition and Analysis, 18, 161-170.
Iverson, S.J. (1993) Milk secretion in marine mammals in relation to foraging: can milk fatty acids predict diet? Symposium of the Zoological Society of London, 66, 263-291.
Iverson, S.J., Oftedal, O.T., Bown, W.D., Boness, D.J., Sampugna, J. (1995) Prenatal and postnatal transfer of fatty acids from mother to pup in the hooded seal (Cystophora cristata). Journal of Comparative Physiology B, 165, 1-12.
Iverson, S.J., Arnould, J.P.Y., Boyd, I.L. (1997a) Milk fatty acid signatures indicate both major and minor shifts in the diet of lactating Antarctic fur seals. Canadian Journal of Zoology, 75, 188-197.
Iverson, S.J., Frost, K.J., Lowry, L.F. (1997b) Fatty acid signatures reveal fine scale structure of foraging distribution of harbor seals and their prey in Prince William Sound, Alaska. Marine Ecology Progress Series, 151, 255-271.
Iverson, S.J., Lang, S.L.C., Cooper, M.H. (2001) Comparison of the Bligh and Dyer and Folch methods for total lipid determination in a broad range of marine tissue. Lipids, 36, 1283-1287.
Iverson, S.J. (2002) Blubber. In: Perrin, W.F., Würsig, B. & Thewissen, J.G.M. (Eds). Encyclopedia of Marine Mammals. Academic Press, San Diego, U.S.A.: 107-112.
Iverson, S.J., Frost, K.J., Lang, S.L.C. (2002) Fat content and fatty acid composition of forage fish and invertebrates in Prince William Sound, Alaska: factors contributing to among and within species variability. Marine Ecology Progress Series, 241, 161-181.
Iverson, S.J., Field, C., Bowen, W.D., Blanchard, W. (2004) Quantitative fatty acid signature analysis: a new method of estimating predator diets. Ecological monographs, 74(2), 211-235.
Iverson, S.J., Stirling, I., Lang, S.L.C. (2006) Spatial and temporal variation in the diets of polar bears across the Canadian Arctic: indicators of changes in prey populations and environment. In: Boyd, I.L., Wanless, S. & Camphuysen, C.J. (Eds). Top predators in Marine Ecosystems. Cambridge University Press, Cambridge, U.K.: 98-117.
Iverson, S.J., Springer, A.M., Kitaysky, A.S. (2007) Seabirds as indicators of food web structure and ecosystem variability: qualitative and quantitative diet analyses using fatty acids. Marine Ecology Progress Series, 352, 235-244.

178
Jackson, G.D. (1995) The use of beaks as tools for biomass estimation in the deepwater squid Moroteuthis ingens (Cephalopoda: Onychoteuthidae) in New Zealand waters. Polar Biology, 15, 9-14.
Jackson, G.D., Shaw, A.G.P., Lalas, C. (2000) Distribution and biomass of two squid species off southern New Zealand: Nototodarus sloanii and Moroteuthis ingens. Polar Biology, 23, 699-705.
Jacob, W., McClatchie, S., Probert, P.K., Hurst, R.J. (1998) Demersal fish assemblages off southern New Zealand in relation to depth and temperature. Deep-sea Research I, 45, 2119-2155.
Jarman, S.N., Deagle, B.E., Gales, N.J. (2004) Group-specific polymerase chain reaction for DNA-based analysis of species diversity and identity in deitary samples. Molecular Ecology, 13, 1313-1322.
Jobling, M., Breiby, A. (1986) The use and abuse of fish otoliths in studies of feeding habits of marine piscivores. Sarsia, 71, 265-274.
Jobling, M. (1987) Marine mammal fecal samples as indicators of prey importance-a source of error in bioenergetics studies. Sarsia, 72, 255-260.
Käkelä, R., Hyvärinen, H., Vainiotalo, P. (1993) Fatty acid composition in liver and blubber of the Saimaa ringed seal (Phoca hispida saimensis) compared with that of the ringed seal (Phoca hispida botnica) and grey seal (Halichoerus grypus) from the Baltic. Comparative Biochemistry and Physiology part B, 105(3/4), 553-565.
Käkelä, R., Hyvärinen, H. (1996) Site-specific fatty acid composition in adipose tissues of several northern aquatic and terrestrial mammals. Comparative Biochemistry and Physiology part B, 115, 501-514.
Käkelä, R., Hyvärinen, H. (1998) Composition of polyunsaturated fatty acids in the liver of freshwater and marine ringed seals (Phoca hispida spp.) differs largely due to the diet of the seals. Comparative Biochemistry and Physiology part B, 120, 231-237.
Käkelä, R., Käkelä, A., Khale, S., Becker, P.H., Kelly, A., Furness, R.W. (2005) Fatty acid signatures in plasma of captive herring gulls as indicators of demersal or pelagic fish diet. Marine Ecology Progress Series, 293, 191-200.
Kawakami, T. (1976) The fishery biological study on a squid Nototodarus sloani sloani (Gray) in the New Zealand waters. Bulletin - Tokai Regional Fisheries Research Laboratory, 85, 31-104.
Kawashima, H. (2005) Unusual minor nonmethylene-interrupted di-, tri-, and tetraenoic fatty acids in limpet gonads. Lipids, 40, 627-630.
Kirkwood, R., Lynch, M., Gales, N.J., Dann, P., Sumner, M.D. (2006) At-sea movements and habitat use of adult male Australian fur seals (Arctocephalus pusillus doriferus). Canadian Journal of Zoology, 84, 1781-1788.

179
Kirsch, P.E., Iverson, S.J., Bowen, W.D., Kerr, S.R., Ackman, R.G. (1998) Dietary effects on the fatty acid signature of whole Atlantic cod (Gadus morhua). Canadian Journal of Fisheries and Aquatic Sciences, 55, 1378-1386.
Kirsch, P.E., Iverson, S.J., Bowen, W.D. (2000) Effect of a low-fat diet on body composition and blubber fatty acids of captive juvenile harp seals (Phoca groenlandica). Physiological and Biochemical Zoology, 73(1), 45-59.
Kitts, D.D., Huynh, M.D., Hu, C., Trites, A.W. (2004) Season variation in nutrient composition of Alaskan walleye pollock. Canadian Journal of Zoology, 82, 1408-1415.
Kleiber, M. (1975). The fire of life: an introduction to animal energetics. Robert E. Krieger Publishing, New York, U.S.A.
Knoff, A., Hohn, A., Macko, S.A. (2008) Ontogenetic diet changes in bottlenose dolphins (Tursiops truncatus) reflected through stable isotopes. Marine Mammal Science, 24(1), 128-137.
Koen Alonso, M., Crespo, E.A., Pedraza, S.N., García, N.A., Coscarella, M.A. (2000) Food habits of the South American sea lion, Otaria flavescens, off Patagonia, Argentina. Fishery Bulletin, 98, 250-263.
Koopman, H.N., Iverson, S.J., Gaskin, D.E. (1996) Stratification and age-related differences in blubber fatty acids of the male harbour porpoise (Phocoena phocoena). Journal of Comparative Physiology B, 165, 628-639.
Koopman, H.N. (1998) Topographic distribution of the blubber of harbor porpoises (Phocoena phocoena). Journal of Mammalogy, 79(1), 260-270.
Koopman, H.N. (2007) Phylogenetic, ecological, and ontogenetic factors influencing the biochemical structure of the blubber of odontocetes. Marine Biology, 151, 277-291.
Kurle, C.M., Worthy, G.A.J. (2001) Stable isotope assessment of temporal and geographic differences in feeding ecology of northern fur seals (Callorhinus ursinus). Oecologia, 126, 254-265.
Kurle, C.M. (2002) Stable-isotope ratios of blood components from captive northern fur seals (Callorhinus ursinus) and their diet: applications for studying the foraging ecology of wild otariids. Canadian Journal of Zoology, 80, 902-909.
Kurle, C.M., Worthy, G.A.J. (2002) Stable nitrogen and carbon isotope ratios in multiple tissues of the northern fur seal Callorhinus ursinus: implications for dietary and migratory reconstructions. Marine Ecology Progress Series, 236, 289-300.
Kvitrud, M.A., Riemer, S.D., Brown, R.F., Bellinger, M.R., Banks, M.A. (2005) Pacific harbor seals (Phoca vitulina) and salmon: genetics presents hard numbers for elucidating predator-prey dynamics. Marine Biology, 147, 1459-1466.
Lalas, C. (1997) Prey of Hooker's sea lions Phocarctos hookeri based at Otago Pensinsula New Zealand. In: Hindell, M.A. & Kemper, C. (Eds). Marine Mammal Research in the Southern Hemisphere Volume 1: Status, Ecology and Medecine. Surrey Beatty & Sons, Sydney, Australia: 130-136.
180
Lang, S.L.C., Iverson, S.J., Bowen, W.D. (2005) Individual variation in milk composition over lactation in harbour seals (Phoca vitulina) and the potential consequences of intermittent attendance. Canadian Journal of Zoology, 83, 1525-1531.
Lawson, J.W., Miller, E.H., Noseworthy, E. (1997) Variation in assimilation efficiency and digestive efficiency of captive harp seals (Phoca groenlandica) on different diets. canadian Journal of Zoology, 75, 1285-1291.
Lea, M.-A., Cherel, Y., Guinet, C., Nichols, P.D. (2002a) Antarctic fur seals foraging in the polar frontal zone: inter-annual shifts in diet as shown from fecal and fatty acid analyses. Marine Ecology Progress Series, 245, 281-297.
Lea, M.-A., Hindell, M.A., Guinet, C., Goldsworthy, S.D. (2002b) Variability in the diving activity of Antarctic fur seals, Arctocephalus gazella, at Iles Kerguelen. Polar Biology, 25, 269-279.
Lea, M.-A., Nichols, P.D., Wilson, G. (2002c) Fatty acid composition of lipid-rich myctophids and mackerel icefish (Champsocephalus gunnari) - Southern Ocean food-web implications. Polar Biology, 25, 843-854.
Learmonth, J.A. (2006) Life history and fatty acid analysis of harbour porpoises (Phocoena phocoena) from Scottish waters. PhD thesis. University of Aberdeen, Aberdeen, U.K.: 293.
Leopold, M.F., Van Damme, C.J.G., Philippart, C.J.M., Winter, C.J.N. (2002). Otoliths of North Sea Fish-Fish Identification key by means of otoliths and other parts. CD-ROM, Expert Centre for Taxonomic Identification, Amsterdam, Netherlands.
Lepage, G., Roy, C.C. (1984) Improved recovery of fatty acid through direct transesterification or purification. Journal of Lipid Research, 25, 1391-1396.
Lesage, V., Hammill, M.O., Kovacs, K.M. (2001) Marine mammals and the community structure of the Estuary and Gulf of St Lawrence, Canada: evidence from stable isotope analysis. Marine Ecology Progress Series, 210, 203-221.
Lewis, R., O'Connell, T.C., Lewis, M., Campagna, C., Hoelzel, A.R. (2006) Sex-specific foraging strategies and resource partitioning in the southern elephant seal (Mirounga leonina). Proceedings of the Royal Society of London B, 273, 2901-2907.
Linares, F., Henderson, R.J. (1991) Incorporation of 14C-labelled polyunsaturated fatty acids by juvenile turbot, Scophthalmus maximus (L.) in vivo. journal of Fish Biology, 38, 335-347.
Littnan, C.L., Arnould, J.P.Y., Harcourt, R.G. (2007) Effect of proximity to the shelf edge on the diet of female Australian fur seals. Marine Ecology Progress Series, 338, 257-267.
Lockyer, C.H., McConnell, L.C., Waters, T.D. (1984) The biochemical composition of fin whale blubber. canadian Journal of Zoology, 62, 2553-2562.

181
Lui, K.S. (1994) Preparation of fatty methyl esters for gas-chromatographic analysis of lipids in biological materials. Journal of the American Oil Chemists' Society, 71, 1179-1187.
Lunn, N.J., Boyd, I.L. (1993) Effects of maternal age and condition on parturition and the perinatal period of Antarctic fur seals. Journal of Zoology, London, 229, 55-67.
Macko, S.A., Fogel-Estep, M.L., Hare, P.E., Hoering, T.C. (1987) Isotopic fractionation of nitrogen and carbon in the synthesis of amino acids by microorganisms. Chemical Geology, 65, 79-92.
Marcus, J. (1998) Effects of meal size on otolith recovery from fecal samples of gray and harbor seal pups. Marine Mammal Science, 14.
Matejusová, I., Doig, F., Middlemas, S.J., Mackay, A., Douglas, A., Armstrong, J.D., Cunningham, C.O., Snow, M. (2008) Using quantitative real-time PCR to detect salmonid prey in scats of grey Halichoerus grypus and harbour Phoca vitulina seals in Scotland - an experimental and field study. Journal of Applied Ecology, 45, 632-640.
Mattlin, R.H., Gales, N.J., Costa, D.P. (1998) Seasonal dive behaviour of lactating New Zealand fur seals (Arctocephalus forsteri). Canadian Journal of Zoology, 76, 350-360.
McConkey, S.D., McConnell, H., Lalas, C., Heinrich, S., Ludmerer, A., McNally, N., Parker, E., Borofsky, C., Schimanski, K., McIntosh, G. (2002) A northward spread in the breeding distribution of the New Zealand sea lion, Phocarctos hookeri. Australian Mammalogy, 24, 97-106.
McMahon, C.R., Holley, D., Robinson, S. (1999) The diet of itinerant male Hooker's sea lions, Phocarctos hookeri, at sub-Antarctic Macquarie Island. Wildlife Research, 26, 839-846.
Melin, S.R. (2002) The foraging ecology and reproduction of the California sea lion (Zalophus californianus californianus). PhD thesis. University of Minnesota, St. Paul, MN, U.S.A.
Mellish, J.-A., Horning, M., York, A.E. (2007) Seasonal and spatial blubber depth changes in captive harbor seals (Phoca vitulina) and Steller's sea lions (Eumetopias jubatus). Journal of Mammalogy, 88(2), 408-414.
Mendes, S., Newton, J., Reid, R.J., Zuur, A.F., Pierce, G.J. (2007) Stable carbon and nitrogen isotope ratio profiling of sperm whale teeth reveals ontogenetic movements and trophic ecology. Oecologia, 151, 605-615.
Meynier, L., Pusineri, C., Spitz, J., Santos, M.B., Pierce, G.J., Ridoux, V. (2008a) Intraspecific dietary variation in the short-beaked common dolphin Delphinus delphis in the Bay of Biscay: the importance of fat fish. Marine Ecology Progress Series, 354, 277-287.
Meynier, L., Stockin, K.A., Bando, M.K.H., Duignan, P.J. (2008b) Stomach contents of common dolphin (Delphinus sp.) from New Zealand waters. New Zealand Journal of Marine and Freshwater Research, 42, 257-268.

182
Minagawa, M., Wada, E. (1984) Stepwise enrichment of δ15N along food chains: further evidence and the relation between δ15N and animal age. Geochimica et Cosmochimica Acta, 48, 1135-1140.
Ministry of Fisheries (2007). Report from the Fishery Assessment Plenary, May 2007: stock assessments and yield estimates. Ministry of Fisheries, Wellington, N.Z.: 1015 pp.
Mintzer, V.J., Gannon, D.P., Barros, N.B., Read, A.J. (2008) Stomach contents of mass- stranded short-finned pilot whales (Globicephala macrorhynchus) from North Carolina. Marine Mammal Science, 24(2), 290-302.
Mitchell, S.J. (1984) Feeding of ling Genypterus blacodes (Bloch & Schneider) from 4 New Zealand offshore fishing grounds. New Zealand Journal of Marine and Freshwater Research, 18, 265-274.
Montie, E.W., Garvin, S.R., Fair, P.A., Bossart, G.D., Mitchum, G.B., McFee, W.E., Speakman, T., Starczak, V.R., Hahn, M.E. (2008) Blubber Morphology in Wild Bottlenose Dolphins (Tursiops truncatus) from the Southeastern United States: Influence of Geographic Location, Age Class, and Reproductive State. Journal of Morphology, 269, 496-511.
Morrison, W.R., Smith, L.M. (1964) Preparation of fatty acid methyl esters and dimethylacetals from lipids with boron fluoride-methanol. Journal of Lipid Research, 5, 600-608.
Murie, D.J., Lavigne, D.M. (1985) Digestion and retention of Atlantic herring otoliths in the stomachs of grey seals. In: Beddington, J.R., Beverton, R.J.H. & Lavigne, D.M. (Eds). Marine mammals and fisheries. George Allen and Unwin, London, U.K.: 292-299.
Murie, D.J., Lavigne, D.M. (1986) Interpretation of otoliths in stomch content analyses of phocid seals: quantifying fish consumption. Canadian Journal of Zoology, 64, 1152-1157.
Nechev, J., Christie, W.W., Robaina, R., de Diego, F., Popov, S., Stefanov, K. (2004) Chemical composition of the sponge Hymeniacidon sanguinea from the Canary Islands. Comparative Biochemistry and Physiology part A, 137, 365-374.
Nelson, G.J. (1992) Dietary fatty acids and lipid metabolism. In: Chow, C.K. (Ed). Fatty acids in foods and their health implications. Marcel Drekker, New York, U.S.A.: 437-471.
Nelson, M.M., Mooney, B.D., Nichols, D.S., Phleger, C.F. (2001) Lipids of Antarctic Ocean amphipods: food chain interactions and the occurence of novel biomarkers. Marine Chemistry, 73, 53-64.
Nesis, K.N. (1987). Cephalopods of the World, Squids, Cuttlefishes, Octopuses and Allies. TFH Publications, Neptune City, NJ, U.S.A.
Newsome, S.D., Etnier, M.A., Kurle, C.M., Waldbauer, J.R., Chamberlain, C.P., Koch, P.L. (2007) Historic decline in primary productivity in western Gulf of Alaska and

183
eastern Bering Sea: isotopic analysis of northern fur seal teeth. Marine Ecology Progress Series, 332, 211-224.
Newsome, S.D., Koth, P.L., Etnier, M.A., Aurioles-Gamboa, D. (2006) Using carbon and nitrogen isotope values to investigate maternal strategies in Northeast Pacific otariids. Marine Mammal Science, 22(3), 556-572.
Nichols, D.S., Williams, D., Dunstan, G.A., Nichols, P.D., Volkman, J.K. (1994) Fatty acid composition of Antarctic and temperate fish of commercial interest. Comparative Biochemistry and Physiology part B, 107(2), 357-363.
Nilsson, A., Hjelte, L., Strandvik, B. (1996) Metabolism of orally fed [3H]-eicosapentaenoic and [14C]-arachidonic acid in essential fatty acid-deficient rats. Scandinavian Journal of Clinical and Laboratory Investigation, 56, 219-227.
Niño-Torres, C.A., Gallo-Reynoso, J.P., Galván-Magaña, F., Escobar-Briones, E., Macko, S.A. (2006) Isotopic analysis of 13C, 15N, and 34S "a feeding tale" in teeth of the longbeaked common dolphin, Delphinus capensis. Marine Mammal Science, 22(4), 831-846.
Nordstrom, C.A., Wilson, L.J., Iverson, S.J., Tollit, D.J. (2008) Evaluating quantitative fatty acid signature analysis (QFASA) using harbour seals Phoca vitulina richardsi in captive feeding studies. Marine Ecology Progress Series, 360, 245-263.
O'Driscoll, R.L., Bagley, N.W. (2001) Review of summer and autumn trawl survey time series from the southland and sub-Antarctic areas 1991-98. NIWA Technical Report 102, Wellington, N.Z.: 115p.
O'Driscoll, R.L., Booth, J.D., Bagley, N.W., Anderson, O.F., Griggs, L.H., Stevenson, M.L., Francis, M.P. (2003). Areas of importance for spawning, pupping or egg-laying, and juveniles of New Zealand deepwater fish, pelagic fish, and invertebrates. NIWA Technical Report 117. NIWA, Wellington, New Zealand: 377 pp.
O'Shea, S. (1999). The marine fauna of New Zealand: Octopoda (Mollusca: Cephalopoda). NIWA Biodiversity Memoir 112: 280 pp.
Oftedal, O.T. (1984) Milk composition, milk yield and energy output at peak lactation: a comparative review. Symposium of the Zoological Society of London, 51, 33-85.
Olsen, E., Grahl-Nielsen, O. (2003) Blubber fatty acids of minke whales: stratification, population identification and relation to diet. Marine Biology, 142, 13-24.
Orians, G.H., Pearson, N.E. (1979) On the theory of central place foraging. In: Horn, D.J., Stairs, B.R. & Mitchell, R.D. (Eds). Analysis of ecological systems. Ohio State University Press, Columbus, USA: 155-177.
Orr, A.J., Harvey, J.T. (2001) Quantifying errors associated with using fecal samples to determine the diet of the California sea lion (Zalophus californianus). Canadian Journal of Zoology, 79, 1080-1087.
Orr, A.J., Banks, A.S., Mellman, S., Huber, H.R., deLong, R.L., Brown, R.F. (2004) Examination of the foraging habits of Pacific harbor seal (Phoca vitulina richardsi) to
184
describe their use of the Umpqua River, Oregon, and their predation on salmonids. Fishery Bulletin, 102, 108-117.
Ozogul, Y., Duysak, O., Ozogul, F., Serhat Özkütük, A., Türeli, C. (2008) Seasonal effects in the nutritional quality of the body structural tissue of cephalopods. Food Chemistry, 108, 847-852.
Page, B., McKenzie, J., Goldsworthy, S.D. (2005a) Dietary resource partitioning among sympatric New Zealand and Australian fur seals. Marine Ecology Progress Series, 293, 283-302.
Page, B., McKenzie, J., Goldsworthy, S.D. (2005b) Inter-sexual differences in New Zealand fur seal diving behaviour. Marine Ecology Progress Series, 304, 249-264.
Parsons, K.M., Piertney, S.B., Middlemas, S.J., Hammond, P.S., Armstrong, J.D. (2005) DNA-based identification of salmonid prey species in seal faeces. journal of Zoology, London, 266, 275-281.
Patton, J.S. (1975) The effect of pressure and temperature on phospholipid and triglyceride fatty acids of fish white muscle: a comparison of deepwater and surface marine species. Comparative Biochemistry and Physiology part B, 52, 105-110.
Paul, L. (2000). New Zealand Fishes: identification, natural history, and fisheries. Revised Edition. Reed Books, Auckland, N.Z.
Paulin, C.D., Stewart, A., Roberts, C., McMillan, P. (1989). New Zealand fish: a complete guide. National Museum of New Zealand, Wellington, N.Z.
Peterson, B.J., Fry, B. (1987) Stable isotopes in ecosystem studies. Annual Review of Ecology and Systematics, 18, 293-320.
Phillips, K.L., Jackson, G.D., Nichols, P.D. (2001) Predation on myctophids by the squid Moroteuthis ingens around Macquarie and Heard Islands: stomach contents and fatty acid analysis. Marine Ecology Progress Series, 215, 179-189.
Phillips, K.L., Nichols, P.D., Jackson, G.D. (2002) Lipid and fatty acid composition of the mantle and digestive gland of four Southern Ocean squid species: implications for food-web studies. Antarctic Science, 14(3), 212-220.
Phillips, K.L., Nichols, P.D., Jackson, G.D. (2003) Dietary variation of the squid Moroteuthis ingens at four sites in the Southern Ocean: stomach contents, lipid and fatty acid profiles. Journal of Marine Biology Association of U.K., 83, 523-534.
Phleger, C.F., Nichols, P.D., Virtue, P. (1997) The lipid, fatty acid and fatty alcohol composition of the myctophid fish Electrona antarctica: high levels of wax esters and food-chain implications. Antarctic Science, 9(3), 258-265.
Phleger, C.F., Nichols, P.D., Erb, E., Williams, R. (1999) Lipids of the notothenioid fishes Trematomus spp. and Pagothenia borchgrevinki from East Antarctica. Polar Biology, 22, 241-247.

185
Pickston, L., Czochanska, Z., Smith, J.M. (1982) The nutritional composition of some New Zealand marine fish. New Zealand Journal of Science, 25, 19-26.
Pierce, G.J., Boyle, P.R. (1991) A review of methods for diet analysis in piscivorous marine mammals. Oceanography and Marine Biology: an Annual Review, 29, 409-486.
Pierce, G.J., Boyle, P.R., Watt, J., Grisley, M. (1993) Recent advances in diet analysis of marine mammals. Symposium of the Zoological Society of London, 66, 241-261.
Pierce, G.J., Santos, M.B. (2003) Diet of harbour seals (Phoca vitulina) in Mull and Skye (Inner Hebrides, western Scotland). Journal of Marine Biology Association of U.K., 83, 647-650.
Pierce, G.J., Santos, M.B., Learmonth, J.A., Mente, E., Stowasser, G. (2004a) Methods for dietary studies on marine mammals. Investigating the roles of cetaceans in marine ecosystems. CIESM, Workshop Monograph 25, Commission Internationale pour l'Exploration Scientifique de la mer Méditérranée, Monaco: 29-36.
Pierce, G.J., Santos, M.B., Reid, R.J., Patterson, I.A.P., Ross, H.M. (2004b) Diet of minke whales Balaenoptera acutorostrata in Scottish (UK) waters with notes on strandings of this species in Scotland 1992-2002. Journal of Marine Biology Association of U.K., 84, 1241-1244.
Pilar Sieiro, M., Aubourg, S.P., Rocha, F. (2006) Seasonal study of the lipid composition in different tissues of the common octopus (Octopus vulgaris). European Journal of Lipid Science and Technology, 108, 479-487.
Pitcher, K.W., Calkins, D.G. (1981) Reproductive biology of Steller sea lions in the Gulf of Alaska. Journal of Mammalogy, 62(3), 599-605.
Pizzocaro, F., Fedeli, E., Gasparoli, A. (1980) Studies on the auto-oxidation of sardine oil. In: Connell, J.J. (Ed). Advances in Fisheries Science and technology. Fishing News Books, London, U.K.: 258-263.
Polis, G.A. (1984) Age structure component of niche width and intra-specific resource partitioning: can age groups function as ecological species? The American Naturalist, 123(4), 541-564.
Post, D.M. (2002) Using stable isotope to estimate trophic position: models, methods, and assumptions. Ecology, 83(3), 703-718.
Prime, J.H., Hammond, P.S. (1987) Quantitative assessment of grey seal diet from faecal analysis. In: Huntley, A.C., Costa, D.P., Worthy, G.A.J. & Castellini, M.A. (Eds). Approaches to marine mammal energetics. Allen Press, Lawrence, Kansas, U.S.A.: 161-181.
Prime, J.H., Hammond, P.S. (1990) The diet of grey seals from the south-western North Sea assessed from analyses of hard parts found in faeces. journal of Applied Ecology, 27(2), 435-447.

186
Purcell, M., Mackey, G., LaHood, E., Huber, H., Park, L. (2004) Molecular methods for the genetic identification of salmonid prey from Pacific harbor seal (Phoca vitulina richardsi) scat. Fishery Bulletin, 102, 213-220.
Pusineri, C., Magnin, V., Meynier, L., Spitz, J., Hassani, S., Ridoux, V. (2007) Food and feeding ecology of the common dolphin (Delphinus delphis) in the oceanic Northeast Atlantic and comparison with its diet in neritic areas. Marine Mammal Science, 23(1), 30-47.
Raclot, T., Groscolas, R. (1993) Differential mobilization of white adipose tissue fatty acids according to chain length, unsaturation, and positional isomerism. Journal of Lipid Research, 34, 1515-1526.
Raclot, T., Groscolas, R. (1995) Selective mobilization of adipose tissue fatty acids during energy depletion in the rat. Journal of Lipid Research, 36, 2164-2173.
Rau, G.H., Sweeney, R.E., Kaplan, I.R. (1982) Plankton 13C:12C ratio changes with latitude: differences between northern and southern oceans. Deep-sea Research, 18, 1035-1039.
Raum-Suryan, K.L., Rehberg, M.J., Pendleton, G.W., Pitcher, K.W., Gelatt, T.S. (2004) Development of dispersal, movements patterns, and haul-out use by pup and juvenile Steller sea lion (Eumetopias jubatus) in Alaska. Marine Mammal Science, 20(4), 823-850.
Riet-Sapriza, F. (2007) Milk composition of the New Zealand sea lion and factors that influence it. PhD thesis. Massey University, Palmerston North, N.Z.
Robertson, B.C., Chilvers, B.L., Duignan, P.J., Wilkinson, I.S., Gemmell, N.J. (2006) Dispersal of breeding, adult male Phocarctos hookeri: implications for disease transmission, population management and species recovery. Biological Conservation, 127, 227-236.
Rosa, R., Nunes, M.L. (2003) Nutritional quality of red shrimp, Aristeus antennatus (Risso), pink shrimp, Parapenaeus longirostris (Lucas), and Norway lobster, Nephros norvegicus (Linnaeus). Journal of the Science of Food and Agriculture, 84, 89-94.
Rosa, R., Pereira, J., Nunes, M.L. (2005) Biochemical composition of cephalopods with different life strategies, with special reference to a giant squid, Architeuthis sp. Marine Biology, 146, 739-751.
Rosen, D.A.S., Trites, A.W. (1999) Metabolic Effects of Low-Energy Diet on Steller Sea Lions, Eumetopias jubatus. Physiological and Biochemical Zoology, 72(6), 723-731.
Rosen, D.A.S., Trites, A.W. (2000) Pollock and the decline of Steller sea lions: testing the junk-food hypothesis. Canadian Journal of Zoology, 78, 1243-1250.
Rosen, D.A.S., Trites, A.W. (2005) Examining the potential for nutritional stress in young Steller sea lions: physiological effects of prey composition. Journal of Comparative Physiology B, 175, 265-273.
187
Ruchonnet, D., Boutoute, M., Guinet, C., Mayzaud, P. (2006) Fatty acid composition of Mediterranean fin whale Balaenoptera physalus blubber with respect to body heterogeneity and trophic interaction. Marine Ecology Progress Series, 311, 165-174.
Ryg, M., Smith, T.G., Øritsland, N.A. (1988) Thermal significance of the topographical distribution of blubber in ringed seals (Phoca hispida). Canadian Journal of Fisheries and Aquatic Sciences, 45, 985-992.
Saito, R., Kawakami, T., Hamabe, M., Matsushita, Y. (1974) Preliminary note on the ecology of the ommastrephid squid Nototodarus sloani sloani (Gray) in New Zealand waters. Bulletin - Tokai Regional Fisheries Research Laboratory, 79, 35-68.
Samuel, A.M., Worthy, G.A.J. (2004) Variability in fatty acid composition of bottlenose dolphin (Tursiops truncatus) blubber as a function of body site, season, and reproductive state. Canadian Journal of Zoology, 82, 1933-1942.
Santos, M.B., Pierce, G.J., Learmonth, J.A., Reid, R.J., Ross, H.M., Patterson, I.A.P., Reid, D.G., Beare, D. (2004a) Variability in the diet of harbor porpoises (Phocoena phocoena) in Scottish waters 1992-2003. Marine Mammal Science, 20(1), 1-27.
Santos, M.B., Pierce, G.J., López, A., Martínez, J.A., Fernández, M.T., Ieno, E., Mente, E., Porteiro, C., Carrera, P., Meixide, M. (2004b) Variability in the diet of common dolphins (Delphinus delphis) in Galician waters 1991-2003 and relationship with prey abundance. ICES CM 2004/Q:09, 40 p.
Sargent, J.R. (1976) The structure, metabolism and function of lipids in marine organisms. In: Malins, D.C. & Sargent, J.R. (Eds). Biochemical and biophysical perspectives in marine biology, vol. 3. Academic Press, London, U.K.: 149-212.
Sargent, J.R., Parkes, R.J., Mueller-Harvey, I., Henderson, R.J. (1987) Lipid biomarkers in marine ecology. In: Sleigh, M.A. (Ed). Microbes in the sea. Wiley and Sons, New York, U.S.A.: 119-138.
Sargent, J.R., Falk-Petersen, S. (1988) The lipid biochemistry of calanoid copepods. Hydrobiologia, 167/168, 101-114.
Schell, D.M., Saupe, S.M., Haubenstock, N. (1989) Natural isotope abundances in bowhead whale (Balaena mysticetus) baleen: markers of aging and habitat usage. In: Rundel, P.W., Ehleringer, J.R. & Nagy, K.A. (Eds). Stable isotopes in ecological research. Springer-Verlag, New York, U.S.A.: 260-269.
Schoener, T.W. (1986) Resource partitioning. In: Kikkawa, J. & Anderson, D.J. (Eds). Community Ecology: Pattern and Process. Blackwell Scientific Publications, Melbourne, Australia: 91-126.
Sidhu, K.S. (2003) Health benefits and potential risks related to consumption of fish or fish oil. Regulatory Toxicology and Pharmacology, 38, 336-344.
Silva-Jr., J.M., Pandolfo, L.J., Sazima, I. (2004) Vomiting behavior of the spinner dolphin (Stenella longirostris) and squid meals. Aquatic Mammals, 30(2), 271-274.

188
Sinclair, E.H., Zeppelin, T.K. (2002) Seasonal and spatial differences in diet in the western stock of Steller sea lions (Eumetopias jubatus). Journal of Mammalogy, 83(4), 973-990.
Sinisalo, T., Jones, R.I., Helle, E., Valtonen, E.T. (2008) Changes in diets of individual Baltic ringed seals (Phoca hispida botnica) during their breeding season inferred from stable isotope analysis of multiple tissues. Marine Mammal Science, 24(1), 159-170.
Smale, M.J., Watson, G., Hetch, T. (1995). Otolith atlas of southern African marine fishes. Ichthyological Monographs number 1. J.L.B. Smith Institute of Ichthyology, Grahamstown, South Africa.
Smith, H.R., Worthy, G.A.J. (2006) Stratification and intra- and inter-specific differences in fatty acid composition of common dolphin (Delphinus sp.) blubber: Implications for dietary analysis. Comparative Biochemistry and Physiology part B, 143, 486-499.
Smith, M.H., Baird, S.J. (2007). Estimation of incidental captures of New Zealand sea lions (Phocarctos hookeri) in New Zealand fisheries in 2004-05, with particular reference to the SQU 6T squid trawl fishery. New Zealand Aquatic Environment and Biodiversity Report 12. Ministry of Fisheries, Wellington, New Zealand: 31 pp.
Smith, R.J., Hobson, K.A., Koopman, H.N., Lavigne, D.M. (1996) Distinguishing between populations of fresh- and salt-water harbour seals (Phoca vitulina) using stable-isotope ratios and fatty acid profiles. Canadian Journal of Fisheries and Aquatic Sciences, 53, 272-279.
Spence-Bailey, L.M., Verrier, D., Arnould, J.P.Y. (2007) The physiological and behavioral development of diving in Australian fur seal (Arctocephalus pusillus doriferus) pups. Journal of Comparative Physiology B, 177, 483-494.
Spitz, J., Rousseau, Y., Ridoux, V. (2006) Diet overlap between harbour porpoise and bottlenose dolphin: An argument in favour of interference competition for food? Estuarine, Coastal and Shelf Science, 70, 259-270.
Staniland, I.J. (2002) Investigating the biases in the use of hard prey remains to identify diet composition using Antarctic fur seals (Arctocephalus gazella) in captive feeding trials. Marine Mammal Science, 18(1), 223-243.
Staniland, I.J., Pond, D.W. (2004) Variability in milk fatty acids: recreating a foraging trip to test dietary predictions in Antarctic fur seals. Canadian Journal of Zoology, 82, 1099-1107.
Staniland, I.J., Pond, D.W. (2005) Investigating the use of milk fatty acids to detect dietary changes: a comparison with faecal analysis in Antarctic fur seals. Marine Ecology Progress Series, 294, 283-294.
Staniland, I.J., Boyd, I.L., Reid, K. (2007) An energy-distance trade-off in a central-place forager, the Antarctic fur seal (Arctocephalus gazella). Marine Biology, 152, 233-241.
189
Staniland, I.J., Robinson, S.L. (2008) Segregation between the sexes: Antarctic fur seals, Arctocephalus gazella, foraging at South Georgia. Animal Behaviour, 75, 1581-1590.
Summers, L.K.M., Barnes, S.C., Fielding, B.A., Beysen, C., Ilic, V., Humphreys, S.M., Frayn, K.N. (2000) Uptake of individual fatty acids in adipose tissue in relation to their presence in the diet. American Journal of Clinical Nutrition, 71, 1470-1477.
Taylor, R.H. (1971) Influence of man on vegetation and wildlife of Enderby and Rose islands, Auckland islands. New Zealand Journal of Botany, 9, 225-268.
Thiemann, G.W., Budge, S.M., Bowen, W.D., Iverson, S.J. (2004a) Comment on Grahl-Nielsen et al. (2003) 'Fatty acid composition of the adipose tissue of polar bears and of their prey: ringed seals, bearded seals and harp seals'. Marine Ecology Progress Series, 281, 297-301.
Thiemann, G.W., Budge, S.M., Iverson, S.J. (2004b) Determining blubber fatty acid composition: a comparison of in situ direct and traditional methods. Marine Mammal Science, 20(2), 284-295.
Thiemann, G.W., Iverson, S.J. (2007) Variability in the blubber fatty acid composition of ringed seals (Phoca hispida) across the Canadian Arctic. Marine Mammal Science, 23(2), 241-261.
Thompson, D., Duck, C.D., McConnell, B.J., Garrett, J. (1998) Foraging behaviour and diet of lactating female southern sea lions (Otaria flavescens) in the Falkland Islands. Journal of Zoology, London, 246, 135-146.
Thompson, P.M., Pierce, G.J., Hislop, J.R.G., Miller, D., Diack, J.S.W. (1991) Winter foraging vy common seals (Phoca vitulina) in relation to food availaibility in the inner Moray Firth, N.E. Scotland. Journal of Animal Ecology, 60(1), 283-294.
Tieszen, L.L., Boutton, T.W., Tesdahl, K.G., Slade, N.A. (1983) Fractionation and turnover of stable carbon isotopes in animal tissues: implications for δ13C analysis of diet. Oecologia, 57, 32-37.
Tollit, D.J., Steward, M.J., Thompson, P.M., Pierce, G.J., Santos, M.B., Hughes, S. (1997) Species and size differences in the digestion of otoliths and beaks: implications for estimates of pinniped diet composition. Canadian Journal of Fisheries and Aquatic Sciences, 54, 105-119.
Tollit, D.J., Wong, M., Winship, A.J., Rosen, D.A.S., Trites, A.W. (2003) Quantifying errors associated with using prey skeletal structures from fecal samples to determine the diet of Steller's sea lion (Eumetopias jubatus). Marine Mammal Science, 19(4), 724-744.
Tollit, D.J., Heaslip, S.G., Zeppelin, T.K., Joy, R., Call, K.A., Trites, A.W. (2004) A method to improve size estimates of walleye pollock (Theragra chalcogramma) and Atka mackerel (Pleurogrammus monopterygius) consumed by pinnipeds: digestion correction factors applied to bones and otoliths recovered in scats. Fishery Bulletin, 102, 498-508.

190
Tollit, D.J., Heaslip, S., Deagle, B., Iverson, S.J., Joy, R., Rosen, D.A.S., Trites, A.W. (2006) Estimating diet composition in sea lions: which technique to choose? In: Trites, A.W., Atkinson, S.K., DeMaster, D.P., Fritz, L.W., Gelatt, T.S., Rea, L.D. & Wynne, K.M. (Eds). Sea lions of the world. Alaska Sea Grant College Program, University of Alaska Fairbanks.
Tollit, D.J., Heaslip, S.G., Barrick, R.L., Trites, A.W. (2007) Impact of diet-index selection and the digestion of prey hard remains on determining the diet of the Steller sea lion (Eumatopias jubatus). Canadian Journal of Zoology, 85, 1-15.
Trites, A.W., Donnelly, C.P. (2003) The decline of Steller sea lions Eumetopias jubatus in Alaska: a review of the nutritional stress hypothesis. Mammal Review, 33(1), 3-28.
Trites, A.W., Joy, R. (2005) Dietary analysis from fecal samples: how many scats are enough? Journal of Mammalogy, 86(4), 704-712.
Trites, A.W., Calkins, D.G., Winship, A.J. (2007a) Diets of Steller sea lions (Eumetopias jubatus) in Southeast Alaska, 1993-1999. Fishery Bulletin, 105, 234-248.
Trites, A.W., Deecke, V.B., Gregr, E.J., Ford, J.K.B., Olesiuk, P.K. (2007b) Killer whales, whaling, and sequential megafaunal collapse in the north Pacific: a comparative analysis of the dynamics of marine mammals in Alaska and British Columbia following commercial whaling. Marine Mammal Science, 23(4), 751-765.
Tsydendambaev, V.D., Christie, W.W., Brechany, E.Y., Vereshchagrin, A.G. (2004) Identification of unusual fatty acids of four alpine plant species from the Pamirs. Phytochemistry, 65, 2685-2703.
Tucker, S., Bowen, W.D., Iverson, S.J. (2007) Dimensions of diet segregation in grey seals Halichoerus grypus revealed through stable isotopes of carbon (δ13C) and nitrogen (δ15N). Marine Ecology Progress Series, 339, 271-282.
Tucker, S., Bowen, W.D., Iverson, S.J. (2008) Convergence of diet estimates derived from fatty acids and stable isotopes within individual grey seals. Marine Ecology Progress Series, 354, 267-276.
Van Boven, M., Holser, R.A., Cokelaere, M., Decuypere, E., Govaerts, C., Lemey, J. (2000) Characterization of triglycerides isolated from jojoba oil. Journal of the American Oil Chemists' Society, 77, 1325-1328.
Vlieg, P. (1982a) Proximate and fatty acid composition of the flesh of New Zealand red cod, hoki, and jack mackerel. New Zealand Journal of Science, 25, 155-158.
Vlieg, P. (1982b) Proximate composition of the flesh of 7 less common New Zealand deep water fish species. New Zealand Journal of Science, 25, 233-235.
Vlieg, P. (1984a) Proximate composition of 10 commercial New Zealand fish species. New Zealand Journal of Zoology, 27, 99-104.
Vlieg, P. (1984b) Proximate composition of commercial New Zealand fish species. 2. New Zealand Journal of Zoology, 27, 427-433.

191
Vlieg, P. (1984c) Proximate composition of New Zealand squid species. New Zealand Journal of Zoology, 27, 145-150.
Vlieg, P., Body, D.R. (1988) Lipid contents and fatty acid composition of some New Zealand freshwater finfish and marine finfish, shellfish, and roes. New Zealand Journal of Marine and Freshwater Research, 22, 151-162.
Walker, J.L., Macko, S.A. (1999) Dietary studies of marine mammals using stable carbon and nitrogen isotopic ratios of teeth. Marine Mammal Science, 15(2), 314-334.
Walker, J.L., Potter, C.W., Macko, S.A. (1999) The diets of modern and historic bottlenose dolphin populations reflected through stable isotopes. Marine Mammal Science, 15(2), 335-350.
Walton, M.J., Henderson, R.J., Pomeroy, P.P. (2000) Use of blubber fatty acid profiles to distinguish dietary differences between grey seals Halichoerus grypus from two UK breeding colonies. Marine Ecology Progress Series, 193, 201-208.
Walton, M.J., Pomeroy, P.P. (2003) Use of blubber fatty acid profiles to detect inter-annual variations in the diet of grey seals Halichoerus grypus. Marine Ecology Progress Series, 248, 257-266.
Walton, M.J., Silva, M.A., Magalhães, S.M., Prieto, R., Santos, R.S. (2007) Using blubber biopsies to provide ecological information about bottlenose dolphins (Tursiops truncatus) around the Azores. Journal of Marine Biology Association of U.K., 87, 223-230.
Weise, M.J. (2006) Foraging ecology of male California sea lion (Zalophus californianus): movement, diving and foraging behavior, and diving capacity. PhD thesis, University of California, Santa Cruz, U.S.A.
Weise, M.J., Costa, D.P., Kudela, R.M. (2006) Movement and diving behavior of male California sea lion (Zalophus californianus) during anomalous oceanographic conditions to those of 2004. Geophysical Research Letters, 33, 1-6.
Welle, S. (1999). Human protein metabolism. Springer-Verlag, New York, U.S.A.
Werner, R., Campagna, C. (1995) Diving behaviour of lactating southern sea lions (Otaria flavescens) in Patagonia. Canadian Journal of Zoology, 73, 1975-1982.
Werner, R., Figueroa-Carranza, A., Ortiz, C.L. (1996) Composition and energy content of milk from southern sea lions (Otaria flavescens). Marine Mammal Science, 12, 313-317.
Wetzel, D.L., Reynolds III, J.E. (2004) Definitive identification of fatty acid constituents in marine mammal tissues. Canadian Journal of Fisheries and Aquatic Sciences, 61, 554-560.
Wetzel, D.L., Reynolds III, J.E., Christie, W.W. (2007) Identification of fatty acids by picolinyl ester derivatives. Marine Mammal Science, 23(4), 989-990.
192
Wheatley, K.E., Nichols, P.D., Hindell, M.A., Harcourt, R.G., Bradshaw, C.J.A. (2007) Temporal variation in the vertical stratification of blubber fatty acids alters diet predictions for lactating Weddell seals. Journal of Experimental Marine Biology and Ecology, 352, 103-113.
Whiteley, G.S.W., Fuller, B.J., Hobbs, K.E.F. (1992) Deterioration of cold-stored tissue specimens due to lipid peroxidation: modulation by antioxidants at high subzero temperatures. Cryobiology, 29, 668-673.
Wilkinson, I.S., Burges, J., Cawthorn, M. (2003) New Zealand sea lions and squid: managing fisheries impacts on a threatened marine mammal. In: Gales, N.J., Hindell, M.A. & Kirkwood, R. (Eds). Marine Mammals: Fisheries, Tourism and Management Issues. CSIRO Publishing, Collingwood, Australia: 192-207.
Wilkinson, I.S., Duignan, P.J., Castinel, A., Grinberg, A., Chilvers, B.L., Robertson, B.C. (2006) Klebsiella pneumoniae Epidemics: possible impacts on New Zealand sea lion recruitment. In: Trites, A.W., Atkinson, S., DeMaster, D.P., Fritz, L.W., Gelatt, T.S., Rea, L.D. & Wynne, K.M. (Eds). Sea Lions of the World. Alaska Sea Grant College Program, University of Alaska Fairbanks: 385-403.
Williams, T.M., Rutishauser, M., Long, B., Fink, T., Gafney, J., Mostman-Liwanagm, H., Casper, D. (2007) Seasonal Variability in Otariid Energetics: Implications for the Effects of predators on Localized Prey Resources. Physiological and Biochemical Zoology, 80(4), 433-443.
Winship, A., Trites, A.W., Rosen, D.A.S. (2002) A bioenergetic model for estimating the food requirements of Steller sea lions Eumetopias jubatus in Alaska, USA. Marine Ecology Progress Series, 229, 291-312.
Winship, A.J., Trites, A.W. (2003) Prey consumption of Steller sea lions (Eumetopias jubatus) off Alaska: How much prey do they require? Fishery Bulletin, 101, 147-167.
Winship, A., Hunter, A.M.J., Rosen, D.A.S., Trites, A.W. (2006) Food consumption by sea lions: existing data and techniques. In: Trites, A.W., Atkinson, S., DeMaster, D.P., Fritz, L.W., Gelatt, T.S., Rea, L.D. & Wynne, K.M. (Eds). Sea Lions of the World. Alaska Sea Grant College Program, University of Alaska Fairbanks: 177-191.
Wolff, R.L., Christie, W.W. (2002) Structures, practical sources (gymnosperm seeds), gas-liquid chromatographic data (equivalent chain lengths), and mass spectrometric characteristics of all-cis 5-olefinic acids. European Journal of Lipid Science and Technology, 104, 234-244.
Worthy, T.H. (1994) Holocene breeding of sea lions (Phocarctos hookeri) at Delaware Bay, Nelson, South Island, New Zealand. New Zealand Natural Sciences, 21, 61-70.
Wren, J.J., Szczepanowska, A.D. (1964) Chromatography of lipids in presence of an antioxidant, 4-methyl-2,6-di-tert.-butylphenol. Journal of Chromatography, 14, 405-410.
Xu, R., Hung, S.S.O., German, J.B. (1993) White surgeon tissue fatty acid compositions are affected by dietary lipids. Journal of Nutrition, 123, 1685-1692.

193
Yonezaki, S., Kiyota, M., Baba, N., Koido, T., Takemura, A. (2003) Size distribution of the hard remains of prey in the digestive tract of northern fur seal (Callorhinus ursinus) and related baises in diet estimation by scat analysis. Mammal Study, 28, 97-102.
York, A.E. (1994) The population dynamics of Northern sea lions, 1975-1985. Marine Mammal Science, 10, 38-51.
York, A.E., Thomason, J.R., Sinclair, E.H., Hobson, K.A. (2008) Stable carbon and nitrogen isotope values in teeth of Steller sea lions: age of weaning and the impact of the 1975-1976 regime shift in the North Pacific Ocean. Canadian Journal of Zoology, 86, 33-44.
Zeppelin, T.K., Ream, R.R. (2006) Foraging habitats based on the diet of female northern fur seals (Callorhinus ursinus) on the Probilof Islands, Alaska. Journal of Zoology, London, 270, 565-576.
Zhao, L., Castellini, M.A., Mau, T.L., Trumble, S.J. (2004) Trophic interactions of Antarctic seals as determined by stable isotope signatures. Polar Biology, 27, 368-373.
Zhao, L., Schell, D.M., Castellini, M.A. (2006) Dietary macronutrients influence 13C and 15N signatures of pinnipeds: captive feeding studies with harbor seals (Phoca vitulina). Comparative Biochemistry and Physiology part A, 143, 469-478.