University of Montana University of Montana ScholarWorks at University of Montana ScholarWorks at University of Montana Graduate Student Theses, Dissertations, & Professional Papers Graduate School 1983 Distribution status and feeding ecology of the Sumatran Distribution status and feeding ecology of the Sumatran rhinoceros in Malaysia rhinoceros in Malaysia Rodney W. Flynn The University of Montana Follow this and additional works at: https://scholarworks.umt.edu/etd Let us know how access to this document benefits you. Recommended Citation Recommended Citation Flynn, Rodney W., "Distribution status and feeding ecology of the Sumatran rhinoceros in Malaysia" (1983). Graduate Student Theses, Dissertations, & Professional Papers. 6696. https://scholarworks.umt.edu/etd/6696 This Thesis is brought to you for free and open access by the Graduate School at ScholarWorks at University of Montana. It has been accepted for inclusion in Graduate Student Theses, Dissertations, & Professional Papers by an authorized administrator of ScholarWorks at University of Montana. For more information, please contact [email protected].

Welcome message from author
This document is posted to help you gain knowledge. Please leave a comment to let me know what you think about it! Share it to your friends and learn new things together.
Transcript
University of Montana University of Montana
ScholarWorks at University of Montana ScholarWorks at University of Montana
Graduate Student Theses, Dissertations, & Professional Papers Graduate School
1983
Distribution status and feeding ecology of the Sumatran Distribution status and feeding ecology of the Sumatran
rhinoceros in Malaysia rhinoceros in Malaysia
Rodney W. Flynn The University of Montana
Follow this and additional works at: https://scholarworks.umt.edu/etd
Let us know how access to this document benefits you.
Recommended Citation Recommended Citation Flynn, Rodney W., "Distribution status and feeding ecology of the Sumatran rhinoceros in Malaysia" (1983). Graduate Student Theses, Dissertations, & Professional Papers. 6696. https://scholarworks.umt.edu/etd/6696
This Thesis is brought to you for free and open access by the Graduate School at ScholarWorks at University of Montana. It has been accepted for inclusion in Graduate Student Theses, Dissertations, & Professional Papers by an authorized administrator of ScholarWorks at University of Montana. For more information, please contact [email protected].

COPYRIGHT ACT OF 1976T h i s is a n u n p u b l i s h e d m a n u s c r i p t in w h i c h c o p y r i g h t s u b
s i s t s . A n y f u r t h e r r e p r i n t i n g o f its c o n t e n t s m u s t b e a p p r o v e d
BY THE AUTHOR.
Ma n s f i e l d L i b r a r y Un i v e r s i t y ^pJIp^TANA D a t e : l & b à
Reproduced with permission of the copyright owner. Further reproduction prohibited without permission.

Reproduced with permission of the copyright owner. Further reproduction prohibited without permission.
DISTRIBUTION, STATUS, AND FEEDING ECOLOGY OF THE SUMATRAN RHINOCEROS IN MALAYSIA
BY
Rodney W. Flynn
B. S., University of Montana, 1974
Presented in partial fulfillment of the requirements for the degree of
Master of Science
UNIVERSITY OF MONTANA
1983
Approved by:
Chairman, Board of Examiners
Dean, Graduate Scmrol
8 August 1983Date
Reproduced with permission of the copyright owner. Further reproduction prohibited without permission.
UMI Number: EP37497
All rights reserved
INFORMATION TO ALL USERS The quality of this reproduction is dependent upon the quality of the copy submitted.
In the unlikely event that the author did not send a complete manuscript and there are missing pages, these will be noted. Also, if material had to be removed,
a note will indicate the deletion.
UMT0ia«art8tion Rjblishing
UMI EP37497Published by ProQuest LLC (2013). Copyright in the Dissertation held by the Author.
Microform Edition © ProQuest LLC.All rights reserved. This work is protected against
unauthorized copying under Title 17, United States Code
Pro.Q st*ProQuest LLC.
789 East Eisenhower Parkway P.O. Box 1346
Ann Arbor, Ml 48106- 1346
Reproduced with permission of the copyright owner. Further reproduction prohibited without permission.
Flynn, Rodney W . , M.S., Summer 1983 Wildlife Biology
Distribution, Status, and Feeding Ecology of the Sumatran Rhinoceros in Peninsular Malaysia. (186 pp.)
Director: Bart W. O'Gara^
The distribution, status, and feeding ecology of the Sumatran rhinoceros in Peninsular Malaysia was investigated from 1975 to 1981. Information on distribution and status country-wide was collected from field surveys, interviews with people living near rhino areas, and the literature. I confirmed that rhinos presently occur in 10 isolated areas scattered throughout the Malay Peninsula. The number of rhinos was estimated at 50 to 80 with the Endau-Rompin (20-25), Taman Negara (8-12), and Sungai Dusun (4-6) areas containing the largest contiguous populations. The Sumatran rhino is threatened with extinction in Peninsular Malaysia. Excessive killing of rhinos has greatly reduced numbers; habitat destruction from logging and land clearance for agricultural development have reduced the amount of available habitat and isolated small populations. The Endau-Rompin region was found to be the most suitable site to maintain a viable population of rhinos in Malaysia because it contains the largest number of animals, evidence of reproduction has been Observed, a law enforcement program has been started, and a portion of the area (870 km^)has been proposed for national park status. Feeding ecology of the Sumatran rhino was studied in the Endau-Rompin region, southern Peninsular Malaysia, to provide information on foods eaten and habitats selected. Feeding sites were located by following recent rhino tracks. Within primary hill forest, Sumatran rhinos selected feeding sites in stream bottom (59%) and lower slope (34%) physiographic types. Small forest gaps (35%) were used more than their availability (15%), but most of the feeding cases were in closed-canopy forest (63%). Sumatran rhinos were mostly browsers, feeding primarily on the mature leaves of woody understory plants. Large, fleshy fruits were eaten occassionally. The diet was diverse with 49 plant families, 102 genera, and between 156 to 181 species represented in 342 feeding cases. Prunus sp. (15.1%), Ficus sp. (6.4%), Pavetta sp. (6.1%), Medusanthera sp. (3.8%), and Eugenia sp. (3.0) contributed the greatest amounts to diet proportions. Chemical analyses of plant materials, collected from certain food plants and randomly selected non-food plants, indicated that Sumatran rhinos selected plants and plant parts high in minerals and crude protein but low in fiber. Phenolics and tannins were tolerated in the diet, but principal food plants contained less tannin.
ii
Reproduced with permission of the copyright owner. Further reproduction prohibited without permission.
ACKNOWLEDGMENTS
Many people and organizations contributed to the success of
this project. In this section, I would like to acknowledge people that
assisted in conducting the overall project. People that contributed to
specific aspects of the study have been acknowledged at the end of that
particular section.
Financial support for this project was provided by the
Malaysian Department of Wildlife and National Parks, World Wildlife
Fund, the Smithsonian-Peace Corps Environmental Program, the National
Wildlife Federation, and the Montana Cooperative Wildlife Research Unit.
Special thanks go to the personnel of the Malaysian Department
of Wildlife and National Parks (DWNP), and the Malaysian Government as a
whole, for their assistance in all aspects of this study. In
particular, I thank Mr. Mohd. Khan bin Momin Khan, Director-General,
DWNP, for sponsering this project and providing the required direction,
encouragement, and support to complete it. Many thanks go to Mr. Louis
Ratnam, Research Officer, for introducing me to the Malaysian
environment, providing administrative support, coordinating the field
work, and contributing many ideas. The fine collaboration of
Mohd. Tajuddin Abdullah, Deputy Research Officer, is gratefully
acknowledged. The DWNP‘'s field staff assisted admirably throughout the
project, especially the game rangers of the Rhino Unit. Encik Abdullah
Ibrahim, Senior Ranger, introduced me to the ways of working in the
ill
Reproduced with permission of the copyright owner. Further reproduction prohibited without permission.
jungle and provided many hours of assistance in the field. Also, I
thank the directors of the state offices for providing men and equipment
as needed, especially Ahmat Harun, Ahmat Zabidi, Jamari Abdullah, Musa
Nordin, and Peter Fong. Collabration during this study with personnel
of the Forest Research Institute, Malaysian Department of Forestry, was
extremely valuable. Mr. K. Kochummen, Forest Botanist, identified most
of the plant materials and provided information on the ecological
characteristics of the collected plant taxa. Dr. F . Ng identified
additional plant materials and contributed ideas on rain forest ecology.
Information on rainfall was provided by the Director-General, Department
of Irrigation and Drainage. Personnel of the Department of
Socio-economic Research and Planning and the Department of Immigration
provided the visa clearance required to conduct research in Malaysia.
I thank the staffs of the International Union for the
Conservation of Nature and Natural Resources (lUCN) and the World
Wildlife Fund (WWF) for providing the grants needed to complete this
study. Drs. R. and L. Schenkel encouraged me to continue these studies,
helped obtain additional funding, and shared many ideas on rhino
biology. Dr. A. Fernhout, Program Manager, administered the WWF grants
and provided timely bank drafts.
Special thanks go to Dr, B. O'Cara, Director of my Graduate
Committee, for thoughtful advice and editing of the manuscript. My
other Committee members, Drs. C. Jonkel and A. Sheldon, provided many
useful ideas on the research plan, suggestions on the data analysis, and
constructive comments on the manuscript. Dr. R. Ream contributed many
XV
Reproduced with permission of the copyright owner. Further reproduction prohibited without permission.
valuable ideas on plant sampling techniques. I thank the staff of the
Montana Cooperative Wildlife Research Unit, particularly Ginger
Schwartz, for cheerfully helping with many tasks during my trips abroad.
I am particularly indebted to Paul Conry, a fellow jungle
treker, for enduring many sweaty days in the field helping to collect
data and several sleepless nights typing parts the manuscript. Cathy
Connor drafted most of the figures, edited the manuscript, and provided
the necessary encouragement to complete this paper. My many thanks to
Dr. P. Waterman, Phytochemistry Research Laboratory, University of
Strathclyde, Mr. Chan Khoon San, Highlands Research Unit, and
Dr. K. C. Chan, University of Malaya, for completing the chemical
analyses of the plant materials. Many people contributed stimulating
ideas on tropical ecology, particularly P. Becker, P. Conry, M. Wong,
R. Olivier, C. Marsh, M. Monroe, J. Wright, J. Putz, K, Wolf, K. Rubeli,
P. Waterman, J. Payne, G. Davies, F. N g , and K. Kochummen. My
background on Asian rhino biology was expanded greatly by discussions
with Andrew Laurie in Nepal and Nico Van Strien in Sumatra.
Early phases of this project were greatly facilited by the
assistance of the staff of Peace Corps Malaysia, especially J. Ferguson,
C. Diniger, R. Graulik, and K. French. Dr. J. Sherbourne,
Smithsonian-Peace Corps Environmental Program, helped in project
development and provided a supplement grant. Fellow Peace Corps
Volunteers - P. Conry, C. Connor, M. Griffin, M. Caprata, K. Ritzer,
M. Monroe, L. England, P. Becker, and M. Wong - provided the warm
companionship needed to keep trekking in a foreign land.
Reproduced with permission of the copyright owner. Further reproduction prohibited without permission.

Finally, my warmest appreciation to Kang Kong bin Mintol and
other members of Kampung Juaseh - Mohd. Nor, Mamek, Alai, Kwai, and
Ghani - for sharing their intimate knowledge of the Endau-Rompin forests
with me and providing many a tale around the camp fire.
VI
Reproduced with permission of the copyright owner. Further reproduction prohibited without permission.
TABLE OF CONTENTS
Page
A B S T R A C T ................................................................. . ii
ACKNOWLEDGMENTS ................................................i ü
LIST OF T A B L E S .............................................................. x
LIST OF F I G U R E S .............................................................. xii
CHAPTER
I. INTRODUCTION ...................................................... 1
II. DISTRIBUTION AND STATUS OF THE SUMATRAN RHINOCEROS INPENINSULAR MALAYSIA ............................................ 3
Title Page ........................................... 3Abstract .......................................................... 4Introduction ................................................... 5Distribution and Numbers .................................... 9
Southern Region ............................................... 9Endau-Rompin area . . . . . 9Gunung Belumüt ........................................... 14Mersing Coast . . . . . 15
Northcentral Region ........................................ 15Taman Negara . ............................................ 15Sungai Depak ............................................... 19Kuala B a l a h ............................................... 19Ulu L e p a r ................................................... 20Bukit G e b o k ............................................... 21Krau Wildlife Reserve .................................... 21
West Coastal R e g i o n ........................................ 22Sungai Dusun Wildlife Reserve . . . 22
Northwest Region ........................................... 25U lu Se l a m a ................................................... 25Ulu B e l u m ......................... - 25Thai-Kedah border ........................................ 26
Status and Conservation ........................................ 26A c k n o w l e d g m e n t s ........................................... 33References . . . . . . . . . . 34
vxi
Reproduced with permission of the copyright owner. Further reproduction prohibited without permission.
III. DISTRIBUTION AND NUMBER OF SUMATRAN RHINOCEROS IN THEENDAU-ROMPIN REGION OF PENINSULAR MALAYSIA . . . . . 37
Title P a g e ..................... 37Abstract . . . . . 38I n t r o d u c t i o n ............................................... 39Study A r e a ...................................................... 41
Endau-Rompin Region ........................................ 41Census Area . . . . . . . . . . . . . . . 44
Methods and P r o c e d u r e s ................................. 44Field M e t h o d s .................................................. 44
General survey .............................................. 44Census surveys ............................. 47
Statistical Procedures ................................. 48R e s u l t s .......................................................... 31
Characteristics of Track Measurements .................. 51Distribution ................................................... 53Census Surveys ............................................... 58
Census 1 * ............................................... 58Census 2 ................................................... 58Census 3 ................................................... 63Census 4 63
N u m b e r s ......................... 68Population Characteristics ................................. 68
D i s c u s s i o n ...................................................... 69Track C h a r a c t e r i s t i c s............................ 69Distribution ............................................ 71N u m b e r s ............................................ 72Population Trends .............................................. 73Conservation ..................................................... 74
Acknowledgments .................................................. 79R e f e r e n c e s ......................................................... 80
IV. FEEDING ECOLOGY OF THE SUMATRAN RHINOCEROS IN SOUTHERNPENINSULAR M A L A Y S I A .................................... 84
Title P a g e ...................................................... 84A b s t r a c t ......................... 85Introduction ................................................... 86Study A r e a ...................................................... 90Methods and Procedures . . . . . . . 94
Feeding Behavior ........................................... 94Food Plant Characteristics . . . . . . . . . . 95Habitat Characteristics .................................... 96Habitat Availability . . . . 97
Transects .................................... 97Random p o i n t s .................. 98
Plant C h e m i s t r y .................. 98Food p l a n t s ............................................... 98
viii
Reproduced with permission of the copyright owner. Further reproduction prohibited without permission.

Non-food plants ............................................ 99Data A n a l y s e s ....................................................100
Data o r g a n i z a t i o n ........................................ 100Habitat selection .................................... 100Diet c o m p o s i t i o n ................................ 102Food a v a i l a b i l i t y ............................................ 102Diet q u a l i t y ..................... 103Food selection ............................................ 104
R e s u l t s ..................... 105Feeding Behavior .................................... 105
Method of f e e d i n g ............................................ 106Habitat Selection .............................. . . . . 108Diet Composition ........................................ 116
Plant life f o r m ................................................116Botanical composition .................................... 116Plant p a r t s ............................................... 123
Use I n d e x ...........................................................126Ecological Characteristics of Food Plants .............. 126Food A v a i l a b i l i t y ........................................... 129Understory Phenology ........................................ 133Plant C h e m i s t r y ................................................... 133
Diet q u a l i t y ................................................... 135Plant parts ................................................139Food and non-food plants .......................142Principal food plants , ............................. ... 144Use i n d e x ....................................................... 144Crude protein/digestion inhibitor ratio ............... 146
D i s c u s s i o n ................................ 148Acknowledgments . . . . . 165R e f e r e n c e s ..................... 167A p p e n d i c e s ...........................................................176
A. Food plant l i s t .................................... 176B. Chemical composition of certain food plants . . . 182C. Chemical composition of certain non-food plants . . 186
XX
Reproduced with permission of the copyright owner. Further reproduction prohibited without permission.

LIST OF TABLES
Table Page
CHAPTER II
1. Number of Sumatran rhinoceros in Peninsular Malaysia . 13
CHAPTER III
1. Track observations from Census I conducted duringMarch 1977................ ... .................................... 60
2. Multiple comparison of track observations recorded duringCensus I ...............................................60
3. Track observations from Census II conducted duringMay 1977 .............................. 62
4. Multiple comparison of track observations recorded duringCensus II . . . . ................................ ... 62
5. Track observations from Census III conducted duringMarch 1979 .................................................... 65
6. Multiple comparison of track observations recorded duringCensus I I I .......................................................65
7. Track observations from Census IV conducted duringSeptember 1980.................................................... 67
8. Multiple comparison of track observations recorded duringCensus I V .......................................................67
CHAPTER IV
1. Principal plants in the diet of the Sumatran rhinocerosby plant f a m i l y .................................................. 121
2. Principal plants in the diet of the Sumatran rhinocerosby plant g e n e r a ............................................... 122
3. Fruits eaten by Sumatran rhinos .............................. 125
X
Reproduced with permission of the copyright owner. Further reproduction prohibited without permission.

4. Mean use index of rhino food plants by plantg e n u s ............................................................. 127
5. Density of saplings within the rhino food plant size classin the forest understory per ha by physiographic type . 130
6. Relative abundance of some plants within the rhino foodplant size class in the forest understory . . 132
7. Phenology of understory saplings within rhino foodsize c l a s s ..........................................................134
8. Chemical composition of Sumatran rhino diets .......... 138
9. Comparison of the chemical composition of mature leafand stem m a t e r i a l ...............................................141
10. Comparison of the chemical composition of food plantsand non-food p l a n t s ...............................................143
11. Calculated nutrient/digestion-inhibitor ratios for matureleaves of plants eaten by Sumatran rhinos .......... 147
XX
Reproduced with permission of the copyright owner. Further reproduction prohibited without permission.

LIST OF FIGURES
Figure Page
Chapter II
1. The locations of Sumatran rhino track observations in thesouthern region of Peninsular Malaysia .................... 10
2. The locations of Sumatran rhino track observations in thenorthcentral region of Peninsular Malaysia ................. 16
3. The location of Sumatran rhino sign observations in thenorthwest and west-coastal regions of PeninsularM a l a y s i a ...................................... 23
CHAPTER III
1. Study area in the Endau-Rompin region located in southernpeninsular Malaysia . . . . . 42
2. Census study area located within the Endau-Rompin regionof southern Peninsular Malaysia ............................... 45
3. Present distribution of Sumatran rhinos in the Endau-Rompin region of Peninsular Malaysia » 54
4. The location of track observations recorded duringCensus I ........................................................... 59
5. The locations of track observations recorded duringCensus I I ...................... - .................................. 61
6. The locations of track observations recorded duringCensus I I I ........................................................... 64
7. The locations of track observations recorded duringCensus I V ................................................. 66
CHAPTER IV
1. Selai study area in southern Peninsular Malaysia . . . . 91
2. Sumatran rhino feeding methods on woody saplings . . . . 107
xii
Reproduced with permission of the copyright owner. Further reproduction prohibited without permission.
3. Plot of the habitat parameters at feeding sites on the first2 principal components .......................................... 109
4. Proportion of physiographic types at rhino feeding sitescompared to points along transects placed in study area . 110
5. Mean elevation at rhino feeding sites compared torandom points placed in the study a r e a ................. 112
6. Mean percent slope at rhino feeding sites compared to randompoints placed in study a r e a ....................................113
7. Mean percent canopy cover at rhino feeding sites compared torandom points placed in study area . . . . . . . 114
8. Proportion of successional stages at rhino feeding sitescompared to points along transects placed in study area . 115
9. Proportion of plant life forms in rhino's diet . . . . 117
10. Relationship between the cumulative number of feeding casesand cumulative number of plant genera ....................... 119
11. Ecological characteristics of plants eaten by Sumatranr h i n o s ...................................................... 128
12. Plant chemistry prameters of food plants ploted onthe first 2 principal components ........................... 136
13. Plant chemistry parameters of non-food plants plotted on thefirst 2 principal c o m p o n e n t s ....................................137
14. Presence of certain secondary plant compounds in rhino foodp l a n t s ............................................................. 140
15. Centroids of plant groups plotted on the first 2 discriminantfunction a x e s ...................................................... 145
X X I X
Reproduced with permission of the copyright owner. Further reproduction prohibited without permission.

Page 1
CHAPTER I
INTRODUCTION
This thesis contains 3 chapters dealing with the distribution,
status, and feeding ecology of the Sumatran rhinoceros in Peninsular
Malaysia. The chapters are written as discrete papers ready for
publication, each with an abstract, introduction, text, acknowledgments,
and references. The writing style of each chapter depends on the
targeted journal.
Most of the information presented in Chapters II and III was
collected during 1975 to 1978 while I was attached to the Malaysia
Department of Wildlife and National Parks as a research officer.
Additional information for Chapters II and III, and all the data for
Chapter IV, was collected during January through May 1979, and July 1980
through August 1981 while I was on contract with World Wildlife Fund
International. I designed and directed the projects, analyzed the data,
and wrote the papers. Mr. Mohd. Tajuddin Abdullah, my Malaysian
counter-part, assisted with the field work and will be a co-author in
publication of Chapters II and III. Dr. Peter Waterman, University of
Strathclyde, assayed the plant materials for secondary plant compounds
and provided some interpretations of the plant chemistry data; he will
be a co-author in publication of Chapter IV,
In Chapter II, information collected on the present
distribution of Sumatran rhinos in Peninsular Malaysia is presented.
Reproduced with permission of the copyright owner. Further reproduction prohibited without permission.
Page 2
Locations of known rhino areas are shown, estimates of population sizes
are given, and the status of rhinos in these areas is discussed. Also,
recommendations are presented for the conservation of the Sumatran rhino
in Peninsular Malaysia.
Chapter III reports the results of an intensive survey of
Sumatran rhinos in the Endau-Rompin region. This area was found to
contain the largest contiguous population of rhinos in the country. The
number of rhinos occurring in the Endau-Rompin region is given based on
a series of 4 census surveys. Conservation options for the Endau-Rompin
area are presented.
In Chapter IV, the feeding ecology of Sumatran rhinos in the
Selai River study site, located within the Endau-Rompin region, is
described. Quantitative information is presented on the kinds and
amounts of foods eaten, the types of habitats selected at feeding sites,
and the chemical composition of certain food and non-food plants. Rhino
food selection is discussed in terms of the availability of foods and
habitat components, and the chemical composition of available plant
material.
Reproduced with permission of the copyright owner. Further reproduction prohibited without permission.

Page 3
CHAPTER II
DISTRIBUTION AND STATUS OF THE SUMATRAN RHINOCEROS
IN PENINSULAR MALAYSIA
Reproduced with permission of the copyright owner. Further reproduction prohibited without permission.

Page 4
ABSTRACT
Distribution and status of the Sumatran rhinoceros in
Peninsular Malaysia were studied from 1975 to 1981. I compiled
information collected from field surveys, interviews with people living
near rhino areas, and the literature. Most potential rhino areas were
surveyed on the ground to confirm the presence of animals, estimate
numbers, and evaluate the status of the habitat. 1 confirmed that
rhinos presently occur in 10 isolated areas scattered throughout the
Malay Peninsula. The number of rhinos is estimated at 50 to 75 animals
with the Endau-Rompin (20-25), Taman Negara (8-12), and Sungai Dusun
(4-6) areas containing the largest contiguous populations. The Sumatran
rhino appears threatened with immediate extinction in Peninsular
Malaysia. Excessive killing of rhinos because of the high commercial
value of their body parts has greatly reduced numbers. Habitat
destruction from logging and forest clearance has separated and isolated
already small populations. I recommend that conservation efforts for
this species in Malaysia be concentrated in the Endau-Rompin region
because this population has the best chances for survival.
Reproduced with permission of the copyright owner. Further reproduction prohibited without permission.
Page 5
INTRODUCTION
The Sumatran or two-horned Asiatic rhinoceros (Dicerorhinus
sumatrensis Fisher 1814), one of the world's rarest large mammals, is
threatened with extinction throughout its range (Simon, 1969). Once
found across Southeast Asia, this rare, forest-dwelling rhino is now
restricted to small isolated populations occurring in Burma, Thailand,
the Malay peninsula, Sumatra, and Borneo (Van Strien, 1974; McNeely &
Laurie, 1977; Borner, 1978; Schenkel & Schenkel, 1979; Payne, 1980;
Flynn, 1981). Excessive hunting has greatly depleted rhino numbers and
reduced their distribution (Van Strien, 1974). The high value of their
body parts, especially the horn, continues to encourage illegal killing
(Martin, 1979). In addition, extensive habitat destruction from logging
and forest clearance for agricultural development has isolated already
small populations and reduced the amount of suitable habitat.
In Malaysia, little information has been available on the
distribution and status of the Sumatran rhino, the literature consisting
mostly of old accounts by hunters and game wardens (e.g. Hubback,
1939; Foenander, 1952; Hislop, 1965). Difficult field conditions and
elusive animals have discouraged extensive field surveys. After
reviewing the status of rare Asian wildlife, Talbot (1960) emphasized
the lack of information on the Sumatran rhino in Malaysia. A brief
field survey by Milton (1963) provided information on the occurrence of
a small rhino population near the Bernam River in the state of Selangor.
In 1965, the 40 km Sungai Dusun Wildlife Reserve was established to
Reproduced with permission of the copyright owner. Further reproduction prohibited without permission.
Page 6
protect these rhinos. Strickland's (1967) short study of this rhino
population provided the first ecological information on the species.
About the same time, Stevens (1968) surveyed other existing wildlife
reserves in Malaysia and proposed the establishment of additional
sanctuaries where he had found rhino sign.
In 1974, the Malaysian Department of Wildlife and National
Parks (DWNP) initiated a long-term study on the distribution and status
of the Sumatran rhinoceros in Peninsular Malaysia. This paper presents
the results of that study along with a review of historical reports
collected from the literature and DWNP files. From 1975 through 1981, I
compiled all rhino reports collected from DWNP field staff and
interviews with people working or living in rhino habitat. Potential
rhino areas were surveyed on foot to confirm the presence of animals.
Confirmation of rhino reports by field surveys was necessary because
most people confuse rhino tracks with those of Malayan tapir (lapirus
indicus) . I found that many people believe tapirs are actually young
rhinos; the base Malayan name (badak) is the same for both animals.
During the field surveys, I recorded all rhino sign,
especially tracks and wallows, encountered while hiking through
suspected rhino areas. Usually I walked along stream bottoms or ridges,
where sign was most likely to be found. Sometimes a local guide would
show me specific places where tracks or wallows had been observed
previously. Recent rhino tracks were followed until at least 10 rear
foot prints could be recorded. For each track, the maximum width
between the lateral toes and the width of the middle toe was measured
Reproduced with permission of the copyright owner. Further reproduction prohibited without permission.
Page 7
(Flynn, 1978). The minimum number of individual animals in an area was
estimated based on differences in median track size and the distance
between track locations (Flynn and Abdullah, 1983). Also, the
relative frequency of rhino sign encountered during a field survey was
used as a rough index of rhino density.
I attempted to survey all potential rhino areas, but time
availability and travel restrictions prevented me from visiting some
places and adequately covering others, especially in the northern states
of Perak, Kedah, and Kelantan. These states contain large, remote
forested lands, and much of the border region is closed to non-military
personnel. My research effort was concentrated in areas that showed the
most promise for conservation of the species, especially the
Endau-Rompin region in the southern portion of the Malay Peninsula.
Peninsular Malaysia, located at the southern tip of the
Asiatic continent (1° to 7** N latitude and 100° to 103° E longitude),
contains 131,700 km^ of land divided politically into 11 states.
Sarawak and Sabah, the Malaysian states in northern Borneo, were not
included in this study. The topography of the Malay Peninsula is
characterized by a prominent north-south granitic mountain range with
several lesser ranges and small valleys. Broad plains lie along the
east and west coasts. Several major river systems dissect the country
into large basins which form the basis for most political subdivisions.
Malaysia's climate is tropical ever-wet with little seasonal variation
because of close proximity to the equator and warm oceans (Whitmore,
1975). The days are hot and humid, with the mean temperature near 27° C
Reproduced with permission of the copyright owner. Further reproduction prohibited without permission.

Page 8
in lowland areas and annual rainfall ranging from 2000 to 5000 mm (Dale,
1952). In the northern part of the peninsula, rainfall is more
seasonal, influenced by the October-to-December monsoon season in the
northeast, and the June-to-September monsoon in the northwest.
The natural vegetation of Peninsular Malaysia is tropical
evergreen rain forest of the Indo-Malayan formation (Richards, 1952).
These forests are exceedingly species-rich containing about 4000 species
of woody plants, primarily trees and climbers (Whitmore, 1975). Forest
structure is characterized by large (to 60 m) emergent trees, dominated
by the family Dipterocarpaceae, which extend above a nearly closed main
canopy at a height of 20 to 45 m. The dense understory consists of
numerous small trees, palms, climbers, and herbaceous plants. Many
problems exist in the classification of these forests (Poore, 1963), but
the primary forest can be grouped into 15 general forest types
(Wyatt-Smith, 1964; Whitmore, 1975). In this study, the following
general forest types were encountered; (1) lowland dipterocarp forest
(below 300 m); (2) hill dipterocarp forest (300 to 800 m); (3) upper
dipterocarp forest (800 to 1200 m ) ; and (4) montane forest (above 1200
m) .
Almost 99% of Peninsular Malaysia was once covered with
tropical rain forest (Lee, 1980). Recently, large tracts of forest have
been cleared and planted to agricultural crops. Today, about 55% of the
total land area is covered with forest (Forest Dept. Report, 1977) and
about 22% of the land area is planted to agricultural crops, primarily
rubber, oil palm, and rice. The balance of the land area is wasteland,
Reproduced with permission of the copyright owner. Further reproduction prohibited without permission.
Page 9
swamp, or urban development. Of the present forested lands, about 30%
have been logged, including most of the lowland forest below 300 m. By
1990, most of the lowland areas will have been converted to agricultural
crop lands, and most of the remaining commercial forest will have been
logged (Lee, 1980).
DISTRIBUTION AND NUMBERS
Southern Region
Endaur-Rompin ar e a . The literature contains many reports of
Sumatran rhinos occurring along the border of the states of Johor and
Pahang, within the upper watersheds of the Endau and Rompin rivers
(Fig. 1). Foenander (1961) conducted several brief surveys in Pekan
District of Pahang and mapped the distribution of rhinos based on
interviews with villagers. Milton (1963) collected a few reports of
rhinos occurring in the upper Endau River basin and also near Tanah
Abang and the Tersap River along the lower Endau. During a survey of
the Endau-Kluang Wildlife Reserve, Stevens (1968) found rhino sign
between the Endau, Emas, and Semberong rivers, and he recommended that
this area be protected as a wildlife sanctuary. In 1970, members of the
Malayan Nature Society (Ellis, 1971) made several trips into the upper
Endau River area and reported evidence of rhinos in the upper Selai,
Segamat, and Endau watersheds.
I surveyed the entire Endau-Rompin region, with an emphasis on
Reproduced with permission of the copyright owner. Further reproduction prohibited without permission.
Page 10
Peninsular Malaysia
Pahang R.
PAHANG
. Keratong R.Rompin R.
i^ekin R. ^ ^ k a t ih R. Pu kin R,
NEGRI SEMBILAN
Endau R.Mersmg
Semberong R.Juaseh R.MELAKA';
Madek
Kahang\
JOHOR Johor
SINGAPORE
SOUTHERN REGION
# Endau-Ronnpln 0 G unung B eium ut ? M ersing C oast— River— State Boundary
0 50 km
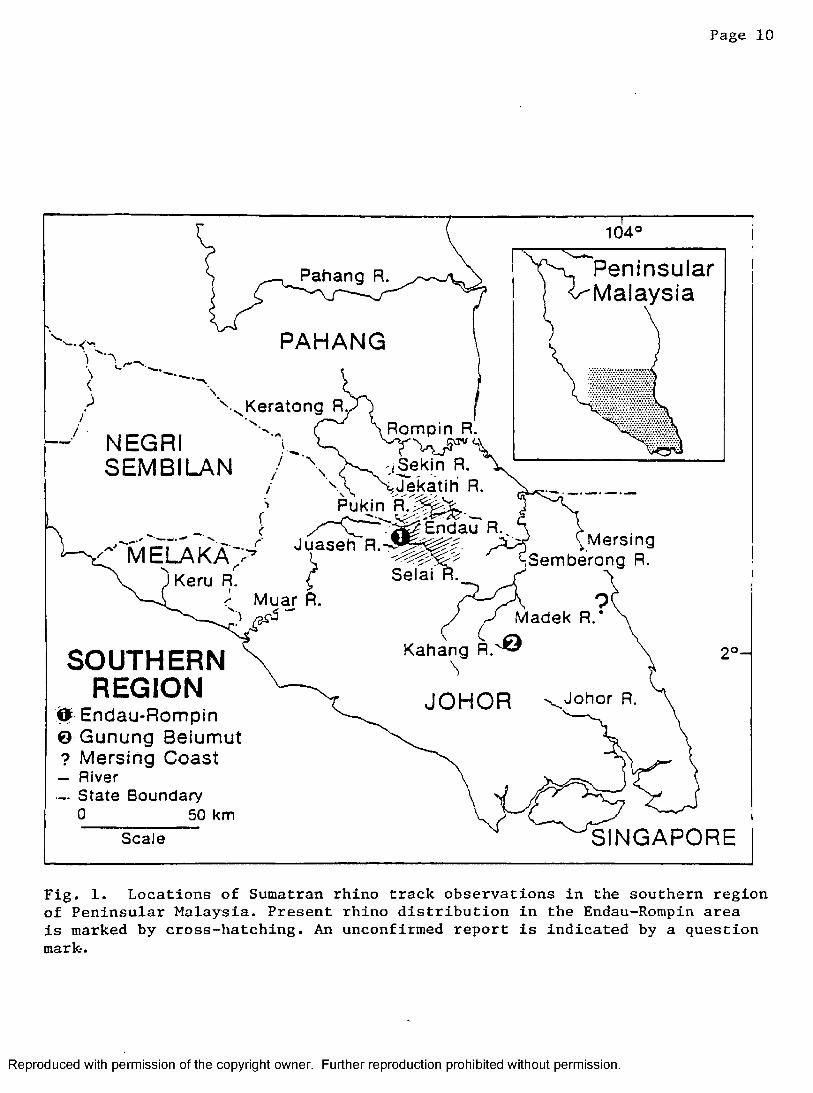
Fig. 1. Locations of Sumatran rhino track observations in the southern region of Peninsular Malaysia. Present rhino distribution in the Endau-Rompin area is marked by cross-hatching. An unconfirmed report is indicated by a question mark.
Reproduced with permission of the copyright owner. Further reproduction prohibited without permission.
Page 11
the remaining tract of contiguous unlogged forest (Flynn and Abdullah,
1983). Rhino sign was found throughout the region, especially within
the contiguous primary forest, an area of about 1600 km^. Rhino tracks
and wallows were found consistently in the upper Endau, Selai, Kemidak,
Juaseh, and Segamat watersheds in Johor; and the upper Pukin, Jekatih,
Sekin, and Kemapan basins in Pahang (Fig. 1). I found no evidence of
rhinos occurring in certain areas where they had been reported
previously. Interviews with villagers living along the lower Endau
River indicated that rhinos had not occurred in the Tanah Abang or
Sungai Tersap areas for many years. Likewise, villagers living along
the Semberong River stated that rhinos no longer occurred in that area,
which had been proposed by Stevens (1968) as a rhino sanctuary. Much of
the land between the Semberong and Endau rivers has been cleared for
agriculture, and the Emas River area has been heavily logged. A survey
along the eastern portion of the region near Gunung Lesong indicated
that rhinos probably no longer occur east of the mountains, as reported
previously by Foenander (1961).
The number of rhinos occurring in the Endau-Rompin region was
calculated by multiplying estimated rhino densities by the amount of
occupied habitat. Based on the frequency that rhino sign was
encountered during the survey, the habitat was divided into high and low
density areas. The high-density area was censused 4 times between 1977
and 1980 to estimate the minimum number of animals (Flynn and Abdullah,
1983). The 1980 census estimated that 10 animals occurred in the 400 km^
census study area, a density of 1 animal per 40 km^. In the rest of
Reproduced with permission of the copyright owner. Further reproduction prohibited without permission.
Page 12
the region, rhino density was much lower, probably less than half.
Within the 1200 km^ of low-densiy habitat, I estimated rhino density
conservatively at 1 animal per 80-120 km^ . Thus, a total of 20 to 25
rhinos occur in the entire 1600 km^ of remaining habitat (Table 1).
During the study period, the tracks of at least 3 young rhinos
were recorded. In 1975-1976, the tracks of a cow/calf pair were found
often in the upper Selai and Endau river areas. During the 1977 census
survey, Conry (DWNP, pers. comm.) recorded tracks of a cow/calf pair in
the upper Juaseh-Kemidak area. Several reports of a cow/calf pair in
the upper Kemidak basin were obtained in 1981. Beginning in February,
villagers at Kampung Juaseh reported that they occasionally encountered
tracks of a cow/calf pair in the upper basins of the Juaseh and Kemidak
rivers. The presence of this pair was confirmed by track observations
during March and June. All other track observations were of single
animals, probably adults or independent sub-adults. This information
indicates that the Endau-Rompin rhino population is still reproducing,
but at an extremely low rate (0.5 young per year).
In 1933, 1014 km^ of the upper Endau River area in Johor was
established as the Endau-Kluang Wildlife Reserve by the state
government. For many years, the remoteness of the region protected it
from exploitation, but during the 1960's most of the land suitable for
agriculture was excised, and several timber concessions were allotted,
even within the wildlife reserve. In 1972, the federal government
proposed that the Endau-Rompin area be established as a national park,
with protection of the Sumatran rhino a major justification. This
Reproduced with permission of the copyright owner. Further reproduction prohibited without permission.

Page 13
Table 1. Number of Sumatran rhinoceros in Peninsular Malaysia.
Region Number Forest 'Type
Southern
Endau-Rompin 20-25 Lowland & HillGunung Beiumut 2-3 Hill & MontaneMersing Coast 0-1 Lowland
Northcentral
Taman Negara 8-12 Lowland & HillUlu Lepar 3-5 Lowland & HillSungai Depak 3-5 HillKuala Balah 3-4 Lowland & HillBukit Gebok 1-2 Lowland & HillKrau Reserve 0-1 Lowland & Hill
West Coastal
Sungai Dusun 4-6 Lowland
Northwest
Ulu Selama 3-5 Lowland & HillUlu Belum 3-5 Lowland & HillKedah Border 0-1 Hill
Total 50-75
Reproduced with permission of the copyright owner. Further reproduction prohibited without permission.
Page 14
national park would contain the upper Endau River basin and adjacent
lands, including portions of Johor and Pahang.
In conjunction with the rhino surveys, the Endau-Rompin area
was evaluated as a national park, and a management plan was prepared
(Flynn, 1980). Briefly, this plan recommends that 870 km^ of this
region be classified as a national park, with special attention given to
the most important rhino areas. High-use rhino areas would be zoned to
exclude unnecessary disturbance and patrolled extensively by park
wardens to prevent poaching. According to this plan, the proposed park
would preserve about 65% of the remaining rhino habitat in the region.
The balance of the rhino habitat, which includes most of the high-value
commercial timber, has already been committed to timber concessions.
Most of the area to be logged will remain covered by forest and managed
by the Department of Forestry (DF) for timber production. Presently,
the Malaysian government is considering the proposed management plan.
Gunung Beiumut. Stevens (1968) reported finding rhino tracks
near Gunung Beiumut in central Johor (Fig. 1). During 1977, a rhino was
observed swimming across the Kahang River near the northwest slope of
the mountain (DF staff, pers. comm.). I made a brief visit to the
Gunung Beiumut area in 1978 and found tracks of at least 1 rhino in the
upper Kahang River basin. Additional reports of rhinos occurring in the
upper Kahang and Madek watersheds on the west and north slopes of Gunung
Beiumut were received in 1980 from villagers living along the lower
Kahang River. Based on the limited information available, I estimate
that 2 or 3 rhinos occur in the Beiumut area.
Reproduced with permission of the copyright owner. Further reproduction prohibited without permission.
Page 15
Today only about 230 km^ of steepland adjacent to Gunung
Beiumut remain under forest; the rest of the former 2300 km^ Endau-Kota
Tinggi Wildlife Reserve has been cleared for agricultural development.
Stevens (1968) recommended that this area be protected as a wildlife
reserve, but no action was ever taken on his proposal. Some of the
steepland adjacent to Gunung Beiumut will probably remain forested, but
the long-term survival of rhinos is unlikely there.
Mersing Coast. Stevens (1968) found tracks of 1 or 2 rhinos
along the east coastal plain within the Tenggaroh Forest Reserve,
located about 40 km south of the district town of Mersing (Fig. 1).
Unfortunately, I was unable to visit this area and no recent information
is available. The presence of rhinos there is doubtful because much of
the forested land has been logged or cleared for agricultural
development.
Northcentral Region
Taman Negara. Rhinos have been reported consistently from
northern Pahang, southern Kelantan, and western Trengganu (Fig. 2),
especially within Taman Negara (National Park) (Foenander, 1952; Hislop,
1961; Khan, 1971). Rhinos were hunted extensively in northern Pahang by
Hubback (1939), but he provided few details on the location of his
hunting areas. After Taman Negara was established as a national park in
1937, DWNP staff began collecting information on rhino distribution in
this remote area (Hislop, 1961; Khan, 1971).
Reproduced with permission of the copyright owner. Further reproduction prohibited without permission.

Page 16
NORTHCENTRAL REGION
o Taman Negara o Sungai Lepar o Sungai Depak o Kuala Balah 0 Bukit Gebok
Krau Reserve- River- State Boundary
National Boundary0 40 km
SOUTH CHINA SEA
THAILAND Kelantan R.
5°30’
Depak R
KELANTAN Lebir Trengganu R.
TRENGGANU
Tahan
Atok R
Jell R. Temb
PAHANG
Peninsular \ Malaysia Pahang
Fig. 2. Locations of Sumatran rhino track observations in the northcentral region of Peninsular Malaysia. An unconfirmed report is indicated by a question mark. The area occupied by Taman Negara (National Park) is shown by cross-hatching.
Reproduced with permission of the copyright owner. Further reproduction prohibited without permission.
Page 17
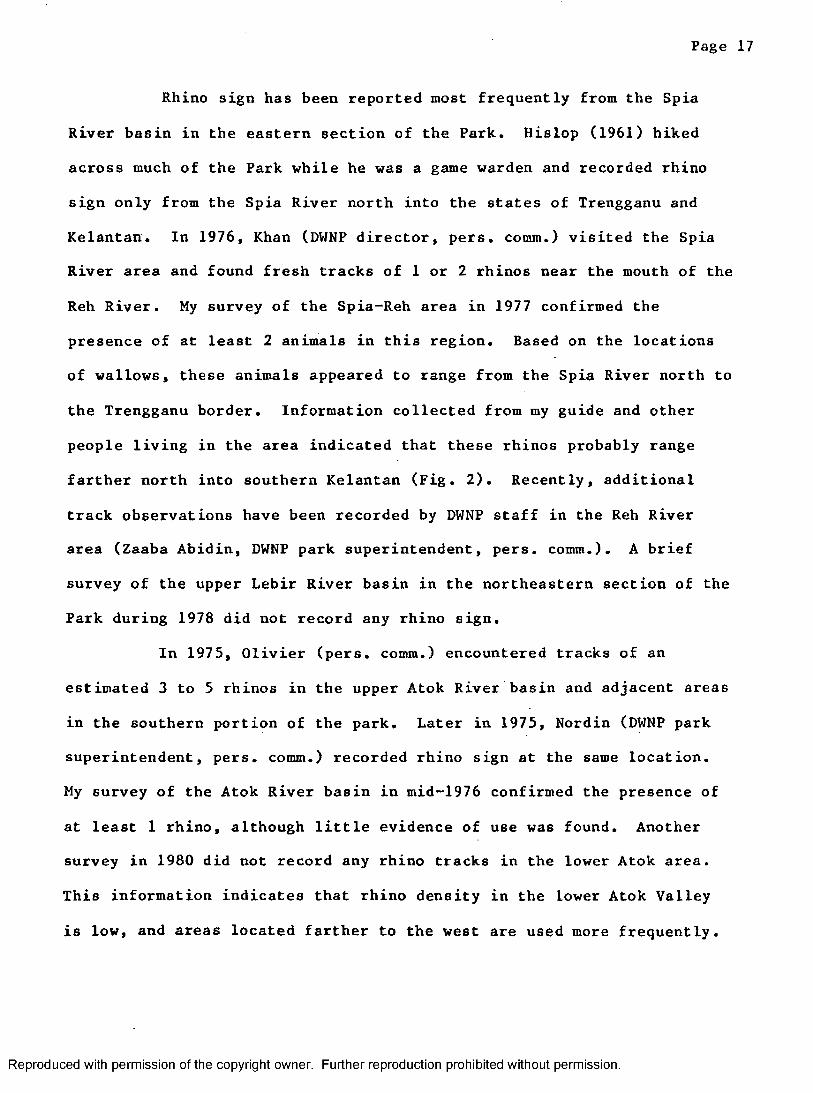
Rhino sign has been reported most frequently from the Spia
River basin in the eastern section of the Park. Hislop (1961) hiked
across much of the Park while he was a game warden and recorded rhino
sign only from the Spia River north into the states of Trengganu and
Kelantan. In 1976, Khan (DWNP director, pers. comm.) visited the Spia
River area and found fresh tracks of 1 or 2 rhinos near the mouth of the
Reh River. My survey of the Spia-Reh area in 1977 confirmed the
presence of at least 2 animals in this region. Based on the locations
of wallows, these animals appeared to range from the Spia River north to
the Trengganu border. Information collected from my guide and other
people living in the area indicated that these rhinos probably range
farther north into southern Kelantan (Fig. 2). Recently, additional
track observations have been recorded by DWNP staff in the Reh River
area (Zaaba Abidin, DWNP park superintendent, pers. comm.). A brief
survey of the upper Lebir River basin in the northeastern section of the
Park during 1978 did not record any rhino sign.
In 1975, Olivier (pers. comm.) encountered tracks of an
estimated 3 to 5 rhinos in the upper Atok River basin and adjacent areas
in the southern portion of the park. Later in 1975, Nordin (DWNP park
superintendent, pers. comm.) recorded rhino sign at the same location.
My survey of the Atok River basin in mid-1976 confirmed the presence of
at least 1 rhino, although little evidence of use was found. Another
survey in 1980 did not record any rhino tracks in the lower Atok area.
This information indicates that rhino density in the lower Atok Valley
is low, and areas located farther to the west are used more frequently.
Reproduced with permission of the copyright owner. Further reproduction prohibited without permission.
Page 18
Only a few other reports of rhinos occurring within Taman
Negara exist. In 1964, an adult rhino was observed near park
headquarters at Kuala Tahan (DWNP ranger, pers, comm.). The tracks of
this animal were followed along the Tahan River to a point near the
Kelantan border (Khan, 1971). In 1977, another adult rhino was observed
swimming across the Tembling River near Kuala Tahan. These animals may
have come from the upper Tekai River area south of the Park, where
Foenander (1952) suggested that rhinos occur. My surveys of the upper
Tahan River in 1977 and 1981 did not locate any rhino sign, even at a
previously used salt lick (Jenut Segantang). Rhino tracks were reported
at Jenut Segantang in 1981 by a park ranger (Zaaba Abidin, pers. comm.).
Olivier (pers. comm.) surveyed much of the Pahang portion of the Park
for elephants during 1973 to 1975, but he found rhino sign only in the
Atok area. Interviews with Orang Asli (aboriginals) who live and travel
extensively within the Park indicated that rhino sign was rarely
encountered. Other rhino reports have been collected from the western
portion of the Park in the upper Tanum River watershed, but these
reports were not confirmed.
I estimate that 8 to 12 rhinos presently occur in the Taman
Negara region, with the upper Atok and Spia river areas being used most
frequently. This estimate includes animals that range extensively into
areas adjacent to the Park in the states of Pahang, Trengganu, and
Kelantan. Additional survey work is needed to better document the
distribution and number of rhinos in Taman Negara. However, my
information indicates that rhino density in this region is quite low.
Reproduced with permission of the copyright owner. Further reproduction prohibited without permission.

Page 19
Also, tracks of young rhinos have never been recorded, indicating that
recruitment is extremely low. Perhaps present population density is
below a minimum needed for successful reproduction.
Sungai Depak. Hislop (1965) suggested that rhinos ranged from
Taman Negara into southern Kelantan (Fig. 2). In 1976, Khan (director,
DWNP; pers. comm.) found tracks of 2 rhinos along the Depak River in the
upper Lebir River basin. Later in 1976, I confirmed the presence of at
least 2 animals at the same location. At that time, a new logging road
had been constructed along the Depak River. Rhino sign was found only
near the end of this road where logging had not yet started. During
1977-1979, much of the Depak area was logged. No positive rhino reports
have been received since the logging began. In 1979, Griffin
(DF; pers. comm.) found no rhino sign while conducting a forest
inventory of the upper Lebir River area. Based on available
information, I estimate that 3 to 5 rhinos may occur in the upper Lebir
River area. Animals found previously near the Depak River may have
moved farther eastward or southward into more mountainous terrain, or
they may have been eliminated during the logging operation by illegal
hunting. During the next few years, most of the forested lands in
southern Kelantan will be logged and the survival of rhinos outside
Taman Negara is unlikely.
Kuala Balah. In 1976, I visited an area near Kuala Balah in
the Pergau River basin, Kelantan (Fig. 2). Villagers in the area showed
us recent tracks of 1 or 2 animals and a frequently used wallow located
Reproduced with permission of the copyright owner. Further reproduction prohibited without permission.

Page 20
near the edge of the primary forest. In 1977, a rhino was killed by
poachers in the same area, about 50 km to the northeast. This animal's
horn had been cut off with a chain saw. No other information is
available on this rhino population. I estimate that 3 to 4 animals may
occur in this section of central Kelantan based on track observations
and reports from villagers living in the area. The chances of these
animals surviving are low because most of the forest will be logged or
cleared for agricultural development during the next few years.
Ulu Lepar. Foenander (1952) suggested that rhinos occurred in
the upper Jengka Valley and the northwest portion of the Kuantan
District of Pahang. In 1976, I investigated a report of rhinos
occurring in the Lepar River Valley, located about 80 km west of the
town of Kuantan (Fig. 2). A villager showed us a place on the east side
of the Lepar River where he had observed a rhino during the previous
week. I followed fresh rhino tracks from the point of his observation
into nearby secondary forest. Suddenly, I encountered a large adult
rhino running from a well-used wallow. The next day, older rhino sign
was found 9 km upstream from the wallow near the primary forest fringe.
From 1976-78, Conry (DWNP staff, pers. comm.) surveyed most of the
lowland area within the Lepar Valley while studying the Malayan gaur
(Bos gaurus). Occasionally, he encountered the tracks and wallows of at
least 2 animals along the primary forest fringe west of the Lepar River.
The only other rhino report from Kuantan District was received in 1979
from the geologist at the Sungai Lembing mine. Singh (pers. comm.)
reported that a rhino was observed while a work crew was surveying the
Reproduced with permission of the copyright owner. Further reproduction prohibited without permission.
Page 21
mountainous area directly north of the mine.
I estimate that 3 to 5 rhinos occur within this section of the
Kuantan District. These animals may range northward from the Lepar
River to Taman Negara. Unfortunately, a thorough search of the hilly
lands to the west and east of the Lepar Valley was not possible.
Presently, this mountainous area is contiguous with a large forested
region to the north. Large-scale agricultural development is planned
for the upper Lepar River basin and the adjacent Tekam Valley, which
will isolate the Lepar rhinos from those in the Taman Negara region.
The long-term survival of the Lepar rhinos is uncertain because of the
large amount of agricultural and forestry development in the region.
Bukit Gebok. In 1980, rhino sign was reported from the Bukit
Gebok area (Fig. 2). A survey of this small isolated patch of forest
confirmed the presence of at least 1 animal. I suspect that this
isolated, solitary animal will not survive long because this patch of
habitat is small and the threat of poaching is high.
Krau Wildlife Reserve. Hislop (1965) reported that rhinos
occurred within the 500 km^ Krau Wildlife Reserve in 1941, primarily on
the western slopes of Gunung Benom (Fig. 2). Milton (1963) recorded the
last confirmed rhino sign in this reserve. I was unable to survey the
Krau Reserve because access was strictly controlled by the police.
Information collected from villagers living near the Reserve indicated
that rhinos probably no longer occur within the Krau.
Reproduced with permission of the copyright owner. Further reproduction prohibited without permission.

Page 22
West Coastal Region
Sungai Dusun Wildlife Reserve. The Sumatran rhino occurred
sympatricly with the Javan rhino (Rhinoceros sondicus) along the west
coastal plain (Fig. 3), especially in the states of Selangor and Perak
(Foenander, 1952; Groves, 1967). The last known Javan rhino in Malaysia
was shot in 1932 (Medway, 1969), and this species is now thought to be
extinct in Malaysia, Because of the overlap in their historic
distribution, species identification has been uncertain in this area
(Strickland, 1967).
Wray (1906) reported that rhinos were formerly plentiful in
the Bindings District of Perak. Sumatran rhinos in the Bernam Valley
west of the railway line were first reported in 1949 by Hislop (1965).
In 1957 and 1960, a solitary Sumatran rhino was observed in Lima Belas
Estate, Perak, 15 km north of the Bernam River. Milton's (1963) 2-month
survey recorded tracks of 2 to 3 rhinos in an area south of the Bernam
River located between the Dusun and Tinggi rivers. In 1965, the
Selangor state government established the 40 km^ Sungai Dusun Wildlife
Reserve to protect this small rhino population, Strickland (1967)
conducted a 1-year study on the movements and ecology of these rhinos
and concluded that at least 3 animals used the Reserve, primarily the
more hilly lands in the eastern section. Since 1970, DWNP rangers have
been stationed at a guard post built near the Dusun River within the
Reserve to protect these rhinos.
Several visits were made to Sungai Dusun to collect rhino
reports recorded by DWNP rangers, and to survey areas located to the
Reproduced with permission of the copyright owner. Further reproduction prohibited without permission.

Y p e r lis
KEDAH
Muda R. ^
l THAILAND
PENANG 'C0" i
■^Selama R X
Belum R.
Page 23
NORTHWEST AND WEST COASTAL REGIONS
O Sungai Dusun © Ulu Selanna 0 Ulu Belum Q Kedah Border— River— State Boundary f - National Boundary
0_______ 30 kmScale
Perak R.Dinding R.
5 ° -
>S
PERAKI
Bernam R.
Dusun R.”
\
i R. Selangor R
V Peninsular \Malaysia ^
SELANGOR.
Kelang R. I f " — )
Kuala Lumpur1 02*3 0 '
Fig. 3. Locations of Sumatran rhino track observations in the west coastal and northwest regions of Peninsular Malaysia.
Reproduced with permission of the copyright owner. Further reproduction prohibited without permission.
Page 24
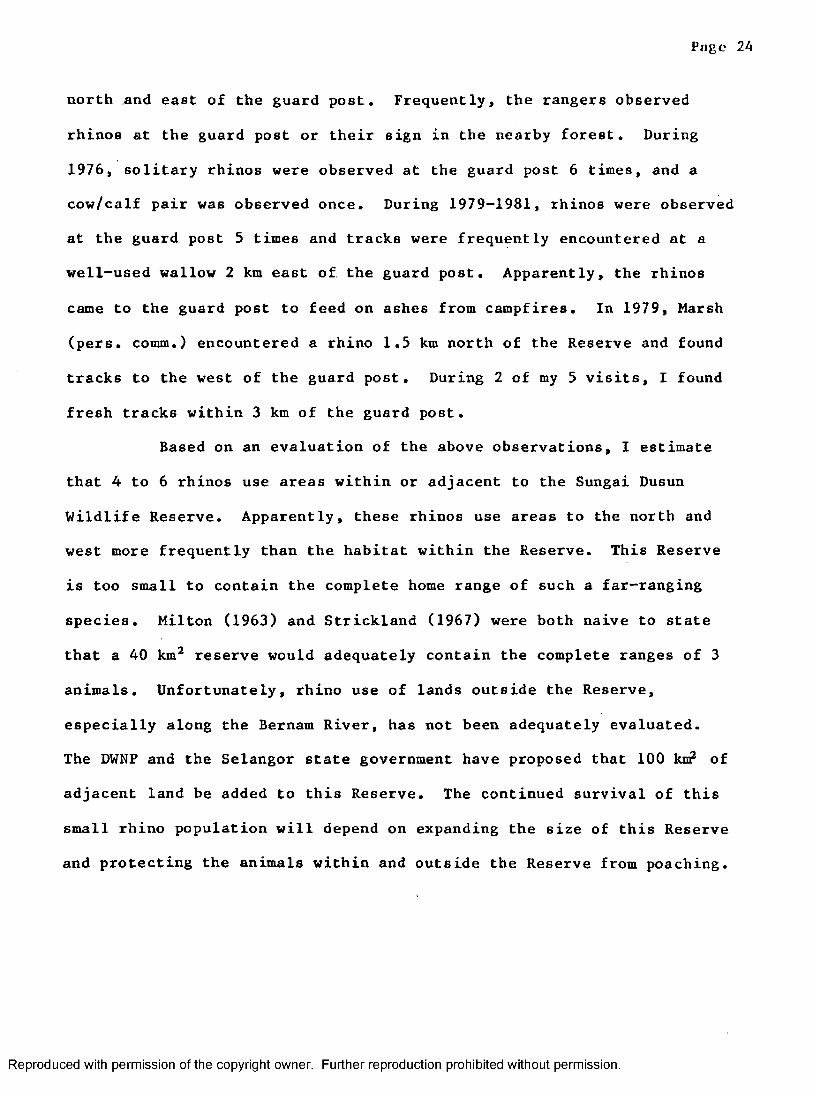
north and east of the guard post. Frequently, the rangers observed
rhinos at the guard post or their sign in the nearby forest. During
1976, solitary rhinos were observed at the guard post 6 times, and a
cow/calf pair was observed once. During 1979-1981, rhinos were observed
at the guard post 5 times and tracks were frequently encountered at a
well-used wallow 2 km east of the guard post. Apparently, the rhinos
came to the guard post to feed on ashes from campfires. In 1979, Marsh
(pers. comm.) encountered a rhino 1.5 kro north of the Reserve and found
tracks to the west of the guard post. During 2 of my 5 visits, I found
fresh tracks within 3 km of the guard post.
Based on an evaluation of the above observations, I estimate
that 4 to 6 rhinos use areas within or adjacent to the Sungai Dusun
Wildlife Reserve. Apparently, these rhinos use areas to the north and
west more frequently than the habitat within the Reserve. This Reserve
is too small to contain the complete home range of such a far-ranging
species. Milton (1963) and Strickland (1967) were both naive to state
that a 40 km^ reserve would adequately contain the complete ranges of 3
animals. Unfortunately, rhino use of lands outside the Reserve,
especially along the Bernam River, has not been adequately evaluated.
The DWNP and the Selangor state government have proposed that 100 kn? of
adjacent land be added to this Reserve. The continued survival of this
small rhino population will depend on expanding the size of this Reserve
and protecting the animals within and outside the Reserve from poaching.
Reproduced with permission of the copyright owner. Further reproduction prohibited without permission.
Page 25
Northwest Region
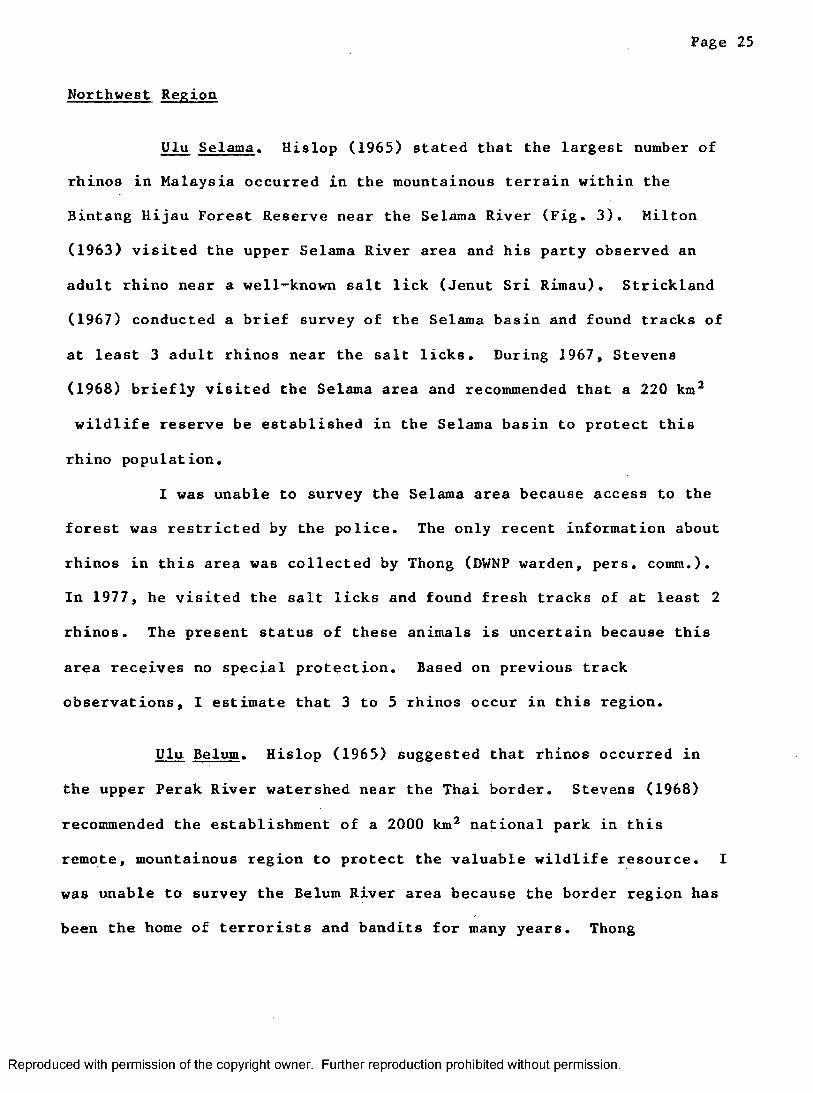
Ulu Selama. Hislop (1965) stated that the largest number of
rhinos in Malaysia occurred in the mountainous terrain within the
Bintang Hijau Forest Reserve near the Selama River (Fig. 3). Milton
(1963) visited the upper Selama River area and his party observed an
adult rhino near a well-known salt lick (Jenut Sri Rimau). Strickland
(1967) conducted a brief survey of the Selama basin and found tracks of
at least 3 adult rhinos near the salt licks. During 1967, Stevens
(1968) briefly visited the Selama area and recommended that a 220 km^
wildlife reserve be established in the Selama basin to protect this
rhino population.
I was unable to survey the Selama area because access to the
forest was restricted by the police. The only recent information about
rhinos in this area was collected by Thong (DWNP warden, pers. comm.).
In 1977, he visited the salt licks and found fresh tracks of at least 2
rhinos. The present status of these animals is uncertain because this
area receives no special protection. Based on previous track
observations, I estimate that 3 to 5 rhinos occur in this region.
Ulu Belum. Hislop (1965) suggested that rhinos occurred in
the upper Perak River watershed near the Thai border. Stevens (1968)
recommended the establishment of a 2000 km^ national park in this
remote, mountainous region to protect the valuable wildlife resource. I
was unable to survey the Belum River area because the border region has
been the home of terrorists and bandits for many years. Thong
Reproduced with permission of the copyright owner. Further reproduction prohibited without permission.
Page 26
(pers. comm.) briefly surveyed the lower section of the Belum River in
1972 and found tracks of at least 2 rhinos. Thong's observations are
the only confirmed rhino reports from the area. Based on the above
information, I estimate that 3 to 5 rhinos may occur in the Ulu Belum
area.
Thait-Kedah border. Hislop (1965) reported finding rhino
tracks in the mountainous land along the Thailand-Kedah border in 1941
(Fig. 3). This area was not surveyed because of police restrictions.
Information collected by McNeely & Laurie (1977) on the Thai side of the
border indicated that rhinos were no longer found there. A more
thorough survey of the entire Thailand-Malaysia border region is needed
to obtain adequate information on rhino occurrence there.
STATUS AND CONSERVATION
Today, the Sumatran rhinoceros appears threatened with
immediate extinction in Peninsular Malaysia. Excessive hunting during
the past few centuries has reduced this once widespread species to a few
small scattered populations occurring in remote areas of the country.
In addition, large-scale habitat destruction by logging and forest
clearance for agricultural development has further isolated the already
small populations and has reduced the amount of suitable habitat. The
exploitation of the forests has also brought the surviving rhinos into
Reproduced with permission of the copyright owner. Further reproduction prohibited without permission.
Page 27
much closer contact with people, greatly increasing their susceptibility
to poaching.
During the colonial period, Sumatran and Javan rhinos were
given inconsistent protection in the Malay peninsula; their legal status
varied among the states. With the approval of the "Wild Animal and Bird
Protection Ordinance" in 1955, the DWNP was centralized and both rhino
species were classified as totally protected. The "Wildlife Act of
1972" provided for better organization of the DWNP and stronger
penalties for the killing or possession of totally protected species
(maximum fine US$ 1200 and/or 2 years in jail). Since 1975, the DWNP
has greatly increased the number of staff and the amount of funds
available for conservation and law enforcement programs. With the
proper deployment and coordination of funds and personnel, rhino
poaching can be minimized.
The high price of rhino body products continues to provide a
strong incentive for poaching. Martin (1979) found the average retail
price of Asian rhino horn in 4 Asian countries to range from US$ 3000 to
11,000 per kg. The number of rhinos killed by poachers in Peninsular
Malaysia is not known, but at least 2 animals have died since 1975.
Even though the trading of Sumatran and Javan rhino body parts is
prohibited under present law, African and Indian rhino products can be
legally sold and are found in most Chinese medicine shops. At least 8
brands of a fever tonic made from rhino horn (known as ayer badak or
rhino water) can be purchased in most retail stores for under US$ 0.50.
The amount of rhino horn consumed or traded in Malaysia is not known.
Reproduced with permission of the copyright owner. Further reproduction prohibited without permission.

Page 28
Recently, Malaysia signed an international treaty controlling the trade
in endangered species (Convention on the International Trade in
Endangered Species of Wild Fauna and Flora). This treaty prohibits all
trade in rhino body parts because the status of all species is
precarious throughout the world. Hopefully, a program stopping the
trade of all rhino products will soon be implemented in Malaysia.
Prospects for the long-term survival of the Sumatran rhino in
Malaysia are poor. The loss of adult animals to poaching and the almost
complete lack of reproductive success are the immediate problems.
Evidence of young animals is seldom reported or encountered in the
field. The only known recruitment of young rhinos has occurred in the
Endau-Rompin and Sungai Dusun areas. Without any new births, a
population is essentially dead and able to persist only because
individuals of the species are long-lived. Sumatran rhinos have been
kept in captivity for over 32 years (Van Strien, 1974), Little
information is available on the reproductive biology of this rhino
species, but all evidence suggests that their reproductive potential is
quite low. Borner (1978) estimated reproductive parameters based on
data from similar rhino species. He conjectured that under good
environmental conditions female Sumatran rhinos become sexually mature
at 3.5 to 6 years of age, then produce a calf only once in about 3
years. Several other factors probably contribute to the low
reproductive rate observed in this species. Adults are solitary,
far-ranging, and occur at low desities (Van Strien, 1974; Borner, 1978).
No evidence of a breeding season has ever been observed. Thus, the
Reproduced with permission of the copyright owner. Further reproduction prohibited without permission.
Page 29
frequency of contact among sexually receptive animals would be low under
optimal conditions and decrease rapidly with reduced population size.
In areas with extremely low numbers, both reproductively active male and
female individuals may not even be present in the population, or the
density of individuals may be too low for successful mating.
The fragmentation of the rhino population into isolated
habitat islands by logging and forest clearance has made the species
more susceptable to extinction. The impact of demographic,
environmental, and genetic stochastic factors increases in importance as
population size decreases (Shaffer, 1981). An effective population size
of at least 50 individuals has been proposed as the minimum necessary
for maintaining short-term fitness in most species (Soule, 1980). In
the long-term, genetic variability will be maintained only if population
sizes are of an order of magnitude higher (Franklin, 1980). All rhino
populations in Peninsular Malaysia are below the suggested minimum
viable population size. Thus, only the largest rhino populations
(Endau-Rompin, Taman Negara, and Sungai Dusun) have much chance for
long-term survival and smaller groups have little chance for even
short-term persistence.
A conservation program for this species needs to be developed
which includes both short-term and long-term strategies. In the
short-term, all animals must be protected from poaching and their
habitat protected. All rhino areas should be regularly patrolled from
guard posts located at main access points. The penalties for poaching
and the trading in rhino body parts should be increased to facilitate
Reproduced with permission of the copyright owner. Further reproduction prohibited without permission.
Page 30
the protection program. Recent studies have shown that this rhino
species avoids areas where their primary forest habitat has been
modified by logging (Flynn, 1978). Thus, large tracts of preferred
habitat need to be protected by establishing national parks or wildlife
sanctuaries. Priority for habitat acquisition should be given to areas
that contain the largest rhino populations. The exploitation of other
rhino areas that can not be acquired should be delayed until a system of
reserves has been established. Additional surveys of all rhino areas
are needed to further document distribution and numbers. Known rhino
groups should be carefully monitored to determine population trends,
especially recruitment rates. Research into the habitat and food
requirements of these animals should be continued until their ecology
and habitat relationships are better understood. Experiments designed
to increase food availability (Flynn, 1980) should be expanded and
evaluated.
In order to prevent the extinction of this species in
Malaysia, I suggest a long-term conservation strategy that would attempt
to maintain viable rhino populations in a system of separated reserves.
This program would require the translocation of animals from areas with
extremely low numbers or insecure habitat to sanctuaries which contain
viable breeding populations, suitable habitat, and good law enforcement
systems. The threats of habitat destruction, parasites, disease, and
natural catastrophes would be reduced by maintaining several isolated
populations. An occasional movement of animals among the reserves would
permit genetic mixing to minimize the negative impact of inbreeding
Reproduced with permission of the copyright owner. Further reproduction prohibited without permission.
Page 31
depression and other genetic factors (Franklin, 1980). However, capture
and handling procedures would need to be developed before such a program
could be implemented.
In Peninsular Malaysia, 3 areas exist that may be suitable for
maintaining viable Sumatran rhino populations. The Endau-Rompin region
appears to be the best place and conservation efforts should be
concentrated there. This area contains the largest (20-25) and most
dense (1 animal per 40 km^ ) rhino population in the country (Flynn and
Abdullah, 1983). Although some evidence of reproduction has been
observed, the low recruitment rate indicates that this population may be
near a minimum number required for reproduction to occur. A portion of
the suitable rhino habitat in the Endau-Rompin region may be protected
as a national park (Flynn, 1980). This national park would be
surrounded by an additional 400 km^ of forested lands managed for timber
production. If approved as proposed, this national park will contain
about 65% of the presently occupied rhino area, including most of the
more heavily used habitats. Presently, DWNP rangers patrol portions of
the rhino area, but this effort needs to be greatly increased. Guard
posts should be built at the main access points to facilitate the
protection program by discouraging human entry (Flynn, 1980).
Taman Negara is the next best area to maintain a rhino
population in Peninsular Malaysia. This remote area contains the second
largest number of rhinos in Malaysia (8-12), and the habitat within the
park is reasonably secure because of legal protection as a national
park. After Malaysia's agricultural lands have been cleared and the
Reproduced with permission of the copyright owner. Further reproduction prohibited without permission.

Page 32
commercial forests logged, Taman Negara will be the largest tract of
primary forest remaining in the country. Presently, the density of
rhinos there is extremely low; these animals may be too scattered to
reproduce successfully. The Taman Negara area should be extensively
surveyed to better document rhino distribution, numbers, and recruitment
rates.
The Sungai Dusun area is the only other place in Peninsular
Malaysia that has much potential for maintaining a viable population of
Sumatran rhinos. A small number of rhinos have persisted there for many
years, and evidence of young animals has been observed occasionally.
The present reserve may be too small for the maintenance of a viable
rhino population. Lands on the north and west side of the reserve
should be added to create a more suitable sanctuary. The DWNP ranger
patrol system needs to be strengthened and expanded to include areas
used by the rhinos that are adjacent to the present reserve.
Other areas within Malaysia have little potential for
maintaining viable populations of Sumatran rhinos. Still, all known
rhino areas should be regularly patrolled to prevent poaching and
determine numbers. A program should be developed to capture rhinos
threatened by immediate habitat destruction or poaching for release in
one of the more secure areas.
Reproduced with permission of the copyright owner. Further reproduction prohibited without permission.
Page 33
ACKNOWLEDGMENTS
Financial support for this study was provided by the Malaysian
Department of Wildlife and National Parks, World Wildlife Fund
International, the National Wildlife Federation, the Smithsonian-Peace
Corps Environmental Program, and the Montana Cooperative Wildlife
Research Unit, My special thanks to Mr. Mohd. Khan bin Momin Khan,
Director-General, DWNP, for his continued support in this project.
Other DWNP personnel provided much assistance in office support or field
logistics, especialy L. Ratnam, Musa Nordin, Ahmat Harun, Zaaba Abidin,
Ahmat Zabidi, P. Fong, Abdullah Ibrahim, and Ahmat Ismail. Many persons
have contributed to this study by either providing information on rhino
sightings or assistance in the field work, especially P. Conry,
C. Connor, R. Olivier, Musa Nordin, S. Baltes, M. Monroe, L. England,
Zaaba Abidin, C. Marsh, B. Thong, J. Payne, M. Griffin, and
R. Blanchard. The assistance of Drs. R. & L. Schenkel, A. Fernhout, and
J. Sherbourne in obtaining additional funding is gratefully
acknowledged. Drs. B. W. O'Gara, C. Jonkel, A. Sheldon, and I. J. Ball
provided useful comments on the manuscript. C . Connor drafted the
figures and provided much encouragement during the preparation of this
paper. My warmest appreciation to Kang Kong bin Mintol and the other
members of Kampung Juaseh for sharing their intimate knowledge of the
Endau-Rompin forests with me.
Reproduced with permission of the copyright owner. Further reproduction prohibited without permission.

Page 34
REFERENCES
Borner, M. (1978). A field study of the Sumatranrhinoceros, Ph.D. thesis, Univ. Basel, Switzerland.
Dale, W . (1952). The rainfall of Malaya. J. Trop. Geogr., 13, 23-37.
Ellis, D, (1971). Rhinos in northern Johor, Malaysia. Singapore, The Malayan Nature Society. (Unpublished report).
Flynn, R. (1978). The Sumatran rhinoceros in the Endau-RompinNational Park of Peninsular Malaysia. Malay. Nat,, 4, 5-12.
__________. (1980). Endau-Rompin National Park managementplan. Kuala Lumpur, Malaysia, Department of Wildlife and National Parks.
. (1981). Sumatran rhinos in the Silabukan area.Sabah. Kuala Lumpur, Malaysia, World Wildlife Fund. (Unpublished Report).
_. and M. Tajuddin Abdullah. (1983). The distribution andnumber of Sumatran rhinoceros in the Endau-Rompin region of Peninsular Malaysia. Malay. Nat. J., in press.
Foenander, E. C. (1952), Big game of Malaya. London, Batchworth Press.
__________. (1961). The occurrence of rhinoceros in Pekan District,Pahang. Kuala Lumpur, Department of Wildlife and National Parks. (Unpublished report).
Forest Department. (1977). Forest resources of Peninsular Malaysia. Kuala Lumpur, Department of Forestry.
Franklin, I. R. (1980). Evolutionary change in small populations. In Conservation biology: An evolutionary— ecological perspective, ed. by M. Soule and B. Wilcox, 135-150. Sunderland, Mass., Sinauer Assoc.
Groves, C, P. (1967). On the rhinoceros of Southeast Asia. Saugetierk. Mitt., 15, 221-237.
Hislop, J. (1961). The distribution of elephant, rhinoceros,seldang, and tapir in Malaya's National Park. Malay. Nat. J., 95-99.
Reproduced with permission of the copyright owner. Further reproduction prohibited without permission.
Page 35
. (1965). Rhinoceros and Seladang. Malaysia's vanishingspecies. lUCN Publ. N. S., 10, 278-283.
Hubback, T. (1939). The Asiatic two-horned rhinoceros. J. Mammal., 20, 1-20.
Khan, M. (1971). The distribution of large animals in Taman Negara. Malay. Nat. J., 24, 125-131.
Lee, D. (1980). The sinking ark. Kuala Lumpur, Heinemann Books.
Martin, E. B. (1979). The international trade in rhinoceros products. Gland, Switzerland, WWF/lUCN.
McNeely, J. & Laurie, A. (1977). Rhinos in Thailand. Oryx 13, 486-487.
Medway, L. (1969). THe wild mammals of Malaya. Kuala Lumpur,Oxford Press.
Milton, 0. (1963). Field notes on wildlife conservation in Malaya. Spec. Publ. No. 16, American Committee for International Wildlife Protection.
Payne, J. (1980). Report on rhinoceros in the Silabukan Forest Reserve, Sabah. Sandakan, Sabah Forest Dept, (Unpublished report).
Poore, M. (1963). Problems in the classification of tropical rain forest. J. Trop. Geogr., 17, 12-19.
Richards, P. (1952). The tropical rain forest. Cambridge,Cambridge Univ. Press.
Schenkel, R. & Schenkel, L. (1979). Report from the SSC Asianrhino group meeting in Bangkok, Thailand. Gland, Switzerland, lUCN/WWF. (Unpublished report).
Shaffer, M. L. (1981). Minimum population sizes for species conservation. Bioscience 31, 131-134.
Simon, N. (ed.). (1969). Red data book, Mammalia. Gland, Switzerland, lUCN/WWF.
Soule, M. E. (1980). Thresholds for survival: maintaining fitness and evolutionary potential. In Conservation biology: An evolutionary-ecological perspective, ed. by M. Soule and B. Wilcox, 151-170. Sunderland, Mass., Sinauer Assoc.
Reproduced with permission of the copyright owner. Further reproduction prohibited without permission.
Page 36
Stevens, W. E. (1968). The conservation of wildlife in WestMalaysia. Kuala Lumpur, Malaysia, Department of Wildlife and National Parks.
Strickland, D. (1967). Ecology of the rhinoceros in Malaya. Malay. Nat. J., 20, 1-17.
Talbot, L. (1960). A look at threatened species. Oryx 5, 153-293.
Van Strien, N. (1974). The Sumatran or two-horned Asiatic rhinoceros. A study of theliterature. Meded. Landbouwhogeschool Wageningen 74-16.
Wray, L. (1906). Rhino trapping. J. Fed. Malay. States Mus. 1, 63-65.
Whitmore, T. C. (1975). Tropical rain forests of the Far East. Oxford, Claredon Press.
Wyatt-Smith, J. (1964). A preliminary vegetation map of Malayawith descriptions of the vegetation types. J. Trop. Geogr., 18, 200-213.
Reproduced with permission of the copyright owner. Further reproduction prohibited without permission.

Pfige 37
CHAPTER III
DISTRIBUTION AND NUMBER OF SUMATRAN RHINOCEROS
IN THE ENDAU-ROMPIN REGION
OF PENINSULAR MALAYSIA
Reproduced with permission of the copyright owner. Further reproduction prohibited without permission.
Page 38
ABSTRACT
Distribution of the Sumatran rhinoceros in the Endau-Rompin
region of southern Peninsular Malaysia was studied from 1975 to 1981. I
collected information from a general field survey and interviews with
people living near rhino areas. I found that individual rhinos could be
differentiated based on statistical differences in median track width,
the distance between track observations of similar size, and
recognizable cow/calf pairs. Rhinos were found to occur throughout the
region in most of the remaining contiguous primary forest, occupying
about 1600 k m ^ . The number of rhinos in 400 km^ of the southern section
was estimated from a series of 4 census surveys conducted from 1977 to
1981. I recorded the tracks of 8, 6, 8, and 8 unique rhinos on the
study area during the censuses and estimated that 10 rhinos occurred
there, a density of 1 animal/40 kmf. Rhino density in the remainder of
the region appeared to be much lower, about 1 animal/80-120 k m ^ . I
estimated that 20-25 Sumatran rhinos occur in the Endau-Rompin region.
Young rhinos were found in the population in 1975, 1977, and 1981 for an
annual total recruitment rate of 0.5 young/year. One case of adult
mortality was documentated. The Endau-Rompin region is the best place
in Malaysia to maintain a viable population of Sumatran rhinos because
it contains the largest number of animals, evidence of recruitment has
been observed, a law enforcement program has been started, and a portion
of the region (870 k m ^ ) has been proposed for national park status.
Reproduced with permission of the copyright owner. Further reproduction prohibited without permission.
Page 39
INTRODUCTION
The Sumatran or two-horned Asiatic rhinoceros (Dicerorhinus
sumatrensis Fisher 1814), one of the world's rarest large mammals, is
threatened with extinction throughout its range (Simon, 1969). This
forest-dwelling rhino was once found across Southeast Asia, from the
hills of eastern Assam in India through Burma, Thailand, Indochina, the
Malay peninsula, and the Sunda islands of Sumatra and Borneo (Groves,
1967; Van Strien, 1974). Recent surveys have shown that the Sumatran
rhino is now restricted to small scattered populations occurring in
Burma (Schenkel and Schenkel, 1979), Thailand (McNeely and Laurie,
1977), the Malay peninsula (Flynn and Abdullah, 1983), Sumatra (Borner,
1978; Van Strien, pers. comm.), and Borneo (Schenkel and Schenkel,
1979; Payne, 1980; Flynn, 1981).
The historic hunting of rhinos for their body parts has
greatly depleted numbers (Van Strien, 1974). Many Asiatic people
believe that rhino body parts, especially the horn, have special
medicinal properties. The increased use of rhino horn for knife handles
in Yeman has caused the price of rhino horn to soar during the past few
years (Martin, 1979). Recently, extensive habitat destruction from
logging and forest clearance for agricultural development has further
isolated rhino populations and reduced the amount of suitable habitat.
Little detailed information on the distribution and numbers of
the Sumatran rhino in Peninsular Malaysia has been available, the
literature consisting of old accounts by hunters and game wardens
Reproduced with permission of the copyright owner. Further reproduction prohibited without permission.

Page 40
(e.g. Hubback, 1939; Foenander, 1952; Hislop, 1965), or brief field
surveys (Talbot, 1960; Foenander, 1961; Milton, 1963; Strickland,
1967; Stevens, 1968; Ellis, 1971). In 1975, the Malaysian Department of
Wildlife and National Parks (DWNP) initiated a long-term study on the
distribution, ecology, and conservation of the Sumatran rhino in
Peninsular Malaysia (Flynn, 1978). Early in this study, I discovered
that the Endau-Rompin region, located in the southern part of the Malay
peninsula, contained the country's largest remaining rhino population
(Flynn and Abdullah, 1983). In this paper, I present the results of a
study into the distribution and number of Sumatran rhinos in the
Endau-Rompin region.
Censusing a ground-dwelling mammal in tropical rain forest
habitat is a difficult task. Dense vegetation, rough topography, heavy
rainfall, and secretive animals prevent the use of standard methods
(Bourliere, 1969). The Sumatran rhino presents a particularly difficult
problem because the animals can not be easily observed or captured.
Thus, all methods must be based on observations of indirect evidence of
an animal's presence. The locations and size of tracks provide the only
information that can be regularly collected in the field. This rhino
species has feet with characteristic flat, circular soles and 3 large
toenails, a half round toenail in front with more pointed toenails to
the left and right of the sole (Van Strien, 1979). In firm soil, these
animals leave clear foot prints that can be measured accurately (Flynn,
1978). A statistical analysis of the characteristics of rhino track
measurements taken under field conditions indicated that individual
Reproduced with permission of the copyright owner. Further reproduction prohibited without permission.
Page 41
animals can be distinguished by differences in track sizes, the distance
between track locations of similar size, and recognizable adult
female/young pairs.
STUDY AREA
Endau-Rompin Region
The Endau-Rompin region is located in the southern portion of
the Malay peninsula, about 225 km south of the capital city of Kuala
Lumpur (Fig, 1). The study area straddles the Johor-Pahang state border
and is bounded between 2* 15' N and 2° 50' N latitude and 103° 00' E and
103° 30' E longitude. The Endau and Rompin rivers drain the southern,
eastern, and northern sections of the region, flowing eastward into the
South China Sea. The Muar River drains the western section into the
Straits of Malacca.
The region's topography is generally hilly, locally quite
steep, with a central north-south trending mountain range that rises
abruptly above the coastal plain. Elevations range from about 100 m
near the coastal plain to over 1000 m at the tops of the highest
mountain peaks. These mountains are composed of undifferentiated
granitic rocks of Triassic age (Gobbett and Hutchison, 1973). To the
east, Permian volcanic rocks of andesitic to rhyolitic composition are
intruded by the granite. In the east and north, Jurassic-Cretaceous
sandstones of the Tebak formation unconformably overlie the older
granitic rocks, forming distinctive plateaus and escarpments (Burton,
Reproduced with permission of the copyright owner. Further reproduction prohibited without permission.

Pnp,e 42
\\ \ SOUTHCHINA SEA
Peninsular vlalaysia Pos R
R om p in RS ep lap R
J e ka t ih R.
Kua la R om pin
Sek in R
P on tian R.
K in c in R.
Puk in R.A nak Endau R
K em apan R
G. B e rem ba r iv
B uk it PetaS e g a m a t R.
G. Puk in ^
G. BesarEndau RK. Peta
jtk
G. Jan ingG. Pertaw i /
Jas in RJuaseh R. Lem akoh Rn 3 n Q
Selai R
K e m id a k R.
G .B ekok
B ekok R
Emas R.
l î K. SelaiK. K e m id a k
Lab is
Endau-Rompin Regions ta te Border Town or V illage
■ m Road M ountain
I Bekok
5 km
Fig. 1. Map of the Endau-Rompin region, located in southern Peninsular Malaysia, showing places mentioned in the text.
Reproduced with permission of the copyright owner. Further reproduction prohibited without permission.
Page 43
1973). The region's soils are quite variable depending on the
underlying parent material, but are generally of poor quality
(Smallwood, 1966). Red and yellow latosols and podzolic soils derived
from acid igneous rocks cover most of the area. Latosols and podzolic
soils derived from sedimentary rocks are found farther to the east
(Smallwood, 1966).
The region has a tropical climate strongly influenced by close
proximity to the equator and warm oceans. Atmospheric conditions are
uniformly warm and humid throughout the region, with a mean annual
temperature of 27° C and mean annual relative humidity of 85% in lowland
areas (Dale, 1963). Rainfall is heavy throughout the year with little
seasonal variation, except for slight increases during the
June-to-August and October-to-December monsoon periods. Annual mean
rainfall varies across the region depending on distance from the sea,
ranging from a low of 2000 mm at the interior town of Segamat to a high
of 3300 m m at the coastal town of Mersing (Dale, 1959).
The natural vegetation of the Endau-Rompin region is tropical
evergreen rain forest of the Indo-Malayan formation (Richards, 1952).
These forests are the most luxuriant of all plant communities and are
characterized by numerous large evergreen, broad-leafed trees dominated
by the family Dipterocarpaceae (Whitmore, 1975). Many problems exist in
the classification of these forests (Poore, 1963), but they can be
grouped into several general forests types (Wyatt-Smith, 1964; Forest
Department, 1977). The majority of the Endau-Rompin region is covered
with mixed lowland dipterocarp forest with hill dipterocarp forest on
Reproduced with permission of the copyright owner. Further reproduction prohibited without permission.
Page 44
the ridges and at elevations above 300 m. According to Gyekis (1966), a
large portion of the western mountainous area contains forests of the
meranti-keruing mixed hill type with seraya-keruing ridge forest
predominating on the ridges and well drained sites. In the north and
east, the forests are variable, composed primarily of edaphic hill
forest, some seraya hill forest, and livestonea-kelat-kedendong forest
(Lee, 1966).
Census Area
Preliminary study results indicated that rhino density in the
Endau-Rompin region was quite variable, with density much higher in the
southern section. A portion of this high-density area was selected for
intensive census work. The census study area contained about 400 km^
within the upper watersheds of the Juaseh, Kemidak, Tenang, Selai,
Segamat, Endau, Pukin, and Jemai rivers (Fig. 2), The balance of the
region will be refered to as the low-density area. The census area was
mostly covered with primary tropical rain forest (90%) with small areas
covered by logged forest (5%), mixed orchard (3%), and agricultural
crops (2%).
METHODS AND PROCEDURES
Field Methods
General survey. The distribution of Sumatran rhinos in the
Reproduced with permission of the copyright owner. Further reproduction prohibited without permission.
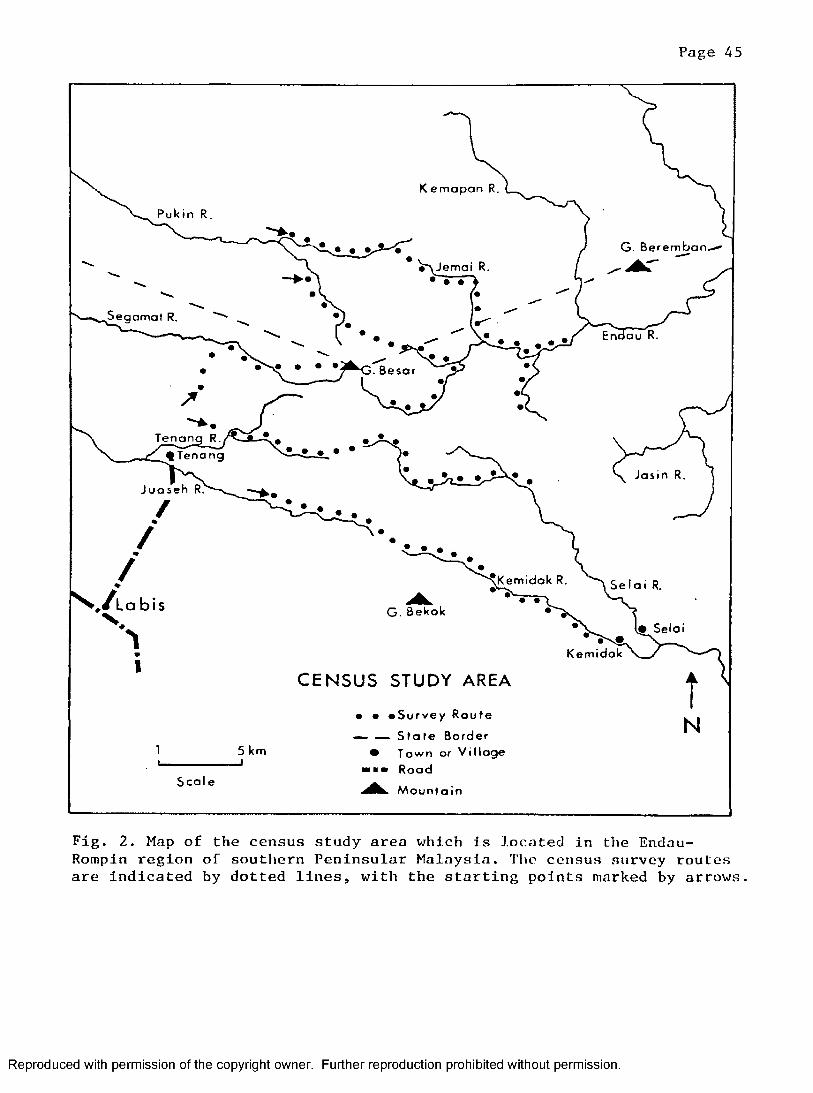
Page 45
K e m a p a n R.
G . B e r e m b o n
J e m a i R.
S e g a m a t R,
>. B e s a r
Tenang R., $Tenong
J u a s e h R,
K e m i d a k R S e l a i R.
bi G.Bekok
K e m i d o k
C EN SUS STUDY AREA
e * « S u r v e y R o u t e
— — S t a t e B o r d e r
• T o w n o r V i l l a g e
■ ■ ■ R o a d
M o u n t a i n
5 k m
S c a l e
Fig. 2. Map of the census study area which Is located in the Endau- Rompin region of southern Peninsular Malaysia. The census survey routes are Indicated by dotted lines, with the starting points marked by arrows
Reproduced with permission of the copyright owner. Further reproduction prohibited without permission.
Page 46
Endau-Rompin region was investigated by a general survey conducted
during January 1975 to January 1978, January 1979 to June 1979, and July
1980 to May 1981. Initially, people living or working in the region,
especially villagers at Kampung Juaseh, Kampung Tenang, Kampung Segamat,
and Kampung Peta, were interviewed to gather information on places where
rhino sign (tracks, wallows, or evidence of feeding) had been observed.
These reports were evaluated for reliability and most were checked by
field surveys, but a lack of time prevented me from verifying all
reports. A survey team, consisting of DWNP rangers, local guides, and
ourselves, searched potential rhino areas for sign. Each field survey
lasted for about 10 days and 80 to 100 km were travelled on foot.
Usually, survey routes followed small streams because rhino sign was
easiest to observe there. The observation of sign confirmed the
presence of rhinos in an area and provided a rough indication of
population density.
I concentrated my survey efforts in areas where rhino sign had
been reported frequently. Thus, the general rhino survey was started in
the Juaseh-Segamat-Selai area. Adjacent watersheds were searched
systematically until most sections of the region had been surveyed. The
field surveys were time consuming, so all areas were not covered.
The locations of all rhino sign observed were plotted on
topographic maps and recorded as map grid coordinates. At each track
observation, the tracks were followed until several clear prints of the
animal's hindfoot could be recorded. At each track, the maximum width
between the lateral toenails and the width of the middle toenail were
Reproduced with permission of the copyright owner. Further reproduction prohibited without permission.
Pnge 47
measured to the nearest millimeter with a steel tape and calipers (Flynn
1978). The maximum width of the middle toenail was useful in
differentiating between rhino and Malayan tapir (Tapirus indicus)
tracks, with rhino tracks having a wider toenail. Usually, only tracks
made by the hindfeet were recorded because the rhinos frequently placed
their hindfeet on top of the forefoot prints. An attempt was made to
follow a set of tracks until at least 10 clear prints made by the animal
walking on flat, firm ground could be measured. The total number of
tracks that were measured at each observation varied depending on
weather conditions and time availability. Also, the topography and soil
conditions were recorded at each track observation.
Census surveys* The number of rhinos occurring in the
high-density census area was estimated using methods similar to those
developed by Schenkel and Schenkel-Hulliger (1969) for censusing the
Javan rhino (Rhinoceros sondicus) in Udjung Kulon Reserve, Indonesia.
Rhinos occurring within the 400 km^ study area were censused by 5 survey
teams that walked simultaneously across the study area along permanent
transect routes during a period of 4 to 5 days. A survey team usually
consisted of a DWNP officer as team leader, 3 DWNP rangers, and local
guides. Each survey team recorded the location, age, and size of all
rhino tracks encountered along their route. After each census survey
was completed, the information from each team was evaluated for accuracy
and reliability. All incomplete or questionable data were eliminated
from further analysis. Census surveys were conducted in March 1977, May
1977, March 1979, and September 1980.
Reproduced with permission of the copyright owner. Further reproduction prohibited without permission.
Page 48
The routes selected for the census surveys were established
along small streams that flow roughly parallel east to west across the
study area (Fig. 2). My initial surveys showed that rhino tracks were
found most often along small streams because the animals use stream
bottom habitat frequently (Flynn, in prep.) and their tracks were more
noticeable in soft soil. Often, these streams provide the only
available route for foot travel through the forest. Also, streams can
be found at a latter date, so the same route can be repeated.
Fortunately, most of the streams in the study area flow roughly parallel
east or west from a central north-south mountain range. All routes
began at the western edge of the study area at points accessible by
road. The routes proceeded east along the streams to the top of the
mountain ridge, then down the opposite drainage to the boundary of the
study area. Each major tributary of the main stream was also surveyed
to provide more complete coverage. The distance between adjacent routes
ranged between 1 and 6 km and route lengths varied between 25 and 45 km
(*=34 k m ) .
Statistical Procedures
Data collected during this study were analyzed on the
DECSYSTEM-2050 computer system available at the University of Motana
Computer Center. The Statistical Package for the Social Sciences (SPSS)
(Nie et_ a^. 1975) computer programs were used for all of the statistical
analyses, unless noted otherwise. The statistical characteristics of a
series of track measurements were investigated by computing descriptive
statistics (mean, median, range, and skewness) and frequency histograms.
Reproduced with permission of the copyright owner. Further reproduction prohibited without permission.

Page 49
Skewed track frequency distributions were compared to a normal
distribution by the Kolmogorov-Smirnov one-sample goodness-of-fit test
using parameters estimated from the data. The sign test was used to
examine whether a significant number of track distributions were skewed
in a particular direction. A 95% confidence interval for the median was
constructed for each track series (Campbell, 1967). Track measurement
distributions made by the left and right feet of the same animal were
compared using the Mann-Whitney two-sample rank sum test. This same
test was used to compare 2 track series of the same animal made in soft
and firm soil.
The track data collected during each census survey were
analyzed to determine the minimum number of animals occurring on the
study area during the census period. In this analysis, all track
observations of the same age that were located farther than 8 km apart
were considered different animals. The assumption was that rhinos
usually do not travel more than 8 km in straight line distance during a
24-hour period, especially over a mountain ridge into another watershed.
Other information, such as whether the animal had spent a large amount
of time in a particular area, was used in the evaluation of the distance
between tracks of the same size. Also, recognizable cow/calf pairs were
used as criteria to identify individual rhinos. Previous work (Flynn,
unpublished) indicated that a young rhino travels with its mother until
the calf's median track width reaches about 17.0 cm. Thus, if a track
series with a median width measurement of less than 17.0 was paired with
a track with a median width size greater than 19.0 cm, a cow/calf pair
Reproduced with permission of the copyright owner. Further reproduction prohibited without permission.
Page 50
was presumed.
The remainder of the track series recorded during a census
period were treated as independent observations. The Kruskal-Wallis
(K-W) one-way analysis of variance (ANOVA) by ranks was used to test
whether these observations all came from distributions with the same
location. If this null hypothesis was rejected, simultaneous confidence
intervals for the difference between medians were calculated according
to a method by Campbell (1967). If the confidence intervals for the
difference between the medians of a pair of observations did not include
zero, then I concluded that the track distributions had been made by
different animals. Other multiple comparison procedures were examined
(Sokal and Rohlf, 1969; Gibbons, 1976), but these procedures proved to
be less useful because of unequal sample sizes and the large number of
groups.
The described census method yielded a minimum count of the
number of rhinos within the study area during a given period. The
detection of all rhinos within the study area by walking the 5 census
routes was unlikely. The surveys were assumed to detect all rhinos
within 2 km of the census routes. Thus, the survey routes adequately
covered about 75% of the entire census study area. The total number of
rhinos within the study area during the census period was estimated by
increasing the minimum count by 25%.
The number of young rhinos in the population was determined
using track size criteria. All animals with a median track width of
less than 17.0 cm were considered dependent young, probably less than
Reproduced with permission of the copyright owner. Further reproduction prohibited without permission.

Page 51
2.3 years of age. All other animals were assumed to be either
sub-adults or adults. Insufficient information existed to further
separate animals into age categories based on foot width measurements.
RESULTS
Characteristics of Track Measurements.
The analyses presented in this paper are based on the
observation of 110 sets of rhino tracks. The number of tracks measured
for each observation varied from 1 to 30 (x=ll). Early in this study,
only the median width of a track series was recorded because the utility
of recording all of the track measurements of a series had not yet been
realized. Thus, multiple samples were recorded for 73 of the track
observations. For all track observations, the maximum width measurement
between the lateral toes of the hindfeet varied from 15.0 to 22.5 cm,
the width of the hindfoot front toe varied from 5.5 to 9.0 cm, the width
of the forefoot varied from 18.5 to 23.0 cm, and the width of the front
toe of the forefoot varied from 6.0 to 9.5 cm. The forefoot track was
always wider than the hindfoot track for all animals with a mean
difference of 1.5 cm. Because accurate measurements of the forefeet
were difficult to obtain, only measurements of the width of the hindfeet
were used in the rest of the analyses. The track distributions made by
the right and left feet of the same animal were found to be similar for
3 sets of observations (Mann-Whitney rank sums test, p>0.S, 0.75, 0.9).
Reproduced with permission of the copyright owner. Further reproduction prohibited without permission.
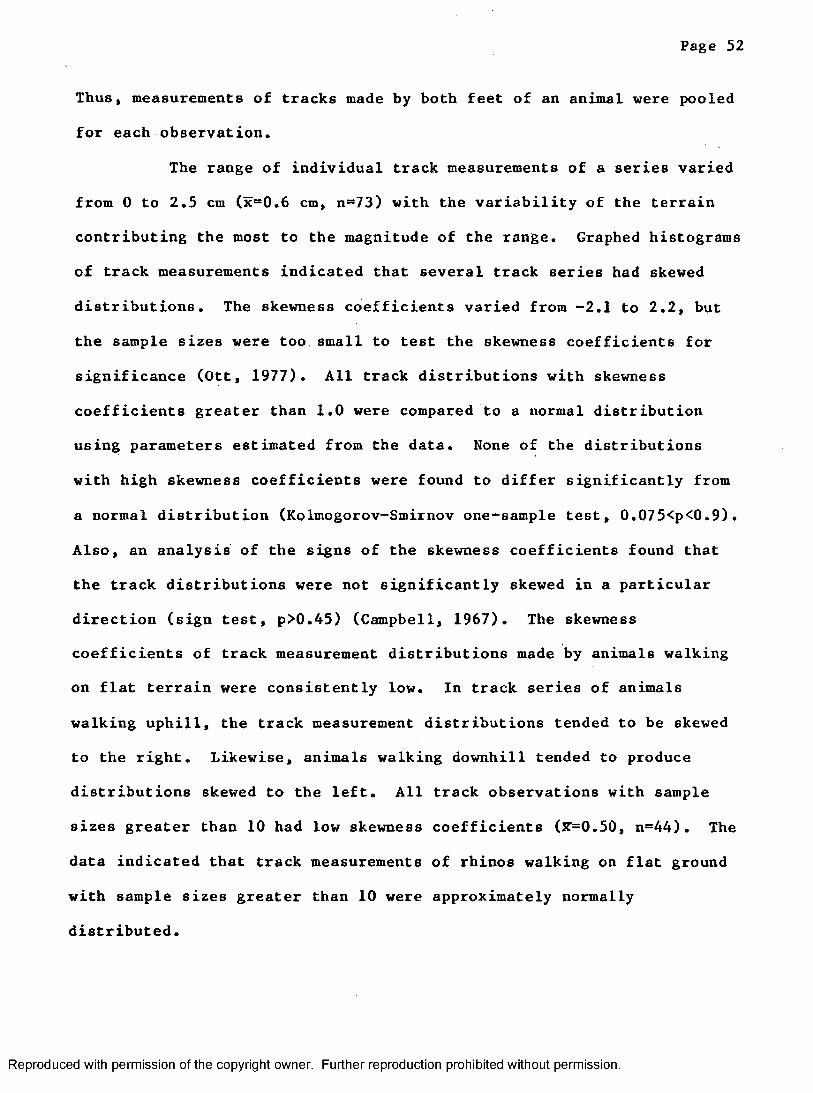
Page 52
Thus, measurements of tracks made by both feet of an animal were pooled
for each observation.
The range of individual track measurements of a series varied
from 0 to 2,5 cm (x=0,6 cm, n=73) with the variability of the terrain
contributing the most to the magnitude of the range. Graphed histograms
of track measurements indicated that several track series had skewed
distributions. The skewness coefficients varied from -2.1 to 2.2, but
the sample sizes were too small to test the skewness coefficients for
significance (Ott, 1977). All track distributions with skewness
coefficients greater than 1.0 were compared to a normal distribution
using parameters estimated from the data. None of the distributions
with high skewness coefficients were found to differ significantly from
a normal distribution (Kolmogorov-Smirnov one-sample test, 0.075<p<0.9).
Also, an analysis of the signs of the skewness coefficients found that
the track distributions were not significantly skewed in a particular
direction (sign test, p>0.45) (Campbell, 1967). The skewness
coefficients of track measurement distributions made by animals walking
on flat terrain were consistently low. In track series of animals
walking uphill, the track measurement distributions tended to be skewed
to the right. Likewise, animals walking downhill tended to produce
distributions skewed to the left. All track observations with sample
sizes greater than 10 had low skewness coefficients (%=0.50, n=44). The
data indicated that track measurements of rhinos walking on flat ground
with sample sizes greater than 10 were approximately normally
distributed.
Reproduced with permission of the copyright owner. Further reproduction prohibited without permission.
Page 53
For 1 set of tracks, sufficient data were available to test
the effect of soil type on track size. A rhino's tracks made in soft,
muddy soil were found to be significantly larger than tracks made in
firm ground (Mann-Whitney rank sums test, p<0.05). A 95% confidence for
the difference in the medians was found to be 2< mm. Thus, soft
soil conditions may result in a shift to the right of the median by 2 to
4 mm.
Distribution
The tracks of Sumatran rhinos were observed 110 times in the
Endau-Rompin region during 50 ground surveys. I spent over 300 days in
the field and walked an estimated 2750 km through the forest. These
surveys were centered in the census study area with the upper Tenang,
Selai, Endau, Segamat, Juaseh, and Kemidak watersheds each surveyed 5 or
more times. The lower Endau River area and the upper Kemapan, Jemai,
Pukin, and Jekatih watersheds were each surveyed 2 to 4 times, and the
upper Sekin, Kinchin, Emas, and Jasin watersheds were surveyed once. .
Additional information on the presence of rhinos along the lower
Semberong, Emas, and Endau rivers was collected from villagers living
there.
Rhino sign was found throughout the Endau-Rompin region,
including most of the remaining contiguous primary forest habitat, about
1600 km^ (Fig. 3). Habitat type, land-use patterns, and human
disturbance were found to be the major factors restricting rhino
distribution. The rhinos used most of the remaining contiguous primary
Reproduced with permission of the copyright owner. Further reproduction prohibited without permission.

Pnpc 54
SOUTH CHINA SEA
Peninsular Malaysia Pos R
K ua la R om pinR om pin RS ep lap R.
J e k a tih R.
Sekin R,:
P o n tia n R.
K in c in R
P uk in R.Anak Endau R
S K e m apan R.
G. BerembanB u k it Peta
S egam a t R
G. P u k in ^
G B esarEndau RK. Peta
G. Ja n in gG. Pertawi
Jasin R.Juaseh R. Lem akoh R^ e n a n g
S e ia i R.
K e m id a k R.
G -B ekok
B ekok R.
Em as R.
Lab is • K. S e la iK. K e m id a k
Endau-Rompin RegionRhino Distribution
State Border• Town or Village
Road Mountain
I B ekokN
1 5 km
S ca le
Fig, 3. Present distribution of Sumatran rhinos in the Endau-Rompin region of southern Peninsular Malaysia.
Reproduced with permission of the copyright owner. Further reproduction prohibited without permission.
Page 55
forest habitat, but they seldom moved into adjacent agricultural areas
or logged forest. In general, rhino sign was not found more than 0.6 km
from the primary forest fringe, and rhinos appeared to avoid areas of
high human-use.
Rhino distribution was well documented in the southern and
western portions of the region. Rhino sign was found during each trip
into the upper watersheds of the Juaseh, Tenang, Segamat, Kemidak, and
Selai rivers. Moat observations of rhino sign were a considerable
distance (x=10 km, n=110) within the primary forest from the fringe,
especially away from areas with high human use. Frequently, villagers
from Kampung Juaseh and Tenang walked 4 to 6 km into the primary forest
along the western boundary. This human disturbance appeared sufficient
to reduce rhino use of the forest fringe. Also, hunting pressures
probably have selected against animals using accessible areas. Rhino
sign was seldom found in logged areas along the Endau River or in the
Segamat, Pukin, Chapau, and Jemal watersheds. Repeated surveys of the
Pukin-Jemai area documented changes in rhino distribution resulting from
logging activity (Flynn, 1978). After logging began in 1977, rhino sign
was no longer found where it had been observed previously. Surveys in
1979 and 1980 did not record rhino sign within logged areas, except
within 0.6 km of the primary forest fringe.
A similar pattern of land development was observed in the
southern sections. Logging has advanced rapidly along the Bekok, Selai,
Emas, and Kemidak rivers from the south. In 1981, a new road was
completed to Kampung Selai along the lower Selai River, greatly
Reproduced with permission of the copyright owner. Further reproduction prohibited without permission.

Page 56
improving human access to this important rhino area. All lands south of
the proposed Endau-Rompin National Park boundaries have been committed
to timber concessions.
Interviews with villagers living along the lower Semberong,
Emas, and Endau rivers indicated that rhinos were no longer found there.
Stevens (1968) reported finding rhino sign throughout this area. Now,
most of the land south and east of the Emas River has been cleared for
agricultural crops, and the Emas watershed has been logged extensively.
Farther to the east along the Endau River near Tanah Abang, villagers
reported that rhinos were no longer found anywhere along the lower
Endau. Apparently, heavy poaching and logging during the 1960's
eliminated these animals.
The present distribution of rhinos in the northern sections of
the region was not well-documented because fewer surveys were conducted
there and sign was encountered less frequently. However, my surveys
recorded rhino sign in the upper Jekatih, Sekin, and Kinchin watersheds
and established that rhinos occurred throughout that area. Villagers
living along the Jekatih River reported that rhinos were once found
throughout the entire region, but now they were restricted to the upper
portions of unlogged watersheds. Much of the land within the lower
Jekatih and Sekin basins has already been cleared for agricultural
development; the remainder has been committed to timber concessions,
primarily to Lesong Timber Products (50,000 ha). This land exploitation
has resulted in a patched pattern of primary forest, logged forest, and
agricultural lands. Many islands of primary forest within the logged
Reproduced with permission of the copyright owner. Further reproduction prohibited without permission.

Page 57
forest have been created, especially in hilly areas, and the amount of
available habitat has been reduced. A few animals in the Seplap and Pos
watersheds within the Lesong concession may have already been isolated
from the main Endau-Rompin population.
In 1981, 1 made a brief survey of the upper Anak Endau and
Pontian river basins near Gunung Lesong. A villager reported
encountering rhino sign on the east slopes of this mountain during 1980.
I found no evidence of rhinos occurring east of the Endau mountains. My
discussions with several loggers indicated that they were not aware of
any rhino reports from the region. Presently, the lowland forest is
being logged by several timber companies. I doubt whether any rhinos
now exist east of the Endau mountain ridge. If a few animals are
presently found there, their chances for survival are poor because all
of the habitat will soon be destroyed, and the threat of poaching is
high.
A few reports of rhinos occurring farther to the north near
the Rompin River were received from villagers living there, but I was
unable to confirm these reports. Rhinos may still occur in the upper
watersheds of small tributaries of the Rompin River (e.g. Aur,
Keratong). However, these animals are isolated from the main
Endau-Rompin population by logged forest and agricultural lands, and
their chances for survival are poor.
Reproduced with permission of the copyright owner. Further reproduction prohibited without permission.

Page 58
Census Surveys
Census The first census survey was conducted during 18-27
March 1977. The 4 survey teams recorded 8 sets of recent rhino tracks
within the 400 km^ study area (Fig. 4) (Table 1). Track observations 1
and 2, found within the upper Kemidak watershed, and observations 5 and
6, found in the upper Selai basin, were recognized as cow/calf pairs.
Track observations 3, 4, 7, and 8 were considered to be different
animals based on the distance between individual track observations
(Table 2). Thus, at least 8 different rhinos were recorded on the study
area during this census period. These animals consisted of 2 adult
females (19.5 and 21.0 cm), 2 calves (15.0, 17.0 cm), and 4 independent
sub-adults or adults (median track width = 17.5, 19.0, 19.2, 22.5 cm).
Based on increasing the minimum count by 25%, the total number of
animals in the study area was estimated at 10, or 1 rhino/40 k m ^ .
Census 2" The second census was conducted during 20-26 May
1977. The 5 survey teams recorded 7 sets of fresh rhino tracks on the
study area during this census period (Fig. 5) (Table 3). Track
observation 9 was considered as made by a unique animal based on the
distance between track locations. The track width measurements of the
remainder of the observations were not all from the same distribution
(K-W ANOVA, F<0.01). A multiple comparison of 80% simultaneous
confidence intervals for the difference in median track width indicated
that track observations 9, 10, 11, 13, 14, and 15 were significantly
different, but no difference was found between observations 11 and 12
(Table 4). Thus, the tracks of 6 different rhinos were found on the
Reproduced with permission of the copyright owner. Further reproduction prohibited without permission.
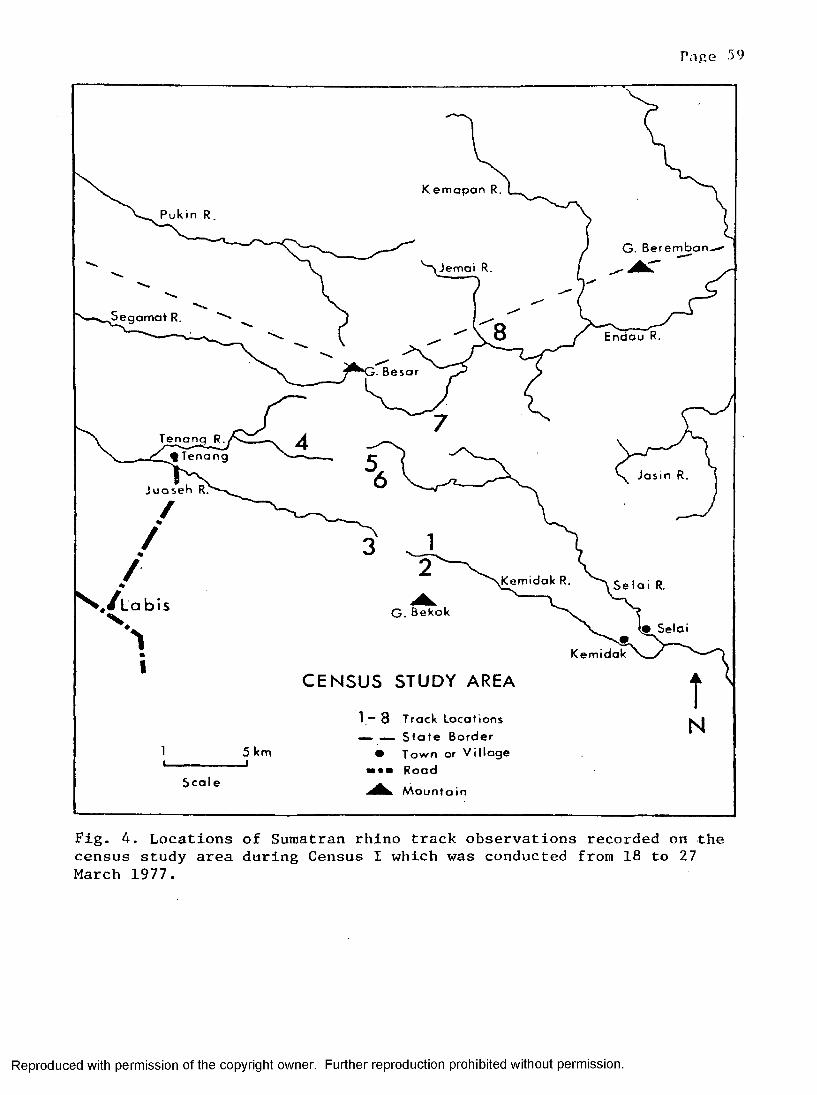
Pnpe 59
K e m a p a n R.
G . B e r e m b a n
é m o i R.
^ g a m a t R.
. B e s a r
$ TenangJ a s i n R.
K e m i d a k R.
bi . B e k o k
[ • S e l a i
K e m i d a k
CENSUS STUDY AREA
1 ~ 8 T r a c k L o c a t i o n s
— — S t a t e B o r d e r
• T o w n o r V i l l a g e
•p • ■ R o a d
«WÊL. M o u n t a i n
5 k m
S c a l e
Fig. 4. Locations of Sumatran rhino track observations recorded on the census study area during Census I which was conducted from 18 to 27 March 1977.
Reproduced with permission of the copyright owner. Further reproduction prohibited without permission.

Page 60
Table 1. Sumatran rhino track observations recorded during Census 1which was conducted from 18 to 27 March 1977.
Observation number Sample size Track width& 95% Clb
1 7 19.5 19.0-20.02 10 17.1 17.0-17.53 15 19.0 18.0-19.04 8 19.2 19.0-19.45 1 18.0 -6 1 21.0 —7 1 22.5 -8 6 17.5 17.0-18.0
^ Median track width.
^ A 95% confidence interval for the median track width.
Table 2. Multiple comparison of track observations recorded duringCensus I.
Track observation 8 7 4
3 S s D4 S s7 S
S = Track observation pair significantly different based on the comparison of simultaneous confidence intervals for the difference in median track width.
N = Median track width of the track observation pair not significantly different.
D = Track observation pair separated based on the linear distance between track observations (greater than 8 km).
Reproduced with permission of the copyright owner. Further reproduction prohibited without permission.
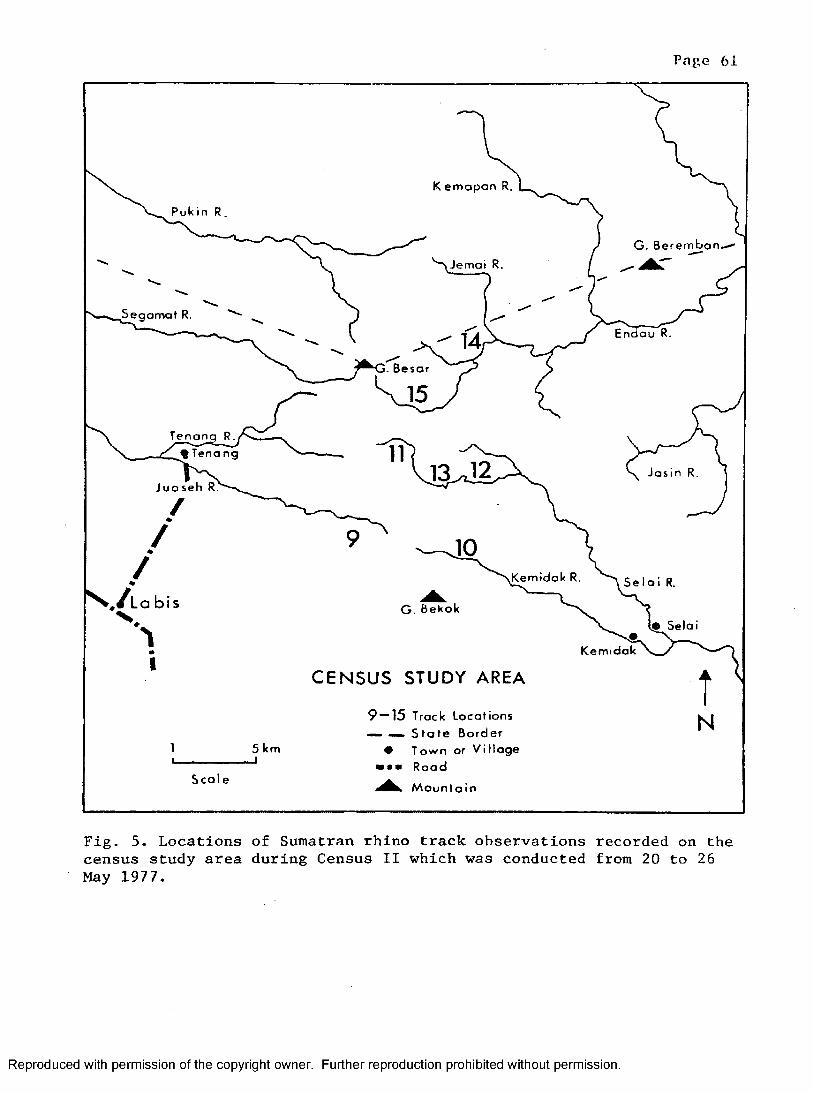
Pape 61
K e m a p a n R.
G. Berembané m o i R.
S e g a m o t R.
E n d a u R.
. B e s a r
J u o s eh R.
K e m f d a k R.
b i G.B e k o ki * S e l a i
K e m i d a k
CENSUS STUDY AREA
9~15 T r a c k L o c a t i o n s
— — S t a t e B o r d e r # T o w n o r V i l l a g e
R o a d
M o u n t a i n
5 k m
S e a l e
Fig. 5. Locations of Sumatran rhino track observations recorded on the census study area during Census II which was conducted from 20 to 26 May 1977.
Reproduced with permission of the copyright owner. Further reproduction prohibited without permission.
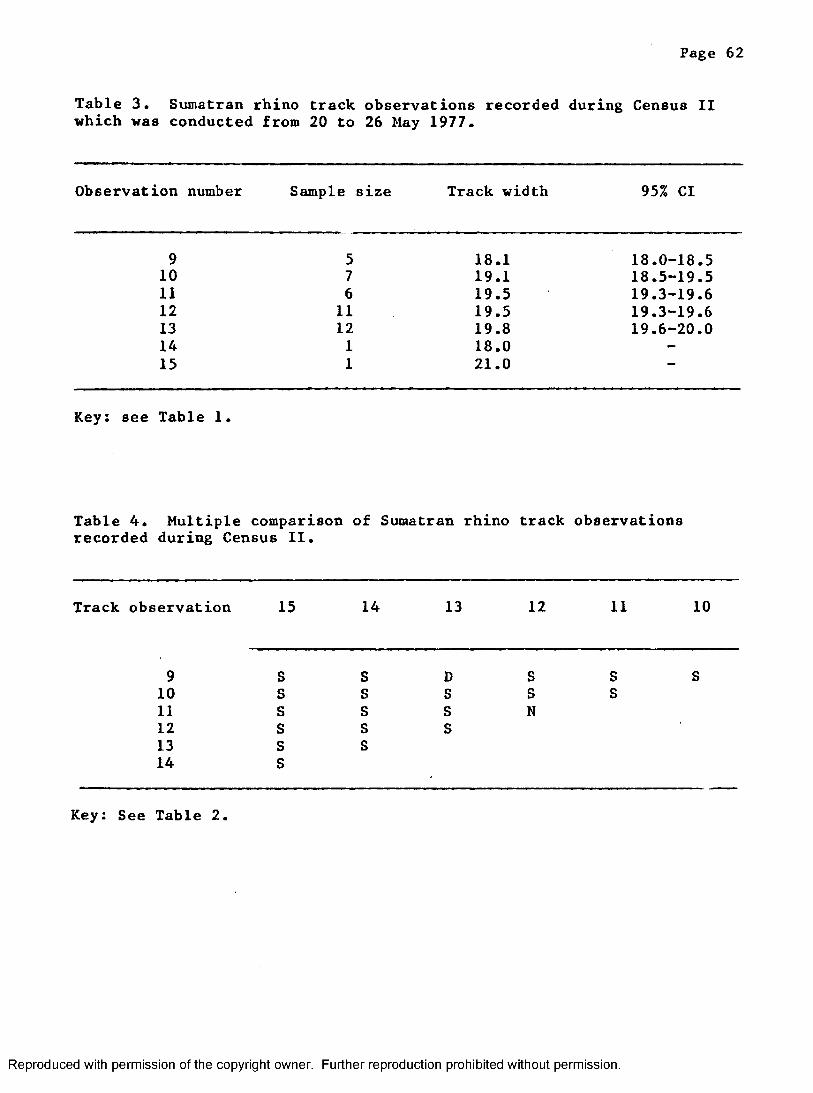
page 62
Table 3. Sumatran rhino track observations recorded during Census IIwhich was conducted from 20 to 26 May 1977.
Observation number Sample size Track width 95% Cl
9 5 18.1 18.0-18.510 7 19.1 18.5-19.511 6 19.5 19.3-19.612 11 19.5 19.3-19.613 12 19.8 19.6-20.014 1 18.015 1 21.0
Key: see Table 1
Table 4. Multiple comparison of Sumatran rhino track observations recorded during Census II.
Track observation 15 14 13 12 11 10
9 S S D S S10 S S S S S11 S S S N12 S S S13 S S14 S
Key: See Table 2.
Reproduced with permission of the copyright owner. Further reproduction prohibited without permission.
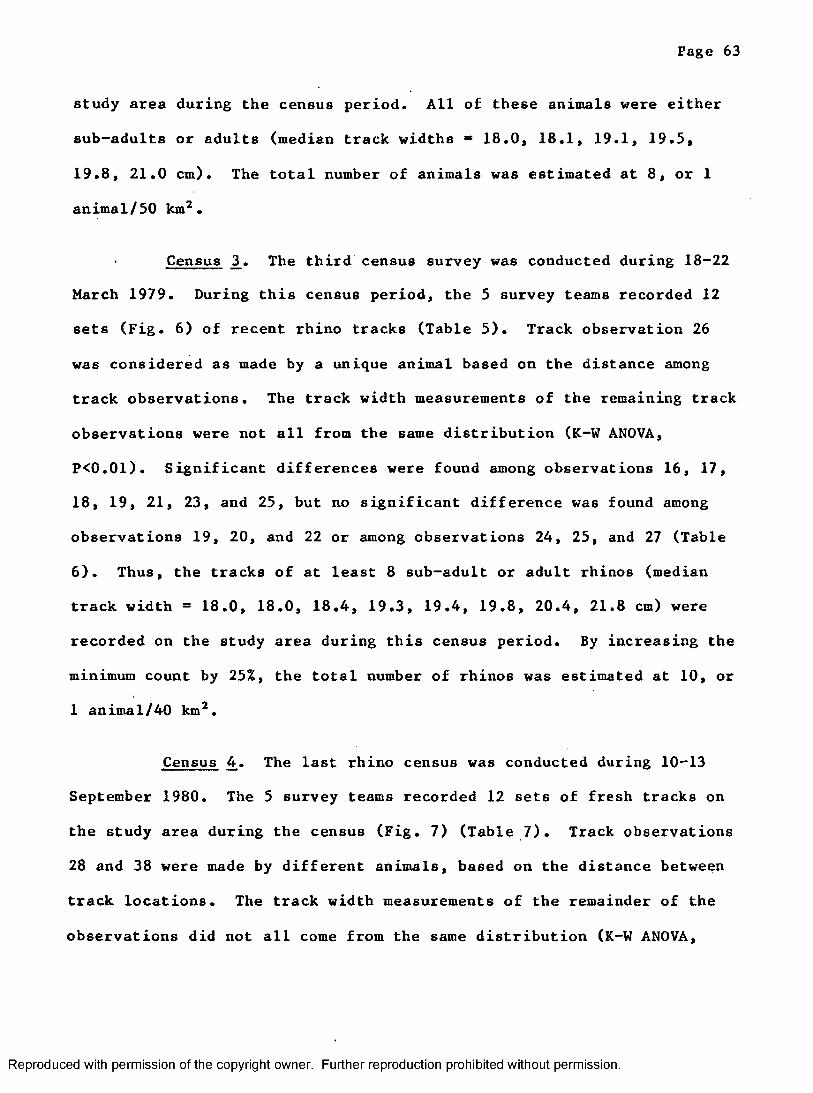
Page 63
study area during the census period. All of these animals were either
sub-adults or adults (median track widths = 18.0, 18,1, 19.1, 19.5,
19.8, 21.0 cm). The total number of animals was estimated at 8, or 1
animal/50 k m ^ .
Census 3 . The third census survey was conducted during 18-22
March 1979. During this census period, the 5 survey teams recorded 12
sets (Fig. 6) of recent rhino tracks (Table 5). Track observation 26
was considered as made by a unique animal based on the distance among
track observations. The track width measurements of the remaining track
observations were not all from the same distribution (K-W ÂNOVA,
P<0,01), Significant differences were found among observations 16, 17,
18, 19, 21, 23, and 25, but no significant difference was found among
observations 19, 20, and 22 or among observations 24, 25, and 27 (Table
6). Thus, the tracks of at least 8 sub-adult or adult rhinos (median
track width = 18.0, 18,0, 18.4, 19.3, 19.4, 19.8, 20.4, 21,8 cm) were
recorded on the study area during this census period. By increasing the
minimum count by 25%, the total number of rhinos was estimated at 10, or
1 animal/40 km^.
Census j4. The last rhino census was conducted during 10-13
September 1980, The 5 survey teams recorded 12 sets of fresh tracks on
the study area during the census (Fig, 7) (Table 7), Track observations
28 and 38 were made by different animals, based on the distance between
track locations. The track width measurements of the remainder of the
observations did not all come from the same distribution (K-W ANOVA,
Reproduced with permission of the copyright owner. Further reproduction prohibited without permission.

Page 64
K e m o p a n R.
G. Berembanémoi R.
S e g a m o t R. 2725
* T e n a n 20 (22 J a s i n R.
J u o s e h R. 23
K e m i d a k R Se
bi G.B e k o kS e l a i
K e m i d a k
CENSUS STUDY AREA
16~27 T r a c k L o c a t i o n s
—— —. S t a t e B o r d e r
• T o w n o r V i l l a g e
R o a d
M o u n t o i n
5 k m
S e a l e
Fig. 6. Locations of Sumatran rhino track observations recorded on the census study area during Census III which was conducted from 18 to 22 March 1979.
Reproduced with permission of the copyright owner. Further reproduction prohibited without permission.
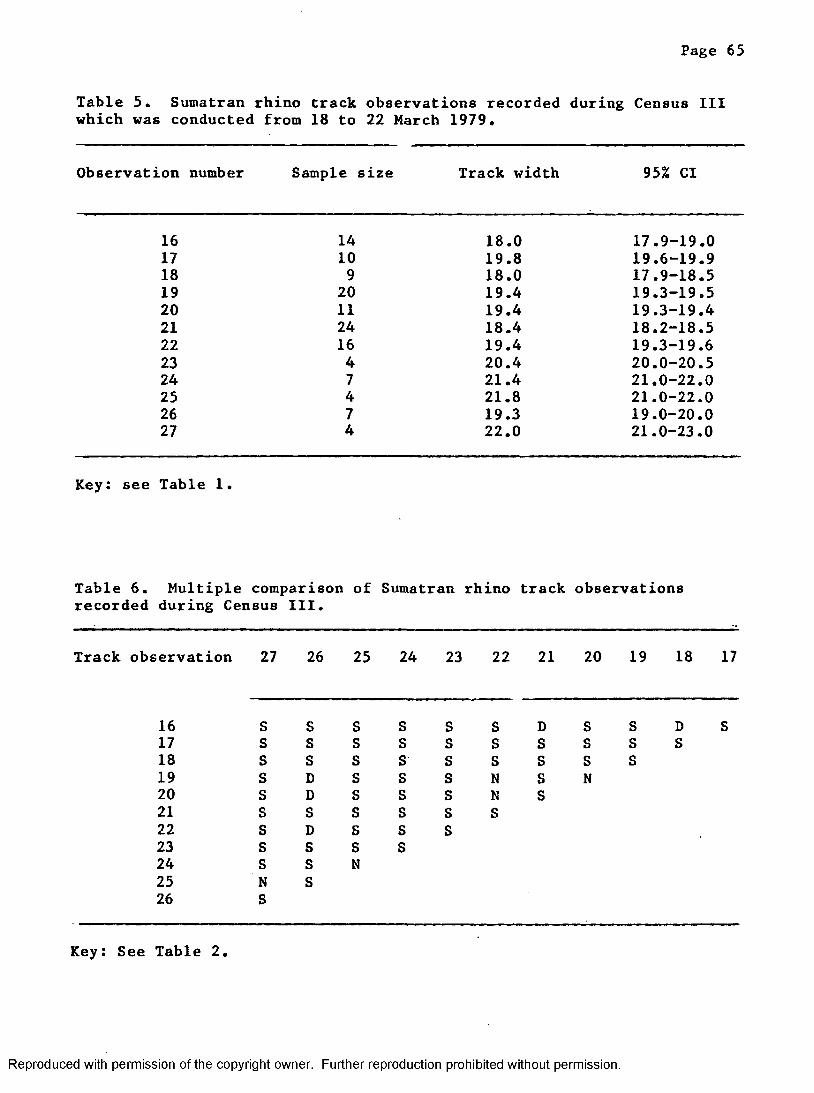
Page 65
Table 5. Sumatran rhino track observations recorded during Census IIIwhich was conducted from 18 to 22 March 1979.
Observation number Sample size Track width 95% Cl
16 14 18.0 17.9-19.017 10 19.8 19.6-19.918 9 18.0 17.9-18.519 20 19.4 19.3-19.520 11 19.4 19.3-19.421 24 18.4 18.2-18.522 16 19.4 19.3-19.623 4 20.4 20.0-20.524 7 21.4 21.0-22.025 4 21.8 21.0-22.026 7 19.3 19.0-20.027 4 22.0 21.0-23.0
Key: see Table 1.
Table 6. Multiple comparison of Sumatran rhino track observationsrecorded during Census III.
Track observation 27 26 25 24 23 22 21 20 19 18 17
16 S S S S B S D S S D S17 S S S S S S S S S S18 S S S S S S S S S19 S D S S S N S N20 S D S S S N S21 S S S S s s22 S D S S S23 S S S S24 S S N25 N S26 S
Key; See Table 2
Reproduced with permission of the copyright owner. Further reproduction prohibited without permission.

Page 66
K e m a p a n R.
G . B e r e m b a n
e m a i R.
S e g a m o t R,
. B e s o r
% T e n a n g 35J u o s e h R. 36
28 K e m i d a k R.
bi G . B e k o k[» S e l a i
e m i d o k
C EN SUS STUDY AREA
28~38 Track L o c a t i o n s— — S t a t e B o r d e r
# T o w n o r V i l l a g e
R o o d
M o u n t a i n
5 k m
S c a l e
Fig. 7. Locations of Sumatran rhino track observations recorded on the census study area during Census IV which was conducted from 10 to 13 September 1980.
Reproduced with permission of the copyright owner. Further reproduction prohibited without permission.

Page 67
Table 7. Sumatran rhino track observations recorded during Census IVwhich was conducted from 10 to 13 September 1980.
Observation number Sample size Track width 95% Cl
28 16 19.5 19.0-20.029 6 19.1 19.0-19.530 13 19.4 19.3-19.531 8 18.6 18.5-18.632 15 19.0 18.8-19.033 7 19.9 19.8-20.034 9 20.0 19.8-20.335 4 19.0 18.9-19.136 10 19.5 19.4-19.537 10 18.2 18.0-18.538 2 19.5 19.4-19.539 6 18.2 18.0-18.9
Key: See Table 1.
Table 8. Multiple comparison of Sumatran rhino track observationsrecorded during Census IV.
Track observation 39 38 37 36 35 34 33 32 31 30 29
28 S D S D N S S S S D N29 S D S S D S S D S D30 S D S D S S S S S31 D S D S S S S S32 S S S S N S S33 S S S S S N34 S S S S S35 S S S S36 S D S37 N S38 S
Key: See Table 2,
Reproduced with permission of the copyright owner. Further reproduction prohibited without permission.

Page 68
P<0.001). Significant differences were found among observations 30, 31,
34, 38, and 39 (Table 8). No significant differences were found between
track pairs 28 and 29; 33 and 34; or 37 and 39. Thus, the tracks of at
least 8 sub-adult or adult rhinos (median track widths = 18.2, 18.6,
19.0, 19.4, 19.5, 19.5, 19.5, and 20.0 cm) were recorded. The total
number of animals was estimated at 10, or 1 rhino/40 k m ^ .
Numbers
The number of rhinos occurring within the Endau-Rompin region
was calculated by combining the number of animals estimated to occur in
the high and low density areas. The number of rhinos within the 400km^
high-density census area was estimated at 10, or 1 animal per 40 k m ^ .
Rhino density was much lower outside of the census area, about half. I
conservatively estimated rhino density within the 1200 km^ of
low-density habitat at 1 animal per 80-120 k m ^ . By multiplying the
amount of available habitat (1200 km^) by the estimated average density
(1 animal per 80-120 km^), the number of rhinos within the low-density
area was estimated at 10 to 15. Combining these estimates yielded a
total number of 20 to 25 rhinos occurring in the Endau-Rompin region.
Population Characteristics
During 1975-1981, the tracks of 3 young rhinos were recorded
in the region for an annual total recruitment rate of 0.5 young per
year. In September 1975, the tracks of a cow/calf pair were first
observed in the upper Selai area. The tracks of this pair were
encountered in the Selai-Endau area during the next 2.5 years. The
Reproduced with permission of the copyright owner. Further reproduction prohibited without permission.

Page 69
March 1977 census survey recorded the tracks of this pair and a second
cow/calf pair in the upper Juaseh-Kemidak area. Beginning in February
1981, villagers reported a cow/calf pair in the upper Juaseh-Kemidak
watershed. The presence of this pair was confirmed by track
observations in March and June 1981.
All other track observations were of independent sub-adults or
adults. Insufficient information existed to further separate animals
into age classes based on track size. I suspected that the range in
track size of adults was quite large. Track width measurements of known
adult females varied from 19.5 to 21,0 cm, I found no evidence of
sexual differences in track size; an adult female had one of the largest
track widths (median “ 21.0 cm).
One rhino death was recorded during this study. In September
1976, the skeleton of a rhino was found in the upper Selai watershed in
a wallow. Apparently, this animal had died while near or in the wallow
of undetermined causes. Skull wear patterns on the teeth indicated that
this animal was quite old. No other deaths were recorded, but evidence
of mortality was difficult to find.
DISCUSSION
Track Characteristics
I found that the locations and sizes of tracks were useful in
documenting Sumatran rhino distribution and estimating numbers. These
Reproduced with permission of the copyright owner. Further reproduction prohibited without permission.
Page 70
animals have toenails that make clear impressions in the soil and the
maximum width between the lateral toes of these tracks can be measured
accurately. This measurement is useful in distinguishing individual
animals. Only hindfoot tracks can be easily measured because these
rhinos usually place their hindfoot on top of the forefoot print.
Measurements from several tracks of a series were required for the use
of statistical procedures in the data analysis.
Many of the frequency distributions of a set of track-width
measurements appeared skewed even though statistical tests failed to
detect any departures from normality. Sumatran rhinos have considerable
flexibility in the movement of their toes. While ascending steep
terrain, they tend to pull their toenails inward for a better grip on
the hillside. Likewise, they spread their toes in a braking motion
while decending. Tracks made in soft soil tend to be expanded, usually
2 to 5 mm. A large sample of track measurements provides a better
estimate of location in a data set. Track measurement distributions of
rhinos walking on firm soil in flat terrain with sample sizes greater
than 10 were approximately normally distributed. Often this set of
conditions cannot be met, and I concluded that nonparametric statistical
procedures were appropriate for analyzing track data. The
Kruskal-Wallis ANOVA in combination with simultaneous confidence
intervals for the difference between medians was found to be a useful
procedure for analyzing the data collected from census surveys.
Several problems were encountered with the census procedures
developed for this study. The method required that several people with
Reproduced with permission of the copyright owner. Further reproduction prohibited without permission.
Page 71
experience in measuring rhino tracks were availble to lead the survey
teams. Some of the data collected by inexperienced groups were
difficult to interpert because of small sample sizes, confusion in
species identification, or a mixture of measurements from fore and hind
foot prints. Travel through the forest was often difficult, and groups
often made slow progress or covered their routes inadequately. Weather
conditions have a major effect on the ability to detect tracks because
heavy rainfall completely washes out tracks. The census periods must
occur during a relatively dry period, preferably during January to
March. The small range in adult track size (5 cm) limits the number of
individuals that can be identified based only on track-width
measurements. If the adult rhino population exceeds about 10
individuals, the utility of the census method declines and alternative
methods will need to be developed.
Distribution
Sumatran rhinos were once found throughout southern Peninsular
Malaysia, although little historical information is available. During
recent years, their distribution within the region has been greatly
reduced by poaching and habitat destruction. Stevens (1968) reported
that rhinos were found in the Endau-Rompin, Gunung Belumut, and Mersing
Coast areas. A recent survey of the country (Flynn and Abdullah, 1983)
confirmed the presence of rhinos in only the Endau-Rompin and Gunung
Belumut areas, but the Mersing area was not searched.
My general survey of the Endau-Rompin region has documented
that rhinos presently use about 1600 km^ of primary forest habitat.
Reproduced with permission of the copyright owner. Further reproduction prohibited without permission.
Page 72
Since 1967, rhinos have disappeared from several areas. I found no
evidence of rhinos along the lower Emas and Semberong rivers where
Stevens (1968) proposed the creation of a rhino sanctuary. Also, rhinos
were no longer reported from the Tersap and Tanah Abang areas along the
lower Endau River. Land-use patterns and human disturbance appeared to
restrict rhino distribution. Rhino sign was found most frequently in
areas of low human use. Along the western boundary, rhino sign was
seldom observed in places where villagers collect jungle products. A
reduction in rhino distribution in the Pukin-Jekatih area was observed.
As the forest was logged or clear-felled, the rhinos retreated farther
into the primary forest. During a 1980 survey of the Jemai and Pukin
watersheds, rhino sign was not found even though logging activity had
stopped over 2 years ago.
Numbers
The Endau-Rompin region contains the largest contiguous
Sumatran rhino population remaining in Malaysia. Based on the results
of the survey and census work, 1 estimate that 20-25 animals occur
there. The Taman Negara (8-12) and the Sungai Dusun (4-6) areas contain
the next largest rhino populations remaining in the country (Flynn and
Abdullah, 1983). Rhino density in the Endau-Rompin region was quite
variable, depending on the section. The census study area contained the
highest density of animals, about 1 animal per 40 k m ^ . In areas to the
north and east, rhino sign was observed less frequently. The
differences in density probably reflect habitat preference and the
amount of human disturbance. The census study area contains mostly hill
Reproduced with permission of the copyright owner. Further reproduction prohibited without permission.
Page 73
forest above 300 m (Flynn, in prep.). The northern and eastern sections
contain mostly lowland forest; much of this area has been subjected to
high levels of human disturbance.
World wide, only the Gunung Leuser Reserve in northern Sumatra
contains a larger number of Sumatran rhinos. Borner (1978) estimated
that 20 to 40 rhinos occur in this vast mountainous region. After
Endau-Rompin, the Silabukan area in Sabah, East Malaysia, probably
contains the next largest group (8-10) of rhinos (Flynn, 1981).
Insufficient data exist to accurately estimate the number of Sumatran
rhinos remaining in the world, however present evidence (Van Strien,
1974; McNeely and Laurie, 1977; Borner, 1978; Schenkel and Schenkel,
1979; Payne, 1980; Van Strien, pers. comm.; Flynn, 1981; Flynn and
Abdullah, 1983) suggests that the total number is less than 300. Thus,
the Endau-Rompin region contains a significant proportion (5-10%) of the
total individuals of this species.
Population Trends
The observation of cow/calf pairs in 1975, 1977, and 1981
indicated that reproduction was still occurring in the Endau-Rompin
rhino population. The tracks of cow/calf pairs were observed only in
the census study area, particularly within the Selai, Endau, Juaseh, and
Kemidak watersheds. The average annual recruitment rate for the entire
population was calculated at 0.5 young per year. This extremely low
recruitment rate is probably insufficient to sustain a population.
In general, tracks of young rhinos have seldom been reported.
Hubback (1939) found tracks of young animals only 3 times during many
Reproduced with permission of the copyright owner. Further reproduction prohibited without permission.

Page 74
years of tracking rhinos. The Sungai Dusun Wildlife Reserve was the
only other area in Peninsular Malaysia where tracks of young animals
were reported during the study period (Flynn and Abdullah, 1983).
Borner (1978) reported finding the tracks of 5 different cow/calf pairs
in the Gunung Leuser Reserve from 1972 to 1975 for an average annual
recruitment rate of 1.6 young per year. The reproductive rate in the
Gunung Leuser area is substantially higher than Endau-Rompin.
Apparently, the higher reproductive rate in the Gunung Leuser area is
reflective of the higher population numbers.
Only limited information was collected on rhino mortality. At
least 1 animal died during the study period, but the cause of death was
unconfirmed. No positive evidence of poaching was found, but
information on poachers was difficult to obtain. In 1976, I found
serveral foot-snares set for rhinos along the middle Endau River near
the mouth of the Kemapan River. These snares were probably set by
villagers living along the lower Endau River. The field surveys
functioned as an effective patrol program and discouraged poaching
activity. At each village visited, I emphasized that rhino hunting was
illegal and entry into the rhino area was restricted.
Conservation
The Endau-Rompin region has the most potential for maintaining
a viable population of Sumatran rhinos in Malaysia, and conservation
efforts for the species should be concentrated there. My work has shown
that Endau-Rompin contains the largest, and possibly the only
reproductively viable, population of rhinos remaining in the country. A
Reproduced with permission of the copyright owner. Further reproduction prohibited without permission.
Page 75
large proportion of the region has been proposed for national park
status which would protect the habitat from exploitation. Recent
research has found numerous food plants available in the habitat (Flynn,
in prep.) .
A sound conservation program must contain short and long-term
strategies. In the short-term, all remaining animals must be protected
from poaching and their habitat protected. Habitat protection should be
a primary priority of a conservation program. Unless a large tract of
contiguous primary forest habitat is maintained, the survival of a
viable rhino population is doubtful. The proposed Endau-Rompin National
Park Management Plan (Flynn, 1980) recommends that 870 km^ of the region
be established as a national park. Within the park area, high-use rhino
areas would be zoned to reduce the impact of human visitation.
According to this plan, the proposed park would contain about 65% of the
presently occupied rhino habitat. The balance of the rhino area,
including most of the high-value commercial timber, has already been
committed to timber concessions. Also, this plan recommends that a
forested buffer zone, 15 to 20 km wide, be maintained around the Park to
reduce the impact of agricultural development and human disturbance.
The buffer zone would be managed by the Department of Forestry, in
consultation with the DWNP, for sustained-yield timber production.
The exploitation of lands outside of the park area will
conflict with rhino conservation. These lands will be logged or cleared
for agricultural development. In the west, all lands containing primary
forest within the state of Johor should be included within the proposed
Reproduced with permission of the copyright owner. Further reproduction prohibited without permission.
Page 76
park. The logging of this key rhino area will reduce the amount of
habitat and greatly increase the impact of human disturbance. Lesong
Timber Products has the timber rights to 500 km^ of rhino habitat in the
northwest portion of the region. This block of forest will be logged
during the next 25 to 35 years. As this logging proceeds, the
disturbance will have a negative impact on several animals. The rhino
population will become fragmented as animals are isolated in patches of
unlogged habitat. By logging the western sections of the concession
area first, the negative impact on the rhinos may be reduced. Important
rhino habitat adjacent to the proposed park boundary in the upper Sekin
and Jekatih watersheds should be logged last. The maintenance of a
system of corridors, composed of unlogged habitat, connecting patches of
primary forest may reduce the fragmentation of the rhino population.
Development of the 200 km^ Selanchar Complex oil palm
plantation in the Pukin River basin will have a major impact on the
rhinos. The early stages of this project by the Federal Land
Development Authority (FELDA) has already destroyed critical rhino
habitat. This plantation intrudes deeply into key rhino habitat along
the Pukin River and threatens to further fragment this population. In
addition, the project will attract an estimated 10,000 settlers or
workers, exposing these rhinos to poaching and human disturbance.
Presently, a hard-surfaced highway is being built along the Pukin River
on land that was used by rhinos in 1977. I strongly recommend that the
last stages (Schemes 7 and 8) of the Selanchar Project remain
uncompleted, and all infrastructural development (town, roads, etc.) be
Reproduced with permission of the copyright owner. Further reproduction prohibited without permission.
Page 77
located at least 15 km from the Endau-Rompin National Park boundary.
All efforts must be made to prevent the killing of rhinos
because population numbers are critically low. Presently, the Sumatran
rhino is classified as a totally protected species under the 'Wildlife
Act of 1972'. Penalties for the killing or possession of totally
protected species are a maximum fine of US$1200 and/or 2 years in jail
(Anonymous, 1972). However, these penalties are inadequate for the
prevention of poaching and should be increased. The high price of rhino
body parts, especially the horn, provides a strong incentive for rhino
poaching. Martin (1979) found the average price of Asiatic rhino horn
in 4 Asian countries to range in price from US$ 3000 to 11,000 per kg.
In order to discourage poaching, the DWNP must regularly patrol the
rhino areas. The ranger patrols should be concentrated along the forest
fringe near the main access points. The construction of guard posts
near the ends of access roads is needed to discourage human entry. A
comprehensive protection program is outlined in the Endau-Rompin
Management Plan (Flynn, 1980).
Presently, the number of rhinos may be below a minimum size
required for maintenance of the population. Even within favorable
habitat, small animal populations can be extinguished because of
stochastic perturbations (Shaffer, 1981). The low recruitment rate
indicates that this population is already near a minimum number
necessary for reproduction. For improved reproductive success, the
number of potential breeding individuals needs to be increased. This
could be accomplished by capturing those animals in areas with extremely
Reproduced with permission of the copyright owner. Further reproduction prohibited without permission.
Page 78
low numbers or insecure habitat, and releasing them in the Endau-Rompin
area. Also, an introduction of new animals into the population would
increase genetic variability, reducing the negative impact of inbreeding
depression (Franklin, 1980). An effective population size of at least
50 individuals has been proposed as the minimum population size
necessary for maintaining short-term fitness in most species (Soule,
1980),
The rhino research program should be continued on a long-term
basis. The census surveys should be conducted at regular intervals
(annually) to monitor population trends. The monitoring of recruitment
rates is probably more important than attempting to estimate total
numbers. The survey work in the northern and eastern sections should be
expanded to better document present rhino distribution. In particular,
the Lesong concession should be closely studied to monitor the impact of
logging on the rhinos. The long-term impact of habitat modification by
logging on rhino habitat-use needs more study. The food and habitat
requirements of this animal should be studied extensively to gather
additional insights into its ecological relationships. Otherwise, this
rare and unique species may disappear before we have learned much about
it.
Reproduced with permission of the copyright owner. Further reproduction prohibited without permission.

Page 79
ACKNOWLEDGMENTS
Financial support for this study was provided by the Malaysian
Department of Wildlife and National Parks, World Wildlife Fund
International, the National Wildlife Federation, and the
Smithsonian-Peace Corps Environmental Program, My special thanks to
Mr, Mohd, Khan bin Momin Khan, Director-General, DWNP, for his continued
support for this project. Other DWNP personnel, especially L. Ratnam,
Research Officer, and ranger Abdullah Ibrahim, contributed much to the
coordination and field logistics of this study. The assistance of
Drs, R, and L, Schenkel, A, Fernhout, and J, Sherbourne in obtaining
additional funding is gratefully acknowledged, MY many thanks to
L. Ratnam, P, Conry, Abdullah Ibrahim, R. Blanchard, Mohd. Ismail, S,
Baltes, M. Monroe, L, England, Sallehuddin Long, and J, Payne for
leading survey teams during the censuses. Many people provided
information on rhino sightings, especially R, Olivier, J, Taylor,
P, Fong, and A, Zabidi, Drs, B, O^Gara, C. Jonkel, and A, Sheldon
provided many useful comments on the manuscript, C, Connor and
B. Bakken drafted the figures, P, Conry typed the tables and edited
parts of the manuscript. My warmest appreciation to Kang Kong bin
Mintol and the other members of Kampung Juaseh for sharing their
intimate knowledge of the Endau-Rompin forests with me.
Reproduced with permission of the copyright owner. Further reproduction prohibited without permission.

Page 80
REFERENCES
Anonymous. (1972). Protection of wildlife act, 1972. Laws ofMalaysia, Act 76. Kuala Lumpur, Government Printing Office.
Borner, M. (1978). A field study of the Sumatranrhinoceros. Ph.D. thesis, Univ. Basel, Switzerland.
Bourliere, M. (1969), The estimation of higher vertebrate numbers in tropical forest environments. An. Acad. Brasil. Cienc., 41(Supp.), 23-28.
Burton, C. (1973). Mesozoic. In The geology of the Malaypeninsula, ed. by D. Corbett and C. Hutchison. New York, John Wiley and Sons.
Campbell, R. (1967). Statistics for biologists. Cambridge, Cambridge Univ. Press.
Dale, W. (1959). The rainfall of Malaya. J. Trop. Geogr., 13,23-37.
. (1963). Surface temperatures in Malaya. J, Trop. Geogr.,17, 52-71.
Ellis, D. (1971). Rhinos in northern Johor, Malaysia. Singapore, The Malayan Nature Society. (Unpublished report).
Flynn, R. (1978). The Sumatran rhinoceros in the Endau-RompinNational Park of Peninsular Malaysia. Malay. Nat,, 4, 5-12.
_. (1980). Endau-Rompin National Park managementplan. Kuala Lumpur, Malaysia, Department of Wildlife and National Parks,
. (1981). Sumatran rhinos in the Silabukan area ofSabah. Kuala Lumpur, World Wildlife Fund. (Unpublished).
. (in prep.). Feeding ecology of the Sumatran rhinocerosin southern Peninsular Malaysia.
. and M. Tajuddin Abdullah. (1983). The distribution andstatus of the Sumatran rhinoceros in Peninsular Malaysia. Biol. Conserv., in press.
Reproduced with permission of the copyright owner. Further reproduction prohibited without permission.
Page 81
Foenander, E. C. (1952). Big game of Malaya. London, Batchworth Press.
__________• (1961), The occurrence of rhinoceros in Pekan District,Pahang. Kuala Lumpur, Department of Wildlife and National Parks. (Unpublished report).
Forest Department. (1977). Forest resources of Peninsular Malaysia. Kuala Lumpur, Department of Forestry.
Franklin, 1. R. (1980). Evolutionary change in small populations. In Conservation biology: An evolutionary-ecological perspective, ed. by M. Soule and B. Wilcox, 135-130. Sunderland, Mass., Sinauer Assoc.
Gibbons, J. (1976), Nonparametric methods for quantitative analysis. New York, Holt, Rinehart, and Winston.
Gobbett, D. and C. Hutchison. (1973). Eds. The geology of the Malay peninsula. New York, John Wiley and Sons.
Groves, C. P. (1967). On the rhinoceros of Southeast Asia. Saugetierk. Mitt., 15, 221-237.
Gyekis, K. (1966). Segamat District. Forest Reconnaissance Survey. For. Res. Inst. Rep. No. 7., Kepong, Selangor.
Hislop, J. (1965). Rhinoceros and Seladang. Malaysia's vanishing species, IÜCN Publ. N. S., 10, 278-283.
Hubback, T. (1939). The Asiatic two-horned rhinoceros. J. Mammal., 20, 1-20.
Lee, P. C. (1966). A forest reconnisance of Rompin District, Pahang. For. Res. Inst. Rep. No. 3., Kepong, Selangor.
Martin, E. B. (1979). The international trade in rhinoceros products. Gland, Switzerland, WWF/IUCN.
McNeely, J. and A, Laurie. (1977). Rhinos in Thailand. Oryx 13, 486-489.
Milton, 0. (1963). Field notes on wildlife conservation in Malaya. Spec. Pub. No. 16, American Committee for International Wildlife Protection.
Nie, J., Hull, J. Jenkins, K. Steinbrenner, andD. Bent. 1975. Statistical package for the social sciences. New York, McGraw-Hill,
Reproduced with permission of the copyright owner. Further reproduction prohibited without permission.
Page 82
Ote, L. 1977. An introduction to statistical methods and data analysis. North Scituate, Mass., Duxbury Press.
Payne, J. (1980), Report on rhinoceros in the Silabukan Forest Reserve, Sabah. Sandakan, Sabah Forest Dep. (Unpublished report).
Poore, M. (1963). Problems in the classification of tropical rain forest. J. Trop. Geogr., 17, 12-19.
Richards, P. (1952). The tropical rain forest. Cambridge, Cambridge Univ. Press.
Schenkel, R. and L. Schenkel-Hulliger, (1969). The Javanrhinoceros in Udjung Kulon Nature Reserve. Its ecology and behavior. Acta Trop. (Basel) 26, 97-135.
. and L. Schenkel (1979). Report from the SBC Asian rhinogroup meeting in Bangkok, Thailand. Gland, Switzerland, lUCN/WWF. (Unpublished report).
Shaffer, M. L. (1981). Minimum population sizes for species conservation. Bioscience 31, 131-134.
Simon, N. ed. (1969). Red data book. Mammalia. Gland, Switzerland, lUCN/WWF.
Smallwood, H. A. (1966), Schematic-reconnaissance soil survey of the Segamat-Gemas-Tangkak region of north Johor. Malay. Soil Survey Rep. Kuala Lumpur, Malaysia, Dep. Agric.
Sokal, R. and F. J, Rohlf. 1969. Biometry. San Fransico,W. H. Freeman and Co.
Soule, M. E, (1980). Thresholds for survival: maintaining fitness and evolutionary potential. In Conservation biology: An evolutionary-ecological perspective, ed. by M. Soule and B. Wilcox, 151-170. Sunderland, Mass., Sinauer Assoc.
Stevens, W. E. (1968). The conservation of wildlife in WestMalaysia. Kuala Lumpur, Malaysia, Department of Wildlife and National Parks.
Strickland, D. (1967). Ecology of the rhinoceros in Malaya. Malay. Nat. J., 20, 1-17.
Talbot, L. (1960). A look at threatened species. Oryx 5, 153-293.
Reproduced with permission of the copyright owner. Further reproduction prohibited without permission.
Page 83
Van Strien, N. (1974), The Sumatran or two-horned Asiatic rhinoceros. A study of theliterature. Meded. Landbouwhogeschool Wageningen, 74-16.
. (1979). On the difference in the footprints of the Javanand Sumatran rhinoceros. Tiger Paper, 7, 16-19
Whitmore, T. C. (1975). Tropical rain forests of the Far East. Oxford, Claredon Press.
Wyatt-Smith, J. (1964). A preliminary vegetation map of Malayawith descriptions of the vegetation types. J. Trop. Geogr., 18, 200-213.
Reproduced with permission of the copyright owner. Further reproduction prohibited without permission.

Page 84
CHAPTER IV
FEEDING ECOLOGY OF THE SUMATRAN RHINOCEROS
IN SOUTHERN PENINSULAR MALAYSIA
Reproduced with permission of the copyright owner. Further reproduction prohibited without permission.

Page 85
ABSTRACT
Feeding ecology of the Sumatran rhinoceros in the Endau-Rompin
region, southern Peninsular Malaysia, was studied during 1979 through
1981 to provide information on foods eaten and habitats selected.
Feeding sites were located by following recent rhino tracks. Within
primary hill forest, Sumatran rhinos selected feeding sites in stream
bottom (59%) and lower slope (34%) physiographic types. Small forest
gaps (35%) were used more than their availability (15%), but most of the
feeding cases were in closed-canopy forest (63%). Sumatran rhinos were
mostly browsers, feeding primarily on the mature leaves of woody
understory plants. Large, fleshy fruits were eaten occassionally. The
diet was diverse with 49 plant families, 102 genera, and between 156 to
181 species represented in 342 feeding cases. Prunus sp. (15.1%), Ficus
sp. (6.4%), Medusanthera sp. (3.8%), and Eugenia sp. (3.0%) contributed
the greatest amounts to diet proportions based on total bites (11,818).
Chemical analyses of plant materials, collected from certain food plants
and randomly selected non-food plants, indicated that Sumatran rhinos
selected plants and plant parts that were high in mineral and crude
protein content but low in fiber. Phenolics and tannins were tolerated
in the diet, but principal food plants contained less condensed tannin.
Rhino feeding behavior was influenced by forage quality, the
availability of foods and habitat attributes, and feeding adaptations.
Reproduced with permission of the copyright owner. Further reproduction prohibited without permission.

Page 86
INTRODUCTION
The Sumatran or two-horned Asiatic rhinoceros (Dicerorhinus
sumatrensifi Fisher 1814) is the only extant rhinoceros living entirely
in primary tropical rain forest habitats. The feeding ecology and
habitat relationships of this unique species, along with most other
large terrestrial herbivores in tropical rain forest habitats, are
poorly understood. Rare secretive animals, complex plant communities,
and difficult working conditions have discourged most field researchers.
In tropical Asia, conservation and management programs have suffered
from the lack of basic information on the ecological relationships
between wildlife and habitat (Stevens, 1968; Lee, 1980). As many of the
large mammals slip toward extinction (Simon, 1969), the impacts of
habitat modification and destruction on wildlife need evaluation.
In 1974, the Malaysian Department of Wildlife and National
Parks (DWNP) initiated a long-term study on the status and ecology of
the Sumatran rhinoceros in Peninsular Malaysia (Flynn, 1978). Early
investigations determined that the Endau-Rompin area, located in
southern Peninsular Malaysia, contained the largest population of
Sumatran rhinos remaining in the country, about 20 to 25 individuals
(Flynn and Abdullah, 1983a). In this paper, I present an analysis of
feeding ecology and habitat selection by the Sumatran rhino in the
Endau-Rompin region. The study's objectives are as follows: 1) to
determine the kinds and relative amounts of foods eaten; 2) to describe
the habitats selected for feeding; 3) to compare the use of foods and
Reproduced with permission of the copyright owner. Further reproduction prohibited without permission.
Page 87
habitats with their availability within the study area; and 4} to
investigate the relationships between plant chemistry and food
selection.
The Sumatran rhino is the smallest and most primitive
rhinoceros (Groves and Kurt, 1972). Adults probably weigh up to 1000 kg
with shoulder heights to 1.45 m. Both sexes have a short nasal horn and
an inconspicuous frontal horn. Sometimes the body is covered by hair,
largely disappearing with age. The skin folds are striking features,
one encircling the trunk just behind the fore-legs and another on the
belly and flanks, but not on the back, just before the hind-legs. The
pair of upper incisors have large flattened crowns, and the enlarged
pair of lower canines have been modified into sharp forward pointing
tusks (Groves, 1967). The pre-molars and molars are similar and
relatively low crowned with tranverse ridges of enamel, indicating a
non-specialized browsing habit. Once found across Southeast Asia, this
rare forest-dwelling rhino is now restricted to small isolated
populations in Burma, Thailand, the Malay Peninsula, Sumatra, and Borneo
(Van Strien, 1974; McNeely and Laurie, 1977; Borner, 1978; Andau and
Payne, 1982; Flynn and Abdullah, 1983b). Historic hunting of rhinos for
the believed medicinal values of their body parts has greatly depleted
numbers (Van Strien, 1974; Martin, 1979); extensive habitat destruction
by logging and forest clearance for agricultural development has reduced
the amount of suitable habitat and isolated already small populations
(Flynn and Abdullah, 1983b).
The rhinoceroses (Perissodactyla: Rhinocerotidae) are of
Reproduced with permission of the copyright owner. Further reproduction prohibited without permission.
Page 88
special interest in the study of feeding ecology because of their
colonic/cecal digestive system (Foose, 1982), Recently, the relative
advantages and adaptations of the ruminant and nonruminant digestive
systems have received some investigation (Janis, 1976; Parra,
1978; Foose, 1982; Van Soest, 1982). The ruminant system appears
adapted to maximize the extraction of energy and protein per unit of
vegetation consumed, but the reticulo-omasal orifice retards the passage
of fibrous particles through the gut (Van Soest, 1982). In the hindgut
or nonruminant digester, the site of microbial fermentation is located
after the normal sites of mammalian digestion and absorption in the
stomach and small intestine (Janis, 1976; Parra, 1978; Foose, 1982).
Most soluble carbohydrates and proteins are digested prececally by
enzymatic action, but fibrous materials are fermented by microbial
activity in an enlarged colon and/or prominent cecum (Parra, 1978).
Nonruminants appear to maximize the extraction of nutrients per unit
time by faster passage rates and larger intakes of forage; they minimize
nutrient requirements per unit weight by enlargement of their body sizes
(Janis, 1976; Foose, 1982).
A herbivorous life-style presents many problems for an animal.
Plants are not just food for animals; they have evolved protective
systems to ensure their own continued existence and survival (see
Rosenthal and Janzen 1979). Plant protective systems include physical
and chemical structures that resist attacks by leaf predators. Physical
protective strategies commonly include thorns, hairs, or other physical
modifications of the leaves or stems, enlarged height and size of stems.
Reproduced with permission of the copyright owner. Further reproduction prohibited without permission.
Page 89
and unpredictability in time and/or space. The plant chemical world is
vast and complex, often poorly understood (Janzen 1978). Herbivores
extract plant chemicals for nutrients by digestive processes, but often
vegetation is a poor food packet. Nutrients may have positive or
negative value to the herbivore after ingestion (Freeland and Janzen,
1974; Westoby, 1974), Proteins, soluble carbohydrates, and most
minerals are common positive nutrients required by an animal for growth,
maintainence, and reproduction. In addition, plants synthesize a vast
array of secondary metablolites that have negative impacts on
herbivores. Secondary plant compounds can be grouped as
digestion-reducing compounds or plant toxins (Rhoades and Cates 1976),
Digestion-reducing compounds often have a quantitative
(dosage-dependent) effect because they complex with proteins and animal
enzymes, interfer with animal metabolism, or inhibit gut microfloras
(Freeland and Janzen, 1974; Feeny, 1976; Rhoades and Cates,
1976; Bryant, 1981; Becker, 1982). Phenolic compounds, such as phenolic
acids, flavonoids, and tannins, are included in this group (Levin,
1971; McKey et al., 1978). Plant structural carbohydrates, such as
cellulose and lignin, are undigestible by mammalian enzymatic action.
Cellulose can be degraded by microbial fermentation; lignin is totally
undigestible and limits the availability of cell wall carbohydrates to
digesting microbes (Van Soest, 1982). Plant toxins include a wide range
of plant chemicals that act as poisons. These chemicals are generally
active in small quantities and extremely toxic once they enter the
herbivore's body (Freeland and Janzen, 1974; Rhoades and Cates, 1976).
Reproduced with permission of the copyright owner. Further reproduction prohibited without permission.
Page 90
Alkaloids and saponins are characteristic of this group (Levin and York,
1978; Rosenthal and Janzen, 1979).
Before this study, little quantitative information on the
foods and habitats selected by this unique species was available.
Previous papers have contained only lists of plants recorded as eaten or
observations of habitats used (Van Strien, 1974). In Malaysia, Hubback
(1939) recorded 44 plant taxa as rhino food plants; most of the
information was collected while he hunted them in the hill forests of
central Pahang. Additional plant taxa were provided by Strickland
(1967) from a 1-year study conducted in the west-coastal lowland forests
of Sungei Dusun Wildlife Reserve. Borner (1978) and N. Van Strien
(pers. comm.) have compiled extensive lists of plants eaten by Sumatran
rhinos in the mountainous rain forests of Gunung Leuser Reserve,
northern Sumatra. Only limited information from incidental observations
has been available from the monsoonal forests of Thailand and Burma
(Evans, 1905; Thom, 1935; Talbot, 1960).
STUDY AREA
Investigations were conducted at the Selai River study site in
the Endau-Rompin region, a proposed national park of over 870 km^
located in southern Peninsular Malaysia (2° 30' N, 103° 15' E). I
defined the study area as the portion of the upper Selai River watershed
lying west of 103° 12' E longitude, an area of about 40 km^ (Fig. 1).
Reproduced with permission of the copyright owner. Further reproduction prohibited without permission.
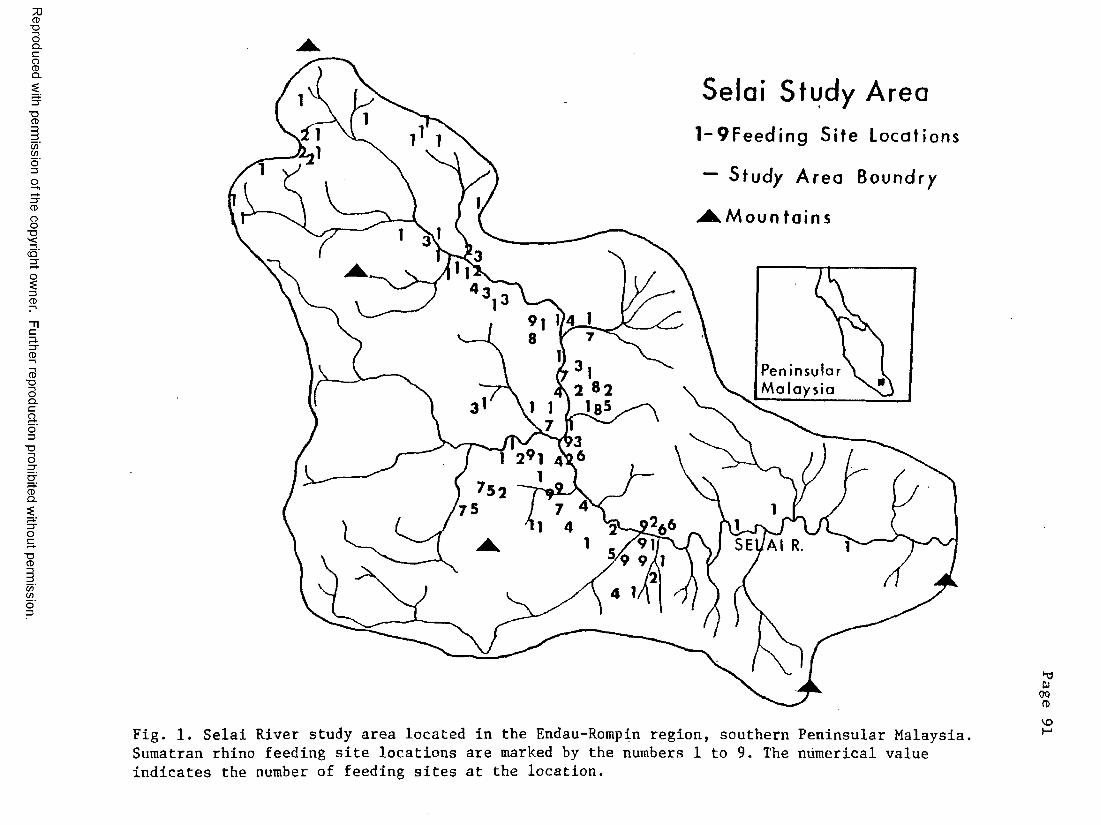
CD■ DOQ.C
gQ.
■ DCD
C/)
o '3
8
CD
3.3"CD
CD-oOQ.Cao3" Oo
CDa.
T3CD
00C/)
Selai Study Areal -9 F e e d in g Site Locations
“ Study Area Boundry
J k Moun tain s
Peninsular \Ma laysia \ j * \
Fig. 1. Selai River study area located in the Endau-Rompin region, southern Peninsular Malaysia. Sumatran rhino feeding site locations are marked by the numbers 1 to 9. The numerical value indicates the number of feeding sites at the location.
01oon>V O
Page 92
The only access to this remote site was by foot travel along a forest
path from the end of the nearest road, 10 km west of the research camp.
The topography of the study area is generally hilly, locally
quite steep, and dominated by a north-south trending mountain range*
Within the study area, the upper Selai watershed forms a distinct high
basin on the east side of the main mountain range. Adjacent to the
eastern boundary of the study area, the Selai River drops abrubtly 300 m
over the next 1.6 km. Elevations vary from 350 m along the stream to
900 m at the highest point. The mountains are composed of
undifferentiated granitic rocks of Triassic age; Permian volcanic rocks
of andesitic and rhyolitic composition occur in the eastern section
(Gobbett and Hutchison, 1973). The soils are quite variable depending
on the underlying parent material, but they are generally of poor
quality (Smallwood, 1966). Red and yellow latosols and podzolic soils
derived from acid igneous rocks cover most of the area. Latosals and
podzolic soils derived from sedimentary rocks are found farther to the
e a s t .
The climate is characteristic of the moist tropics, uniformly
warm and humid throughout the year. Although accurate weather
information was not available for the study site, seasonal variation in
temperature and rainfall was slight. At a nearby lowland site
(Segamat), the mean daily temperature was 27° C, with the diurnal range
greater than the seasonal range (Dale, 1963). The mean temperature at
the Selai base camp, elevation 470 m, was 24° C. Typically, the
relative humidity was near 100% in the forest understory. Rainfall was
Reproduced with permission of the copyright owner. Further reproduction prohibited without permission.

Page 93
abundant throughout the year, except for a slight decrease during the
January-to-May intermonsoonal period. Annual mean rainfall was
extrapolated to be near 2800 mm, based on records from nearby lowland
stations at the interior town of Segamat (2000 mm) and the coastal town
of Mersing (3300 mm) (Dale, 1959).
The natural vegetation of the study area is tropical evergreen
rain forest of the Indo-Malayan formation (Richards, 1952; Whitmore,
1975). These forests are the world's most luxuriant and species-rich;
an estimated 4100 species of woody plants occur in Peninsular Malaysia
(Whitmore, 1972; 1975). In general, these forests are characterized by
numerous large, evergreen, broad-leafed trees with a predominance of
individuals from the family Dipterocarpaceae. Forest structure is
characterized by a few large emergent trees, a nearly closed canopy at
about 25 m, and an understory consisting of numerous seedlings and
juveniles of large trees, shrubs, palms, climbers, and herbaceous
plants. Successional dynamics of tropical rain forests are
characterized by the death and collapse of large forest trees, creating
small gaps in the canopy (Whitmore, 1975). These gaps are filled by
juvenile trees growing in the understory or by invading species. As
these understory trees grow to maturity, the gap is closed and the
rebuilding forest returns to the mature, closed-canopy phase. Many
problems exist in the classification of tropical rain forest communities
(Poore, 1963), but several general forest types are recognized
(Wyatt-Smith, 1964; Forest Department, 1977). Most of the study area is
covered with mixed hill dipterocarp forest. According to Gyekis (1966),
Reproduced with permission of the copyright owner. Further reproduction prohibited without permission.

Page 94
the western portion consists of meranti-keruing mixed hill forest with
seraya-keruing hill forest on the ridges and well-drained upper sites.
In addition to the Sumatran rhinoceros, the large mammal fauna
of the Endau-Rompin region includes elephant (Elephas maximus). Malayan
tapir (Tapirua indiens), gaur (Boa garus). bearded pig (Bus barbatus).
common pig (Bus scrofa) , mouse deer (Trangulus n a p u . T, Javanicus) .
barking deer (Muntiacus munt4ak) , sambur deer (Cervus unicolor) , common
leopard (Panthera pardus). and tiger (Panthera tigris).
METHODS AND MATERIALS
Feeding Behavior
A system of foot paths was cut through the forest understory
in the study area, and 2 base camps were built at points located 12 and
20 km from the end of the nearest road. I searched the study area for
rhino tracks along the trail system from the base camps using skilled
animal trackers hired from the nearby village of Kampung Juaseh.
Additional field staff were provided by the Malayan Department of
Wildlife and National Parks (DWNP). Once a set of recent tracks had
been located, the rhino's trail was followed and all evidence of feeding
activity was recorded. Each individual plant that had been eaten by a
rhino was treated as a case of feeding, or a feeding site. Rhino
feeding behavior was studied by recording evidence of their feeding
activities left at feeding sites. Method of feeding was described in
Reproduced with permission of the copyright owner. Further reproduction prohibited without permission.

Page 95
terms of pushing or breaking the plant's main stem. The amount of plant
material eaten from each plant was estimated using a bite-count method
similar to Peek et al. (1976). A standard rhino bite consisted of a 10
cm length of leaf or stem material. The number of bites removed from a
plant was estimated by carefully examining branches of the plant that
had not been eaten. The total number of bites available at a plant was
calculated by adding the number of bites remaining on a plant to the
number of bites estimated to have been consumed. The mean weight of a
standard bite was calculated by measuring the weight of 100 bites of
individual leaves from 10 species of trees and 50 bites of stem from 5
different trees. The mean weight of leaf material was found to be 2.4 g
and stem 1.4 g.
The distance between feeding sites was measured by recording
the number of steps taken between them with a hand counter. I estimated
my average step length at 1 m and converted the number of steps to
linear distance.
Food Plant Characteristics
A leaf sample was collected from each plant recorded as eaten
by a rhino at a feeding site for later identification. Also, the local
common name was noted for each plant. The leaf samples were pressed
over night, then sealed in a plastic bag with ethanol (Womersley, 1969)
until delivered to the the Forest Research Institute (FRI), Department
of Forestry, Kepong, Malaysia, for identification. Mr. K. M. Kochummen
and Dr. F. S. P. Ng kindly arranged for the identifications of all the
plant materials. The plant life form - woody sapling, climber, palm, or
Reproduced with permission of the copyright owner. Further reproduction prohibited without permission.
Page 96
herbaceous plant - was recorded for each plant. Also, each stem was
examined for the presence of thorns or other physical defense structures
and measured for diameter at breast height (DBH) and total height.
The ecological characteristics of rhino food plants were
investigated by reviewing the available literature, primarily Van
Steenis (1953), Whitmore (1972), Wyatt-Smith and Kochummen (1979), and
K. Kochummen (pers. comm.). Plant taxa were evaluated in terms of their
typical canopy position, forest type, successional stage, and timber
potential.
Habitat Characteristics
Habitat attributes were measured at each feeding site to
obtain quantitative information on the habitat characteristics selected
for feeding. The habitat was evaluated in terms of physiographic type,
elevation, slope, successional stage, and canopy cover. At each feeding
site, the plant that had been eaten by a rhino established the center
point for a circular plot with a diameter of 20 m. The map grid
location and elevation were determined from topographic maps available
from the Malaysian Government Printing Office. Based on topographic and
slope characteristics, the site was placed into 1 of 4 physiographic
types, as follows: 1) stream bottom - level land along the stream's
flood plain; 2) lower slope - gently sloping land adjacent to the flood
plain; 3) upper slope - steeply sloping land above the lower slope
type; and 4) ridge - gently sloping land along the to^of the ridges. A
measure of slope was obtained by ocular estimate and expressed as a
percent. Successional stage of the forest at a feeding site was
Reproduced with permission of the copyright owner. Further reproduction prohibited without permission.
Page 97
categorized as either closed canopy (mature forest), new gap, old gap,
or open riverine (disturbed). In the new gap phase, a large forest tree
had recently fallen, creating an opening in the forest canopy. In
contrast, the old gap phase had a new generation of seedlings growing in
the opening. Open areas along the major streams were classified as open
riverine. Canopy cover was measured by taking 20 sightings at 1 m
intervals directly above the plot through an ocular tube and recording
the presence or absence of canopy at each sighting (James and Shugart,
1970). Canopy cover was expressed as the percentage of the sightings
with canopy present. The general forest type was determined by the
presence of indicator species nearby.
Habitat Availability
Transects. Information on the vegetative characteristics of
the study area was gathered from 14 transects. The 4 physiographic
types were delinated on a topographic map, and the starting points for 4
transects were randomly placed in each type, except ridge (2 transects).
Each transect, laid out along a compass bearing parallel to the longest
axis of the habitat patch, was 400 m long and divided into 20 points at
20 m intervals. Each point along the transect line was treated as a
potential feeding site and described in the same manner. Information
was recorded on canopy cover, successional stage, and slope.
Woody saplings within the rhino food plant size class (stem
DBH between 0.8 and 3.2 cm) were enumerated along each transect using
the point-center quarter method (Mueller-Dumbois and Ellenberg, 1974).
At each point, the plot was divided into 4 quarters by a line
Reproduced with permission of the copyright owner. Further reproduction prohibited without permission.

Page 98
perpendicular to the transect line. The distance to the nearest woody
sapling between 0.8 and 3.2 cm DBH was recorded for each quarter. The
local name was noted for each sapling. The amount of leaf material in
the forest understory was determined by estimating the total number of
bites of leaf available at each sapling. In addition, phenology of the
woody saplings was determined by recording the number of bites of young
and mature leaves present on each plant.
Random points. Certain habitat attributes were more easily
measured by placing random points on a map of the study area with the
habitat types delineated (Marcum and Loftsgaarden, 1980). Using a 100 m
grid of the study area, the x, y coordinates of 100 random points were
generated by a computer program (P. Conry, pers. comm.). The elevation
and physiographic type were recorded from the map for each random point.
The proportions of the study area occupied by the 4 physiographic types
and the mean elevation of the study area were adequately estimated by
100 random points.
Plant Chemistry
Food plants. Information on the chemical composition of food
plants was obtained from the analysis of leaf or stem material collected
from plants eaten by the rhinos. Samples consisted of 20-30 g (fresh
weight) of a single plant part (young leaf, mature leaf, or stem) taken
from an individual plant that had been eaten by a rhino at a feeding
site. Most of the samples were collected from a few long feeding bouts
during February through May 1981, I attempted to collect samples from
Reproduced with permission of the copyright owner. Further reproduction prohibited without permission.
Page 99
every plant that had been eaten by a rhino during a feeding bout, thus
including plants that showed various levels of use. Because the plants
could not be identified at the time of collection, the plant taxon of a
sample was not known until the chemical analyses had been completed.
Collected materials were initially held in sealed plastic bags. After
returning to camp, each sample was heated in a portable kerosene oven at
50 to 60“ C for at least 1 hour, then allowed to air-dry in open bags
until delivered to a laboratory. At Highlands Research Unit, Kelang,
Malaysia, the plant samples were oven-dried at 5 5 “ C, then ground to
pass through a 1 mm screen.
The total content of selected mineral elements and nitrogen
(N) were assessed in all samples by Highlands Research Unit following
standard procedures. The N content was determined by the Kjeldahl
method and estimates of crude protein obtained from N x 6.25,
Phosphorus (P) content was determined using Vanando-Molybdate
calorimetry, potassium (K) using a flame photometer, and calcium (Ca)
and magnesium (Mg) using an atomic absorption spectrophotometer. The
dried plant material remaining from the previous asssays was sealed in
plastic bags, then shipped to the Phytochemistry Research Laboratory,
University of Strathclyde, UK, Dr. P. Waterman assayed these samples
for total phenolic content (TP), condensed tannins (CT), and acid
detergent fiber (ADF) (Waterman et al., 1980). All chemical parameters
were expressed as percent dry weight.
Non-food plants, Mature leaf material was collected from the
nearest non-food plant at alternate points along 3 of the vegetative
Reproduced with permission of the copyright owner. Further reproduction prohibited without permission.

Page 100
transects, 1 each in the stream bottom, lower slope, and upper slope
physiographic types, to use as a control for comparisons with the food
plants. After these plants had been identified, all genera that
composed more than 1.3% of the diet were excluded from the group,
leaving a total of 27 mature leaf samples. This group probably contains
non-food plants that are common in the habitat, plant taxa that are
uncommon and infrequently eaten, and plants that are so rare in the
habitat that they are seldom eaten. These leaf samples were handled
like the food plants and assayed for the same chemical components.
Data Analyses
Data organization. The basic level of organization for most
of the data collected during this study was the feeding site, each plant
that was eaten by a rhino; or a randomly located plot, a potential
feeding site. Information on habitat attributes and feeding activities
for each feeding site was entered as an observation into a computer data
file. The data were analyzed on the DECSYSTEM-2050 computer system at
the Unversity of Montana Computer Center. The Statistical Package for
the Social Sciences (SPSS) (Nie et al., 1975) and the BMDP Biomedical
Computer Programs (Dixon and Brown, 1979) software computer packages
were used extensively for data manipulation, summarization, and
statistical analyses.
Habitat selection. Sumatran rhino use of habitat attributes
at feeding sites was determined by calculating the proportion of feeding
cases in each habitat category. Discrete variables (physiographic type
and successional stage) were coded as 1, 2, 3, or 4 to reflect a
Reproduced with permission of the copyright owner. Further reproduction prohibited without permission.

Page 101
gradient of increasing steepness or canopy closure. For continuous
variables (canopy cover, slope, and elevation), the mean response for
each was estimated from the data.
Principal components analysis (Cooley and Lohnes, 1971) was
conducted on the habitat data to investigate the correlations of the
habitat variables with a reduced set of independent factors (components)
that account for known proportions of the total variance of the data
set. The 2 principal components that contained the most variance were
extracted from the correlation matrix for this analysis.
For the discrete variables, the proportionate use of each
habitat attribute at feeding sites was compared to the availability of
the same variable in the study area as determined by vegetative
transects or random points. Habitat selection at feeding sites was
defined as proportionate use of a habitat attribute significantly
different than the availability of that attribute in the habitat
(Petrides, 1975). The null hypothesis that the rhinos used each habitat
category in proportion to its occurrence in the study area was
statistically tested using a chi-squared test of homogenity (Marcum and
Loftsgaarden, 1980). If the null hypothesis was accepted, I concluded
that no selection for that habitat attribute had occurred at P=0.10
level of significance. Rejection of the null hypothesis indicated that
selection had occurred. Using the Bonferroni approach, 90% simultaneous
confidence intervals for the difference between proportionate use and
availability for each habitat category were constructed. Positive
selection for a habitat category was defined as proportionate use
Reproduced with permission of the copyright owner. Further reproduction prohibited without permission.
Page 102
significantly greater than availability and negative selection as
proportionate use significantly less than availability. For continuous
data (canopy cover, slope, and elevation), the sample means for each
group were compared using a 2-sample t-test.
Diet composition. Botanical composition of rhino diets was
calculated as percentages of the total recorded number of bites for all
feeding observations during the study period. It was assumed that no
seasonal differences in diet existed. Because of problems in the
identification of plant materials, diet composition was expressed in
terms of plant families and genera. All plant taxa eaten by rhinos were
considered as food plants. Because many of the plant taxa were eaten
rarely, plant taxa contributing more than 1.5% of the diet were defined
as principal food plants, or plants that the rhinos ate in greatest
quantities (Petrides, 1975). A use index for each feeding site was
calculated by dividing the number of bites removed by the number of
bites available on the plant. This index was considered a measure of
forage preference (Petrides, 1975). The proportion of fruits in the
diet was not determined quantitatively because of difficulties in
determining the number of fruits eaten from the forest floor. Diet
proportions by plant part (young leaf, mature leaf, stem) were computed
by weighting the total number of bites of each type by the weight of 1
standard bite of leaf (2.4 g) or stem (1.4 g). Food plants were
characterized (physically and ecologically) by computing parameter means
or proportions.
Food availability. The amount of food available in the forest
Reproduced with permission of the copyright owner. Further reproduction prohibited without permission.
Page 103
understory was estimated by the enumeration of saplings along transects
using the point-center quarter method (Mueller-Dumbois and Ellenberg,
1974). If the stem DBH of a woody sapling was within 1 standard
deviation of the overall mean for all stems eaten (1.9 cm), the plant
was considered to be available to a potential foraging rhino. The mean
distance from the center point to the nearest available sapling in each
quarter was computed for each physiographic type to obtain a measure of
woody sapling density, expressed as stems/ha. The hypothesis that all
physiographic types contained the same woody sapling density was tested
with a 1-way analysis of variance (ANOVA). Scheffe's multiple range
test was used to detect differences in mean sapling density among the
physiographic types (Sokal and Rolf, 1969).
The biomass of mature leaf forage available in the forest
understory was estimated by multiplying the mean weight of a standard
bite of leaf (2.4 g) times the mean number of bites/plant times the mean
density of stems/ha for each habitat type. Because of the large
standard error of such an estimate, the mean biomass of leaf material
per ha was not tested for statistical differences among the habitat
types.
Understory phenology was expressed as the proportion of stems
with young leaf present, the mean number of bites of young leaf present,
and the mean percentage of young leaf at each stem.
Diet quality. Chemical composition of rhino diets was
calculated as the sum of mean forage chemical values times weighted diet
percentages (Hobbs et al., 1981). For plant taxa with no chemical
Reproduced with permission of the copyright owner. Further reproduction prohibited without permission.

Page 104
composition information available, the mean for the plant family was
used. The intercorrelations of the plant chemistry variables were
examined using principal component analysis (PGA) (Cooley and Lohnes,
1971). PGA analysis reduced the dimensionality of the problem under
study, thus clarifing patterns present in the data. The first 2
principal components that contained most of the data set"s variance were
extracted from the correlation matrix. Each axis was rotated by the
varimax procedure to make the components more interpretable as real
factors.
Food selection. Relationships between food selection and
plant chemistry were examined in terms of significant differences in the
chemical composition of plant taxa, or plant parts, grouped by several
criteria. At the univariate level, paired t-tests were used to test
differences between the chemical composition of mature leaf and stem
material. A 2-sample t-test was used to test for differences in means
for each variable between plant samples grouped by food and non-food
plants.
Because of the multivariate nature of the data, discriminate
function analysis (DFA) (Cooley and Lohnes, 1971) was used to classify
the plant taxa into predetermined groups based on linear combinations of
the plant chemistry variables. The first discriminant function
maximizes differences among species groups, based on their chemical
composition. Remaining discriminant functions account for successively
smaller amounts of the difference among groups. Discriminant-function
scores are orthogonal (Morrison, 1967), and because each score
Reproduced with permission of the copyright owner. Further reproduction prohibited without permission.
Page 105
summarizes information from 8 parameters, the discriminant space
corresponds to a "chemical hyperspace" (Garten, 1978). Because the
maximum number of discriminant functions that can be derived is 1 less
than the number of groups, only 1 or 2 functions were possible depending
on the number of groups. For the DFA analysis, plant taxa were grouped
by the following criteria: 1) principal, non-principal, and non-food
plants and 2) high use index, low use index, and non-food plants.
RESULTS
Feeding Behavior
Rhino tracks were followed on 43 occasions during 25
expeditions into the study area. Often, fresh rhino tracks were
difficult to locate because of the low density of animals and poor
weather conditions. During some of the trips into the study area, fresh
rhino tracks were not found. Often tracks were difficult to follow more
than a few hundred meters, even with the assistance of a skilled native
tracker. Fallen leaves obscured tracks and reduced the depth of the
impression made by the animals'' toenails. Because of the time required
to locate tracks and record data, tracks could be followed a maximum of
2 km a day. Thus, the distance that a particular set of tracks were
followed (a feeding bout) was quite variable, ranging from 1 to 4000 m
(x=850 m), for a total distance of 36 km.
Altogether, 342 cases of rhino feeding were recorded during
Reproduced with permission of the copyright owner. Further reproduction prohibited without permission.
Page 106
this study, an average of 7.7 cases per feeding bout. Ninety of the
observations were recorded in 1979 and 252 during 1980-81. All
observations for both years were pooled for the analyses because of
small sample sizes and lack of significant seasonal climatic factors.
Most of the data in both time periods were collected during the
relatively dry months of February to May,
Method of feeding. Sumatran rhinos left obvious evidence of
their feeding activities. Usually, these animals browsed only 1
individual plant at a feeding site. Thus, each plant eaten by a rhino
during a feeding bout could be easily determined. Depending on a
plant's life form and size, the rhinos attacked the plant differently
(Fig. 2). Short plants were browsed from above without damaging the
main stem. This feeding method was observed on woody and herbaceous
plants. Large woody saplings were usually pushed or the main stem
broken to bring the leaves within reach of the animals' mouths. Woody
saplings with small stem diameters were broken by the animal grasping
the main stem in its mouth and twisting its head sideways. Rhinos
pushed saplings with large stem diameters to the ground by walking over
the main stem. Sometimes, the rhinos placed their feet against the main
stem, breaking it near the ground. After breaking or pushing the plant,
the rhinos browswed the leaves and smaller stems, usually after walking
along the main stem. Often, only leaves and stems on the upperside of
the sapling were eaten. I found no conclusive evidence of animals
eating bark, although this has been reported by other authors (Hubback,
1939; Strickland, 1967). In most cases where bark appeared to have been
Reproduced with permission of the copyright owner. Further reproduction prohibited without permission.
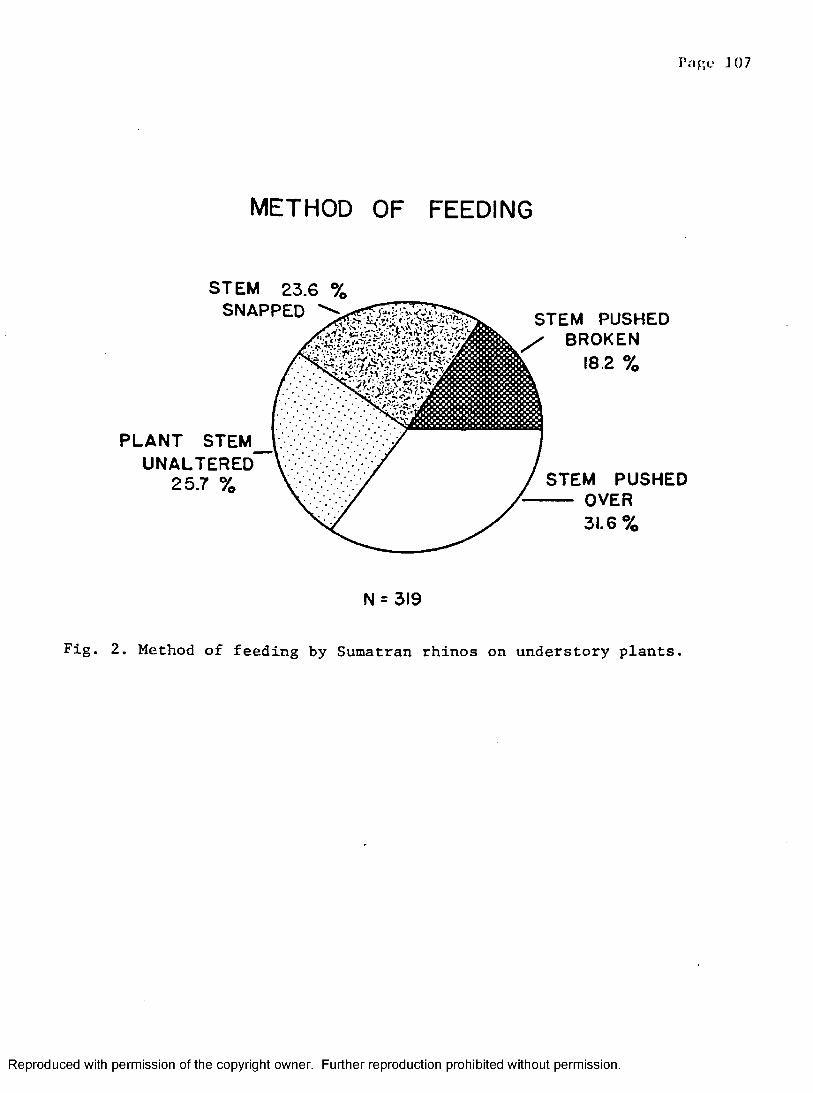
P.'if;c J07
METHOD OF FEEDING
STEM 23.6 % SNAPPED
PLANT STEMu n a l t e r e d '
25.7 %
STEM PUSHED BROKEN
18.2 %
STEM PUSHED OVER 31.6%
N = 319
Fig. 2. Method of feeding by Sumatran rhinos on understory plants,
Reproduced with permission of the copyright owner. Further reproduction prohibited without permission.
Page 108
removed, the animal apparently rubbed the bark off with its horn or
foot.
Sometimes, rhino trails led to forest trees that were
fruiting. Apparently, the rhinos were eating the fruits by picking them
up with their mouths, consuming them whole. This belief was supported
by the presence of whole fruits in dung samples. Because of the
difficulty in determing the number of fruits eaten at a site, I was
unable to quantity the relative amount of fruit eaten by the rhinos.
Habitat Selection
Habitat selection by foraging rhinos was determined by an
analysis of habitat attributes measured at 338 feeding sites. A
principal components analysis of the habitat variables clearly showed
that 2 major factors had been measured, physiography and canopy cover
(Fig. 3). Physiographic type was strongly correlated with elevation,
slope, and the distance from the nearest stream in the first principal
component. Successional stage was strongly correlated with canopy cover
in the second principal component. The first 2 principal components
accounted for 76% of the variance in the data set.
A plot of the feeding site locations clearly showed the
relationship with physiography. About 59% of the feeding sites were in
the stream bottom type (Fig. 1), with 34% on the lower slopes adjacent
to the streams. A comparison of the proportionate use of these
physiographic types with their availability showed strong selection for
the stream bottom and lower slope types (Fig. 4). Likewise, upper
slopes were selected against. The mean elevation of feeding sites (478
Reproduced with permission of the copyright owner. Further reproduction prohibited without permission.
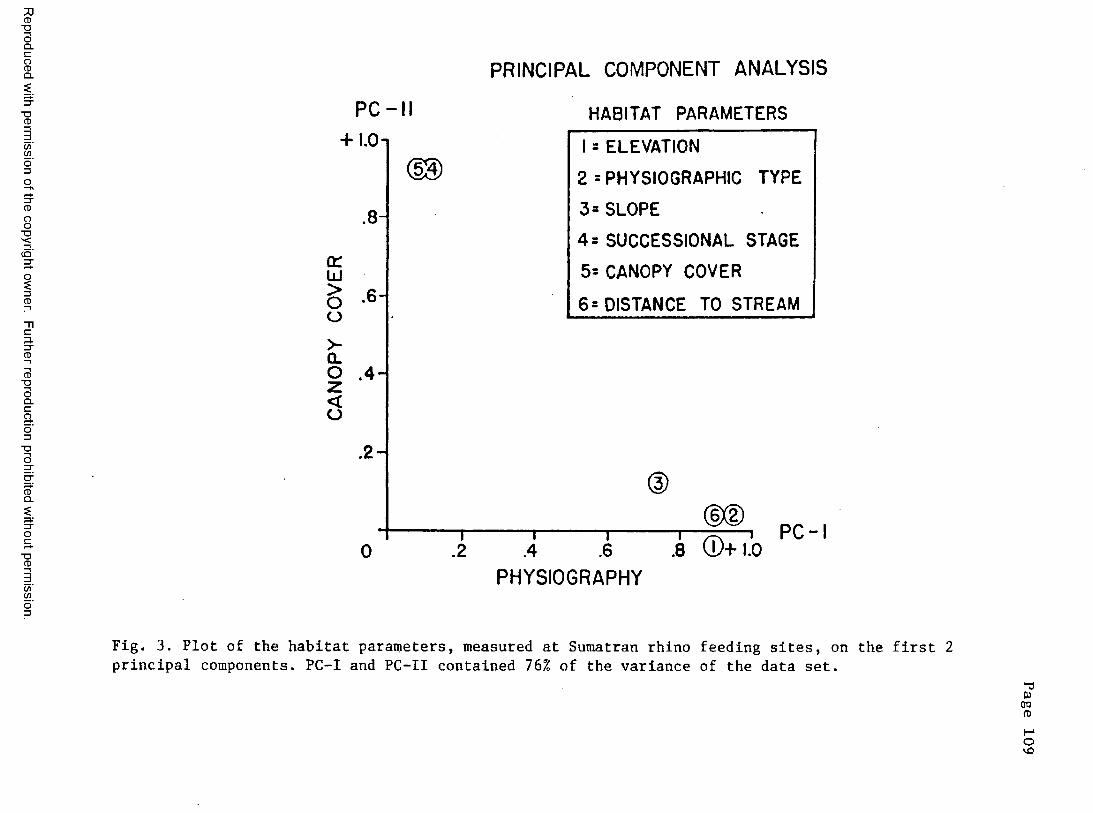
CD■DOQ .CgQ . PRINCIPAL COMPONENT ANALYSIS
■DCD
C/)C/)
8
ci'
33"CD
CD■DOQ .CaO3"OO
CDQ .
■DCD
C/)C/)
PC + 1.0
O U
wèo
.8-
.6-
>-Û.o .4.
5
.24
T.2 .4
HABITAT PARAMETERS
1 = ELEVATION
2 = PHYSIOGRAPHIC TYPE
3 = SLOPE
4 s SUCCESSIONAL STAGE
5 = CANOPY COVER
6= DISTANCE TO STREAM
“T.6 .8 ®+I.O
PC- I
PHYSIOGRAPHY
Fig. 3. Plot of the habitat parameters, measured at Sumatran rhino feeding sites, on the first 2 principal components. PC-I and PC-II contained 76% of the variance of the data set.
cuOQmovD
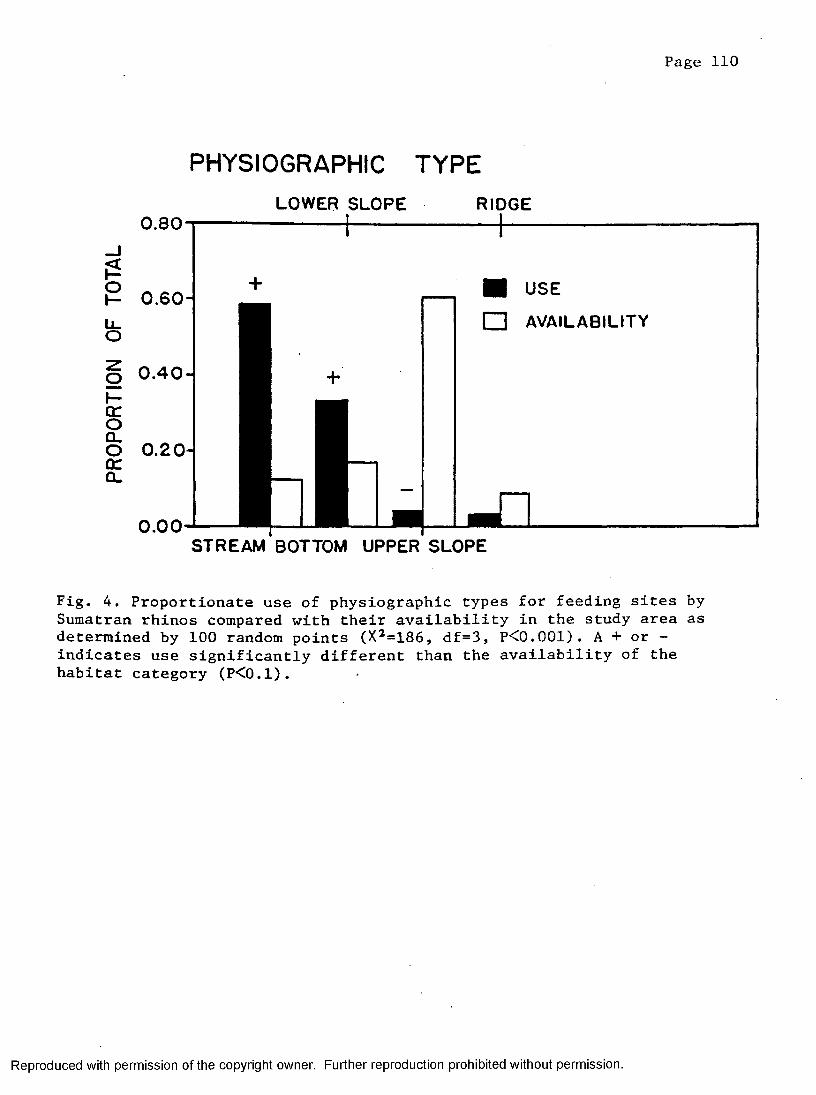
Page 110
PHYSIOGRAPHIC TYPELOWER SLOPE RIDGE
0.80
5 0 .4 0
O 0 .2 0 -
■ USE
□ AVAILABILITY
0.00STREAM BOTTOM UPPER SLOPE
Fig, 4. Proportionate use of physiographic types for feeding sites by Sumatran rhinos compared with their availability in the study area as determined by 100 random points (X^=186, df=3, P<C0.001) . A + or - indicates use significantly different than the availability of the habitat category <P<0.1).
Reproduced with permission of the copyright owner. Further reproduction prohibited without permission.

Page 111
m) was significantly lower than the mean elevation of the study area
(542 m) (t=8.0, df“ 417, P<0.001; Fig. 5). Likewise, the rhinos selected
feeding sites with a mean slope (8.3%) less than the mean (17.3%) of the
study area (t=7.2, df=587, P<0.001; Fig. 6). The distance between
feeding sites and the nearest stream with a permanent flow was 143 m.
Rhino selection of the canopy cover habitat attribute at
feeding sites was apparent but more difficult to interpret. The mean
percent canopy cover at feeding sites (83%) was significantly less than
the mean for the study area (93%) (t=9.2, df=578, P<0.001; Fig, 7). In
terms of successional stage, the rhinos showed a significant positive
selection for the old gap category (Fig. 8). Likewise, the use of the
closed canopy forest (63%) was less than its availability in the study
area (83%). No significant difference was found between use and
availability of the new gap and riverine types. By collapsing the
number of successional stage categories into gap and non-gap sites, the
dimensionality of the problem was reduced. The rhinos fed in forest
gaps 35% of the time, significantly higher than their availability
(15%). Also, 44.6% of the total number of rhino bites were at feeding
sites located in forest gaps, although the mean number of bites per
plant was not significantly higher (P=0.30). These rhinos used small
forests gaps for feeding more than their availability, indicating a
selection for small open areas. On the other hand, a majority of the
feeding cases (63%) was in the closed canopy forest. Although the
rhinos showed a selection for small forest gaps for feeding sites, the
closed canopy forest was still an important habitat for feeding.
Reproduced with permission of the copyright owner. Further reproduction prohibited without permission.
Page 112
ELEVATION
(f) QZ UJ 1— LÜ
0LUW
<LU
5 5 0 -
5 0 0 -
4 5 0 -
4 0 0 -FEEDING
SITESTRANSECT
POINTS
Fig, 5. Mean elevation of Sumatran rhino feeding sites (5=478 m, SD=71, n=319) compared with the mean elevation of the study area as determined by random points (5=542, SD=67, n = 1 0 0 ) . Each mean is bounded by a 95% confidence interval.
Reproduced with permission of the copyright owner. Further reproduction prohibited without permission.
Page 113
SLOPE30-,
LÜ 20o ccUJCL
2 10
FEEDINGSITES
TRANSECTPOINTS
Fig. 6. Mean percent slope of Sumatran rhino feeding sites (x=8.3, SD=10, n=309) compared with the mean slope of the study area (x=17.3, SD=17, n= 280). Each mean is bounded by a 95% confidence interval.
Reproduced with permission of the copyright owner. Further reproduction prohibited without permission.
Page 114
CANOPY COVER %95-1
5cc wa.z< 85 -
80FEEDING TRANSECT
SITES POINTS
Fig, 7. Mean percent canopy cover of Sumatran rhino feeding sites (x=83, SD=16, n=300) compared with the mean percent canopy cover of the study area (%=93, SD*9, n=280). Each mean is bounded by a 95% confidence interval.
Reproduced with permission of the copyright owner. Further reproduction prohibited without permission.
Pngc 115
SUCCESSIONAL STAGE
1.00
gg
og 0.25OccCL
0.00
CLOSEDCANOPY
0 .75 - _
0 .5 0 -
OLD GAPr
■ USE□ AVAILABILITY
NEW GAP RIVERINE
Fig. 8. Proportionate use of successional stages for feeding sites by Sumatran rhinos compared with their availability in the study area as determined by 280 transect points (X^=30, df=3, P<0.001).A + or - indicates use significantly different than the availability of that habitat category (P<0.1).
Reproduced with permission of the copyright owner. Further reproduction prohibited without permission.

Page 116
Diet Composition
Plant life form» Woody saplings were the dominant plant life
form type (95.6%) selected for feeding (Fig. 9). Woody saplings
consisted of shrubs, small understory trees, and juveniles of mid-canopy
and large emergent trees. Woody climbers (vines) were the next most
frequently eaten plant form (3.5%). Often these climbers were growing
on saplings that were consumed by the rhinos. Some feeding on climbers
appeared almost incidental to eating the saplings. Only 2 palms and 1
herbaceous plant were consumed, and in each case little foliage was
removed.
Rhinos selected plants within a narrow range of stem diameters
for feeding. The stem diameter at breast height (DBH) varied from 0.4
to 6.0 cm (x=l.9 cm, SD=i.l, n=317); about 68% of the plants had stem
diameters between 0.8 and 3.3 cm. Woody saplings with large stem
diameters were seldom selected for feeding because the stems were
probably difficult to push or break. The height of food plants was more
variable and had less influence on food selection (x=3.3 m, SD=1.8,
n=301). Usually, stems taller than 1.5 m were broken or pushed to the
ground so the leaves would be available for feeding.
Botanical composition. During the study, 11,818 rhino bites
on 342 individual plants were recorded. The food plants consisted of 49
families, 102 genera, and from 156 to 181 species. Identification of
food plants proved to be a difficult problem. Because plants could not
be identified in the field, a leaf sample was collected from each plant
for later identification by forest botanists. These botanists had
Reproduced with permission of the copyright owner. Further reproduction prohibited without permission.
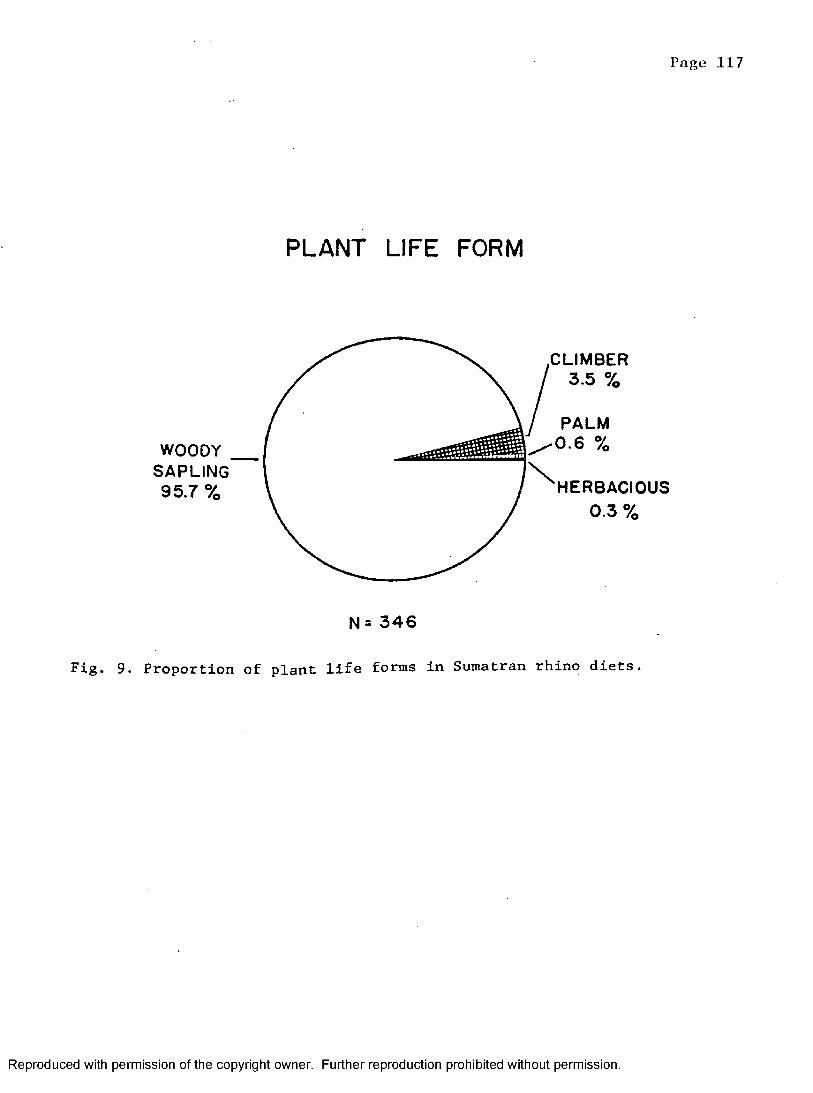
Page 117
PLANT LIFE FORM
WOODY . s ap lin g ' 95.7 %
CLIMBER 3.5 %
PALM0.6 %HERBACIOUS
0.3 %
N= 3 46
Fig. 9. Proportion of plant life forms in Sumatran rhino diets,
Reproduced with permission of the copyright owner. Further reproduction prohibited without permission.

Pnge 118
difficulties in identifying the plants to species because only sterile
samples were available from my collections, little plant collecting has
been done in the Endau-Rompin region, and the taxonomy of many
under story plants, especially the Rubiaceae, was poorly known. Thus,
only about 70% of the plant samples were identified to species, but most
of them were classified to genus. The food plant list contained several
new records for the region and possibly 2 new species (K. Kochummen,
pers. comm.). Because of the lack of species names for many of the
plants, I grouped the plants by family or genus for many of the
analyses.
The great diversity in the tropical forest understory
presented many problems in the interpretation of diet composition and
food selection. The botanical composition of rhino diets reflected the
species diversity of the habitat. About 46% of the feeding cases were
different species. Even at the generic level, diversity in the diet was
high with 102 genera represented in the 342 cases of feeding. The food
plant list contained 46% of the total number of woody plant families
occurring in Peninsular Malaysia.
The relationship between the cumulative number of plant genera
in the food plant list and the cumulative number of feeding cases was
studied to determine the number of feeding cases needed to accurately
sample diet composition at the generic level (Fig. 10). The first 100
feeding cases consisted of 55 different plant genera. This curve
leveled off at about 250 feeding cases; the last 100 cases added only 6
new plant genera, the rest being replicates. This information indicated
Reproduced with permission of the copyright owner. Further reproduction prohibited without permission.
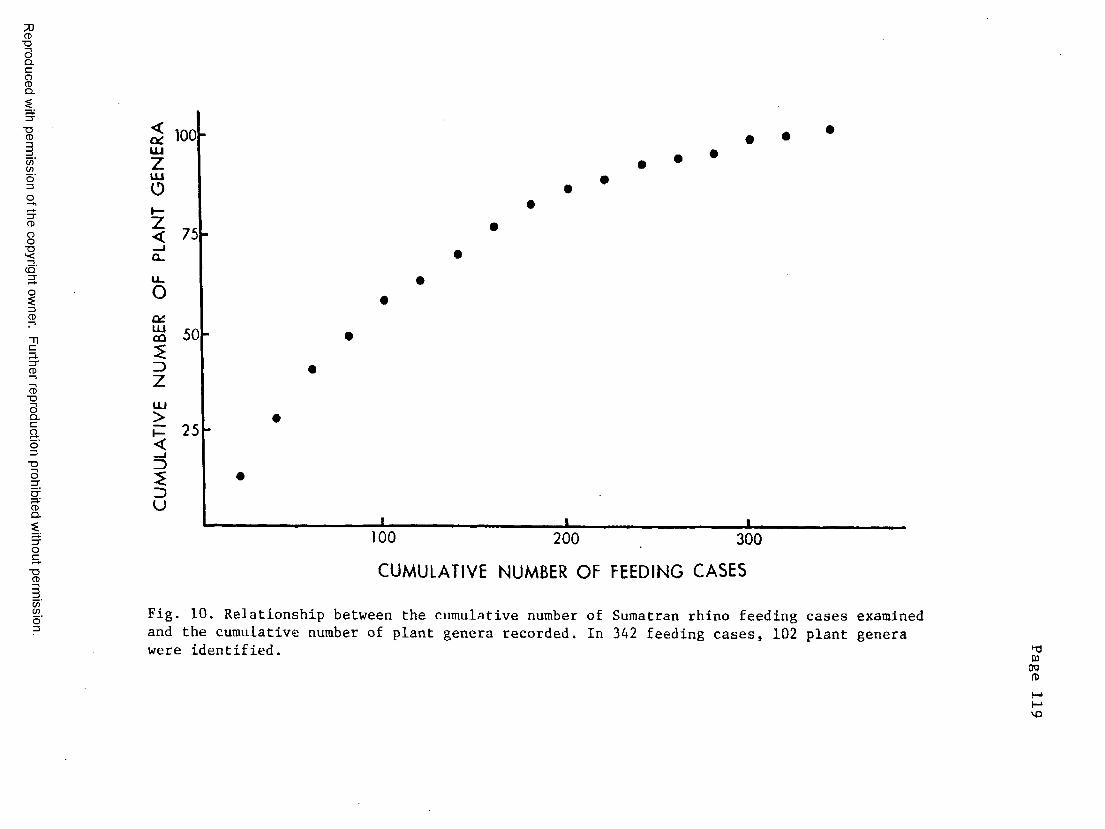
7JCD■DOQ.CgQ.
■DCD
(/)(/)
8
3.3"CD
CD■DOQ.Cao3■DO
CDQ.
100 lUzU JoI—z< _ _ I
u.o0£U1CÛ3zU J>I—<33U
100 200 300"DCD CUMULATIVE NUMBER OF FEEDING CASES
(/)(/) Fig. 10. Relationship between the cumulative number of Sumatran rhino feeding cases examined
and the cumulative number of plant genera recorded. In 342 feeding cases, 102 plant genera were identified. M3Wera
V O
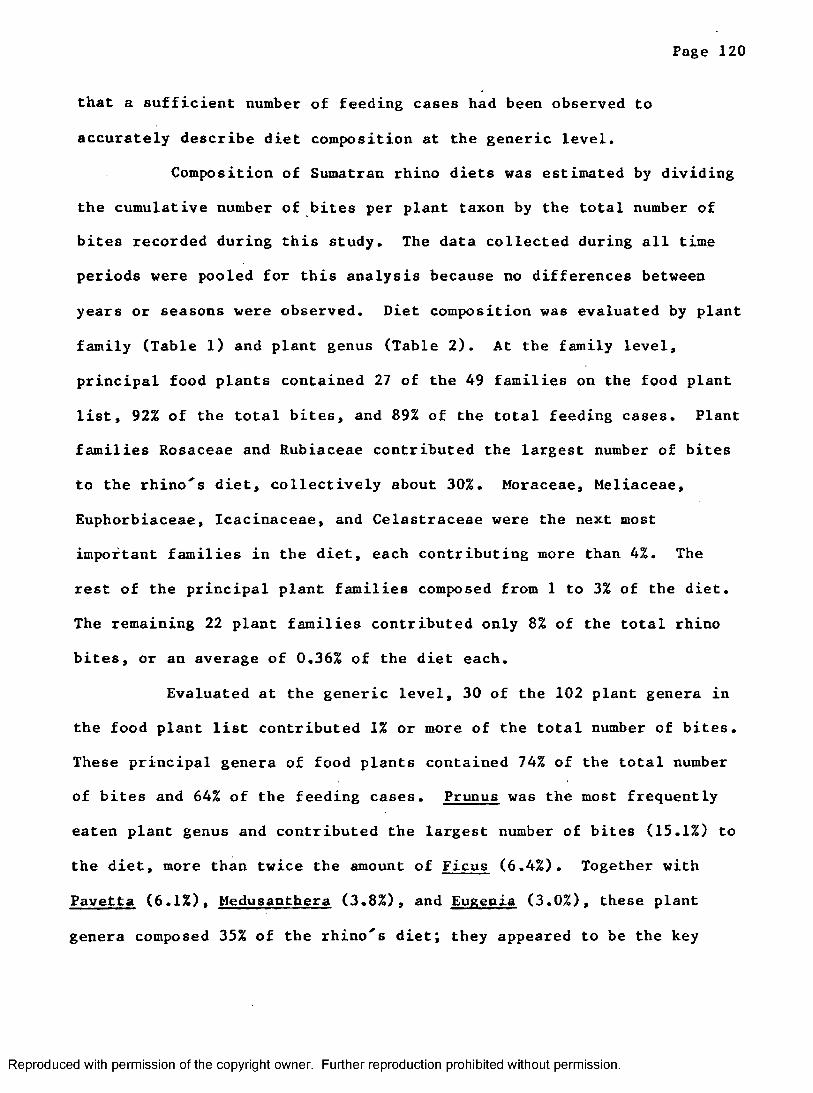
Page 120
that a sufficient number of feeding cases had been observed to
accurately describe diet composition at the generic level.
Composition of Sumatran rhino diets was estimated by dividing
the cumulative number of bites per plant taxon by the total number of
bites recorded during this study. The data collected during all time
periods were pooled for this analysis because no differences between
years or seasons were observed. Diet composition was evaluated by plant
family (Table 1) and plant genus (Table 2). At the family level,
principal food plants contained 27 of the 49 families on the food plant
list, 92% of the total bites, and 89% of the total feeding cases. Plant
families Rosaceae and Rubiaceae contributed the largest number of bites
to the rhino's diet, collectively about 30%. Moraceae, Meliaceae,
Euphorbiaceae, Icacinaceae, and Celastraceae were the next most
important families in the diet, each contributing more than 4%. The
rest of the principal plant families composed from 1 to 3% of the diet.
The remaining 22 plant families contributed only 8% of the total rhino
bites, or an average of 0.36% of the diet each.
Evaluated at the generic level, 30 of the 102 plant genera in
the food plant list contributed 1% or more of the total number of bites.
These principal genera of food plants contained 74% of the total number
of bites and 64% of the feeding cases. Prunus was the most frequently
eaten plant genus and contributed the largest number of bites (15.1%) to
the diet, more than twice the amount of Ficus (6.4%). Together with
Pavetta (6.1%), Medusantbera (3.8%), and Eugenia (3.0%), these plant
genera composed 35% of the rhino's diet; they appeared to be the key
Reproduced with permission of the copyright owner. Further reproduction prohibited without permission.

Page 121
Table 1, Principal plants in the diet of the Sumatran rhinoceros in the Endau-Rompin region, feeding cases grouped by plant family. Plant taxa ranked by percentage of total number of bites recorded during the study period.
Plant family^ Rank Percentage of dietb
Number of feeding cases
Number of bites/plant
Rosaceae 1 15.0 46 38Rubiaceae 2 14.7 47 36Moraceae 3 8.1 24 40Meliaceae 4 5.5 15 43Euphorbiaceae 5 5.1 27 22Icacinaceae 6 4.1 13 37Celastraceae 7 4.0 7 66Myrsinaceae 8 3.3 12 32Leguminosae 9 3.1 6 61Sapotaceae 10 3.0 9 39Myrtaceae 11 3.0 12 29Theaceae 12 2.3 4 67Lauraceae 13 2.2 12 21Ulmaceae 14 2.2 2 127Myristicaceae 15 1.8 5 43Flacourtiaceae 16 1.5 4 43Actinidiaceae 17 1.4 3 55Sapindaceae 18 1.4 8 20Guttifera 19 1.3 5 31Rutaceae 20 1.3 5 30Verbenaceae 21 1.3 8 19Oleaceae 22 1.2 6 22Aceraceae 23 1.1 2 67Rhizophoraceae 24 1.1 5 26Ebenaceae 25 1.1 6 22Dipterocarpaceae 26 1,0 6 18Loganiaceae 27 1.0 2 52
TOTALS 92.0 301 41
^ Plant families contributing more than 1% of the total number ofbites,^ Total number of bites = 11,818.^ Total number of feeding cases = 342.
Mean number of bites per plant.
Reproduced with permission of the copyright owner. Further reproduction prohibited without permission.
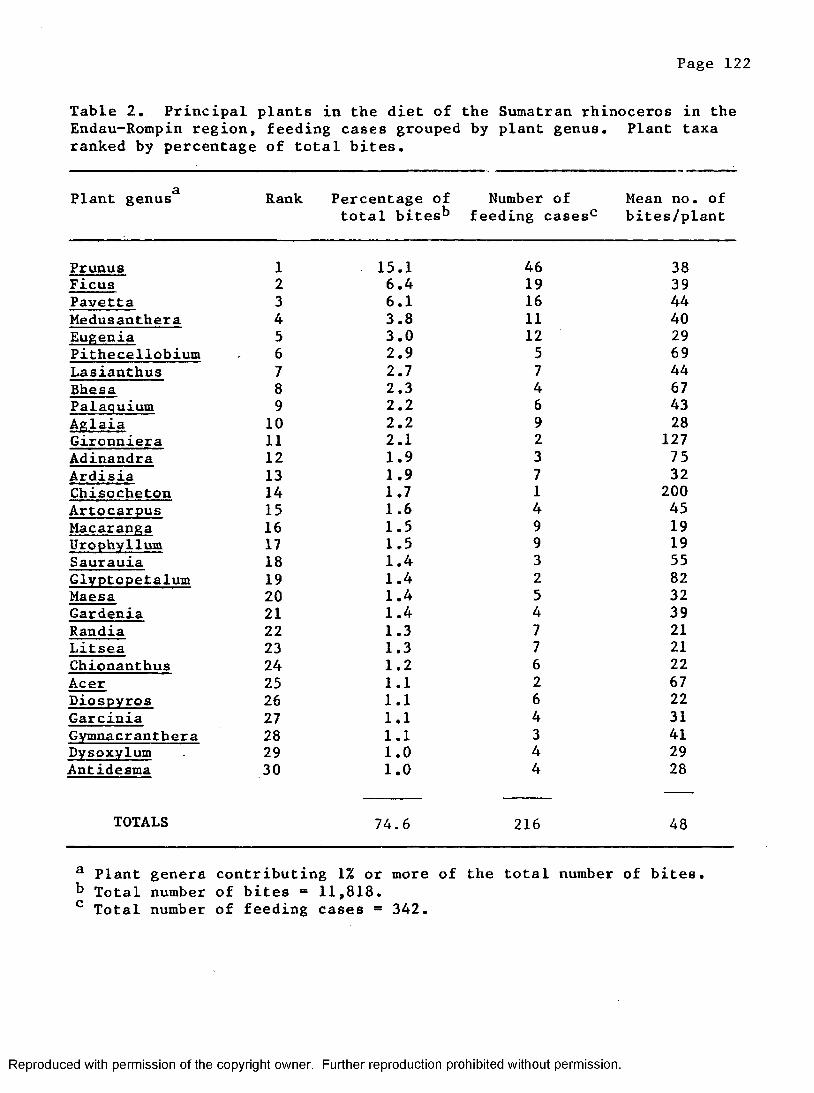
Page 122
Table 2. Principal plants in the diet of the Sumatran rhinoceros in the Endau-Rompin region, feeding cases grouped by plant genus. Plant taxa ranked by percentage of total bites.
Plant genus^ Rank Percentage of total bitesb
Number of feeding cases'^
Mean n o . of bites/plant
Prunus 1 15.1 46 38Ficus 2 6.4 19 39Pavetta 3 6.1 16 44Medusantbera 4 3.8 11 40Eugenia 5 3.0 12 29Pithecellobium 6 2.9 5 69Lasianthus 7 2.7 7 44Bhesa 8 2.3 4 67Palaquium 9 2.2 6 43Aglaia 10 2.2 9 28Gironniera 11 2.1 2 127Adinandra 12 1.9 3 75Ardisia 13 1.9 7 32Chisocheton 14 1.7 1 200Artocarpus 15 1.6 4 45Macaranga 16 1.5 9 19Urophvllum 17 1.5 9 19Saurauia 18 1.4 3 55Glvptopetalum 19 1.4 2 82Maesa 20 1.4 5 32Gardenia 21 1.4 4 39Randia 22 1.3 7 21Litsea 23 1.3 7 21Chionanthus 24 1.2 6 22Acer 25 1.1 2 67Diospvros 26 1.1 6 22Garcinia 27 1.1 4 31Gymnacranthera 28 1.1 3 41Dysoxvlum 29 1.0 4 29Antidesma 30 1.0 4 28
TOTALS 74.6 216 48
^ Plant genera contributing 1% or more of the total number of bites.^ Total number of bites = 11,818.^ Total number of feeding cases = 342.
Reproduced with permission of the copyright owner. Further reproduction prohibited without permission.
Page 123
forage group. Most of the plant genera were poorly represented in the
diet; 50 genera were recorded only once. The lowest 72 genera in the
diet contributed an average of 0.35% to the diet. Individuals of these
plant genera may have been uncommon in the habitat or highly
unpalatable.
The mean number of bites per plant was quite variable, but
illustrated whether many small plants or a few large plants contributed
to the diet proportions. Because of the problem with differences in
plant size, diet proportions based on the relative frequency of stems
gave a different estimate of diet composition than total bites.
Diet composition was not evaluated at the species level
because of the problems mentioned previously. Prunus arborea, Pavetta
indica. and Medusantbera sracilis contributed the largest diet
proportions at the species level. Each of these species were single
members of a genus that were eaten frequently. Most of the plants at
the species level contributed only 1 or 2 feeding cases and a small
proportion of the total number of bites.
Plant parts. Mature leaves accounted for 85.5% of the total
bites at feeding sites. Stem material (8.6%) and young leaves (1.4%)
were eaten in much smaller proportions. The use of young leaves was
difficult to assess because young leaves were a small proportion of the
available leaves on a plant (less than 2%), and they may have been eaten
completely. Thus, the proportion of young leaves in the diet may have
been slightly underestimated. Young leaves, mature leaves, and stem
material were often eaten together at the same plant, often in about the
Reproduced with permission of the copyright owner. Further reproduction prohibited without permission.
Page 124
same proportion as their availability. Mature leaves were the most
available plant part (82%) at all sites. Much of the stem material
consumed appeared to have been incidental to eating mature leaves.
Young and mature leaves were always used more than stem material. Stems
larger than 5 mm in diameter were seldom eaten.
The proportion of fruit in the diet was difficult to
determine, so I treated fruits separately from the other plant parts.
Rhino tracks were followed to fruiting trees 13 times, and the animals
appeared to eat fallen fruit from the ground. I was unable to quantify
the number or amount of fruit eaten. The importance of fruit in the
diet was estimated by examining 65 dung piles for seeds. The frequency
of occurrence of fruit seeds in the dung was assumed to be reflective of
the amount of fruit eaten. Fruit seeds were found in 10 (15%) of the
dung samples. The rest of the dung material was usually leaf or stem
matter from woody saplings* Fruit consumption was quite seasonal with
most use recorded from March to September, the main fruiting period for
many forest trees. All large, fleshy fruits appeared to be highly
preferred food items, especially wild mangos (Mangifera sp.)(Table 3).
The identification of fruits and seeds was difficult because many of
them had not been collected previously. When a large tree was fruiting
heavily, rhino trails often returned to the same tree several times.
During April 1981, several mango trees were fruiting at the same time
near the Selai base camp, and fresh rhino tracks were found at these
trees daily. While following tracks at other times, the rhinos
occasionally returned to trees where they had eaten fruits previously.
Reproduced with permission of the copyright owner. Further reproduction prohibited without permission.

Paj’G 1 25
Table 3, Forest fruits recorded as eaten by Sumatran rhinos in the Endau-Rompin region. Information collected from the observation of feeding evidence or of seeds in dung samples.
Family Species
Ânacardiaceae Mangifera foetidaÂnacardiaceae M. lageniferaÂnacardiaceae M. microphvllaGuttiferae Calophyllum macrocarpumLeguminosae Parkia sp.Rhizophoraceae Anisophvllea eriffithiiRosaceae Parinari sp.Rutaceae Citrus sp.
Reproduced with permission of the copyright owner. Further reproduction prohibited without permission.
Page 126
Forest fruits are probably an important source of nutrients and highly
palatable. The rhinos, in turn, probably function as important
seed-dispersing agents for the seeds of some trees. Mango seedlings
were found sprouting in rhino dung on 5 occasions.
Use Index
The percentage of leaf and stem matter eaten from each plant
at feeding sites was recorded as a use index. For all feeding cases,
this index ranged from 0 to 100 (x=44, n=342). Plant genera with a mean
index greater than 44 have been listed in Table 4. Many of the plant
genera with high use values contributed little to diet proportions.
Plants with high use indices were probably quite rare in the habitat.
Principal food plants were often used less on an individual basis with
use indices clumped around the mean. On the other hand, some plants
with a low use index were eaten infrequently, suggesting that they were
unpalatable.
Ecological Characteristics of Food Plants
The ecological characteristics of rhino food plants were
investigated by reviewing the available information on the groups,
primarily that by Symington (1933), Van Steenis (1953), Burkill (1966),
Whitmore (1972), Wyatt-Smith and Kochummen (1979), and Kochummen
(pers. comm.). In regard to canopy position, 73% of the feeding cases
were plants typical of the forest understory (Fig. 11). In contrast,
18% of the feeding cases were juvenile trees that usually reach the
mid-canopy position at maturity. Only 2.8% of the feeding cases were
Reproduced with permission of the copyright owner. Further reproduction prohibited without permission.
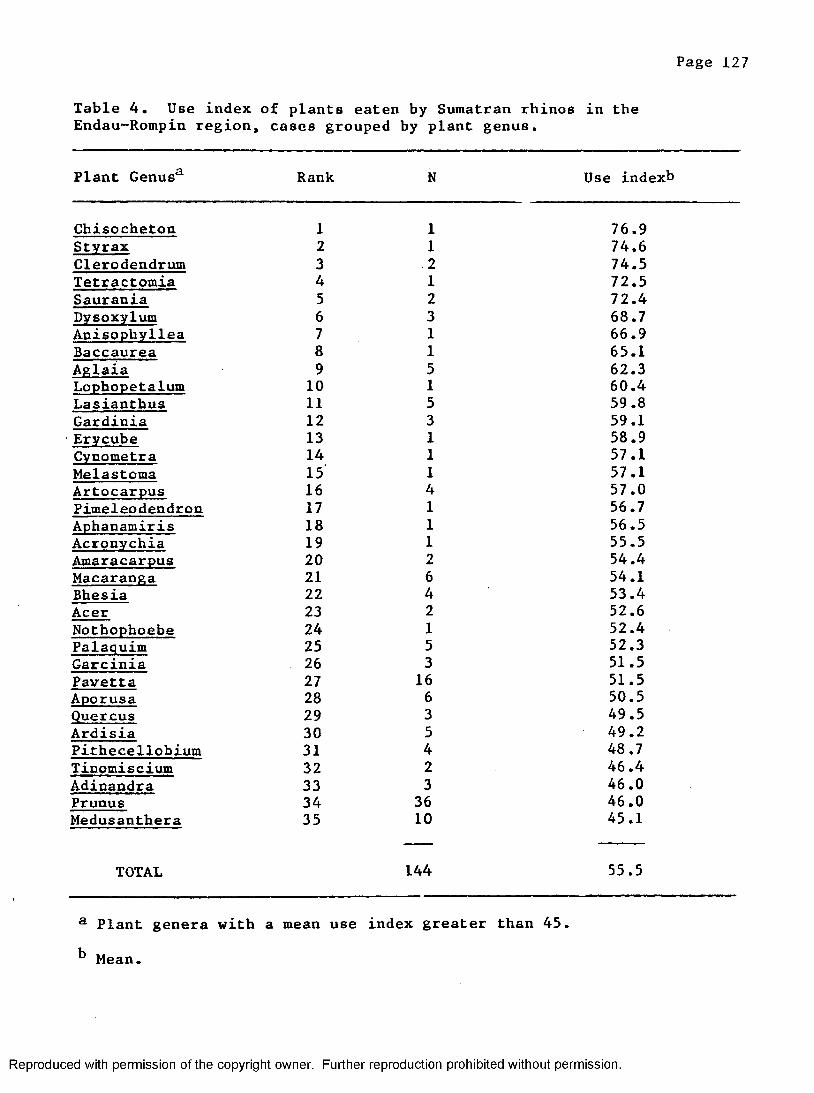
Page 127
Table 4. Use index of plants eaten by Sumatran rhinos in the Endau-Rompin region, cases grouped by plant genus.
Plant Genus^ Rank N Use indexb
Chisocheton 1 1 76.9Styrax 2 1 74.6Clerodendrum 3 2 74.5Tetractomia 4 1 72.5Saurania 5 2 72.4Dysoxylum 6 3 68.7Anisophyllea 7 1 66.9Baccaurea 8 1 65.1Aglaia 9 5 62.3Lophopetalum 10 1 60.4Lasianthus 11 5 59.8Gardinia 12 3 59.1Erycube 13 1 58.9Cynometra 14 1 57.1Melastoma 15 1 57.1Artocarpus 16 4 57.0Pimeleodendron 17 1 56.7Aphanamiris 18 1 56.5Acronychia 19 1 55.5Amaracarpus 20 2 54.4Macaranga 21 6 54.1Bhesia 22 4 53.4Acer 23 2 52.6Nothophoebe 24 1 52.4Palaquim 25 5 52.3Garcinia 26 3 51.5Pavetta 27 16 51.5Aporusa 28 6 50.5Quercus 29 3 49.5Ardisia 30 5 49.2Pithecellobium 31 4 48.7Tinomiscium 32 2 46.4Adinandra 33 3 46.0Prunus 34 36 46.0Medusantbera 35 10 45.1
TOTAL 144 55.5
® Plant genera with a mean use index greater than 45,
^ Mean.
Reproduced with permission of the copyright owner. Further reproduction prohibited without permission.
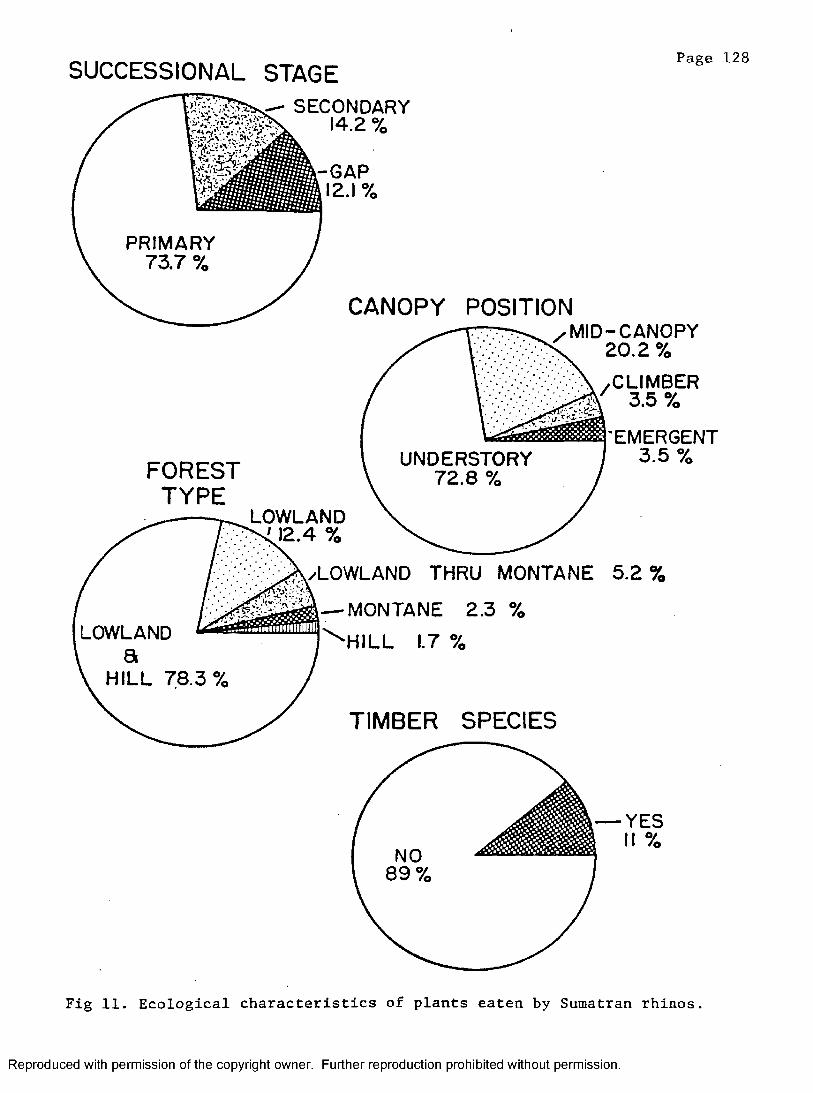
SUCCESSIONAL STAGESECONDARY
14.2 91
-GAP 12.1 %
Page 128
PRIMARY 73.7 %
CANOPY POSITION
FORESTTYPE
LOWLAND 12.4 %
LOWLANDa
HILL
UNDERSTORY
MID-CANOPY 20.2 %CLIMBER
3.5 %
'EMERGENT 3.5 %
/LOWLAND THRU MONTANE 5 .2%
MONTANE 2.3 %HILL 1.7 %
TIMBER SPECIES
— YESII %
Fig 11. Ecological characteristics of plants eaten by Sumatran rhinos,
Reproduced with permission of the copyright owner. Further reproduction prohibited without permission.

Page 129
juveniles of emergent trees. Likewise, only 10% of the feeding cases
were juveniles of timber trees.
In terms of successional stage, 74% of the plants were
characteristic of the primary closed canopy forest. Only 14% of the
feeding cases were plants typical of secondary vegetation and 11% were
of forest gaps. Most of the food plants were trees typically found in
lowland and hill forest (78%) . A smaller number were commonly
restricted to lowland forest (12.3%) or montane forest (2.3%). A few
had wide ecological distributions, ranging from lowland through montane
forest (4.7%).
Food Availability
The availability of potential food for feeding rhinos in the
forest understory was estimated from the enumeration of saplings within
the rhino food size class along transects (Table 3). The mean density
of woody saplings between 0.8 and 3.2 cm DBH was found to be
significantly different among the physiographic types (ANOVA, f=4.3,
P=0.004), varying from 4710 stems/ha on the ridges to 6740 stems/ha in
the stream bottom type. Woody sapling densities in the lower and upper
slope types were intermediate at 3000 and 4990 stems/ha. Likewise, the
stream bottom type had the largest amount of availble leaf matter (330
kg/ha) and the ridge type had the least amount (310 kg/ha). These data
indicated that the largest amount of potential food for foraging rhinos
was available in the stream bottom type and the quantity of available
food decreased with increasingly steep topography.
Several of the enumerated saplings were identified to genus
Reproduced with permission of the copyright owner. Further reproduction prohibited without permission.
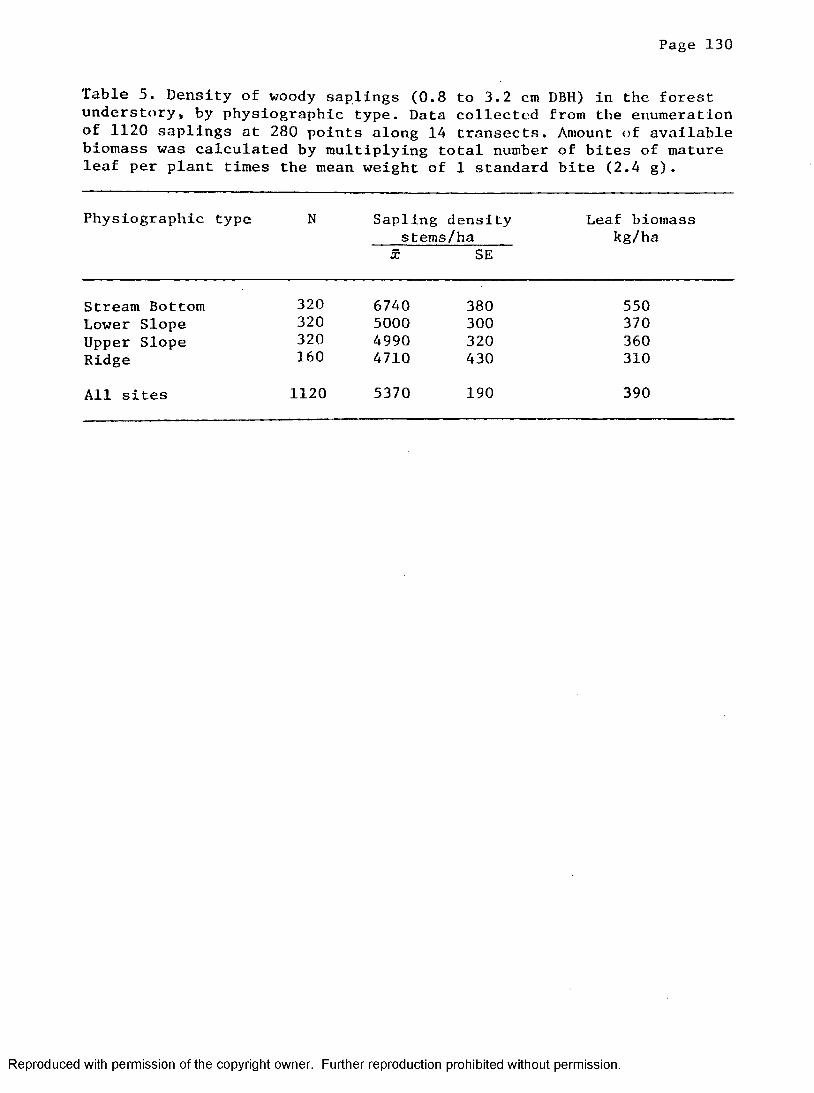
Page 130
Table 5. Density of woody saplings (0.8 to 3.2 cm DBH) in the forest understory, by physiographic type. Data collected from the enumeration of 1120 saplings at 280 points along 14 transects. Amount of available biomass was calculated by multiplying total number of bites of mature leaf per plant times the mean weight of 1 standard bite (2.4 g) .
Physiographic type N Sapling densitystems/ha
Leaf biomass kg/ha
X SE
Stream Bottom 320 6740 380 550Lower Slope 320 5000 300 370Upper Slope 320 4990 320 360Ridge 160 4710 430 310
All sites 1120 5370 190 390
Reproduced with permission of the copyright owner. Further reproduction prohibited without permission.

Page 131
and provided information on the relative density of certain food plants
(Table 6), Eugenia sp, was the most frequent woody sapling in the
forest understory, comprising about 6% of the stems within the rhino
food size class. Shorea sp., a non-principal food plant, and Pavetta
sp., a highly used food plant, were the next most common taxa of plants
in the understory (about 4.5% each). Ouercus sp. and Xerospermum sp.,
seldom used plants, each comprised about 3% of the understory. Prunus
sp,, the most highly used plant, comprised about 1% of the stems in the
understory. Because of the high diversity of the understory, the
remainder of the food plants probably composed less than 1% of the
stand. Generally, rhino food plants occurred at low relative densities
in the forest understory, most comprising less than 1% of the stand.
Under the classic definition of preferred plants, use greater than
availability (Petrides, 1975), most of the food plants could be
considered as preferred food because diet proprortions were greater than
their relative densities in the habitat. In tropical rain forest
habitats, this type of analysis was not meaningful.
Several important food plants were found more frequently in
the stream bottom and lower slope physiographic types. In the stream
bottom type, the stand consisted of 2,1% Prunus sp. and 10% Eugenia sp.
In the ridge type, the proportion of Prunus in the understory dropped to
0.0% and Eugenia to 3.8%. This trend was consistent for all food plants
enumerated, indicating that the availability of food plants was higher
in the stream bottom type, and they decreased in abundance with
increasing elevation. A similar trend was observed in total sapling
Reproduced with permission of the copyright owner. Further reproduction prohibited without permission.

Page 1 32
Table 6. Relative abundance of certain plant taxa (0.8 to 3,2 cm DBH) in the forest understory. Information collected from the enumeration of 1120 saplings at 280 points along 14 transects during March through May 1981. Data grouped by physiographic type, expressed as the percentage of saplings in that category.
Physiographic type
Taxa Streambottom
Lowerelope
Upperslope
Ridge All types
Prunus sp. 2.1 2.2 0.3 0.0 1.1Pavetta sp. ^ 4.0 3.1 6.3 3.2 4.3Eugenia sp. 10.0 5.9 4.4 3.8 6.3Garcinia sp. 1.3 0.6 1.3 3.2 1.3Quercus sp. 4.7 1.9 3.1 1.3 3.0Pithecelobium sp. ^ 0.0 1.3 1.9 0.0 0.9Xerospermum sp. 3.1 2.2 4.1 1.3 3.2Shorea sp. 5.3 3.2 5.3 3.2 4.4
Probably includes other members of Family RUBIACEAE. Includes Lithocarpus.Probably includes other members of Family LEGUMINOSAE.
Reproduced with permission of the copyright owner. Further reproduction prohibited without permission.
Page 133
density,
Understory Phenology
The phenology of woody saplings in the forest understory was
studied by recording the proportion of young and mature leaves on
saplings enumerated along transects (Table 7), Most of the leaf
material in the forest understory consisted of mature leaves. Only
about 11% of the saplings had young leaves present. Based on the total
number of bites present on enumerated saplings, young leaves comprised
only about 1.7% of the leaf material. The mean number of bites of young
leaves per plant was 0.57, or 1.4 g of leaf matter, compared with an
average of 29.3 bites (70 g) of mature leaf. In regards to
physiographic type, woody saplings in the stream bottom and lower slope
types had a higher proportion of stems with young leaves present (0.14)
than upper slope and ridge types (0.08). This same trend was reflected
by the mean number of young leaves per stem and the mean percentage of
young leaf per stem.
Plant Chemistry
Leaf and stem material from certain plants actually eaten by
rhinos and a sample of mature leaf from non-food plants were analyzed
for their chemical composition. Chemical assays of each type were not
available for all samples, so sample sizes varied depending on assay.
Information for all chemical assays, except magnesium, was available
from 87 plants eaten by rhinos and 27 non-food plants collected along
transects.
Reproduced with permission of the copyright owner. Further reproduction prohibited without permission.

Page 13A
Table 7. Phenology of woody saplings in the forest understory (0.8 to 3.2 cm DBH), by physiographic type. Information collected from the enumeration of 1120 saplings at 280 points along 14 transects during March through May 1981.
Physiographic N Proportion of stems Bites YL per stemtype with YL present YL/S tern %
PSE SE 2 SE
Stream Bottom 320 0.12 0.02 0.57 0.11 1.42 0.25Lower Slope 320 0.15 0.02 0.78 0.13 2.43 0.37Upper Slope 320 0.08 0.02 0.37 0.09 1.32 0.33Ridge 160 0.08 0.02 0.52 0.18 1.21 0.38
All sites 1120 0.11 0.01 0.57 0.06 1.65 0.17
YL = young leaf.
Reproduced with permission of the copyright owner. Further reproduction prohibited without permission.
Page 135
 principal components analysis of the food plant samples
showed the intercorrelations of the plant chemistry variables. The
first 2 principal components contained 54% of the variance of the data
set. PC-1 was interpreted as illustrating the overall correlations of
the plant chemistry variables (Fig. 12). ASH, P, N, Ca, and K were all
positively correlated with PC-1; TP, CT, and ADF were negatively
correlated. In PC-2, Ca and ASH were highly positively correlated and
ADF negatively. The PC analysis indicated that if a rhino ate leaves
high in crude protein content, the leaves would also contain high
concentrations of most minerals and low amounts of fiber and tannins.
In contrast, the intercorrelations of the plant chemistry variables in
the non-food plants were different compared with the food plants. In
the non-food plants, N and P were not correlated with ASH, Ca, and K in
PC-1 (Fig. 13). Instead, P and N were positively correlated with PC-2.
The relationships among ASH, Ca, K, TP, CT, and ADF remained similar to
the food plants.
Diet quality. The nutritional quality of diets depended on
the proportions of the various forages and the chemical composition of
those forages. Diet quality was estimated by the sum of the forage
chemical values times weighted diet percentages (Table 8). The rhino''s
diet was characterized as high in fiber (45% ADF); moderate in some
minerals(K, CA, and ASH), phenolic compounds (TP 4.0% and CT 6.8%), and
crude protein (11.3%); but extremely low in phosphorus (0.077%). The
low amount of P in the diet resulted in a high CA to P ratio (12:1).
The large amount of fiber and phenolic compounds in the diet yielded a
Reproduced with permission of the copyright owner. Further reproduction prohibited without permission.

CD■DOQ.CgQ.
■DCD
C/)C/)
8
( O '
3.3"CD
CD■DOQ.Cao3"Oo
CDQ.
■DCD
C/)C/)
PRINCIPAL COMPONENT ANALYSIS
FOODPLANTS
PC — II + I T
• -TP
- I CT
ADF-#
PLANT CHEMISTRY PARAMETERS
•-C A
• -ASH
•-P
N -# # -K
4------- 1------- 1------- 1 PC-1+ 1
Fig. 12. Plant chemistry parameters of mature leaf material, collected from certain Sumatran rhino food plants, plotted on the first 2 principal components. PC-I and PC-II contained 54% of the variance in the data set. N = nitrogen, P = phosphorus, Ca = calcium, K = potassium, TP = total phenolics, CT = condensed tannins, ADF = acid detergent fiber.
"0B)00mwON

CD■DOQ .CgQ .
PRINCIPAL COMPONENT ANALYSIS
■ DCD
C/)C/)
8
ci'
33"CD
CD■ DOQ .CaO3" OO
CDQ .
■DCD
C/)C/)
NON-FOOD PLANTS
P C - + I T
N -«
I 1-------- 1------- F
ADF-#
T P -#
CT
— I
Fig. 13. Plant chemistry parameters of mature leaf material from certain non-food plants, selected randomly along transects, plotted on the first 2 principal components. PC-I and PC-II contained 56% of the variance of the data set. Key: see Fig. 12.
PLANT CHEMISTRY PARAMETERS
# -P
ASH/ • + 1\ PC-I
TlOQfOw
Pnp,c' IlH
Table 8. Chemical composition of Sumatran rhino diets.
Assay Diet composition
ASH (%) 6.68N 1.80P 0.077Ca 0.86K 1.08TP 3.99CT 6.83ADF 44.77
Key: ASH = total ash, N = nitrogen, P = phosphorous, Ca = calcium, K = potassium, TP = total phenolics, CT = condensed tannins, ADF = acid detergent fiber.
Reproduced with permission of the copyright owner. Further reproduction prohibited without permission.

Page 139
crude protein to CX plus ADF ratio of 0.218,
According to a review of the available literature, plants
eaten by Sumatran rhinos contained few plant toxins (Fig. 14). Of the
plant genera with information available, only 3.3% of the feeding cases
were plants known to contain alkaloids, a common plant toxin. About 21%
of the feeding cases were plants known to contain saponins; 33% of the
feeding cases were plant genera recorded as medicinal plants, indicating
the presence of some kind of secondary plant compound. Of the 16 food
plant samples actually screened (K. Chan, pers. comm.), only 2 mature
leaf samples contained alkaloids and 3 samples contained saponins.
Plant parts. Pair-wise comparisons (Table 9) of mature leaf
and stem matter collected from the same plants eaten by rhinos showed
that mature leaves contained consistently higher dry-weight
concentrations of Ash, N, P, Ca, K, and Mg, indicating a higher
concentration of minerals and crude protein in mature leaves. Stem
matter was higher in ADF than mature leaves for all samples. The
concentration of CT was significantly higher in mature leaf material,
but no difference was found in the content of TP. Generally, these data
suggested that mature leaves were much higher in nutrient quality than
stem material, except for the CT assay.
Rhino selection of plant parts for feeding reflected the
nutrient composition of the parts. Excluding fruits, the diet consisted
of 90% mature leaves and 8.6% stem material, showing a strong selection
for mature leaves. For the most part, feeding on stem material may have
been incidental to eating leaves. The lower amount of CT in the stems
Reproduced with permission of the copyright owner. Further reproduction prohibited without permission.

P a g e 1 4 0
ALKALOIDS
ABSENT96.7%
PRESENT 3.3 %
SAPONINS
OTHER SECONDARY COMPOUNDS
ABSENT
— PRESENT 21.3 %
PRESENT 28.2 %
MEDICINAL USES
'USE32.9%
NO USE 67.1 %
Fig. 14. Presence of certain secondary plant compounds in Sumatran rhino food plants. Information extracted from the literature, especially Burkill (1966), Garrick et al. (1968), Chan and Tec (1969), and Chan et al. (1972, 1977).
Reproduced with permission of the copyright owner. Further reproduction prohibited without permission.

Page 141
Table 9, Comparison of the chemical composition of mature leaf and stem material collected from plants eaten by Sumatran rhinos. All values are reported as percent dry matter.
Assay NMature leaf Stem
X SE X SE
Ash (%) 13 6.35 0.68 3.69 0.36 5.46***N 13 1.57 0.18 0.78 0.08 5.86***P 13 0.055 0.004 0.039 0.005 2.55*Ca 13 0,79 0.13 0.55 0.11 4.85***K 13 0.95 0.09 0.71 0.09 2.63*Mg 12 0.35 0.03 0.15 0.02 6.03***TP 10 5.07 1,41 2.53 0.48 2.13*CT 10 6.51 2,19 6.64 1.91 -0.14ADF 10 43.75 4,29 59.74 2.13 -4.23**
^ Paired T-test, two-tailed probabilities. *P<0.05; **P<0.01; ***P<0.001.Key: see Table 8.
Reproduced with permission of the copyright owner. Further reproduction prohibited without permission.
Page 142
may have increased their, palatability,
Unfortunately, little information was available for young
leaves. Usually, the amount of young material available at a feeding
site was too low for the chemical analyses. Only 1 sample of young leaf
material was collected, Ardisia colorata. The young leaves of this
plant were much higher in N, P, and K than mature leaves, but much lower
than mature leaves in ADF and slightly lower in CT. The content of TP
was slightly higher in the young leaves.
Food and non-food plants. The mature leaves of 68 plants
eaten by rhinos were assayed for dry-weight composition of Ash, N, P,
Ca, and K; 55 of the samples were additionally assayed for TP, CT, and
ADF. Thus, complete information of the chemical composition of mature
leaves was available for 55 taxa of food plants. In order to
investigate whether the rhinos selected mature leaves for food based on
their chemical composition, the food plant group was compared with a
group of 25 non-food plants (Table 10), This comparison showed that the
chemical composition of the food plant group was different than the
non-food group. The food plant group contained significantly higher
concentrations of Ash, N, P, and Ca, indicating that the animals
selected plants higher in crude protein and mineral content. Although
the groups were significantly different based on those chemical
parameters, the absolute difference between the means was quite small
for most assays. In contrast, the food plants were much lower in ADF,
indicating a strong selection for plants low in fiber. The mean content
of TP and CT was higher in the food plant group, although neither mean
Reproduced with permission of the copyright owner. Further reproduction prohibited without permission.
Page ]43
Table 10. Comparison of the chemical composition of certain Sumatran rhino food plants collected at feeding sites and a sample of non-food plants collected at points along 3 transects. All values expressed as percent dry matter. For replicate samples of same species, the mean was computed before statistical tests were performed.
AssayFood plants Non -food plants
N X SE N X SE
Ash (%) 68 6.85 0.35 25 5.67 0.45 1.87*N 68 1.71 0.05 25 1.45 0.04 2.99**P 68 0.069 0.002 25 0.057 0.003 2.63**Ca 68 0.80 0.05 25 0.57 0.07 2.65**K 68 1.12 0.07 25 1.02 0.08 0.99TP 55 4.11 0.46 25 3.59 0.47 0.79CT 55 6.33 1.04 25 3.45 0.72 1.79ADF 55 45.82 1.32 25 56.32 1.92 -4.48***
^ Two-sample T-test, two-tailed probabilities. *P<0.05; **P<0.01; ***P<0.001.Key: see Table 8.
Reproduced with permission of the copyright owner. Further reproduction prohibited without permission.
Page 144
was significantly different from the non-food group (P<0.05).
Principal food plants. Discriminant function (DF) analysis
was used to investigate the ability to classify plant samples, based on
their chemical composition, into groups determined by the importance of
the plant genera in the diet. For this analysis, the plant samples were
grouped as principal food plants (genera contributing more than 1.5% of
the diet), non-principal food plants (genera contributing less than 1.5%
of the diet), and non-food plants. With all 3 groups and all 8
variables in the analysis, 2 discriminant functions were derived that
classified 64% of all the cases accurately. DF 1 contained most of the
variance of the data set (88%) and was interpreted as measuring
differences in the concentrations of ADF, CT, and N. DF 2 contained a
small proportion of the variance (12%) and had less discriminanting
power. This function was interpreted as measuring differences in ASH,
CT, ADF, TP, Ca, P, and N. To illustrate intergroup differences, the
group centroids were graphed in a two-dimensional space based on DF 1
and DF 2 (Fig. 15). The best separation among group centroids was
between food and non-food groups, with the non-food space high in ADF
and low in minerals, N. and CT. Separation between principal and
non-principal food plants was poor. The group centroids for principal
food plants lay in a chemical space characterized by high ASH, N, and
TP. The non-principal food group centroid lay in a space high in CT and
ADF. K had little discriminanting power in this analysis.
Use index. DF analysis was used to determine whether plant
Reproduced with permission of the copyright owner. Further reproduction prohibited without permission.
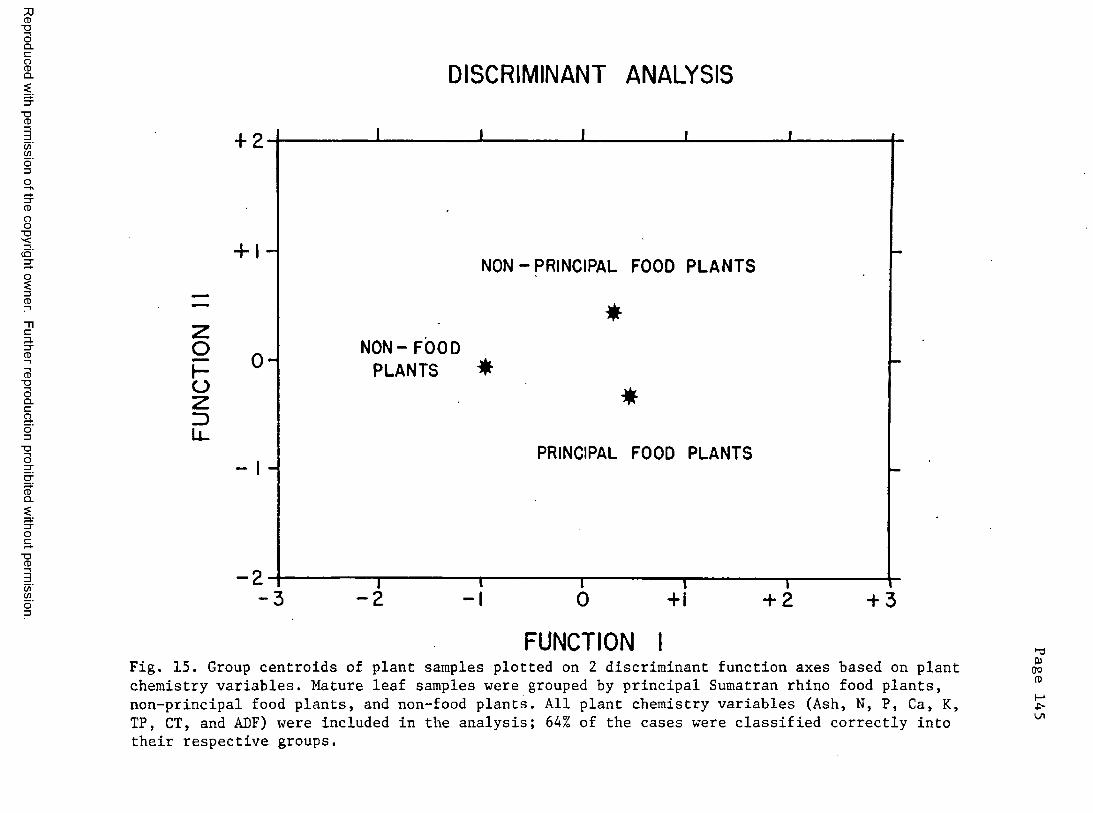
CD■DOQ .CgQ . DISCRIMINANT ANALYSIS■DCD
C/)C/)
8
ci'
33"CD
CD■DOQ .CaO3"OO
CDQ .
■DCD
C/)C/)
+ 2
•4” I —NON-PRINCIPAL FOOD PLANTS
gh-OzZDü_
0 -NON- FOOD
PLANTS $
— I “PRINCIPAL FOOD PLANTS
- 2- 3
T-2 - IT0 +1 + 2 + 3
FUNCTION IFig. 15. Group centroids of plant samples plotted on 2 discriminant function axes based on plant chemistry variables. Mature leaf samples were grouped by principal Sumatran rhino food plants, non-principal food plants, and non-food plants. All plant chemistry variables (Ash, N, P, Ca, K, TP, CT, and ADF) were included in the analysis; 64% of the cases were classified correctly into their respective groups.
"VS3OQ
Ul

Page 146
samples could be separated Into use index groups based on their chemical
composition. The feeding cases were put into 3 groups based on whether
their use index was greater than the overall mean (44), less than the
mean, or whether they were classified as non-food plants. With all 3
groups in the analysis, a significant discriminant function was derived
(P=0.004) that properly classified 53% of the feeding cases into their
respective groups. In this analysis, ADF and CT were the most useful
discriminating variables. DF 1 contained most of the data set's
variance (90%); this function was interpreted as measuring differences
in the concentrations of P, CA, and ADF. The best separation among
group centroids was between food and non-food groups. The chemical
space occuppied by non-food plants was high in ADF, and the food plants
were high in P, CA, and CT. DF 2 had less discriminating power,
essentially separating the food plants grouped by high and low use
indices. The group centroid of the high use index plans lay in a
chemical space high in ASH. P, and K. The group centroid of the low use
index plants lay in a space high in N, CT, and ADF.
Crude protein/digestion inhibitor ratio. Rhino food plants
were ranked based on the ratio of crude protein (N x 6.25) content to CT
+ ADF (Table 11). This ratio (CP/DI) has been found to be a good
measure of forage quality, and is highly correlated with food selection
in some species of primates (McKey et al., 1981). In the rhino food
plants, this ratio ranged from 0.581 to 0.075 for 68 species. Many of
the plants that were principal food plants, or had high use indices,
also had a high CP/DI ratio. The rhino food plant group had a
Reproduced with permission of the copyright owner. Further reproduction prohibited without permission.
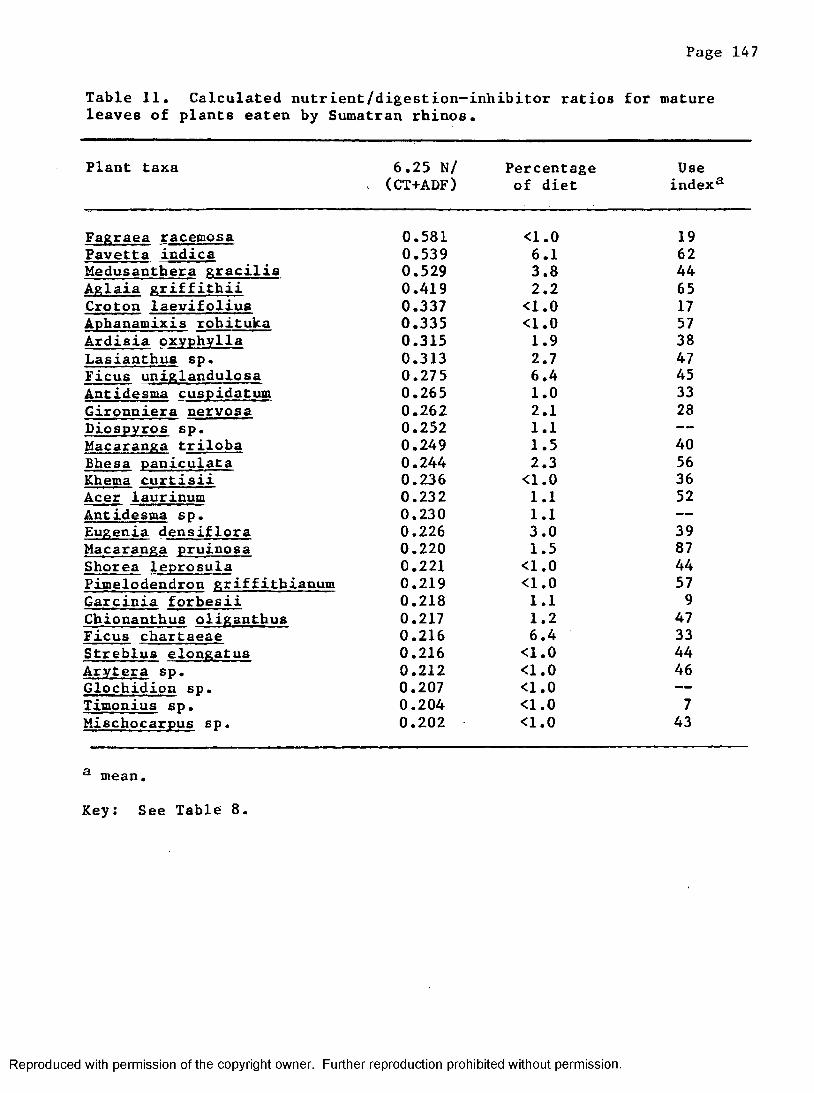
Page 147
Table 11, Calculated nutrient/digestion-inhibitor ratios for mature leaves of plants eaten by Sumatran rhinos.
Plant taxa 6,25 N/ , (CT+ADF)
Percentage of diet
Useindex^
Fagraea racemosa 0,581 <1,0 19Pavetta indica 0,539 6,1 62Medusantbera gracilis 0.529 3.8 44Aglaia griffithii 0,419 2.2 65Croton laevifolius 0,337 <1,0 17Apbanamixis rohituka 0,335 <1,0 57Ardisia oxyphylla 0.315 1,9 38Lasianthus sp. 0,313 2,7 47Ficus uniglandulosa 0,275 6,4 45Antidesma cuspidatum 0,265 1,0 33Gironniera nervosa 0.262 2,1 28Diospyros sp. 0,252 1,1 —Macaranga triloba 0,249 1.5 40Bhesa paniculata 0.244 2,3 56Khema curtisii 0.236 <1.0 36Acer laurinum 0.232 1.1 52Antidesma sp. 0,230 1.1Eugenia densiflora 0.226 3.0 39Macaranga pruinosa 0.220 1.5 87Shorea leprosula 0,221 <1.0 44Pimelodendron griffithianum 0,219 <1.0 57Garcinia forbesii 0,218 1,1 9Chionanthus oliganthus 0,217 1.2 47Ficus chartaeae 0,216 6.4 33Streblus elongatus 0,216 <1,0 44Arytera sp. 0,212 <1,0 46Glochidion sp. 0,207 <1,0Timonius sp. 0.204 <1.0 7Mischocarpus sp. 0,202 <1.0 43
^ mean.
Key: See Table 8.
Reproduced with permission of the copyright owner. Further reproduction prohibited without permission.
Page 148
significantly higher CP/DI ratio than the non-food group (Mann-Whitney,
rank sum test, P<0.001),
DISCUSSION
Sumatran rhinos in the Endau-Rompin study area use the
understory vegetation of mature tropical rain forest for their food
source. Few other mammals attempt this foraging strategy. Indirect
information indicates that the understory of tropical rain forests is a
poor habitat for mammilian herbivores. Mature rain forests of both the
New world and the Old World tropics have a less diverse and less dense
terrestrial ungulate fauna than savanna or grassland habitats (Eisenberg
and McKay, 1974). In southern Asia, the biomass of terrestrial
herbivores declines as forest cover becomes continuous (Eisenberg and
Seidensticker, 1976). Within a mature tropical rain forest, arboreal
herbivores typically constitute a majority of the mammalian biomass
(Eisenberg and Thorington, 1973).
The once sympatric Javan rhino (Rhinoceros sondicus) is the
only other extant rhinoceros that occupies rain forest habitats (Groves,
1967). Presently extinct in Malaysia (Medway, 1969), the Javan rhino
predominantly uses lowland areas covered by riverine, swamp, or more
disturbed forested habitats (Schenkel and Schenkel-Hulliger,
1969; Hoogerwerf, 1970). The African species, the black rhino (Diceros
bicornis) and the white rhino (Ceratotherium simun), and the Indian
Reproduced with permission of the copyright owner. Further reproduction prohibited without permission.
Page 149
rhino (Rhinoceros unicornis) occur in tropical or sub-tropical savanna
or grassland habitats (Goddard, 1970; Owen-Smith, 1975; Laurie, 1982),
Of the 11 species of terrestrial mammalian herbivores found in
Peninsular Malaysia (Medway, 1969), only 7 species occur in the mature
hill forests of Endau-Rompin; none of them are abundant there (Flynn,
unpub1. data). Most of these terrestrial herbivores prefer riverine
areas or disturbed secondary forests for feeding habitats, especially
elephants (Khan, 1977; Olivier, 1978), gaur (Weigum, 1972; Khan,
1973; Conry, 1981), wild pigs, and sambar deer (Medway, 1969). Only the
Malayan tapir (Williams and Petrides, 1980), barking deer, and mouse
deer frequent the mature hill forests that are also used by the rhinos
(Medway, 1969).
Why is the understory of mature tropical rain forest a poor
habitat for most mammalian herbivores? The understory is a unique
habitat for plants. The overstory trees and vines form a nearly closed
canopy, creating a microclimate characterized by constantly high
humidity, relatively constant temperature, and low light intensity
(Richards, 1952), Understory plants must be capable of establishing
themselves and growing in the stable gloom of the high forest. In
addition, tropical soils are generally nutrient poor, especially those
susceptable to rapid leaching (Whitmore, 1975; Jordon and Herrera,
1981). The extensive root systems of overstory trees actively compete
with the understory plants for available nutrients (Richards, 1952).
Thus, understory species commonly persist for many years, but biomass
and reproductive output is greatly reduced by competition with the
Reproduced with permission of the copyright owner. Further reproduction prohibited without permission.
Page 150
forest canopy (Whitmore, 1975). Most understory plants are evergreen,
and once leaves mature, they may remain for several years (Whitmore,
1975).
The slow growth rate and productivity of the mature rain
forest understory were reflected by plant phenology. The vegetative
transects indicated that few young leaves were present; 98% of the leaf
biomass consisted of mature leaves, and only 11% of the stems had young
leaves present. Few flowers or fruits were encountered. Janzen (1977)
had similar observations. He hypothesized that the paucity of flowers
and fruits on understory shrubs had a depressing effect on the biomass
and species richness of the understory fauna. In contrast to the
lowland forests of Costa Rica, Janzen (1977) concluded that the rain
forests of Malaysia sit on a poor piece of real estate. Phenological
studies of the overstory (McClure, 1966; Medway, 1972; Raemaekers et
al., 1980) have recorded a much higher production of young leaves,
flowers, and fruits. Some seasonality in leaf production existed; often
young leaf production peaked during the same months (February to May) in
which the vegetative transects were enumerated.
Each leaf in the understory represents a substantial
investment in nutrients and energy by the plant; resources that are in
short supply in the understory environment. In order to protect their
investment, plants have evolved numerous defensive strategies to avoid
leaf predators. Some plants, especially palms and climbers, are well
protected by physical structures (i.e. thorns, spines, hairs, etc.)
growing from their stems or leaves. Thorns and spines, particularly
Reproduced with permission of the copyright owner. Further reproduction prohibited without permission.

Page 151
effective defenses against foraging terrestrial herbivores, probably
evolved in response to browsing by mammals (Janzen, 1981). Of Malaysian
mammalian herbivores, only elephants are capable of eating plants
protected by thorns (Olivier, 1978).
Some plants escape herbivory by being unpredicatable in space
and time (Feeny, 1976; Rhoades and Cates, 1976), The apparency of most
understory plants in mature rain forests is greatly reduced by the high
species diversity of the habitat. Over 4,000 species of woody plants
occur in forests of Peninsular Malaysia (Whitmore, 1972); most of them
are relatively rare and widely scattered in the understory (Whitmore,
1975). Aggregations of like individuals are seldom found, except in old
fields, secondary forests, or forest gaps (Symington, 1933; Kochummen
and Ng, 1977). In most ecological studies, stems smaller than 10cm DBH
are rarely enumerated because of the vast number of species encountered
(Poore, 1968; Whitmore, 1975) and the ephemeral nature of many juvenile
trees (F. Ng, pers. comm.). In this study, Eugenia sp. was the most
common genus of the understory plants, but comprised less than 6% of the
stand. Most plant species probably contributed fewer than 1% of the
understory stems.
Tropical rain forest plants use several chemical defensive
strategies to avoid leaf predation (Rhoades and Cates, 1976). These
plants contain a variety of secondary plant metabolites that influence
food selection by mammalian herbivores (Freeland and Janzen,
1974; Rosenthal and Janzen, 1979). Tannins and alkaloids, two classes
of secondary compounds that have received the most attention, are
Reproduced with permission of the copyright owner. Further reproduction prohibited without permission.
Page 152
widespread in tropical vegetation (Burkill, 1966; Levin and York,
1978; McKey et al., 1978; Gartlan et al., 1980; Oates et al.,
1980; Waterman et al., 1980; Becker, 1981). Generally, high
concentrations of tannins, or other large phenolic compounds, reduce
forage quality by interfering with animal metabolism, complexing with
plant proteins, or inhibiting gut microfloras (Feeny, 1970; Freeland and
Janzen, 1974; Rhoades and Cates, 1976; Becker, 1982). Mature leaves
from woody plants collected in Endau-Rompin contained high
concentrations of total phenolics (x=3.9%, n=80) and condensed tannins
(SE=5.4%, n=80). Phenolic compounds were absent from only 2 species.
Compared with other rain forest sites, concentrations of condensed
tannins in mature leaves from Endau-Rompin were similiar to those
reported from tropical rain forest sites in Douala-Edea, Cameroon,
(Gartlan et al., 1980) and Kakachi, India (Oates et al., 1980), but they
were much higher than at Kibale, Uganda (Gartlan et al.,
1980; P. Waterman, pers. comm.).
Alkaloids constitute the largest single class of secondary
plant products in flowering plants (Levin and York, 1978). Because many
alkaloids are potent poisons, they play a prominent role in plant
chemical defense (Rhoades and Cates, 1976). The toxicity of alkaloids
from tropical plants is greater than those from temperate plants (Levin
and York, 1978). Phytochemical screening studies in Malaysia (Carrick
et al., 1968; Chan and Teo, 1969, 1972; Chan et al., 1977) indicate that
11 to 22% of the forest plants contain alkaloids. Gartlan et al.
(1980) found that 8% of the trees sampled at Douala-Edea contained
Reproduced with permission of the copyright owner. Further reproduction prohibited without permission.
Page 153
alkaloids compared with 37% at Kibale.
Plants may use low nutrient quality (Moran and Hamilton, 1980)
or poor digestibility (Van Soest, 1982) as a defense against herbivores.
By providing a low supply of nutrients or making them difficult to
extract, plants present a potential food source that yields a lower net
benefit to an animal. Often plants may sustain growth on levels of
mineral that will not support animal growth (Van Soest, 1982). Mature
leaf foliage from a variety of Endau-Rompin plants contained
consistantly low concentartions of mineral nutrients, indicating a
forage of low nutritive quality. Phosphorus content was quite low
(x=0.066%, n=93), especially compared with calcium (x=0.74%, n=93) (Ca:P
ratio = 11:1). Crude protein content was also low (x=10.2%, n=93)
compared with other rain forest sites (P. Waterman, pers. comm.). In
addition, protein availability was probably reduced by the high tannin
content. High concentrations of structural carbohydrates and lignin,
expressed as ADF, further reduced forage quality. Cellulose can be
degraded only by microbes; lignin is undigestible (Van Soest, 1982).
Endau-Rompin foliage averaged 49% ADF, indicating high fiber content and
low digestibility (Waterman et al., 1980).
Stem material was consistantly poorer quality forage compared
with mature leaves. Concentrations of crude protein, ash, and minerals
were substantially higher in mature leaves. Percent composition of
fiber in stems was 16% more than in mature leaves. The only indicator
of poor quality forage higher in mature leaves than stems was the
condensed tannin assay.
Reproduced with permission of the copyright owner. Further reproduction prohibited without permission.
Page 154
Forest gaps play a prominent role in the successional dynamics
of tropical rain forests (Hartshorn, 1978; Whitmore, 1978). These gaps,
created by the death and collapse of large forest trees, are filled by
juvenile trees growing in the understory or by invading species. As the
understory trees grow to maturity, the gap is closed and the rebuilding
forest returns to the mature closed-canopy phase. Primary forest
consists of a near random mosaic of gap, rebuilding, and mature
successional stages. Gaps in the forest canopy provide a better growing
environment for many plants. The quantity and quality of light reaching
the understory are increased, and nutrients are released as dead plants
decay. Also, a temporary decrease in root competition occurs. Gap size
has an important influence on species composition and growth rates. In
small gaps, existing shade-tolerant seedlings and saplings commence more
rapid growth. Larger gaps encourage the establishment of more
light-demanding species, plants more typical of secondary forests.
Often, these pioneer species form small monotypic stands, especially in
large openings (Whitmore, 1975).
Experimental research suggests pioneer plants are more
palatable to generalist herbivores than late successional plants (Cates
and Grians, 1975; Coley, 1980; Hartshorn, 1978), though exceptions exist
(Otte, 1975; Majorana, 1977). Generally, late successional species are
more apparent in the habitat (Feeny, 1976). Thus, they are expected to
contain greater concentrations of defensive chemicals, particularly
substances that reduce digestibility (Feeny, 1976). In contrast,
rapidly growing pioneer plants should contain higher concentrations of
Reproduced with permission of the copyright owner. Further reproduction prohibited without permission.
Page 155
soluble cell contents and less fiber. Because of the high metabolic
cost of tannins, pioneers may depend on small quantities of plant toxins
(i.e. alkaloids, saponins, etc.) for chemical defense (Rhoades and
Cates, 1976).
About 15% of the Selai study site was in the gap successional
stage. The remainder of the forest was in a closed-canopy phase, either
rebuilding or mature. All gaps were small in area (<0.1 ha), created by
a single or multiple tree falls, and widely scattered. Because of their
small size, most gaps contained plants typical of the adjacent forest
understory. Clumps of pioneers, especially Macaranga sp., were found
only along river banks.
All animals must capture nutrients to live and leave
offspring. Optimal foraging theory attempts to explain and predict many
aspects of foraging behavior (see Pyke et al., 1977). Natural selection
should favor animals that maximize their rate of net intake of positive
nutrient, while avoiding toxic situations. As an animal forages, it
chooses where to feed, what to eat, how long to stay in a habitat patch,
and its path among habitat patches. Generally, a foraging animal should
select habitats with the greatest abundance of preferred foods, choose
foods that provide it with the greatest net benefit, feed in a habitat
patch until its rate of food intake drops below some average, and move
so that the maximum number of preferred foods are encountered (Pyke et
al., 1977). Because of the complex chemical nature of vegetation,
optimal foraging theory has been unable to adequately predict diets of
large generalist herbivores (Westoby. 1974). Westoby (1974, 1977)
Reproduced with permission of the copyright owner. Further reproduction prohibited without permission.
Page 156
suggests several factors that cause large generalist herbivores to
select more diverse diets than optimal foraging theory would predict.
Diverse diets in these animals, including rhinos, may result from them
sampling plants for palatibility, balancing nutrition by mixing their
diet, and selecting plants or plant parts based on changes in abundance
or phenology.
Mammals possess morphological and physiological adaptations
for a particular feeding habit, especially specializations of the
dentition and digestive system. Ungulate evolution has resulted in 2
major groups, perissodactyls and artiodactyls, that arose from a common
"proto-ungulate" ancestor (Janis, 1976). Although these 2 ungulate
groups have different external morphological characteristics, the
ecologically important difference is the anatomy of their digestive
systems (Foose, 1982). In the artiodactyls, microbial fermentation of
foods occurs in the rumen, a greatly enlarged and complicated
forestomach. Consequently, ingested vegetation is subjected to
microbial fermentation before reaching the normal sites of mammalian
digestion and absorption in the stomach and intestines. The ruminent
systems appears to maximize the extraction of energy and protein per
unit of vegetation consumed, but the reticulo-omasal orifice retards the
passage of fibrous particles through the gut (Van Soest, 1982). Also,
gut microbes may be effective and versatile in detoxifying plant poisons
(Freeland and Jansen, 1982). Because of the rumen's forward position,
plant toxins would be detoxified before they could be absorbed into the
ungulate's body.
Reproduced with permission of the copyright owner. Further reproduction prohibited without permission.
Page 157
In perissodactyls, fibrous materials are fermented by
microbial activity in an enlarged colon and/or prominent cecum (Parra,
1978; Van Soest, 1982). The processes of fermentation are similiar in
both groups, but in nonruminents the site is located after the normal
sites of enzymatic digestion and absorption (Janis, 1976; Parra,
1978; Foose, 1982). Most soluble carbohydrates and proteins are
digested prececally by enzymatic action (Parra, 1978). In general,
nonruminants digest fiber to a lessor extent, but they can extract more
nutrients per unit time by faster passage rates and greater intakes of
forage (Parra, 1978; Foose, 1982). Also, nonruminents minimize nutrient
requirements per unit weight by enlargement of their body sizes. Thus,
the nonruminent system may be advantagous in highly fibrous vegetation
(Foose, 1982), especially if foods are available in sufficient
quantities. In regards to plant poisons, hindgut fermenters are at a
disadvantage because ingested plant toxins can be absorbed into the
animal's body before encountering detoxifying microbes (Freeland and
Janzen, 1974; Foose, 1982). Because the nonruminent system is less
effective in detoxifying secondary plant compounds than the ruminent
system, nonruminents would be expected to avoid or consume small amounts
of potentially poisonous plants. On the other hand, their large body
size may allow nonruminents to tolerate certain secondary plant
compounds in the diet, especially the digestion-reducing compounds.
Sumatran rhinos, like all herbivores, are expected to select
the least fibrous, most nutritious, least toxic plants available; but
they are adapted to subsist on abundant, fibrous, low-quality forage.
Reproduced with permission of the copyright owner. Further reproduction prohibited without permission.

Page 158
Foose (1982) reports that browsing rhinos are adapted to eat highly
lignified vegetation that contains abundant digestible cell solubles but
little fermentable fiber. Because tropical rain forest understory
foliage contains low concentrations of minerals and proteins and high
amounts of fiber and secondary plant compounds, these rhinos would be
expected to be selective in choosing foods, attempting to extract
sufficient quantities of minerals and proteins while avoiding plant
poisons.
The feeding behavior and diet of Sumatran rhinos in
Endau-Rompin were similiar to those expected, given habitat conditions
and feeding adaptations. Habitat and food selection were strongly
influenced by their availability and quality. These rhinos were found
to be animals of the hill forests, primarily occurring above 300 m.
Within the Endau-Rompin region, rhino density was highest in hill forest
habitats, although adjacent lowland habitats were also used (Flynn and
Abdullah, 1983a). Elsewhere in Malaysia, Sumatran rhinos occurred
mostly in hill forest habitats (Flynn and Abdullah, 1983b), In Sumatra,
Borner (1978) found Sumatran rhinos using mostly hill and montane forest
types, particularly in the mountainous Gunung Leuser Reserve.
Historically, Sumatran rhinos were widely distributed, occurring in
habitats ranging from coastal swamps to high mountains (Van Strien,
1974). Rhinos have been eliminated from most of their former range by
hunting, leaving remnant populations. Human encroachment of lowland
areas probably had a major impact on present rhino distribution. In
Endau-Rompin, rhinos were gradually eliminated from most lowland areas
Reproduced with permission of the copyright owner. Further reproduction prohibited without permission.

Page 159
with human encroachment, especially agricultural development and human
settlement (Flynn and Abdullah, 1983a).
The selection of hill forest habitats may be influenced by
behavioral factors. Hill forest sites are substantially cooler than
adjacent lowland areas (Dale, 1963). The mean daily air temperature at
the Selai base camp was 3 C cooler than at Segamat, a lowland site.
Also, many suitable wallowing sites are available on the ridges and
along the small streams of the study area. The lack of large predators,
particularly tigers, in most hill forest sites may result in higher
rhino survival there. Laurie (1978) reports that in Nepal and India
tigers kill Indian rhino calves. Sumatran rhinos, being substantially
smaller than Indian rhinos, would be susceptable to tiger predation
until a greater age. Tigers were seldom observed in the hill forests of
Endau-Rompin (Flynn, unpubl. data).
Within hill forest, rhinos selected habitats for feeding
delineated by physiography and canopy cover. Stream bottom and lower
slope physiographic types were selected for feeding; upper slopes were
avoided. Stream bottoms contained a higher mean density of woody
saplings and a greater amount of total leaf biomass, indicating a
greater availability of food. Also, the density of certain principal
food plants (i.e. Prunus sp. and Eugenia sp.) were higher in lower
slope types. Although not specifically studied, foliage collected from
stream bottom and lower slope types contained higher mean concentrations
of minerals, suggesting a forage of higher nutritional quality.
Alluvial soils in stream bottoms would be expected to contain more
Reproduced with permission of the copyright owner. Further reproduction prohibited without permission.

Page 160
mineral nutrients than upland sites (Smallwood, 1966). Upper slopes
were used mostly for travel; ridges were frequently used as travel
corridors between drainages.
Talbot (1960) and Strickland (1967) stated that the Sumatran
rhinoceros was an animal of secondary forest. Contrarily, I found them
to select small forest gaps within primary forest for feeding sites.
Selected forest gaps were always small (<0.1 ha), and plant composition
within the gaps was not substantially different than the understory of
the adjacent forest. Although gaps were selected for feeding, most of
the feeding sites (59%) were in the closed-canopy forest, and most of
the feeding cases (75%) were plants typical of closed-canopy forest.
Gaps were widely scattered, almost randomly distributed in the forest,
and occupied a small proportion (15%) of the available habitat. Thus
feeding exclusively in gaps would require a significant amount of search
time. Plants growing in gaps may be slightly more nutritious but
probably not enough to warrant feeding exclusively in them. Many gap
plants may use toxins as their chemical defense (Feeny, 1976; Hartshorn,
1978); thus, they may be avoided by rhinos. In large gaps or open areas
(i.e. river banks) with small clumps of similiar species, multiple
individuals of a species were seldom eaten at a feeding site. On
several occassions, only 1 individual from a clump of Macaranga sp. was
eaten. Only a few large openings occurred in the study area, and they
were seldom used. In adjacent areas, feeding in large openings was
sometimes encountered, but the areas were not far from primary forest.
Feeding in large openings was probably done during the cooler portions
Reproduced with permission of the copyright owner. Further reproduction prohibited without permission.
Page 161
of the day,
Sumatran rhinos were found to be generalist herbivores,
feeding on a great variety of plant taxa in the forest understory. In
342 feeding cases, food plants were represented by 49 plant families,
102 genera, and from 136 to 181 species. An exhaustive list of plants
eaten would probably contain nearly every species growing in the study
area, but most would contribute little to diet proportions. Thus,
simple plant lists provide little information on rhino feeding ecology.
Although the diet contained a large number of plant taxa, 75% of the
total bites were from 30 genera. These plant genera were considered the
rhino's principal food plants. Unfortunately, good information on the
species composition of the understory was not available. The limited
available information on understory composition indicated that some
principal foods were relatively common in the understory, but most were
relatively rare, comprising less than 1% of the stand.
Species diversity of rhino diets reflected diversity in the
under story of tropical rain forests. The total number of plant species
in the study area was unknown, but over 4100 species of woody plants
have been collected in Peninsula Malaysia (Whitmore, 1972). Wyatt-Smith
(1966) found over 210 species of trees (over 10 cm DBH)in a 1.6 ha plot
of lowland forest. A nearby plot contained an almost completely
different set of species. The large number of plant taxa in the diet
indicated that many plants could be eaten by the rhinos, but the low use
indices suggested that most plants were only sampled for palatability.
Also, diet diversity suggested that the rhinos were attempting to mix
Reproduced with permission of the copyright owner. Further reproduction prohibited without permission.

Page 162
their diet, probably to obtain a good balance of nutrients while
avoiding toxic dosages of secondary plant compounds.
Woody plants, including shrubs, small trees, vines, and
juveniles of overstory trees, were almost exclusively selected for
forage. Although common in the understory, herbacious plants were only
eaten once. Also, palms were seldom eaten. Generally, rhinos ate the
food resource most available to a terrestrial herbivore. The mean
density of woody saplings in the understory was 5370 stems/ha; the total
leaf biomass was estimated at 390 kg/ha. Plants with woody stems
greater than 3.5 cm were seldom selected for food. Apparently, larger
stems were difficult to break or push to the ground.
By plant part, the rhino's diet consisted of mostly mature
leaves; young leaves comprised a small proportion of the diet. Stem
material was often eaten along with mature leaves. Rhinos seldom
browsed stems larger than 5 mm in diameter, although size was quite
variable. Generally, rhinos selected plant parts based on availability
and nutritional quality. Young leaves were rare in the
understory; stems were low in nutrients and high in fiber. Most
arboreal folivores in rain forest habitats show a strong preference for
young leaves, seeds, or fruits (Chivers, 1980; Oates et al., 1980; McKey
et al., 1981). Fruits were also an important part of the rhinos diet,
but amounts eaten were difficult to quantify. Most large fleshy fruits
were eaten when available, especially mangos. Fruits and seeds are high
in minerals and digestible energy (McKey, 1978), generally good food
packets. Fruits may provide important accessory nutrients that
Reproduced with permission of the copyright owner. Further reproduction prohibited without permission.
Page 163
subsidize digestion of the high-toxin low-nutrient leaf portion of the
diet (McKey, 1978). Also, Foose (1982) states that the nonruminant
digestive system is adapted to efficiently digest fruits. Apparently,
Sumatran rhinos spend a considerable amount of time searching for
fruiting trees. During a major fruiting period, rhino tracks frequently
led to fruiting trees. On other occasions, rhino trails passed under
trees that had been in fruit previously. Rhinos may be important seed
disperser6 for trees with large fleshy fruits.
Nutritional quality of the diet of Sumatran rhinos was
generally low. Diet was characterized by low levels of minerals and
crude protein, and high concentrations of fiber and phenolics.
Phosphorus content was especially low (0.077%) and may have been a
limiting factor. Although little information has been available on the
nutritional requirements of rhinos, Robinson and Slade (1974)
recommended that horses should have a diet containing about 0.45%
phosphorus and calcium with a Ca:P ratio not exceeding 2:1. Low
phosphorus levels in the diet have a substantial impact on recruitment
in most mammals by reducing fertility in females and survival of young.
Rhinos may have improved the mineral content of their diet by eating
fruits. Crude protein content (11.3%) of the diet was relatively low,
especially considering the high condensed tannin content (4.8%). By
complexing with plant and animal proteins, tannins and phenolics
probably reduced protein digestibility. Fiber, expressed as ADF, was
high (45%) in the diet. Choo et al. (1981) found the ADF assay highly
inversely correlated with dry matter digestibility. Because of
Reproduced with permission of the copyright owner. Further reproduction prohibited without permission.
Page 164
digestive system adaptations, rhinos were able to exploit a high fiber
diet. Apparently, rhinos were able to tolerate tannins and phenolic
compounds in the diet, possibly by passing them quickly through the
digestive system (Foose, 1982), Limited information from the literature
suggested that the diet contained few plants with alkaloids or saponins.
Plant chemistry influenced food selction by Sumatran rhinos.
Generally, rhinos ate available mature leaves that provided the best
food packet. Mature leaves of certain food plants contained
significantly higher mean concentrations of most minerals (ASH, P, Ca)
and crude protein compared with plants collected randomly along
transects. The mean content of ADF in food plants was substantially
lower, indicating that fiber was a strong factor affecting food
selection. Discriminant function analysis showed good separation
between group centroids of principal food plants and non-food
plants; plants contributing little to diet proportions were
intermediate. Over 64% of the plant samples were classified accurately
into their respective groups, based on plant chemistry, using DF
analysis. In contrast to the other 2 groups, principal food plants lay
in a chemical space that was high in minerals, N, and TP, but low in ADF
and CT. Non-food plants were high in ADF and low in minerals and N.
The DF analysis indicated that plants eaten in the greatest amounts
contained more minerals and crude protein. Plants high in phenolic
compounds were eaten, but plants high in condensed tannins were used
less. Other phenolic compounds, expressed as TP, did not adversely
affect food selection. Sometimes phenolic compounds complex with
Reproduced with permission of the copyright owner. Further reproduction prohibited without permission.
Page 16 5
alkaloids to form insoluble tannins (Freeland and Janzen, 1974). Any
detoxification of alkaloids may result in a plant being more palatable
to a rhino, thus possibly acounting for the high phenolic content of the
diet.
Although high in the diet, some plant taxa were below average
in nutritional quality. Some plants, i.e. Eugenia sp. and Prunus sp.,
were relatively common in the understory. These plant taxa probably
provided some net benefit to the animals without introducing plant
toxins; their high availability made them suitable forage. Plants that
were high in nutrient content but low in the diet probably contained
plant toxins, or they were rare in the habitat.
In conclusion, Sumatran rhino feeding ecology was influenced
by the availability and quality of foods. In general, mature leaves
selected for food contained relatively high levels of most minerals and
crude protein, but low amounts of fiber and condensed tannins. Leaves
containing plant toxins were probably avoided. The high plant species
diversity in the habitat resulted in the rhinos having a diverse diet.
Also, diet diversity was probably influenced by the rhinos sampling
plants for palatability, balancing the nutritional composition of their
diet, and mixing their diet to avoid toxic dosages of secondary plant
compounds.
ACKNOWLEDGMENTS
Reproduced with permission of the copyright owner. Further reproduction prohibited without permission.
Page 166
Financial support for this study was provided by the Malaysian
Department of Wildlife and National Parks, World Wildlife Fund
International, the National Wildlife Federation, the Smithsonian-Peace
Corps Environmental Program, and the Montana Cooperative Wildife
Research Unit. My special thanks to Mr, Mohd. Khan bin Momin Khan,
Director-General, DWNP, for his support for this project. Other DWNP
personnel, especially L, Ratnam, Abdullah Ibrahim, and Mohd, Tajuddin
Abdullah, contributed many ideas and assisted in the field work. The
assistance of Drs. R, and L, Schenkel, A, Fernhout, and J, Sherbourne in
obtaining additional funding is gratefully acknowledged. My many thanks
to Dr, Peter Waterman, Phytochemistry Research Laboratory, Unversity of
Strathclyde, Mr, Chan Khoon San, Highlands Research Unit, and
Dr, K, C, Chan, University of Malaya, for completing the chemical
analyses of the plant materials, Mr, K, Kochummen and Dr, Francis Ng,
Forest Research Institute, identified most of the plant materials and
provided information on their ecological characteristics. Many people
provided ideas that were incorporated into this paper, especially
P, Becker, P, Conry, C, Marsh, R, Ream, M, Thomas, P. Waterman, M, Wong,
and J, Wright, Drs, B, O'Gara, C, Jonkel, and A, Sheldon provided many
useful comments on the manuscript, C. Connor, B, Bakken, and D,
Williams drafted the figures, P, Conry typed and edited parts of the
manuscript. My warmest appreciation to Kang Kong bin Mintol and the
other members of Kampung Juaseh for sharing their intimate knowledge of
the Endau-Rompin forests with me.
Reproduced with permission of the copyright owner. Further reproduction prohibited without permission.
Page 167
REFERENCES
Andau, P. and J. Payne. (1982), The plight of the Sumatran rhinoceros in Sabah. Sandakan, Malaysia, Sabah For. Dep. (Unpublished report).
Becker, P. (1981), Potential physical and chemical defences of Shores seedling leaves against insects. Malay. For., 44. 346-356.
, (1982). Protein-binding capacity in Shores(Dipterocarpaceae) seedling leaves. J. Chem. Ecol., 8, 1353-1367.
Borner, M. (1978). A field study of the Sumatranrhinoceros. Ph.D. thesis. Univ. Basel, Switzerland.
Bryant, J. P. (1981), Phytochemical deterrence of snowshoe hare browsing by adventitious shoots of four Alaskan trees. Science, 213, 889-890.
Burkill, I. H. (1966), Dictionary of the economic products of the Malay Peninsula. Kuala Lumpur, Ministry of Agric, Reprinted.
Garrick, J., K. C. Chan, and H. T. Cheung. (1968). A new phytochemical screening of Malaya, I. Chemical screening. Chem. Pharm. Bull., 16, 113-118.
Cates, R. G. and G. H. Orians. (1975). Successional status and the palatability of plants to generalized herbivores. Ecology,56, 410-418.
Chan, K. C. and L. E. Teo. (1969). A new phytochemical survey of Malaya. II, Chemical screening. Chem. Pharm. Bull., 17, 1284-1286.
_________ ., and __________. (1972). A new phytochemical survey ofMalaya. Ill, Chemical screening, Chem. Pharm. Bull., 20, 1582-1584.
___ ., Kok Fef Mak, and (1977). A new pytochemicalsurvey of Malaya. IV. Chemical screening. Chem. Pharm. Bull., 25, 1826-1829.
Chivers, D. (1980). Ed. Malayan forest primates. Ten years'' study of tropical rain forest. New York, Pleum Press.
Reproduced with permission of the copyright owner. Further reproduction prohibited without permission.
Page 168
Choo, G. M,, P. W. Waterman, D, B. McKey, andJ. S. Gartlan. (1981). A simple enzyme assay for dry matter digestibility and its value in studying food selection by generalist herbivores. Oecologia (Berl.), 49, 170-178.
Coley, P. (1980). Effects of leaf age and life history patterns onherbivory. Nature, 284, 545-546.
Conry, P. (1981). Habitat selection and use by the Malayan gaur in central Pahang, Malaysia. M. S. thesis. Univ. Montana, Missoula.
Cooley, W. and P. Lohnes. (1971). Mulitivarite data analysis. NewYork, John Wiley and Sons.
Dale, W. (1959). The rainfall of Malaya. J. Trop. Geogr., 13,23-37.
____________ (1963). Surface temperatures in Malaya. J. Trop. Geogr.,17, 52-71.
Dixon, L. and J, Brown. (1979). BMDP biomedical programs: P series. Berkely, Univ. Calif.
Eisenberg, J. F. and R. W. Thorington. (1973). A preliminary analysis of a neotropical mammal fauna. Biotropica, 5, 150-162.
_________ ., and G. M. McKay. (1974). Comparison of ungulateadaptions in the New World and Old World tropical forests with special reference to Ceylon and the rainforests of Central America. In The behavior of ungulates and its relation to management, ed. by V. Geist and F. Walter, 585-602. lUCN Publ. New Ser., 24. Morges, Switzerland.
., and J. Seidensticker. (1976). Ungulates in southernAsia: a consideration of biomass estimates for selected habitats. Biol. Conserv., 10, 293-308,
Evans, G. H. (1905). Notes on rhinoceros in Burma. J. Bombay Nat. Hist. Soc., 16, 555-561.
Feeny, P. (1970). Seasonal changes in oak leaf tannins and nutrients as a cause of spring feeding by winter moth caterpillars. Ecology, 51, 566-581.
_____. (1976). Plant apparency and chemical defense. RecentAdv. Phytochem., 10, 1-40.
Reproduced with permission of the copyright owner. Further reproduction prohibited without permission.
Page 169
Flynn, R, (1978). The Sumatran rhinoceros in the Endau-RompinNational Park of Peninsular Malaysia. Malay. Nat., 4, 5-12.
_________ ., and M. Tajuddin Abdullah. (1983a), Distribution andnumber of Sumatran rhinoceros in the Endau-Rompin region of Peninsular Malaysia. Malay. Nat, J., in press.
and __________. (1983b). The distribution and status ofthe Sumatran rhinoceros in Peninsular Malaysia, Biol. Conserv., in press,
Foose, T. (1982). Trophic strategies of ruminents andnonruminents. Ph.D. thesis. Univ. Chicago, Chicago, Illinois.
Forest Department. (1977). Forest resources of Peninsular Malaysia. Kuala Lumpur, Dep. For.
Freeland, W. and D. Janzen. (1974). Strategies in herbivory by mammals: the role of secondary plant compounds. Am. Nat.,108, 269-286.
Garten, C. T. (1978). Multivariate perspectives on the ecology of plant mineral element composition. Am, Nat., 112, 533-544.
Gartlan, J. S., P. G. Waterman, D. B. Mckey, C. N. Mbi, and T. T. Struhsaker. (1980). A comparative study of the phytochemistry of two Africanrainforets, Biochem. Systematics and Ecol., 8, 401-422.
Gobbett, J. and C. Hutchison. (1973). Eds. The geology of the Malay peninsula. New York, John Wiley and Sons.
Goddard, J. (1970). Food preferences of black rhinos in Tsavo National Park. East Afri. Wildl. J., 8, 145-161.
Groves, C. P. (1967). On the rhinoceros of Southeast xAsia. Saugetierk. Mitt., 15, 221-237.
_________ ., and F, Kurt. (1972), D icerorhinussumatrensis. Mammal. Species, 21. Am. Society Mammal. +
Gyekis, K. (1966). Segamat District. Forest Reconnaissance Survey, For. Res. Inst. Rep. No. 7., Kepong, Malaysia.
Hartshorn, G. S. (1978). Tree falls and tropical forestdynamics. In Tropical trees as living systems, ed, by P, Tomlinson and M, Zimmermann, 617-638, New York, Cambridge Univ. Press.
Reproduced with permission of the copyright owner. Further reproduction prohibited without permission.
Page 170
Hobbs, N . , D* Barker, J. Ellis, and D. Swift. (1981). Composition and quality of elk winter diets in Colorado. J. Wildl. Manage., 45, 156-171.
Hoogerwerf, A. (1970). Udjung Kulon. The land of the last Javan rhinoceros. Leiden, Brill.
Hubback, T. (1939). The Asiatic two-horned rhinoceros, J. Mammal., 20, 1-20.
James, F, C. and H. H. Shugart, (1970). A quantitative method of habitat description, Audubon Field Notes, 24, 727-736.
Janis, C, (1976). The evolutionary strategy of the equidae and the origions of rumen and cecal digestion. Evolution, 30,757-774.
Janzen, D. (1977). Promising directions of study in tropical animal-plant interactions. Ann. Missouri Bot, Gard., 64, 706-736.
_________ . (1978), Complications in interpreting the chemicaldefense of trees against tropical arboreal plant-eating vertebrates. In The ecology of arboreal folivores, ed. by G. Montgomery, 78-84. Washington, Smithsonian Inst. Press,
. (1981). Patterns of herbivory in a deciduousforest. Biotropica, 13, 271-282.
Jordon, C, F. and R. Herrera. (1981). Tropical rain forests: are nutrients really critical? Am. Nat,, 117, 167-180.
Khan, Mohd. (1973). Studies of the seladang (Bos gaurus) in the state of Perak, Malay. Nat. J., 26, 163-169.
_________ (1977). Utilization of plants and fruits byelephants. Malay. Nat. J., 30, 35-38.
Kochummen, K. M. and F. S. P. Ng. (1977). Natural plant succession after farming in Kepong. Malay. For., 40, 61-78.
Laurie, A. (1978). The ecology and behavior of the greaterone-horned rhinoceros, Ph.D. thesis, Univ. Cambridge, UK.
_______ . (1982). Behavioral ecology of the greater one-hornedrhinoceros. J. Zool., 196, 307-342.
4-
Reproduced with permission of the copyright owner. Further reproduction prohibited without permission.
Page 171
Lee, D. (1980). The sinking ark. Kuala Lumpur, Heinemann Books.
Levin, D. A. (1971). Plant phenolics: an ecological perspective. Am. Nat., 105, 157-181.
__________., and B. M. York. (1978). The toxicity of plantalkaloids: an ecological perspective. Biochem. Systematics and Ecol., 6, 61-76.
Maiorana, V. C, (1978), What kinds of plants do herbivores really prefer? Am. Nat., 112, 631-635.
Marcum, C. L. and D. 0. Loftsgaarden. (1980). A nonmappingtechnique for studing habitat preferences. J. Wildl, Manage., 44, 963-968.
Martin, E. B. (1979). The international trade in rhinoceros ^products. Gland, Switzerland, WWF/IUCN.
McClure, H. (1966). Flowering, fruiting, and animals in the canopy of a tropical rain forest. Malay. For., 29, 182-203.
McKey, D. (1978). Soils, vegetation, and seed-eating by blackcolobus monkeys. In The ecology of arboreal folivores, ed, by G. Montgomery, 423-437. Washington, Smithsonian Inst. Press.
, P. W. Waterman, C. N. Mbi, J. S. Gartlan, andT. S. Struhsaker. (1978). Phenolic content of vegetation in two African rain forests: ecological implications. Science, 202, 61-64.
., J. S. Gartlan, P. W. Waterman, andG. M. Choo. (1981). Food selection by black colobus monkeys (Colobus satanas) in relation to plant chemistry. Biol. J. Linn. Soc., 16, 115-146.
McNeely, J. and A. Laurie. (1977), Rhinos in Thailand. Oryx, 13, 486-487,
Medway, L. (1969). The wild mammals of Malaya and Singapore. Kuala Lumpur, Oxford Press.
__________. (1972). Phenology of a tropical rain forest inMalaya, Biol. J. Linn. Soc,, 4, 117-146.
Moran, N. and W. Hamilton. (1980). Low nutritive quality as a defense against herbivores. J. Theor. Biol., 86, 247-254.
Reproduced with permission of the copyright owner. Further reproduction prohibited without permission.
Page 172
Morrison, D, (1967), Multivariate statistical methods. New York, McGraw-Hill.
Mueller-Dombois, D. and H. Ellenberg. (1974). Aims and methods of vegetation ecology. New York, John Wiley and Sons.
Nie, J., Hull, J. Jenkins, K. Steinbrenner. andD. Bent. (1975). Statistical package for the social sciences. Chicago, McGraw-Hill.
Oates, J. F . , P. W . Waterman, and G . M. Choo. (1980). Foodselection by the South Indian leaf-monkey. Presbytia 4ohnii. in relation to leaf chemistry, Oecologia (Berl.), 45, 45-56.
Olivier, R. C. D. (1978). On the ecology of the Asian elephantElephas maximus Linn, with particular reference to Malaya and Sri Lanka. Ph.D. thesis. Cambridge Univ., UK.
Otte, D. (1975). Plant preference and plant succession: a consideration of evolution of plant preference in Schistocerca. Oecologia (Berl.), 18, 129-144.
Owen-Smith, N. (1975). The social ethology of the white rhinoceros (Ceratotherium simum Burchell 1817). Z. Tierpsychol., 38, 337-384.
Parra, R. (1978). Comparision of foregut and hindgut fermentation in herbivores. In The ecology of arboreal folivores, ed. by G. Montgomery, 205-229. Washington, Smithsonian Inst. Press.
Peek, J. M . , D. L. Urich, and R. Mackie. (1976). Moose habitat selection and relationships to forest management in northeastern Minnesota. Wildl. Monogr., 65, 1-65.
Petrides, G. A. (1975). Principal foods versus preferred foods and their relations to stocking rate and range condition. Biol. Conserv., 7, 161-169.
Poore, M. (1963). Problems in the classification of tropical rain forest. J. Trop. Geogr., 17, 12-19.
_________ . (1968). Studies in Malaysian rain forest. I. The foreston the Triassic sediments in Jenka Forest Reserve. J. Ecol., 56, 143-196.
Pyke, G. H . , H. R, Pulliam, and E. L. Charnov. (1977). Optimal foraging: A selective review of theory and tests. Q. Rev. Biol., 52, 137-154.
Reproduced with permission of the copyright owner. Further reproduction prohibited without permission.
Page 173
Raemaekers, J,, F, P. Aldrich-Blake, and J. Payne, (1980), The forest. In Malayan forest primates. Ten years' study in tropical rain forest, ed, by D, Chivers, 29-61, New York, Plenum Press.
Rhoades, D. and R, Cates, (1976). Toward a general theory of plant antiherbivore chemistry. Recent Adv. Phytochem,, 10, 168-213.
Robinson, D. and L, Slade. (1974). The current status of knowledge on the nutrition of equines, J, Anim. Sci,, 39, 1044-1066.
Rosenthal, G. and D. Janzen, (1979). Eds. Herbivores; Theirinteractions with secondary plant metabolites. New York, Academic Press,
Richards, P. (1952), The tropical rain forest, Cambridge,Cambridge Univ. Press,
Schenkel, R, and L. Schenkel-Hulliger. (1969), The Javanrhinoceros in Udjung Kulon Nature Reserve, Its ecology and behavior. Acta Trop. (Basel) 26, 97-135.
Simon, N. Ed, (1969), Red data book. Mammalia, Gland, Switzerland, lUCN/WWF,
Smallwood, H. A. (1966), Schematic-reconnaissance soil survey of the Segamat-Gemas-Tangkak region of north Johor, Malay, Soil Surv, Rep, Kuala Lumpur, Malaysia, Dep. Agric.
Sokal, R. and F. J. Rohlf. (1969). Biometry, San Fransisco,W. H. Freeman and Co.
Stevens, W. E. (1968). The conservation of wildlife in WestMalaysia. Kuala Lumpur, Malaysia, Dep. Wildl, and National Parks.
Strickland, D. (1967). Ecology of the rhinoceros in Malaya. Malay. Nat. J., 20, 1-17.
Symington, C. F, (1933). The study of secondary growth on rainforst sites in Malaya. Malay. For., 2, 107-117.
Talbot, L. (1960), A look at threatened species. Oryx, 5, 153-293.
Thom, W. (1935), Rhinoceros shooting in Burma, J, Bombay Nat. Hist, Soc,, 38, 138-150,
Reproduced with permission of the copyright owner. Further reproduction prohibited without permission.
Page 174
Van Soest, P. J. (1982). Nutritional ecology of the ruminent. Corvallis, 0 and B Books.
Van Steenis, C. (1953). Flora Halesiana. Leiden, Noordhoff.
Van Strien, N. (1974). The Sumatran or two-horned Asiatic rhinoceros. A study of theliterature. Meded, Landbouwhogeschool Wageningen, 14-16.
Waterman, P. W . , C. N. Mbi, D. B. McKey, andJ. S. Gartlan. (1980). African rainforest vegetation and rumen microbes: phenolic compounds and nutrients as correlates of digestibility. Oecologia (Berl.), 47, 22-33.
Weigum, L. (1972). The problems in the preservation of the seladang in the Malaysian national park. M. S. thesis. Mich. St. Univ., East Lansing.
Westoby, M. (1974), An analysis of diet selection by large generalist herbivores. Am. Nat., 108, 290-304.
_. (1978). What are the biological bases of varieddiets? Am. Nat., 112, 627-631.
Whitmore, T. (1972). Tree flora of Malaya. Kuala Lumpur, Longman,
_. (1975). Tropical rain forests of the Far East. Oxford,Claredon Press.
. (1978). Gaps in the forest canopy. In Tropical trees asliving systems, ed. by P. Tomlinson and M. Zimmermann, 639-655. New York, Cambridge Univ. Press.
Williams, K. and G. Petrides. (1980). Browse use, feeding behavior, and management of the Malayan tapir. J. Wildl. Manage., 44, 489-493.
Womersley, J. (1969). Plant collecting for anthropologist,geographers, and ecologists in New Guinea. Port Morsby, Papuan New Guinea, Dep. For.
Wyatt-Smith, J. (1964). A preliminary vegetation map of Malayawith descriptions of the vegetation types. J. Trop. Geogr., 18, 200-213.
. (1966). Ecological studies on Malayanforests. Malay. For. Dep. Res. Rep. 52. Kuala Lumpur, Malaysia, Dep. For.
Reproduced with permission of the copyright owner. Further reproduction prohibited without permission.
Page 175
, and K, Kochummen, (1979). Pocket check list of thetimber trees. Malay. For. Rec. No. 17, Kuala Lumpur, Dep. For.
Reproduced with permission of the copyright owner. Further reproduction prohibited without permission.

Page 176
APPENDIX A
PLANT TAXA RECORDED AS EATEN BY SUMATRAN RHINOCEROS IN THE ENDAU-ROMPIN AREA, SOUTHERN PENINSULAR MALAYSIA.
Scientific name Number of Feeding cases
AceraceaeA e e T t a u r t n u m
ActinidiaceaeS a u v a u t a s p .
AlangiaceaeA l a n g i u m e b e n a a e u m
AnnonaceaeG o n i - o t h a t a m u s s p .
M o n o a a r p i a m c œ g % n a t i - s
P o Z y a Z t h i - a g Z a u a a
ApocynaceaeT a h e r n a e m o n t a n a s p .
Aquifoliaceaei Z e x m a a v o p h y Z Z a
AraceaeH ' o m a Z o m e n a r u b r a
BurseraceaeD a c r y o d e s Z a x a
D . r u g o s a
CelastraceaeB h e s a p a n Z o u Z a t a
G Z y p t o p e t a Z u m f r u t i o o s i m
L o p h o p e t a Z u m f Z o r i b u n d u m
Convolvulaceae E r y o i b e s p .
111
11
421
Reproduced with permission of the copyright owner. Further reproduction prohibited without permission.
Appendix A (Cont’d).Page 177
Scientific name Number of feeding cases
DichapetalaceaeD i c h a p e t a t u m s p .
Dipterocarpaceae H o p e a n u t a n s
H o p e a s p .
S h o v e a Z e p r o s u Z a
S . m a x i m a
S . p a r v i f o Z i a
EbenaceaeD i o s p y r o s s u b r h o m b o i d e a
D . w a Z Z i c h i i
D i o s p y r o s s p .
ElaeocarpaceaeE Z a e o o a v p u s p e t i o Z a t u s
E Z a e o c a v p u s s p .
EuphorbiaceaeA n t i d e s m a c u s p i d a t i m
A . v e Z u t i n o s u m
A n t i d e s m a s p .
A p o r u s a s p .
B a c a a u r e a Z a n o e o Z a t a
C r o t o n Z a e v i f o Z i - u s
E Z a t e r i o s p e r m u m t a p e s
G Z o a h i d i o n h y p o Z e u o w n
G Z o a h i d a n s p .
M a c a r a n g a h o s e t
M . Z a c i n i a t a
M . p r u i n o s a
M . t r i Z o b a
F i m e Z o d e n d r o n g r i f f i t h i a n u m
T r i g o n o p Z e u r a m a Z a y a n a
FagaceaeL i t h o o a r p u s s p .
Q u e r c u s o i d o c a r p a
FlacourtiaceaeC a s e a r i a Z o b b i a n a
F Z a c o u r t i a s p .
E o m a Z i u m s p .
11112
116
11
113 7 1 1 1 21 124 2 1 1
13
121
Reproduced with permission of the copyright owner. Further reproduction prohibited without permission.

Page 178Appendix A (Cont’d)
Scientific name Number of feeding cases
GnetaceaeG n e t u m s p .
I
GuttiferaeC a t o p h y t I n m s p .
11
G a r a i n i a f o r b e s i iJ.
G . g r t f f i t h i i12
G a v a i n i a s p .
HyperlacaceaeC r a t o x y t u m f o r m o s u m
1
IcacinaceaeG o n o a a v y u m g r a o t t e
17
M e d u s a n t h e r a g r a a i l i s 4M e d u s a n t h e r a s p .
S t e m o n u r u s s e o u n d i f t o v u s
Lauraceae -IC i - n n a m o m i o n - L n e r s
X1
E n d i a n d r a k i n g i a n a 1E n d i a n d v a s p . 1L i t s e a a m a r a 2L . n i . d u t a v i s 4L i t s e a s p . 1N o t h o p h o e b e s p .
Leeaceae %L e e a ï n d i c a
Leguminosae 1C y n o m e t r a e a u t t f l o r a 1P i t h e o e l t o b i u m a t y p e a r i a 4P . e U t p t - i o i m
Loganlaceae 2F a g r a e a r a c e m o s a
Melastcmataceae 1M e t a s t o m a m a t a b a t h n t o u m 1M e t a s t o m a s p . 1P h y t t a g a t h i s r o t u n d i f o t i a
Meliaceae 1A g t a i a g r i f f t t h t i 1A . t e n u t c a u t t s 7A g t a v a s p .
Reproduced with permission of the copyright owner. Further reproduction prohibited without permission.
Appendix A (Cont'd)Page 179
Scientific name Number of feeding cases
A p h a n a m t - x i s v o h i t u k a
C h i s o o h e t o n s p .
D y s o x y t u m s p .
114
MenispermaceaeT i n o m i s a t i m p e t t o Z a r e
MoraceaeA r t o c a r p u s e Z a s t Z a u s
A . n i t i d u s
A . r i g i d u s
F i a u s c h a v t a a e a
F . d e p r e s s a
F . f i s t u t o s a
F . g r o s s u Z a r i o i d e s
F . s a h w a r z i Z
F . s Z n u a t a
F . u n i g Z a n d u Z o s a
F . v a s a u Z o s a
F . v v Z e s e a n a
F Z c u s s p .
S t r e b Z u s e Z o n g a t u s
12141111111261
MyristicaceaeG y m n a a r a n t h e r a f o v h e s Z Z
K n e m a c u v t i s d Z
K . m a Z a y a n a
311
MyrsinaceaeA r d Z s Z a c o Z o r a t a
A . o x y p h y Z Z a
A v d Z s Z a s p .
M a e s a r a m e n t a a e a
3135
MyrtaceaeE u g e n Z a a n Z s o s e p a Z a
E , o e r a s Z f o r m Z s
E . d e n s Z f Z o r a
E . s y z y g Z o Z d e s
E u g e n Z a s p .
11127
OleaceaeC h Z o n a n t h u s Z a m o s a
C . o Z Z g a n t h u s
C . v a m Z f Z o r u s
C h Z o n a n t h u s s p .
1212
Reproduced with permission of the copyright owner. Further reproduction prohibited without permission.

Appendix A (Cont'd)Page 180
Scientific names Number of feeding cases
PalmaeC a l a m u s s p .
K o v t h a l s i a s p .
PolygalaceaeX a n t h o p h y l l v o n s p .
RhizophoraceaeA n i s o p h y l l e a g v a n d i s
G y n o t v o o h e s a x - i l l a v l s
P e l l a a a t y x s a c o a r d i a n u s
P e l l a c a t y x s p .
Rosaceae
Rubiaceae
11
1121
P r u n u s a r b o r e a36
P . g r - i s e a1
P . m a Z a y a n a
P . o d o r a t a1
P . p o Z y s t a e h y a21
P r u n u s s p .
A m a r a o a r p u s o a u d a t u s1
A m a r a a a r p u s s p . 4G a r d e n i a s p . 7L a s i a n t h u s s p .
/1
M y c e t i a s p . 15P a v e t t a i n d i o a 1P a v e t t a s p . 0R a n d i a s c o r t e c h i n i 9R a n d i a s p .
sL
\
T i m o n i u s s p . 2U n c a r i a s p . 2U r o p k y Z Z i m g Z a b m m 7U r o p h y Z Z u m s p .
taceae 1A o r o n y o h i a p o r t e r i
J.
1A t a Z a n t i a r o x b u r g h i a n a 1L u v u n g a s c a n d e n s 1L u v u n g a s p . 1T e t r a o t o m i a s p .
Sapindaceae A r y t e r a s p .
M i s o h o c a r p u s s p .
11
Reproduced with permission of the copyright owner. Further reproduction prohibited without permission.
Appendix A (Cont'd)Page 181
Scientific names Number of feeding cases
P o m e t - i a p - i n n a t a
X e v o s p e m r u m w d l l i c h i i
15
SapotaceaeM a d h u o a k o r t h a l s % - i
P d l a q u i v m h e x a n d r u m
P . T o s t v a t u m
P a t a q u i u m s p .
P a y e n a t u a i d a
12222
SimaroubaceaeQ u a s s i a i n d i c a
Sterculiaceae S t e x c u l i a s p .
StyraceaeS t y r a x b e n z o i n
SymplocaceaeS y m p l o a o s a d e n o p h y l t a
TheaceaeA d i n a n d r a a c i m i n a t a
A d i n a n d r a s p .
T e r n s t r o e m i a p e n a n g i a n a
2
1
TiliaceaeG r e w i a Z a v œ i f o l i a
G . p a n i o u t a t a
G r e w i a s p .
112
UlmaceaeG i r o n n i e r a n e r v o s a
G . s u h a e q u a l i s
11
VerbenaceaeC a t l i e a r p a s p .
C l e r o d e n d r u m v i l l o s i m
C l e r o d e n d r u m s p .
C o n g e a f o r b e s s i i
2321
Reproduced with permission of the copyright owner. Further reproduction prohibited without permission.
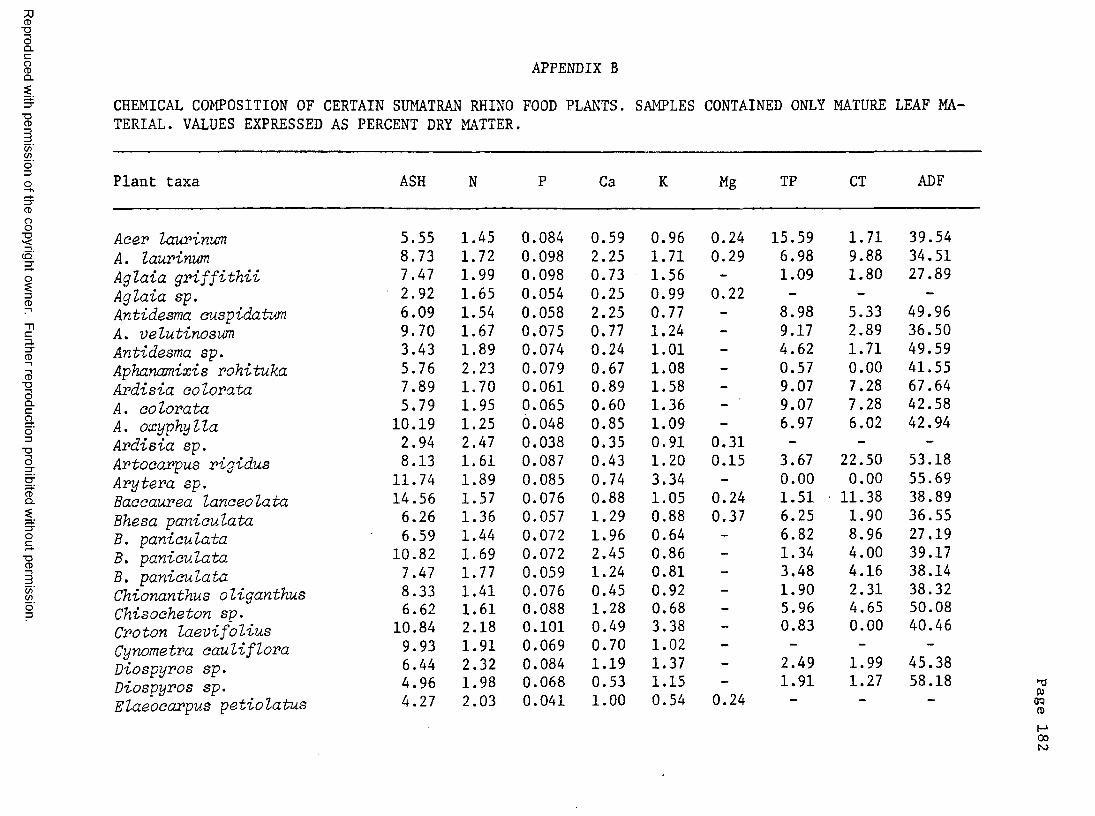
CD■DOQ .
S APPENDIX BQ .
g3= CHEMICAL COMPOSITION OE CERTAIN SUMATRAN RHINO FOOD PLANTS. SAMPLES CONTAINED ONLY MATURE LEAF MA-J TERIAL. VALUES EXPRESSED AS PERCENT DRY MATTER.C/)C/)
8
( O '
3.3"CD
CD■DOQ.Cao3"Oo
CDQ.
■DCD
C/)C/)
Plant taxa ASH N P Ca K Mg TP CT ADF
A c e r l a u p i n i m 5.55 1.45 0.084 0.59 0.96 0.24 15.59 1.71 39.54A . l a u r i m m 8.73 1.72 0.098 2.25 1.71 0.29 6.98 9.88 34.51A g l a i a g r i f f i t h i i 7.47 1.99 0.098 0.73 1.56 — 1.09 1.80 27.89A g l a i a s p . 2.92 1.65 0.054 0.25 0.99 0.22 - — —A n t i d e s m a e u s p i d a t m 6.09 1.54 0.058 2.25 0.77 - 8.98 5.33 49.96A . v e l u t i n o s m 9.70 1.67 0.075 0.77 1.24 — 9.17 2.89 36.50A n t i d e s m a s p . 3.43 1.89 0.074 0.24 1.01 - 4.62 1.71 49.59A p h a n a m i x i s r o h i t u k a 5.76 2.23 0.079 0.67 1.08 - 0.57 0.00 41.55A r d i s i a c o l o r a t a 7.89 1.70 0.061 0.89 1.58 - 9.07 7.28 67.64A . C O l o r a t a 5.79 1.95 0.065 0.60 1.36 - 9.07 7.28 42.58A . o x y p h y l l a 10.19 1.25 0.048 0.85 1.09 — 6.97 6.02 42.94A r d i s i a s p . 2.94 2.47 0.038 0.35 0.91 0.31 — - *•A r t o o a r p u s r i g i d u s 8.13 1.61 0.087 0.43 1.20 0.15 3.67 22.50 53.18A r y t e r a s p . 11.74 1.89 0.085 0.74 3.34 - 0.00 0.00 55.69B a a c a u r e a l a n a e o t a t a 14.56 1.57 0.076 0.88 1.05 0.24 1.51 11.38 38.89B h e s a p a n i o u t a t a
6.26 1.36 0.057 1.29 0.88 0.37 6.25 1.90 36.55B . p a n i o u t a t a 6.59 1.44 0.072 1.96 0.64 - 6.82 8.96 27.19B . p a n i o u t a t a 10.82 1.69 0.072 2.45 0.86 - 1.34 4.00 39.17B . p a n i o u t a t a
7.47 1.77 0.059 1.24 0.81 - 3.48 4.16 38.14C h i o n a n t h u s o t i g a n t h u s 8.33 1.41 0.076 0.45 0.92 - 1.90 2.31 38.32C h i s o c h e t o n s p .
6.62 1.61 0.088 1.28 0.68 - 5.96 4.65 50.08C v o t o n t a e v i f a l i u s
10.84 2.18 0.101 0.49 3.38 - 0.83 0.00 40.46C y n o m e t r a o a u t i f t o r a
9.93 1.91 0.069 0.70 1.02 —1.99
D i o s p y r o s s p .
D i o s p y r o s s p .
6.44 2.32 0.084 1.19 1.37 - 2.49 45.384.96 1.98 0.068 0.53 1.15 - 1.91 1.27 58.18
F . l a e o o œ o o u s v e t i o t a t u s 4.27 2.03 0.041 1.00 0.54 0.24 —13W09m00N)
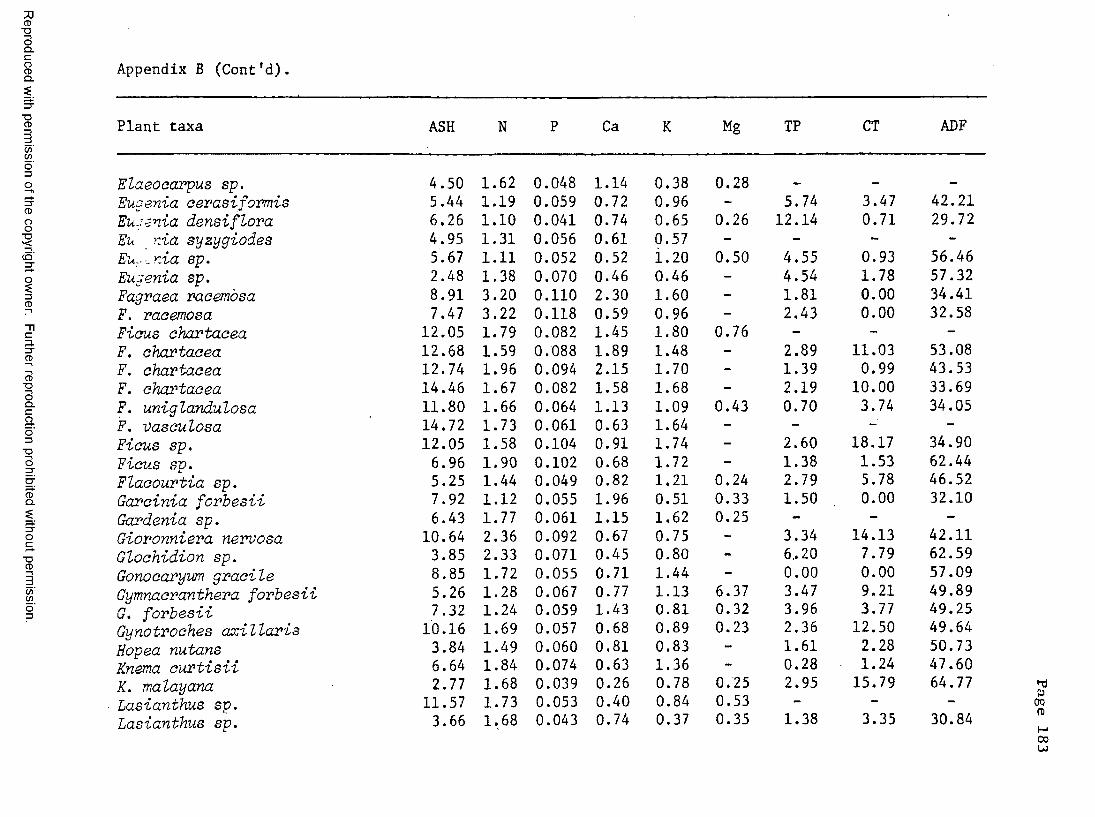
CD■DOQ .CgQ .
Appendix B (Cont'd)
■DCD
C/)C/)
8
ci'
33"CD
CD■DOQ .CaO3"OO
CDQ .
■DCD
C/)C/)
Plant taxa ASH N F Ca K Mg TP CT ADF
E l a e o a a r p u s s p . 4.50 1.62 0.048 1.14 0.38 0.28 _
E u g e n i a o e r a s i f o r m i s 5.44 1.19 0.059 0.72 0.96 - 5.74 3.47 42.21E u g e n i a d e n s i f l o r a 6.26 1.10 0.041 0.74 0.65 0.26 12.14 0.71 29.72E u n i a s y z y g i o d e s 4.95 1.31 0.056 0.61 0.57 - - - -E u - - - ^ n i a s p . 5.67 1.11 0.052 0.52 i.20 0.50 4.55 0.93 56.46E u g e n i a s p . 2.48 1.38 0.070 0.46 0.46 - 4.54 1.78 57.32F a g r a e a r a a e m à s a 8.91 3.20 0.110 2.30 1.60 — 1.81 0.00 34.41F . r a o e m o s a 7.47 3.22 0.118 0.59 0.96 - 2.43 0.00 32.58F i c u s c h a r t a c e a 12.05 1.79 0.082 1.45 1.80 0.76 — - -F , c h a r t a c e a 12.68 1.59 0.088 1.89 1.48 - 2.89 11.03 53.08F . c h a r t a c e a 12.74 1.96 0.094 2.15 1.70 - 1.39 0.99 43.53F . c h a r t a c e a 14.46 1.67 0.082 1.58 1.68 - 2.19 10.00 33.69F . u n i g l a n d u l o s a 11.80 1.66 0.064 1.13 1.09 0.43 0.70 3.74 34.05F . v a s c u l o s a 14.72 1.73 0.061 0.63 1.64 - - — -F i c u s s p . 12.05 1.58 0.104 0.91 1.74 - 2.60 18.17 34.90F i c u s s p . 6.96 1.90 0.102 0.68 1.72 - 1.38 1.53 62.44F l a o o u r t i a s p . 5.25 1.44 0.049 0.82 1.21 0.24 2.79 5.78 46.52G a r o i n i a f o r b e s i i 7.92 1.12 0.055 1.96 0.51 0.33 1.50 0.00 32.10G a r d e n i a s p . 6.43 1.77 0.061 1.15 1.62 0.25 — —G i o r o n n i e r a n e r v o s a 10.64 2.36 0.092 0.67 0.75 - 3.34 14.13 42.11G l o c h i d i o n s p . 3.85 2.33 0.071 0.45 0.80 - 6.20 7.79 62.59G o n o c a r y u m g r a c i l e 8.85 1.72 0.055 0.71 1.44 — 0.00 0.00 57.09G y m n a c r a n t h e r a f o r b e s i i 5.26 1.28 0.067 0.77 1.13 6.37 3.47 9.21 49.89G , f o r b e s i i 7.32 1.24 0.059 1.43 0.81 0.32 3.96 3.77 49.25G y n o t r o c h e s a x i l l a r i s 10.16 1.69 0.057 0.68 0.89 0.23 2.36 12.50 49.64H o p e a n u t a n s 3.84 1.49 0.060 0.81 0.83 "• 1.61 2.28 50.73K n e m a c u r t i s i i 6.64 1.84 0.074 0.63 1.36 — 0.28 1.24 47.60K . m a l a y a n a 2.77 1.68 0.039 0.26 0.78 0.25 2.95 15.79 64.77L a s i a n t h u s s p . 11.57 1.73 0.053 0.40 0.84 0.53 - - -L a s i a n t h u s s p . 3.66 1.68 0.043 0.74 0.37 0.35 1.38 3.35 30.84
POQmM00w
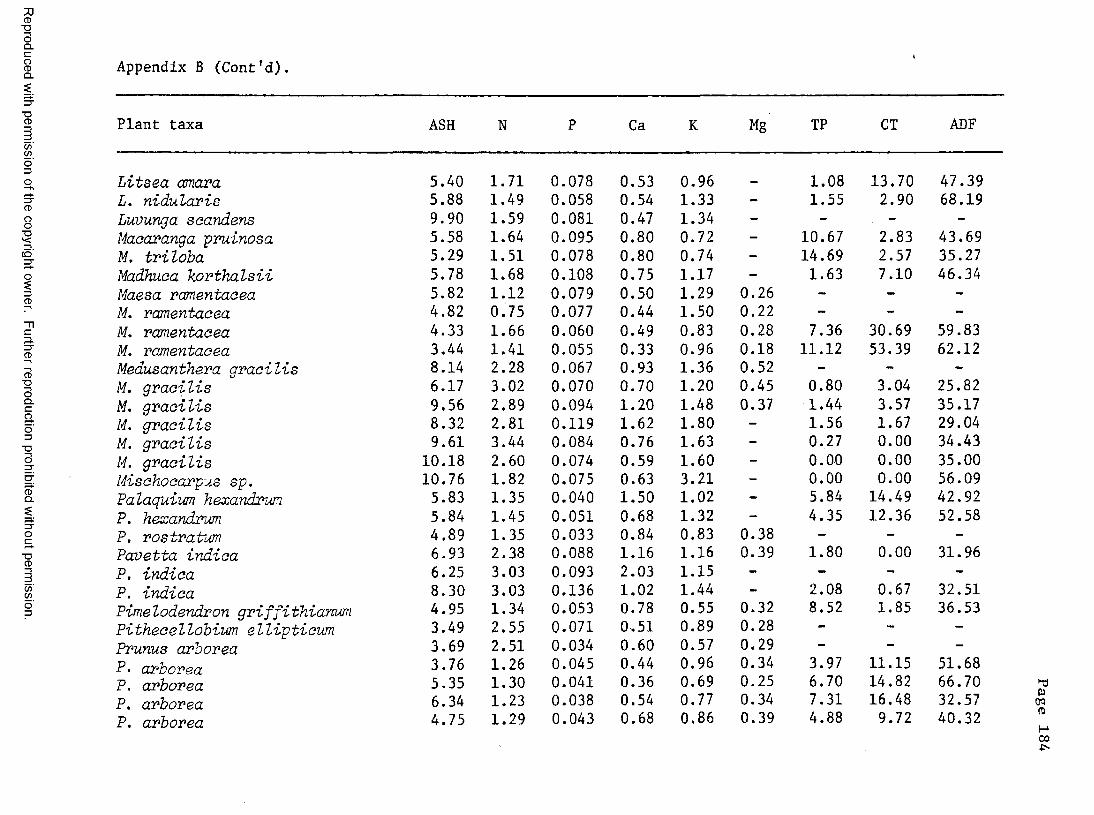
CD■DOQ .CgQ .
Appendix B (Cont'd)
■DCD
C/)C/)
8
ci'
33"CD
CD■DOQ .CaO3"OO
CDQ .
■DCD
C/)C/)
Plant taxa ASH N P Ca K Mg TP CT ADF
L i t s e a a m a r a 5.40 1.71 0.078 0.53 0.96 1.08 13.70 47.39L , n i d u l a r i s 5.88 1.49 0.058 0.54 1.33 1.55 2.90 68.19L u v u n g a s a a n d e n s 9.90 1.59 0.081 0.47 1.34 — - - -M a e a r a n g a p r u i n o s a 5.58 1.64 0.095 0.80 0.72 - 10.67 2.83 43.69M . t r i l o b a 5.29 1.51 0.078 0.80 0.74 — 14.69 2.57 35.27M a d h u o a k o r t h a l s i i 5.78 1.68 0.108 0.75 1.17 - 1.63 7.10 46.34M a e s a r a m e n t a a e a 5.82 1.12 0.079 0.50 1.29 0.26 — — -M . r a m e n t a a e a 4.82 0.75 0.077 0.44 1.50 0.22 — -M , r a m e n t a a e a 4.33 1.66 0.060 0.49 0.83 0.28 7.36 30.69 59.83M . r a m e n t a a e a 3.44 1.41 0.055 0.33 0.96 0.18 11.12 53.39 62.12M e d u s a n t h e r a g r a c i l i s 8.14 2.28 0.067 0.93 1.36 0.52 - - -M . g r a a i l i s 6.17 3.02 0.070 0.70 1.20 0.45 0.80 3.04 25.82M . g r a a i l i s 9.56 2.89 0.094 1.20 1.48 0.37 1.44 3.57 35.17M . g r a a i l i s 8.32 2.81 0.119 1.62 1.80 - 1.56 1.67 29.04M . g r a a i l i s 9.61 3.44 0.084 0.76 1.63 — 0.27 0.00 34.43M . g r a a i l i s 10.18 2.60 0.074 0.59 1.60 - 0.00 0.00 35.00M i s a h o c a r p u s s p . 10.76 1.82 0.075 0.63 3.21 - 0.00 0.00 56.09P a l a q u i u m h e x a n d n m 5.83 1.35 0.040 1.50 1.02 - 5.84 14.49 42.92P . h e x a n d r u m 5.84 1.45 0.051 0.68 1.32 - 4.35 12.36 52.58P . r o s t r a t u r n 4.89 1.35 0.033 0.84 0.83 0.38 - - -P a v e t t a i n d i o a 6.93 2.38 0.088 1.16 1.16 0.39 1.80 0.00 31.96P . i n d i a a 6.25 3.03 0.093 2.03 1.15 - — - -P , i n d i a a 8.30 3.03 0.136 1.02 1.44 2.08 0.67 32.51P i m e l o d e n d r o n g r i f f i t h i a n u m 4.95 1.34 0.053 0.78 0.55 0.32 8.52 1.85 36.53P i t h e a e l l o b i u m e l l i p t i a i m 3.49 2.55 0.071 0.51 0.89 0.28 "" — —P r u n u s a r h o r e a 3.69 2.51 0.034 0.60 0.57 0.29 - - -P • a r b o r e a
3.76 1.26 0.045 0.44 0.96 0.34 3.97 11.15 51.68P . a r b o r e a 5.35 1.30 0.041 0.36 0.69 0.25 6.70 14.82 66.70P . a r b o r e a 6.34 1.23 0.038 0.54 0.77 0.34 7.31 16.48 32.57P . a r b o r e a 4.75 1.29 0.043 0.68 0.86 0.39 4.88 9.72 40.32
m09mH00
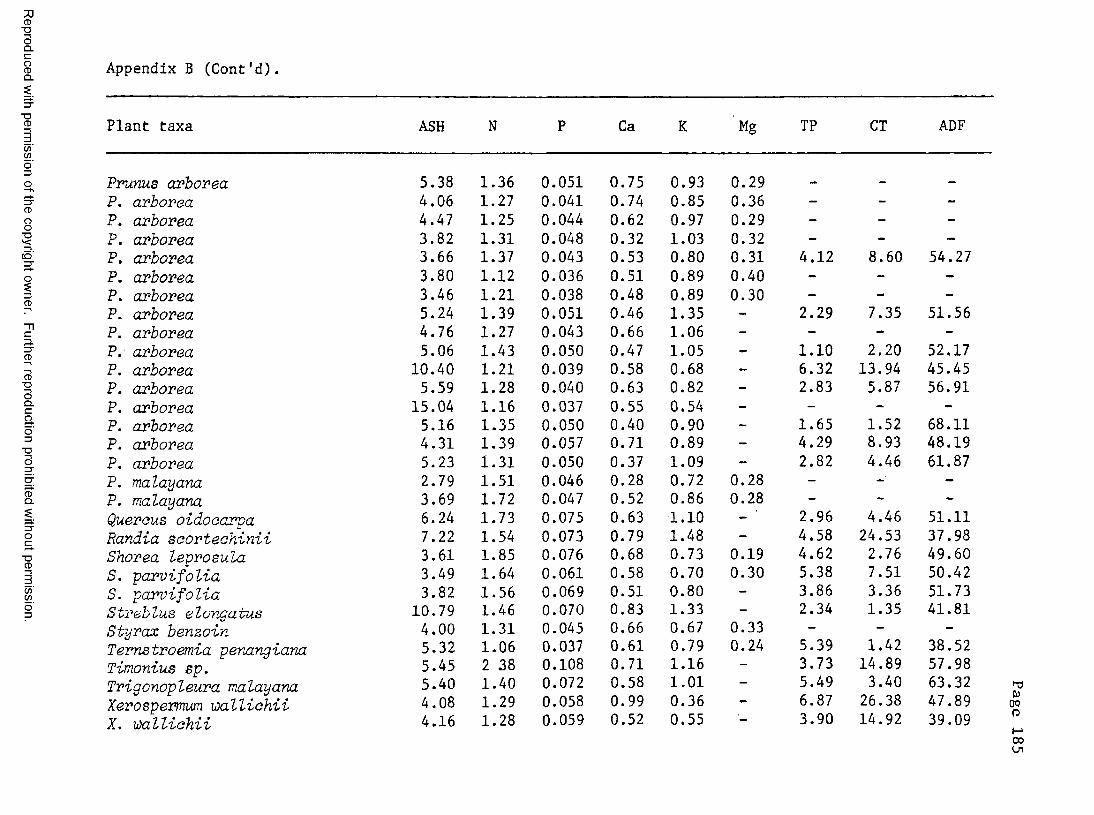
CD■DOQ.CgQ.
Appendix B (Cont'd)
■DCD
C/)C/)
CD
8
CD
3.3"CD
CD■DOQ.Cao3"Oo
CDQ.
■DCD
C/)C/)
Plant taxa ASH N P Ca K Mg TP CT ADF
Prunus arhorea 5.38 1.36 0.051 0.75 0.93 0.29P. arborea 4.06 1.27 0.041 0.74 0.85 0.36 — — —
P. arborea 4.47 1.25 0.044 0.62 0.97 0.29 - -
P. arborea 3.82 1.31 0.048 0.32 1.03 0.32 - - —
P. arhorea 3.66 1.37 0.043 0.53 0.80 0.31 4.12 8.60 54.27P. arborea 3.80 1.12 0.036 0.51 0.89 0.40 - - -
P. arborea 3.46 1.21 0.038 0.48 0.89 0.30 — — -
P. arborea 5.24 1.39 0.051 0.46 1.35 - 2.29 7.35 51.56P. arborea 4.76 1.27 0.043 0.66 1.06 - - - -P. arborea 5.06 1.43 0.050 0.47 1.05 - 1.10 2.20 52.17P. arborea 10.40 1.21 0.039 0.58 0.68 - 6.32 13.94 45.45P. arborea 5.59 1.28 0.040 0.63 0.82 - 2.83 5.87 56.91P. arhorea 15.04 1.16 0.037 0.55 0.54 - - - —
P. arborea 5.16 1.35 0.050 0.40 0.90 - 1.65 1.52 68.11P. arborea 4.31 1.39 0.057 0.71 0.89 - 4.29 8.93 48.19P. arborea 5.23 1.31 0.050 0.37 1.09 - 2.82 4.46 61.87P. malayana 2.79 1.51 0.046 0.28 0.72 0.28 - -
P. malayana 3.69 1.72 0.047 0.52 0.86 0.28 - — —
Querous oidoaarpa 6.24 1.73 0.075 0.63 1.10 — 2.96 4.46 51.11Randia saortechinii 7.22 1.54 0.073 0.79 1.48 - 4.58 24.53 37.98Shorea leprosula 3.61 1.85 0.076 0.68 0.73 0.19 4.62 2.76 49.60S. parvifolia 3.49 1.64 0.061 0.58 0.70 0.30 5.38 7.51 50.42S. parvifolia 3.82 1.56 0.069 0.51 0.80 - 3.86 3.36 51.73Strehlus elongatus 10.79 1.46 0.070 0.83 1.33 - 2.34 1.35 41.81Styrax benzoin 4.00 1.31 0.045 0.66 0.67 0.33 - -
Ternstroemia penangiana 5.32 1.06 0.037 0.61 0.79 0.24 5.39 1.42 38.52Timonius sp. 5.45 2 38 0.108 0.71 1.16 - 3.73 14.89 57.98Trigonopleura malayana 5.40 1.40 0.072 0.58 1.01 - 5.49 3.40 63.32Xerospermum walliahii 4.08 1.29 0.058 0.99 0.36 — 6.87 26.38 47.89X. walliahii 4.16 1.28 0.059 0.52 0.55 3.90 14.92 39.09
OO
COLn

CD"DOQ.CgQ.
APPENDIX C
■DCD
CHEMICAL COMPOSITION OF MATURE LEAF MATERIAL COLLECTED FROM CERTAIN UNDERSTORY PLANTS SELECTED RANDOMLY ALONG TRANSECTS. VALUES EXPRESSED AS PERCENT DRY MATTER.
C/)C/)
8
CD
3.3"CD
CD■DOQ.Cao3"Oo
CDQ.
■DCD
C/)C/i
Plant taxa ASH N P Ca K TP CT ADF
Alangium ebenacem 6.56 1.50 0.096 1.14 1.23 6.66 0.64 47.18Casearia sp. 8.68 1.45 0.041 1.34 1.71 0.98 1.71 65.59Chisocheton sp. 6.73 1.27 0.073 0.57 1.50 0.56 1.29 58.58Cinnamomum iners 4.17 1.90 0.062 0.42 1.27 0.55 0.00 58.08Cryptoearya rugutosa 4.68 1.38 0.049 0.42 0.90 3.41 7.72 70.46Durio malacoensis 10.26 1.24 0.055 0.70 1.11 2.52 9.39 59.25Eryaibe sp. 10.65 1.23 0.047 1.23 1.62 2.94 0.60 51.31Evycibe sp. 3.56 1.27 0.047 0.63 0.88 10.39 9.97 43.51Gonystylus confusus 4.66 1.82 0.084 0.49 1.24 1.22 0.60 61.41Govdonia sp. 3.76 1.22 0.039 0.37 0.64 5.28 1.53 30.90Homalium sp. 6.40 1.38 0,059 0.66 1.37 4.94 2.31 39.50Hullettia dumosa 6.07 1.52 0.052 0.41 0.72 0.55 0.60 57.49Lithocarpus sp. 4.45 1.29 0.047 0.31 0.61 4.96 1.00 55.24Memeoylon sp. 5.94 1.20 0.049 0.67 0.41 3.88 2.00 46.10Neosaorteahina paniaulata 5.34 1.25 0.052 0.53 0.97 2.54 12.85 59.59Polyalthia sp. 8.50 1.71 0.057 0.39 1,17 2.57 2.79 64.30PtevospemTm javanioum 3.39 1.39 0.073 0.23 1.10 0.99 0.99 60.86Rhodamnia oinerea 2.20 1.23 0.034 0.24 0.81 9.17 10.57 64.29Shorea acuminata 3.48 1.66 0.078 0.61 0.47 5.52 2.49 53.73S. ovalis 2.71 1.59 0.072 0.44 0.70 4.83 1.73 65.93S. singkawang 1.77 1.37 0.057 0.32 0.56 7.02 8.00 65.65Shorea sp. 8.72 1.58 0.048 0.38 0.51 5.03 3.28 46.76Stemonurus sp. 8.52 1.26 0.062 1.45 1.92 1,41 0:00 47.70Trigonosiemon sp. 7.80 1.21 0.045 0.47 1.25 2.19 2.59 68.46Xanthophyllm sp. 5.32 2.19 0.048 0.33 0.75 1.38 0.00 50.91Xanthophyllum sp. 3.40 1.53 0.060 0.32 0.86 5.63 1.55 54.32Xylopia magna 5.38 1.60 0.049 0.40 1.18 2.82 6.11 63.01
DCT5CDCO
Related Documents