Extracting Valuable Data Extracting Valuable Data from Classroom Trading Pitsfrom Classroom Trading Pits
Ted Bergstrom & Eugene Kwok
University of California, Santa Barbara

The Origin of Experimental The Origin of Experimental Economics Economics
• The first scientific experiments in economics were classroom market experiments
by Edward Chamberlin at Harvard in 1940’s.

Chamberlin’s experimentsChamberlin’s experiments
• Assigned Buyer Values and Seller Costs.
• Let students mill around and trade.
• Recorded prices.
• Remarked on difference from competitive equilibrium outcome.
• Observed excess trading.

Revival at Purdue Revival at Purdue
• Chamberlin’s experiments went almost unnoticed until
Vernon Smith revisited them in his classroom at Purdue.

Smith’s experimentsSmith’s experiments
• Gave competition a better chance.
• Two main differences from Chamberlin.– Double oral auction, not pit trading– Ran 3-5 rounds, repeating same setup
• Found outcomes very close to competitive equilibrium

Founders of Experimental Economics
• Edward Chamberlin • Vernon Smith

Our Data Our Data
• Classroom experiments from Experiments with Economic Principles, a principles text by Bergstrom and Miller
• Experiments conducted in 31 classrooms, 10 universities.

The Apple MarketThe Apple Market
• Students assigned roles as apple suppliers or apple demanders.
• Suppliers supply at most 1 bushel.
• Demanders demand at most 1 bushel.

Buyer Values and Seller CostsBuyer Values and Seller Costs
• Two types of demanders– High Value—Buyer Value is $40– Low Value—Buyer Value is $20
• Two types of suppliers– High Cost—Seller Cost is $30– Low Cost—Seller Cost is $10

Session 1 Session 1
• 2/3 of Sellers have low cost, 1/3 high.
• 2/3 of Demanders have low value, 1/3 high.

Demand and Supply in Session 1Demand and Supply in Session 1

Session 2 Session 2
• 2/3 of Sellers have high cost, 1/3 low.
• 2/3 of Demanders have high value, 1/3 low.

Demand and Supply in Session 2

Session 1: Distribution of Average PricesSession 1: Distribution of Average Prices

Session 2: Distribution of Average PricesSession 2: Distribution of Average Prices

Session 1: Distribution of Quantity DeviationsSession 1: Distribution of Quantity Deviations

Session 2: Distribution of Quantity DeviationsSession 2: Distribution of Quantity Deviations

Enough to convince crudulous students, maybe…
But does the evidence show that competitive theory is empirically useful?
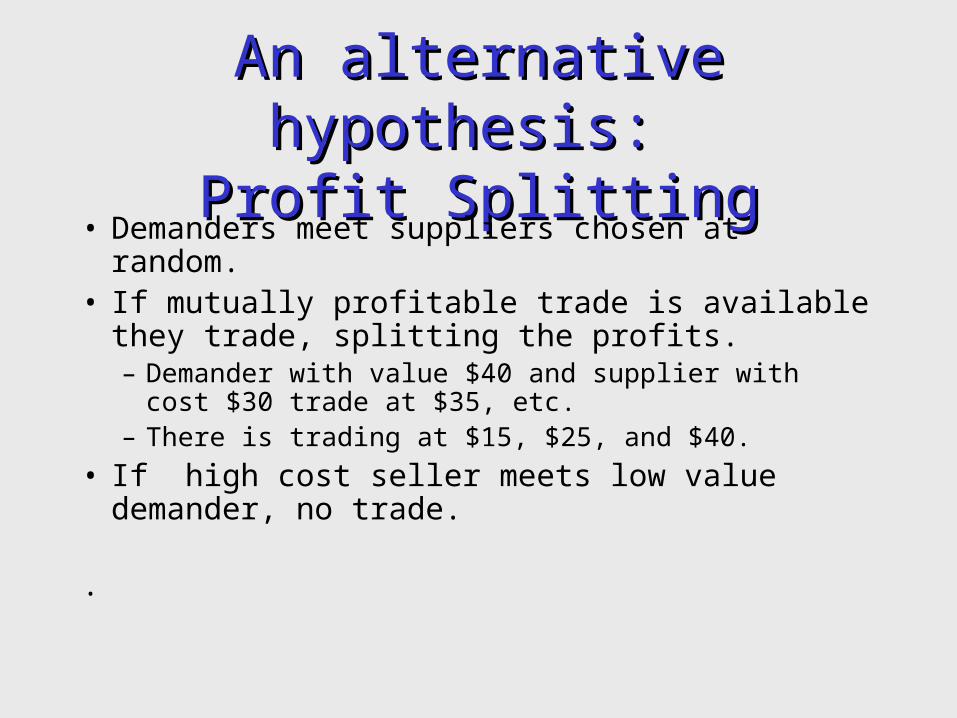
An alternative hypothesis: An alternative hypothesis: Profit SplittingProfit Splitting
• Demanders meet suppliers chosen at random.• If mutually profitable trade is available they trade,
splitting the profits.– Demander with value $40 and supplier with cost $30
trade at $35, etc.– There is trading at $15, $25, and $40.
• If high cost seller meets low value demander, no trade.
.

Average Prices are predicted Average Prices are predicted better by Profit-Splittingbetter by Profit-Splitting
Session 1 Session 2
Competitive $20 $30
Profit-Split $20.7 $29.3
Actual, Rd 1 $21.2 $27.0
Actual Rd 2 $21.2 $28.5

Detailed predictionsDetailed predictions
• Competitive theory and profit splitting theory both make detailed predictions beyond average price and total quantity.
• Distribution of prices– Competition implies uniform price.– Splitting implies trading at $15, $25, and $40.
• Both theories predict who trades with whom as well as total number of trades.

Demand and Supply in Session 1Demand and Supply in Session 1

Session 1: Detailed Price Predictions Session 1: Detailed Price Predictions Competitive vs Profit-splittingCompetitive vs Profit-splitting
Price Range $14-16 $24-26 $34-36 $19-21
Competitive 0% 0% 0% 100%
Profit-splitting 57% 29% 14% 0%
Actual shares, Rd 1 24% 18% 6% 20%
Actual shares, Rd 2 16% 19% 2% 30%

Session 1: Distribution of All PricesSession 1: Distribution of All Prices

Demand and Supply in Session 2

Session 2: Detailed Price Predictions Session 2: Detailed Price Predictions Competitive vs Profit-splittingCompetitive vs Profit-splitting
Price Range $14-16 $24-26 $34-36 $29-31
Competitive 0% 0% 0% 100%
Profit-splitting 14% 29% 57% 0%
Actual shares, Rd 1 7% 20% 8% 32%
Actual shares, Rd 2 2% 24% 8% 42%

Session 2: Distribution of All PricesSession 2: Distribution of All Prices

Session 1: Detailed Quantity Predictions Session 1: Detailed Quantity Predictions Competitive vs Profit-SplittingCompetitive vs Profit-Splitting
Buyer Value Seller Cost
LowLow
Low High
High Low
High High
Total Trades
Competitive Prediction
197 0 241 0 438
Profit-Splitting Prediction
290 0 145 73 508
Actual, Round 1 221 9 207 34 471
Actual Round 2 218 0 209 38 465

Session 2: Detailed Quantity Predictions Session 2: Detailed Quantity Predictions Competitive vs Profit-SplittingCompetitive vs Profit-Splitting
Buyer Value Seller Cost
LowLow
Low High
High Low
High High
Total Trades
Competitive Prediction
0 0 241 201 442
Profit-Splitting Prediction
74 0 148 296 518
Actual, Round 1 26 6 218 211 461
Actual Round 2 18 2 218 213 451

RemarksRemarks
• Sometimes trading environment is like Smith’s, much repetition with same environments and public trading.
• Sometimes more like Chamberlin’s or like ours.
• Seems worth understanding what happens in environments with intermediate levels of information.

Mining Classroom Trading PitsMining Classroom Trading Pits
• Data is cheap and abundant.
• Design is less flexible.
• But worth saving and studying.
• Remember where experimental economics started.

That’s all for now…That’s all for now…
• Mine tailings