RESEARCH ARTICLE
EXPERT BLOGS AND CONSUMER PERCEPTIONSOF COMPETING BRANDS
Xueming LuoDepartment of Marketing, Fox School of Business, Temple University,
Philadelphia, PA 19122 U.S.A. {[email protected]}
Bin GuDepartment of Information Systems, W. P. Carey School of Business, Arizona State University,
Tempe, AZ 85287 U.S.A. {[email protected]}
Jie ZhangDepartment of Information Systems and Operations Management, College of Business, University of Texas at Arlington,
Arlington, TX 76019 U.S.A. {[email protected]}
Chee Wei PhangDepartment of Information Management and Information Systems, School of Management, Fudan University,
Shanghai 200433 CHINA {[email protected]}
Appendix A
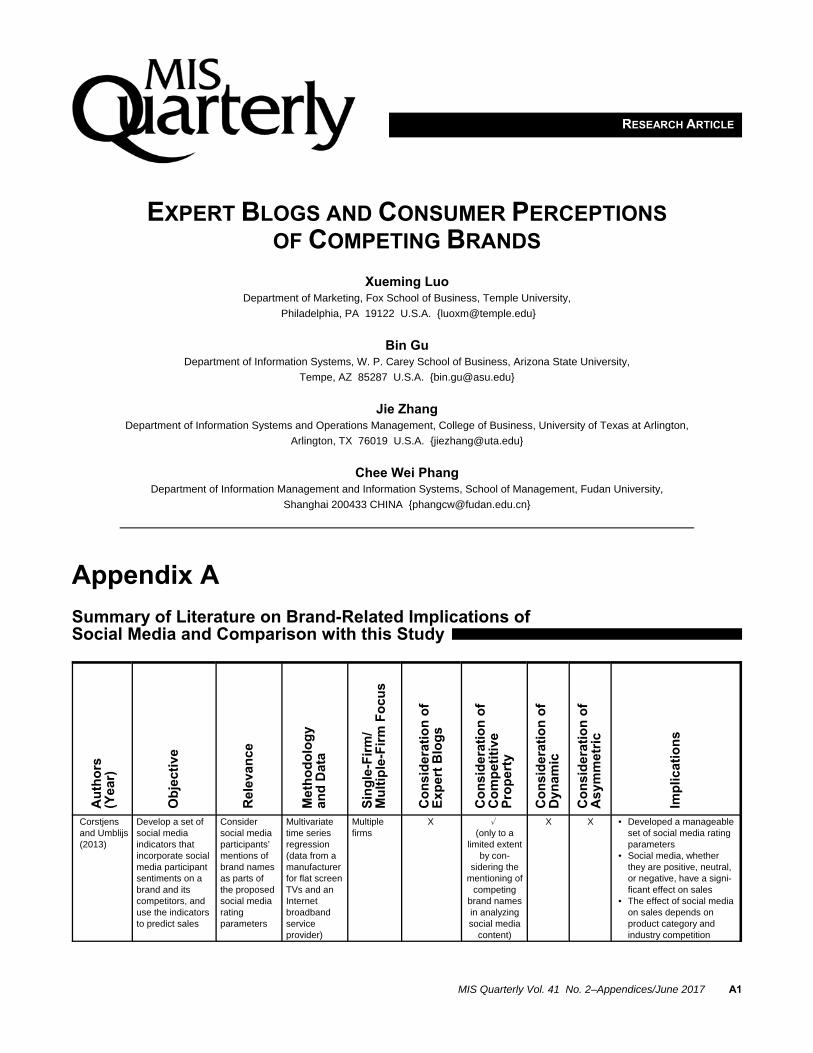
Summary of Literature on Brand-Related Implications ofSocial Media and Comparison with this Study
Au
tho
rs(Y
ear)
Ob
ject
ive
Rel
evan
ce
Met
ho
do
log
yan
d D
ata
Sin
gle
-Fir
m/
Mu
ltip
le-F
irm
Fo
cus
Co
nsi
der
atio
n o
fE
xper
t B
log
s
Co
nsi
der
atio
n o
fC
om
pet
itiv
eP
rop
erty
Co
nsi
der
atio
n o
fD
ynam
ic
Co
nsi
der
atio
n o
fA
sym
met
ric
Imp
licat
ion
s
Corstjensand Umblijs(2013)
Develop a set ofsocial mediaindicators thatincorporate socialmedia participantsentiments on abrand and itscompetitors, anduse the indicatorsto predict sales
Considersocial mediaparticipants’mentions ofbrand namesas parts ofthe proposedsocial mediaratingparameters
Multivariatetime seriesregression(data from amanufacturerfor flat screenTVs and anInternetbroadbandserviceprovider)
Multiplefirms
X % (only to a
limited extentby con-
sidering thementioning of
competingbrand namesin analyzingsocial media
content)
X X • Developed a manageableset of social media rating parameters
• Social media, whetherthey are positive, neutral,or negative, have a signi-ficant effect on sales
• The effect of social mediaon sales depends onproduct category andindustry competition
MIS Quarterly Vol. 41 No. 2–Appendices/June 2017 A1

Luo et al./Expert Blogs & Consumer Perceptions
Au
tho
rs(Y
ear)
Ob
ject
ive
Rel
evan
ce
Met
ho
do
log
yan
d D
ata
Sin
gle
-Fir
m/
Mu
ltip
le-F
irm
Fo
cus
Co
nsi
der
atio
n o
fE
xper
t B
log
s
Co
nsi
der
atio
n o
fC
om
pet
itiv
eP
rop
erty
Co
nsi
der
atio
n o
fD
ynam
ic
Co
nsi
der
atio
n o
fA
sym
met
ric
Imp
licat
ion
s
Goh et al.(2013)
Investigate theimpact of socialmedia contents inbrand communitythat are generatedby consumers andmarketers onconsumers’repeated apparelpurchaseexpenditures
Gettingcustomers torepeatedlydeal with afirm is animportantprecursor ofbrandbuilding
Qualitativeand quanti-tative analysisbased onpropensityscorematchingtechniquewith difference-in-differencesapproach
(datacomprisingsocial mediacontents andcustomers’purchaserecords fromfan pages)
Single firm X X X X • Engagement in socialmedia leads to a positiveincrease in purchaseexpenditures
• Social media contentsaffect consumer pur-chase behavior throughembedded informationand persuasion
• Contents contributed byconsumers exhibit astronger impact thancontents contributed bymarketers on consumerpurchase behavior
Laroche etal. (2013)
Examine how thesetting up of asocial mediabrand communitymay bring forthenhancedcustomers’ brandloyalty
Focus onbrand loyaltyas theoutcome
Survey
(441 respon-dents who aremembers ofsocial mediabrandcommunities)
No specificfocus on aparticularfirm
X X X X • The setting up of a brandcommunity enhancesrelationships with custo-mers, which in turnpromote brand trust andeventually improve brandloyalty
Luo et al.(2013)
Examine theeffect of socialmedia (blogs andconsumer ratings)on firm equityvalue, and itsrelative impactcompared toconventionalonline behavioralmetrics
A firm’s equityvalue is highlyassociatedwith its brandequity
Vector auto-regressivemodels
(a combina-tion of datafromAlexa.com,GoogleInsights forSearch,CNet)
Multiplefirms
% (not
explicitlymentioned,
but theyconsideredblogs from
sourcessuch as
Techcrunchand
Engadgetwhere
expert blogsare
prevalent)
X X X • Social media metrics areleading predictors of firmequity value, more sothan conventional onlinebehavioral metrics (e.g.,search engines)
• Social media has a fasterpredictive value, i.e.,shorter “wear-in” time,than conventional onlinemedia
Naylor etal. (2012)
Investigatewhether revealinginformation of abrand’s onlinesupporters wouldaffect its otherconsumers’ per-ception about thebrand
Examine howconsumersevaluate abrand
Laboratoryexperiments
(scenario-based, non-field data)
Multiplefirms
X % X X • Demographic informationof brand supporters on asocial media website willinfluence a target consu-mer’s brand evaluationsand purchase intentions,even when the presenceof these supporters isonly passively experi-enced and virtual
• Framework for brandmanagers when decidingwhether to reveal theidentities of their online
A2 MIS Quarterly Vol. 41 No. 2–Appendices/June 2017

Luo et al./Expert Blogs & Consumer Perceptions
Au
tho
rs(Y
ear)
Ob
ject
ive
Rel
evan
ce
Met
ho
do
log
yan
d D
ata
Sin
gle
-Fir
m/
Mu
ltip
le-F
irm
Fo
cus
Co
nsi
der
atio
n o
fE
xper
t B
log
s
Co
nsi
der
atio
n o
fC
om
pet
itiv
eP
rop
erty
Co
nsi
der
atio
n o
fD
ynam
ic
Co
nsi
der
atio
n o
fA
sym
met
ric
Imp
licat
ion
s
supporters based on: (1) the composition ofexisting supportersrelative to targeted newsupporters; (2) whetherthe brand is evaluatedsingly or in combinationwith rival brands
Rishika etal. (2013)
Examine theeffect of customers’ participation ina firm’s socialmedia brandcommunity on theintensity ofrelationshipbetween the firmand its customers
Interactionbetween firmsand itscustomersmay cultivate/enhancebrand image
Propensityscorematchingtechnique incombinationwithdifference-in-differences analysis
Single firm X X X X • There are positive linksbetween customers’participation in a firm’ssocial media brandcommunity and theintensity of customer-firminteractions
Schweideland Moe(2014)
Propose metricsto measure brandsentiments basedon social mediacontent
Assessmentof brandsentiments
Contentanalysis ofcommentsposted byconsumers
(data fromvarious socialmediaplatforms)
Multiplefirms (in sepa-rate indus-tries: anenterprisesoftwarefirm and atelecom-munications firm)
(Althoughthe studyconsidersblogs, it isnot statedwhetherthey areexpertblogs)
X X X • Comments contributed todifferent social mediatypes vary in the senti-ment expressed and theirfocal topic (i.e., theproduct and attributereferenced)
• Inferences obtained frommonitoring social mediaare dependent on whichtype of social media is offocus
Singh andSonneburg(2012)
Suggest how firmsshould engagesocial media forbetter brandperformances
Ways ofimprovingconsumerbrandperceptionare proposed
Qualitativeanalysisbased on animprovisationtheater model
(data fromvarious socialmediacampaigns)
Multiplefirms
X X X X • Show that social mediabrand owners do not tellbrand stories alone butco-create brand perfor-mances in collaborationwith the consumers
• Offers a semanticframework that demon-strates the necessity ofco-creation in storytelling,and identifies the core ofan inspiring story
This study Examine thecompetitiverelationshipsbetween expertblog and generalconsumer brandperception, takinginto considera-tions the dynamicand asymmetricnature of therelationshipsbetween leadingvs. non-leadingbrands
Focus ongeneralconsumer brandperception
Vector auto-regressivemodel
(datacombiningonline expertblogs, andofflinegeneralconsumerperception ofthe brands ata daily level)
Multiplefirms
% % % % • Expert blogs on a brandnot only have a positiverelationship with consu-mer perception about thebrand, but also a nega-tive relationship with thatof its competitors
• Demonstrate the dyna-mics in the influences ofexpert blogs
• Highlight the asymmetricnature of the competitiveand dynamic influencesof expert blogs betweenleading and a non-leading brands
MIS Quarterly Vol. 41 No. 2–Appendices/June 2017 A3
Luo et al./Expert Blogs & Consumer Perceptions
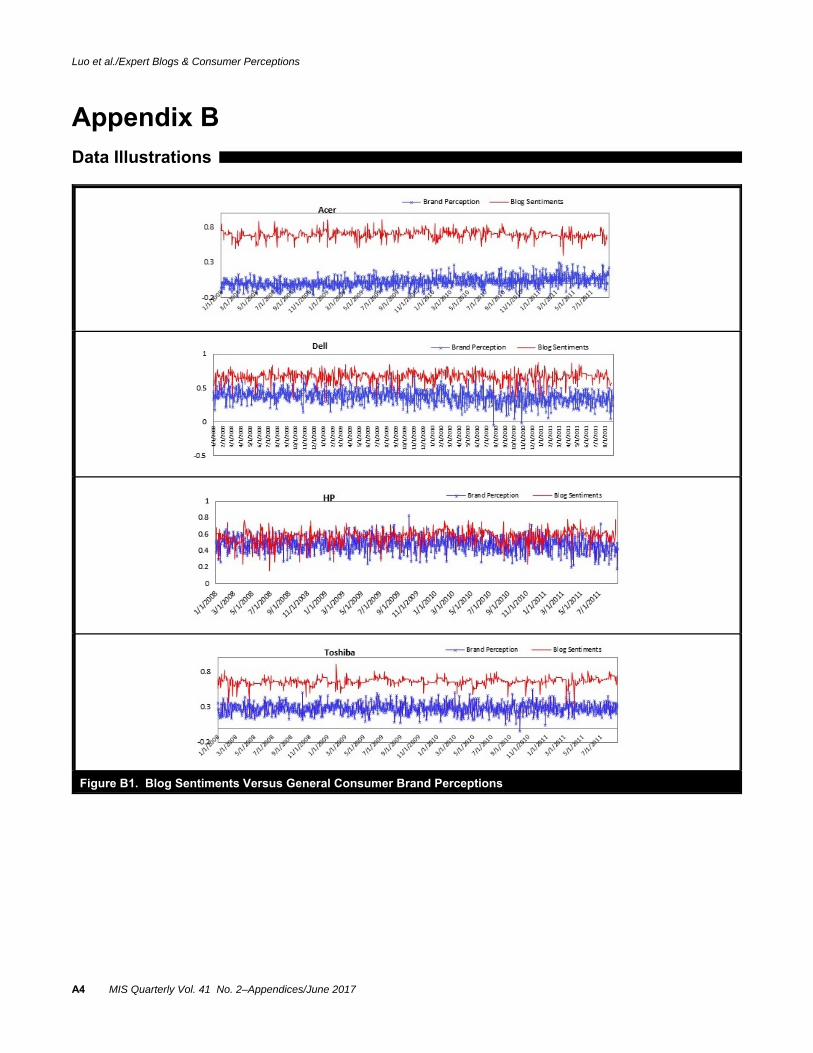
Appendix BData Illustrations
Figure B1. Blog Sentiments Versus General Consumer Brand Perceptions
A4 MIS Quarterly Vol. 41 No. 2–Appendices/June 2017

Luo et al./Expert Blogs & Consumer Perceptions
Figure B1. Blog Sentiments Versus General Consumer Brand Perceptions (Continued)
Figure B2. A “Zoomed In” View of General Consumer Brand Perception and Expert Blog Sentiments of HP (Aug-Oct 2008)
MIS Quarterly Vol. 41 No. 2–Appendices/June 2017 A5

Luo et al./Expert Blogs & Consumer Perceptions
Table B1. Summary Statistics of Monthly Advertising Spending for Each Brand
Variable Mean Std Dev Minimum Maximum
adAceradAppleadCompaqadDelladGatewayadHpadLenovoadSonyadToshiba
904.417164.56344.3121644.5464.0816105.971888.351367.162245.43
853.568370.80618.8212177.05233.627679.383368.742134.831946.97
0005175.3003828.501.800.1054.30
3910.2023663.502527.1065393.601427.3039194.8019445.108222.609780.40
Note: Based on ad$pender by Kantar Media, in thousands.
Appendix CMore Impulse Response Functions
Response of Brand Perception of Acer toits Blog Sentiments
Response of Brand Perception of Acer tothe Blog Sentiments of Dell
Response of Brand Perception of Compaq toits Blog Sentiments
Response of Brand Perception of Compaq tothe Blog Sentiments of HP
Figure C1. Accumulated Response of General Consumer Brand Perception to the Unanticipated Shock in ExpertBlog Sentiment (The dotted lines are the confidence bound of ±σ)
A6 MIS Quarterly Vol. 41 No. 2–Appendices/June 2017

Luo et al./Expert Blogs & Consumer Perceptions
Response of Brand Perception of Dell toits Blog Sentiments
Response of Brand Perception of Dell tothe Blog Sentiments of HP
Response of Brand Perception of Gateway toits Blog Sentiments
Response of Brand Perception of Gateway tothe Blog Sentiments of HP
Response of Brand Perception of Sony toits Blog Sentiments
Response of Brand Perception of Sony tothe Blog Sentiments of Apple
Figure C1. Accumulated Response of General Consumer Brand Perception to the Unanticipated Shock in ExpertBlog Sentiment (The dotted lines are the confidence bound of ±σ) (Continued)
MIS Quarterly Vol. 41 No. 2–Appendices/June 2017 A7
Luo et al./Expert Blogs & Consumer Perceptions
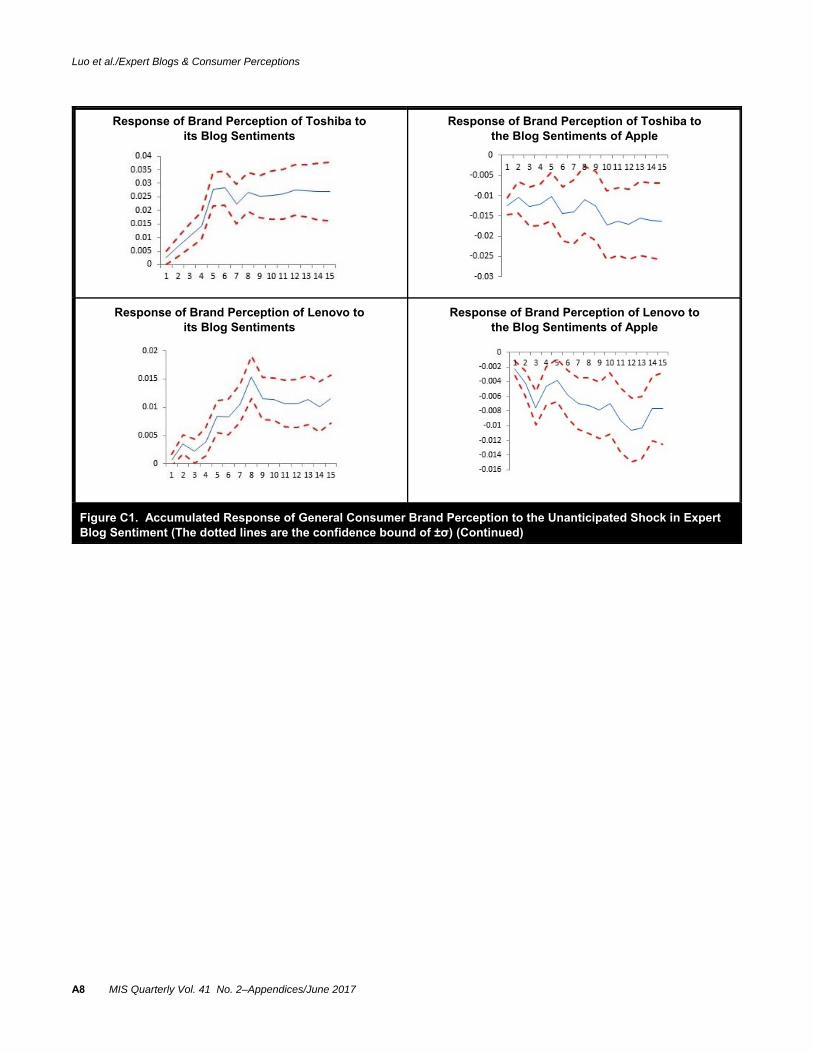
Response of Brand Perception of Toshiba toits Blog Sentiments
Response of Brand Perception of Toshiba tothe Blog Sentiments of Apple
Response of Brand Perception of Lenovo toits Blog Sentiments
Response of Brand Perception of Lenovo tothe Blog Sentiments of Apple
Figure C1. Accumulated Response of General Consumer Brand Perception to the Unanticipated Shock in ExpertBlog Sentiment (The dotted lines are the confidence bound of ±σ) (Continued)
A8 MIS Quarterly Vol. 41 No. 2–Appendices/June 2017
Luo et al./Expert Blogs & Consumer Perceptions
Brand Perception ttt
Brand Perceptionit i i
i i
i i
ip
ip
ip
ip
ip
ip
p
Pi t p i
Blog SentimentBlog Sentiment
Blog Sentiment Blog Sentiment
it
jt
i,t - p
j,t - p
=+++
+
+=
−
α δα δα δ
φ φφ φφ φ
τ1 1
2 2
3 3
1 1 1 3
2 1 2 3
3 1 3 3
1
1, ,
, ,
, ,
, ,
1 1 10
2 1 2 10
3 1 3 10
1
2
3
4
5
6
7
8
9
10
1
2
3
ττ ττ τ
εεε
i
i i
i i
i t
i t
i t
i t
i t
i t
i t
i t
i t
i t
i t
i t
i t
xxxxxxxxxx
,
, ,
, ,
+
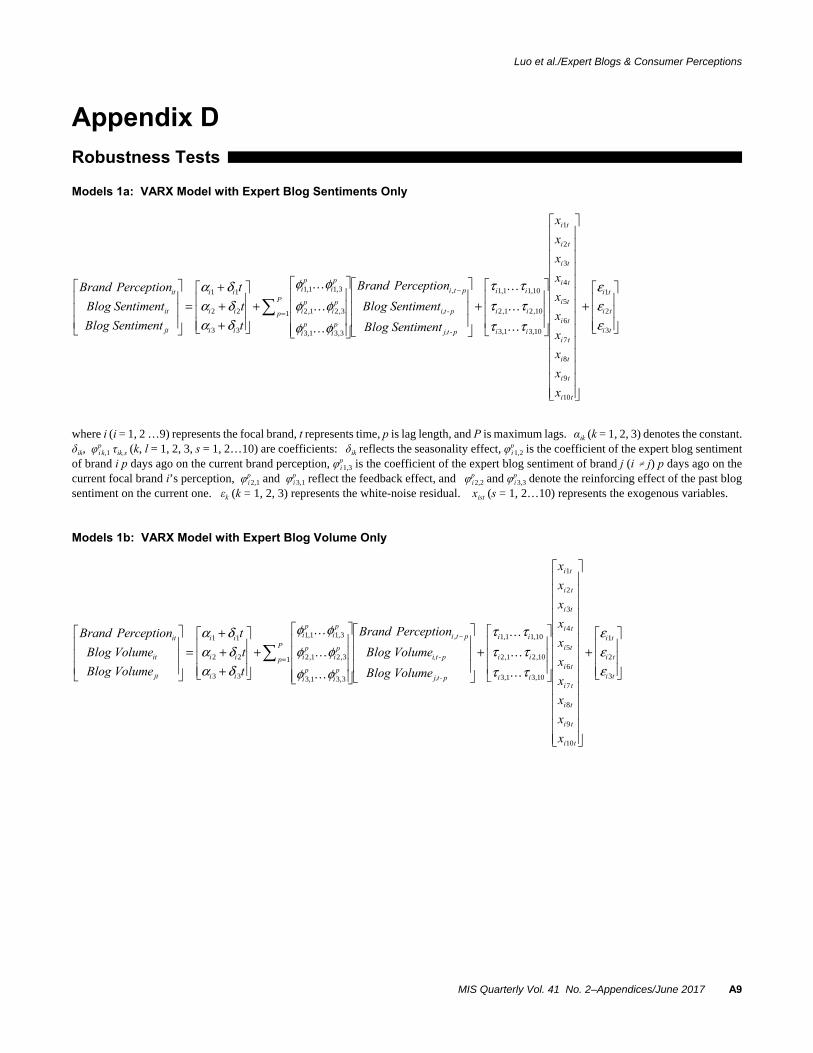
Appendix DRobustness Tests
Models 1a: VARX Model with Expert Blog Sentiments Only
where i (i = 1, 2 …9) represents the focal brand, t represents time, p is lag length, and P is maximum lags. αik (k = 1, 2, 3) denotes the constant. δik, φi
pk,1 τik,s (k, l = 1, 2, 3, s = 1, 2…10) are coefficients: δik reflects the seasonality effect, φi
p1,2 is the coefficient of the expert blog sentiment
of brand i p days ago on the current brand perception, φip1,3 is the coefficient of the expert blog sentiment of brand j (i … j) p days ago on the
current focal brand i’s perception, φip2,1 and φi
p3,1 reflect the feedback effect, and φi
p2,2 and φi
p3,3 denote the reinforcing effect of the past blog
sentiment on the current one. εk (k = 1, 2, 3) represents the white-noise residual. xist (s = 1, 2…10) represents the exogenous variables.
Models 1b: VARX Model with Expert Blog Volume Only
Brand Perception ttt
Brand Perceptionit i i
i i
i i
ip
ip
ip
ip
ip
ip
p
Pi t p i
Blog VolumeBlog Volume
Blog VolumeBlog Volume
it
jt
i,t - p
j,t - p
=+++
+
+=
−
α δα δα δ
φ φ
φ φφ φ
τ τ1 1
2 2
3 3
1 1 1 3
2 1 2 3
3 1 3 3
1
1 1, ,
, ,
, ,
, ,
i
i i
i i
i t
i t
i t
i t
i t
i t
i t
i t
i t
i t
i t
i t
i t
xxxxxxxxxx
1 10
2 1 2 10
3 1 3 10
1
2
3
4
5
6
7
8
9
10
1
2
3
,
, ,
, ,
τ ττ τ
εεε
+
MIS Quarterly Vol. 41 No. 2–Appendices/June 2017 A9
Luo et al./Expert Blogs & Consumer Perceptions
Brand Perception ttttt
it i i
i i
i i
i i
i i
ip
ip
ip
ip
ip
ip
ip
ip
i
Blog SentimentBlog VolumeBlog SentimentBlog Volume
it
it
-i,t
-i,t
=
+++++
+
α δα δα δα δα δ
φ φφ φ
φ φφ φφ
1 1
2 2
3 3
4 4
5 5
1 1 1 6
2 1 2 6
3 1 3 6
4 1 4 6
5
, ,
, ,
, ,
, ,
,
1 5 6
1
1 1 1 10
2 1 2 10
3 1 3 10
4 1 4 10
5 1 5 10p
ip
p
P
i t p i i
i i
i i
i i
i i
Brand Perception
φ
τ ττ ττ ττ ττ τ
,
, , ,
, ,
, ,
, ,
, ,
+
=
−
Blog VolumeBlog Volume
Blog SentimentBlog Volume
i,t - p
i,t - p
-i,t - p
-i,t - p
+
xxxxxxxxxx
i t
i t
i t
i t
i t
i t
i t
i t
i t
i t
i t
i t
i t
i t
i t
1
2
3
4
5
6
7
8
9
10
1
2
3
4
5
εεεεε
Brand Perception ttttt
it i i
i i
i i
i i
i i
ip
ip
ip
ip
ip
ip
ip
ip
i
Blog PosVolumeBlog Neg VolumeBlog PosVolumeBlog Neg Volume
it
it
-i,t
-i,t
=
+++++
+
α δα δα δα δα δ
φ φφ φφ φφ φ
φ
1 1
2 2
3 3
4 4
5 5
1 1 1 6
2 1 2 6
3 1 3 6
4 1 4 6
5
, ,
, ,
, ,
, ,
, ,
, , ,
, ,
, ,
, ,
, ,1 5 6
1
1 1 1 10
2 1 2 10
3 1 3 10
4 1 4 10
5 1 5 10p
ip
p
P
i t p i i
i i
i i
i i
i i
Brand Perception
φ
τ ττ ττ ττ ττ τ
+
=
−
Blog PosVolumeBlog Neg VolumeBlog PosVolumeBlog Neg Volume
i,t - p
i,t - p
-i,t - p
-i,t - p
+
xxxxxxxxxx
i t
i t
i t
i t
i t
i t
i t
i t
i t
i t
i t
i t
i t
i t
i t
1
2
3
4
5
6
7
8
9
10
1
2
3
4
5
εεεεε
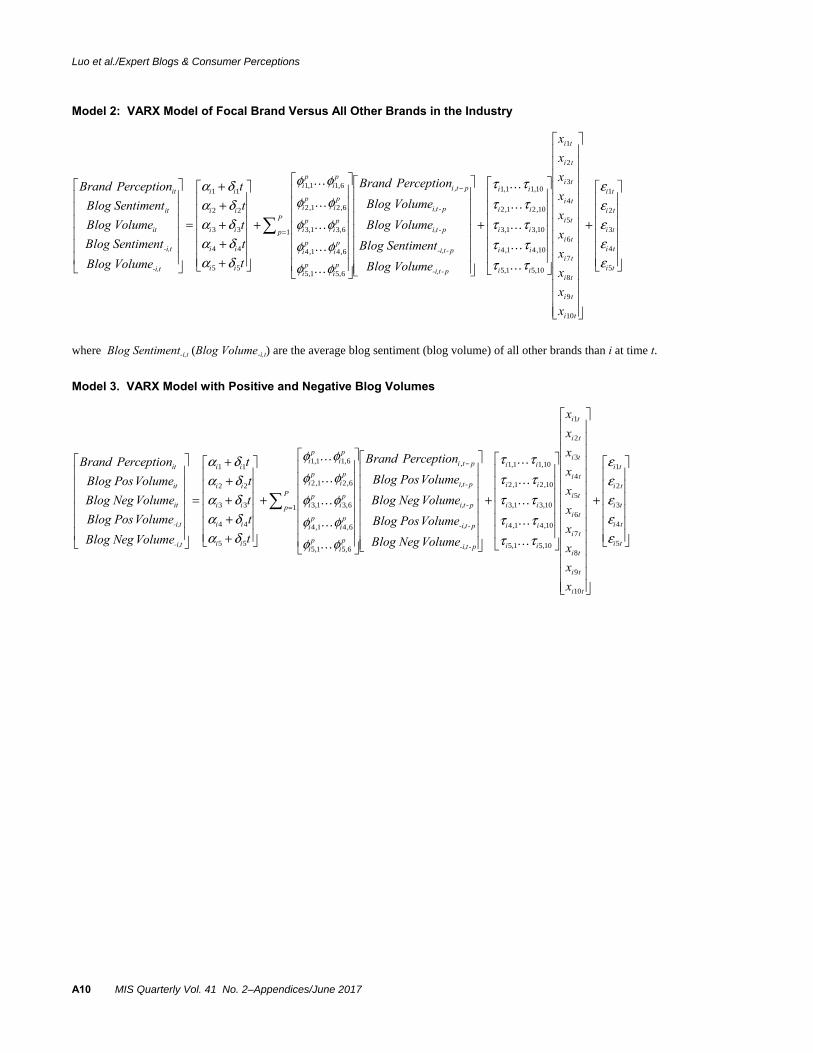
Model 2: VARX Model of Focal Brand Versus All Other Brands in the Industry
where Blog Sentiment-i,t (Blog Volume-i,t) are the average blog sentiment (blog volume) of all other brands than i at time t.
Model 3. VARX Model with Positive and Negative Blog Volumes
A10 MIS Quarterly Vol. 41 No. 2–Appendices/June 2017

Luo et al./Expert Blogs & Consumer Perceptions
Table D1. Additional VARX Model Results with Expert Blog Sentiments and Volume Modeled Separately
Panel A: Responses of General Consumer Brand Perception to Expert Blog Sentiments
Response of general consumer brand perception
Expert BlogSentiment ACER COMPAQ DELL GATEWAY HP
SONYVAIO TOSHIBA LENOVO
AppleMAC
ACER 0.044** -0.063*** -0.032** -0.049** -0.026* -0.083** -0.046* -0.032* -0.032
COMPAQ -0.015** 0.057*** -0.008* -0.026** -0.017* -0.021* -0.023* -0.014** -0.015**
DELL -0.018** -0.033** 0.051** -0.057** -0.066** -0.026*** -0.053*** -0.011** -0.035***
GATEWAY -0.012** -0.033*** -0.008*** 0.062** -0.010* -0.022** -0.032** -0.005*** -0.014*
HP -0.021* -0.034** -0.017*** -0.070** 0.054** -0.069** -0.049** -0.016* -0.018**
SONY VAIO -0.011** -0.032* -0.015** -0.061*** -0.022** 0.057** -0.107*** -0.009* -0.012*
TOSHIBA -0.011*** -0.021* -0.016*** -0.041* -0.010*** -0.044*** 0.068*** -0.021* -0.018
LENOVO -0.015** -0.022** -0.019* -0.045** -0.007* -0.055* -0.044*** 0.052* -0.019*
Apple MAC -0.008*** -0.046* -0.017* -0.033*** -0.008** -0.027** -0.021* -0.012** 0.015*
Note: The diagonal estimates are impulse responses of brand perception to blog sentiments of own brand, and the off-diagonal estimates
are impulse responses of brand perception to the blog sentiments of rival brands. *p < .10, **p < .05, ***p < .01.
Panel B: Auto-Regression of Expert Blog Sentiments
Response of expert blog sentiment
Expert BlogSentiment ACER COMPAQ DELL GATEWAY HP
SONYVAIO TOSHIBA LENOVO
AppleMAC
ACER 0.266*** 0.019* -0.068** -0.031** -0.015* -0.022** -0.014* -0.082*** -0.025***
COMPAQ -0.038* 0.110*** -0.065* -0.023*** -0.011* -0.031*** -0.018* -0.030* -0.003*
DELL -0.033*** -0.004 0.231*** -0.035** -0.059* -0.017** -0.058*** -0.014*** -0.052***
GATEWAY -0.051*** -0.023*** -0.039* 0.156*** -0.026** -0.015** -0.017* -0.014* -0.012
HP -0.048*** -0.002* -0.044*** -0.025* 0.249*** -0.025*** -0.014*** -0.033* -0.024**
SONY VAIO -0.029*** -0.042*** -0.062*** -0.027** -0.018 0.170*** -0.033* -0.048* -0.016***
TOSHIBA -0.043*** -0.010** -0.059*** -0.023* -0.046** -0.008** 0.188*** -0.052*** -0.015*
LENOVO -0.034*** -0.014* -0.065*** -0.034** -0.048** -0.057*** -0.066*** 0.217*** -0.022*
Apple MAC -0.071* -0.019 -0.068*** -0.099*** -0.070* -0.022 -0.055 -0.039 0.082***
Panel C: Responses of General Consumer Brand Perception to Expert Blog Volume
Response of general consumer brand perception
Expert BlogVolume ACER COMPAQ DELL GATEWAY HP
SONYVAIO TOSHIBA LENOVO
AppleMAC
ACER 0.023*** -0.018** -0.007** -0.024*** -0.012* -0.018*** -0.007* -0.004** -0.016*
COMPAQ -0.005* 0.028** -0.025*** -0.025** -0.009** -0.003* -0.010** -0.003* -0.015
DELL -0.012** -0.018* 0.019** -0.018* -0.016* -0.021* -0.015*** -0.013*** -0.031*
GATEWAY -0.017*** -0.008 0.015** 0.024*** -0.010** 0.009** -0.012* -0.009** -0.016
HP -0.014** -0.012 -0.017*** -0.019* 0.021** -0.013** -0.023** -0.011** -0.019*
SONY VAIO -0.012* -0.008*** 0.016** -0.016*** -0.005 0.023*** -0.018 -0.012* -0.009*
TOSHIBA -0.011* -0.009** -0.008* -0.007 -0.009 0.014** 0.027** -0.007** -0.021**
LENOVO -0.004** -0.015*** -0.008* -0.018** -0.012** 0.012* -0.014** 0.018** -0.017
Apple MAC 0.026*** -0.014* -0.016** -0.012** 0.024*** -0.011*** -0.021** -0.008** 0.043*
Note: The diagonal estimates are impulse responses of general consumer brand perception to the expert blog volume of own brand, and
the off-diagonal estimates are impulse responses of brand perception to the blog volume of rival brands. *p < .10, **p < .05, ***p < .01.
MIS Quarterly Vol. 41 No. 2–Appendices/June 2017 A11
Luo et al./Expert Blogs & Consumer Perceptions
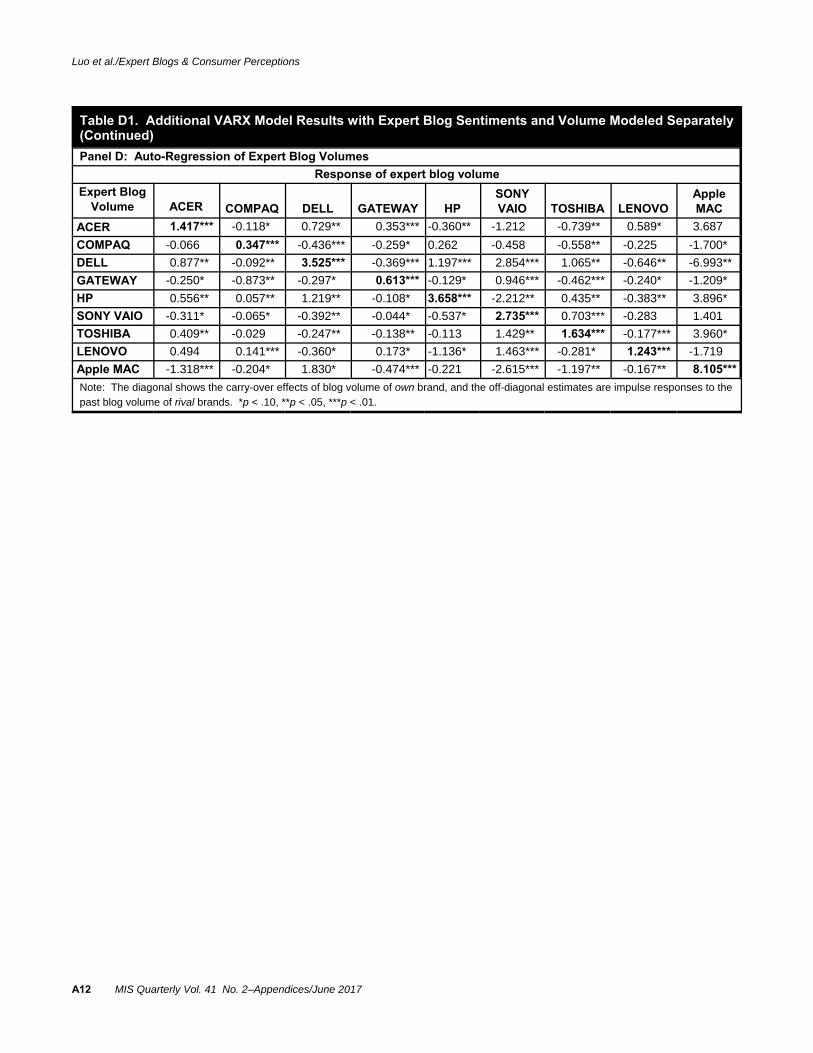
Table D1. Additional VARX Model Results with Expert Blog Sentiments and Volume Modeled Separately(Continued)
Panel D: Auto-Regression of Expert Blog Volumes
Response of expert blog volume
Expert BlogVolume ACER COMPAQ DELL GATEWAY HP
SONYVAIO TOSHIBA LENOVO
AppleMAC
ACER 1.417*** -0.118* 0.729** 0.353*** -0.360** -1.212 -0.739** 0.589* 3.687
COMPAQ -0.066 0.347*** -0.436*** -0.259* 0.262 -0.458 -0.558** -0.225 -1.700*
DELL 0.877** -0.092** 3.525*** -0.369*** 1.197*** 2.854*** 1.065** -0.646** -6.993**
GATEWAY -0.250* -0.873** -0.297* 0.613*** -0.129* 0.946*** -0.462*** -0.240* -1.209*
HP 0.556** 0.057** 1.219** -0.108* 3.658*** -2.212** 0.435** -0.383** 3.896*
SONY VAIO -0.311* -0.065* -0.392** -0.044* -0.537* 2.735*** 0.703*** -0.283 1.401
TOSHIBA 0.409** -0.029 -0.247** -0.138** -0.113 1.429** 1.634*** -0.177*** 3.960*
LENOVO 0.494 0.141*** -0.360* 0.173* -1.136* 1.463*** -0.281* 1.243*** -1.719
Apple MAC -1.318*** -0.204* 1.830* -0.474*** -0.221 -2.615*** -1.197** -0.167** 8.105***
Note: The diagonal shows the carry-over effects of blog volume of own brand, and the off-diagonal estimates are impulse responses to the
past blog volume of rival brands. *p < .10, **p < .05, ***p < .01.
A12 MIS Quarterly Vol. 41 No. 2–Appendices/June 2017
Luo et al./Expert Blogs & Consumer Perceptions
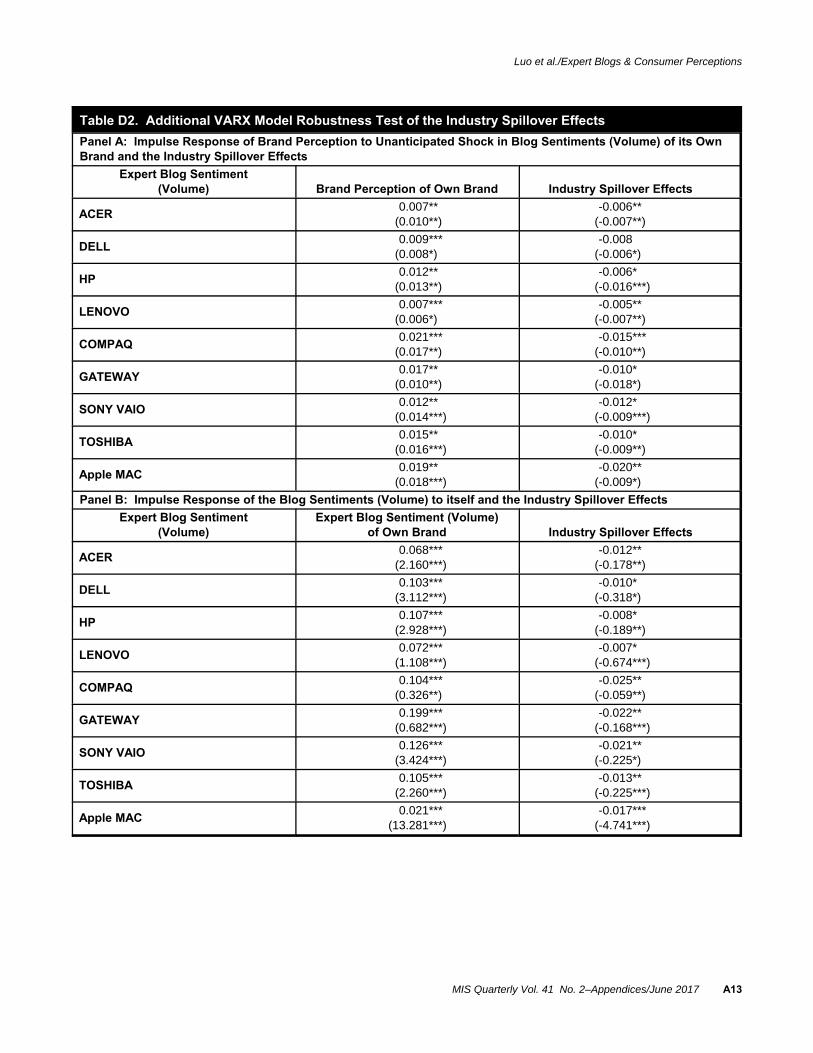
Table D2. Additional VARX Model Robustness Test of the Industry Spillover Effects
Panel A: Impulse Response of Brand Perception to Unanticipated Shock in Blog Sentiments (Volume) of its OwnBrand and the Industry Spillover Effects
Expert Blog Sentiment(Volume) Brand Perception of Own Brand Industry Spillover Effects
ACER0.007**
(0.010**)-0.006**
(-0.007**)
DELL0.009***
(0.008*)-0.008
(-0.006*)
HP0.012**
(0.013**)-0.006*
(-0.016***)
LENOVO0.007***
(0.006*)-0.005**
(-0.007**)
COMPAQ0.021***
(0.017**)-0.015***
(-0.010**)
GATEWAY0.017**
(0.010**)-0.010*
(-0.018*)
SONY VAIO0.012**
(0.014***)-0.012*
(-0.009***)
TOSHIBA0.015**
(0.016***)-0.010*
(-0.009**)
Apple MAC0.019**
(0.018***)-0.020**
(-0.009*)
Panel B: Impulse Response of the Blog Sentiments (Volume) to itself and the Industry Spillover Effects
Expert Blog Sentiment(Volume)
Expert Blog Sentiment (Volume)of Own Brand Industry Spillover Effects
ACER0.068***
(2.160***)-0.012**
(-0.178**)
DELL0.103***
(3.112***)-0.010*
(-0.318*)
HP0.107***
(2.928***)-0.008*
(-0.189**)
LENOVO0.072***
(1.108***)-0.007*
(-0.674***)
COMPAQ0.104***
(0.326**)-0.025**
(-0.059**)
GATEWAY0.199***
(0.682***)-0.022**
(-0.168***)
SONY VAIO0.126***
(3.424***)-0.021**
(-0.225*)
TOSHIBA0.105***
(2.260***)-0.013**
(-0.225***)
Apple MAC0.021***
(13.281***)-0.017***
(-4.741***)
MIS Quarterly Vol. 41 No. 2–Appendices/June 2017 A13